Questions as text
Q1 · Answer the whole of this question on a sheet of graph paper 0580/41 May/June 2005
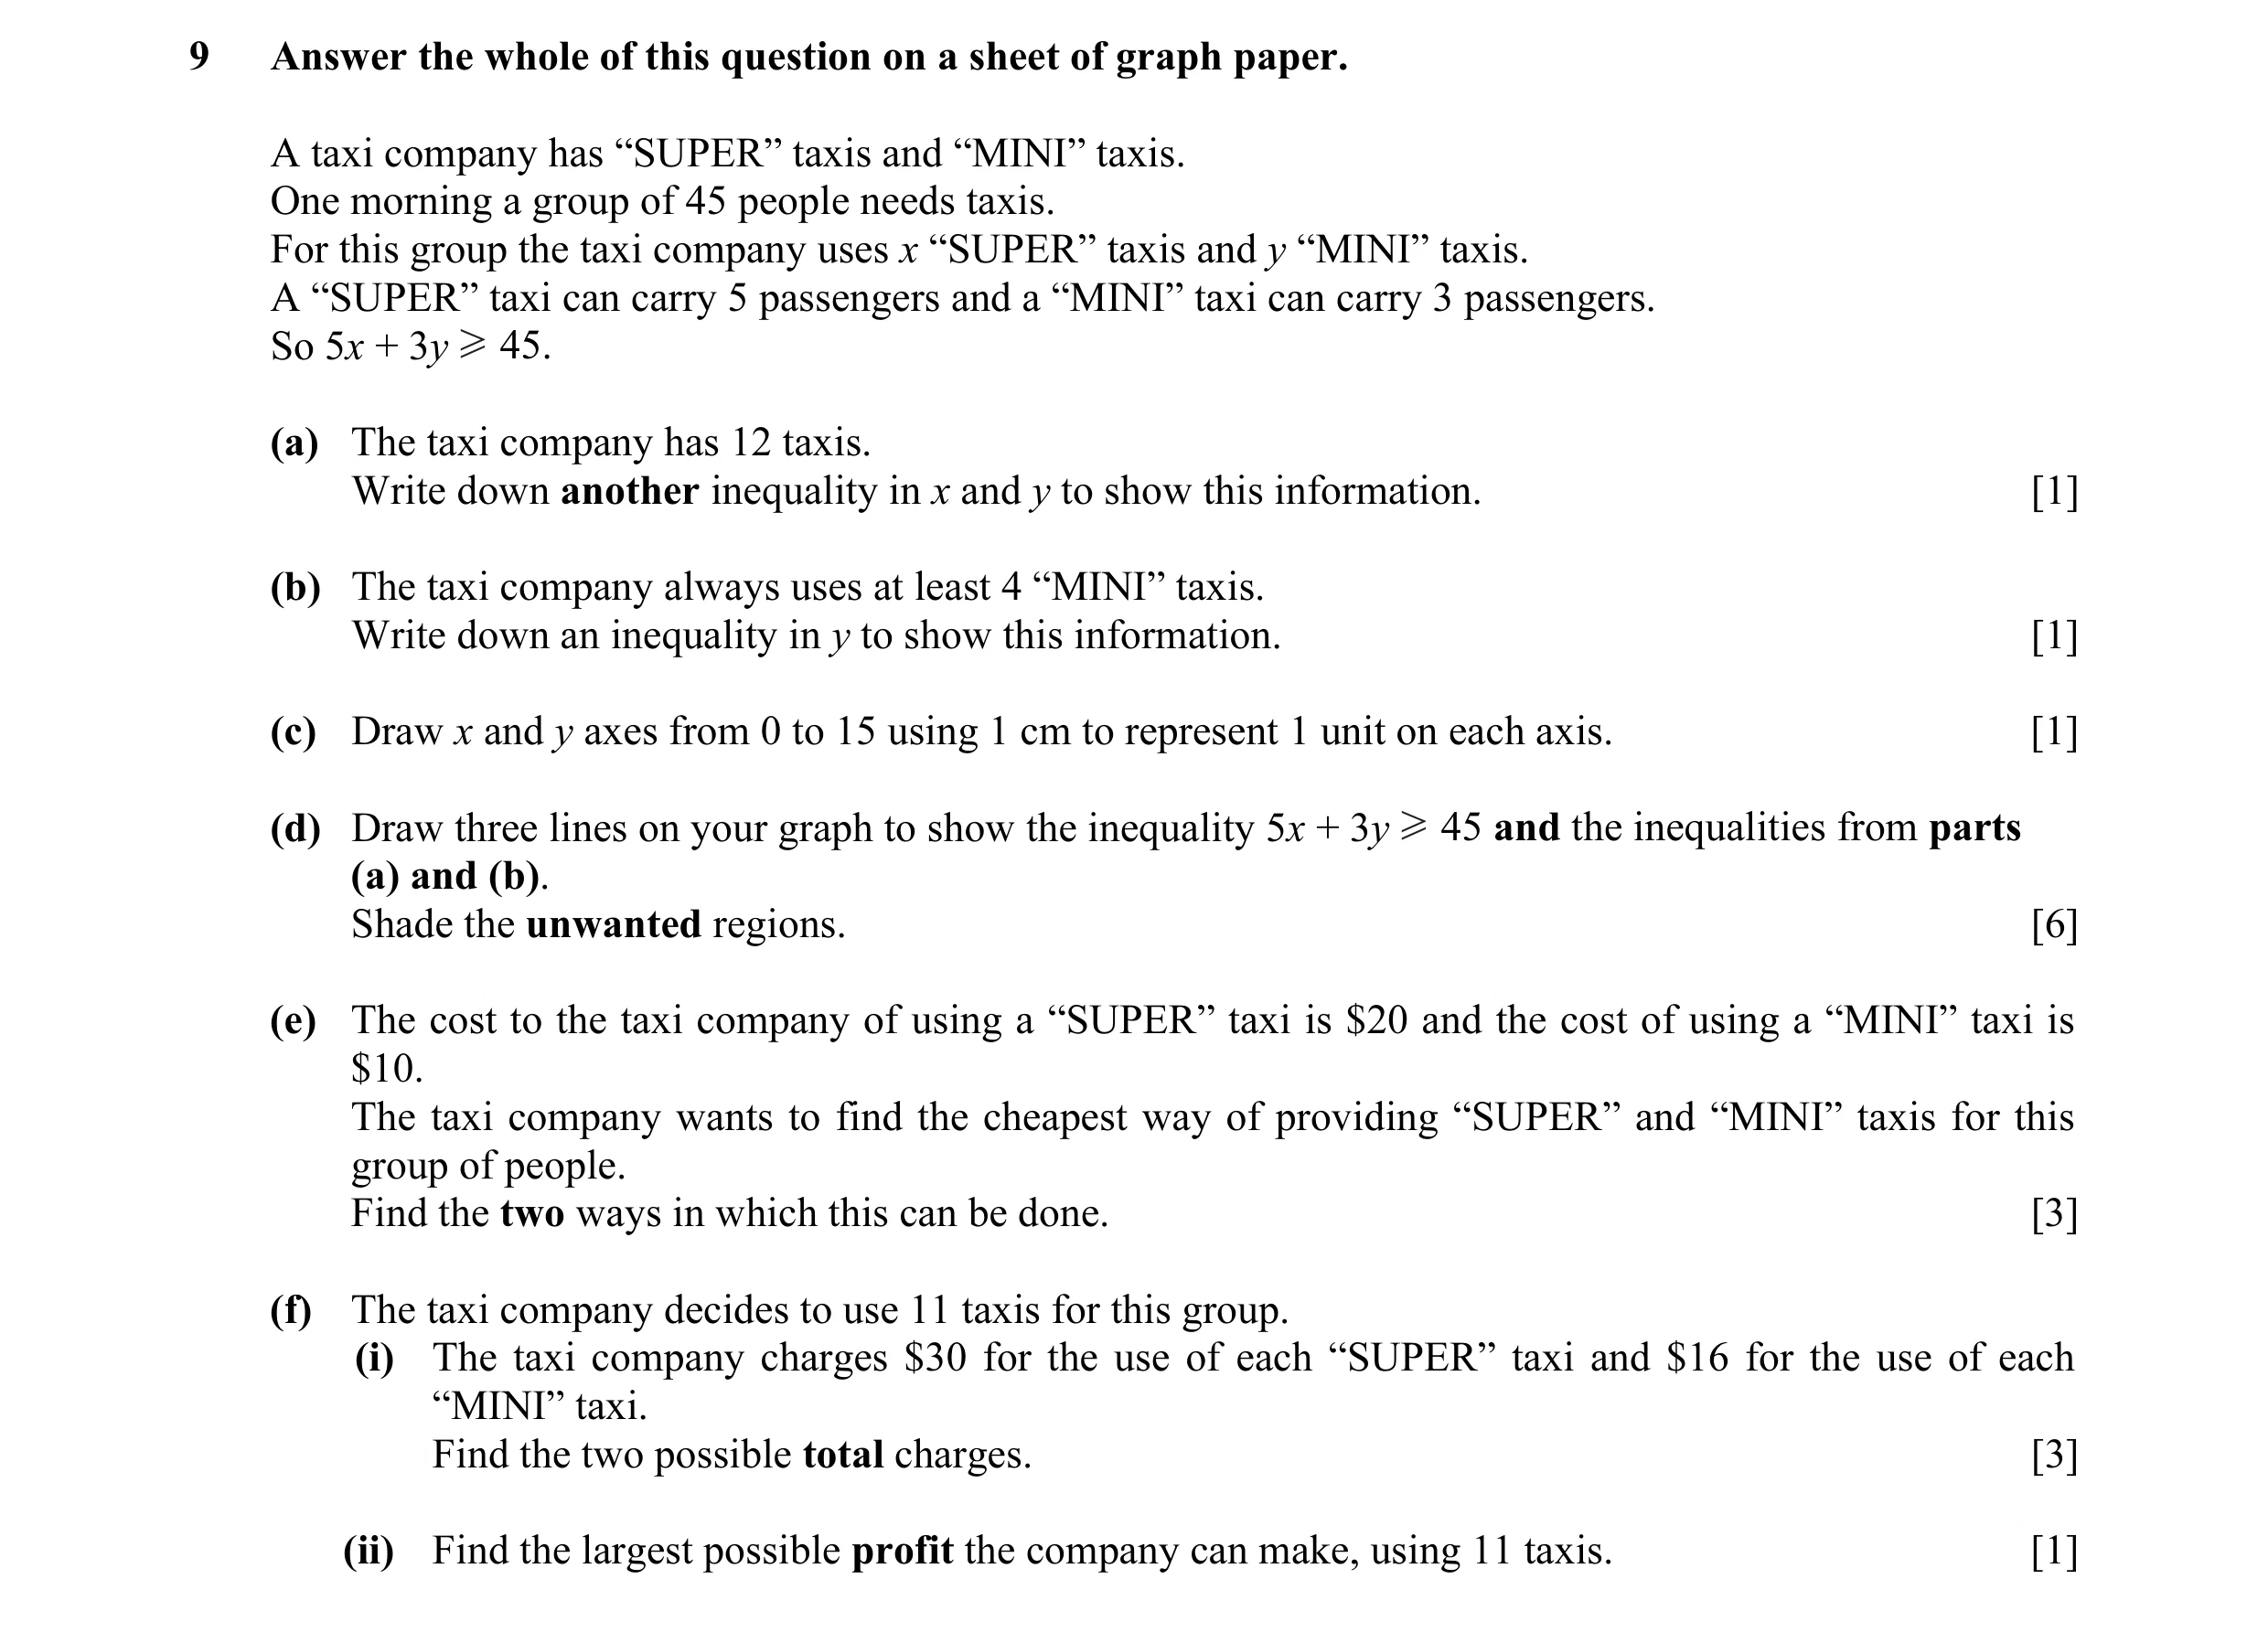
9 Answer the whole of this question on a sheet of graph paper. A taxi company has “SUPER” taxis and “MINI” taxis. One morning a group of 45 people needs taxis. For this group the taxi company uses x “SUPER” taxis and y “MINI” taxis. A “SUPER” taxi can carry 5 passengers and a “MINI” taxi can carry 3 passengers. So 5x + 3y 45. (a) The taxi company has 12 taxis. Write down another inequality in x and y to show this information. [1] (b) The taxi company always uses at least 4 “MINI” taxis. Write down an inequality in y to show this information. [1] (c) Draw x and y axes from 0 to 15 using 1 cm to represent 1 unit on each axis. [1] (d) Draw three lines on your graph to show the inequality 5x + 3y 45 and the inequalities from parts (a) and (b). Shade the unwanted regions. [6] (e) The cost to the taxi company of using a “SUPER” taxi is $20 and the cost of using a “MINI” taxi is $10. The taxi company wants to find the cheapest way of providing “SUPER” and “MINI” taxis for this group of people. Find the two ways in which this can be done. [3] (f) The taxi company decides to use 11 taxis for this group. (i) The taxi company charges $30 for the use of each “SUPER” taxi and $16 for the use of each “MINI” taxi. Find the two possible total charges. [3] (ii) Find the largest possible profit the company can make, using 11 taxis. [1]
16 marks
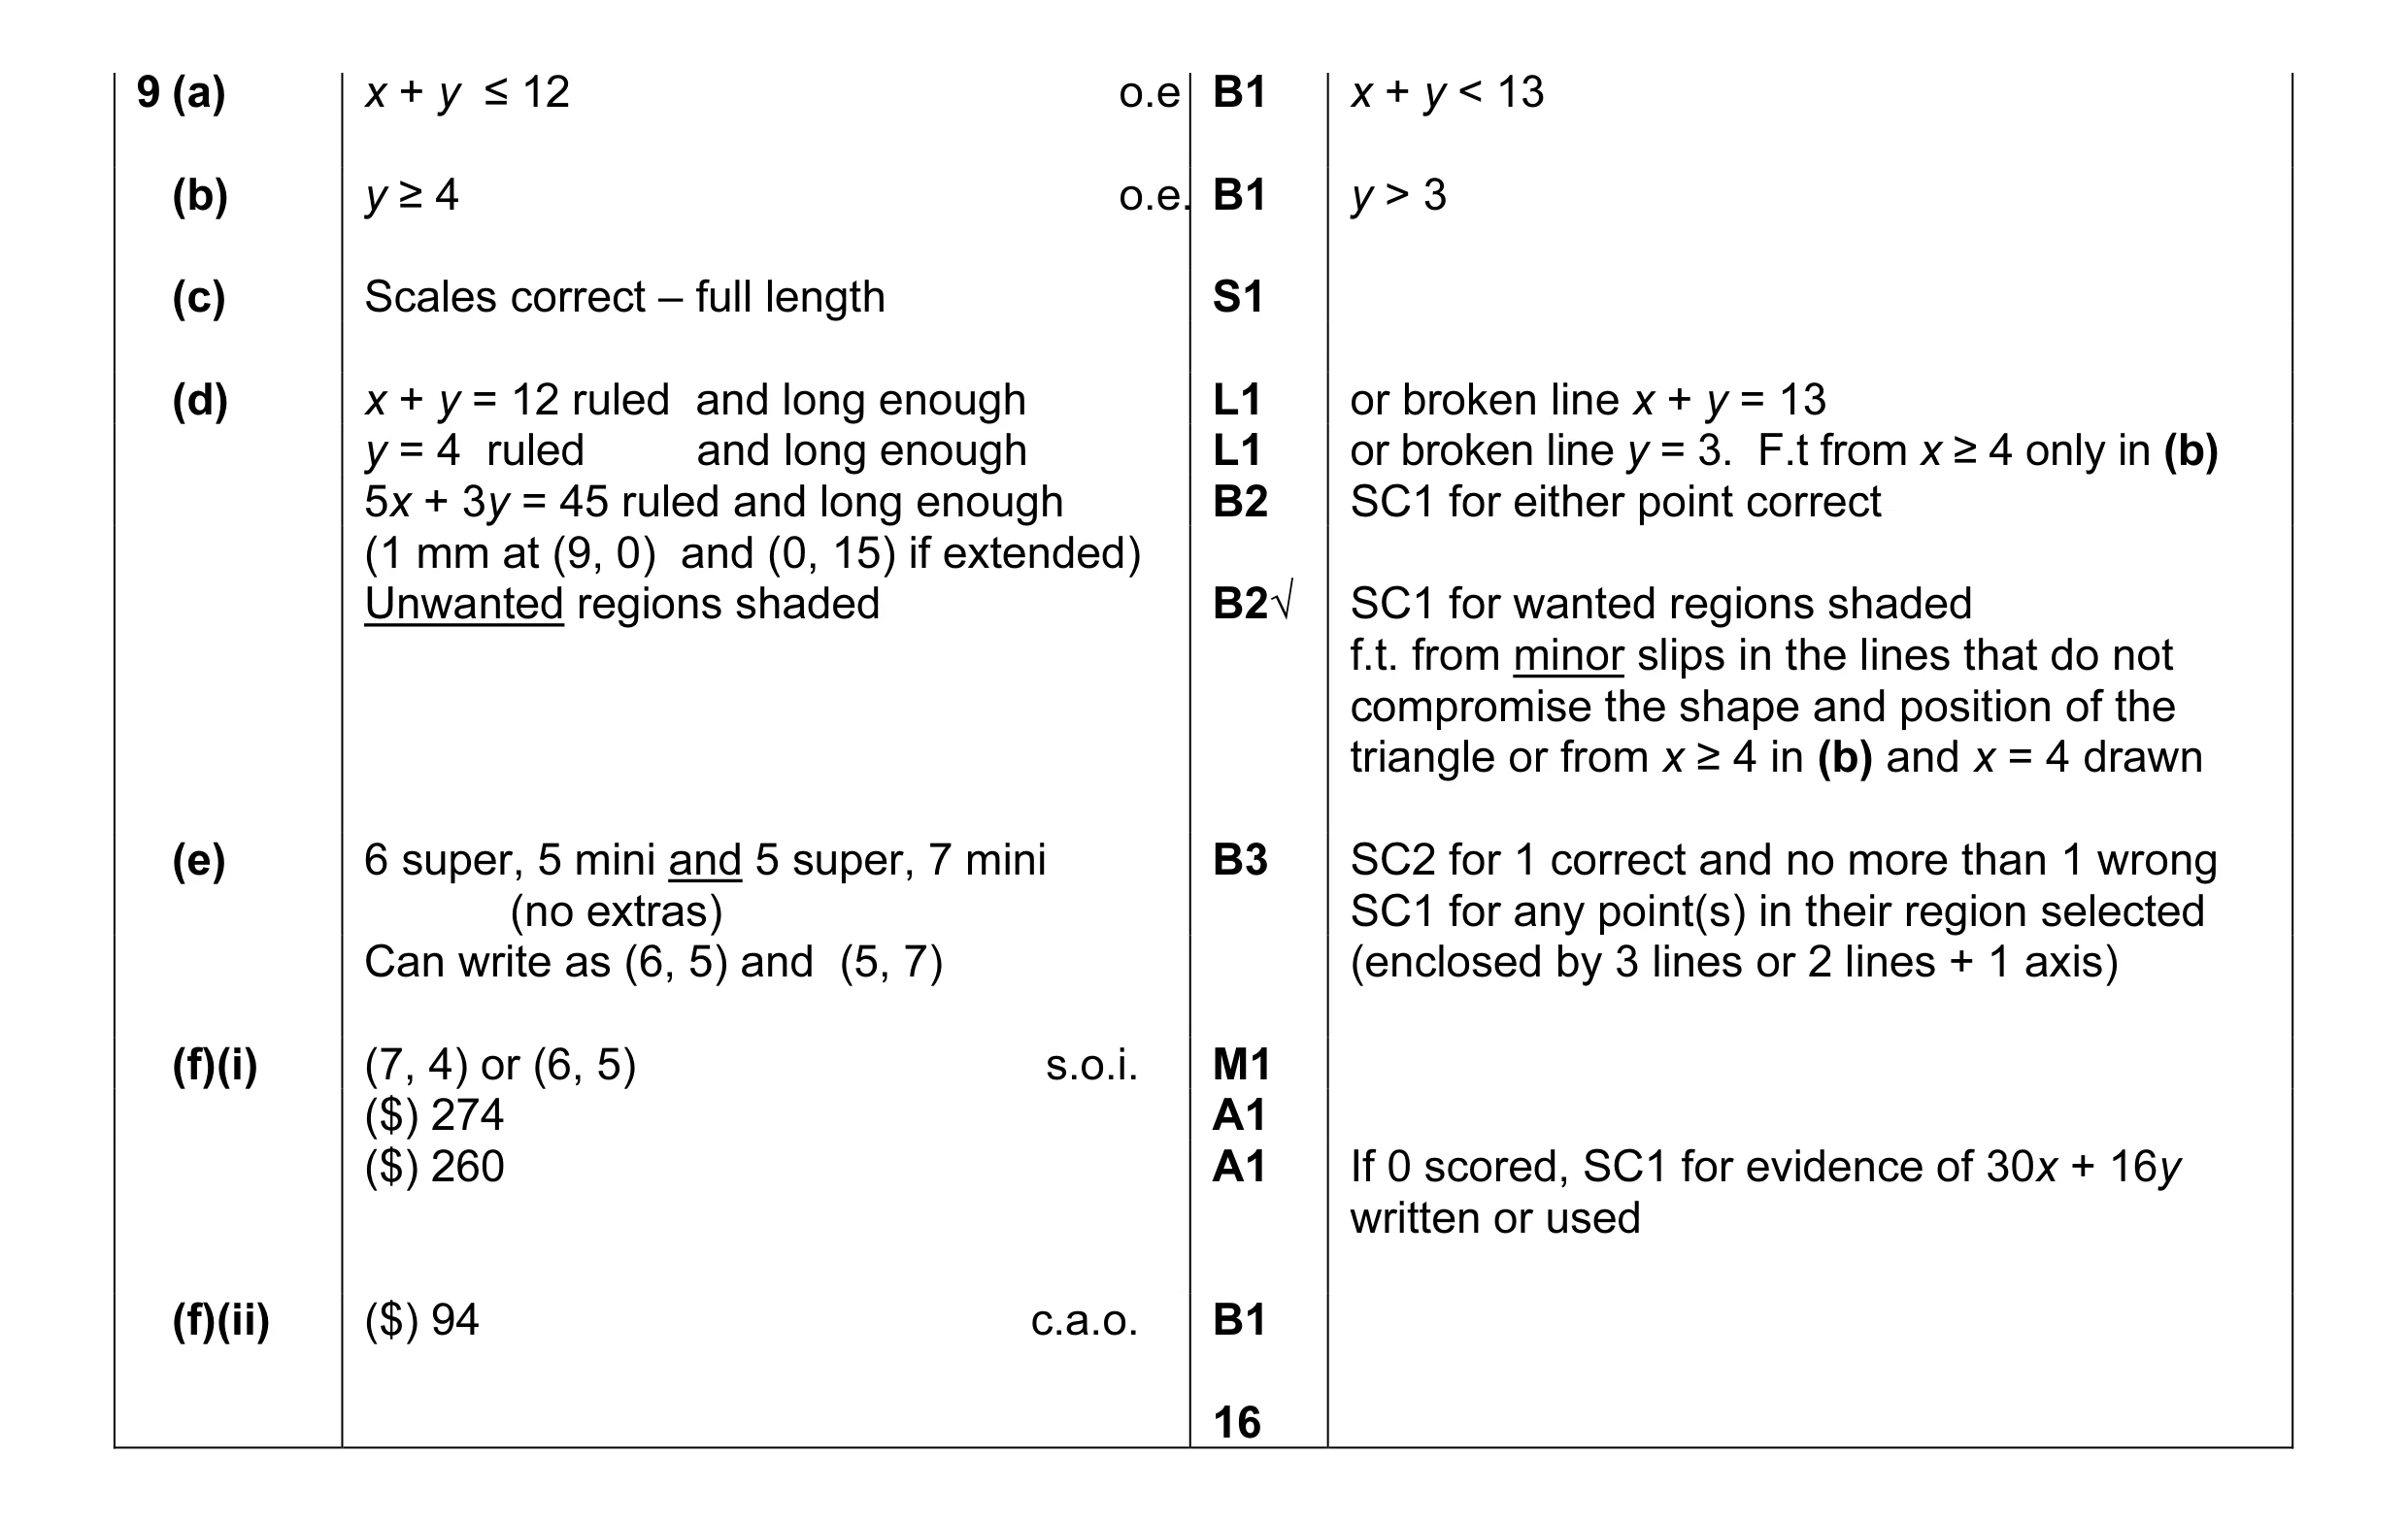
Mark scheme: 9 (a) x + y ≤ 12 o.e B1 x + y < 13 (b) y ≥ 4 o.e. B1 y > 3 (c) Scales correct – full length S1 (d) x + y = 12 ruled and long enough L1 or broken line x + y = 13 y = 4 ruled and long enough L1 or broken line y = 3. F.t from x ≥ 4 only in (b) 5x + 3y = 45 ruled and long enough B2 SC1 for either point correct (1 mm at (9, 0) and (0, 15) if extended) Unwanted regions shaded B2√ SC1 for wanted regions shaded f.t. from minor slips in the lines that do not compromise the shape and position of the triangle or from x ≥ 4 in (b) and x = 4 drawn (e) 6 super, 5 mini and 5 super, 7 mini B3 SC2 for 1 correct and no more than 1 wrong (no extras) SC1 for any point(s) in their region selected Can write as (6, 5) and (5, 7) (enclosed by 3 lines or 2 lines + 1 axis) (f)(i) (7, 4) or (6, 5) s.o.i. M1 ($) 274 A1 ($) 260 A1 If 0 scored, SC1 for evidence of 30x + 16y written or used (f)(ii) ($) 94 c.a.o. B1 16
This question in 0580/41 May/June 2005
Q2 · Mr Chang hires x large coaches and y small coaches to take 300 students on a school trip 0580/41 Oct/Nov 2011
8 Mr Chang hires x large coaches and y small coaches to take 300 students on a school trip. For Large coaches can carry 50 students and small coaches 30 students. Examiner's There is a maximum of 5 large coaches. Use (a) Explain clearly how the following two inequalities satisfy these conditions. (i) x Y 5 Answer(a)(i) [1] (ii) 5x + 3y [ 30 Answer(a)(ii) [2] Mr Chang also knows that x + y Y 10. (b) On the grid, show the information above by drawing three straight lines and shading the unwanted regions. y 10 8 6 4 2 x 0 2 4 6 8 10 [5] (c) A large coach costs $450 to hire and a small coach costs $350. For Examiner's (i) Find the number of large coaches and the number of small coaches that would give the Use minimum hire cost for this school trip. Answer(c)(i) Large coaches Small coaches [2] (ii) Calculate this minimum cost. Answer(c)(ii) $ [1]
11 marks
Mark scheme: 8 (a) (i) There are up to 5 large coaches 1 E.g. can’t hire more than 5 large coaches oe The maximum is 5 large coaches The large coaches are less than or equal to 5 (ii) 50x + 30y ≥ 300 oe E2 No errors Allow in words provided clear e.g. 50 in large coaches and 30 in small coaches must equal 300 seats or more M1 for associating 50 with x or large coaches and 30 with y or small coaches (b) Freehand lines –1 pen once. All lines must be long enough to make full boundary of their region accept dashed or solid lines x = 5 ruled L1 x + y = 10 ruled L1 5x + 3y = 30 ruled L2 L1 for ruled line with intercepts at (0, 10) or (6, 0) within 2mm by eye at intercepts (extend if line is short) Correct region indicated cao R1 Allow if slight inaccuracy(s) in diagonal lines Allow any clear indication of region (c) (i) 5 1 After 5 and 2 in working ignore attempts to 2 1 calculate costs (ii) 2950 1ft ft their 5 × 450 + their 2 × 350 provided positive integers
This question in 0580/41 Oct/Nov 2011
Q3 · Hassan stores books in large boxes and small boxes 0580/43 Oct/Nov 2011
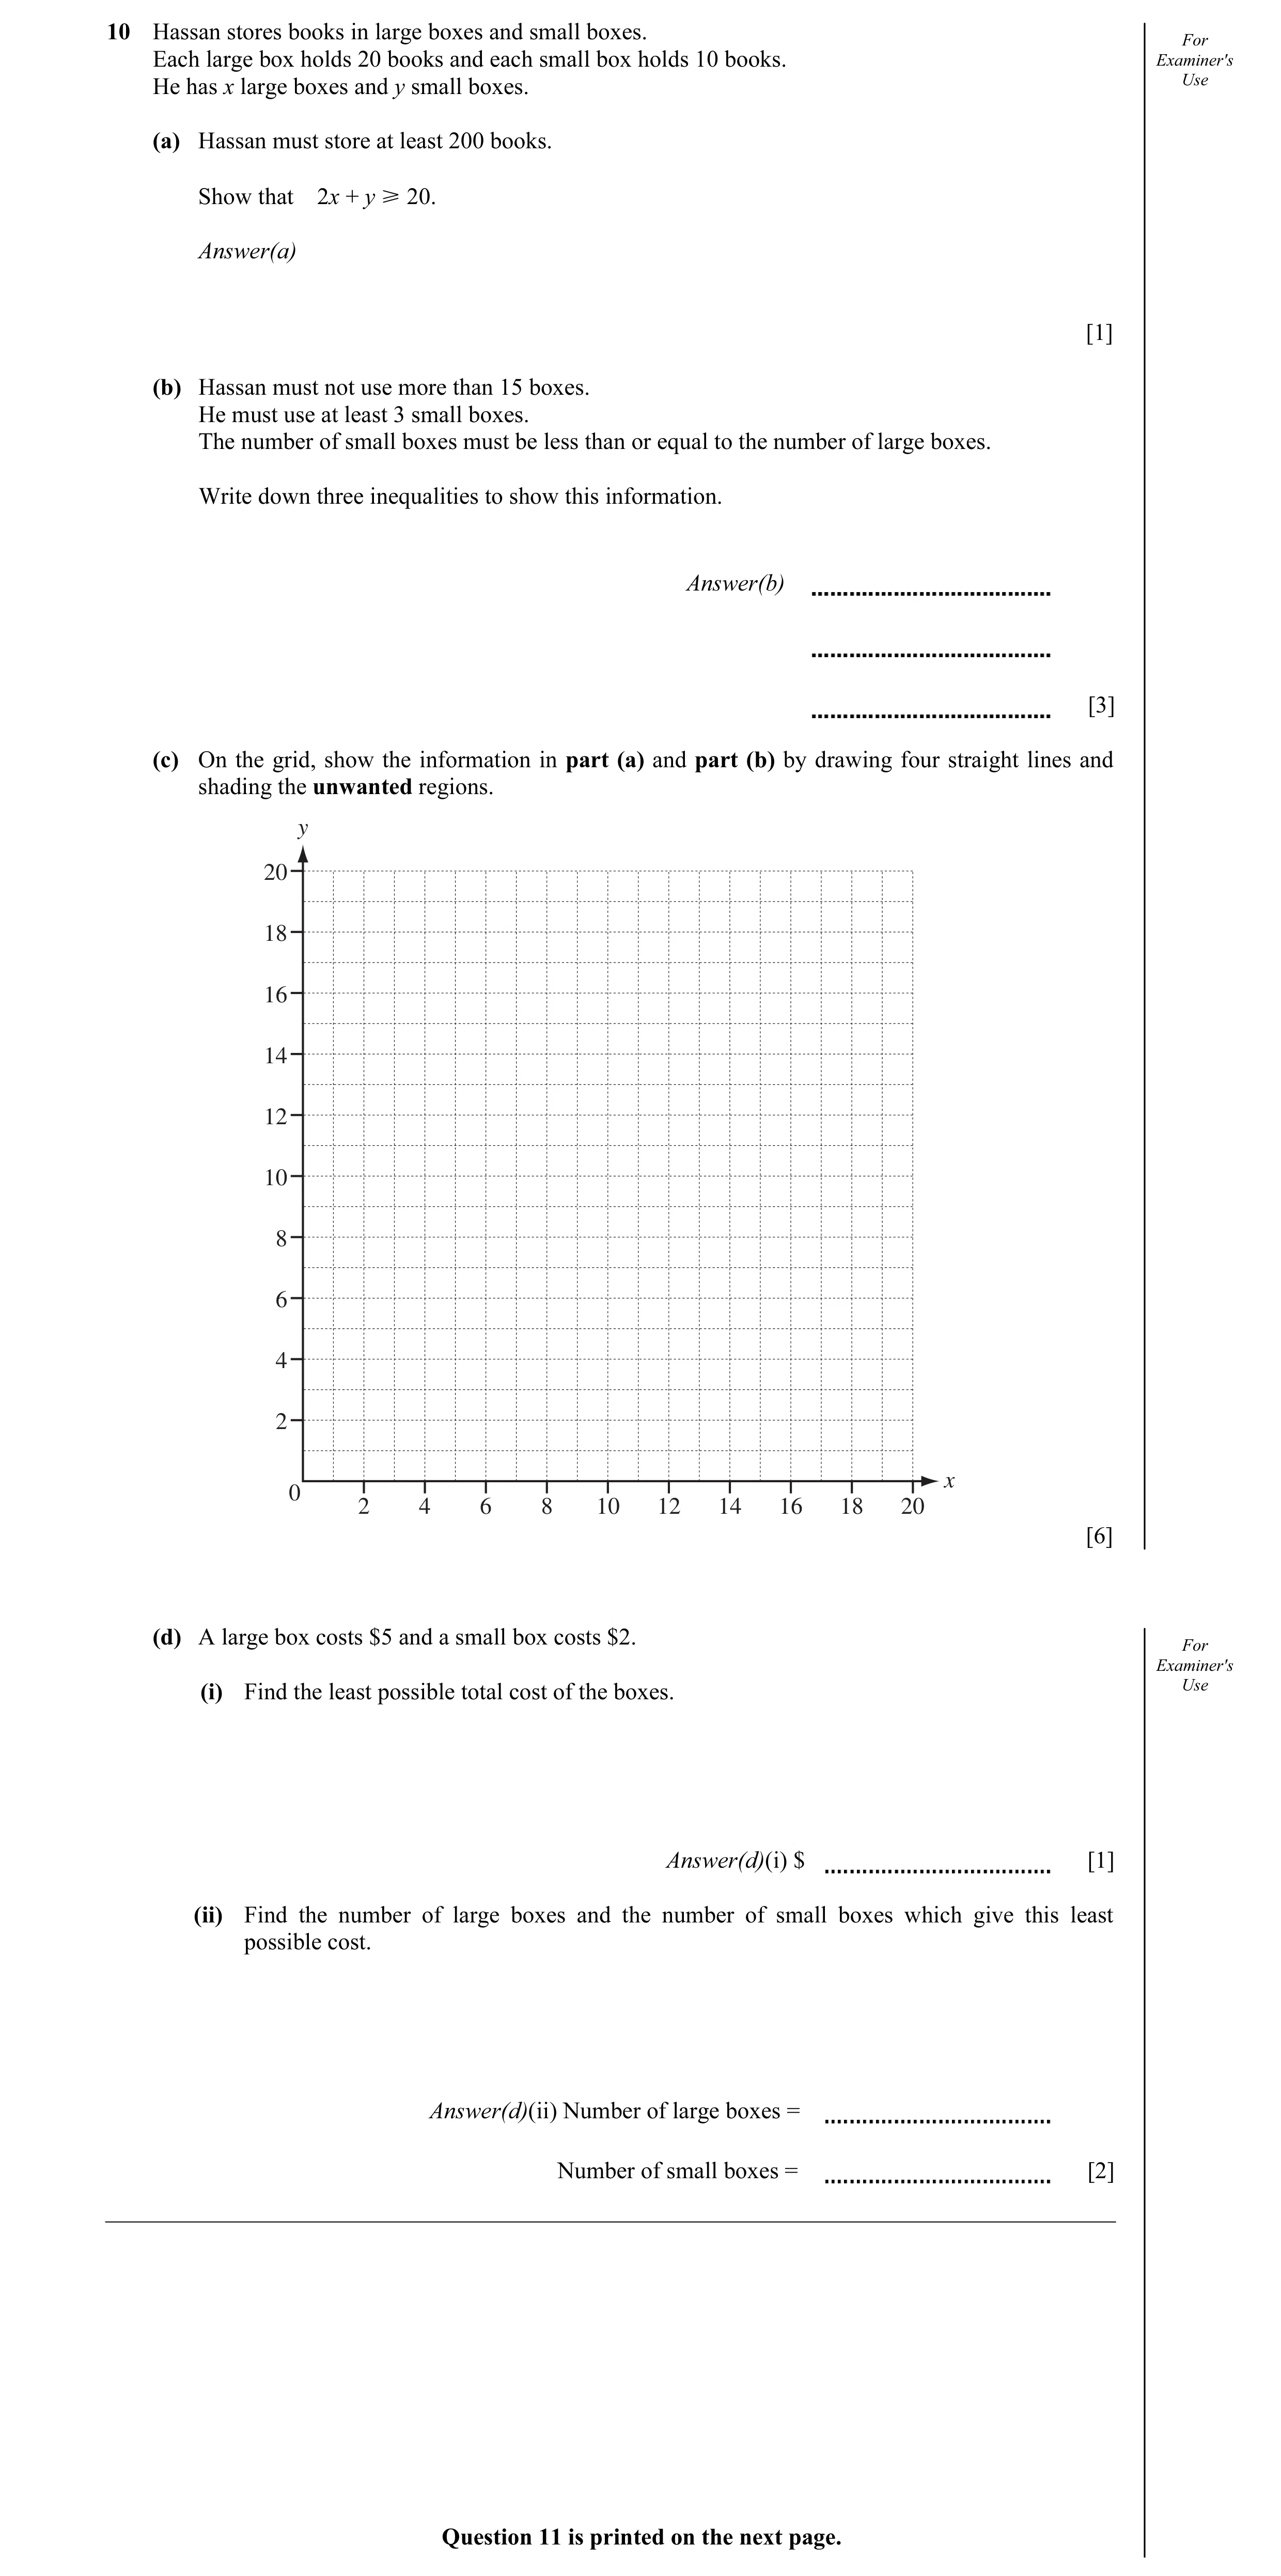
10 Hassan stores books in large boxes and small boxes. For Each large box holds 20 books and each small box holds 10 books. Examiner's He has x large boxes and y small boxes. Use (a) Hassan must store at least 200 books. Show that 2x + y [ 20. Answer(a) [1] (b) Hassan must not use more than 15 boxes. He must use at least 3 small boxes. The number of small boxes must be less than or equal to the number of large boxes. Write down three inequalities to show this information. Answer(b) [3] (c) On the grid, show the information in part (a) and part (b) by drawing four straight lines and shading the unwanted regions. y 20 18 16 14 12 10 8 6 4 2 x 0 2 4 6 8 10 12 14 16 18 20 [6] (d) A large box costs $5 and a small box costs $2. For Examiner's (i) Find the least possible total cost of the boxes. Use Answer(d)(i) $ [1] (ii) Find the number of large boxes and the number of small boxes which give this least possible cost. Answer(d)(ii) Number of large boxes = Number of small boxes = [2] Question 11 is printed on the next page.
13 marks
Mark scheme: 10 (a) 20x + 10y ≥ 200 1 In (a), (b) −1 once for wrong symbol (b) x + y ≤ 15, y ≥ 3, y ≤ x 3 B1 for each (c) All lines long enough to make full boundary of region, accept dashed or solid lines, 2 mm acc at intercepts 2x + y = 20 ruled B2 B1 for ruled line through (10, 0) or (0, 20) x + y = 15 ruled B1 y = x ruled B1 y = 3 ruled B1 −1 once, freehand Quadrilateral identified R1 Allow if slight inaccuracy(s) in diagonal lines Allow any clear indication of region (d) (i) 47 cao 1 (ii) 7, 6 cao 2 M1 for any 5x + 2y in their region evaluated to equal their 47 IGCSE – October/November 2011 0580 43 8
This question in 0580/43 Oct/Nov 2011
Q4 · Emily cycles along a path for 2 minutes 0580/41 Oct/Nov 2013
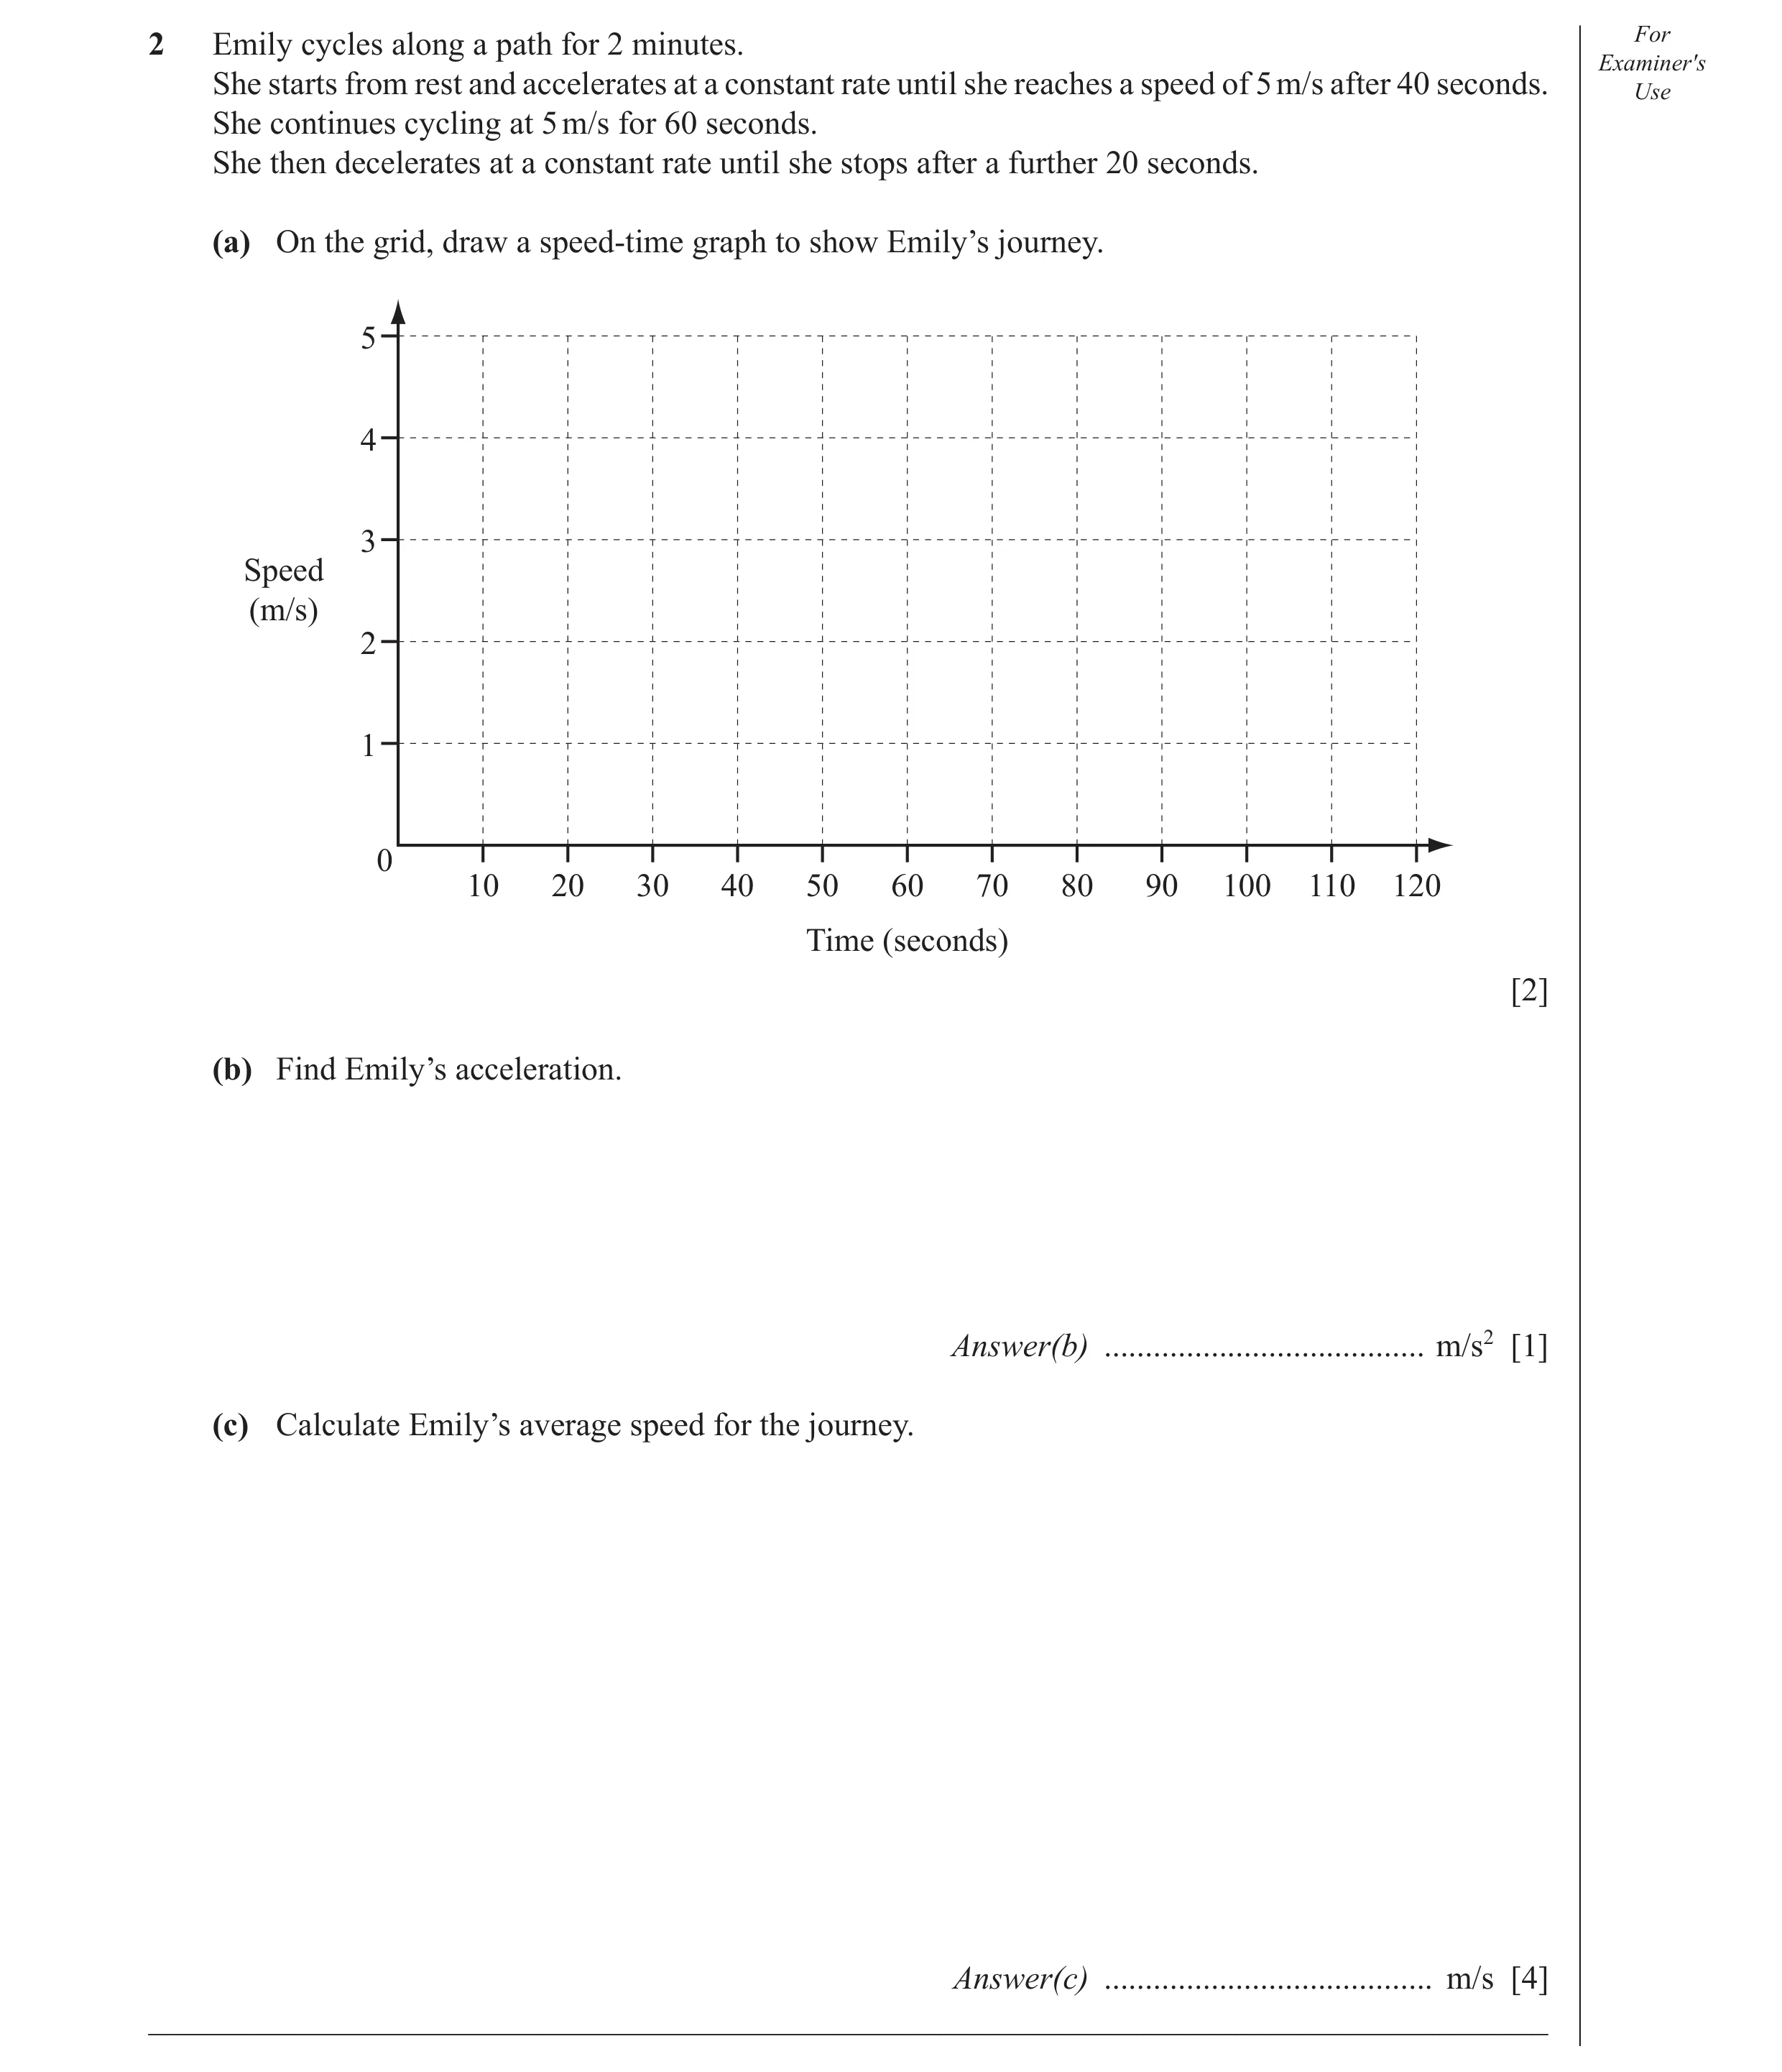
2 Emily cycles along a path for 2 minutes. For Examiner′s She starts from rest and accelerates at a constant rate until she reaches a speed of 5 m/s after 40 seconds. Use She continues cycling at 5 m/s for 60 seconds. She then decelerates at a constant rate until she stops after a further 20 seconds. (a) On the grid, draw a speed-time graph to show Emily’s journey. 5 4 3 Speed (m/s) 2 1 0 10 20 30 40 50 60 70 80 90 100 110 120 Time (seconds) [2] (b) Find Emily’s acceleration. Answer(b) … m/s2 [1] (c) Calculate Emily’s average speed for the journey. Answer(c) … m/s [4] _____________________________________________________________________________________
7 marks
Mark scheme: 2 (a) 3 correct lines on grid 2 Allow good freehand (0, 0) to (40, 5) SC1FT for 2 lines correct, FT from an incorrect (40, 5) to (100, 5) line (100, 5) to (120, 0) 5 (b) oe 1 40 (c) 3.75 4 M2 for 0.5 × 40 × 5 + 60 × 5 + 0.5 × 20 × 5 oe [450] or M1 for evidence of a relevant area = distance and M1dep their area (or distance) ÷ 120 IGCSE – October/November 2013 0580 41
This question in 0580/41 Oct/Nov 2013
Q5 · The school cook buys potatoes in small sacks, each of mass 4 kg, and large sacks, each of… 0580/42 Feb/March 2015
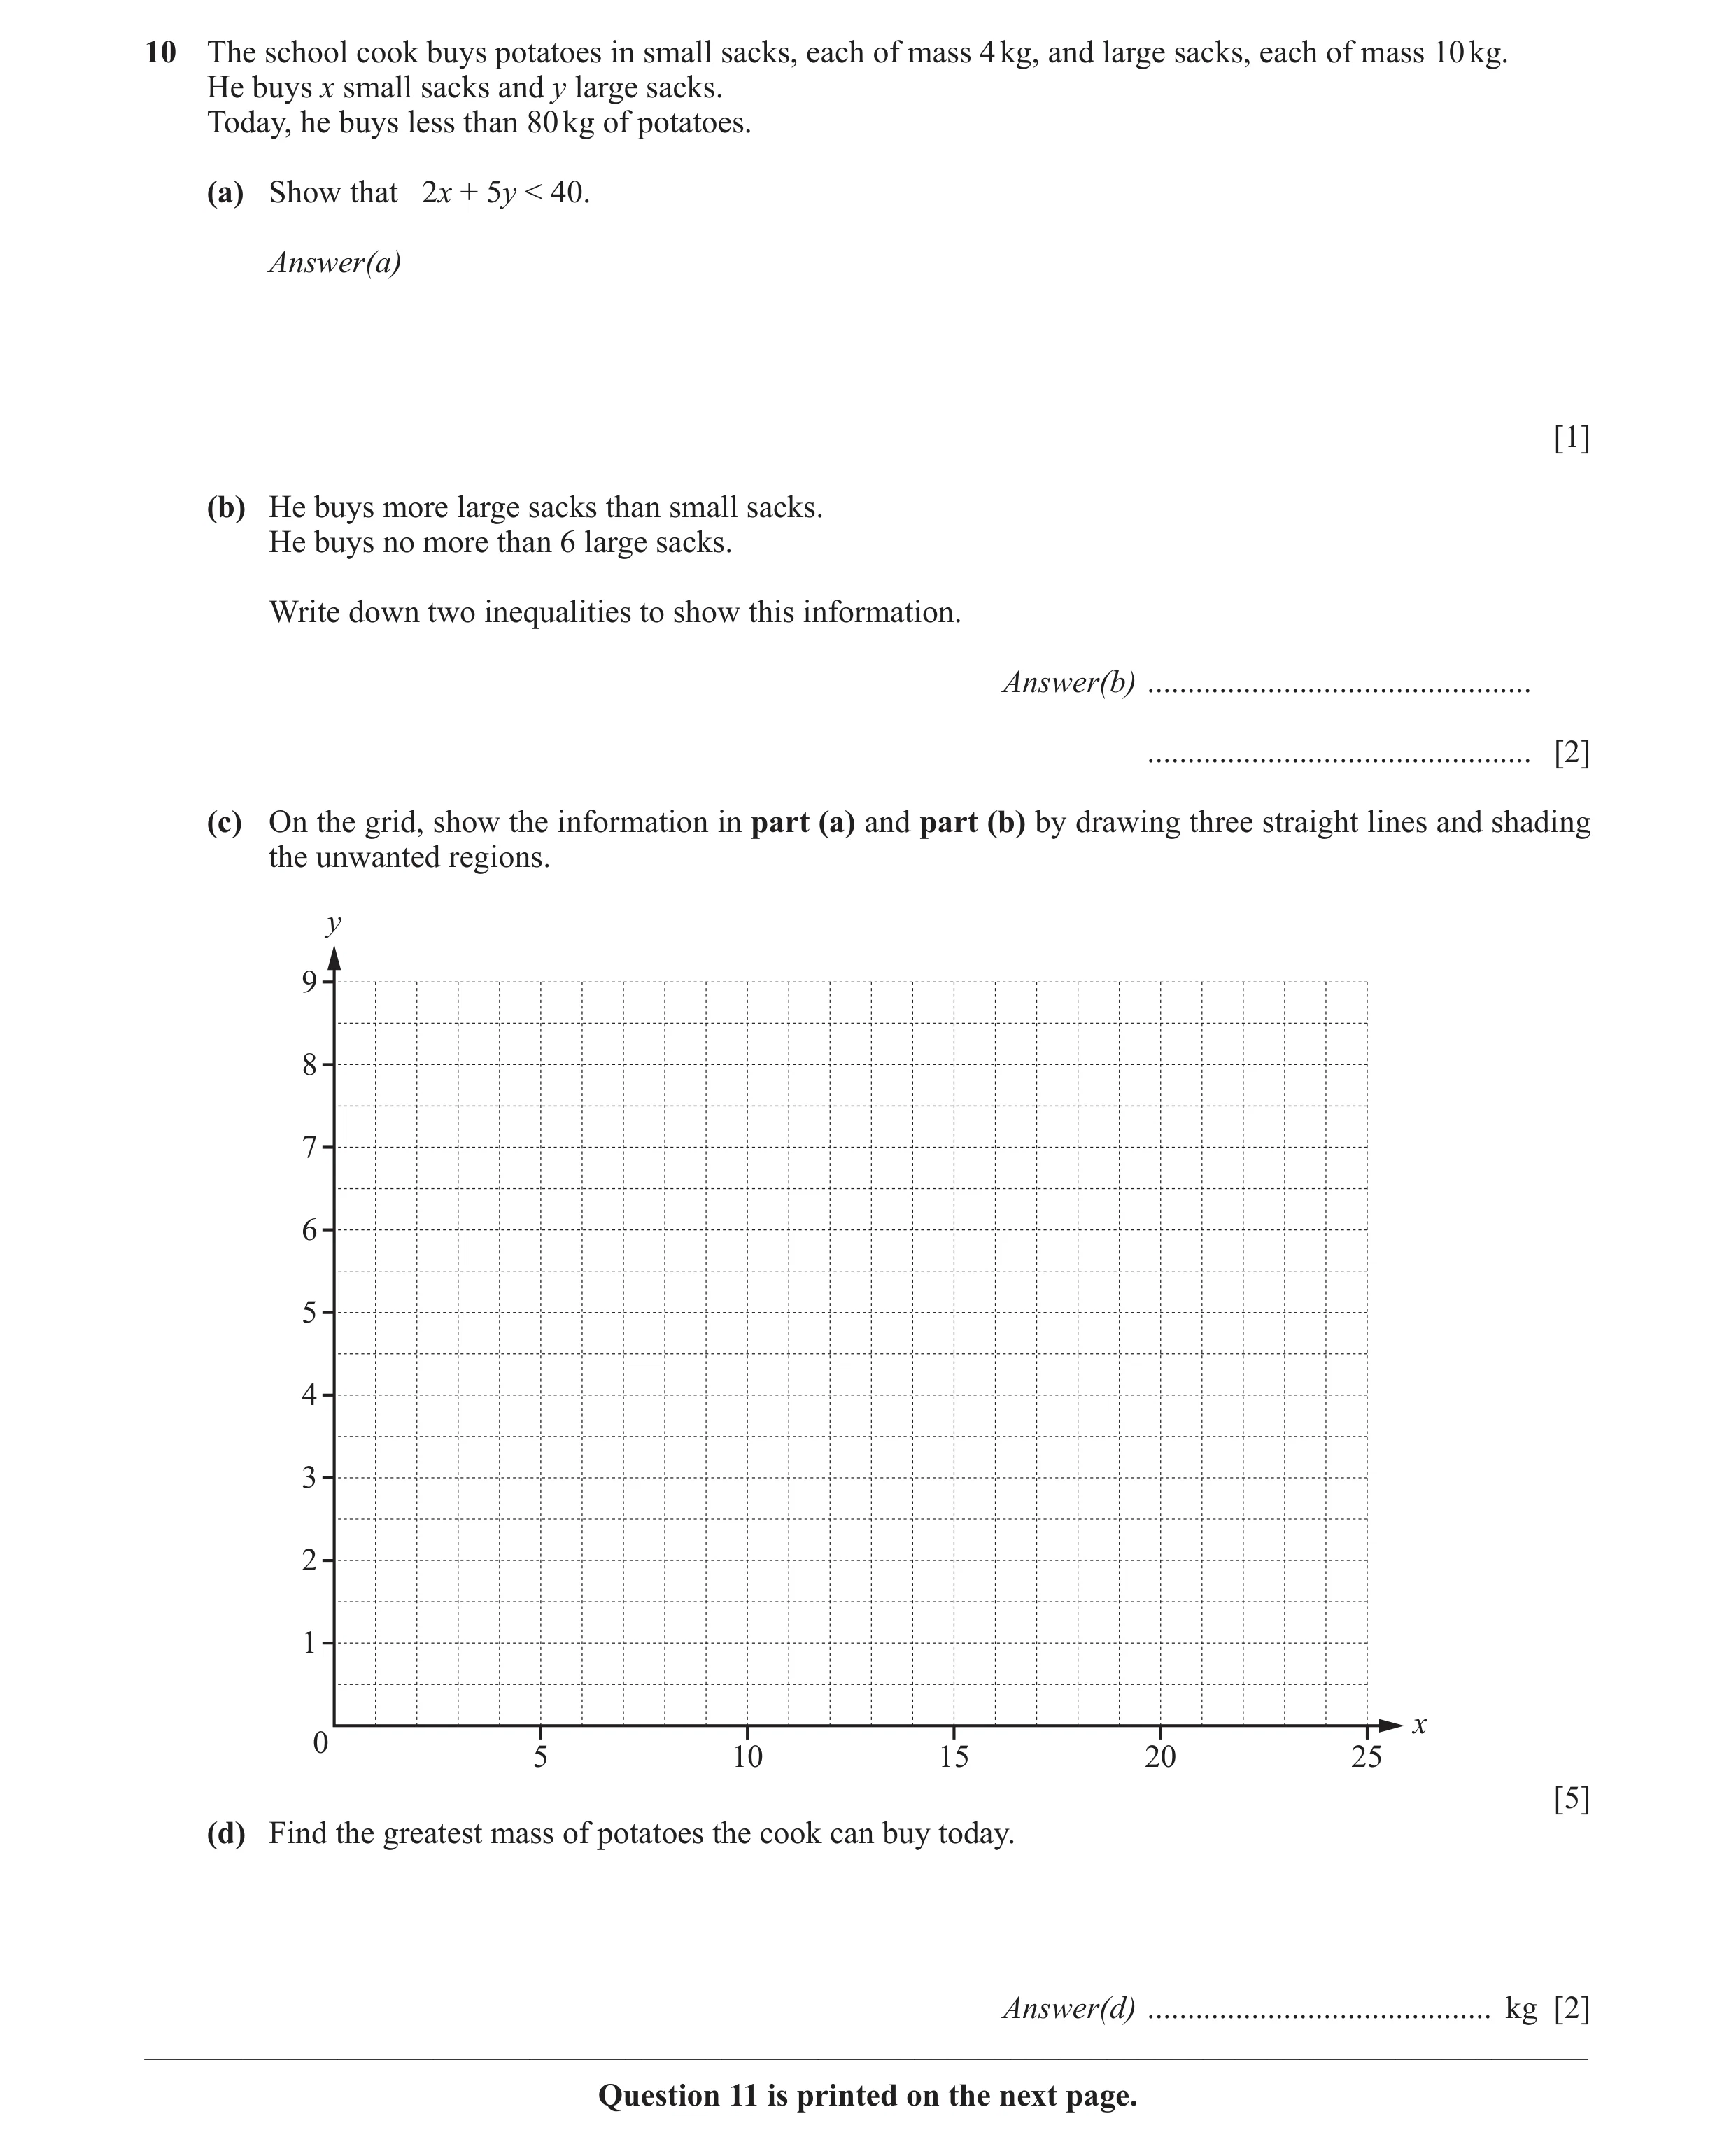
10 The school cook buys potatoes in small sacks, each of mass 4 kg, and large sacks, each of mass 10 kg. He buys x small sacks and y large sacks. Today, he buys less than 80 kg of potatoes. (a) Show that 2x + 5y < 40. Answer(a) [1] (b) He buys more large sacks than small sacks. He buys no more than 6 large sacks. Write down two inequalities to show this information. Answer(b) … … [2] (c) On the grid, show the information in part (a) and part (b) by drawing three straight lines and shading the unwanted regions. y 9 8 7 6 5 4 3 2 1 x 0 5 10 15 20 25 [5] (d) Find the greatest mass of potatoes the cook can buy today. Answer(d) … kg [2] __________________________________________________________________________________________ Question 11 is printed on the next page.
10 marks
Mark scheme: 10 (a) 4 x + 10 y < 80 1 With no errors seen (b) y > x 1 y ≤ 6 or y < 7 1 Accept 0 ≤ y ≤ 6 or 0 < y ≤ 6 or 0 ≤ y < 7 or 0 < y < 7 (c) ruled broken line through (5, 6) to B2 SC1 for correct only at (5, 6) or (10, 4) (10,4) ruled broken line y = x B1 ruled solid line y = 6 or broken y = 7 B1 Must be consistent with their (b) correct region indicated B1 (d) 76 2 SC1 for ( 4, 6 ) indicated or 4 x + 10 y evaluated for ( x, y ) in their region, x, y integers
This question in 0580/42 Feb/March 2015
Q6 · 200 NOT TO SCALE 150 Distance (km) 50 0 07 00 07 30 07 40 08 10 09 10 Time The… 0580/42 May/June 2017
9 (a) 200 NOT TO SCALE 150 Distance (km) 50 0 07 00 07 30 07 40 08 10 09 10 Time The distance-time graph shows the journey of a train. (i) Find the speed of the train between 07 00 and 07 30. … km/h [1] (ii) Find the average speed for the whole journey. … km/h [3] (b) V NOT TO SCALE Speed (km/ h) 0 06 00 06 05 06 25 06 30 Time The speed-time graph shows the first 30 minutes of another train journey. The distance travelled is 100 km. The maximum speed of the train is V km/h. (i) Find the value of V. V = … [3] (ii) Find the acceleration of the train during the first 5 minutes. Give your answer in m/s2. … m/s2 [2] Question 10 is printed on the next page.
9 marks
Mark scheme: 9(a)(i) 100 1 9(a)(ii) 92.3 or 92.29… to 92.31 3 10 M2 for 200 ÷ (2 + ) oe 60 or M1 for 200 ÷ their time interval 10 or M1 for soi oe 60 9(b)(i) 240 nfww 3 V 30 20 M2 for + = 100 oe 2 60 60 or M1 for any correct relevant area seen in terms of V 9(b)(ii) 2 2FT FT for their (b)(i) ÷ 1080 to 3 sf or better oe 1000 9 M1 for their (b)(i) × soi 3600
This question in 0580/42 May/June 2017
Q7 · The graph shows information about the journey of a train between two stations 0580/43 Oct/Nov 2017
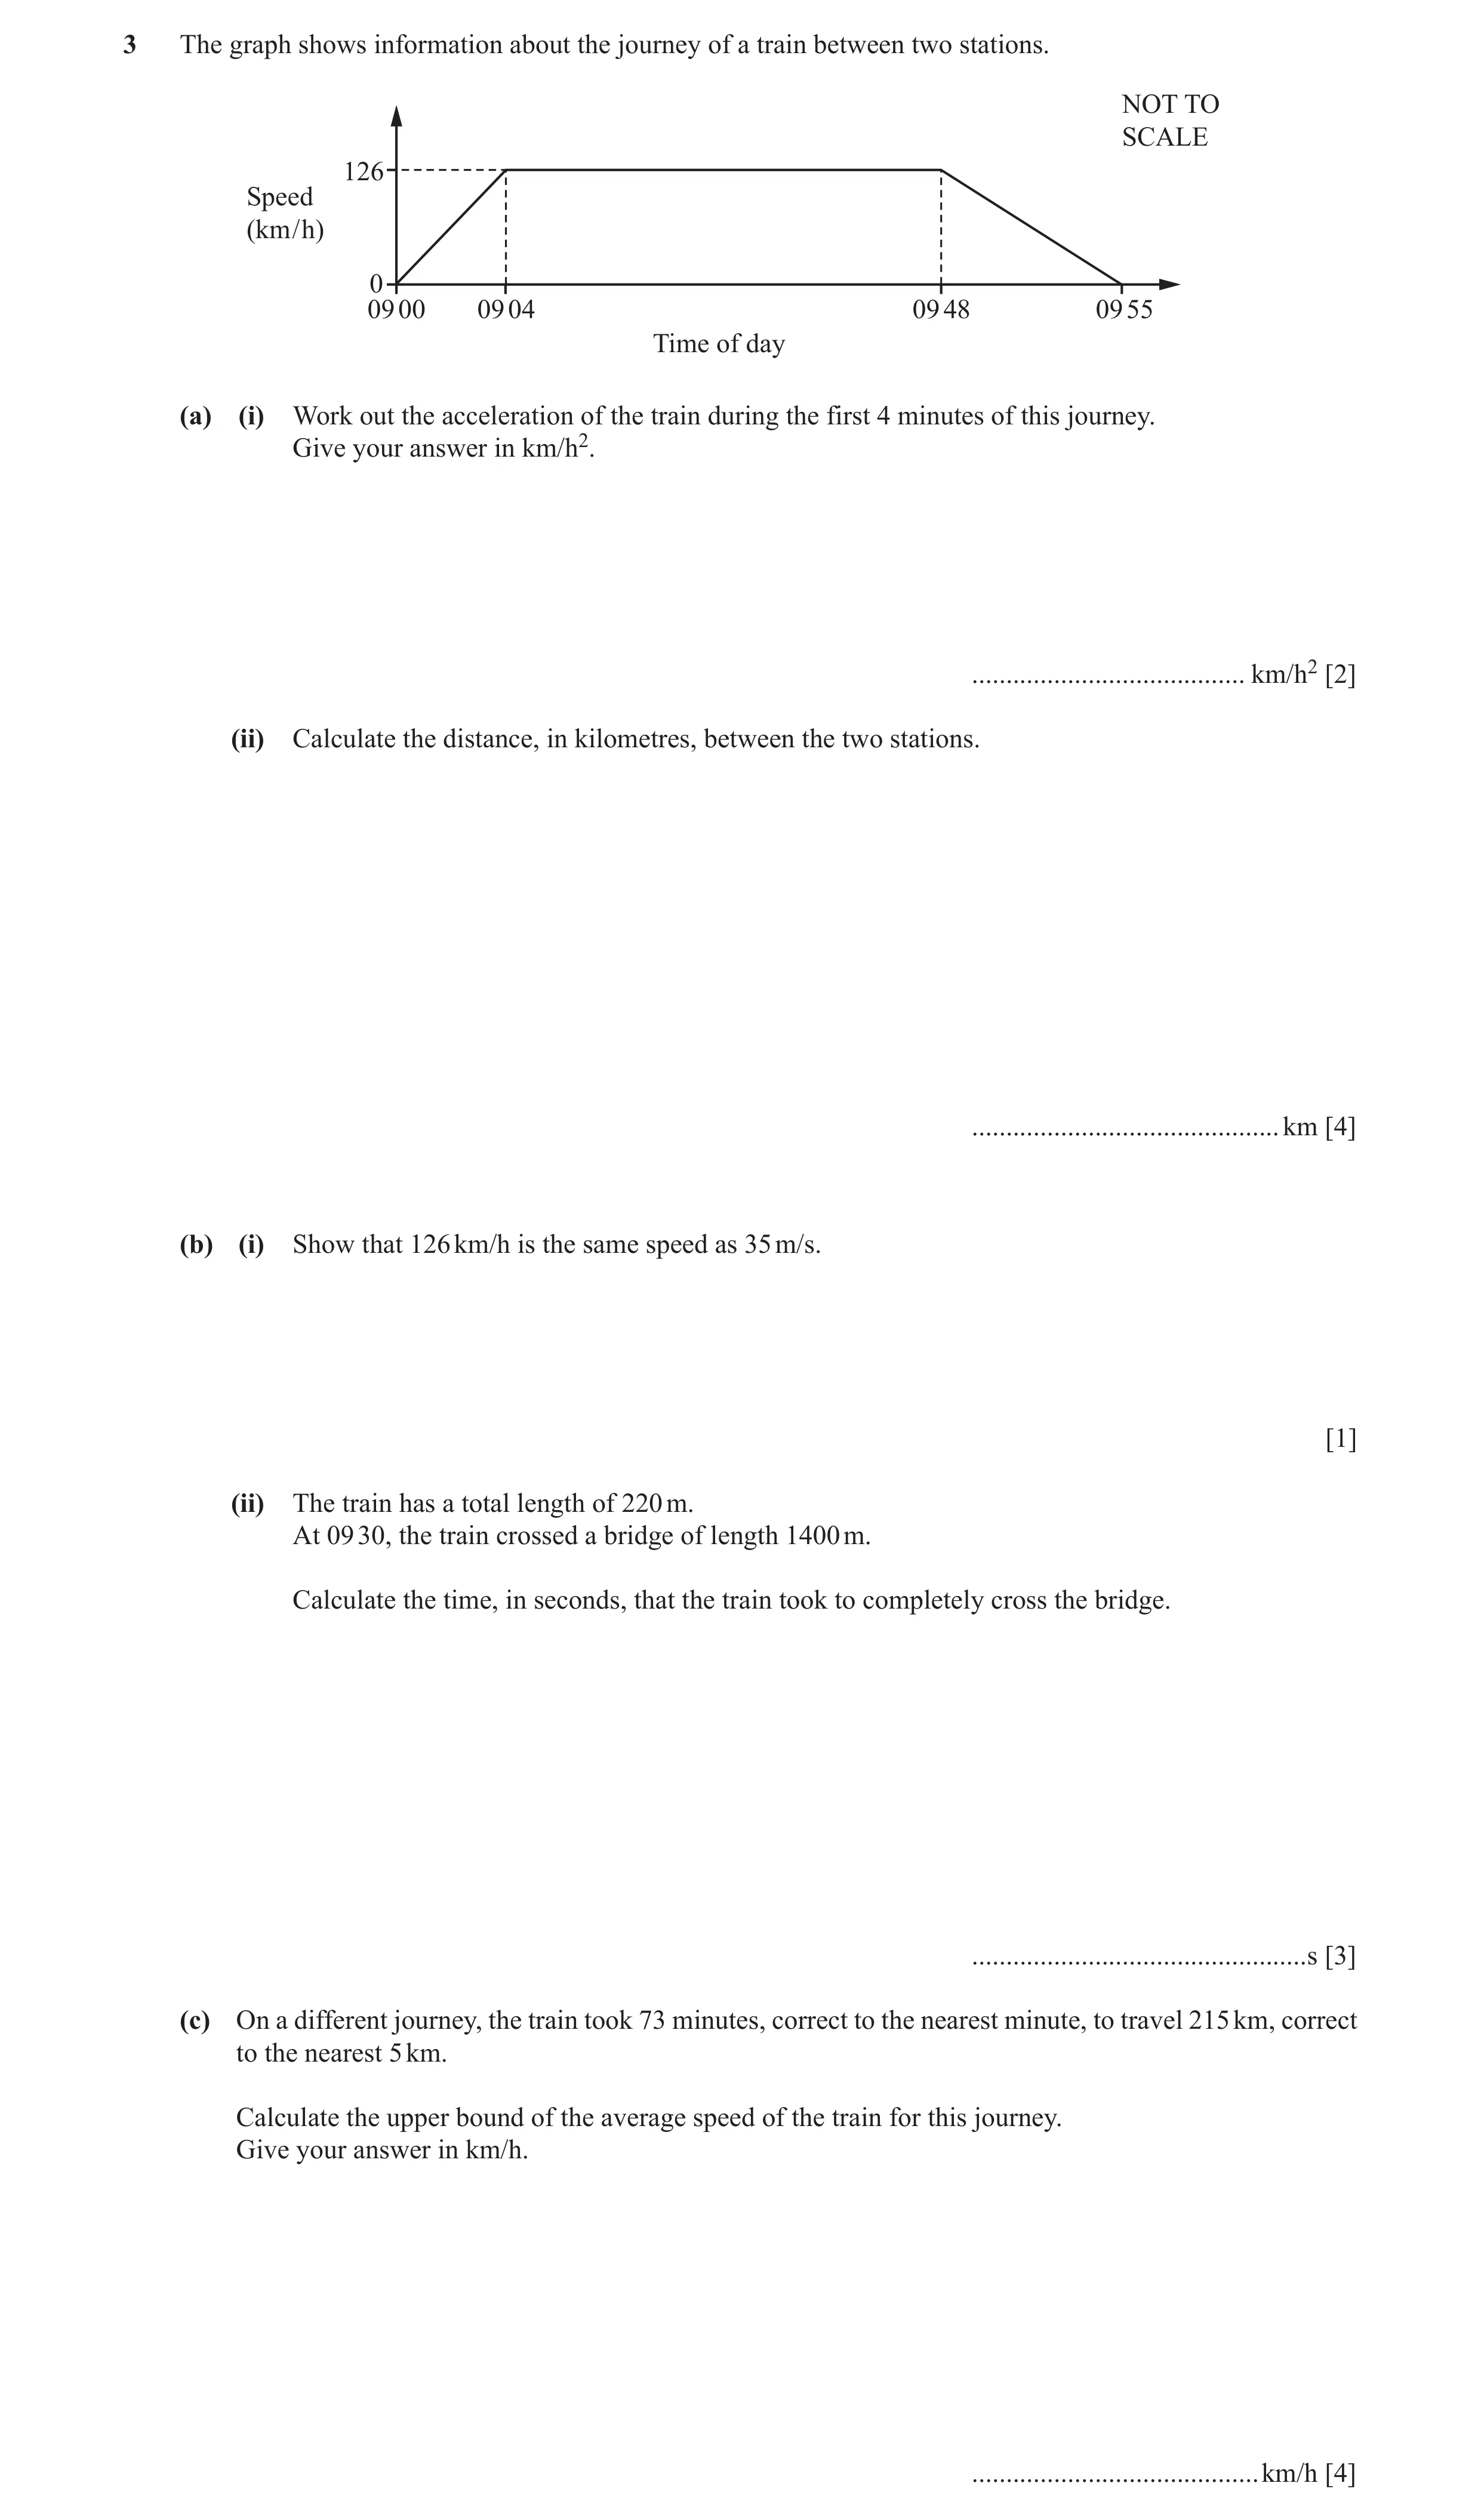
3 The graph shows information about the journey of a train between two stations. NOT TO SCALE 126 Speed (km / h) 0 09 00 09 04 09 48 09 55 Time of day (a) (i) Work out the acceleration of the train during the first 4 minutes of this journey. Give your answer in km/h2. … km/h2 [2] (ii) Calculate the distance, in kilometres, between the two stations. … km [4] (b) (i) Show that 126 km/h is the same speed as 35 m/s. [1] (ii) The train has a total length of 220 m. At 09 30, the train crossed a bridge of length 1400 m. Calculate the time, in seconds, that the train took to completely cross the bridge. … s [3] (c) On a different journey, the train took 73 minutes, correct to the nearest minute, to travel 215 km, correct to the nearest 5 km. Calculate the upper bound of the average speed of the train for this journey. Give your answer in km/h. … km/h [4]
14 marks
Mark scheme: 3(a)(i) 1890 2 M1 for 126 ÷ 4 [× 60] oe If zero scored, SC1 for answer 31.5 3(a)(ii) 103.95 4 44 55 M3 for 0.5 × + × 126 oe 60 60 or SC3 for figs 10395 or figs 104 or M2 for two correct area methods or for a full method without minutes to hours conversion or M1 for one correct area with or without minutes to hours conversion 3(b)(i) 126 × 1000 ÷ (60 × 60) 1 3(b)(ii) 46.3 or 46.28 to 46.29 3 M2 for (1400 + 220) ÷ 35 oe or M1 for distance ÷ speed or 1400 + 220 3(c) 180 nfww 4 B3 for final answer 3 OR 217.5 M3 for × 60 oe 72.5 or M2 for 217.5 ÷ 72.5 oe 210 to 220 or × 60 72.5 217.5 or × 60 72 to 74 215 or M1 for 217.5 or 72.5 seen or × 60 73
This question in 0580/43 Oct/Nov 2017
Q8 · The diagram shows the speed−time graph for the first 180 seconds of a train journey 0580/41 May/June 2021
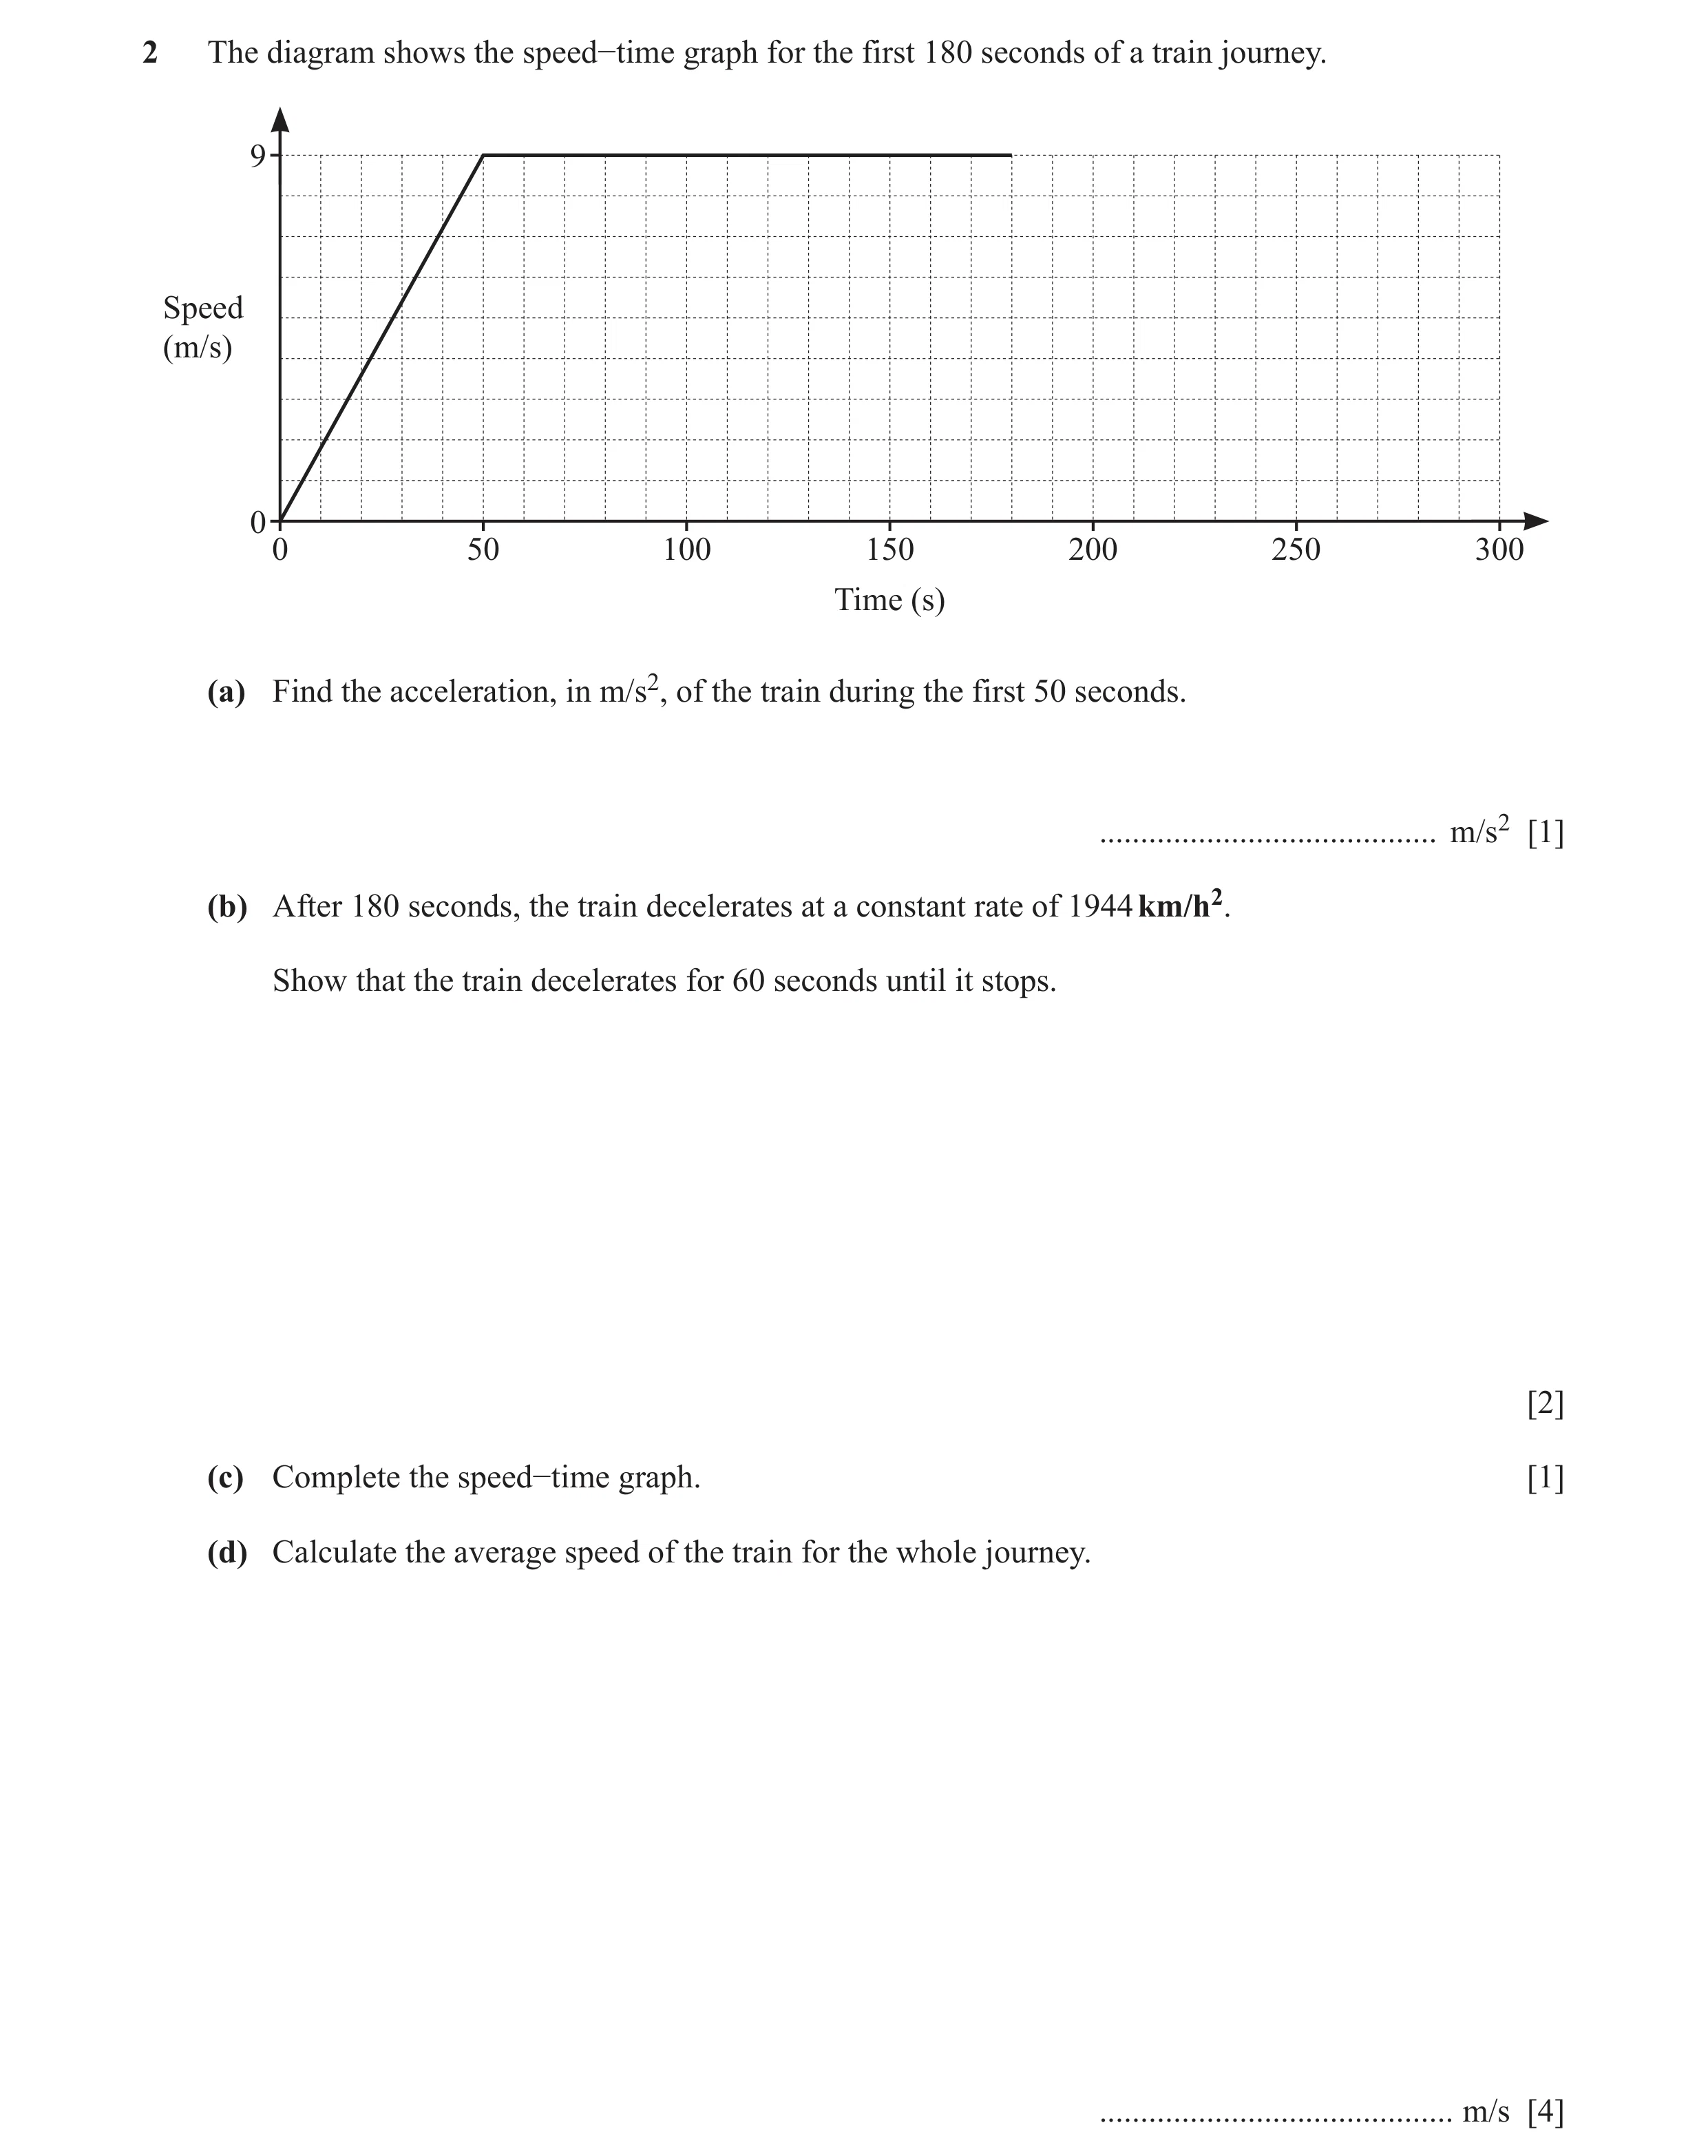
2 The diagram shows the speed−time graph for the first 180 seconds of a train journey. 9 Speed (m/s) 0 0 50 100 150 200 250 300 Time (s) (a) Find the acceleration, in m/s2, of the train during the first 50 seconds. … m/s2 [1] (b) After 180 seconds, the train decelerates at a constant rate of 1944 km/h2. Show that the train decelerates for 60 seconds until it stops. [2] (c) Complete the speed−time graph. [1] (d) Calculate the average speed of the train for the whole journey. … m/s [4]
8 marks
Mark scheme: 2(a) 9 1 0.18 or 50 2(b) 1000 M1 1944 × 3600 × 3600 9 ÷ 0.15 = 60 M1 2(c) 1 ruled line to axis with point of contact at 240 240 2(d) 6.9375 4 1 M2 for area = × (130 + 240 ) × 9 oe 2 or M1 for one correct partial area M1dep for their total area ÷ 240
This question in 0580/41 May/June 2021
Q9 · Kaito runs along a 12 km path at an average speed of x km/h 0580/42 Oct/Nov 2021
8 (a) Kaito runs along a 12 km path at an average speed of x km/h. (i) Write down an expression, in terms of x, for the number of hours he takes. … hours [1] (ii) Yuki takes 1.5 hours longer to walk along the same path as Kaito. She walks at an average speed of ( x - 4 ) km/h. Write down an equation, in terms of x, and show that it simplifies to x 2 - 4x - 32 = 0 . [4] (iii) Solve by factorisation. x 2 - 4x - 32 = 0 x = … or x = … [3] (iv) Find the number of hours it takes Yuki to walk along the 12 km path. … hours [2] (b) A bus travels 440 km, correct to the nearest 10 km. The time taken to complete the journey is 6 hours, correct to the nearest half hour. Calculate the lower bound of the speed of the bus. … km/h [3]
13 marks
Mark scheme: 8(a)(i) 12 1 or 12 ÷ x final answer x 8(a)(ii) 12 12 M1 Accept 3 or more term equivalents – their = 1.5oe x − 4 x 12x – 12(x – 4) = 1.5x(x – 4) M1 Correctly clearing fractions, or correctly or collecting into a ‘single fraction’ 12 x − 12( x − 4) FT their expression dep on two fractions both [= 1.5] x ( x − 4) with algebraic denominators 12x – 12x + 48 = 1.5x2 – 6x M1 Correctly multiplying their two sets of brackets FT their expression dep on two fractions both with algebraic denominators or first M1 given [1.5x2 – 6x – 48 = 0 ] A1 One further step either 3 term equation or division throughout by 1.5 leading to solution x2 – 4x – 32=0 With no errors or omissions seen, dep on M3 8(a)(iii) (x + 4)(x – 8) M2 M1 for (x + a)(x + b) where ab = –32 or a + b = –4 or for x(x + 4) – 8(x + 4) or x(x – 8) + 4(x – 8) –4 and 8 B1 8(a)(iv) 3 2 12 FT their 8 − 4 12 12 M1 for or + 1.5 oe their 8 − 4 their 8 12 or for answer their 8 8(b) 69.6 3 430 to 440 440 − 5 M2 for or oe 6 + 0.25 6 to 6.5 or M1 for 440 + 5 oe or 440 – 5 oe or 6 + 0.25 oe or 6 – 0.25 oe seen
This question in 0580/42 Oct/Nov 2021
Q10 · The diagram shows the speed–time graph for part of a journey for two vehicles, a car and… 0580/42 Oct/Nov 2022
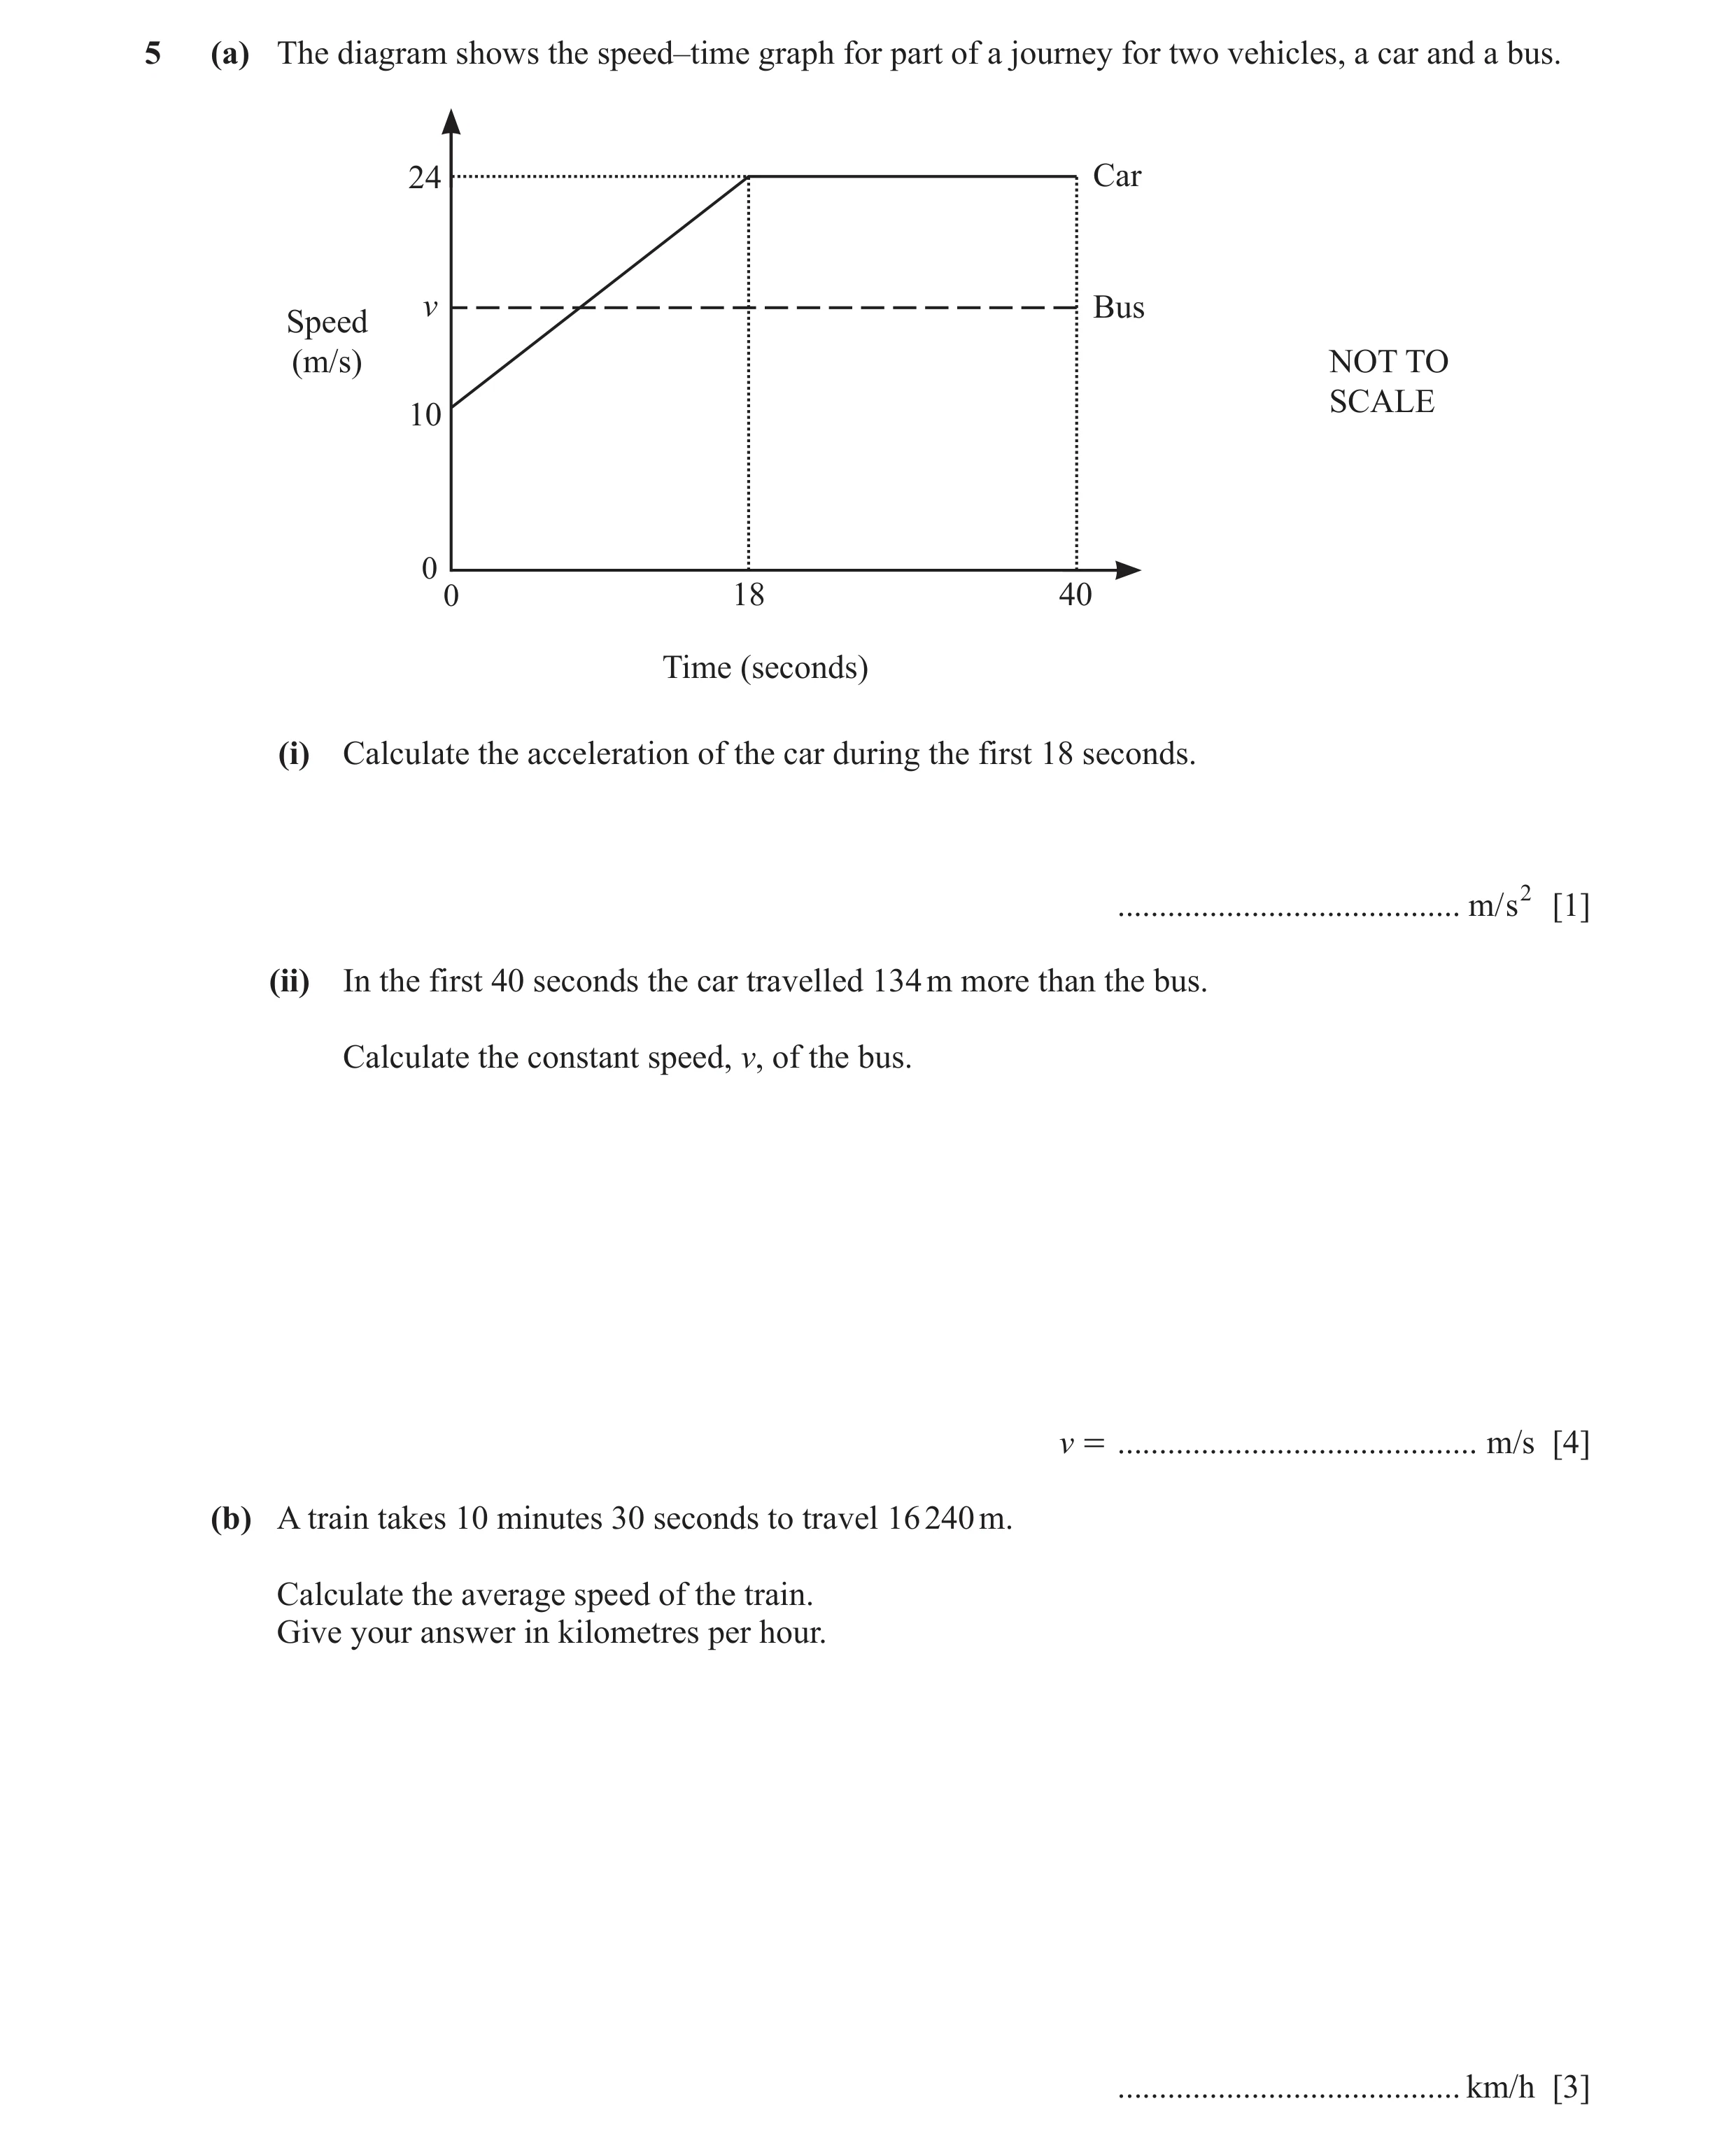
5 (a) The diagram shows the speed–time graph for part of a journey for two vehicles, a car and a bus. 24 Car v Bus Speed (m/s) NOT TO SCALE 10 0 0 18 40 Time (seconds) (i) Calculate the acceleration of the car during the first 18 seconds. … m/s2 [1] (ii) In the first 40 seconds the car travelled 134 m more than the bus. Calculate the constant speed, v, of the bus. v = … m/s [4] (b) A train takes 10 minutes 30 seconds to travel 16 240 m. Calculate the average speed of the train. Give your answer in kilometres per hour. … km/h [3]
8 marks
Mark scheme: 5(a)(i) 14 1 oe 18 5(a)(ii) 17.5 4 1 M3 for (10 + 24 )18 + 22 24 – 134 = 40v oe 2 1 or M2 for (10 + 24 )18 + 22 24 oe 2 or B2 for [distance covered by bus =] 700 or M1 for correct method for any partial area for the car or for 40v 5(b) 4 3 figs162[4] 92.8 or 92 M1 for oe 5 their 10min30sec 60 M1 for correct conversion to km/h, e.g. 1000
This question in 0580/42 Oct/Nov 2022
Q11 · A baker decorates x small cakes and y large cakes 0580/42 May/June 2024
8 A baker decorates x small cakes and y large cakes. In one day, he decorates: • not more than 16 small cakes • less than 10 large cakes • more small cakes than large cakes • a total of not more than 24 cakes. One of the inequalities that shows this information is x G 16 . (a) Write down the other three inequalities in x and/or y. … … … [3] (b) On the grid, draw four straight lines and shade the unwanted regions to show these inequalities. Label the region, R, which satisfies the four inequalities. y 26 24 22 20 18 16 14 12 10 8 6 4 2 x 0 2 4 6 8 10 12 14 16 18 20 22 24 26 [6] (c) The baker earns $8 for decorating a small cake and $12 for decorating a large cake. Use your diagram to find the largest amount the baker can earn in one day by decorating cakes. $ … [2]
11 marks
Mark scheme: 8(a) y < 10 3 B1 for each y x oe x + y ⩽ 24 oe If 0 scored, SC1 for y ⩽ 10 and y ⩽ x and x + y < 24 8(b) Correct lines and region indicated 6 B1 for each correct line and c c c R B2 for R in correct region for all 4 correct c lines or B1 for R in any one of the regions marked c or B1 for R that satisfies 3 of the correct inequalities 8(c) 228 nfww 2 M1 for 8x + 12y for any (x, y) in their R, x, y both integer or x = 15, y = 9
This question in 0580/42 May/June 2024
Q12 · The graph shows the speed of a cyclist during a journey of 30 seconds 0580/42 Feb/March 2025
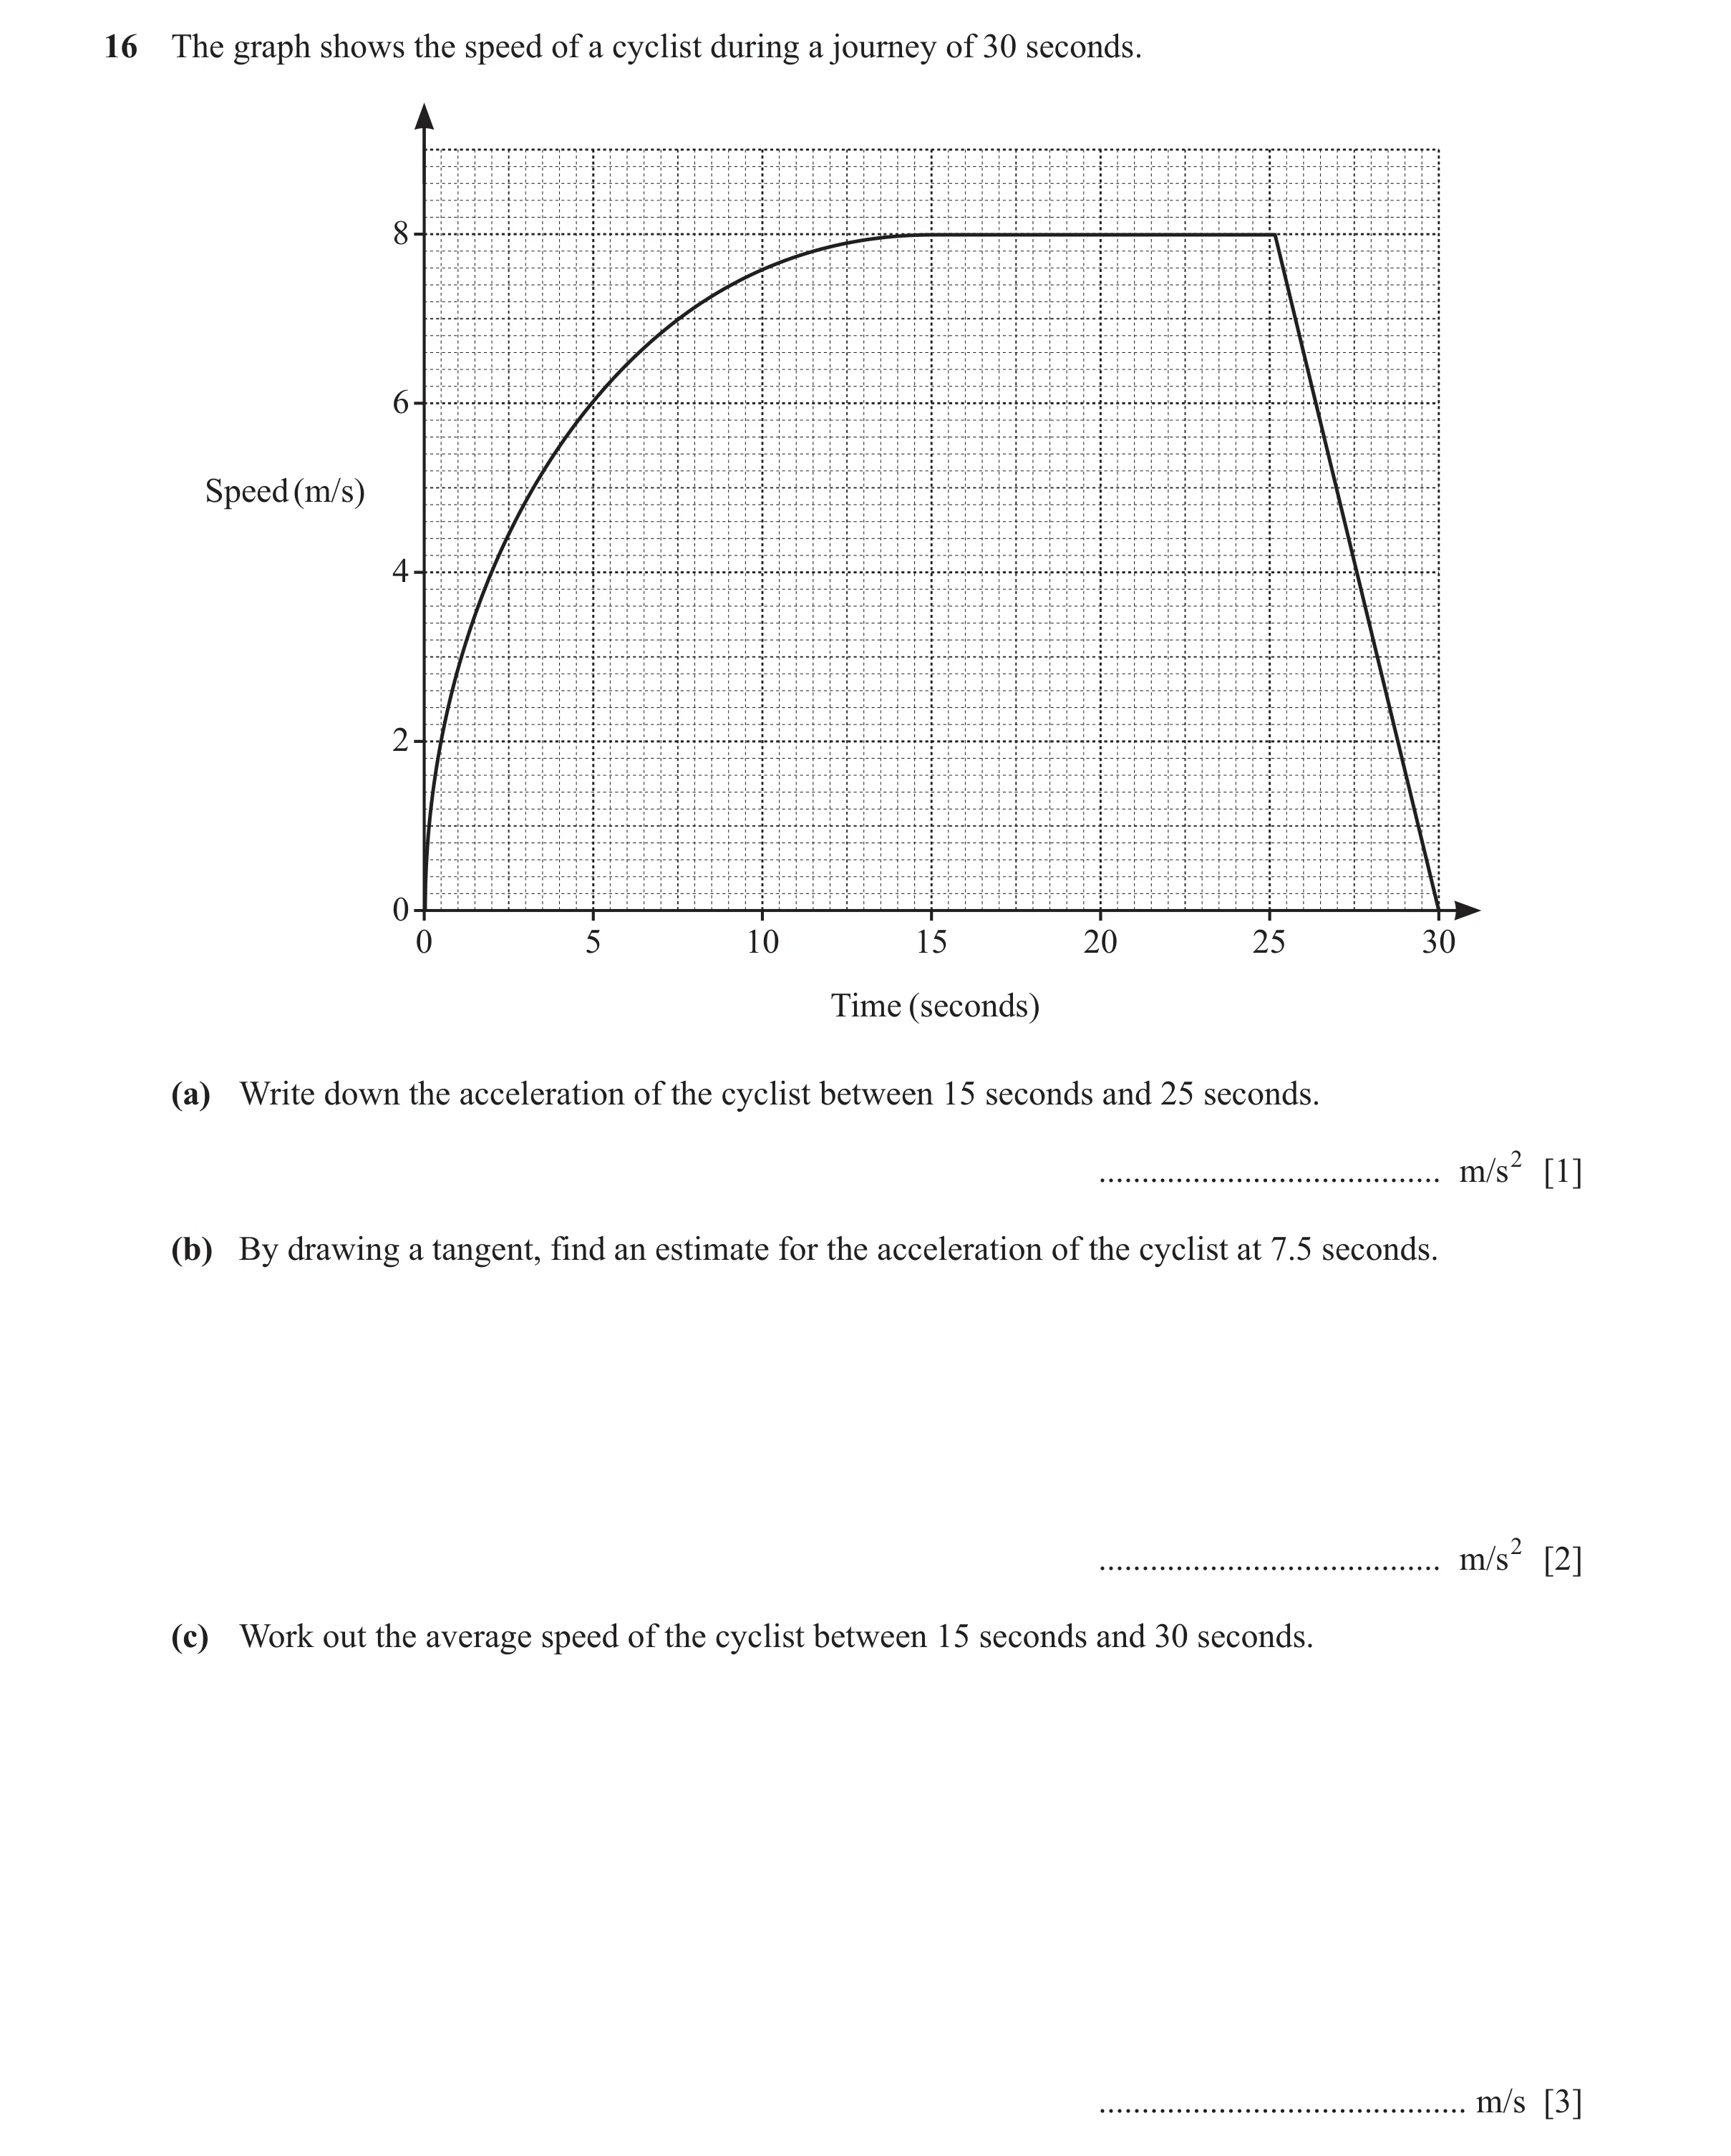
16 The graph shows the speed of a cyclist during a journey of 30 seconds. 8 6 Speed (m/s) 4 2 0 0 5 10 15 20 25 30 Time (seconds) (a) Write down the acceleration of the cyclist between 15 seconds and 25 seconds. … m/s2 [1] (b) By drawing a tangent, find an estimate for the acceleration of the cyclist at 7.5 seconds. … m/s2 [2] (c) Work out the average speed of the cyclist between 15 seconds and 30 seconds. … m/s [3]
6 marks
Mark scheme: 16(a) 0 1 16(b) Ruled tangent to curve at time = 7.5 B1 seconds 0.25 to 0.4 B1 Dep on tangent correct or close attempt 16(c) 6.666 to 6.733… 3 (4.75 to 5) 8 M2 for (10 to 10.25) × 8 + oe 2 or M1 for attempt at one relevant area under graph for time between 15 and 30 seconds
This question in 0580/42 Feb/March 2025
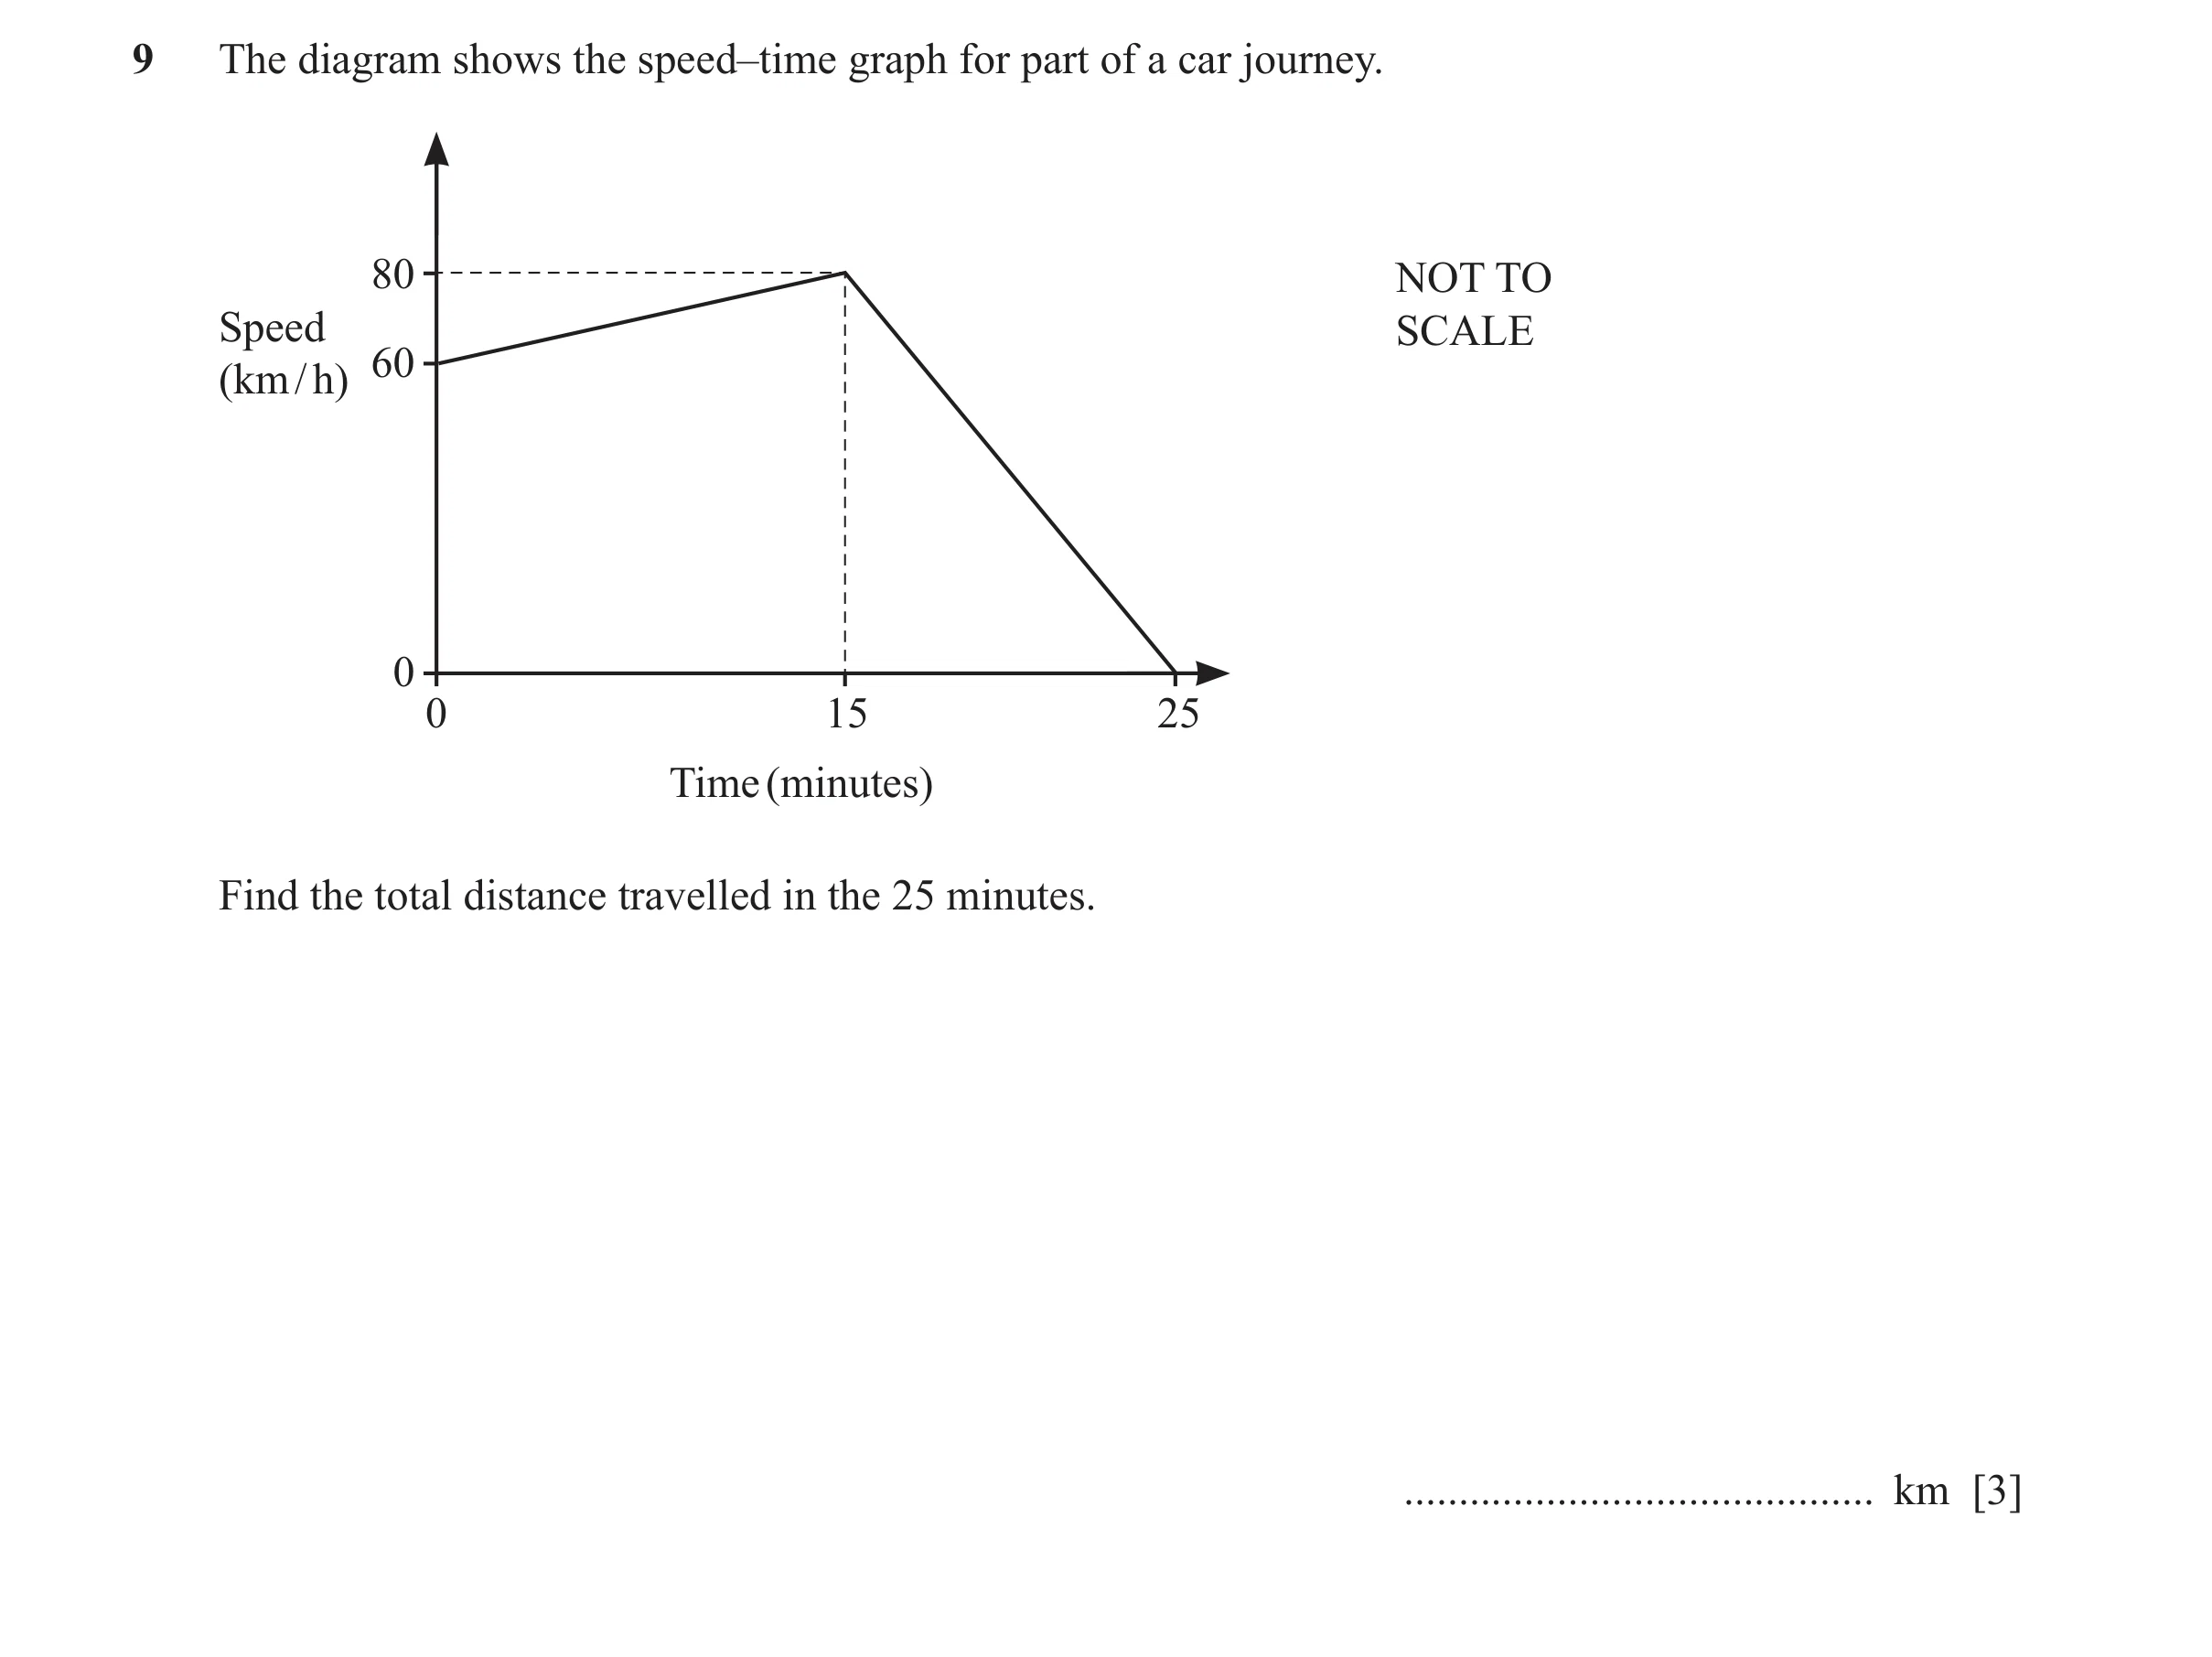
Q13 · The diagram shows the speed–time graph for part of a car journey 0580/42 Oct/Nov 2025
9 The diagram shows the speed–time graph for part of a car journey. 80 NOT TO Speed SCALE 60 (km / h) 0 0 15 25 Time (minutes) Find the total distance travelled in the 25 minutes. … km [3]
3 marks
Mark scheme: 9 24.2 or 24.16 to 24.17 3 60 + 80 15 80 10 M2 for + oe 2 60 2 60 or M1 for a correct partial area under line 60 + 80 15 80 10 e.g. or oe 2 60 2 60 OR If 0 scored, SC2 for final answer 1450 60 + 80 80 10 or SC1 for 15 + oe seen 2 2
This question in 0580/42 Oct/Nov 2025
 1 / 18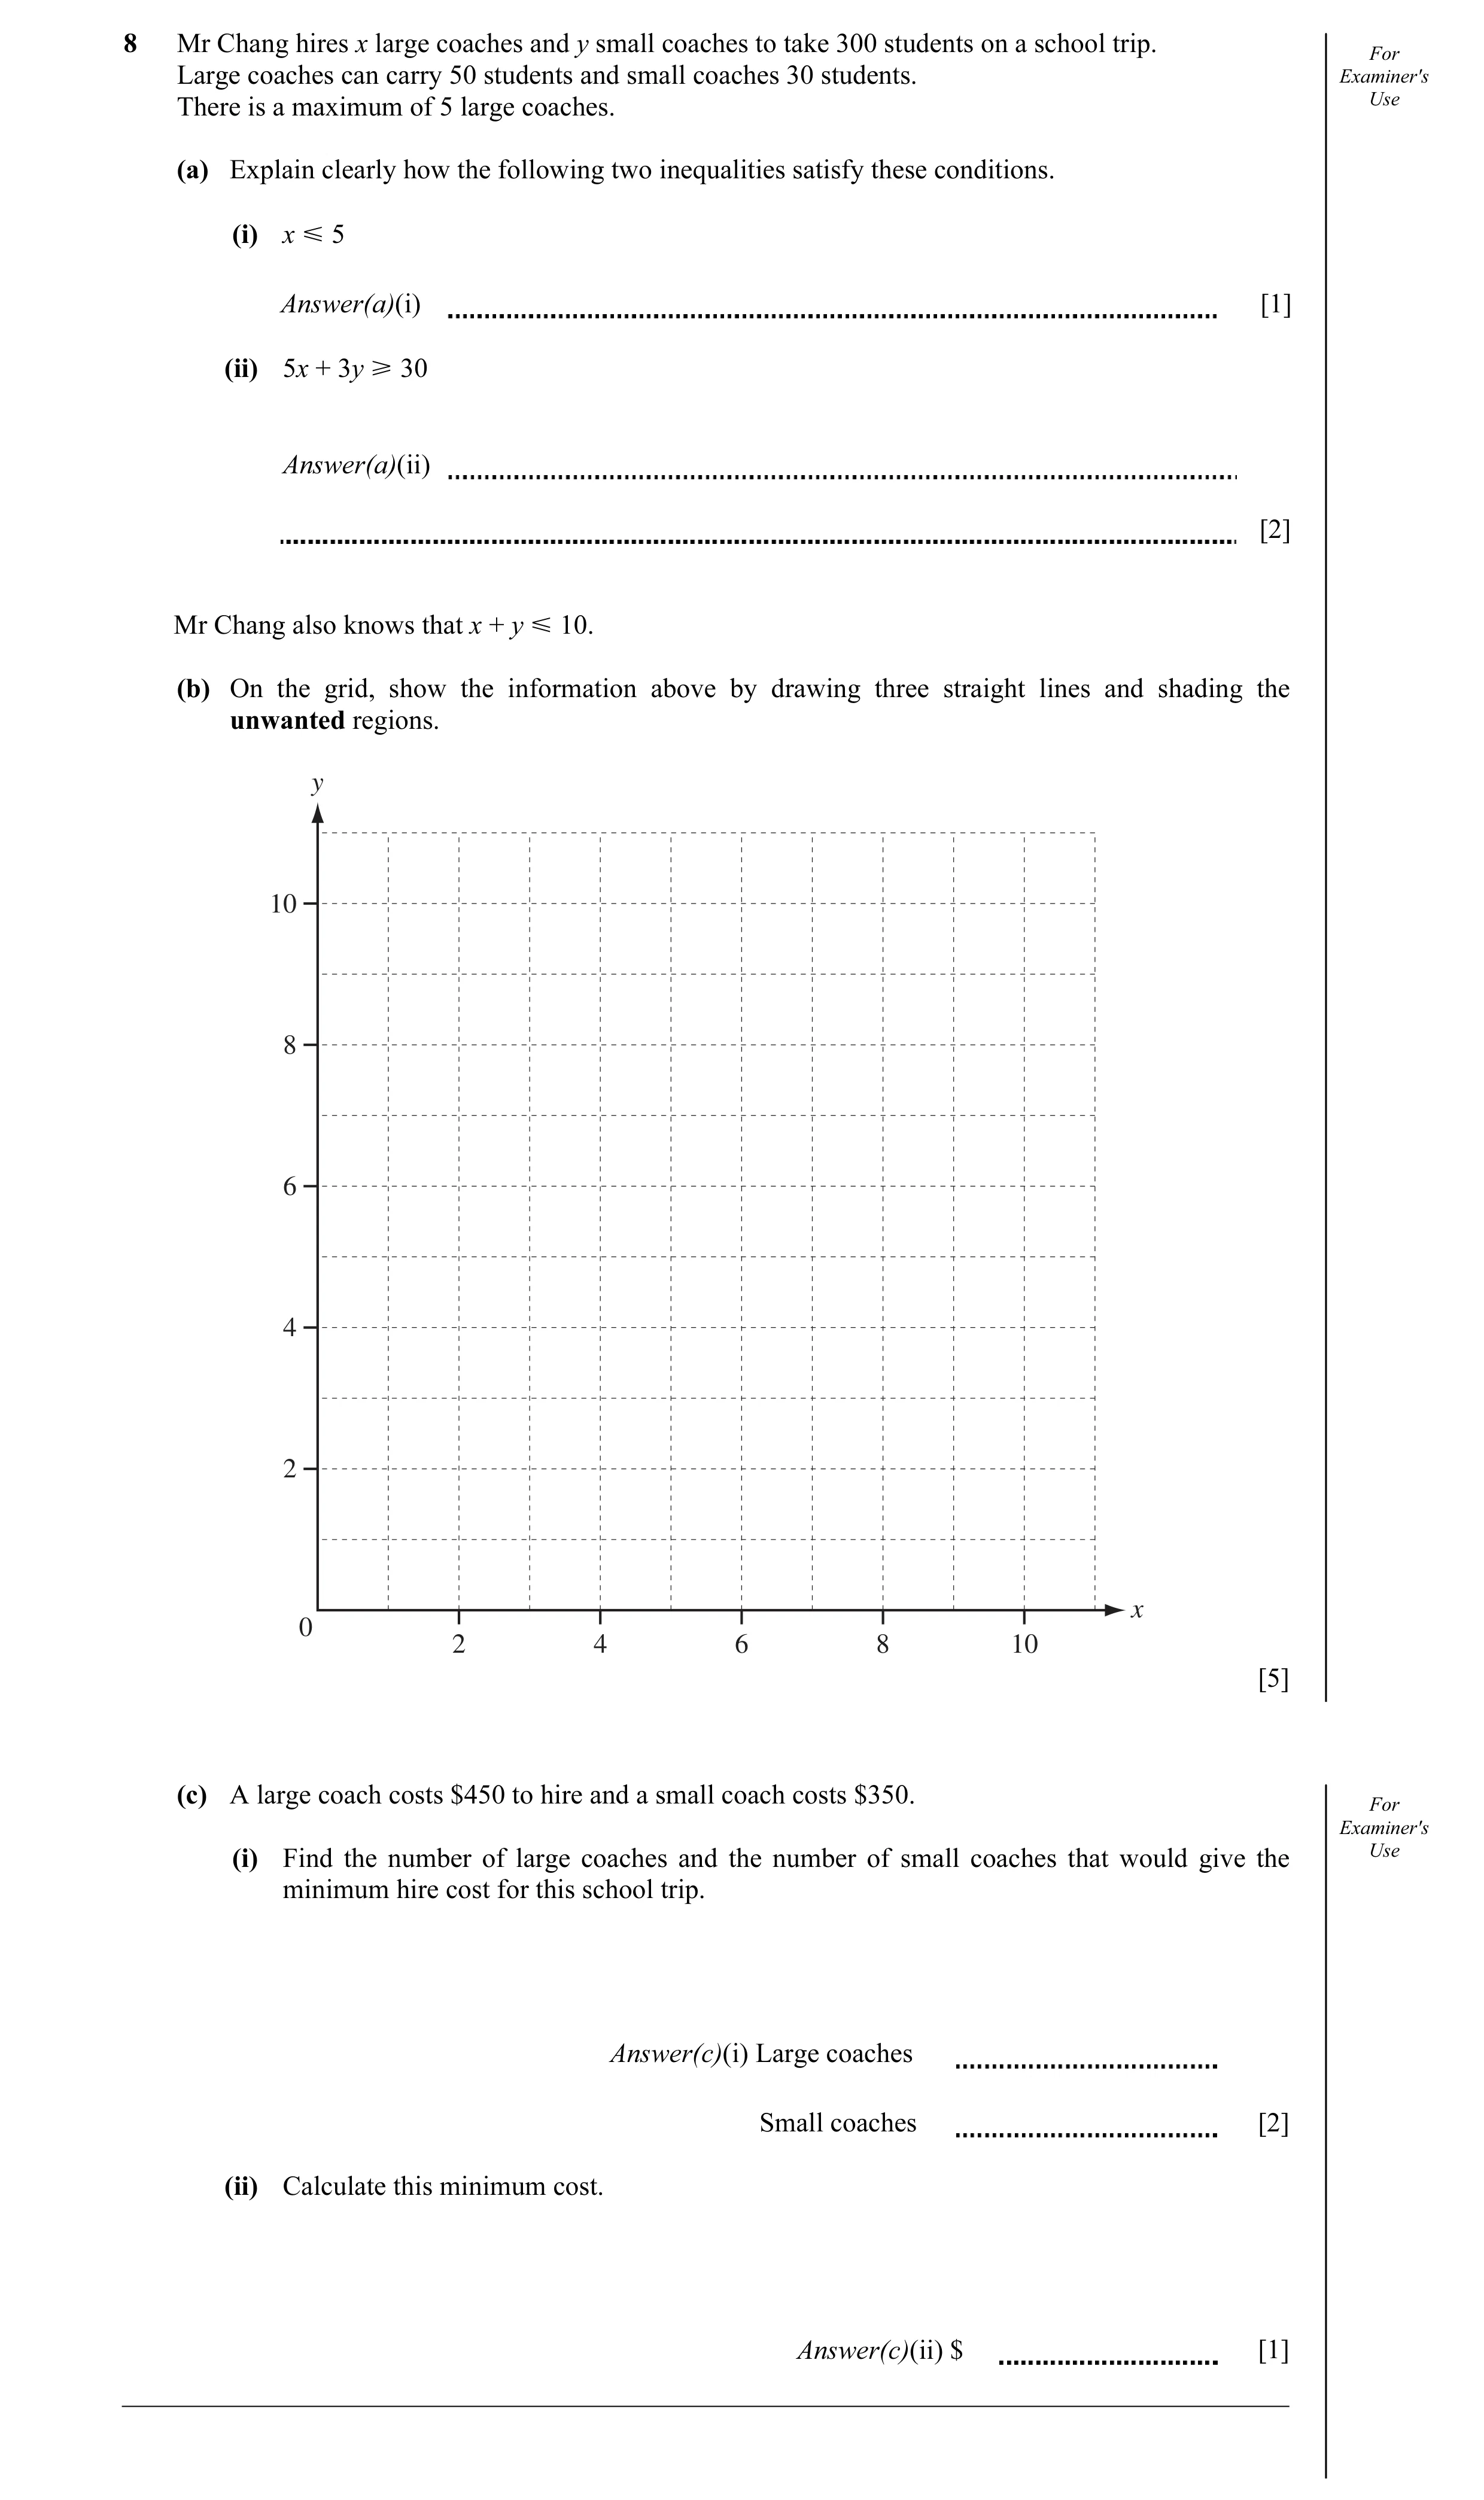
 6 / 18
 7 / 18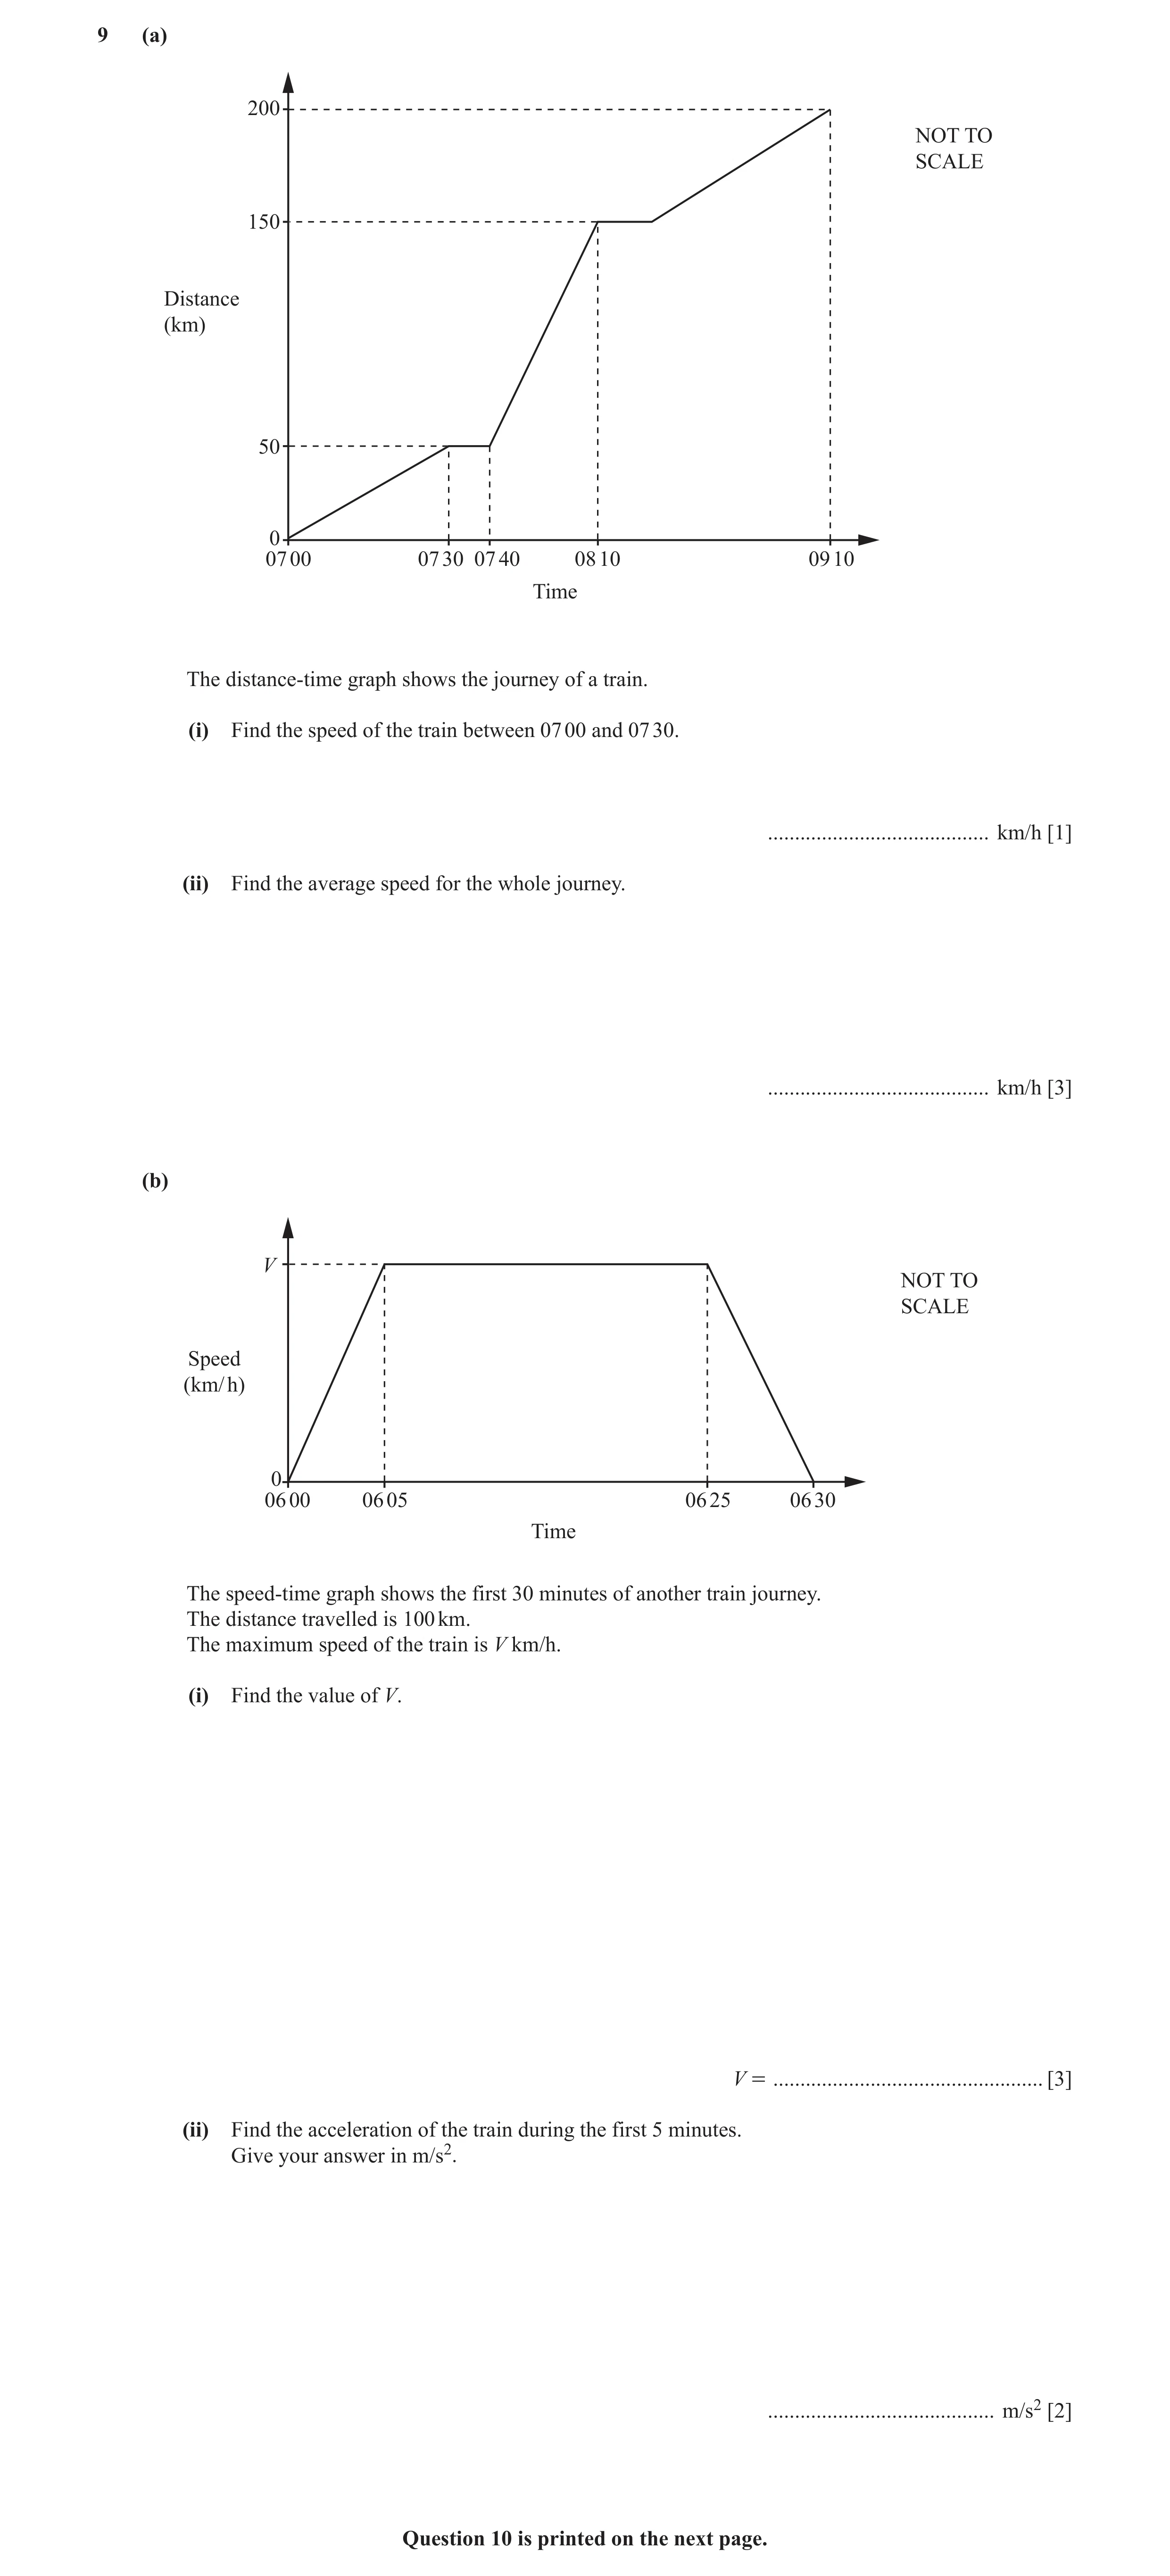
 11 / 18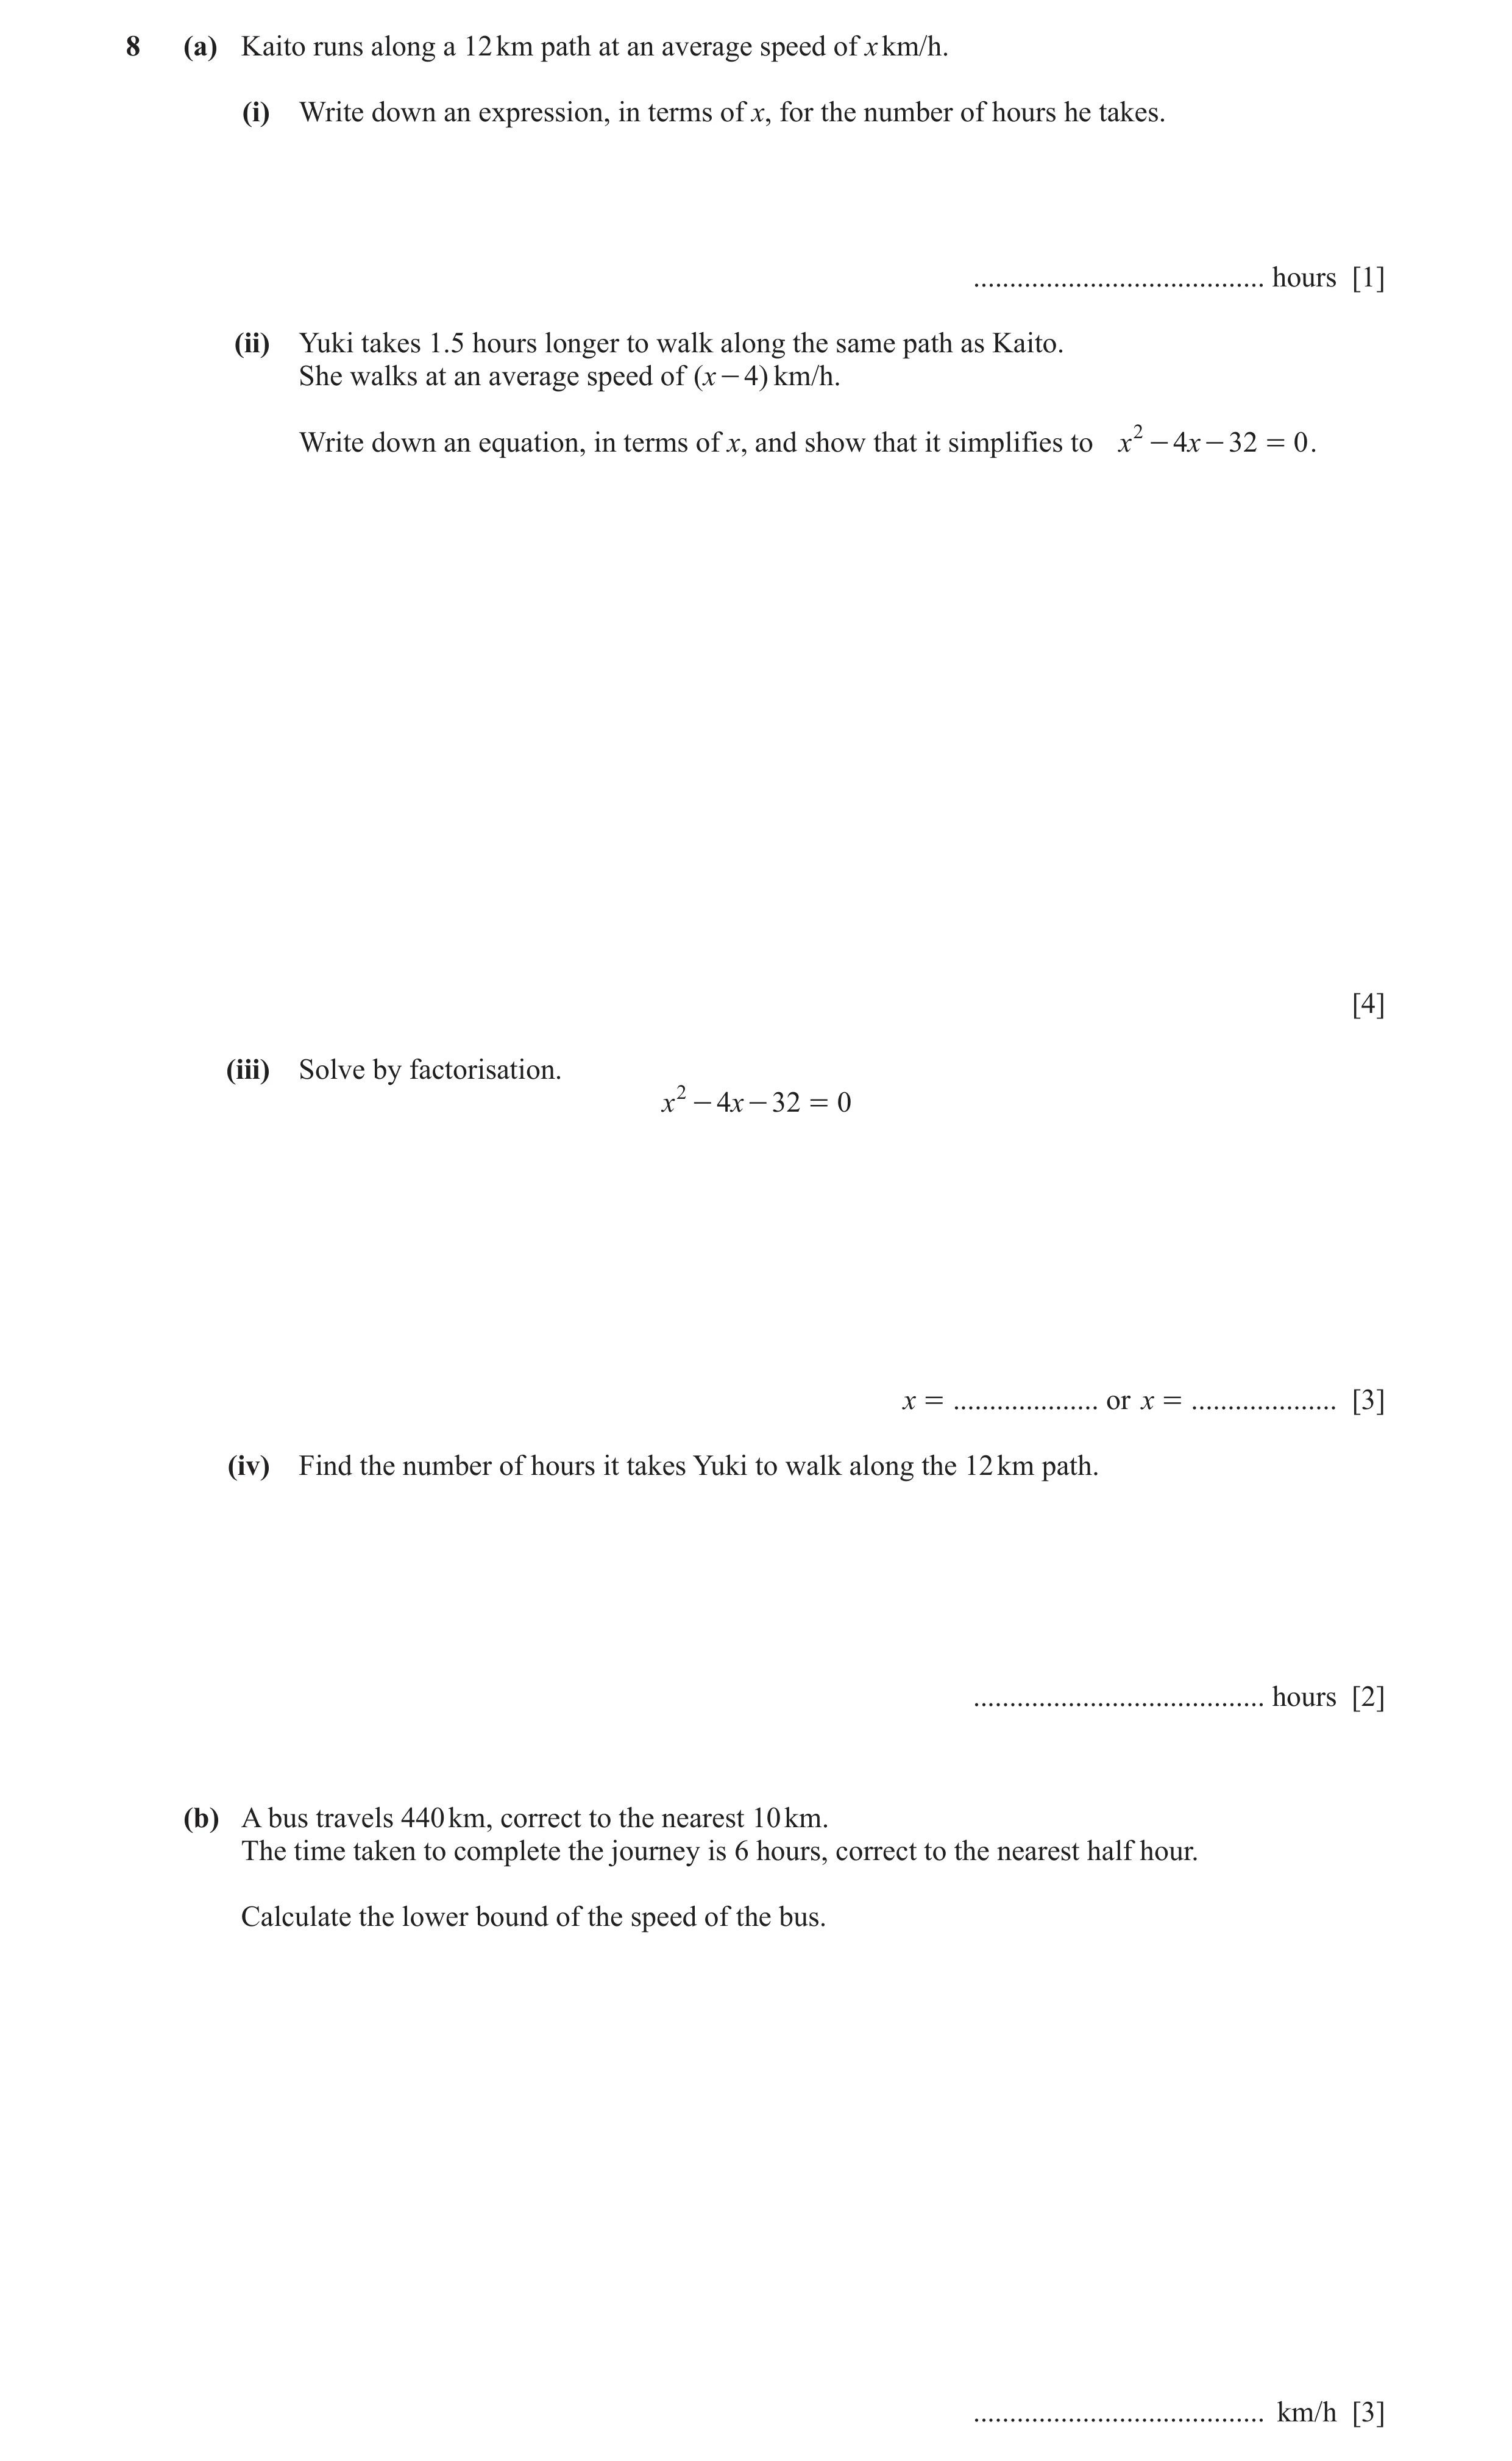
 14 / 18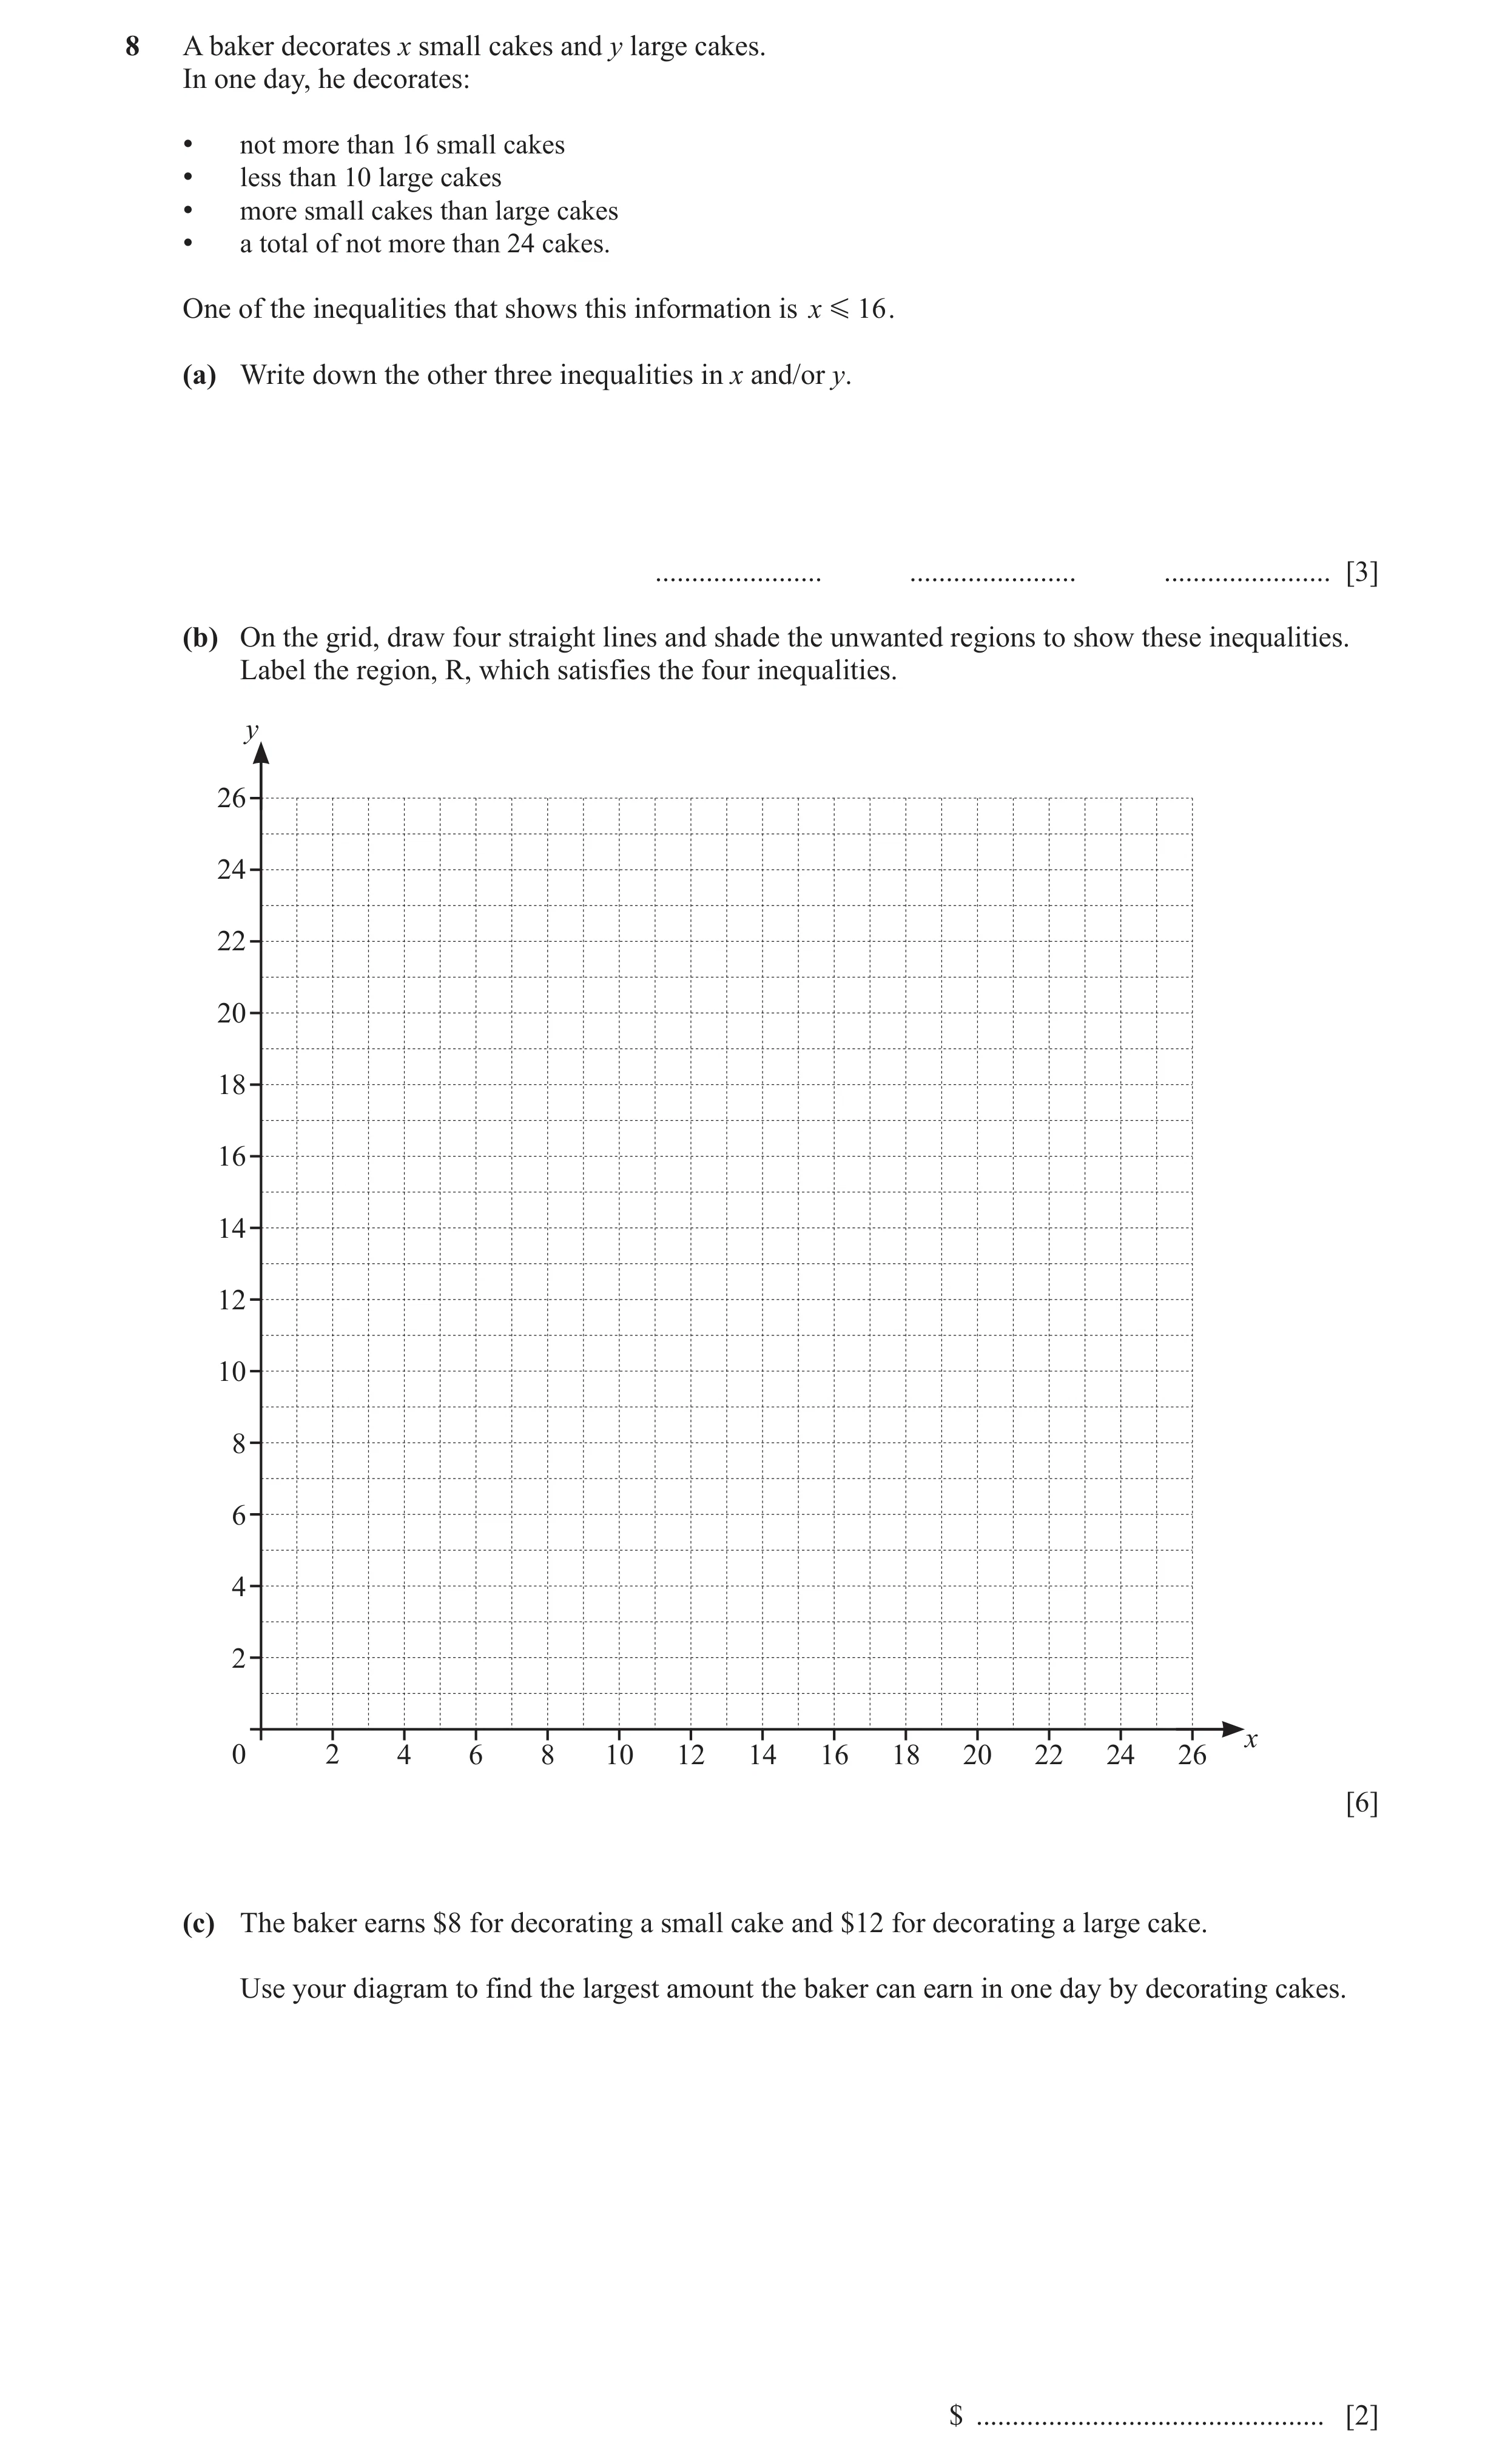
 17 / 18
 18 / 18
 16
16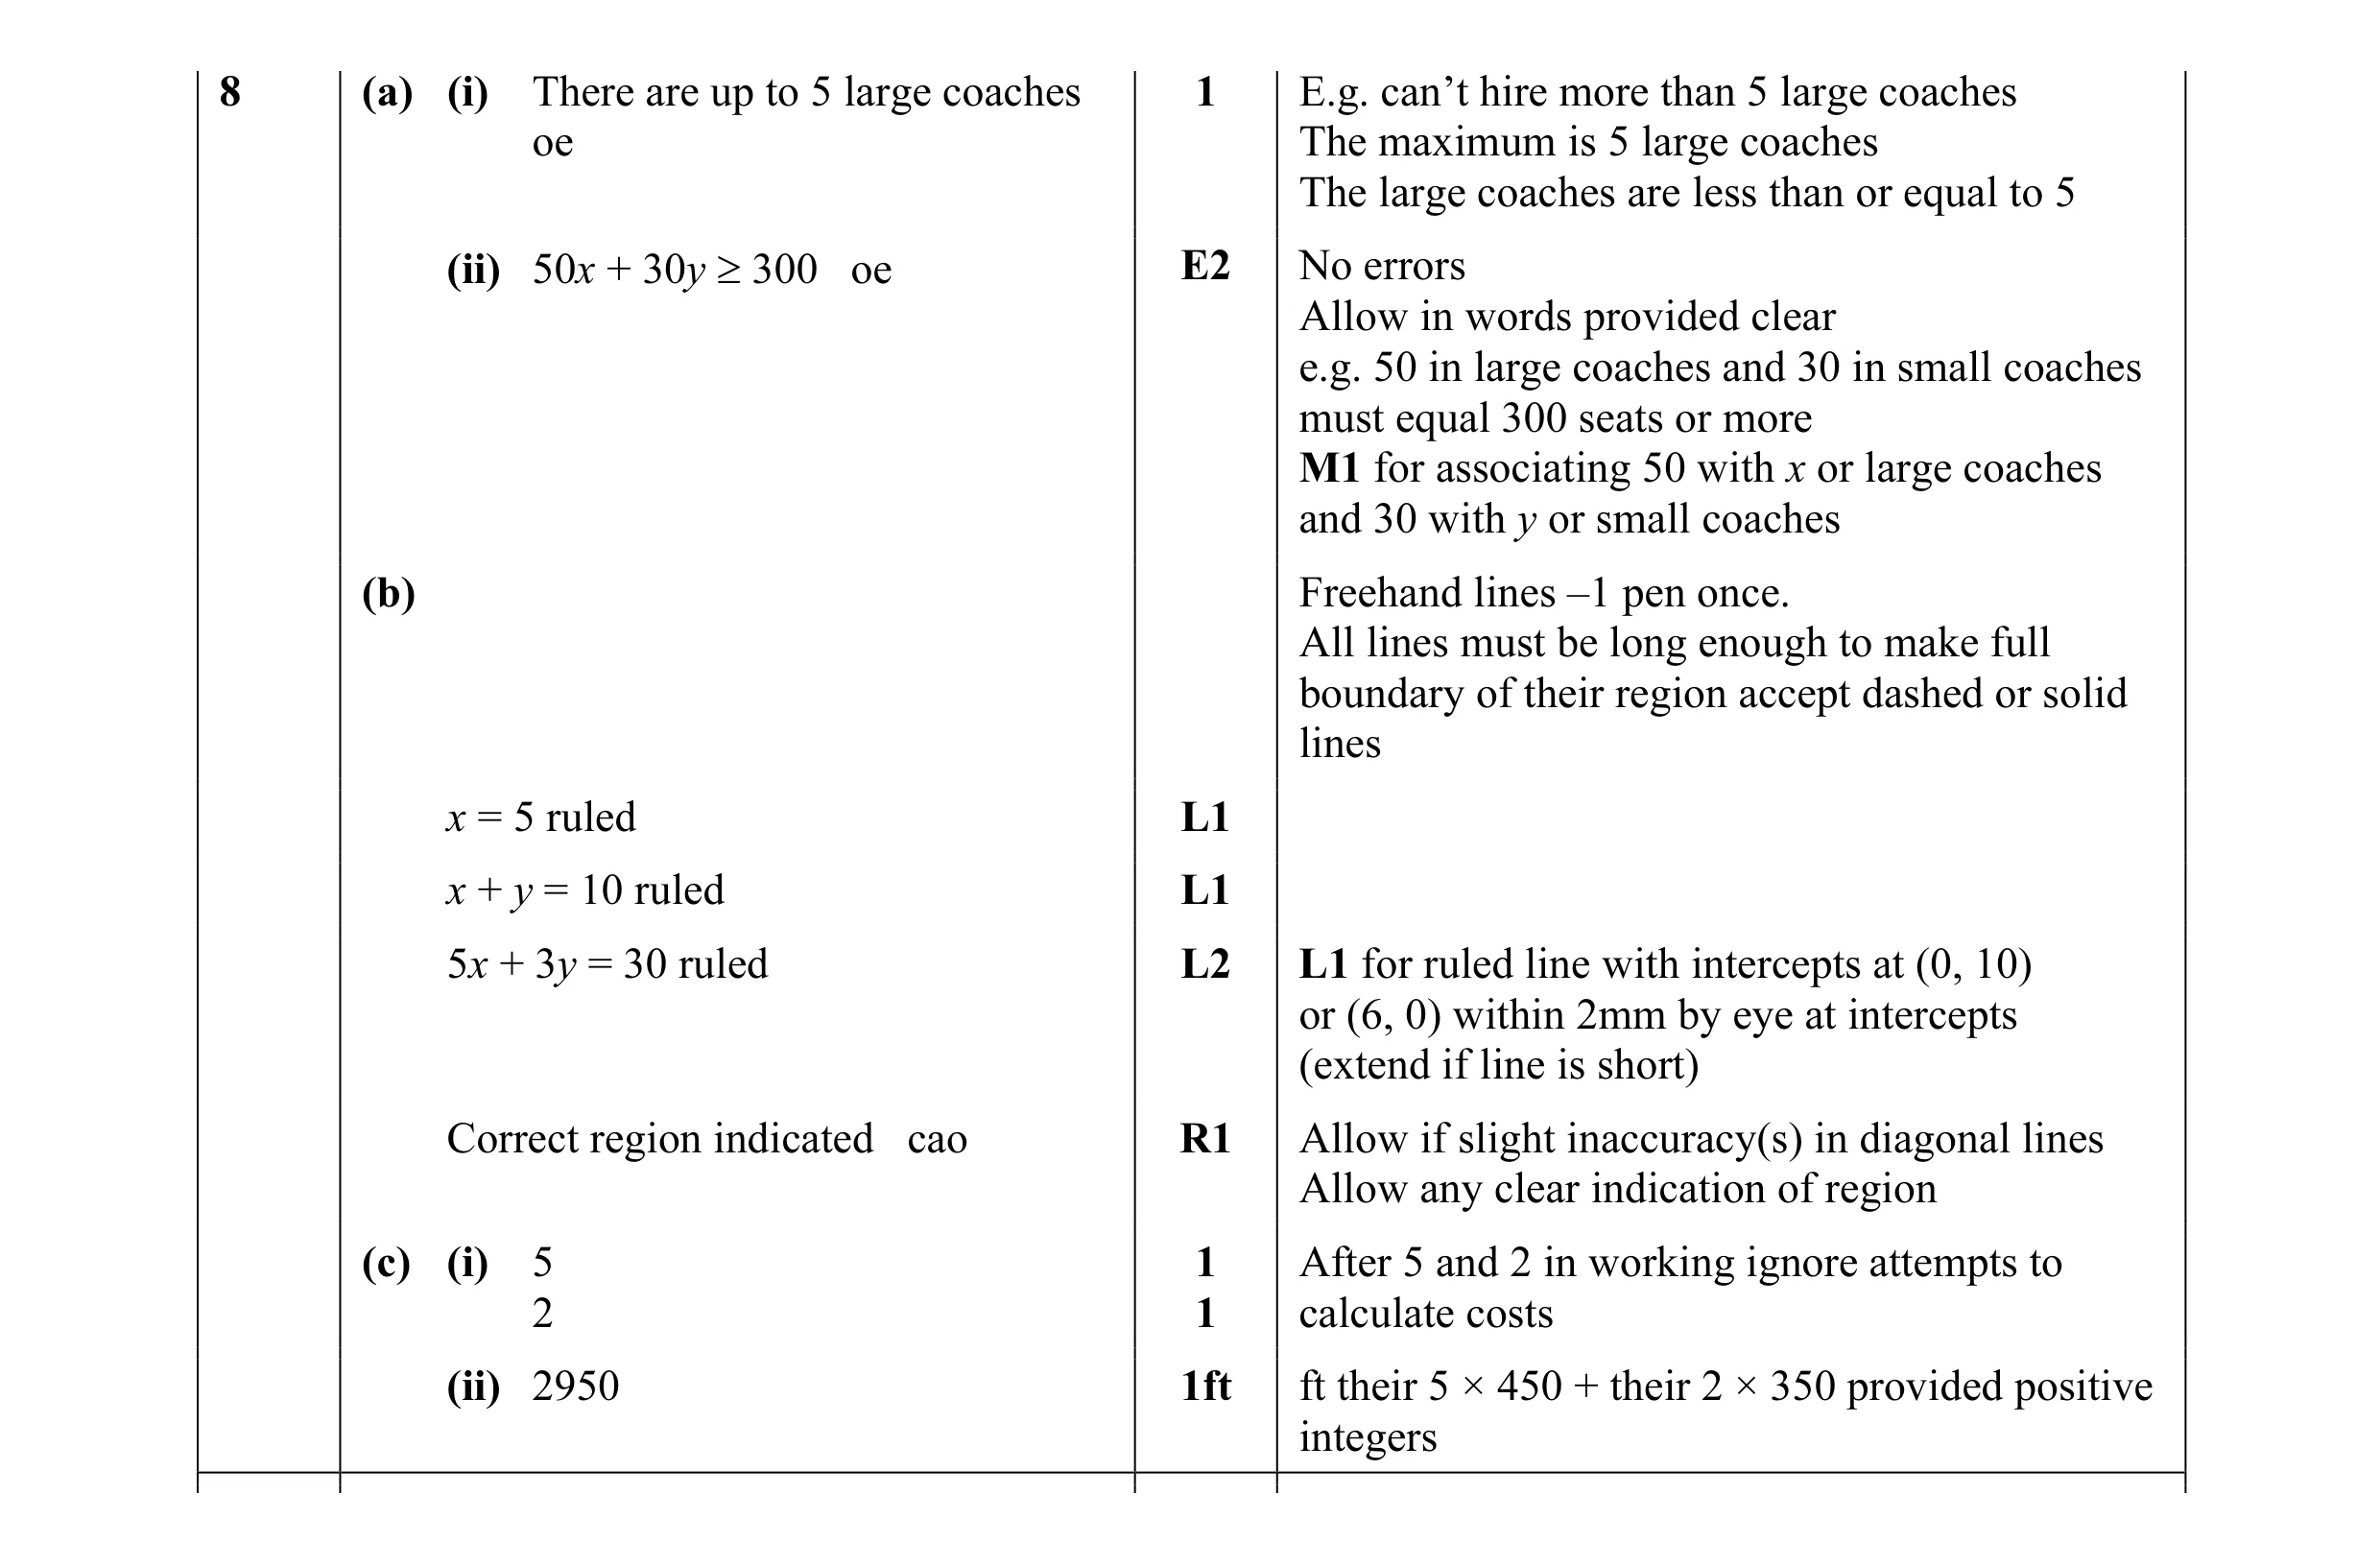 11
11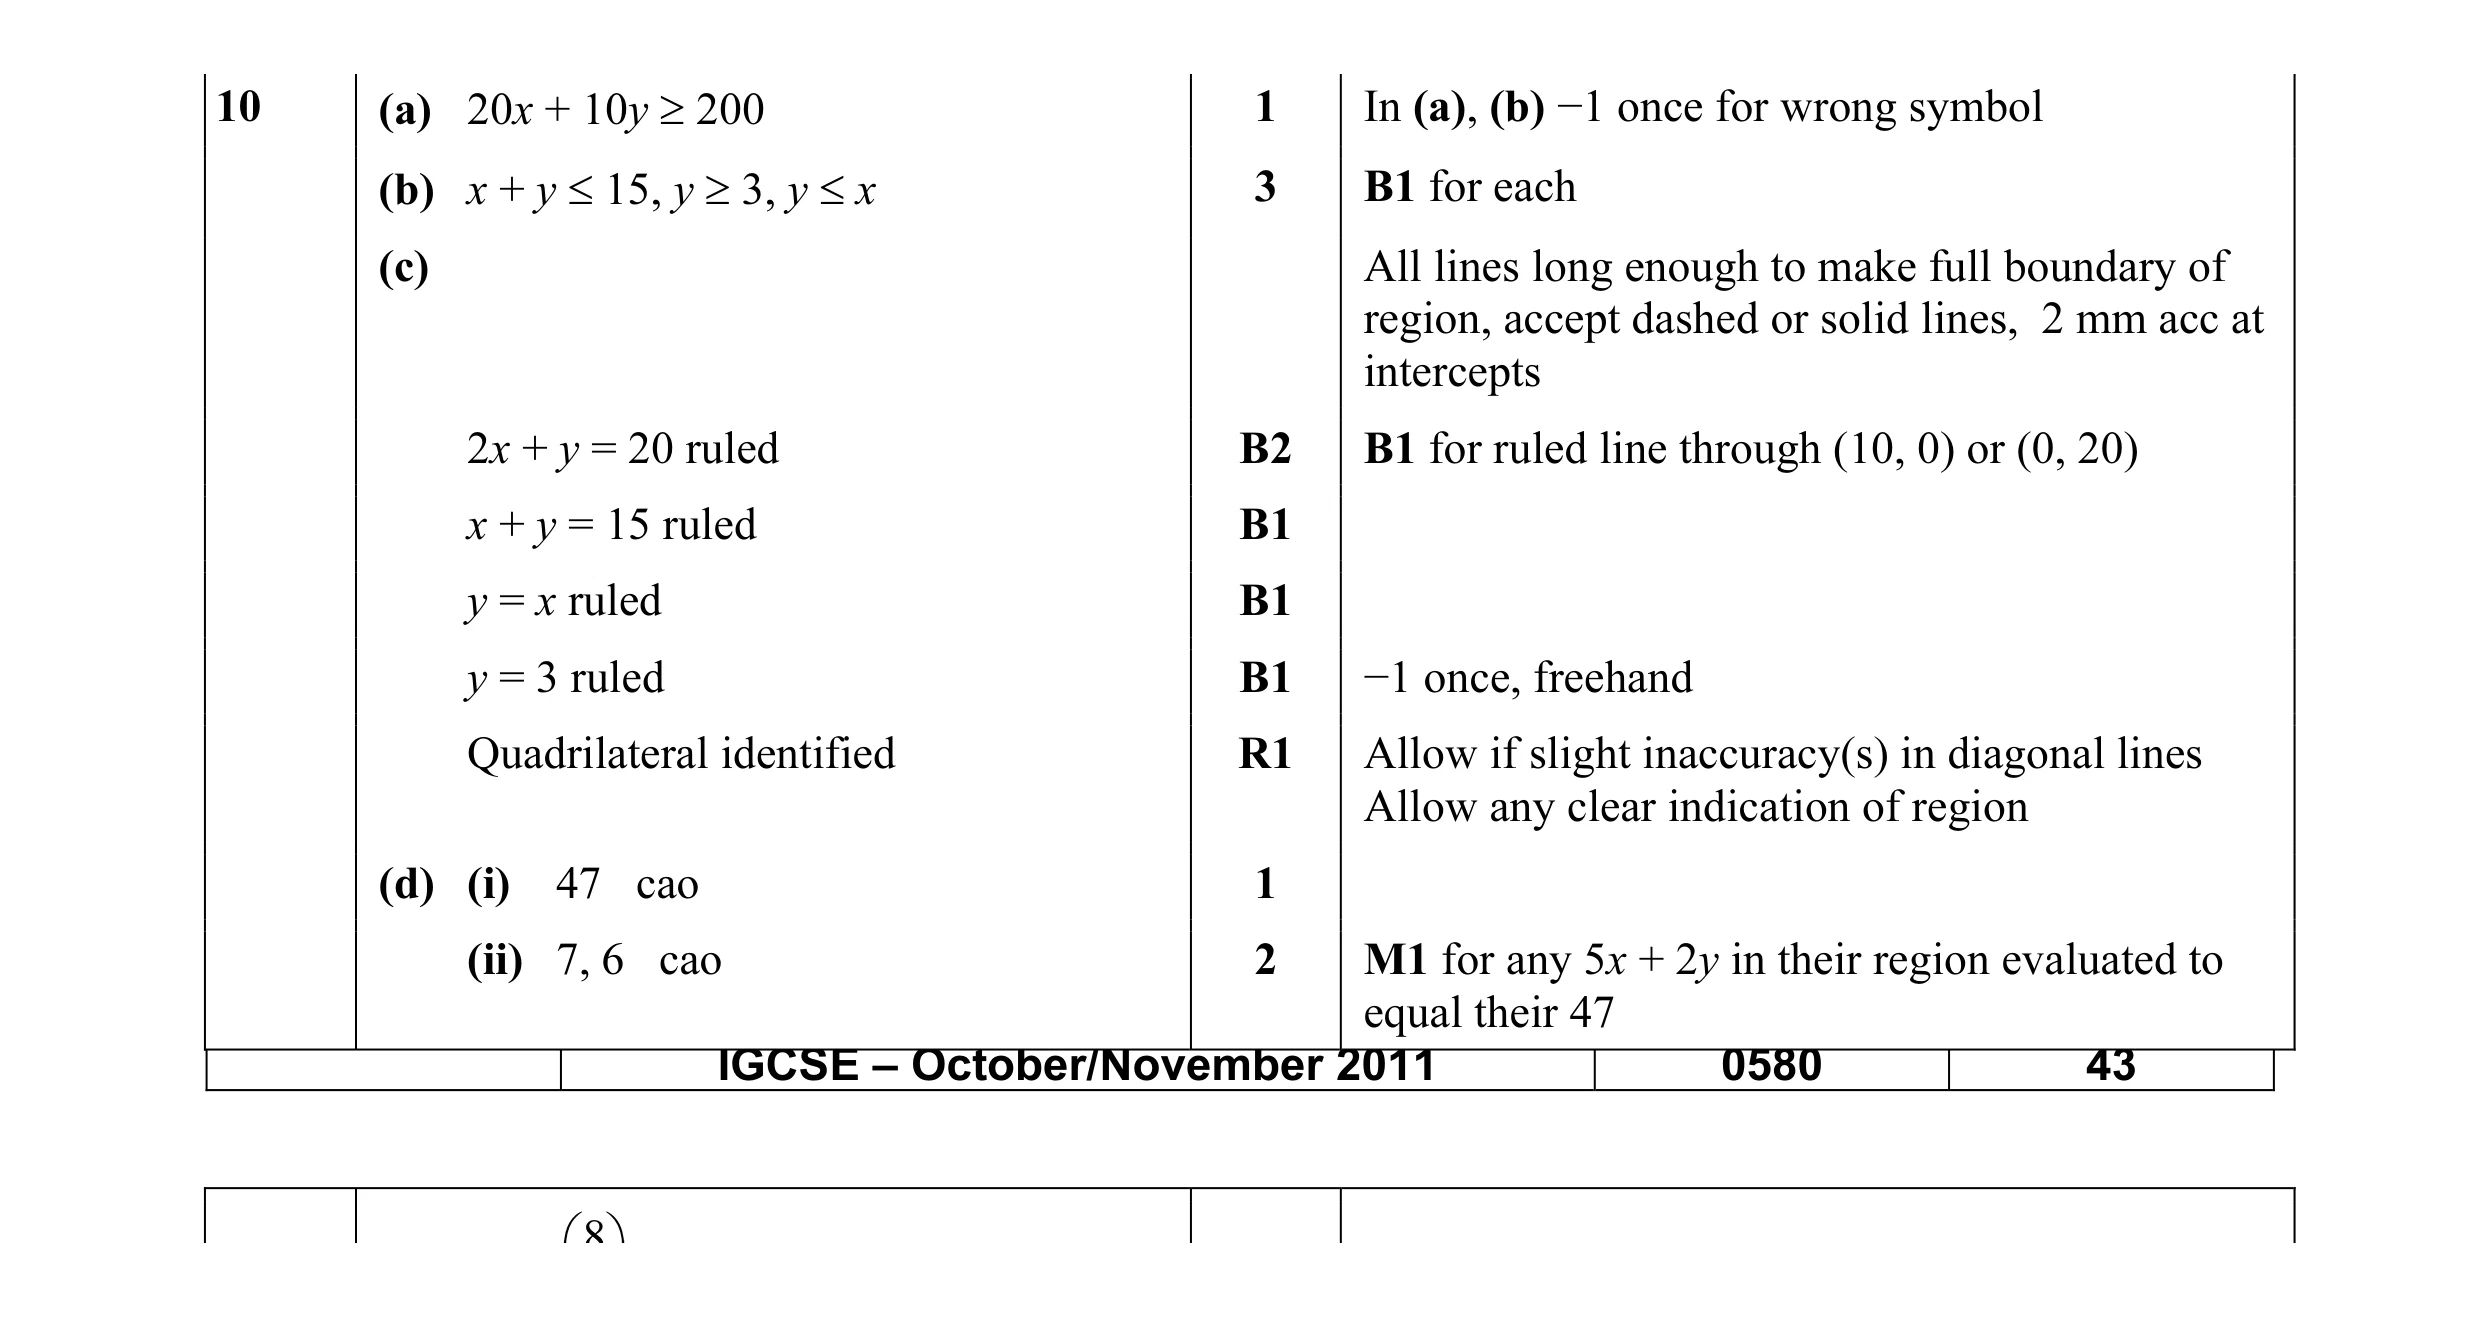 13
13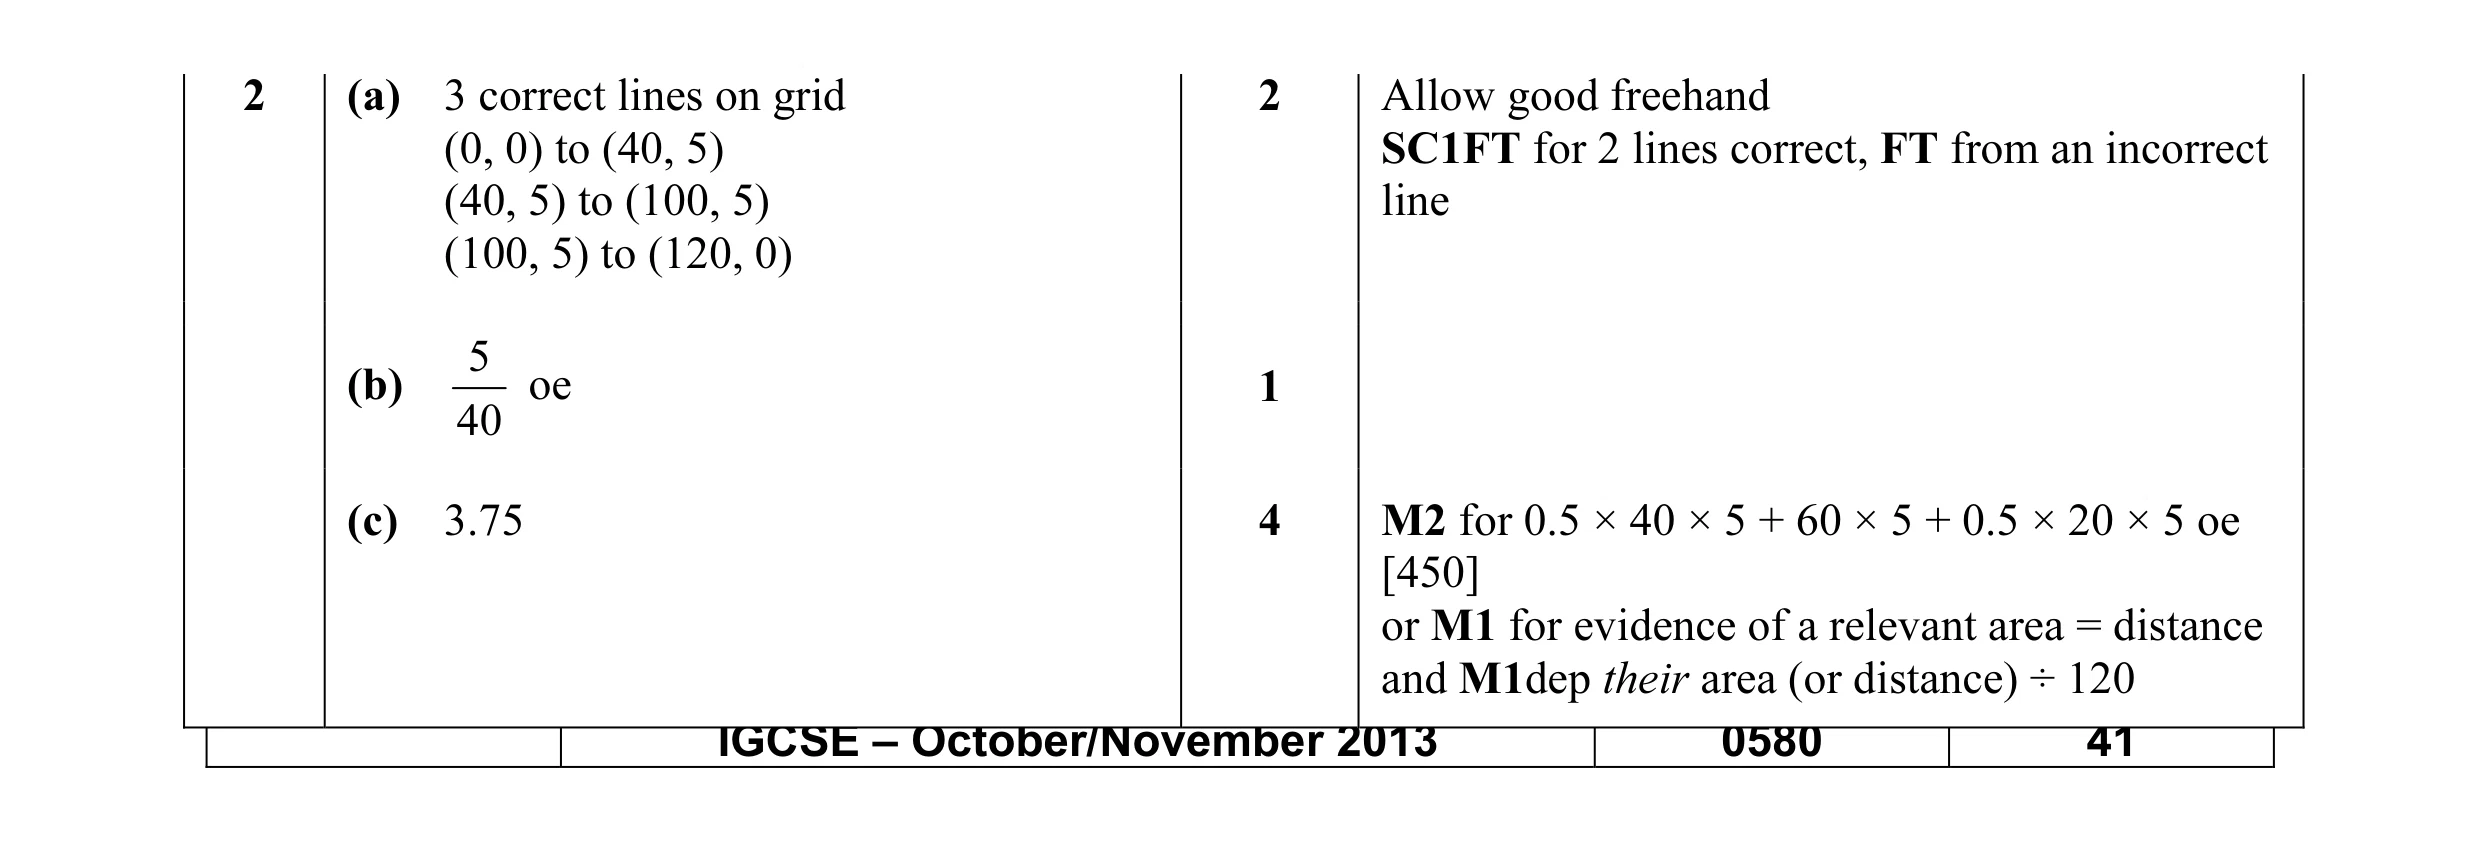 7
7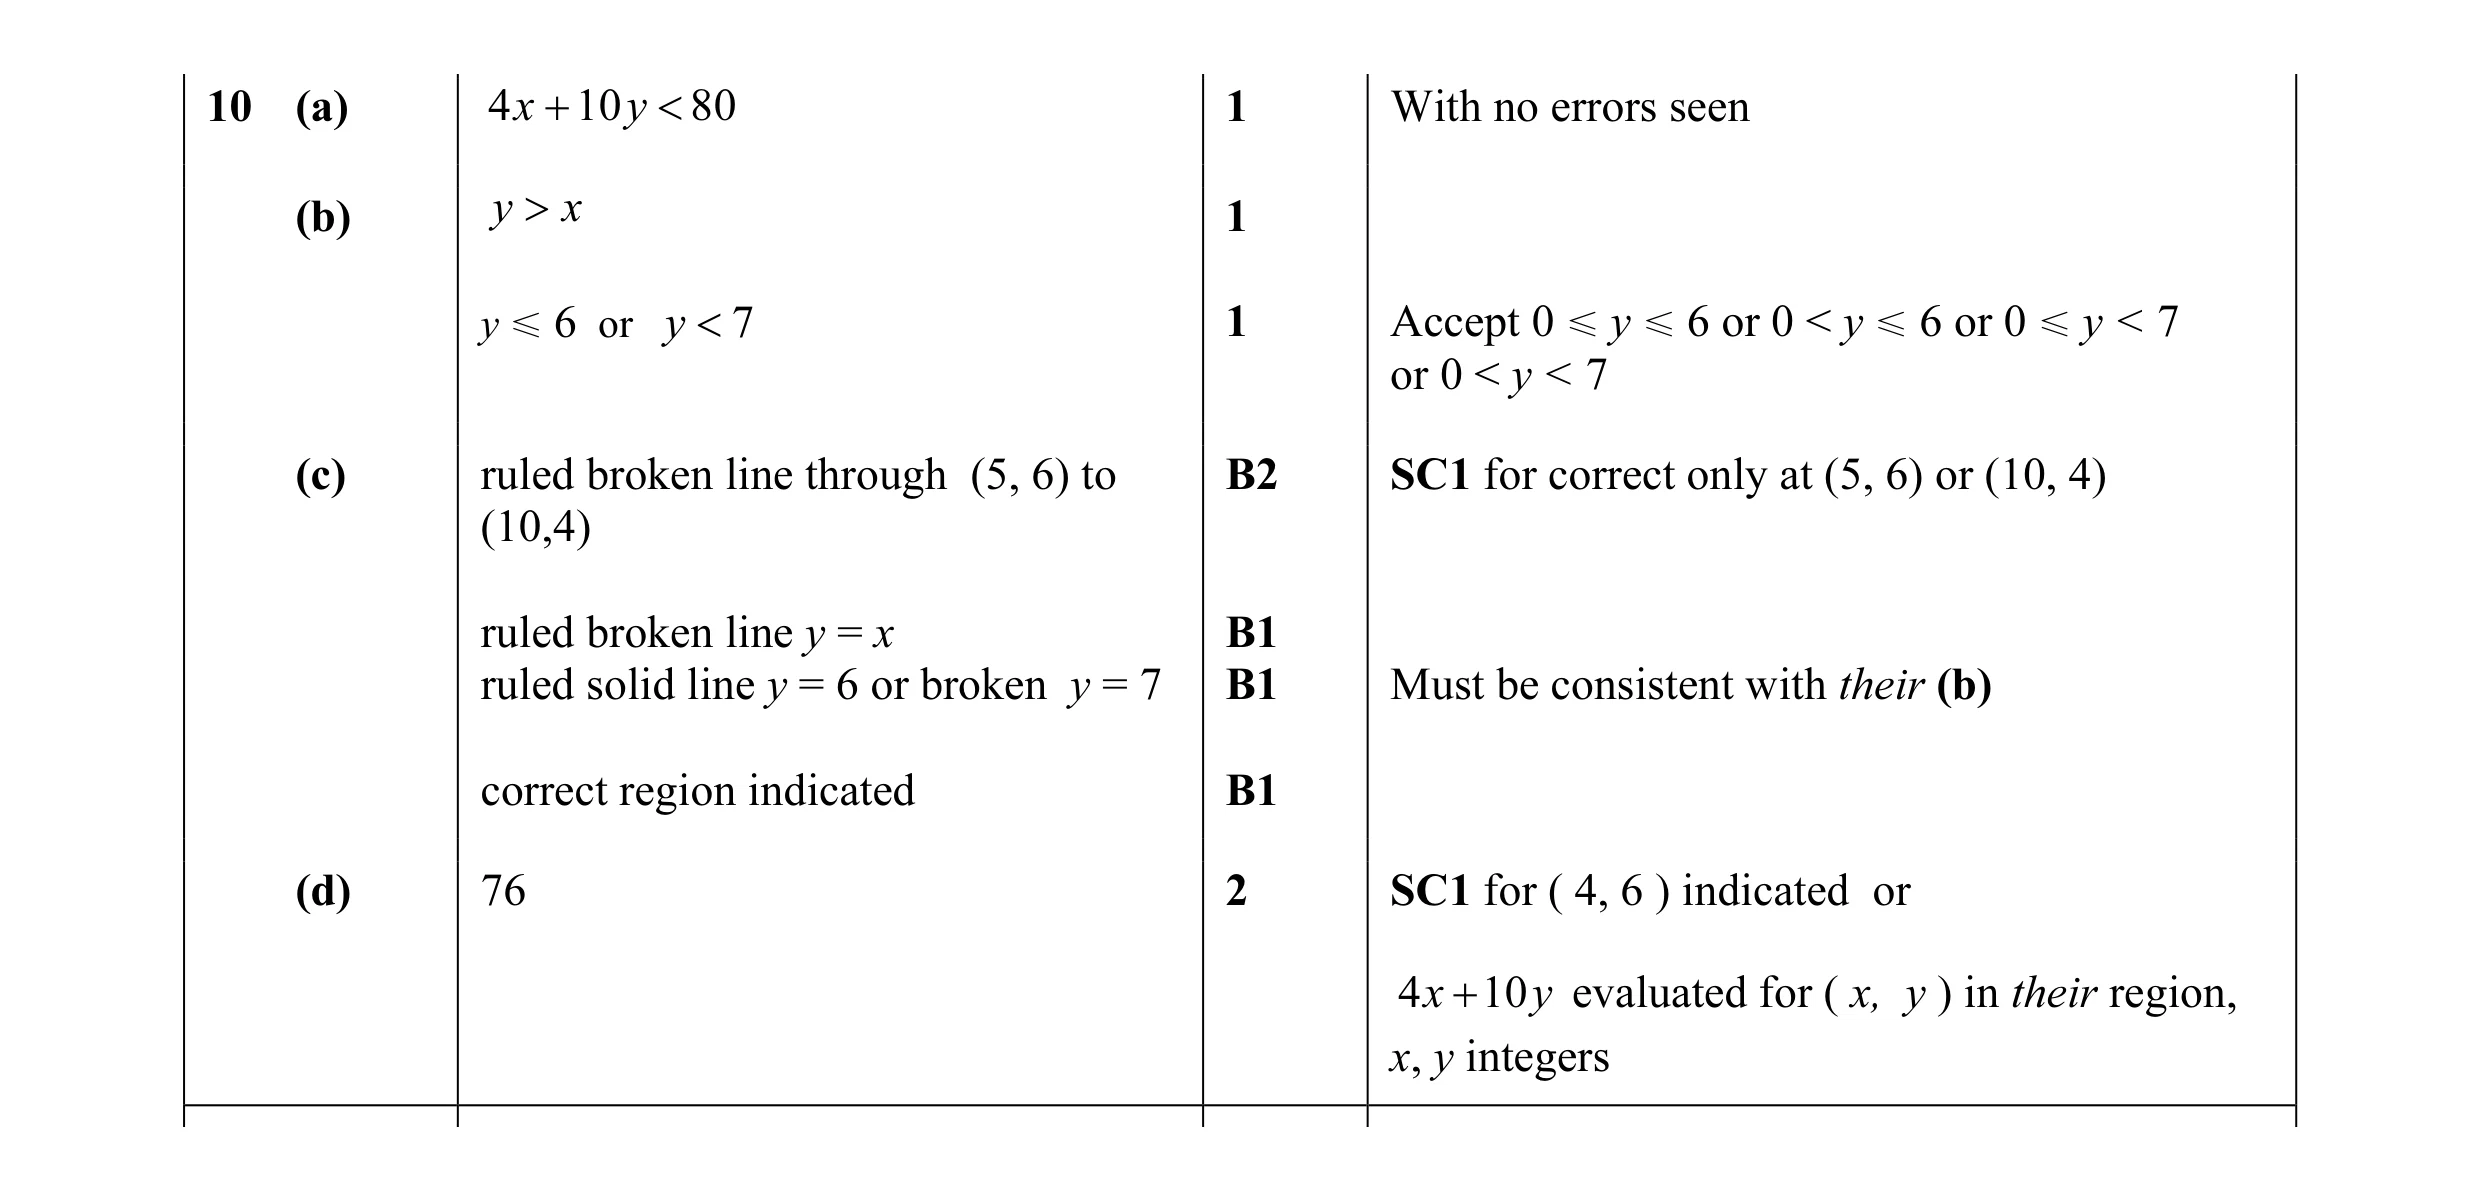 10
10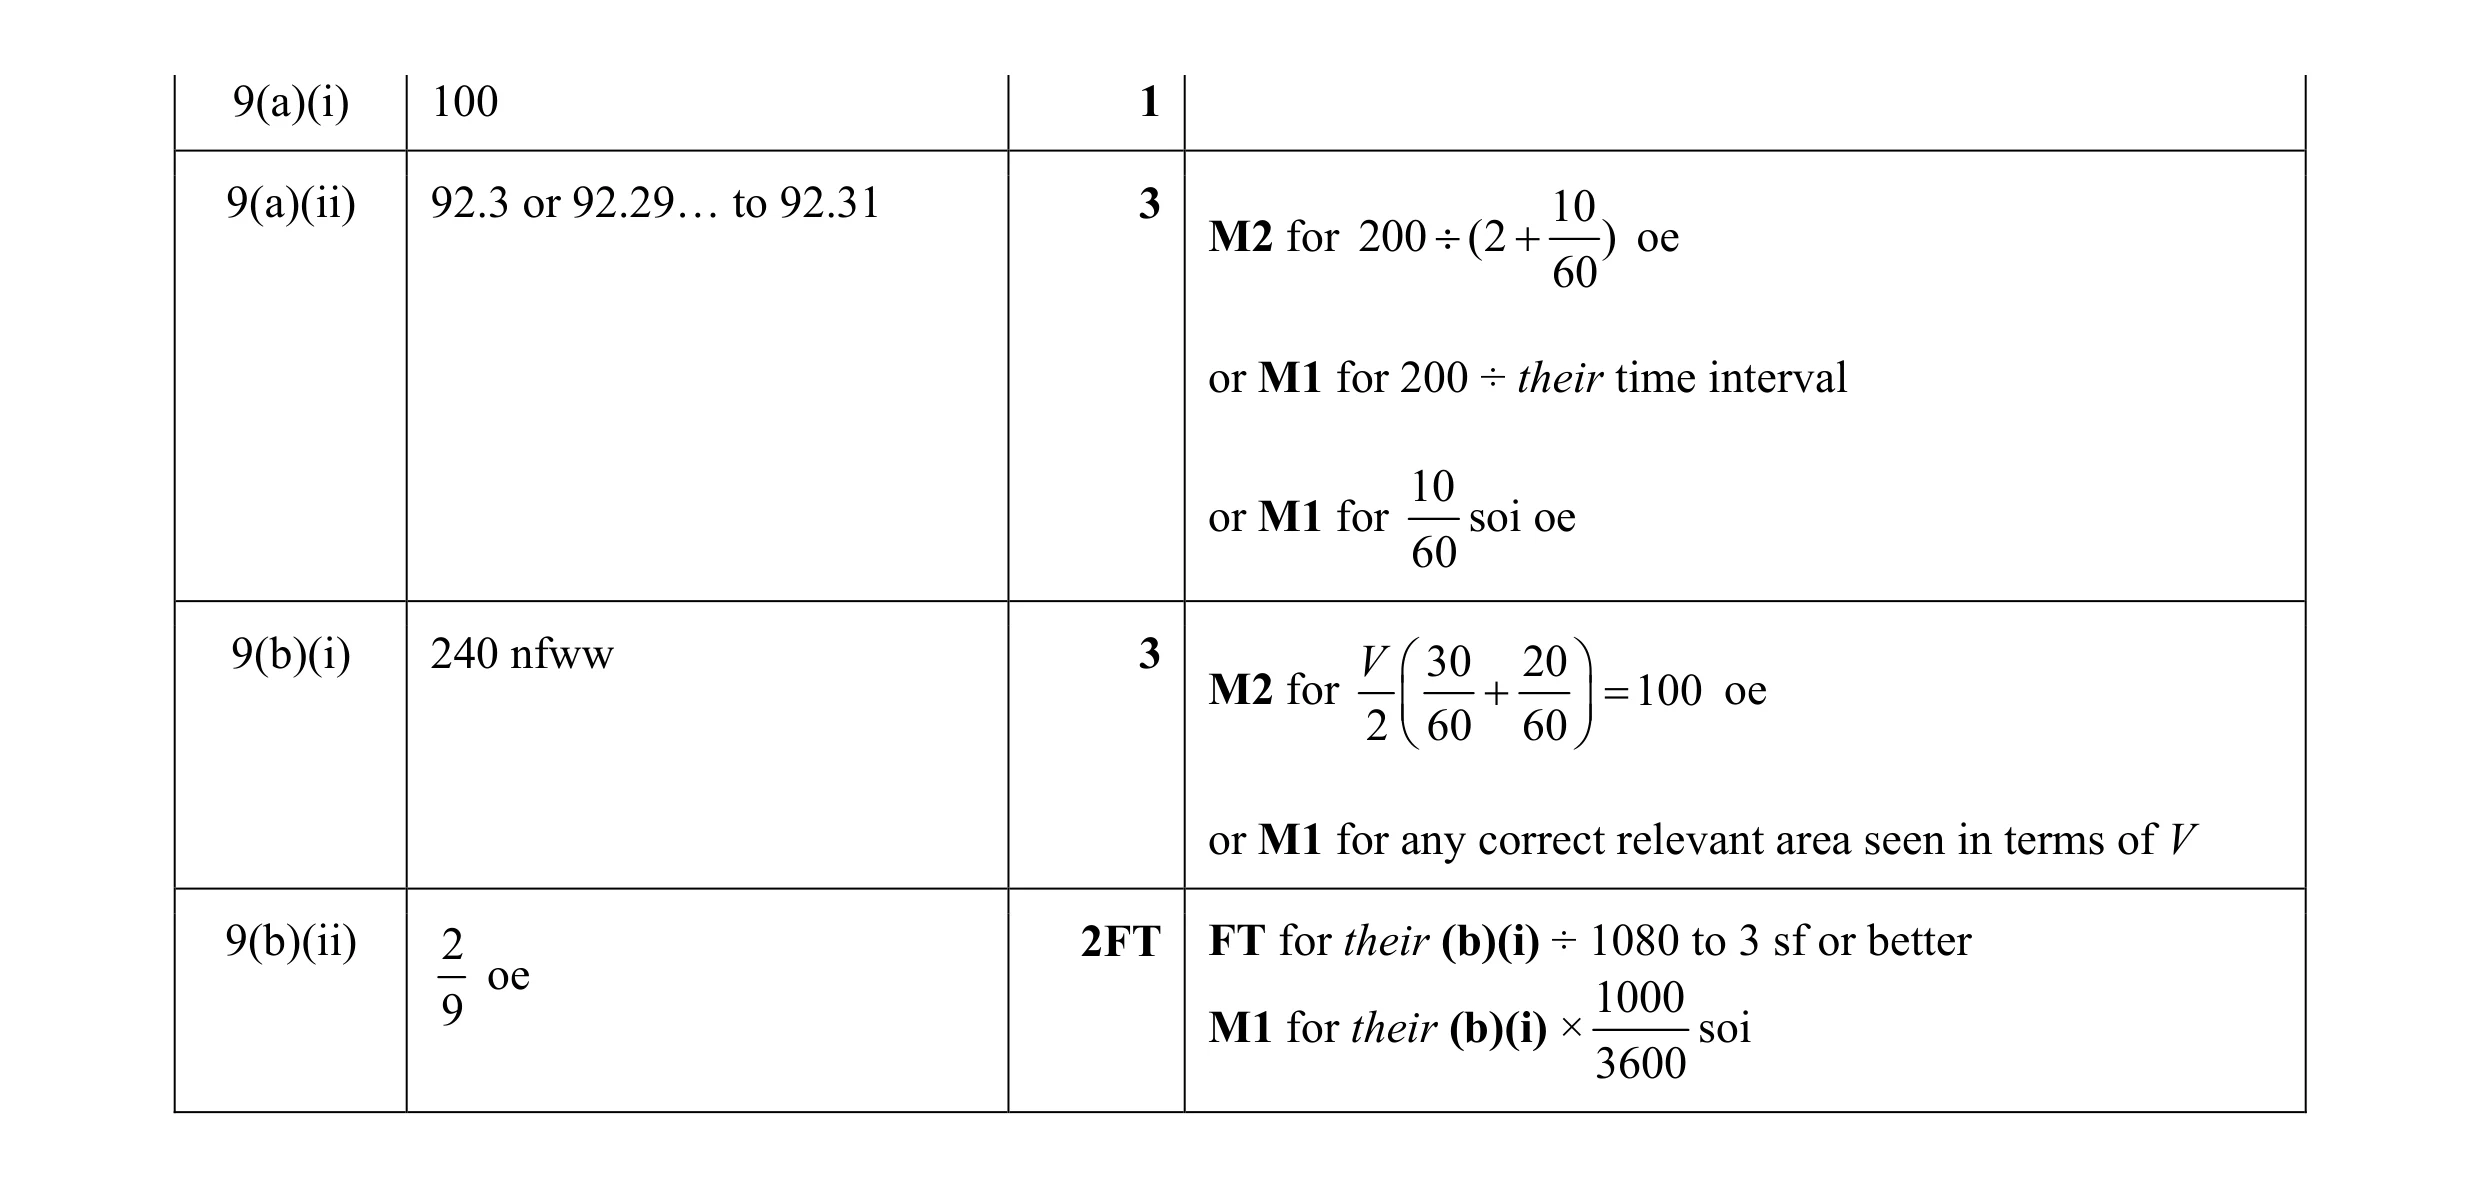 9
9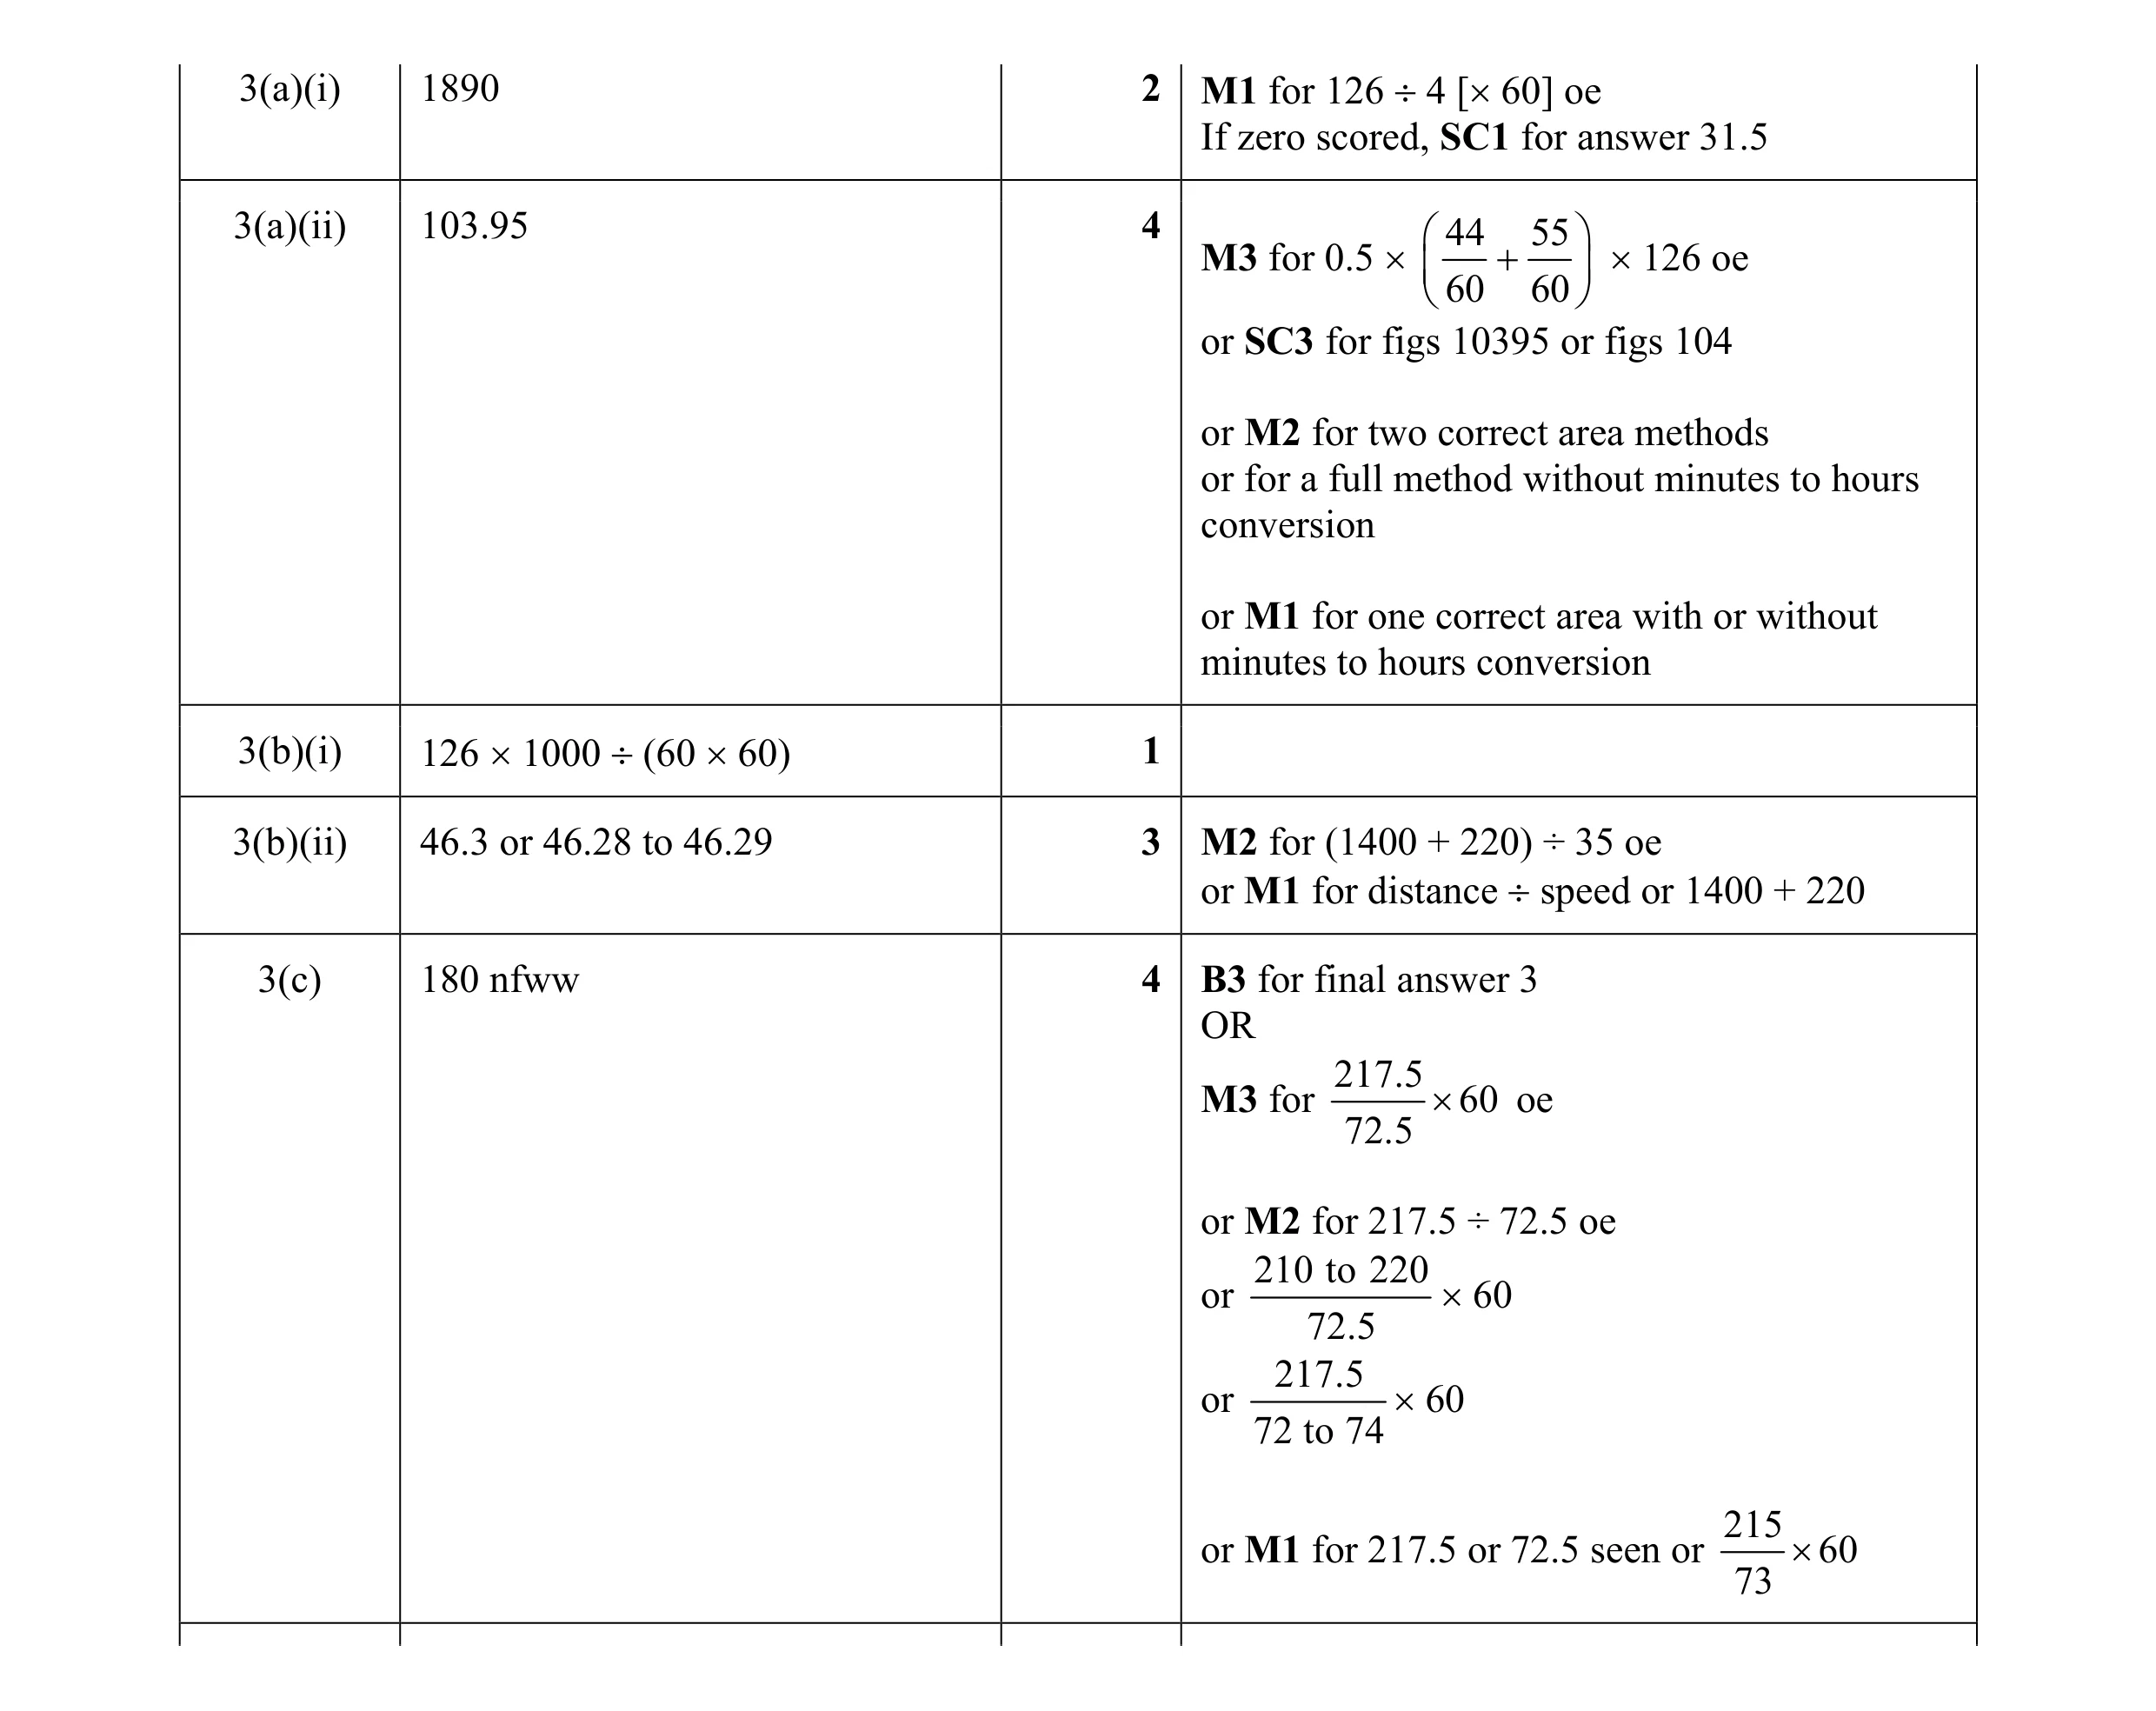 14
14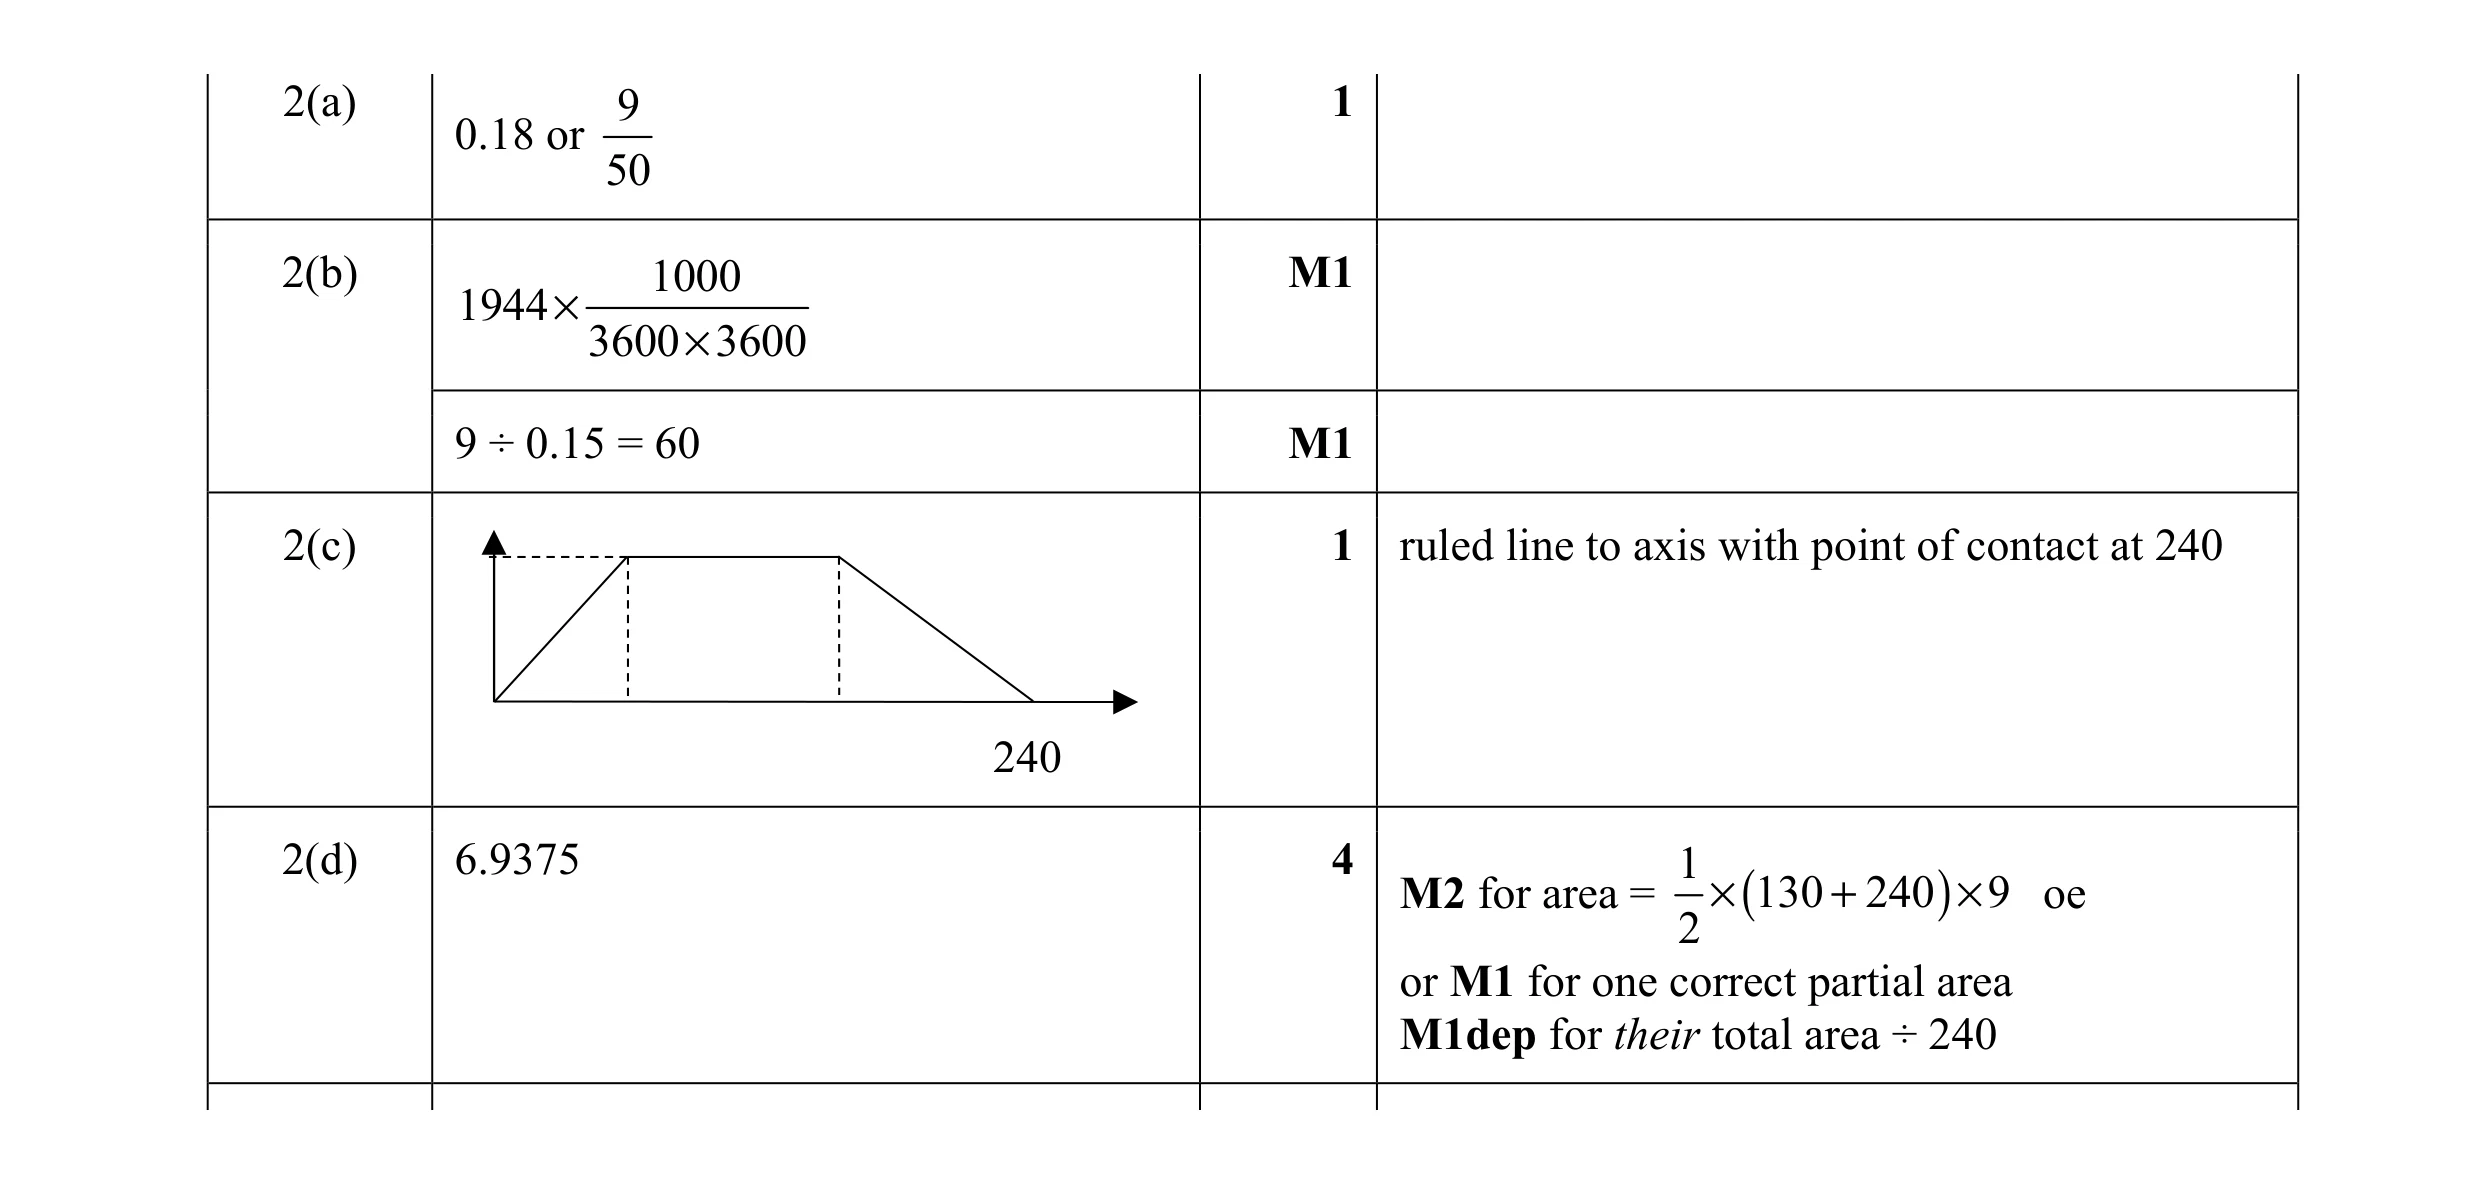 8
8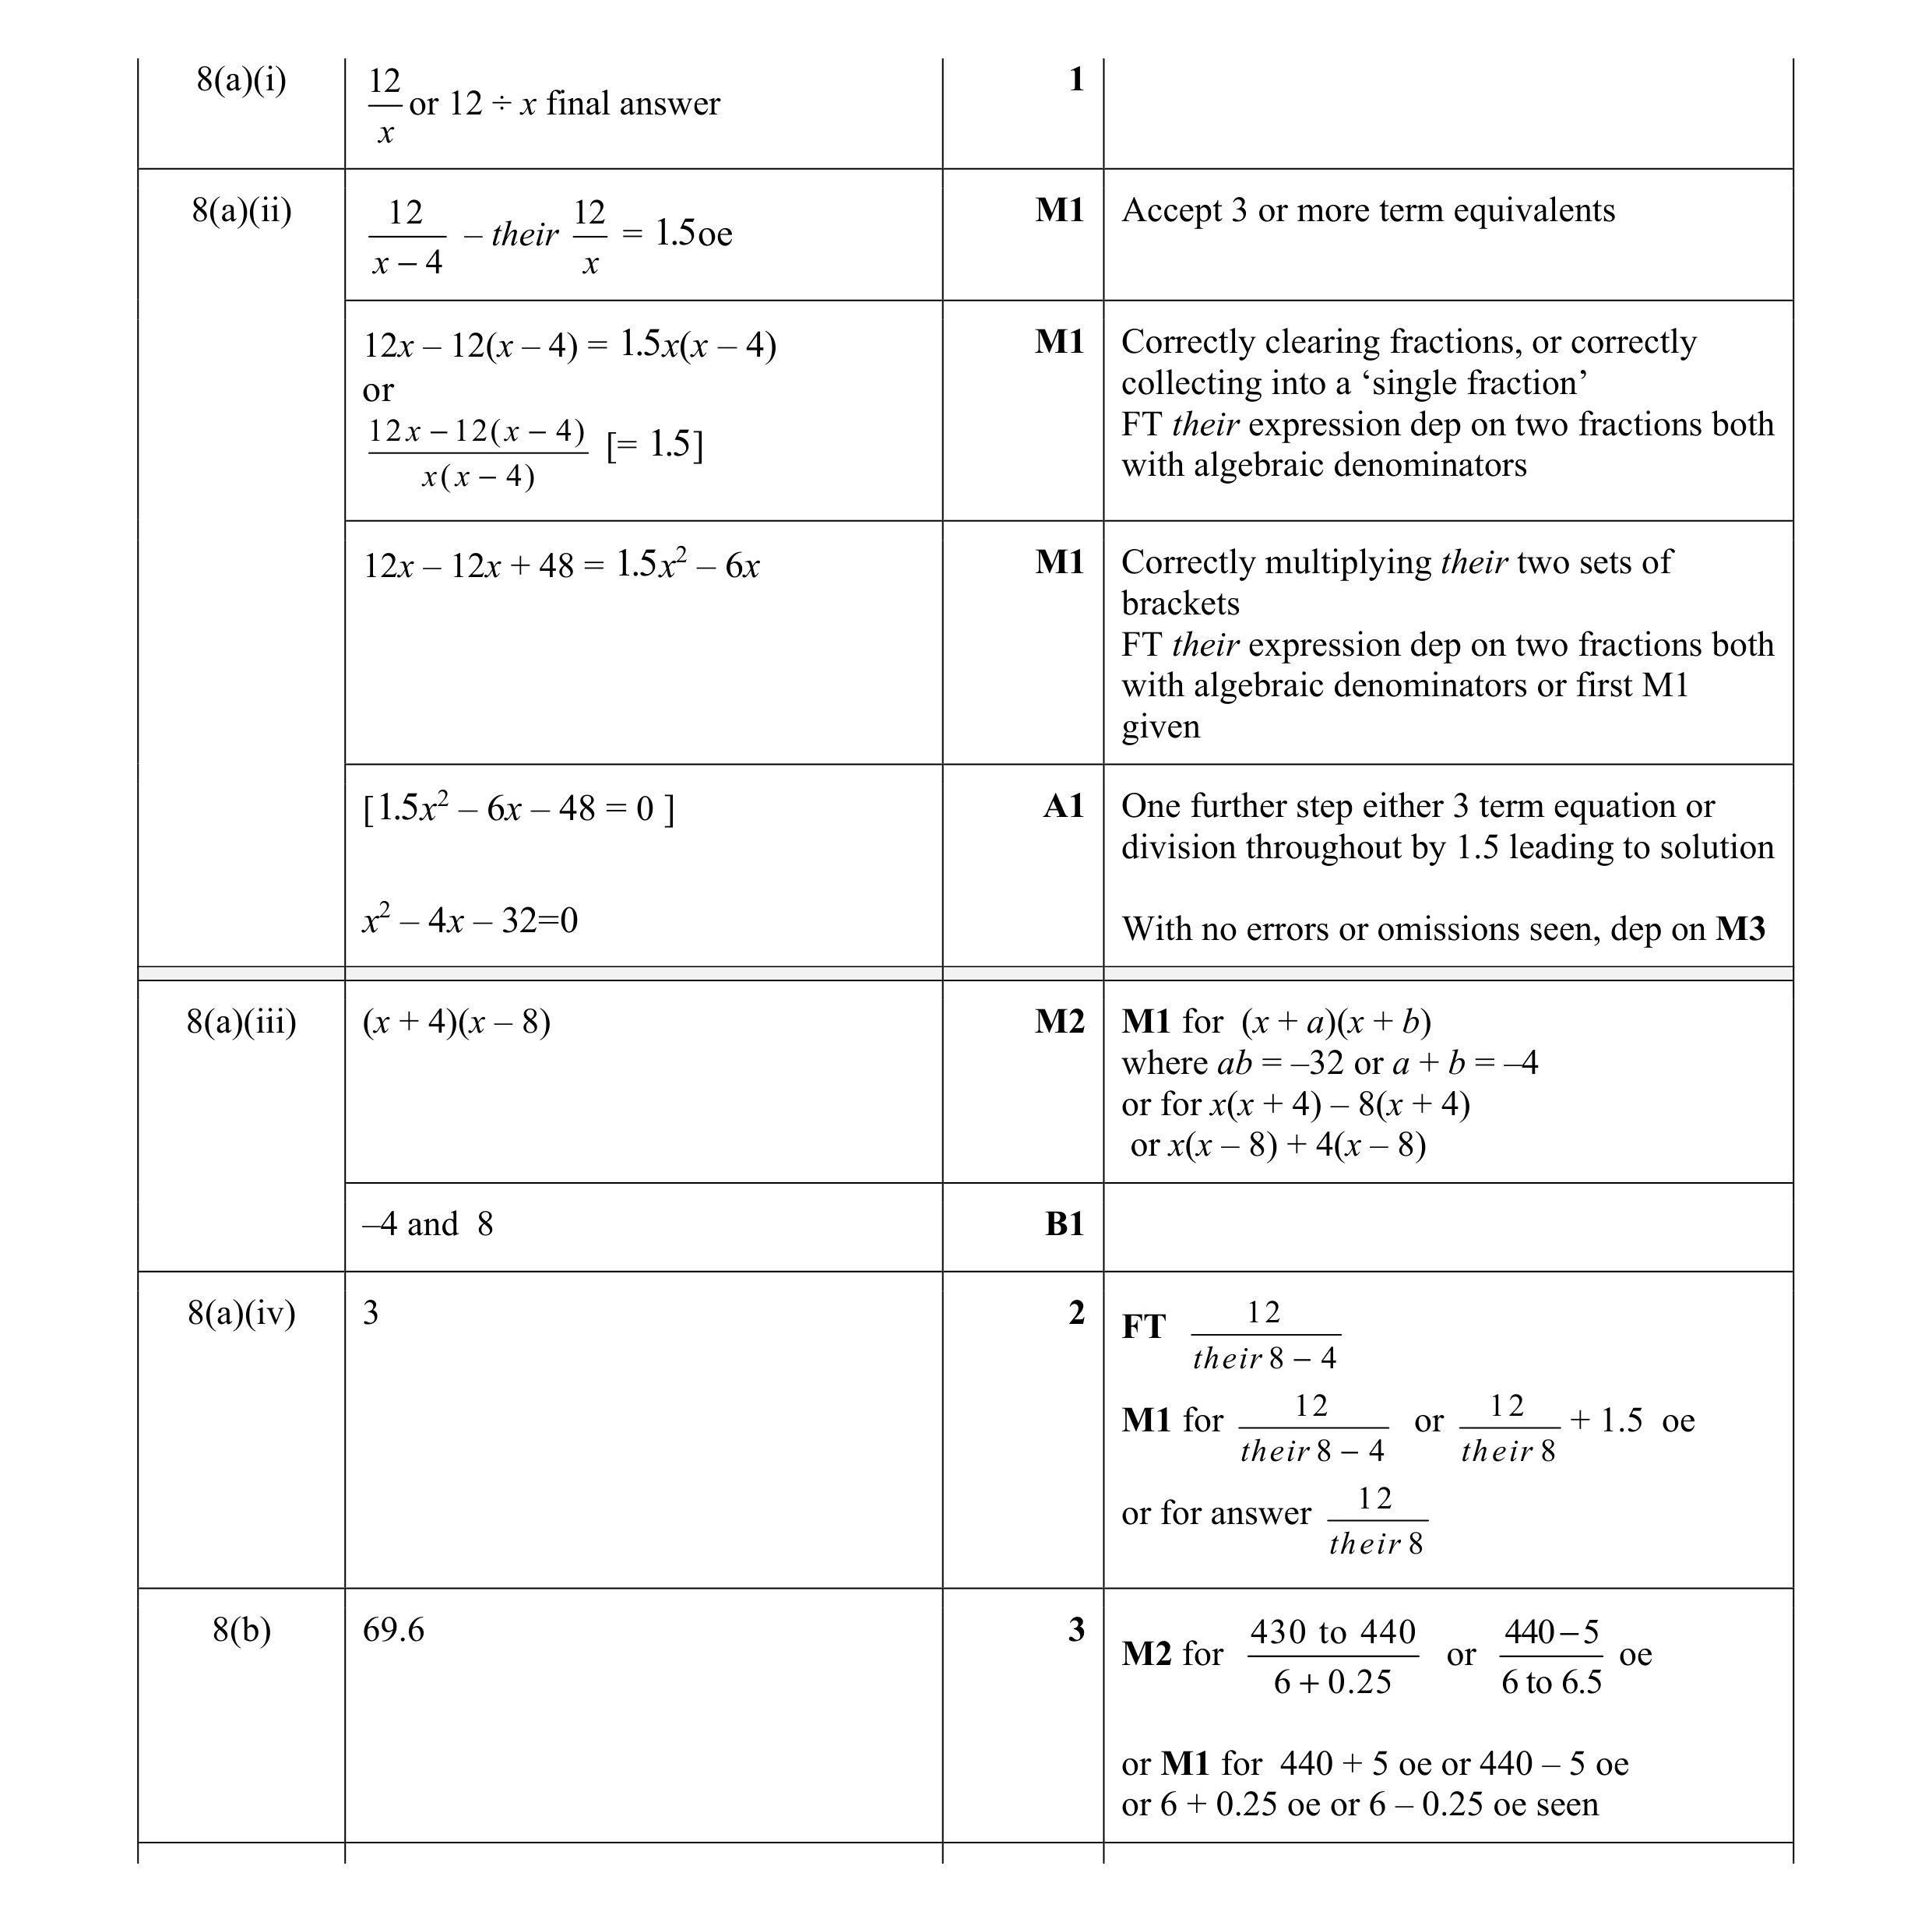 13
13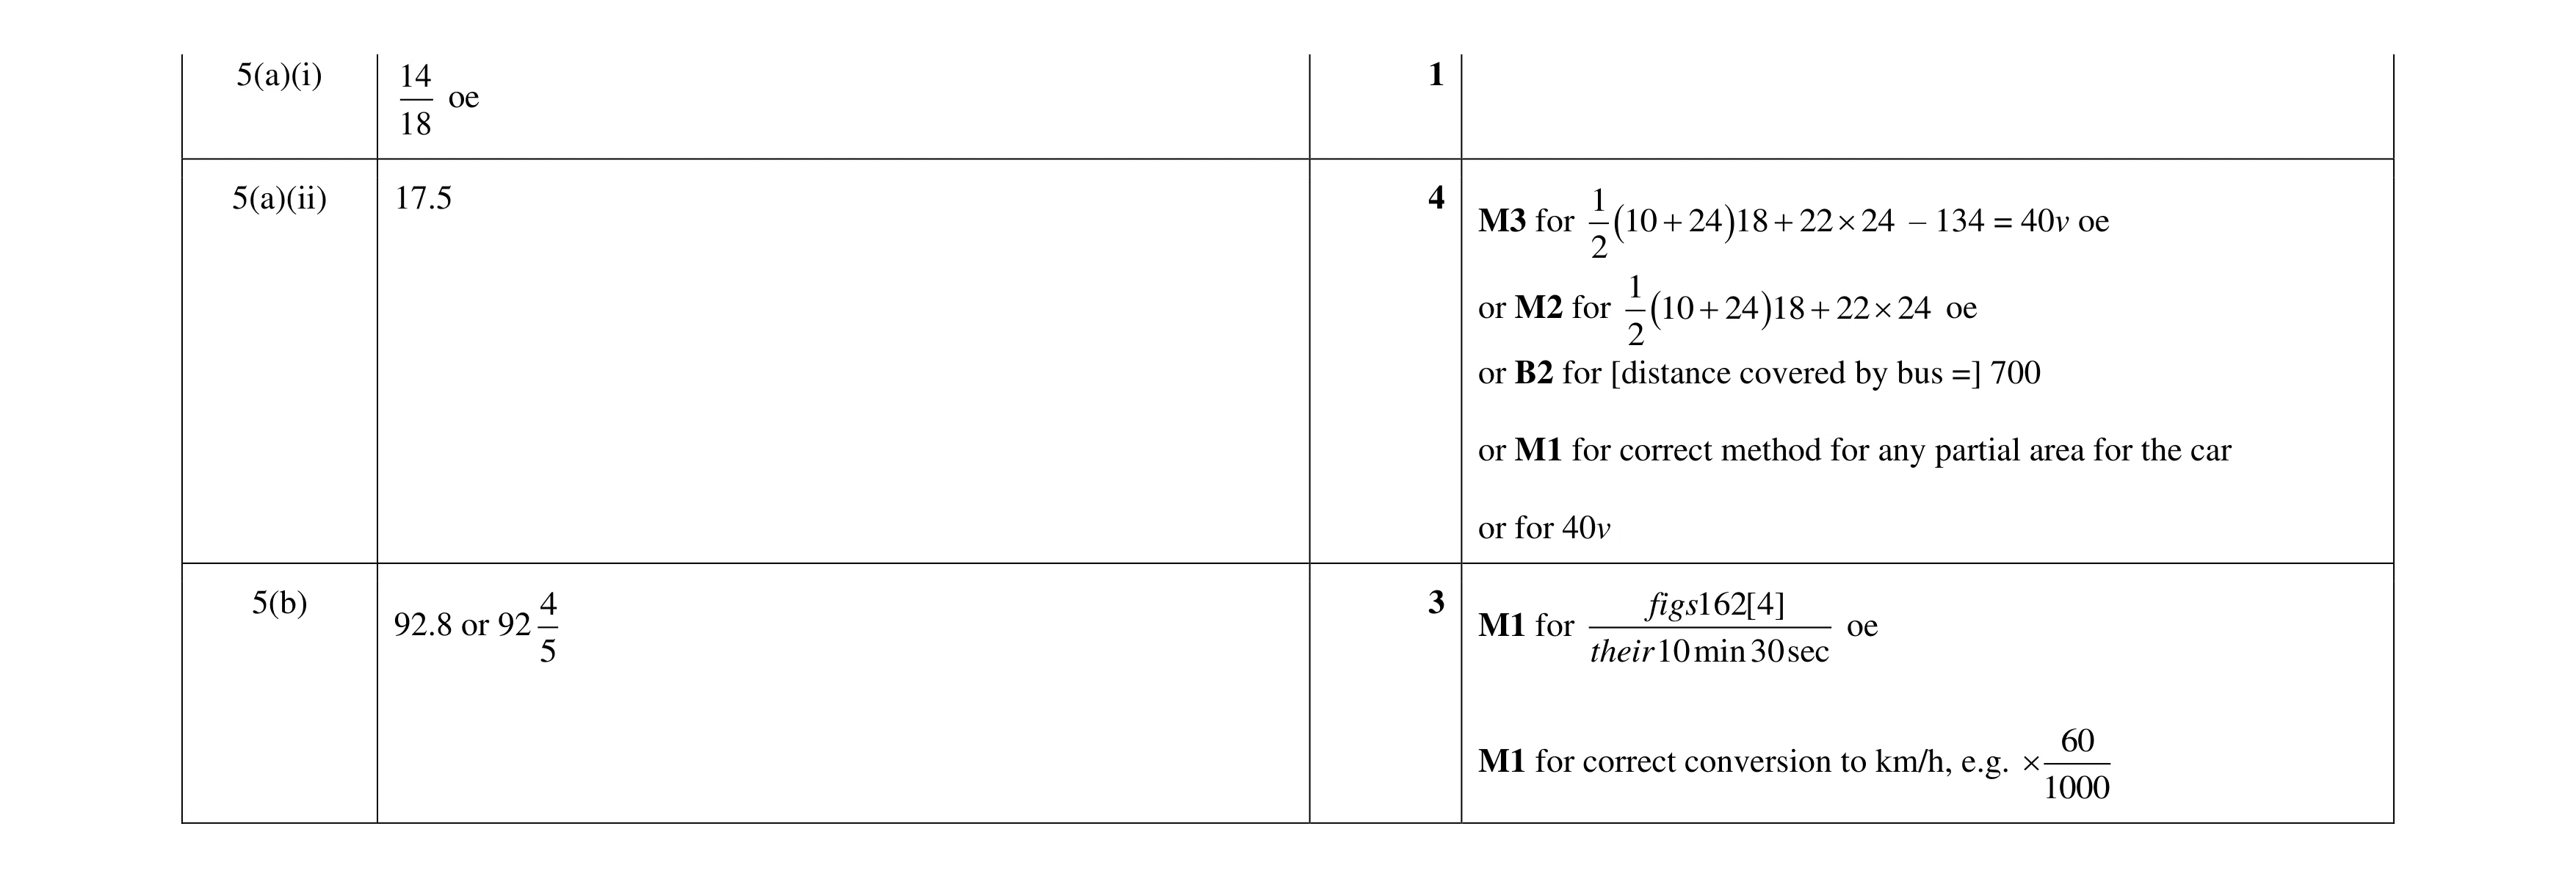 8
8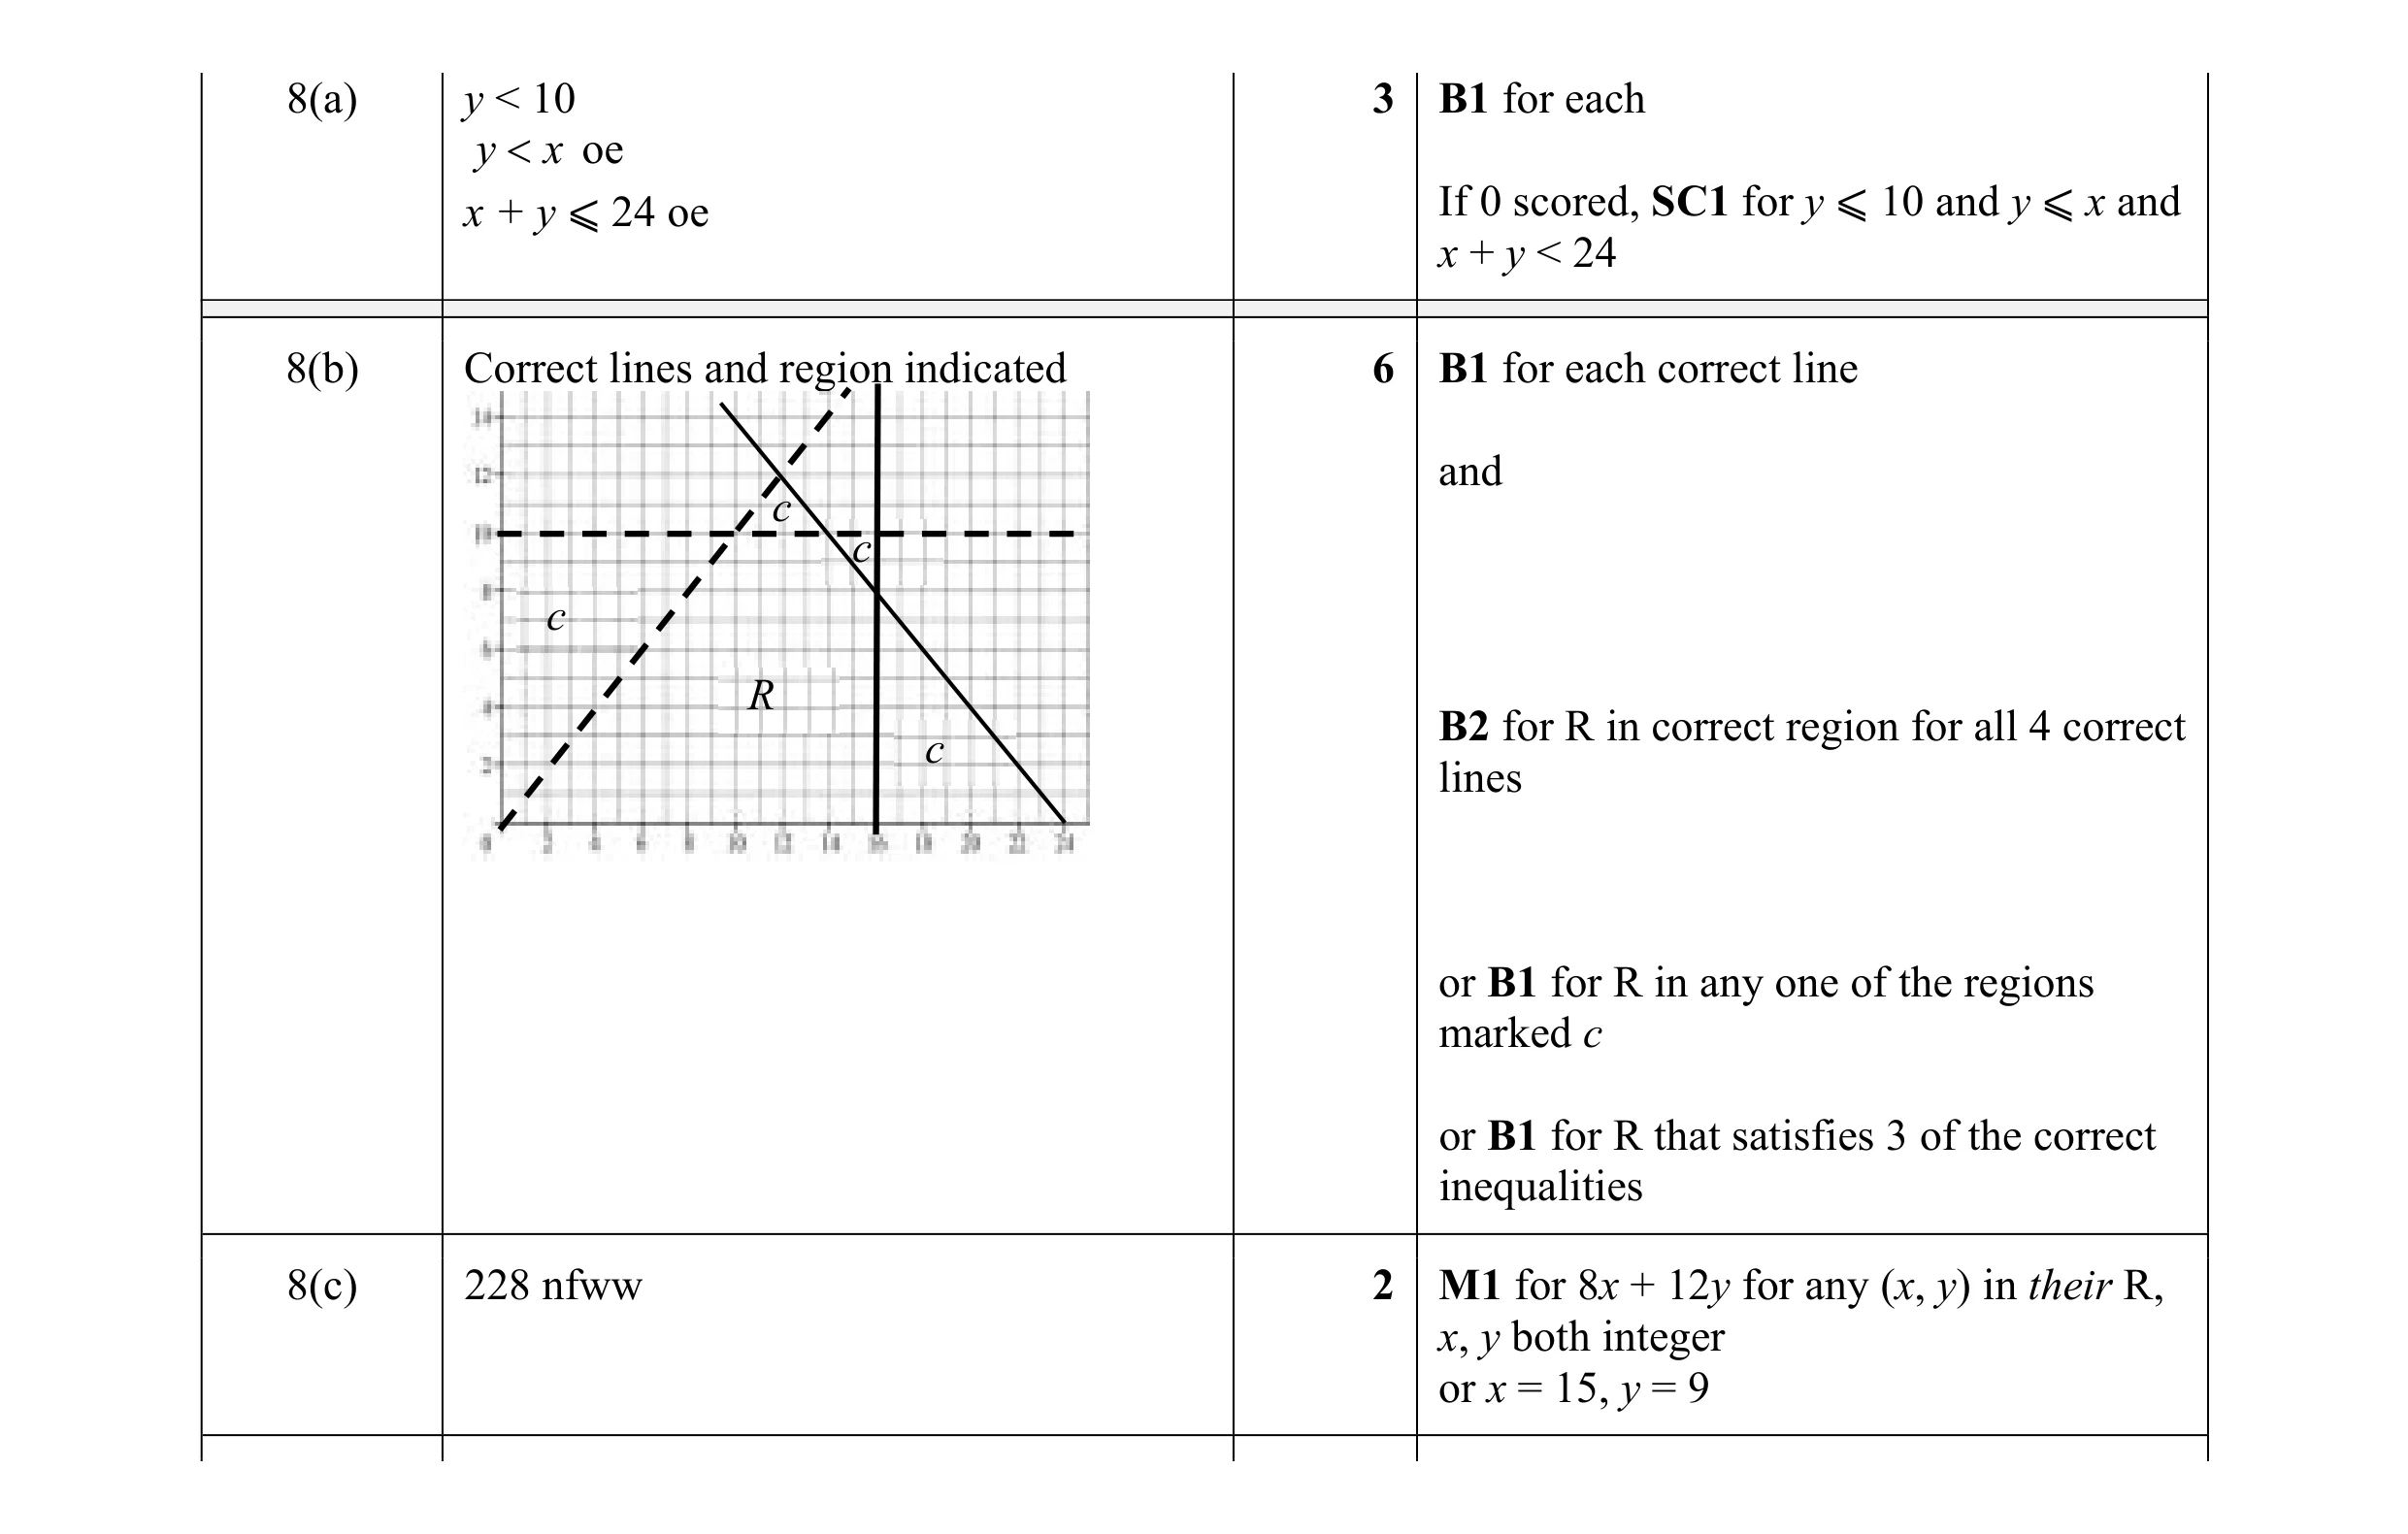 11
11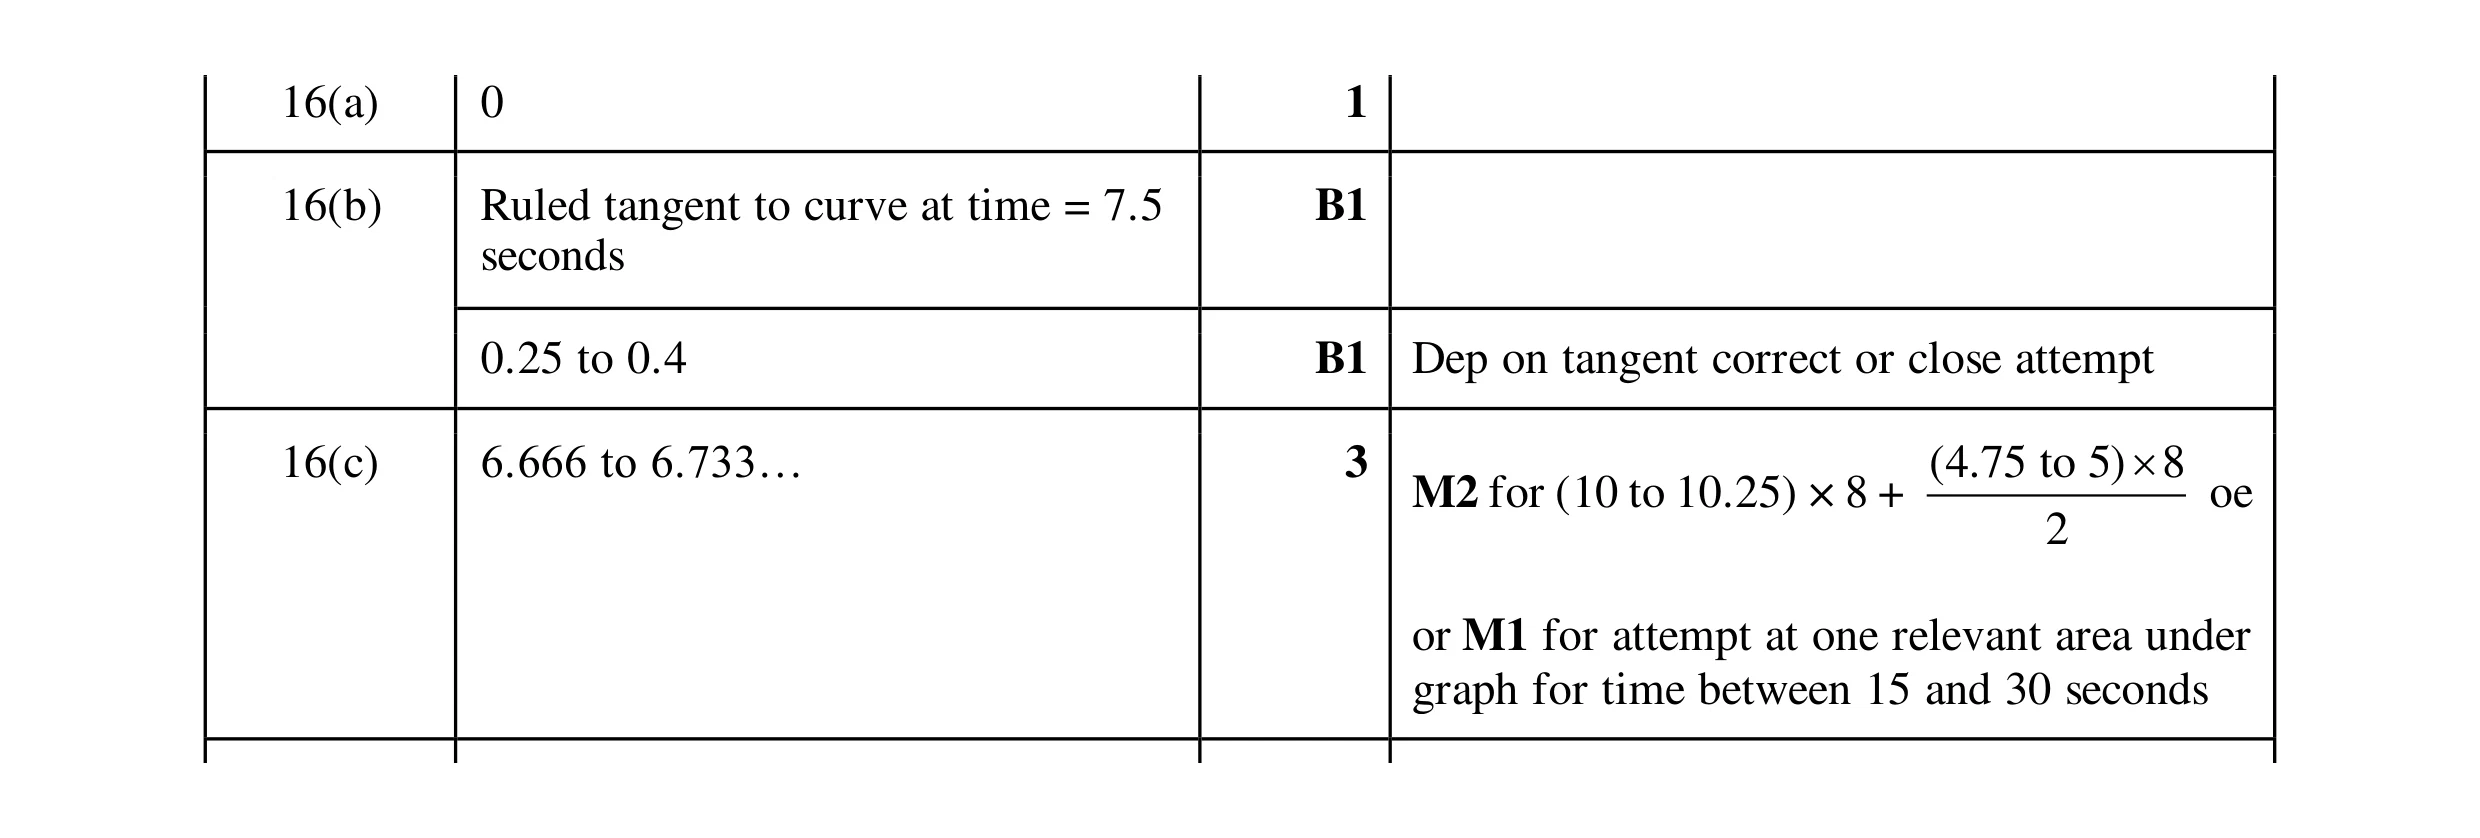 6
6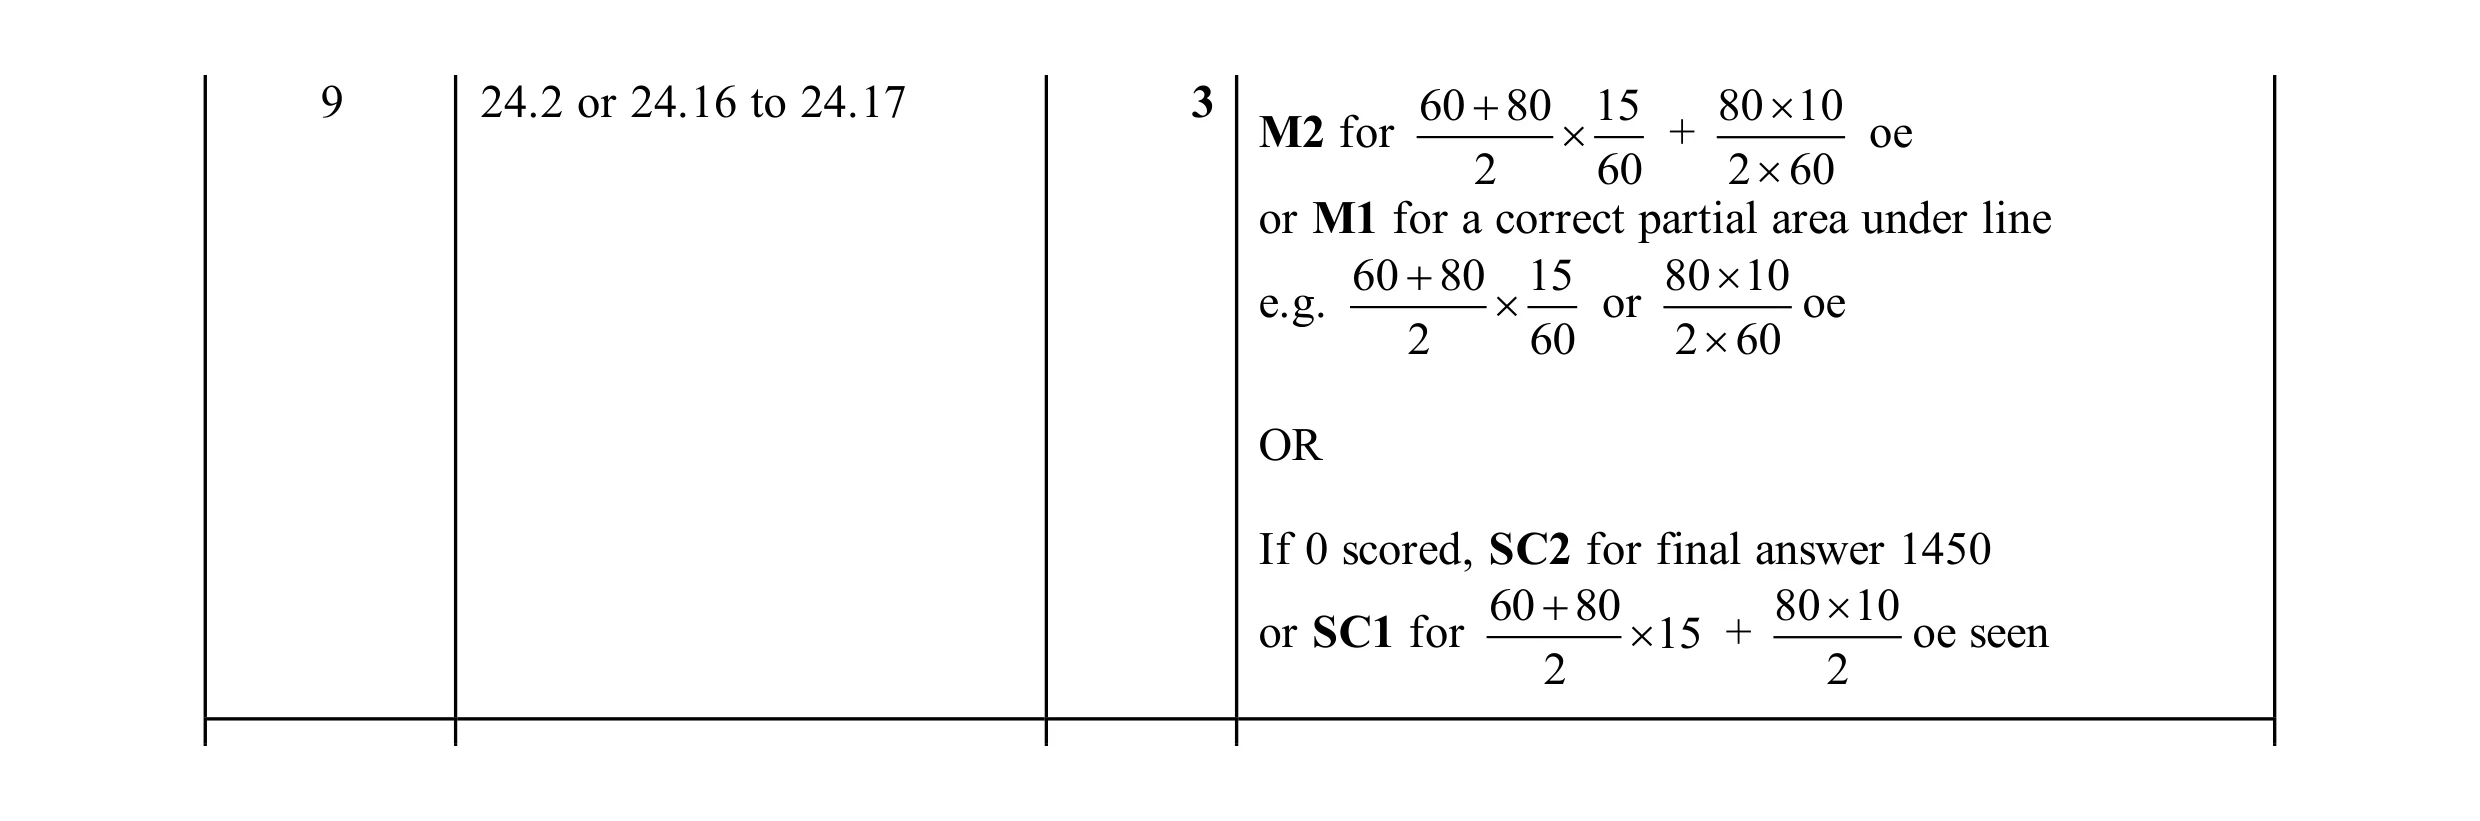 3
3