Cambridge IGCSE Mathematics 0580 — 2005 May/June Paper 4 · Variant 1
0580/41/M/J/05 · 4 questions · 62 marks · ≈70 min
The question paper and its mark scheme, free to read here and free to download. This is Cambridge’s own paper, exactly as it was sat.
Question paper8 pages
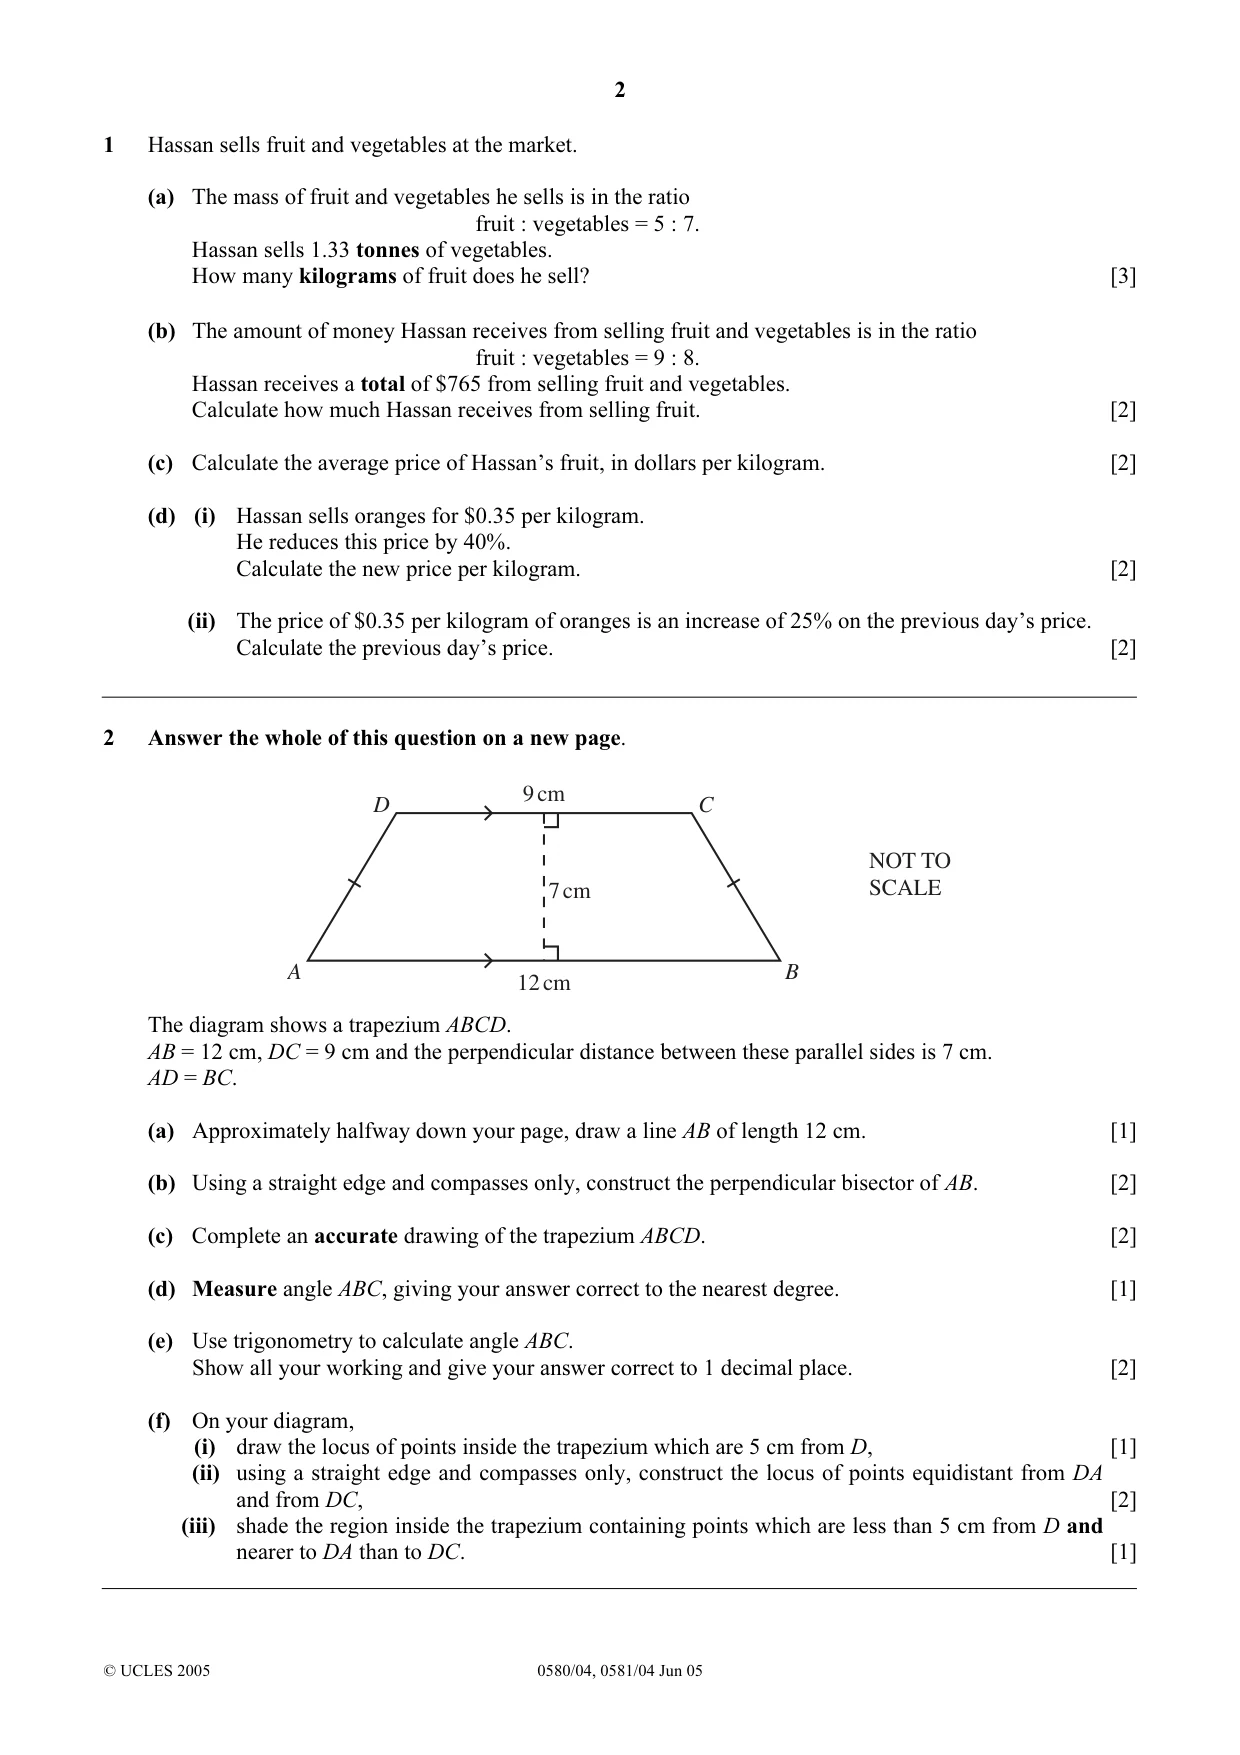
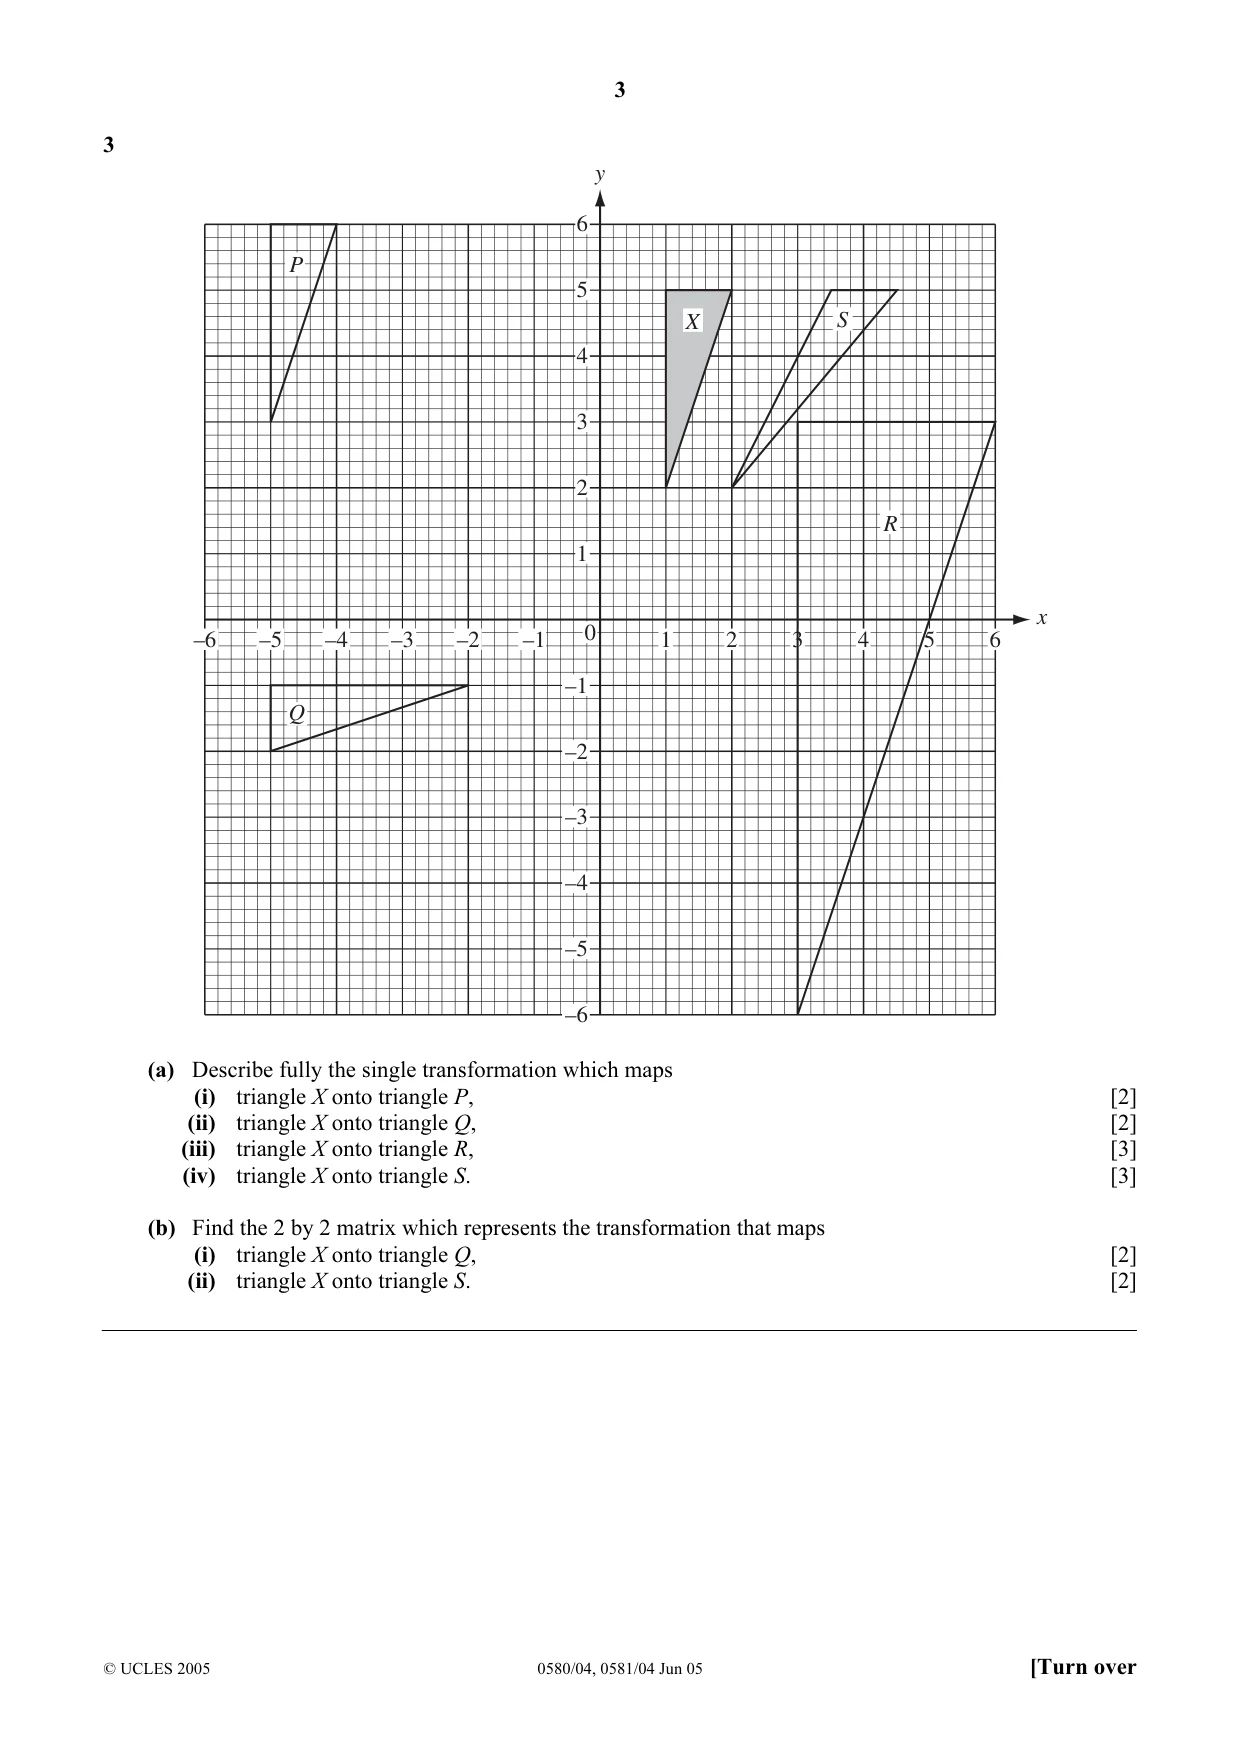
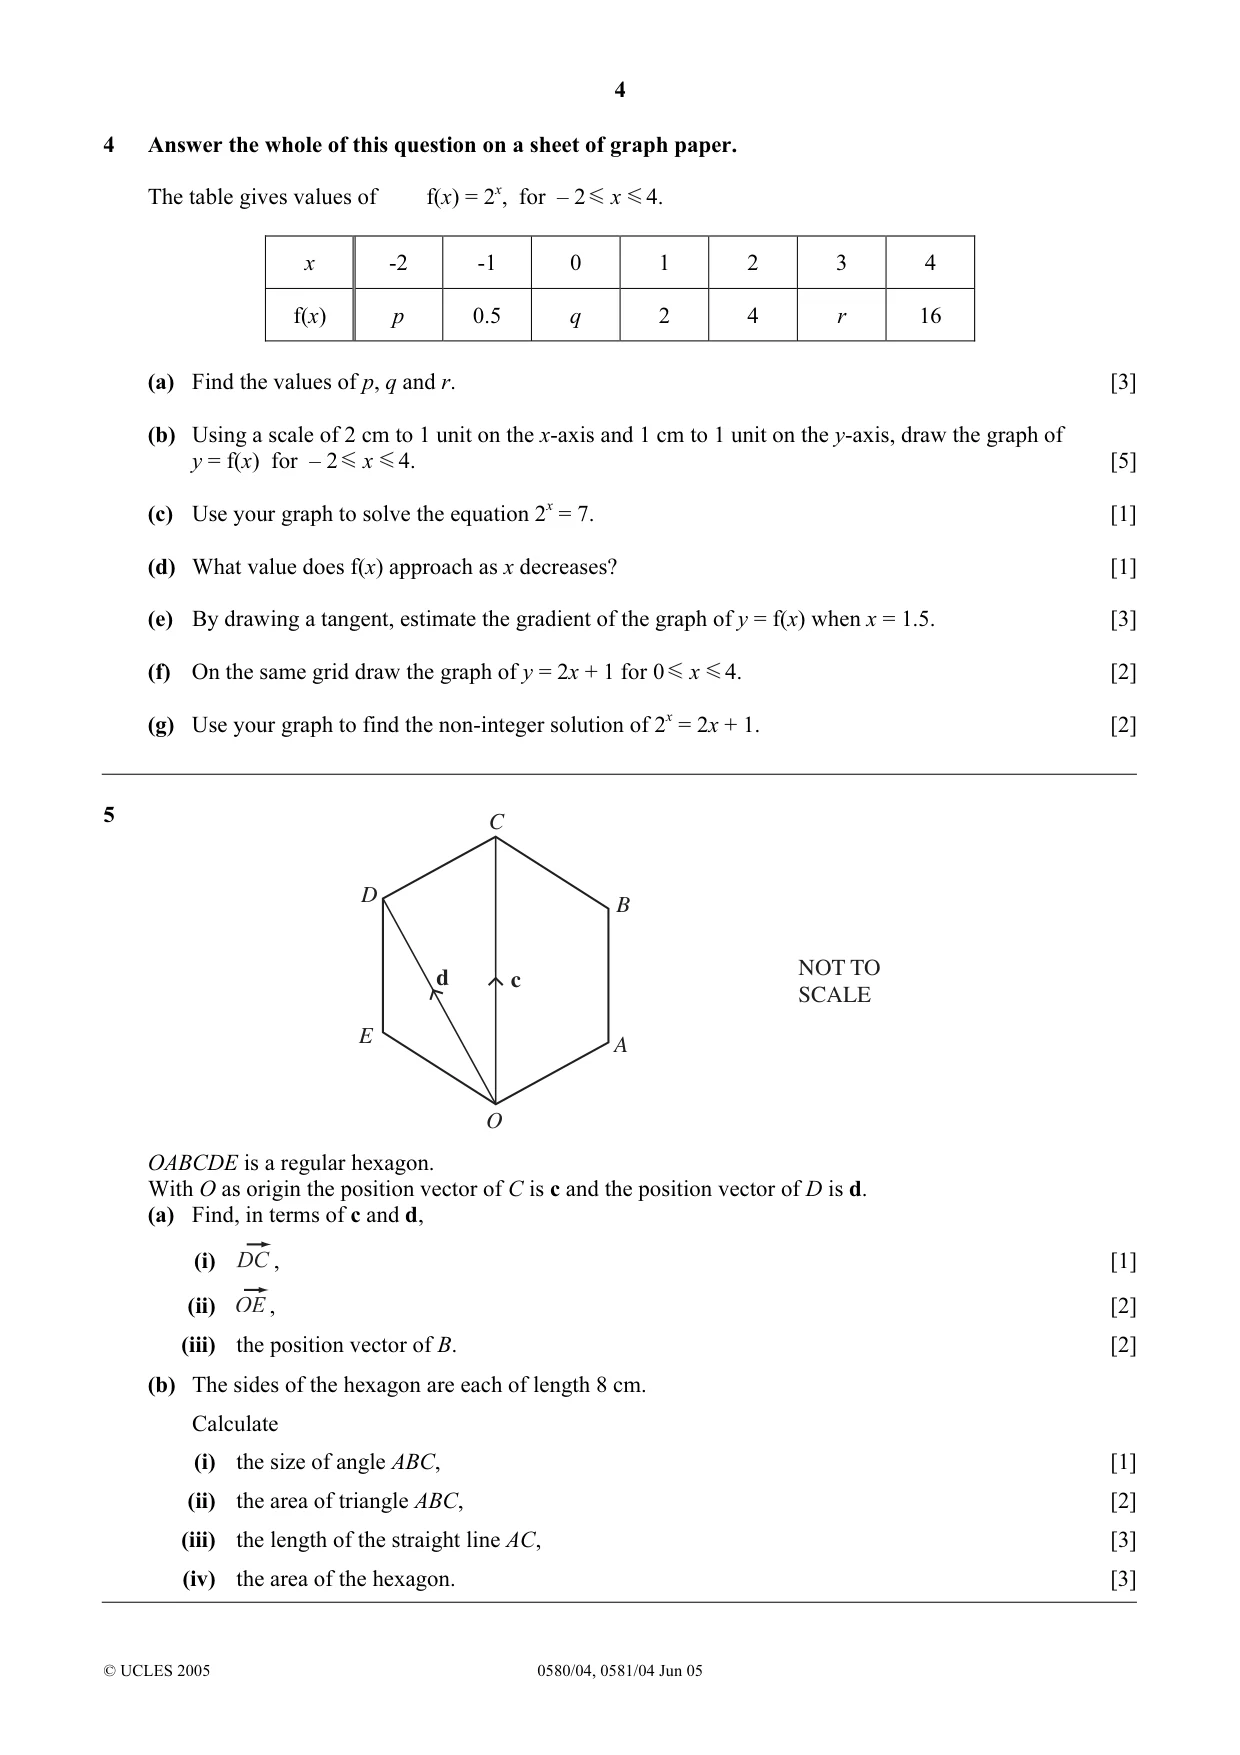
Mark scheme10 pages
Answers below. Sit the paper first if you are practising.
Questions as text
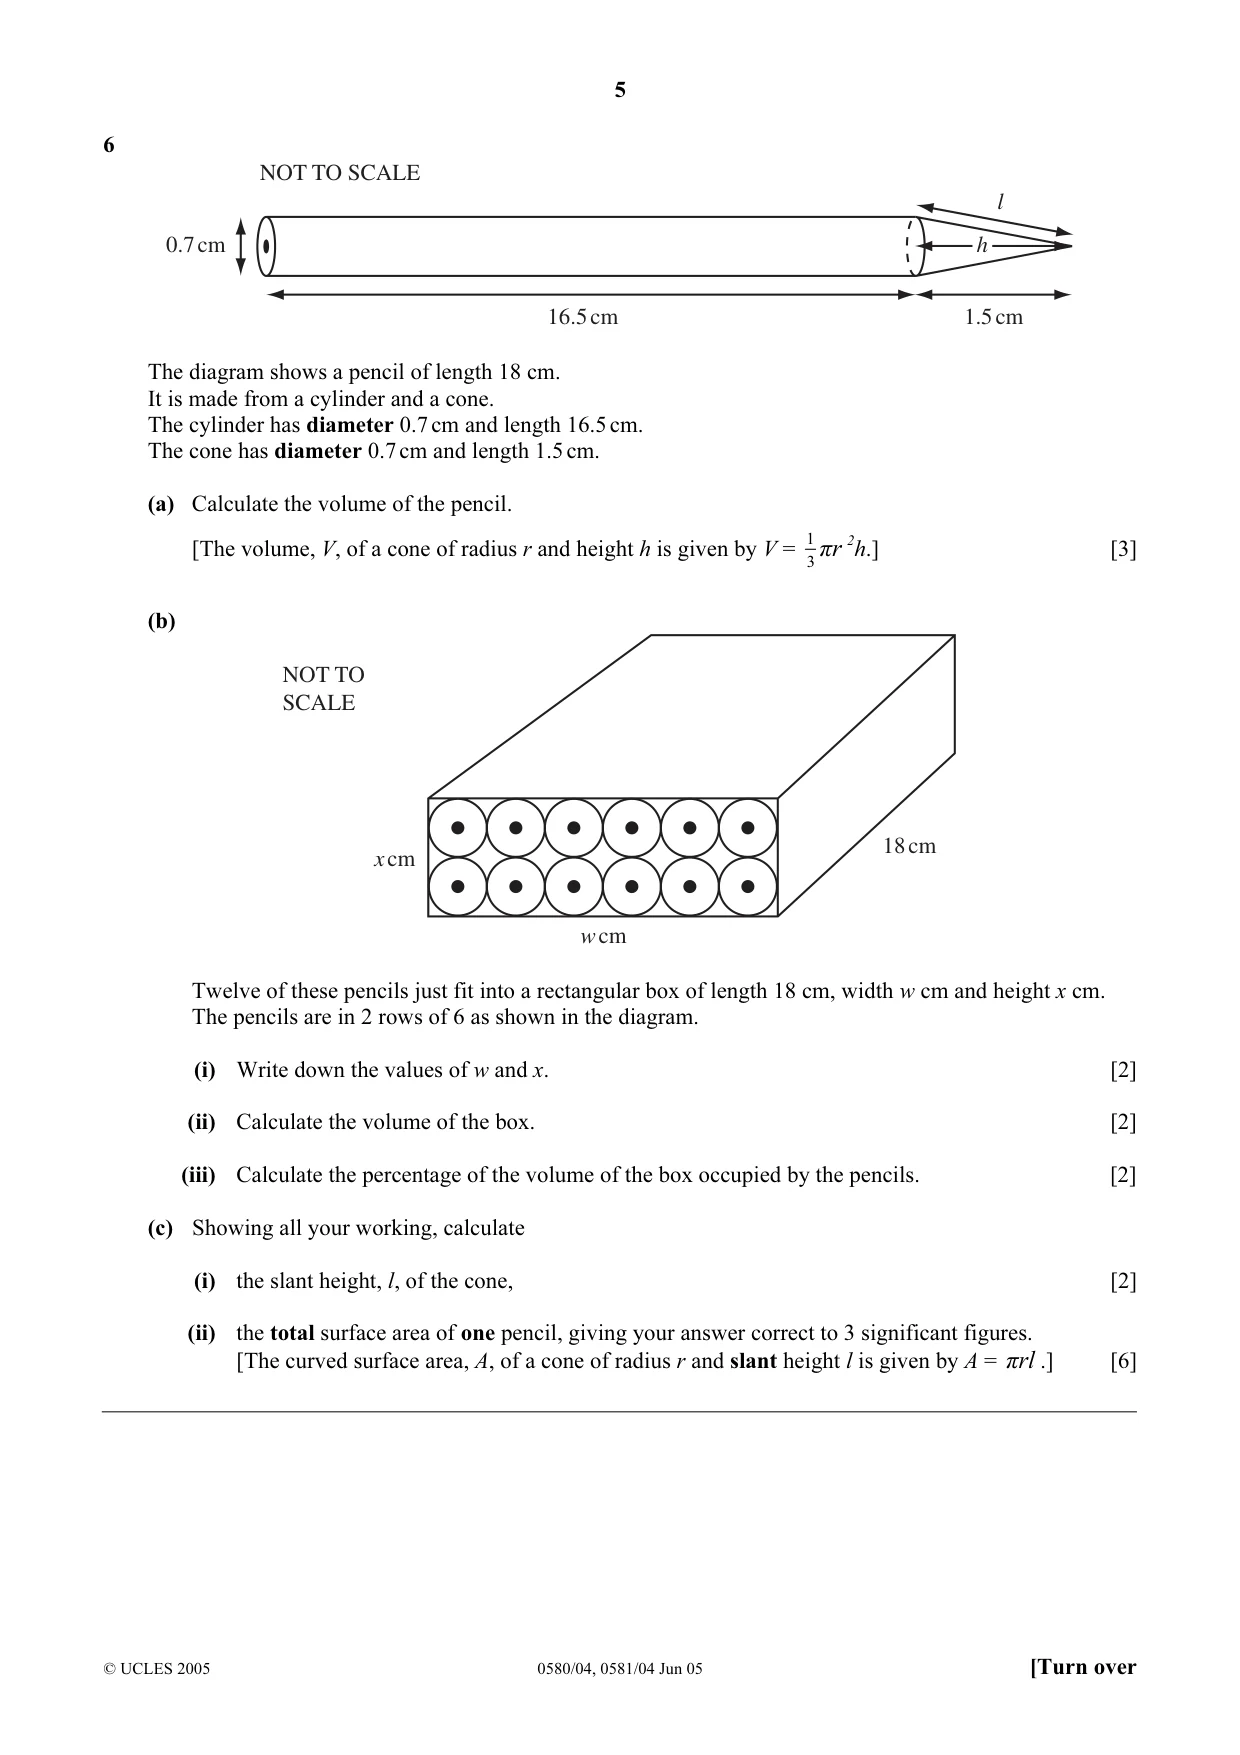
Q6 · NOT TO SCALE l 0.7 cm h 16.5 cm 1.5 cm The diagram shows a pencil of length 18 cm
6 NOT TO SCALE l 0.7 cm h 16.5 cm 1.5 cm The diagram shows a pencil of length 18 cm. It is made from a cylinder and a cone. The cylinder has diameter 0.7 cm and length 16.5 cm. The cone has diameter 0.7 cm and length 1.5 cm. (a) Calculate the volume of the pencil. [The volume, V, of a cone of radius r and height h is given by V = 1 πr 2h.] [3] 3 (b) NOT TO SCALE 18 cm x cm w cm Twelve of these pencils just fit into a rectangular box of length 18 cm, width w cm and height x cm. The pencils are in 2 rows of 6 as shown in the diagram. (i) Write down the values of w and x. [2] (ii) Calculate the volume of the box. [2] (iii) Calculate the percentage of the volume of the box occupied by the pencils. [2] (c) Showing all your working, calculate (i) the slant height, l, of the cone, [2] (ii) the total surface area of one pencil, giving your answer correct to 3 significant figures. [The curved surface area, A, of a cone of radius r and slant height l is given by A = πrl .] [6]
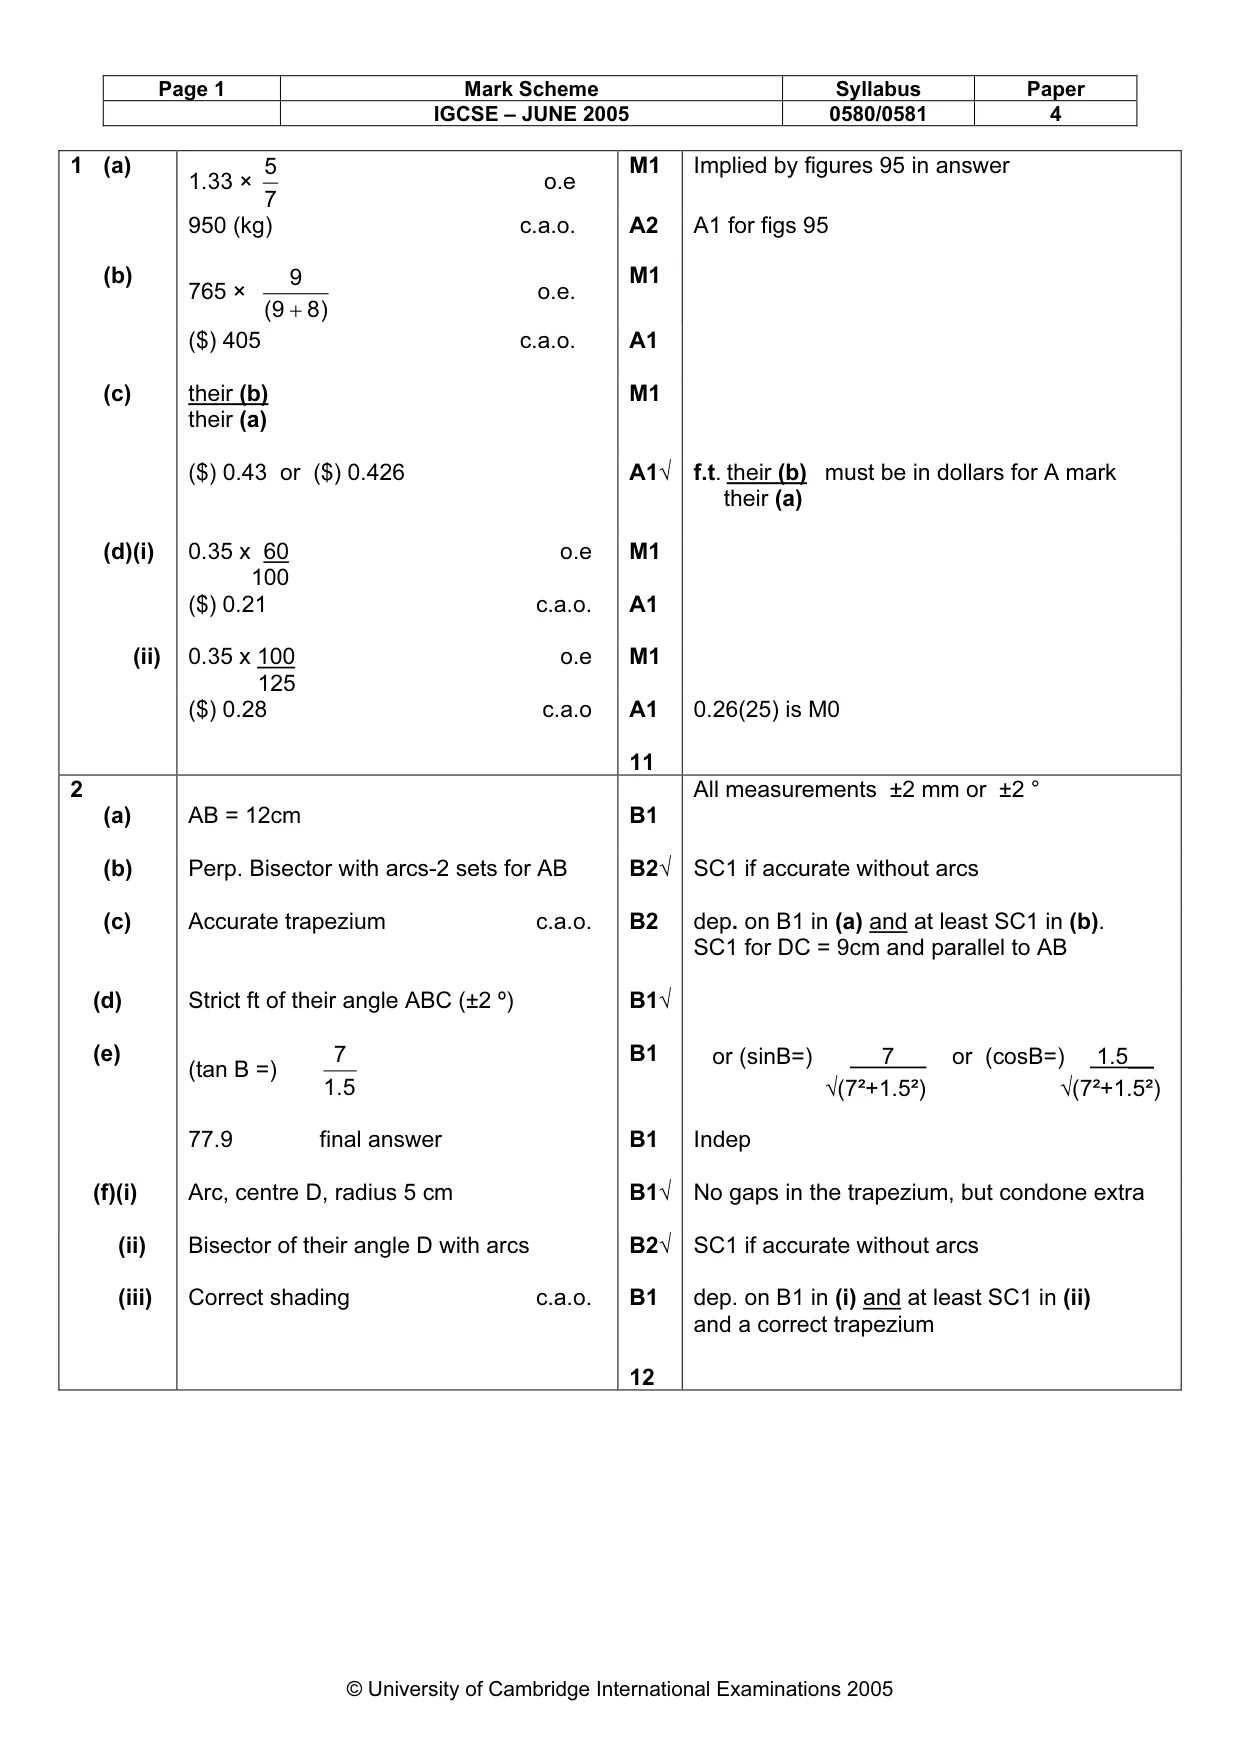
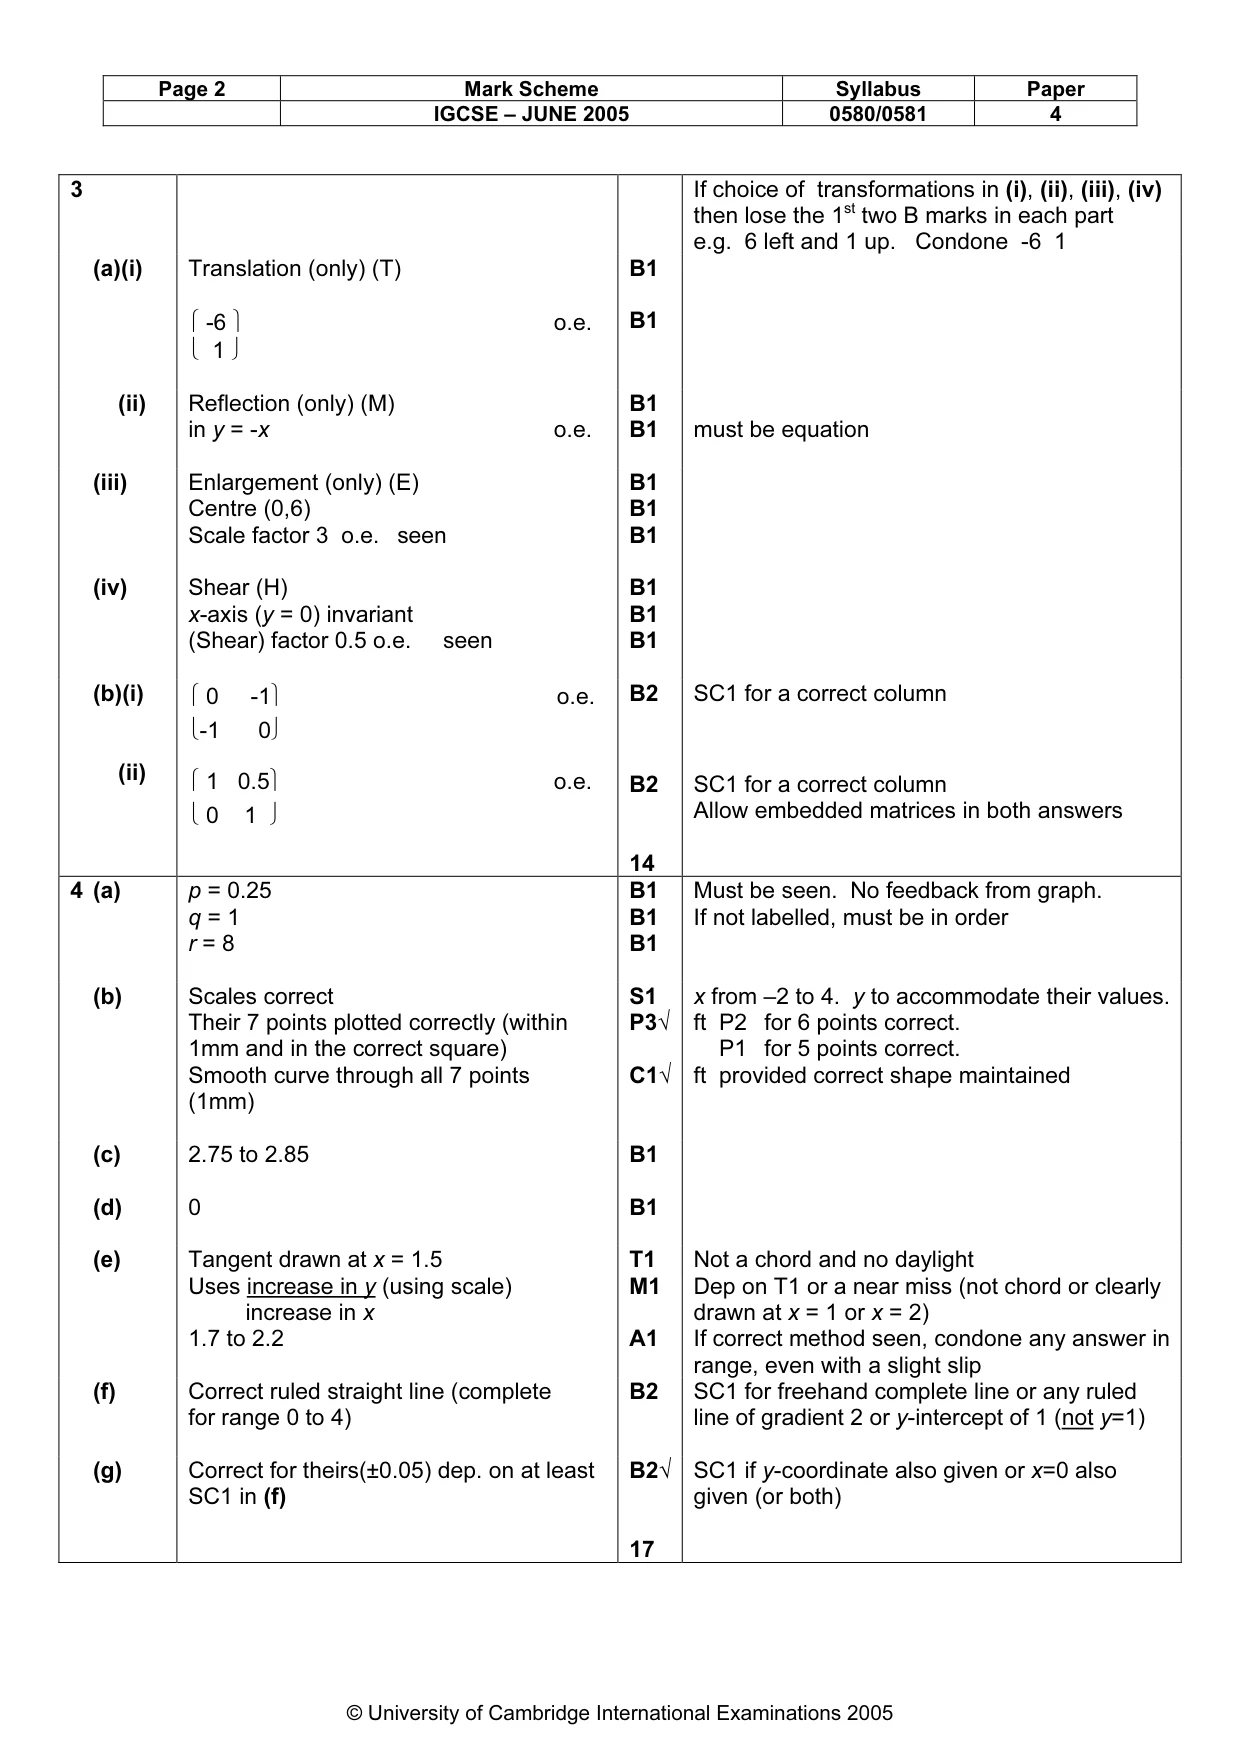
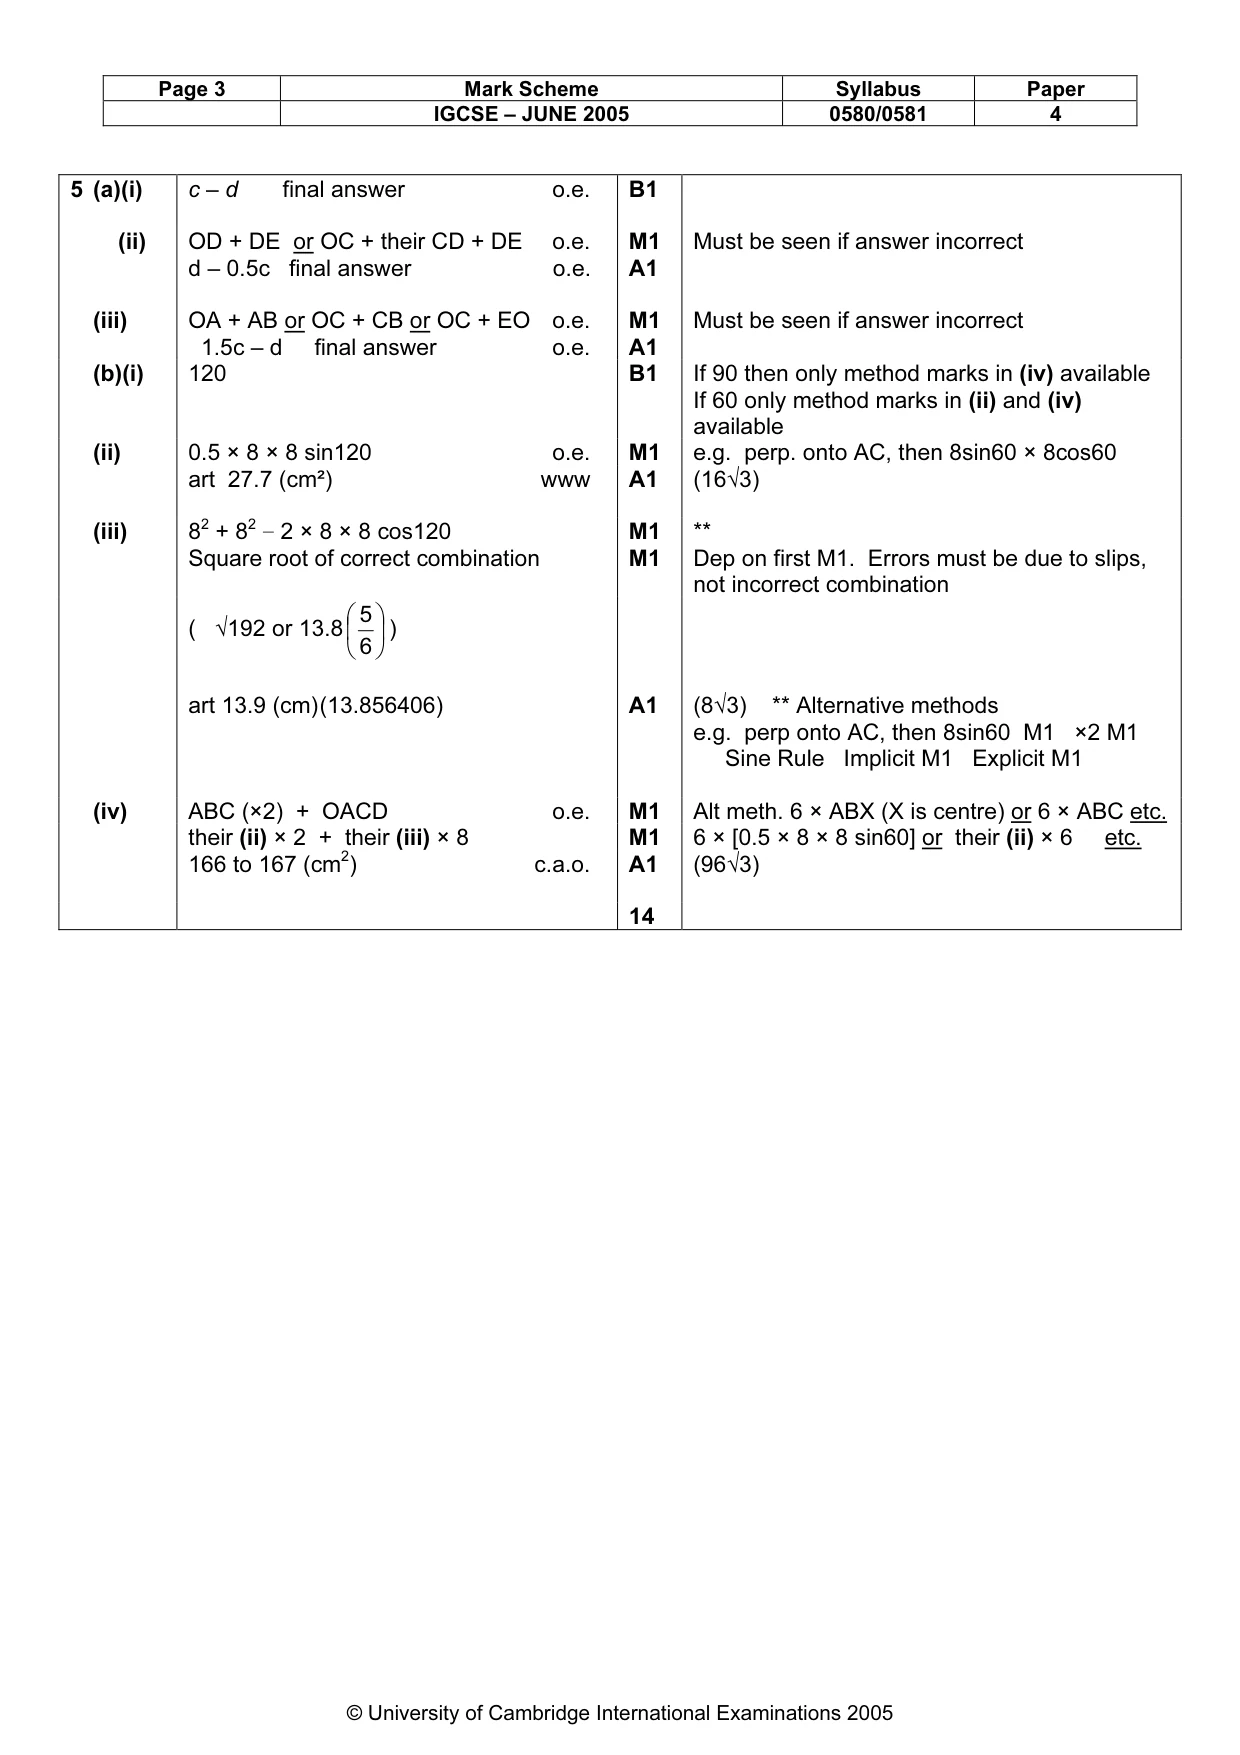
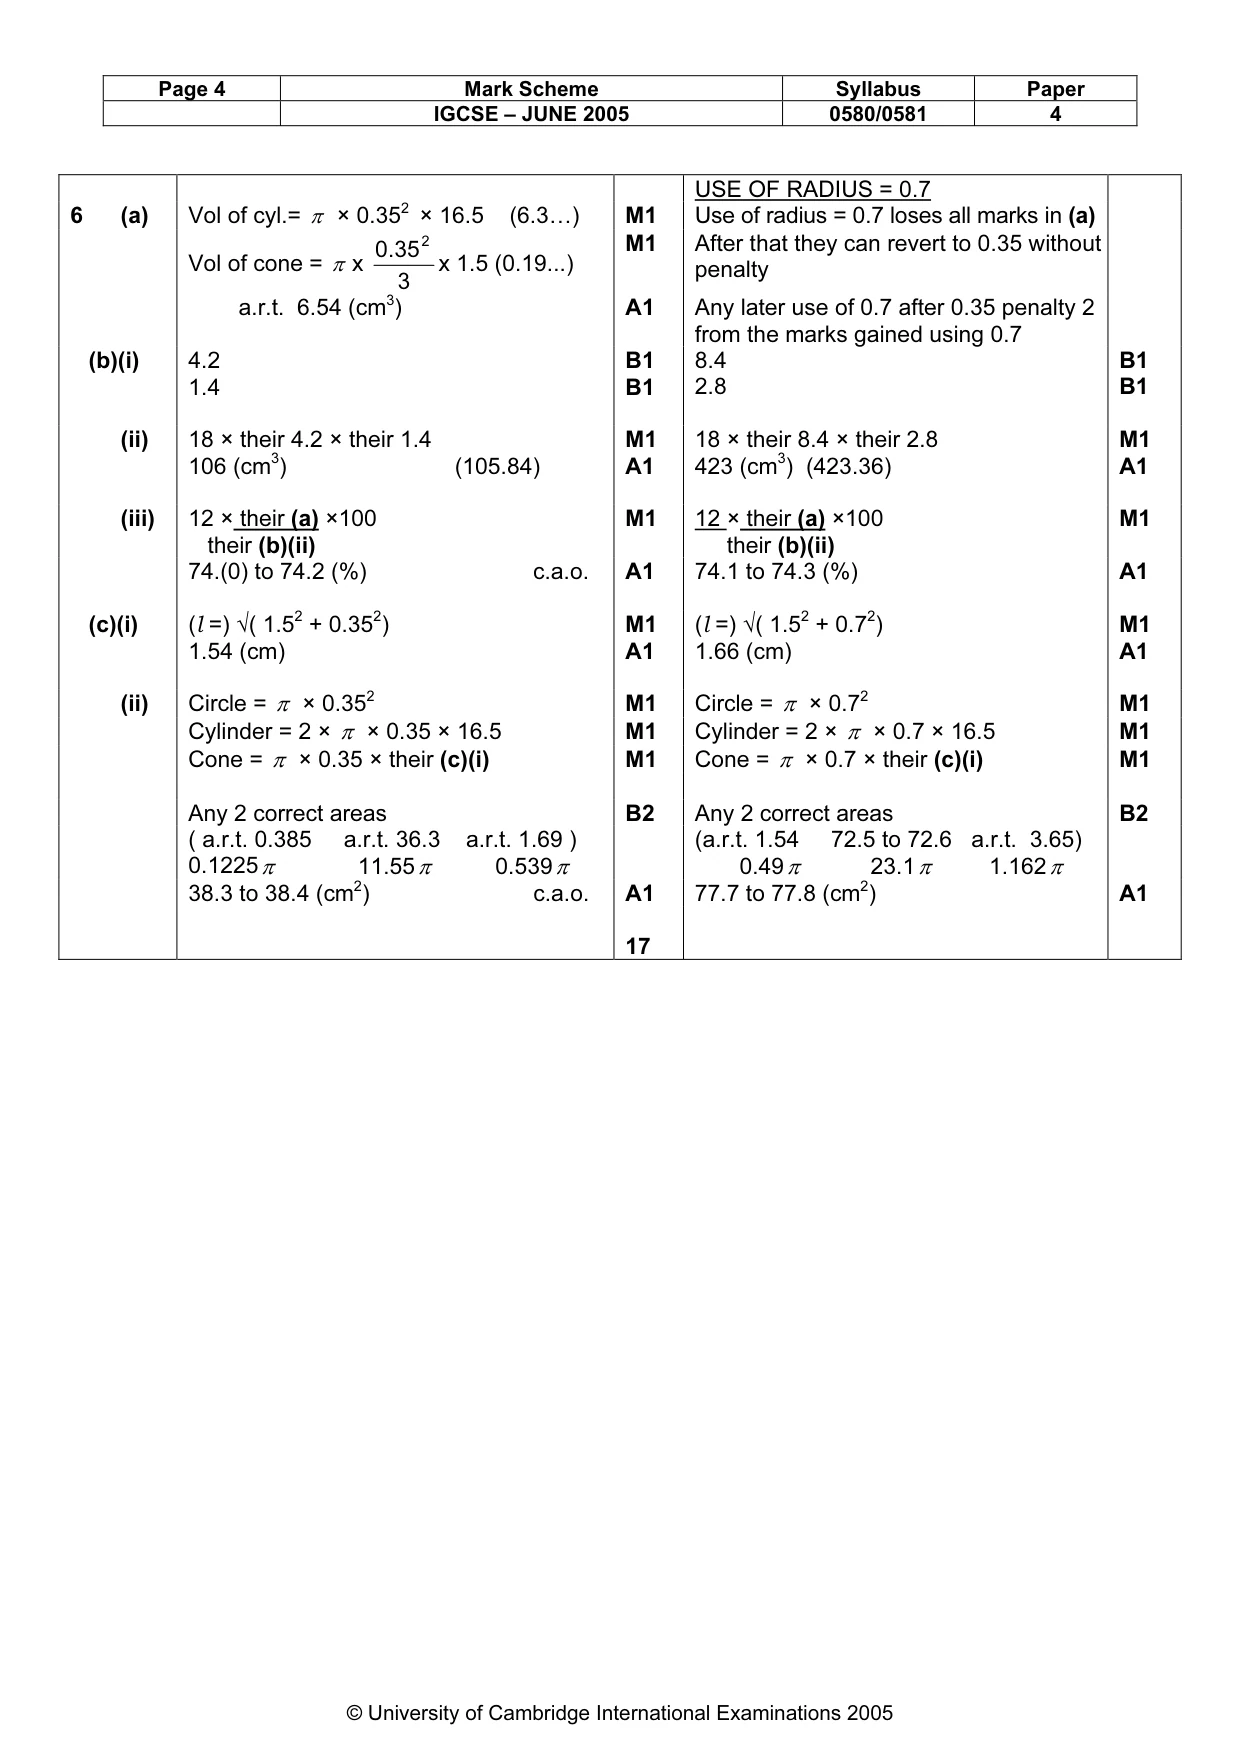
Mark scheme: 6 (a) Vol of cyl.= π × 0.352 × 16.5 (6.3…) M1 Use of radius = 0.7 loses all marks in (a) 0 . 35 2 M1 After that they can revert to 0.35 without Vol of cone = π x x 1.5 (0.19...) penalty 3 a.r.t. 6.54 (cm3) A1 Any later use of 0.7 after 0.35 penalty 2 from the marks gained using 0.7 (b)(i) 4.2 B1 8.4 B1 1.4 B1 2.8 B1 (ii) 18 × their 4.2 × their 1.4 M1 18 × their 8.4 × their 2.8 M1 106 (cm3) (105.84) A1 423 (cm3) (423.36) A1 (iii) 12 × their (a) ×100 M1 12 × their (a) ×100 M1 their (b)(ii) their (b)(ii) 74.(0) to 74.2 (%) c.a.o. A1 74.1 to 74.3 (%) A1 (c)(i) (l =) √( 1.52 + 0.352) M1 (l =) √( 1.52 + 0.72) M1 1.54 (cm) A1 1.66 (cm) A1 (ii) Circle = π × 0.352 M1 Circle = π × 0.72 M1 Cylinder = 2 × π × 0.35 × 16.5 M1 Cylinder = 2 × π × 0.7 × 16.5 M1 Cone = π × 0.35 × their (c)(i) M1 Cone = π × 0.7 × their (c)(i) M1 Any 2 correct areas B2 Any 2 correct areas B2 ( a.r.t. 0.385 a.r.t. 36.3 a.r.t. 1.69 ) (a.r.t. 1.54 72.5 to 72.6 a.r.t. 3.65) 0.1225π 11.55π 0.539π 0.49π 23.1π 1.162π 38.3 to 38.4 (cm2) c.a.o. A1 77.7 to 77.8 (cm2) A1 17 IGCSE – JUNE 2005 0580/0581 4
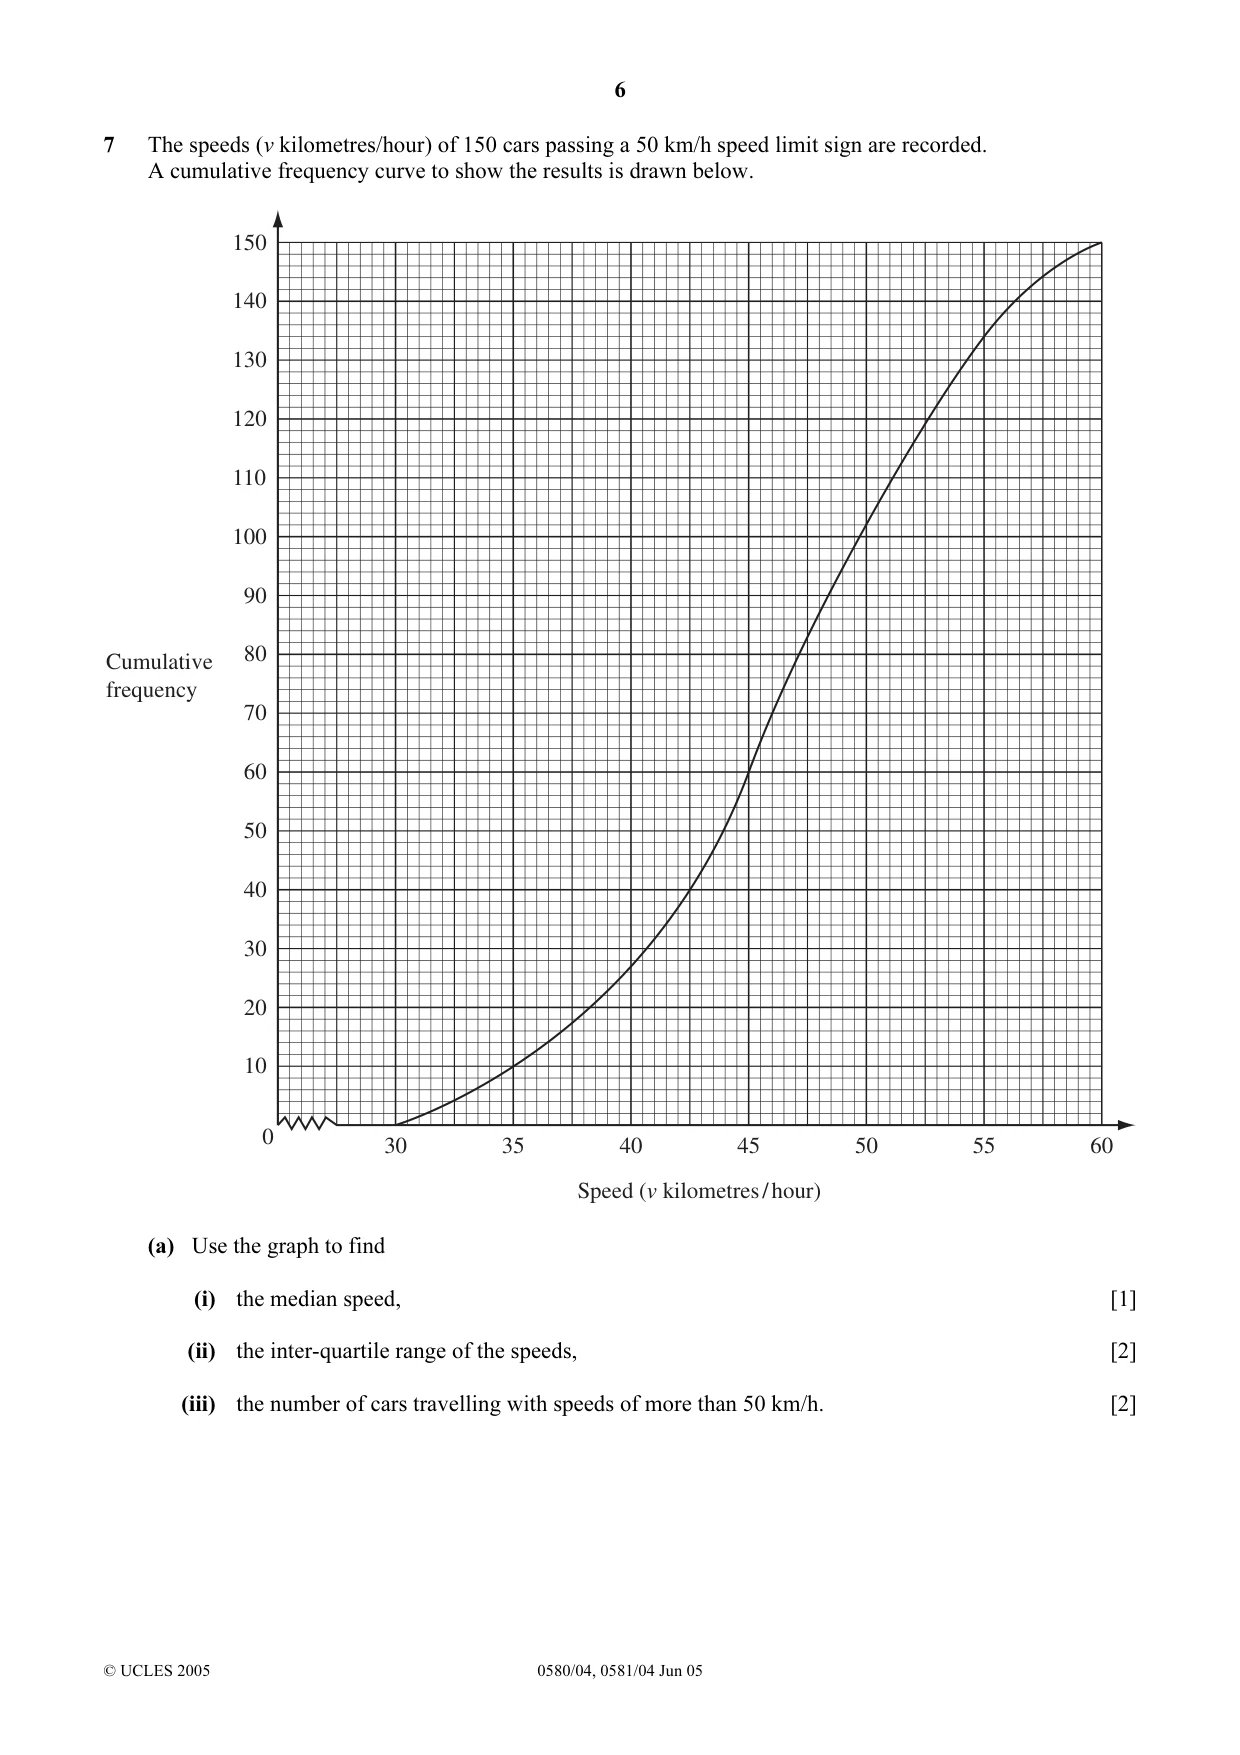
Q7 · The speeds (v kilometres/hour) of 150 cars passing a 50 km/h speed limit sign are recorded
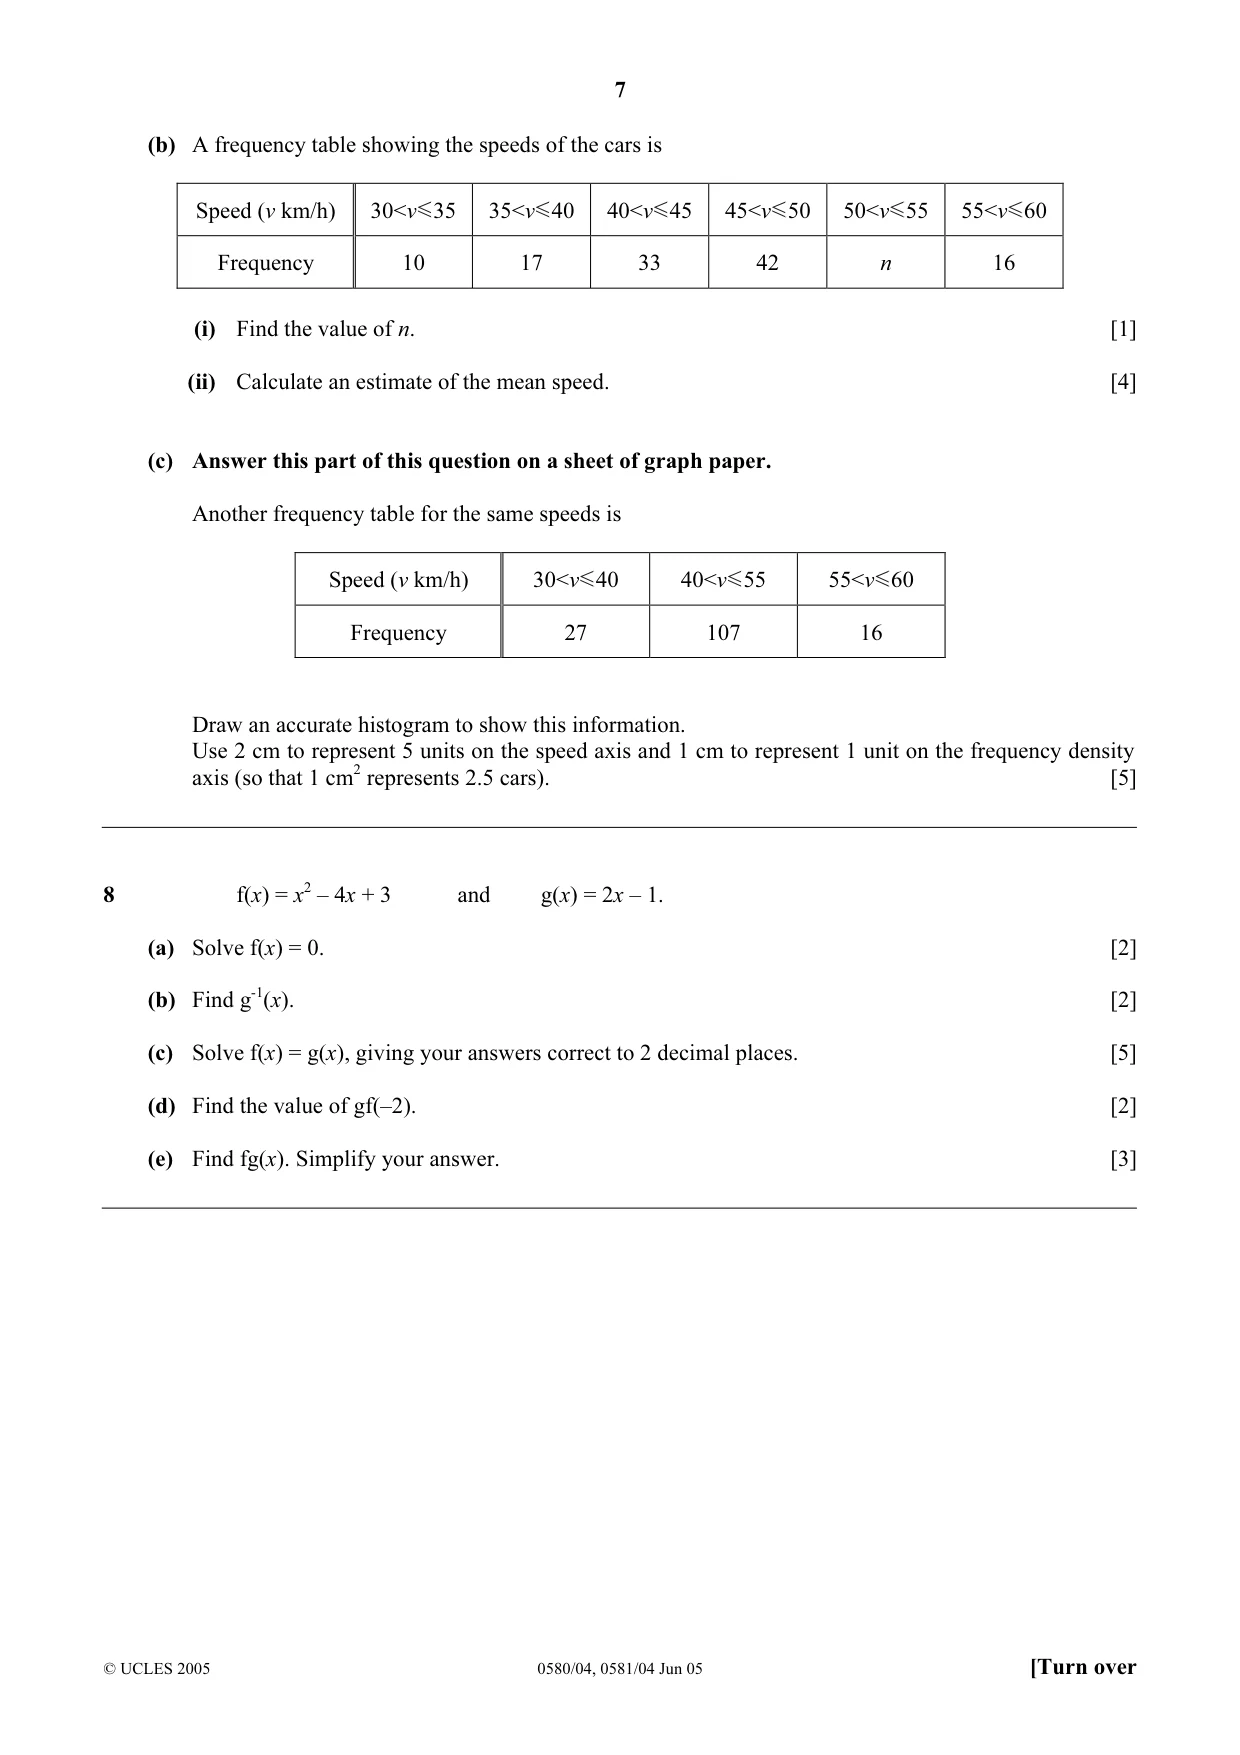
7 The speeds (v kilometres/hour) of 150 cars passing a 50 km/h speed limit sign are recorded. A cumulative frequency curve to show the results is drawn below. 150 140 130 120 110 100 90 80Cumulative frequency 70 60 50 40 30 20 10 0 30 35 40 45 50 55 60 Speed (v kilometres / hour) (a) Use the graph to find (i) the median speed, [1] (ii) the inter-quartile range of the speeds, [2] (iii) the number of cars travelling with speeds of more than 50 km/h. [2] (b) A frequency table showing the speeds of the cars is Speed (v km/h) 30<v 35 35<v 40 40<v 45 45<v 50 50<v 55 55<v 60 Frequency 10 17 33 42 n 16 (i) Find the value of n. [1] (ii) Calculate an estimate of the mean speed. [4] (c) Answer this part of this question on a sheet of graph paper. Another frequency table for the same speeds is Speed (v km/h) 30<v 40 40<v 55 55<v 60 Frequency 27 107 16 Draw an accurate histogram to show this information. Use 2 cm to represent 5 units on the speed axis and 1 cm to represent 1 unit on the frequency density axis (so that 1 cm2 represents 2.5 cars). [5]
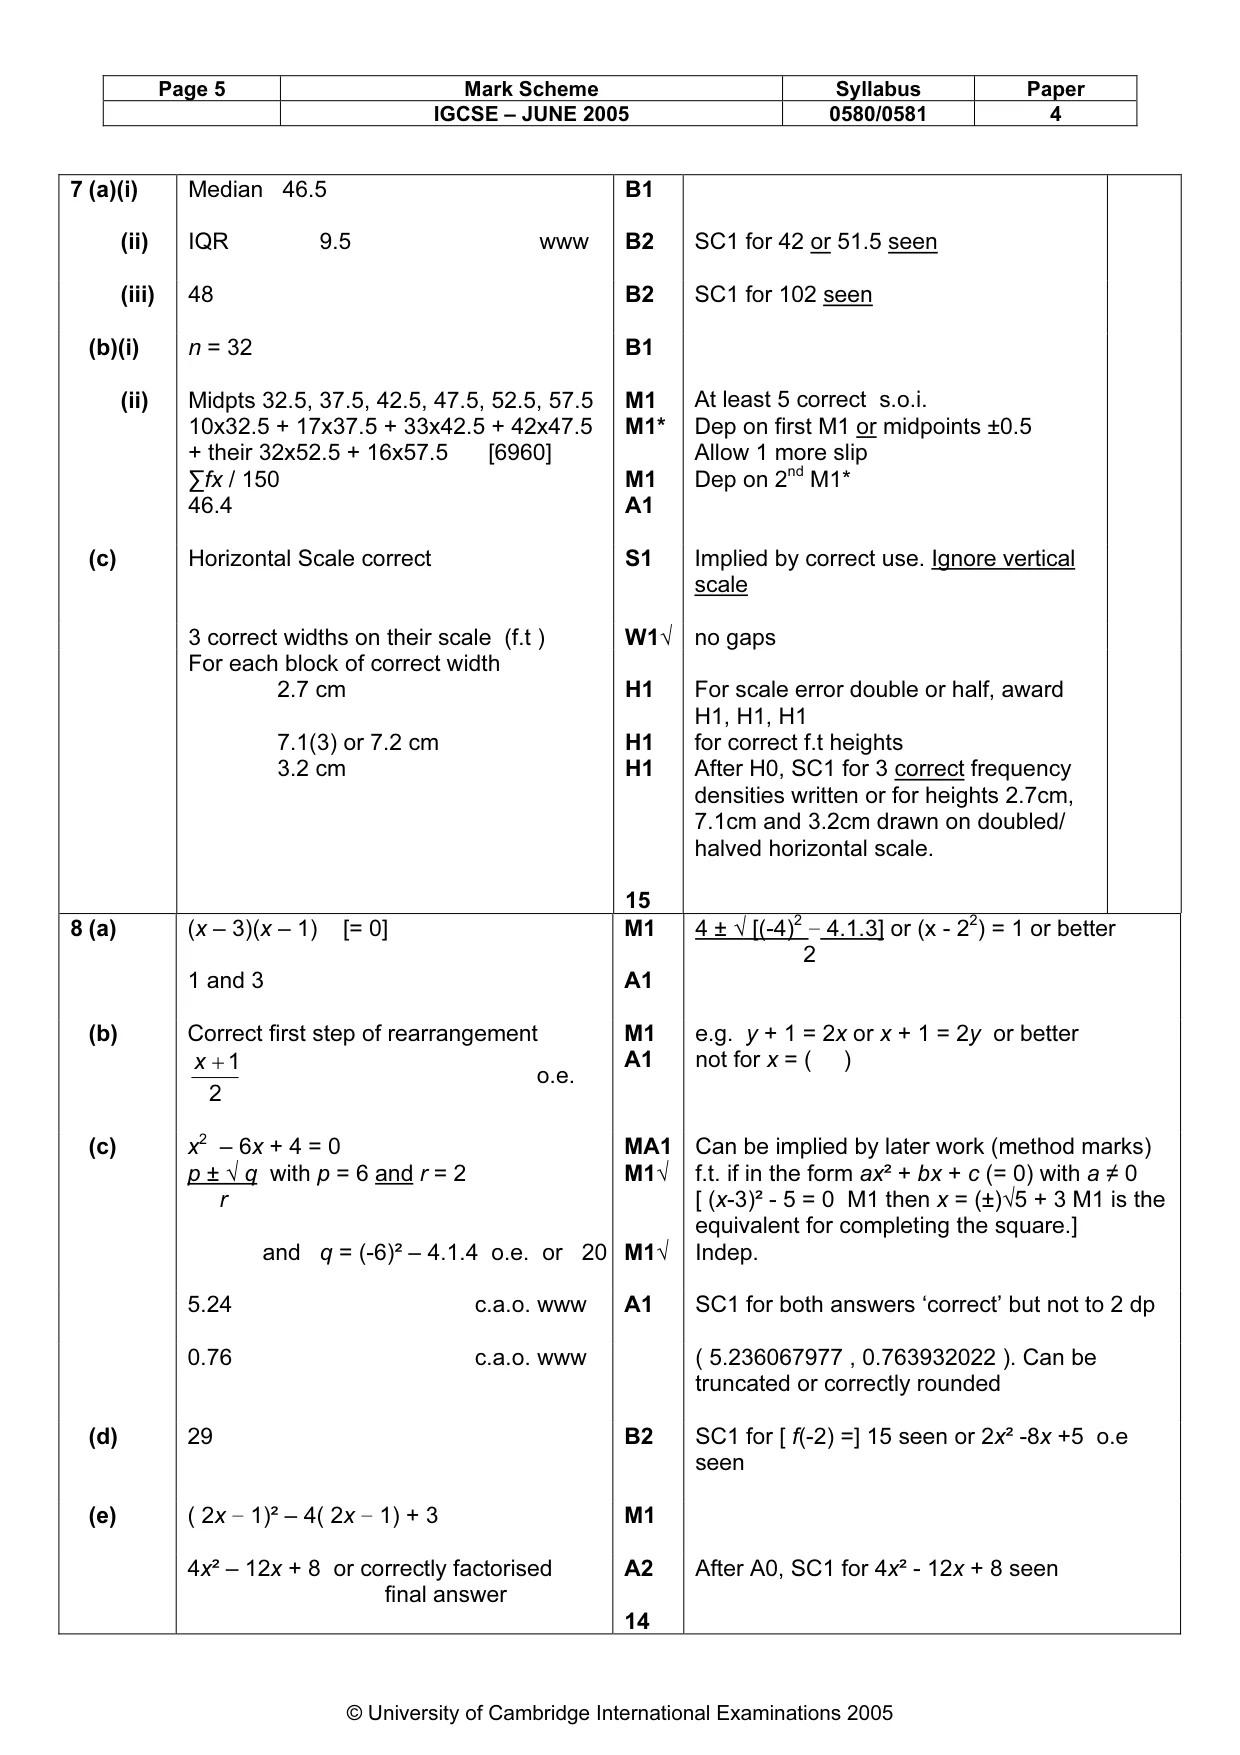
Mark scheme: 7 (a)(i) Median 46.5 B1 (ii) IQR 9.5 www B2 SC1 for 42 or 51.5 seen (iii) 48 B2 SC1 for 102 seen (b)(i) n = 32 B1 (ii) Midpts 32.5, 37.5, 42.5, 47.5, 52.5, 57.5 M1 At least 5 correct s.o.i. 10x32.5 + 17x37.5 + 33x42.5 + 42x47.5 M1* Dep on first M1 or midpoints ±0.5 + their 32x52.5 + 16x57.5 [6960] Allow 1 more slip ∑fx / 150 M1 Dep on 2nd M1* 46.4 A1 (c) Horizontal Scale correct S1 Implied by correct use. Ignore vertical scale 3 correct widths on their scale (f.t ) W1√ no gaps For each block of correct width 2.7 cm H1 For scale error double or half, award H1, H1, H1 7.1(3) or 7.2 cm H1 for correct f.t heights 3.2 cm H1 After H0, SC1 for 3 correct frequency densities written or for heights 2.7cm, 7.1cm and 3.2cm drawn on doubled/ halved horizontal scale. 15 2 2 √
Q8 · F(x) = x2 – 4x + 3 and g(x) = 2x – 1
8 f(x) = x2 – 4x + 3 and g(x) = 2x – 1. (a) Solve f(x) = 0. [2] (b) Find g-1(x). [2] (c) Solve f(x) = g(x), giving your answers correct to 2 decimal places. [5] (d) Find the value of gf(–2). [2] (e) Find fg(x). Simplify your answer. [3]
Mark scheme: 8 (a) (x – 3)(x – 1) [= 0] M1 4 ± √ [(-4)2 − 4.1.3] or (x - 22) = 1 or better 2 1 and 3 A1 (b) Correct first step of rearrangement M1 e.g. y + 1 = 2x or x + 1 = 2y or better x + 1 A1 not for x = ( ) o.e. 2 (c) x2 – 6x + 4 = 0 MA1 Can be implied by later work (method marks) p ± √ q with p = 6 and r = 2 M1√ f.t. if in the form ax² + bx + c (= 0) with a ≠ 0 r [ (x-3)² - 5 = 0 M1 then x = (±)√5 + 3 M1 is the equivalent for completing the square.] and q = (-6)² – 4.1.4 o.e. or 20 M1√ Indep. 5.24 c.a.o. www A1 SC1 for both answers ‘correct’ but not to 2 dp 0.76 c.a.o. www ( 5.236067977 , 0.763932022 ). Can be truncated or correctly rounded (d) 29 B2 SC1 for [ f(-2) =] 15 seen or 2x² -8x +5 o.e seen (e) ( 2x − 1)² – 4( 2x − 1) + 3 M1 4x² – 12x + 8 or correctly factorised A2 After A0, SC1 for 4x² - 12x + 8 seen final answer 14 IGCSE – JUNE 2005 0580/0581 4
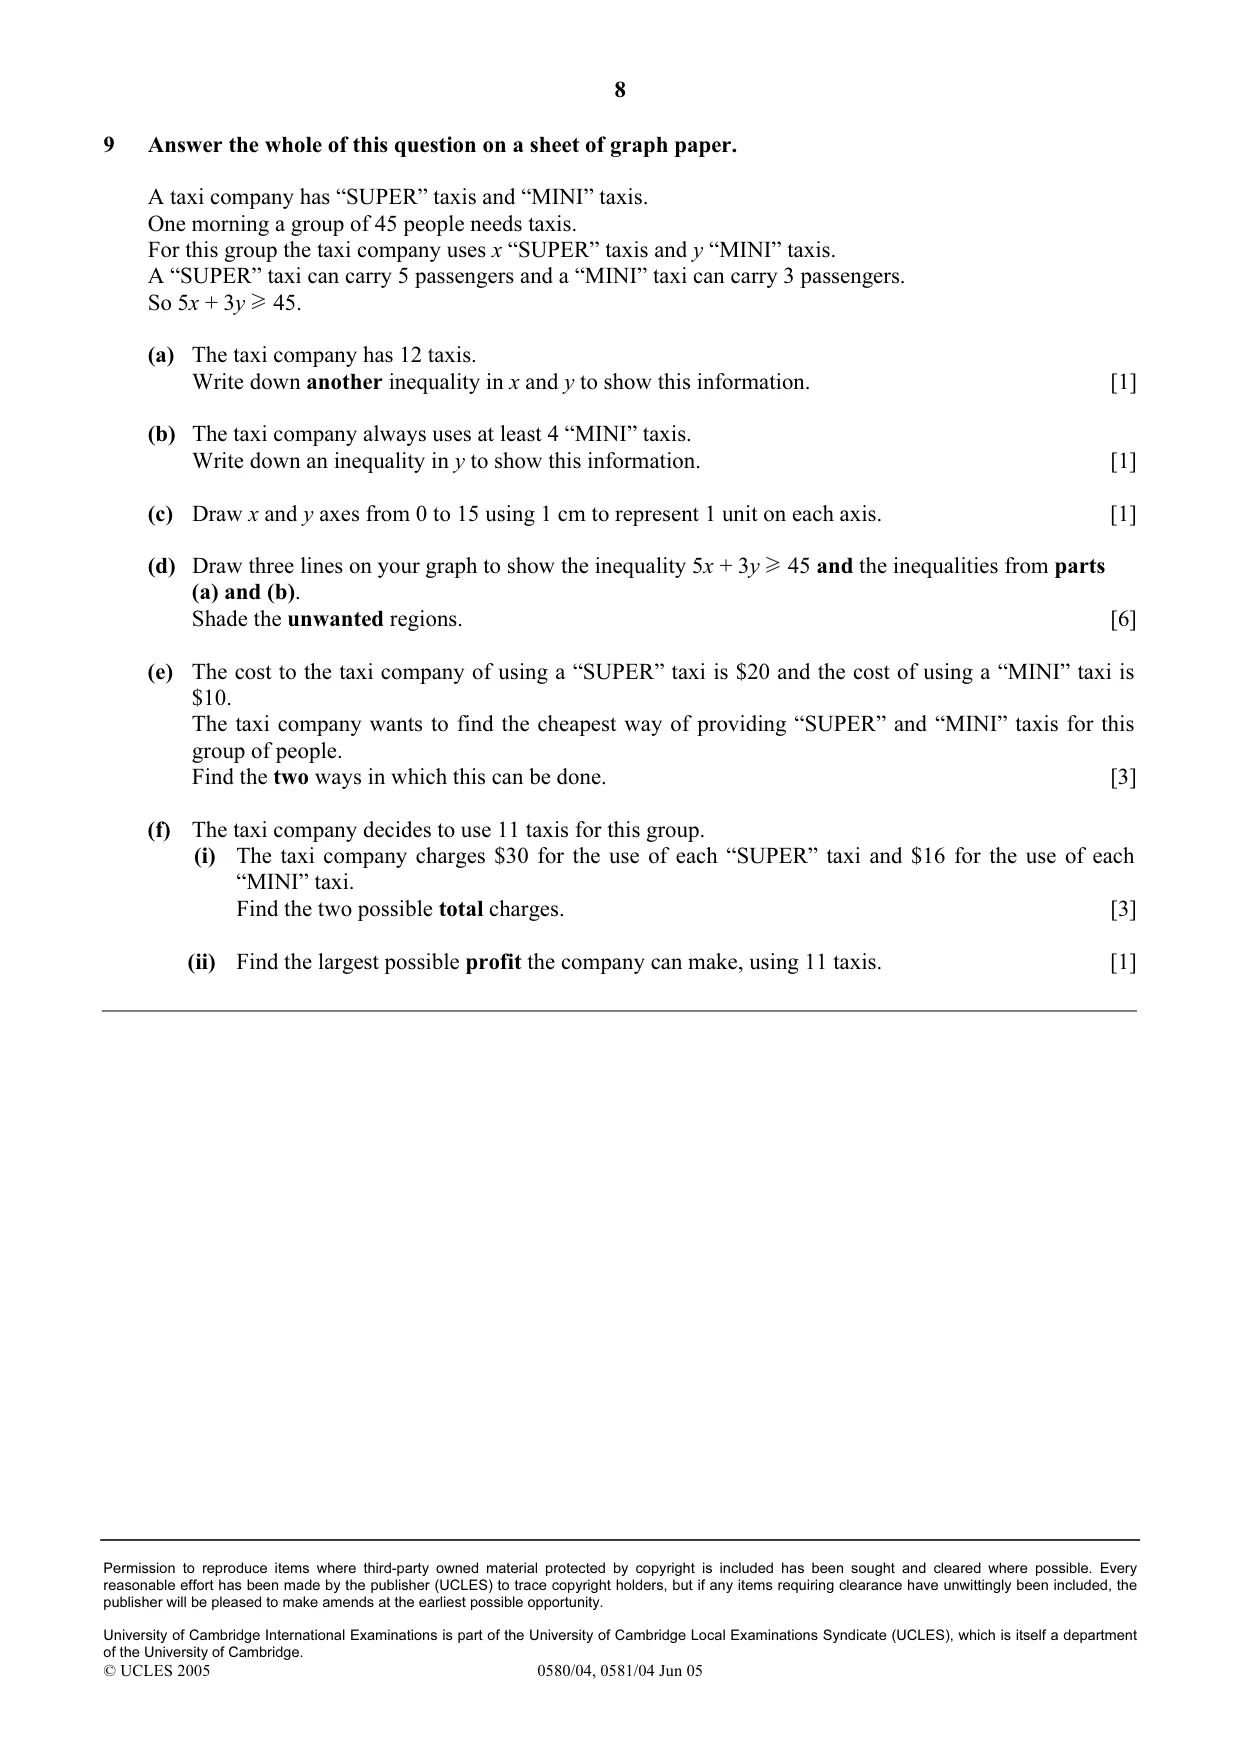
Q9 · Answer the whole of this question on a sheet of graph paper
9 Answer the whole of this question on a sheet of graph paper. A taxi company has “SUPER” taxis and “MINI” taxis. One morning a group of 45 people needs taxis. For this group the taxi company uses x “SUPER” taxis and y “MINI” taxis. A “SUPER” taxi can carry 5 passengers and a “MINI” taxi can carry 3 passengers. So 5x + 3y 45. (a) The taxi company has 12 taxis. Write down another inequality in x and y to show this information. [1] (b) The taxi company always uses at least 4 “MINI” taxis. Write down an inequality in y to show this information. [1] (c) Draw x and y axes from 0 to 15 using 1 cm to represent 1 unit on each axis. [1] (d) Draw three lines on your graph to show the inequality 5x + 3y 45 and the inequalities from parts (a) and (b). Shade the unwanted regions. [6] (e) The cost to the taxi company of using a “SUPER” taxi is $20 and the cost of using a “MINI” taxi is $10. The taxi company wants to find the cheapest way of providing “SUPER” and “MINI” taxis for this group of people. Find the two ways in which this can be done. [3] (f) The taxi company decides to use 11 taxis for this group. (i) The taxi company charges $30 for the use of each “SUPER” taxi and $16 for the use of each “MINI” taxi. Find the two possible total charges. [3] (ii) Find the largest possible profit the company can make, using 11 taxis. [1]
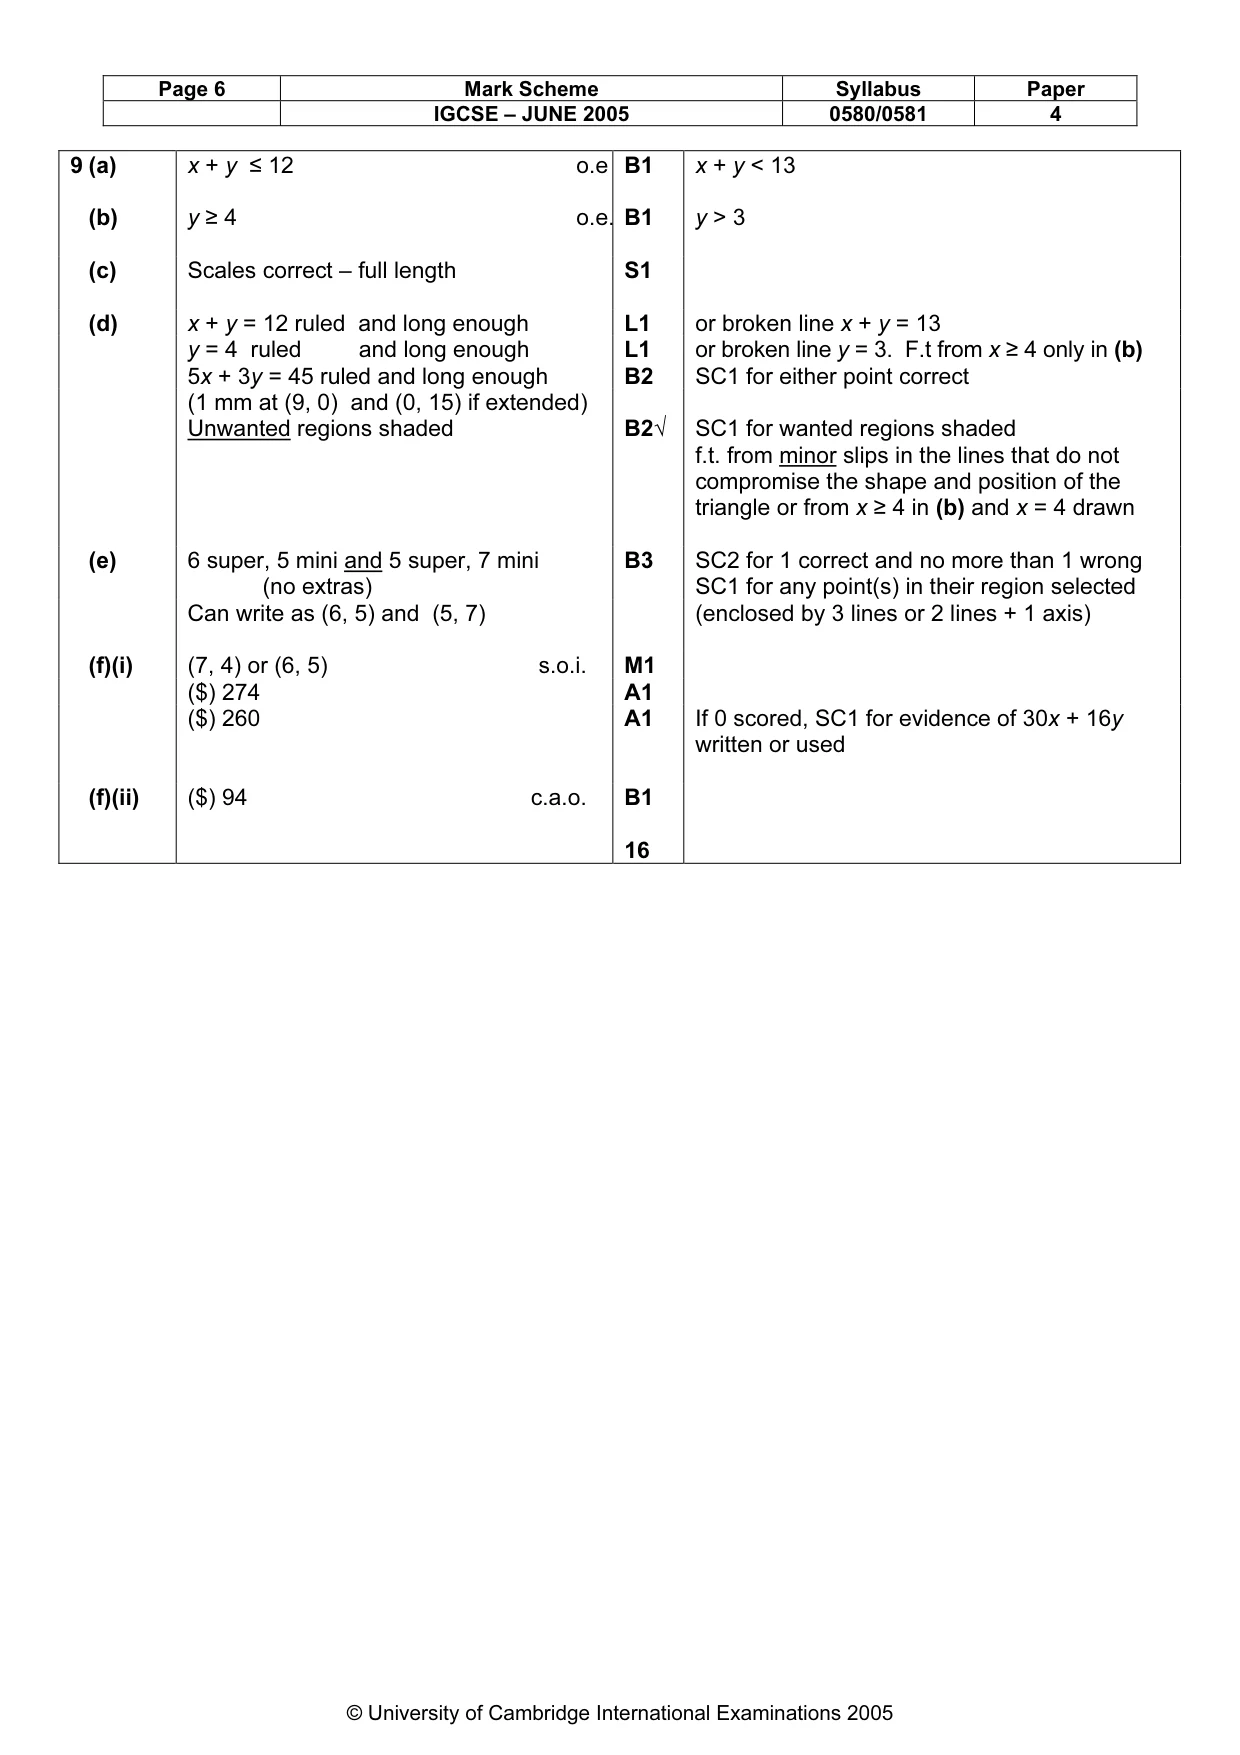
Mark scheme: 9 (a) x + y ≤ 12 o.e B1 x + y < 13 (b) y ≥ 4 o.e. B1 y > 3 (c) Scales correct – full length S1 (d) x + y = 12 ruled and long enough L1 or broken line x + y = 13 y = 4 ruled and long enough L1 or broken line y = 3. F.t from x ≥ 4 only in (b) 5x + 3y = 45 ruled and long enough B2 SC1 for either point correct (1 mm at (9, 0) and (0, 15) if extended) Unwanted regions shaded B2√ SC1 for wanted regions shaded f.t. from minor slips in the lines that do not compromise the shape and position of the triangle or from x ≥ 4 in (b) and x = 4 drawn (e) 6 super, 5 mini and 5 super, 7 mini B3 SC2 for 1 correct and no more than 1 wrong (no extras) SC1 for any point(s) in their region selected Can write as (6, 5) and (5, 7) (enclosed by 3 lines or 2 lines + 1 axis) (f)(i) (7, 4) or (6, 5) s.o.i. M1 ($) 274 A1 ($) 260 A1 If 0 scored, SC1 for evidence of 30x + 16y written or used (f)(ii) ($) 94 c.a.o. B1 16
What was in this paper
The subtopics covered by these 4 questions, and how many questions each got. Open one in a new tab to see every Cambridge question on it.