Cambridge IGCSE Mathematics 0580 — 2015 Feb/March Paper 4 · Variant 2
0580/42/F/M/15 · 7 questions · 130 marks · ≈146 min
The question paper and its mark scheme, free to read here and free to download. This is Cambridge’s own paper, exactly as it was sat.
Question paper16 pages
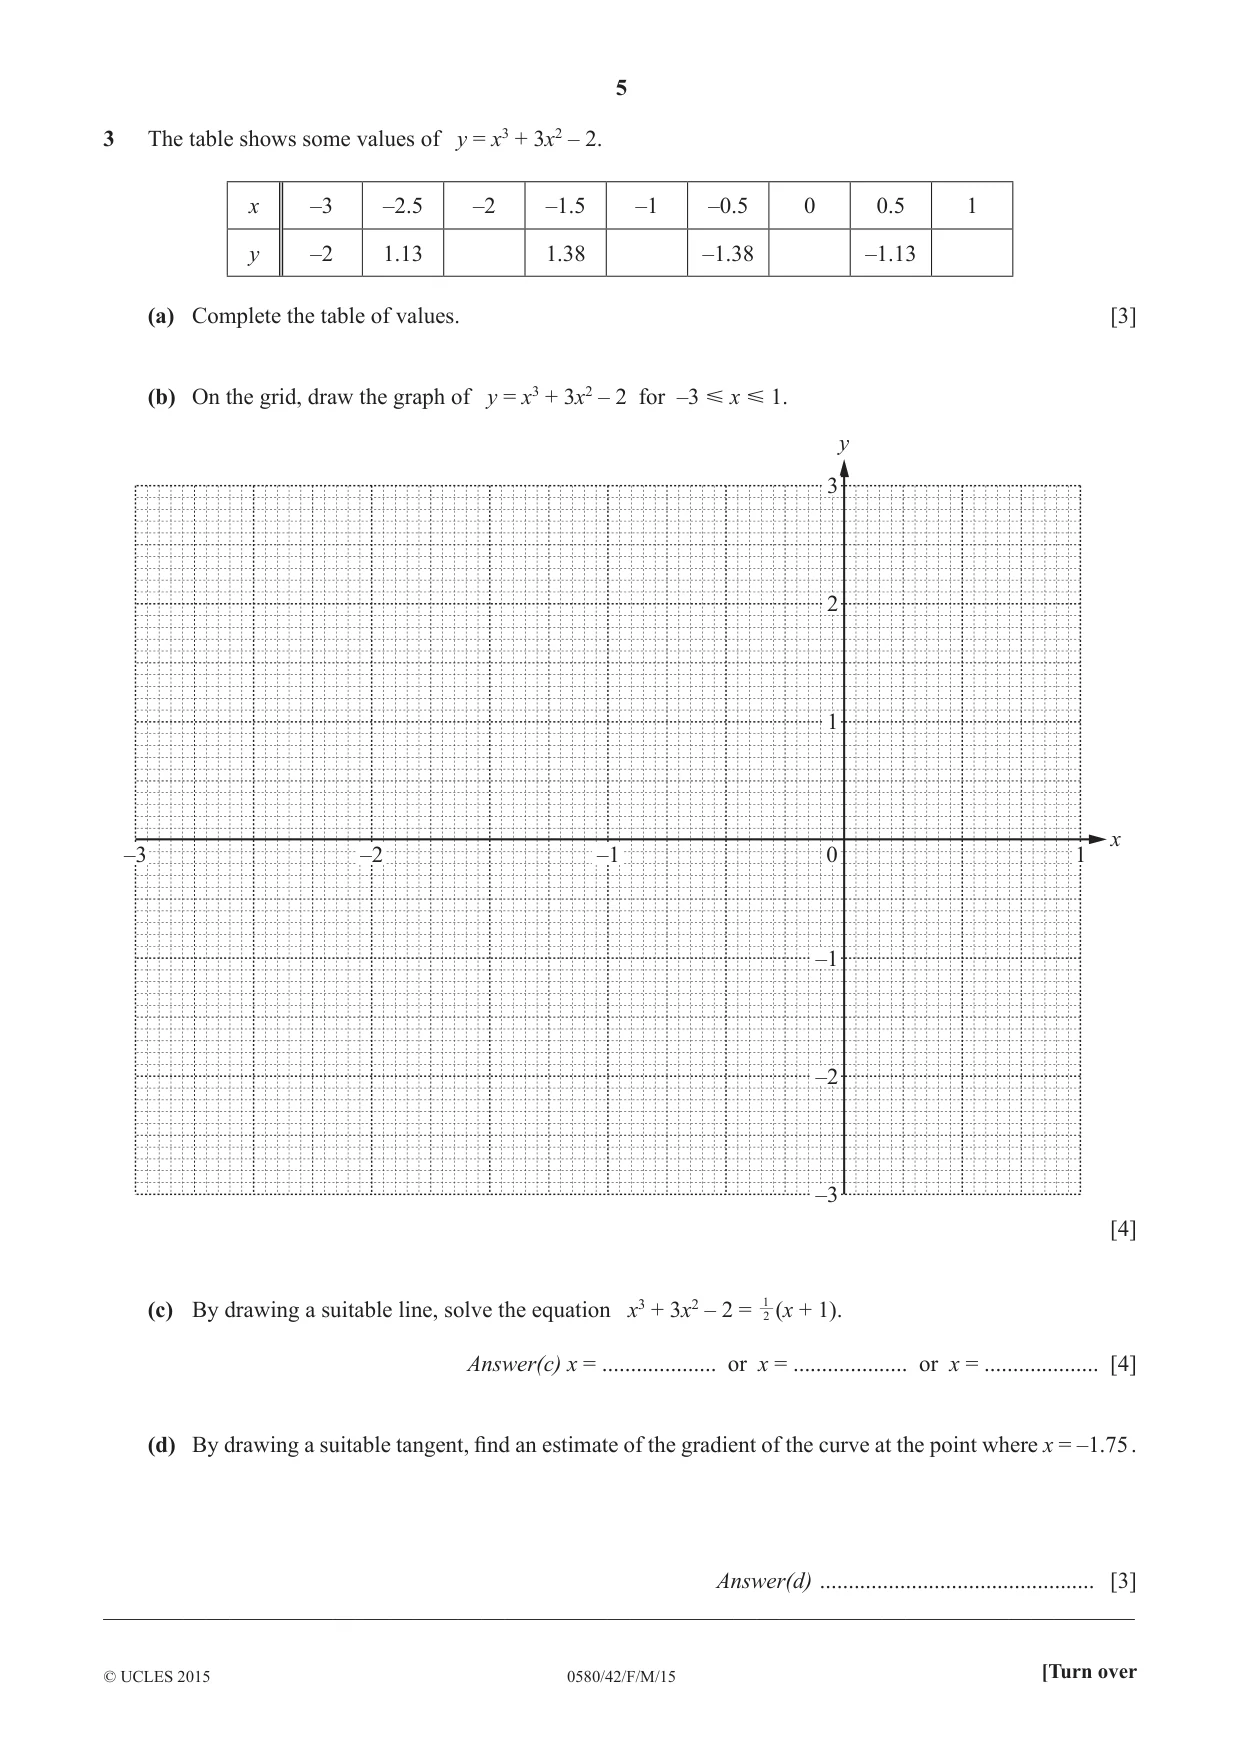
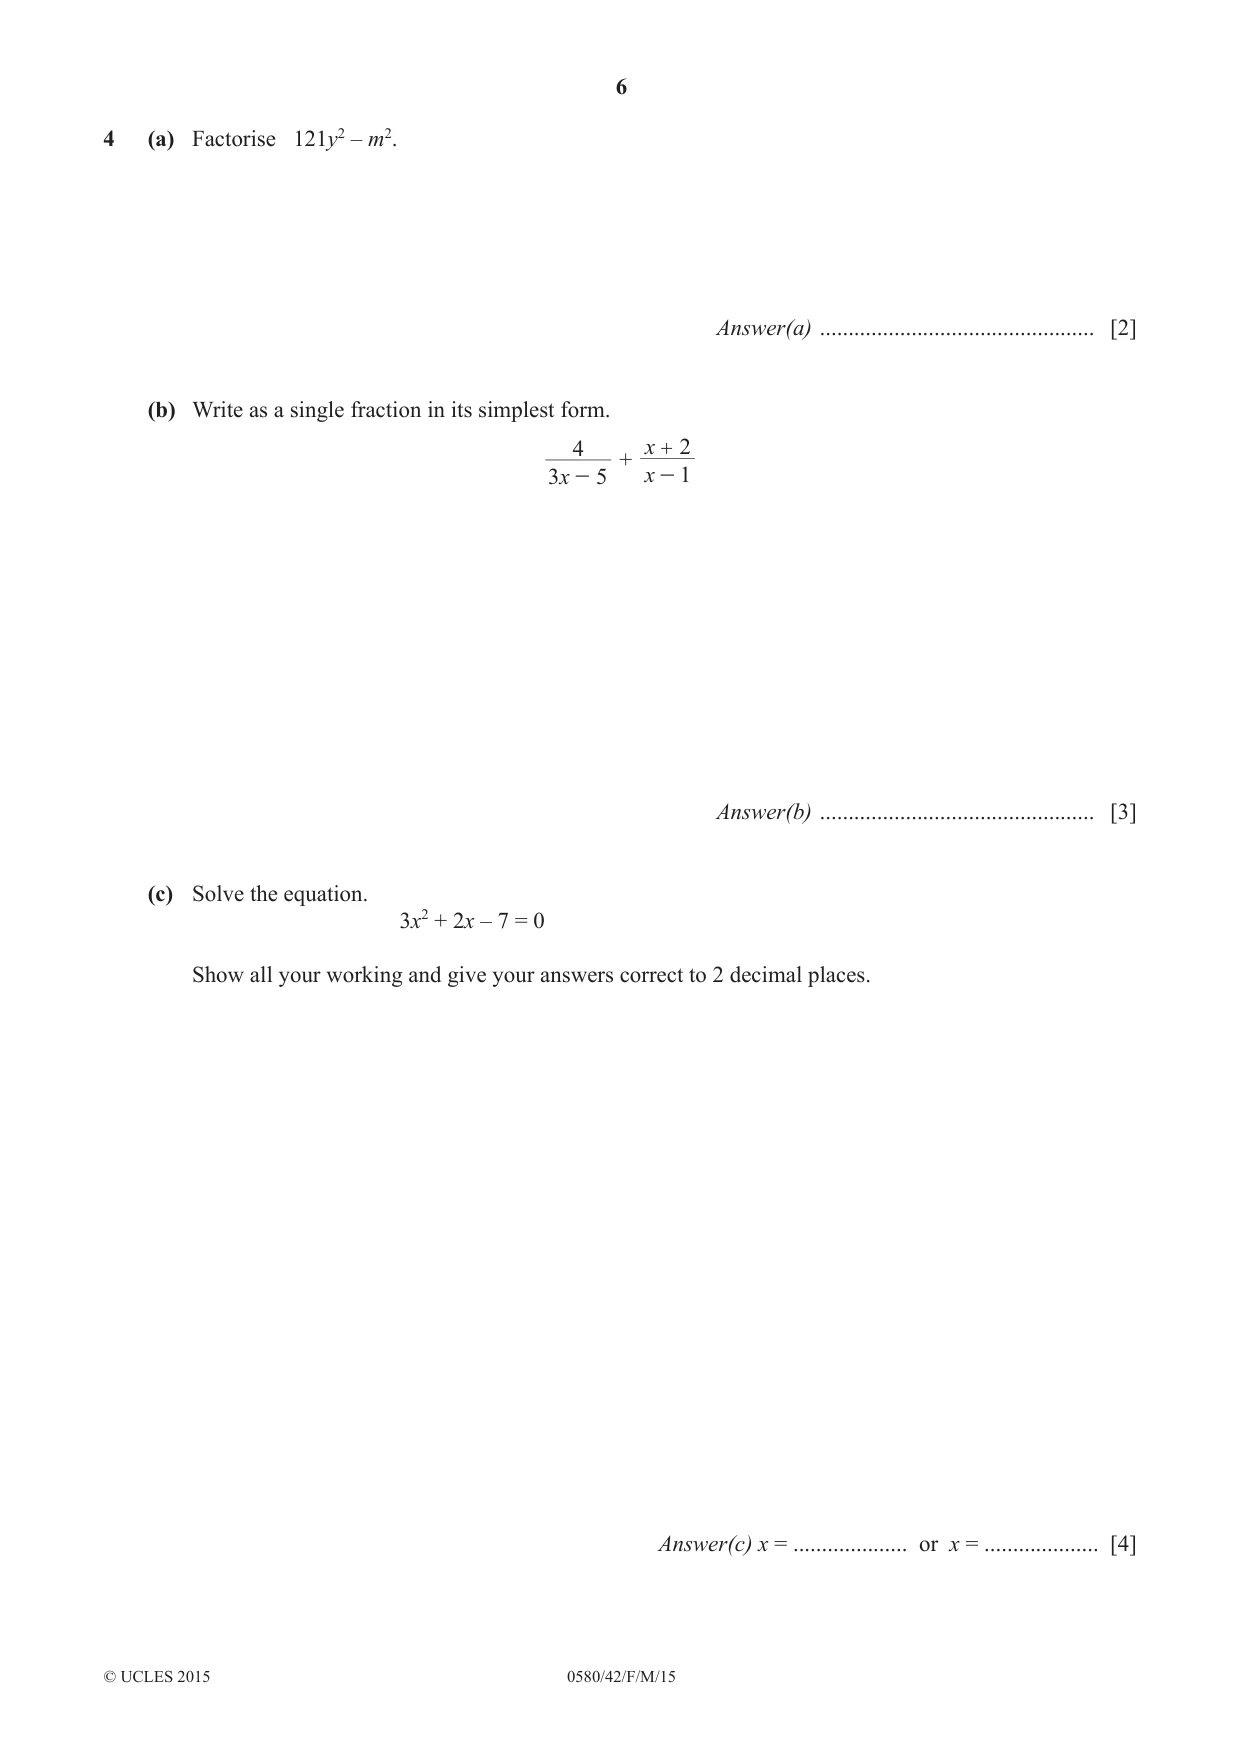
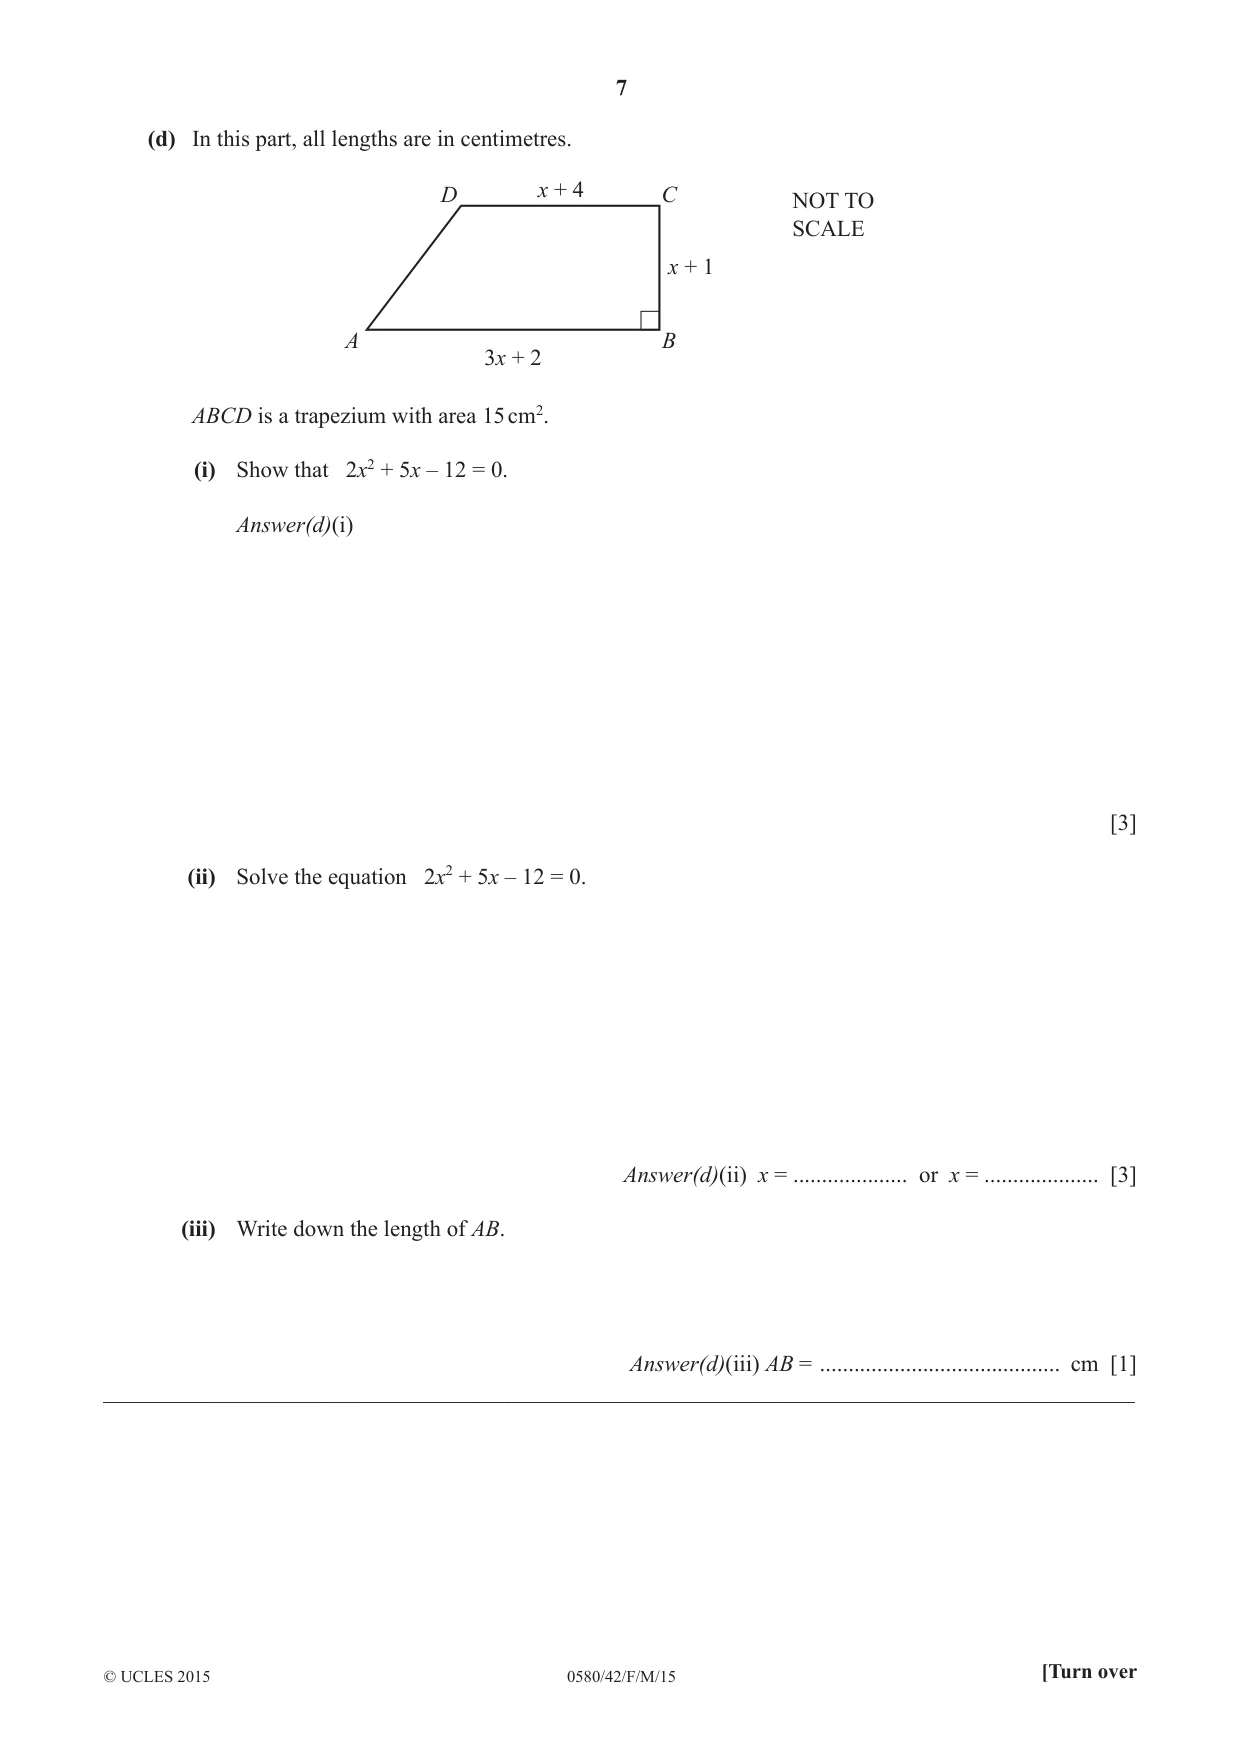
Mark scheme7 pages
Answers below. Sit the paper first if you are practising.
Questions as text
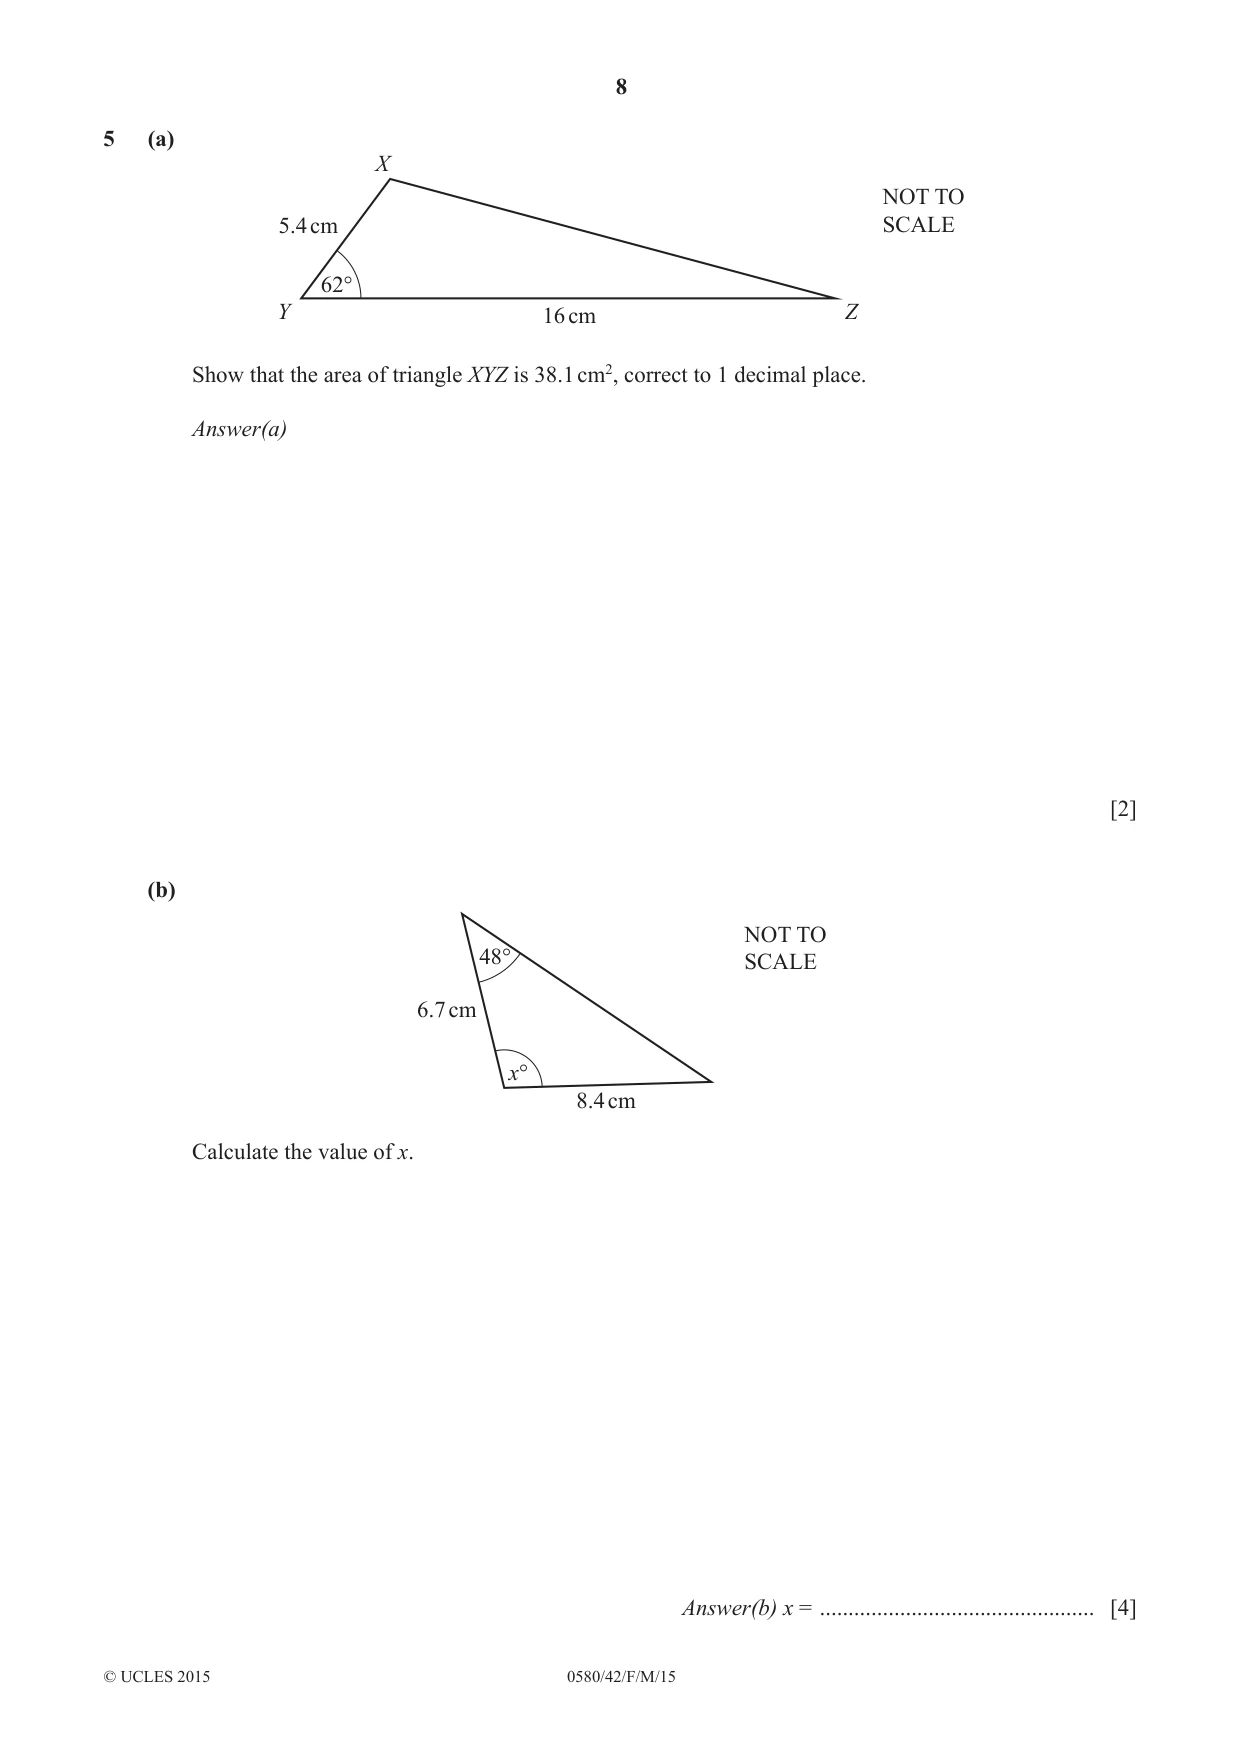
Q5 · X NOT TO 5.4 cm SCALE 62° Y 16 cm Z Show that the area of triangle XYZ is 38.1 cm2…
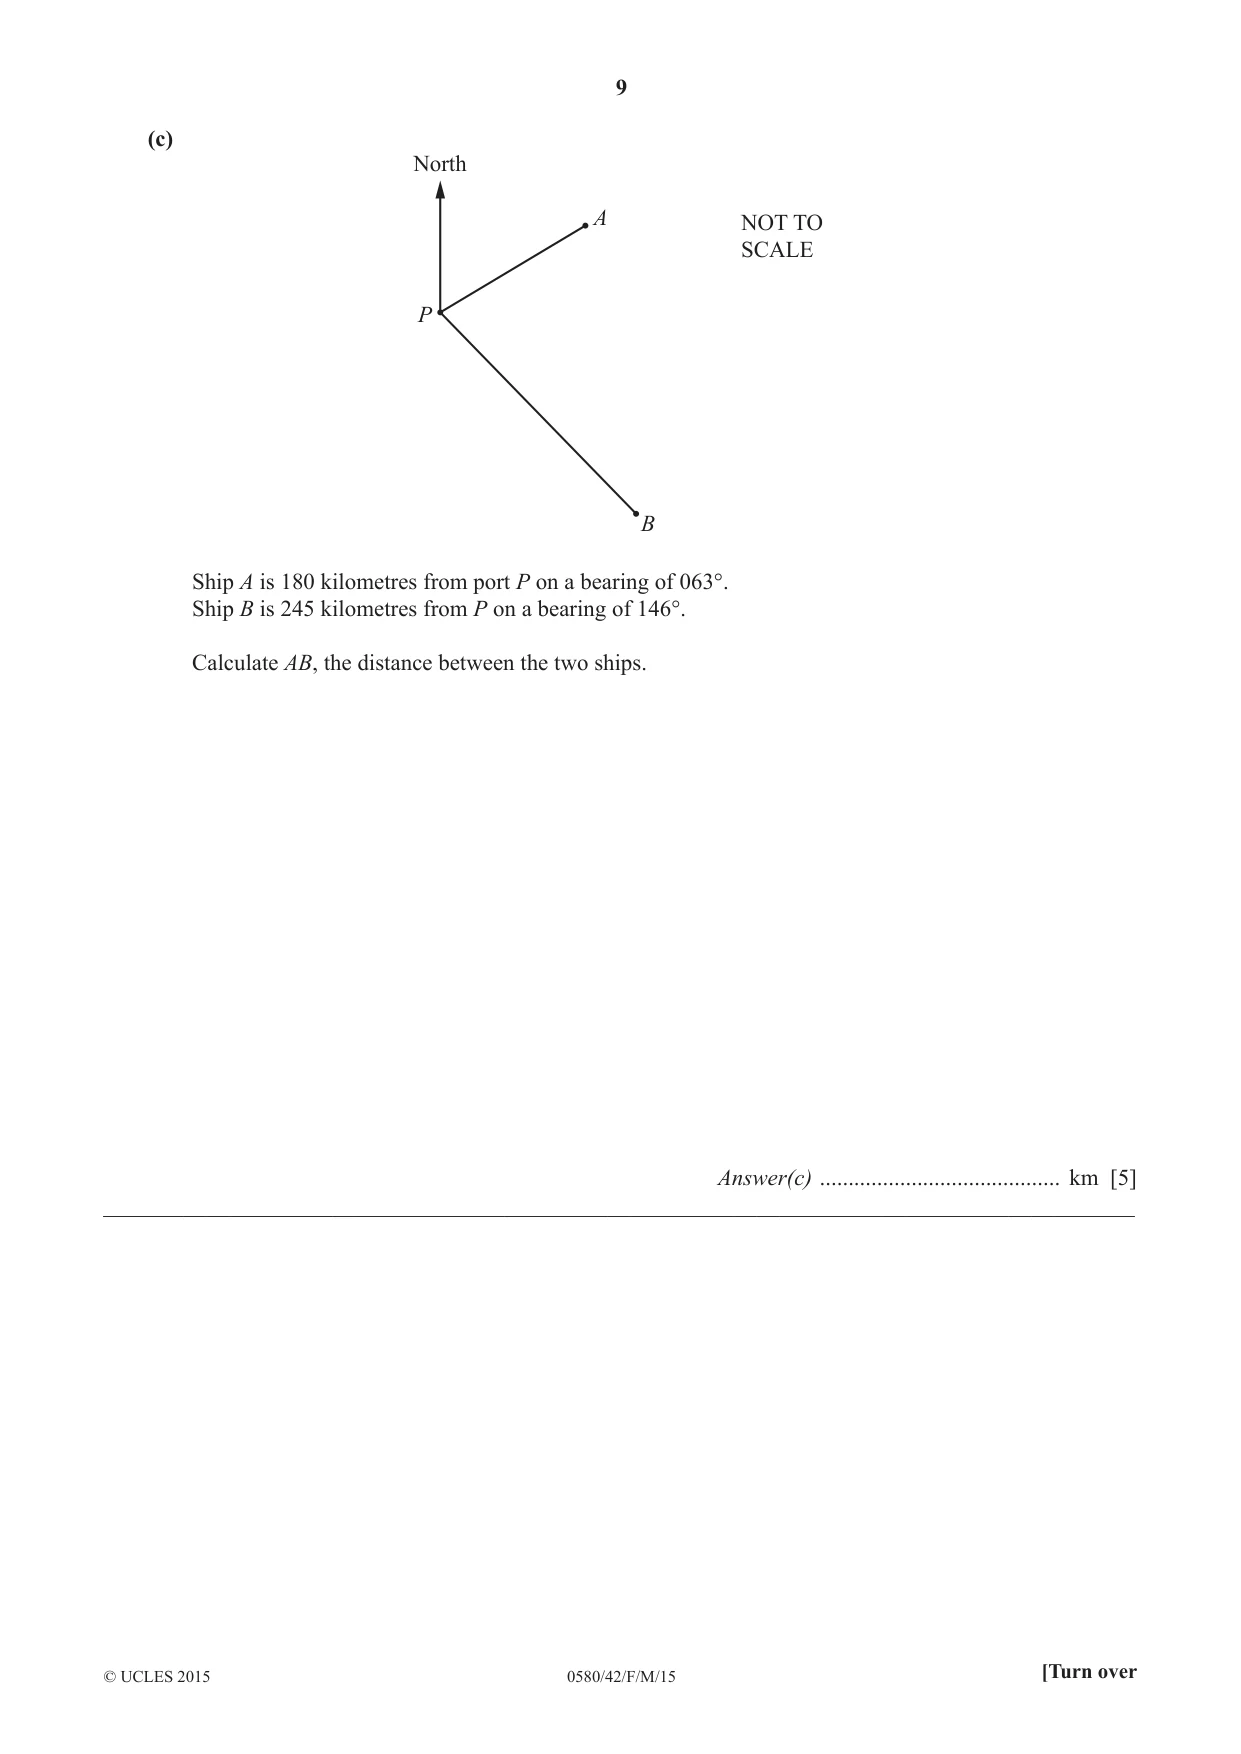
5 (a) X NOT TO 5.4 cm SCALE 62° Y 16 cm Z Show that the area of triangle XYZ is 38.1 cm2, correct to 1 decimal place. Answer(a) [2] (b) NOT TO 48° SCALE 6.7 cm x° 8.4 cm Calculate the value of x. Answer(b) x = ................................................ [4] (c) North A NOT TO SCALE P B Ship A is 180 kilometres from port P on a bearing of 063°. Ship B is 245 kilometres from P on a bearing of 146°. Calculate AB, the distance between the two ships. Answer(c) .......................................... km [5] __________________________________________________________________________________________
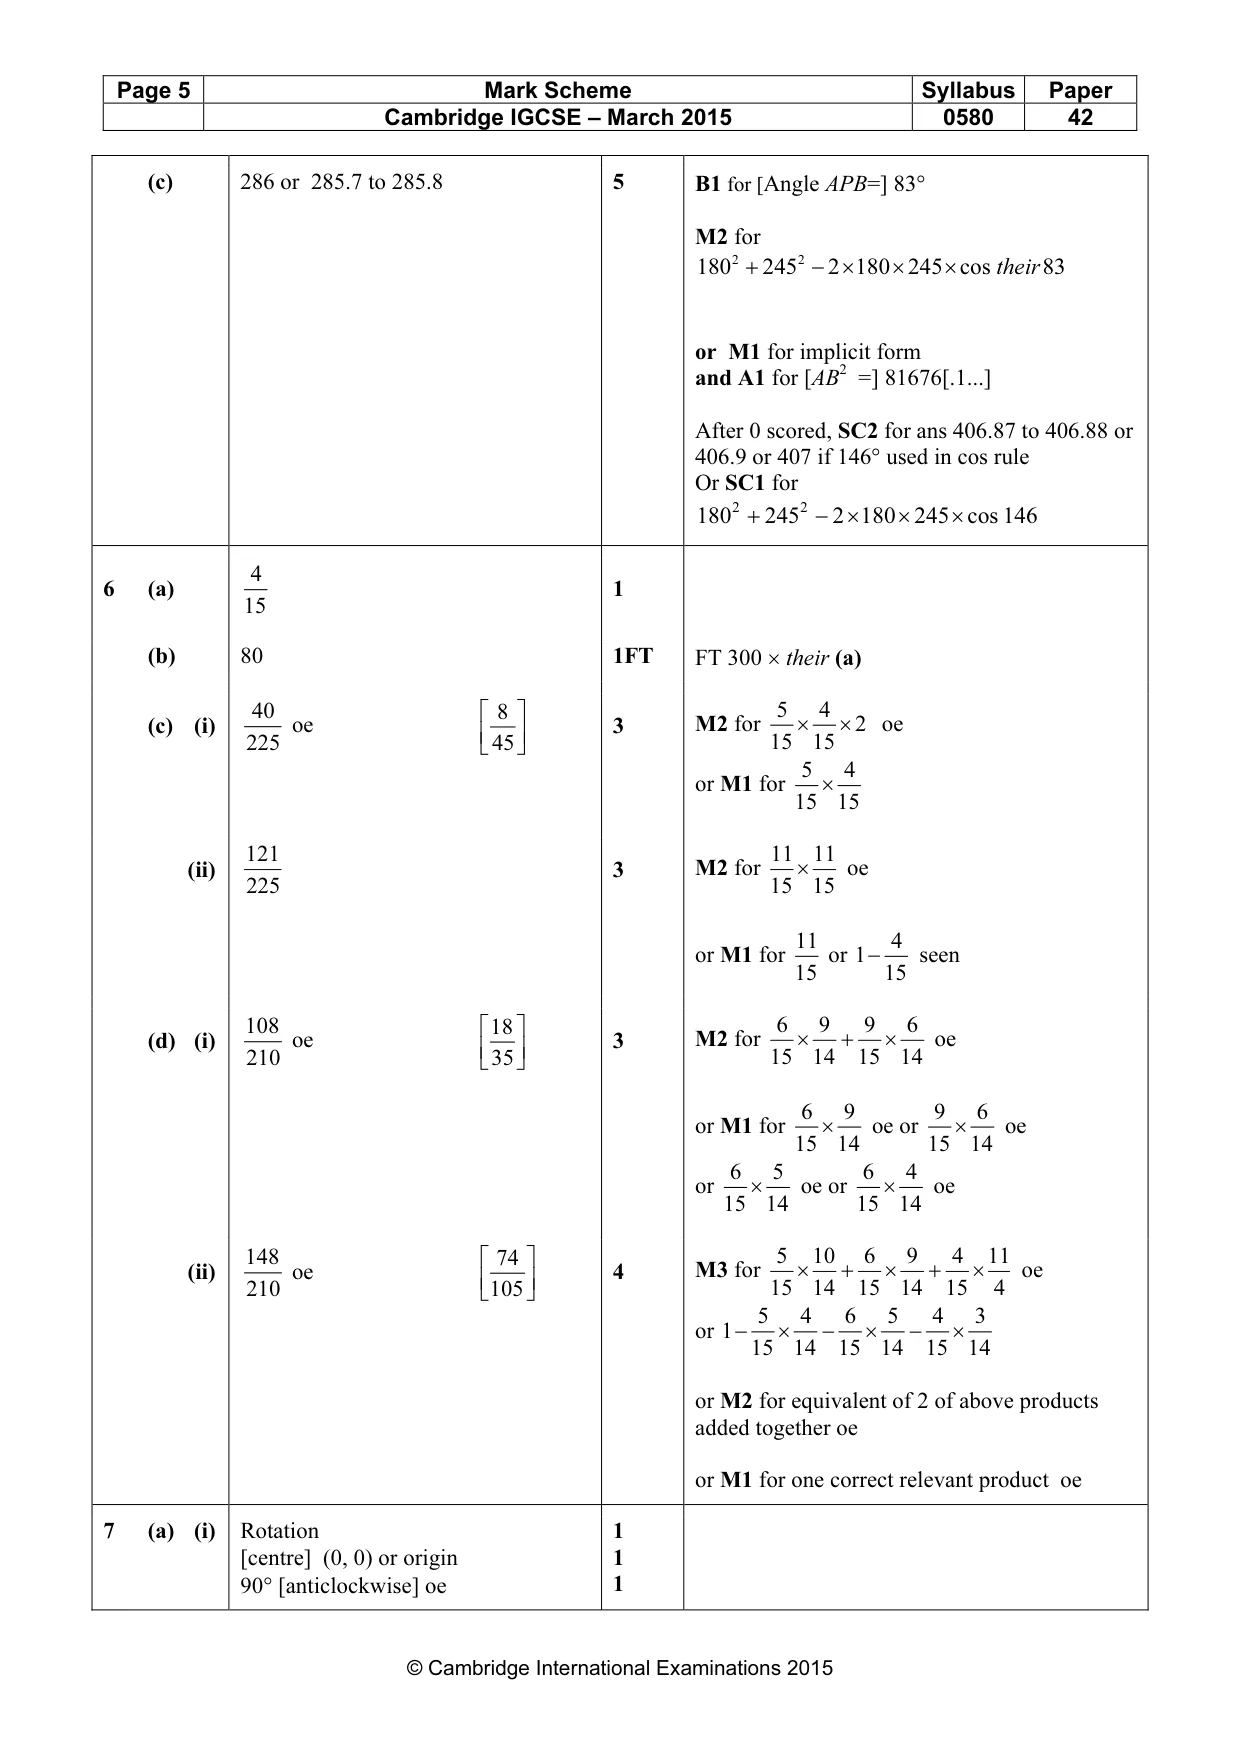
Mark scheme: 5 (a) 1 × 16 × 4.5 × sin 62 oe M1 2 A1 38.14... 7.6 × sin 48 (b) 95.6 or 95.64 to 95.65 4 M2 for 4.8 or M1 for implicit form and M1dep for 180 − 48 − their 36.4 (c) 286 or 285.7 to 285.8 5 B1 for [Angle APB=] 83° M2 for 180 2 + 245 2 − 2 × 180 × 245 × cos their 83 or M1 for implicit form and A1 for [AB2 =] 81676[.1...] After 0 scored, SC2 for ans 406.87 to 406.88 or 406.9 or 407 if 146° used in cos rule Or SC1 for 180 2 + 245 2 − 2 × 180 × 245 × cos 146 4
Q6 · In this question write any probability as a fraction
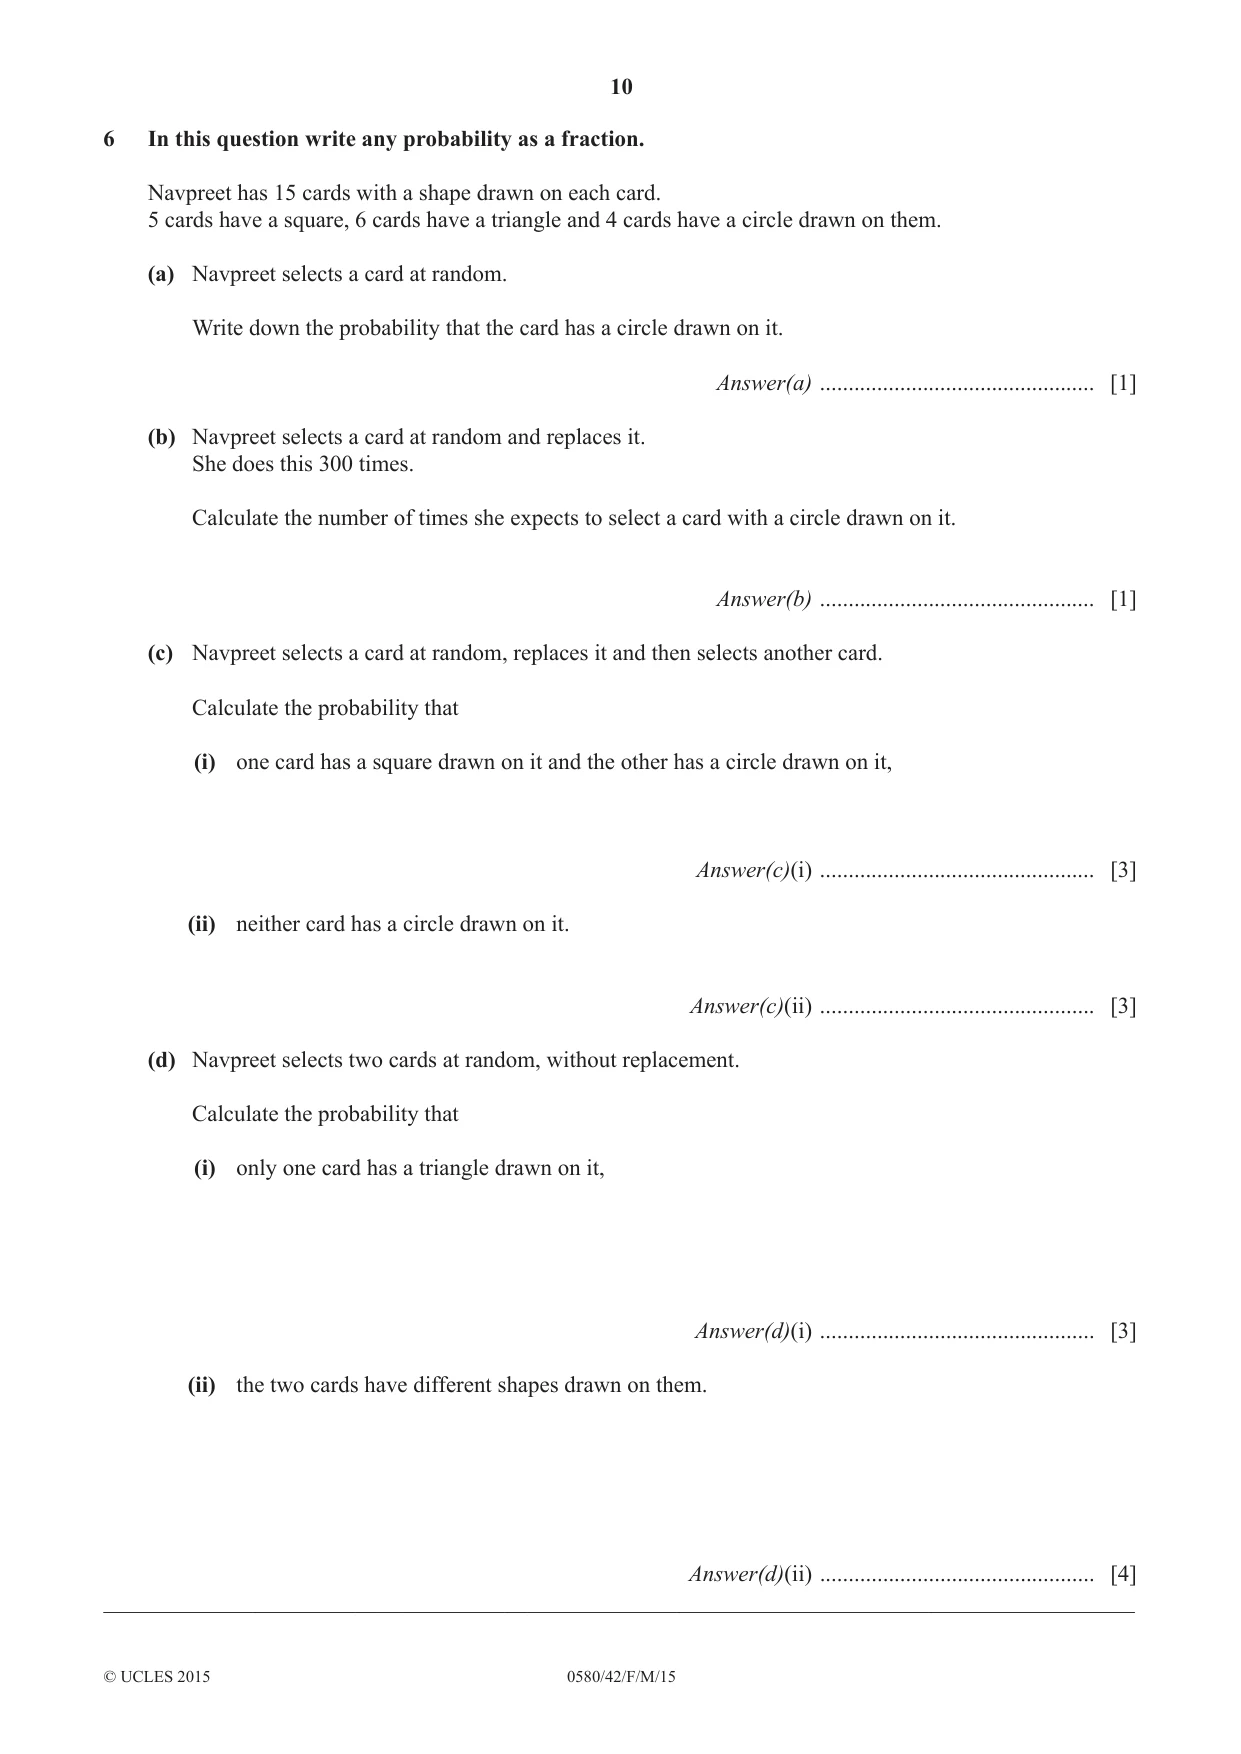
6 In this question write any probability as a fraction. Navpreet has 15 cards with a shape drawn on each card. 5 cards have a square, 6 cards have a triangle and 4 cards have a circle drawn on them. (a) Navpreet selects a card at random. Write down the probability that the card has a circle drawn on it. Answer(a) ................................................ [1] (b) Navpreet selects a card at random and replaces it. She does this 300 times. Calculate the number of times she expects to select a card with a circle drawn on it. Answer(b) ................................................ [1] (c) Navpreet selects a card at random, replaces it and then selects another card. Calculate the probability that (i) one card has a square drawn on it and the other has a circle drawn on it, Answer(c)(i) ................................................ [3] (ii) neither card has a circle drawn on it. Answer(c)(ii) ................................................ [3] (d) Navpreet selects two cards at random, without replacement. Calculate the probability that (i) only one card has a triangle drawn on it, Answer(d)(i) ................................................ [3] (ii) the two cards have different shapes drawn on them. Answer(d)(ii) ................................................ [4] __________________________________________________________________________________________
Mark scheme: 46 (a) 1 15 (b) 80 1FT FT 300 × their (a) 40 8 5 4 (c) (i) oe 3 M2 for × × 2 oe 225 45 15 15 5 4 or M1 for × 15 15 121 11 (ii) 3 M2 for 11× oe 225 15 15 11 4 or M1 for or 1− seen 15 15 108 18 6 9 9 6 (d) (i) oe 3 M2 for × + × oe 210 35 15 14 15 14 6 9 9 6 or M1 for × oe or × oe 15 14 15 14 6 5 6 4 or × oe or × oe 15 14 15 14 148 74 5 10 6 9 4 11 (ii) oe 4 M3 for × + × + × oe 210 105 15 14 15 14 15 4 5 4 6 5 4 3 or 1 − × − × − × 15 14 15 14 15 14 or M2 for equivalent of 2 of above products added together oe or M1 for one correct relevant product oe
Q7 · Y 7 6 5 A 4 3 2 1 x –7 –6 –5 –4 –3 –2 –1 0 1 2 3 4 5 6 7 8 –1 –2 –3 –4 B –5 –6 C –7 –8…
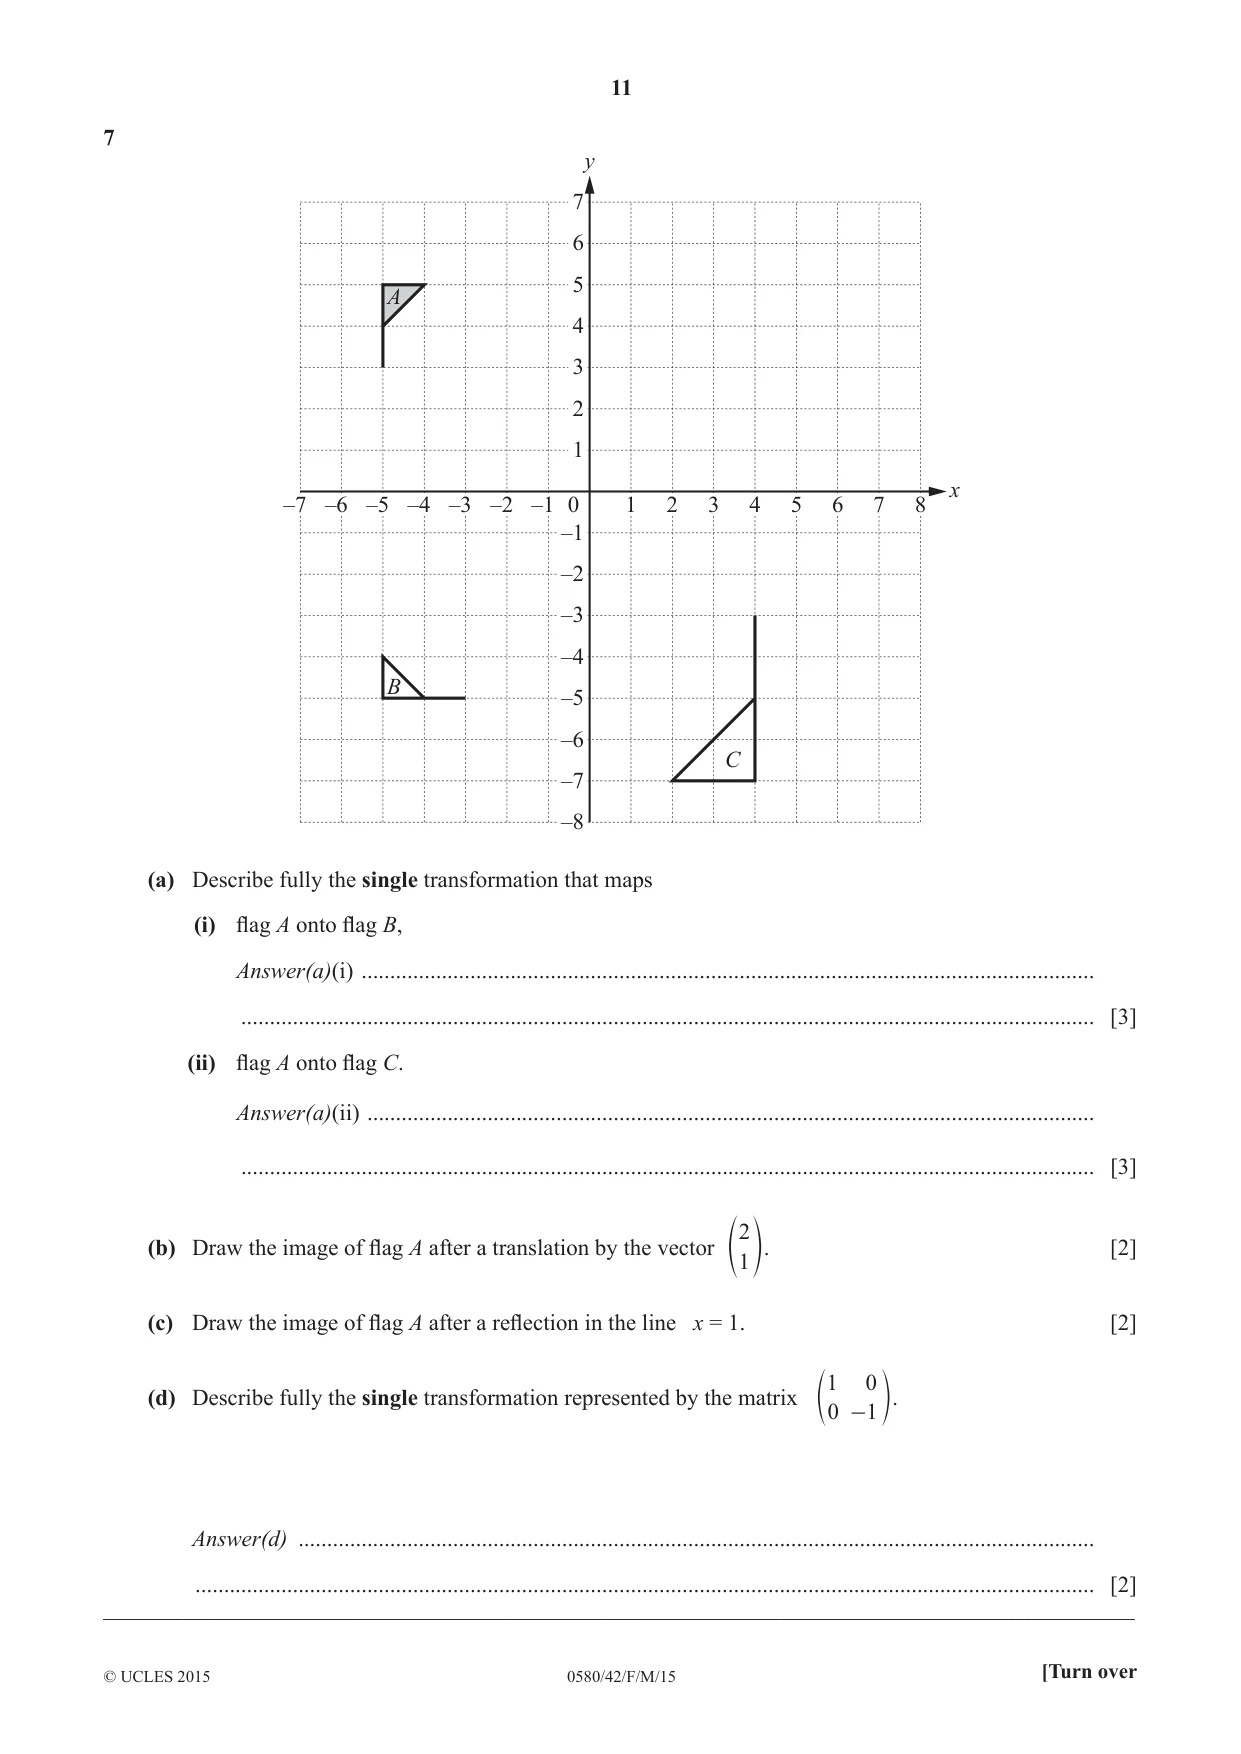
7 y 7 6 5 A 4 3 2 1 x –7 –6 –5 –4 –3 –2 –1 0 1 2 3 4 5 6 7 8 –1 –2 –3 –4 B –5 –6 C –7 –8 (a) Describe fully the single transformation that maps (i) flag A onto flag B, Answer(a)(i) ................................................................................................................................ ..................................................................................................................................................... [3] (ii) flag A onto flag C. Answer(a)(ii) ............................................................................................................................... ..................................................................................................................................................... [3] 2 (b) Draw the image of flag A after a translation by the vector [2] e 1 o. (c) Draw the image of flag A after a reflection in the line x = 1. [2] 1 0 (d) Describe fully the single transformation represented by the matrix e 0 - 1 o. Answer(d) ........................................................................................................................................... ............................................................................................................................................................. [2] __________________________________________________________________________________________
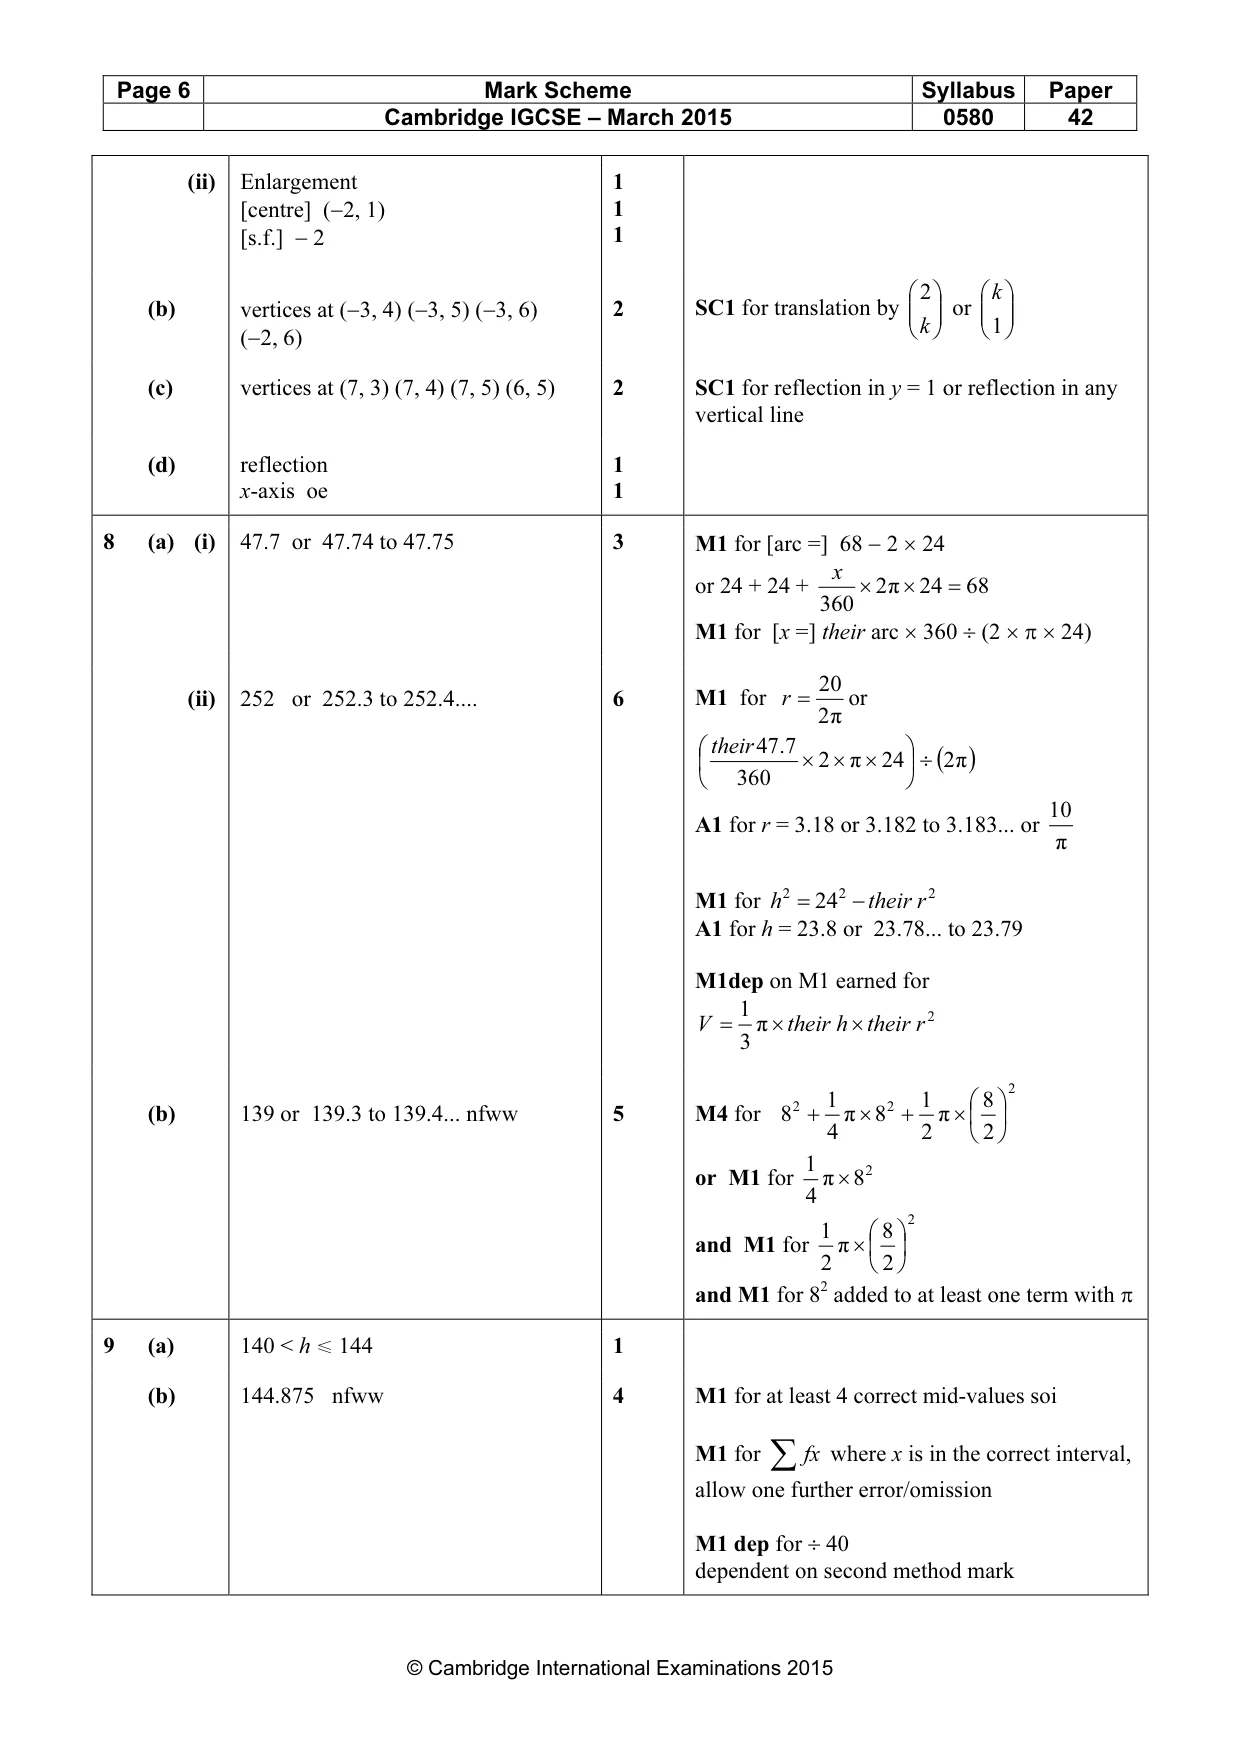
Mark scheme: 7 (a) (i) Rotation 1 [centre] (0, 0) or origin 1 90° [anticlockwise] oe 1 (ii) Enlargement 1 1 [centre] (−2, 1) 1 [s.f.] − 2 2 k (b) vertices at (−3, 4) (−3, 5) (−3, 6) 2 SC1 for translation by or k 1 (−2, 6) (c) vertices at (7, 3) (7, 4) (7, 5) (6, 5) 2 SC1 for reflection in y = 1 or reflection in any vertical line (d) reflection 1 x-axis oe 1
Q8 · The diagram shows a sector of a circle A with centre O and radius 24 cm
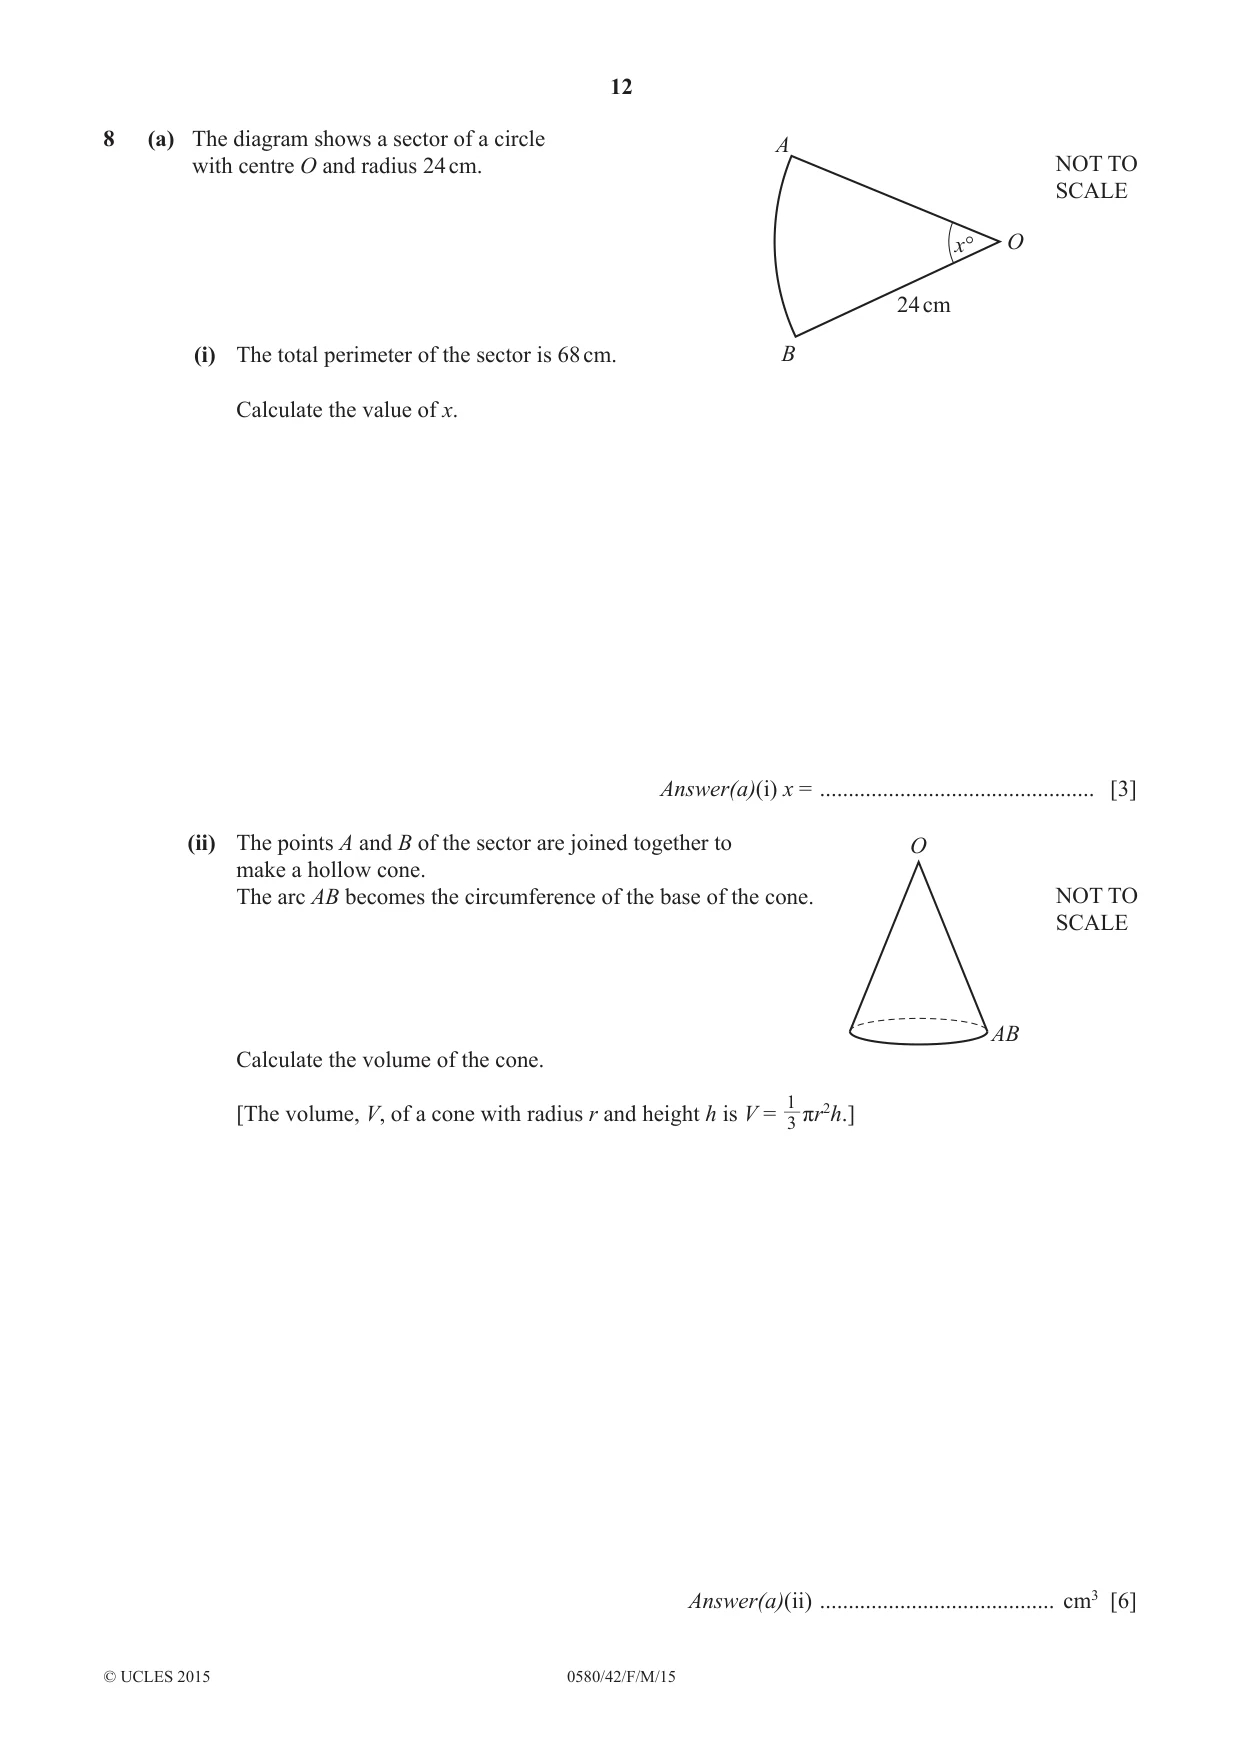
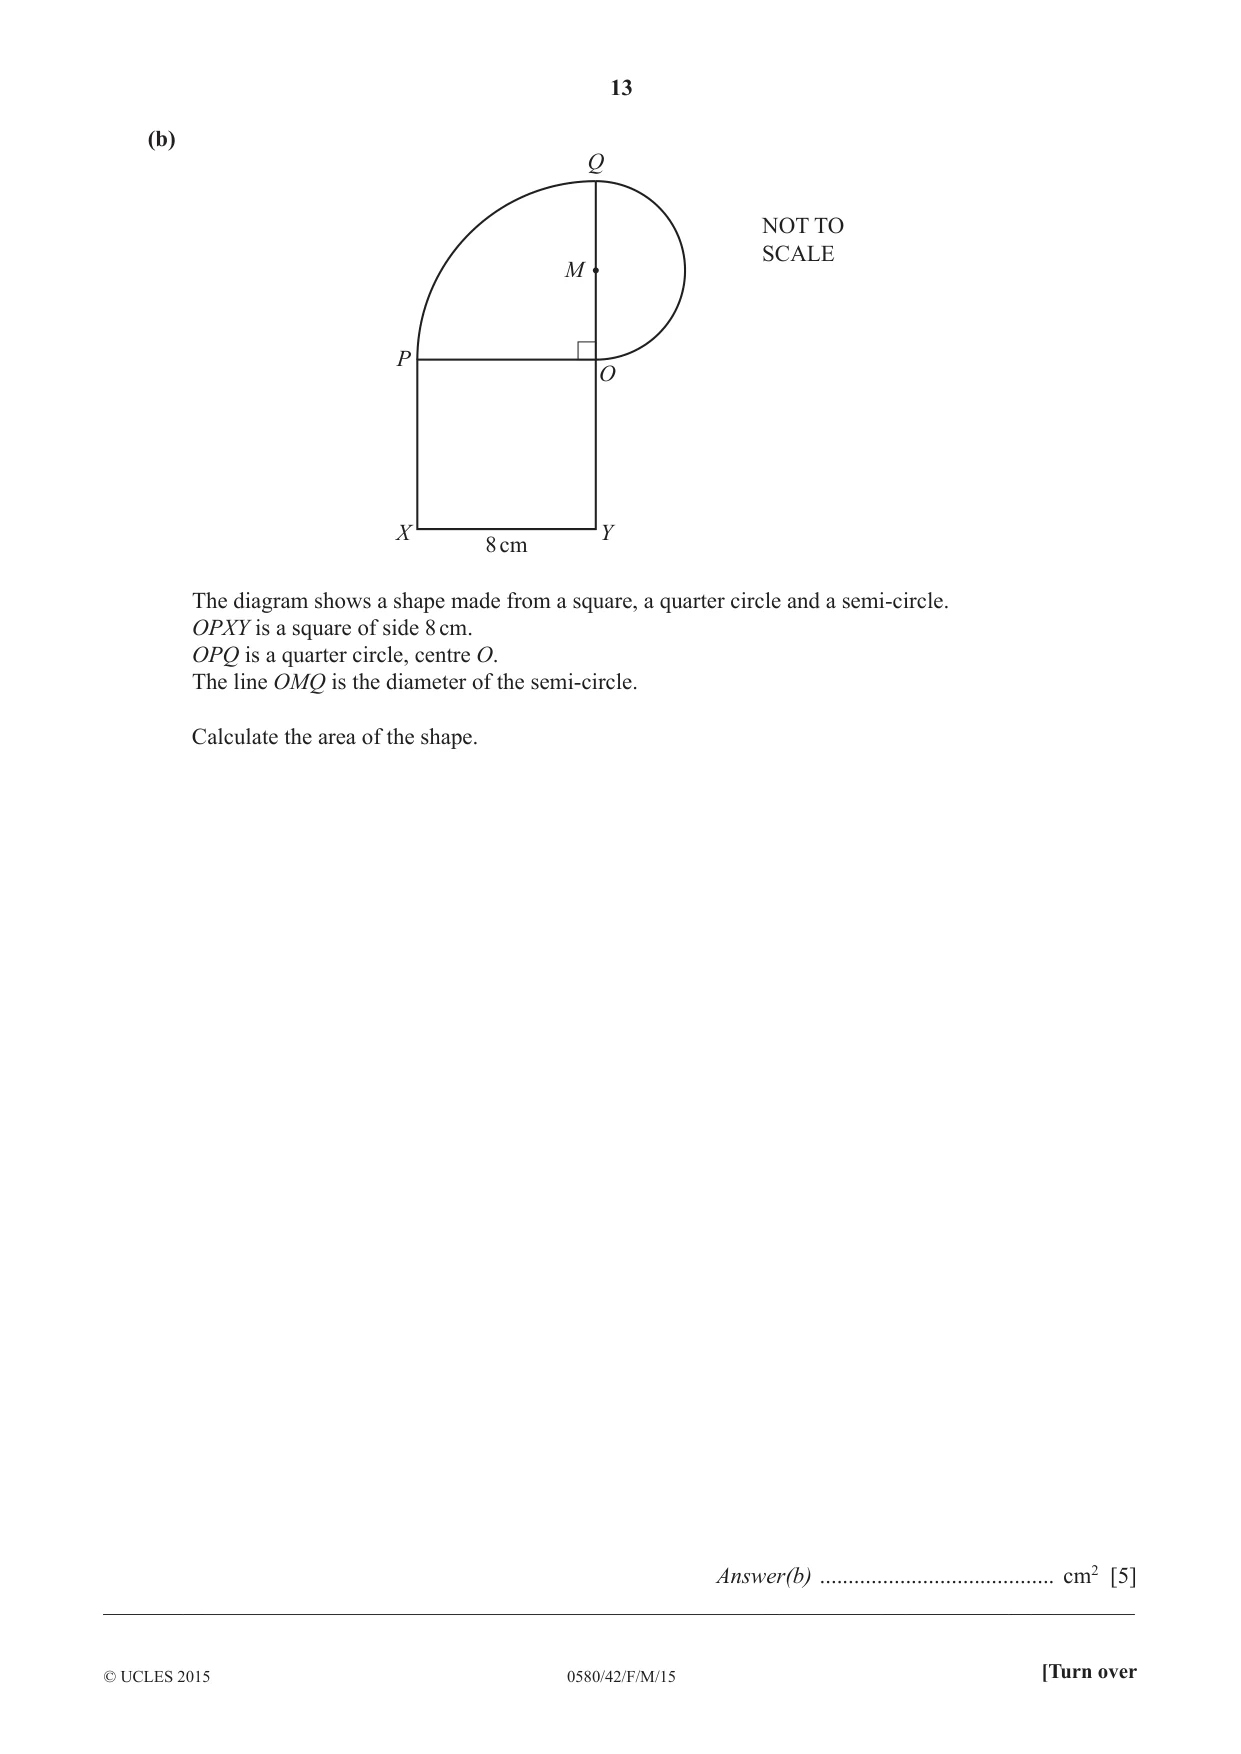
8 (a) The diagram shows a sector of a circle A with centre O and radius 24 cm. NOT TO SCALE x° O 24 cm (i) The total perimeter of the sector is 68 cm. B Calculate the value of x. Answer(a)(i) x = ................................................ [3] (ii) The points A and B of the sector are joined together to O make a hollow cone. The arc AB becomes the circumference of the base of the cone. NOT TO SCALE AB Calculate the volume of the cone. 1 [The volume, V, of a cone with radius r and height h is V = πr2h.] 3 Answer(a)(ii) ......................................... cm3 [6] (b) Q NOT TO SCALE M P O X Y 8 cm The diagram shows a shape made from a square, a quarter circle and a semi-circle. OPXY is a square of side 8 cm. OPQ is a quarter circle, centre O. The line OMQ is the diameter of the semi-circle. Calculate the area of the shape. Answer(b) ......................................... cm2 [5] __________________________________________________________________________________________
Mark scheme: 8 (a) (i) 47.7 or 47.74 to 47.75 3 M1 for [arc =] 68 − 2 × 24 x or 24 + 24 + × 2 π × 24 = 68 360 M1 for [x =] their arc × 360 ÷ (2 × π × 24) 20 (ii) 252 or 252.3 to 252.4.... 6 M1 for r = or 2 π their 47 7. × 2 × π × 24 ÷ (2 π ) 360 10 A1 for r = 3.18 or 3.182 to 3.183... or π M1 for h 2 = 24 2 − their r 2 A1 for h = 23.8 or 23.78... to 23.79 M1dep on M1 earned for 1 2 V = π × their h × their r 3 2 2 1 2 1 8 (b) 139 or 139.3 to 139.4... nfww 5 M4 for 8 + π × 8 + π × 4 2 2 1 2 or M1 for π × 8 4 2 1 8 and M1 for π × 2 2 and M1 for 82 added to at least one term with π
Q9 · The table shows the height, h cm, of 40 children in a class
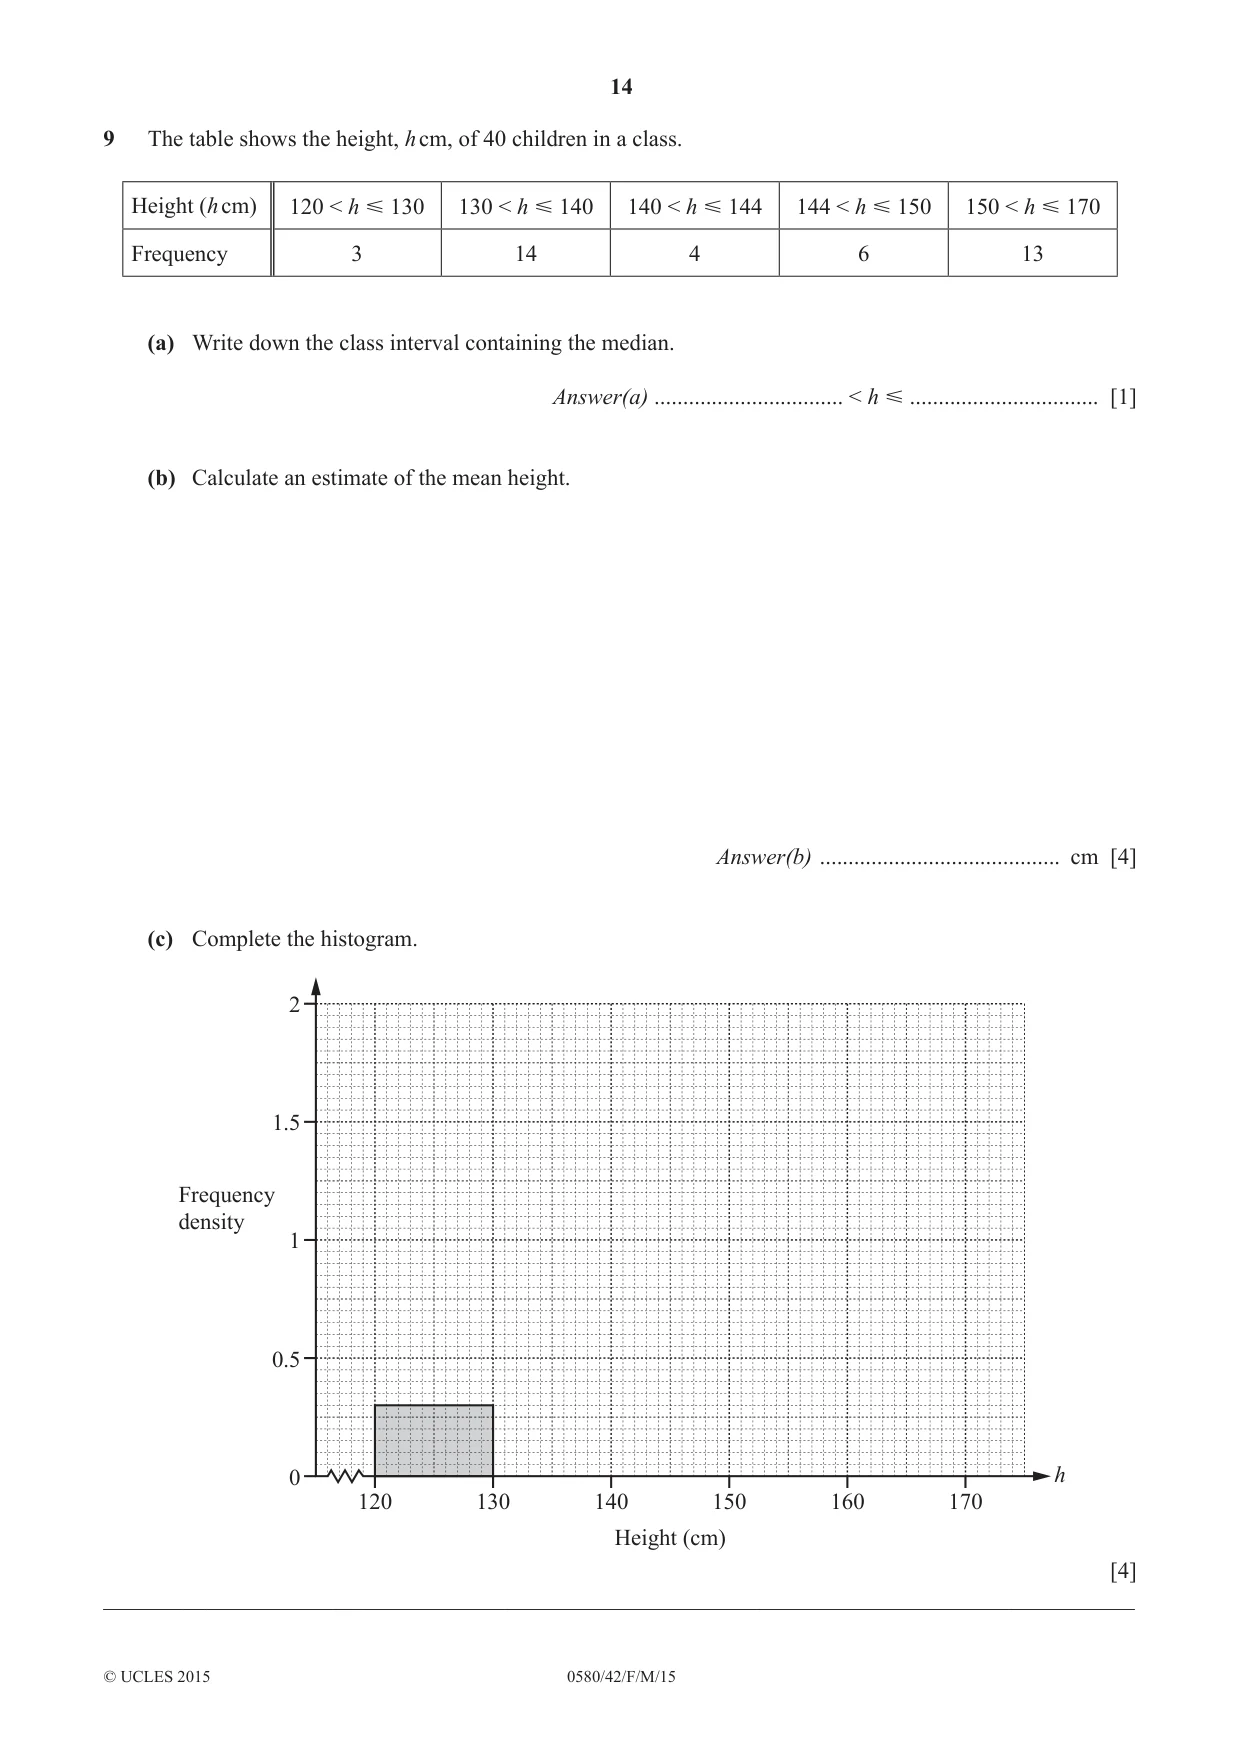
9 The table shows the height, h cm, of 40 children in a class. Height (h cm) 120 < h 130 130 < h 140 140 < h 144 144 < h 150 150 < h 170 Frequency 3 14 4 6 13 (a) Write down the class interval containing the median. Answer(a) ................................. < h ................................. [1] (b) Calculate an estimate of the mean height. Answer(b) .......................................... cm [4] (c) Complete the histogram. 2 1.5 Frequency density 1 0.5 0 h 120 130 140 150 160 170 Height (cm) [4] __________________________________________________________________________________________
Mark scheme: 9 (a) 140 < h ≤ 144 1 (b) 144.875 nfww 4 M1 for at least 4 correct mid-values soi M1 for ∑fx where x is in the correct interval, allow one further error/omission M1 dep for ÷ 40 dependent on second method mark (c) 4 correct blocks 4 B3 for 3 correct blocks B2 for 2 correct blocks B1 for 1 correct block or at least 3 correct frequency densities (1.4, 1, 1, 0.65 )
Q10 · The school cook buys potatoes in small sacks, each of mass 4 kg, and large sacks, each of…
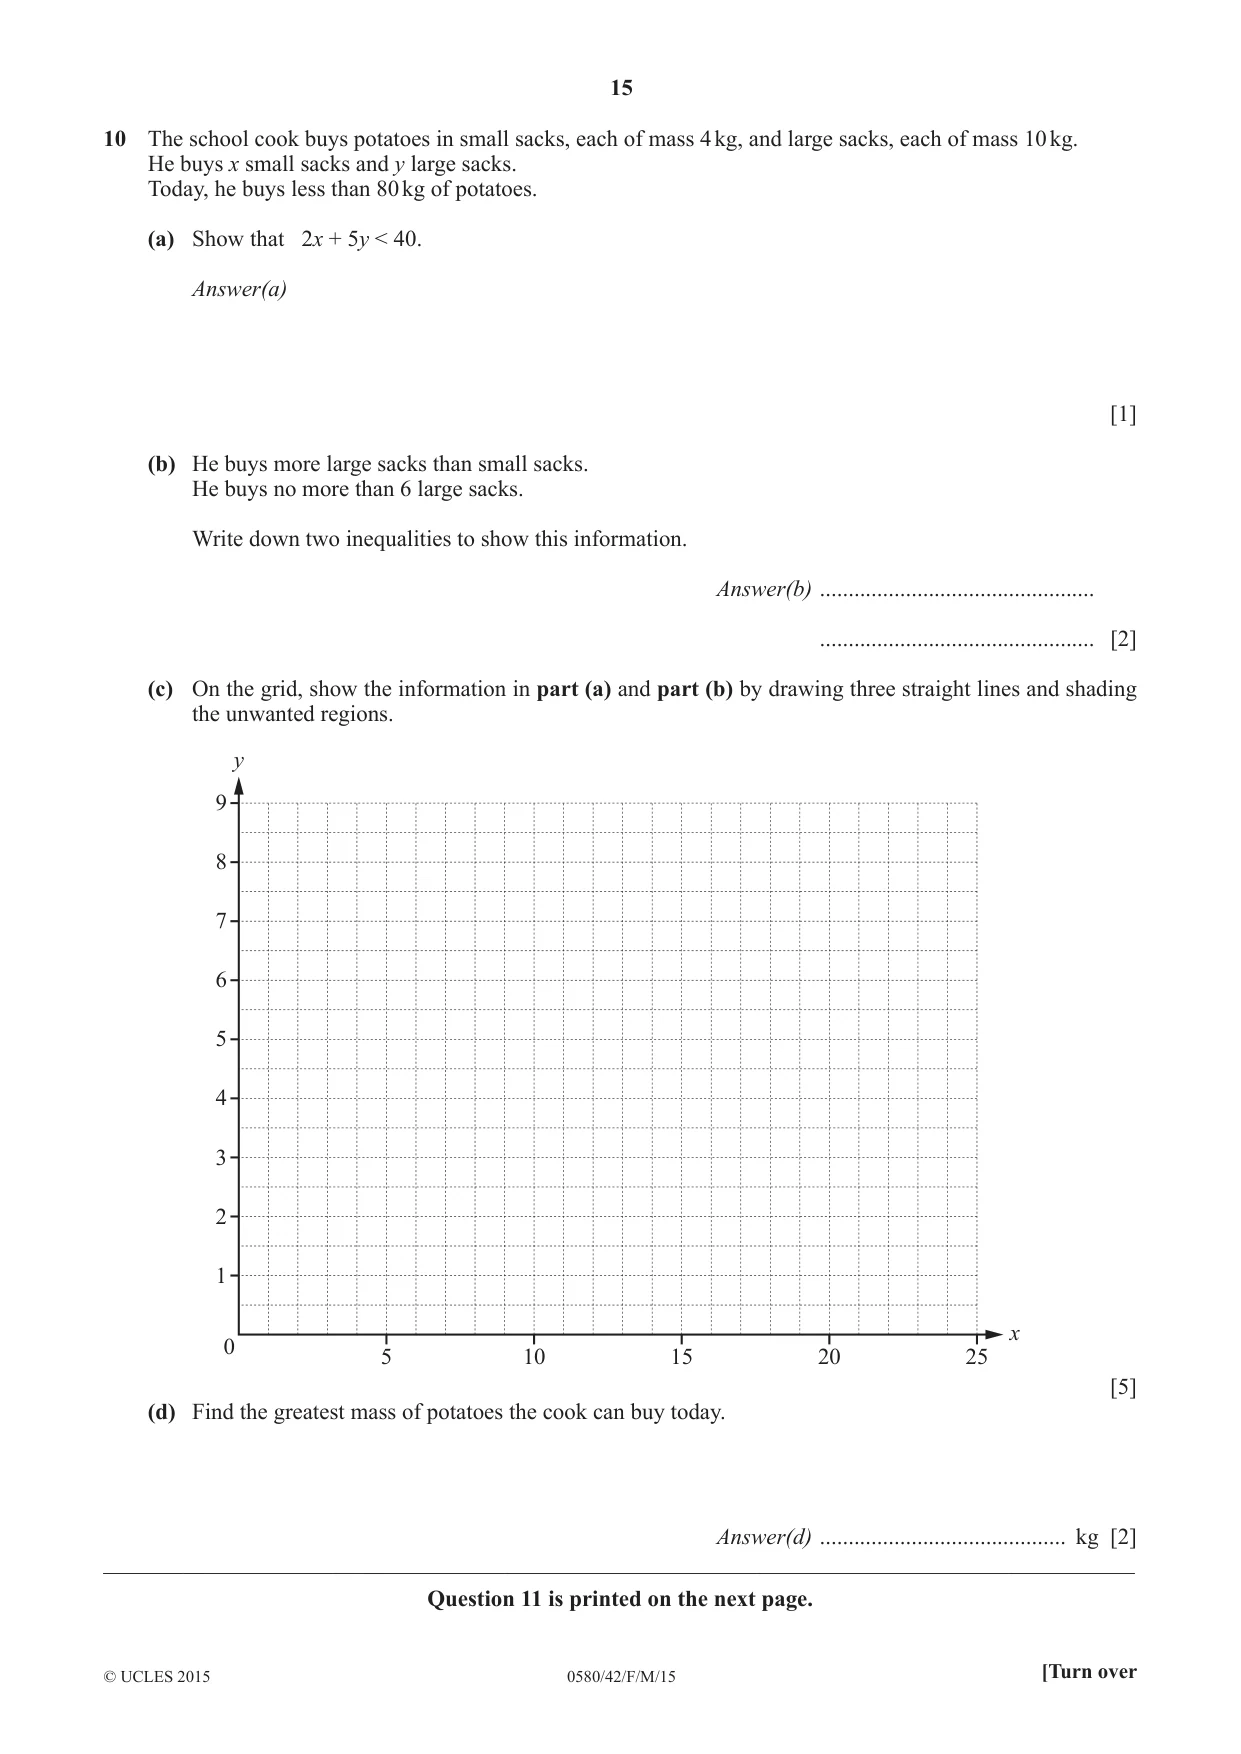
10 The school cook buys potatoes in small sacks, each of mass 4 kg, and large sacks, each of mass 10 kg. He buys x small sacks and y large sacks. Today, he buys less than 80 kg of potatoes. (a) Show that 2x + 5y < 40. Answer(a) [1] (b) He buys more large sacks than small sacks. He buys no more than 6 large sacks. Write down two inequalities to show this information. Answer(b) ................................................ ................................................ [2] (c) On the grid, show the information in part (a) and part (b) by drawing three straight lines and shading the unwanted regions. y 9 8 7 6 5 4 3 2 1 x 0 5 10 15 20 25 [5] (d) Find the greatest mass of potatoes the cook can buy today. Answer(d) ........................................... kg [2] __________________________________________________________________________________________ Question 11 is printed on the next page.
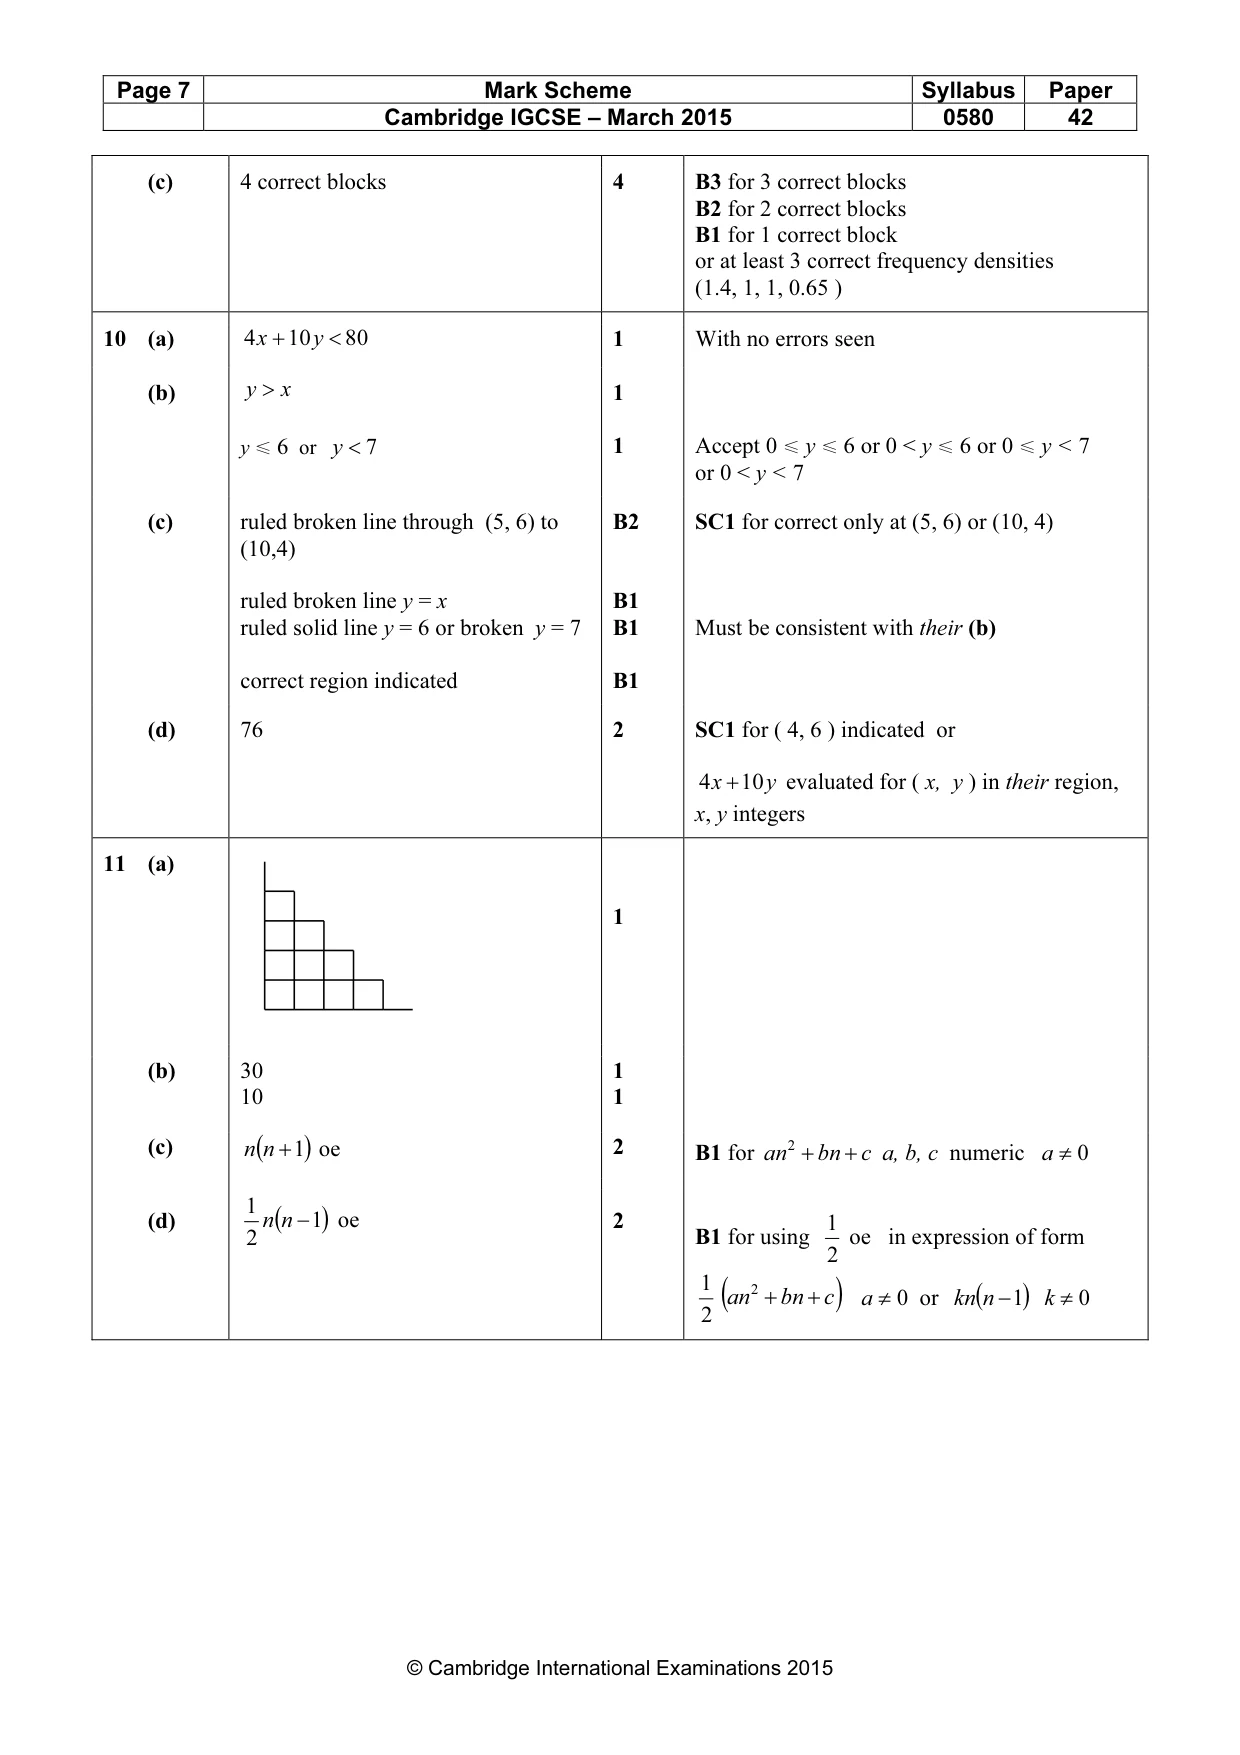
Mark scheme: 10 (a) 4 x + 10 y < 80 1 With no errors seen (b) y > x 1 y ≤ 6 or y < 7 1 Accept 0 ≤ y ≤ 6 or 0 < y ≤ 6 or 0 ≤ y < 7 or 0 < y < 7 (c) ruled broken line through (5, 6) to B2 SC1 for correct only at (5, 6) or (10, 4) (10,4) ruled broken line y = x B1 ruled solid line y = 6 or broken y = 7 B1 Must be consistent with their (b) correct region indicated B1 (d) 76 2 SC1 for ( 4, 6 ) indicated or 4 x + 10 y evaluated for ( x, y ) in their region, x, y integers
Q11 · Diagram 1 Diagram 2 Diagram 3 Diagram 4 Diagram 5 Diagram 1 shows two lines of length 1…
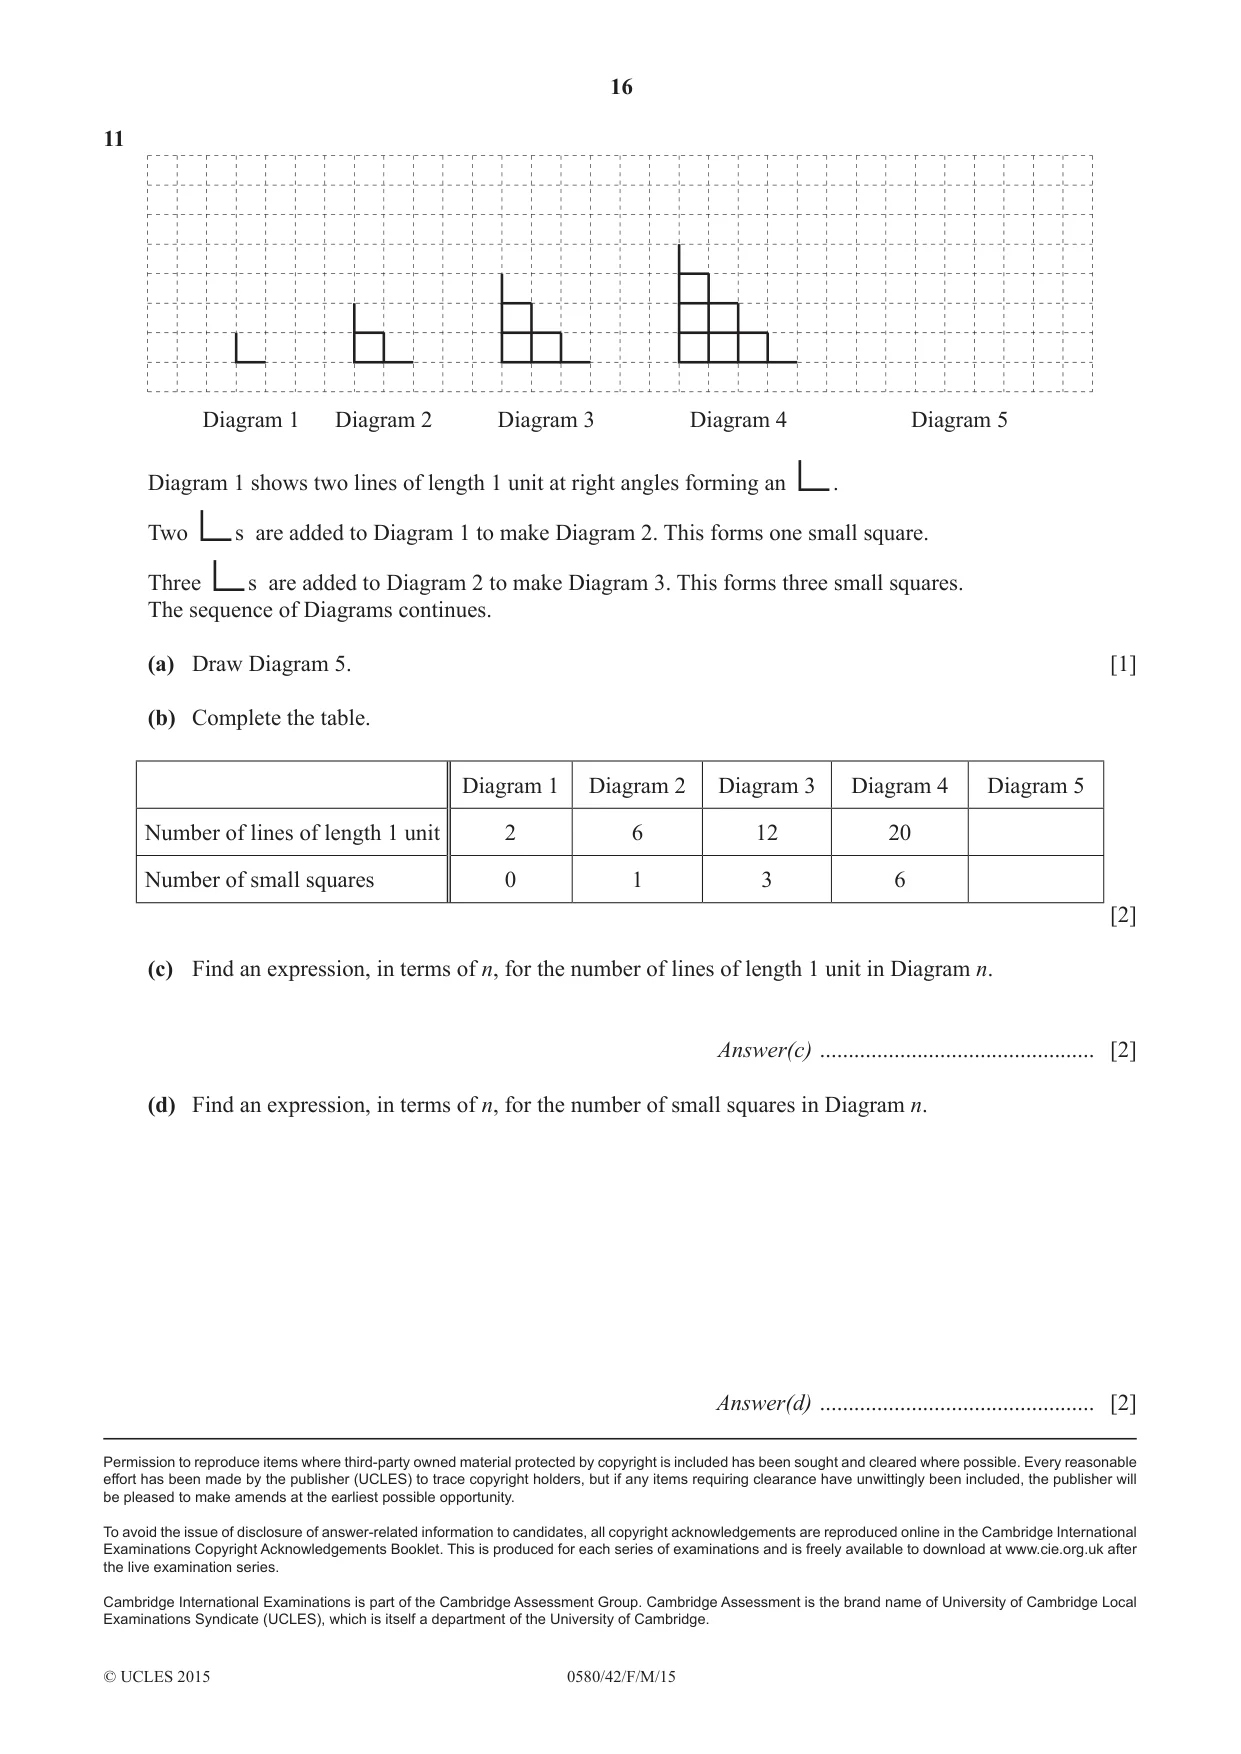
11 Diagram 1 Diagram 2 Diagram 3 Diagram 4 Diagram 5 Diagram 1 shows two lines of length 1 unit at right angles forming an . Two s are added to Diagram 1 to make Diagram 2. This forms one small square. Three s are added to Diagram 2 to make Diagram 3. This forms three small squares. The sequence of Diagrams continues. (a) Draw Diagram 5. [1] (b) Complete the table. Diagram 1 Diagram 2 Diagram 3 Diagram 4 Diagram 5 Number of lines of length 1 unit 2 6 12 20 Number of small squares 0 1 3 6 [2] (c) Find an expression, in terms of n, for the number of lines of length 1 unit in Diagram n. Answer(c) ................................................ [2] (d) Find an expression, in terms of n, for the number of small squares in Diagram n. Answer(d) ................................................ [2]
Mark scheme: 11 (a) 1 (b) 30 1 10 1 2 + bn + c a, b, c numeric a ≠ 0 (c) n (n + )1 oe 2 B1 for an 1 (d) n (n − )1 oe 2 1 2 B1 for using oe in expression of form 2 1 (an 2 + bn + c ) a ≠ 0 or kn(n − )1 k ≠ 0 2
What was in this paper
The subtopics covered by these 7 questions, and how many questions each got. Open one in a new tab to see every Cambridge question on it.
What you needed in this session
Cambridge’s own grade thresholds for 2015 Feb/March, Paper 4 · Variant 2. A higher threshold means an easier paper — the bar moves with how the cohort did.