Questions as text
Q1 · The table below shows the age and price of 20 used cars in a showroom 0580/31 May/June 2009
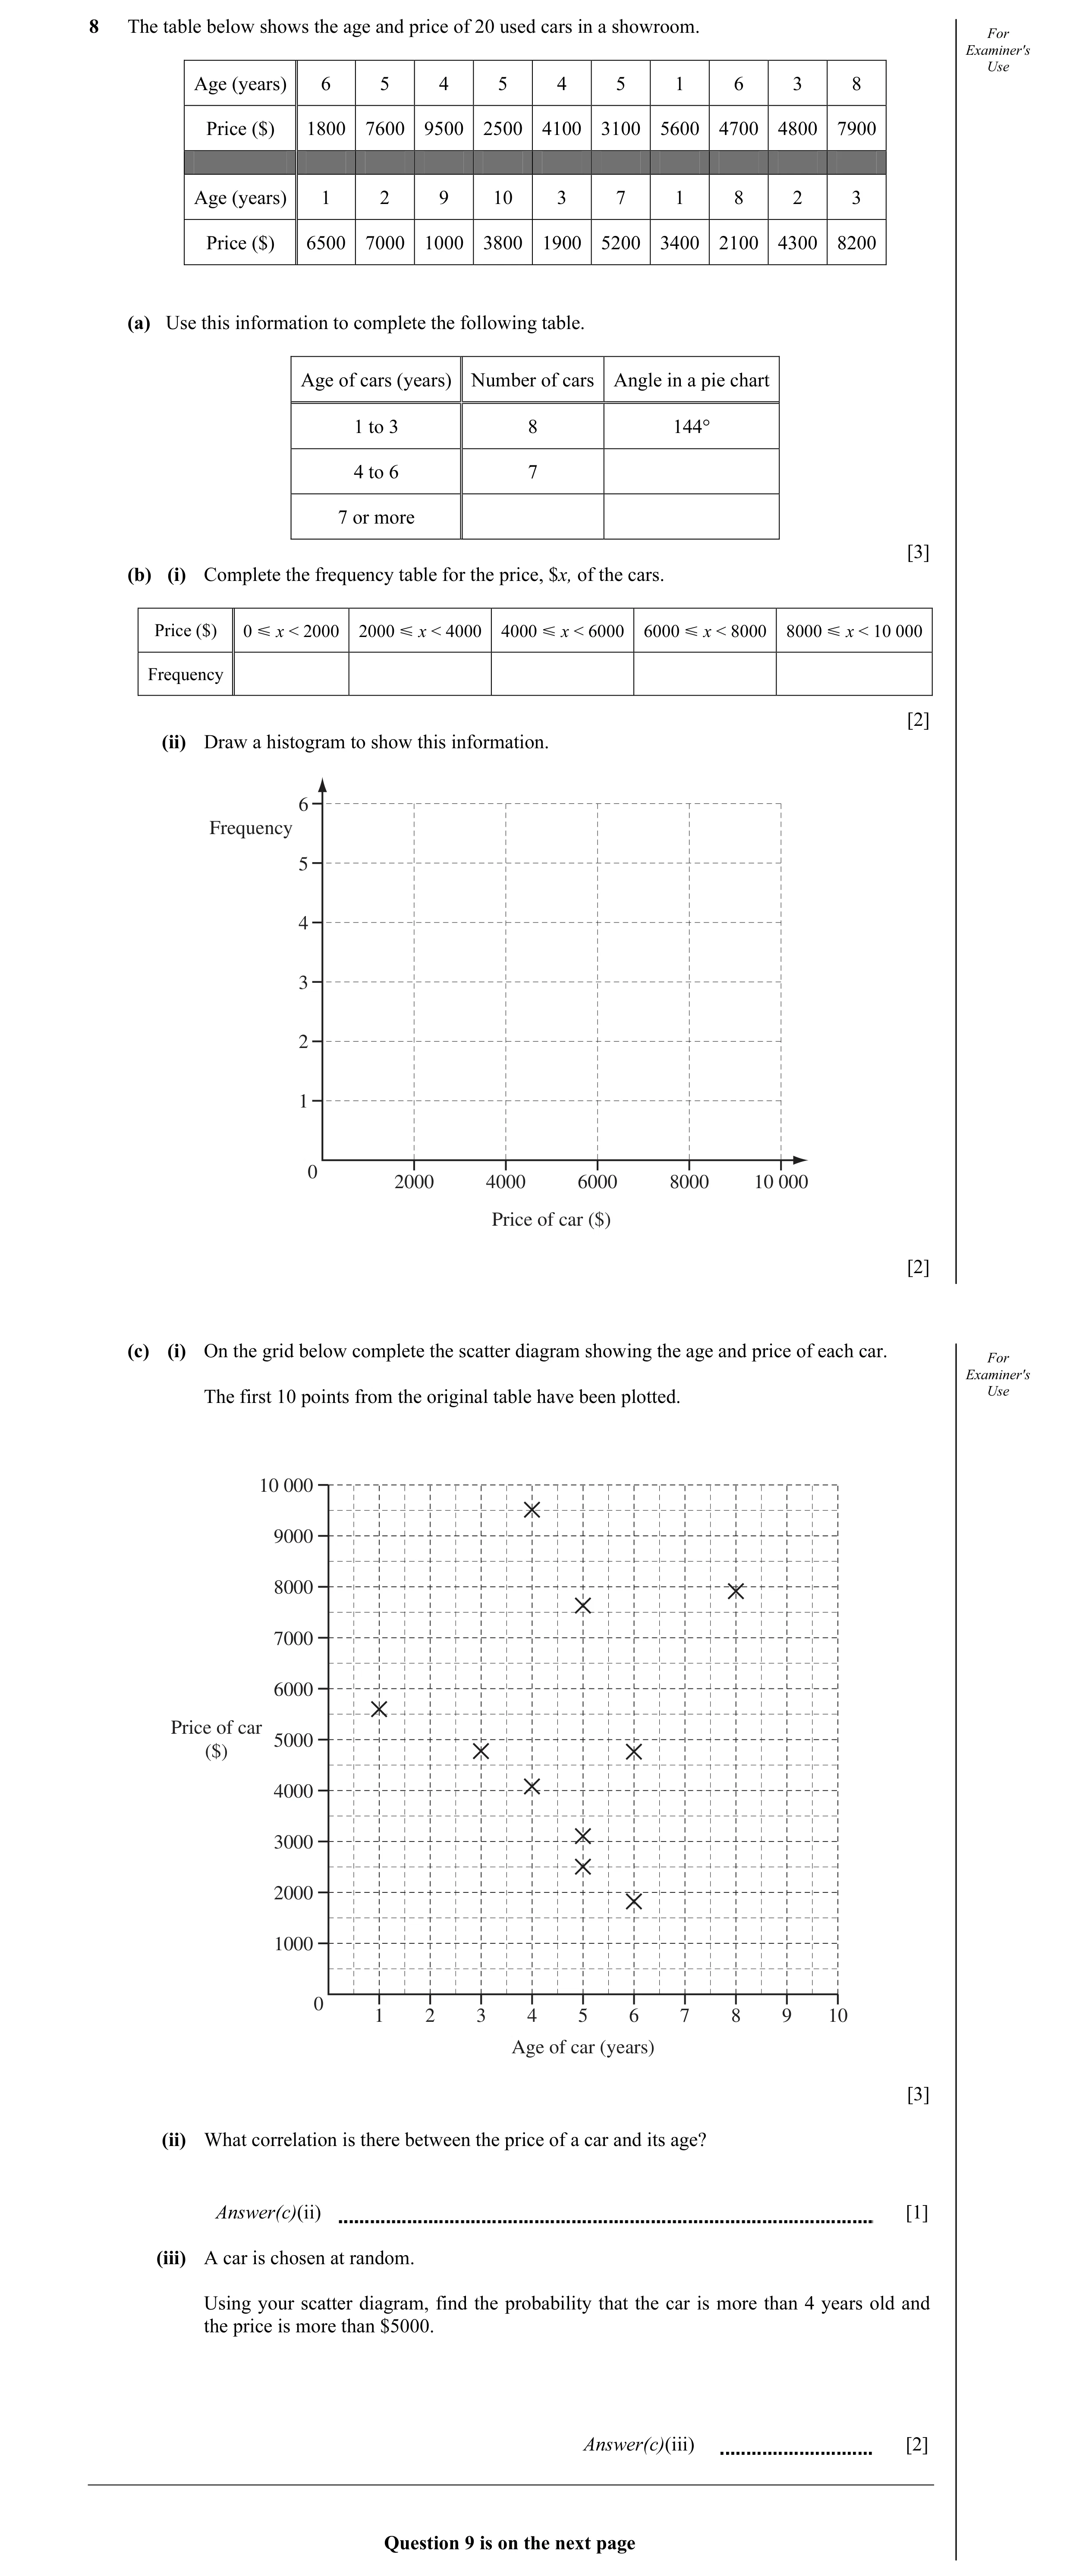
8 The table below shows the age and price of 20 used cars in a showroom. For Examiner's Use Age (years) 6 5 4 5 4 5 1 6 3 8 Price ($) 1800 7600 9500 2500 4100 3100 5600 4700 4800 7900 Age (years) 1 2 9 10 3 7 1 8 2 3 Price ($) 6500 7000 1000 3800 1900 5200 3400 2100 4300 8200 (a) Use this information to complete the following table. Age of cars (years) Number of cars Angle in a pie chart 1 to 3 8 144° 4 to 6 7 7 or more [3] (b) (i) Complete the frequency table for the price, $x, of the cars. Price ($) 0 Y x < 2000 2000 Y x < 4000 4000 Y x < 6000 6000 Y x < 8000 8000 Y x < 10 000 Frequency [2] (ii) Draw a histogram to show this information. 6 Frequency 5 4 3 2 1 0 2000 4000 6000 8000 10 000 Price of car ($) [2] (c) (i) On the grid below complete the scatter diagram showing the age and price of each car. For Examiner's The first 10 points from the original table have been plotted. Use 10 000 9000 8000 7000 6000 Price of car 5000 ($) 4000 3000 2000 1000 0 1 2 3 4 5 6 7 8 9 10 Age of car (years) [3] (ii) What correlation is there between the price of a car and its age? Answer(c)(ii) [1] (iii) A car is chosen at random. Using your scatter diagram, find the probability that the car is more than 4 years old and the price is more than $5000. Answer(c)(iii) [2] Question 9 is on the next page
13 marks
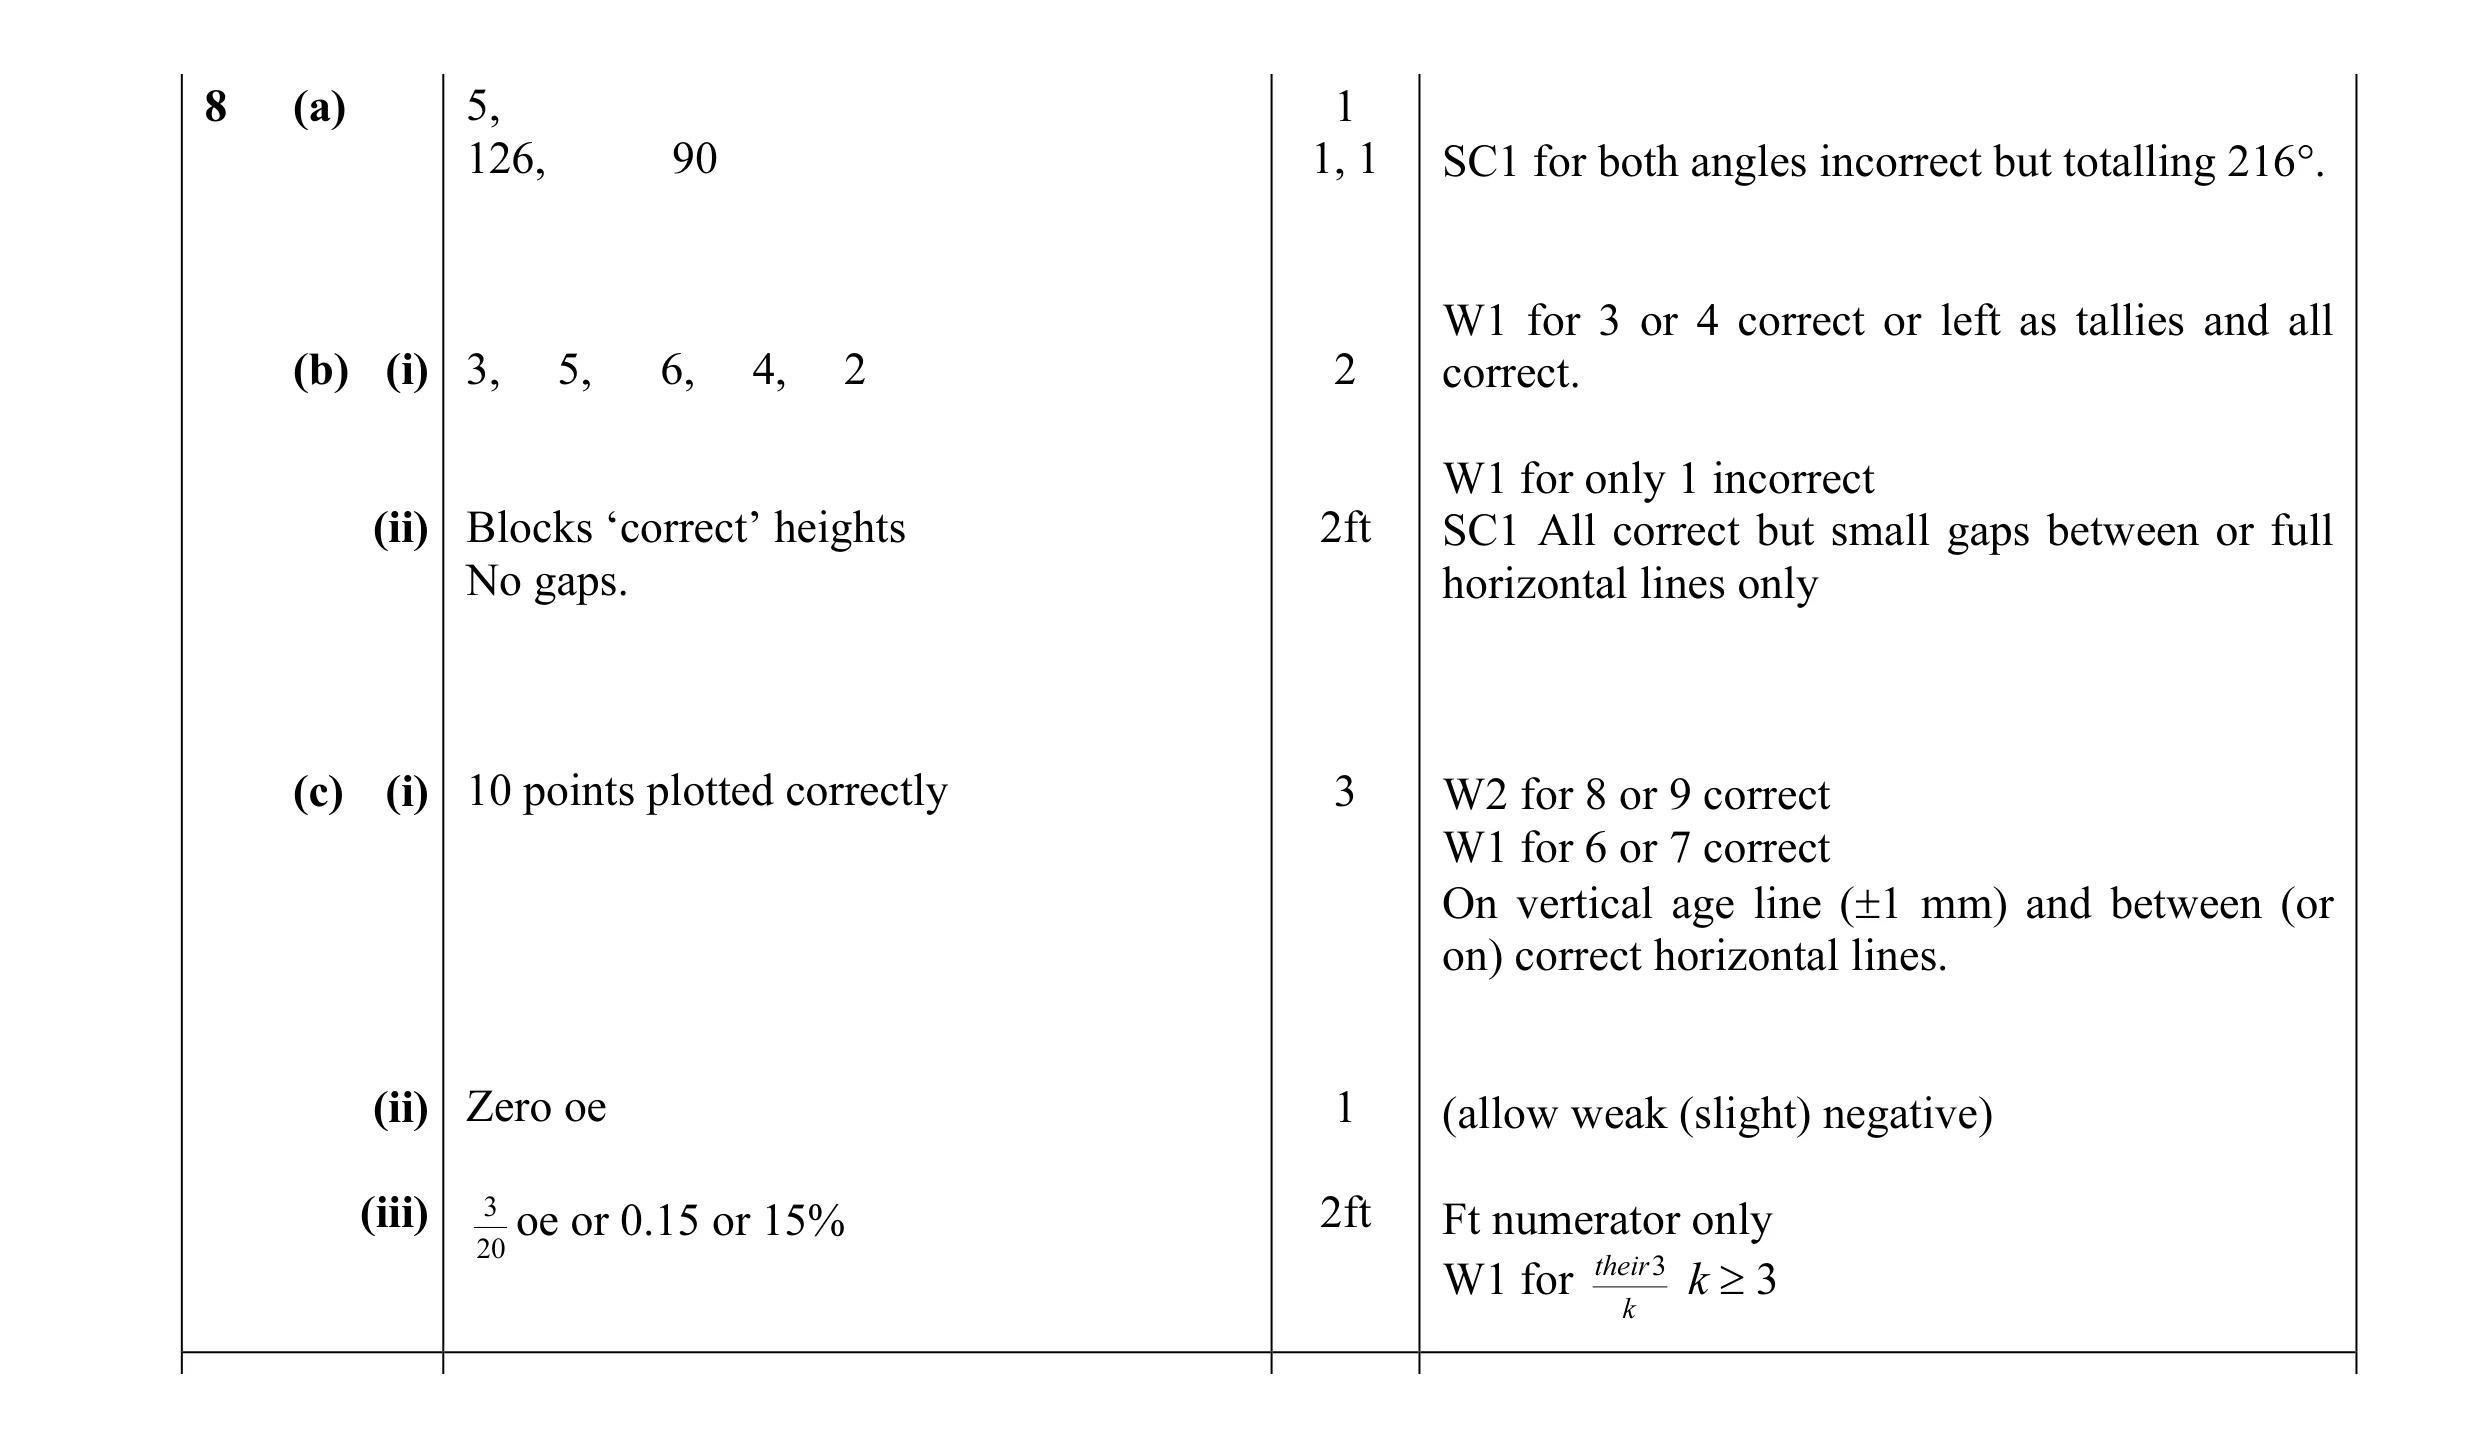
Mark scheme: 8 (a) 5, 1 126, 90 1, 1 SC1 for both angles incorrect but totalling 216°. W1 for 3 or 4 correct or left as tallies and all (b) (i) 3, 5, 6, 4, 2 2 correct. W1 for only 1 incorrect (ii) Blocks ‘correct’ heights 2ft SC1 All correct but small gaps between or full No gaps. horizontal lines only (c) (i) 10 points plotted correctly 3 W2 for 8 or 9 correct W1 for 6 or 7 correct On vertical age line (±1 mm) and between (or on) correct horizontal lines. (ii) Zero oe 1 (allow weak (slight) negative) (iii) 3 oe or 0.15 or 15% 2ft Ft numerator only 20 W1 for their3 k ≥ 3 k
This question in 0580/31 May/June 2009
Q2 · The travel graph shows Helva’s journey from her home to the airport 0580/33 Oct/Nov 2012
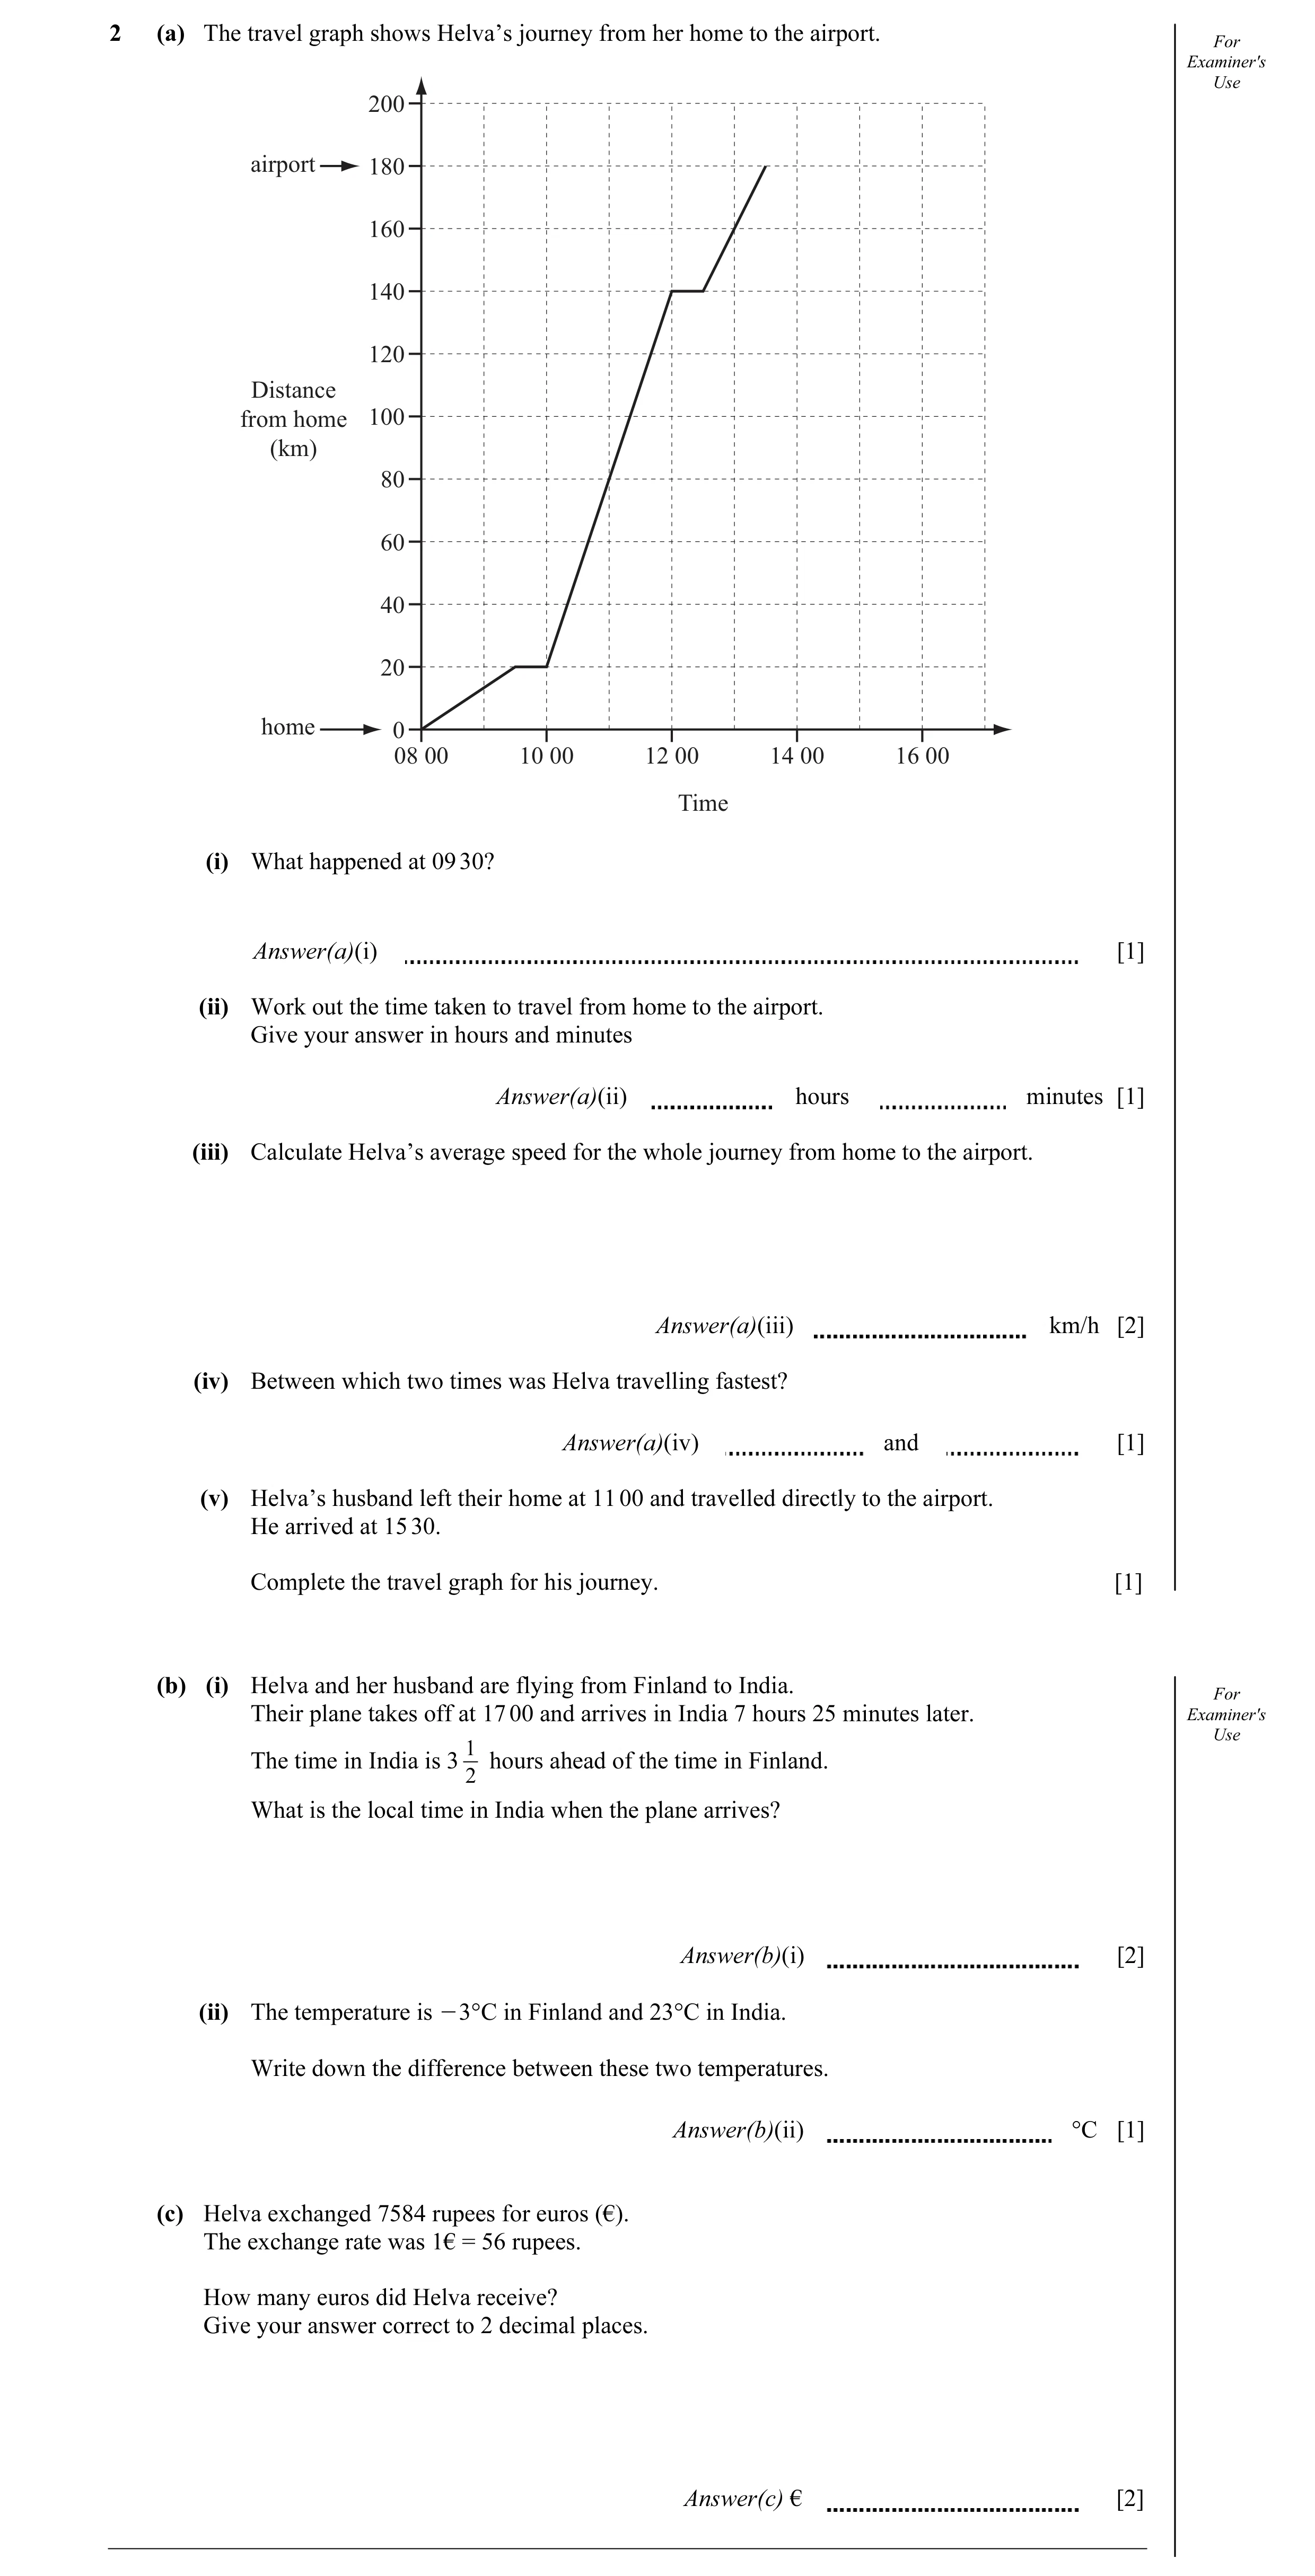
2 (a) The travel graph shows Helva’s journey from her home to the airport. For Examiner's Use 200 airport 180 160 140 120 Distance from home 100 (km) 80 60 40 20 home 0 08 00 10 00 12 00 14 00 16 00 Time (i) What happened at 09 30? Answer(a)(i) [1] (ii) Work out the time taken to travel from home to the airport. Give your answer in hours and minutes Answer(a)(ii) hours minutes [1] (iii) Calculate Helva’s average speed for the whole journey from home to the airport. Answer(a)(iii) km/h [2] (iv) Between which two times was Helva travelling fastest? Answer(a)(iv) and [1] (v) Helva’s husband left their home at 11 00 and travelled directly to the airport. He arrived at 15 30. Complete the travel graph for his journey. [1] (b) (i) Helva and her husband are flying from Finland to India. For Their plane takes off at 17 00 and arrives in India 7 hours 25 minutes later. Examiner's Use 1 The time in India is 3 hours ahead of the time in Finland. 2 What is the local time in India when the plane arrives? Answer(b)(i) [2] (ii) The temperature is O3°C in Finland and 23°C in India. Write down the difference between these two temperatures. Answer(b)(ii) °C [1] (c) Helva exchanged 7584 rupees for euros (€). The exchange rate was 1€ = 56 rupees. How many euros did Helva receive? Give your answer correct to 2 decimal places. Answer(c) € [2]
11 marks
Mark scheme: 2 (a) (i) stopped 1 (ii) 5 hours 30 mins or 5 ½ hours 1 (iii) 32.72 – 32.73 or 32.7 2 ft M1 180 ÷ their (a)(ii) ft correct to 3 sig figs (iv) 10(00) and 12(00) 1 (v) Line or curve from 1100,0 to 1530,180 1 (b) (i) (0)355 or 3.55 am 2 B1 0025 or 2030 seen SC1 2055 as answer or 3.55 pm as answer (ii) 26° or –26° 1 (c) 135.43 cao 2 M1 135 or 135.4 or 7854 ÷ 56, implied by 135.(428…) IGCSE – October/November 2012 0580 33
This question in 0580/33 Oct/Nov 2012
Q3 · For Examiner′s Use Felix rolls two fair dice, each numbered from 1 to 6, and adds the… 0580/33 May/June 2013
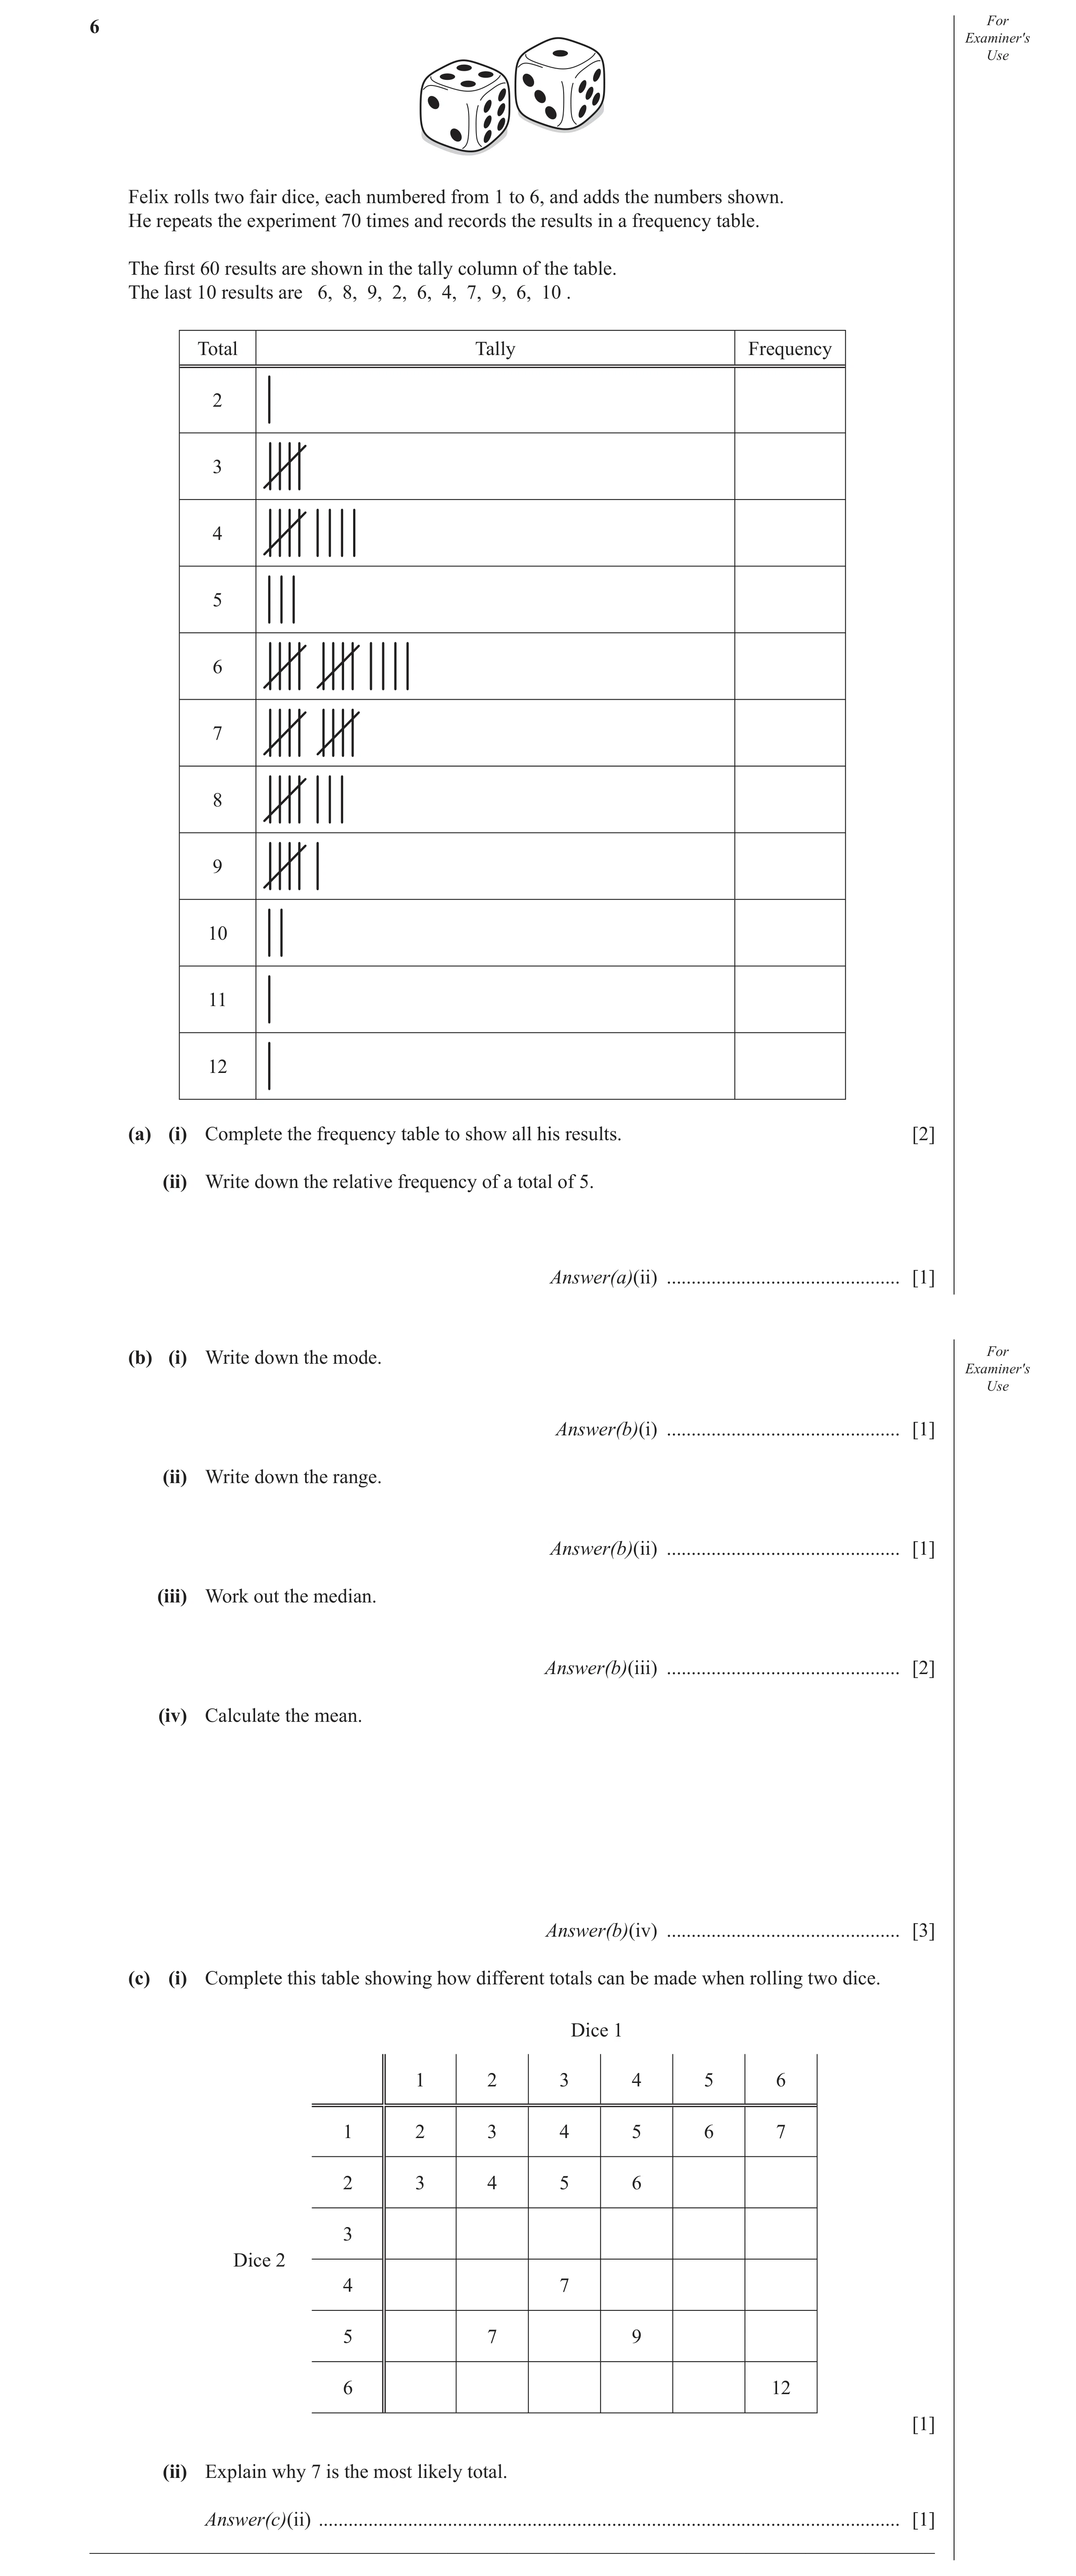
6 For Examiner′s Use Felix rolls two fair dice, each numbered from 1 to 6, and adds the numbers shown. He repeats the experiment 70 times and records the results in a frequency table. The fi rst 60 results are shown in the tally column of the table. The last 10 results are 6, 8, 9, 2, 6, 4, 7, 9, 6, 10 . Total Tally Frequency 2 3 4 5 6 7 8 9 10 11 12 (a) (i) Complete the frequency table to show all his results. [2] (ii) Write down the relative frequency of a total of 5. Answer(a)(ii) … [1] (b) (i) Write down the mode. For Examiner′s Use Answer(b)(i) … [1] (ii) Write down the range. Answer(b)(ii) … [1] (iii) Work out the median. Answer(b)(iii) … [2] (iv) Calculate the mean. Answer(b)(iv) … [3] (c) (i) Complete this table showing how different totals can be made when rolling two dice. Dice 1 1 2 3 4 5 6 1 2 3 4 5 6 7 2 3 4 5 6 3 Dice 2 4 7 5 7 9 6 12 [1] (ii) Explain why 7 is the most likely total. Answer(c)(ii) … [1] _____________________________________________________________________________________
12 marks
Mark scheme: 6 (a) (i) Frequency table completed 2 M1 for 8 correct frequencies SC1 for all correct tallies if no frequencies. OR SC1 for all correct frequencies in tally column (ii) 3 1 ft ft their table oe 70 (b) (i) 6 1 (ii) 10 1 (iii) 6 2 M1 for clear recognition of mid values used (iv) 6.43 to 3sf 3 M1 for total of freq × their result M1 dep for division by their 70 (c) (i) All totals filled in 1 Allow 1 error or omission (ii) More ways of getting 7 1 Any equivalent explanation
This question in 0580/33 May/June 2013
Q4 · Alison scored the following number of runs in 15 cricket matches 0580/33 Oct/Nov 2013
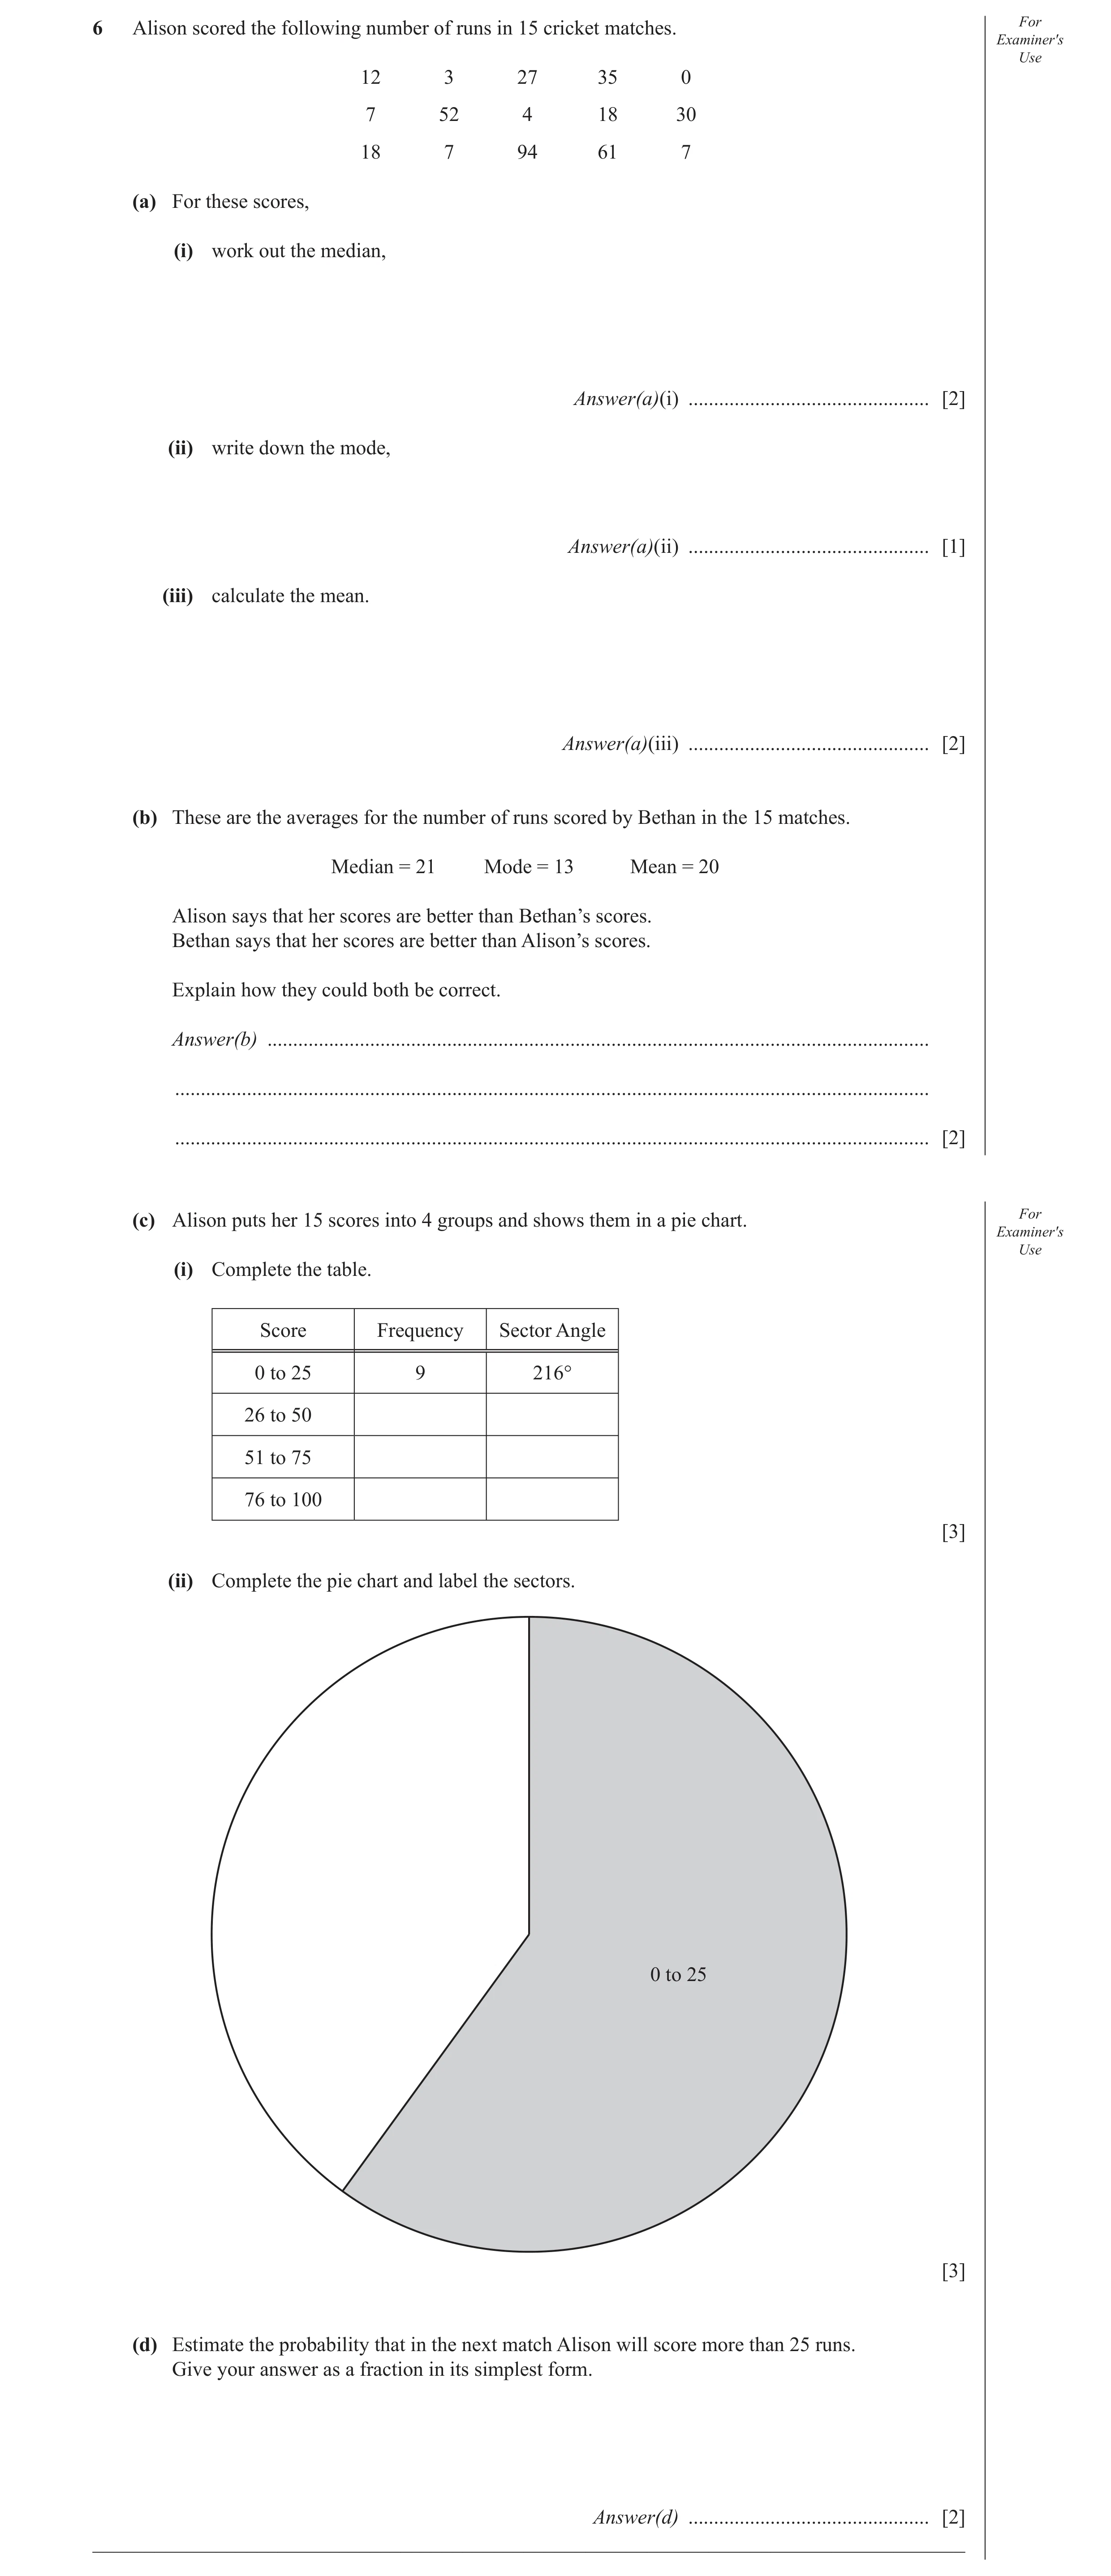
6 Alison scored the following number of runs in 15 cricket matches. For Examiner′s Use 12 3 27 35 0 7 52 4 18 30 18 7 94 61 7 (a) For these scores, (i) work out the median, Answer(a)(i) … [2] (ii) write down the mode, Answer(a)(ii) … [1] (iii) calculate the mean. Answer(a)(iii) … [2] (b) These are the averages for the number of runs scored by Bethan in the 15 matches. Median = 21 Mode = 13 Mean = 20 Alison says that her scores are better than Bethan’s scores. Bethan says that her scores are better than Alison’s scores. Explain how they could both be correct. Answer(b) … … … [2] (c) Alison puts her 15 scores into 4 groups and shows them in a pie chart. For Examiner′s Use (i) Complete the table. Score Frequency Sector Angle 0 to 25 9 216° 26 to 50 51 to 75 76 to 100 [3] (ii) Complete the pie chart and label the sectors. 0 to 25 [3] (d) Estimate the probability that in the next match Alison will score more than 25 runs. Give your answer as a fraction in its simplest form. Answer(d) … [2] _____________________________________________________________________________________
15 marks
Mark scheme: 6 (a) (i) 18 2 M1 for evidence of ordering (ii) 7 1 (iii) 25 2 M1 for sum of 15 items ÷ 15 soi (b) Alison with reference to [higher] mean 1FT Strict FT and Bethan with reference to [higher] median 1FT Strict FT (c) (i) [Frequencies] 3, 2, 1 1 [Angles] 72°, 48°, 24° 2 B1 for 1 correct or M1 for one frequency ÷ 15 × 360 or × 24 (ii) Two correct sectors on pie chart 2FT B1FT for 1 correct sector Only ft if (c)(i) angles total 144 3 ‘correct’ labels 1 Independent 2 6 (d) 2 B1 for 0.4 or 40% or or any equivalent 5 15 fraction
This question in 0580/33 Oct/Nov 2013
Question 5 0580/32 Feb/March 2015
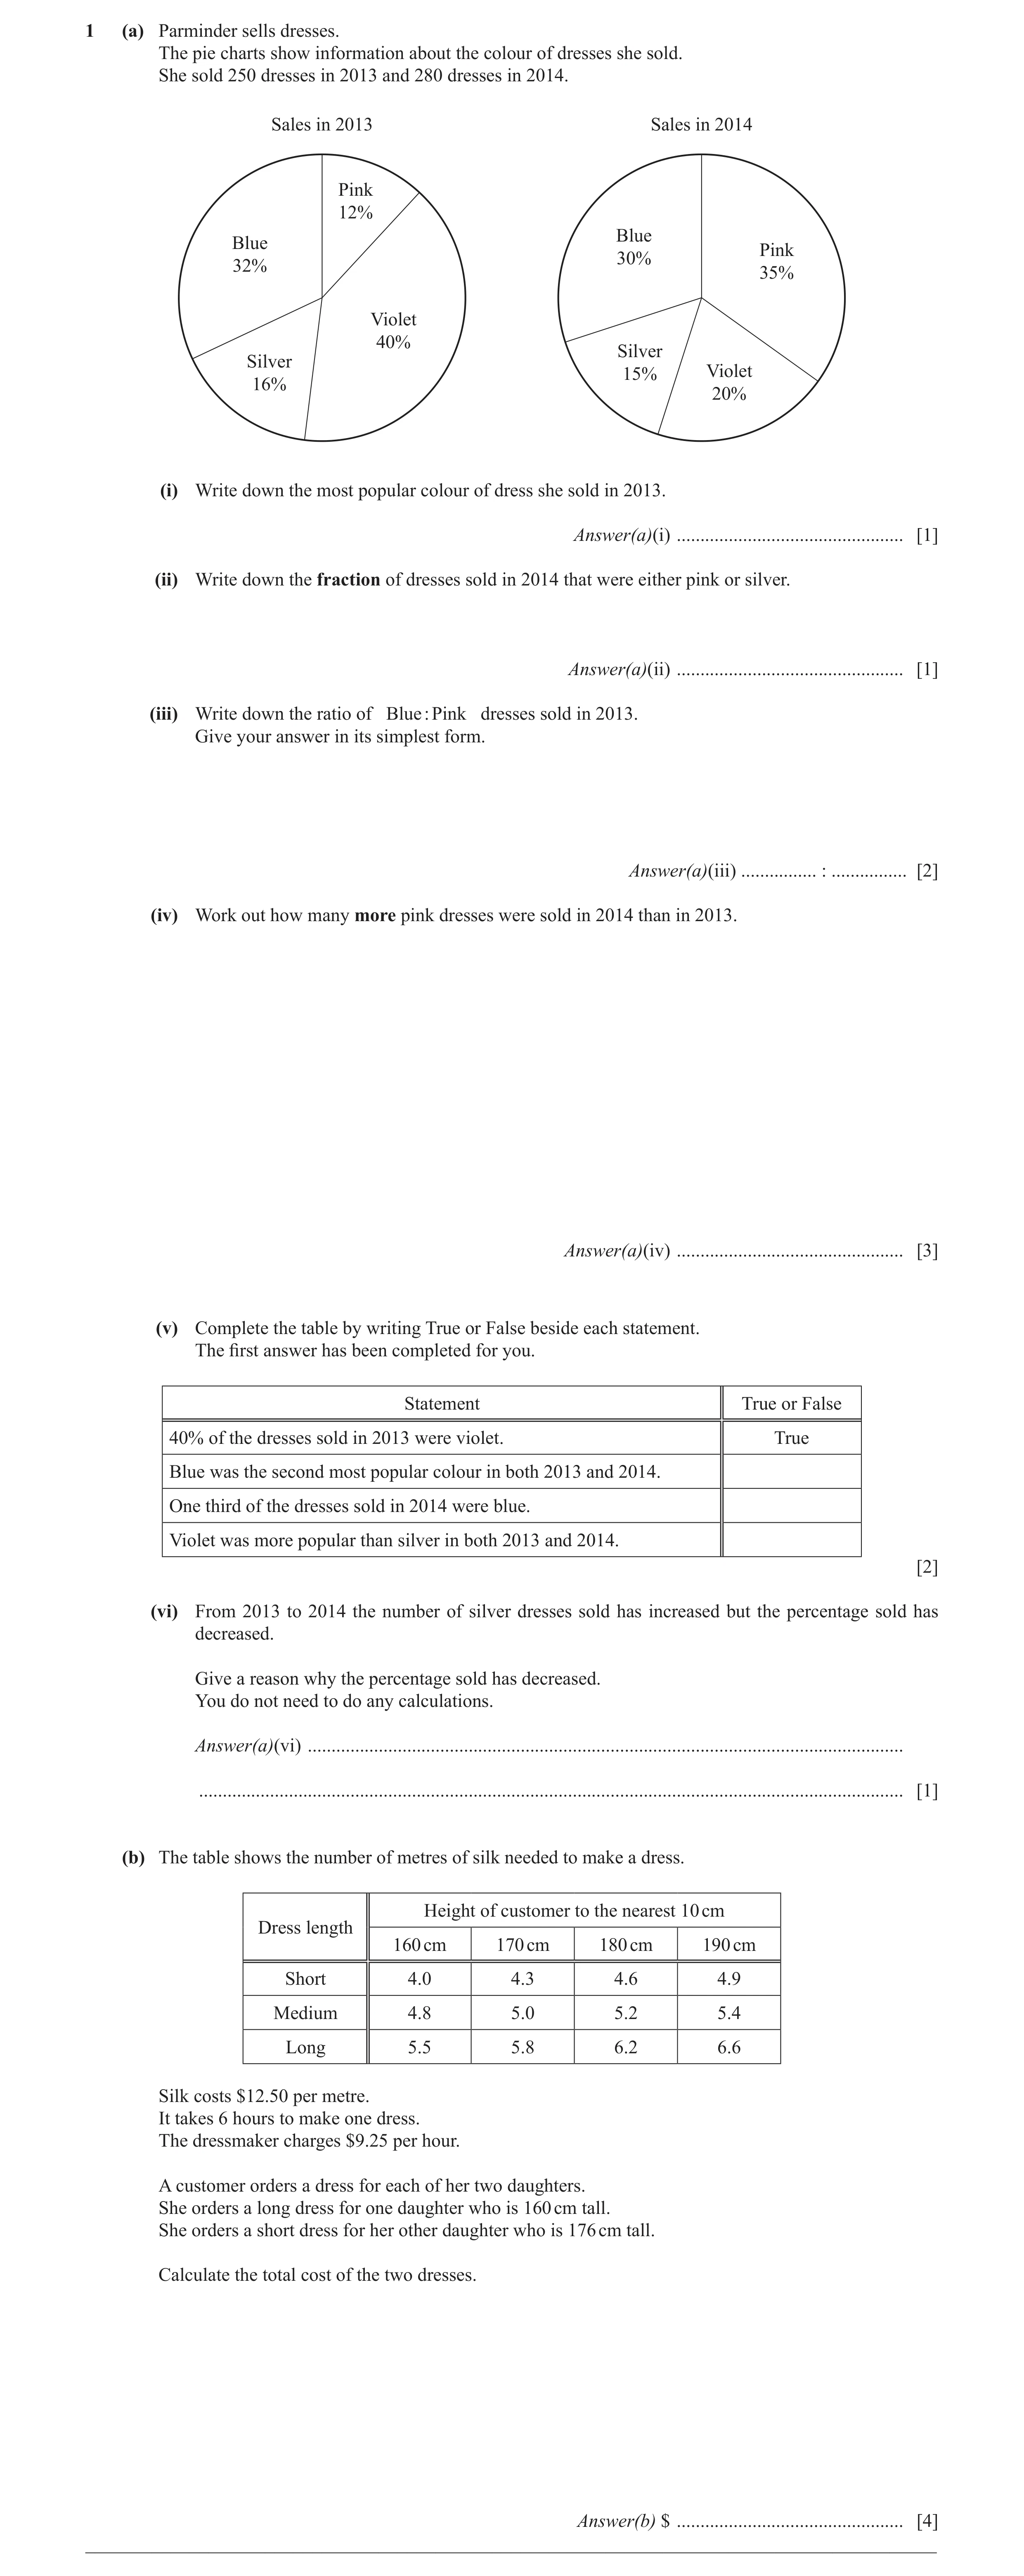
1 (a) Parminder sells dresses. The pie charts show information about the colour of dresses she sold. She sold 250 dresses in 2013 and 280 dresses in 2014. Sales in 2013 Sales in 2014 Pink 12% Blue Blue Pink 30% 32% 35% Violet 40% Silver Silver 15% Violet 16% 20% (i) Write down the most popular colour of dress she sold in 2013. Answer(a)(i) … [1] (ii) Write down the fraction of dresses sold in 2014 that were either pink or silver. Answer(a)(ii) … [1] (iii) Write down the ratio of Blue : Pink dresses sold in 2013. Give your answer in its simplest form. Answer(a)(iii) … : … [2] (iv) Work out how many more pink dresses were sold in 2014 than in 2013. Answer(a)(iv) … [3] (v) Complete the table by writing True or False beside each statement. The first answer has been completed for you. Statement True or False 40% of the dresses sold in 2013 were violet. True Blue was the second most popular colour in both 2013 and 2014. One third of the dresses sold in 2014 were blue. Violet was more popular than silver in both 2013 and 2014. [2] (vi) From 2013 to 2014 the number of silver dresses sold has increased but the percentage sold has decreased. Give a reason why the percentage sold has decreased. You do not need to do any calculations. Answer(a)(vi) … … [1] (b) The table shows the number of metres of silk needed to make a dress. Height of customer to the nearest 10 cm Dress length 160 cm 170 cm 180 cm 190 cm Short 4.0 4.3 4.6 4.9 Medium 4.8 5.0 5.2 5.4 Long 5.5 5.8 6.2 6.6 Silk costs $12.50 per metre. It takes 6 hours to make one dress. The dressmaker charges $9.25 per hour. A customer orders a dress for each of her two daughters. She orders a long dress for one daughter who is 160 cm tall. She orders a short dress for her other daughter who is 176 cm tall. Calculate the total cost of the two dresses. Answer(b) $ … [4] __________________________________________________________________________________________
14 marks
Mark scheme: 1 (a) (i) Violet 1 50 (ii) oe 1 100 (iii) 8:3 2 M1 for 32:12 or better or 80:30 or better SC1 for 3:8 or 6:7 (iv) 68 3 M2 for 0.35 × 280 – 0.12 × 250 or better or M1 for 0.35 × 280 or 0.12 × 250 seen (v) True, False, True 2 B1 for 2 correct (vi) [The] percentage is [smaller but it is] 1 of a larger [total] number [of dresses] (b) 237.25 4 B1 for 5.5 and 4.6 seen M1FT for their 5.5×12.50 + their 4.6×12.50 or better M1 for 6 × 2 × 9.25 or better OR M1FT for their 5.5 × 12.50 + 6 × 9.25 M1FT for their 4.6 × 12.50 + 6 × 9.25
This question in 0580/32 Feb/March 2015
Q6 · 40 Cawley 35 30 25 Distance from 20 Audley (km) 15 Brookland 10 5 Audley 0 09 00 09 30 10… 0580/31 May/June 2015
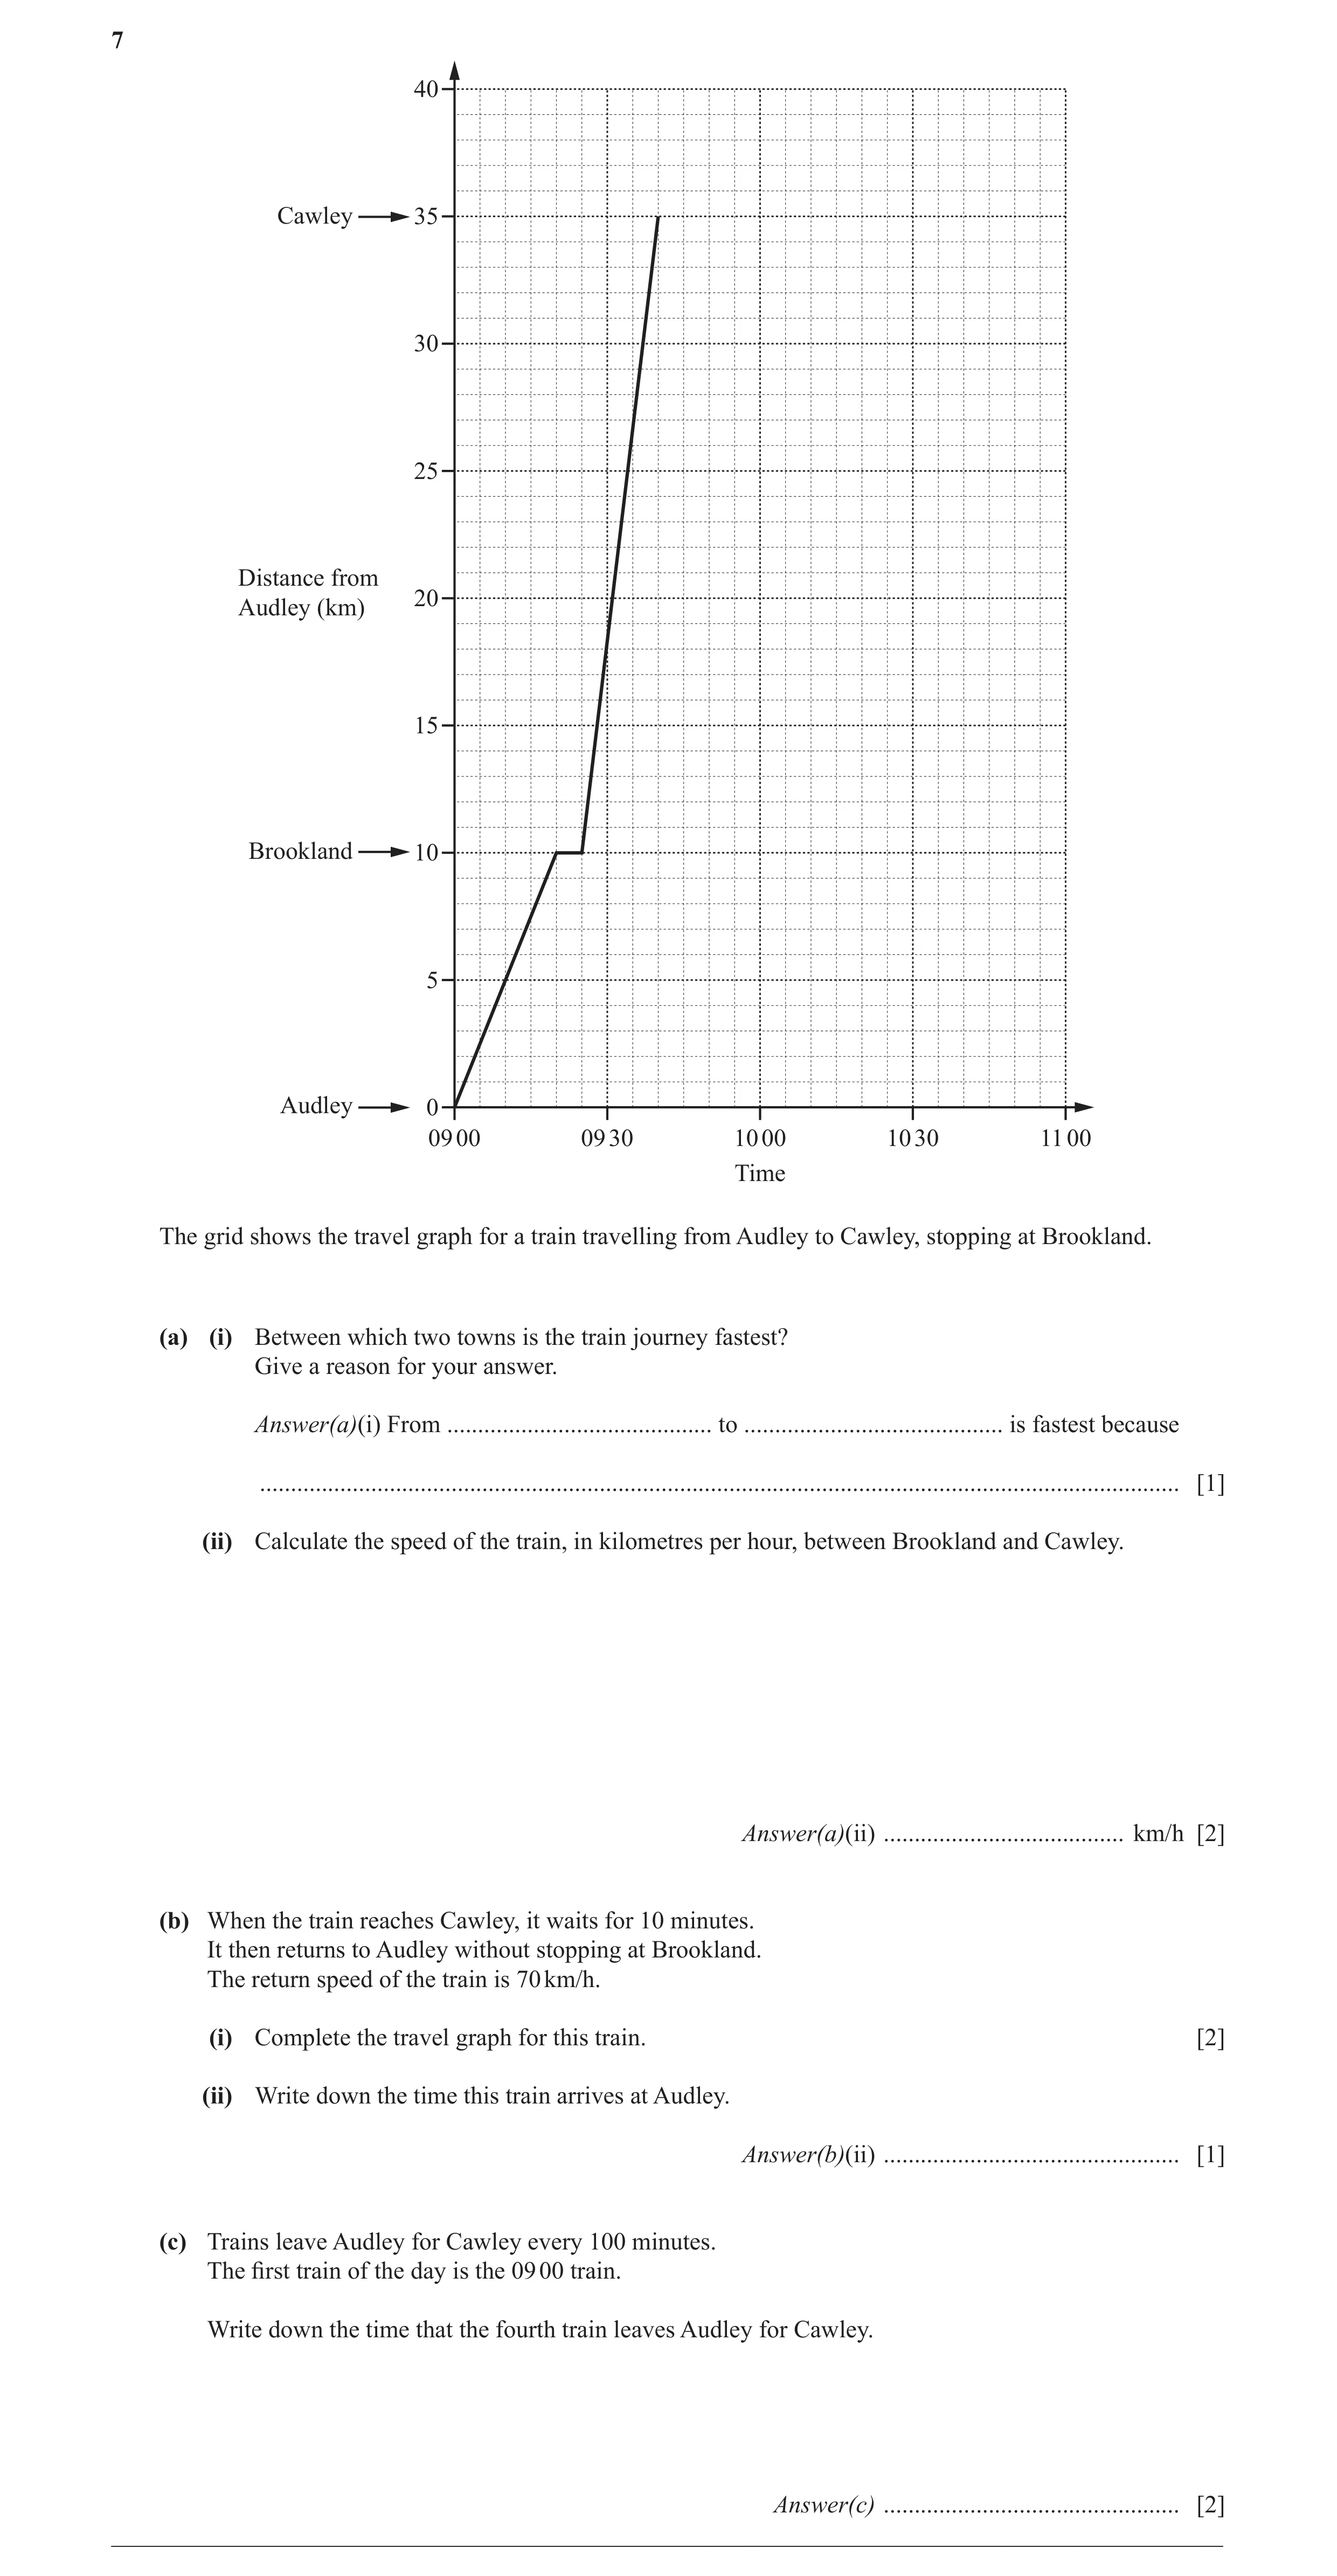
7 40 Cawley 35 30 25 Distance from 20 Audley (km) 15 Brookland 10 5 Audley 0 09 00 09 30 10 00 10 30 11 00 Time The grid shows the travel graph for a train travelling from Audley to Cawley, stopping at Brookland. (a) (i) Between which two towns is the train journey fastest? Give a reason for your answer. Answer(a)(i) From … to … is fastest because … [1] (ii) Calculate the speed of the train, in kilometres per hour, between Brookland and Cawley. Answer(a)(ii) … km/h [2] (b) When the train reaches Cawley, it waits for 10 minutes. It then returns to Audley without stopping at Brookland. The return speed of the train is 70 km/h. (i) Complete the travel graph for this train. [2] (ii) Write down the time this train arrives at Audley. Answer(b)(ii) … [1] (c) Trains leave Audley for Cawley every 100 minutes. The first train of the day is the 09 00 train. Write down the time that the fourth train leaves Audley for Cawley. Answer(c) … [2] __________________________________________________________________________________________
8 marks
Mark scheme: 7 (a) (i) Brookland to Cawley 1 and [gradient is] steeper oe 35 − 10 (ii) 100 2 M1 for oe time (b) (i) correct graph 2 B1 for horizontal line (0940, Cawley) to (0950, Cawley) B1FT for line (their 0950, Cawley) to (their 0950 + 30, Audley) (ii) 10 20 1FT (c) 1400 2 B1 for 300 or 5 h or 2:00 or 2 o’clock or any 2 of 10:40, 12:20(FT) or 14:00(FT)/2:00(FT) If zero scored, SC1 for 1540 or 3:40pm
This question in 0580/31 May/June 2015
Q7 · Swimming pool Shop Distance from home (km) Cinema Home 0 10 00 10 10 10 20 10 30 10 40 10… 0580/32 Feb/March 2016
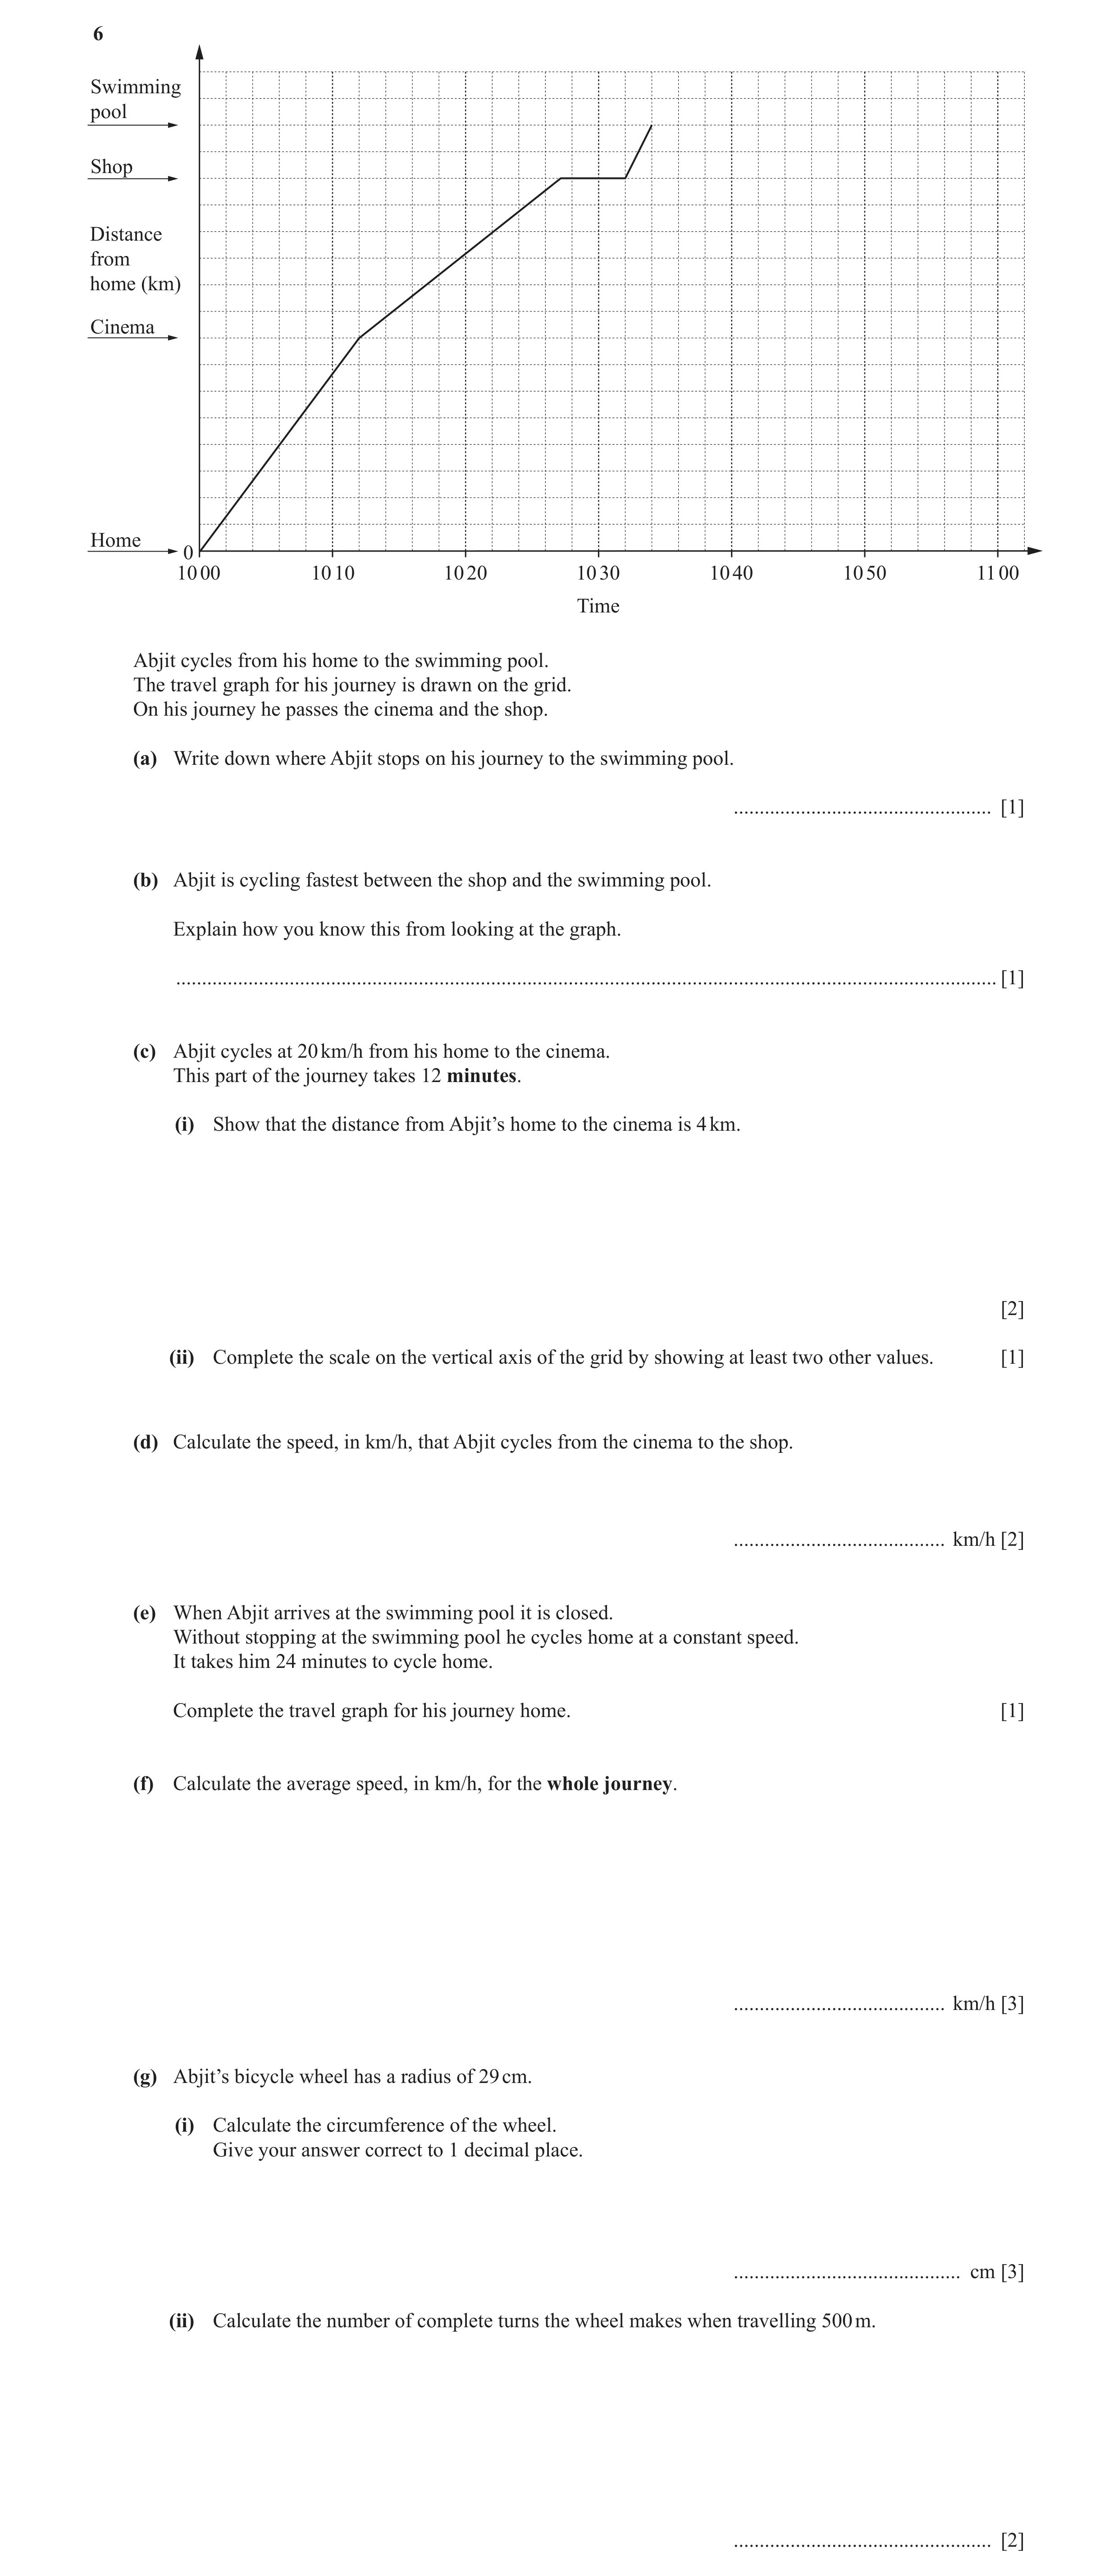
6 Swimming pool Shop Distance from home (km) Cinema Home 0 10 00 10 10 10 20 10 30 10 40 10 50 11 00 Time Abjit cycles from his home to the swimming pool. The travel graph for his journey is drawn on the grid. On his journey he passes the cinema and the shop. (a) Write down where Abjit stops on his journey to the swimming pool. … [1] (b) Abjit is cycling fastest between the shop and the swimming pool. Explain how you know this from looking at the graph. … [1] (c) Abjit cycles at 20 km/h from his home to the cinema. This part of the journey takes 12 minutes. (i) Show that the distance from Abjit’s home to the cinema is 4 km. [2] (ii) Complete the scale on the vertical axis of the grid by showing at least two other values. [1] (d) Calculate the speed, in km/h, that Abjit cycles from the cinema to the shop. … km/h [2] (e) When Abjit arrives at the swimming pool it is closed. Without stopping at the swimming pool he cycles home at a constant speed. It takes him 24 minutes to cycle home. Complete the travel graph for his journey home. [1] (f) Calculate the average speed, in km/h, for the whole journey. … km/h [3] (g) Abjit’s bicycle wheel has a radius of 29 cm. (i) Calculate the circumference of the wheel. Give your answer correct to 1 decimal place. … cm [3] (ii) Calculate the number of complete turns the wheel makes when travelling 500 m. … [2]
16 marks
Mark scheme: 6 (a) shop 1 (b) [graph] steepest oe 1 1 (c) (i) 0.2 × 20 or 12 × oe M2 M1 for 12×20 3 (ii) distance axis numbered correctly 1 with at least 2 more numbers 3 3 (d) 12 2 M1 for or [ 60 ] 0.25 15× (e) ruled line from (1034, 8) to 1 (1058, 0) their swimming pool distance × 2 (f) 16.6 or 16.55… 3 M2 for ×60 their 1058 − 1000 dist or M1 for a timeinterval (g) (i) 182.2 3 M1 for 2π × 29 A1 for 182.2 to 182.24 A1FT for their A1 rounded correctly to 1dp 50000 500 (ii) 274 2FT M1FT or their ( g )( i ) their ( g )( i ) ÷ 100 If zero scored SC1 for figs 27[44…] 1732
This question in 0580/32 Feb/March 2016
Q8 · This graph shows Gianna’s journey to work 0580/31 Oct/Nov 2016
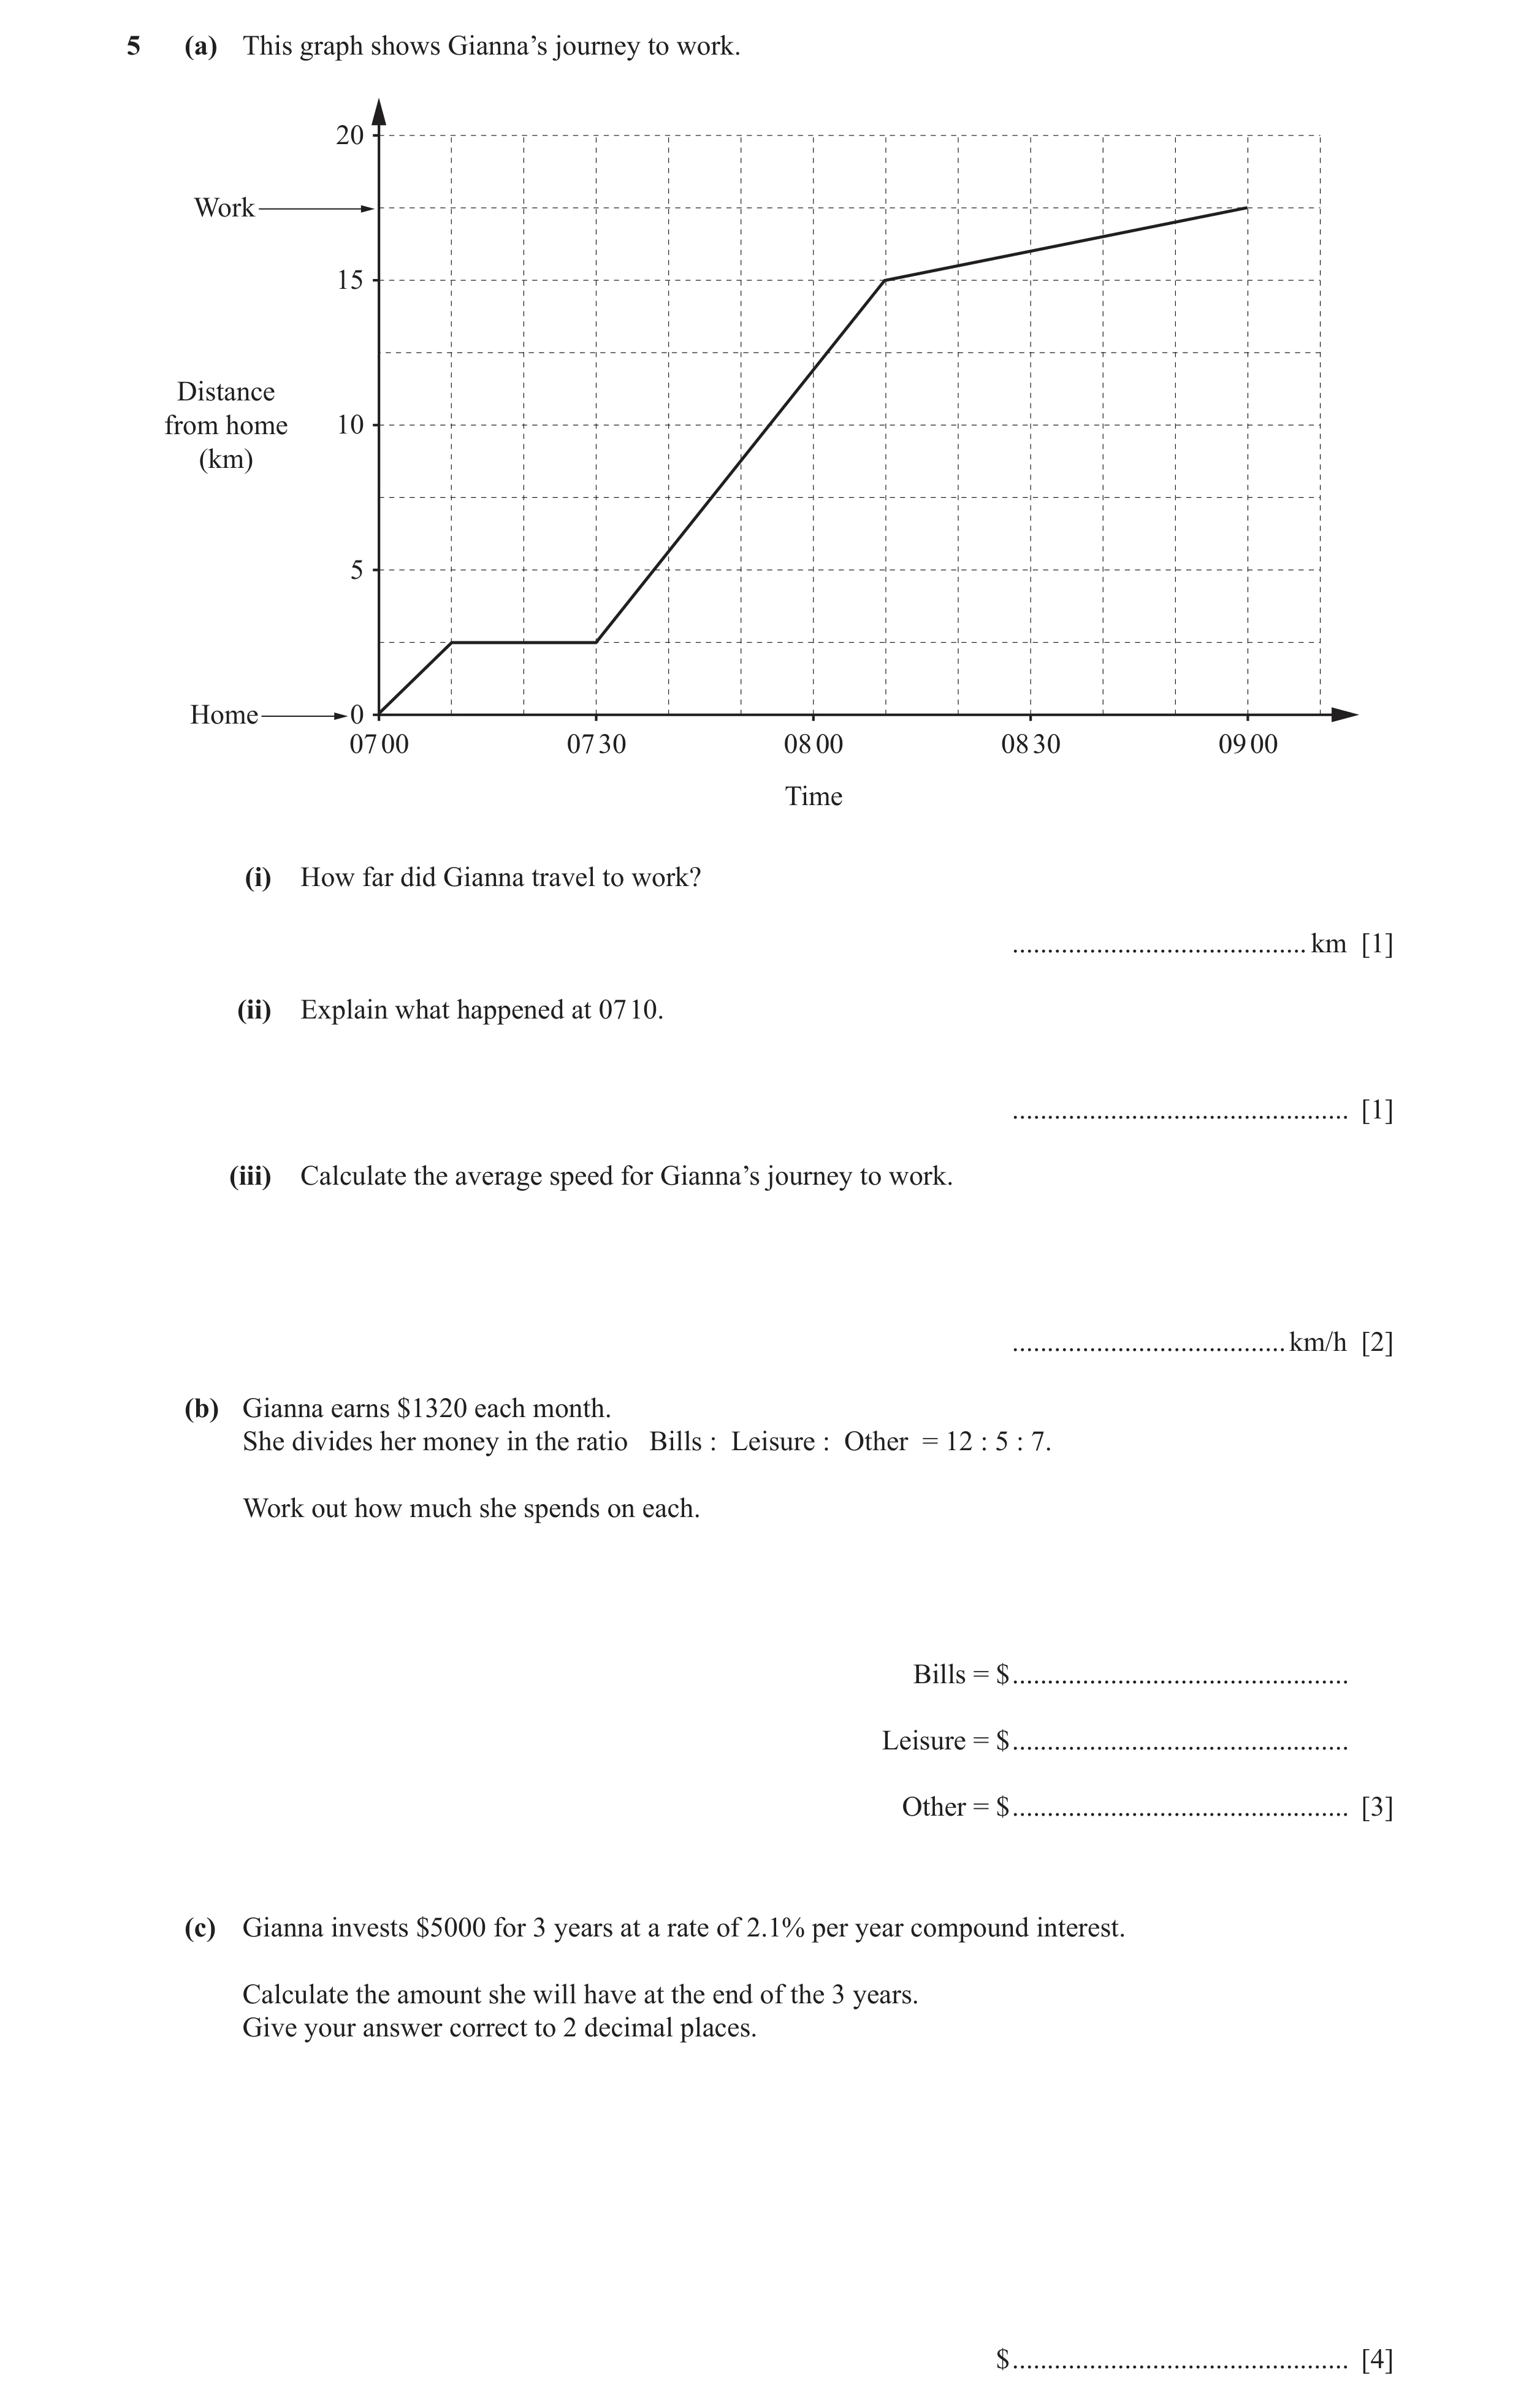
5 (a) This graph shows Gianna’s journey to work. 20 Work 15 Distance from home 10 (km) 5 Home 0 07 00 07 30 08 00 08 30 09 00 Time (i) How far did Gianna travel to work? … km [1] (ii) Explain what happened at 07 10. … [1] (iii) Calculate the average speed for Gianna’s journey to work. … km/h [2] (b) Gianna earns $1320 each month. She divides her money in the ratio Bills : Leisure : Other = 12 : 5 : 7. Work out how much she spends on each. Bills = $ … Leisure = $ … Other = $ … [3] (c) Gianna invests $5000 for 3 years at a rate of 2.1% per year compound interest. Calculate the amount she will have at the end of the 3 years. Give your answer correct to 2 decimal places. $ … [4]
11 marks
Mark scheme: 5 (a) (i) 17.5 1 (ii) She stopped oe 1 (iii) 8.75 2 M1FT for their (a)(i) ÷ 2 soi (b) 660 3 M2 for one correct value in correct place 275 1320 385 or × k where k is 5, 12 or 7 ( 5 + 12 + 7 ) or better in working 1320 or M1 for or better ( 5 + 12 + 7 ) If zero scored, SC1 for all correct answers in incorrect order (c) 5321.66 cao 4 M2 for 5000 × 1.0213 oe or M1 for 5000 × 1.021 × 1.021 oe A1 for 5321.661….. B1 indep for their answer corrected to 2 d.p. if their unrounded answer is shown to at least 3 d.p.
This question in 0580/31 Oct/Nov 2016
Q9 · Some children chose their favourite ice-cream flavour from chocolate, vanilla, strawberry… 0580/33 May/June 2017
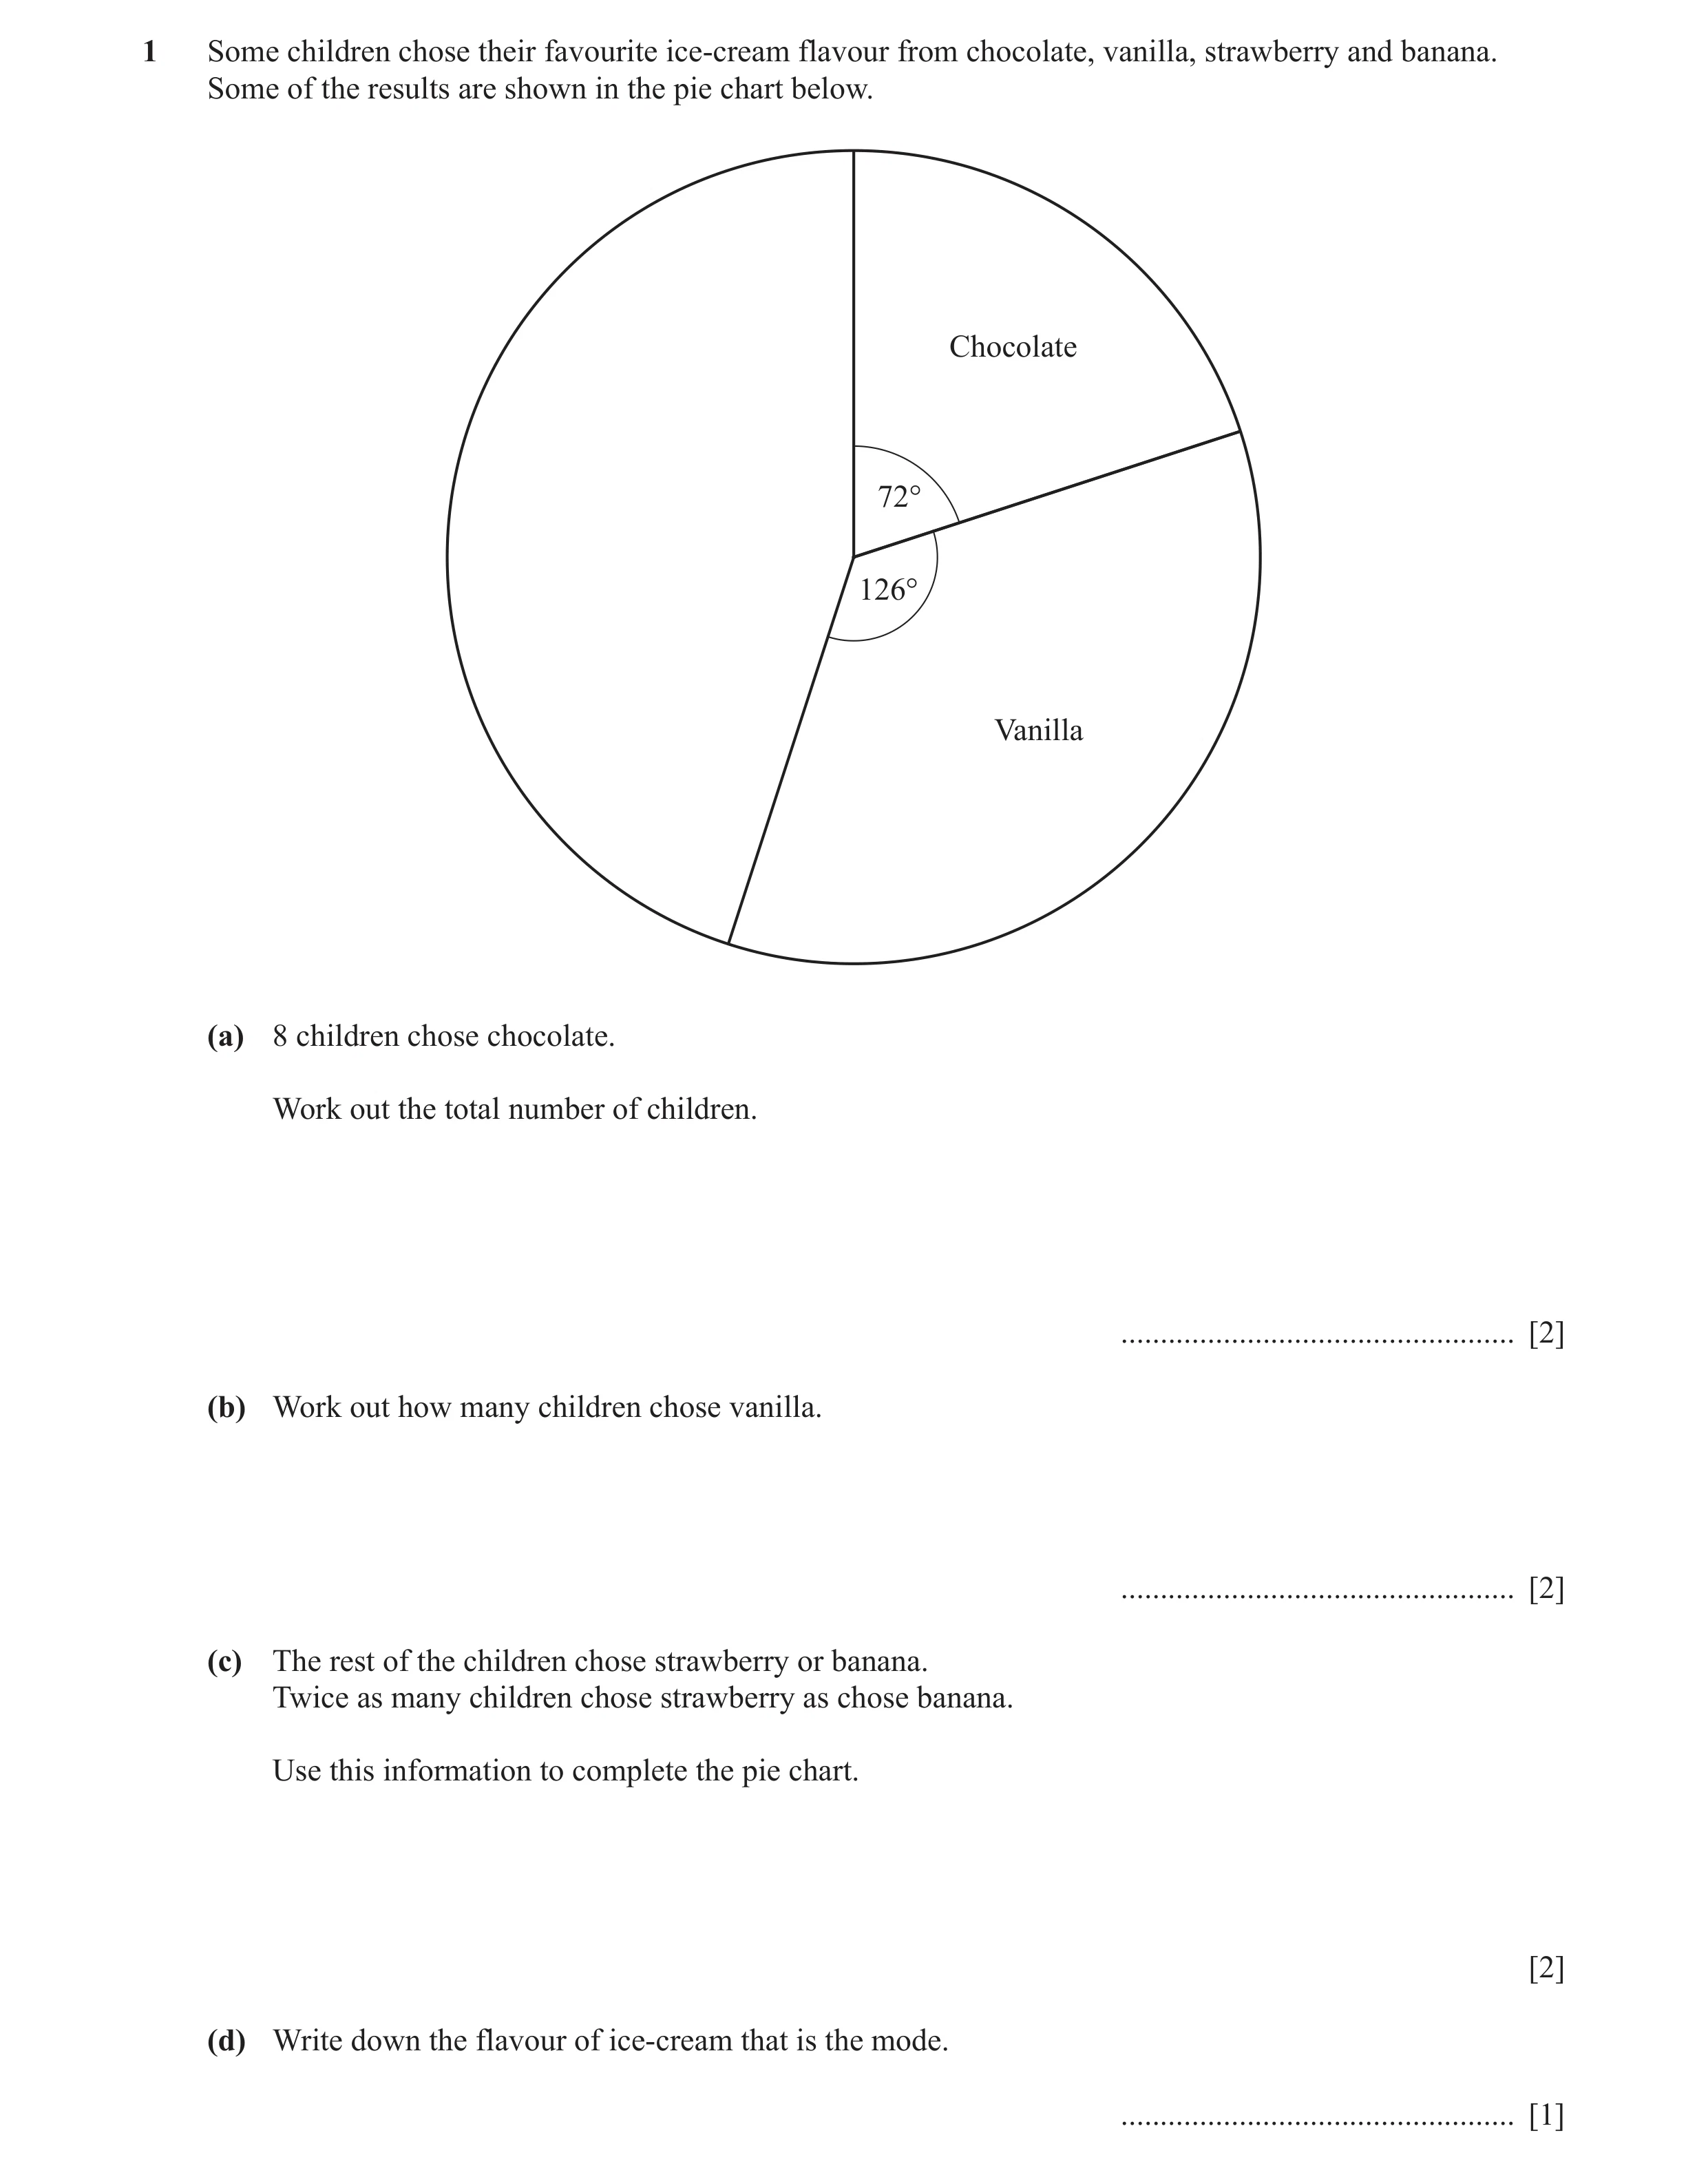
1 Some children chose their favourite ice-cream flavour from chocolate, vanilla, strawberry and banana. Some of the results are shown in the pie chart below. Chocolate 72° 126° Vanilla (a) 8 children chose chocolate. Work out the total number of children. … [2] (b) Work out how many children chose vanilla. … [2] (c) The rest of the children chose strawberry or banana. Twice as many children chose strawberry as chose banana. Use this information to complete the pie chart. [2] (d) Write down the flavour of ice-cream that is the mode. … [1]
7 marks
Mark scheme: Question Answer Marks Part marks 1(a) 40 2 360 M1 for × 8 oe 72 1(b) 14 2 126 126 M1 for × 8 oe or ×their 40 oe 72 360 1(c) Correct ruled line drawn 2 162 162 M1 for [ = 54 ] or × 2 [ = 108 ] 3 3 72 or (their 40 −−8 their 14) ÷ 3 × [ × 2 ] 8 1(d) Vanilla 1FT FT from their pie chart
This question in 0580/33 May/June 2017
Q10 · Write down the temperature shown by each arrow 0580/31 Oct/Nov 2017
1 (a) Write down the temperature shown by each arrow. (i) Temperature (°C) 0 10 20 … °C [1] (ii) Temperature (°C) –20 0 20 … °C [1] (b) The table shows the daily temperature in Hayville for one week in January. Day Sunday Monday Tuesday Wednesday Thursday Friday Saturday Temperature –4 2 –1 0 1 –6 –2 (°C) (i) Which was the coldest day? … [1] (ii) Find the difference between the temperature on Sunday and the temperature on Monday. … °C [1] (c) In Grassington, the temperature recorded at 07 35 was −3 °C. (i) The temperature was recorded again 8 12 hours later. At what time was this temperature recorded? … [1] (ii) By this time, the temperature had risen by 7 °C. Find this temperature. … °C [1]
6 marks
Mark scheme: Question Answer Marks Partial marks 1(a)(i) 16 1 1(a)(ii) –15 1 1(b)(i) Friday 1 1(b)(ii) 6 1 1(c)(i) 16 05 or 4 05 pm 1 1(c)(ii) 4 1
This question in 0580/31 Oct/Nov 2017
Q11 · 80 students each record the name of their mathematics teacher 0580/32 May/June 2019
2 80 students each record the name of their mathematics teacher. The number of these students taught by Mr House and by Miss Patel are shown in the bar chart. 24 20 16 Frequency 12 8 4 0 Mr Mrs Mr Miss Mr Jones Brown House Patel Smith (a) How many more students are taught by Miss Patel than by Mr House? … [1] (b) 15 students are taught by Mr Smith. Twice as many students are taught by Mrs Brown than by Mr Jones. Use this information to complete the bar chart. [4] (c) Write down the mode. … [1] (d) One of these students is chosen at random. Work out the probability that this student (i) is taught by Mr House, … [1] (ii) is not taught by either Mr House or Miss Patel. … [2] (e) This information is also to be shown in a pie chart. Work out the sector angle for Miss Patel. … [2]
11 marks
Mark scheme: 2(a) 4 1 2(b) 3 correct bars drawn on bar chart 4 B1 for Mr Smith bar drawn height 15 M2 for their ( 80 − (18 + 14 + 15 ) ) ÷ 3 [× 2 ] or M1 for 80 − (18 + 14 + 15 ) oe 2(c) Mrs Brown 1 FT their bar chart provided 5 bars drawn 2(d)(i) 14 1 oe 80 2(d)(ii) 48 2 FT their bar chart oe 80 18 + 14 M1 for 80 − (18 + 14 ) or oe 80 OR M1FT for adding heights of bars for (Mr Jones, Mrs Brown and Mr Smith) 2(e) 81 2 360 18 M1 for [× 18 ] or [× 360 ] 80 80
This question in 0580/32 May/June 2019
Q12 · 20 students choose their favourite science subject 0580/32 Feb/March 2021
1 20 students choose their favourite science subject. The results are shown in the bar chart. 12 10 8 Frequency 6 4 2 0 Biology Chemistry Physics (a) Work out how many more students choose biology than physics. … [1] (b) Write down the fraction of students whose favourite science subject is chemistry. … [1] (c) One of the 20 students is picked at random. Write down the probability that this student did not choose biology. … [2] (d) Only one of the averages, median, mode and mean can be found for these results. (i) Write down the average that can be found. … [1] (ii) Find this average for these results. … [1] (iii) Explain why the range cannot be found. … [1] (e) The results are to be shown in a pie chart. (i) Complete the table. Favourite Pie chart Frequency science sector angle Biology Chemistry Physics [3] (ii) Complete the pie chart. [2]
12 marks
Mark scheme: Question Answer Marks Partial Marks 1(a) 5 1 1(b) 3 1 cao 20 1(c) 9 2 11 oe M1 for 1 − or 20 − 11 or 3 + 6 oe 20 20 1(d)(i) Mode 1 1(d)(ii) Biology 1 1(d)(iii) Correct reason 1 1(e)(i) 11 198 3 B2 for 2 correct angles 3 54 OR 6 108 B1 for 11, 3, 6 k M1 for × 360 seen, 20 k =1,11,3,6 or one of their frequencies 1(e)(ii) Correct pie chart drawn 2 B1FT for one correct sector drawn, provided sum of their 3 angles is 360
This question in 0580/32 Feb/March 2021
Q13 · Mei and Jian each make a four-faced dice as shown in the diagram 0580/33 May/June 2021
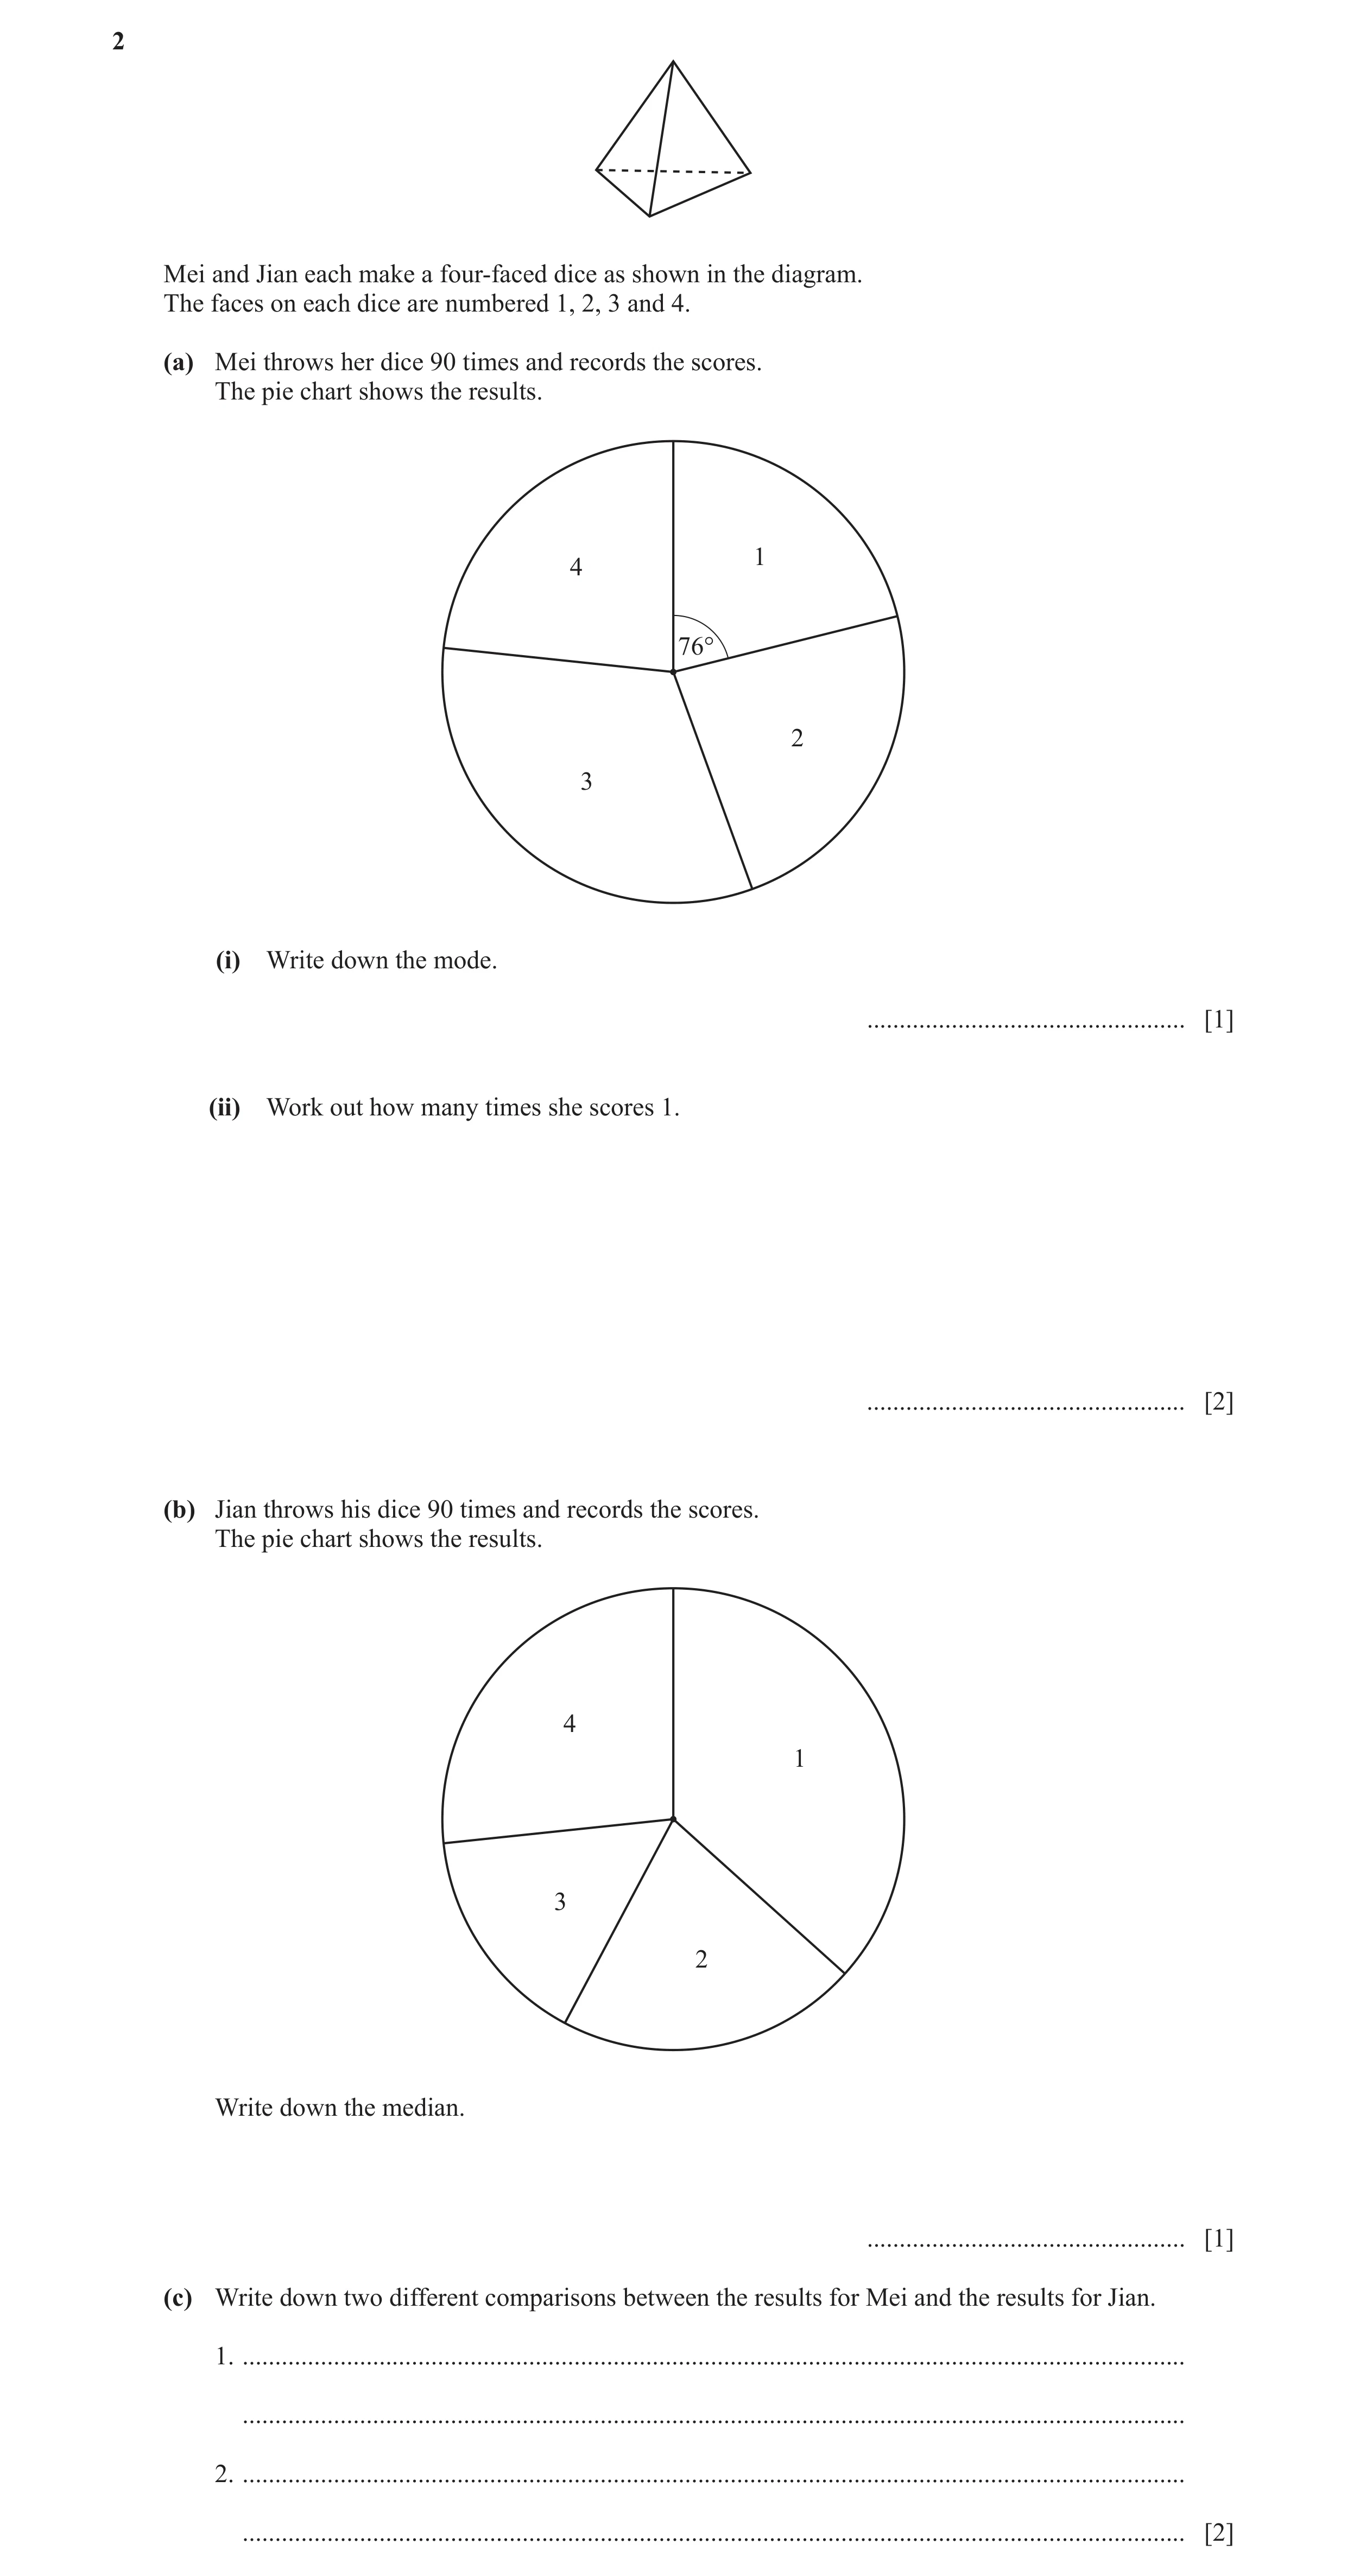
2 Mei and Jian each make a four-faced dice as shown in the diagram. The faces on each dice are numbered 1, 2, 3 and 4. (a) Mei throws her dice 90 times and records the scores. The pie chart shows the results. 1 4 76° 2 3 (i) Write down the mode. … [1] (ii) Work out how many times she scores 1. … [2] (b) Jian throws his dice 90 times and records the scores. The pie chart shows the results. 4 1 3 2 Write down the median. … [1] (c) Write down two different comparisons between the results for Mei and the results for Jian. 1. … … 2. … … [2]
6 marks
Mark scheme: 2(a)(i) 3 1 2(a)(ii) 19 2 M1 for 36090 × 76 oe 2(b) 2 1 2(c) e.g. 2 B1 for each correct different comparison Mei has median of 3 and Jian has median of 2 or Mei has mode of 3 and Jian has mode of 1 e.g. Mei has larger 2 and 3 sectors than Jian or Jian has larger 1 and 4 sectors than Mei
This question in 0580/33 May/June 2021
Q14 · 24 people own a car 0580/32 Oct/Nov 2022
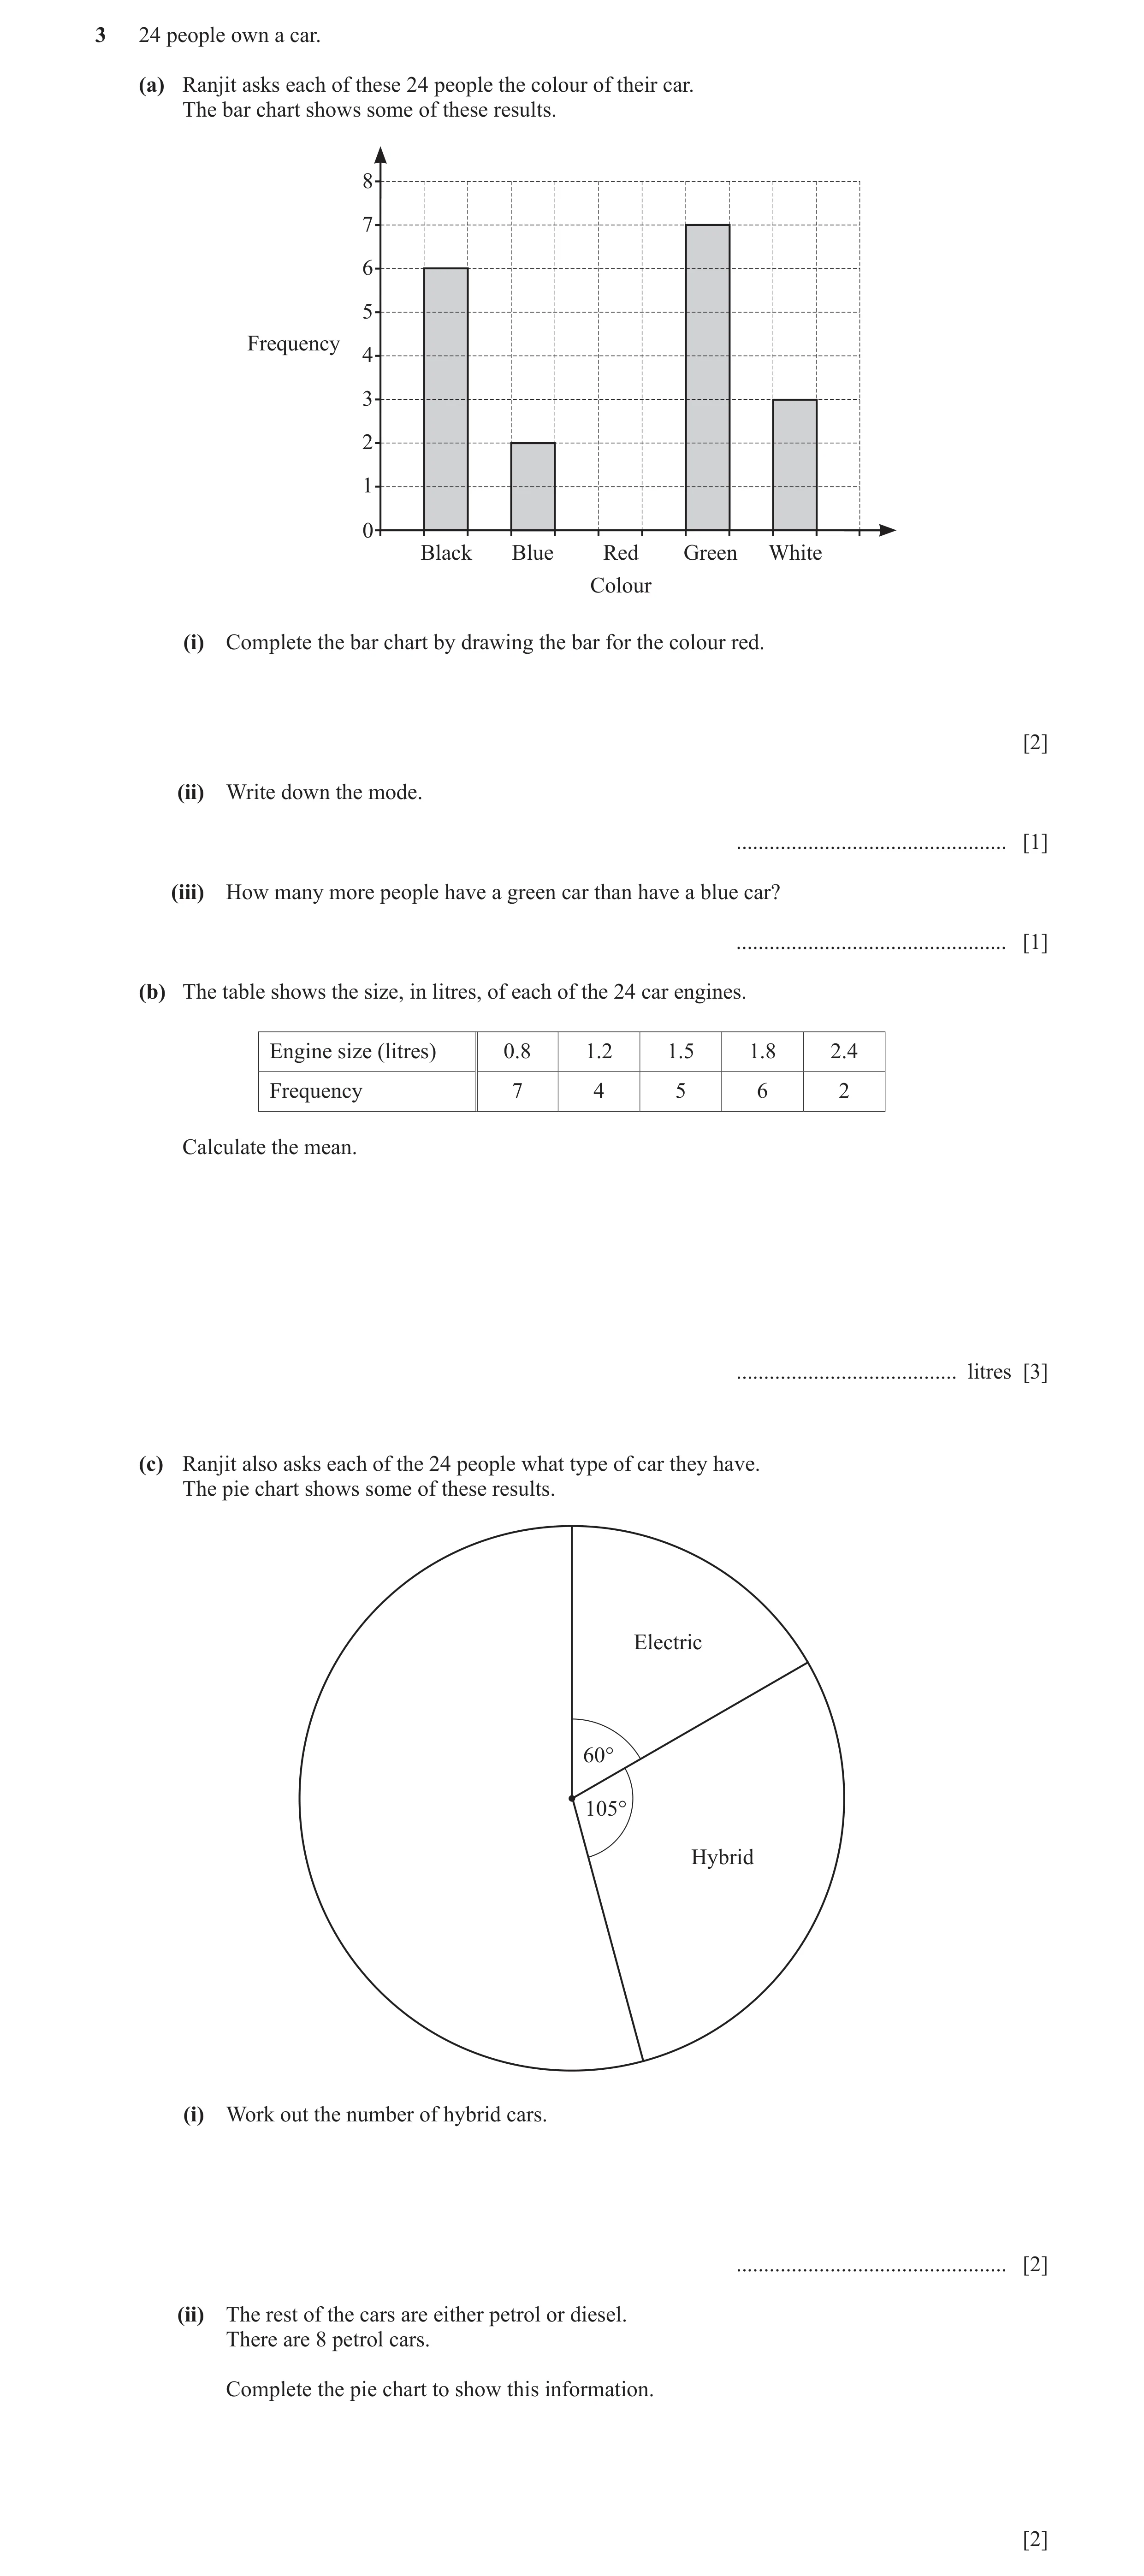
3 24 people own a car. (a) Ranjit asks each of these 24 people the colour of their car. The bar chart shows some of these results. 8 7 6 5 Frequency 4 3 2 1 0 Black Blue Red Green White Colour (i) Complete the bar chart by drawing the bar for the colour red. [2] (ii) Write down the mode. … [1] (iii) How many more people have a green car than have a blue car? … [1] (b) The table shows the size, in litres, of each of the 24 car engines. Engine size (litres) 0.8 1.2 1.5 1.8 2.4 Frequency 7 4 5 6 2 Calculate the mean. … litres [3] (c) Ranjit also asks each of the 24 people what type of car they have. The pie chart shows some of these results. Electric 60° 105° Hybrid (i) Work out the number of hybrid cars. … [2] (ii) The rest of the cars are either petrol or diesel. There are 8 petrol cars. Complete the pie chart to show this information. [2]
11 marks
Mark scheme: 3(a)(i) Bar at 6 with correct width 2 M1 for 24 – 6 – 2 – 7 – 3 oe 3(a)(ii) Green 1 FT their bar chart 3(a)(iii) 5 1 3(b) 1.4[0] or 1.395 to 1.396 3 M1 for 0.8×7 + 1.2×4 + 1.5×5 + 1.8×6 + 2.4×2 oe M1dep for their 33.5 ÷ 24 3(c)(i) 7 2 105 M1 for 24 oe 360 3(c)(ii) Correct sector with line at 120° 2 B1 for 120 soi
This question in 0580/32 Oct/Nov 2022
Q15 · The bar chart shows the number of people who visit a beach in each month in one year 0580/33 Oct/Nov 2022
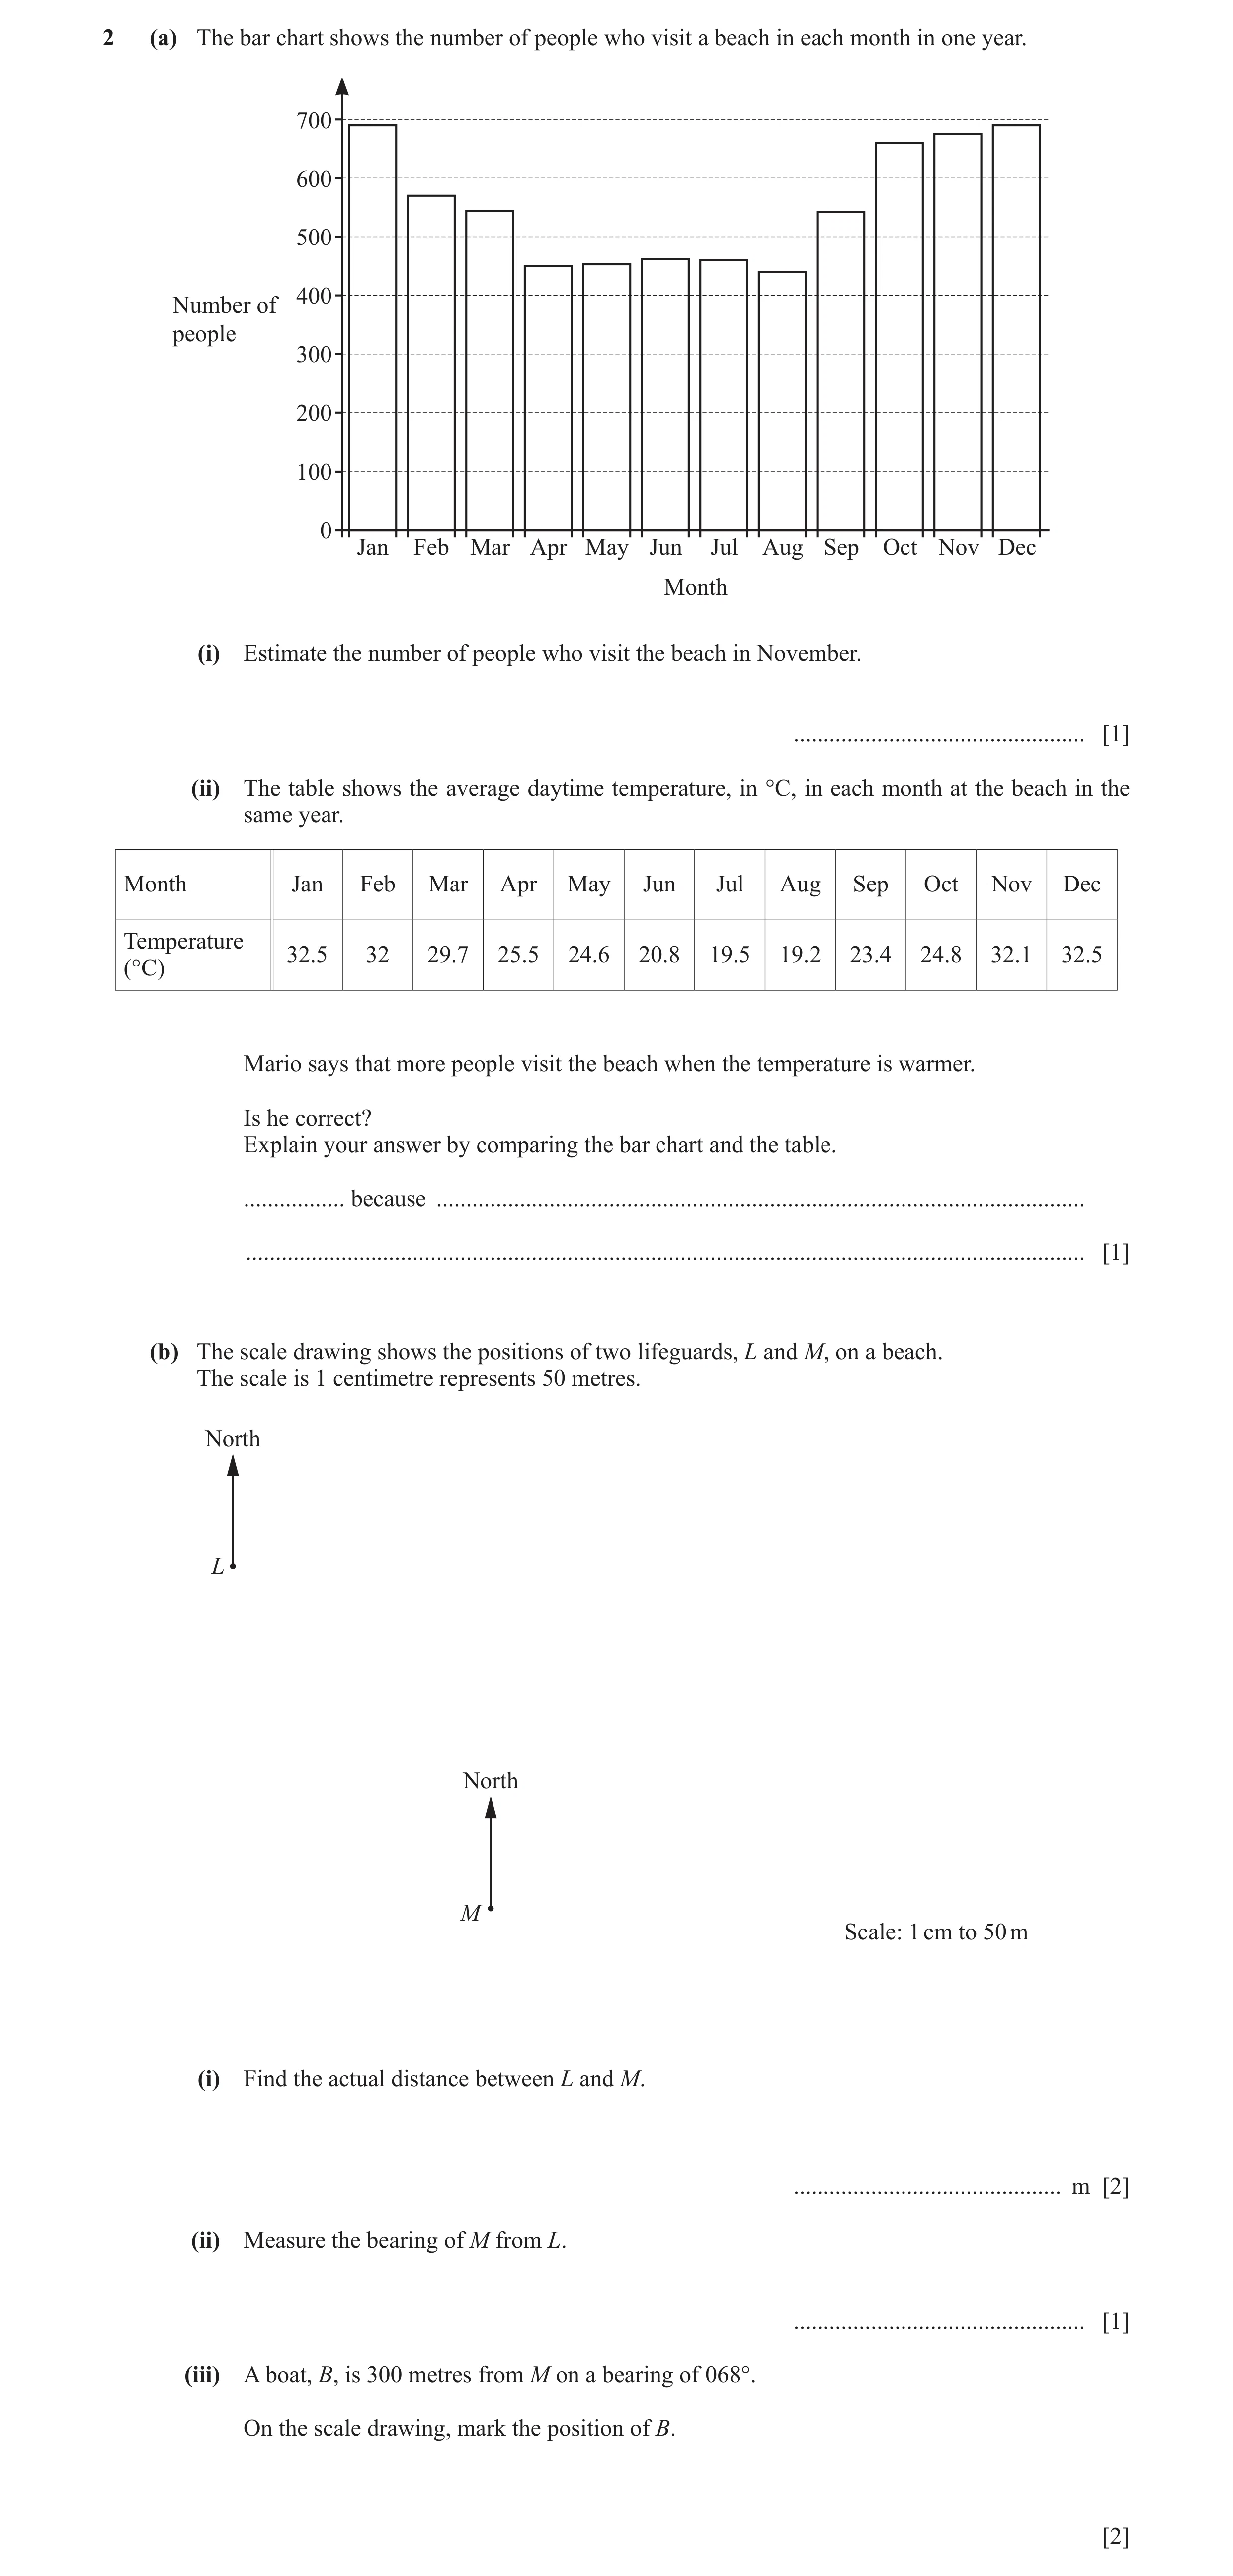
2 (a) The bar chart shows the number of people who visit a beach in each month in one year. 700 600 500 400 Number of people 300 200 100 0 Jan Feb Mar Apr May Jun Jul Aug Sep Oct Nov Dec Month (i) Estimate the number of people who visit the beach in November. … [1] (ii) The table shows the average daytime temperature, in °C, in each month at the beach in the same year. Month Jan Feb Mar Apr May Jun Jul Aug Sep Oct Nov Dec Temperature 32.5 32 29.7 25.5 24.6 20.8 19.5 19.2 23.4 24.8 32.1 32.5 (°C) Mario says that more people visit the beach when the temperature is warmer. Is he correct? Explain your answer by comparing the bar chart and the table. … because … … [1] (b) The scale drawing shows the positions of two lifeguards, L and M, on a beach. The scale is 1 centimetre represents 50 metres. North L North M Scale: 1 cm to 50 m (i) Find the actual distance between L and M. … m [2] (ii) Measure the bearing of M from L. … [1] (iii) A boat, B, is 300 metres from M on a bearing of 068°. On the scale drawing, mark the position of B. [2]
7 marks
Mark scheme: 2(a)(i) Any integer between 660 and 690 1 2(a)(ii) Yes, tallest bars [[Nov], Dec and Jan] 1 occur when temperature is at its highest oe 2(b)(i) 365 2 B1 for 7.3 or M1 for their 7.3 50 2(b)(ii) 143 1 2(b)(iii) B correctly placed 2 M1 for B on bearing of 068 from M or for B 6 cm from M
This question in 0580/33 Oct/Nov 2022
Q16 · Anton records the number of pets owned by each of 50 families 0580/32 May/June 2024
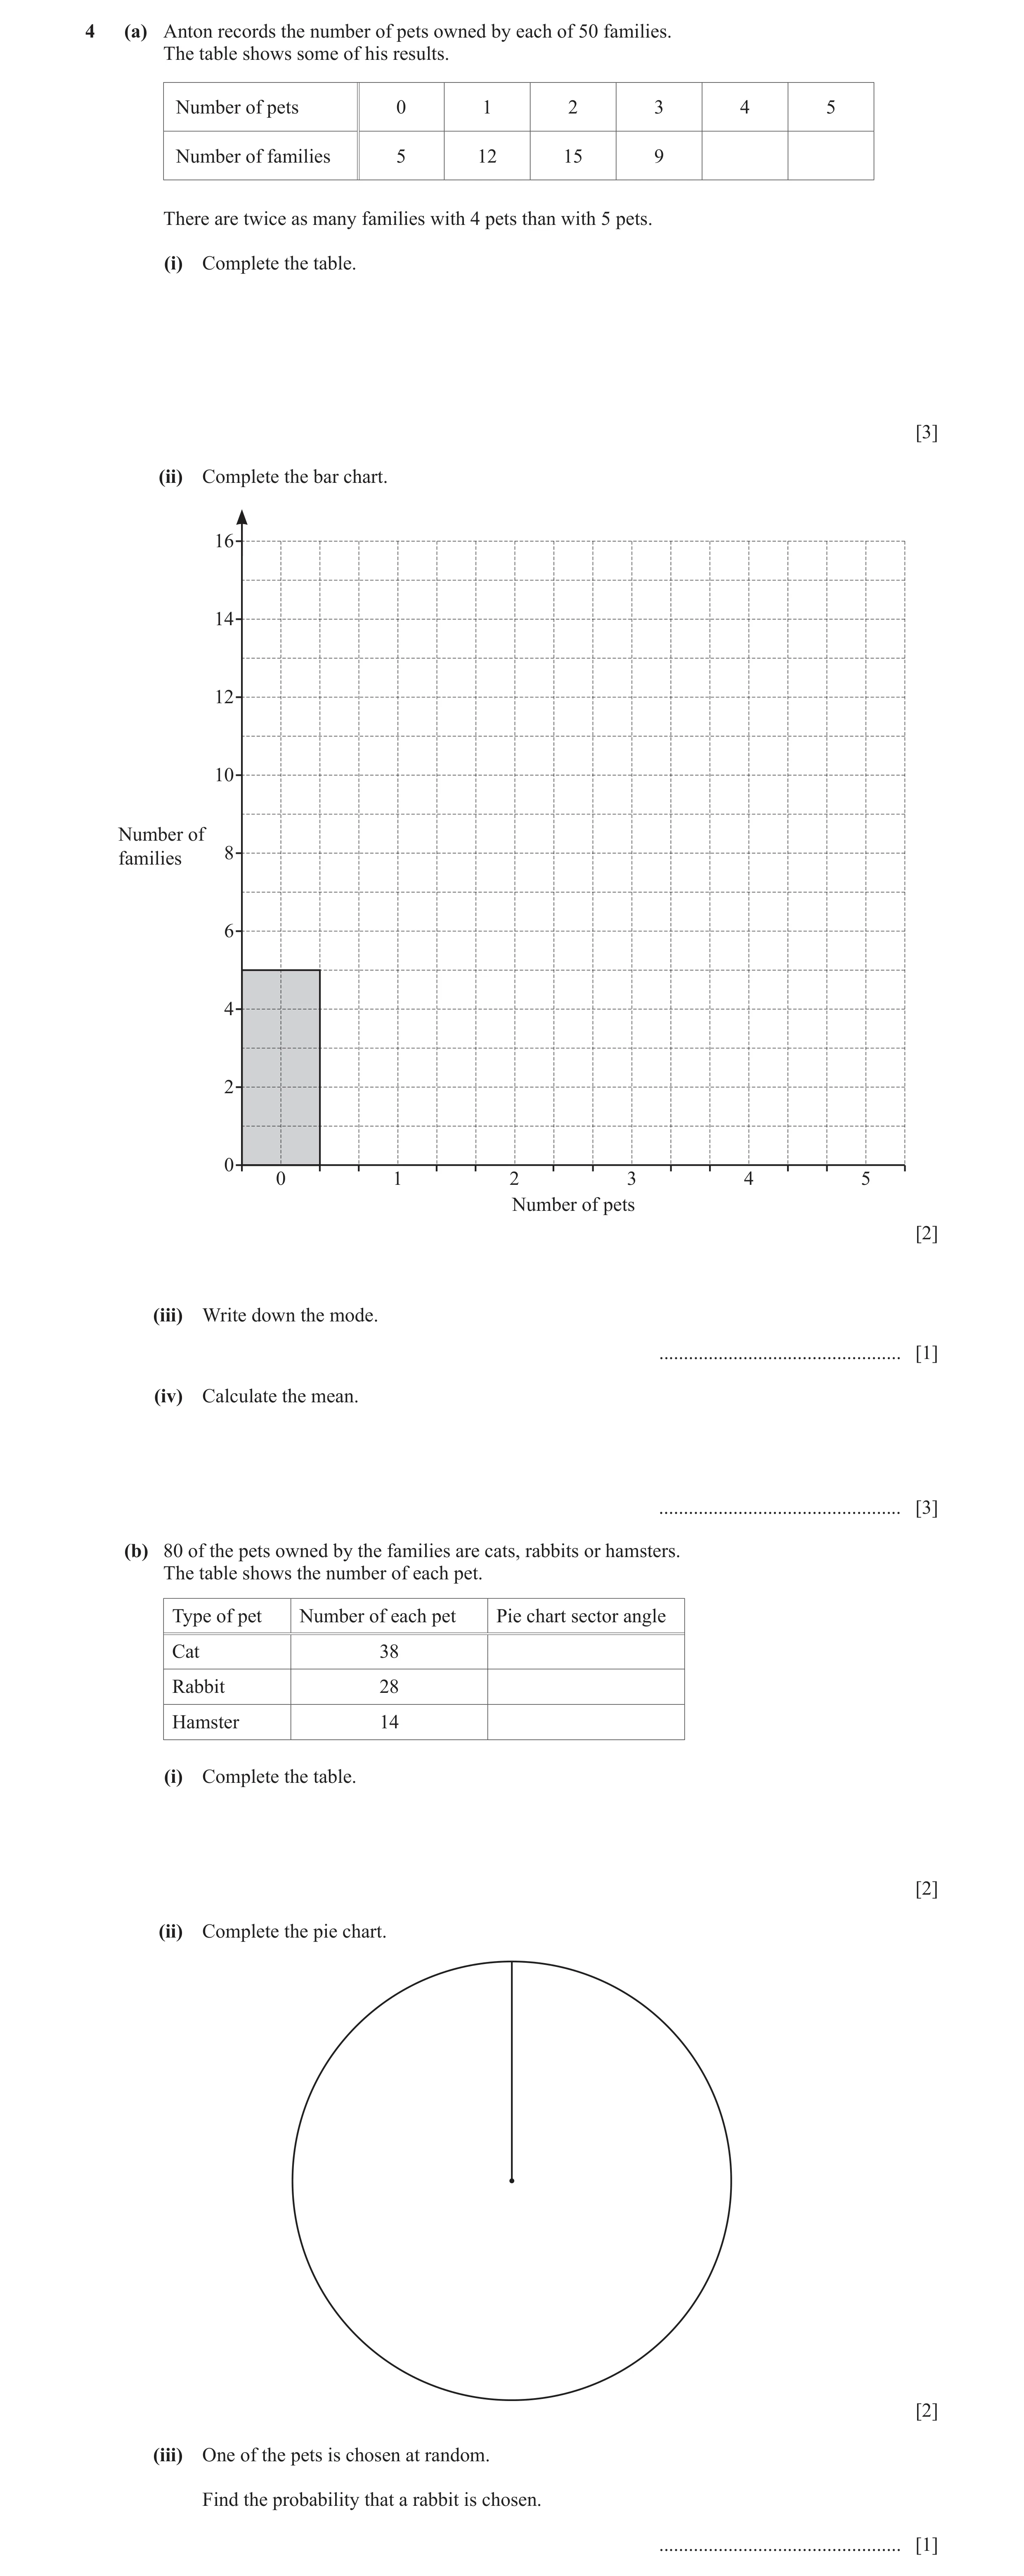
4 (a) Anton records the number of pets owned by each of 50 families. The table shows some of his results. Number of pets 0 1 2 3 4 5 Number of families 5 12 15 9 There are twice as many families with 4 pets than with 5 pets. (i) Complete the table. [3] (ii) Complete the bar chart. 16 14 12 10 Number of 8 families 6 4 2 0 0 1 2 3 4 5 Number of pets [2] (iii) Write down the mode. … [1] (iv) Calculate the mean. … [3] (b) 80 of the pets owned by the families are cats, rabbits or hamsters. The table shows the number of each pet. Type of pet Number of each pet Pie chart sector angle Cat 38 Rabbit 28 Hamster 14 (i) Complete the table. [2] (ii) Complete the pie chart. [2] (iii) One of the pets is chosen at random. Find the probability that a rabbit is chosen. … [1]
14 marks
Mark scheme: 4(a)(i) 6 3 3 M2 for (50 – (5 + 12 + 15 + 9)) ÷ 3 or M1 for 50 – (5 + 12 + 15 + 9) 4(a)(ii) Correct bar chart 2 FT their table entry for 4 and 5 pets B1 for 3 or 4 correct heights 4(a)(iii) 2 1 4(a)(iv) 2.16 3 M1 for [0 × 5] + (1 × 12) + (2 × 15) + (3 × 9) + (4 × their6) + (5 × their3) M1 dep for (their∑fx) ÷ 50 4(b)(i) 171 2 B1 for one correct angle 126 360 or M1 for k where k = 1, 38, 28 or 63 80 14 4(b)(ii) Correct pie chart drawn 2 2FT provided the sum of their 3 angles is 360° B1FT for one correct sector drawn, or one correct FT sector drawn 4(b)(iii) 7 1 oe 20
This question in 0580/32 May/June 2024
Q17 · Jack does a survey about cycling 0580/31 Oct/Nov 2024
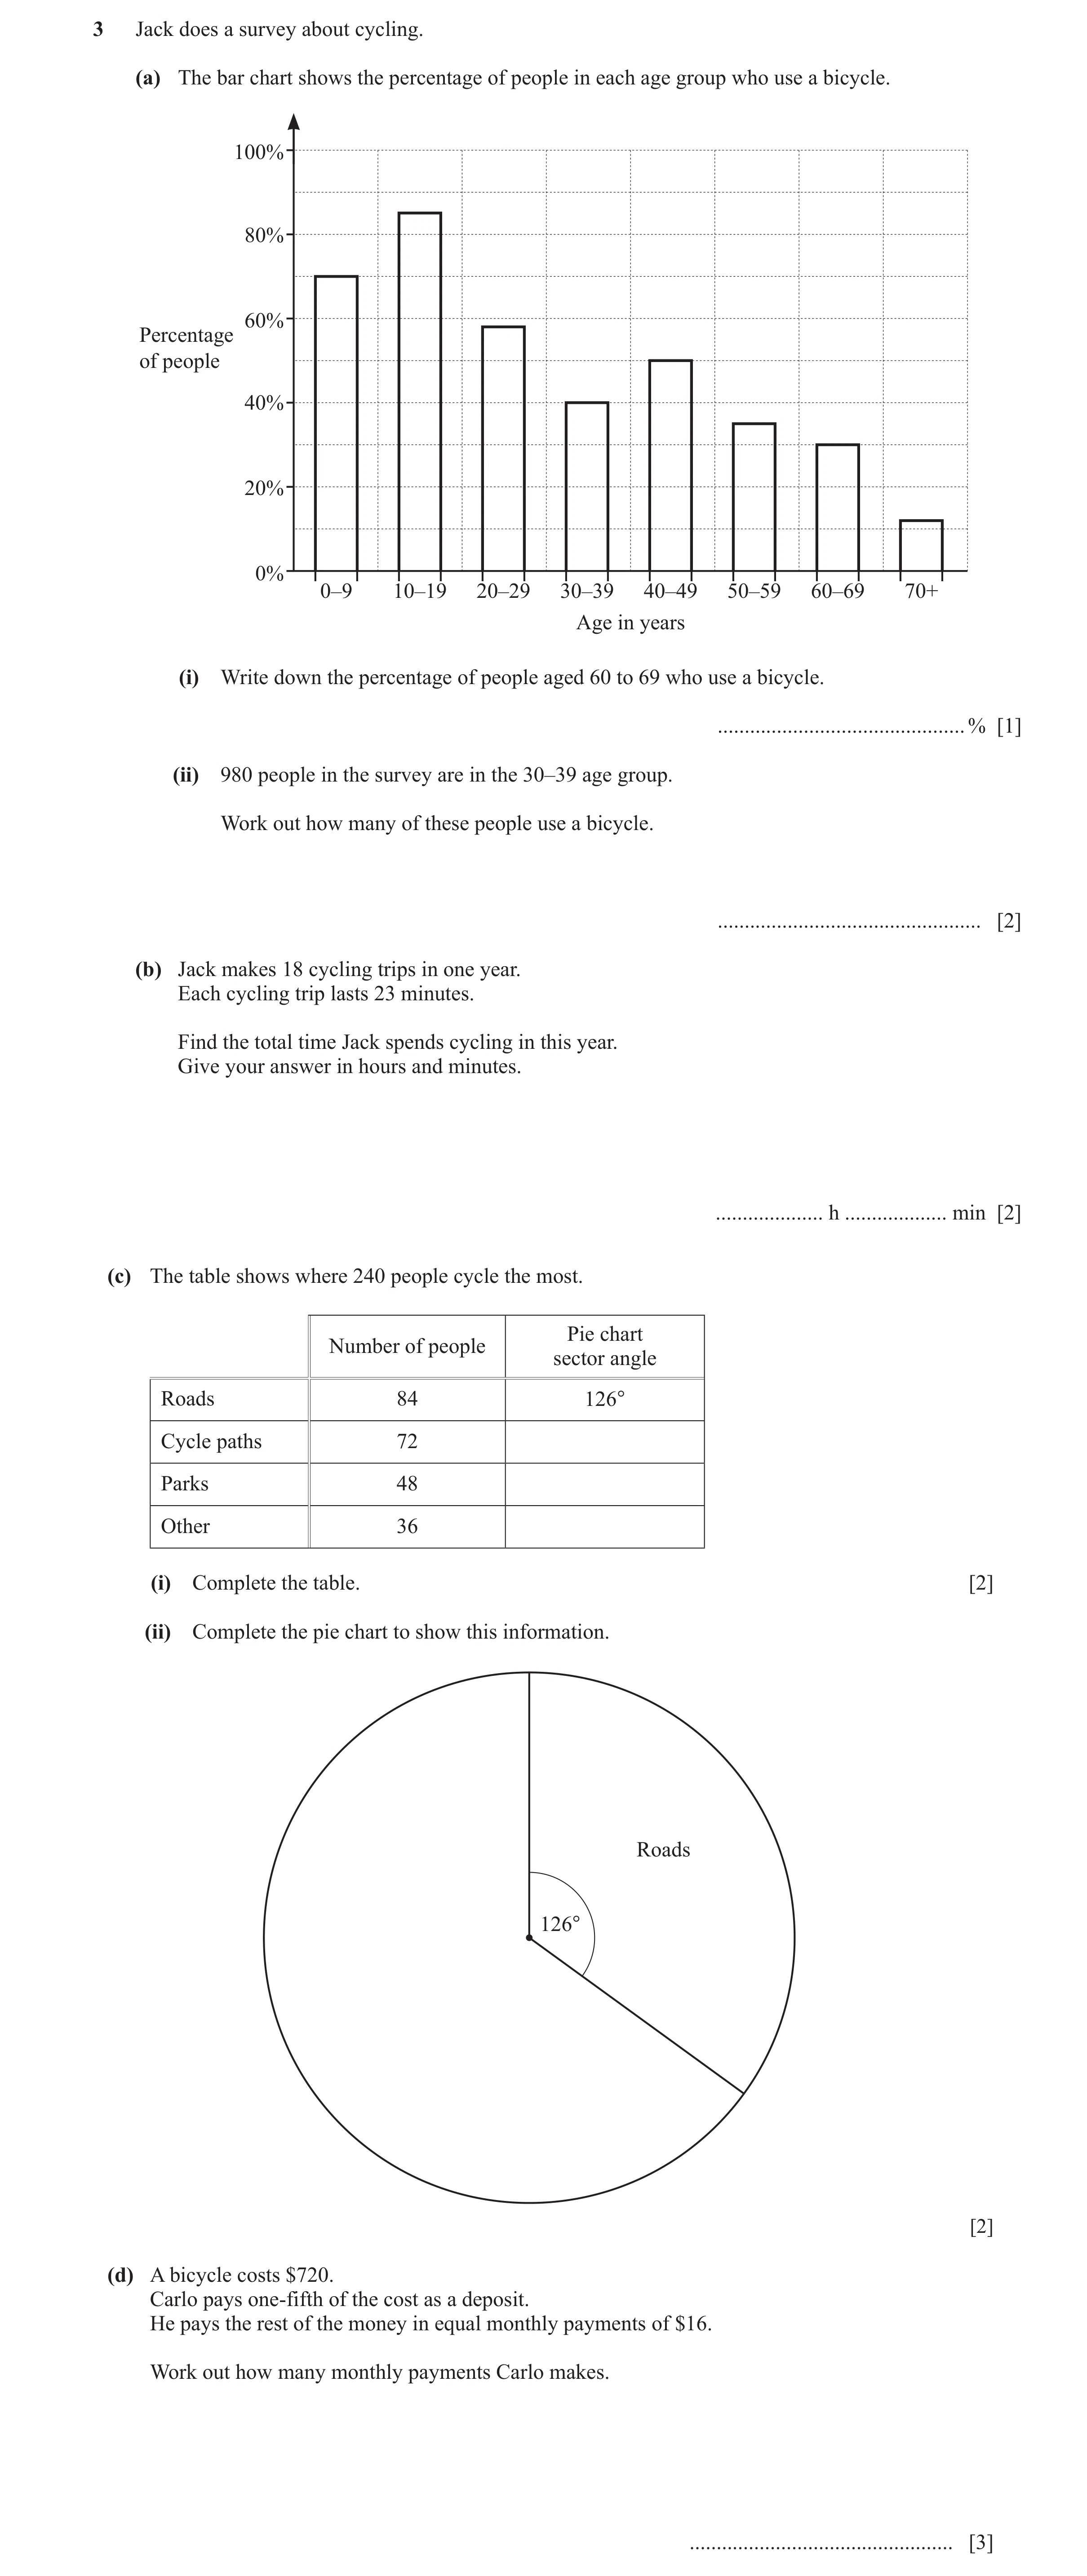
3 Jack does a survey about cycling. (a) The bar chart shows the percentage of people in each age group who use a bicycle. 100% 80% 60% Percentage of people 40% 20% 0% 0–9 10–19 20–29 30–39 40–49 50–59 60–69 70+ Age in years (i) Write down the percentage of people aged 60 to 69 who use a bicycle. … % [1] (ii) 980 people in the survey are in the 30–39 age group. Work out how many of these people use a bicycle. … [2] (b) Jack makes 18 cycling trips in one year. Each cycling trip lasts 23 minutes. Find the total time Jack spends cycling in this year. Give your answer in hours and minutes. … h … min [2] (c) The table shows where 240 people cycle the most. Pie chart Number of people sector angle Roads 84 126° Cycle paths 72 Parks 48 Other 36 (i) Complete the table. [2] (ii) Complete the pie chart to show this information. Roads 126° [2] (d) A bicycle costs $720. Carlo pays one-fifth of the cost as a deposit. He pays the rest of the money in equal monthly payments of $16. Work out how many monthly payments Carlo makes. … [3]
12 marks
Mark scheme: 3(a)(i) 30 1 3(a)(ii) 392 2 40 M1 for 980 oe 100 3(b) 6 hours 54 mins 2 M1 for 18 × 23 oe 3(c)(i) 108 2 B1 for 1 correct angle in correct place 72 or M1 for 126[k ] where k = 1, 72, 48 54 84 or 36 or for 360[m ] where m = 1, 72, 48 or 36 240 3(c)(ii) Correct pie chart 2 FT their table if angles add up to 360 B1FT for one sector drawn correctly 3(d) 36 nfww 3 4 M2 for 720 16 oe 5 4 720 or M1 for 720 or oe 5 5 or k ÷ 16 , k ≠ 720
This question in 0580/31 Oct/Nov 2024
Q18 · The table shows an ordered stem-and-leaf diagram 0580/32 Feb/March 2025
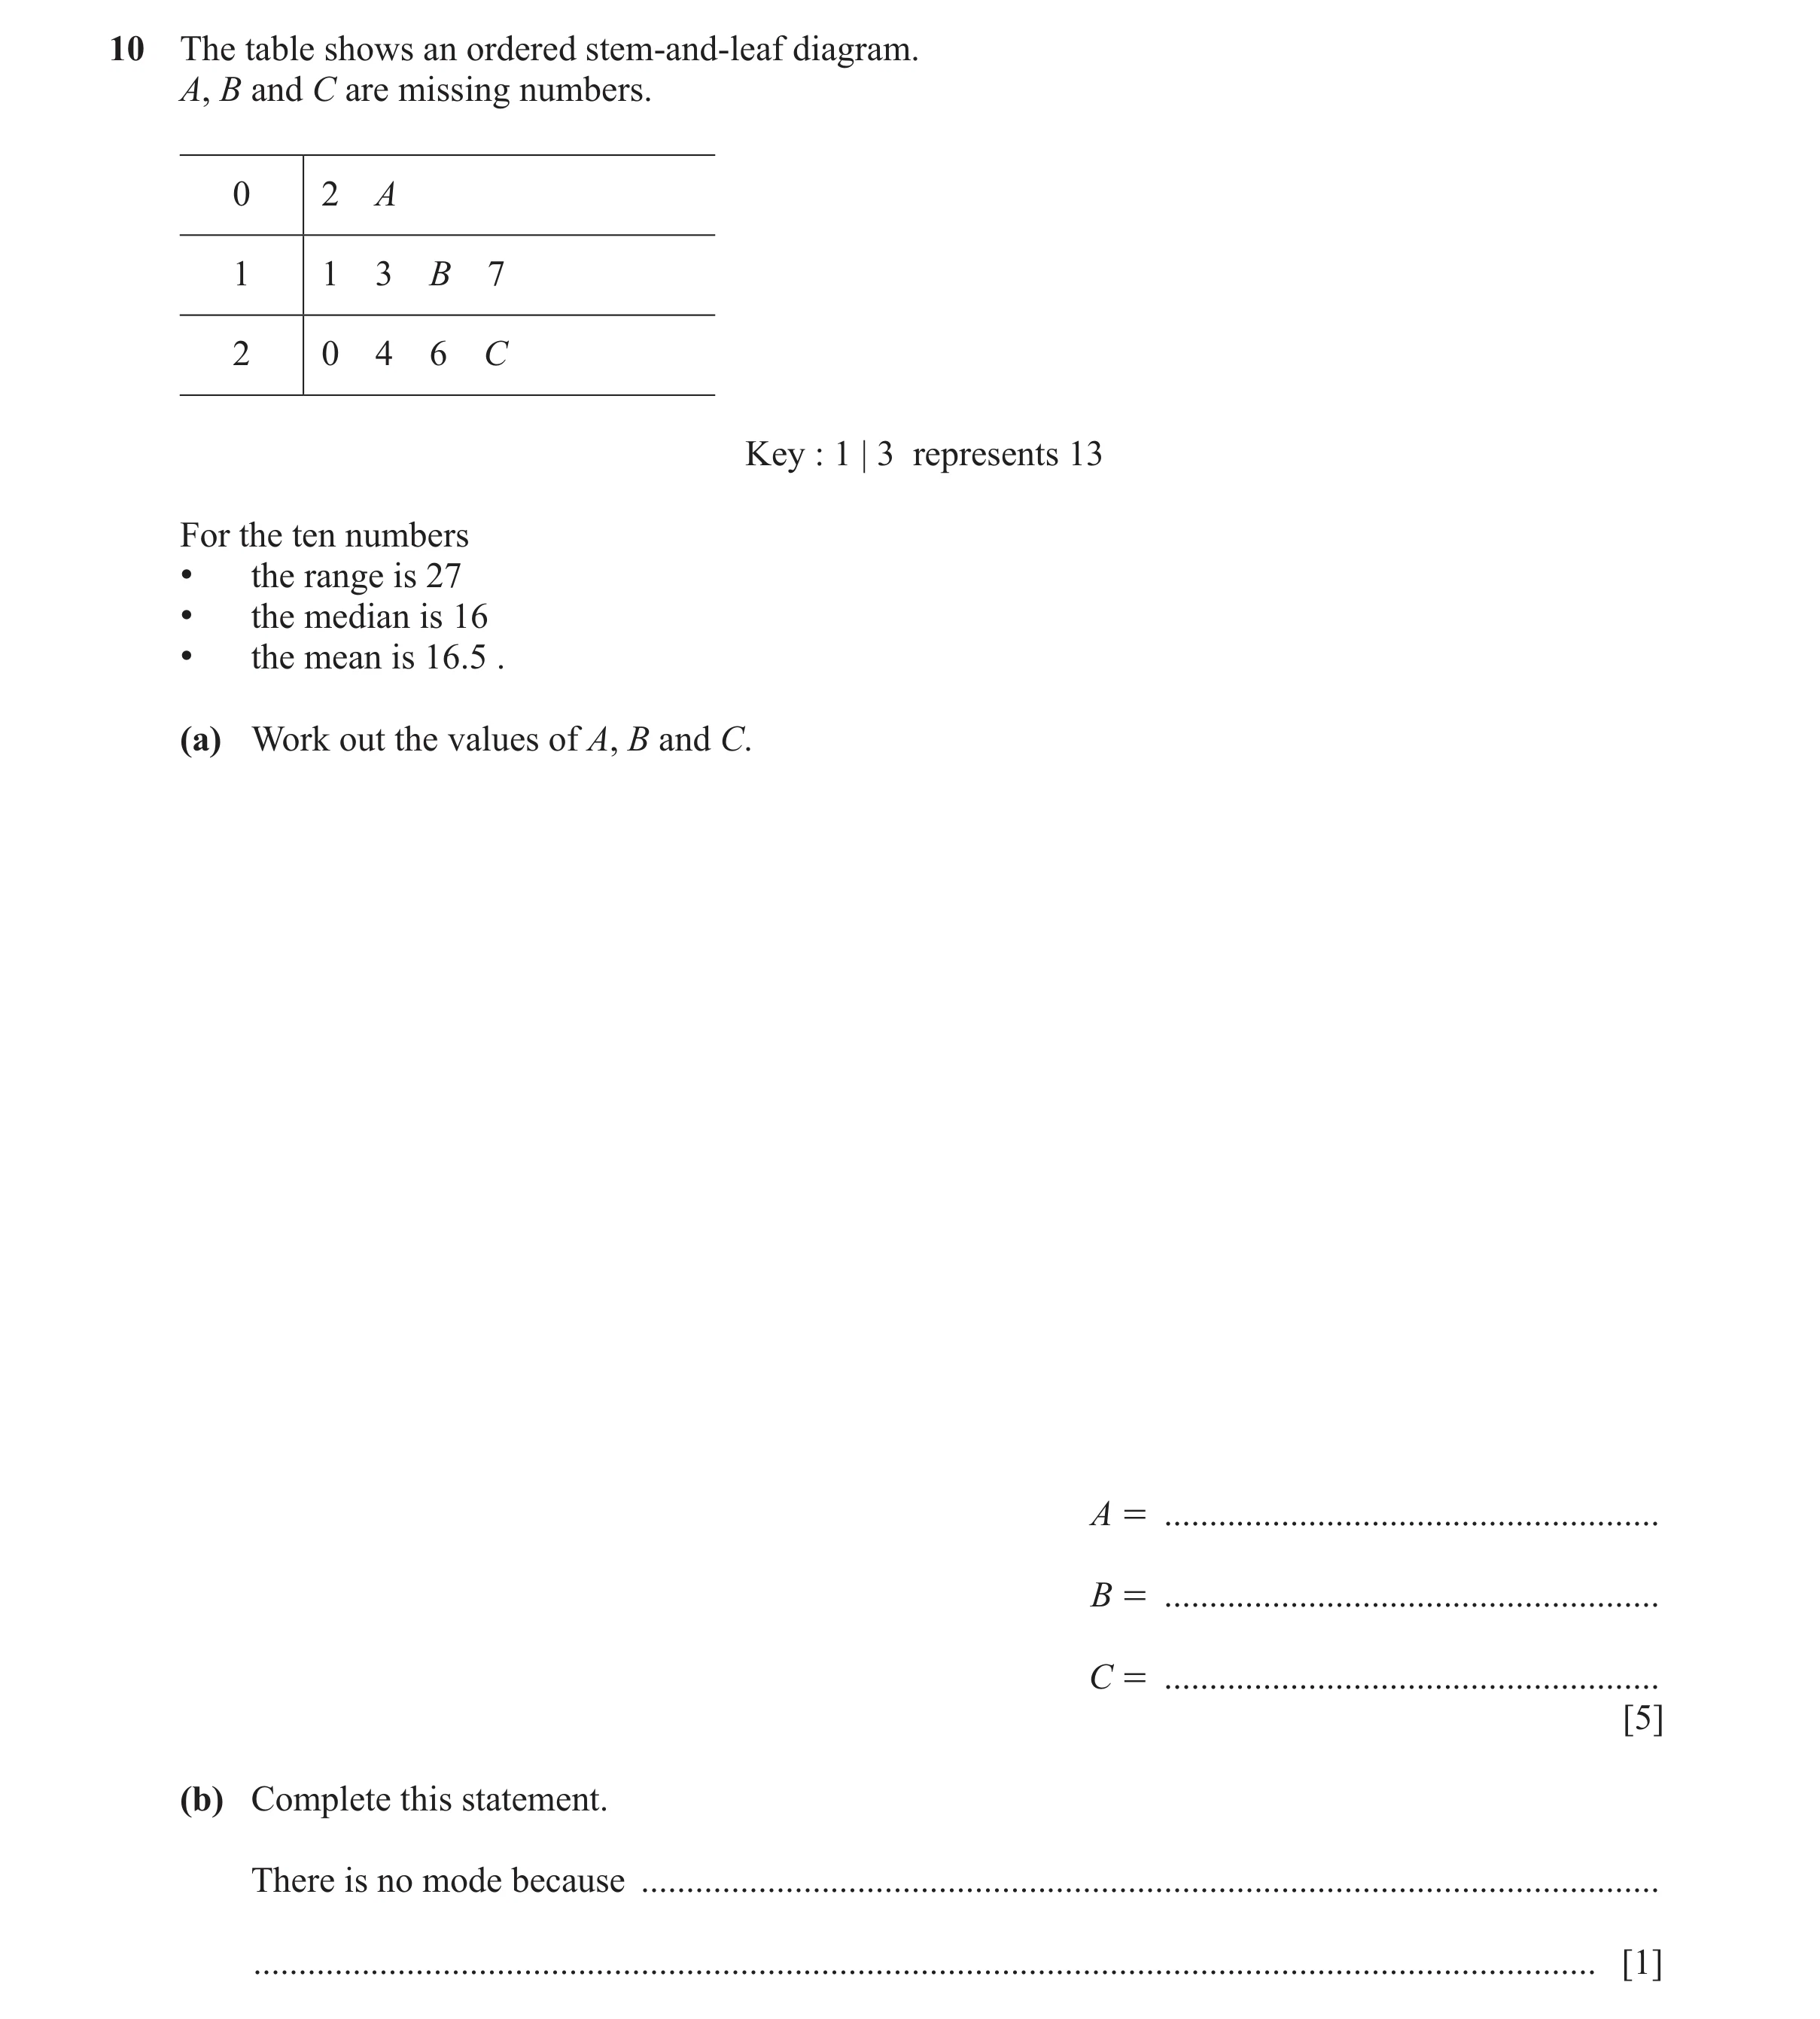
10 The table shows an ordered stem-and-leaf diagram. A, B and C are missing numbers. 0 2 A 1 1 3 B 7 2 0 4 6 C Key : 1 | 3 represents 13 For the ten numbers • the range is 27 • the median is 16 • the mean is 16.5 . (a) Work out the values of A, B and C. A = … B = … C = … [5] (b) Complete this statement. There is no mode because … … [1]
6 marks
Mark scheme: 10(a) 8 5 9 5 B1 for [B=] 5 B1 for [C=] 9 If B0,B0 scored SC1 for B = 15 and C = 29 B3 for 8 , 15 , 29 or 8 , 5 , 29 or 8 , 15 , 9 or M2 for ( 2 + A + 11 + 13 + (10 + theirB) + 17 + 20 + 24 + 26 ++ (20 + theirC))10[=16.5] oe soi or better or M1 for 16.5×10 oe or better 10(b) All the numbers are different oe 1
This question in 0580/32 Feb/March 2025
Q19 · The pictogram shows the number of goals scored by teams A, B and C 0580/31 May/June 2025
1 The pictogram shows the number of goals scored by teams A, B and C. Team Goals A B C D Key : represents 4 goals (a) Work out the number of goals scored by team B. … [1] (b) Teams A, B, C and D scored a total of 43 goals. Complete the pictogram. [3]
4 marks
Mark scheme: Question Answer Marks Partial Marks 1(a) 19 1 1(b) 5 correctly shown in diagram 3 B2 for 5 OR B1 for 38 OR M1 for 43 – (13 + 19 + 6) oe B1 for a correct diagram from their 5
This question in 0580/31 May/June 2025
Q20 · A spinner is numbered 1, 2, 3, 4 and 5 0580/33 May/June 2025
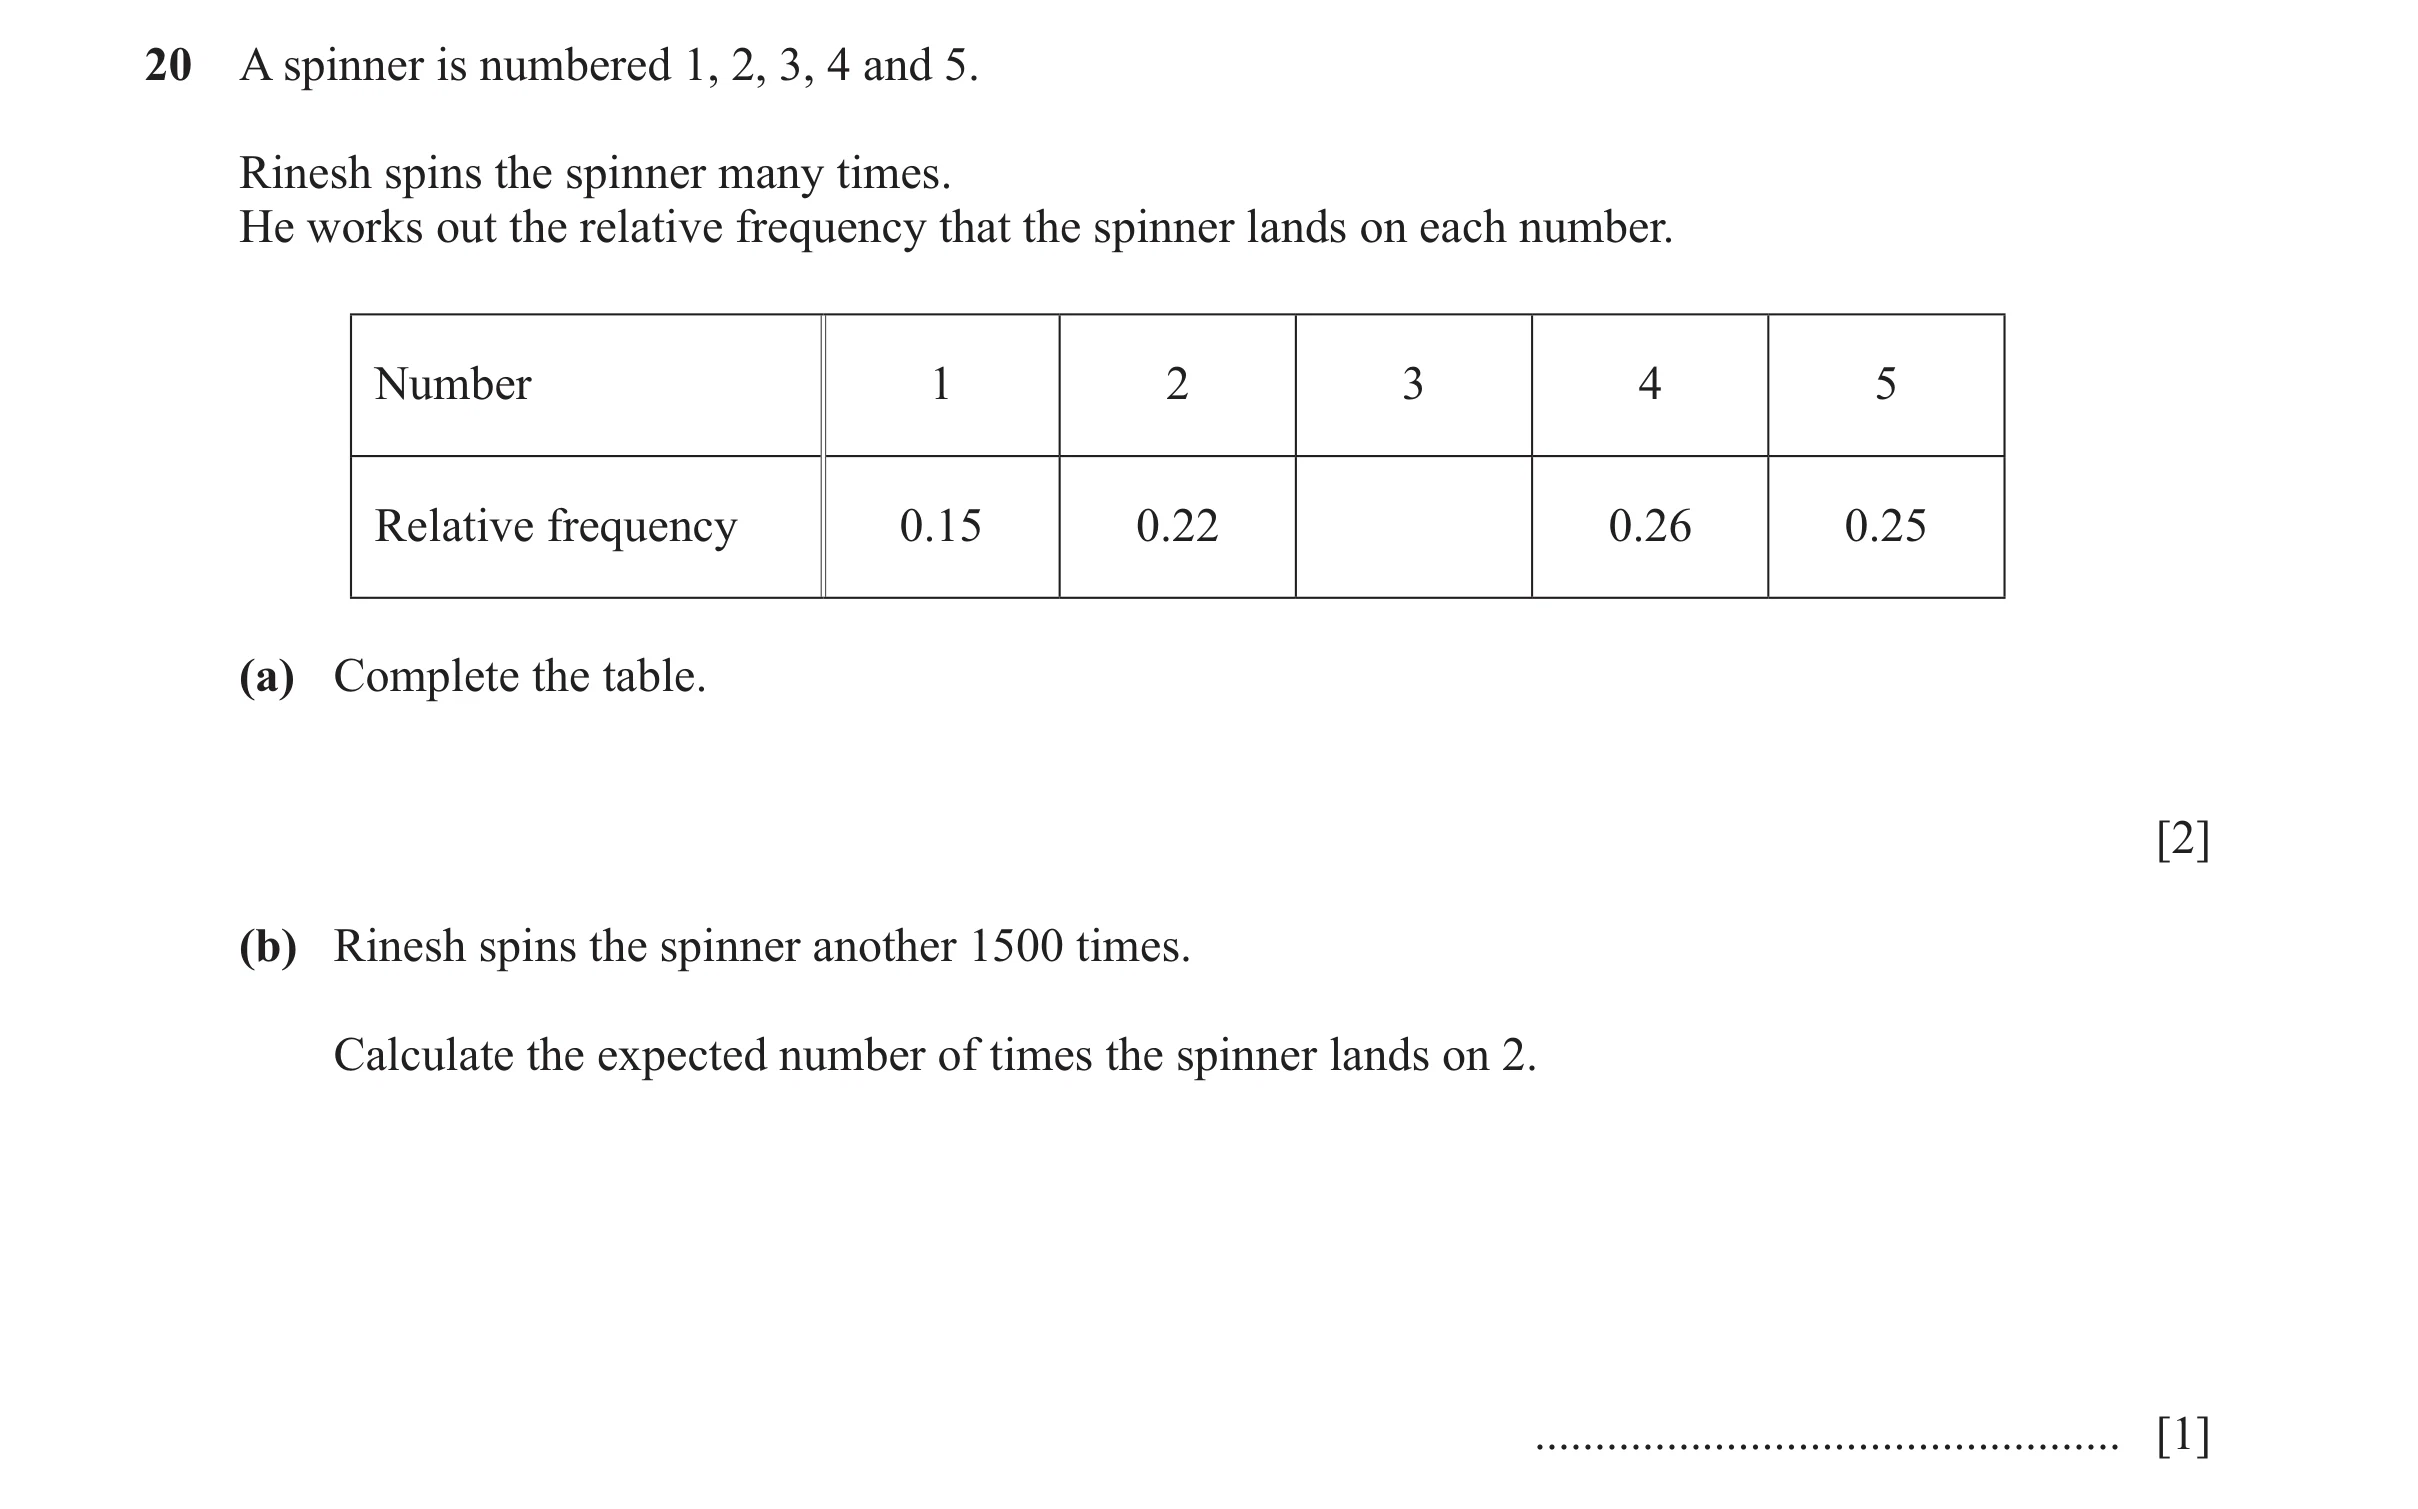
20 A spinner is numbered 1, 2, 3, 4 and 5. Rinesh spins the spinner many times. He works out the relative frequency that the spinner lands on each number. Number 1 2 3 4 5 Relative frequency 0.15 0.22 0.26 0.25 (a) Complete the table. [2] (b) Rinesh spins the spinner another 1500 times. Calculate the expected number of times the spinner lands on 2. … [1]
3 marks
Mark scheme: 20(a) 0.12 oe 2 B1 for 0.88 oe or M1 for 1 – (0.15 + 0.22 + 0.26 + 0.25) oe 20(b) 330 1
This question in 0580/33 May/June 2025
 16 / 30
![Question 10: (a) Write down the temperature shown by each arrow. (i) Temperature (°C) 0 10 20 ............................................°C [1] (ii) Te…](https://img.pastlit.com/crops/43c56002-14ed-403f-be73-7f519e6c0974/q1.webp) 17 / 30
17 / 30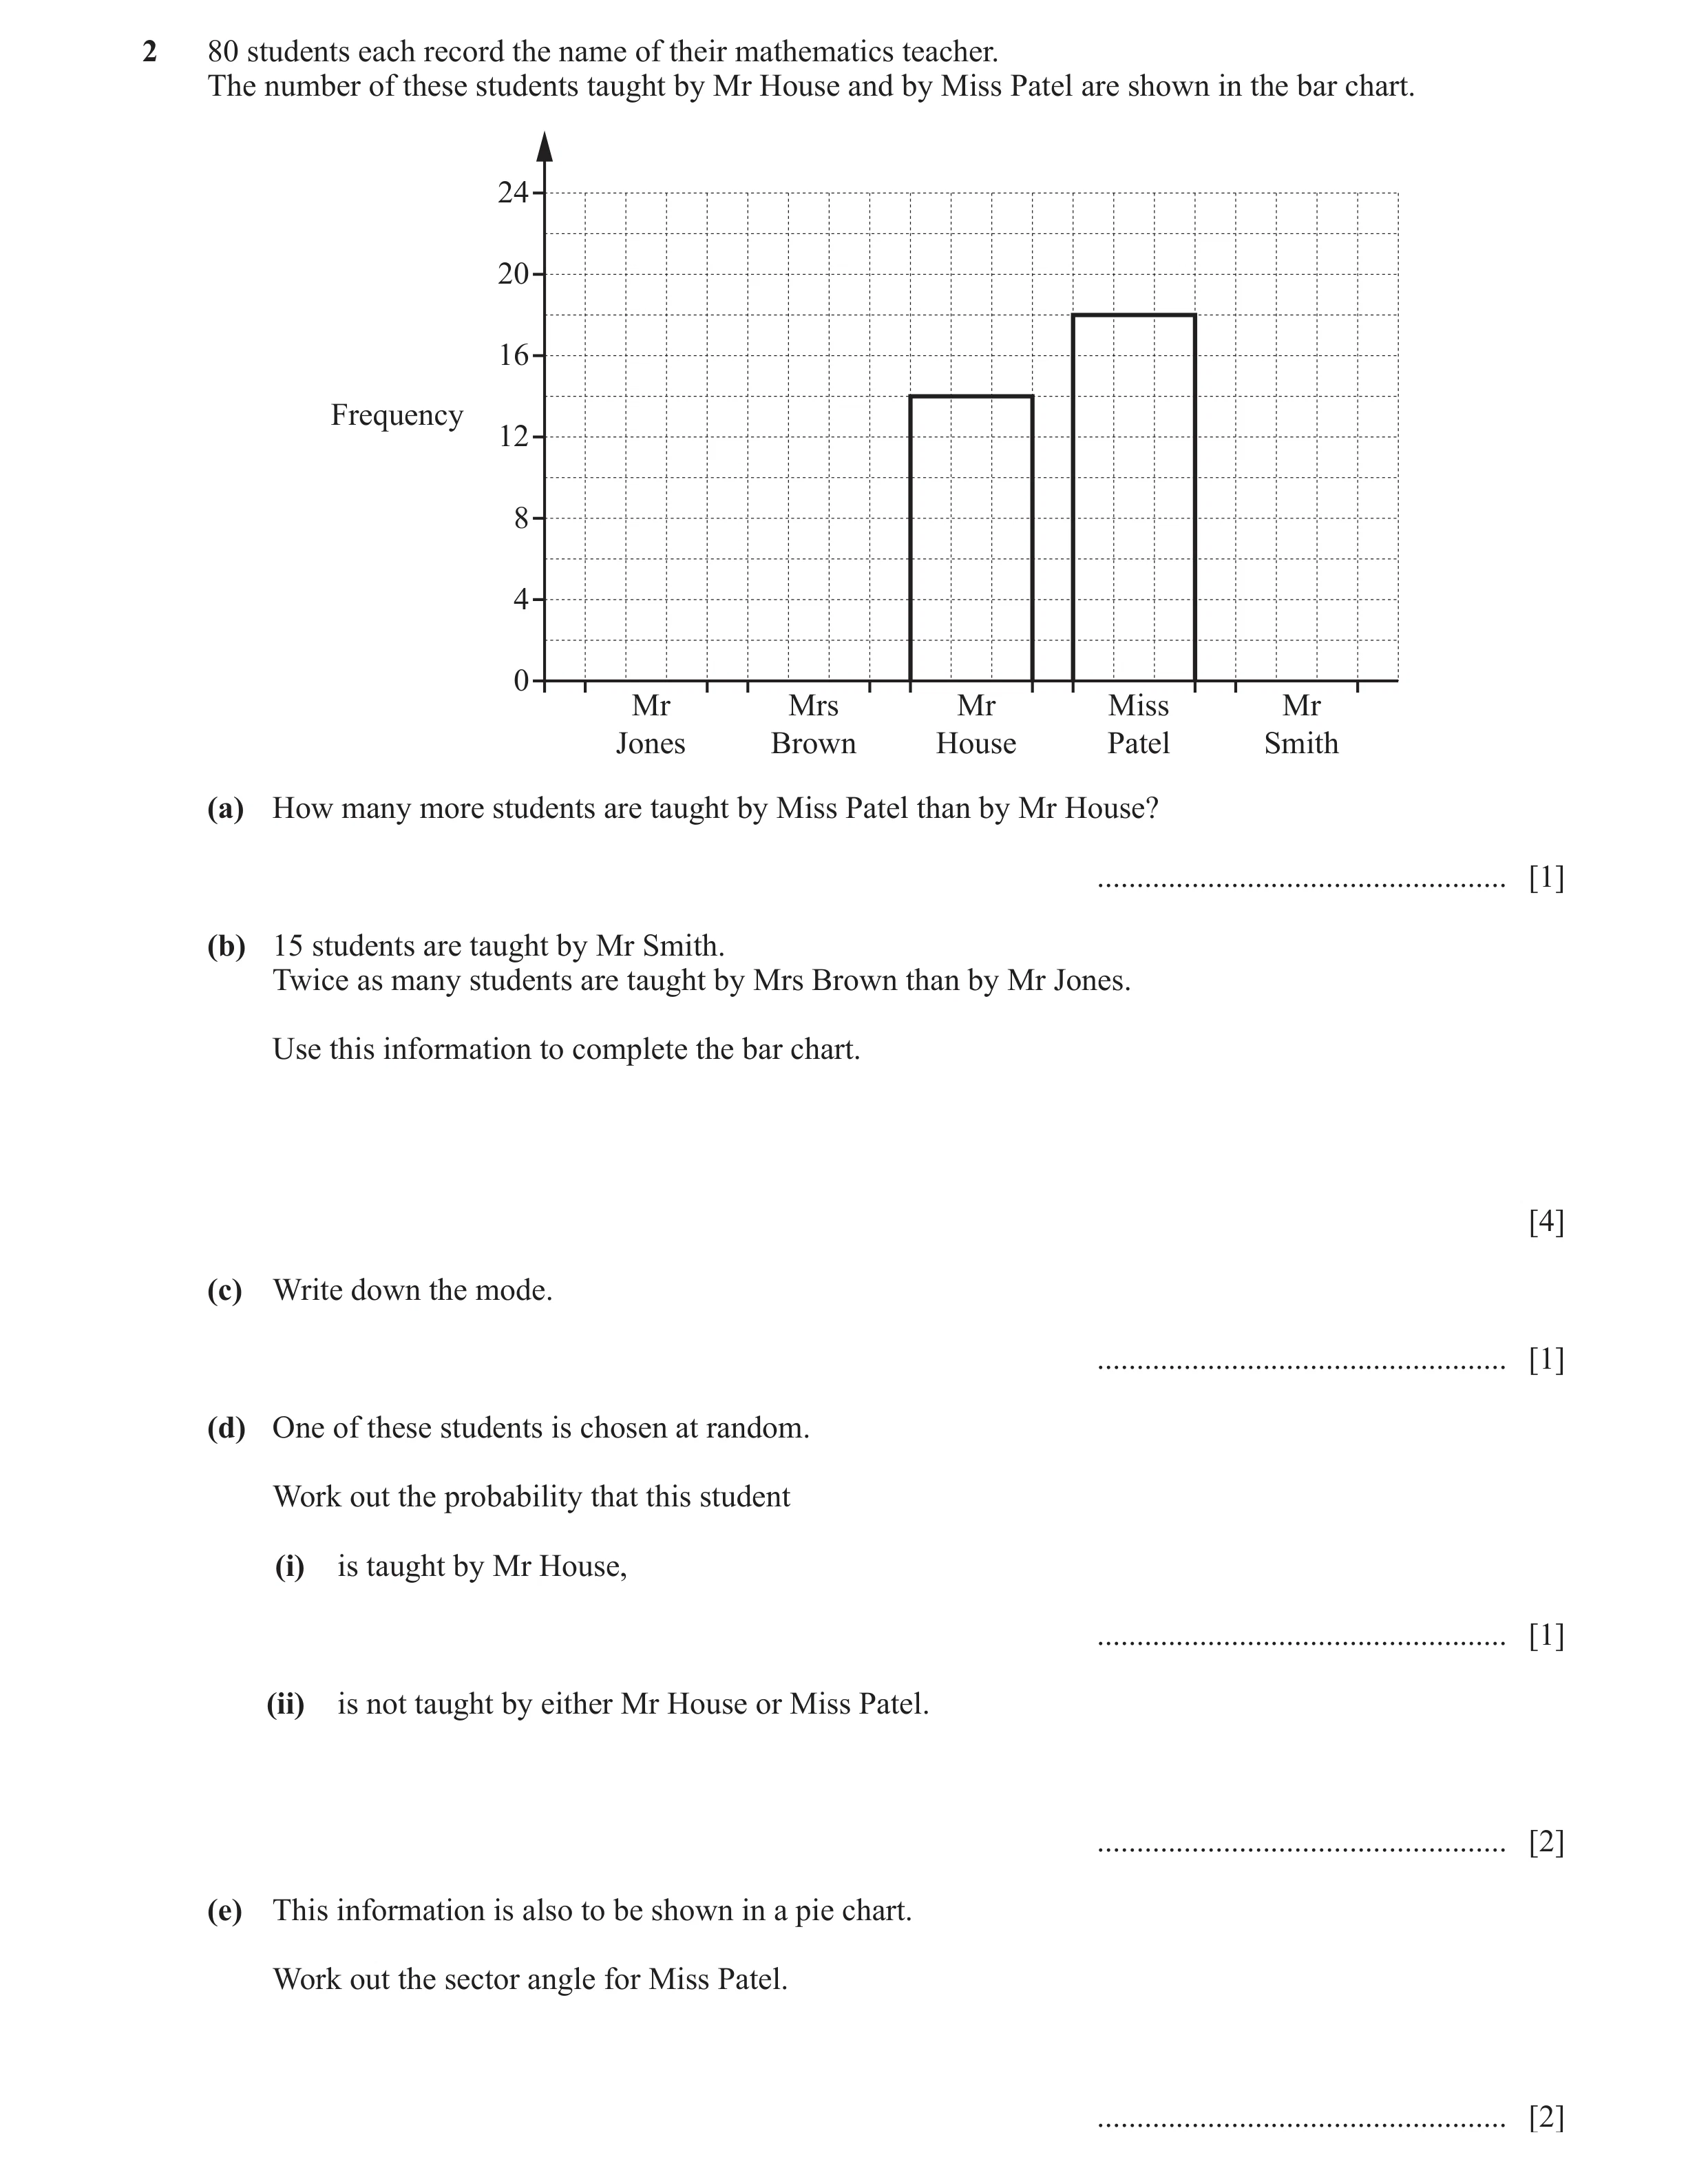 18 / 30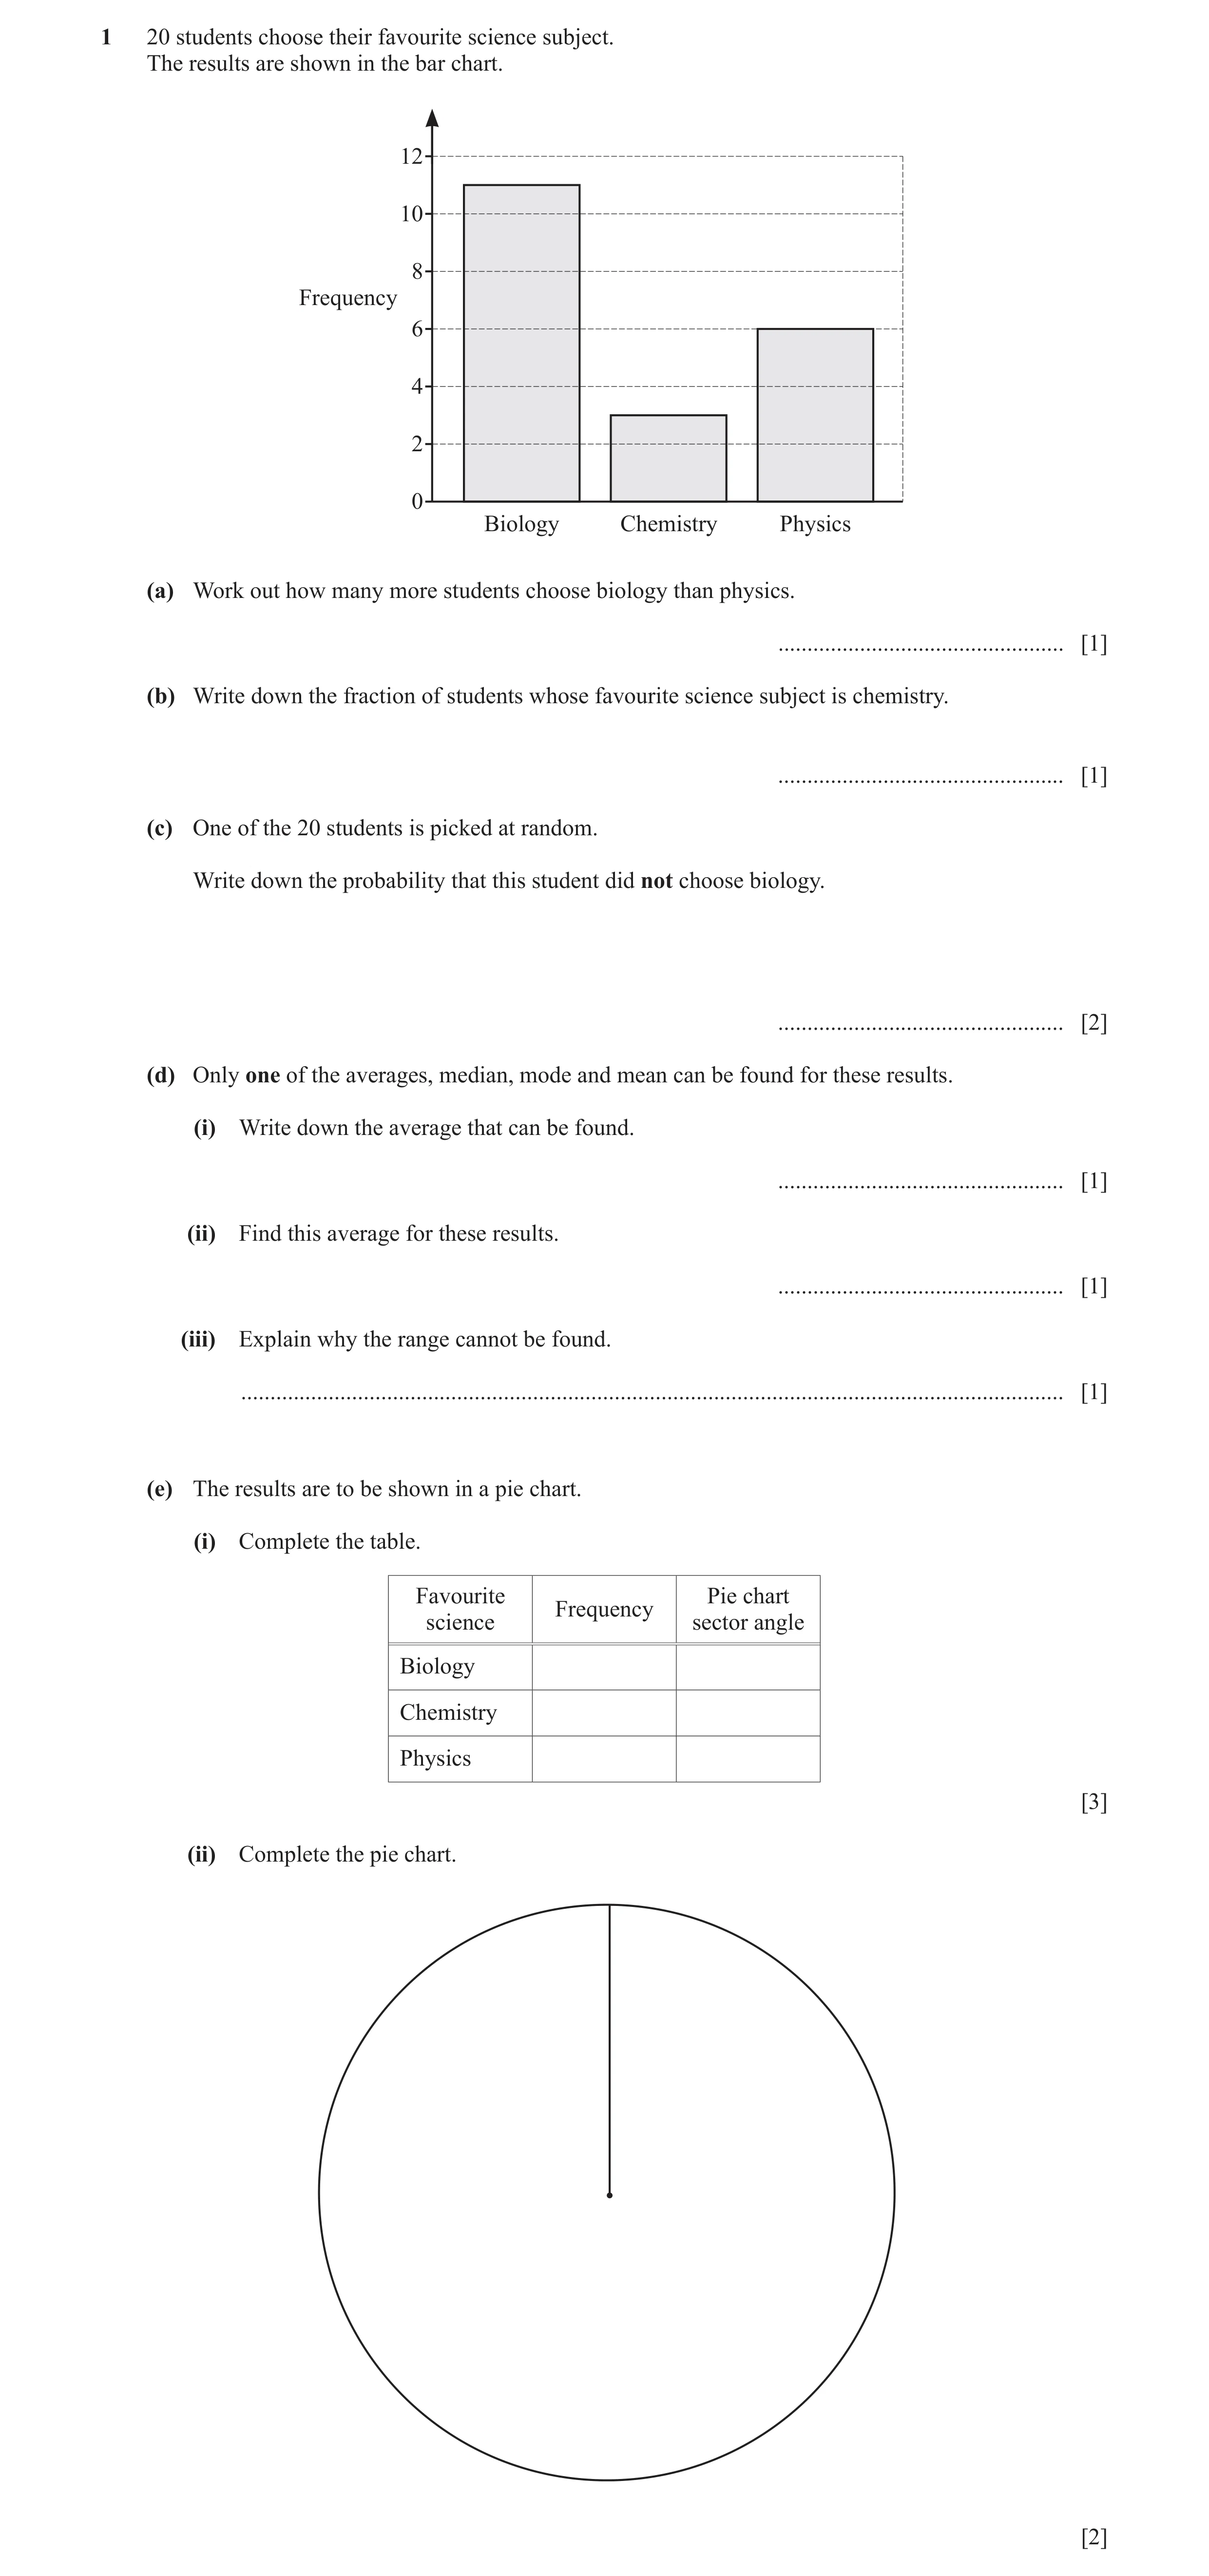
 29 / 30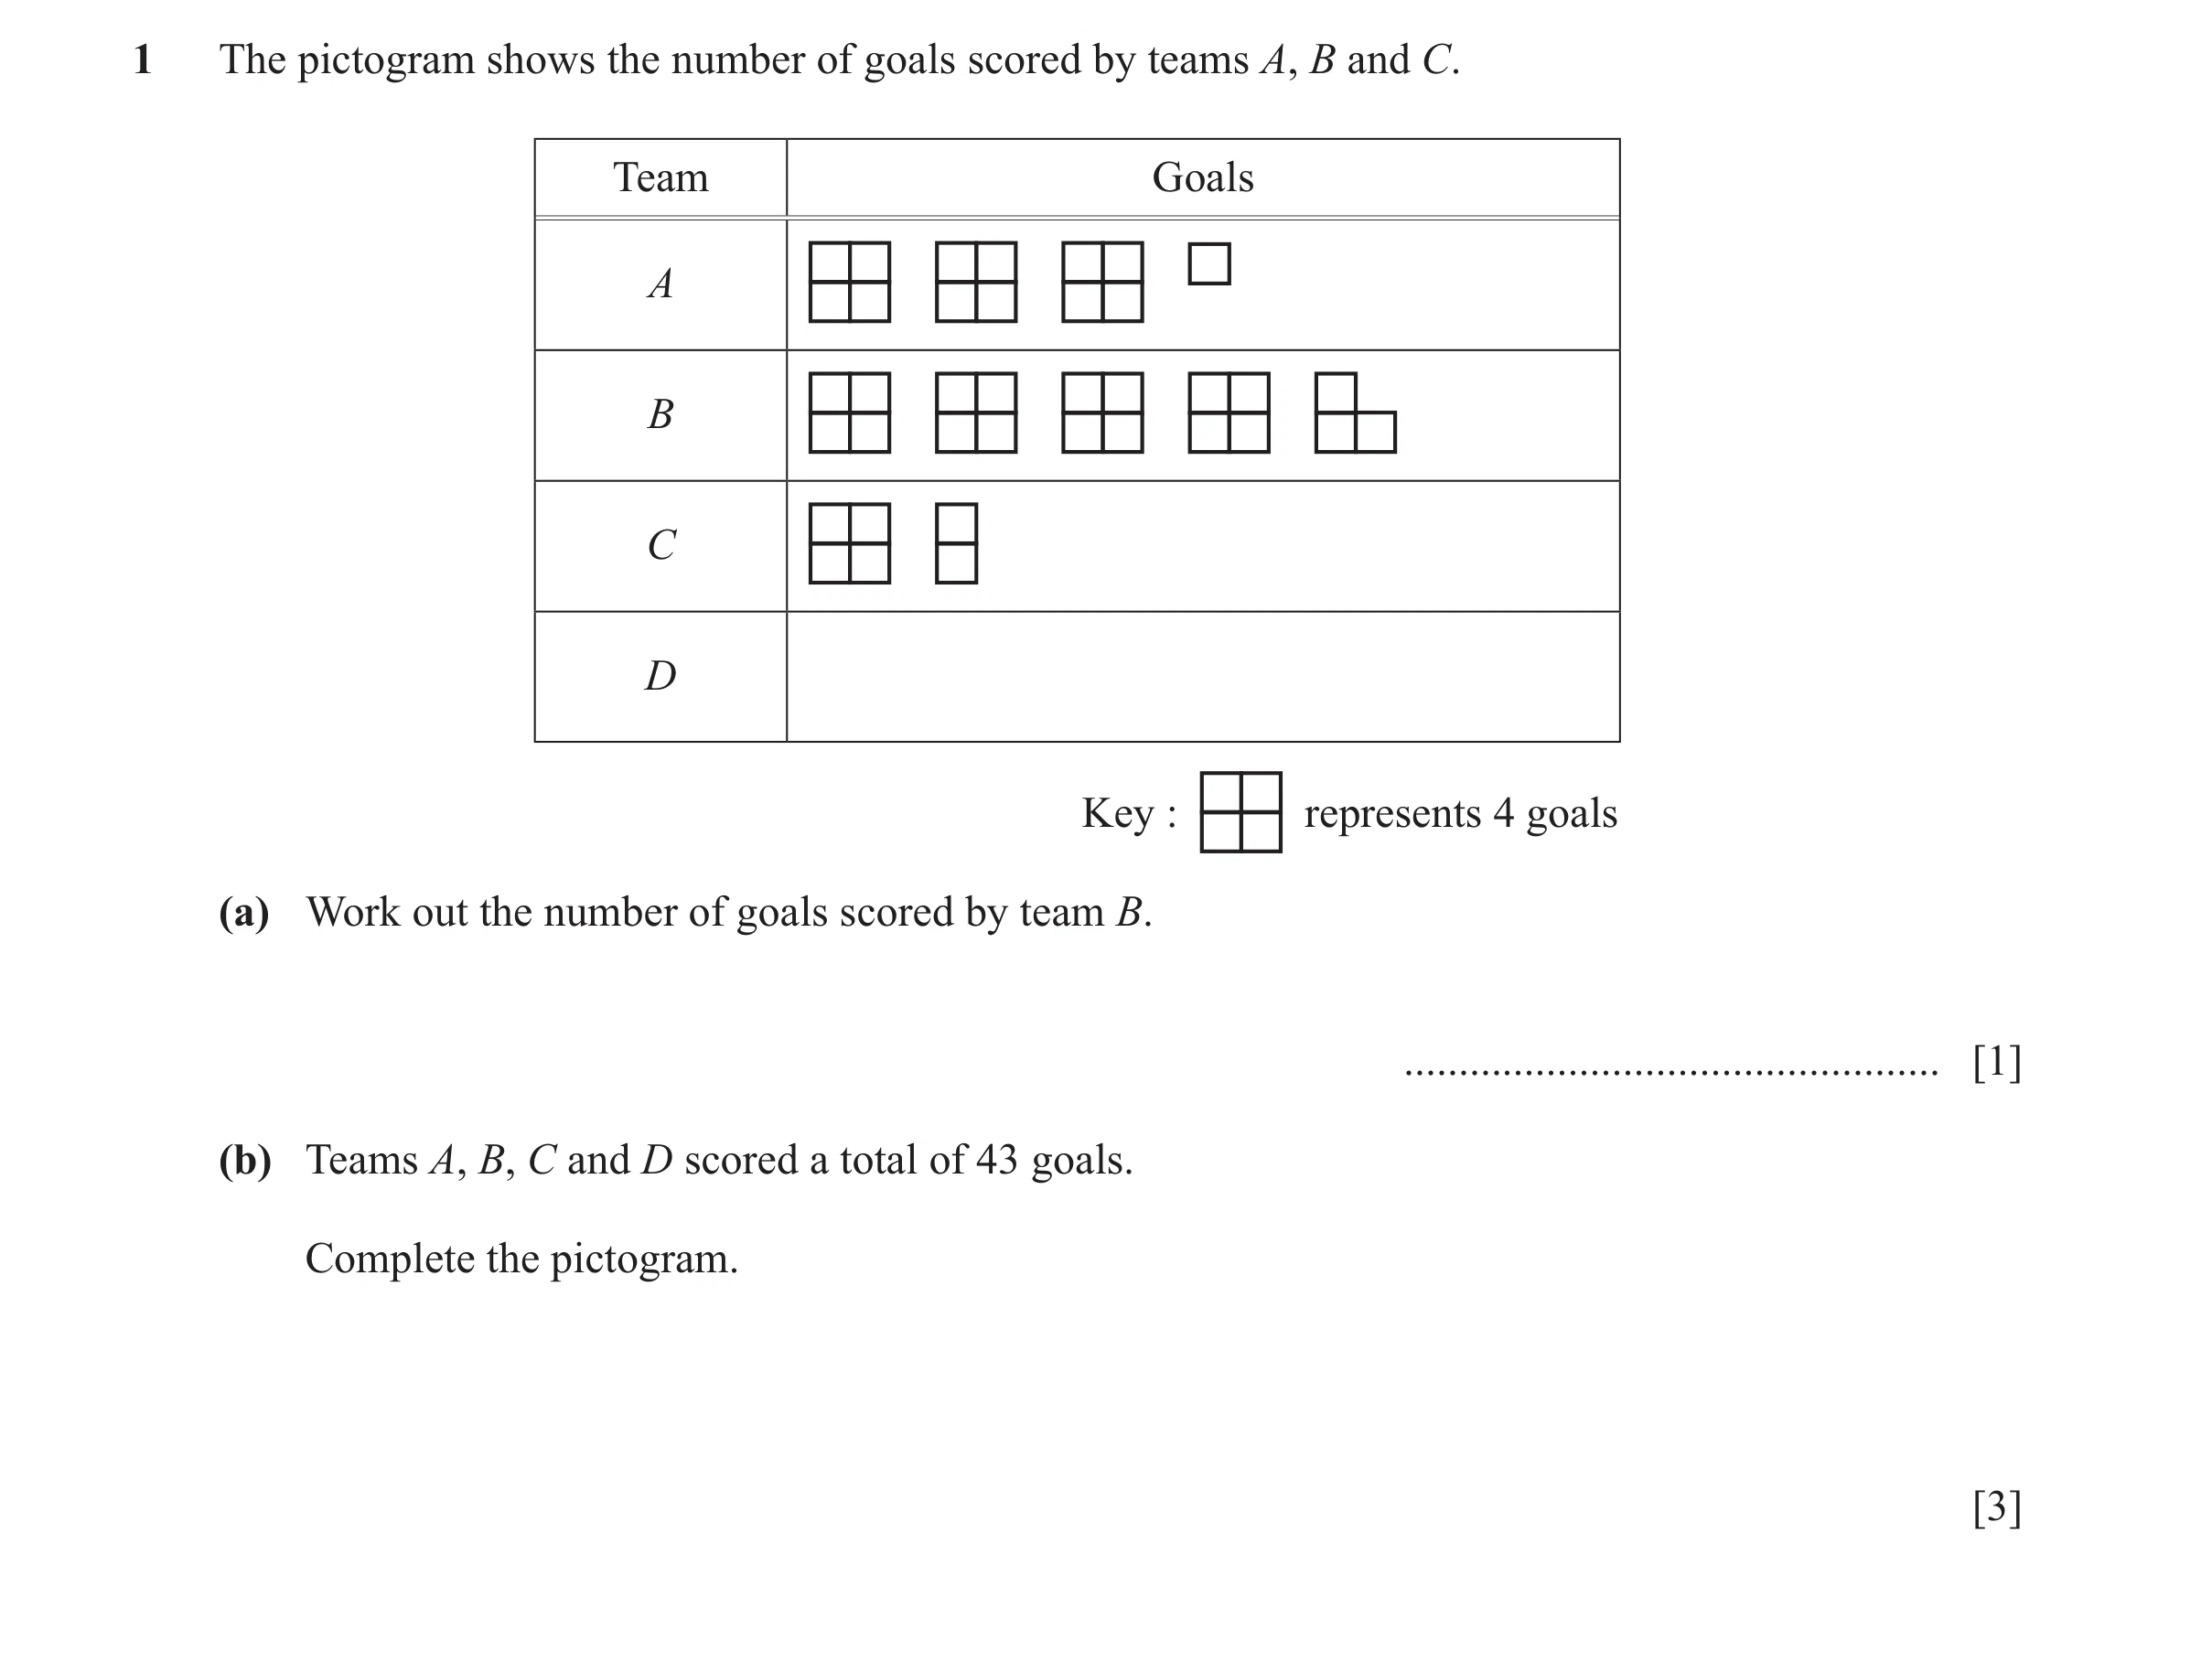
 30 / 30
 13
13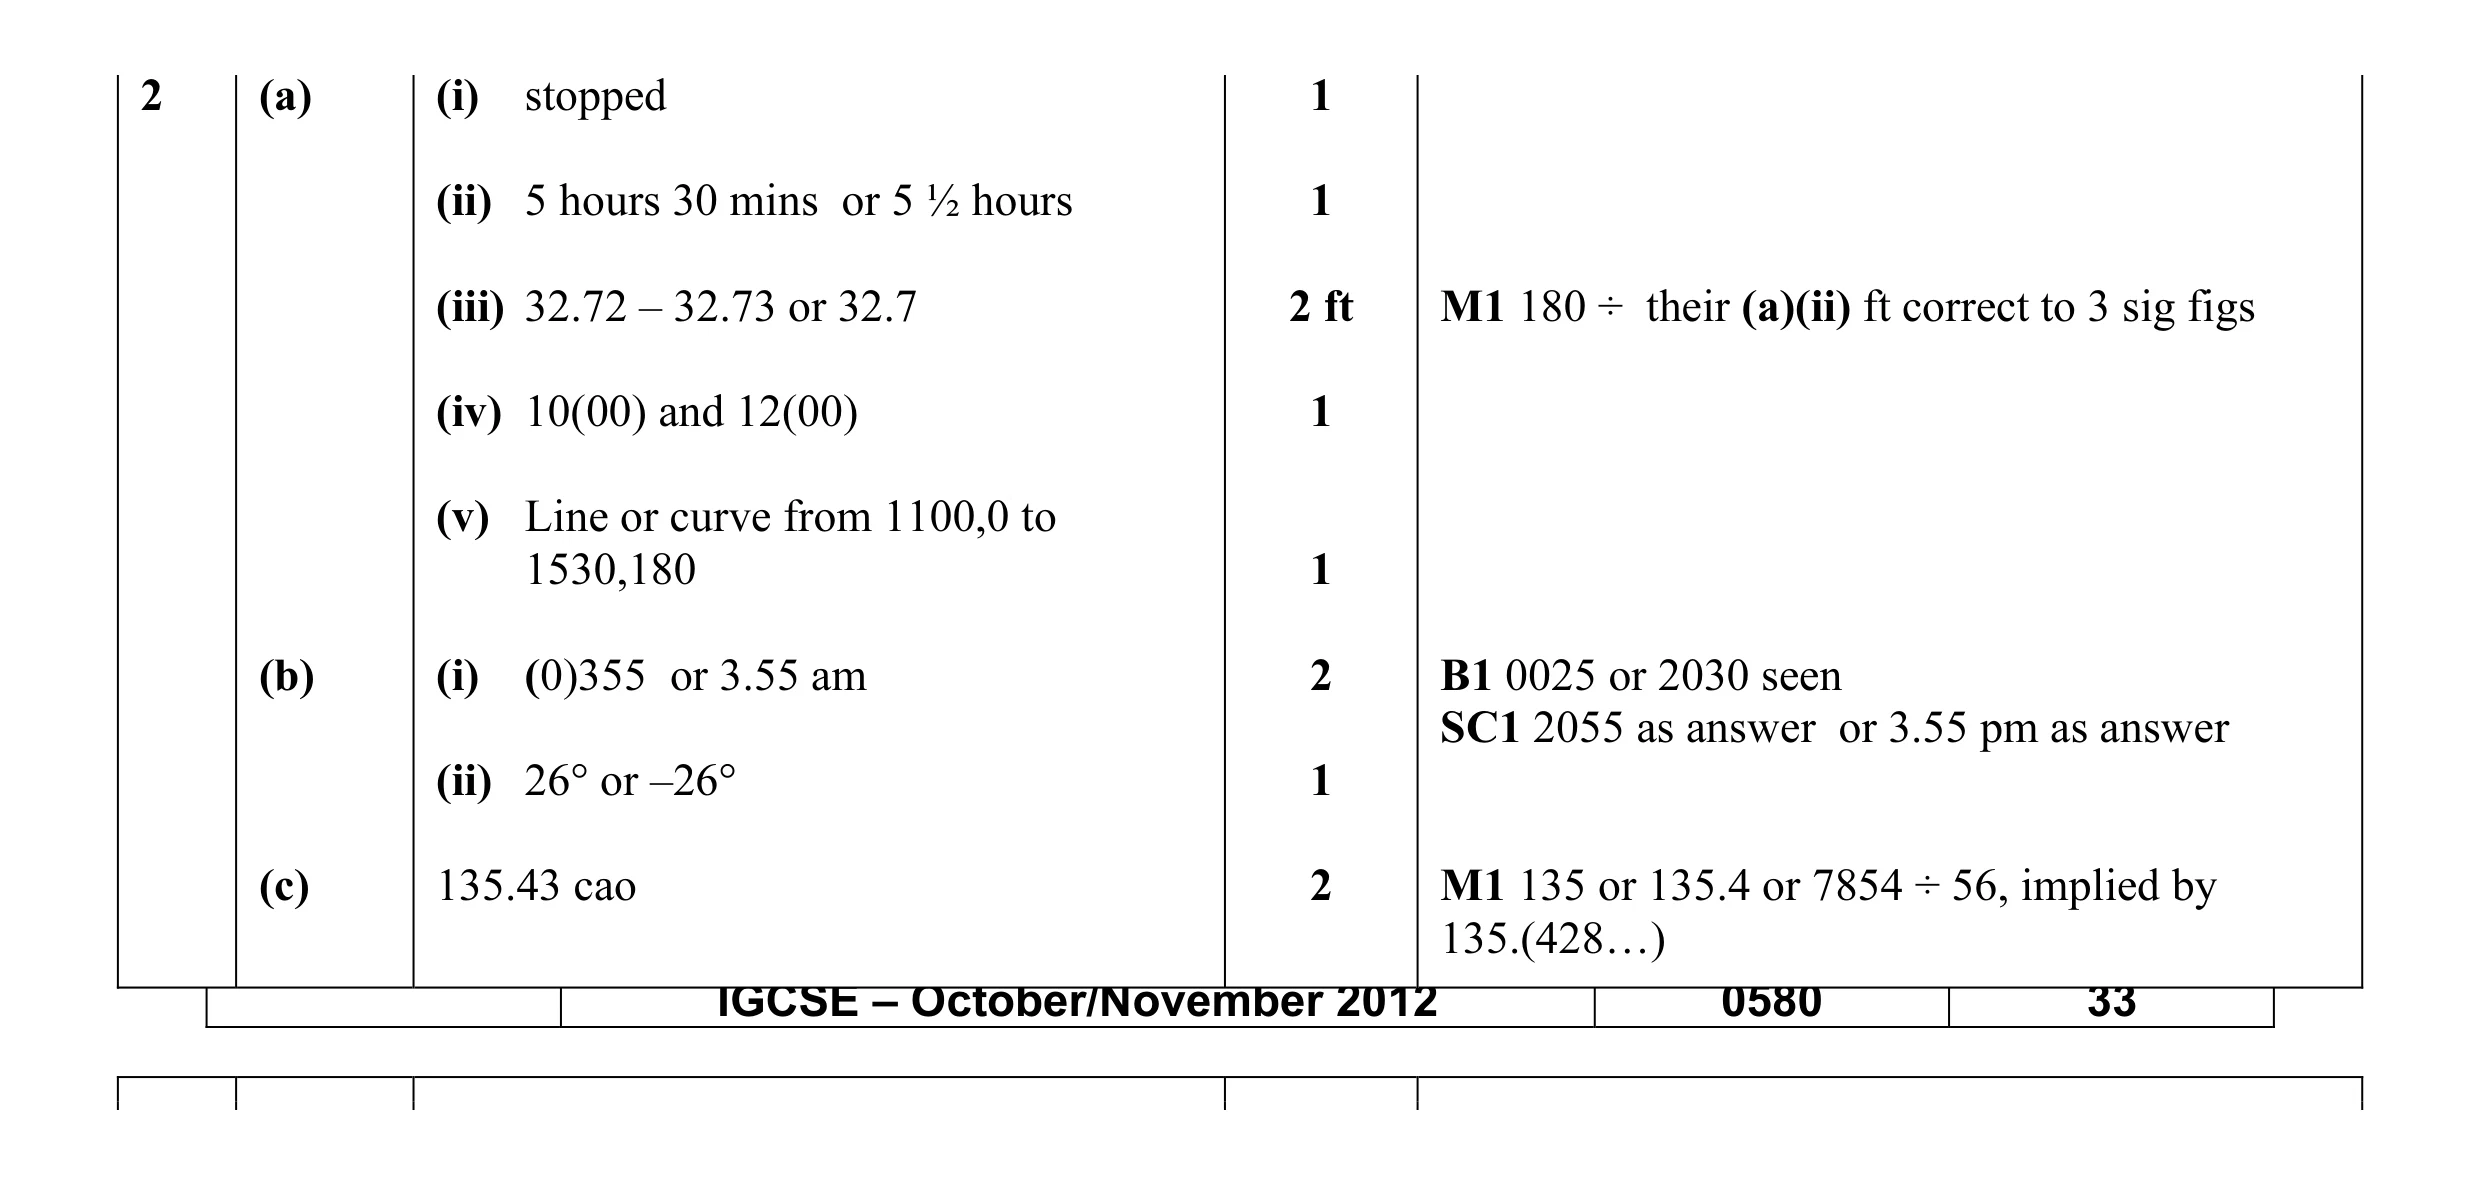 11
11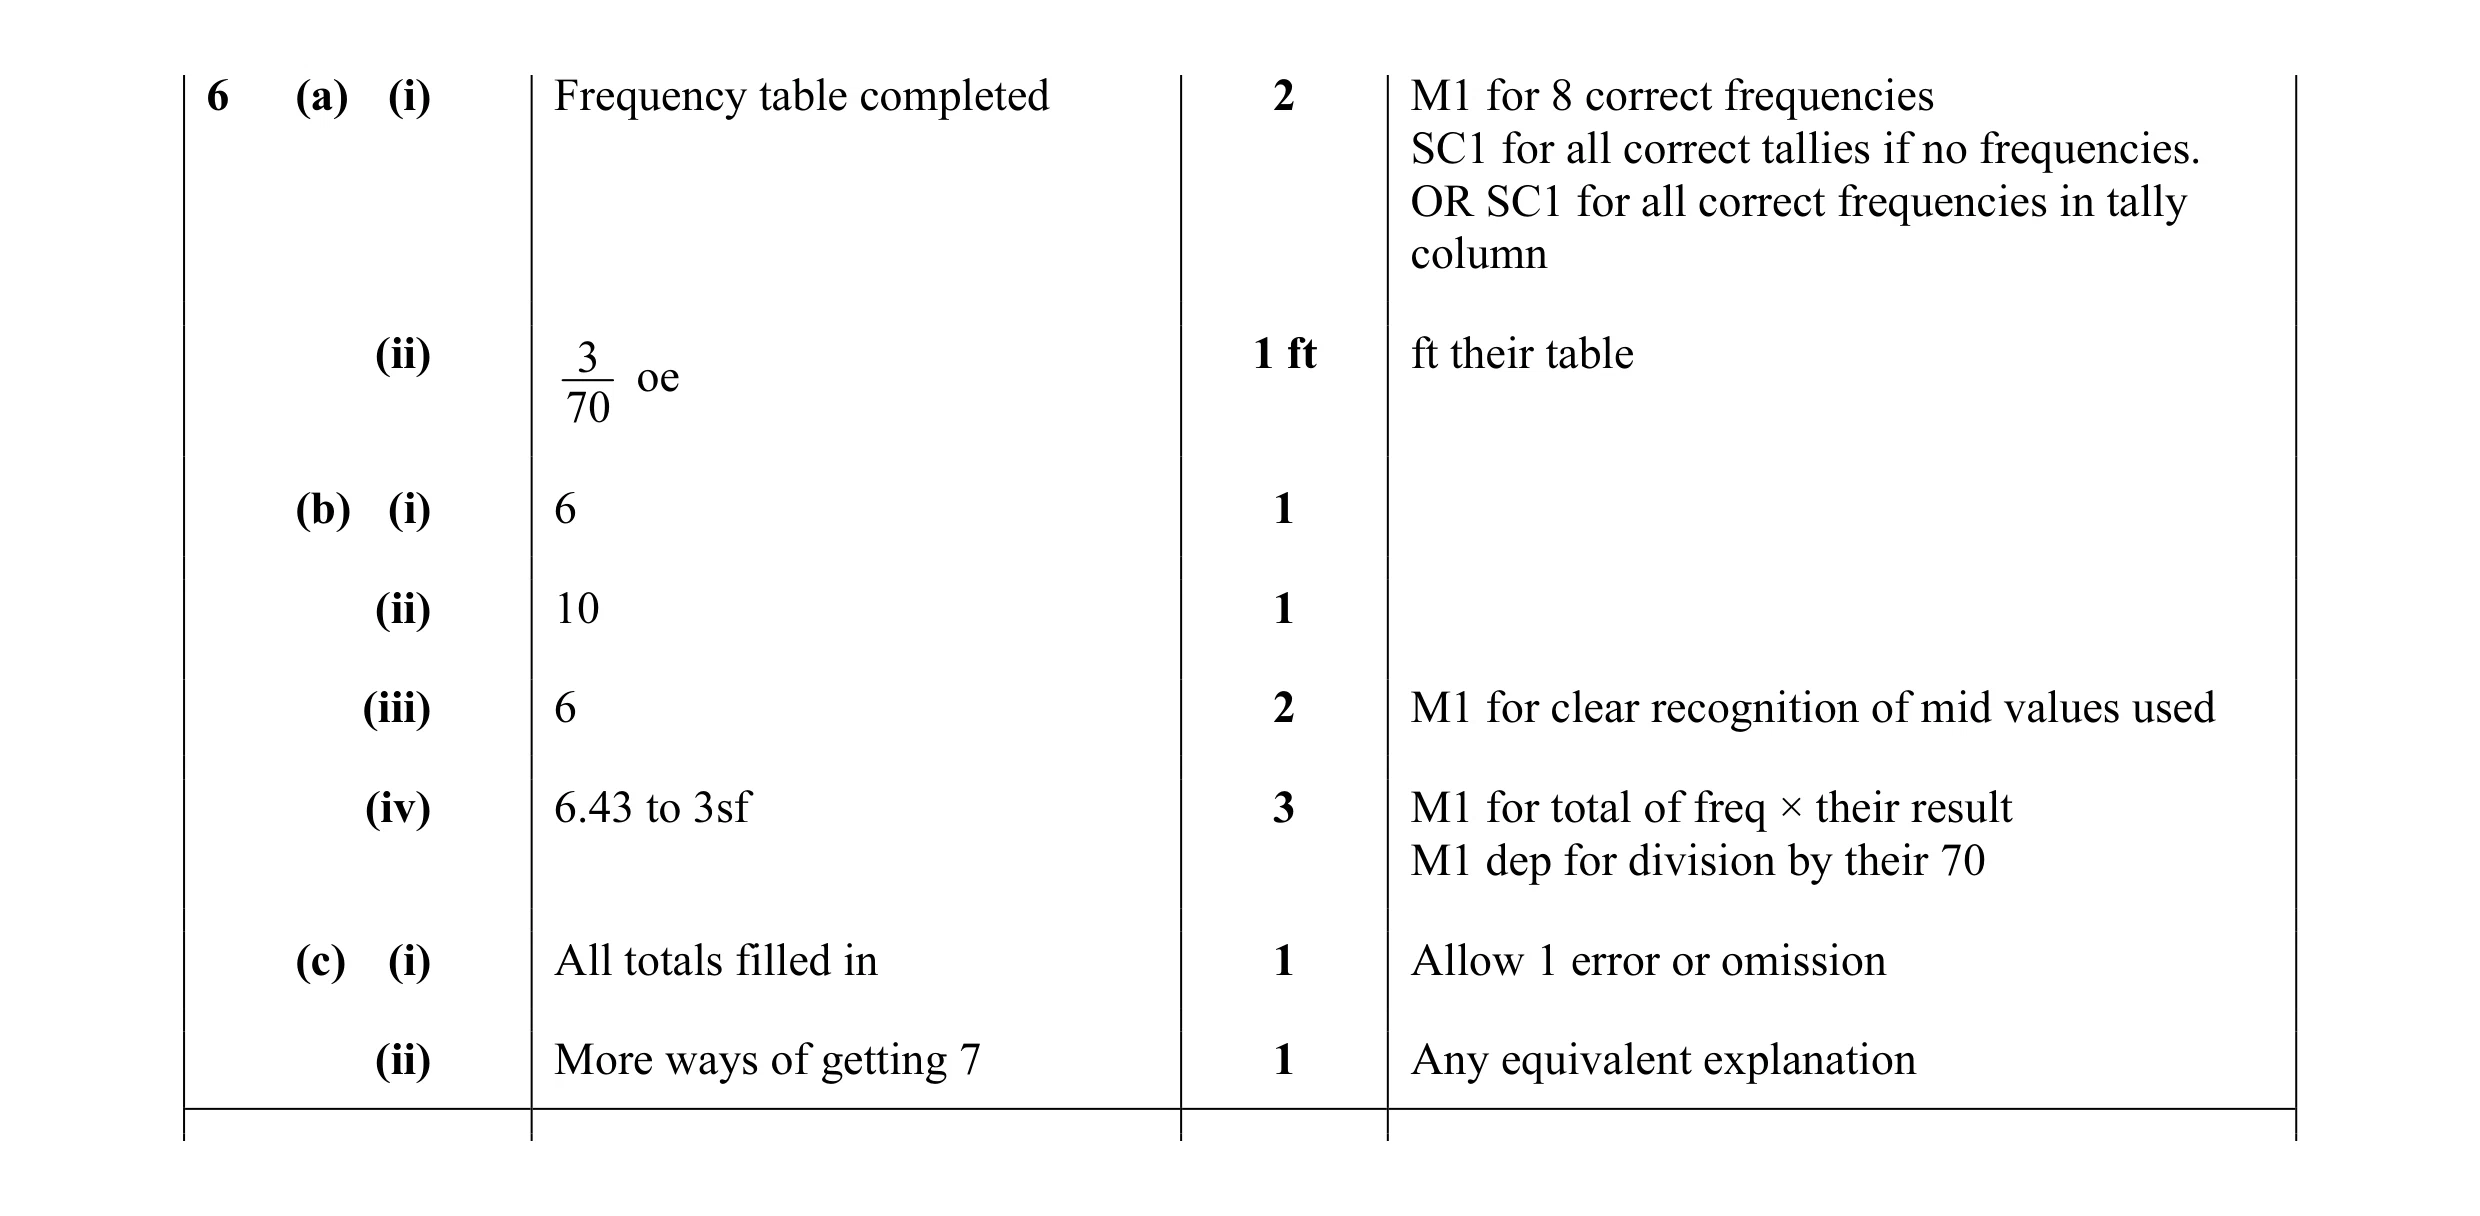 12
12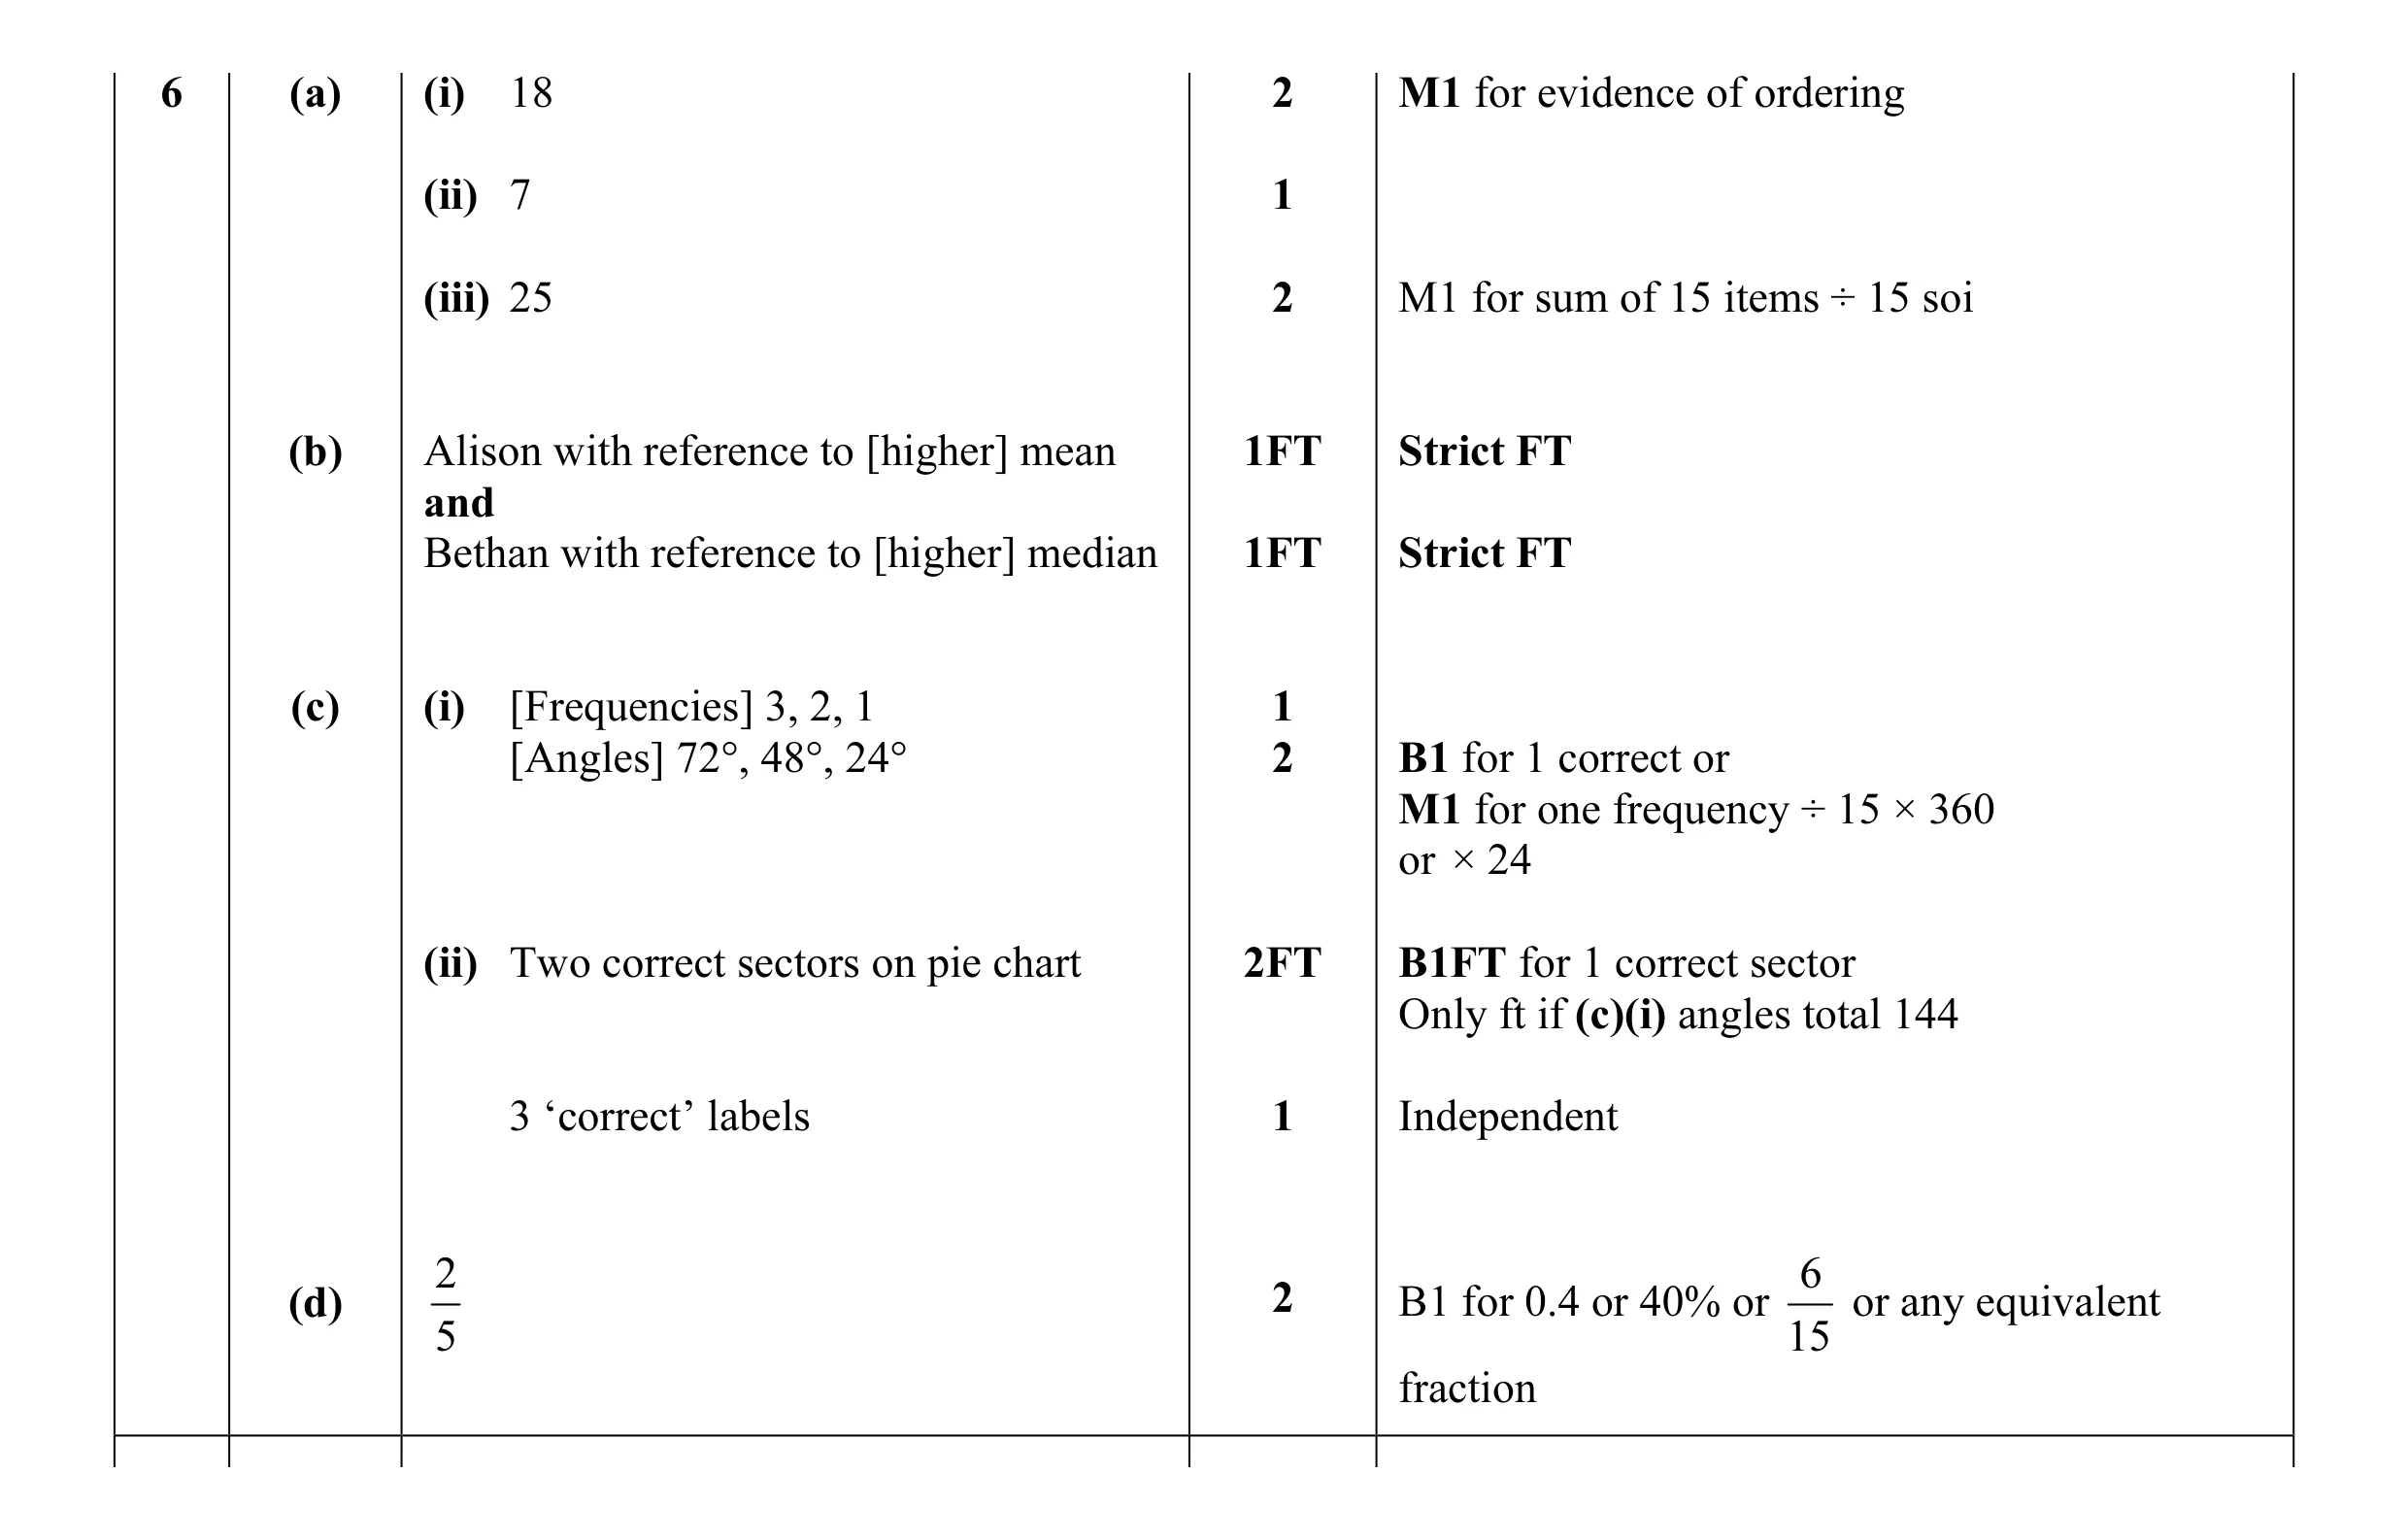 15
15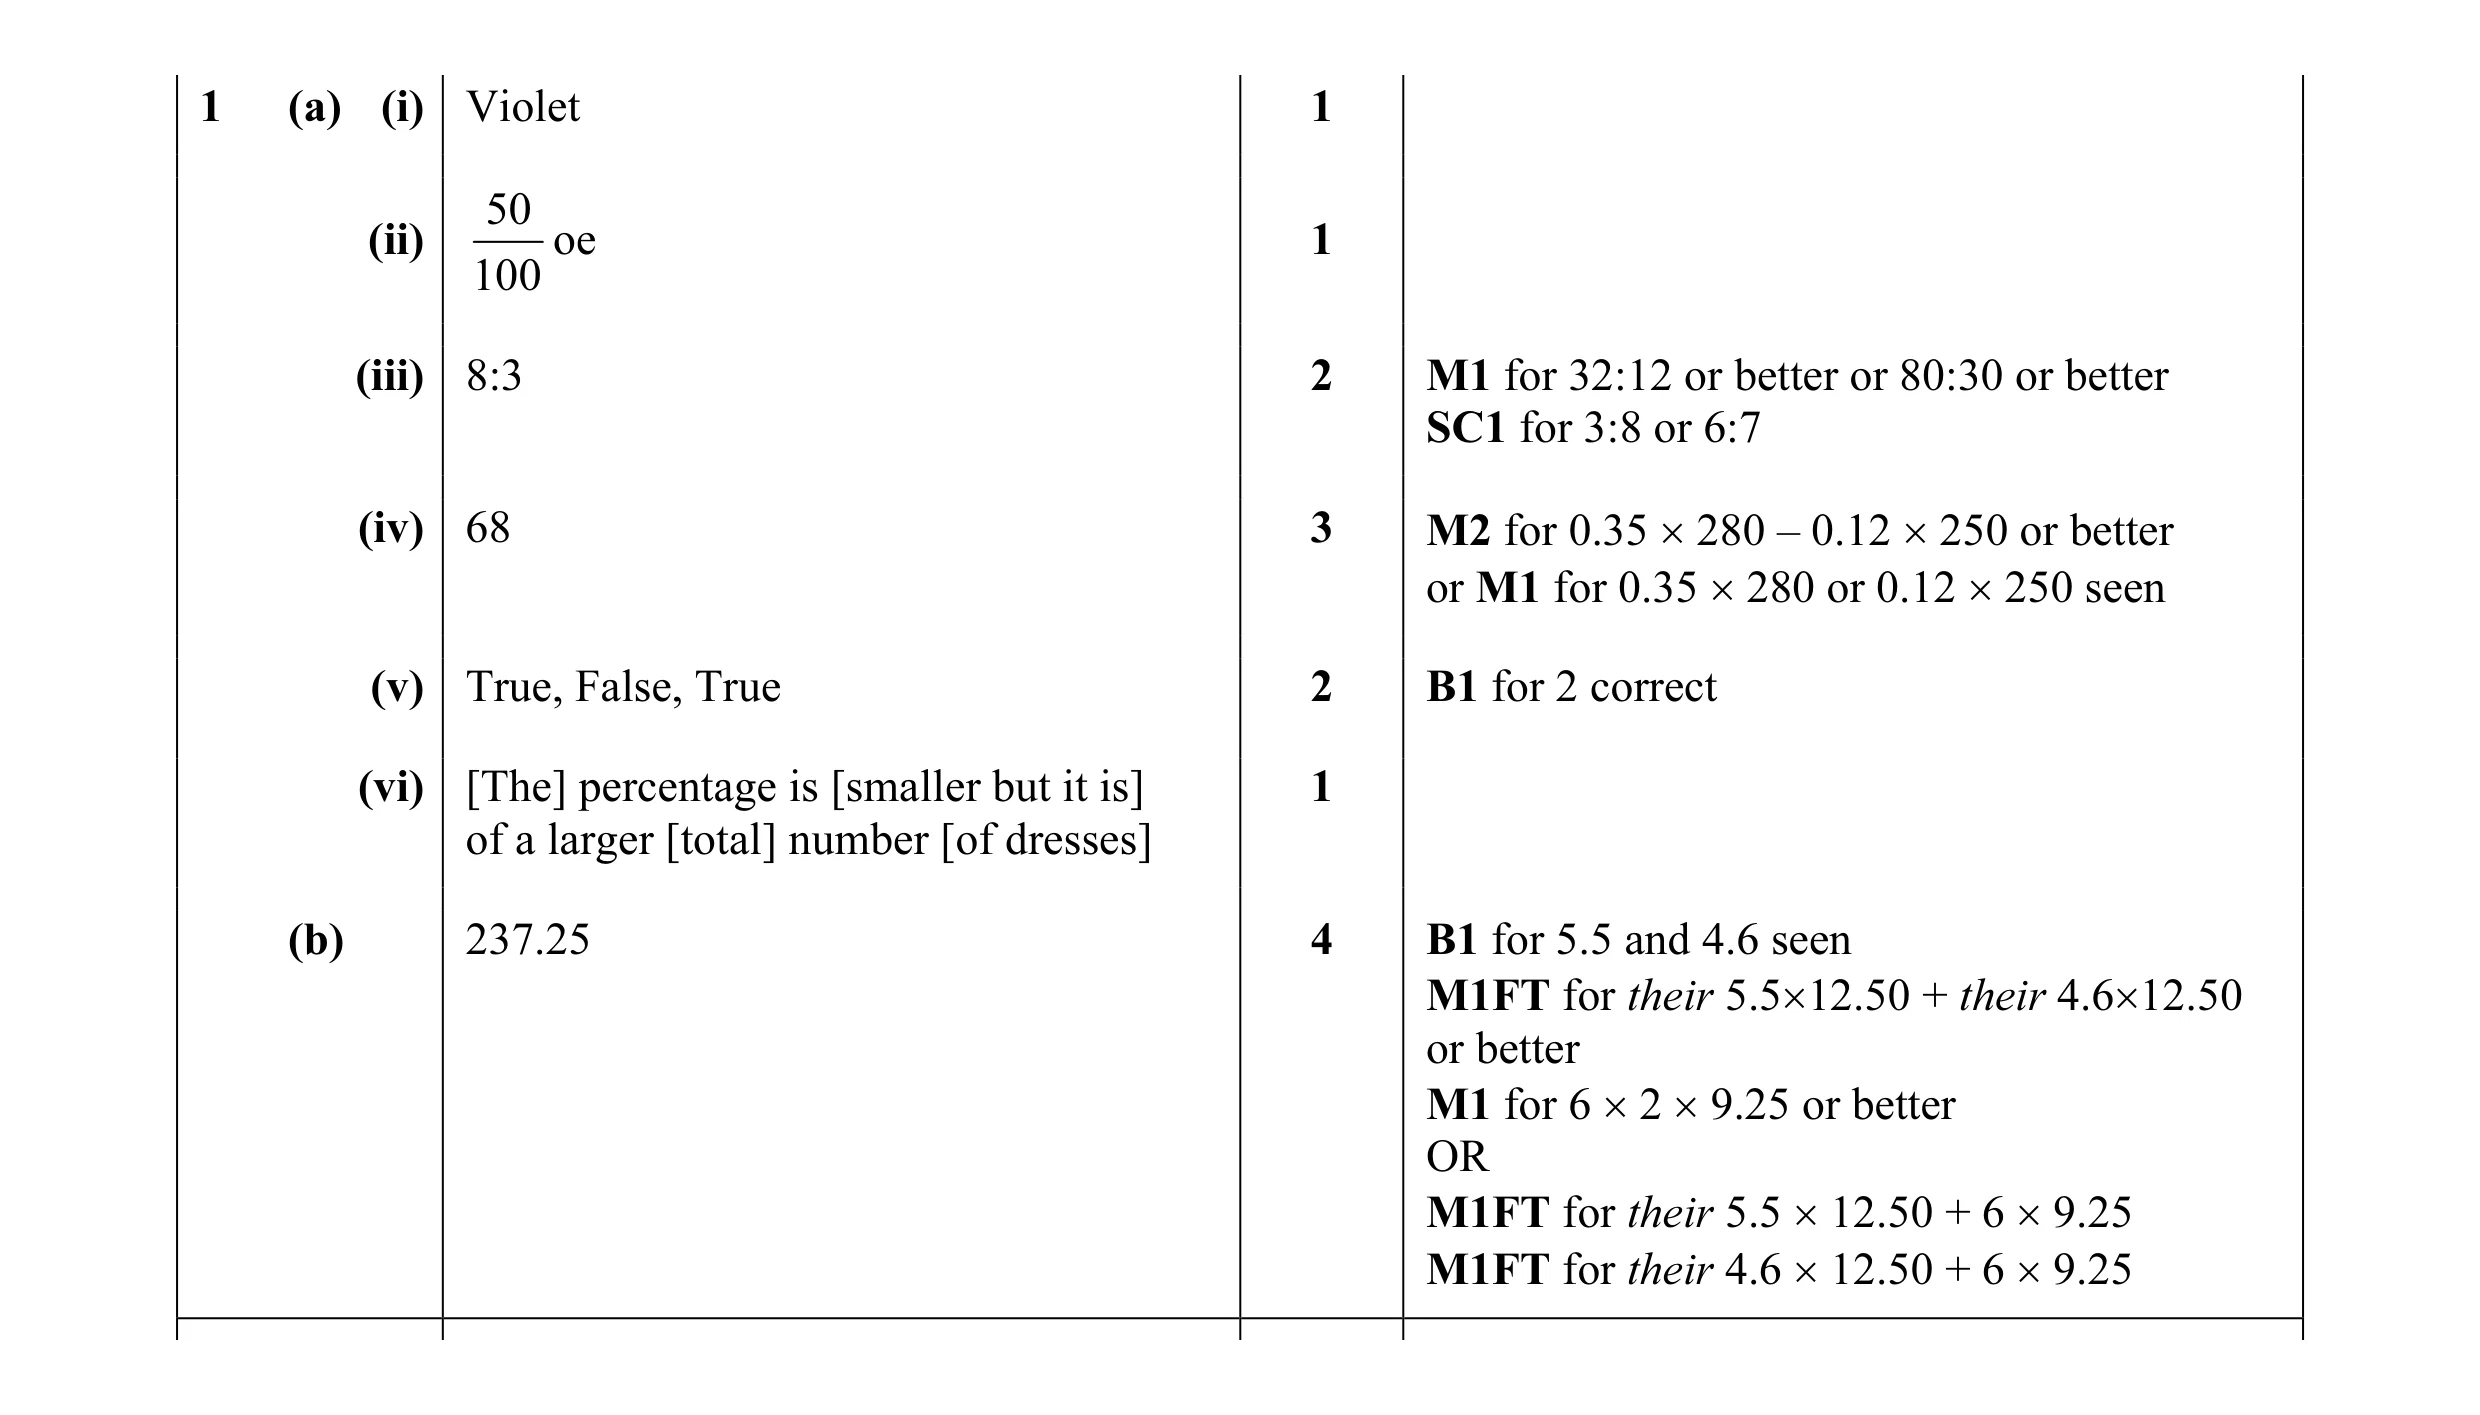 14
14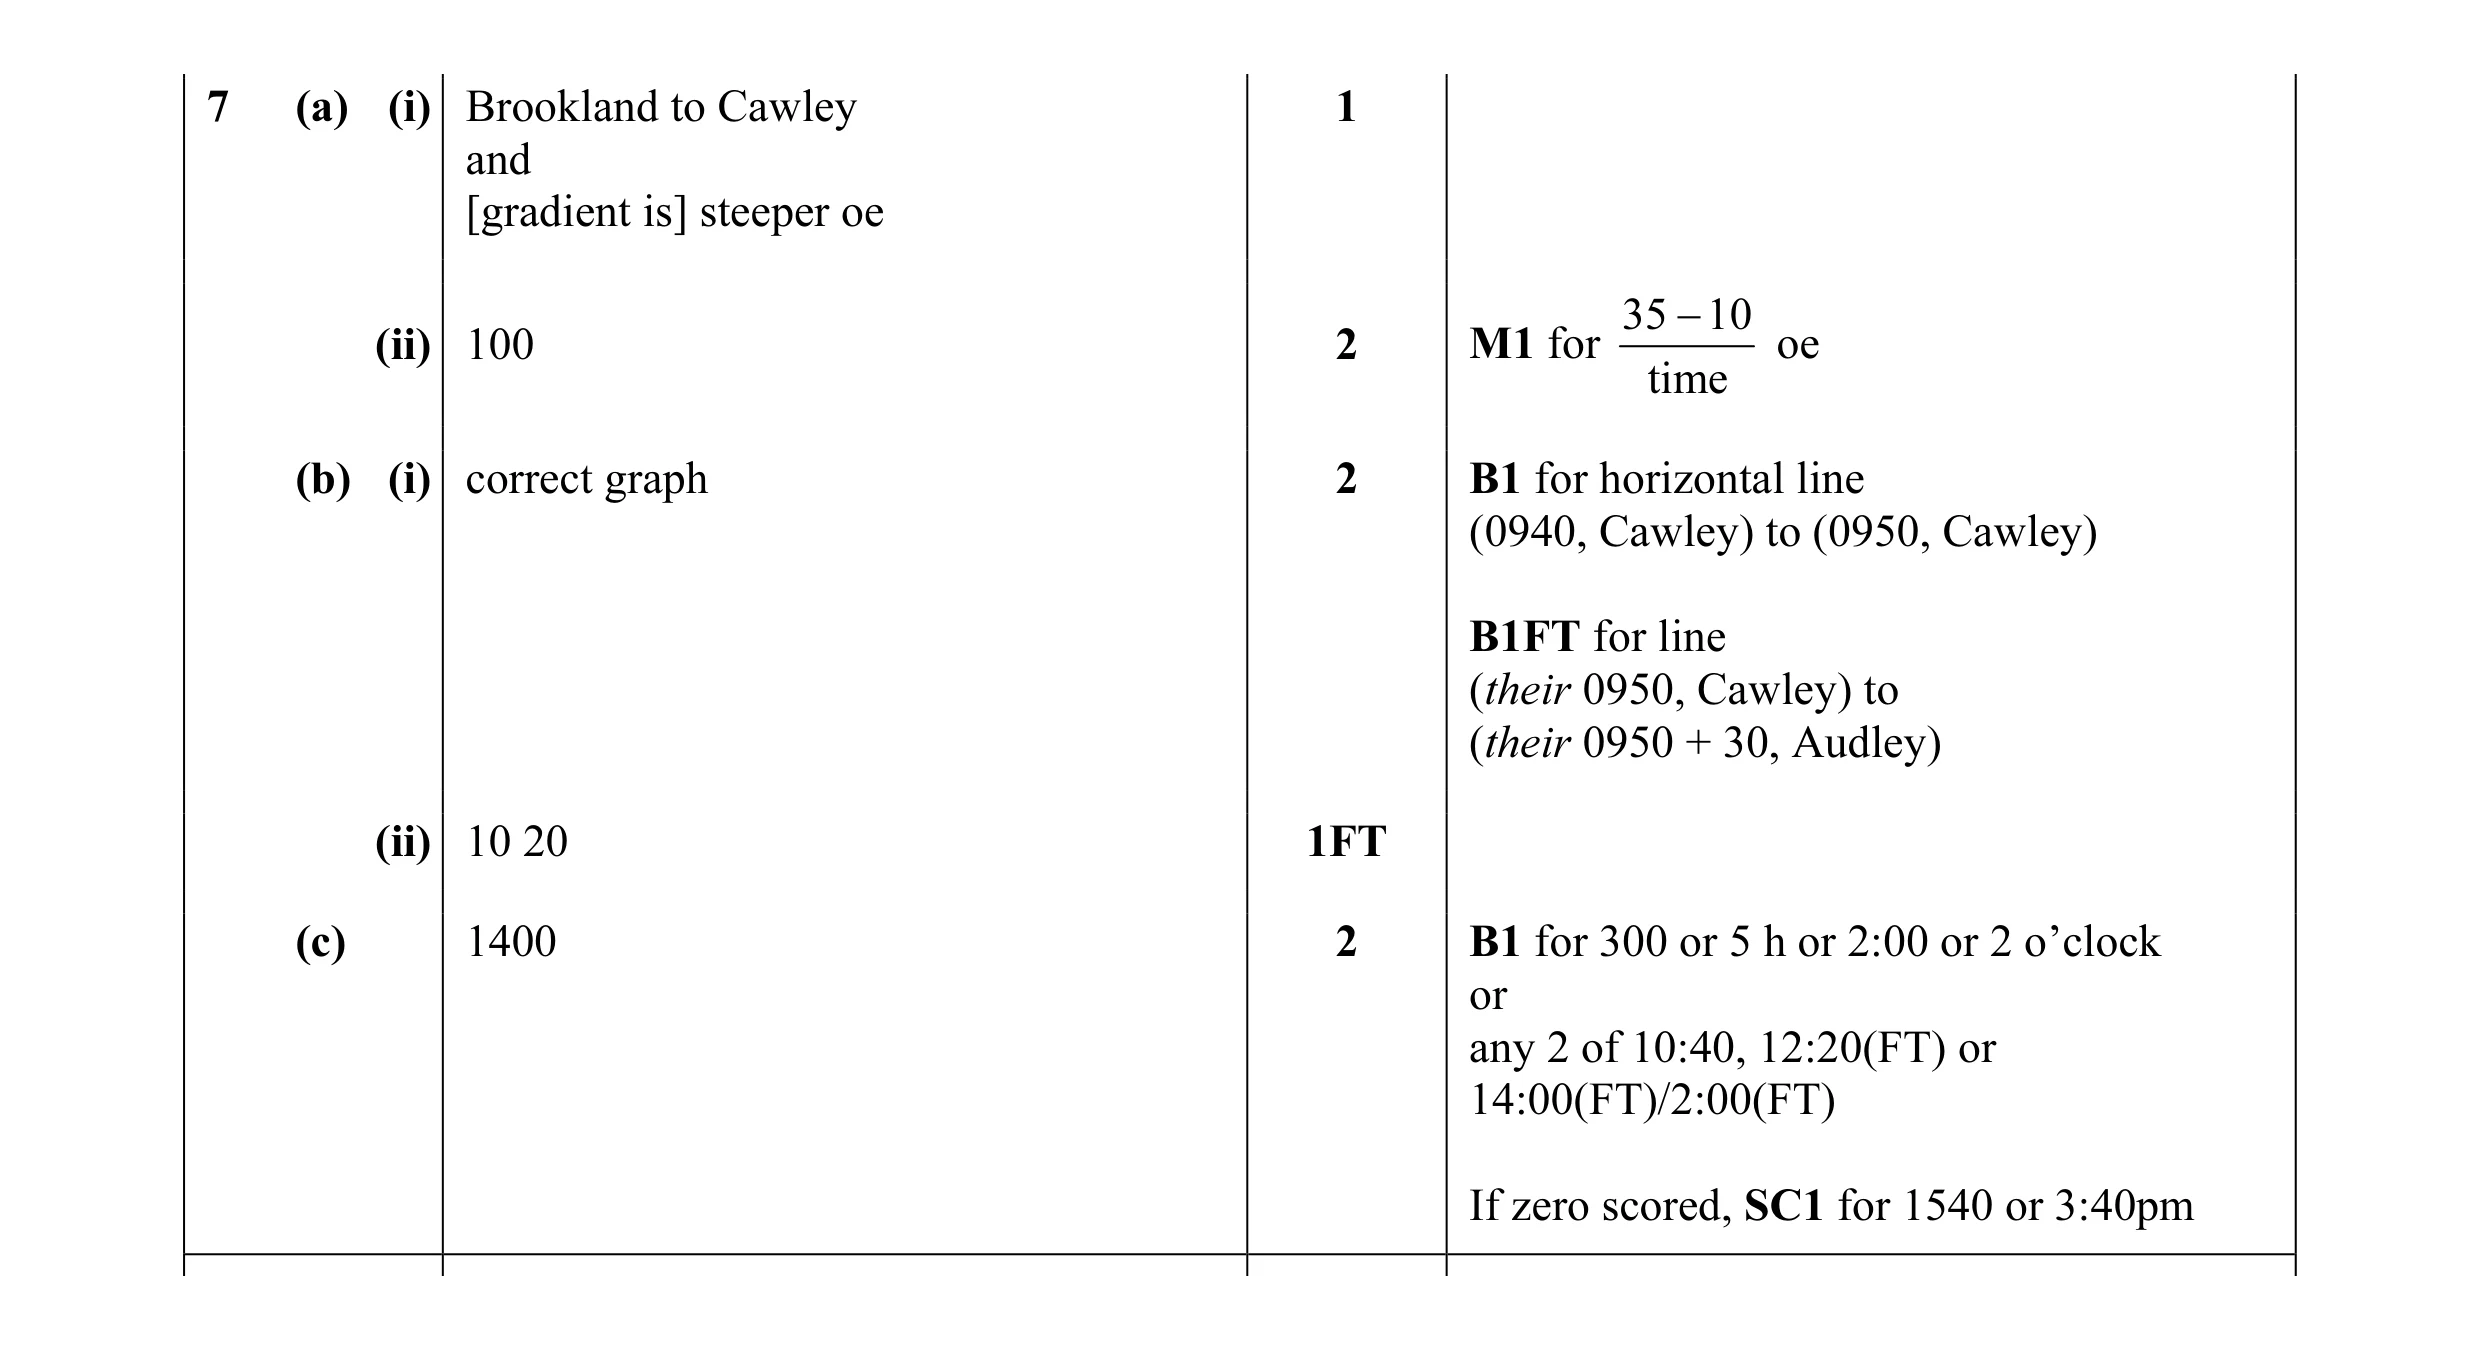 8
8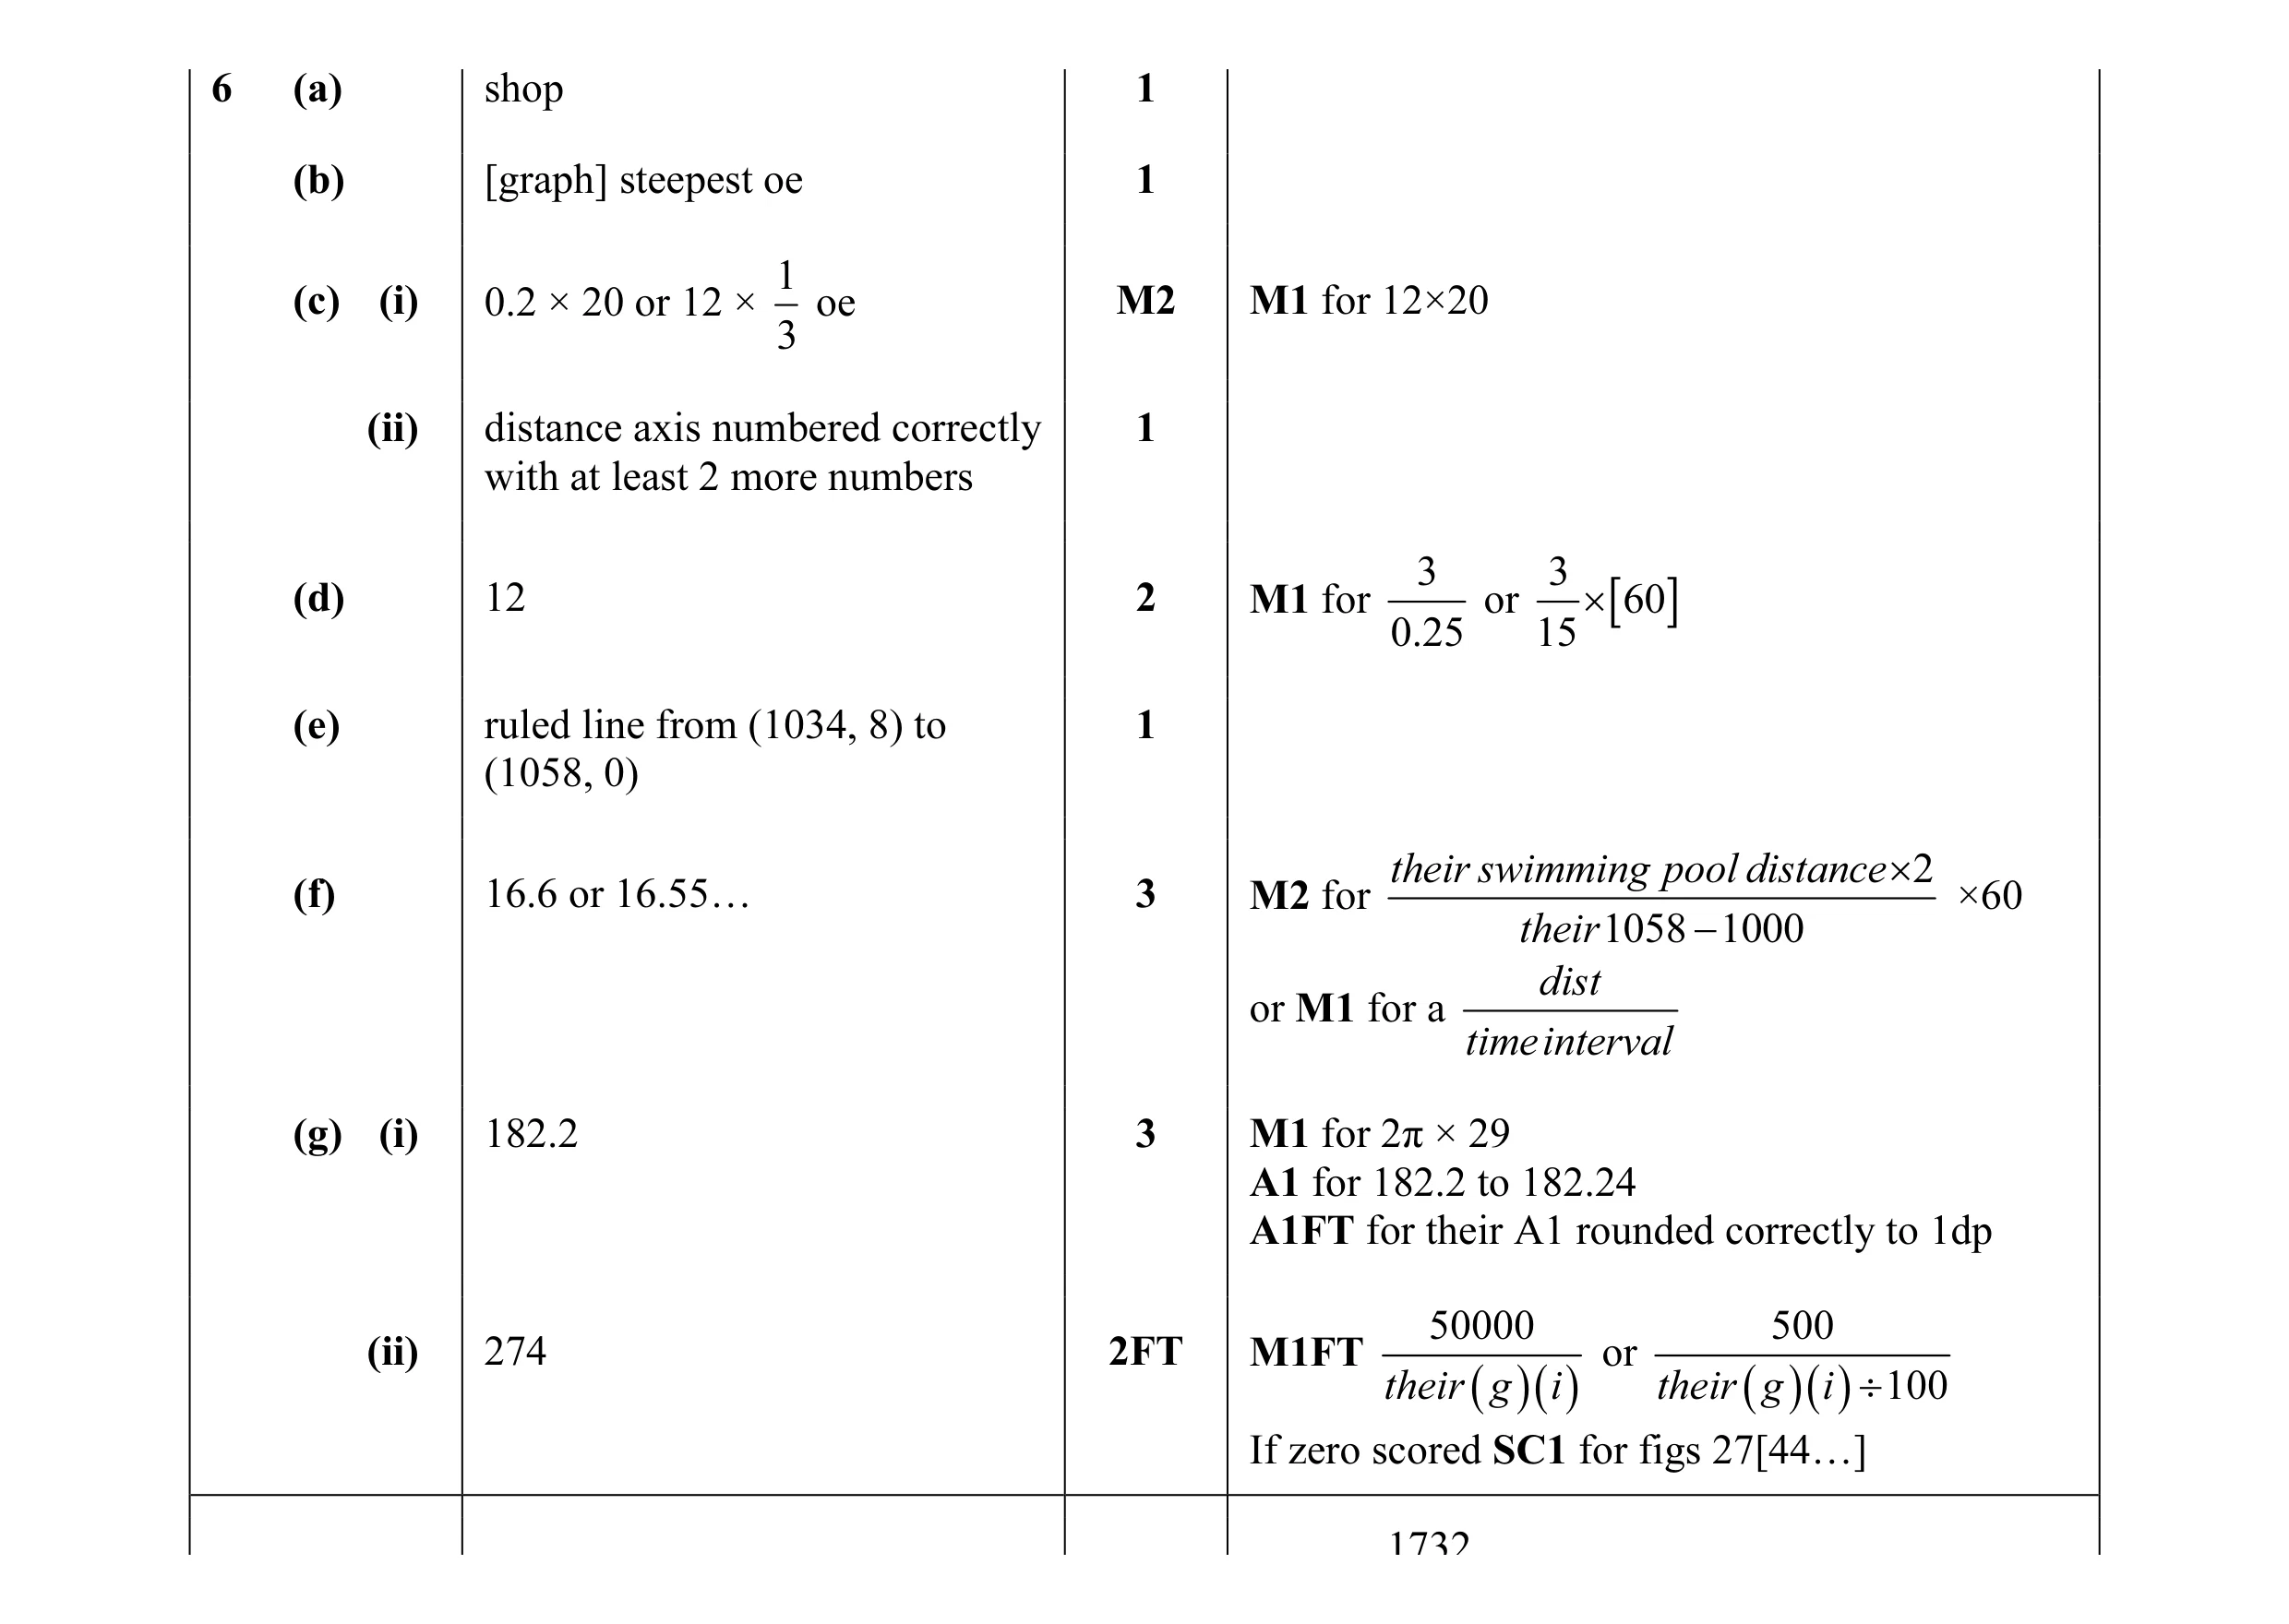 16
16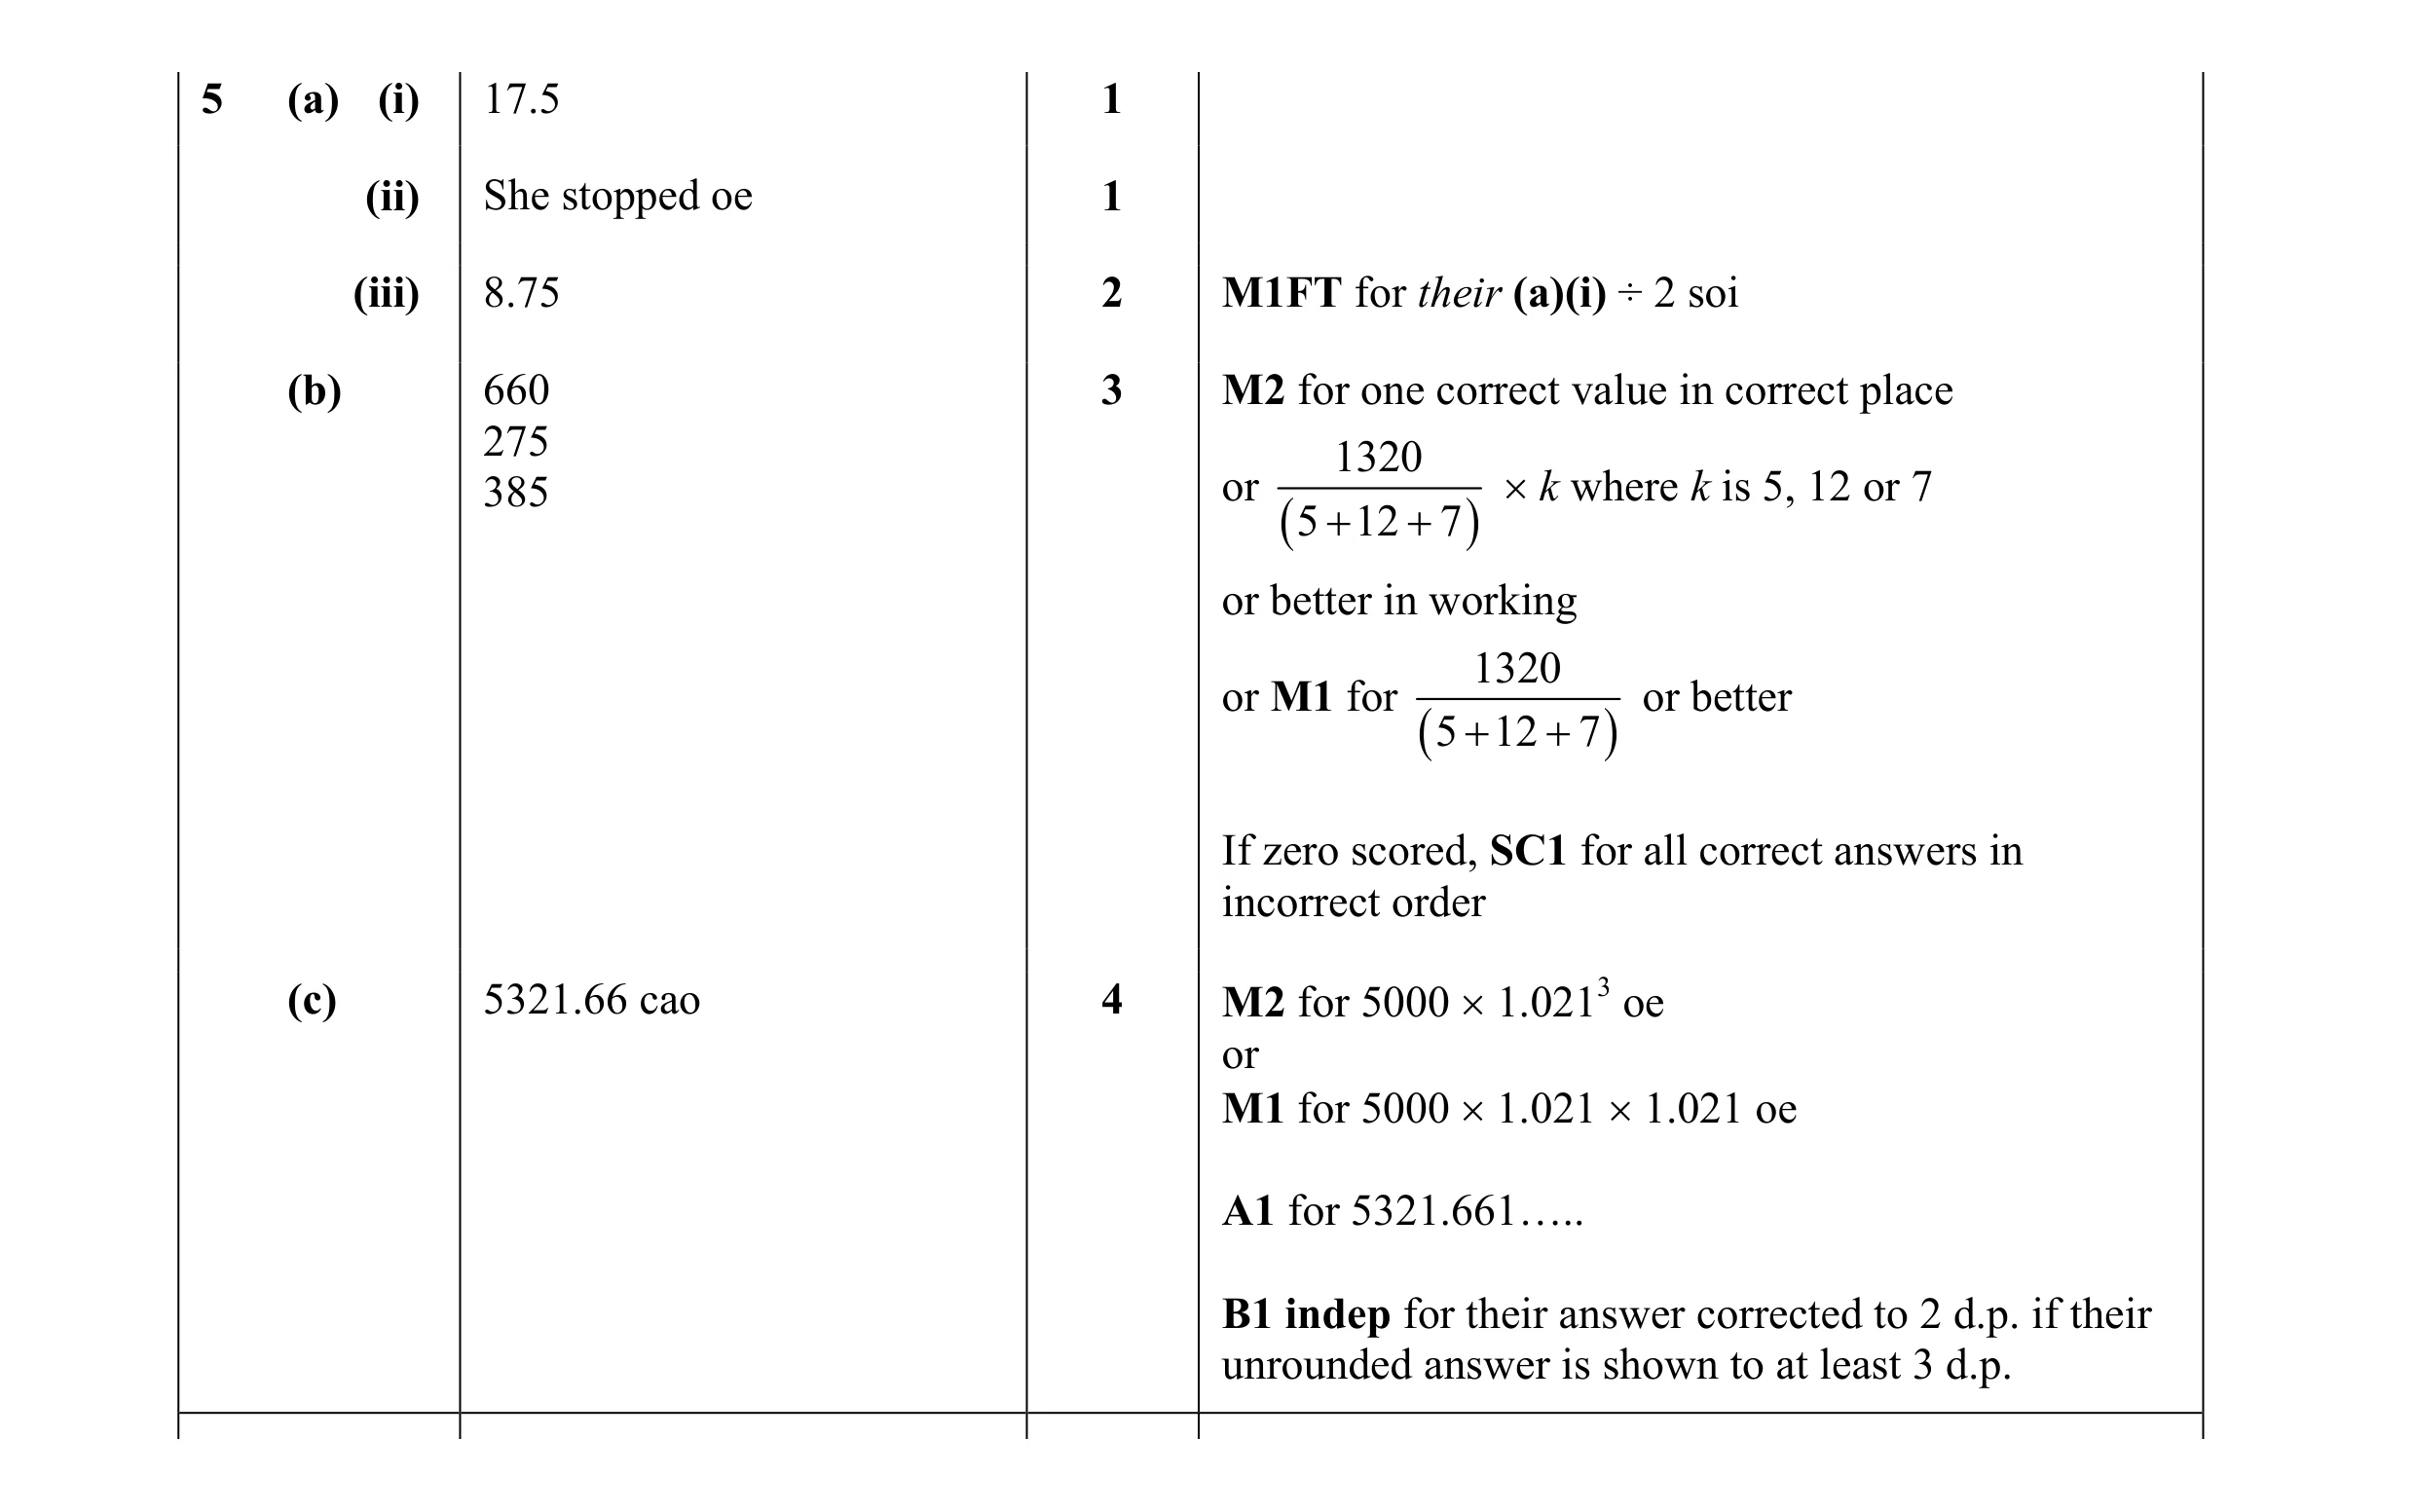 11
11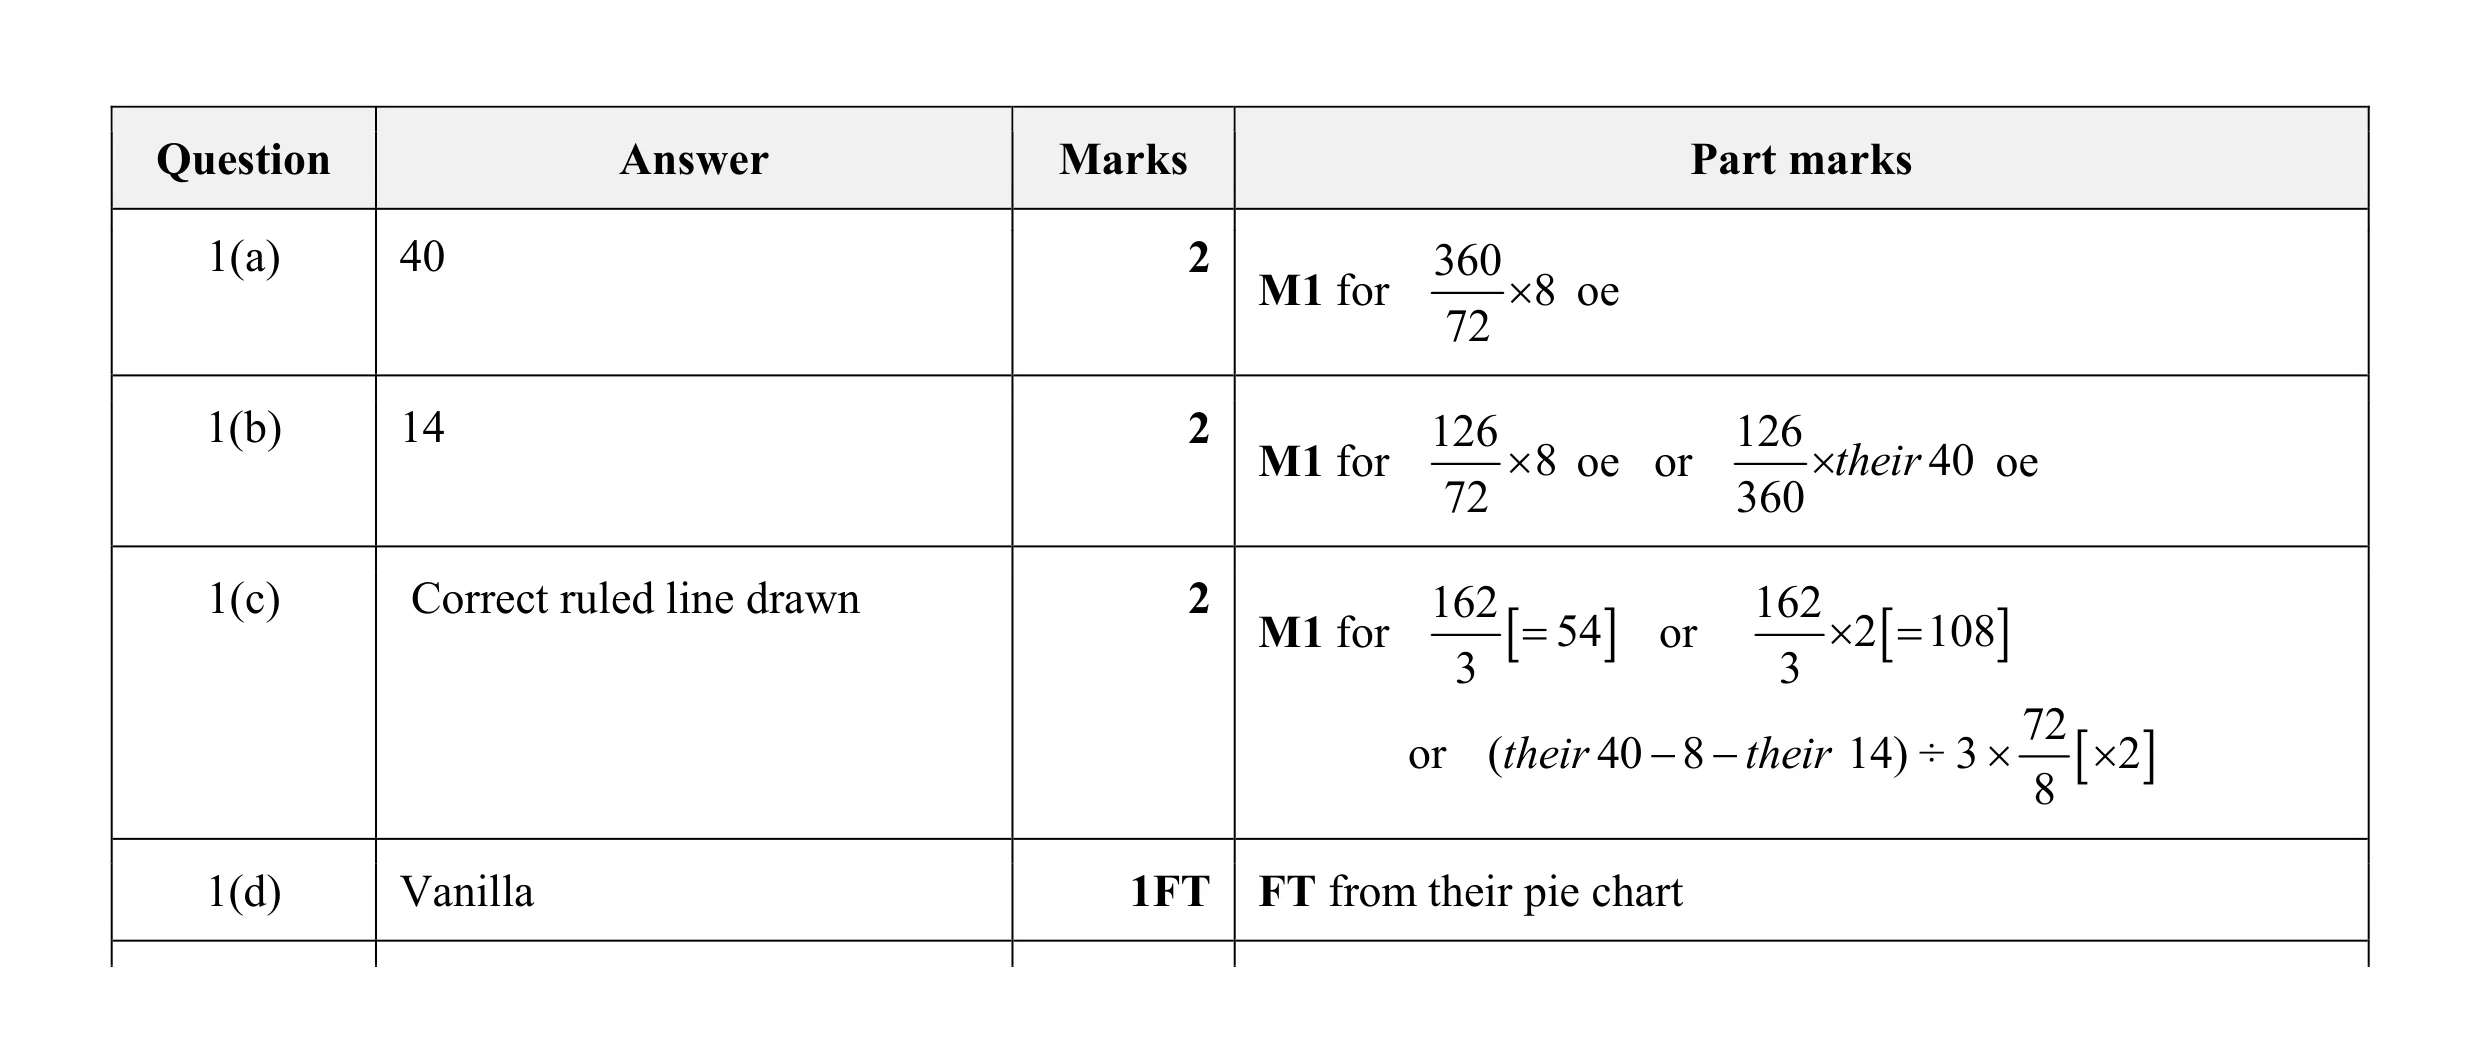 7
7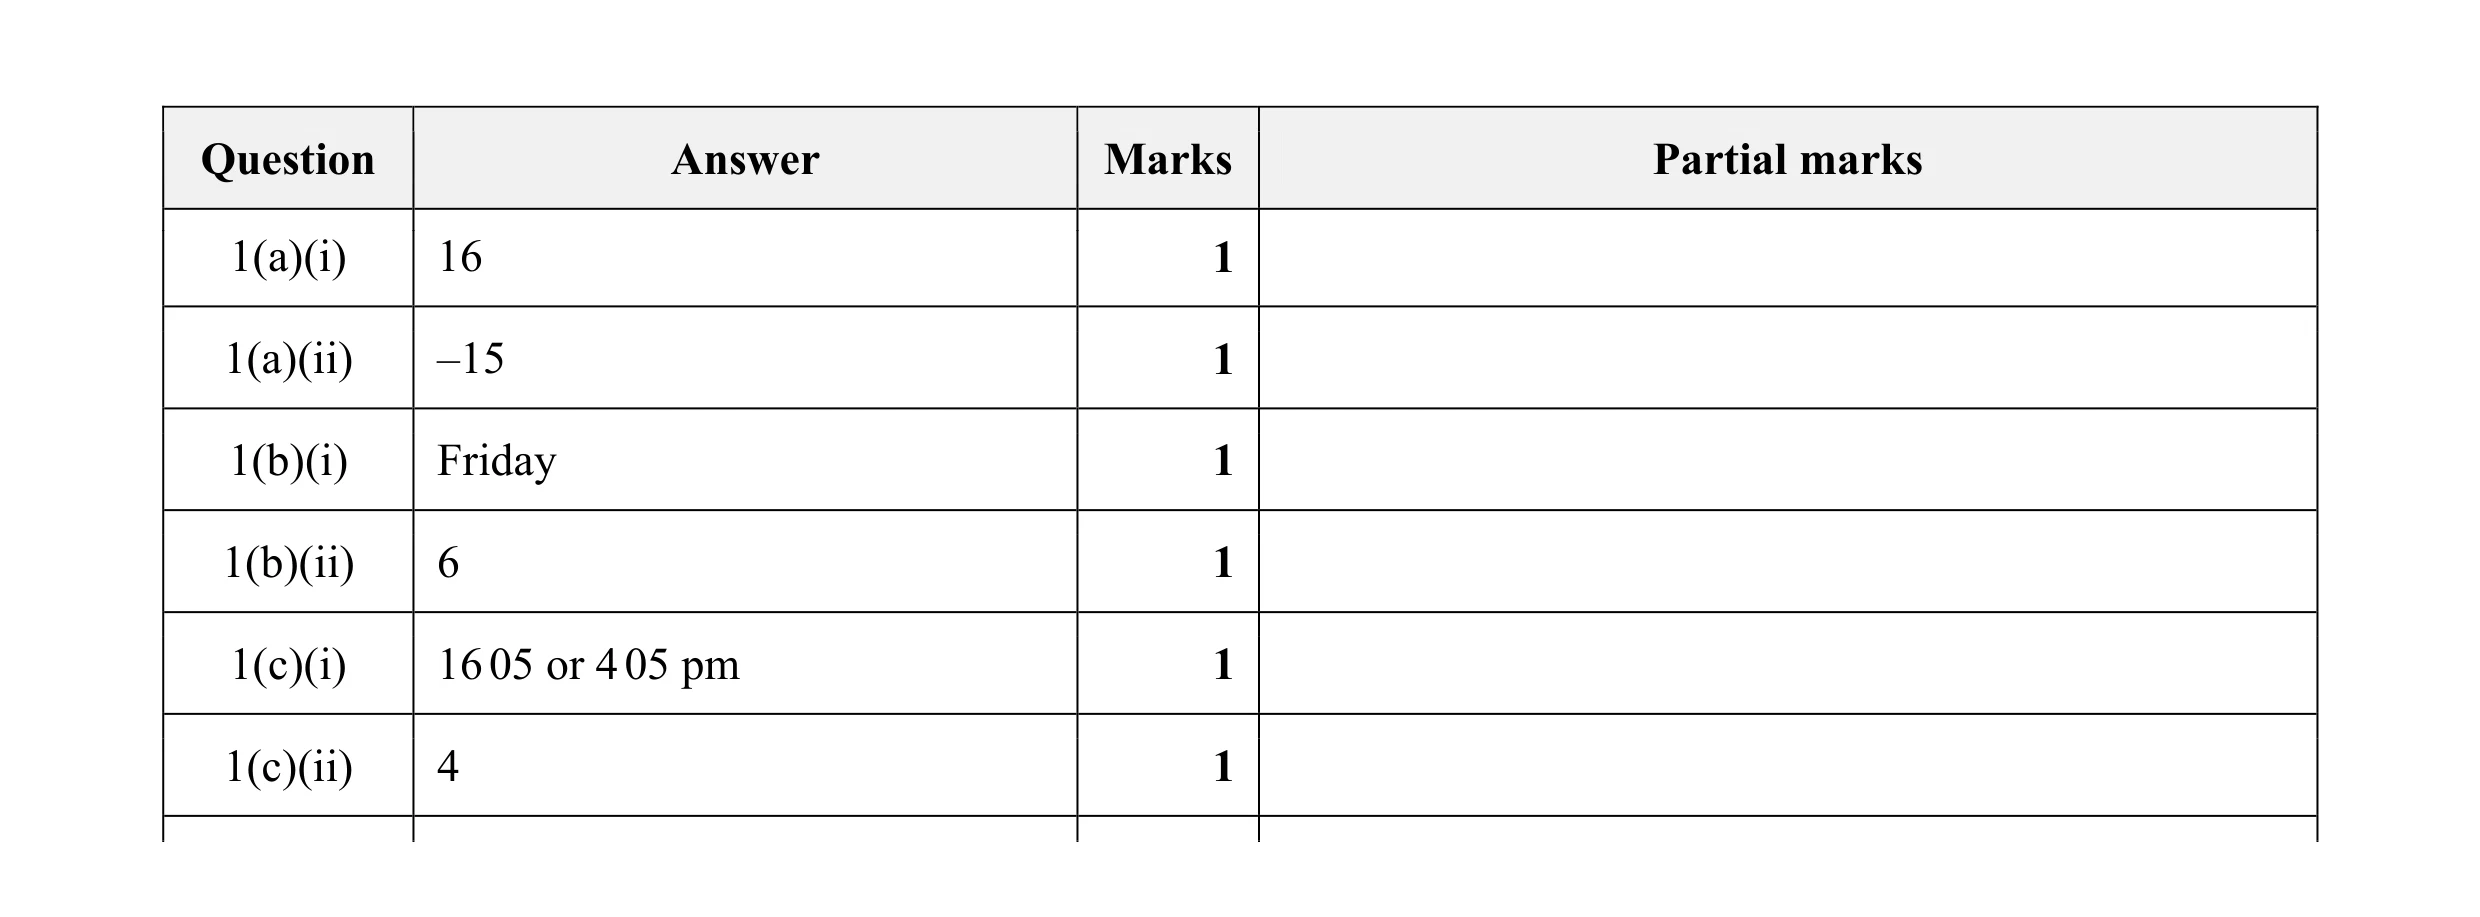 6
6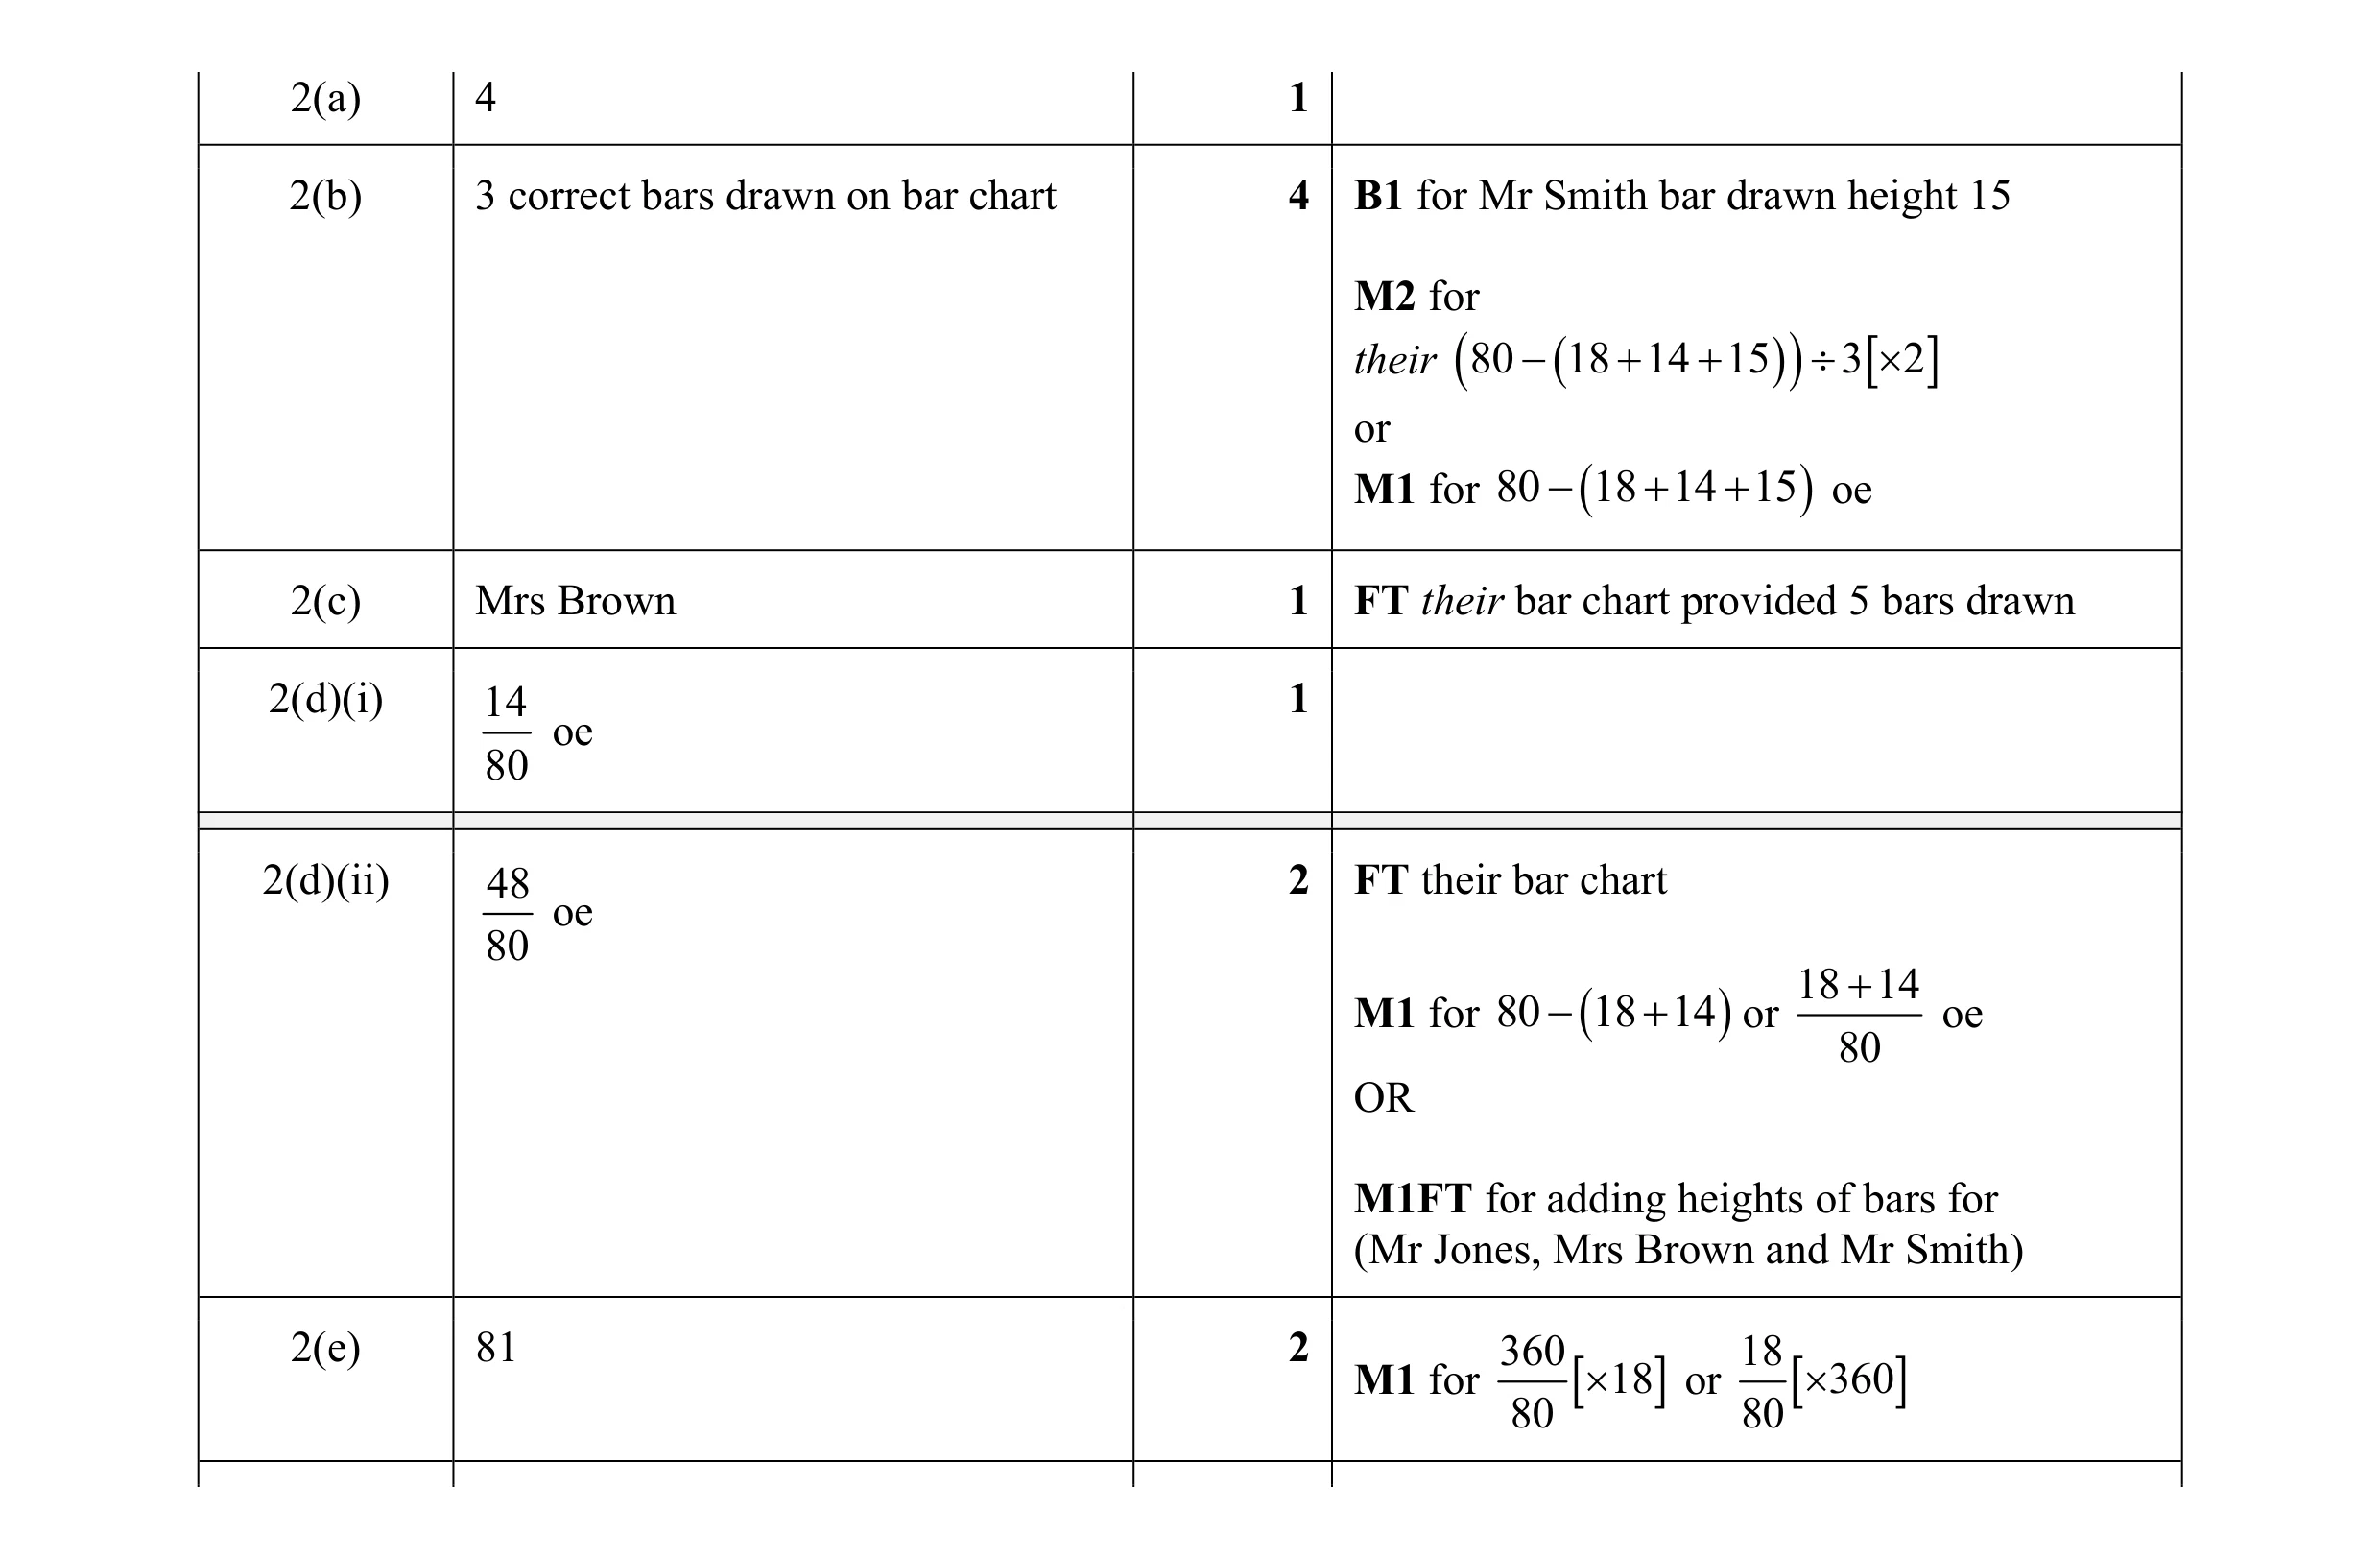 11
11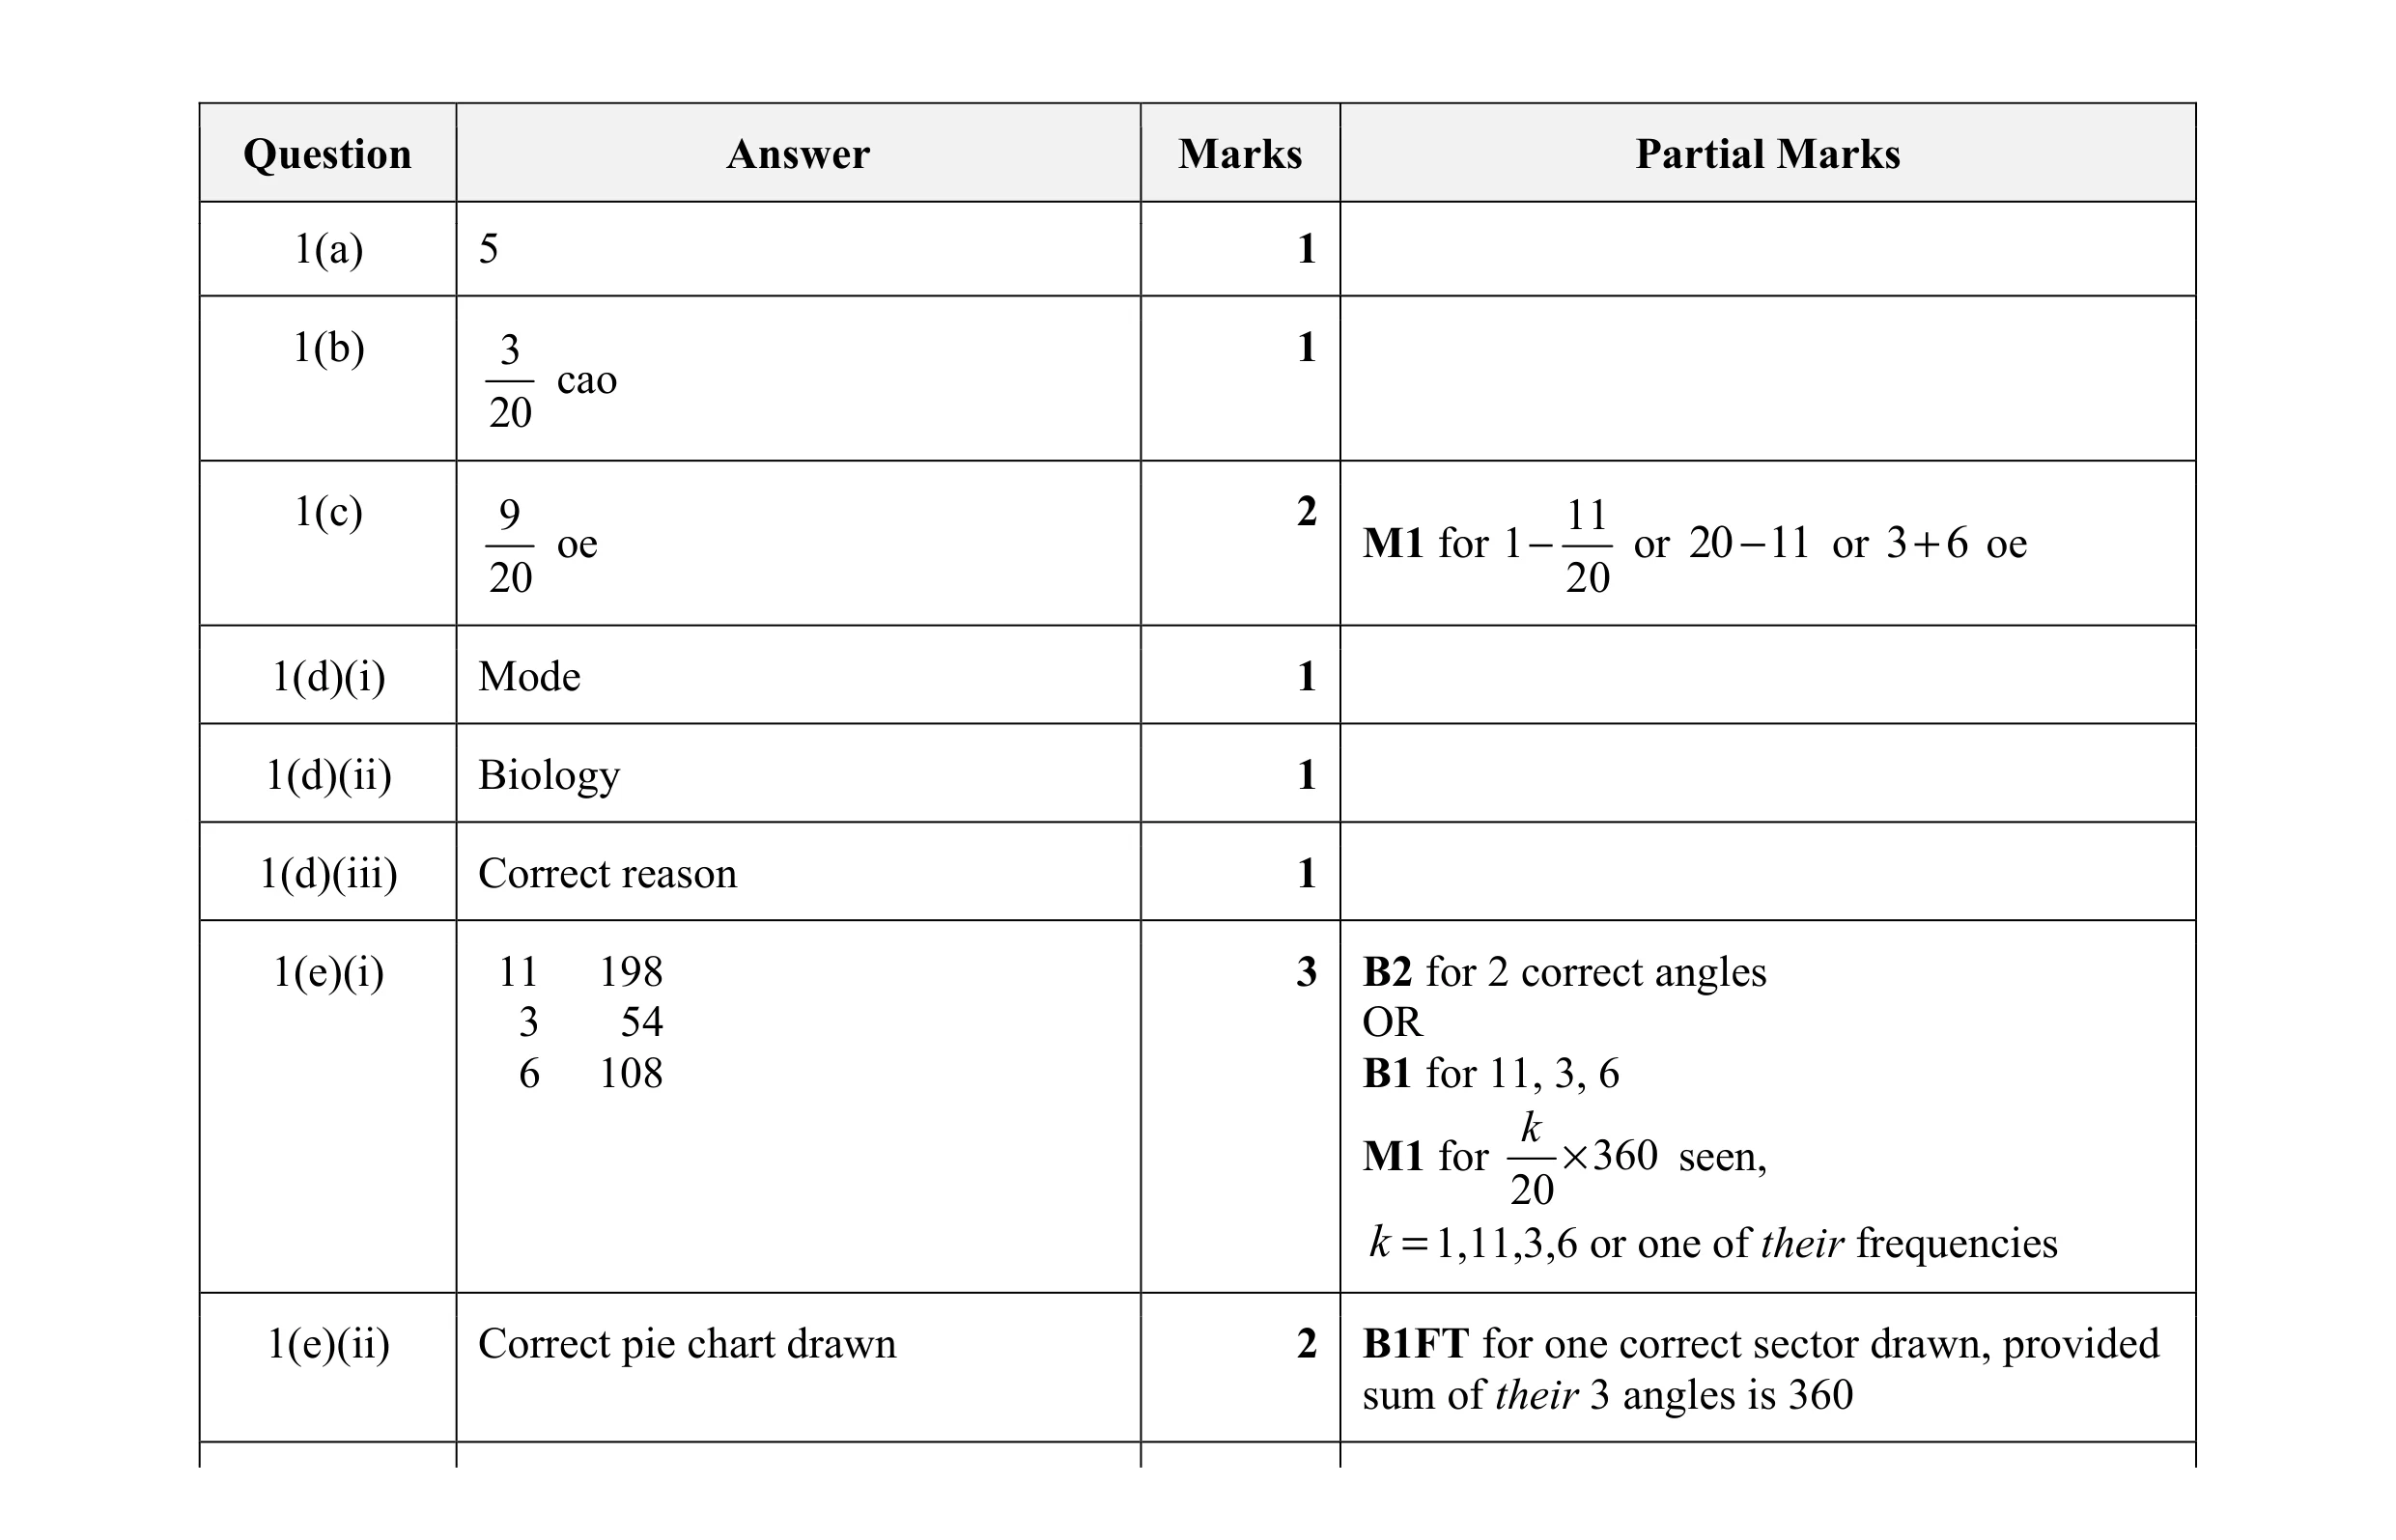 12
12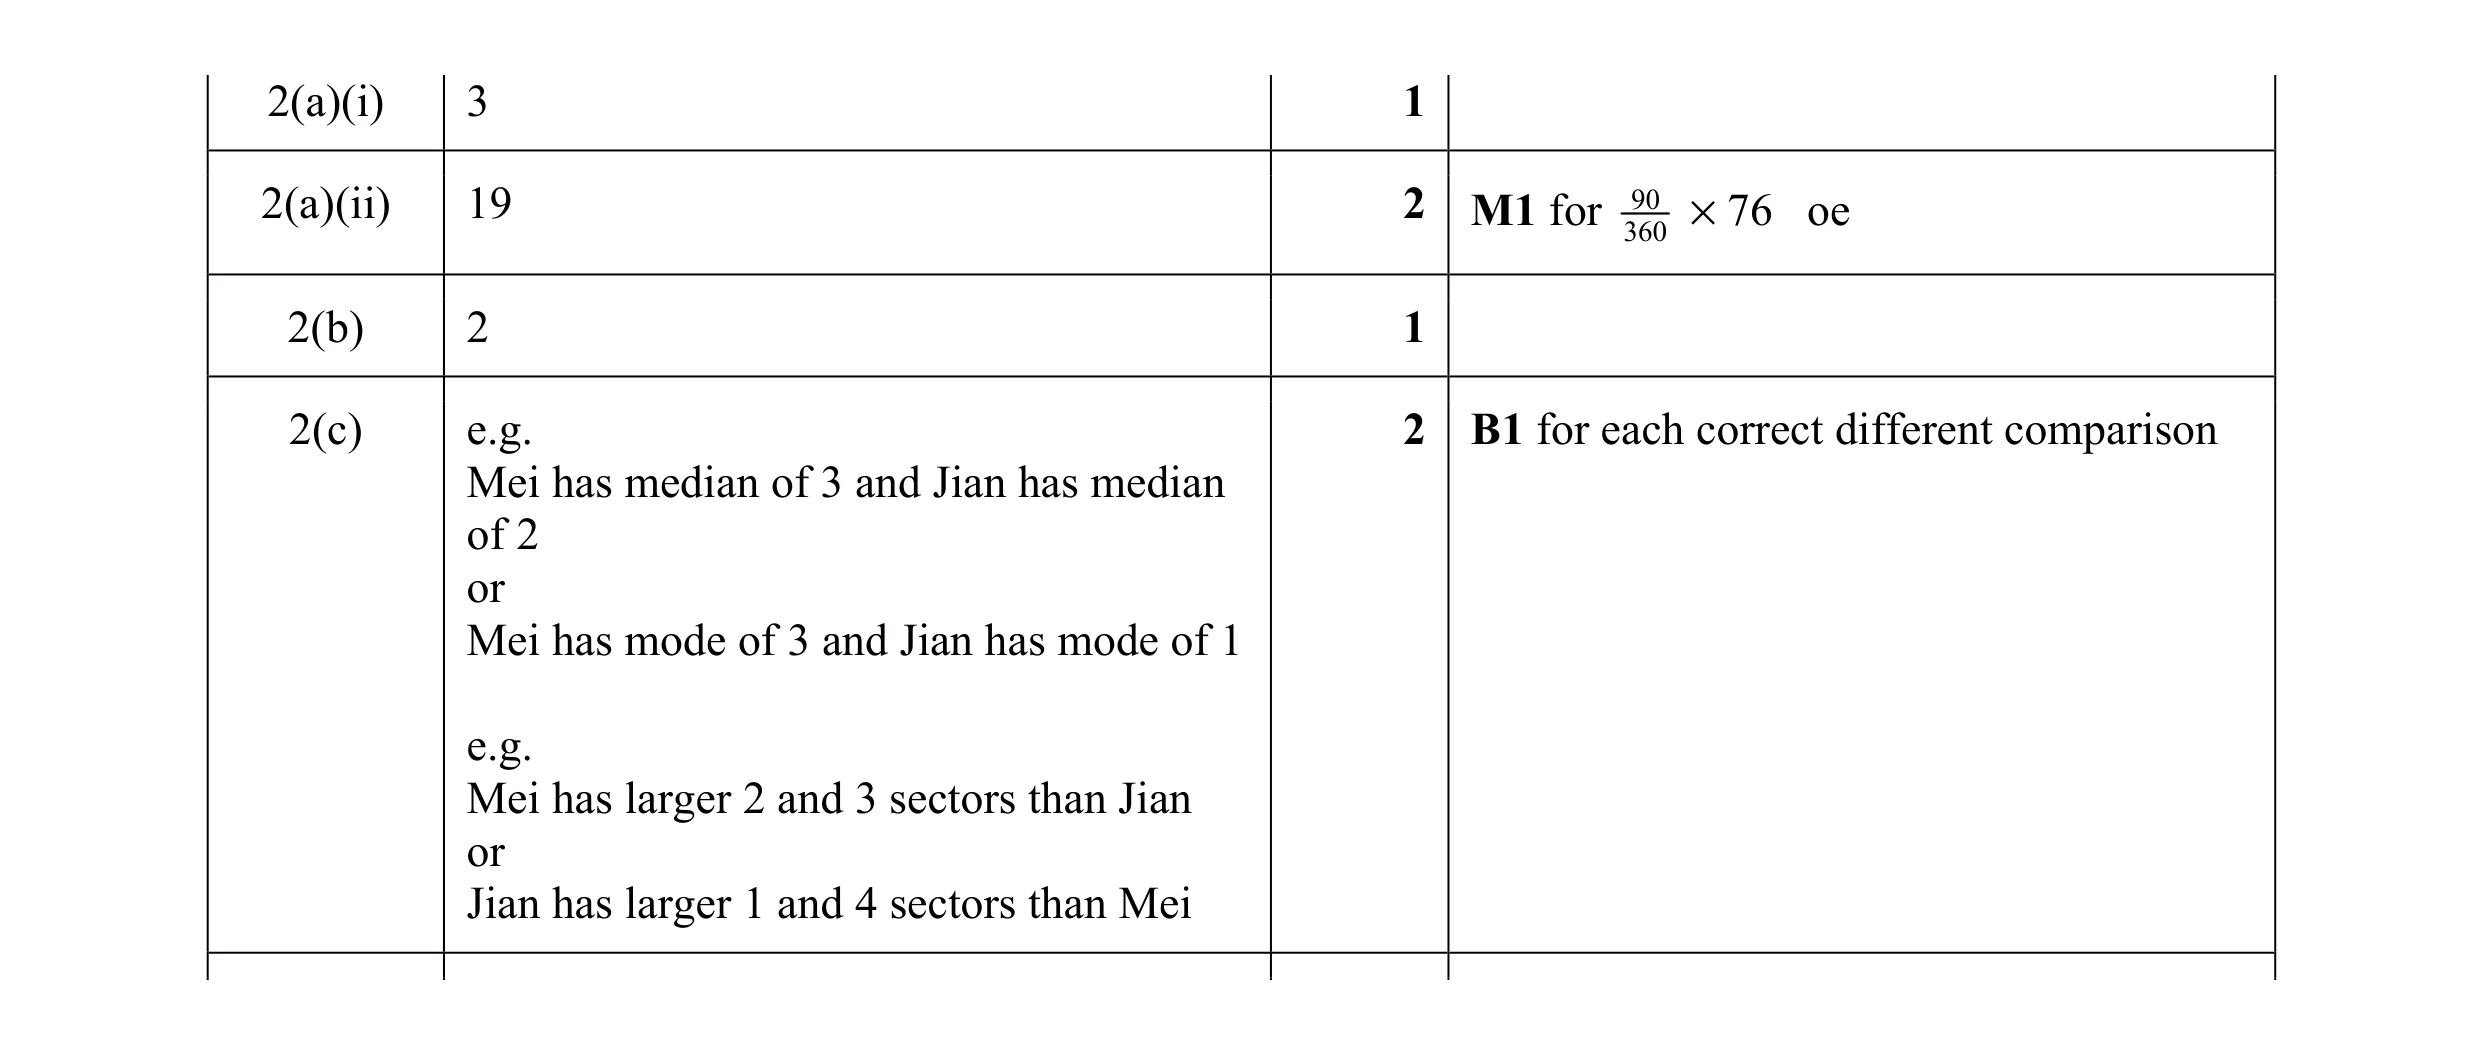 6
6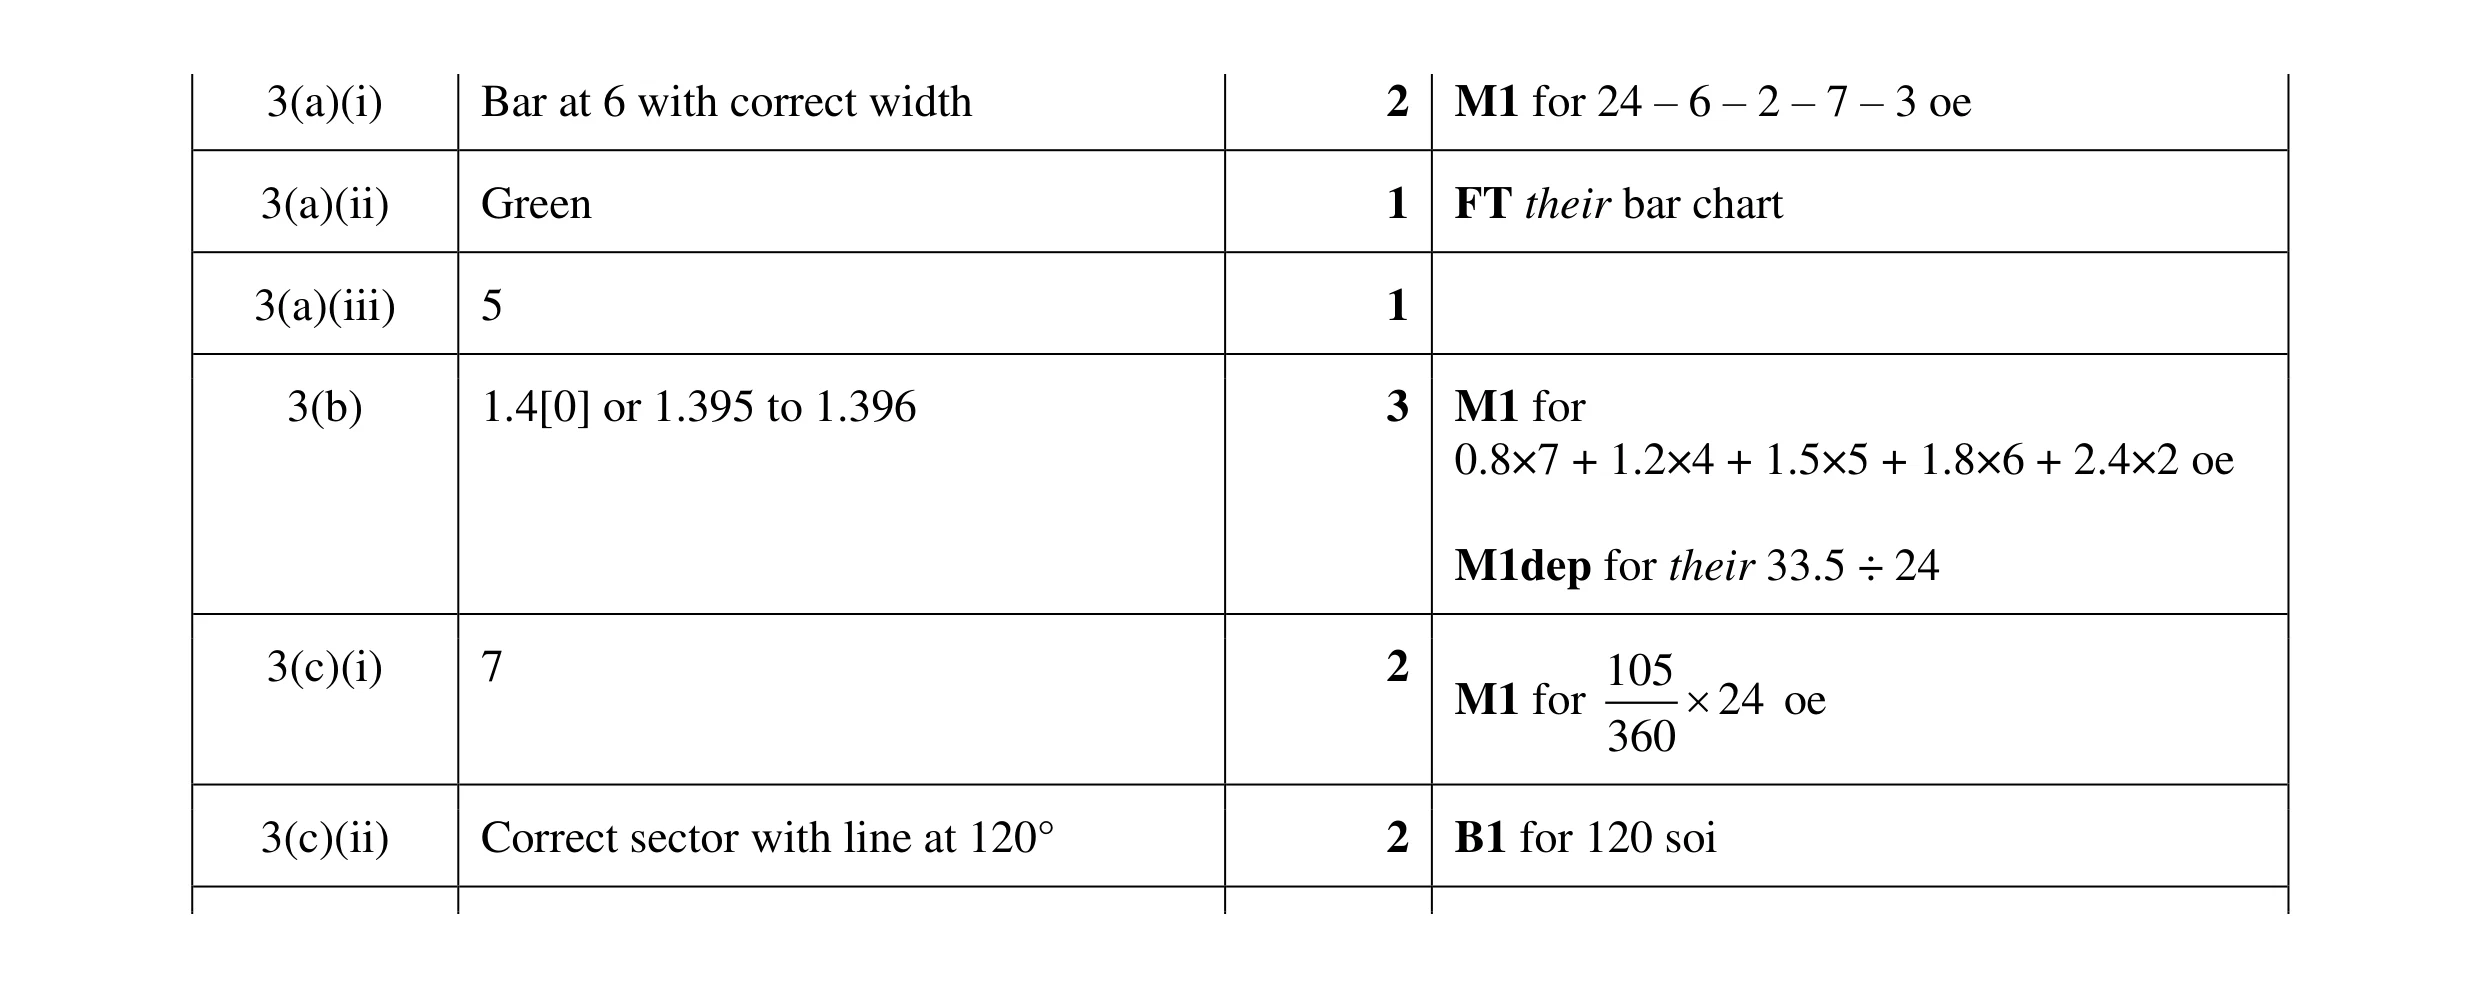 11
11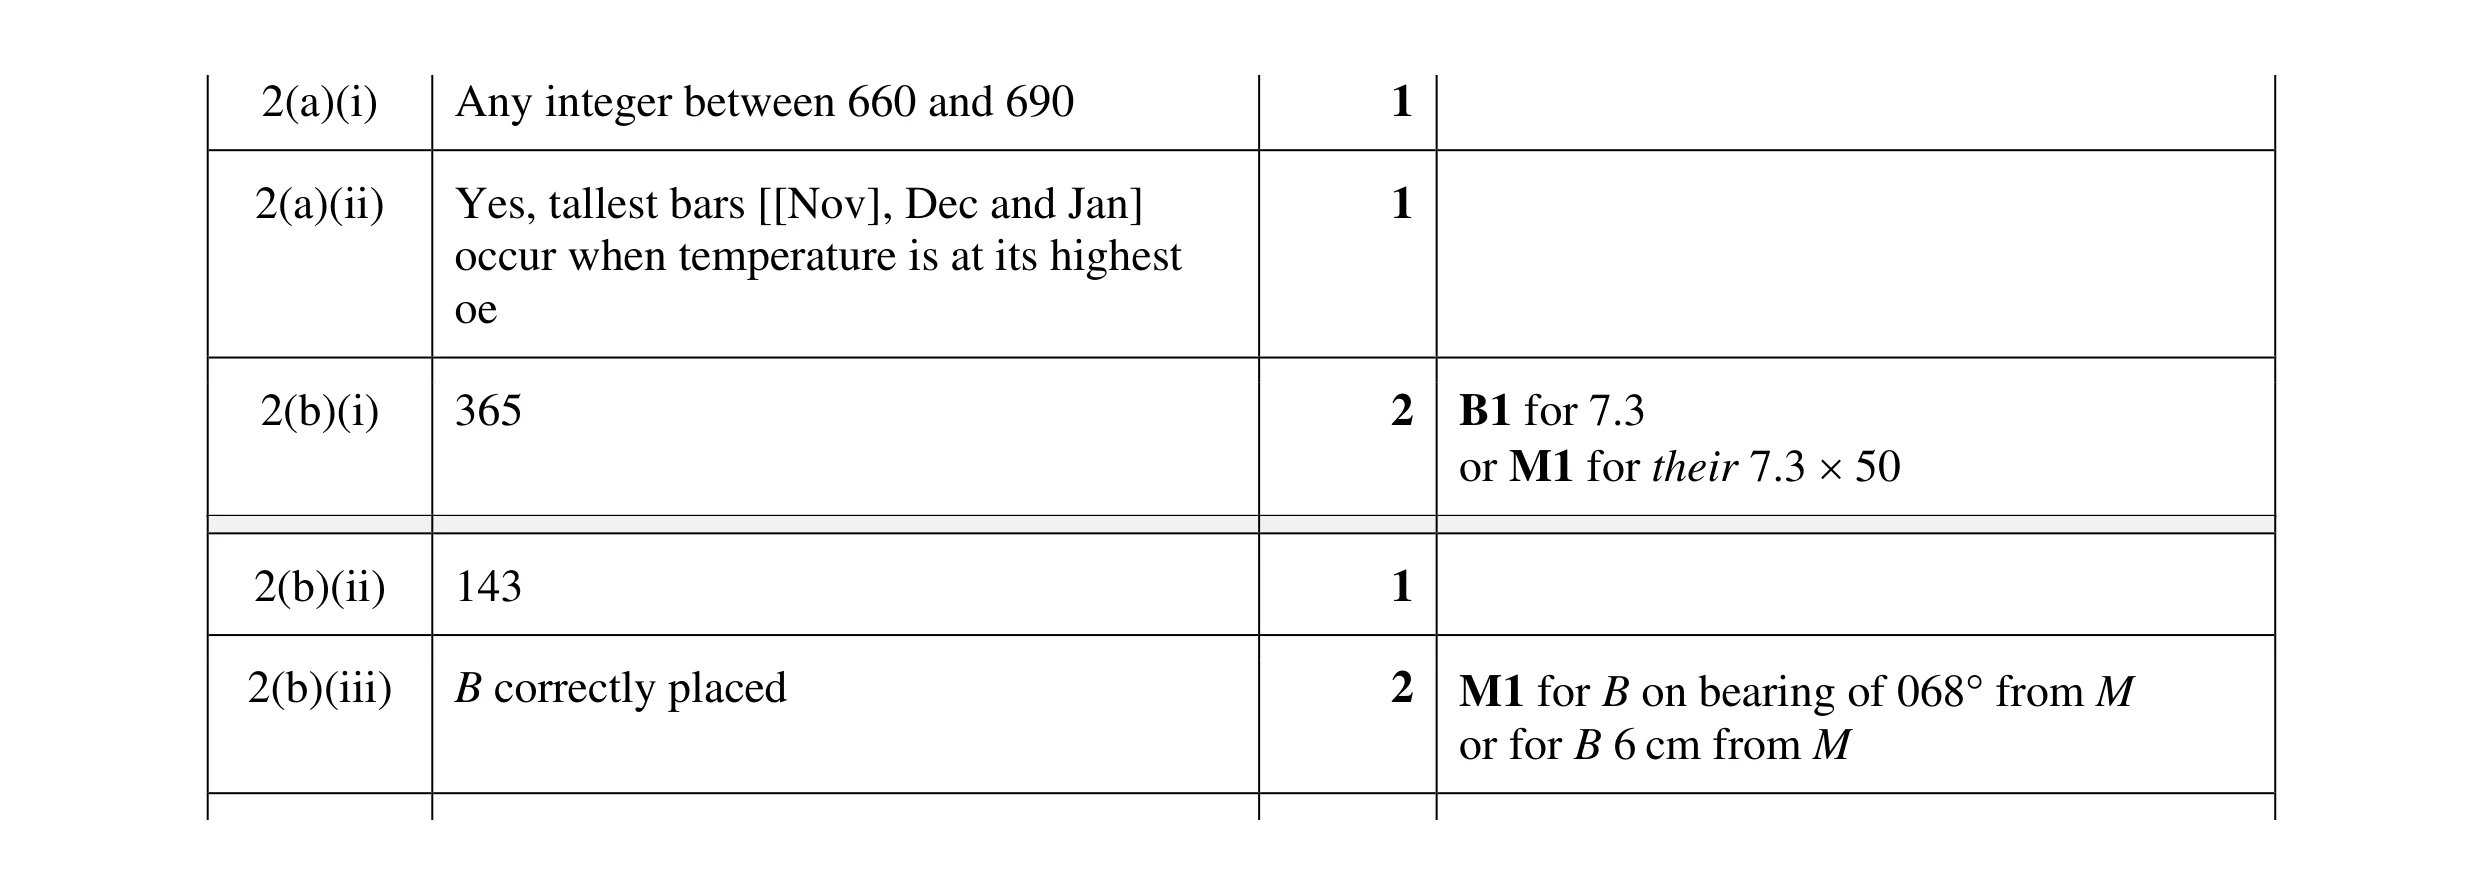 7
7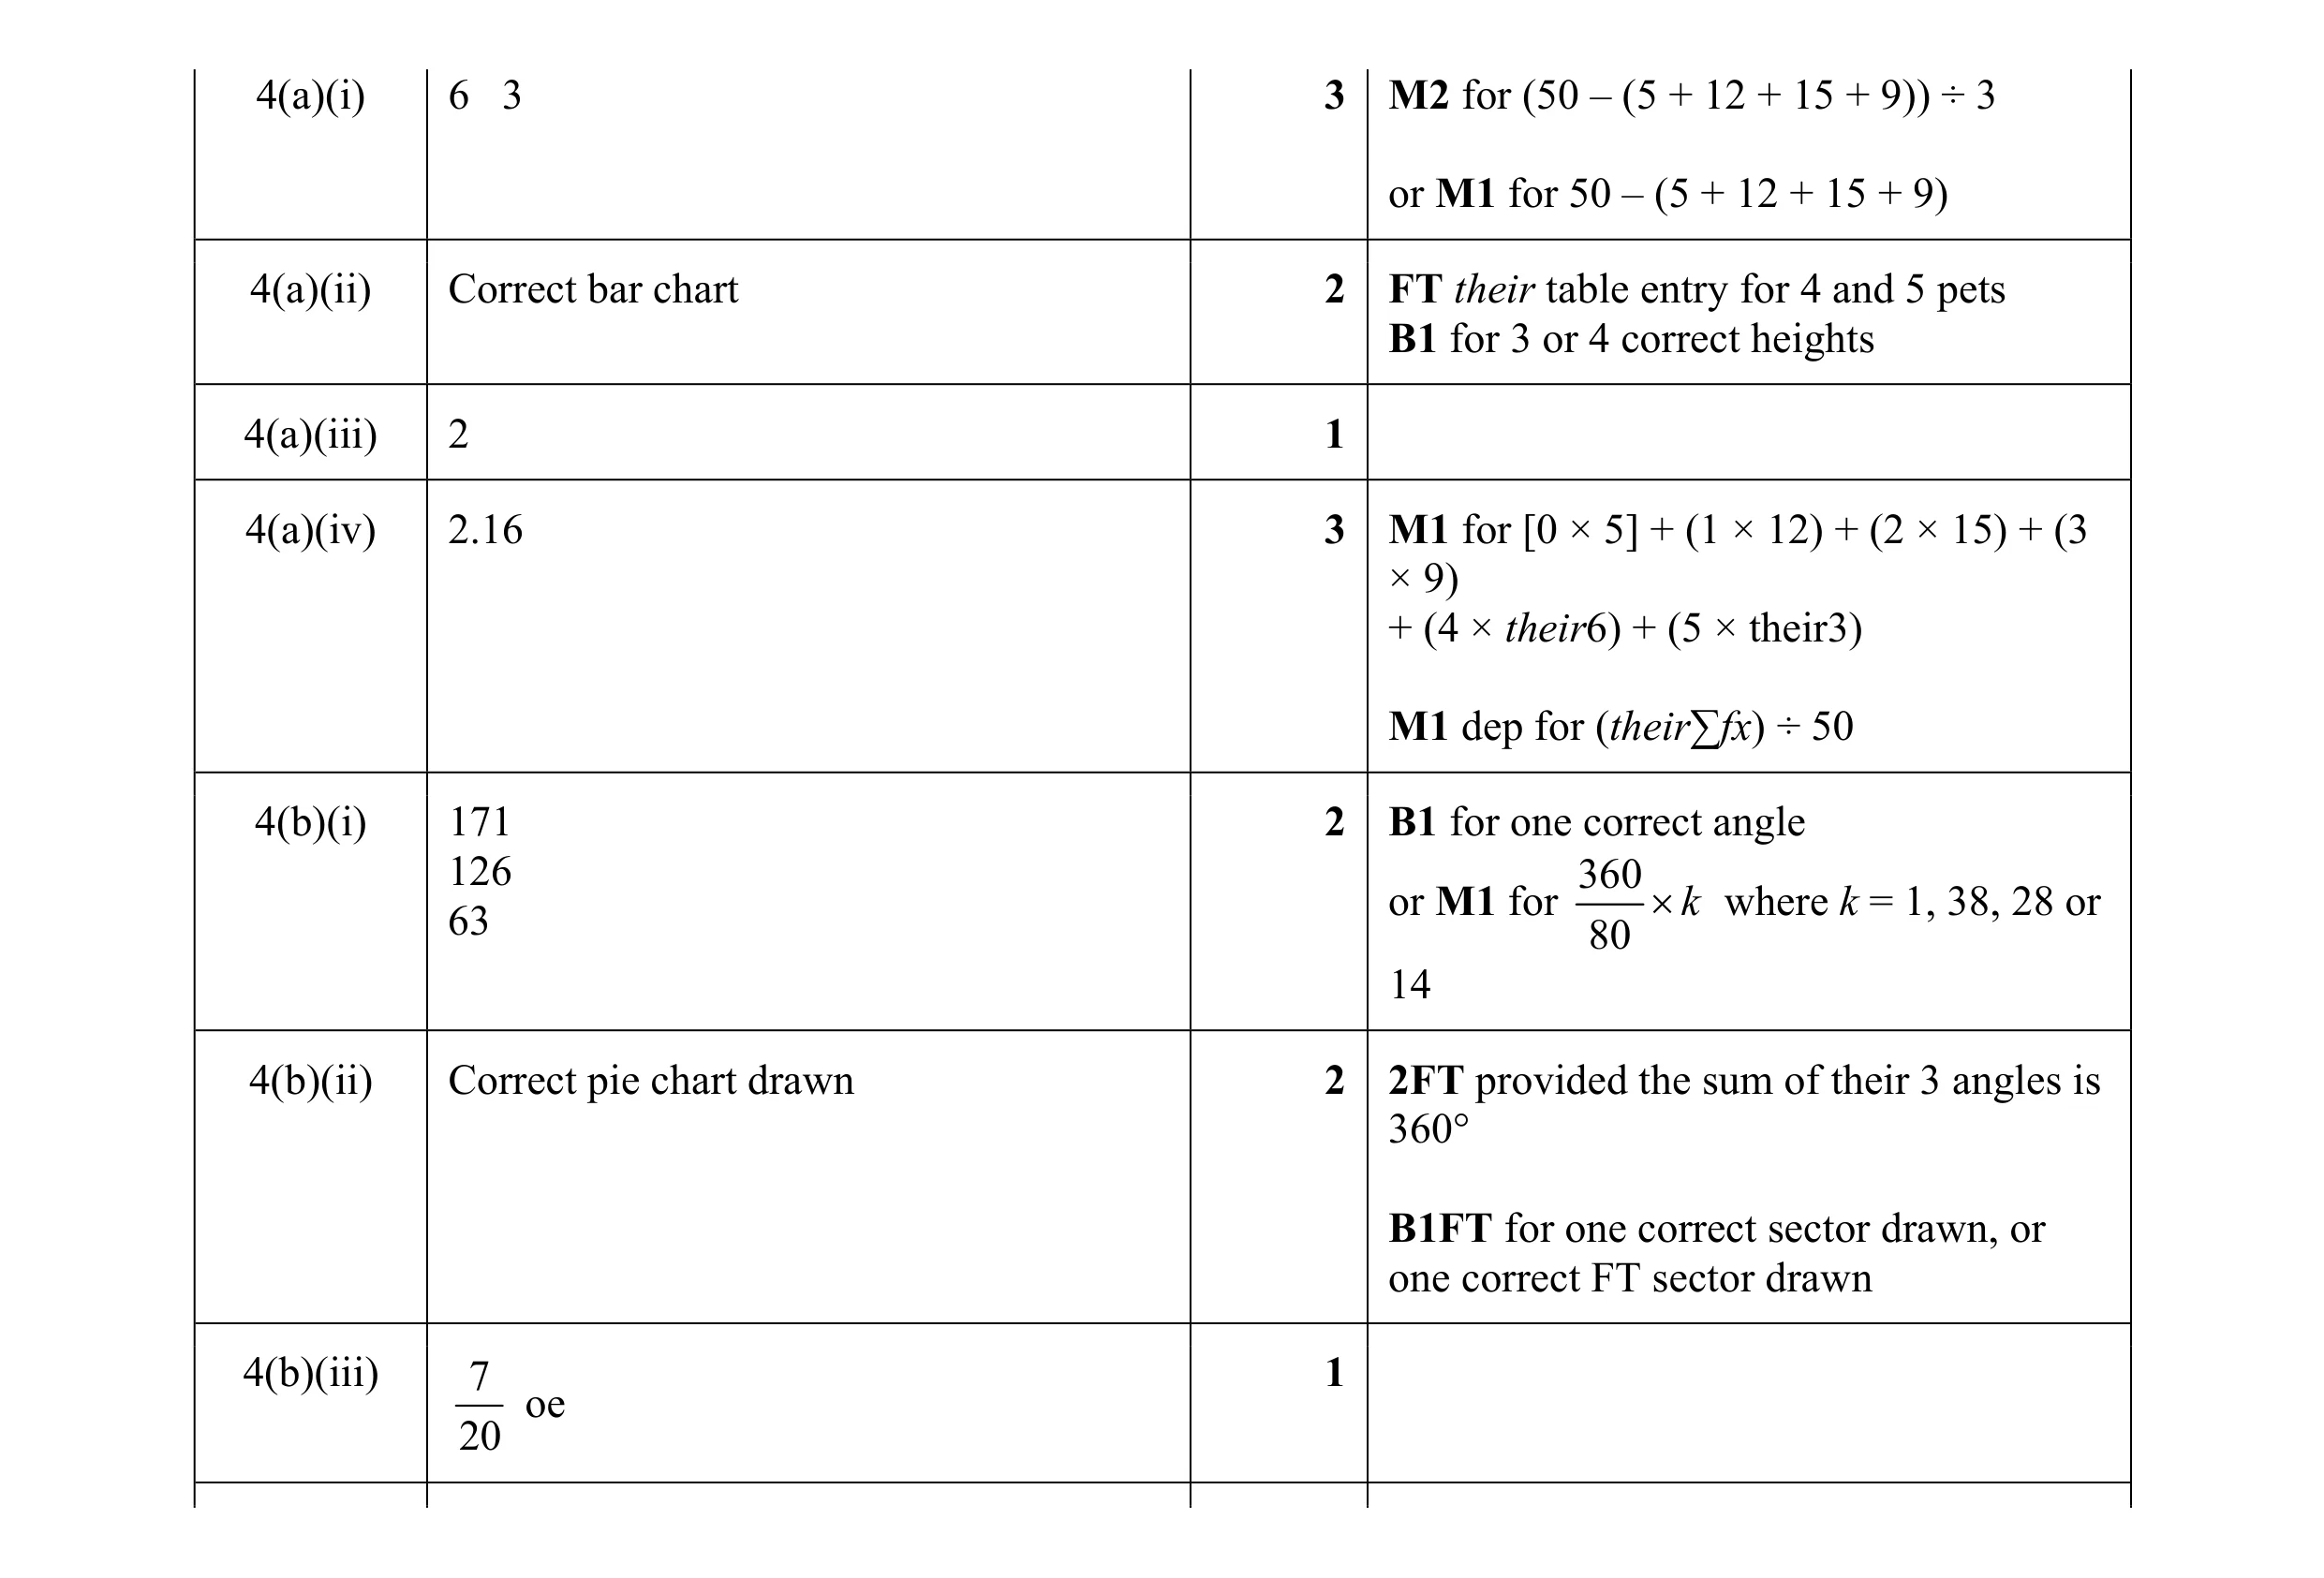 14
14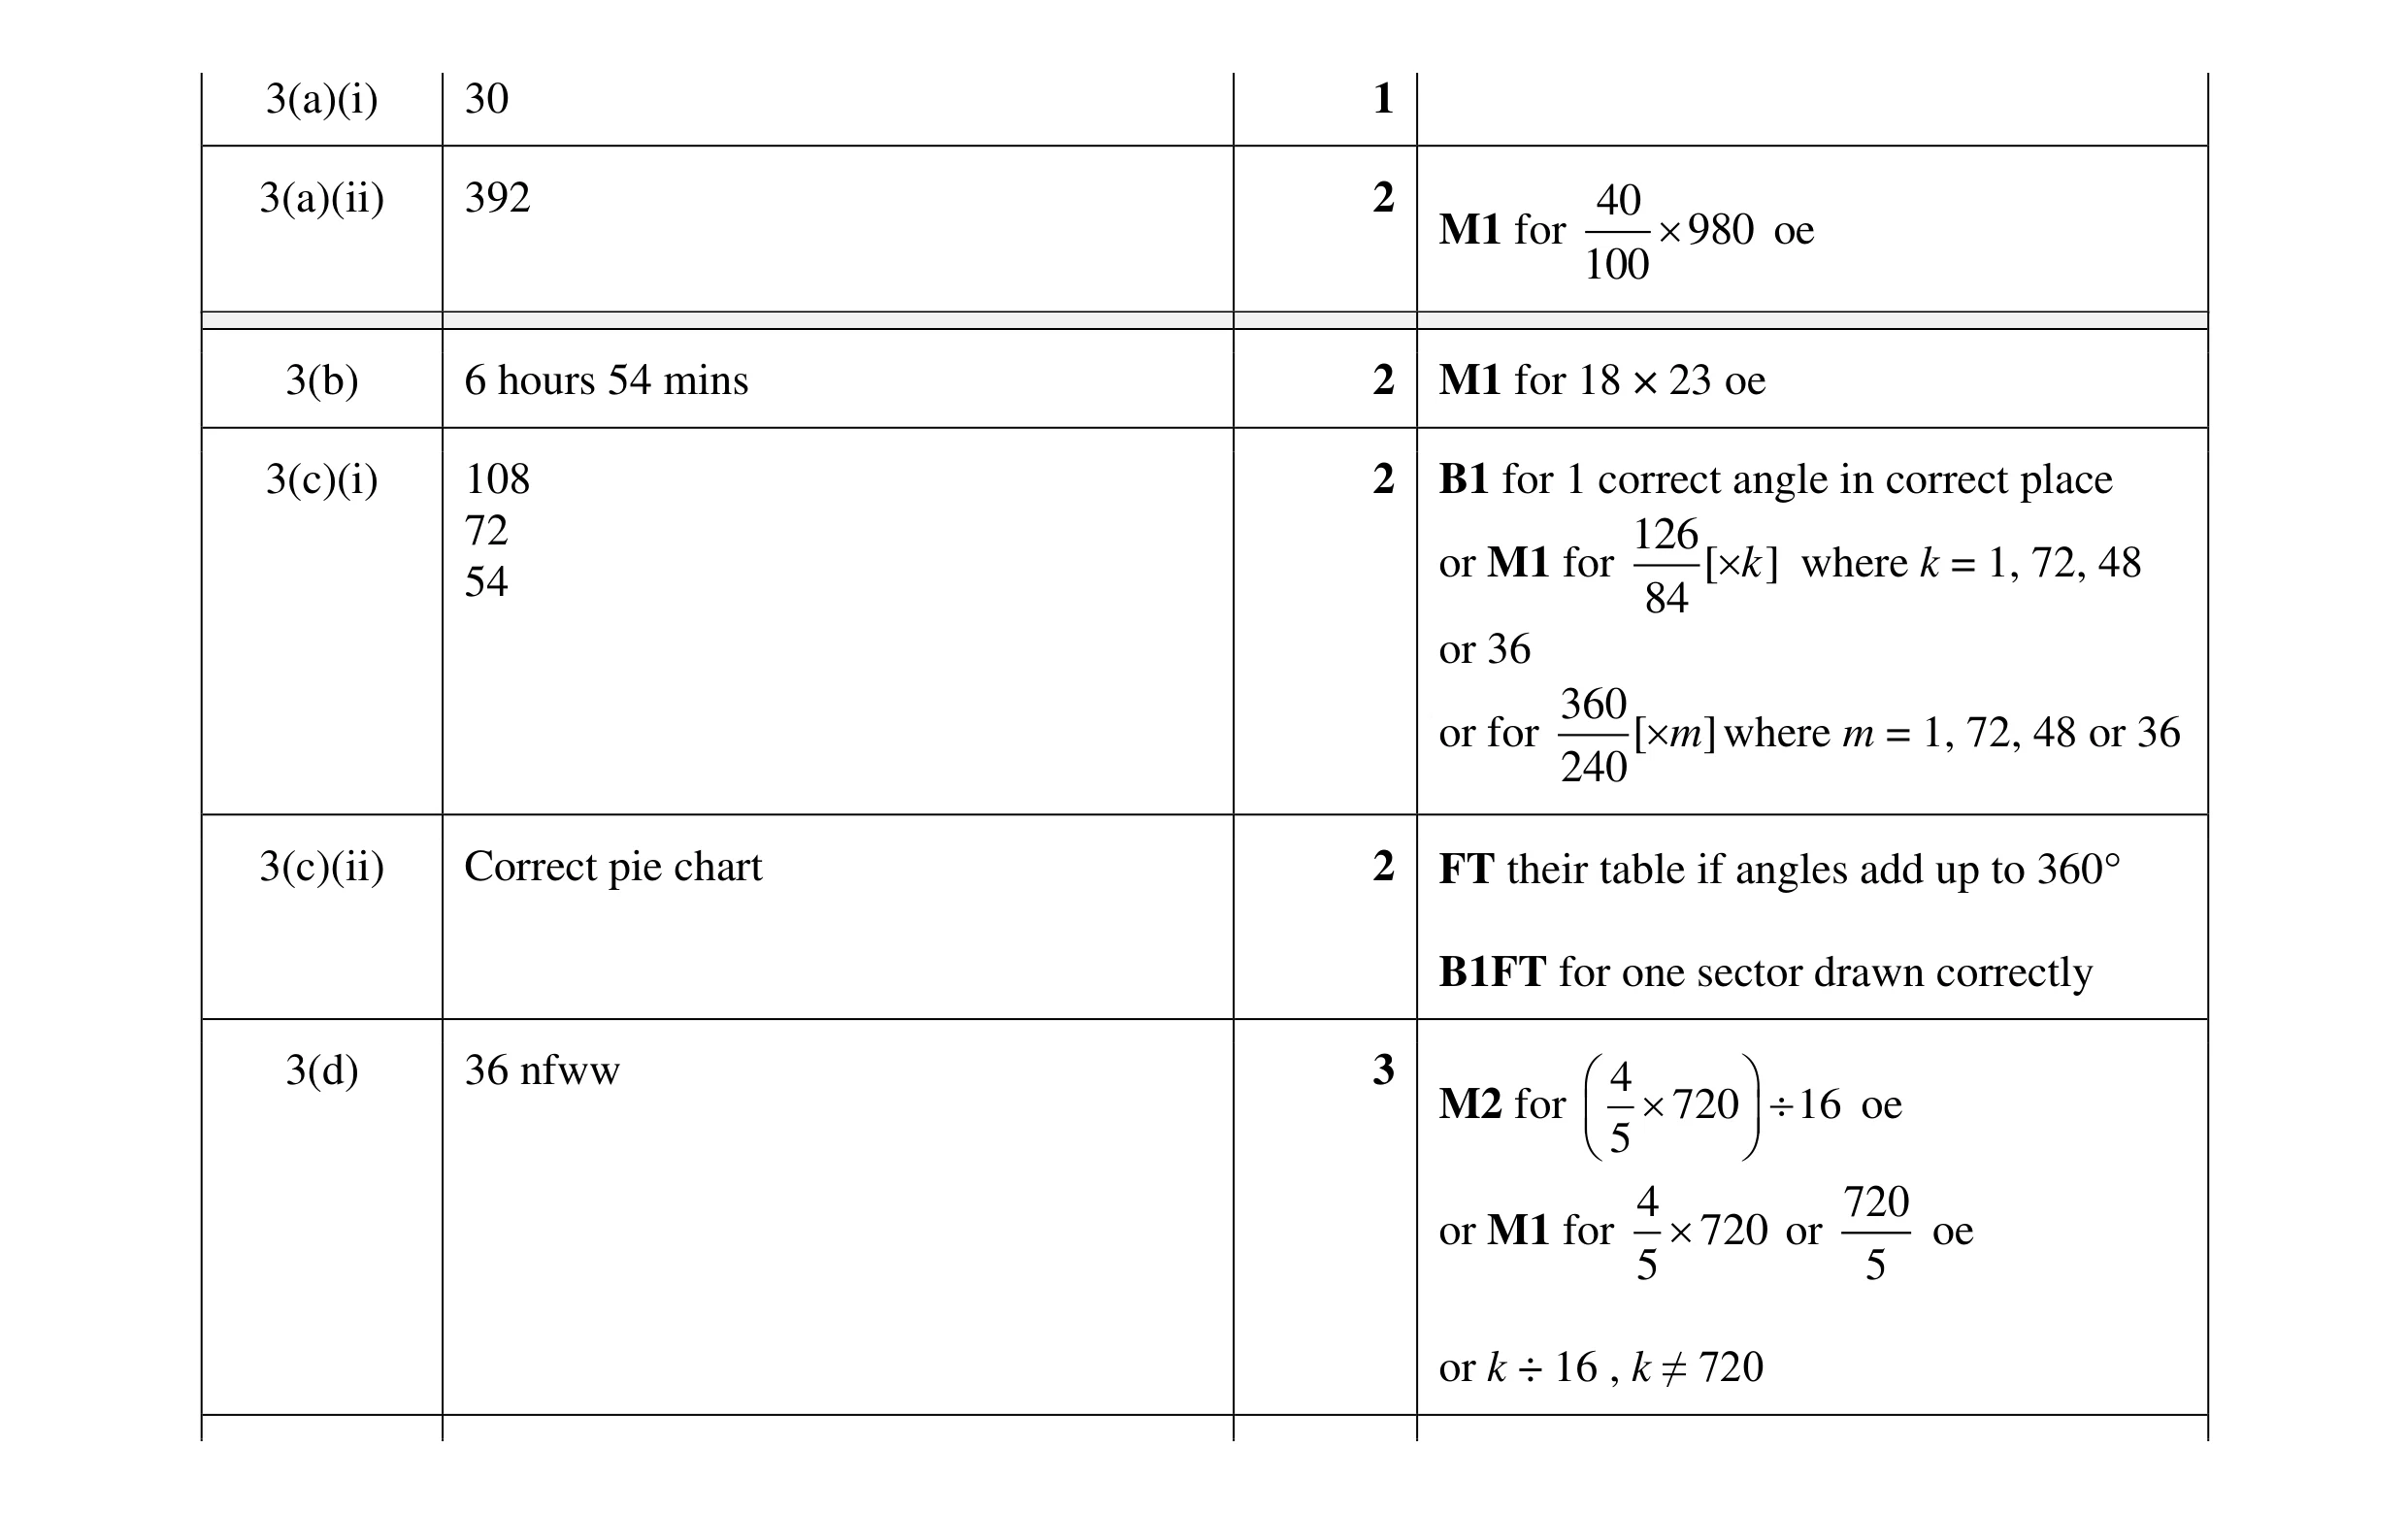 12
12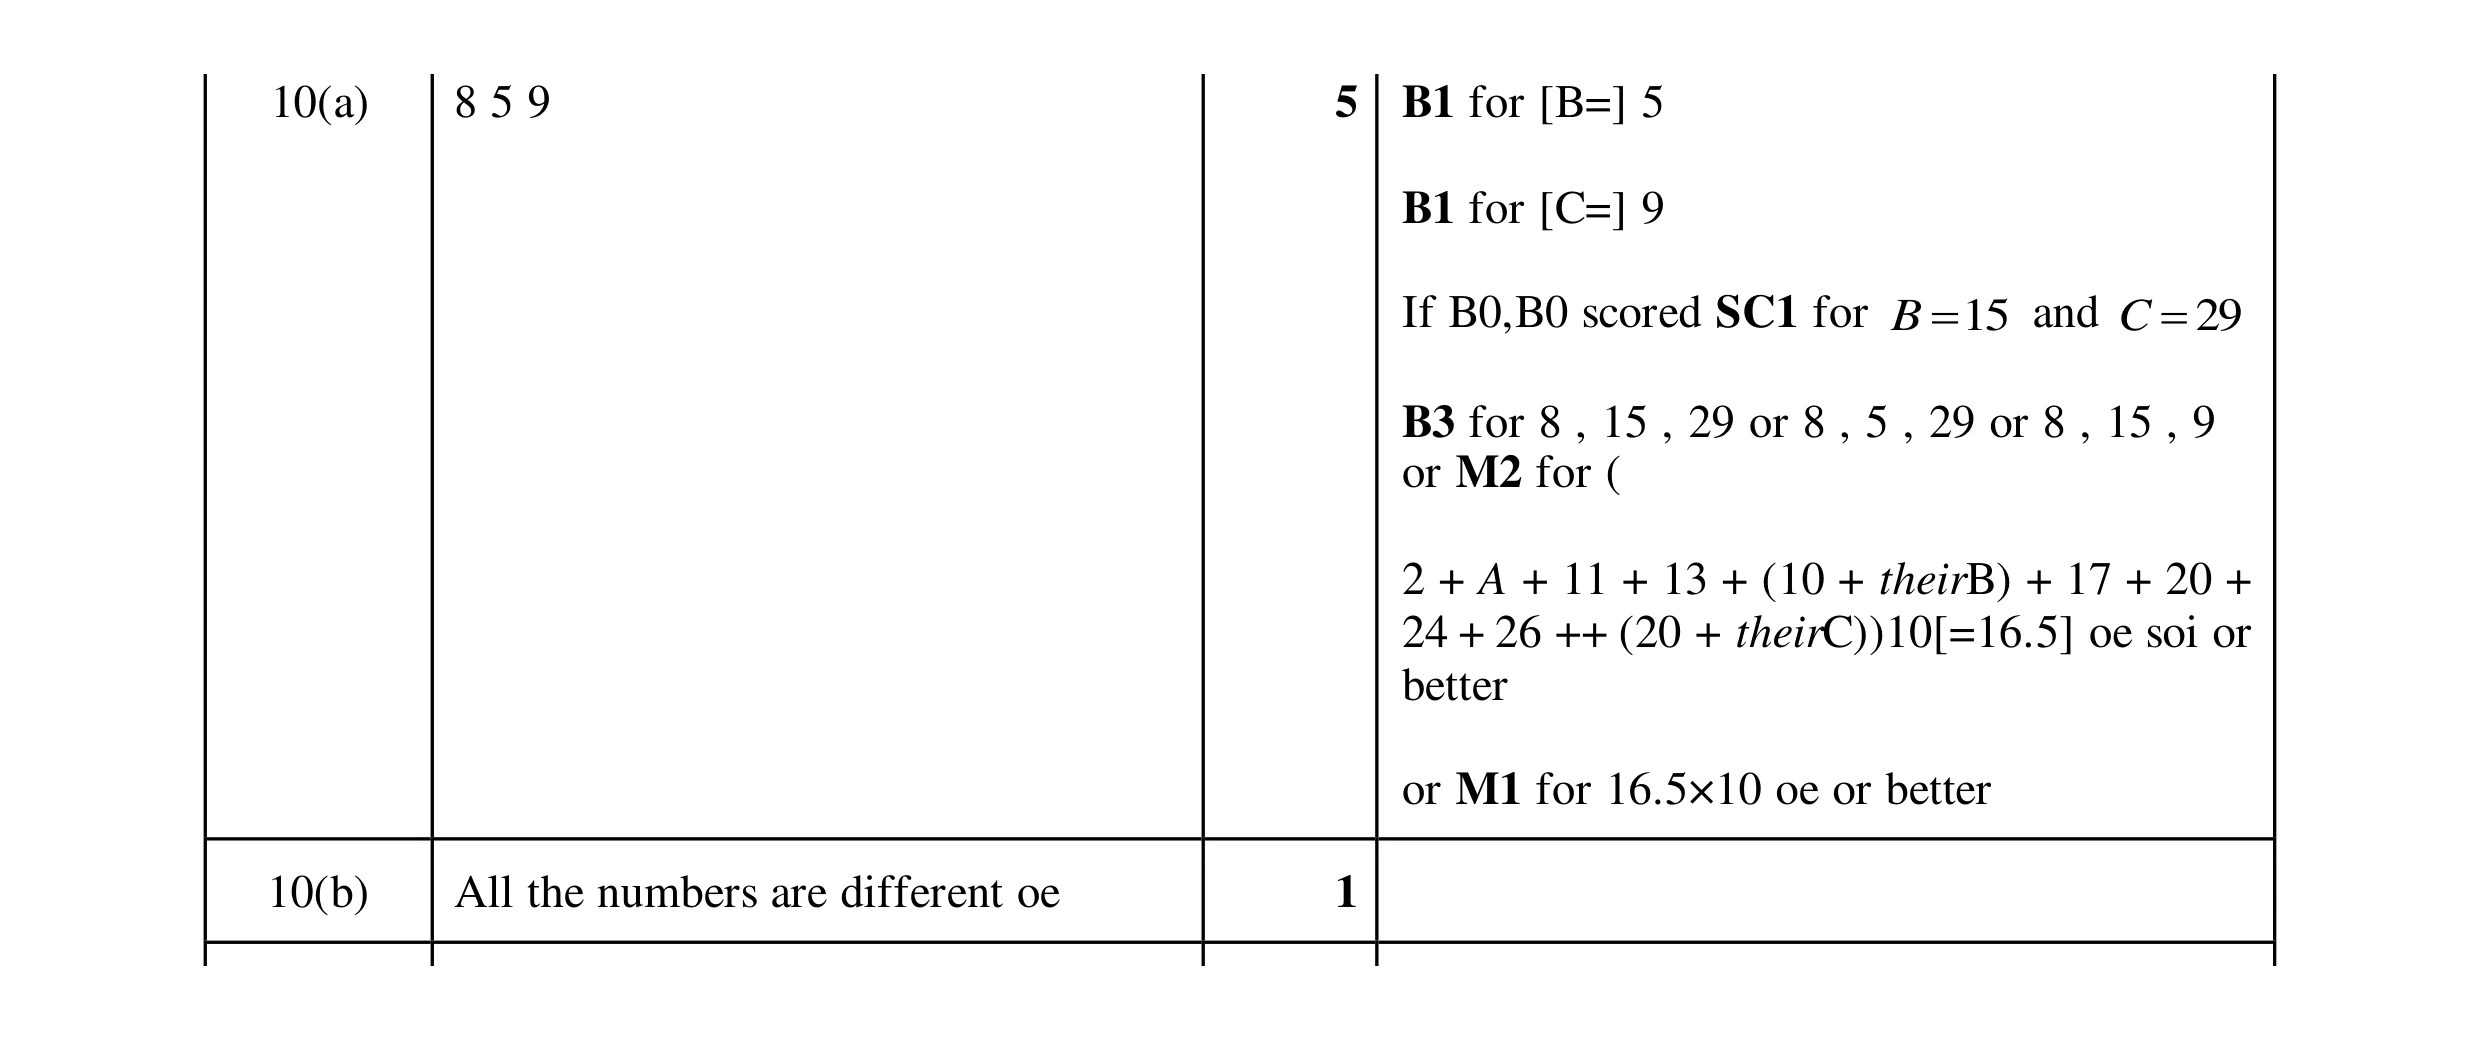 6
6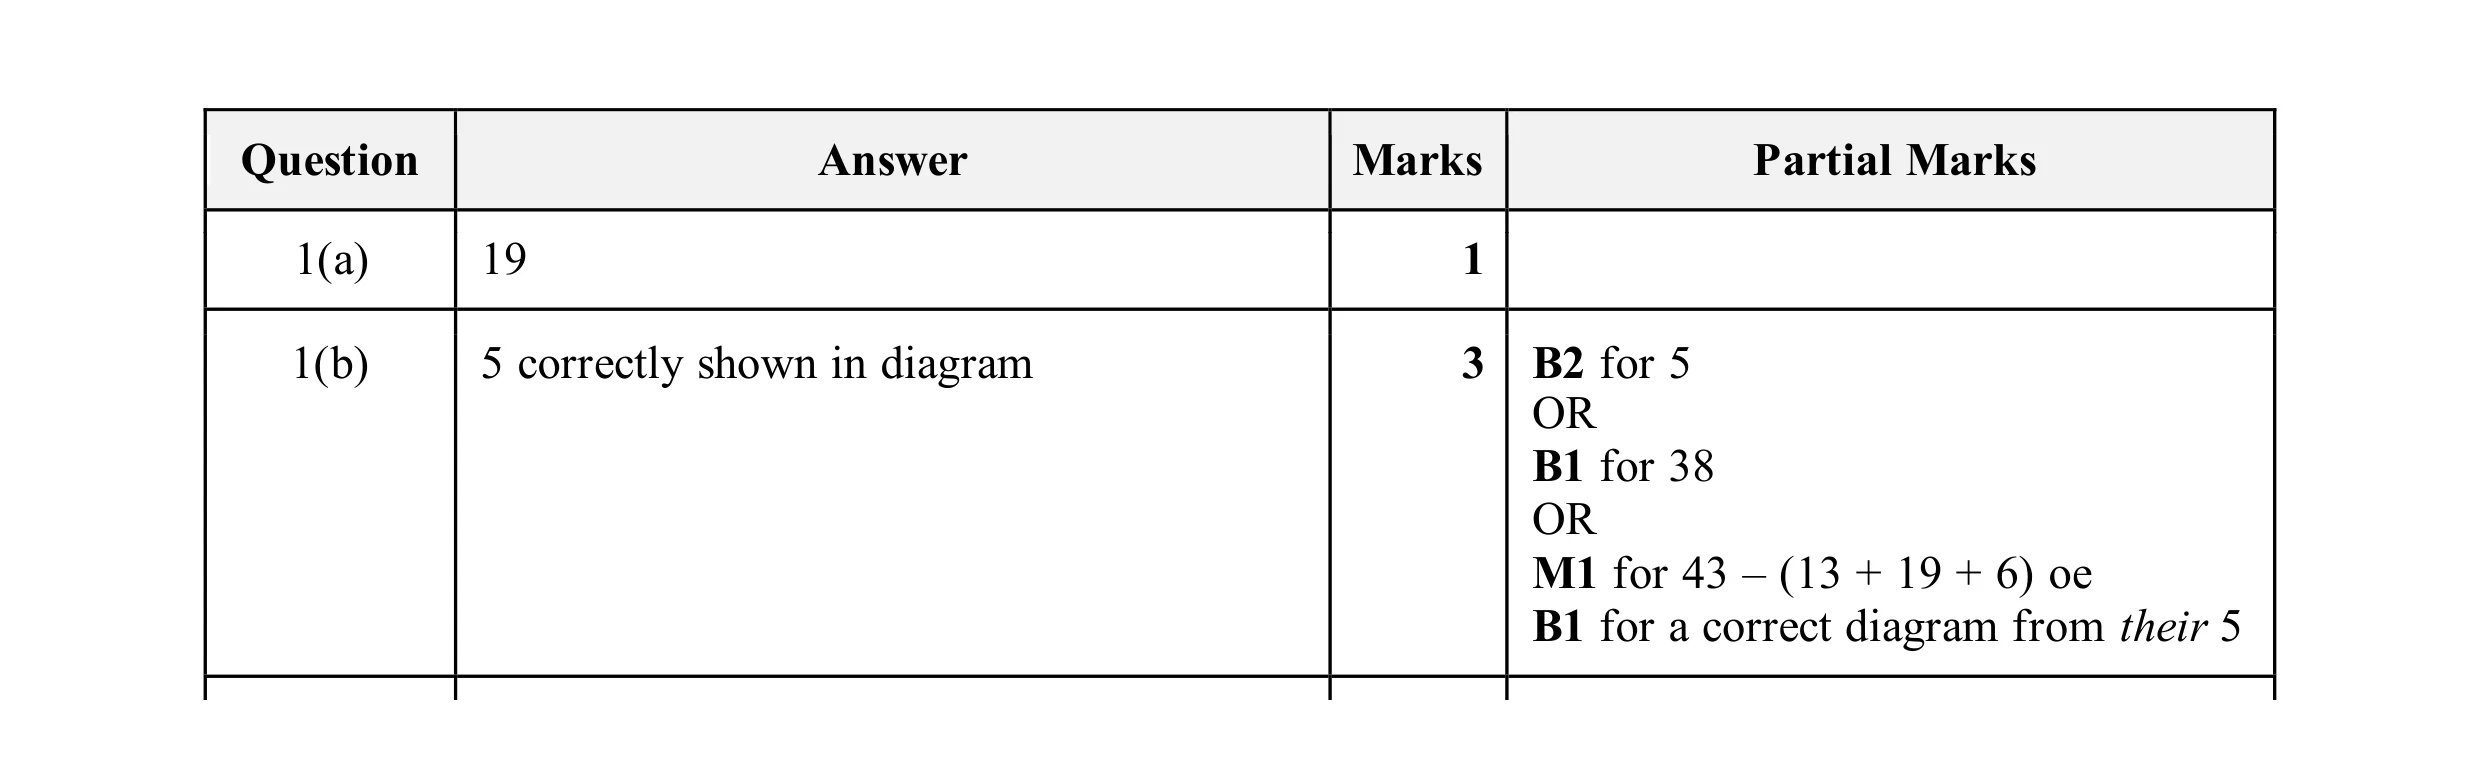 4
4 3
3