Cambridge IGCSE Mathematics 0580 — 2022 Oct/Nov Paper 3 · Variant 3
0580/33/O/N/22 · 10 questions · 104 marks · ≈117 min
The question paper and its mark scheme, free to read here and free to download. This is Cambridge’s own paper, exactly as it was sat.
Question paper20 pages
Mark scheme8 pages
Answers below. Sit the paper first if you are practising.
Questions as text
Q1 · List all the factors of 68
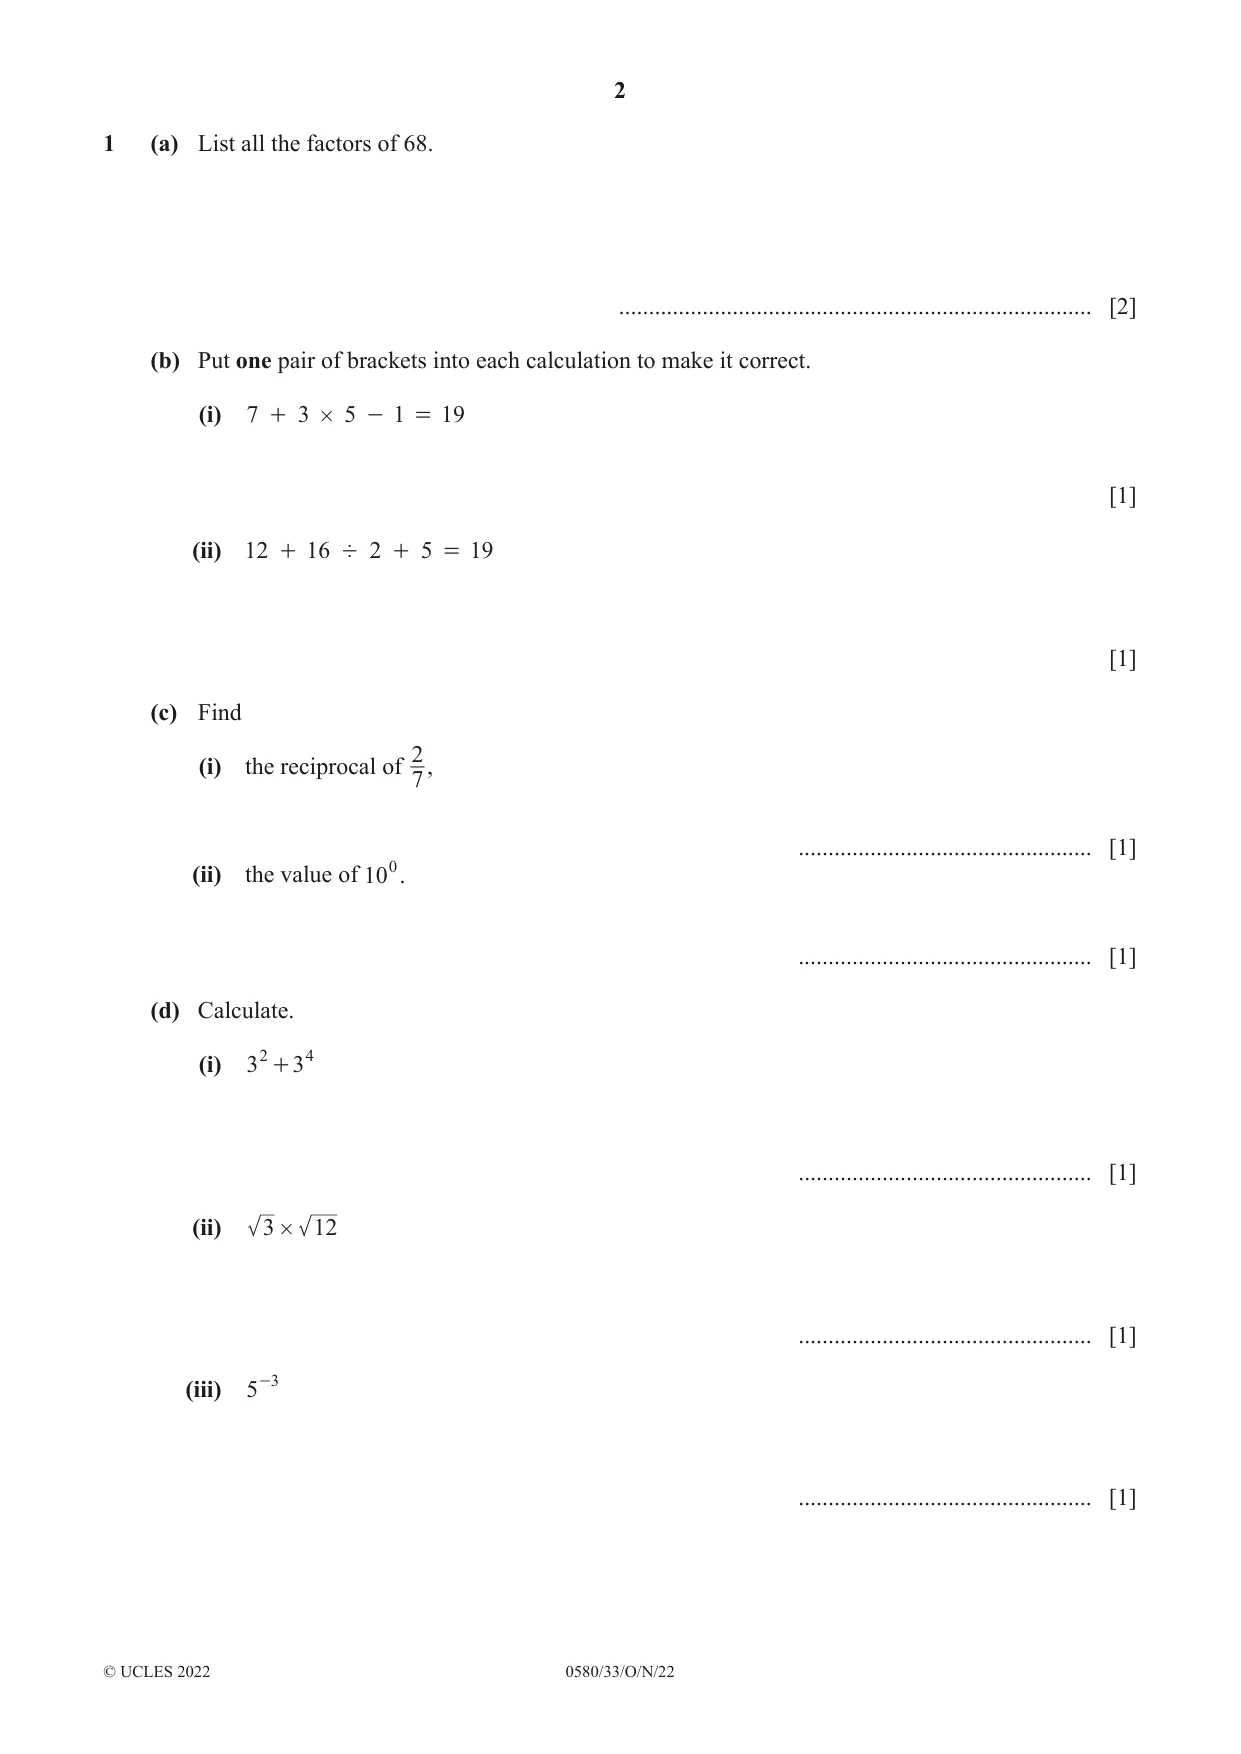
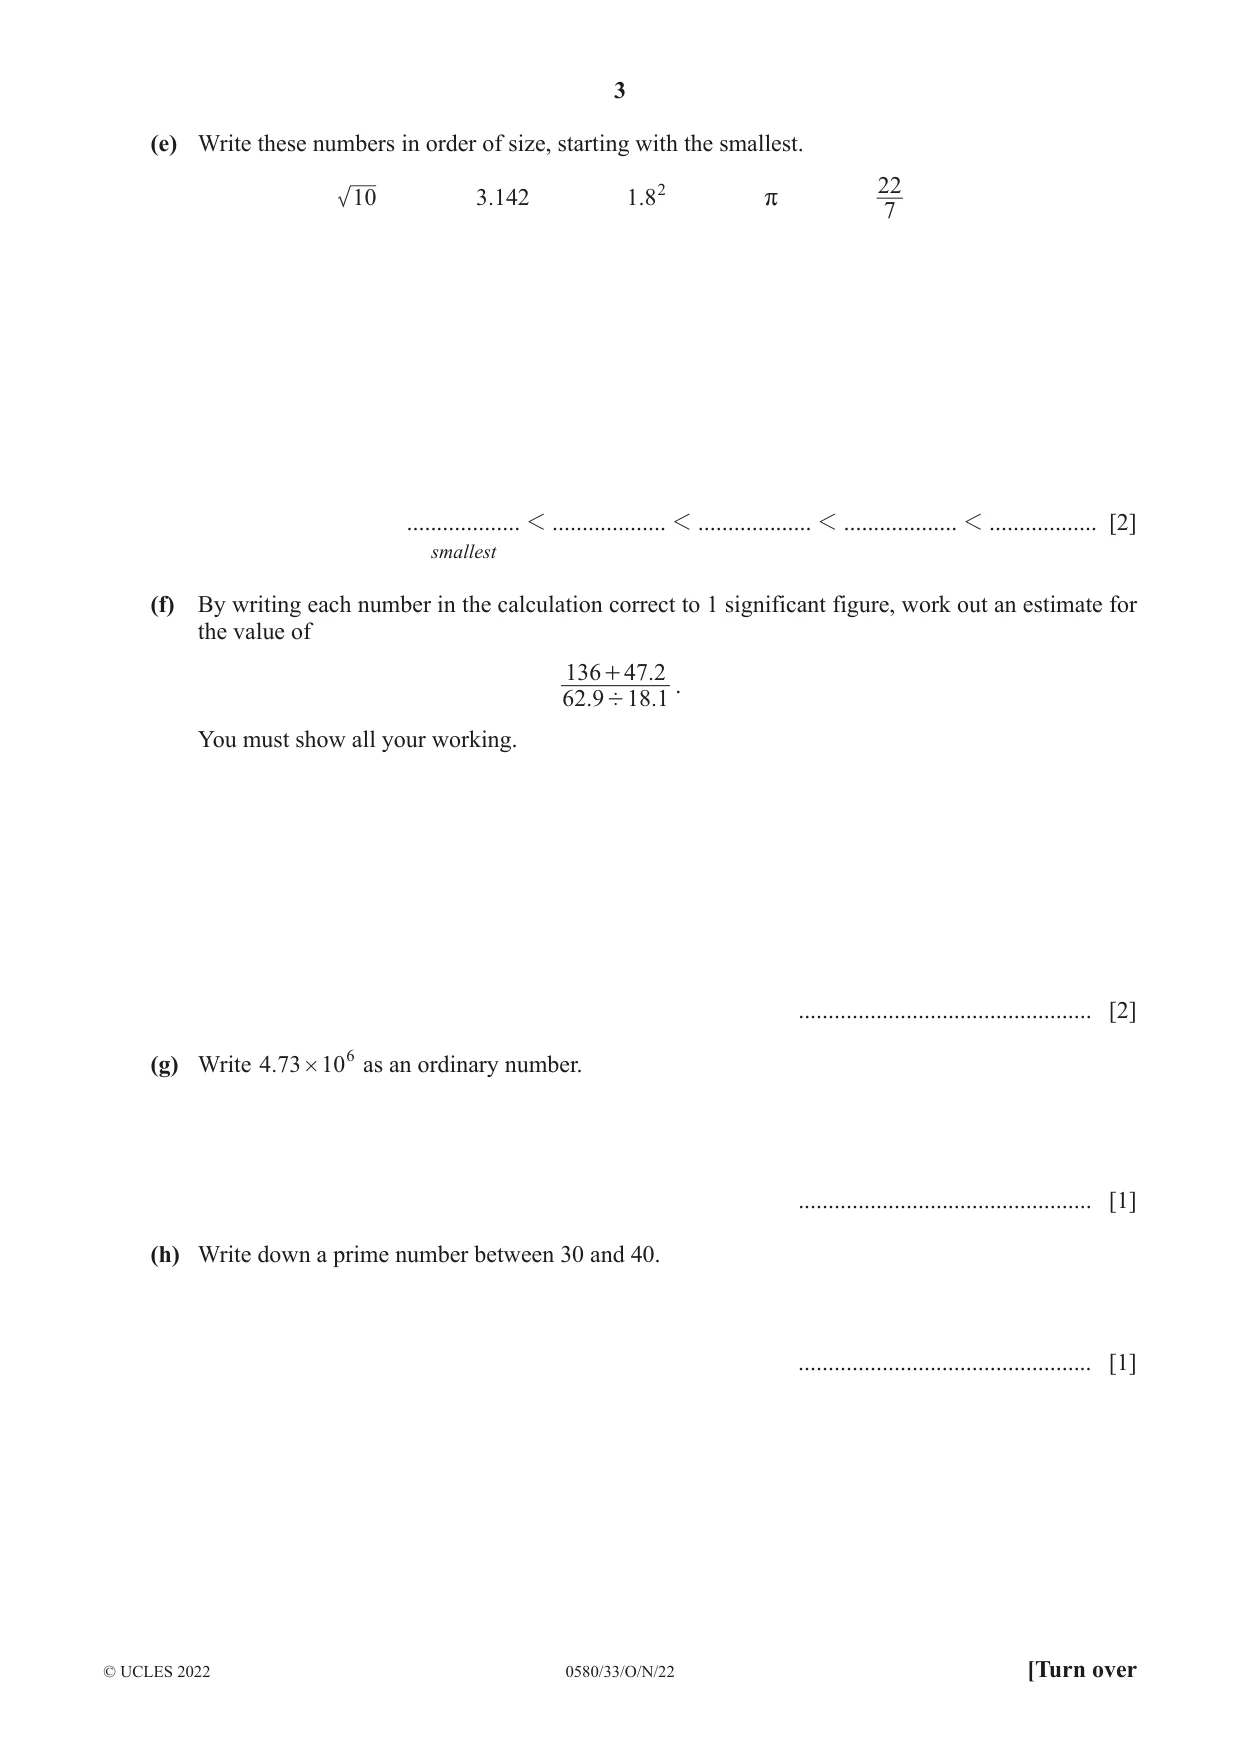
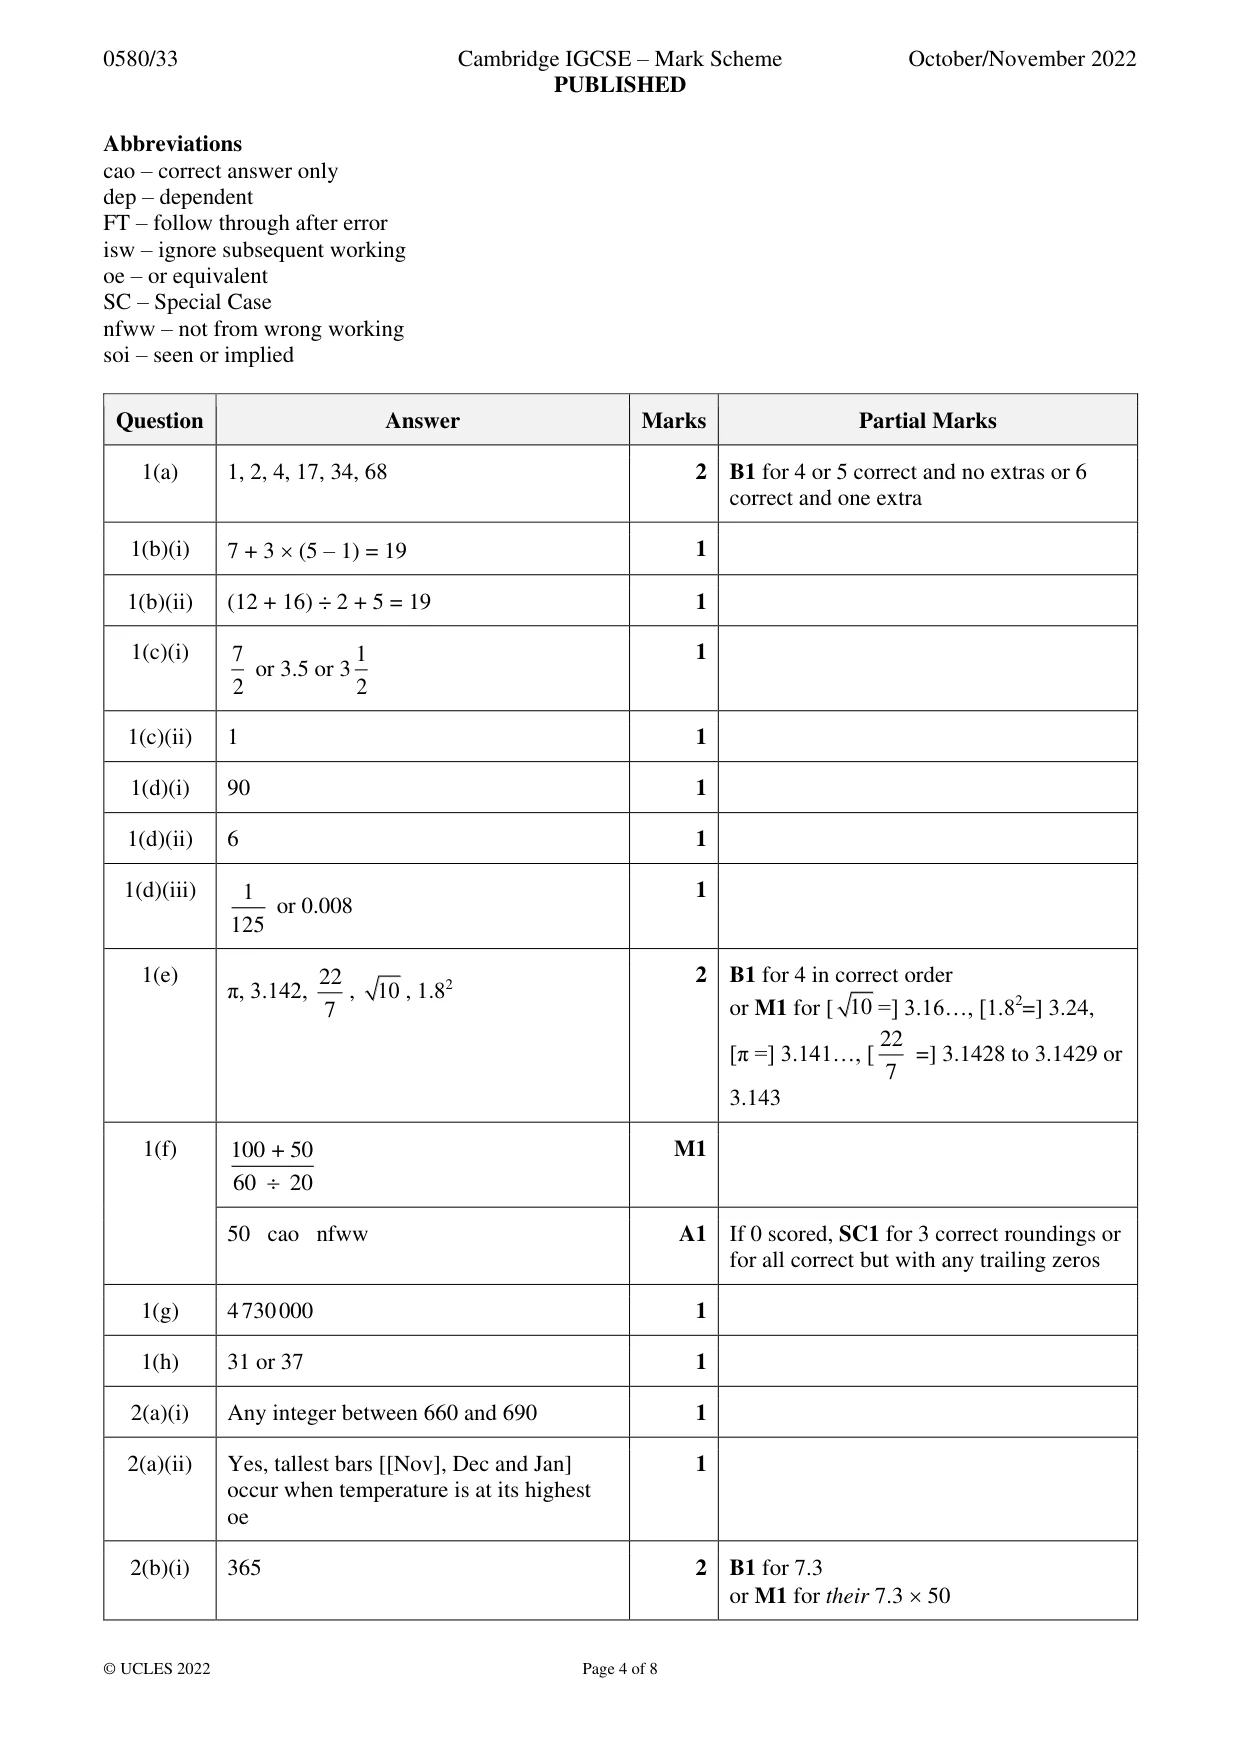
1 (a) List all the factors of 68. ............................................................................... [2] (b) Put one pair of brackets into each calculation to make it correct. (i) 7 + 3 # 5 - 1 = 19 [1] (ii) 12 + 16 ' 2 + 5 = 19 [1] (c) Find (i) the reciprocal of 2, 7 ................................................. [1] (ii) the value of 100. ................................................. [1] (d) Calculate. (i) 3 2 + 3 4 ................................................. [1] (ii) 3 # 12 ................................................. [1] (iii) 5 -3 ................................................. [1] (e) Write these numbers in order of size, starting with the smallest. 22 10 .3142 .182 r 7 ................... 1 ................... 1 ................... 1 ................... 1 .................. [2] smallest (f) By writing each number in the calculation correct to 1 significant figure, work out an estimate for the value of 136 + 47.2 . 62.9 ' 18.1 You must show all your working. ................................................. [2] (g) Write .473 # 106 as an ordinary number. ................................................. [1] (h) Write down a prime number between 30 and 40. ................................................. [1]
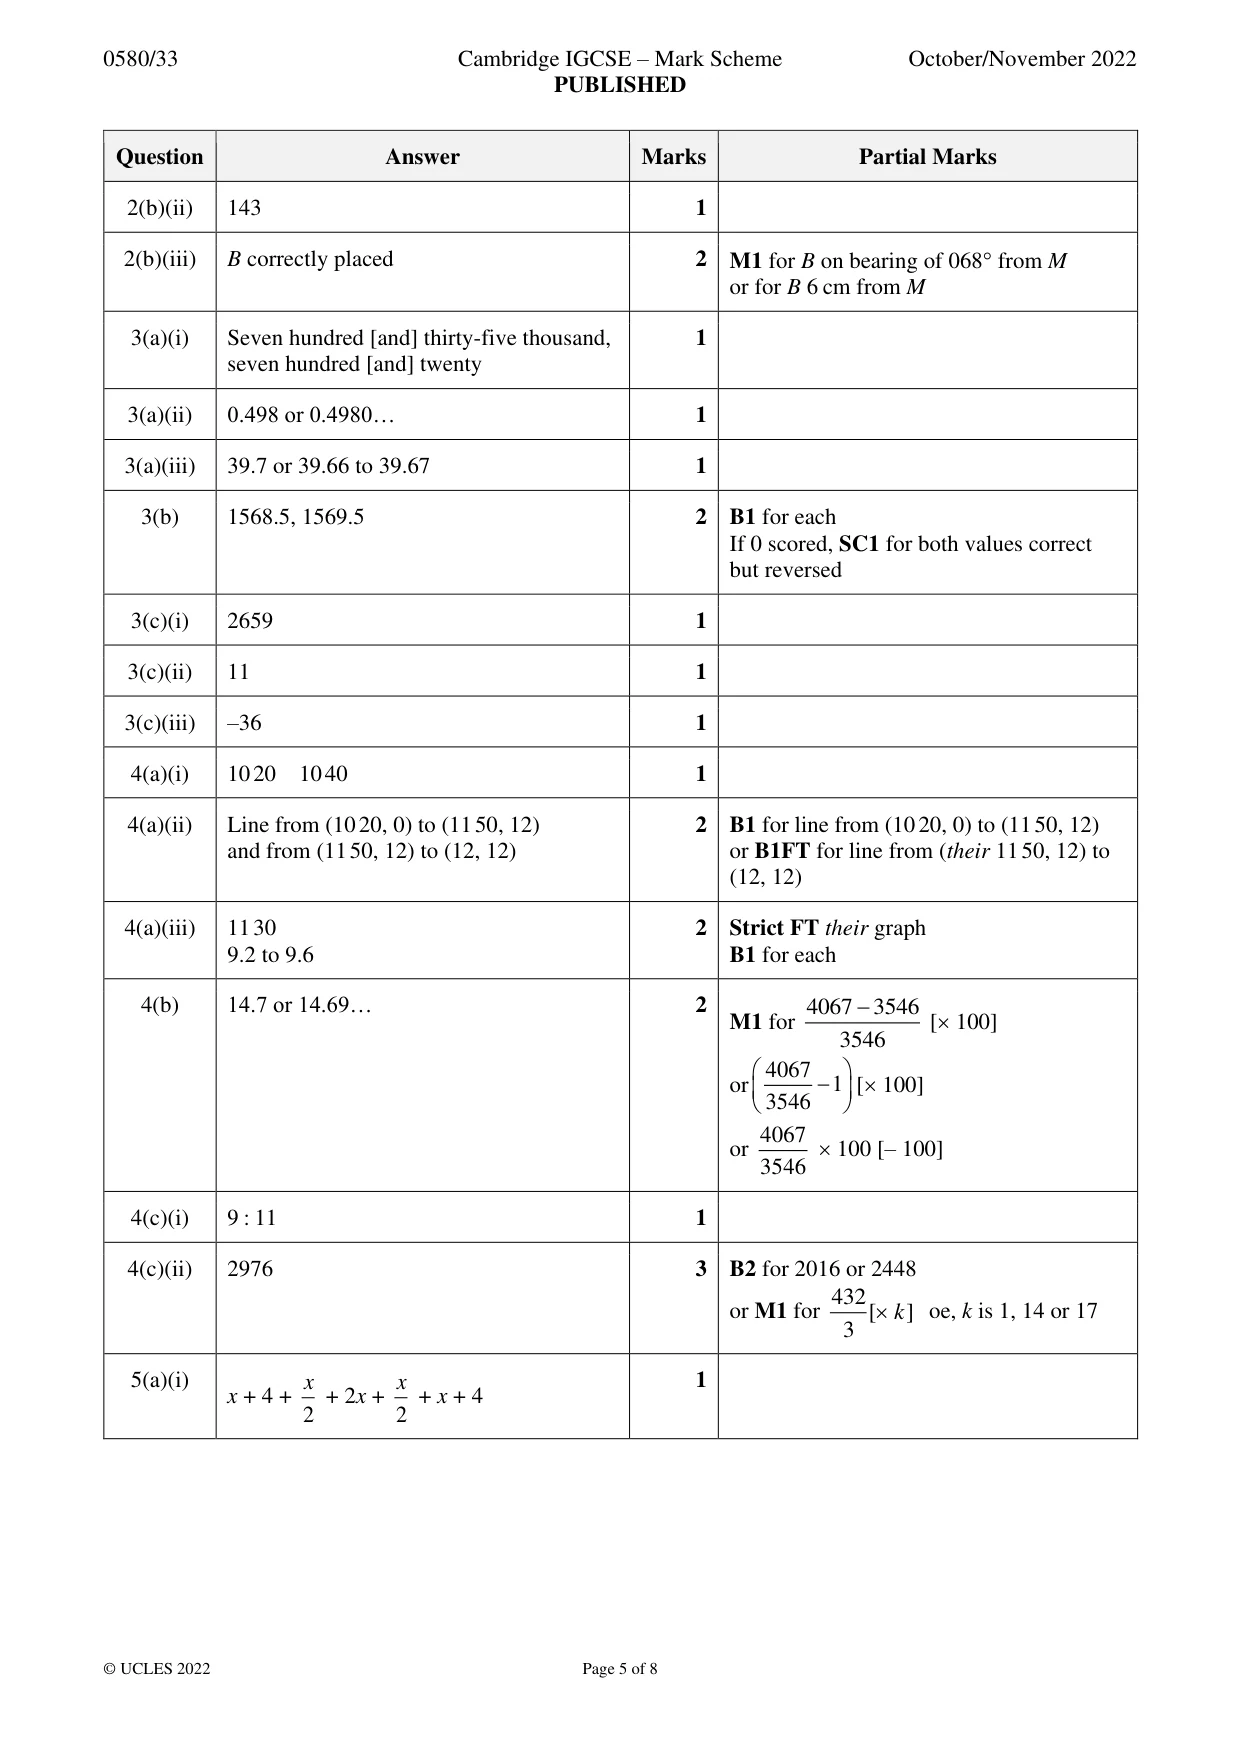
Mark scheme: Question Answer Marks Partial Marks 1(a) 1, 2, 4, 17, 34, 68 2 B1 for 4 or 5 correct and no extras or 6 correct and one extra 1(b)(i) 7 + 3 (5 – 1) = 19 1 1(b)(ii) (12 + 16) ÷ 2 + 5 = 19 1 1(c)(i) 7 1 1 or 3.5 or 3 2 2 1(c)(ii) 1 1 1(d)(i) 90 1 1(d)(ii) 6 1 1(d)(iii) 1 1 or 0.008 125 1(e) 22 2 B1 for 4 in correct order π, 3.142, , 10 , 1.82 7 or M1 for [ 10 =] 3.16…, [1.82=] 3.24, 22 [π =] 3.141…, [ =] 3.1428 to 3.1429 or 7 3.143 1(f) 100 + 50 M1 60 20 50 cao nfww A1 If 0 scored, SC1 for 3 correct roundings or for all correct but with any trailing zeros 1(g) 4 730 000 1 1(h) 31 or 37 1
Q2 · The bar chart shows the number of people who visit a beach in each month in one year
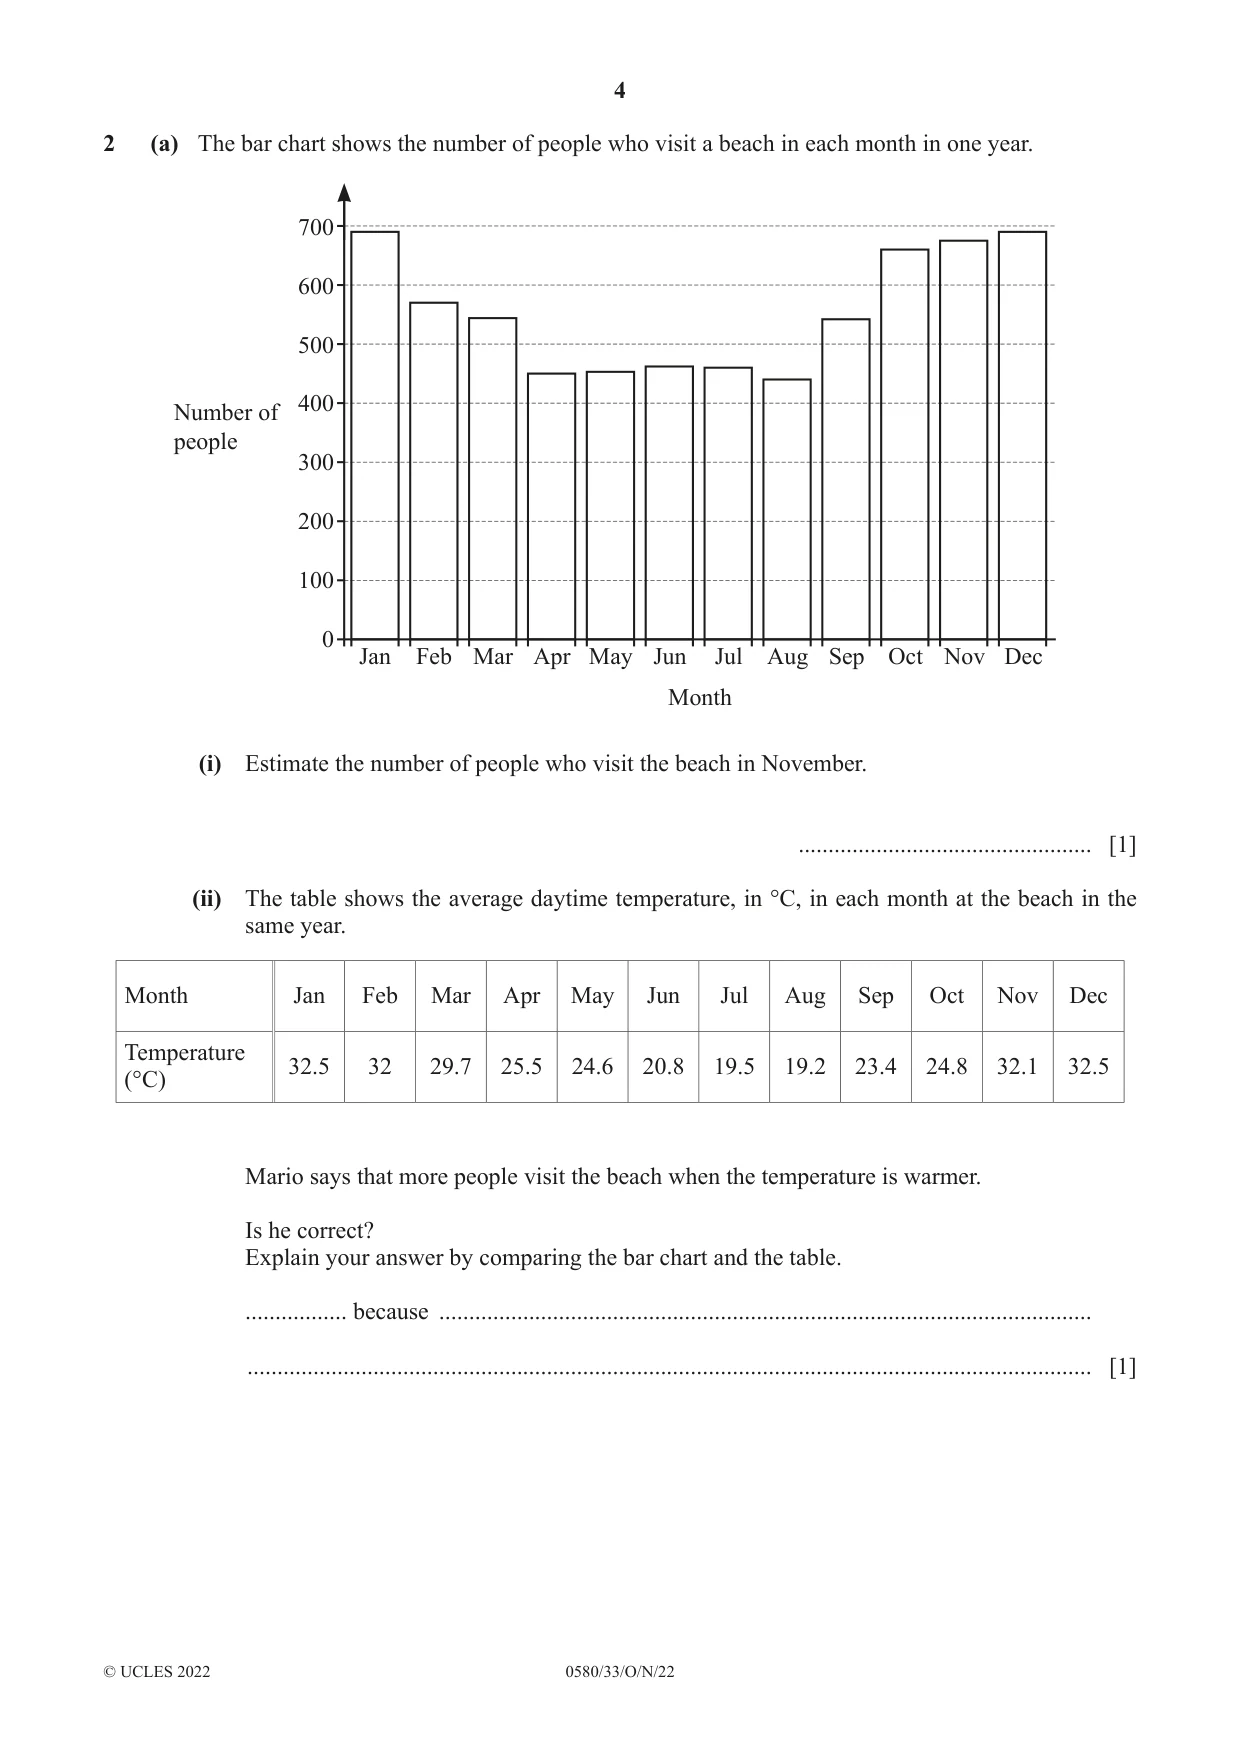
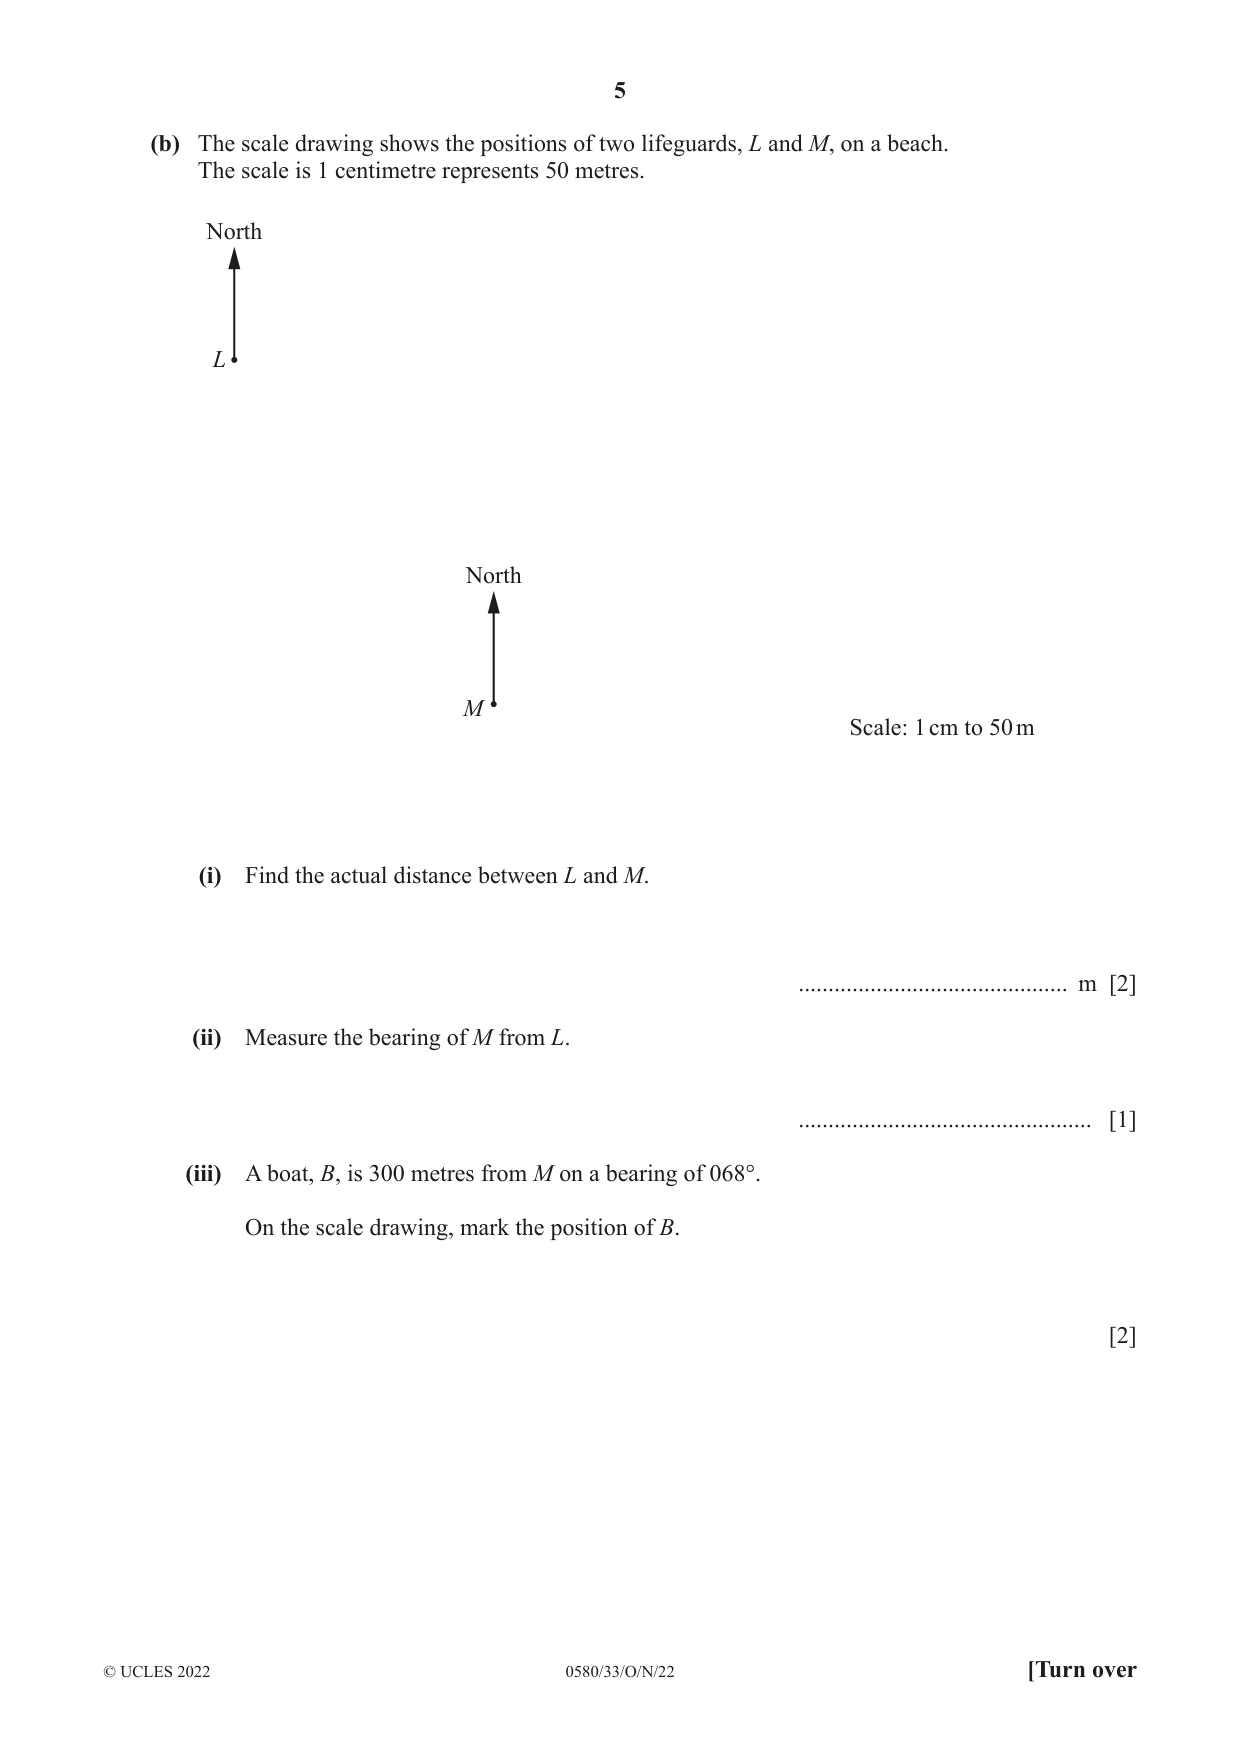
2 (a) The bar chart shows the number of people who visit a beach in each month in one year. 700 600 500 400 Number of people 300 200 100 0 Jan Feb Mar Apr May Jun Jul Aug Sep Oct Nov Dec Month (i) Estimate the number of people who visit the beach in November. ................................................. [1] (ii) The table shows the average daytime temperature, in °C, in each month at the beach in the same year. Month Jan Feb Mar Apr May Jun Jul Aug Sep Oct Nov Dec Temperature 32.5 32 29.7 25.5 24.6 20.8 19.5 19.2 23.4 24.8 32.1 32.5 (°C) Mario says that more people visit the beach when the temperature is warmer. Is he correct? Explain your answer by comparing the bar chart and the table. ................. because ............................................................................................................. ............................................................................................................................................. [1] (b) The scale drawing shows the positions of two lifeguards, L and M, on a beach. The scale is 1 centimetre represents 50 metres. North L North M Scale: 1 cm to 50 m (i) Find the actual distance between L and M. ............................................. m [2] (ii) Measure the bearing of M from L. ................................................. [1] (iii) A boat, B, is 300 metres from M on a bearing of 068°. On the scale drawing, mark the position of B. [2]
Mark scheme: 2(a)(i) Any integer between 660 and 690 1 2(a)(ii) Yes, tallest bars [[Nov], Dec and Jan] 1 occur when temperature is at its highest oe 2(b)(i) 365 2 B1 for 7.3 or M1 for their 7.3 50 2(b)(ii) 143 1 2(b)(iii) B correctly placed 2 M1 for B on bearing of 068 from M or for B 6 cm from M
Q3 · The population of Alaska is 735 720
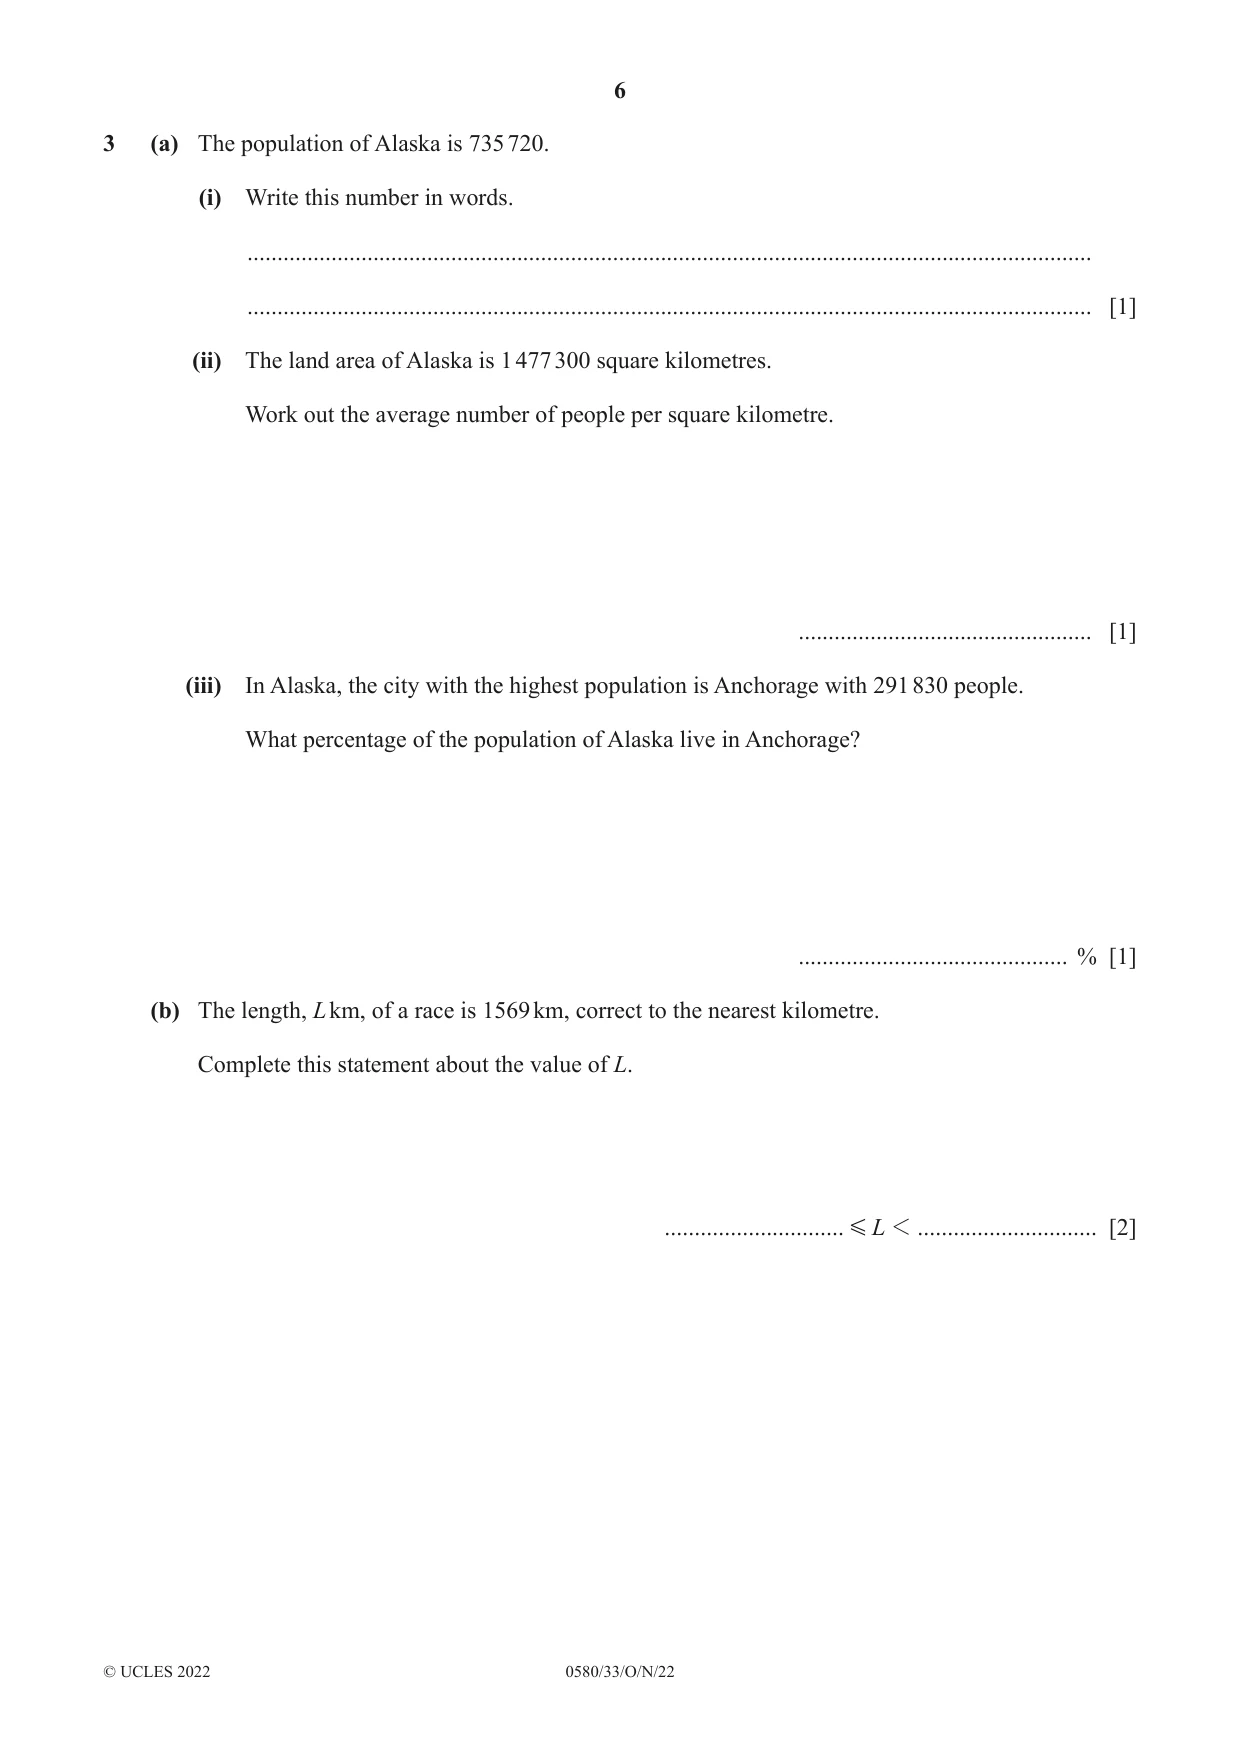
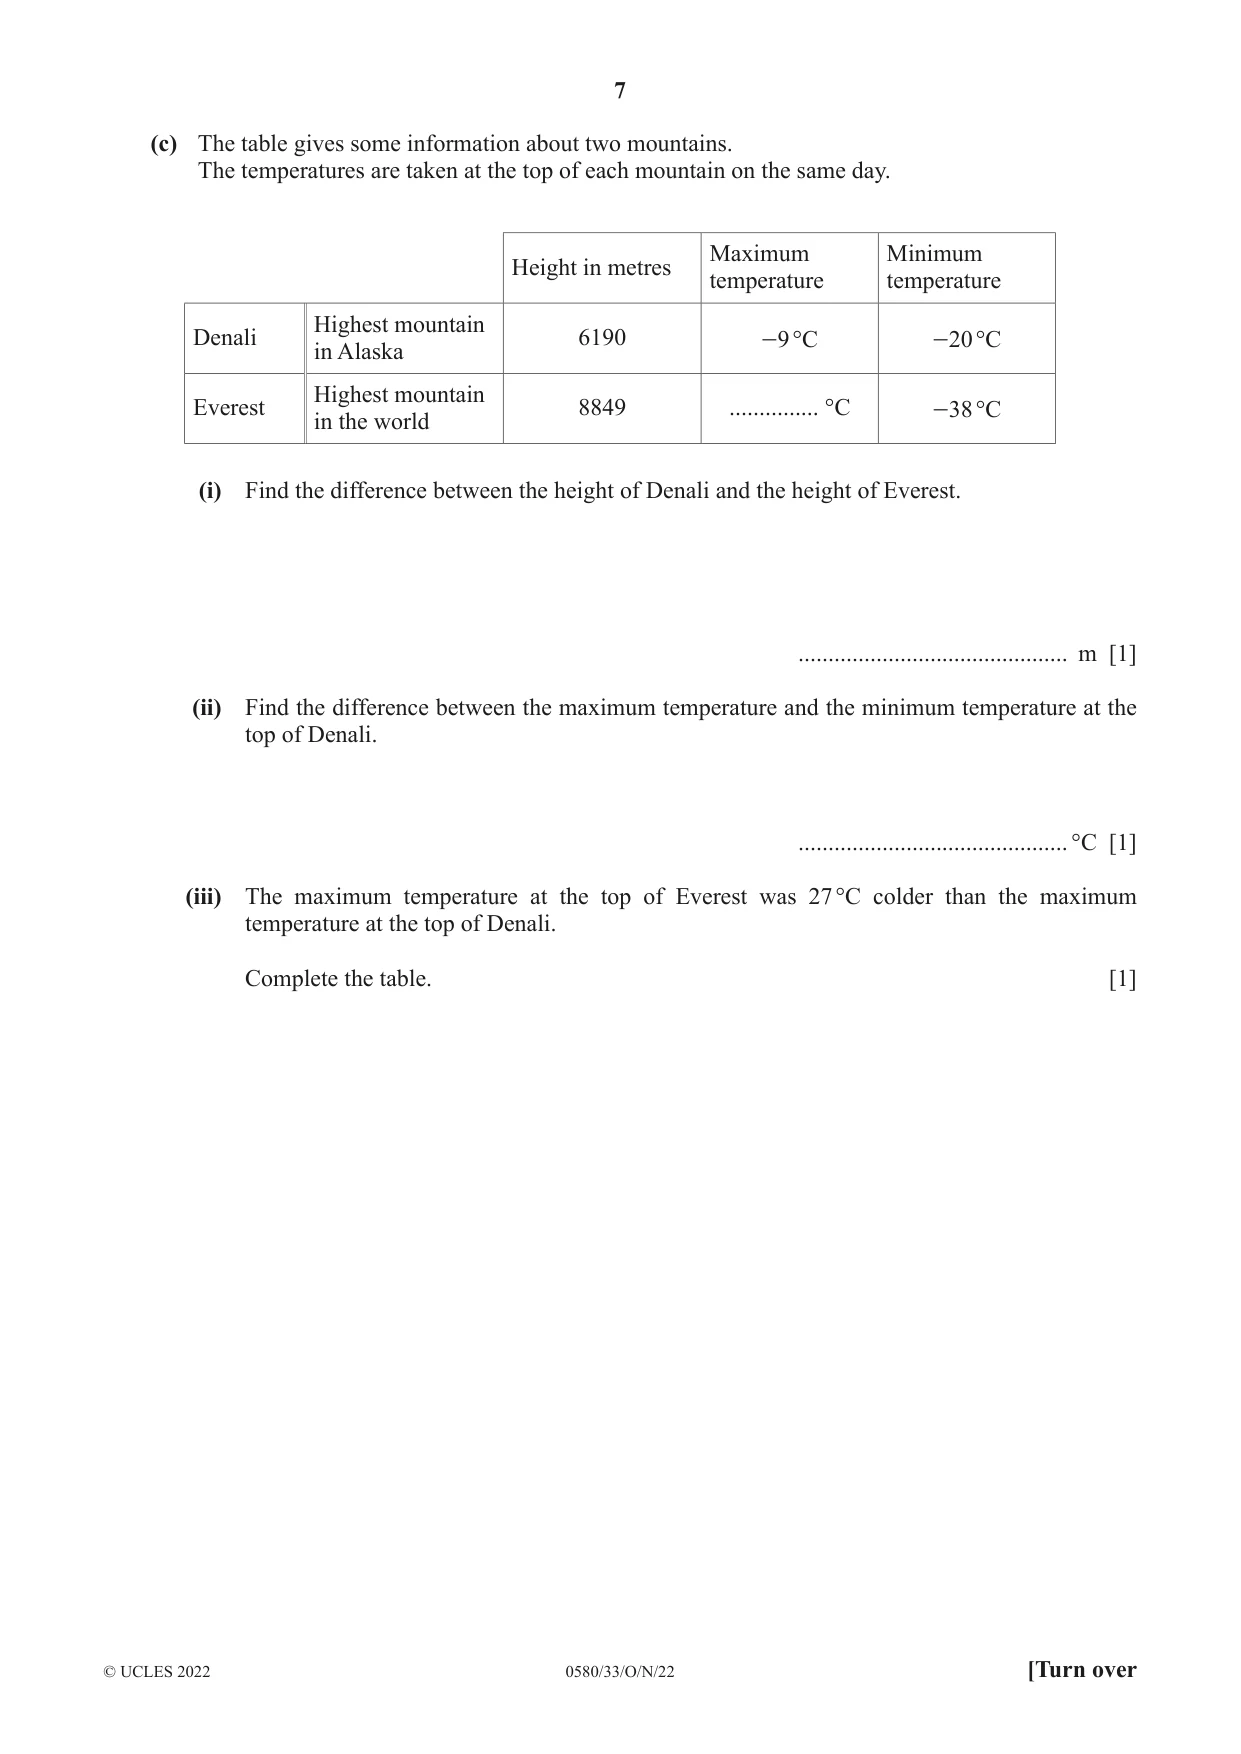
3 (a) The population of Alaska is 735 720. (i) Write this number in words. ............................................................................................................................................. ............................................................................................................................................. [1] (ii) The land area of Alaska is 1 477 300 square kilometres. Work out the average number of people per square kilometre. ................................................. [1] (iii) In Alaska, the city with the highest population is Anchorage with 291 830 people. What percentage of the population of Alaska live in Anchorage? ............................................. % [1] (b) The length, L km, of a race is 1569 km, correct to the nearest kilometre. Complete this statement about the value of L. .............................. G L 1 .............................. [2] (c) The table gives some information about two mountains. The temperatures are taken at the top of each mountain on the same day. Maximum Minimum Height in metres temperature temperature Highest mountain Denali 6190 -9 °C -20 °C in Alaska Highest mountain Everest 8849 ............... °C -38 °C in the world (i) Find the difference between the height of Denali and the height of Everest. ............................................. m [1] (ii) Find the difference between the maximum temperature and the minimum temperature at the top of Denali. ............................................. °C [1] (iii) The maximum temperature at the top of Everest was 27 °C colder than the maximum temperature at the top of Denali. Complete the table. [1]
Mark scheme: 3(a)(i) Seven hundred [and] thirty-five thousand, 1 seven hundred [and] twenty 3(a)(ii) 0.498 or 0.4980… 1 3(a)(iii) 39.7 or 39.66 to 39.67 1 3(b) 1568.5, 1569.5 2 B1 for each If 0 scored, SC1 for both values correct but reversed 3(c)(i) 2659 1 3(c)(ii) 11 1 3(c)(iii) –36 1
Q4 · A path from Bay Park to Ocean Park passes through Sandy Cove
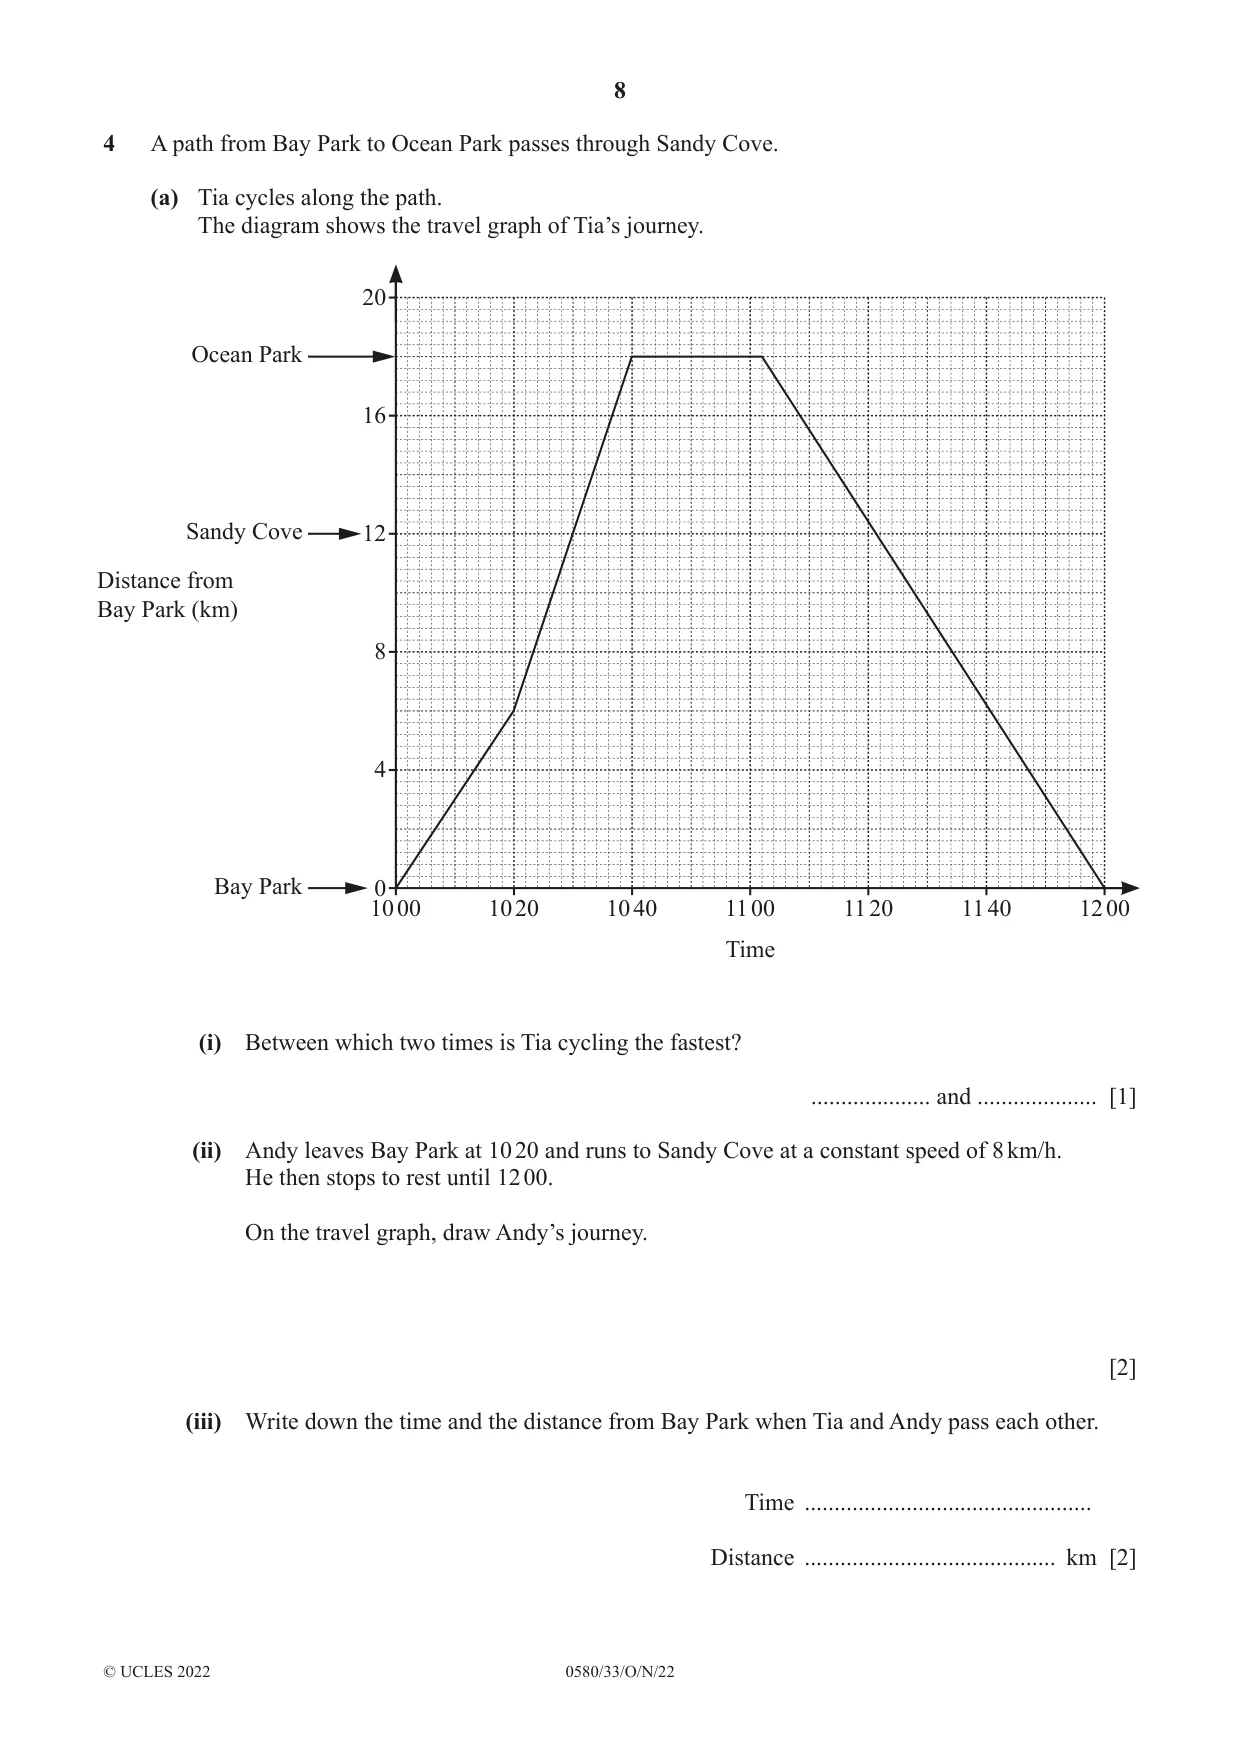
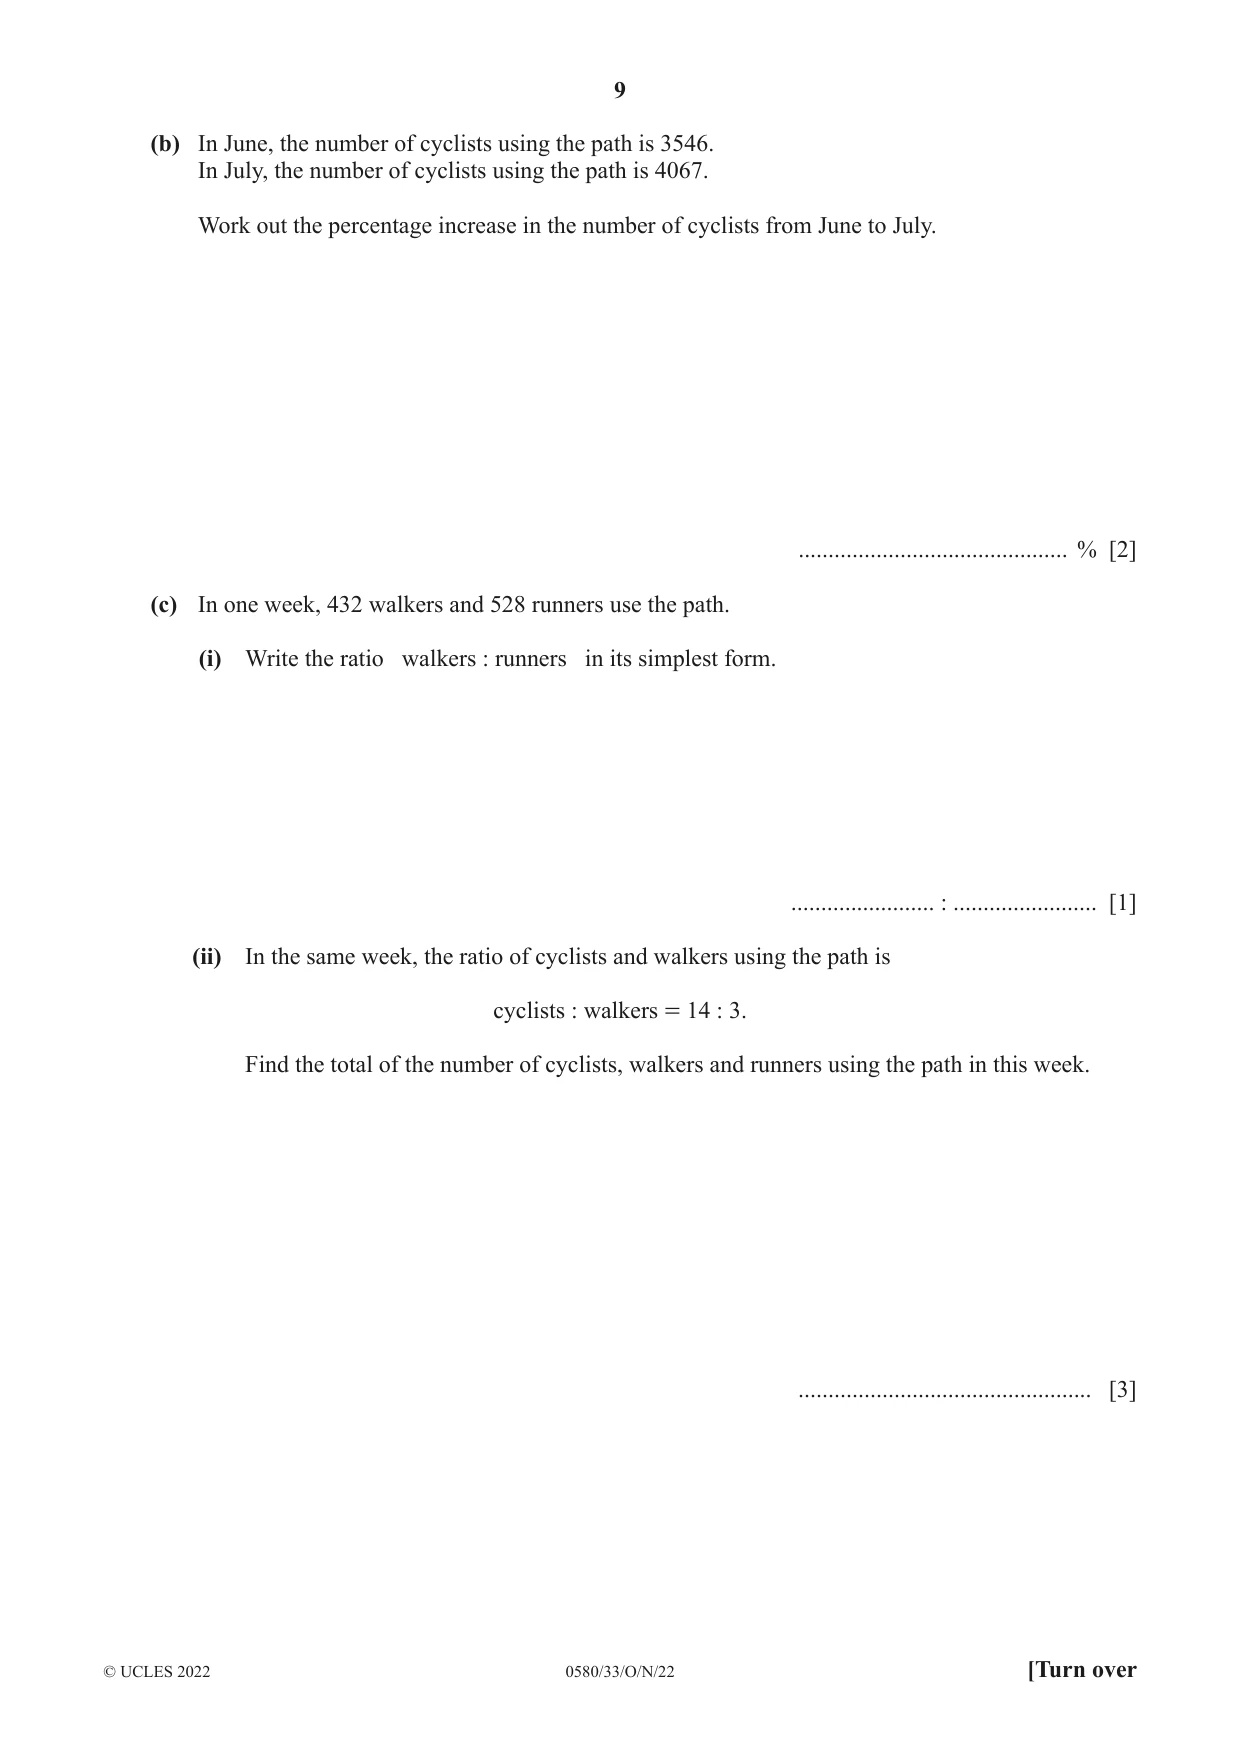
4 A path from Bay Park to Ocean Park passes through Sandy Cove. (a) Tia cycles along the path. The diagram shows the travel graph of Tia’s journey. 20 Ocean Park 16 Sandy Cove 12 Distance from Bay Park (km) 8 4 Bay Park 0 10 00 10 20 10 40 11 00 11 20 11 40 12 00 Time (i) Between which two times is Tia cycling the fastest? .................... and .................... [1] (ii) Andy leaves Bay Park at 10 20 and runs to Sandy Cove at a constant speed of 8 km/h. He then stops to rest until 12 00. On the travel graph, draw Andy’s journey. [2] (iii) Write down the time and the distance from Bay Park when Tia and Andy pass each other. Time ................................................ Distance .......................................... km [2] (b) In June, the number of cyclists using the path is 3546. In July, the number of cyclists using the path is 4067. Work out the percentage increase in the number of cyclists from June to July. ............................................. % [2] (c) In one week, 432 walkers and 528 runners use the path. (i) Write the ratio walkers : runners in its simplest form. ........................ : ........................ [1] (ii) In the same week, the ratio of cyclists and walkers using the path is cyclists : walkers = 14 : 3. Find the total of the number of cyclists, walkers and runners using the path in this week. ................................................. [3]
Mark scheme: 4(a)(i) 10 20 10 40 1 4(a)(ii) Line from (10 20, 0) to (11 50, 12) 2 B1 for line from (10 20, 0) to (11 50, 12) and from (11 50, 12) to (12, 12) or B1FT for line from (their 11 50, 12) to (12, 12) 4(a)(iii) 11 30 2 Strict FT their graph 9.2 to 9.6 B1 for each 4(b) 14.7 or 14.69… 2 4067 − 3546 M1 for [ 100] 3546 4067 or − 1 [ 100] 3546 4067 or 100 [– 100] 3546 4(c)(i) 9 : 11 1 4(c)(ii) 2976 3 B2 for 2016 or 2448 or M1 for 432[k ] oe, k is 1, 14 or 17 3
Q5 · In this part, all measurements are in centimetres
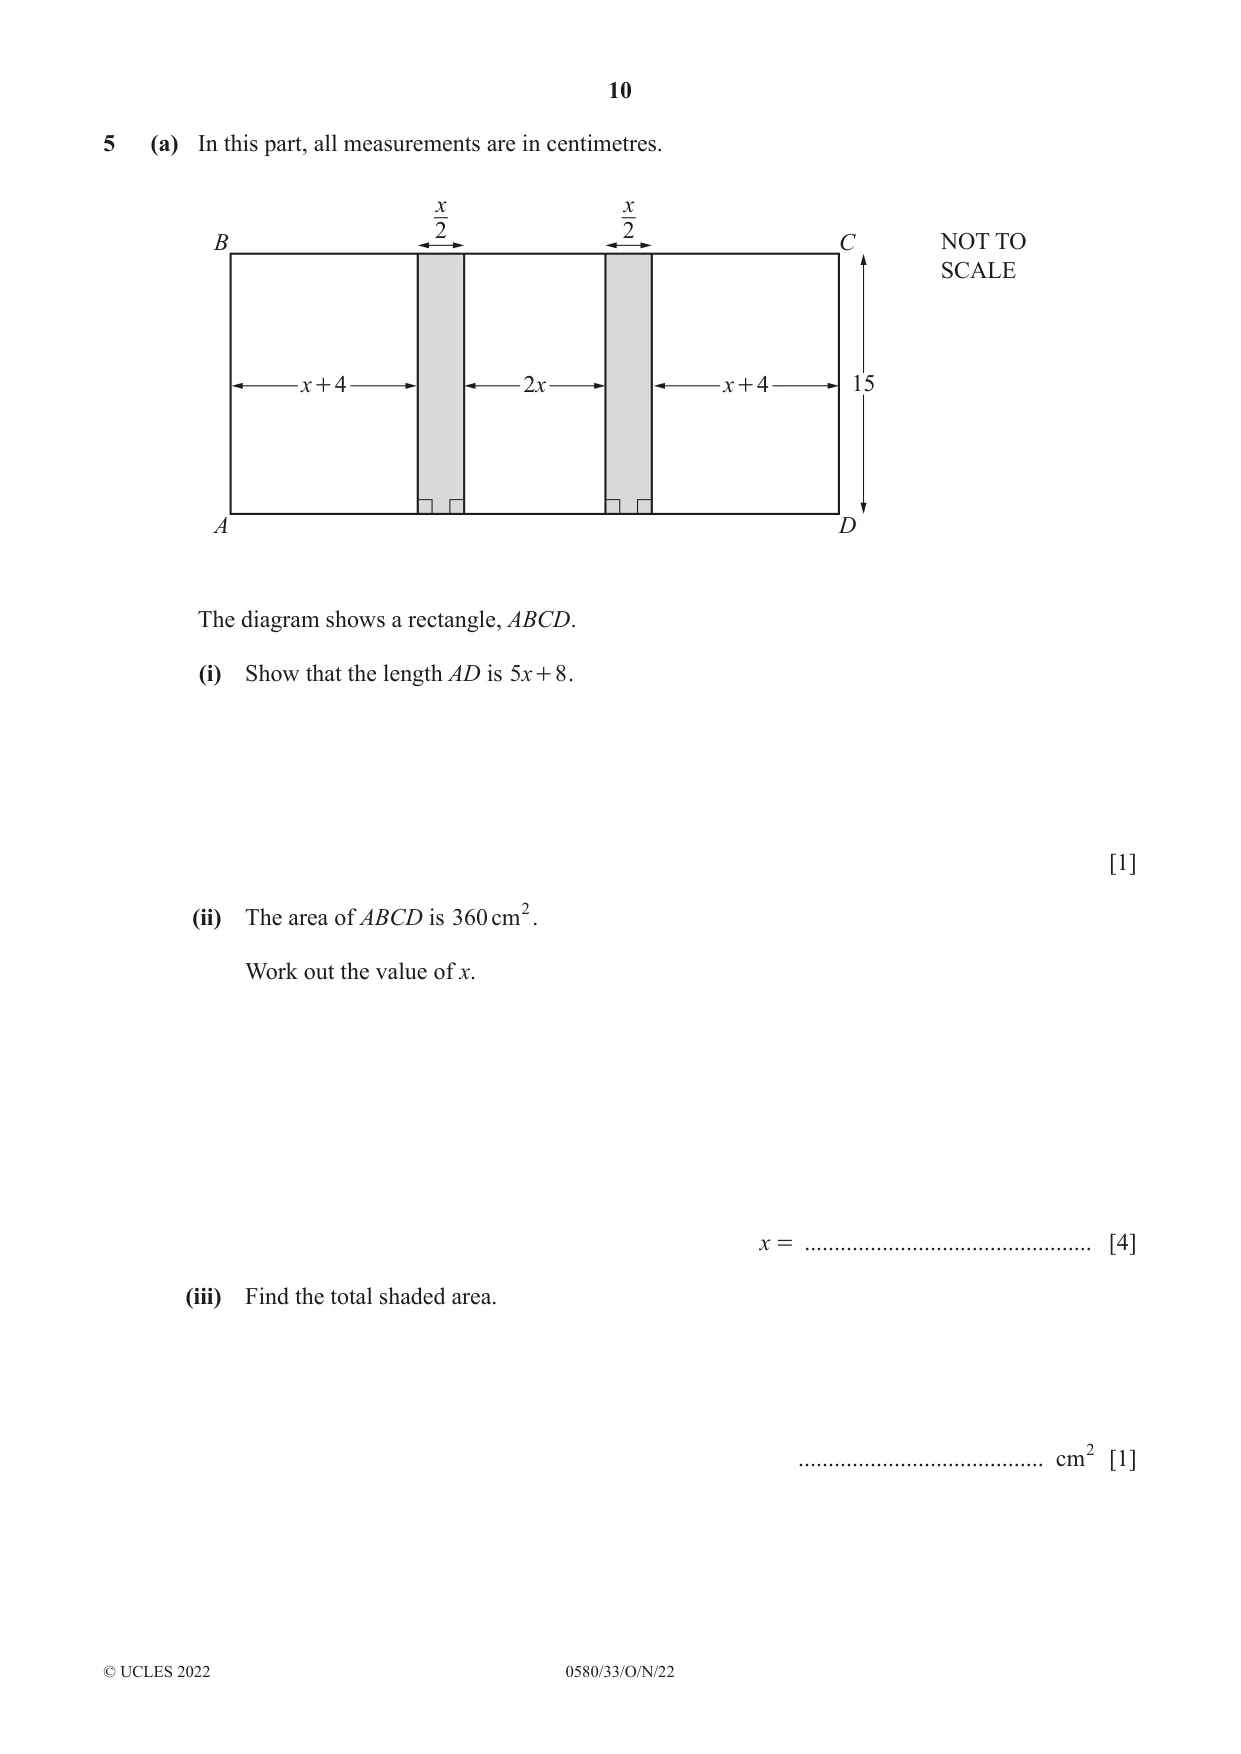
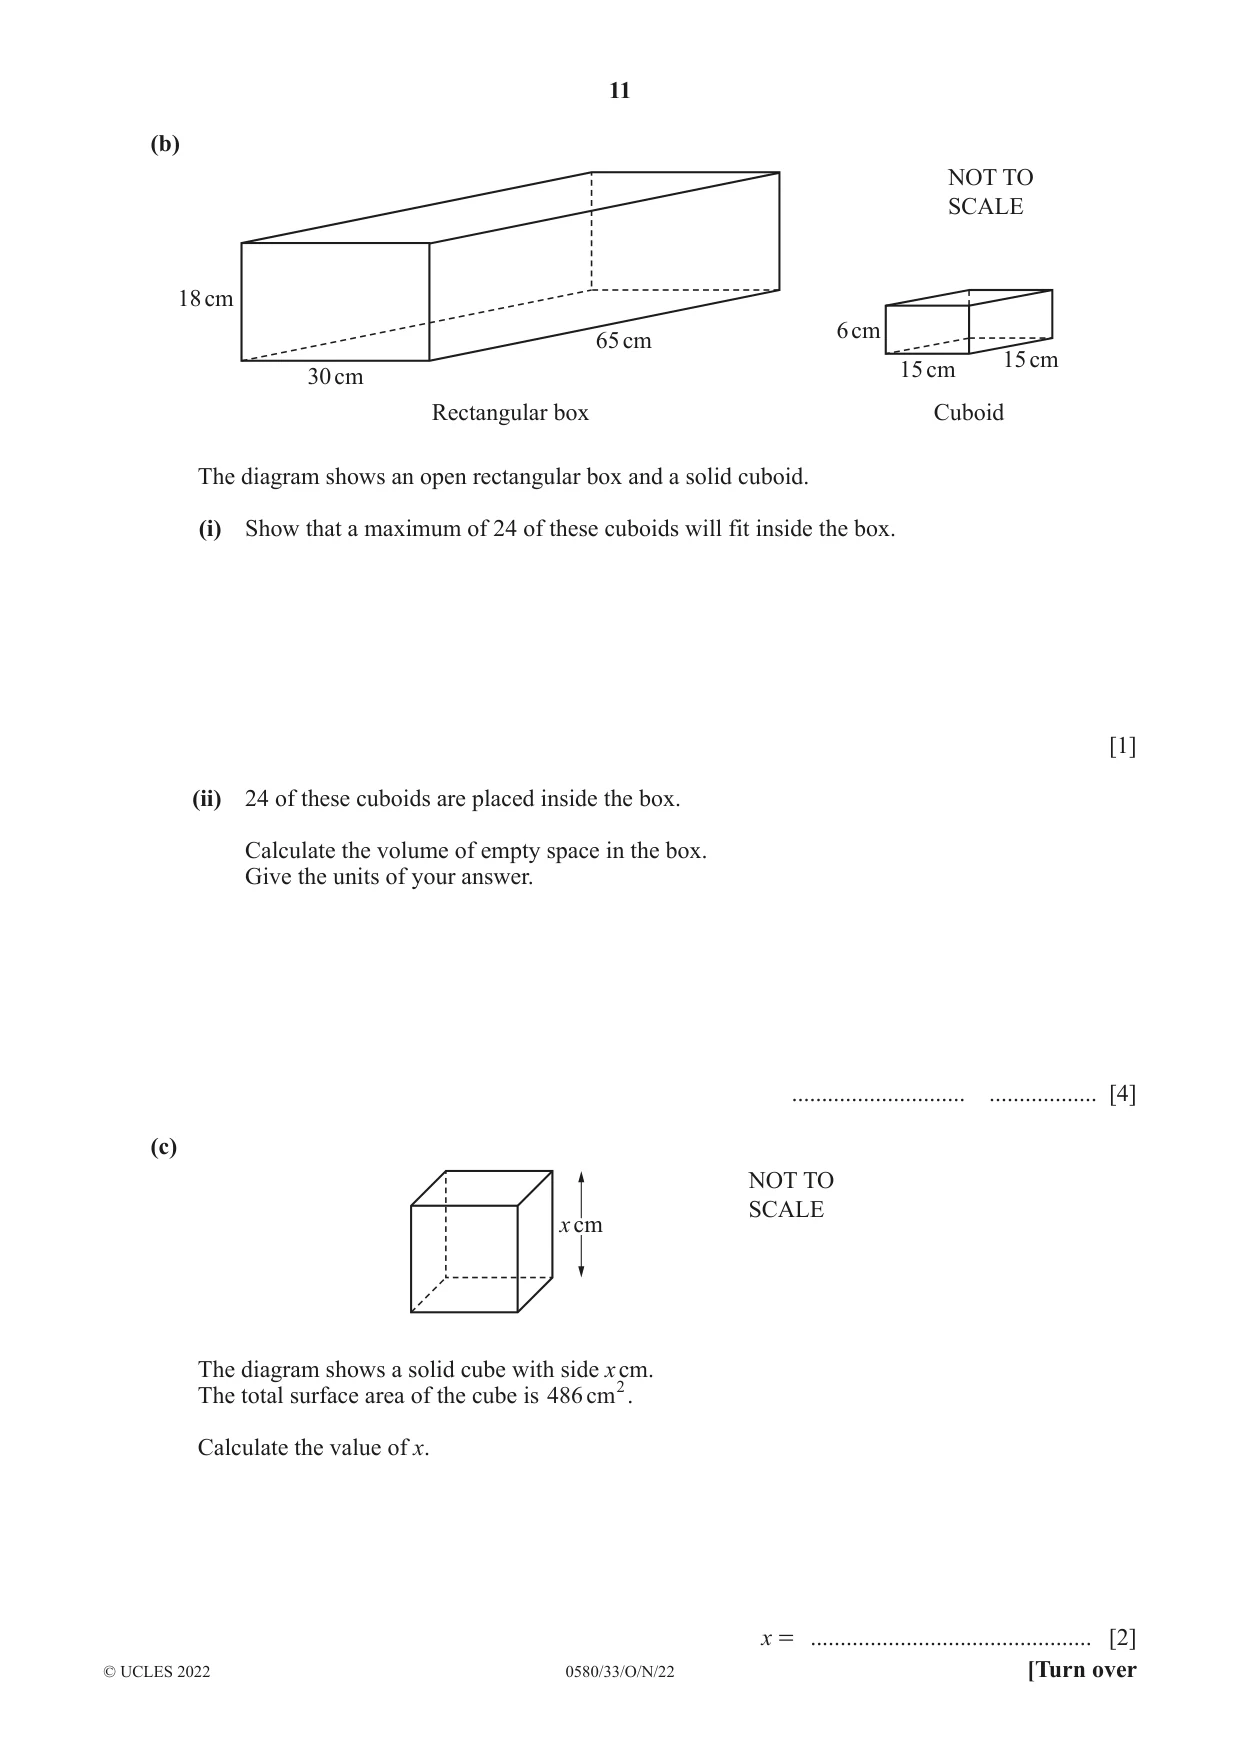
5 (a) In this part, all measurements are in centimetres. x x 2 2 B C NOT TO SCALE x + 4 2x x + 4 15 A D The diagram shows a rectangle, ABCD. (i) Show that the length AD is 5x + 8 . [1] (ii) The area of ABCD is 360 cm 2. Work out the value of x. x = ................................................ [4] (iii) Find the total shaded area. ......................................... cm2 [1] (b) NOT TO SCALE 18 cm 6 cm 65 cm 15 cm 30 cm 15 cm Rectangular box Cuboid The diagram shows an open rectangular box and a solid cuboid. (i) Show that a maximum of 24 of these cuboids will fit inside the box. [1] (ii) 24 of these cuboids are placed inside the box. Calculate the volume of empty space in the box. Give the units of your answer. ............................. .................. [4] (c) NOT TO SCALE x cm The diagram shows a solid cube with side x cm. The total surface area of the cube is 486 cm 2. Calculate the value of x. x = ............................................... [2]
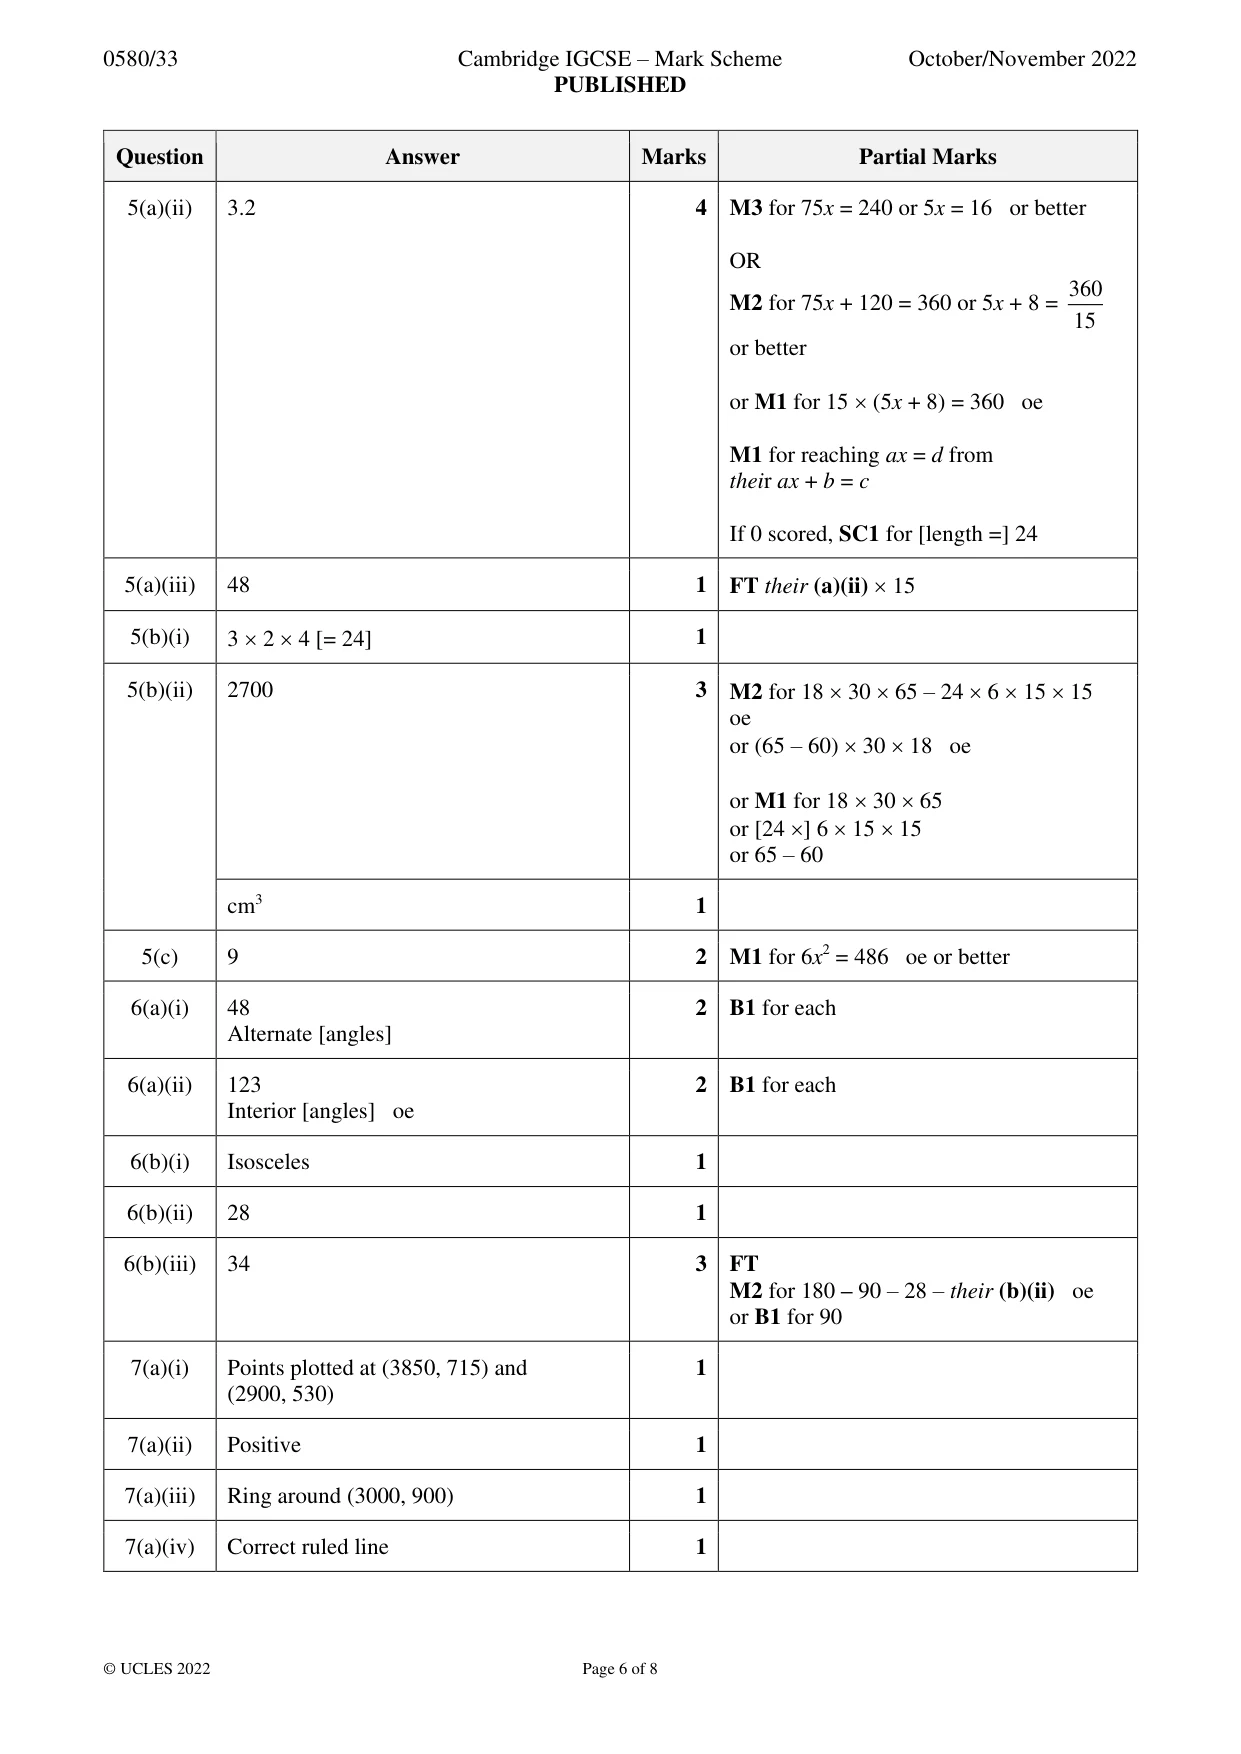
Mark scheme: 5(a)(i) x x 1 x + 4 + + 2x + + x + 4 2 2 5(a)(ii) 3.2 4 M3 for 75x = 240 or 5x = 16 or better OR 360 M2 for 75x + 120 = 360 or 5x + 8 = 15 or better or M1 for 15 (5x + 8) = 360 oe M1 for reaching ax = d from their ax + b = c If 0 scored, SC1 for [length =] 24 5(a)(iii) 48 1 FT their (a)(ii) 15 5(b)(i) 3 2 4 [= 24] 1 5(b)(ii) 2700 3 M2 for 18 30 65 – 24 6 15 15 oe or (65 – 60) 30 18 oe or M1 for 18 30 65 or [24 ] 6 15 15 or 65 – 60 cm3 1 5(c) 9 2 M1 for 6x2 = 486 oe or better
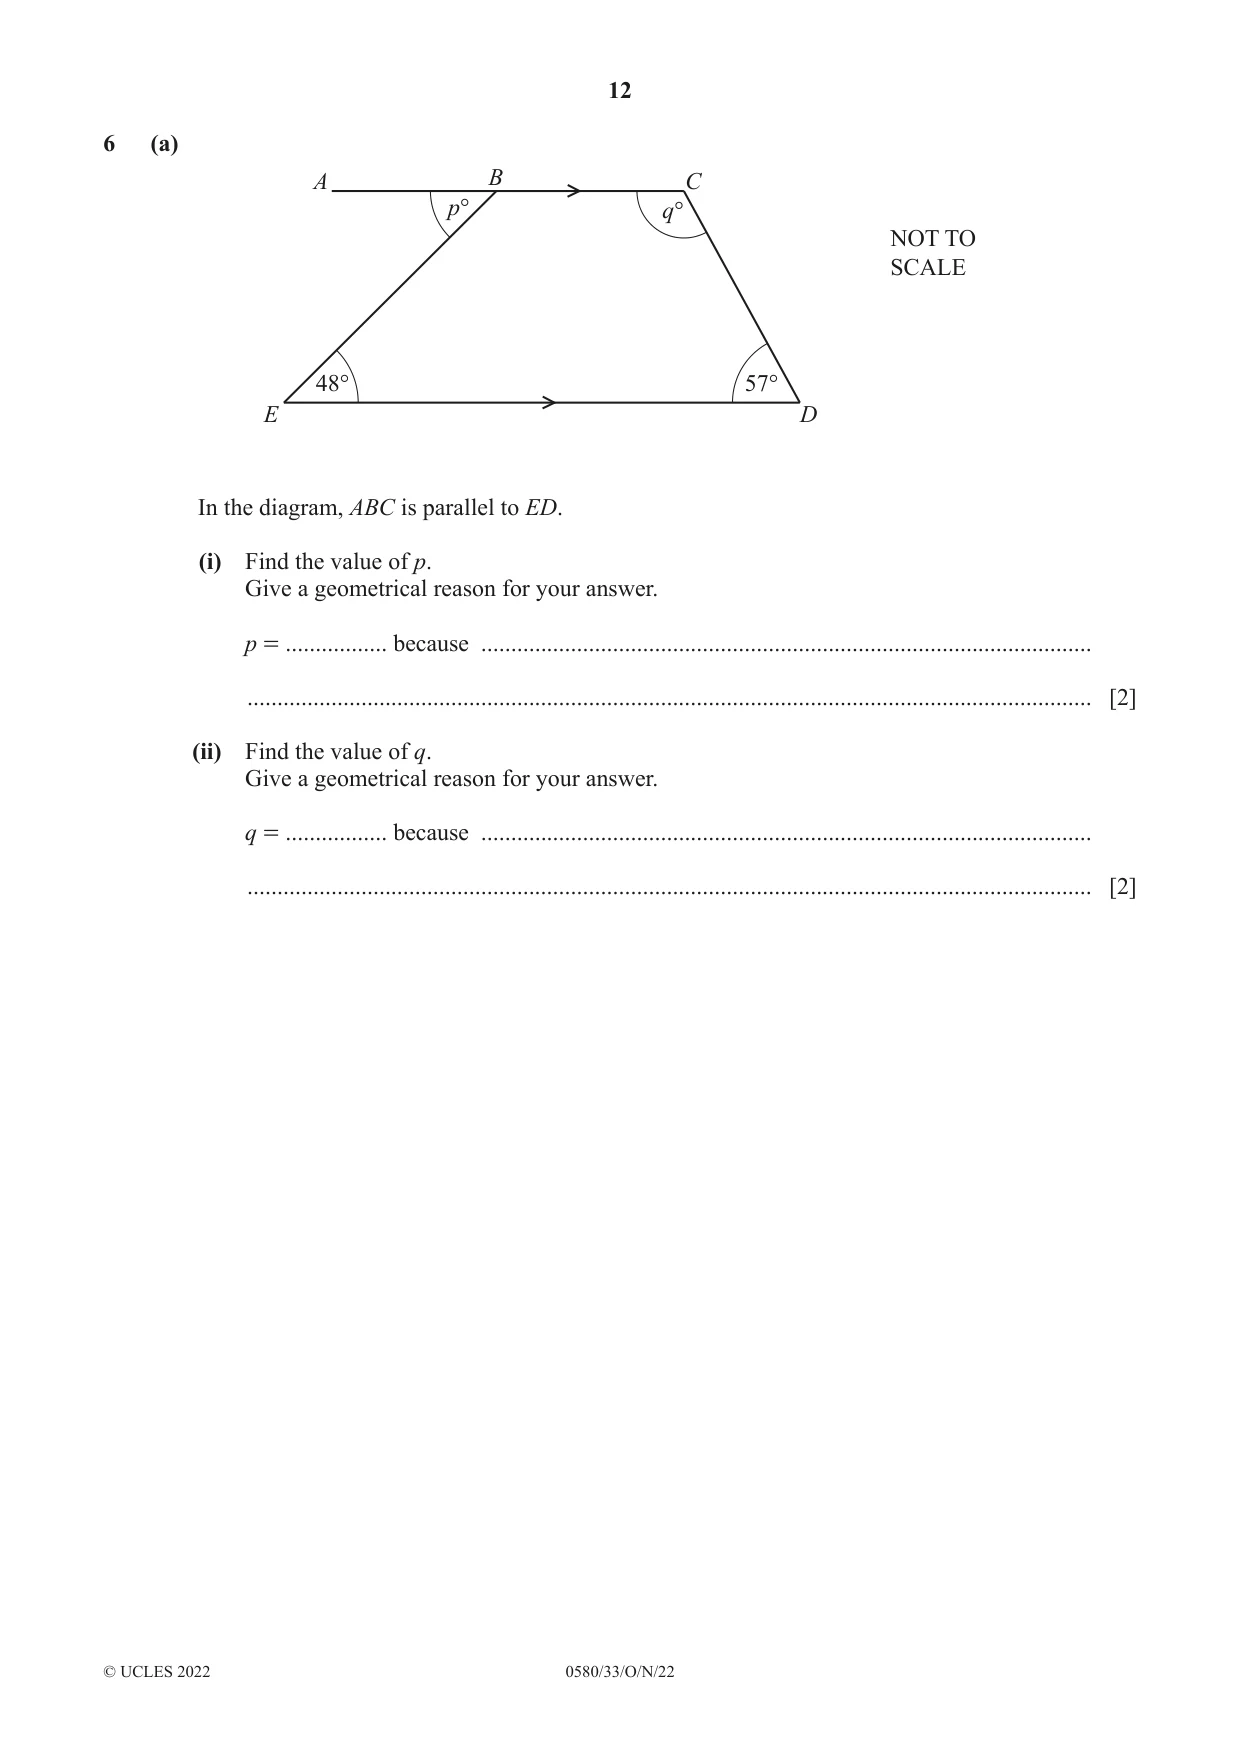
Q6 · A B C p° q° NOT TO SCALE 48° 57° E D In the diagram, ABC is parallel to ED
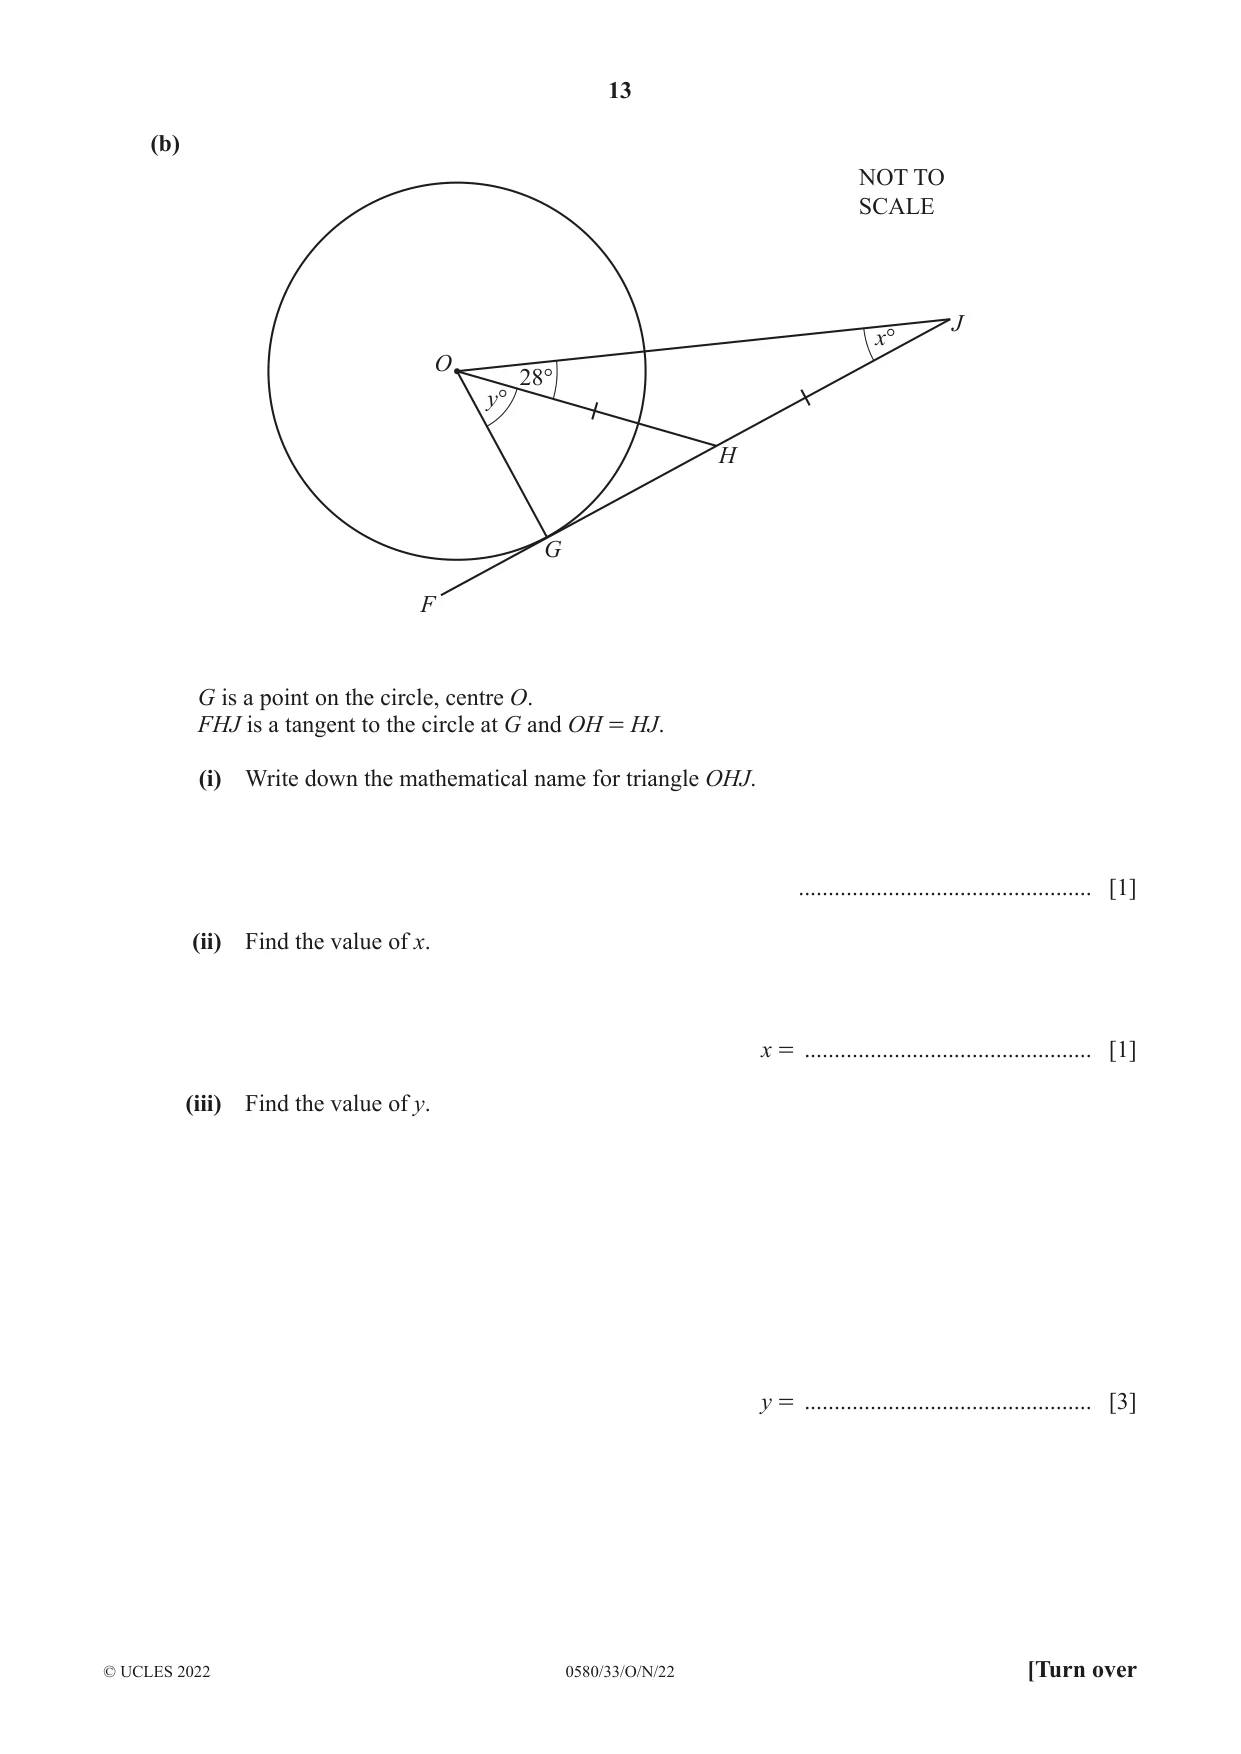
6 (a) A B C p° q° NOT TO SCALE 48° 57° E D In the diagram, ABC is parallel to ED. (i) Find the value of p. Give a geometrical reason for your answer. p = ................. because ...................................................................................................... ............................................................................................................................................. [2] (ii) Find the value of q. Give a geometrical reason for your answer. q = ................. because ...................................................................................................... ............................................................................................................................................. [2] (b) NOT TO SCALE J x° O 28° y° H G F G is a point on the circle, centre O. FHJ is a tangent to the circle at G and OH = HJ. (i) Write down the mathematical name for triangle OHJ. ................................................. [1] (ii) Find the value of x. x = ................................................ [1] (iii) Find the value of y. y = ................................................ [3]
Mark scheme: 6(a)(i) 48 2 B1 for each Alternate [angles] 6(a)(ii) 123 2 B1 for each Interior [angles] oe 6(b)(i) Isosceles 1 6(b)(ii) 28 1 6(b)(iii) 34 3 FT M2 for 180 – 90 – 28 – their (b)(ii) oe or B1 for 90
Q7 · The table shows the distance, in km, a plane travels and the ticket price, in dollars…
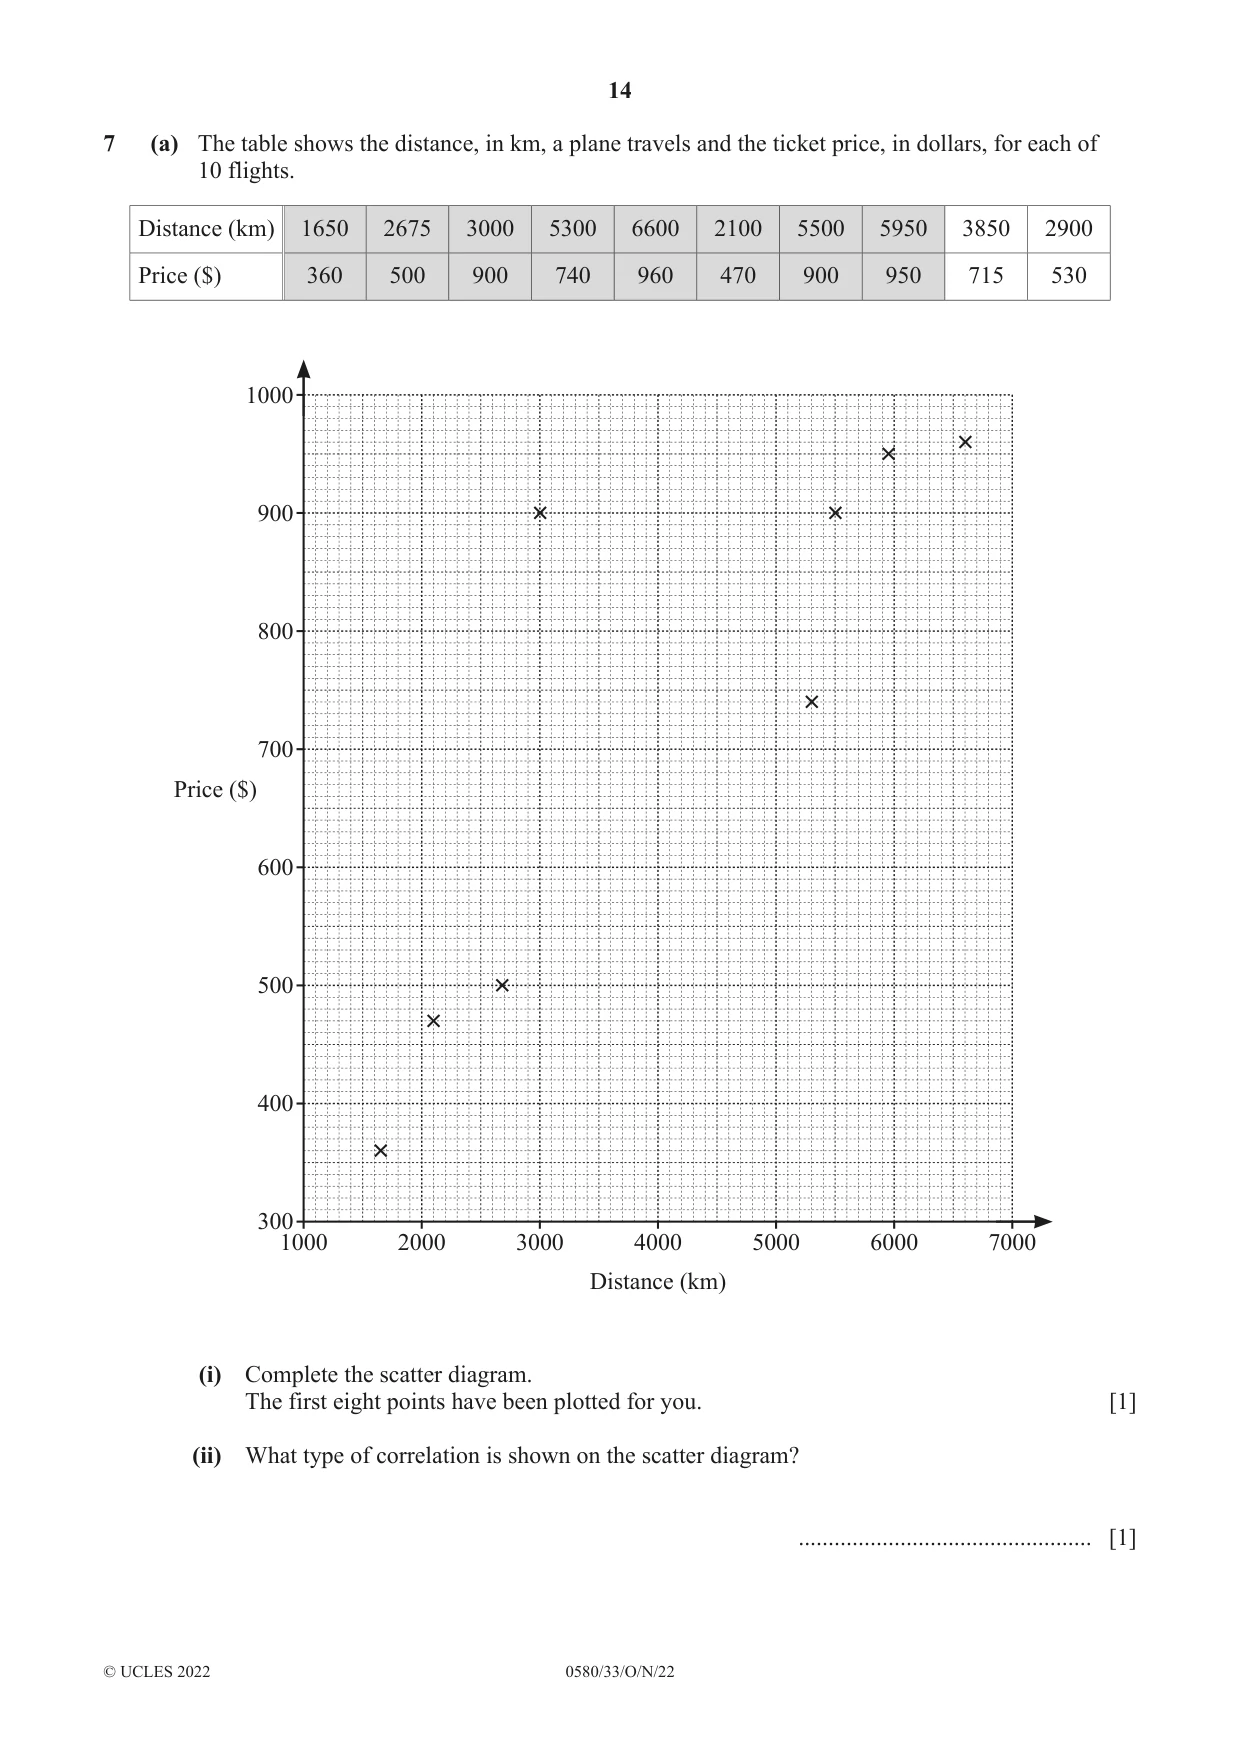
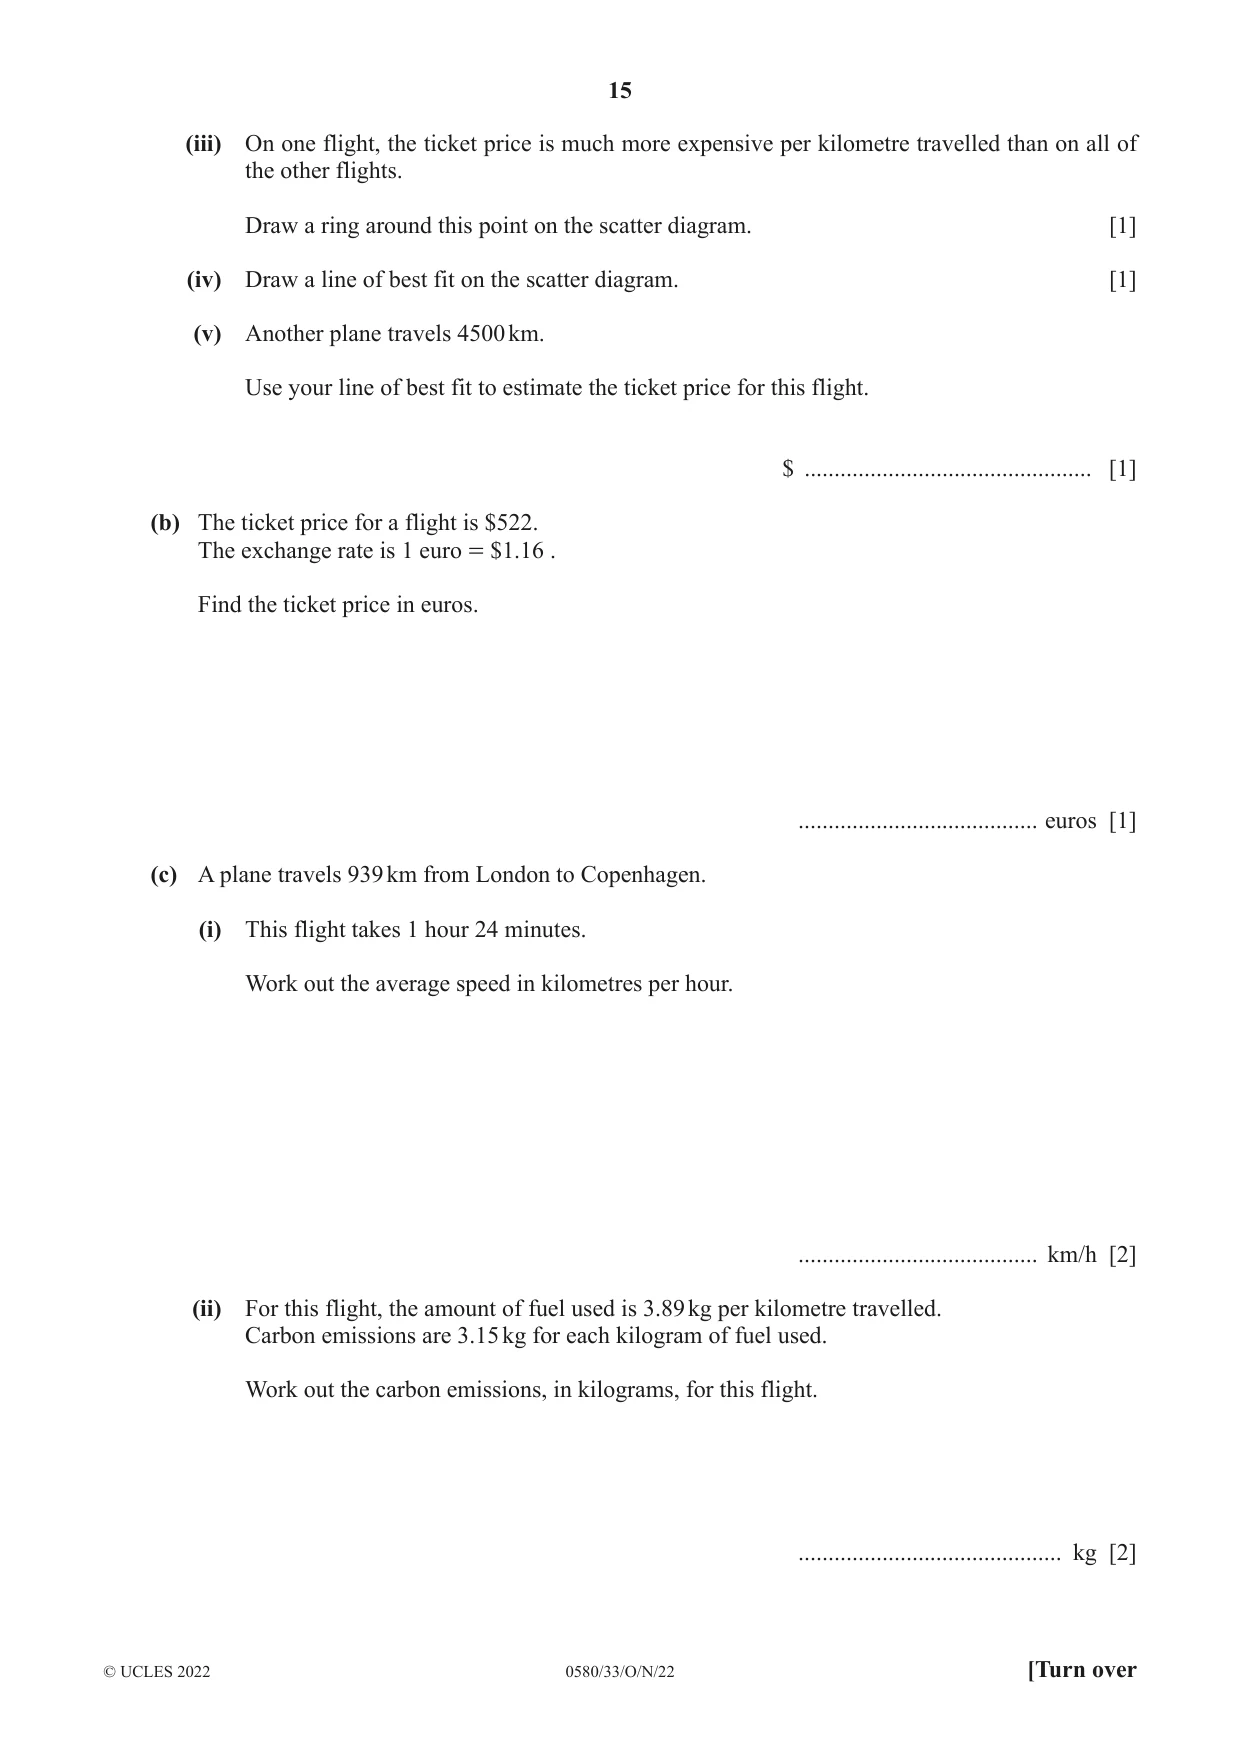
7 (a) The table shows the distance, in km, a plane travels and the ticket price, in dollars, for each of 10 flights. Distance (km) 1650 2675 3000 5300 6600 2100 5500 5950 3850 2900 Price ($) 360 500 900 740 960 470 900 950 715 530 1000 900 800 700 Price ($) 600 500 400 300 1000 2000 3000 4000 5000 6000 7000 Distance (km) (i) Complete the scatter diagram. The first eight points have been plotted for you. [1] (ii) What type of correlation is shown on the scatter diagram? ................................................. [1] (iii) On one flight, the ticket price is much more expensive per kilometre travelled than on all of the other flights. Draw a ring around this point on the scatter diagram. [1] (iv) Draw a line of best fit on the scatter diagram. [1] (v) Another plane travels 4500 km. Use your line of best fit to estimate the ticket price for this flight. $ ................................................ [1] (b) The ticket price for a flight is $522. The exchange rate is 1 euro = $1.16 . Find the ticket price in euros. ........................................ euros [1] (c) A plane travels 939 km from London to Copenhagen. (i) This flight takes 1 hour 24 minutes. Work out the average speed in kilometres per hour. ........................................ km/h [2] (ii) For this flight, the amount of fuel used is 3.89 kg per kilometre travelled. Carbon emissions are 3.15 kg for each kilogram of fuel used. Work out the carbon emissions, in kilograms, for this flight. ............................................ kg [2]
Mark scheme: 7(a)(i) Points plotted at (3850, 715) and 1 (2900, 530) 7(a)(ii) Positive 1 7(a)(iii) Ring around (3000, 900) 1 7(a)(iv) Correct ruled line 1 7(a)(v) 720 to 760 1 FT from their line provided positive gradient 7(b) 450 1 7(c)(i) 671 or 670.7… 2 M1 for 939 ÷ 1.4 oe or 939 ÷ their time 7(c)(ii) 11 500 or 11 510 or 11 506.[…] 2 M1 for 3.89 939 3.15
Q8 · Y 10 9 8 7 6 C 5 4 3 2 A 1 – 8 – 7 – 6 – 5 – 4 – 3 – 2 – 1 0 1 2 3 4 5 6 x – 1 B – 2 – 3…
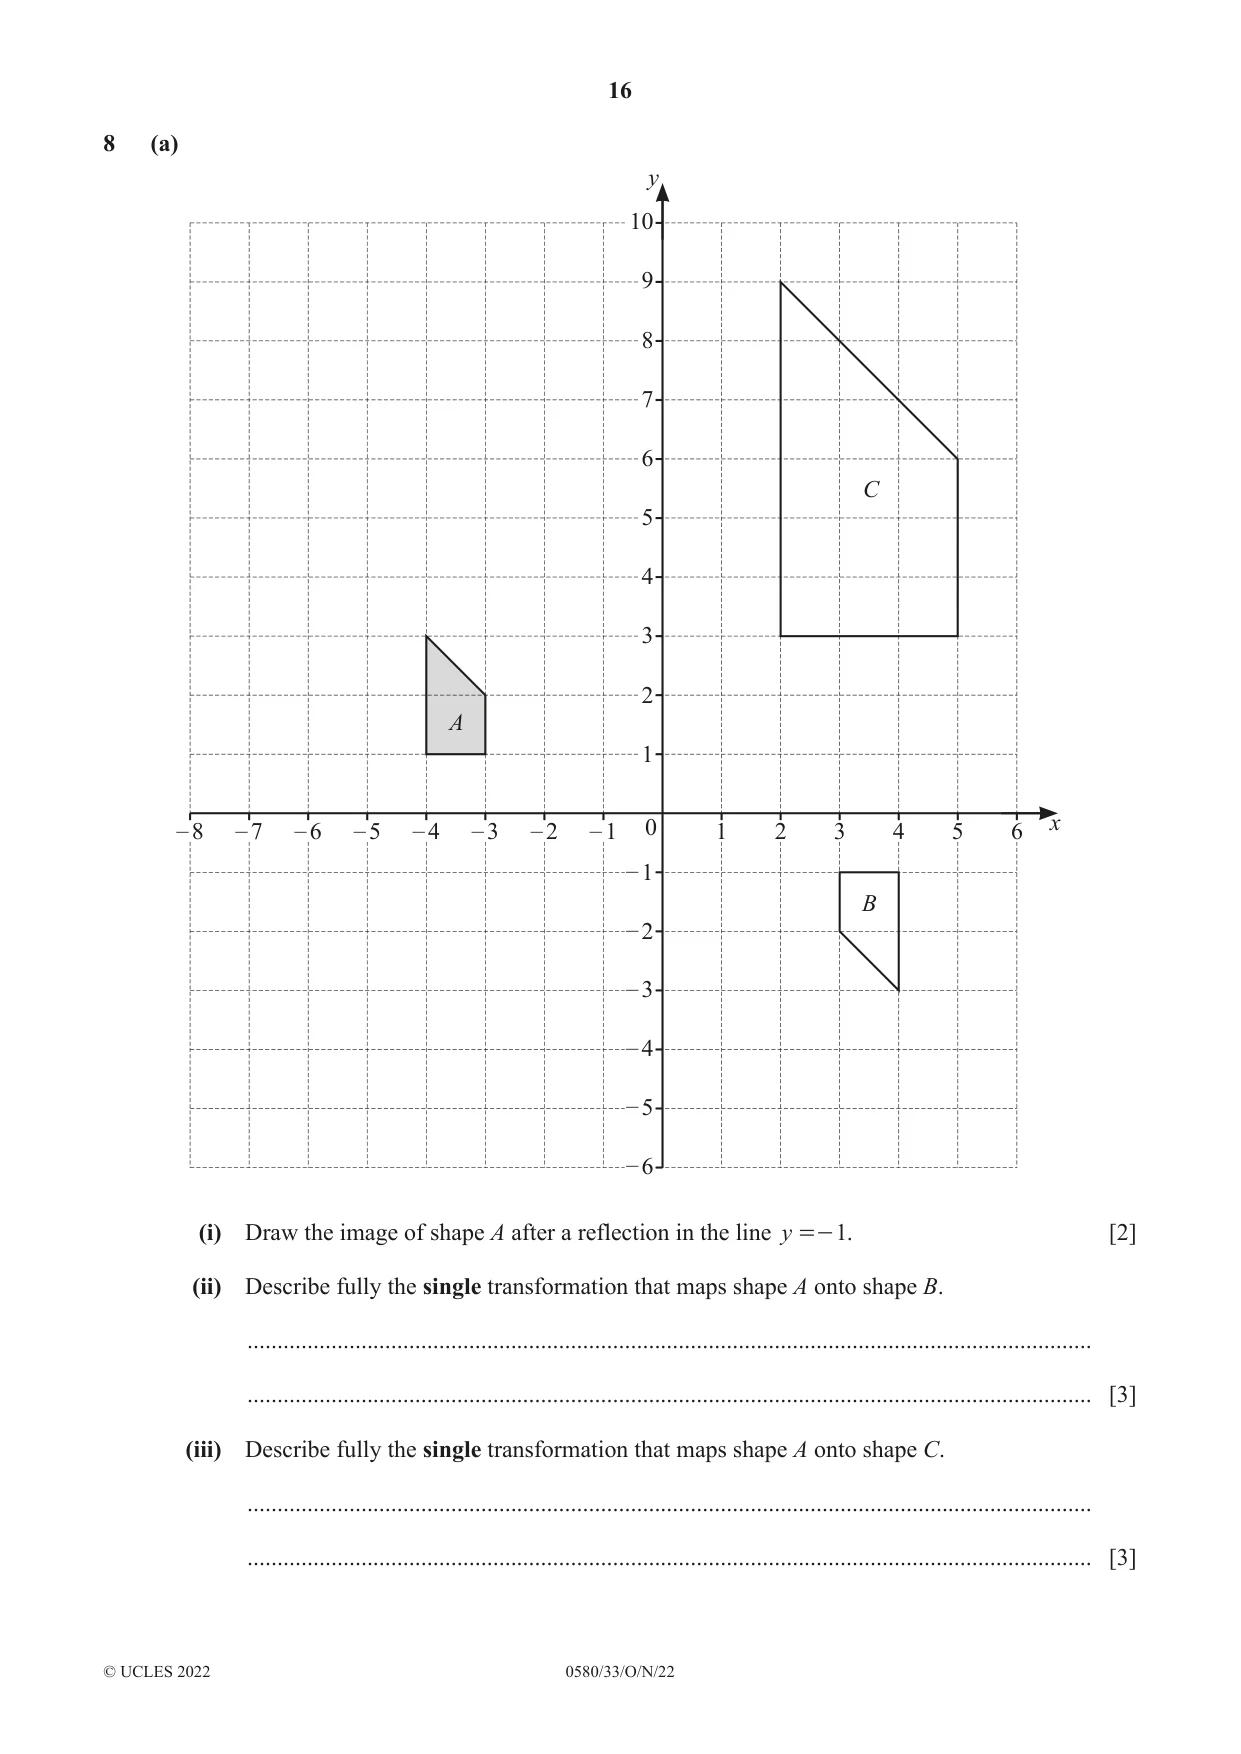
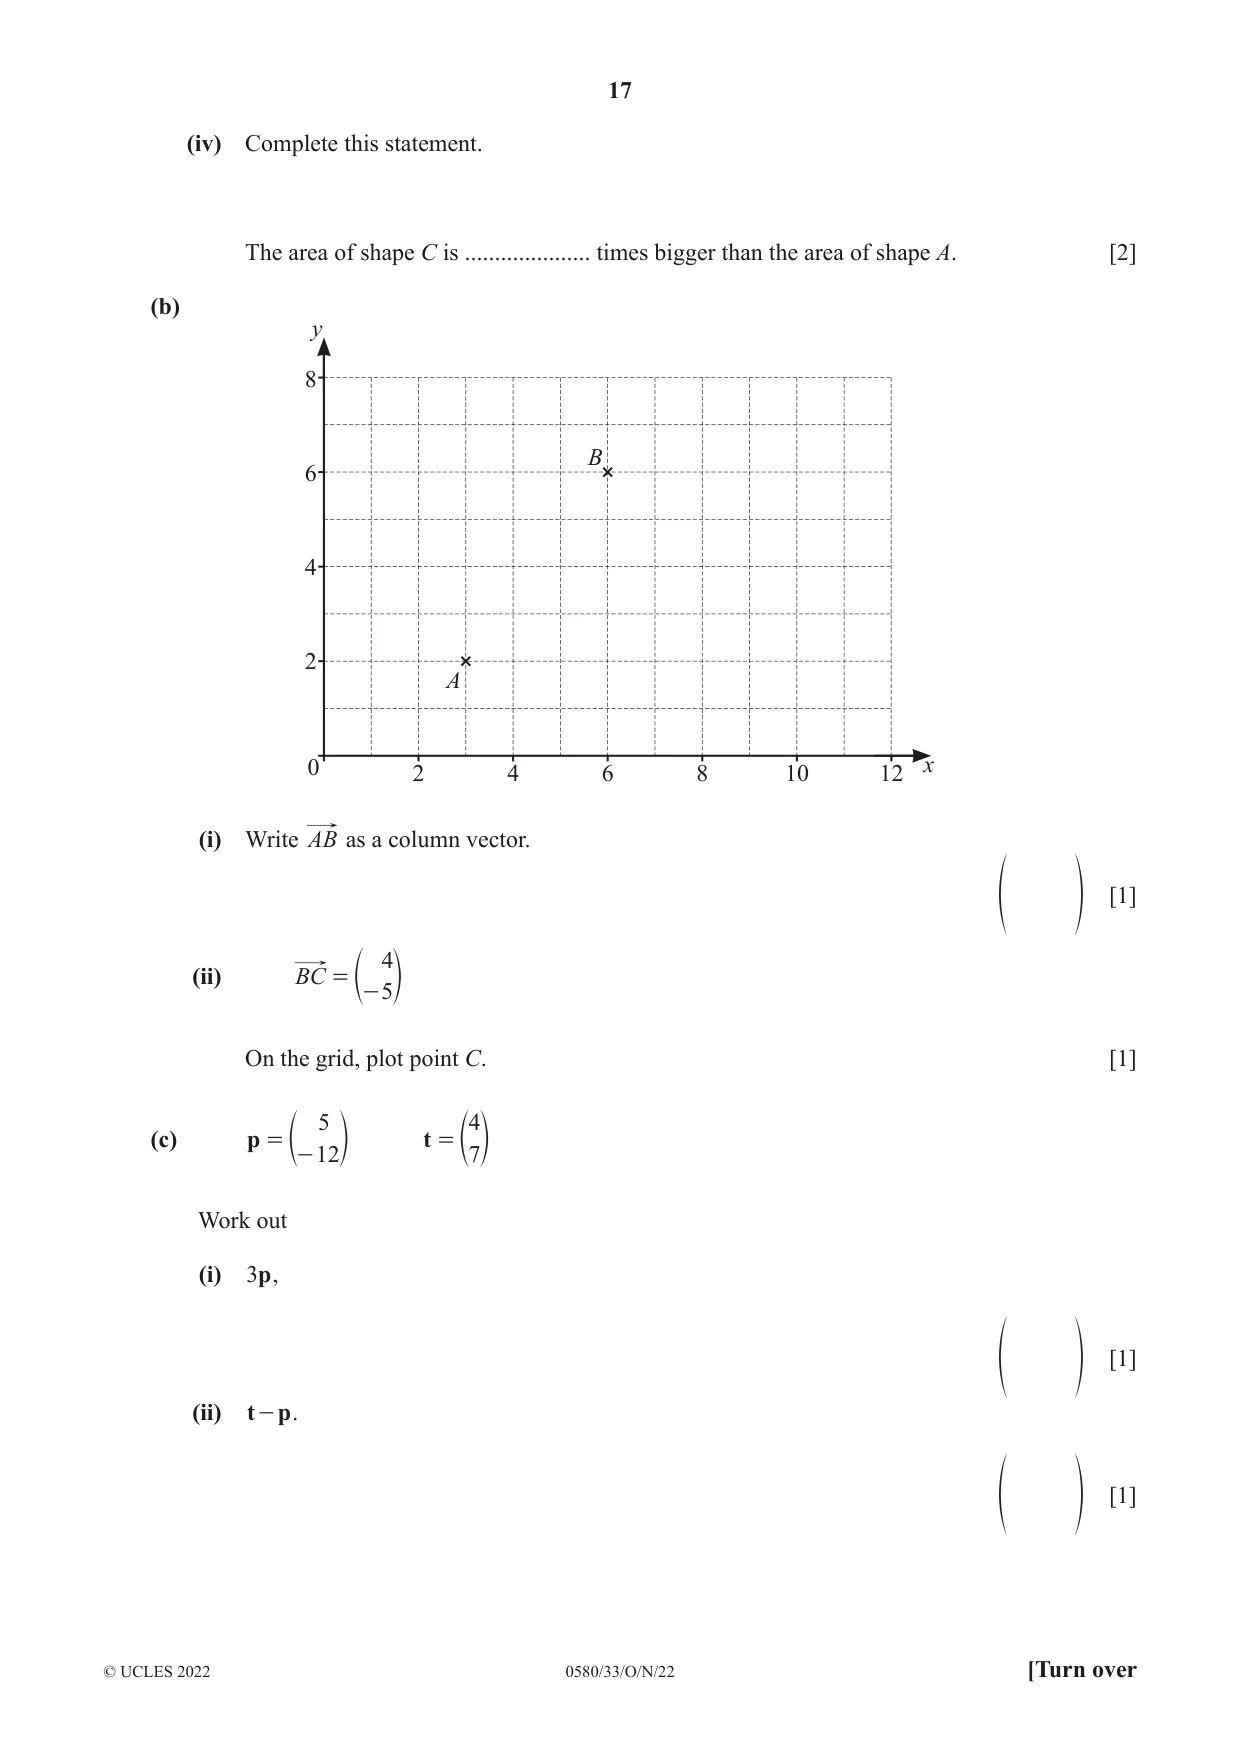
8 (a) y 10 9 8 7 6 C 5 4 3 2 A 1 – 8 – 7 – 6 – 5 – 4 – 3 – 2 – 1 0 1 2 3 4 5 6 x – 1 B – 2 – 3 – 4 – 5 – 6 (i) Draw the image of shape A after a reflection in the line y =- 1. [2] (ii) Describe fully the single transformation that maps shape A onto shape B. ............................................................................................................................................. ............................................................................................................................................. [3] (iii) Describe fully the single transformation that maps shape A onto shape C. ............................................................................................................................................. ............................................................................................................................................. [3] (iv) Complete this statement. The area of shape C is ..................... times bigger than the area of shape A. [2] (b) y 8 B 6 4 2 A 0 2 4 6 8 10 12 x (i) Write AB as a column vector. [1] f p 4 (ii) BC = e- 5o On the grid, plot point C. [1] 5 4 (c) p = t = e- 12o e7o Work out (i) 3p , [1] f p (ii) t - p . [1] f p
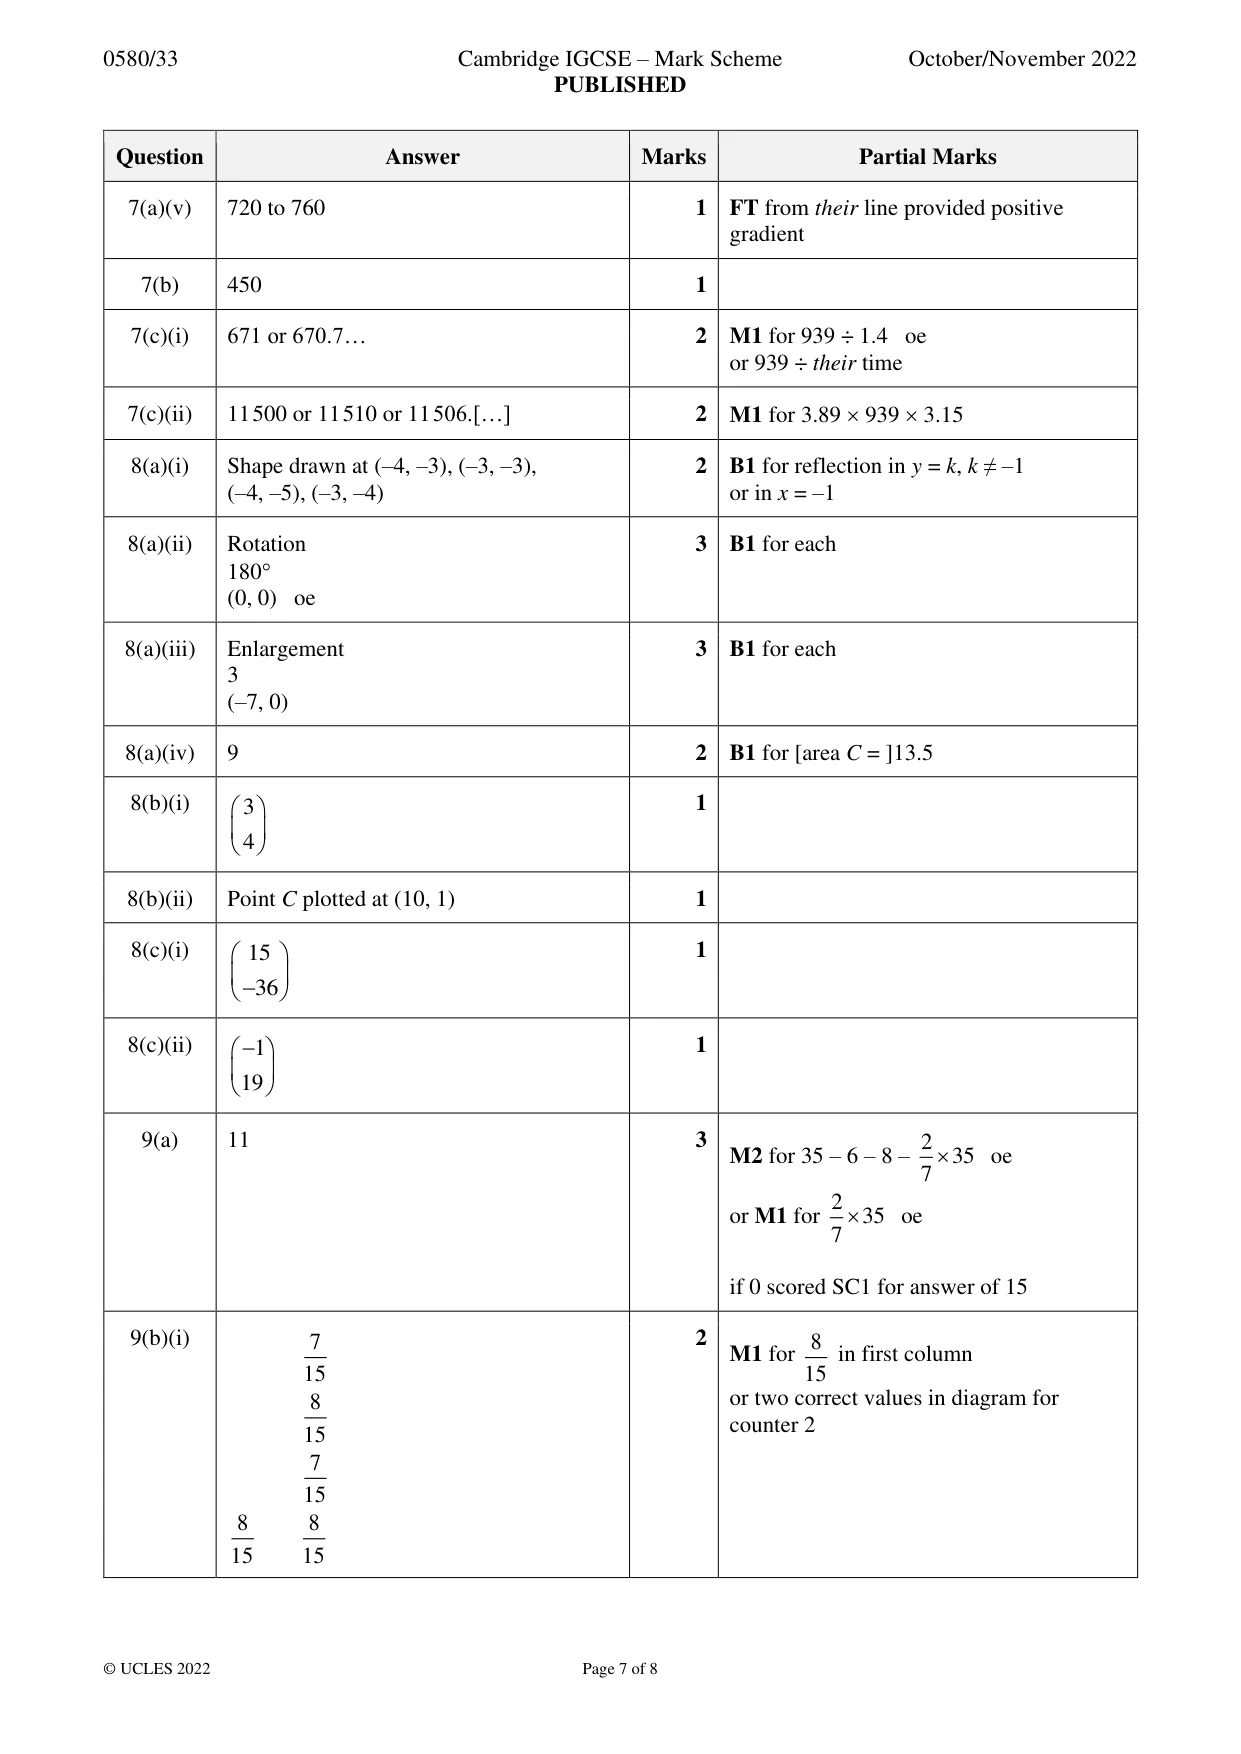
Mark scheme: 8(a)(i) Shape drawn at (–4, –3), (–3, –3), 2 B1 for reflection in y = k, k ≠ –1 (–4, –5), (–3, –4) or in x = –1 8(a)(ii) Rotation 3 B1 for each 180 (0, 0) oe 8(a)(iii) Enlargement 3 B1 for each 3 (–7, 0) 8(a)(iv) 9 2 B1 for [area C = ]13.5 8(b)(i) 3 1 4 8(b)(ii) Point C plotted at (10, 1) 1 8(c)(i) 15 1 −36 8(c)(ii) −1 1 19
Q9 · Alvian has a bag containing 35 counters
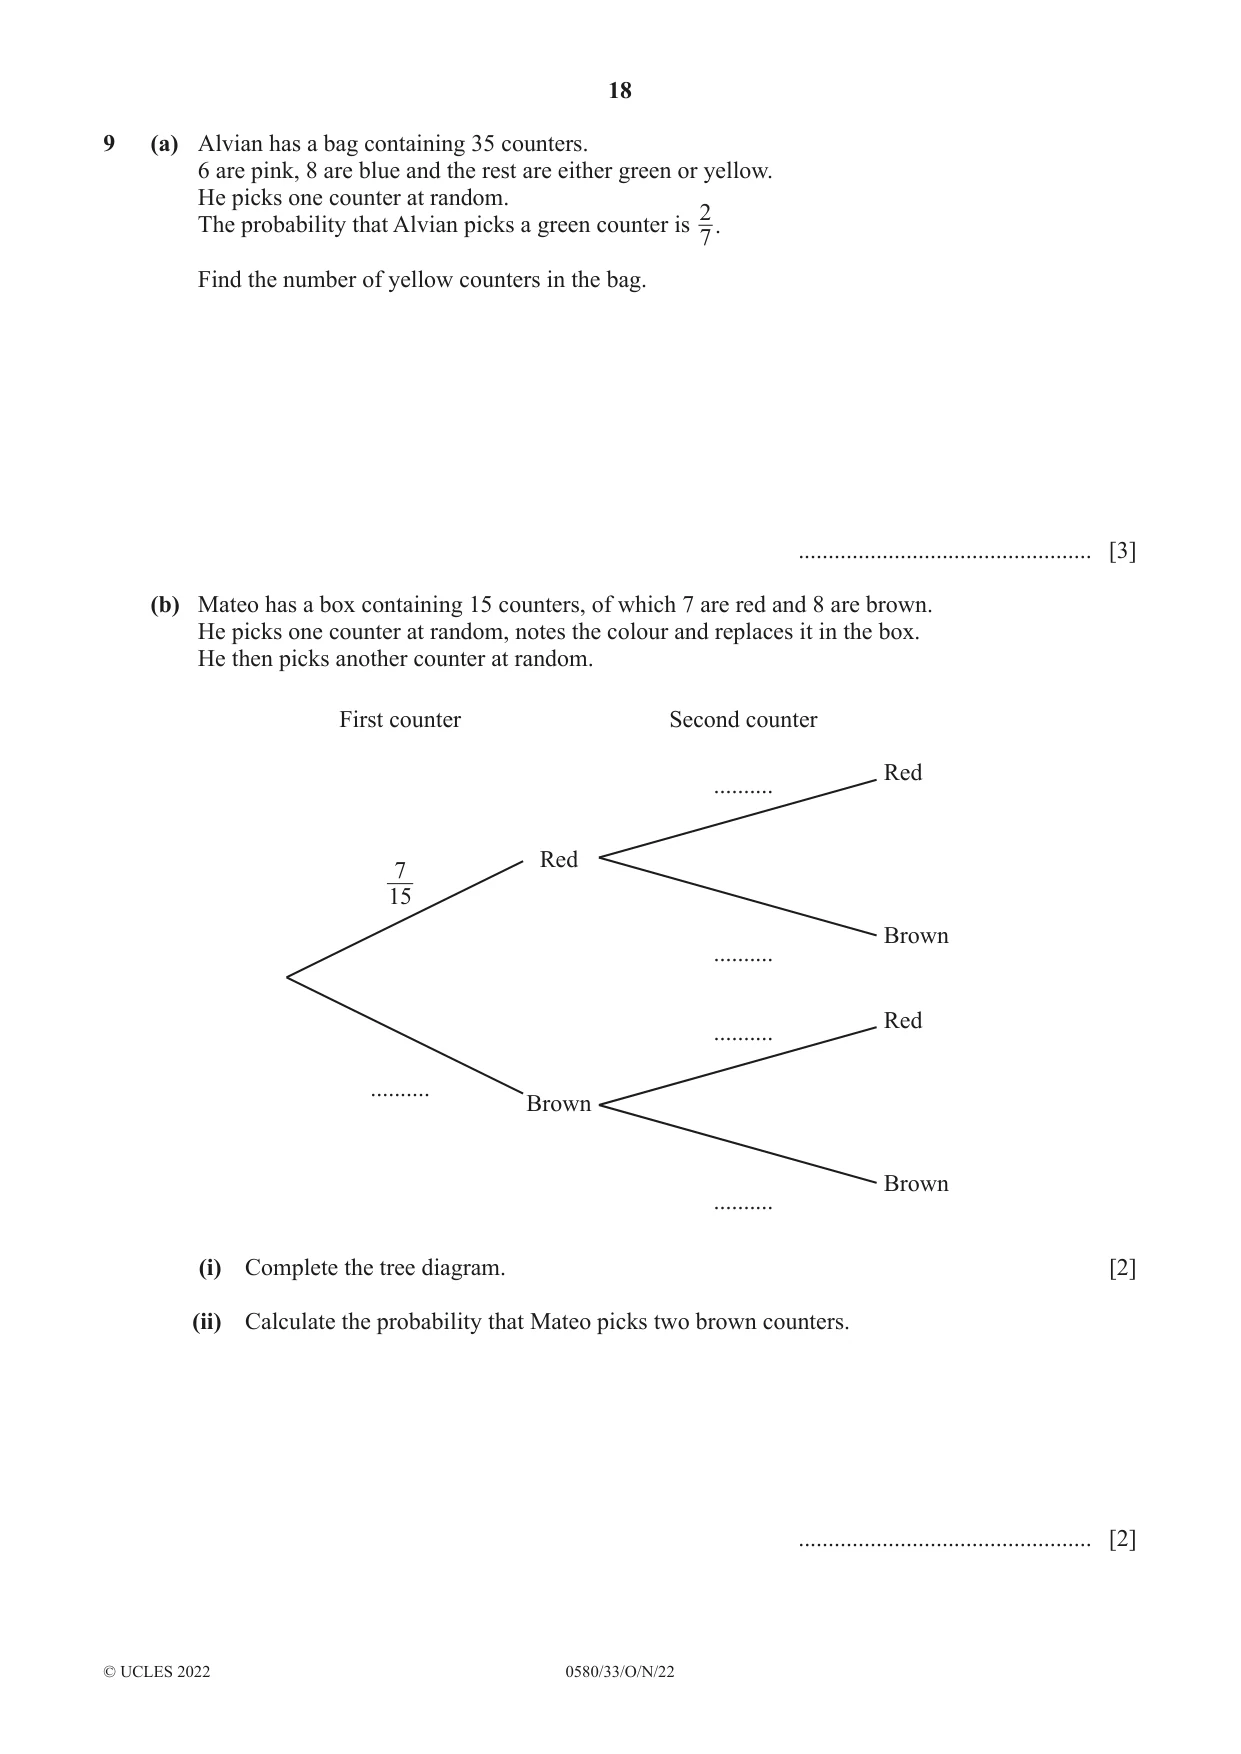
9 (a) Alvian has a bag containing 35 counters. 6 are pink, 8 are blue and the rest are either green or yellow. He picks one counter at random. The probability that Alvian picks a green counter is 2. 7 Find the number of yellow counters in the bag. ................................................. [3] (b) Mateo has a box containing 15 counters, of which 7 are red and 8 are brown. He picks one counter at random, notes the colour and replaces it in the box. He then picks another counter at random. First counter Second counter Red .......... Red 7 15 Brown .......... Red .......... .......... Brown Brown .......... (i) Complete the tree diagram. [2] (ii) Calculate the probability that Mateo picks two brown counters. ................................................. [2]
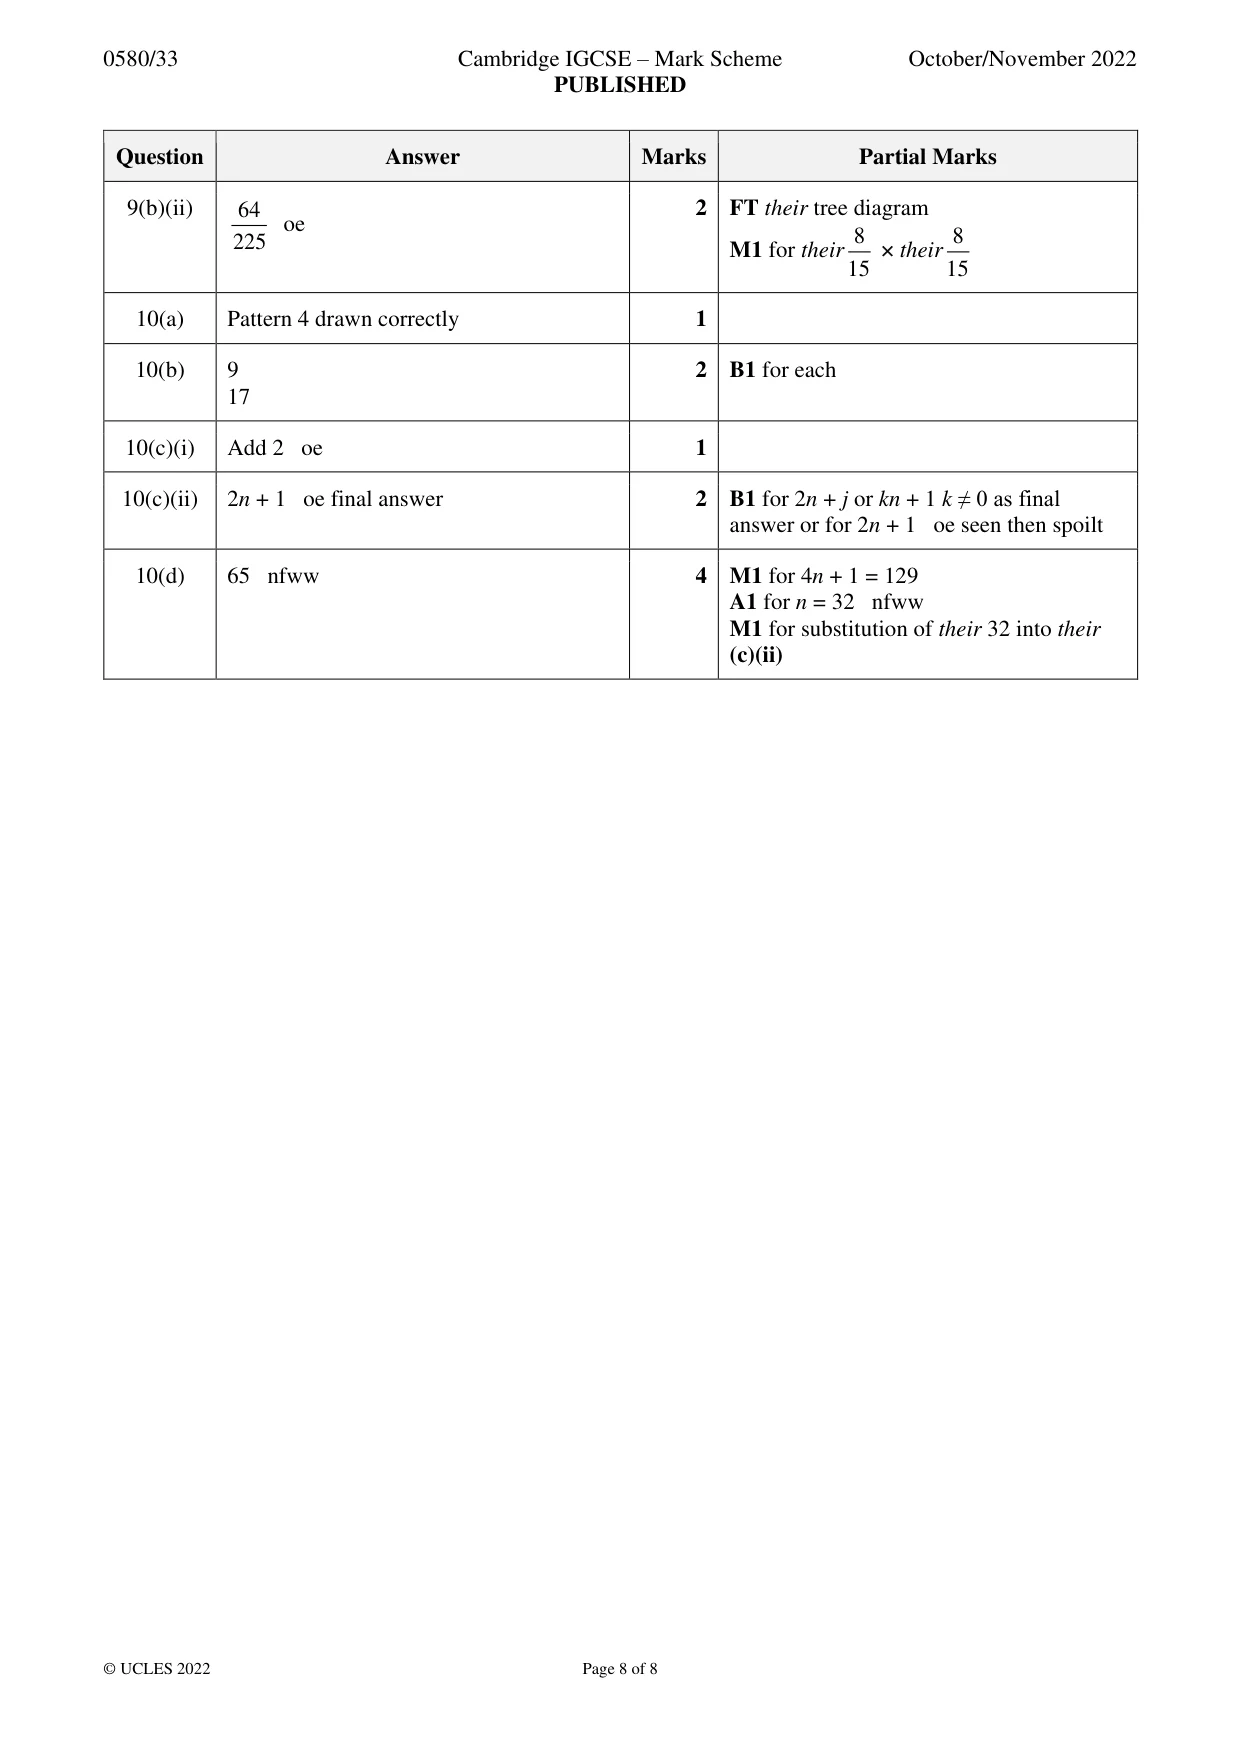
Mark scheme: 9(a) 11 3 2 M2 for 35 – 6 – 8 – 35 oe 7 2 or M1 for 35 oe 7 if 0 scored SC1 for answer of 15 9(b)(i) 7 2 8 M1 for in first column 15 15 8 or two correct values in diagram for counter 2 15 7 15 8 8 15 15 9(b)(ii) 64 2 FT their tree diagram oe 225 8 8 M1 for their their 15 15
Q10 · Meena makes these patterns using dots and lines
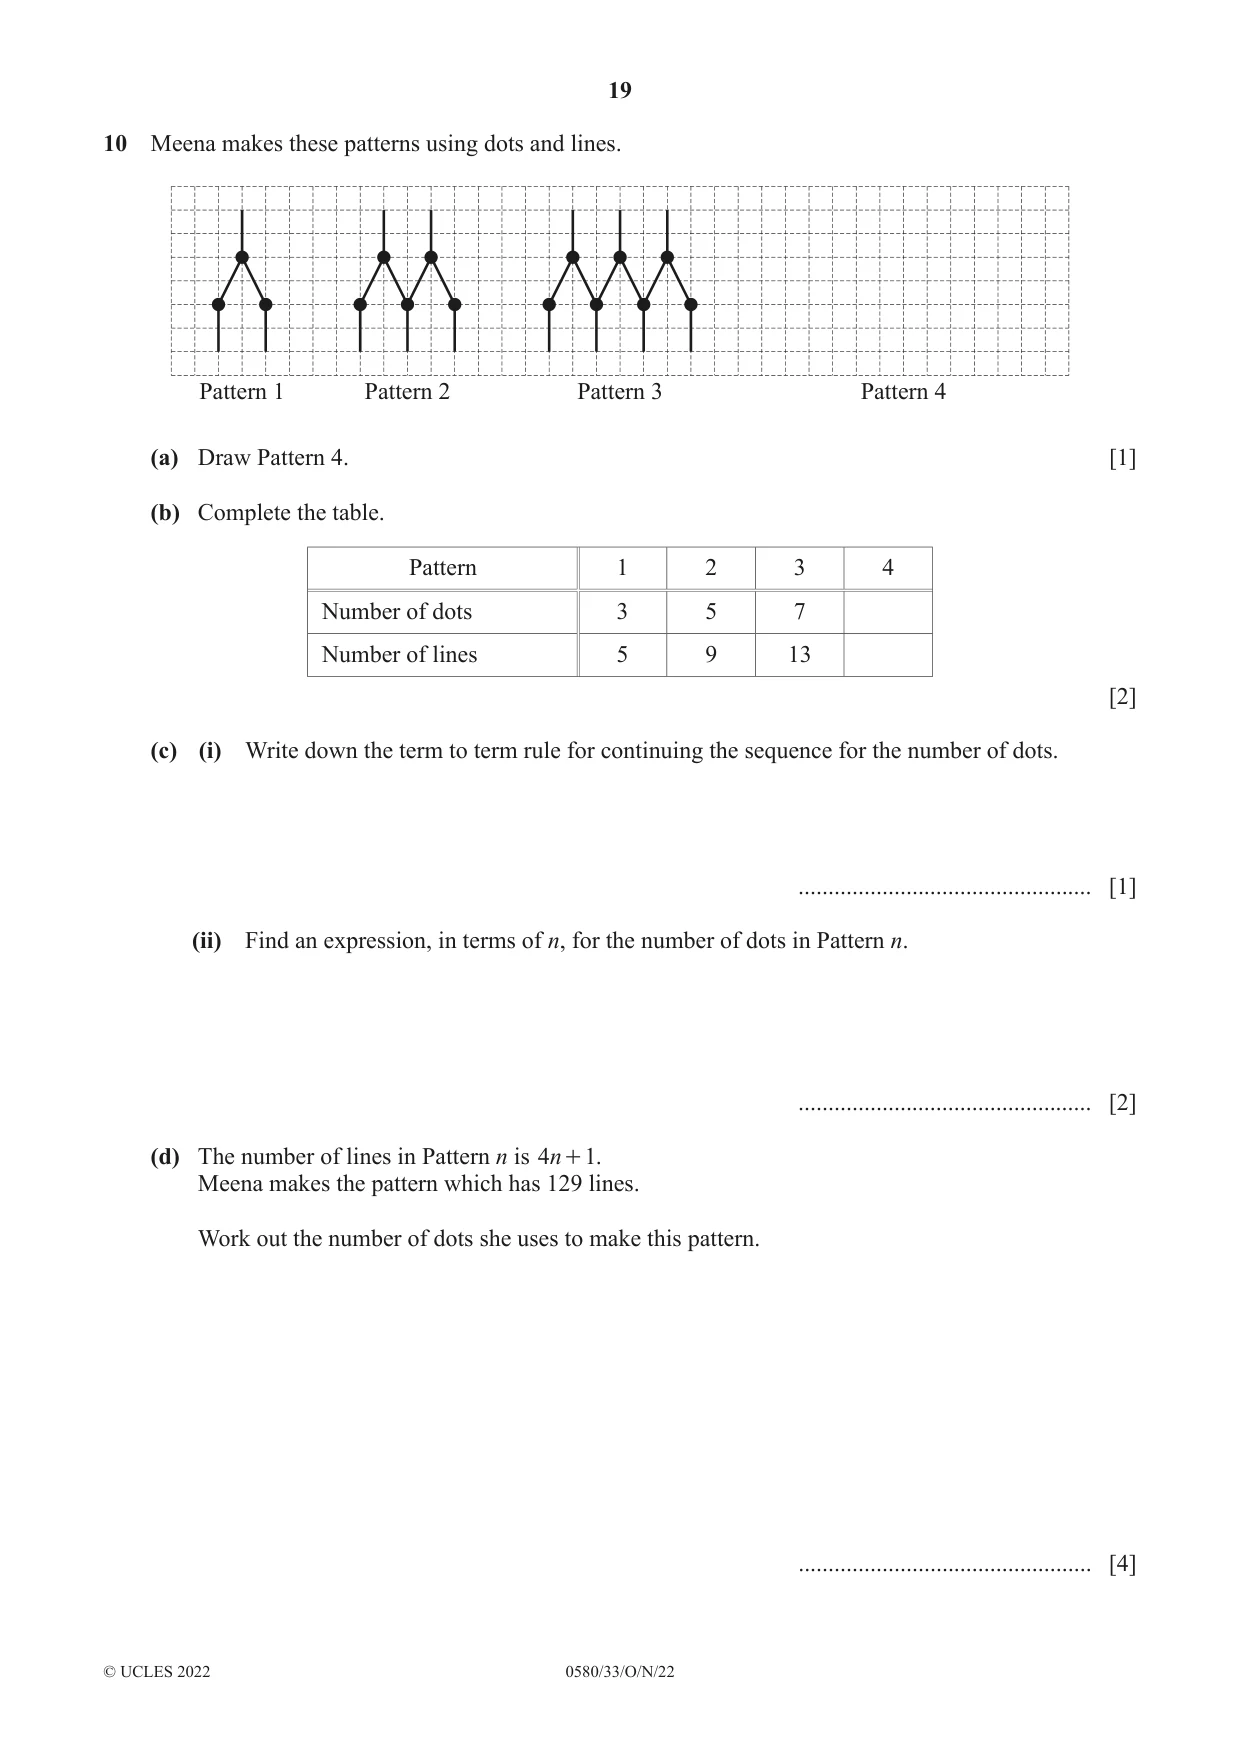
10 Meena makes these patterns using dots and lines. Pattern 1 Pattern 2 Pattern 3 Pattern 4 (a) Draw Pattern 4. [1] (b) Complete the table. Pattern 1 2 3 4 Number of dots 3 5 7 Number of lines 5 9 13 [2] (c) (i) Write down the term to term rule for continuing the sequence for the number of dots. ................................................. [1] (ii) Find an expression, in terms of n, for the number of dots in Pattern n. ................................................. [2] (d) The number of lines in Pattern n is 4n + 1. Meena makes the pattern which has 129 lines. Work out the number of dots she uses to make this pattern. ................................................. [4]
Mark scheme: 10(a) Pattern 4 drawn correctly 1 10(b) 9 2 B1 for each 17 10(c)(i) Add 2 oe 1 10(c)(ii) 2n + 1 oe final answer 2 B1 for 2n + j or kn + 1 k ≠ 0 as final answer or for 2n + 1 oe seen then spoilt 10(d) 65 nfww 4 M1 for 4n + 1 = 129 A1 for n = 32 nfww M1 for substitution of their 32 into their (c)(ii)
What was in this paper
The subtopics covered by these 10 questions, and how many questions each got. Open one in a new tab to see every Cambridge question on it.
What you needed in this session
Cambridge’s own grade thresholds for 2022 Oct/Nov, Paper 3 · Variant 3. A higher threshold means an easier paper — the bar moves with how the cohort did.