Cambridge IGCSE Mathematics 0580 — 2024 Oct/Nov Paper 3 · Variant 1
0580/31/O/N/24 · 10 questions · 104 marks · ≈117 min
The question paper and its mark scheme, free to read here and free to download. This is Cambridge’s own paper, exactly as it was sat.
Question paper20 pages
Mark scheme8 pages
Answers below. Sit the paper first if you are practising.
Questions as text
Q1 · Write the number six million and thirty in figures
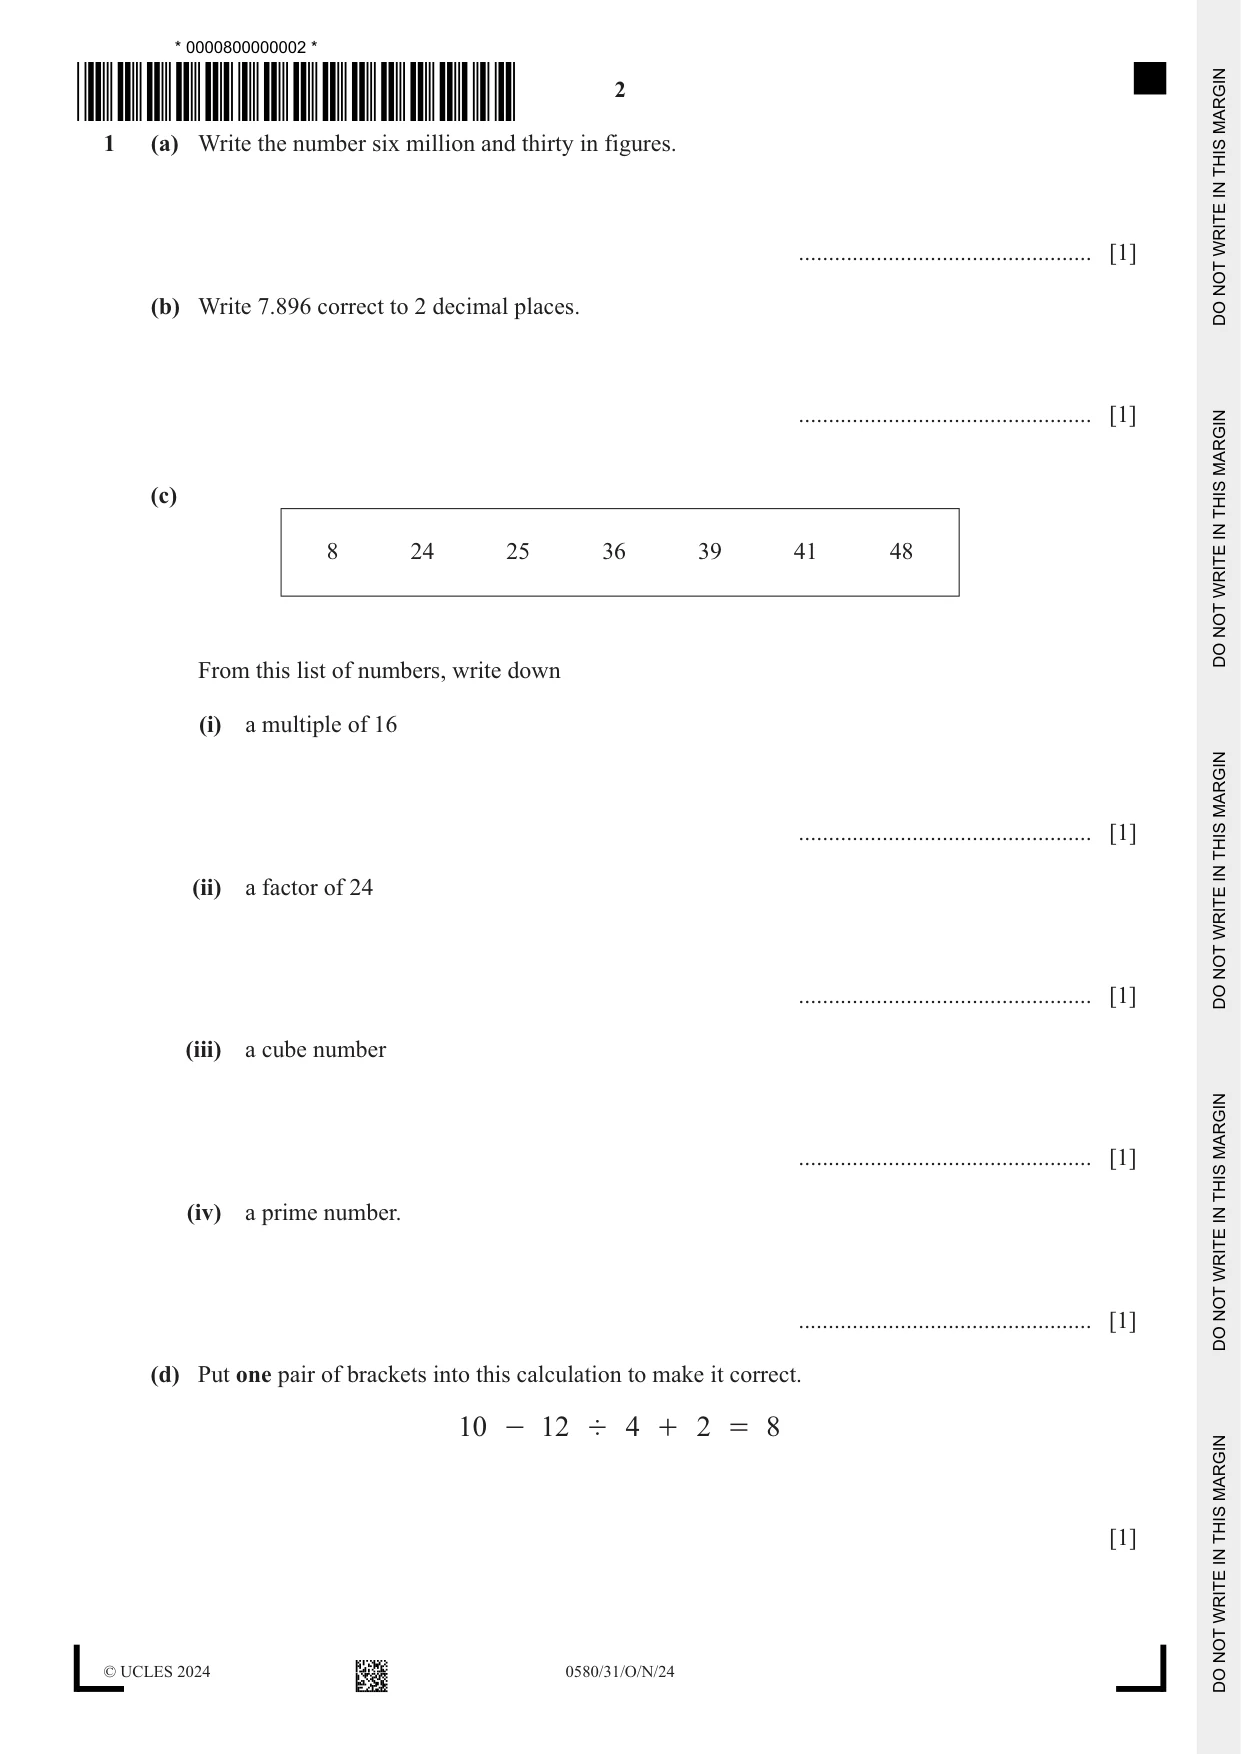
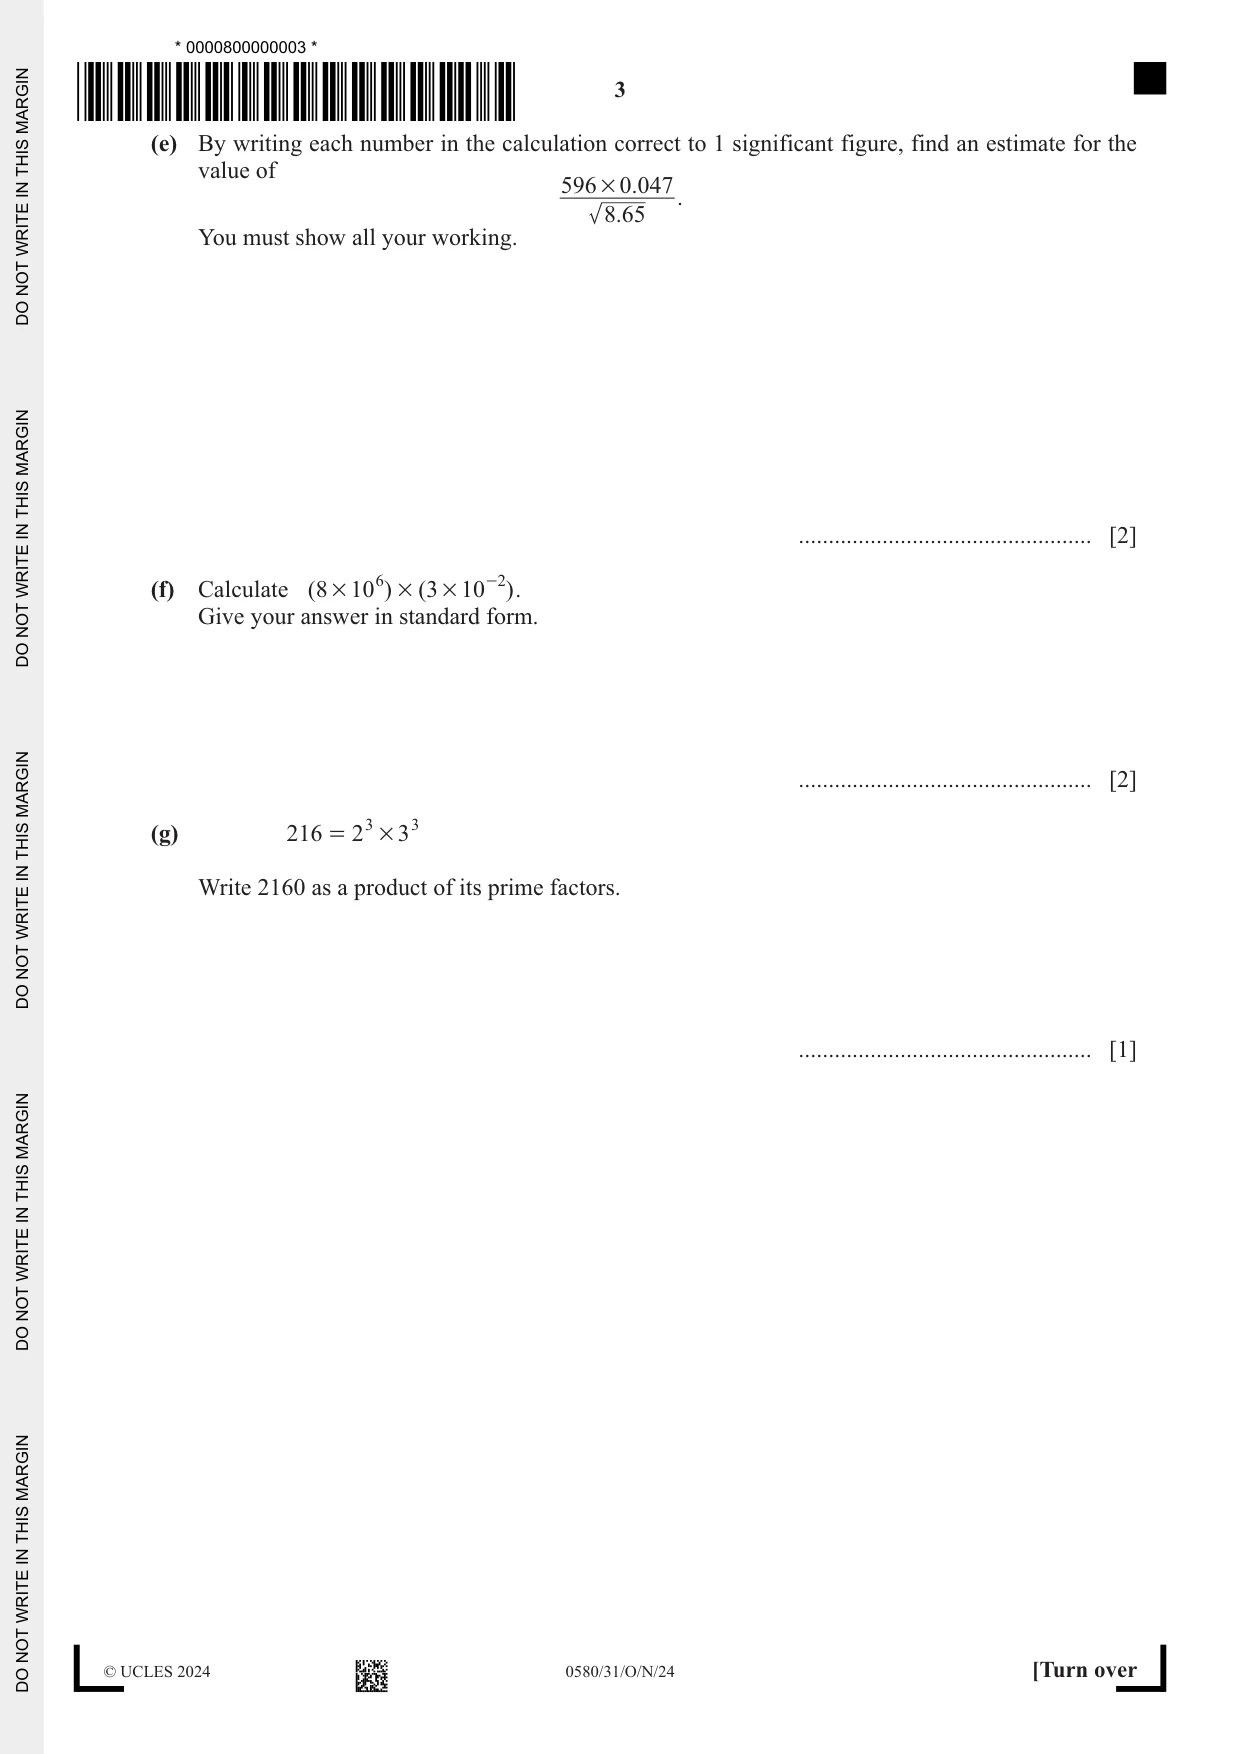
1 (a) Write the number six million and thirty in figures. ................................................. [1] (b) Write 7.896 correct to 2 decimal places. ................................................. [1] (c) 8 24 25 36 39 41 48 From this list of numbers, write down (i) a multiple of 16 ................................................. [1] (ii) a factor of 24 ................................................. [1] (iii) a cube number ................................................. [1] (iv) a prime number. ................................................. [1] (d) Put one pair of brackets into this calculation to make it correct. 10 - 12 ' 4 + 2 = 8 [1] (e) By writing each number in the calculation correct to 1 significant figure, find an estimate for the value of 596 # 0.047 . 8.65 You must show all your working. ................................................. [2] (f) Calculate ( 8 # 10 6 ) # ( 3 # 10 -2) . Give your answer in standard form. ................................................. [2] (g) 216 = 2 3 # 3 3 Write 2160 as a product of its prime factors. ................................................. [1]
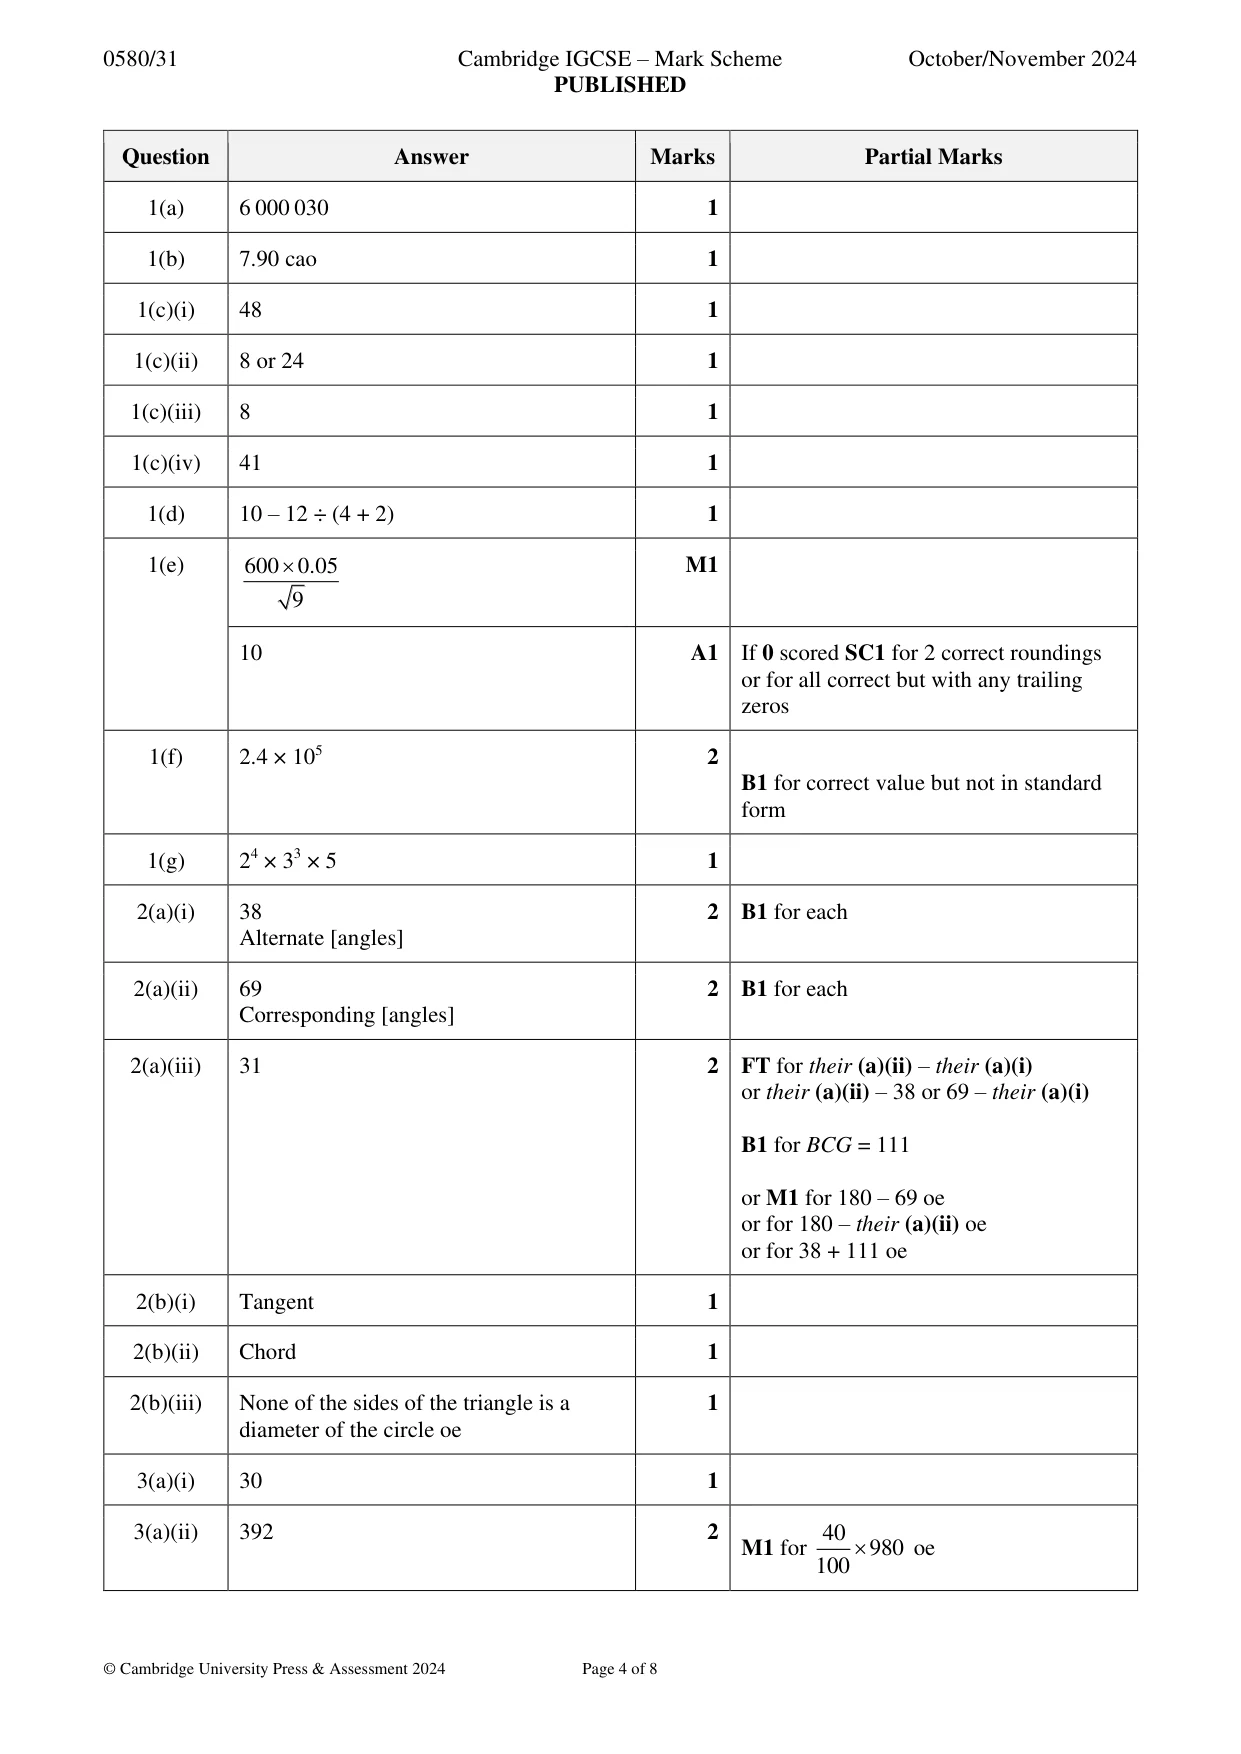
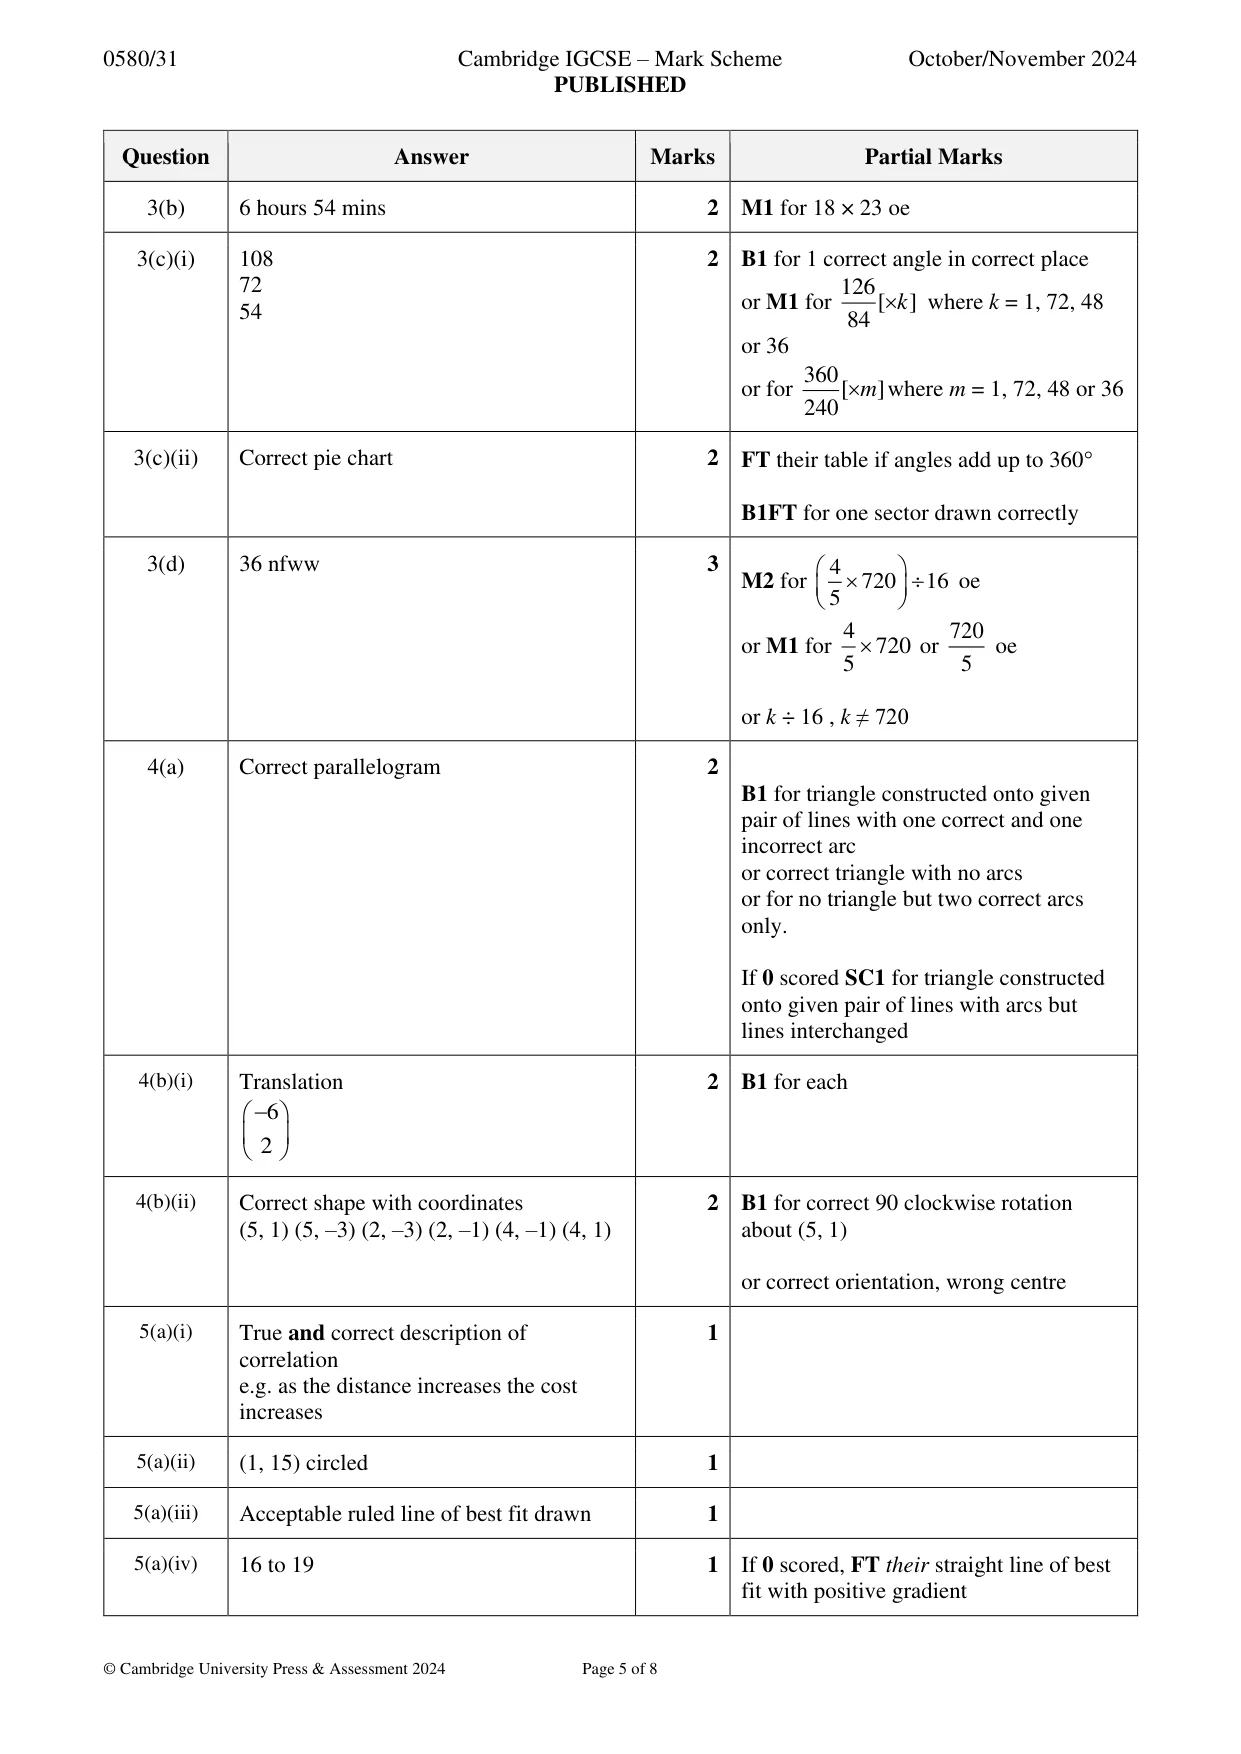
Mark scheme: Question Answer Marks Partial Marks 1(a) 6 000 030 1 1(b) 7.90 cao 1 1(c)(i) 48 1 1(c)(ii) 8 or 24 1 1(c)(iii) 8 1 1(c)(iv) 41 1 1(d) 10 – 12 ÷ (4 + 2) 1 1(e) 600 0.05 M1 9 10 A1 If 0 scored SC1 for 2 correct roundings or for all correct but with any trailing zeros 1(f) 2.4 × 10⁵ 2 B1 for correct value but not in standard form 1(g) 24 × 33 × 5 1
Q2 · In the diagram, BCG is a triangle
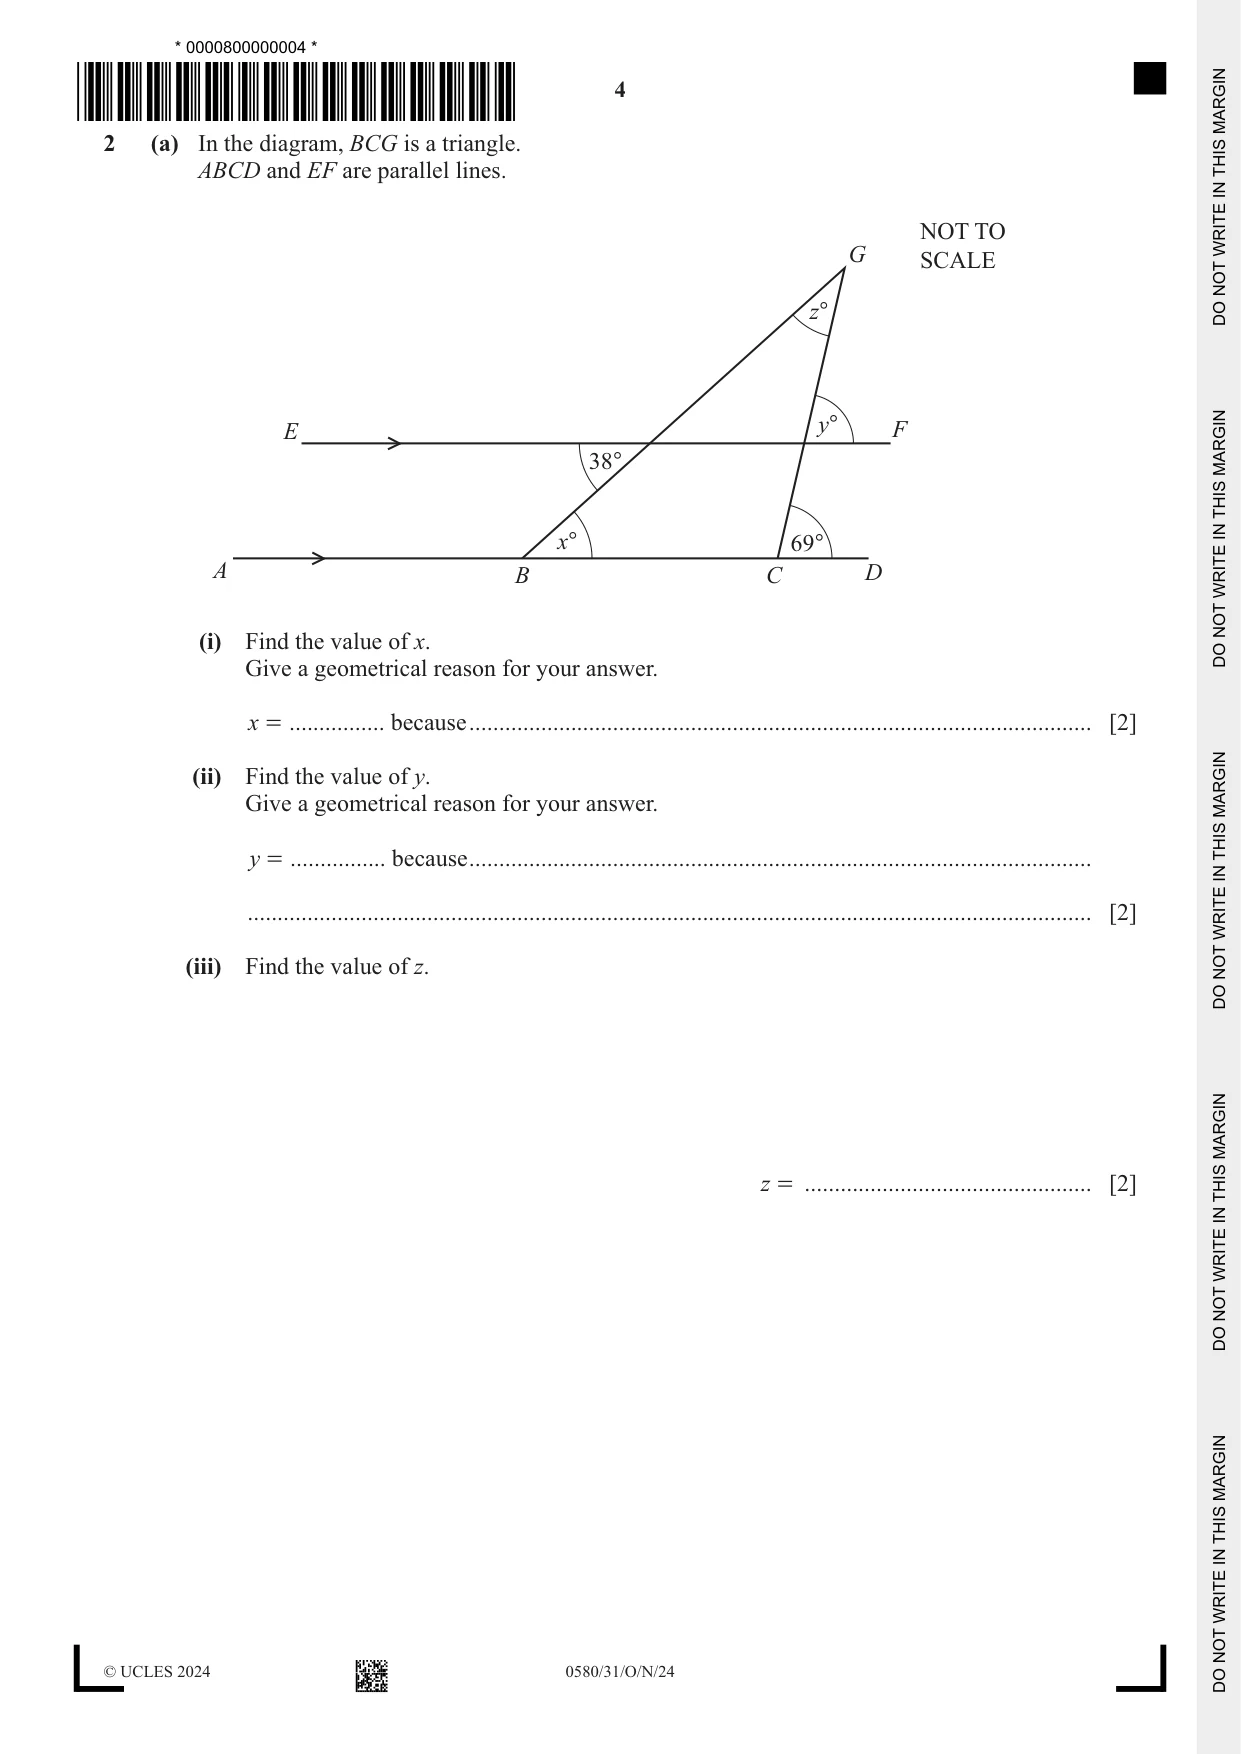
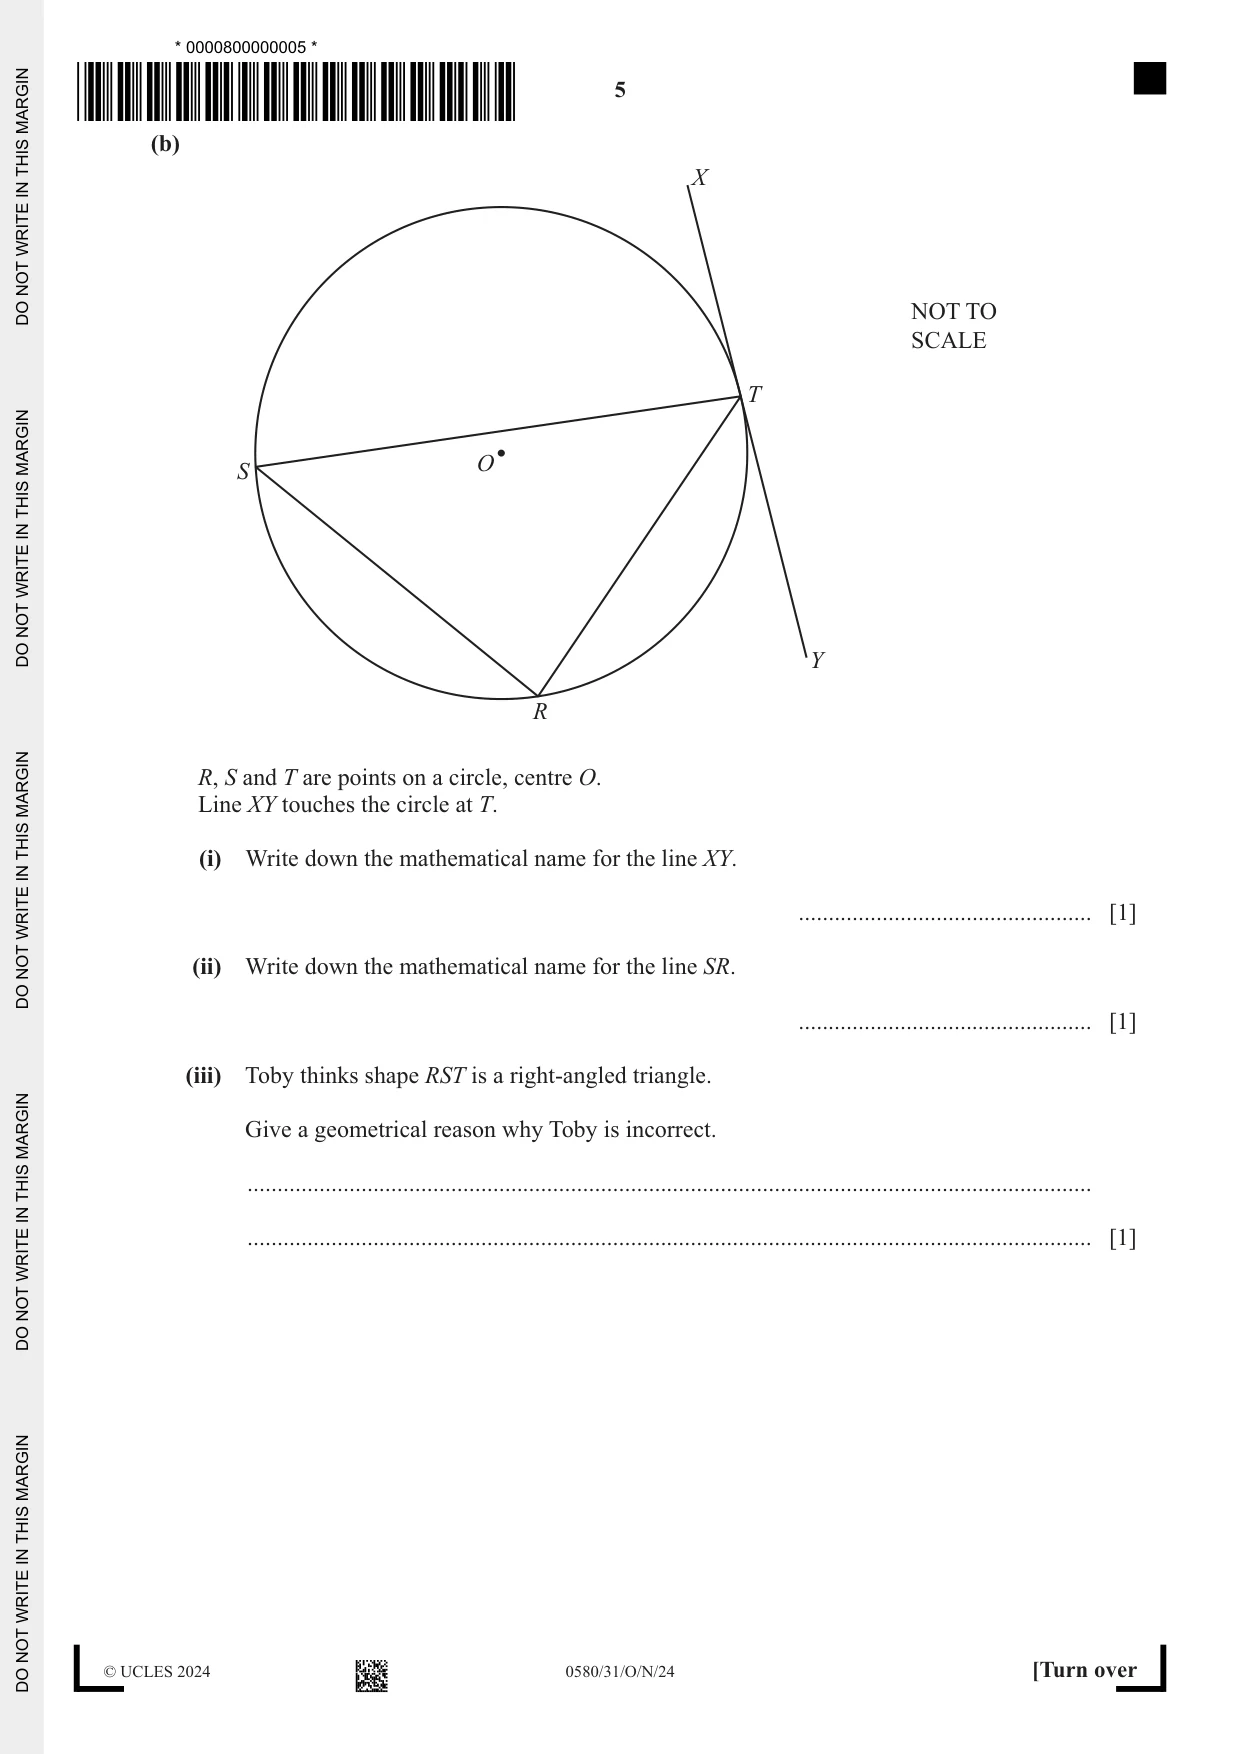
2 (a) In the diagram, BCG is a triangle. ABCD and EF are parallel lines. NOT TO G SCALE z° y° F E 38° x° 69° A B C D (i) Find the value of x. Give a geometrical reason for your answer. x = ................ because ........................................................................................................ [2] (ii) Find the value of y. Give a geometrical reason for your answer. y = ................ because ........................................................................................................ ............................................................................................................................................. [2] (iii) Find the value of z. z = ................................................ [2] (b) X NOT TO SCALE T O S Y R R, S and T are points on a circle, centre O. Line XY touches the circle at T. (i) Write down the mathematical name for the line XY. ................................................. [1] (ii) Write down the mathematical name for the line SR. ................................................. [1] (iii) Toby thinks shape RST is a right-angled triangle. Give a geometrical reason why Toby is incorrect. ............................................................................................................................................. ............................................................................................................................................. [1]
Mark scheme: 2(a)(i) 38 2 B1 for each Alternate [angles] 2(a)(ii) 69 2 B1 for each Corresponding [angles] 2(a)(iii) 31 2 FT for their (a)(ii) – their (a)(i) or their (a)(ii) – 38 or 69 – their (a)(i) B1 for BCG = 111 or M1 for 180 – 69 oe or for 180 – their (a)(ii) oe or for 38 + 111 oe 2(b)(i) Tangent 1 2(b)(ii) Chord 1 2(b)(iii) None of the sides of the triangle is a 1 diameter of the circle oe
Q3 · Jack does a survey about cycling
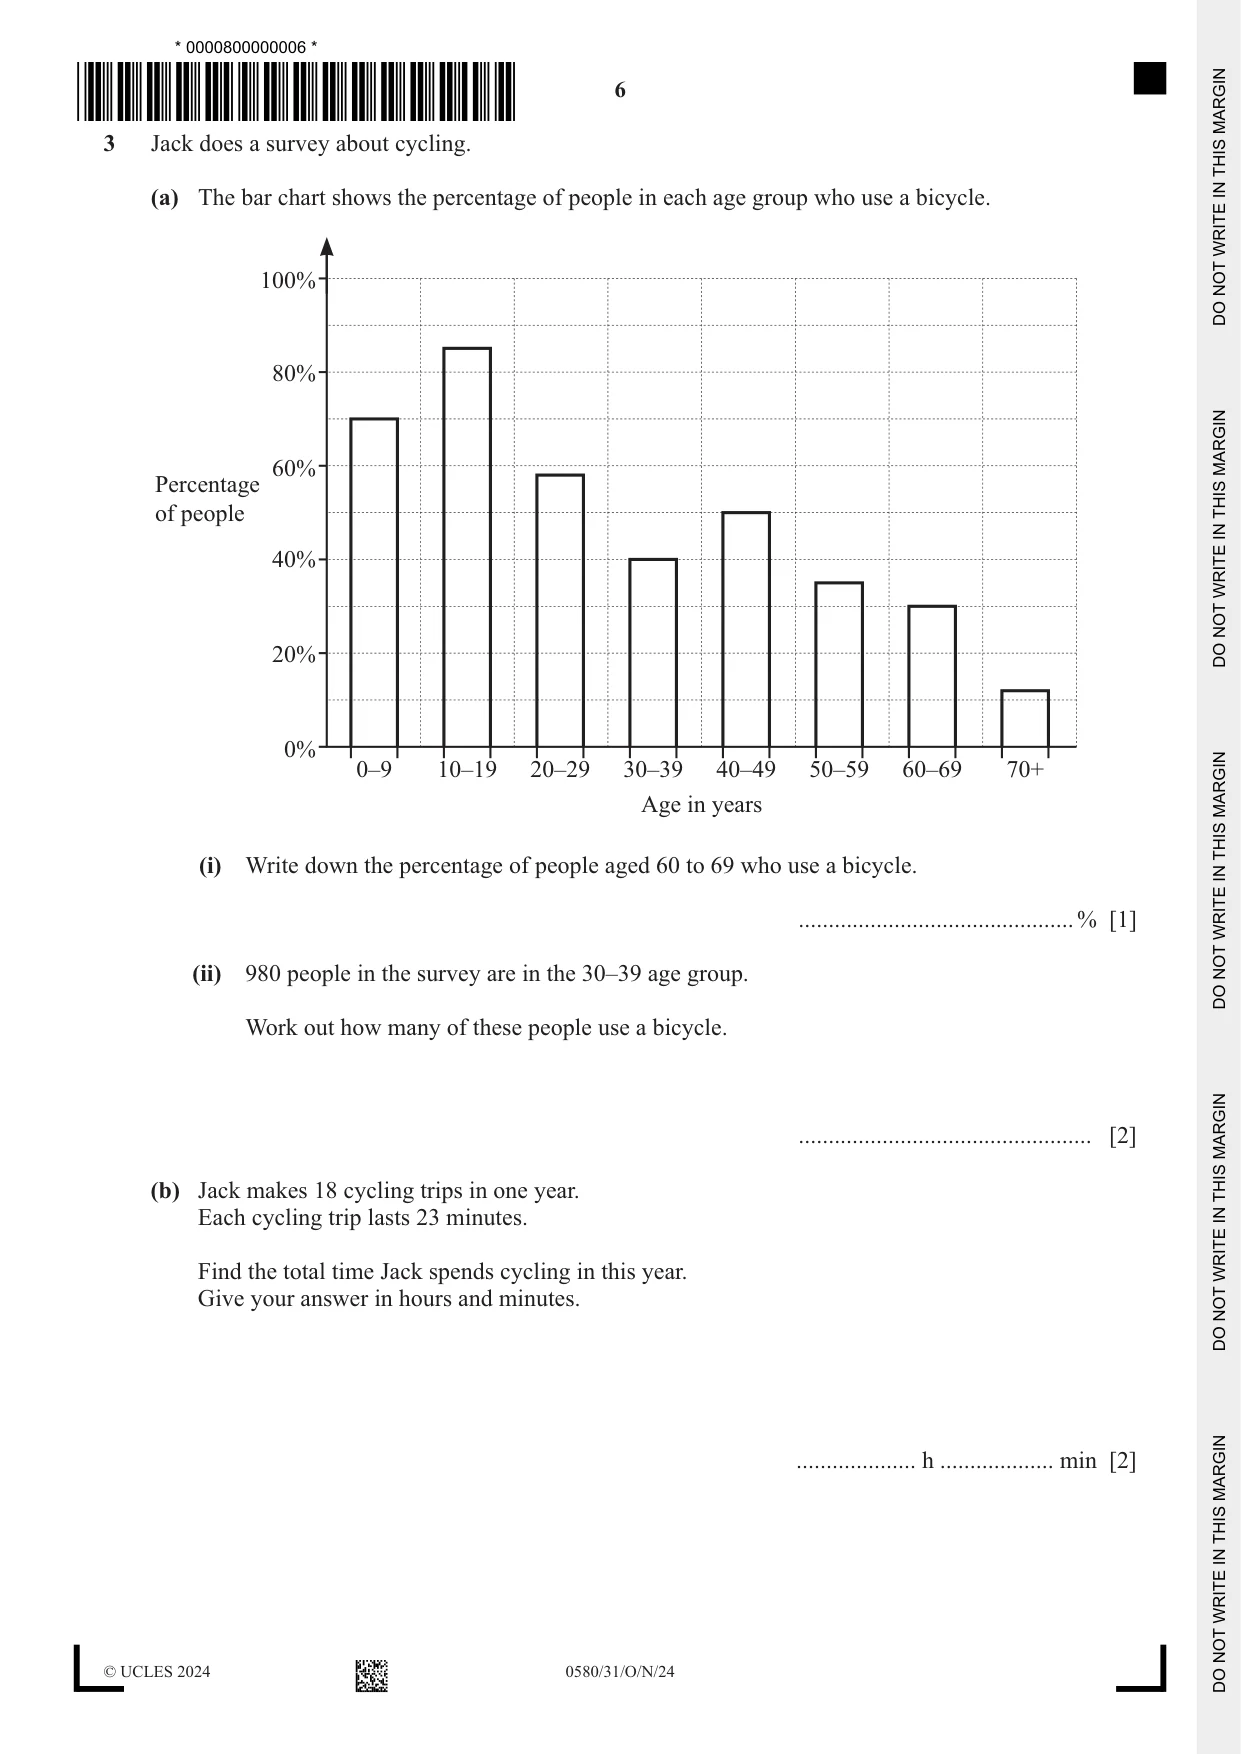
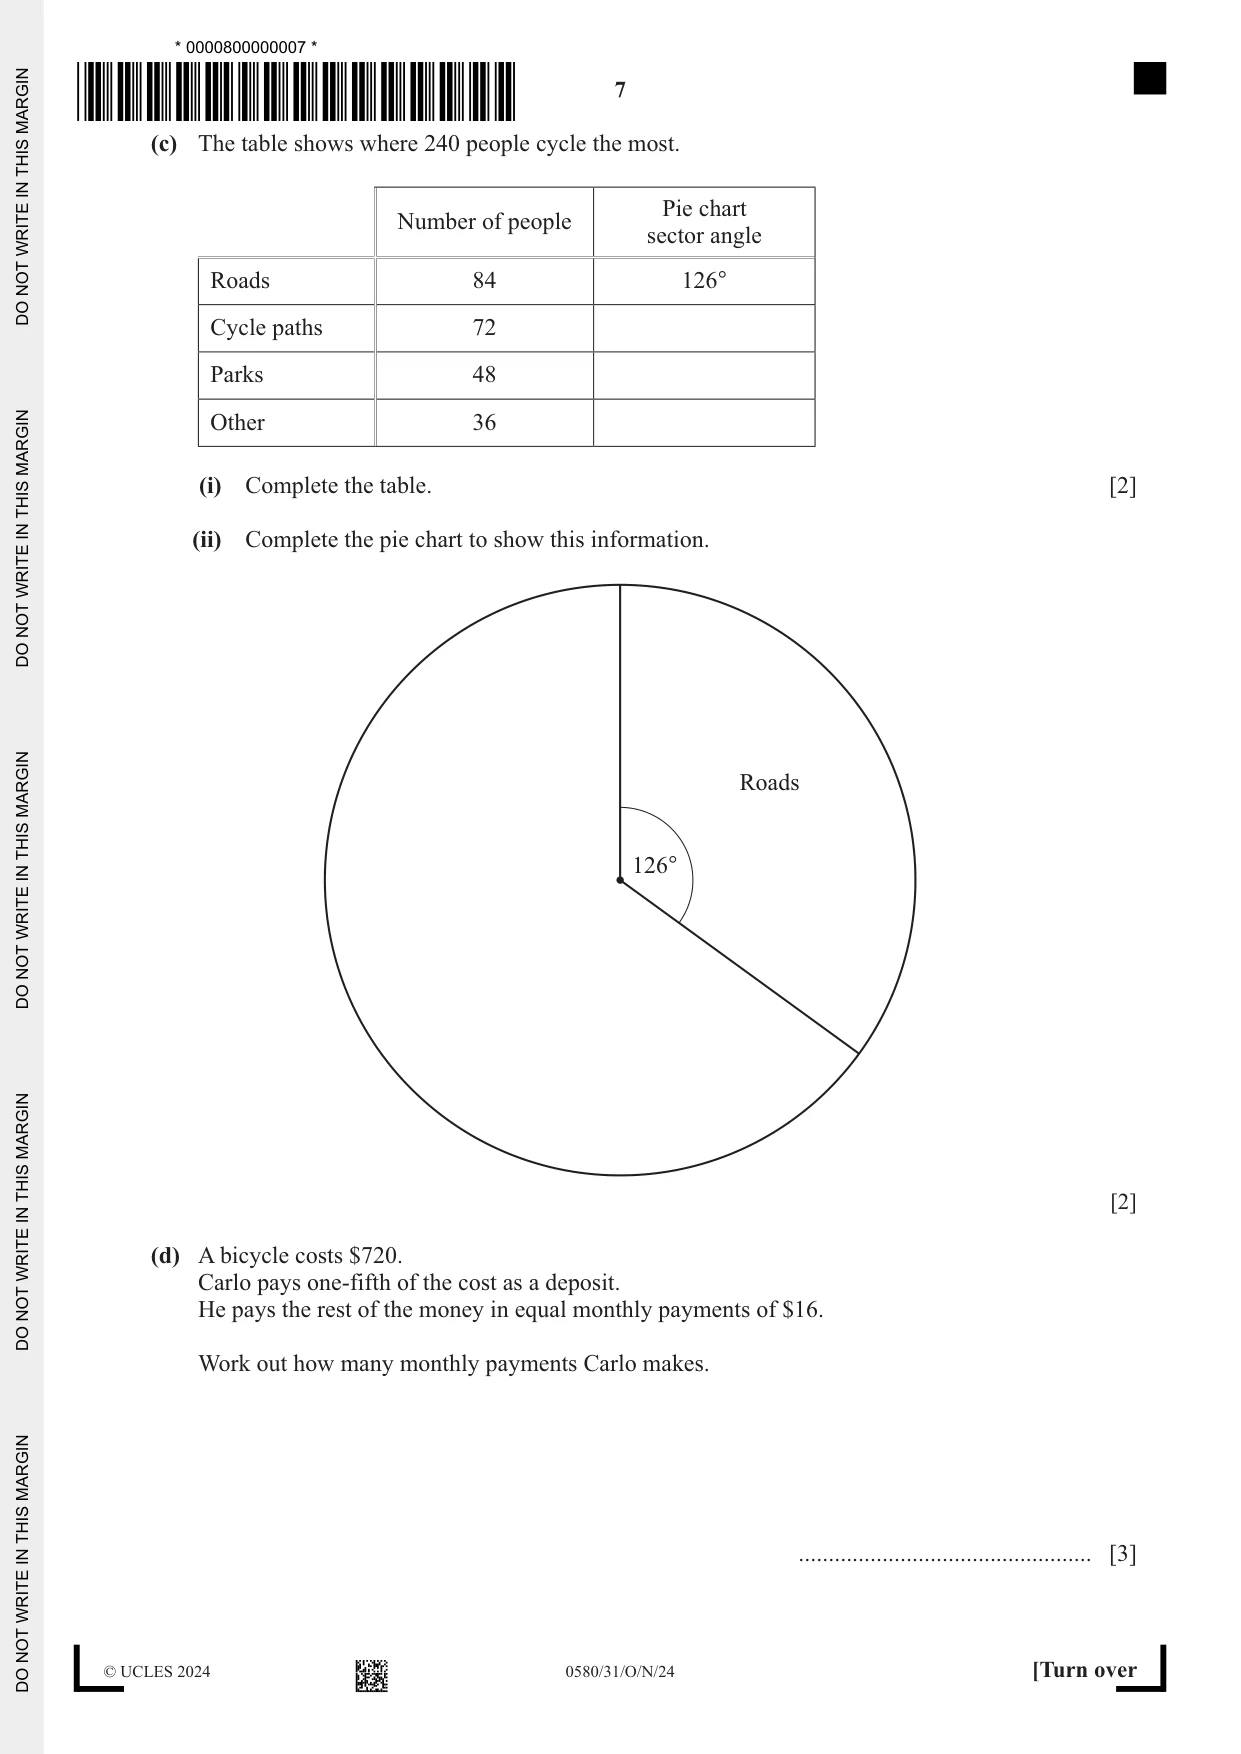
3 Jack does a survey about cycling. (a) The bar chart shows the percentage of people in each age group who use a bicycle. 100% 80% 60% Percentage of people 40% 20% 0% 0–9 10–19 20–29 30–39 40–49 50–59 60–69 70+ Age in years (i) Write down the percentage of people aged 60 to 69 who use a bicycle. ..............................................% [1] (ii) 980 people in the survey are in the 30–39 age group. Work out how many of these people use a bicycle. ................................................. [2] (b) Jack makes 18 cycling trips in one year. Each cycling trip lasts 23 minutes. Find the total time Jack spends cycling in this year. Give your answer in hours and minutes. .................... h ................... min [2] (c) The table shows where 240 people cycle the most. Pie chart Number of people sector angle Roads 84 126° Cycle paths 72 Parks 48 Other 36 (i) Complete the table. [2] (ii) Complete the pie chart to show this information. Roads 126° [2] (d) A bicycle costs $720. Carlo pays one-fifth of the cost as a deposit. He pays the rest of the money in equal monthly payments of $16. Work out how many monthly payments Carlo makes. ................................................. [3]
Mark scheme: 3(a)(i) 30 1 3(a)(ii) 392 2 40 M1 for 980 oe 100 3(b) 6 hours 54 mins 2 M1 for 18 × 23 oe 3(c)(i) 108 2 B1 for 1 correct angle in correct place 72 or M1 for 126[k ] where k = 1, 72, 48 54 84 or 36 or for 360[m ] where m = 1, 72, 48 or 36 240 3(c)(ii) Correct pie chart 2 FT their table if angles add up to 360 B1FT for one sector drawn correctly 3(d) 36 nfww 3 4 M2 for 720 16 oe 5 4 720 or M1 for 720 or oe 5 5 or k ÷ 16 , k ≠ 720
Q4 · A parallelogram ABCD has sides 8 cm and 6 cm
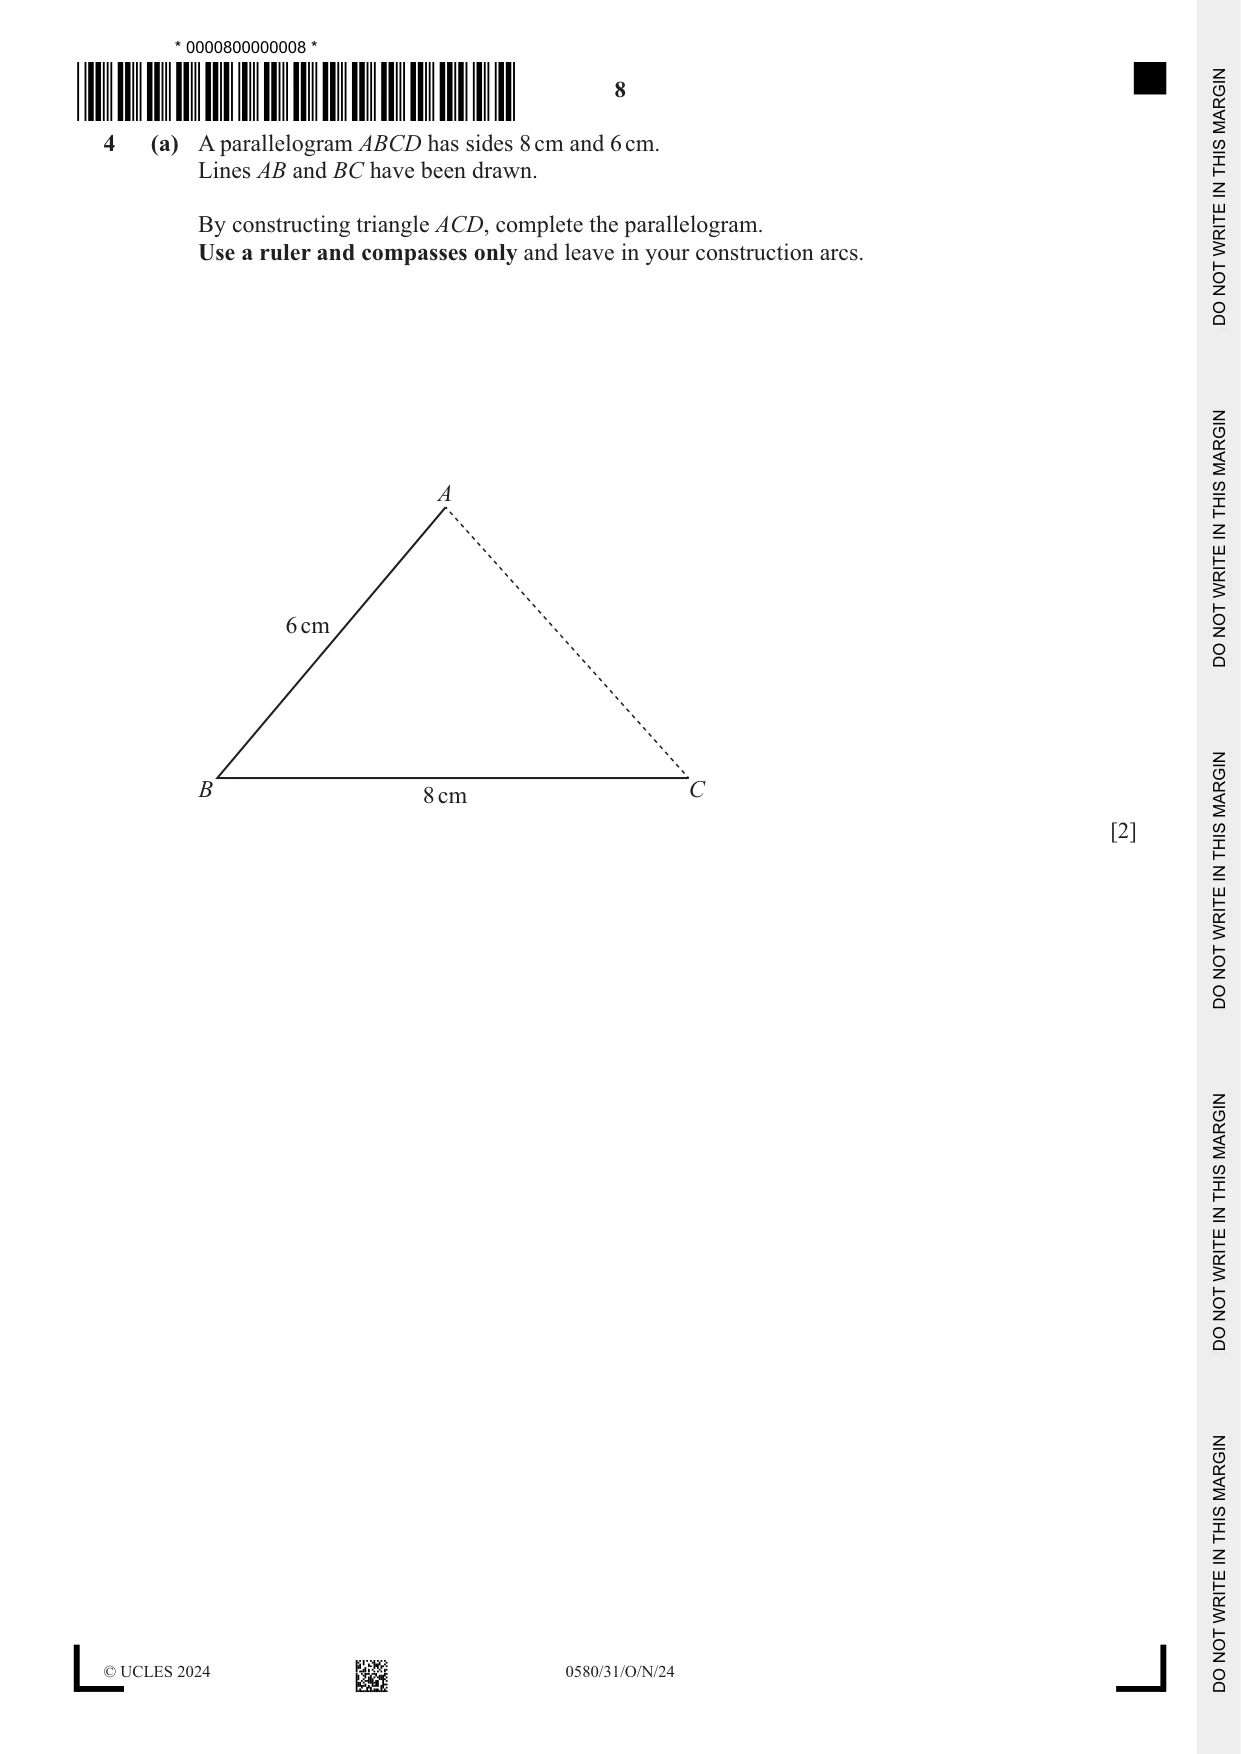
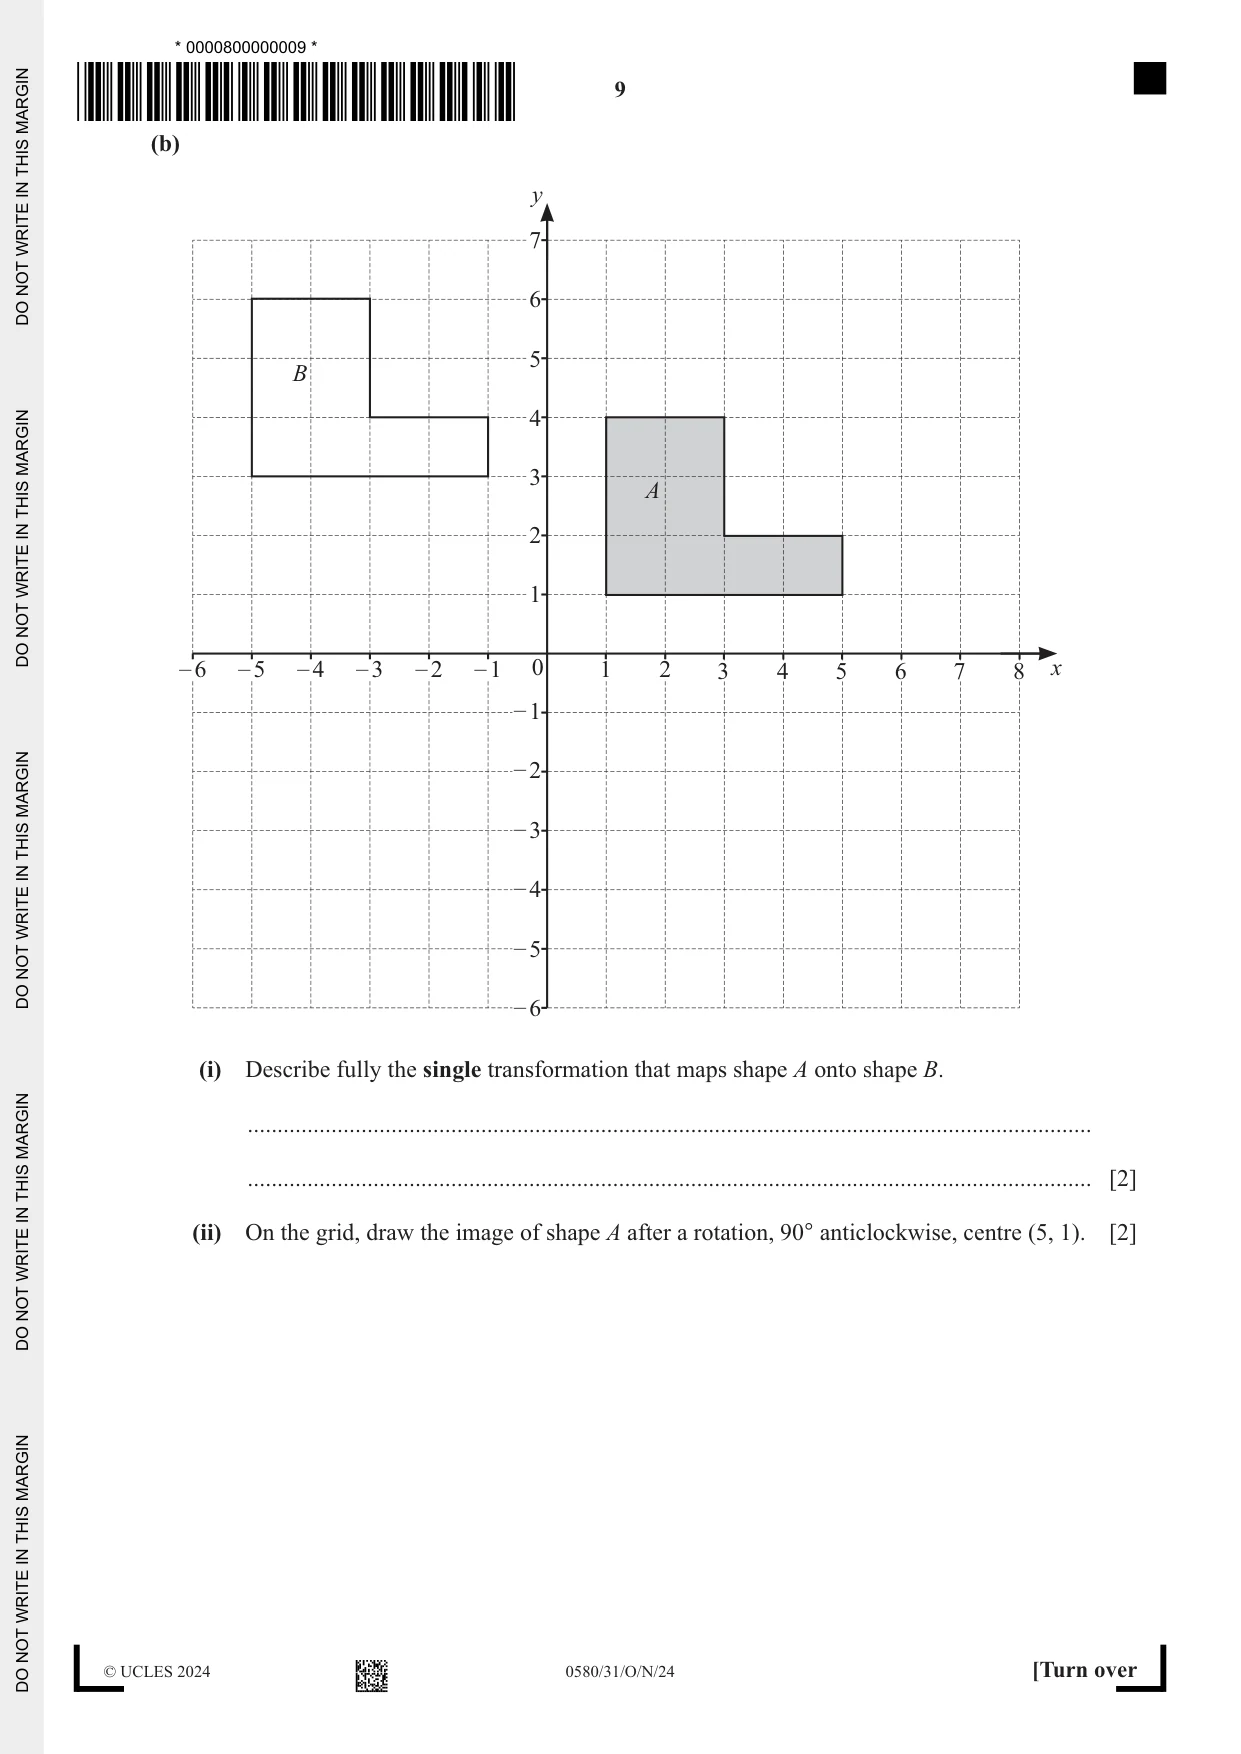
4 (a) A parallelogram ABCD has sides 8 cm and 6 cm. Lines AB and BC have been drawn. By constructing triangle ACD, complete the parallelogram. Use a ruler and compasses only and leave in your construction arcs. A 6 cm B 8 cm C [2] (b) y 7 6 5 B 4 3 A 2 1 – 6 – 5 – 4 – 3 – 2 – 1 0 1 2 3 4 5 6 7 8 x – 1 – 2 – 3 – 4 – 5 – 6 (i) Describe fully the single transformation that maps shape A onto shape B. ............................................................................................................................................. ............................................................................................................................................. [2] (ii) On the grid, draw the image of shape A after a rotation, 90° anticlockwise, centre (5, 1). [2]
Mark scheme: 4(a) Correct parallelogram 2 B1 for triangle constructed onto given pair of lines with one correct and one incorrect arc or correct triangle with no arcs or for no triangle but two correct arcs only. If 0 scored SC1 for triangle constructed onto given pair of lines with arcs but lines interchanged 4(b)(i) Translation 2 B1 for each −6 2 4(b)(ii) Correct shape with coordinates 2 B1 for correct 90 clockwise rotation (5, 1) (5, –3) (2, –3) (2, –1) (4, –1) (4, 1) about (5, 1) or correct orientation, wrong centre
Q5 · The scatter diagram shows the distance travelled and the cost for each of 12 taxi journeys
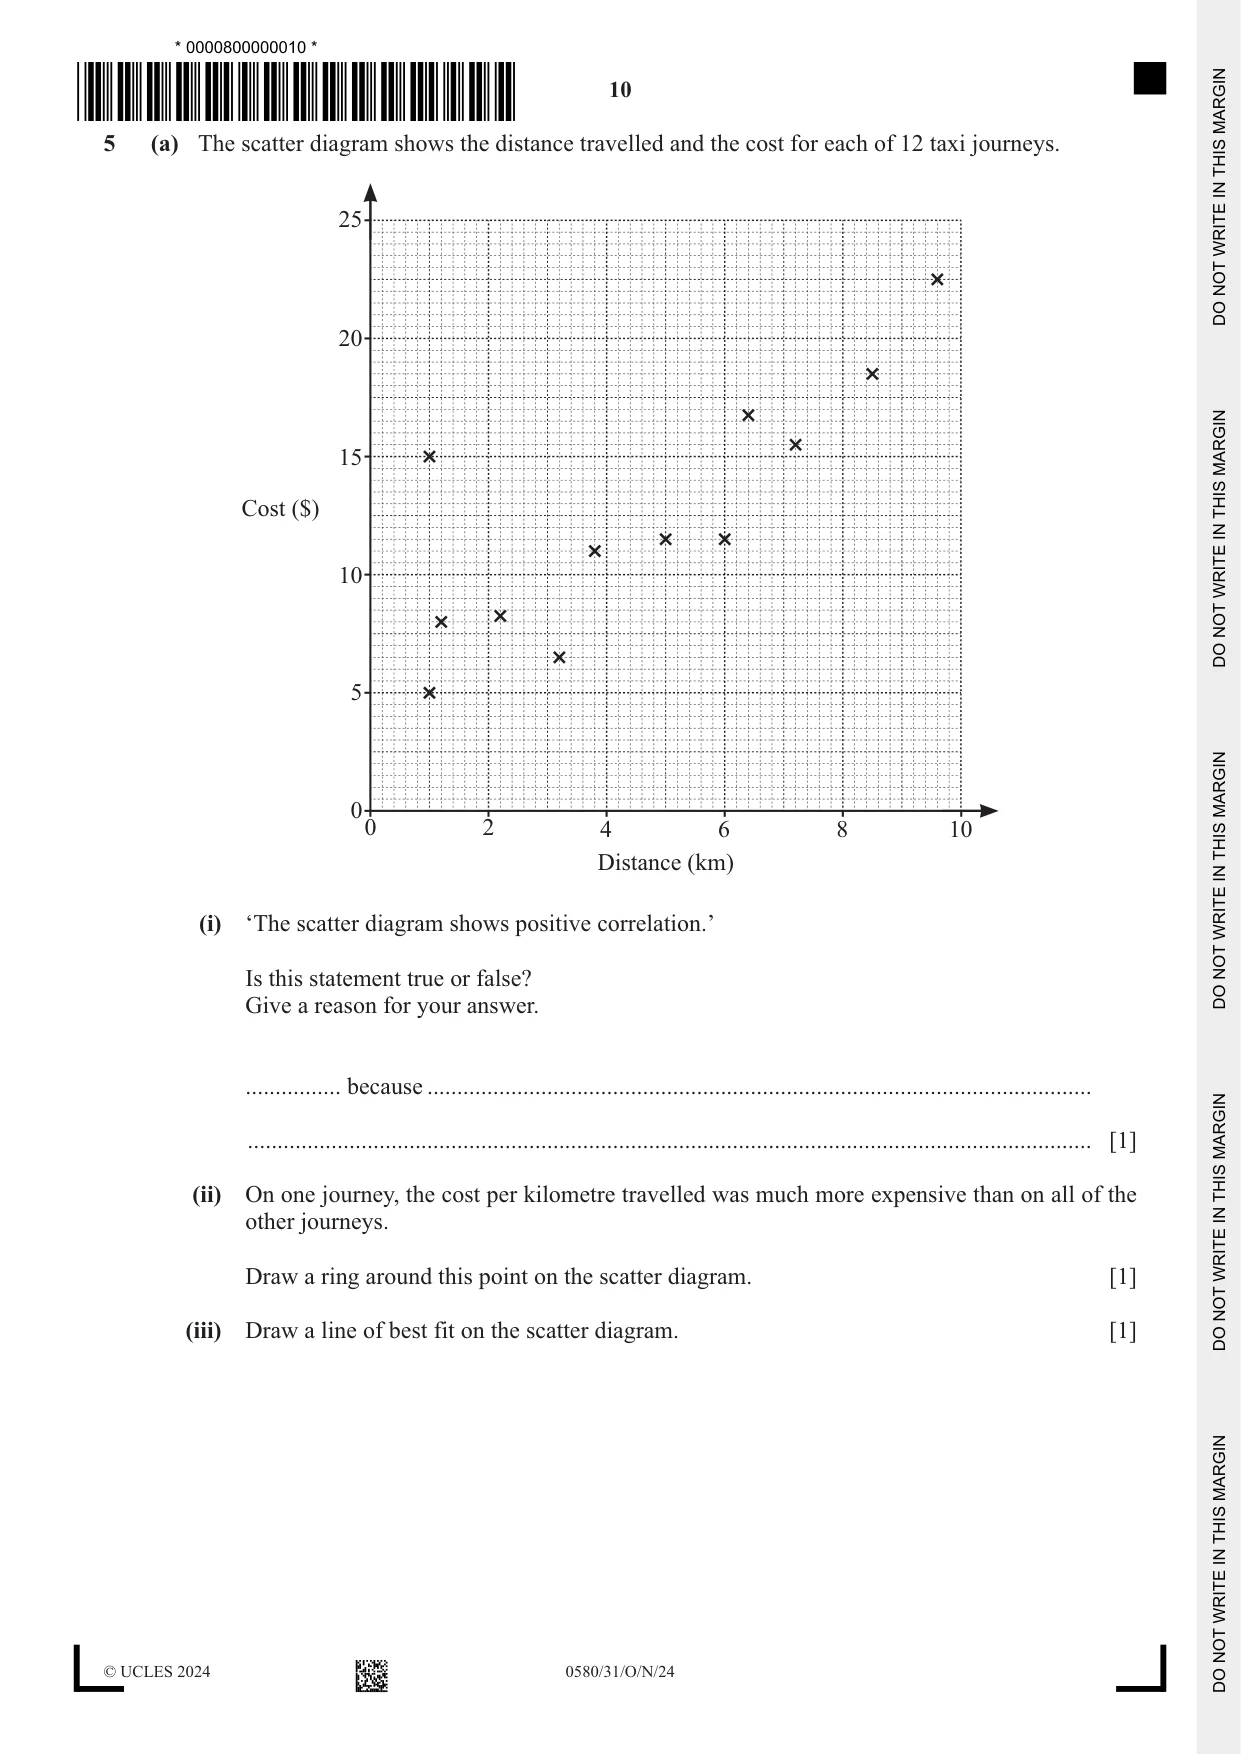
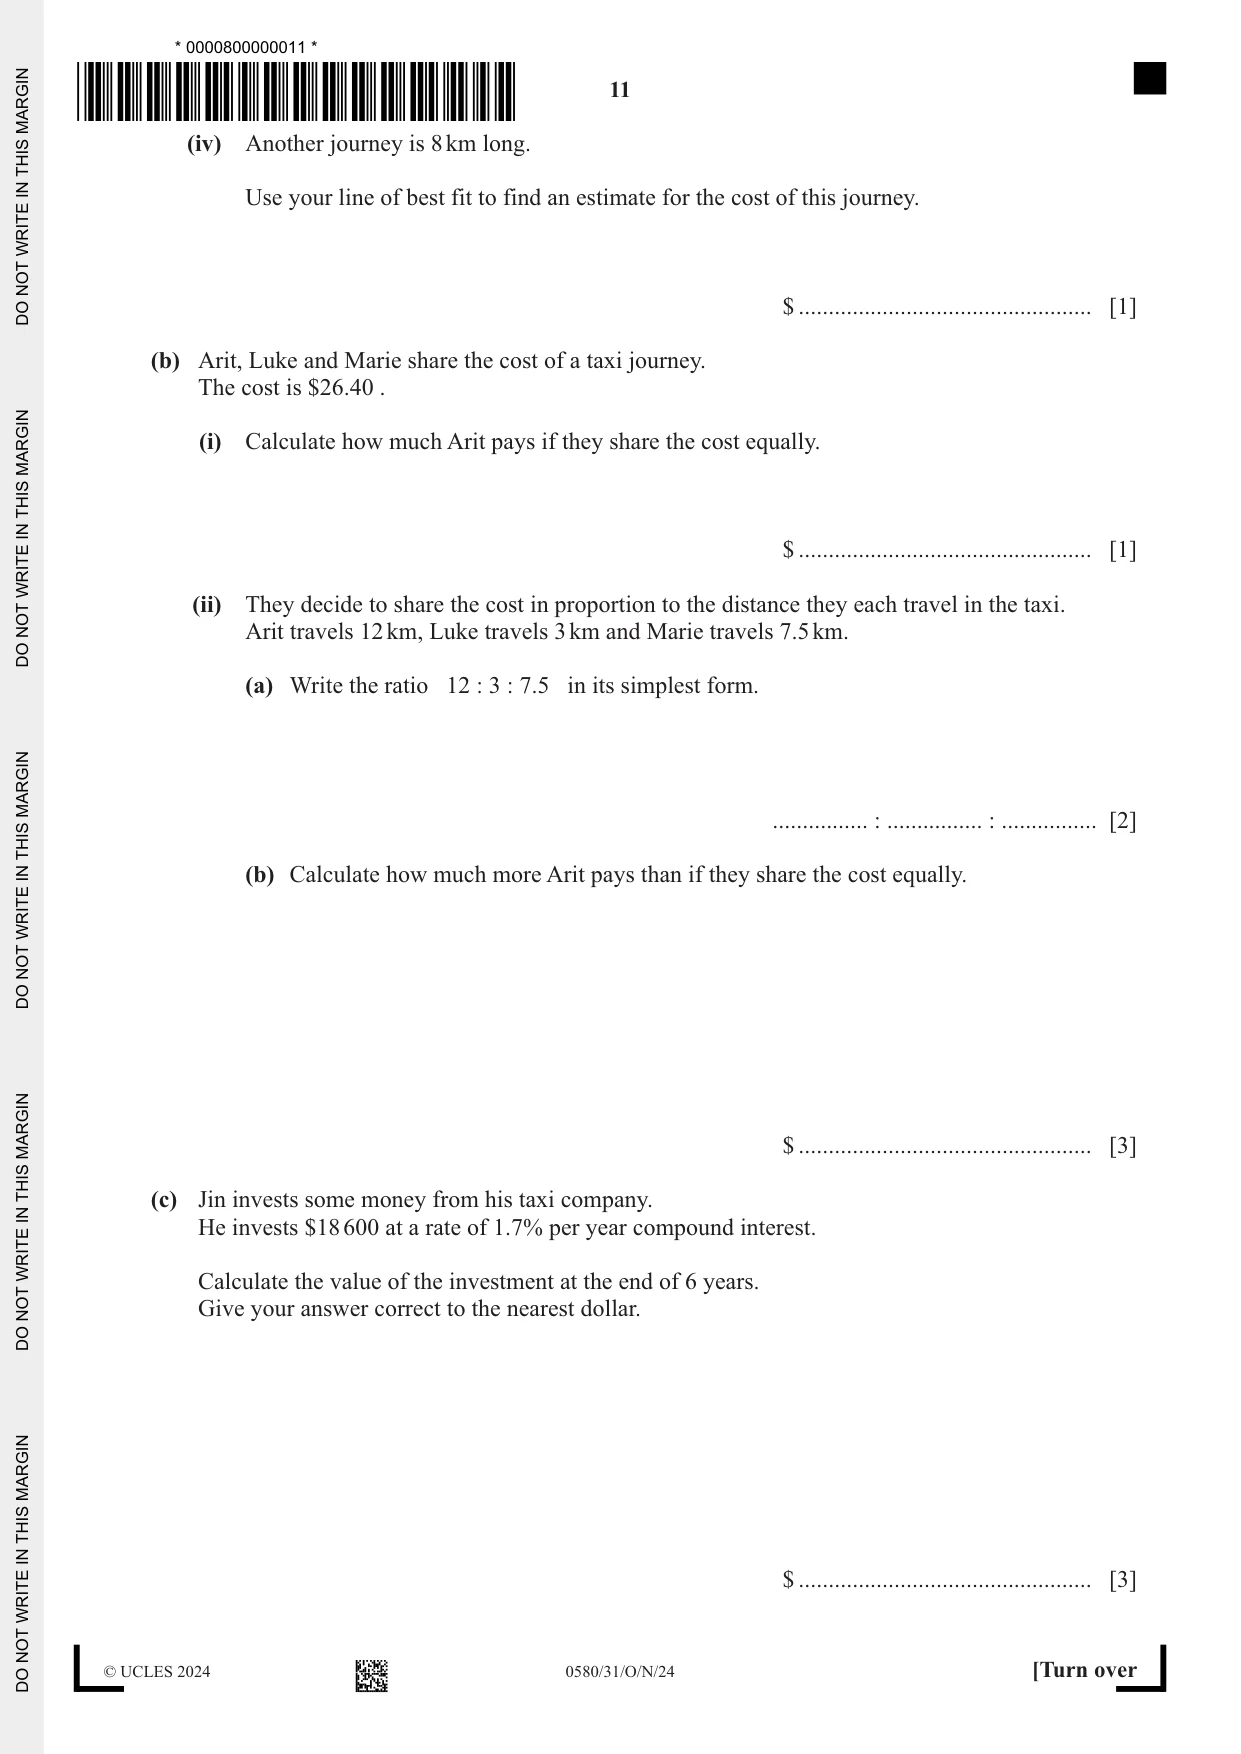
5 (a) The scatter diagram shows the distance travelled and the cost for each of 12 taxi journeys. 25 20 15 Cost ($) 10 5 0 0 2 4 6 8 10 Distance (km) (i) ‘The scatter diagram shows positive correlation.’ Is this statement true or false? Give a reason for your answer. ................ because ............................................................................................................... ............................................................................................................................................. [1] (ii) On one journey, the cost per kilometre travelled was much more expensive than on all of the other journeys. Draw a ring around this point on the scatter diagram. [1] (iii) Draw a line of best fit on the scatter diagram. [1] (iv) Another journey is 8 km long. Use your line of best fit to find an estimate for the cost of this journey. $ ................................................. [1] (b) Arit, Luke and Marie share the cost of a taxi journey. The cost is $26.40 . (i) Calculate how much Arit pays if they share the cost equally. $ ................................................. [1] (ii) They decide to share the cost in proportion to the distance they each travel in the taxi. Arit travels 12 km, Luke travels 3 km and Marie travels 7.5 km. (a) Write the ratio 12 : 3 : 7.5 in its simplest form. ................ : ................ : ................ [2] (b) Calculate how much more Arit pays than if they share the cost equally. $ ................................................. [3] (c) Jin invests some money from his taxi company. He invests $18 600 at a rate of 1.7% per year compound interest. Calculate the value of the investment at the end of 6 years. Give your answer correct to the nearest dollar. $ ................................................. [3]
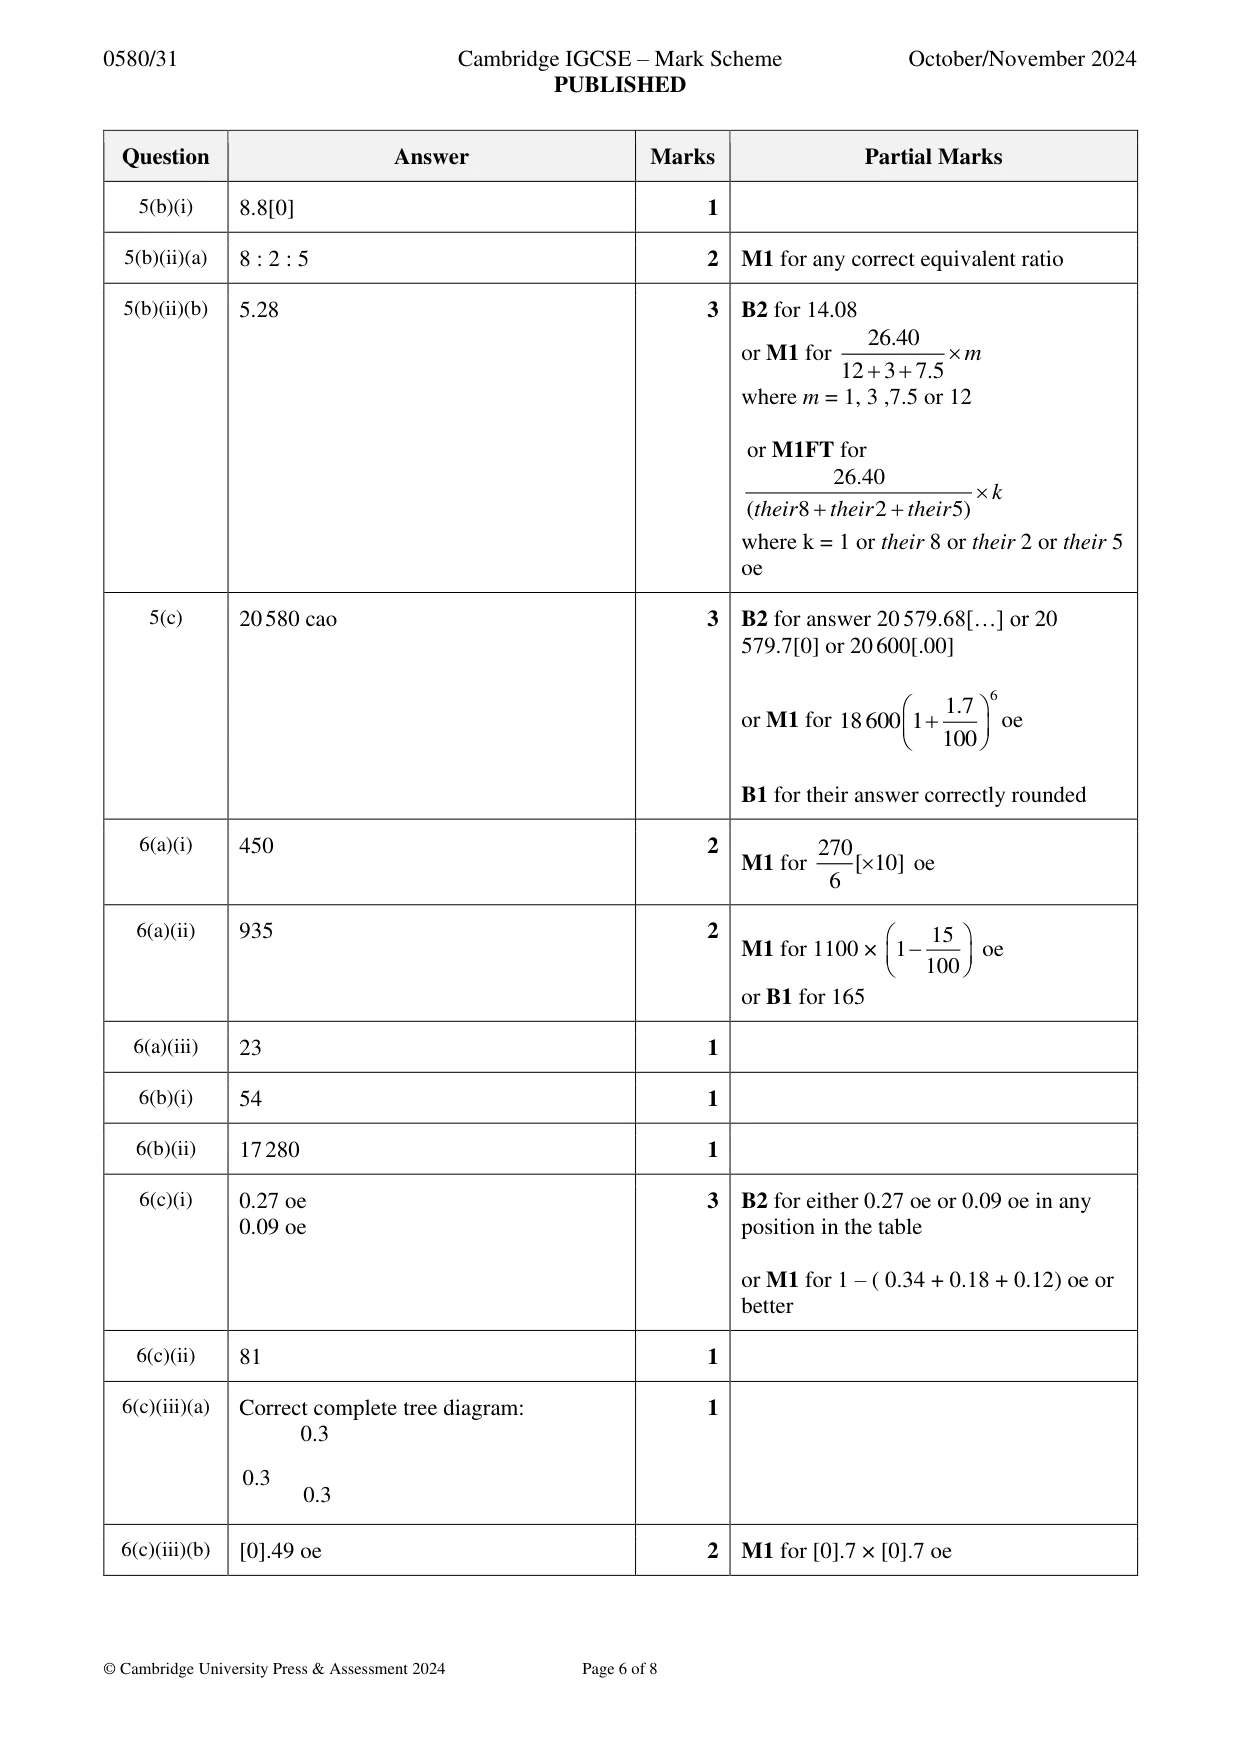
Mark scheme: 5(a)(i) True and correct description of 1 correlation e.g. as the distance increases the cost increases 5(a)(ii) (1, 15) circled 1 5(a)(iii) Acceptable ruled line of best fit drawn 1 5(a)(iv) 16 to 19 1 If 0 scored, FT their straight line of best fit with positive gradient 5(b)(i) 8.8[0] 1 5(b)(ii)(a) 8 : 2 : 5 2 M1 for any correct equivalent ratio 5(b)(ii)(b) 5.28 3 B2 for 14.08 26.40 or M1 for m 12 + 3 + 7.5 where m = 1, 3 ,7.5 or 12 or M1FT for 26.40 k (their 8 + their 2 + their 5) where k = 1 or their 8 or their 2 or their 5 oe 5(c) 20 580 cao 3 B2 for answer 20 579.68[…] or 20 579.7[0] or 20 600[.00] 1.7 6 or M1 for 18600 1 + oe 100 B1 for their answer correctly rounded
Q6 · This is a recipe to make ice cream for 6 people
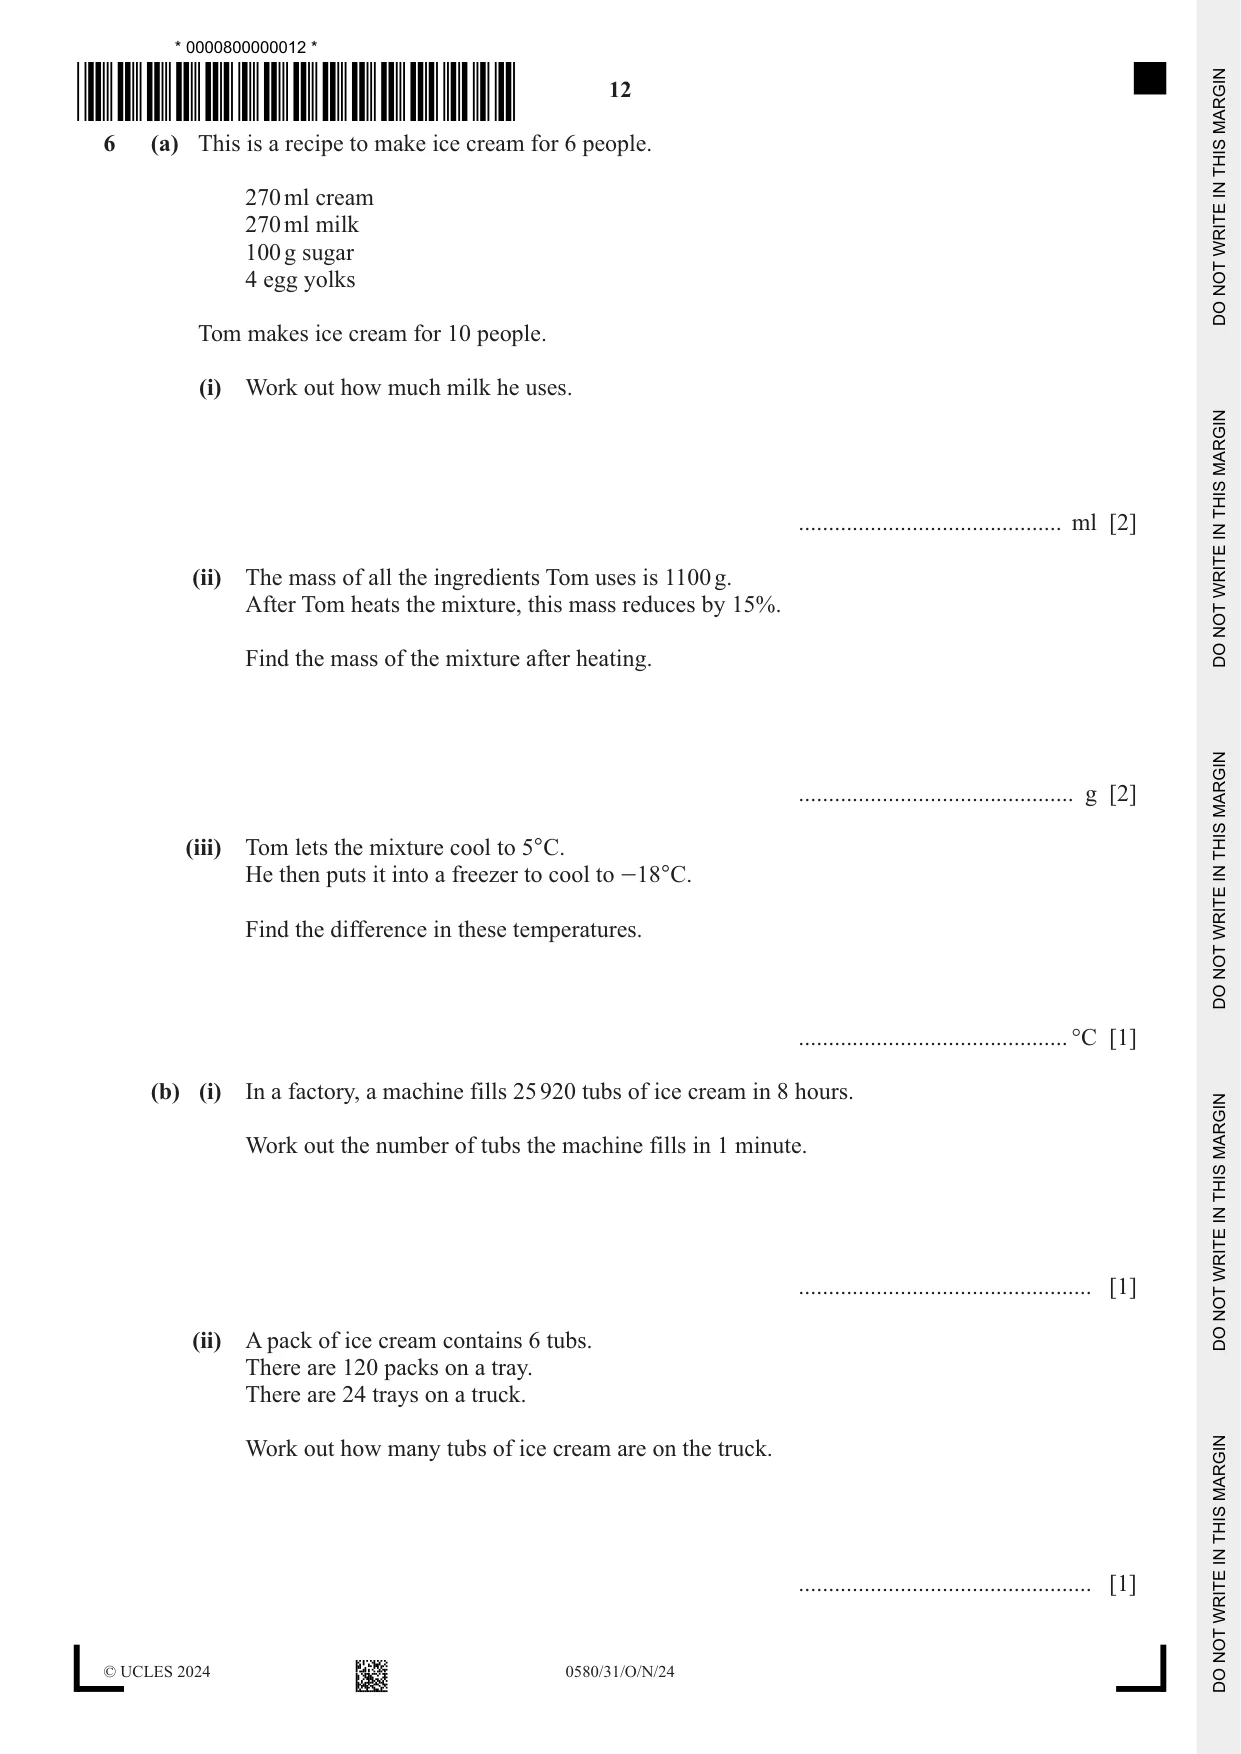
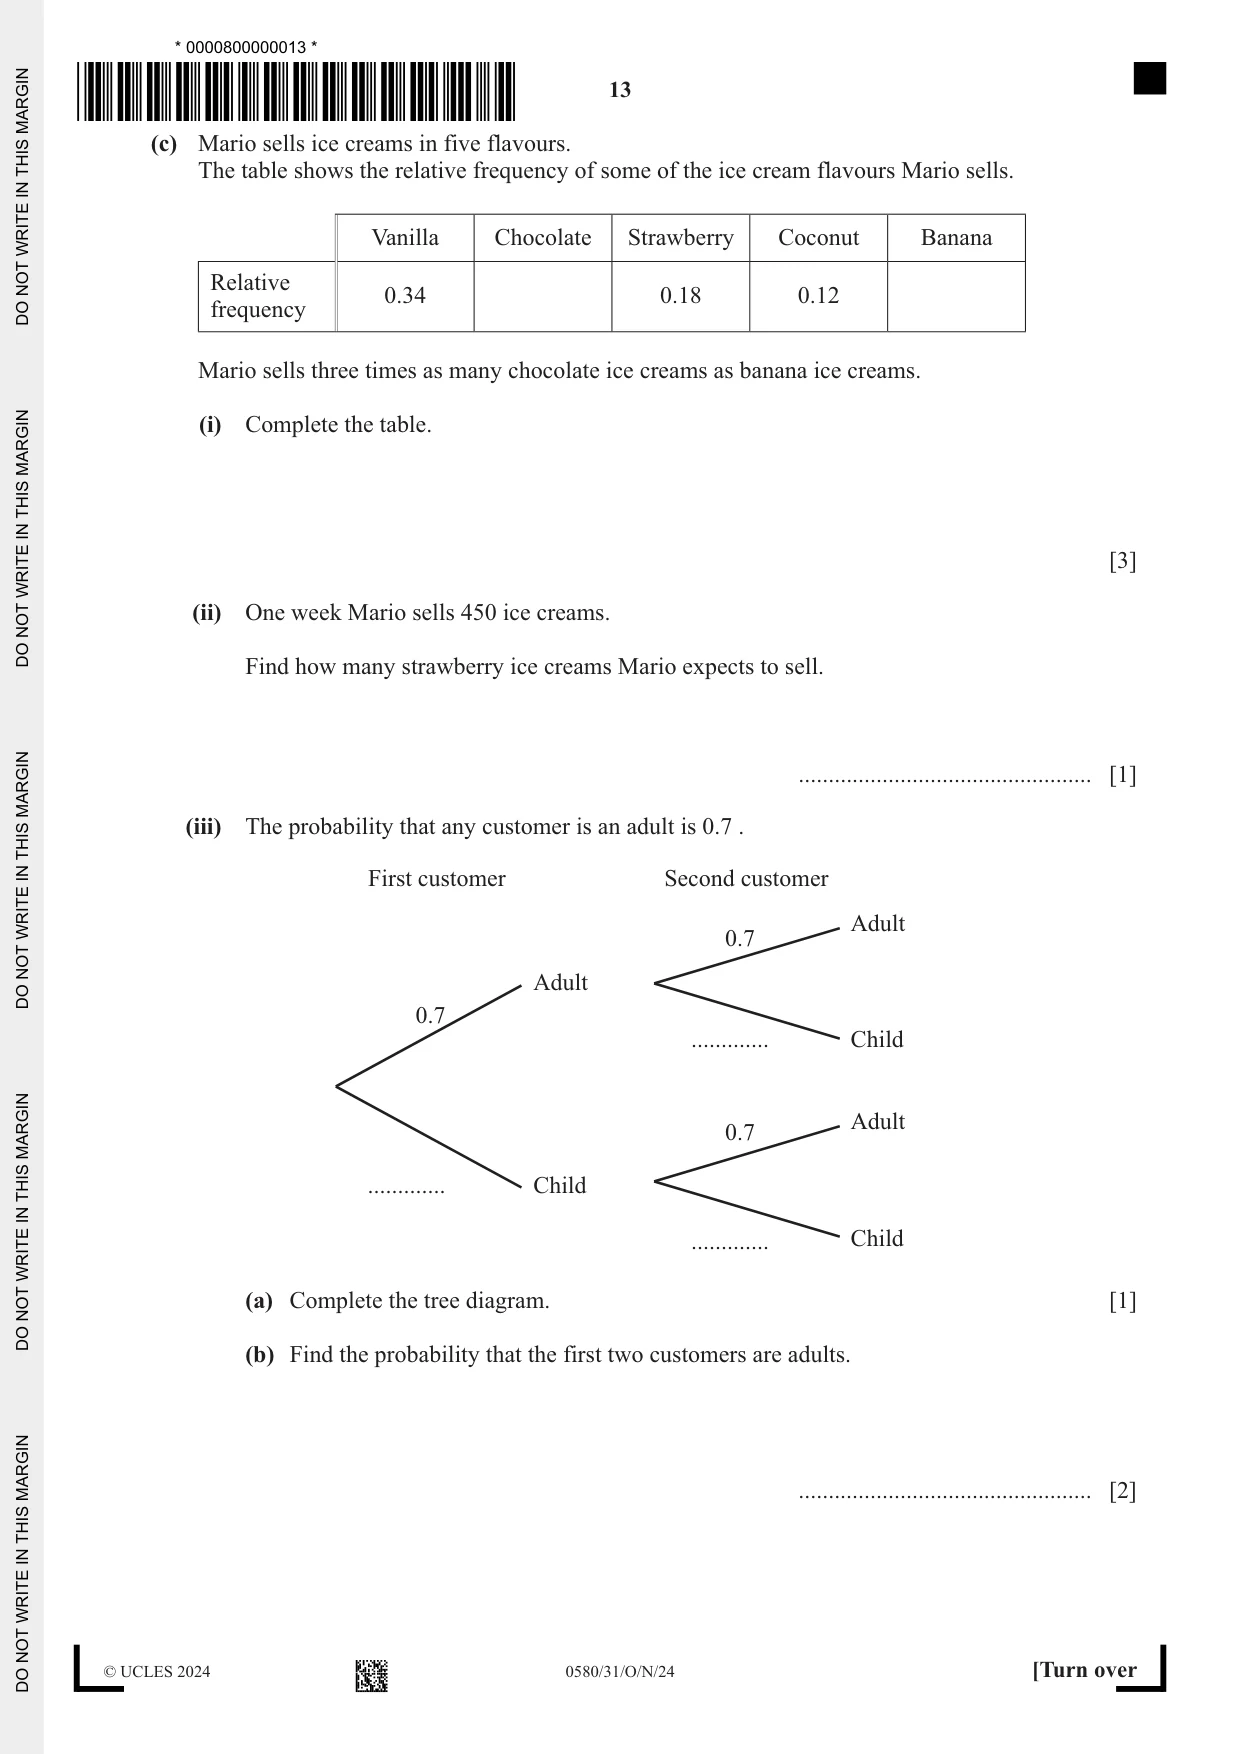
6 (a) This is a recipe to make ice cream for 6 people. 270 ml cream 270 ml milk 100 g sugar 4 egg yolks Tom makes ice cream for 10 people. (i) Work out how much milk he uses. ............................................ ml [2] (ii) The mass of all the ingredients Tom uses is 1100 g. After Tom heats the mixture, this mass reduces by 15%. Find the mass of the mixture after heating. .............................................. g [2] (iii) Tom lets the mixture cool to 5°C. He then puts it into a freezer to cool to -18°C. Find the difference in these temperatures. ............................................. °C [1] (b) (i) In a factory, a machine fills 25 920 tubs of ice cream in 8 hours. Work out the number of tubs the machine fills in 1 minute. ................................................. [1] (ii) A pack of ice cream contains 6 tubs. There are 120 packs on a tray. There are 24 trays on a truck. Work out how many tubs of ice cream are on the truck. ................................................. [1] (c) Mario sells ice creams in five flavours. The table shows the relative frequency of some of the ice cream flavours Mario sells. Vanilla Chocolate Strawberry Coconut Banana Relative 0.34 0.18 0.12 frequency Mario sells three times as many chocolate ice creams as banana ice creams. (i) Complete the table. [3] (ii) One week Mario sells 450 ice creams. Find how many strawberry ice creams Mario expects to sell. ................................................. [1] (iii) The probability that any customer is an adult is 0.7 . First customer Second customer Adult 0.7 Adult 0.7 ............. Child Adult 0.7 ............. Child ............. Child (a) Complete the tree diagram. [1] (b) Find the probability that the first two customers are adults. ................................................. [2]
Mark scheme: 6(a)(i) 450 2 M1 for 270[10] oe 6 6(a)(ii) 935 2 15 M1 for 1100 × 1 − oe 100 or B1 for 165 6(a)(iii) 23 1 6(b)(i) 54 1 6(b)(ii) 17 280 1 6(c)(i) 0.27 oe 3 B2 for either 0.27 oe or 0.09 oe in any 0.09 oe position in the table or M1 for 1 – ( 0.34 + 0.18 + 0.12) oe or better 6(c)(ii) 81 1 6(c)(iii)(a) Correct complete tree diagram: 1 0.3 0.3 0.3 6(c)(iii)(b) [0].49 oe 2 M1 for [0].7 × [0].7 oe
Q7 · NOT TO 10 cm SCALE 4 cm 7 cm Find the perimeter of the triangle
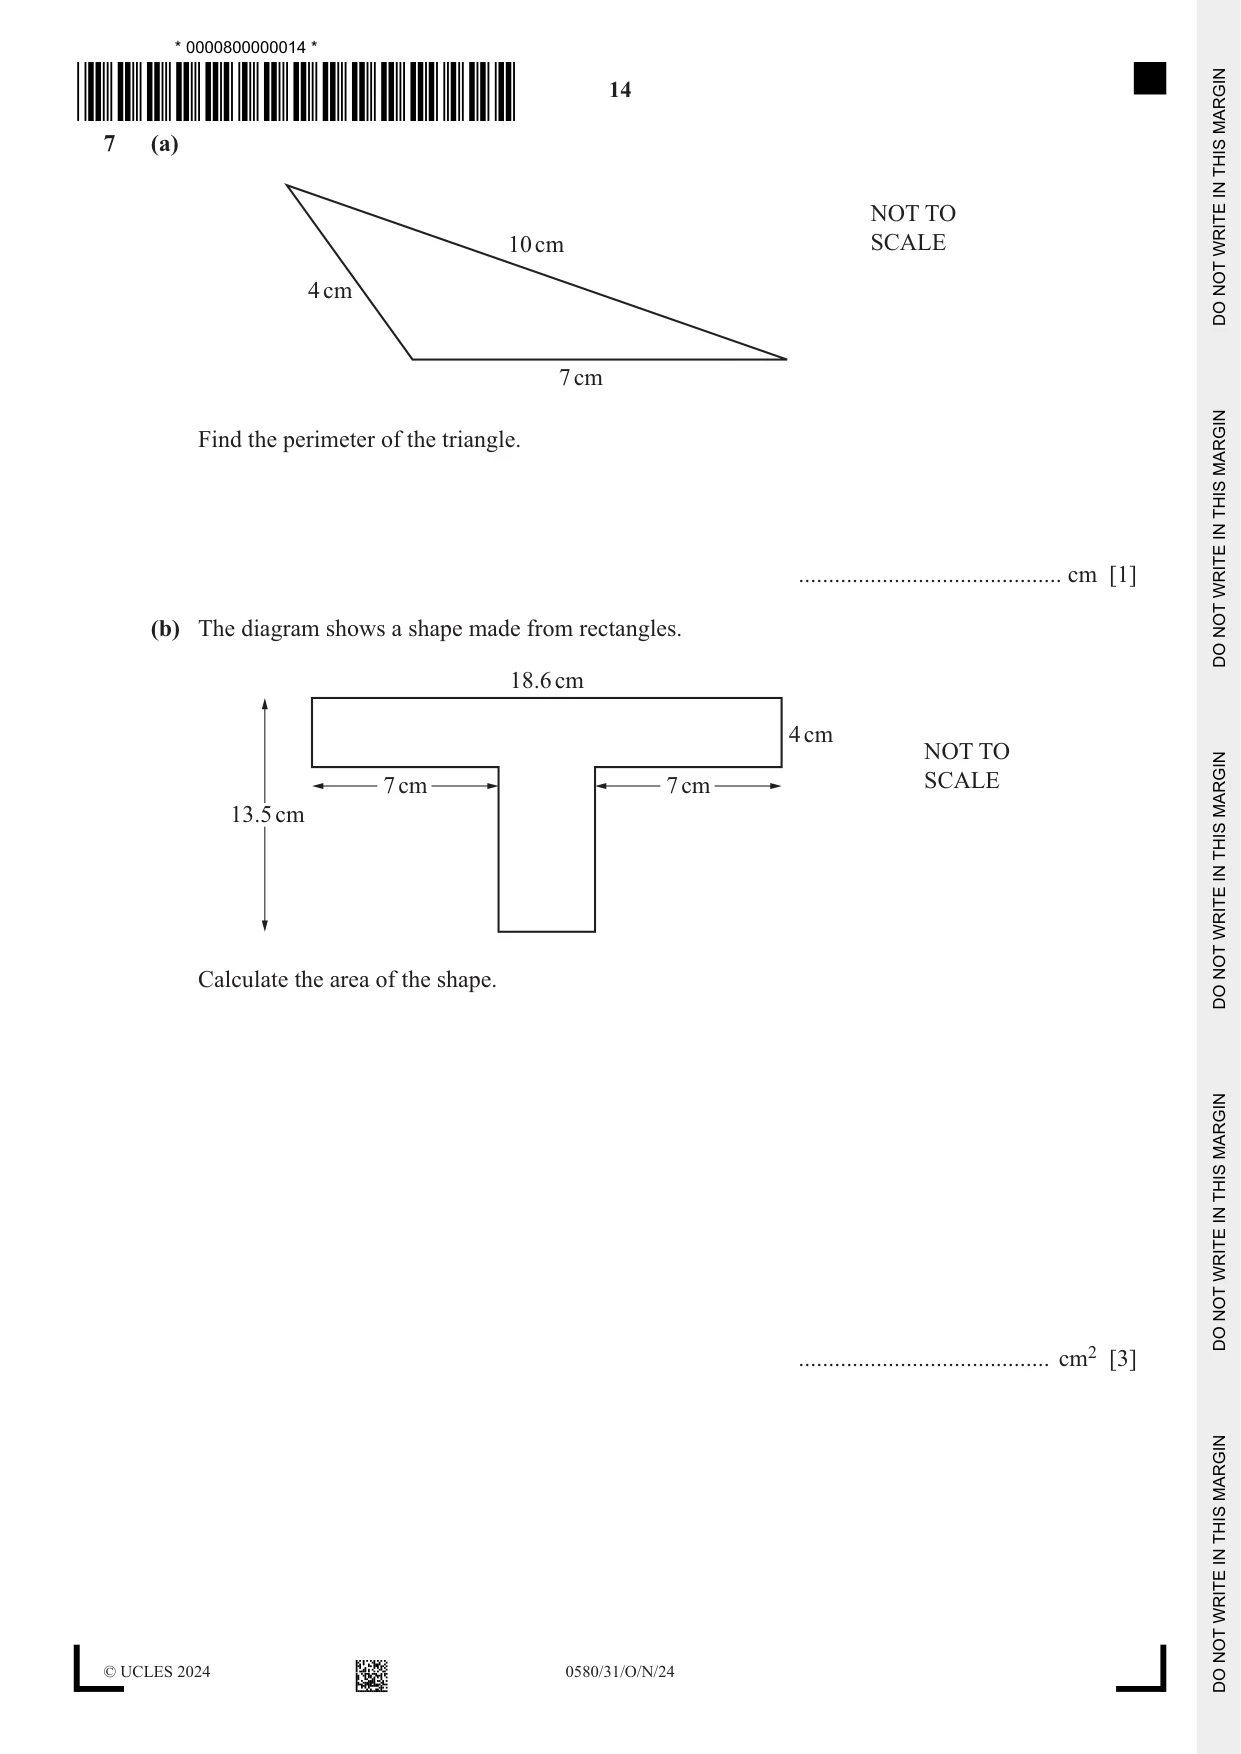
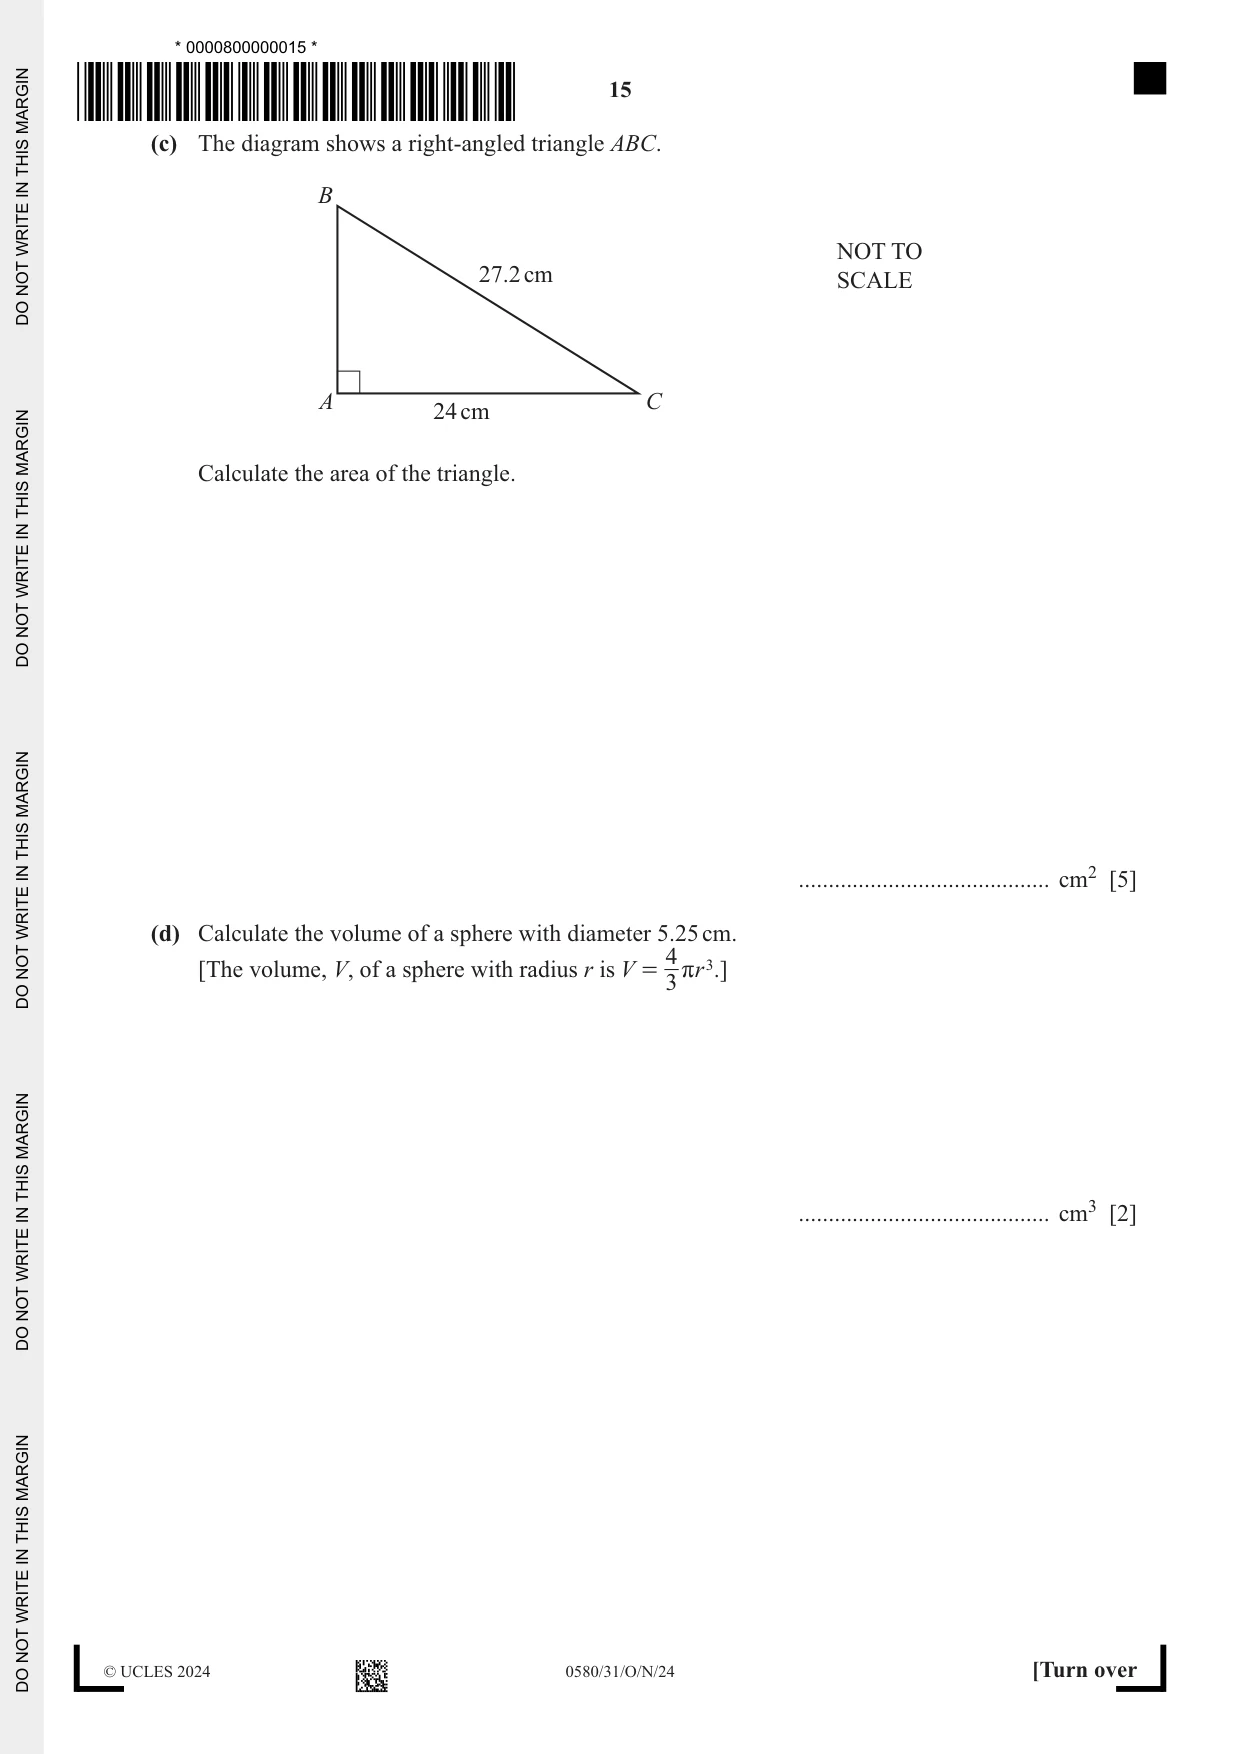
7 (a) NOT TO 10 cm SCALE 4 cm 7 cm Find the perimeter of the triangle. ............................................ cm [1] (b) The diagram shows a shape made from rectangles. 18.6 cm 4 cm NOT TO 7 cm 7 cm SCALE 13.5 cm Calculate the area of the shape. .......................................... cm2 [3] (c) The diagram shows a right-angled triangle ABC. B NOT TO 27.2 cm SCALE A C 24 cm Calculate the area of the triangle. .......................................... cm2 [5] (d) Calculate the volume of a sphere with diameter 5.25 cm. 4 [The volume, V, of a sphere with radius r is V = rr 3.] 3 .......................................... cm3 [2]
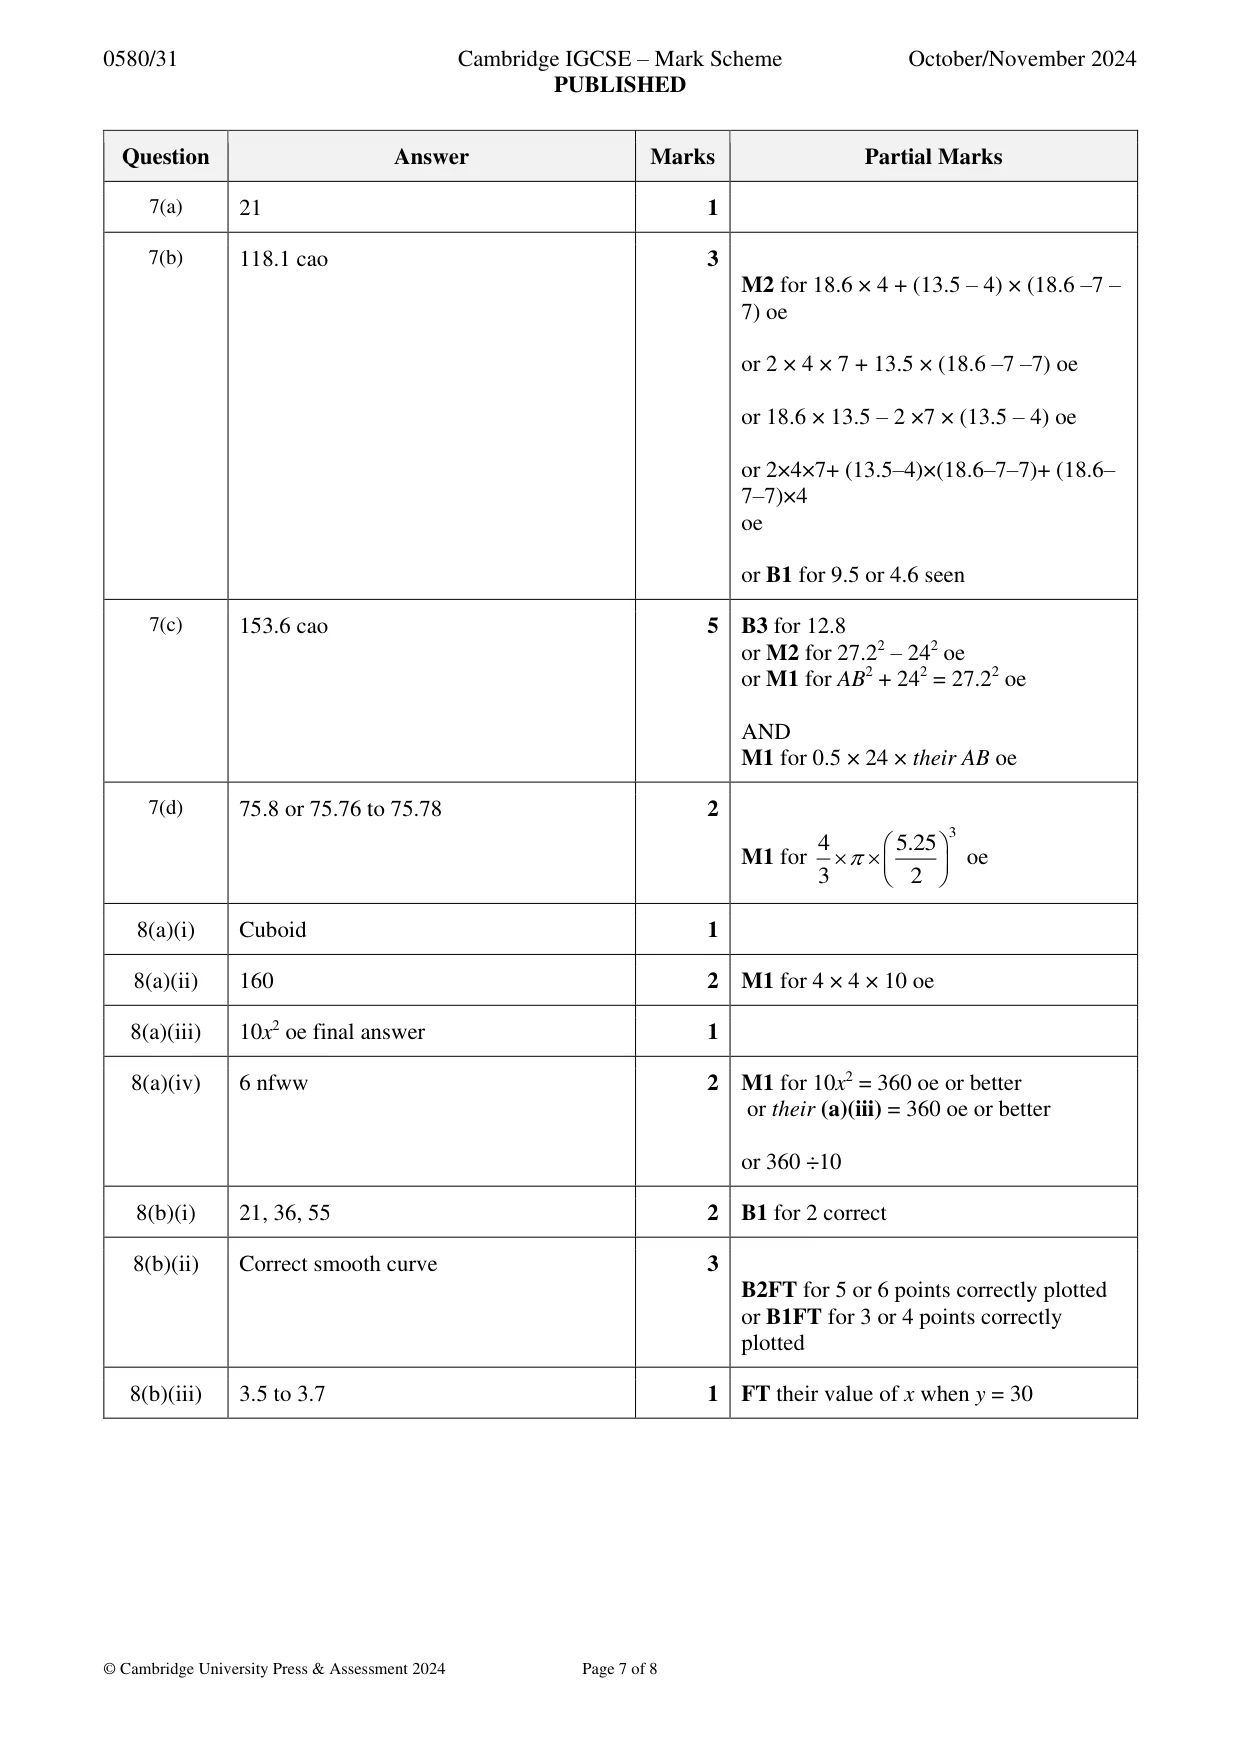
Mark scheme: 7(a) 21 1 7(b) 118.1 cao 3 M2 for 18.6 × 4 + (13.5 – 4) × (18.6 –7 – 7) oe or 2 × 4 × 7 + 13.5 × (18.6 –7 –7) oe or 18.6 × 13.5 – 2 ×7 × (13.5 – 4) oe or 2×4×7+ (13.5–4)×(18.6–7–7)+ (18.6– 7–7)×4 oe or B1 for 9.5 or 4.6 seen 7(c) 153.6 cao 5 B3 for 12.8 or M2 for 27.22 – 242 oe or M1 for AB2 + 242 = 27.22 oe AND M1 for 0.5 × 24 × their AB oe 7(d) 75.8 or 75.76 to 75.78 2 4 5.25 3 M1 for oe 3 2
Q8 · The diagram shows the net of a solid
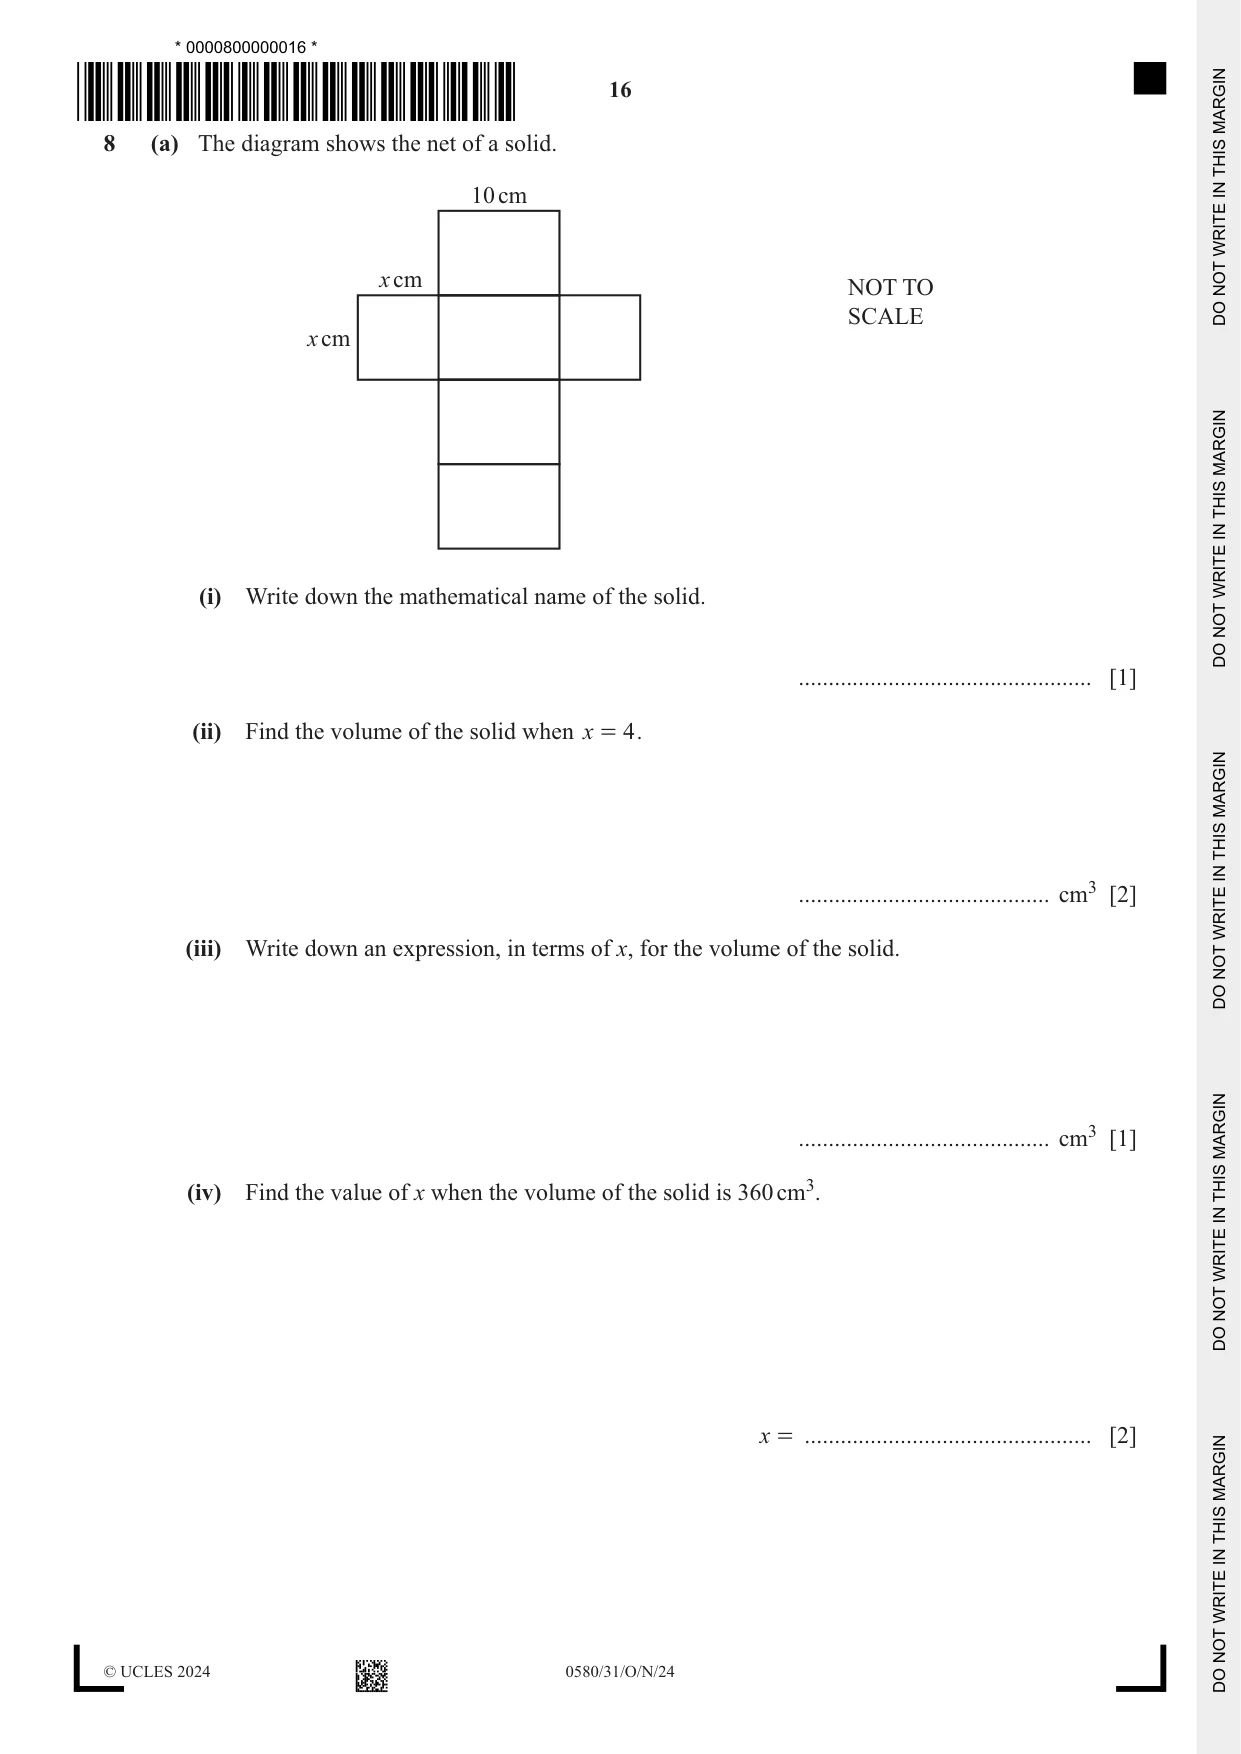
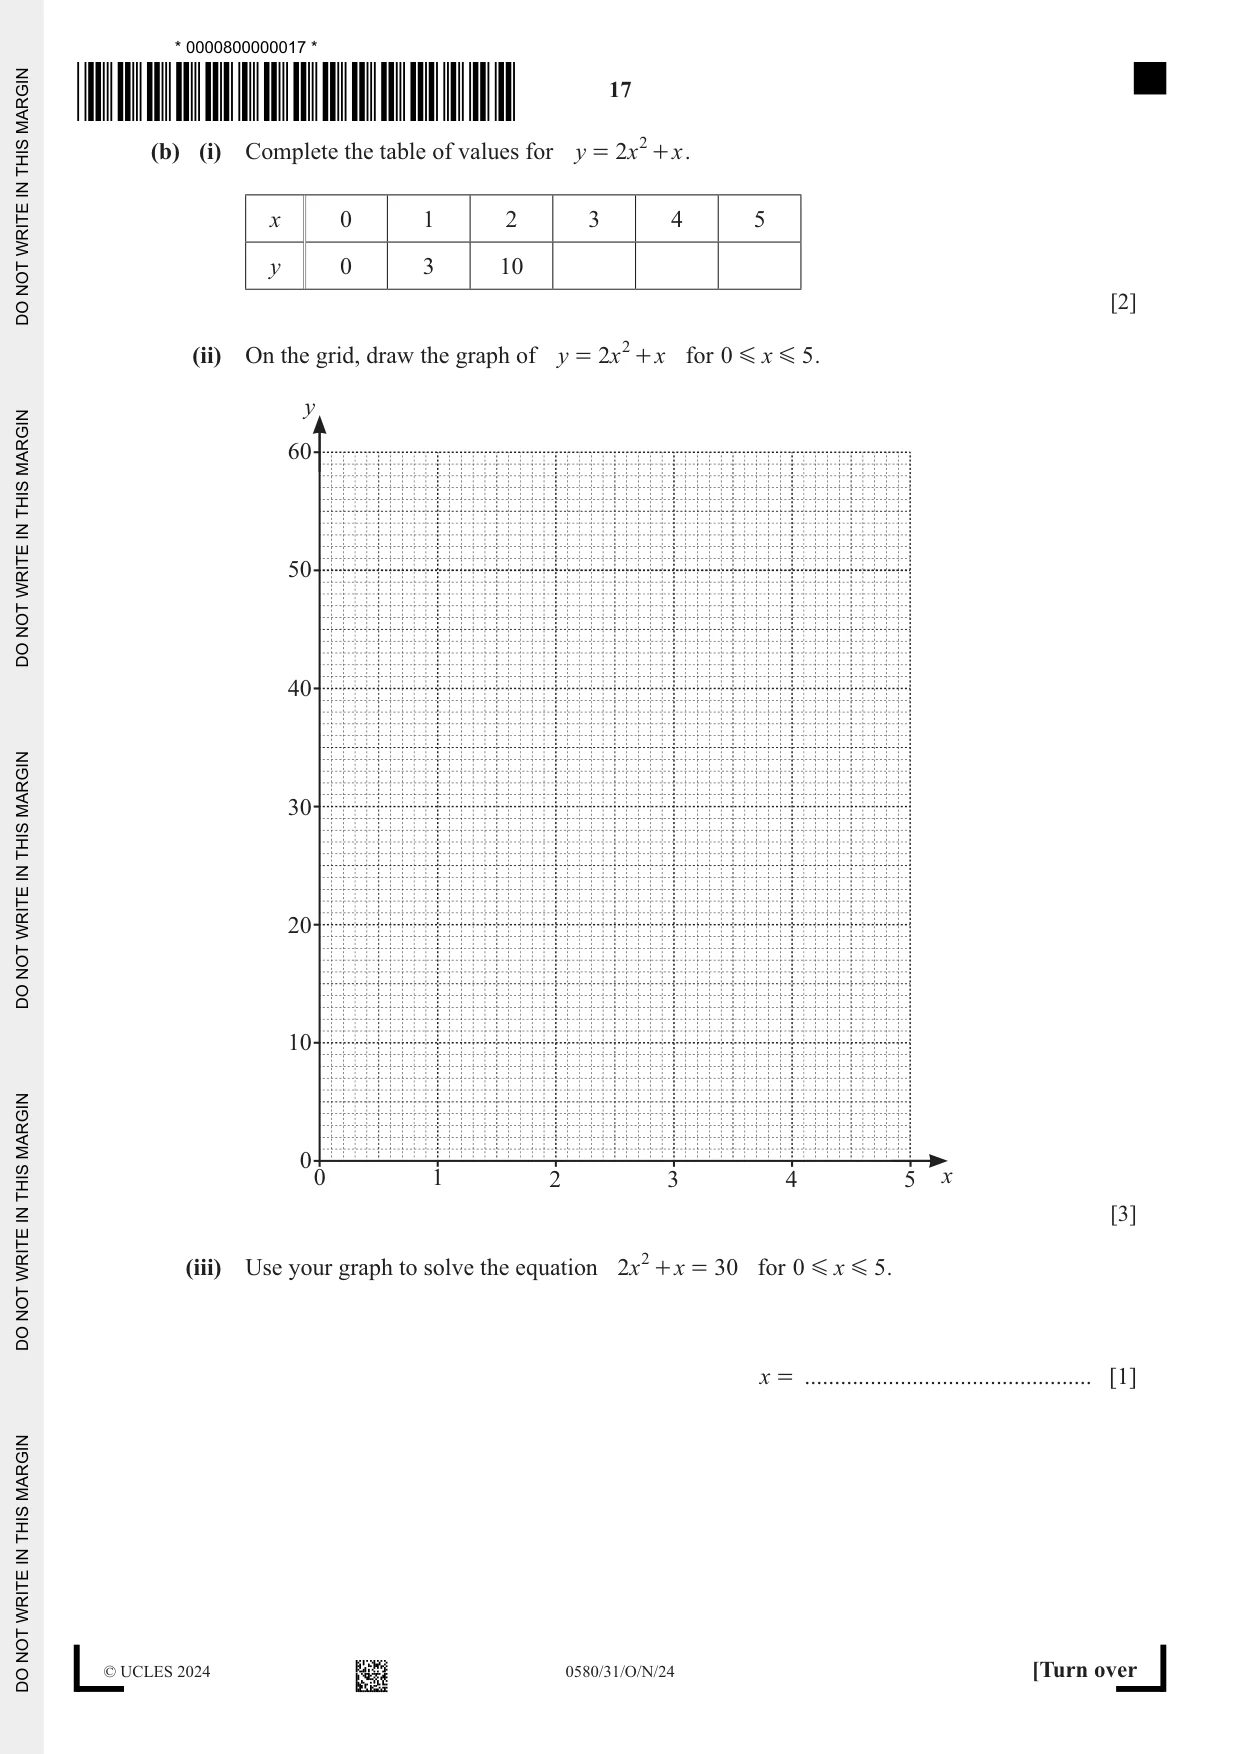
8 (a) The diagram shows the net of a solid. 10 cm x cm NOT TO SCALE x cm (i) Write down the mathematical name of the solid. ................................................. [1] (ii) Find the volume of the solid when x = 4 . .......................................... cm3 [2] (iii) Write down an expression, in terms of x, for the volume of the solid. .......................................... cm3 [1] (iv) Find the value of x when the volume of the solid is 360 cm3. x = ................................................ [2] (b) (i) Complete the table of values for y = 2 x 2 + x . x 0 1 2 3 4 5 y 0 3 10 [2] (ii) On the grid, draw the graph of y = 2 x 2 + x for 0 G x G 5 . y 60 50 40 30 20 10 0 0 1 2 3 4 5 x [3] (iii) Use your graph to solve the equation 2x 2 + x = 30 for 0 G x G 5 . x = ................................................ [1]
Mark scheme: 8(a)(i) Cuboid 1 8(a)(ii) 160 2 M1 for 4 × 4 × 10 oe 8(a)(iii) 10x2 oe final answer 1 8(a)(iv) 6 nfww 2 M1 for 10x2 = 360 oe or better or their (a)(iii) = 360 oe or better or 360 ÷10 8(b)(i) 21, 36, 55 2 B1 for 2 correct 8(b)(ii) Correct smooth curve 3 B2FT for 5 or 6 points correctly plotted or B1FT for 3 or 4 points correctly plotted 8(b)(iii) 3.5 to 3.7 1 FT their value of x when y = 30
Q9 · Samir leaves home at 2 pm
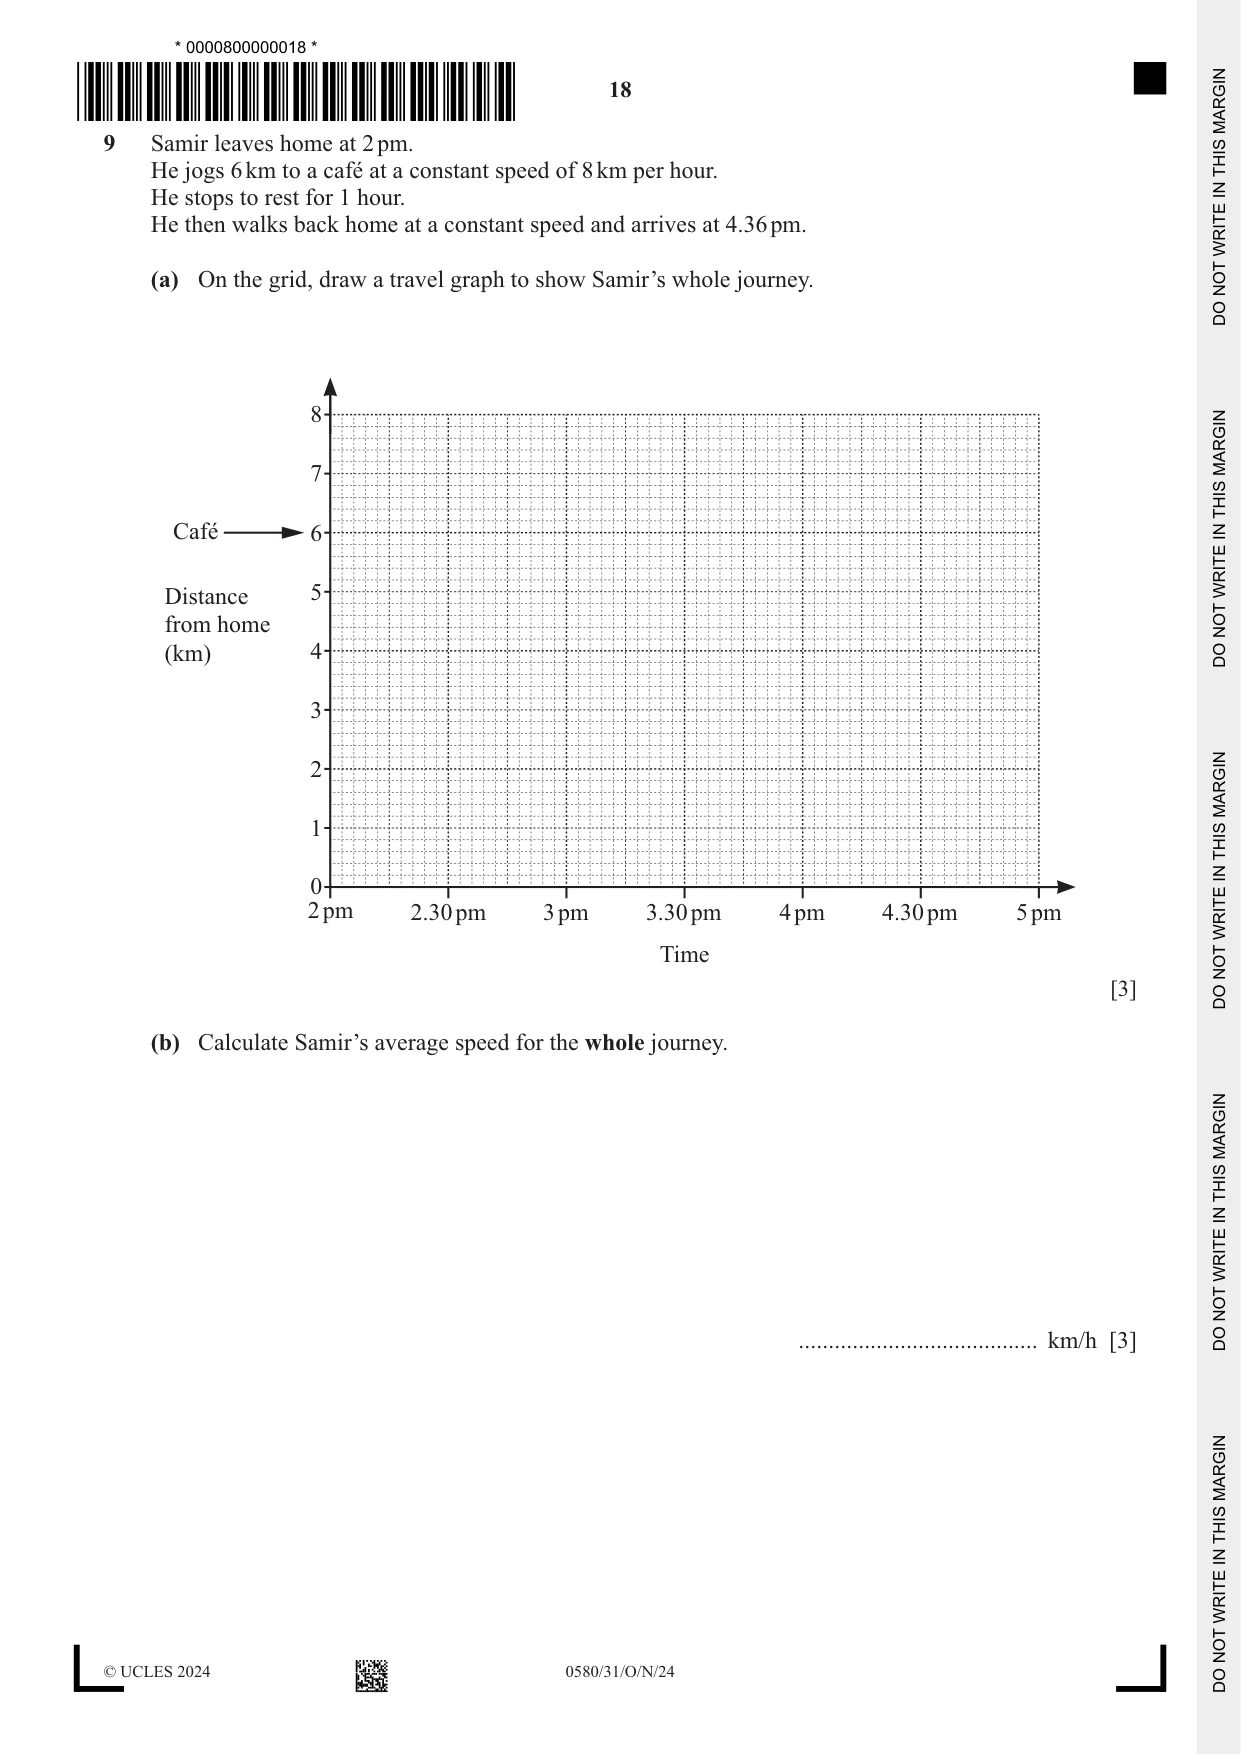
9 Samir leaves home at 2 pm. He jogs 6 km to a café at a constant speed of 8 km per hour. He stops to rest for 1 hour. He then walks back home at a constant speed and arrives at 4.36 pm. (a) On the grid, draw a travel graph to show Samir’s whole journey. 8 7 Café 6 Distance 5 from home (km) 4 3 2 1 0 2 pm 2.30 pm 3 pm 3.30 pm 4 pm 4.30 pm 5 pm Time [3] (b) Calculate Samir’s average speed for the whole journey. ........................................ km/h [3]
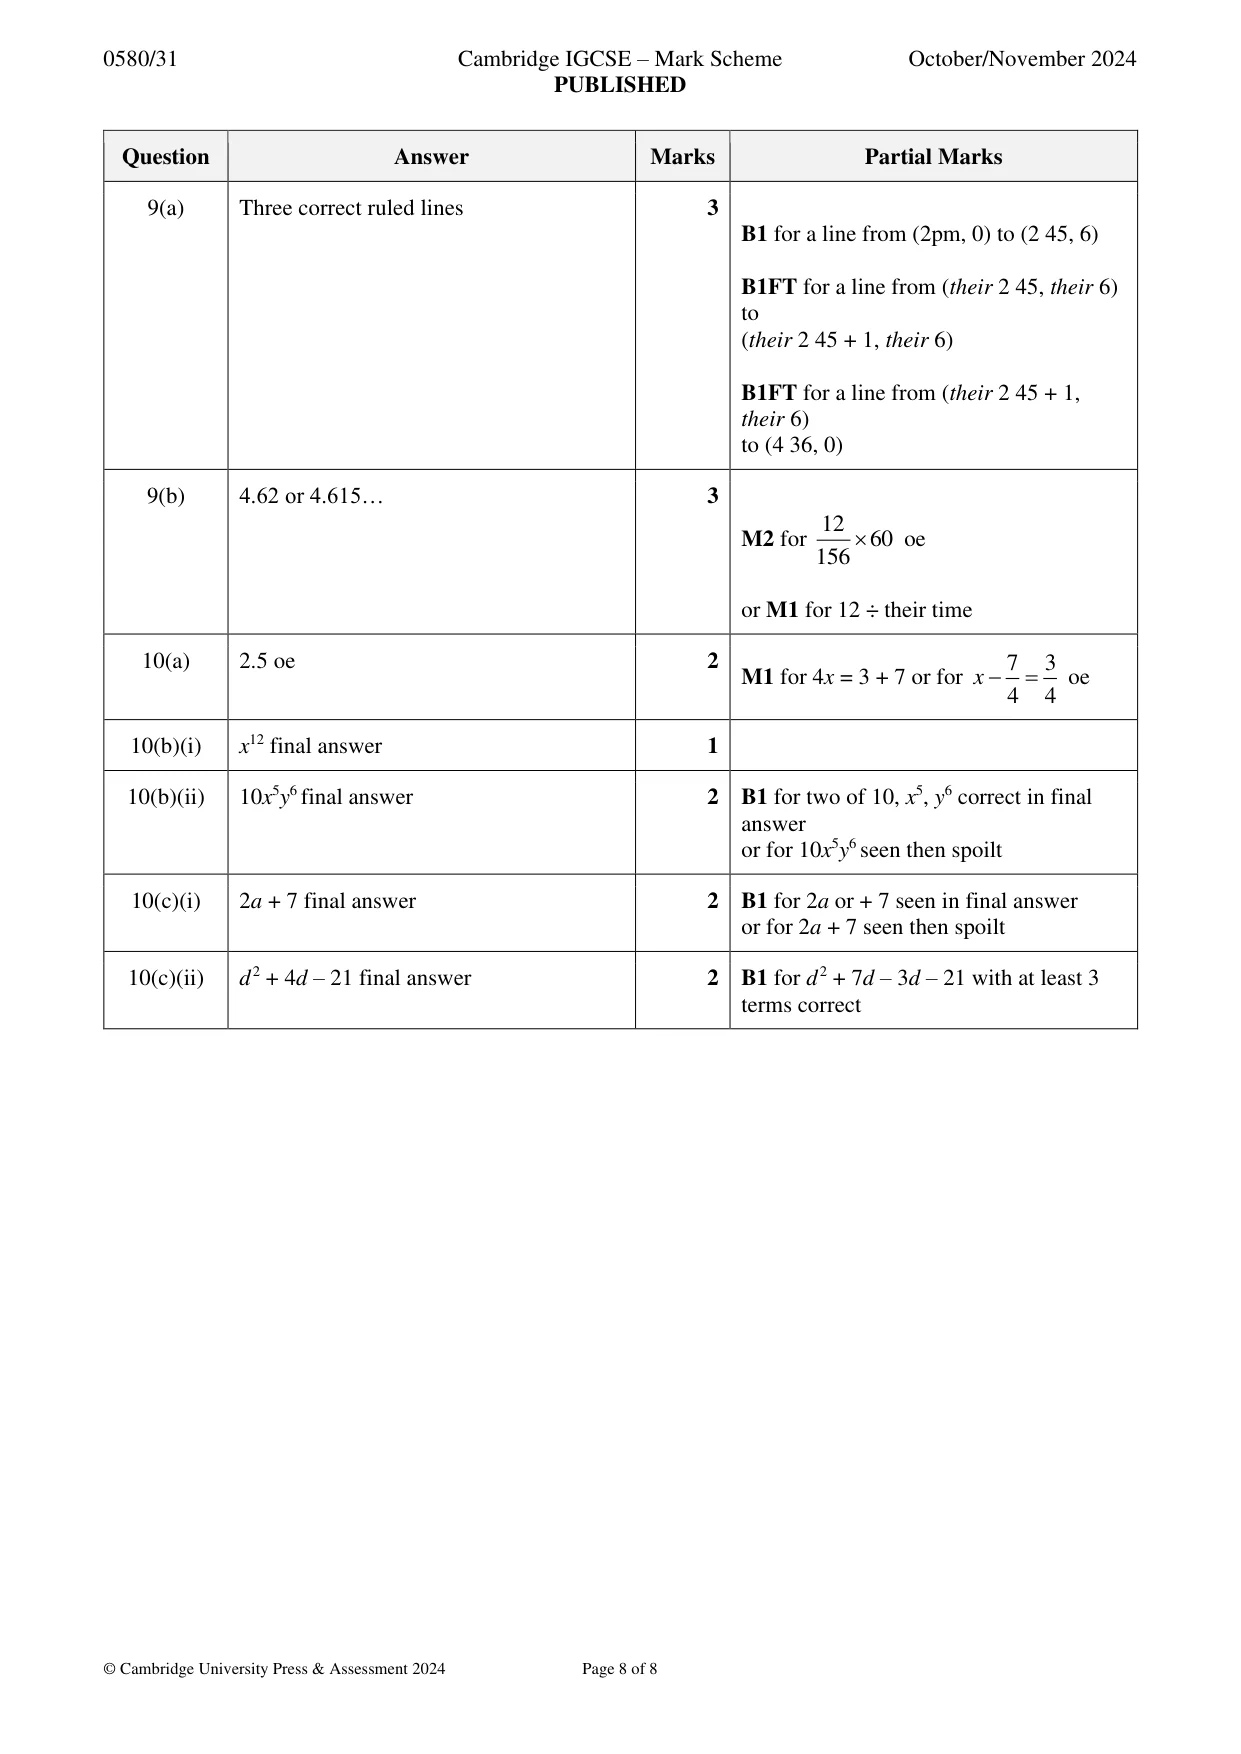
Mark scheme: 9(a) Three correct ruled lines 3 B1 for a line from (2pm, 0) to (2 45, 6) B1FT for a line from (their 2 45, their 6) to (their 2 45 + 1, their 6) B1FT for a line from (their 2 45 + 1, their 6) to (4 36, 0) 9(b) 4.62 or 4.615… 3 12 M2 for 60 oe 156 or M1 for 12 ÷ their time
Question 10
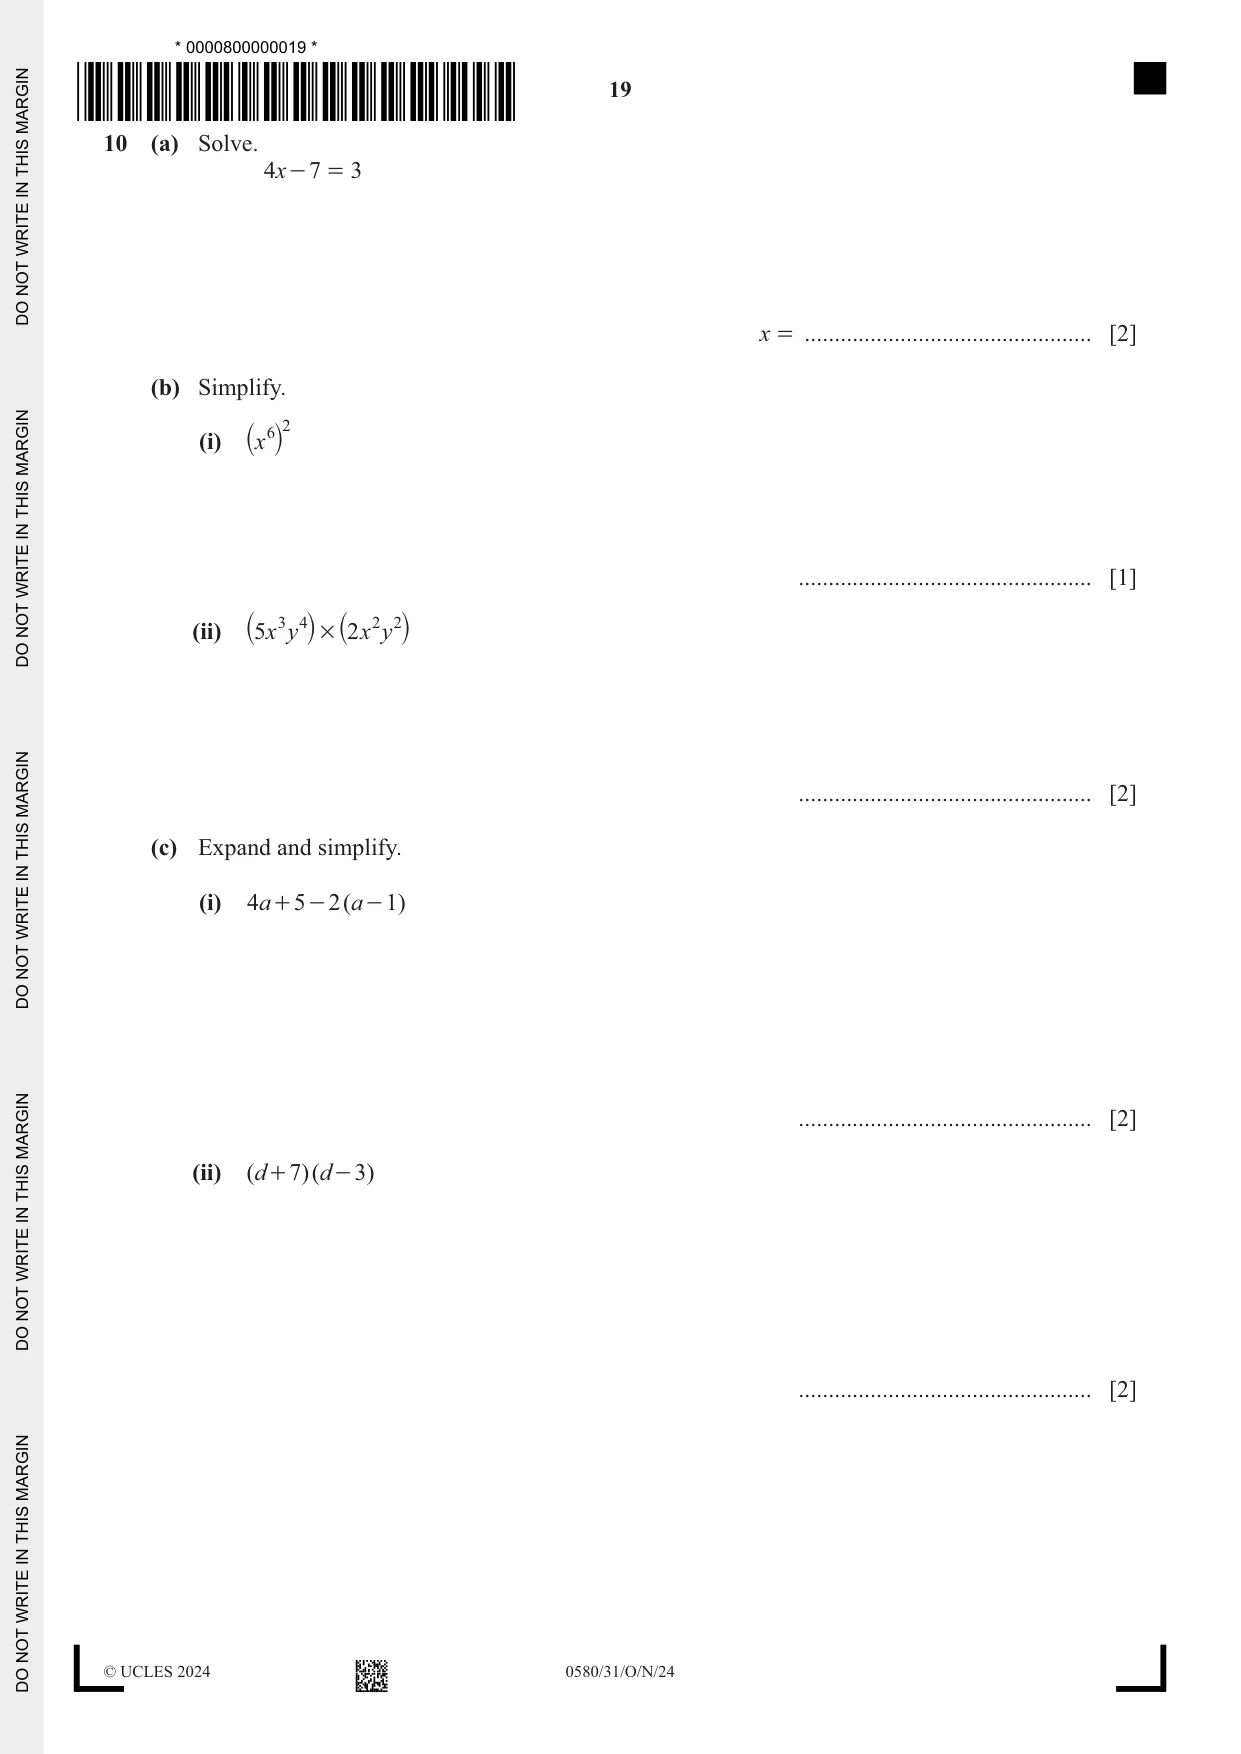
10 (a) Solve. 4x - 7 = 3 x = ................................................ [2] (b) Simplify. 2 (i) `x6j ................................................. [1] (ii) `5x 3 y 4j # `2 x 2 y 2j ................................................. [2] (c) Expand and simplify. (i) 4a + 5 - 2 ( a - 1) ................................................. [2] (ii) ( d + 7)( d - 3) ................................................. [2]
Mark scheme: 10(a) 2.5 oe 2 7 3 M1 for 4x = 3 + 7 or for x − = oe 4 4 10(b)(i) x12 final answer 1 10(b)(ii) 10x5y6 final answer 2 B1 for two of 10, x5, y6 correct in final answer or for 10x5y6 seen then spoilt 10(c)(i) 2a + 7 final answer 2 B1 for 2a or + 7 seen in final answer or for 2a + 7 seen then spoilt 10(c)(ii) d 2 + 4d – 21 final answer 2 B1 for d 2 + 7d – 3d – 21 with at least 3 terms correct
What was in this paper
The subtopics covered by these 10 questions, and how many questions each got. Open one in a new tab to see every Cambridge question on it.
What you needed in this session
Cambridge’s own grade thresholds for 2024 Oct/Nov, Paper 3 · Variant 1. A higher threshold means an easier paper — the bar moves with how the cohort did.