Questions as text
Q1 · An athlete runs in a race 0654/32 Oct/Nov 2018
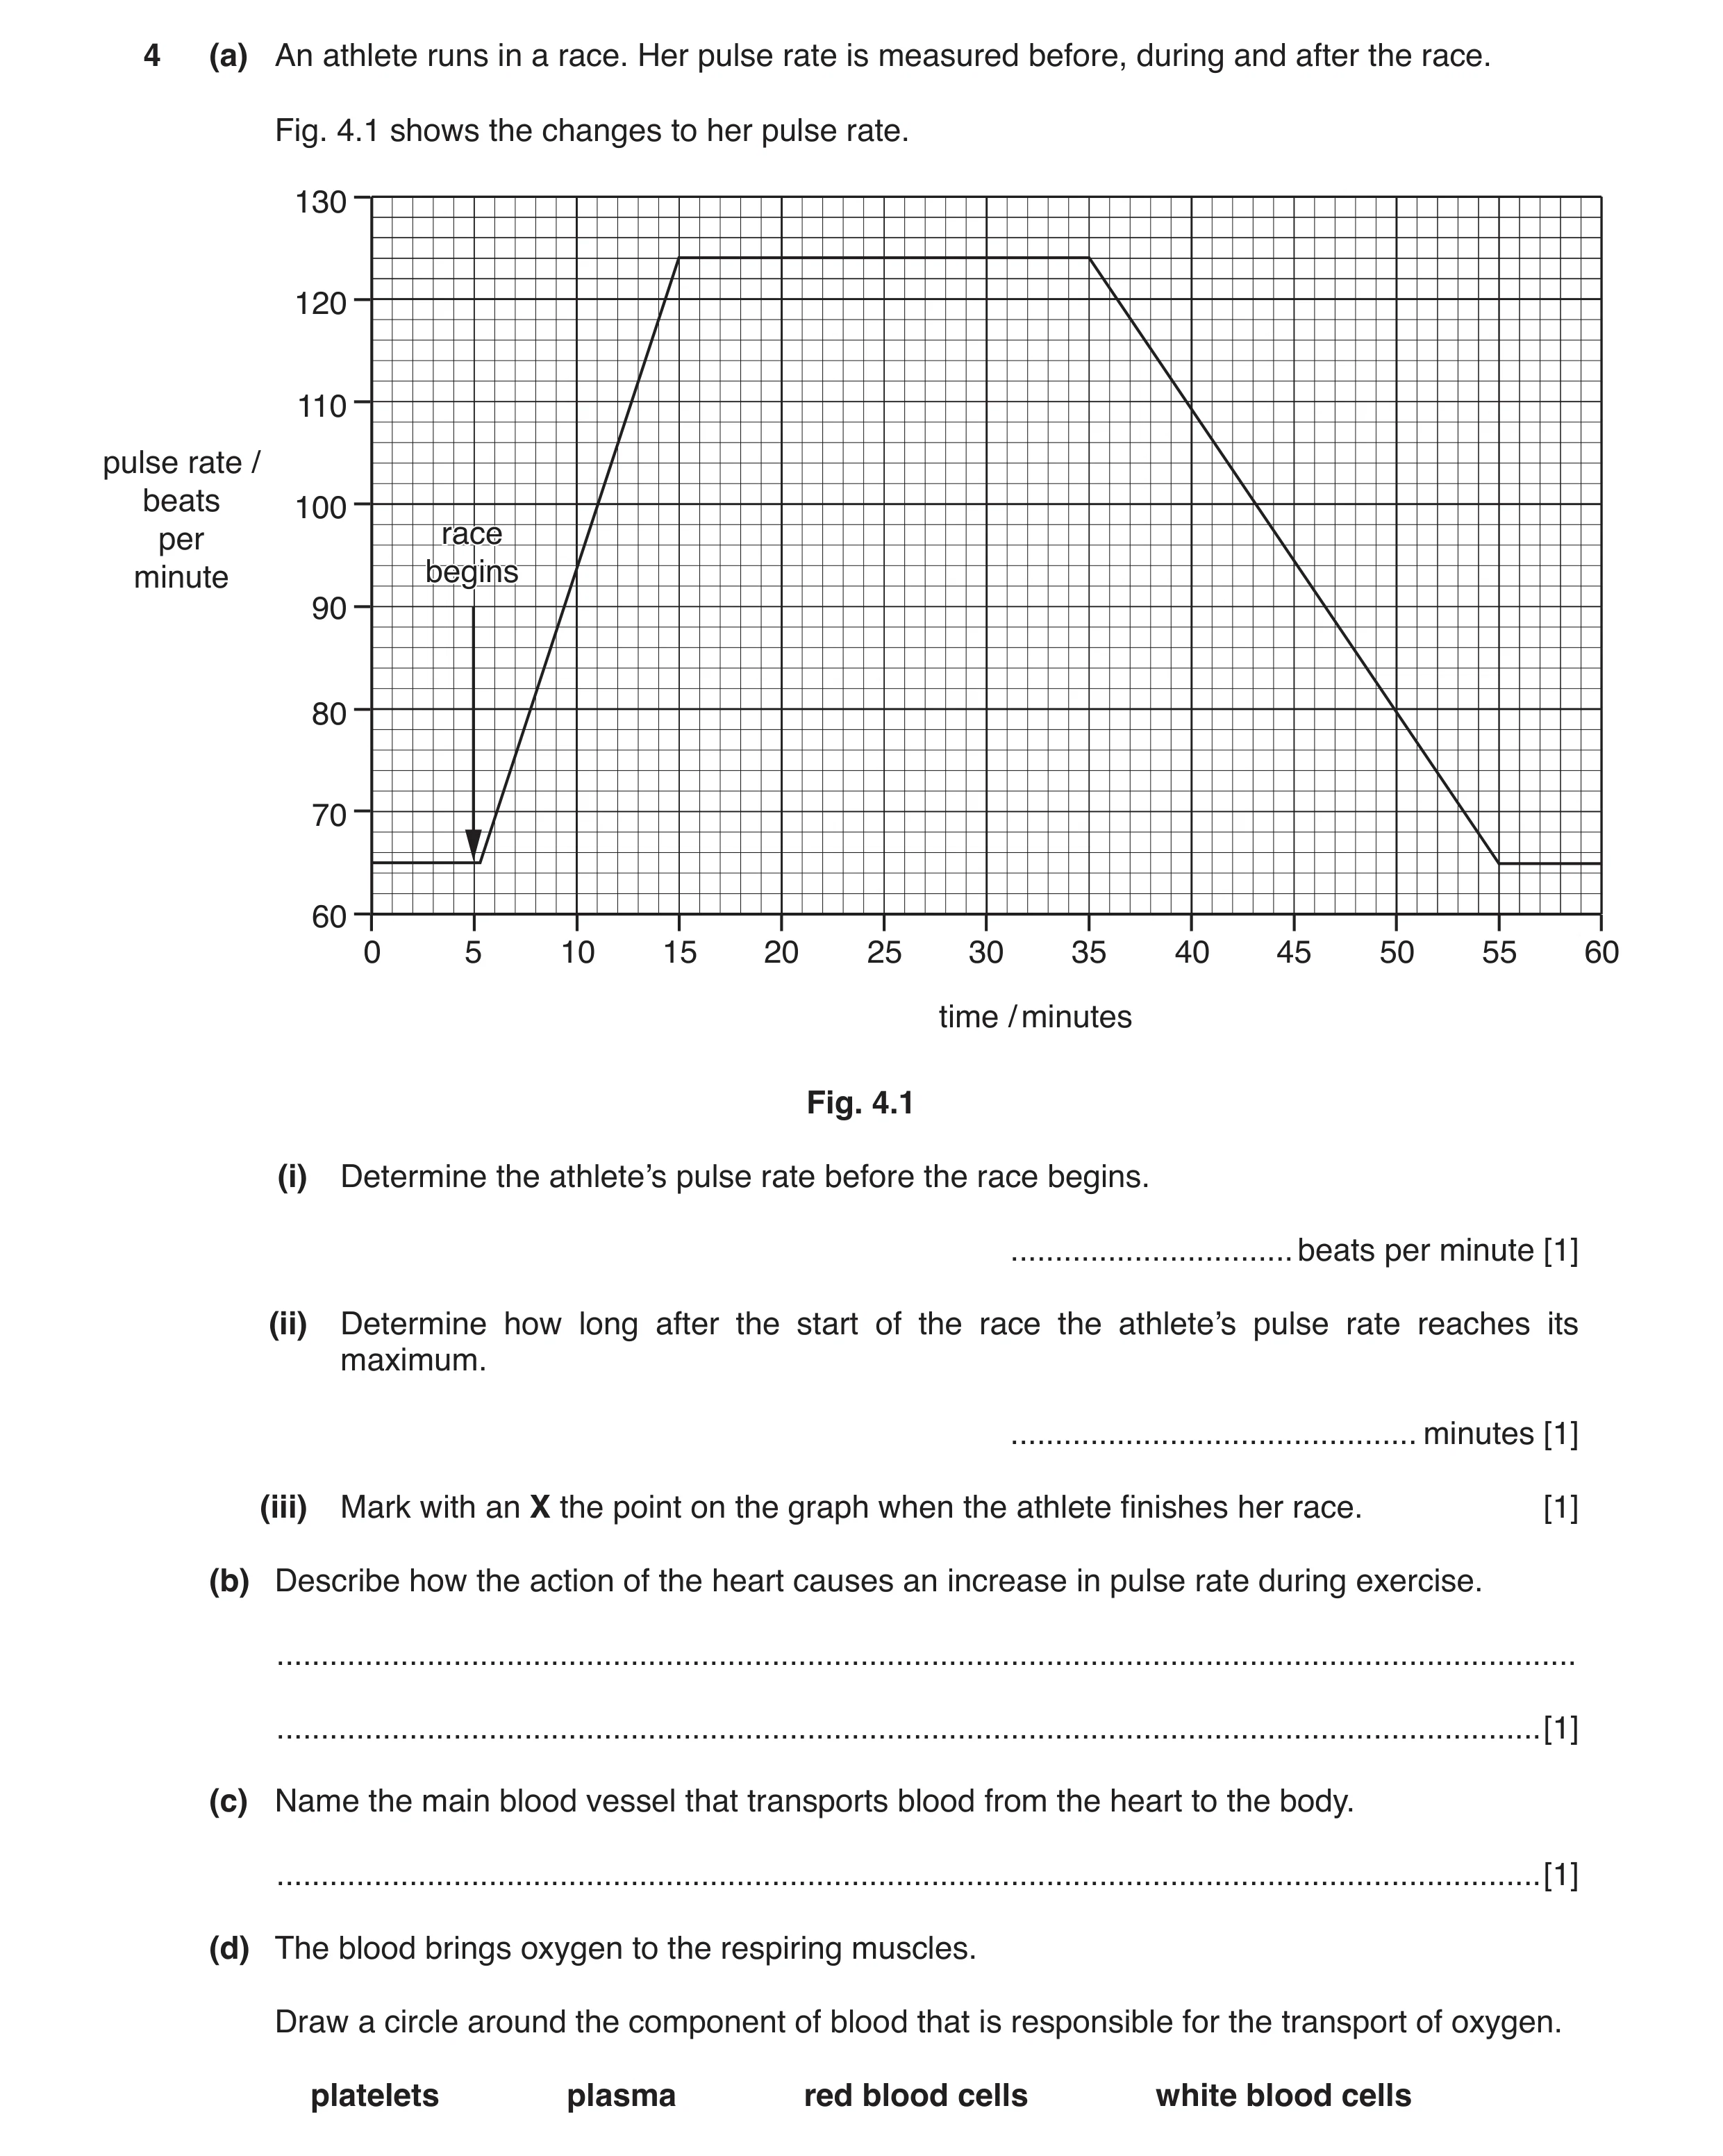
4 (a) An athlete runs in a race. Her pulse rate is measured before, during and after the race. Fig. 4.1 shows the changes to her pulse rate. 130 120 110 pulse rate / beats 100 per racerace minute beginsbegins 90 80 70 60 0 5 10 15 20 25 30 35 40 45 50 55 60 time / minutes Fig. 4.1 (i) Determine the athlete’s pulse rate before the race begins. … beats per minute [1] (ii) Determine how long after the start of the race the athlete’s pulse rate reaches its maximum. … minutes [1] (iii) Mark with an X the point on the graph when the athlete finishes her race. [1] (b) Describe how the action of the heart causes an increase in pulse rate during exercise. … … [1] (c) Name the main blood vessel that transports blood from the heart to the body. … [1] (d) The blood brings oxygen to the respiring muscles. Draw a circle around the component of blood that is responsible for the transport of oxygen. platelets plasma red blood cells white blood cells
6 marks
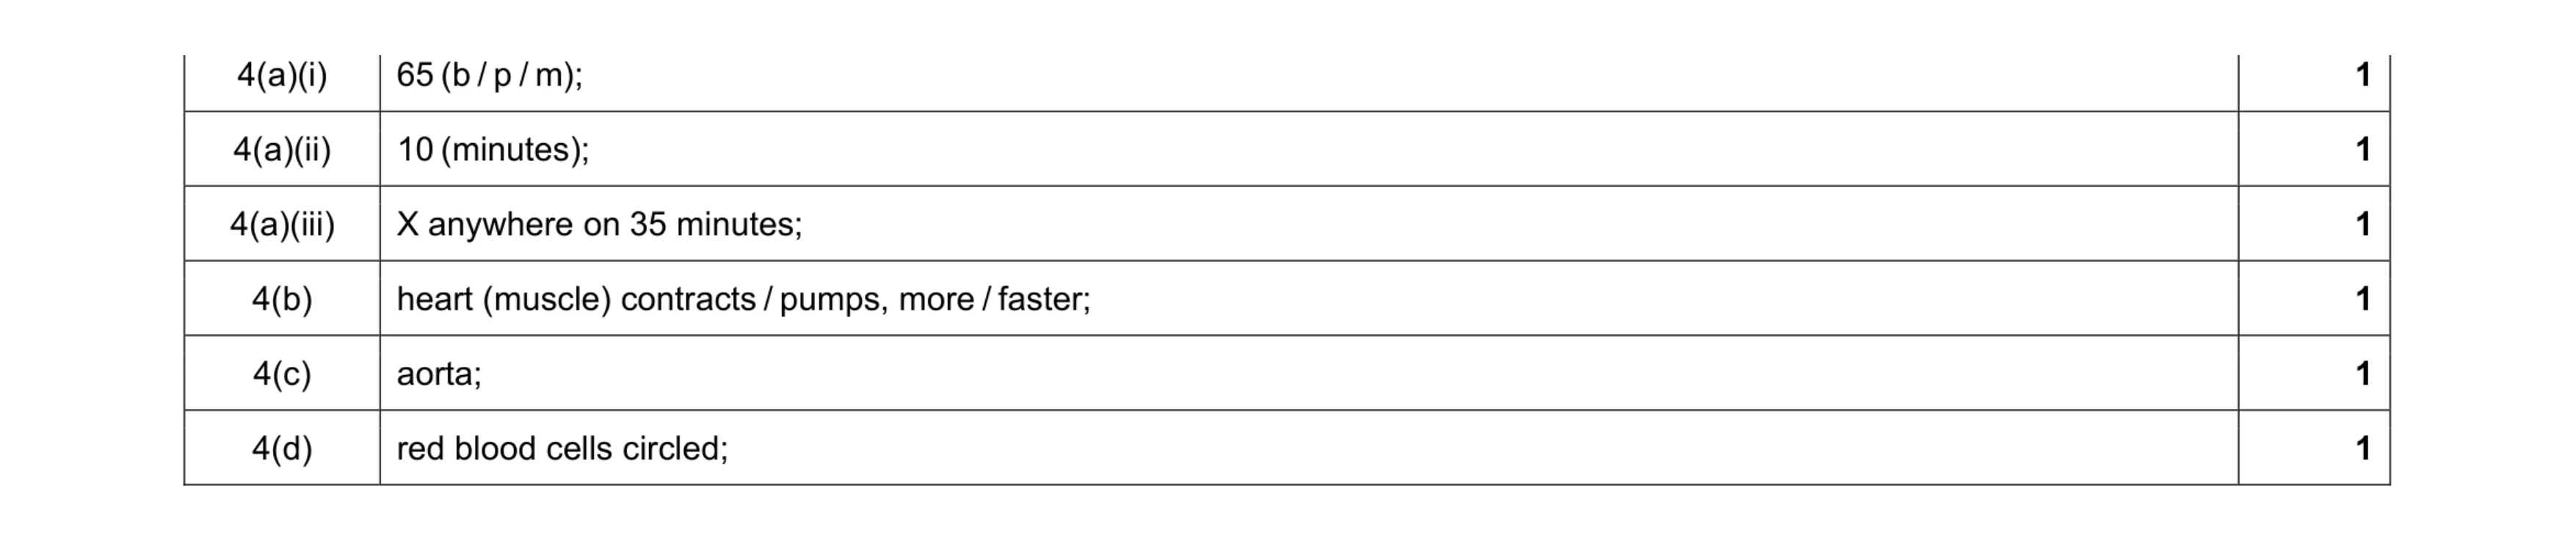
Mark scheme: 4(a)(i) 65 (b / p / m); 1 4(a)(ii) 10 (minutes); 1 4(a)(iii) X anywhere on 35 minutes; 1 4(b) heart (muscle) contracts / pumps, more / faster; 1 4(c) aorta; 1 4(d) red blood cells circled; 1
This question in 0654/32 Oct/Nov 2018
Q2 · A diagram of a section through the heart and associated blood vessels 0654/33 Oct/Nov 2019
1 (a) Fig. 1.1 is a diagram of a section through the heart and associated blood vessels. X Fig. 1.1 (i) Name the structure labelled X in Fig. 1.1. … [1] (ii) Name the structure shown in Fig. 1.1 that ensures one-way flow of blood. … [1] (iii) Draw an arrow on Fig. 1.1 to show where blood enters the heart from the lungs. [1] (b) Table 1.1 shows some of the functions of the components of blood. Table 1.1 component of blood function antibody production and phagocytosis … promotes blood clotting … transport of dissolved nutrients … transport of oxygen … Complete Table 1.1 by adding the name of the component of blood which has each function. [4] (c) Substances are transported around the body by blood in blood vessels. Substances are also transported around plants in vessels. Name the two vessels that transport substances in plants. 1 … 2 … [2] (d) Water is one of the substances transported through plants and is lost by the process of transpiration. Complete the definition of the term transpiration using words or phrases from the list. Each word or phrase may be used once, more than once or not at all. absorption diffusion epidermis evaporation palisade cells photosynthesis roots stomata Transpiration is defined as the loss of water vapour from plant leaves by … of water at the surfaces of the mesophyll cells followed by … of water vapour through the … . [3] [Total: 12]
12 marks
Mark scheme: 1(a)(i) septum ; 1 1(a)(ii) valve; 1 1(a)(iii) arrow pointing into the heart from the pulmonary vein ; (furthest right blood vessel) 1 1(b) component of blood function white blood cell ; antibody production and phagocytosis platelets ; promotes blood clotting plasma ; transport of dissolved nutrients red blood cell ; transport of oxygen 4 1(c) xylem ; phloem ; 2 1(d) evaporation ; diffusion ; stomata ; 3
This question in 0654/33 Oct/Nov 2019
Q3 · A scientist investigates the recovery time of an athlete and a non‑athlete after exercise 0654/31 Oct/Nov 2020
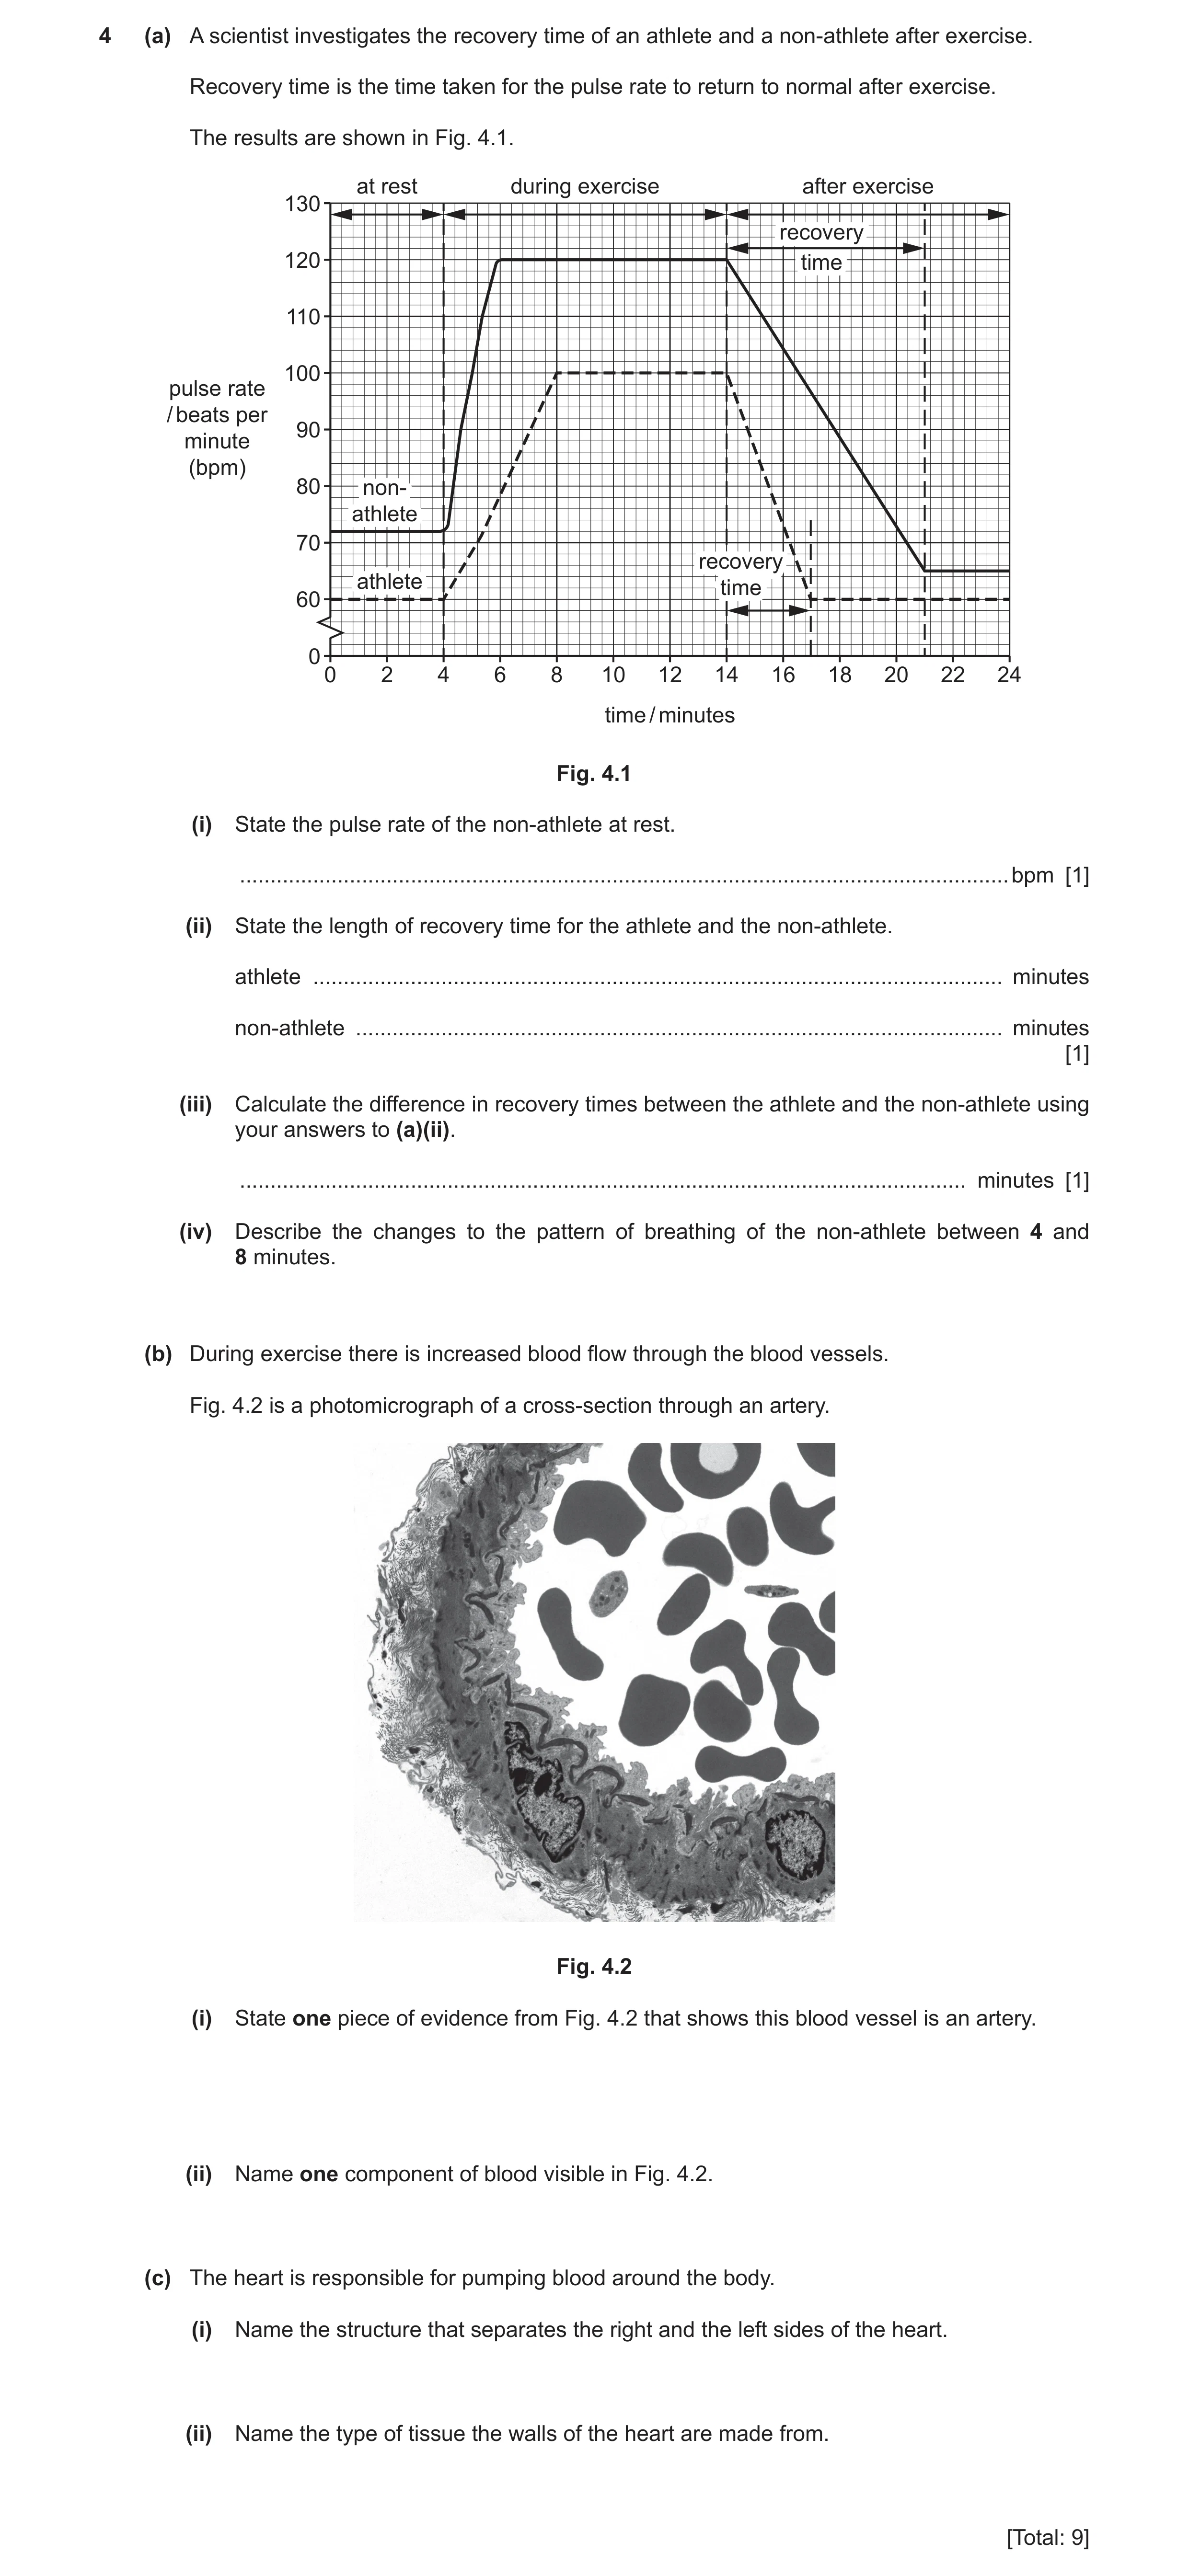
4 (a) A scientist investigates the recovery time of an athlete and a non‑athlete after exercise. Recovery time is the time taken for the pulse rate to return to normal after exercise. The results are shown in Fig. 4.1. at rest during exercise after exercise 130 recovery 120 time 110 100 pulse rate / beats per 90 minute (bpm) 80 non- athlete 70 recovery athlete time 60 0 0 2 4 6 8 10 12 14 16 18 20 22 24 time / minutes Fig. 4.1 (i) State the pulse rate of the non‑athlete at rest. ������������������������������������������������������������������������������������������������������������������������������ bpm [1] (ii) State the length of recovery time for the athlete and the non‑athlete. athlete ����������������������������������������������������������������������������������������������������������������� minutes non‑athlete ���������������������������������������������������������������������������������������������������������� minutes [1] (iii) Calculate the difference in recovery times between the athlete and the non‑athlete using your answers to (a)(ii). ����������������������������������������������������������������������������������������������������������������������� minutes [1] (iv) Describe the changes to the pattern of breathing of the non‑athlete between 4 and 8 minutes. (b) During exercise there is increased blood flow through the blood vessels. Fig. 4.2 is a photomicrograph of a cross‑section through an artery. Fig. 4.2 (i) State one piece of evidence from Fig. 4.2 that shows this blood vessel is an artery. (ii) Name one component of blood visible in Fig. 4.2. (c) The heart is responsible for pumping blood around the body. (i) Name the structure that separates the right and the left sides of the heart. (ii) Name the type of tissue the walls of the heart are made from. [Total: 9]
9 marks
Mark scheme: 4(a)(i) 72 (bpm) 1 4(a)(ii) athlete 3 (minutes) and non-athlete 7 (minutes) ; 1 4(a)(iii) 7 – 3 = 4 (minutes) ; 1 4(a)(iv) breathing rate would increase ; breathing depth would increase ; 2 4(b)(i) thick wall ; 1 4(b)(ii) red blood cell ; 1 4(c)(i) septum ; 1 4(c)(ii) muscular (tissue) ; 1
This question in 0654/31 Oct/Nov 2020
Q4 · A scientist investigates the recovery time of an athlete and a non‑athlete after exercise 0654/33 Oct/Nov 2020
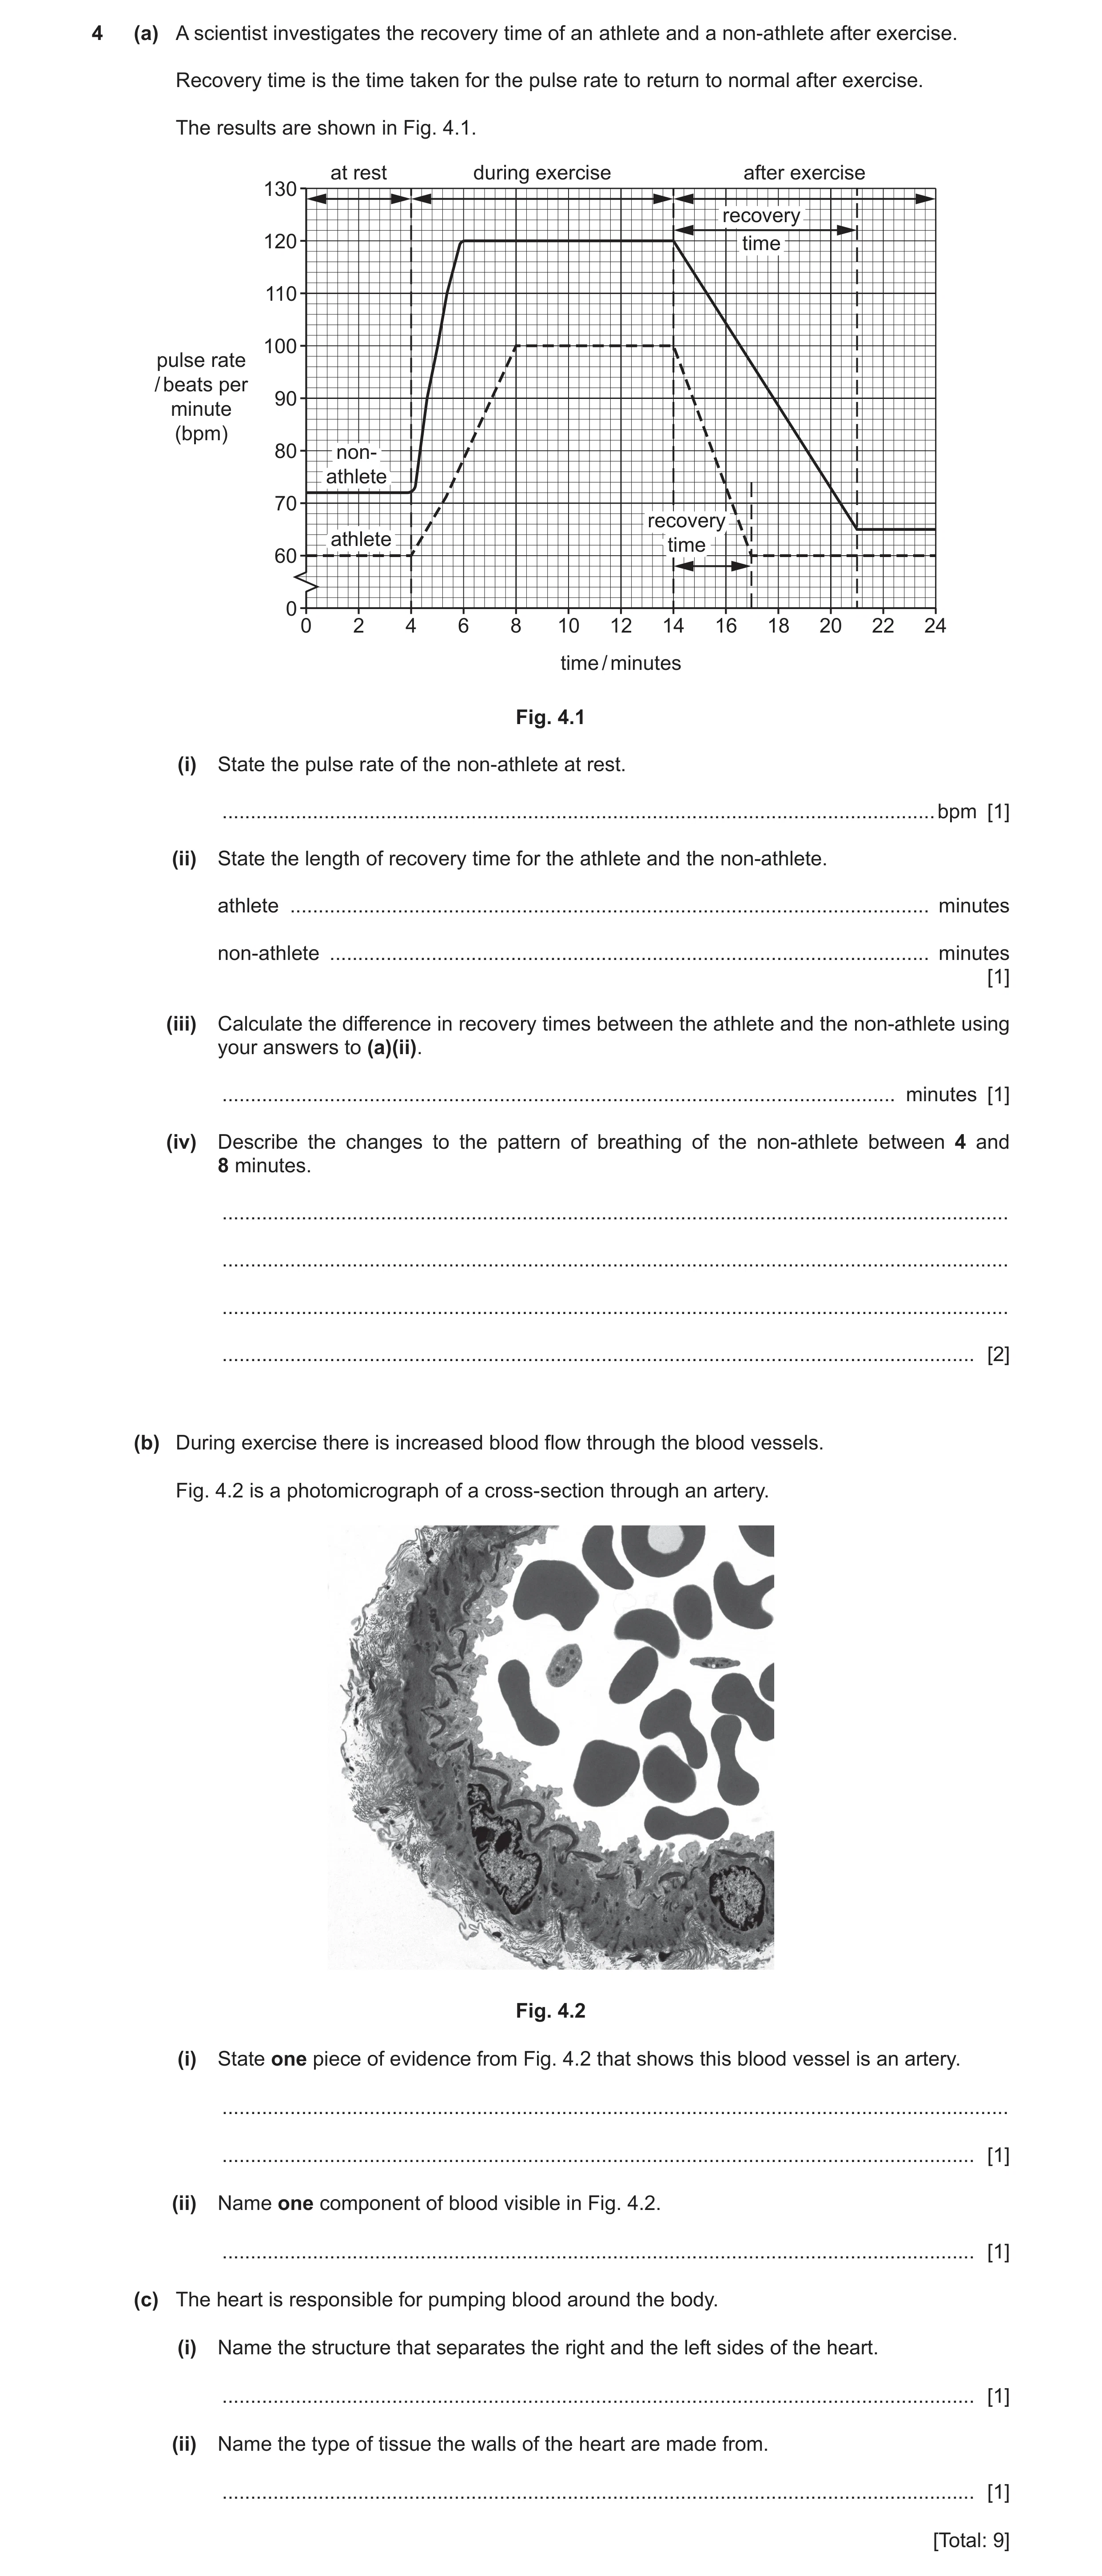
4 (a) A scientist investigates the recovery time of an athlete and a non‑athlete after exercise. Recovery time is the time taken for the pulse rate to return to normal after exercise. The results are shown in Fig. 4.1. at rest during exercise after exercise 130 recovery 120 time 110 100 pulse rate / beats per 90 minute (bpm) 80 non- athlete 70 recovery athlete time 60 0 0 2 4 6 8 10 12 14 16 18 20 22 24 time / minutes Fig. 4.1 (i) State the pulse rate of the non‑athlete at rest. … bpm [1] (ii) State the length of recovery time for the athlete and the non‑athlete. athlete … minutes non‑athlete … minutes [1] (iii) Calculate the difference in recovery times between the athlete and the non‑athlete using your answers to (a)(ii). … minutes [1] (iv) Describe the changes to the pattern of breathing of the non‑athlete between 4 and 8 minutes. … … … … [2] (b) During exercise there is increased blood flow through the blood vessels. Fig. 4.2 is a photomicrograph of a cross‑section through an artery. Fig. 4.2 (i) State one piece of evidence from Fig. 4.2 that shows this blood vessel is an artery. … … [1] (ii) Name one component of blood visible in Fig. 4.2. … [1] (c) The heart is responsible for pumping blood around the body. (i) Name the structure that separates the right and the left sides of the heart. … [1] (ii) Name the type of tissue the walls of the heart are made from. … [1] [Total: 9]
9 marks
Mark scheme: 4(a)(i) 72 (bpm) 1 4(a)(ii) athlete 3 (minutes) and non-athlete 7 (minutes) ; 1 4(a)(iii) 7 – 3 = 4 (minutes) ; 1 4(a)(iv) breathing rate would increase ; breathing depth would increase ; 2 4(b)(i) thick wall ; 1 4(b)(ii) red blood cell ; 1 4(c)(i) septum ; 1 4(c)(ii) muscular (tissue) ; 1
This question in 0654/33 Oct/Nov 2020
Q5 · A student measures their pulse rate at rest, during and after exercise 0654/33 Oct/Nov 2021
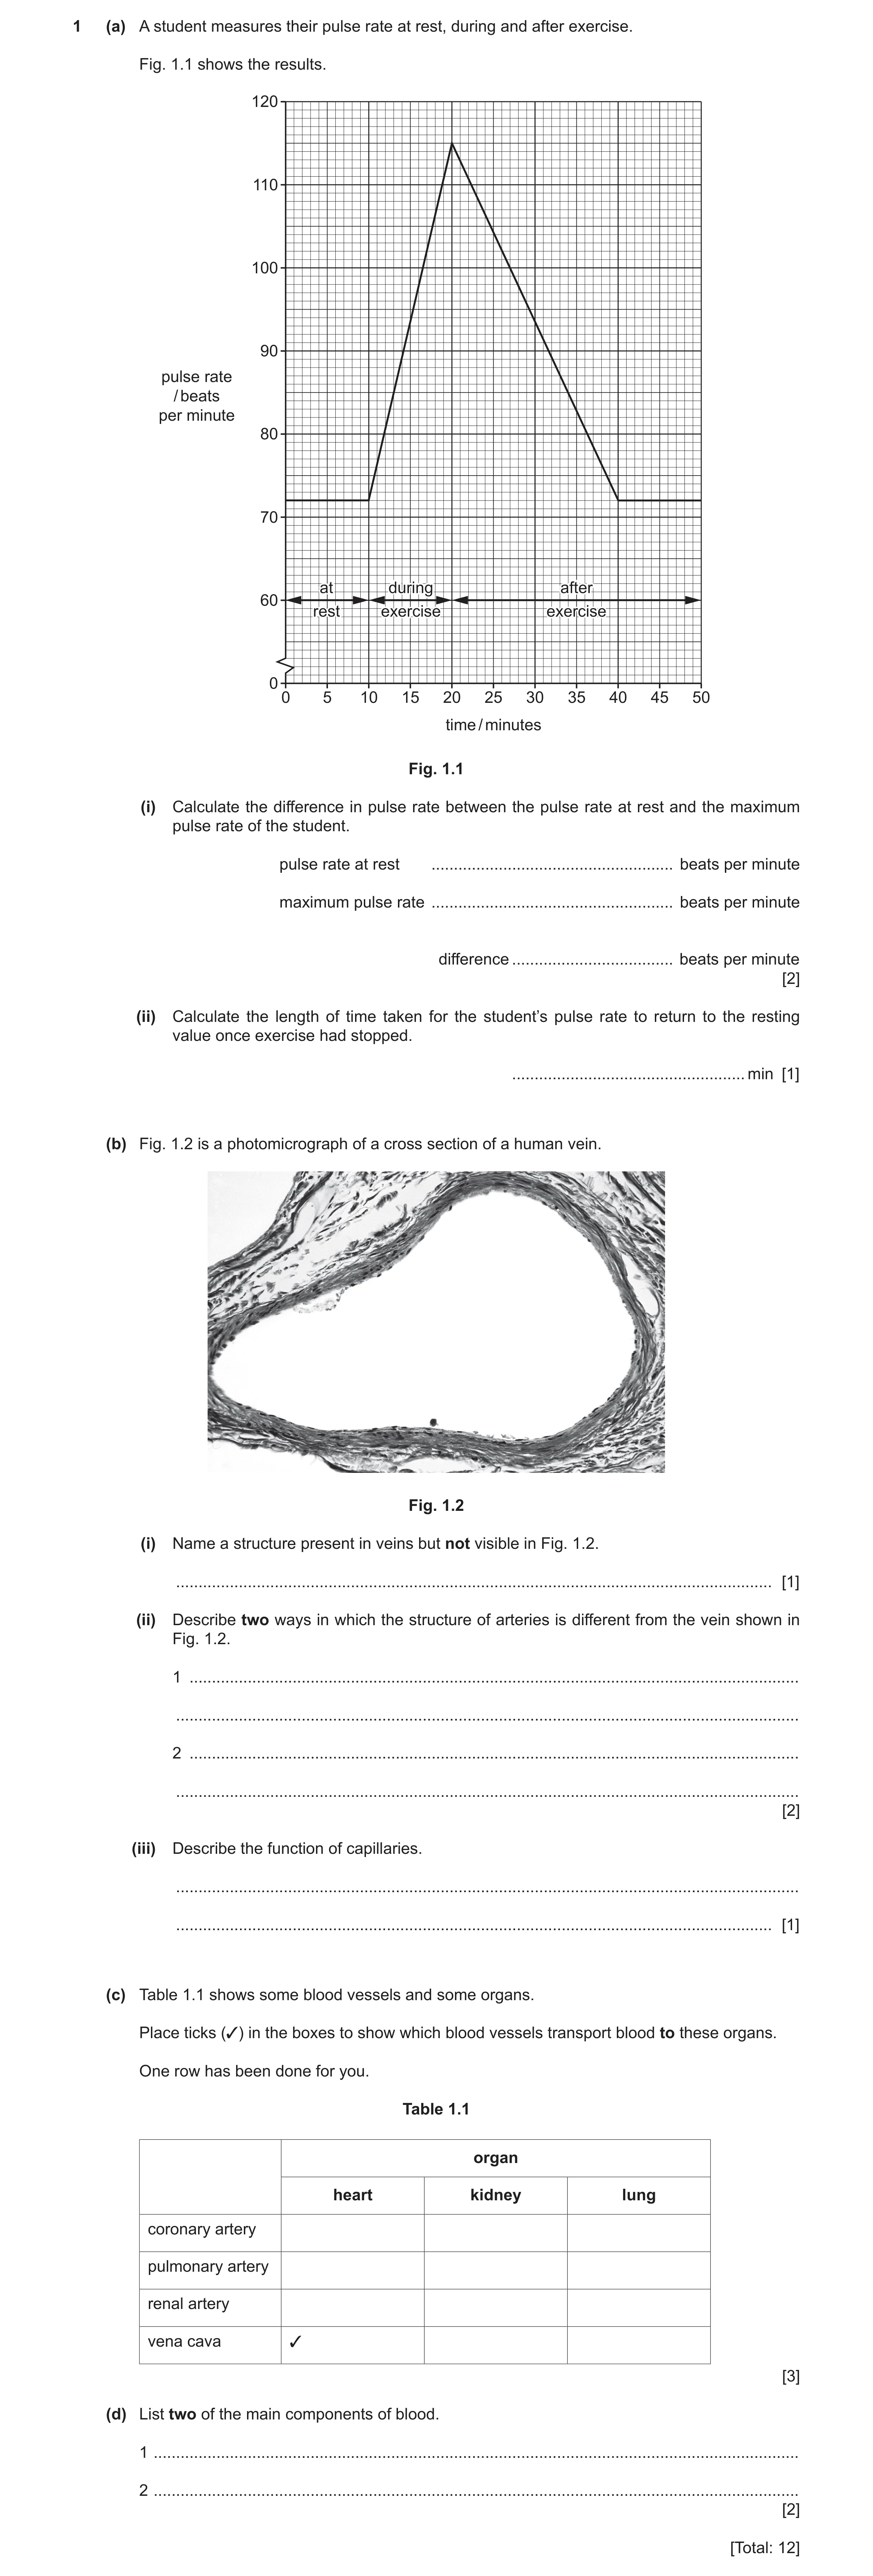
1 (a) A student measures their pulse rate at rest, during and after exercise. Fig. 1.1 shows the results. 120 110 100 90 pulse rate / beats per minute 80 70 atat duringduring afterafter 60 restrest exerciseexercise exerciseexercise 0 0 5 10 15 20 25 30 35 40 45 50 time / minutes Fig. 1.1 (i) Calculate the difference in pulse rate between the pulse rate at rest and the maximum pulse rate of the student. pulse rate at rest … beats per minute maximum pulse rate … beats per minute difference … beats per minute [2] (ii) Calculate the length of time taken for the student’s pulse rate to return to the resting value once exercise had stopped. … min [1] (b) Fig. 1.2 is a photomicrograph of a cross section of a human vein. Fig. 1.2 (i) Name a structure present in veins but not visible in Fig. 1.2. … [1] (ii) Describe two ways in which the structure of arteries is different from the vein shown in Fig. 1.2. 1 … … 2 … … [2] (iii) Describe the function of capillaries. … … [1] (c) Table 1.1 shows some blood vessels and some organs. Place ticks (3) in the boxes to show which blood vessels transport blood to these organs. One row has been done for you. Table 1.1 organ heart kidney lung coronary artery pulmonary artery renal artery vena cava 3 [3] (d) List two of the main components of blood. 1 … 2 … [2] [Total: 12]
12 marks
Mark scheme: 1(a)(i) pulse rate at rest = 72 (bpm) and maximum pulse rate = 115 (bpm) ; (115 – 72) = 43 (bpm) ; 2 1(a)(ii) 20 (mins) ; 1 1(b)(i) valves ; 1 1(b)(ii) any two from: thicker wall ; muscle / elastic fibres ; no valves ; narrower lumen ; 2 1(b)(iii) transfer of (named) substances (to / from, tissues / cells) ; 1 1(c) heart kidney lung coronary artery pulmonary artery renal artery vena cava ;;; 3 1(d) any two from: red blood cells ; white blood cells ; plasma ; platelets ; 2
This question in 0654/33 Oct/Nov 2021
Q6 · An athlete monitors her pulse rate during different types of activity 0654/31 May/June 2022
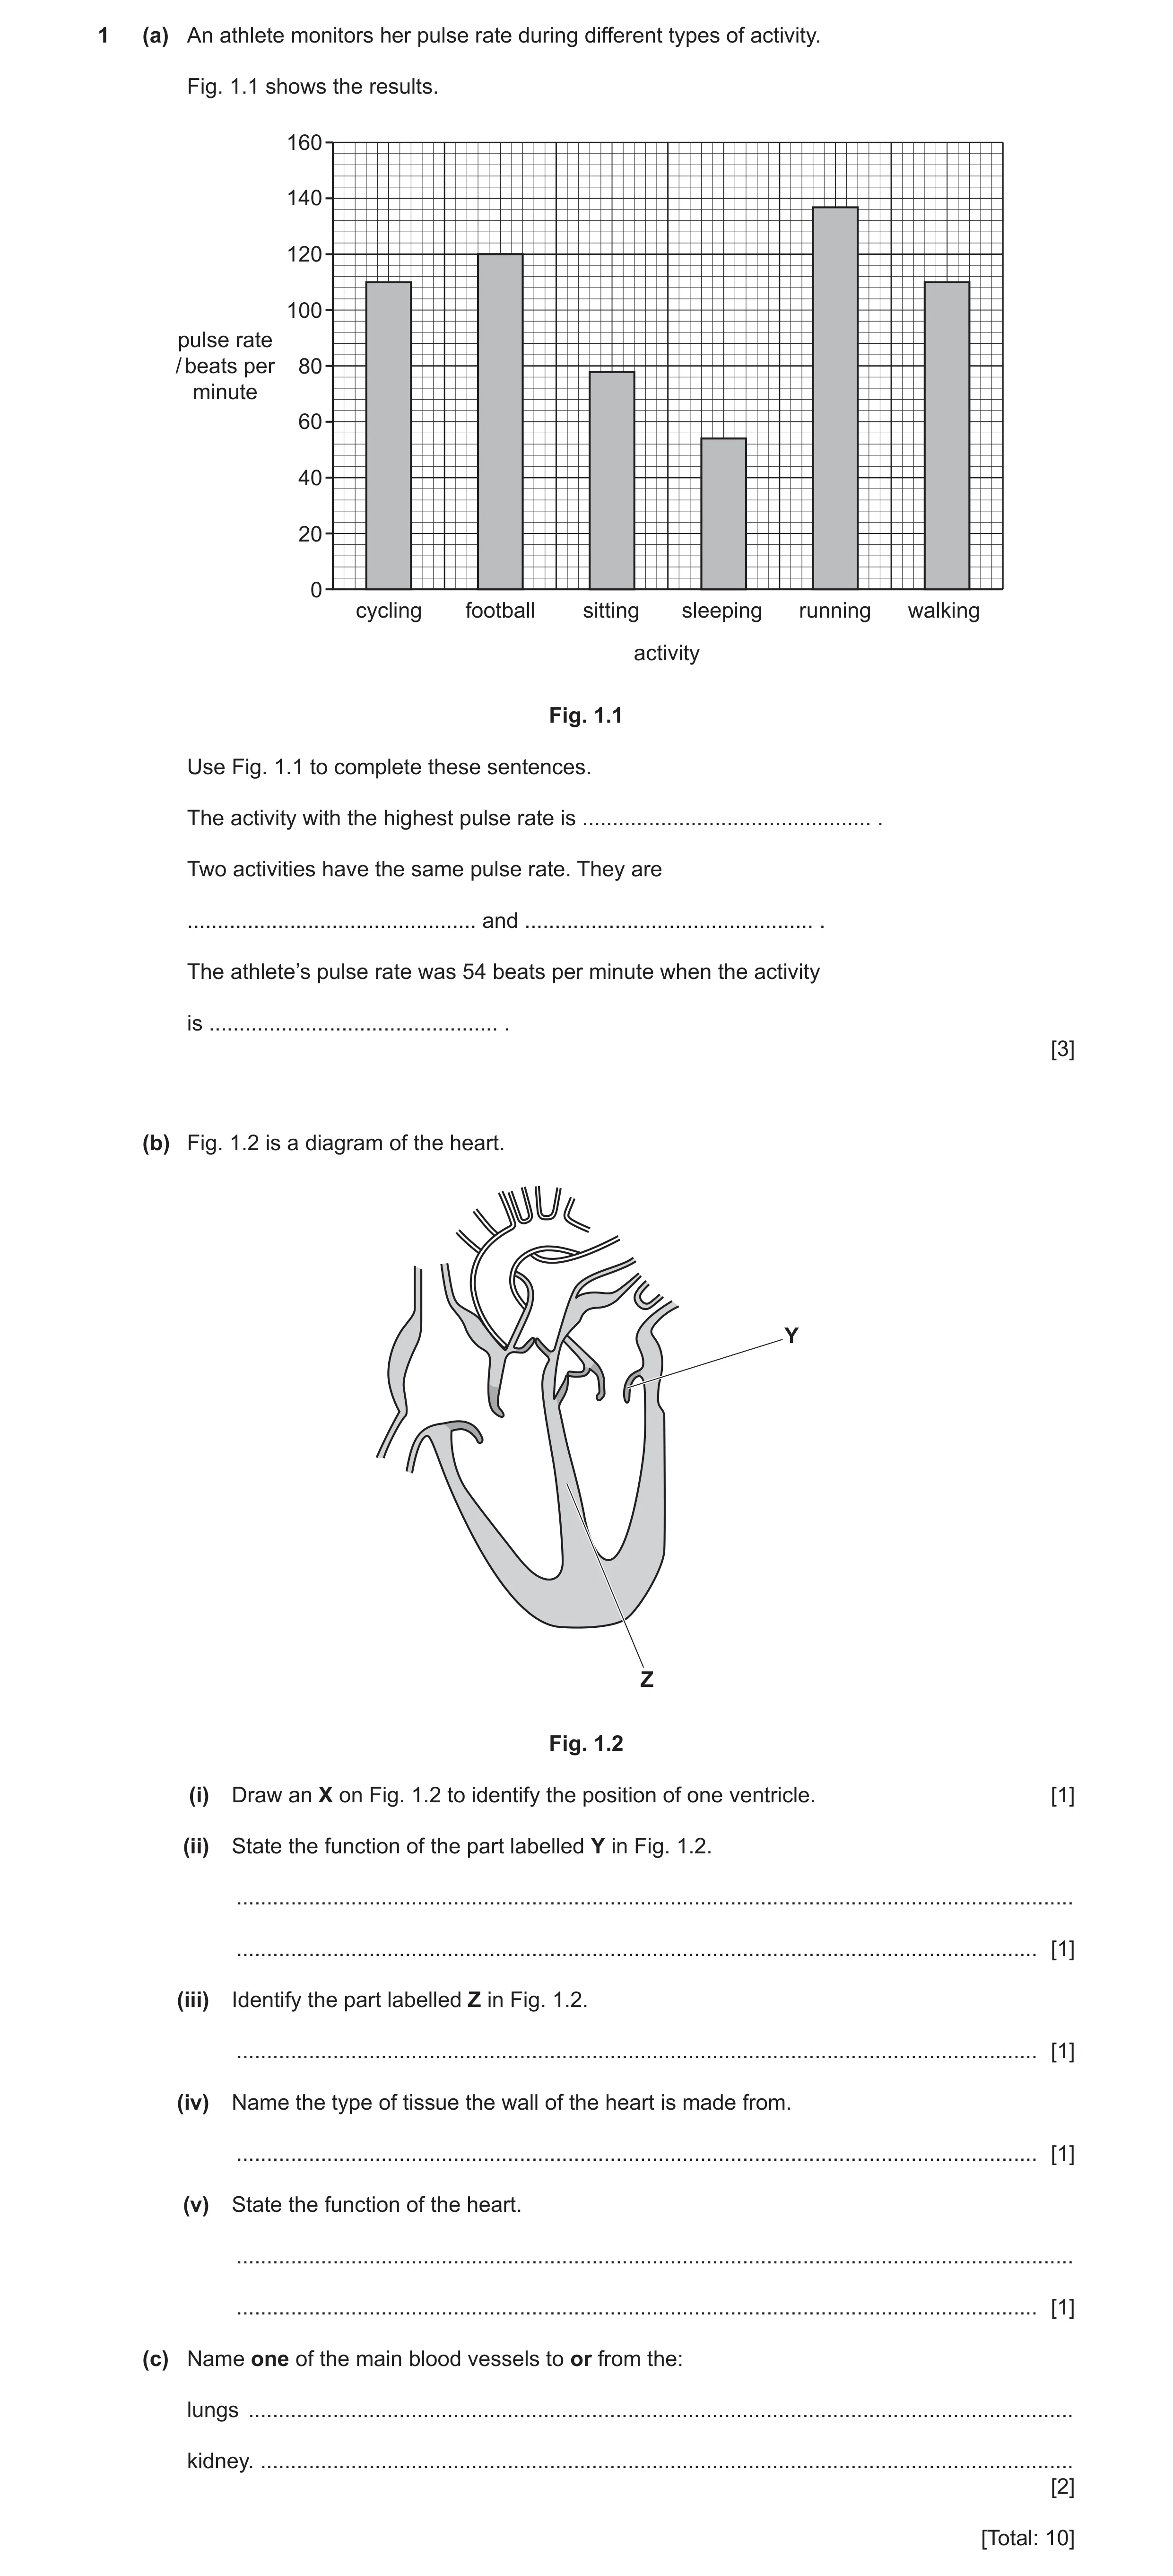
1 (a) An athlete monitors her pulse rate during different types of activity. Fig. 1.1 shows the results. 160 140 120 100 pulse rate / beats per 80 minute 60 40 20 0 cycling football sitting sleeping running walking activity Fig. 1.1 Use Fig. 1.1 to complete these sentences. The activity with the highest pulse rate is … . Two activities have the same pulse rate. They are … and … . The athlete’s pulse rate was 54 beats per minute when the activity is … . [3] (b) Fig. 1.2 is a diagram of the heart. Y Z Fig. 1.2 (i) Draw an X on Fig. 1.2 to identify the position of one ventricle. [1] (ii) State the function of the part labelled Y in Fig. 1.2. … … [1] (iii) Identify the part labelled Z in Fig. 1.2. … [1] (iv) Name the type of tissue the wall of the heart is made from. … [1] (v) State the function of the heart. … … [1] (c) Name one of the main blood vessels to or from the: lungs … kidney. … [2] [Total: 10]
10 marks
Mark scheme: 1(a) running ; cycling and walking ; sleeping ; 3 1(b)(i) X on one of the ventricles ; 1 1(b)(ii) ensures one-way flow of the blood ; 1 1(b)(iii) septum ; 1 1(b)(iv) muscle ; 1 1(b)(v) pump blood (around the body) ; 1 1(c) lung – pulmonary, artery / vein ; kidney – renal, artery / vein ; 2
This question in 0654/31 May/June 2022
Q7 · The number of new infections of HIV each year in one country is recorded 0654/32 May/June 2023
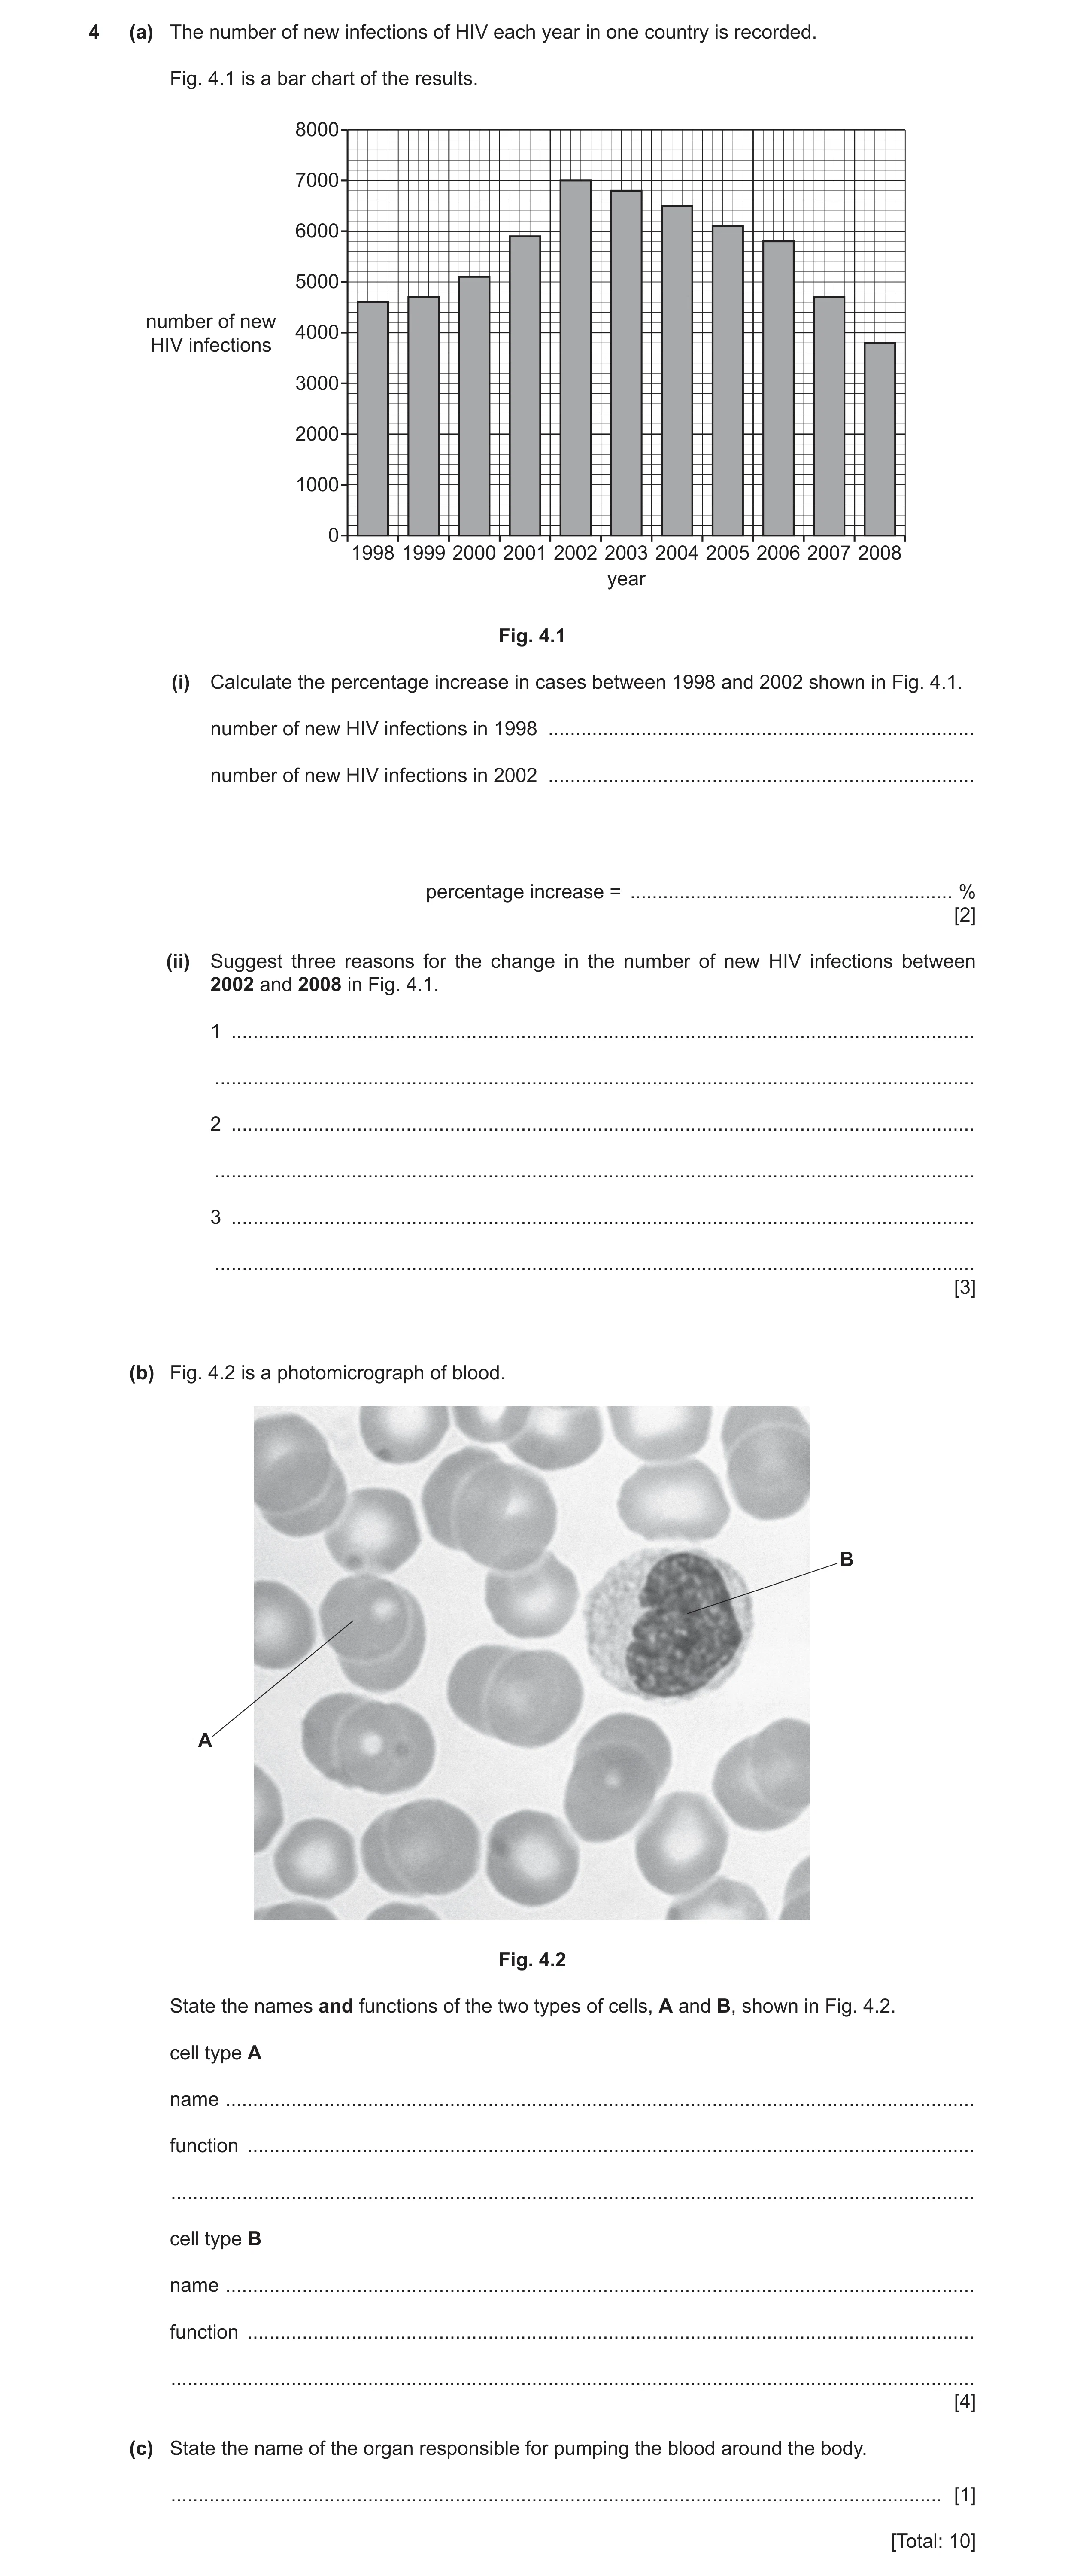
4 (a) The number of new infections of HIV each year in one country is recorded. Fig. 4.1 is a bar chart of the results. 8000 7000 6000 5000 number of new 4000 HIV infections 3000 2000 1000 0 1998 1999 2000 2001 2002 2003 2004 2005 2006 2007 2008 year Fig. 4.1 (i) Calculate the percentage increase in cases between 1998 and 2002 shown in Fig. 4.1. number of new HIV infections in 1998 … number of new HIV infections in 2002 … percentage increase = … % [2] (ii) Suggest three reasons for the change in the number of new HIV infections between 2002 and 2008 in Fig. 4.1. 1 … … 2 … … 3 … … [3] (b) Fig. 4.2 is a photomicrograph of blood. B A Fig. 4.2 State the names and functions of the two types of cells, A and B, shown in Fig. 4.2. cell type A name … function … … cell type B name … function … … [4] (c) State the name of the organ responsible for pumping the blood around the body. … [1] [Total: 10]
10 marks
Mark scheme: 4(a)(i) infections in 1998 – 4600 and infections in 2002 – 7000 ; ((7000 – 4600) / 4600) 100 = 52 ; 2 4(a)(ii) any three from: increased education / awareness ; use of condoms ; screening of blood transfusions ; use of clean needles ; increased screening ; AVP ; 3 4(b) cell type A red blood cell ; transport of oxygen ; cell type B white blood cell ; production of antibodies / phagocytosis ; 4 4(c) heart ; 1
This question in 0654/32 May/June 2023
Q8 · The number of new infections of HIV each year in one country is recorded 0654/33 May/June 2023
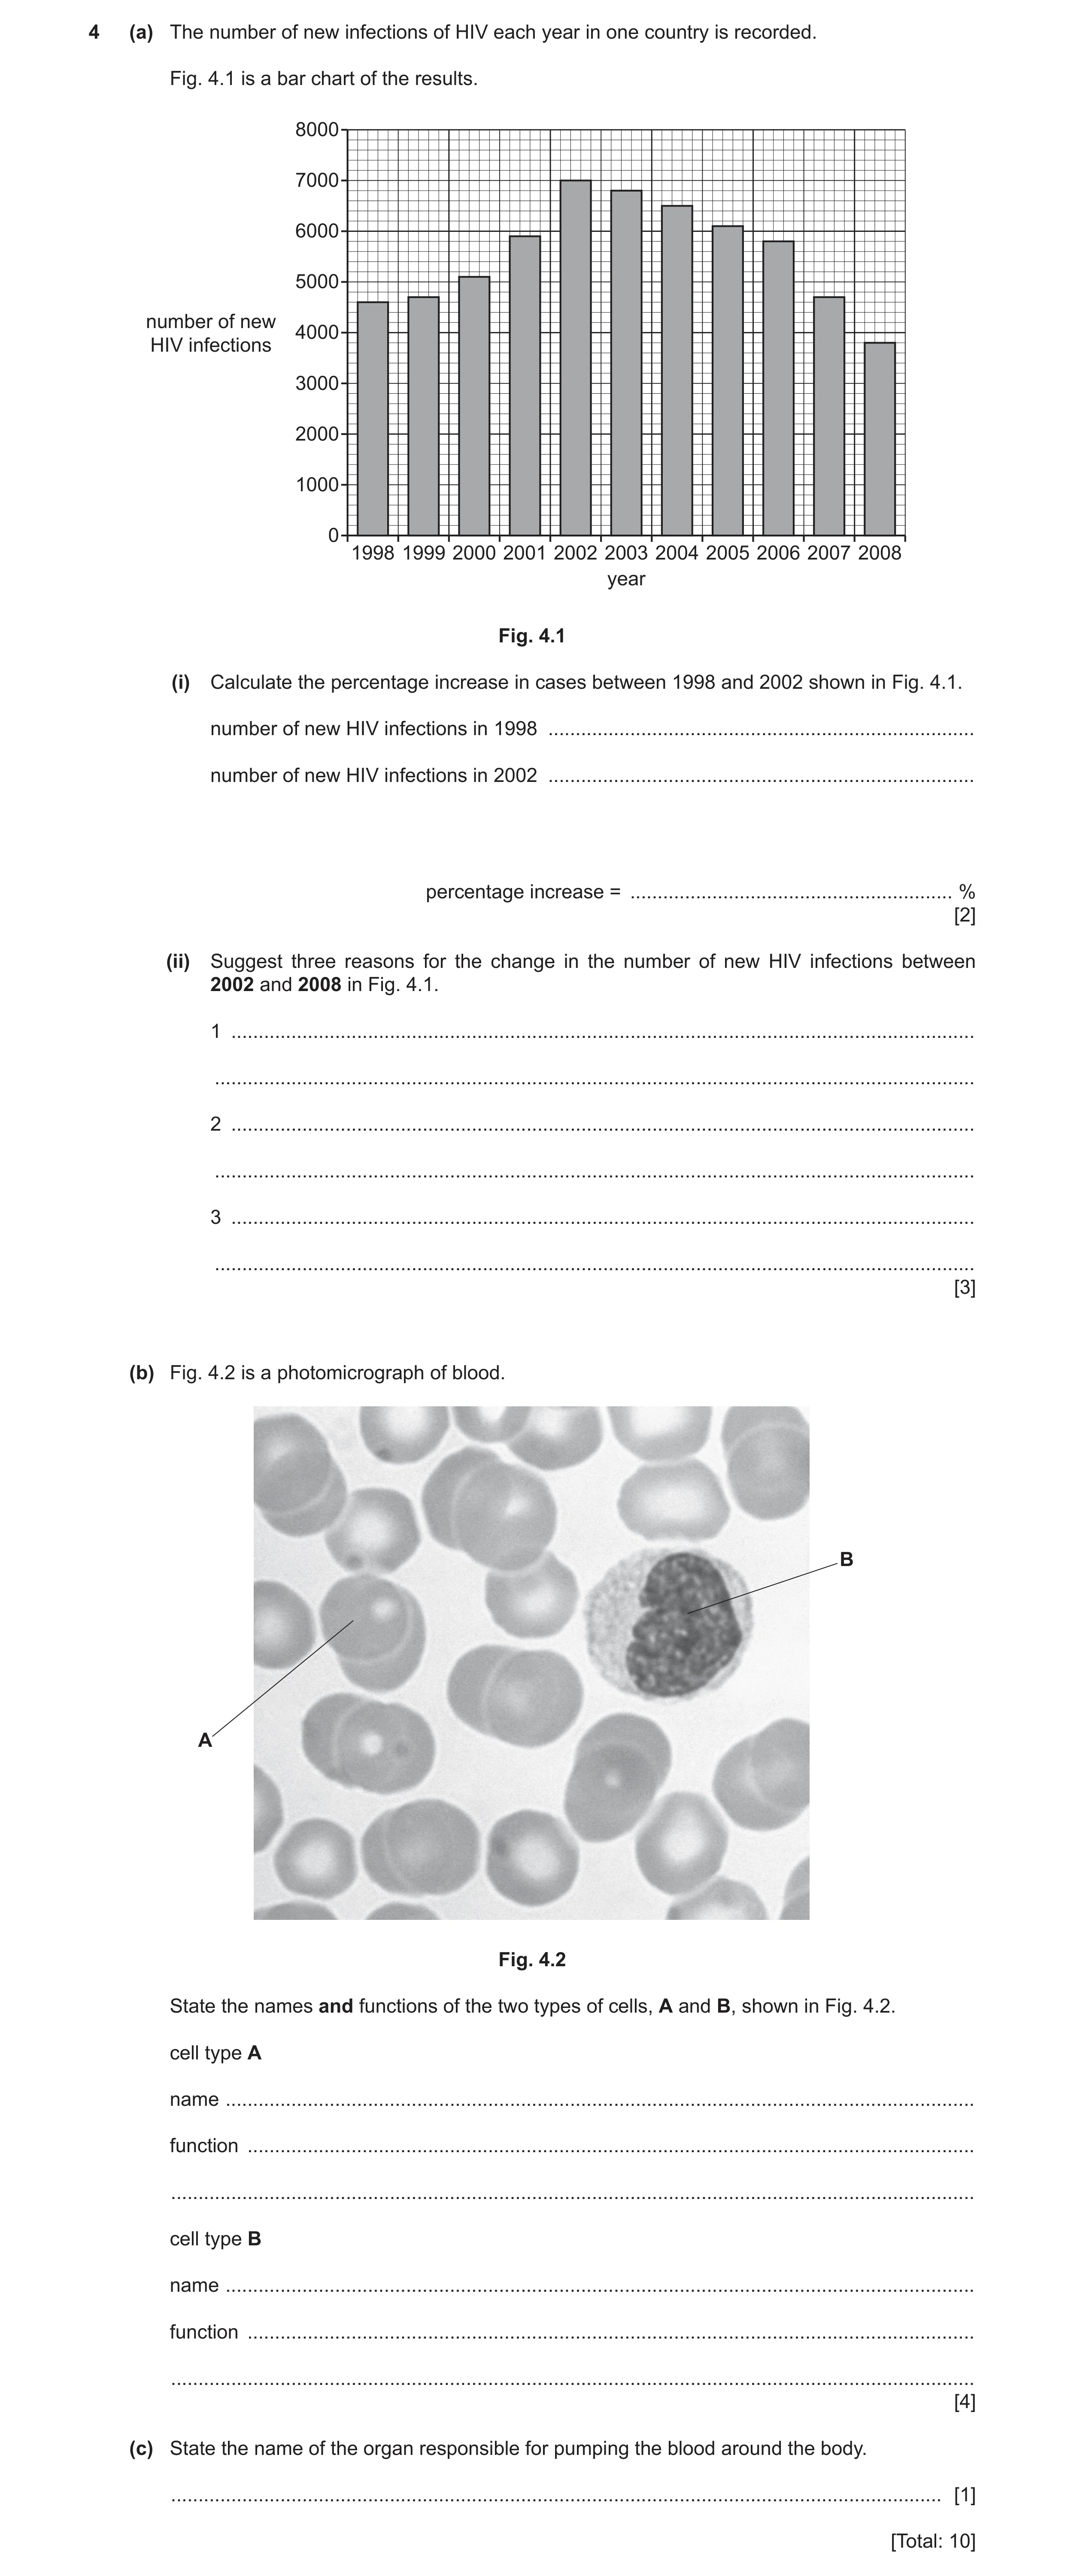
4 (a) The number of new infections of HIV each year in one country is recorded. Fig. 4.1 is a bar chart of the results. 8000 7000 6000 5000 number of new 4000 HIV infections 3000 2000 1000 0 1998 1999 2000 2001 2002 2003 2004 2005 2006 2007 2008 year Fig. 4.1 (i) Calculate the percentage increase in cases between 1998 and 2002 shown in Fig. 4.1. number of new HIV infections in 1998 … number of new HIV infections in 2002 … percentage increase = … % [2] (ii) Suggest three reasons for the change in the number of new HIV infections between 2002 and 2008 in Fig. 4.1. 1 … … 2 … … 3 … … [3] (b) Fig. 4.2 is a photomicrograph of blood. B A Fig. 4.2 State the names and functions of the two types of cells, A and B, shown in Fig. 4.2. cell type A name … function … … cell type B name … function … … [4] (c) State the name of the organ responsible for pumping the blood around the body. … [1] [Total: 10]
10 marks
Mark scheme: 4(a)(i) infections in 1998 – 4600 and infections in 2002 – 7000 ; ((7000 – 4600) / 4600) 100 = 52 ; 2 4(a)(ii) any three from: increased education / awareness ; use of condoms ; screening of blood transfusions ; use of clean needles ; increased screening ; AVP ; 3 4(b) cell type A red blood cell ; transport of oxygen ; cell type B white blood cell ; production of antibodies / phagocytosis ; 4 4(c) heart ; 1
This question in 0654/33 May/June 2023
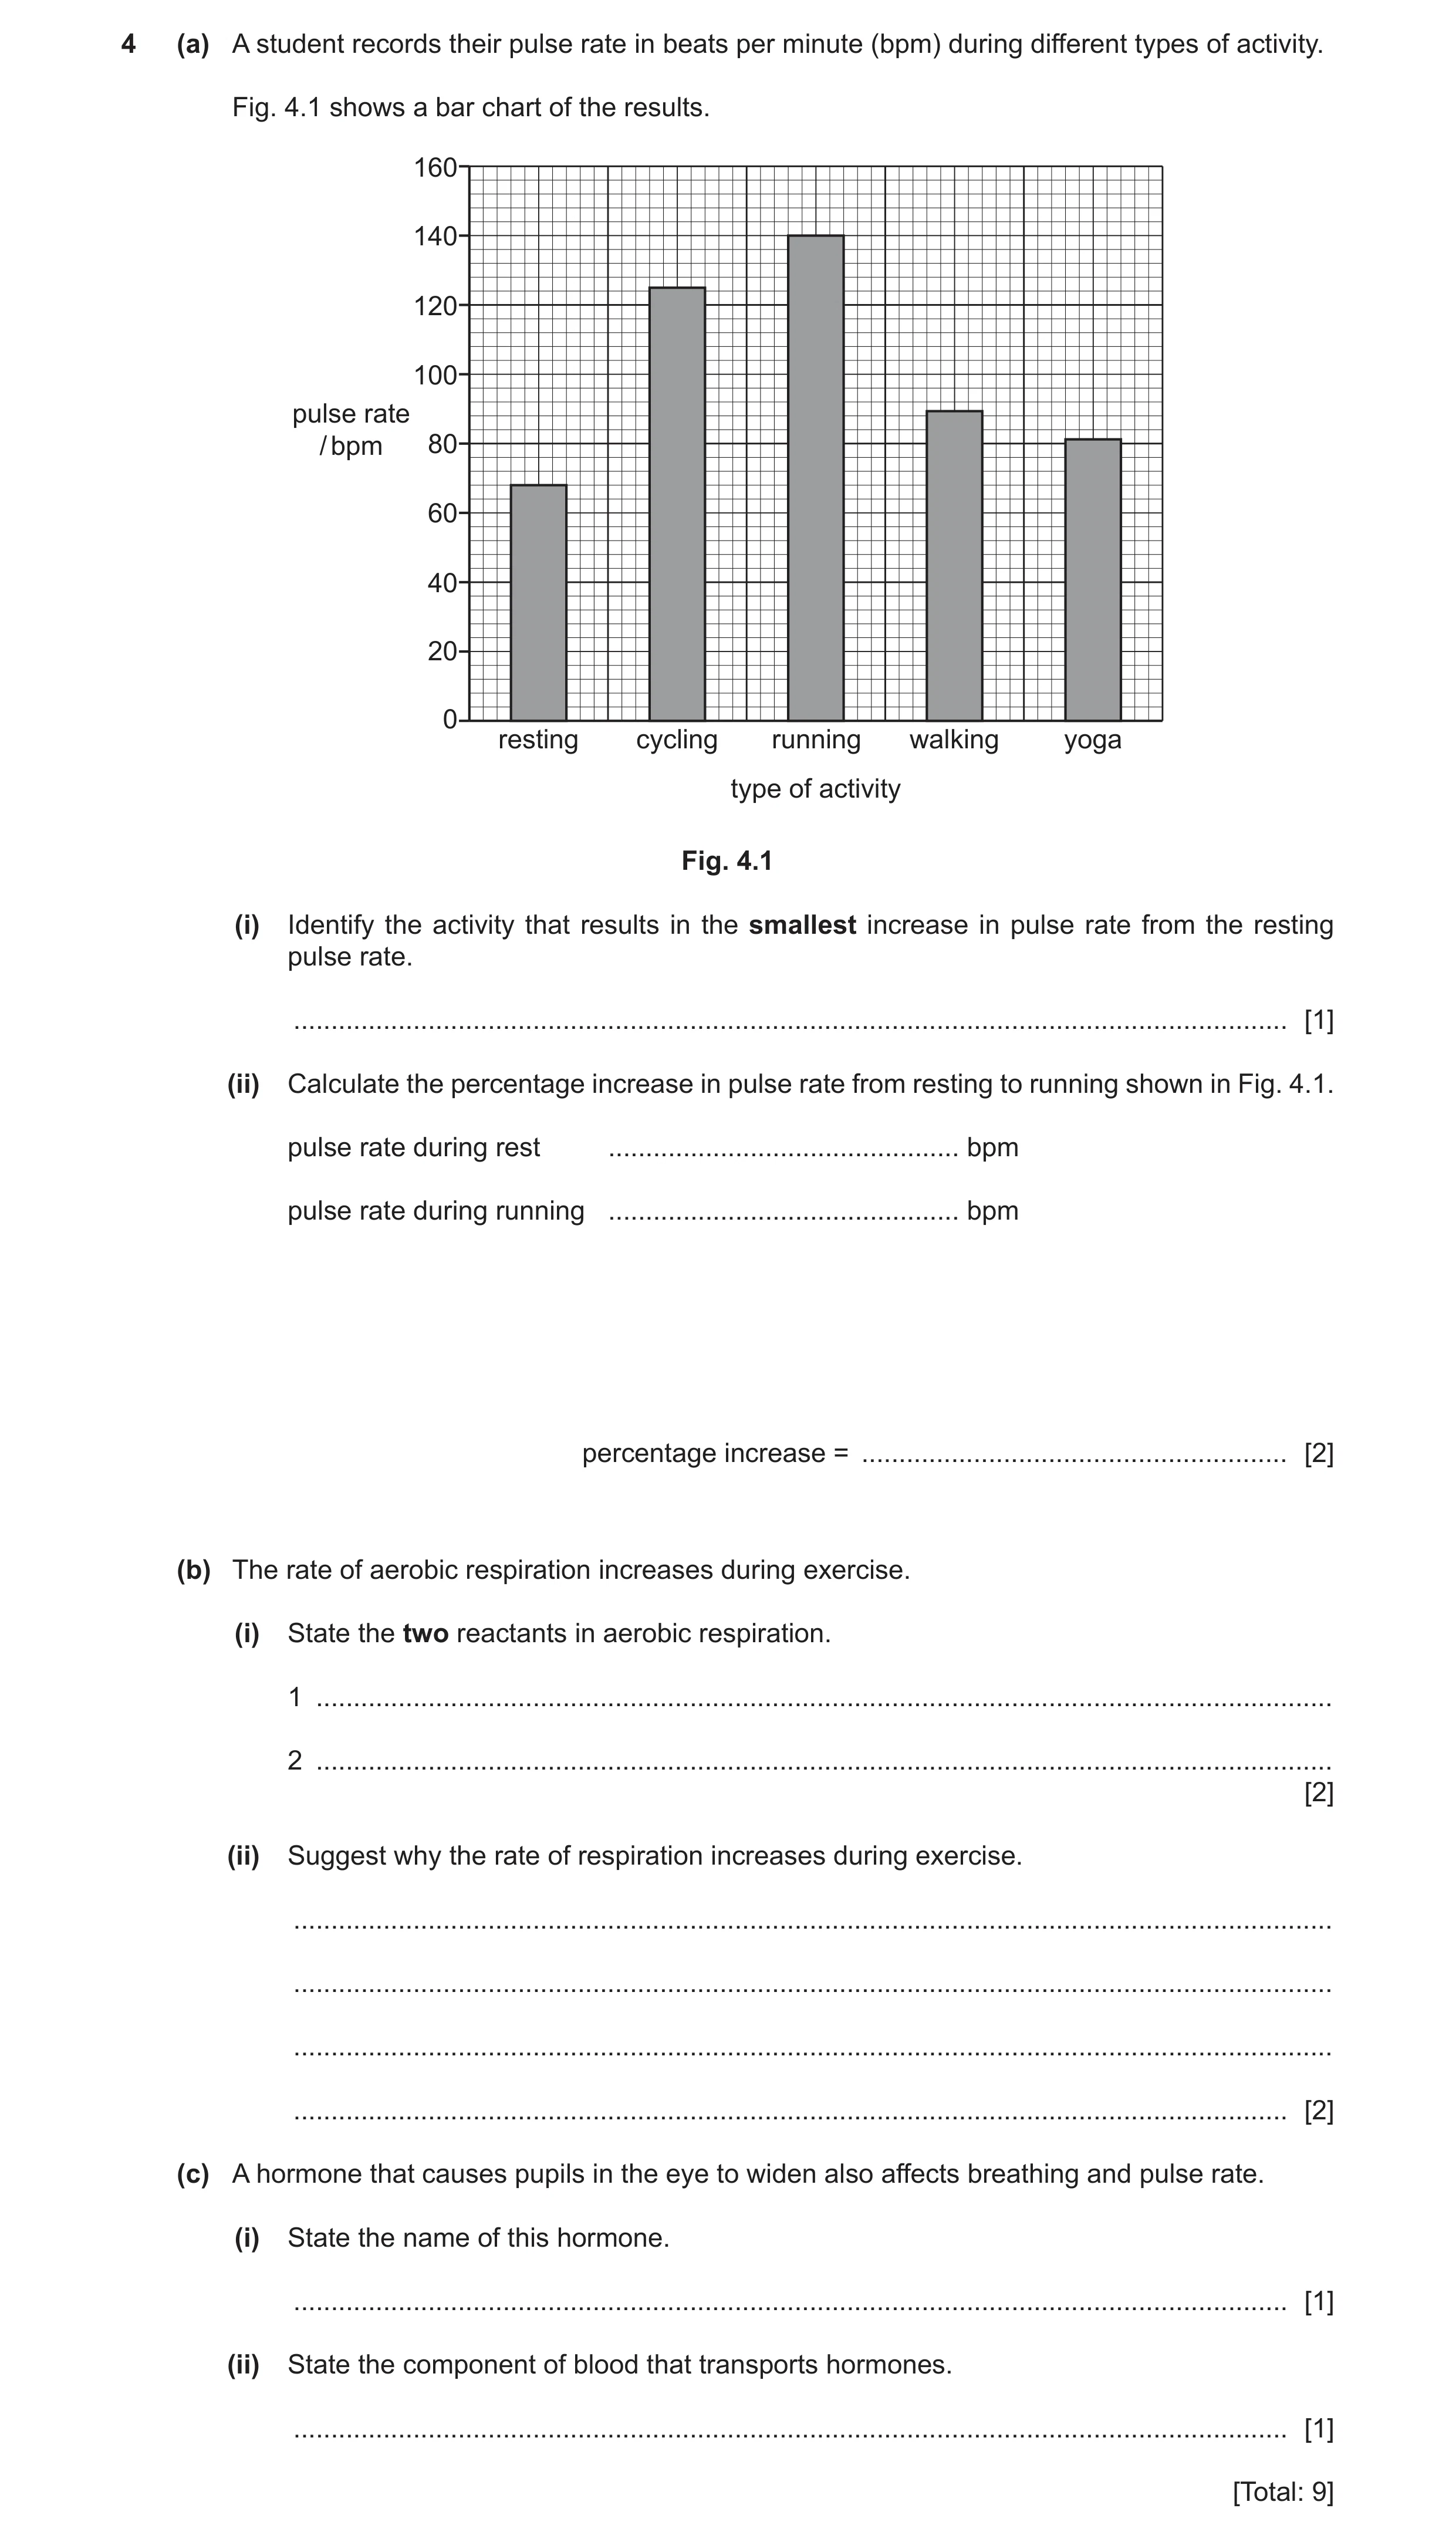
Q9 · A student records their pulse rate in beats per minute (bpm) during different types of… 0654/31 Oct/Nov 2023
4 (a) A student records their pulse rate in beats per minute (bpm) during different types of activity. Fig. 4.1 shows a bar chart of the results. 160 140 120 100 pulse rate / bpm 80 60 40 20 0 resting cycling running walking yoga type of activity Fig. 4.1 (i) Identify the activity that results in the smallest increase in pulse rate from the resting pulse rate. … [1] (ii) Calculate the percentage increase in pulse rate from resting to running shown in Fig. 4.1. pulse rate during rest … bpm pulse rate during running … bpm percentage increase = … [2] (b) The rate of aerobic respiration increases during exercise. (i) State the two reactants in aerobic respiration. 1 … 2 … [2] (ii) Suggest why the rate of respiration increases during exercise. … … … … [2] (c) A hormone that causes pupils in the eye to widen also affects breathing and pulse rate. (i) State the name of this hormone. … [1] (ii) State the component of blood that transports hormones. … [1] [Total: 9]
9 marks
Mark scheme: 4(a)(i) yoga ; 1 4(a)(ii) pulse rate at rest – 68 and pulse rate during running – 140 ; 2 ((140 − 68) / 68) 100 = 106 ; 4(b)(i) glucose ; 2 oxygen ; 4(b)(ii) any two from: 2 more energy is required ; for muscle contraction ; (aerobic) respiration releases energy ; 4(c)(i) adrenaline ; 1 4(c)(ii) plasma ; 1
This question in 0654/31 Oct/Nov 2023
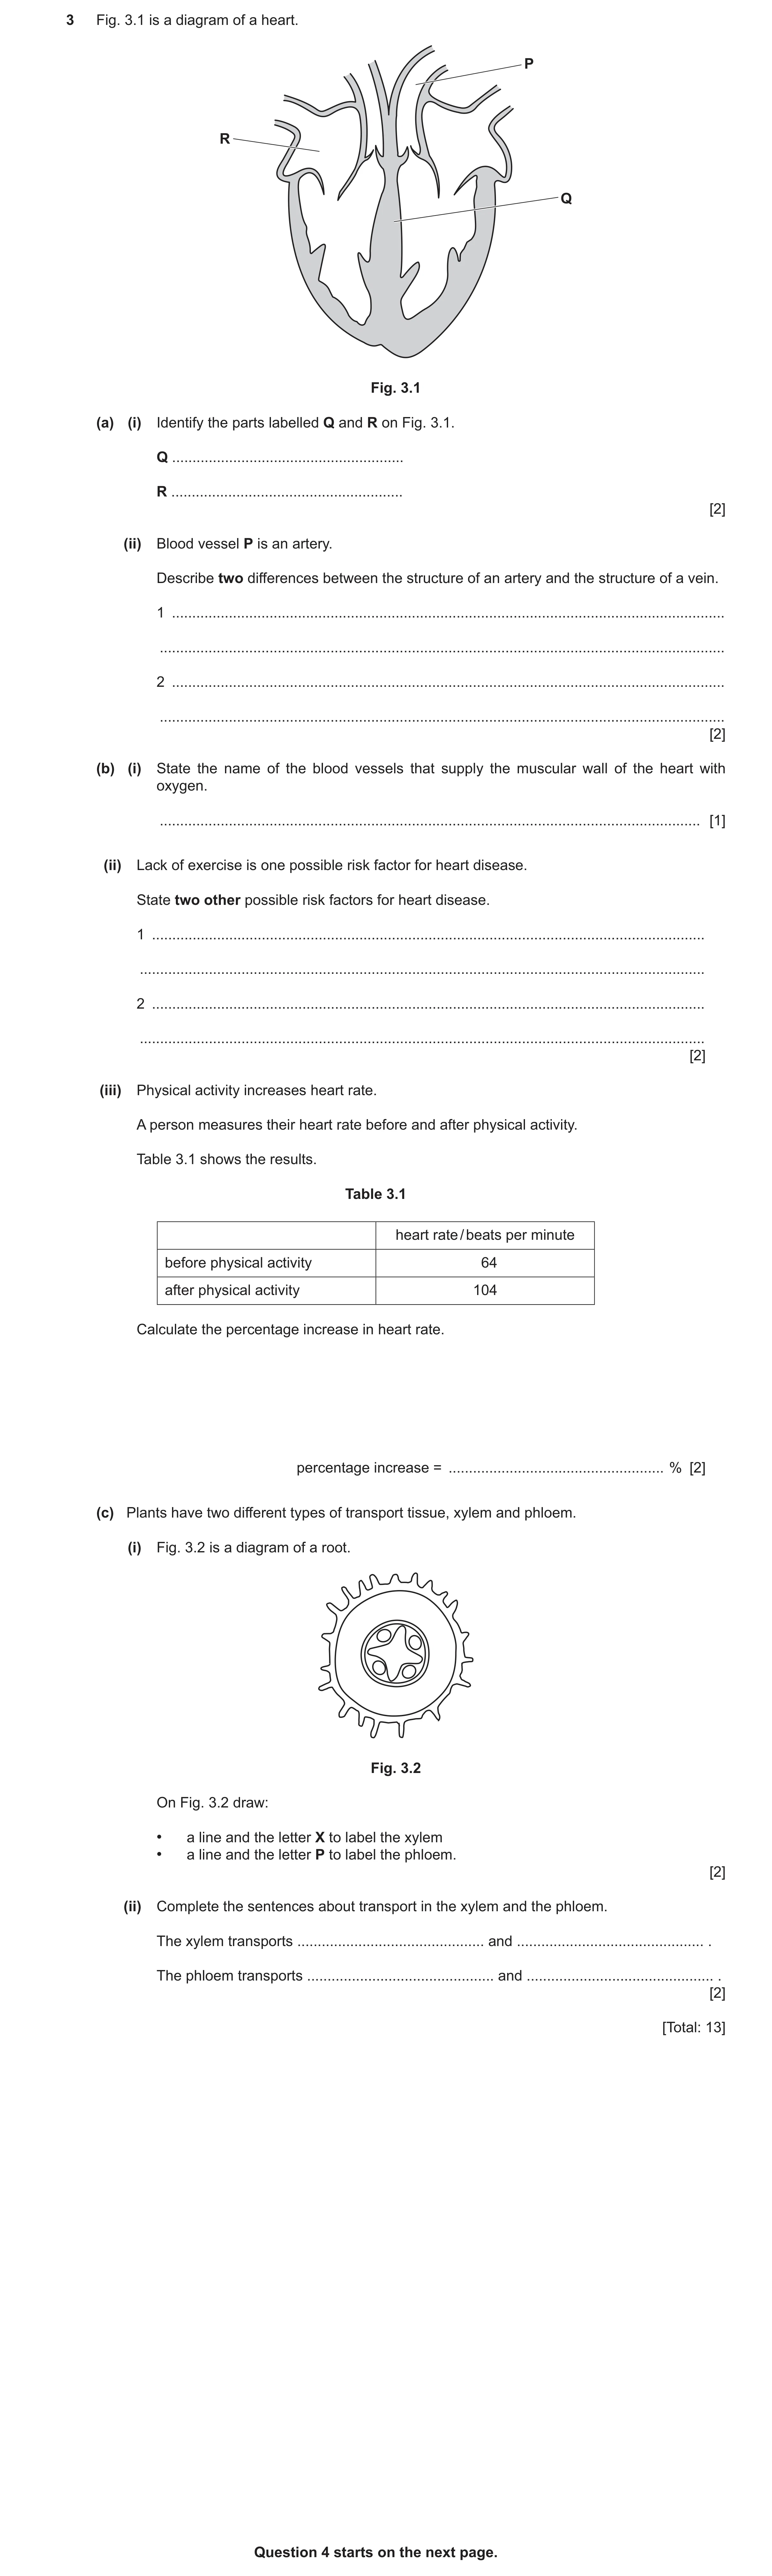
Q10 · A diagram of a heart 0654/31 Oct/Nov 2025
3 Fig. 3.1 is a diagram of a heart. P R Q Fig. 3.1 (a) (i) Identify the parts labelled Q and R on Fig. 3.1. Q … R … [2] (ii) Blood vessel P is an artery. Describe two differences between the structure of an artery and the structure of a vein. 1 … … 2 … … [2] (b) (i) State the name of the blood vessels that supply the muscular wall of the heart with oxygen. … [1] (ii) Lack of exercise is one possible risk factor for heart disease. State two other possible risk factors for heart disease. 1 … … 2 … … [2] (iii) Physical activity increases heart rate. A person measures their heart rate before and after physical activity. Table 3.1 shows the results. Table 3.1 heart rate / beats per minute before physical activity 64 after physical activity 104 Calculate the percentage increase in heart rate. percentage increase = … % [2] (c) Plants have two different types of transport tissue, xylem and phloem. (i) Fig. 3.2 is a diagram of a root. Fig. 3.2 On Fig. 3.2 draw: • a line and the letter X to label the xylem • a line and the letter P to label the phloem. [2] (ii) Complete the sentences about transport in the xylem and the phloem. The xylem transports … and … . The phloem transports … and … . [2] [Total: 13] Question 4 starts on the next page.
13 marks
Mark scheme: 3(a)(i) Q = septum ; 2 R = right atrium ; 3(a)(ii) any two from: 2 • artery has, smaller lumen / ORA ; • artery has, thicker wall / muscle / ORA ; • veins have valves / ORA ; 3(b)(i) coronary arteries ; 1 3(b)(ii) any two from: 2 • alcohol ; • smoking ; • obesity ; • diabetes ; • high blood pressure ; • diet ; • stress ; • genetic predisposition ; • age ; • sex ; 3(b)(iii) 104 − 64 2 100 = ; 64 63 (%) ; 3(c)(i) 2 X P 1 mark for each correct label 3(c)(ii) xylem – water and mineral ions ; 2 phloem – sucrose and amino acids ;
This question in 0654/31 Oct/Nov 2025
 1 / 18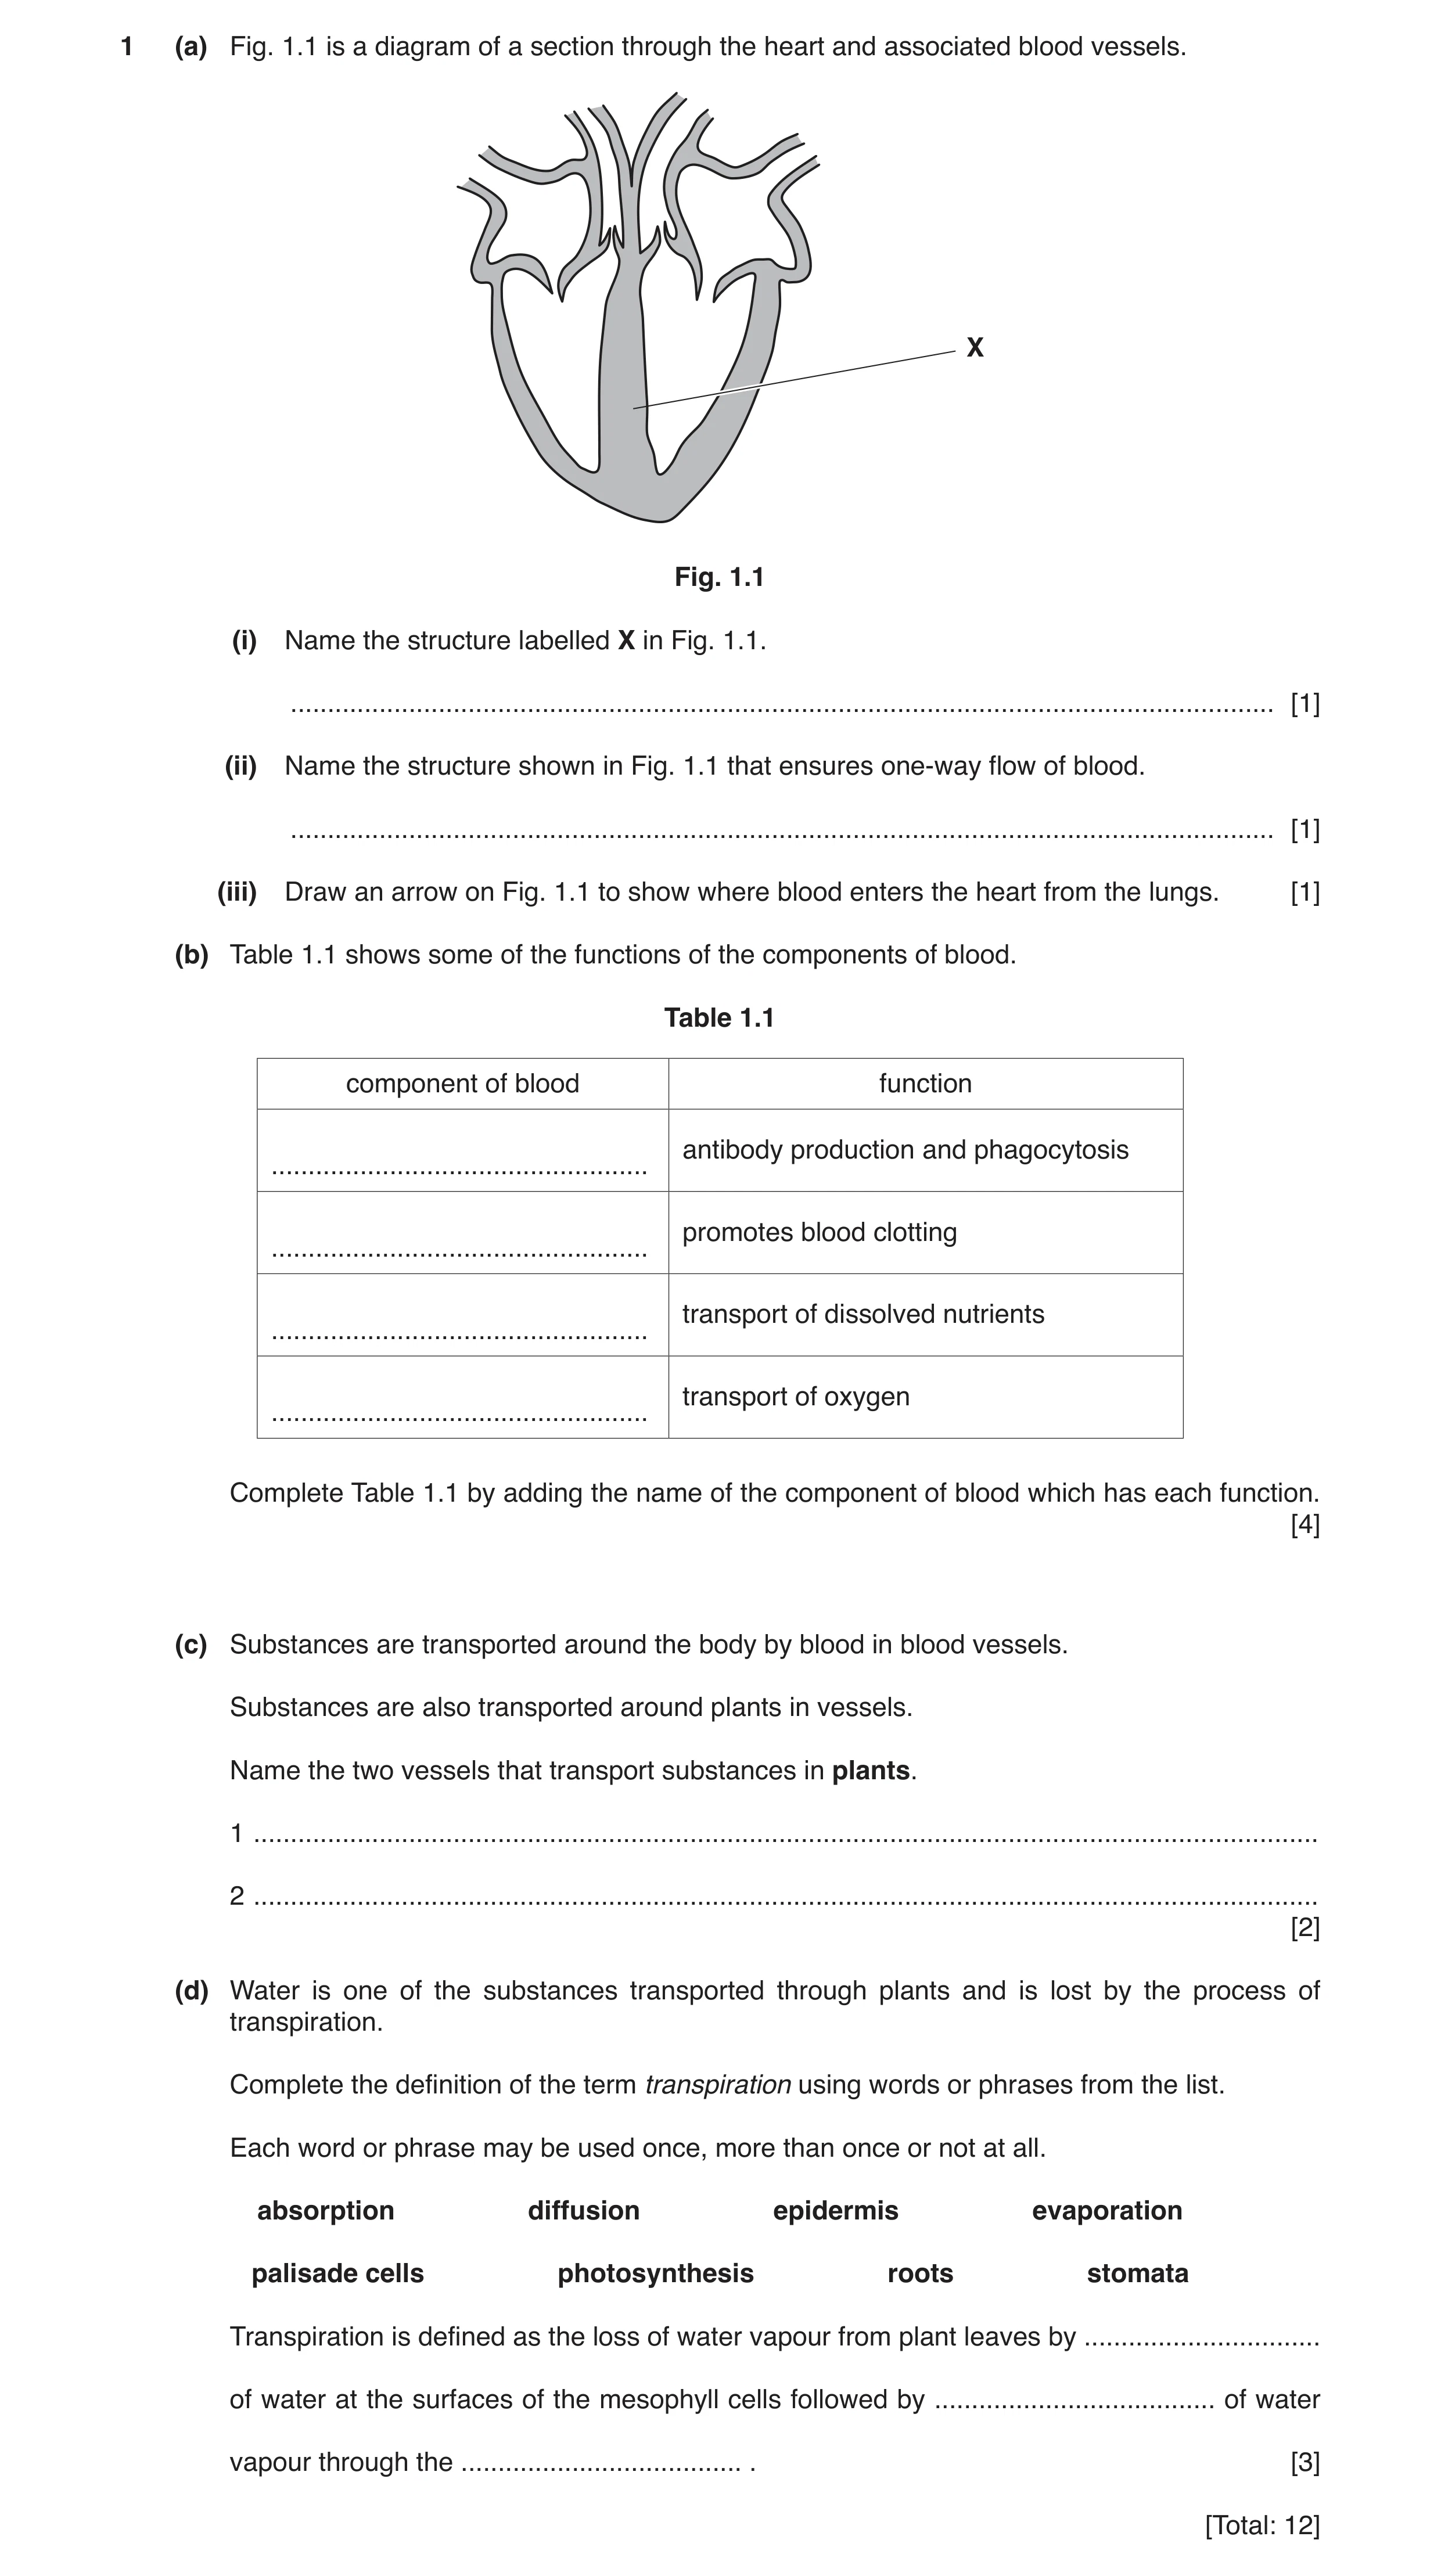
 6
6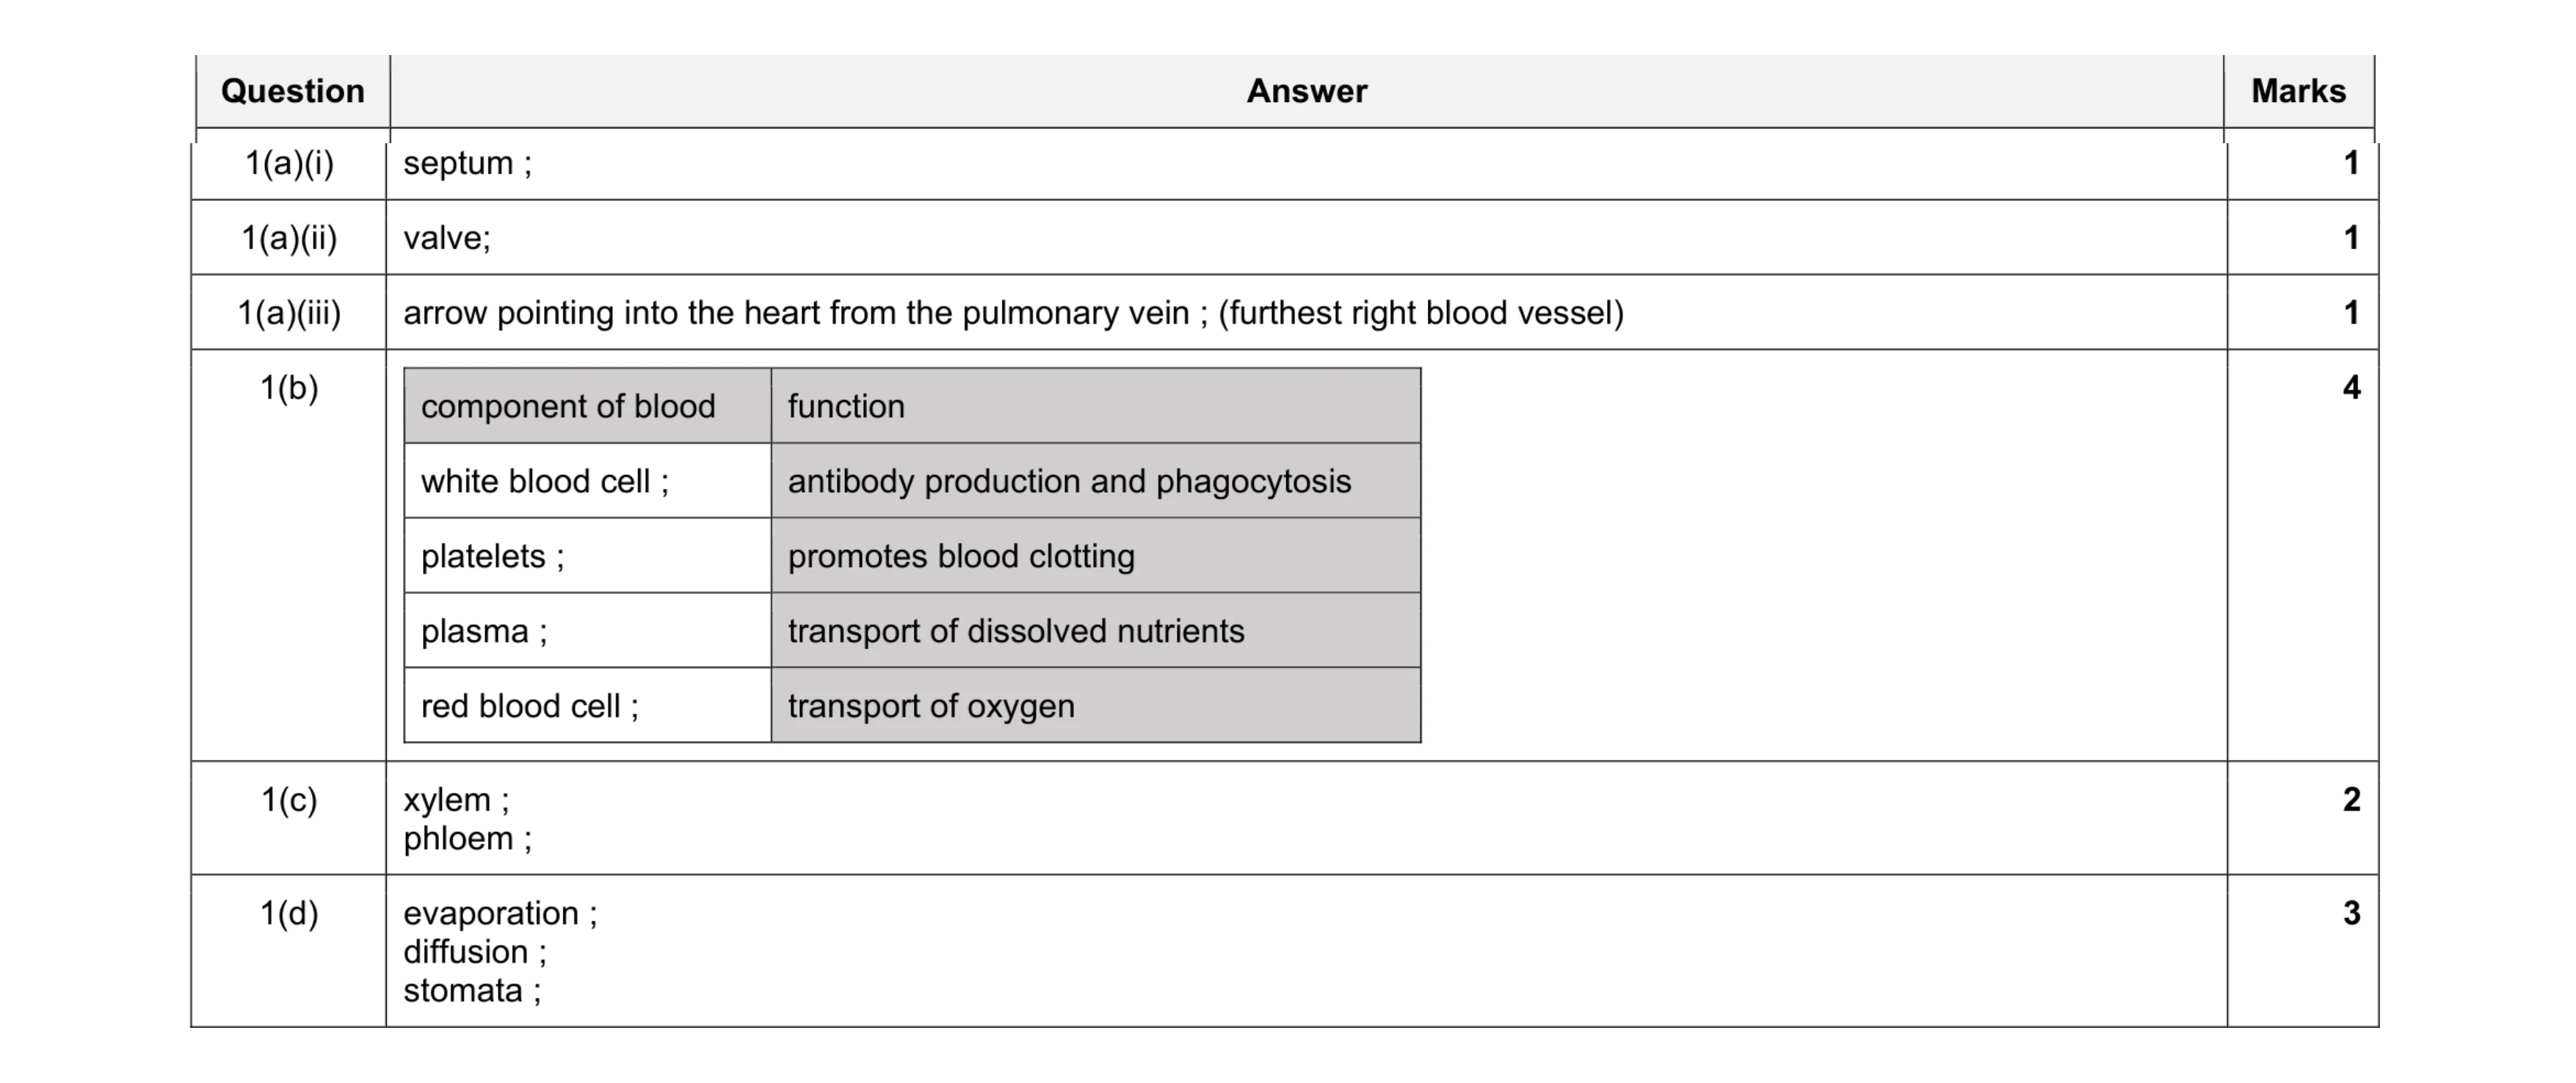 12
12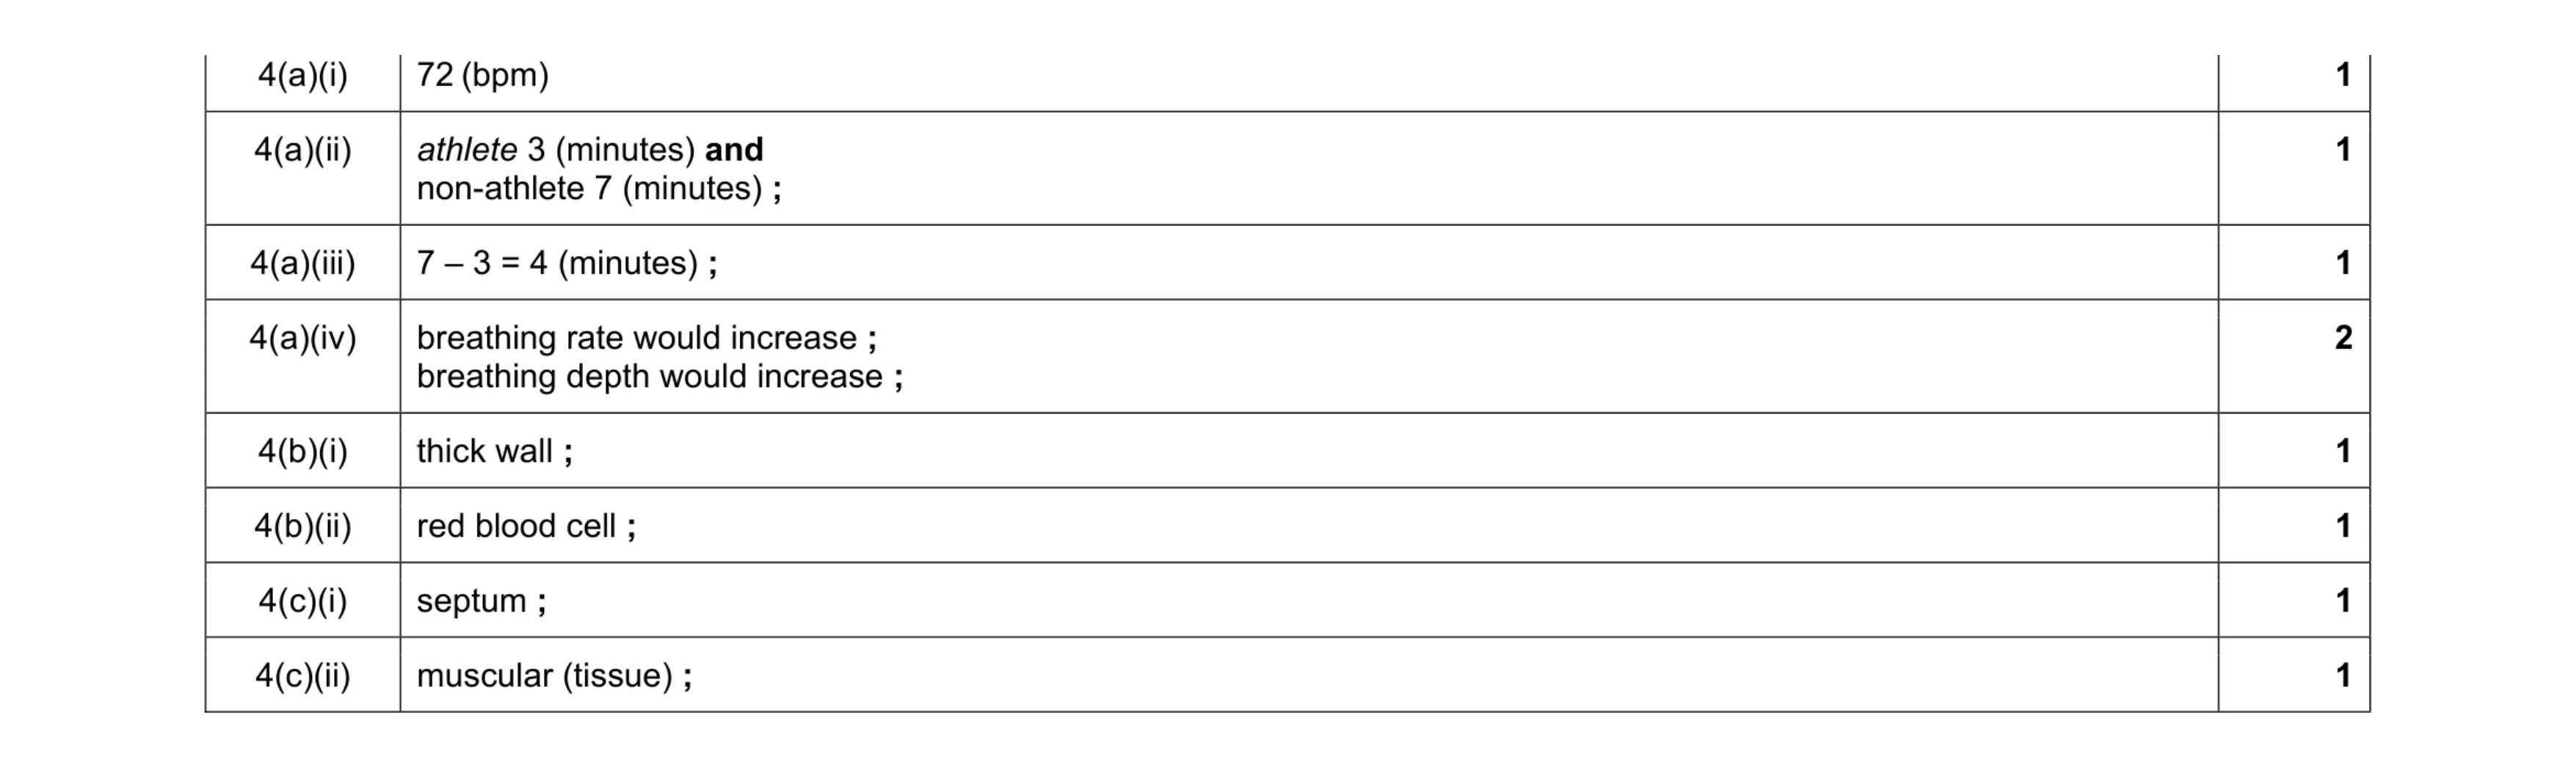 9
9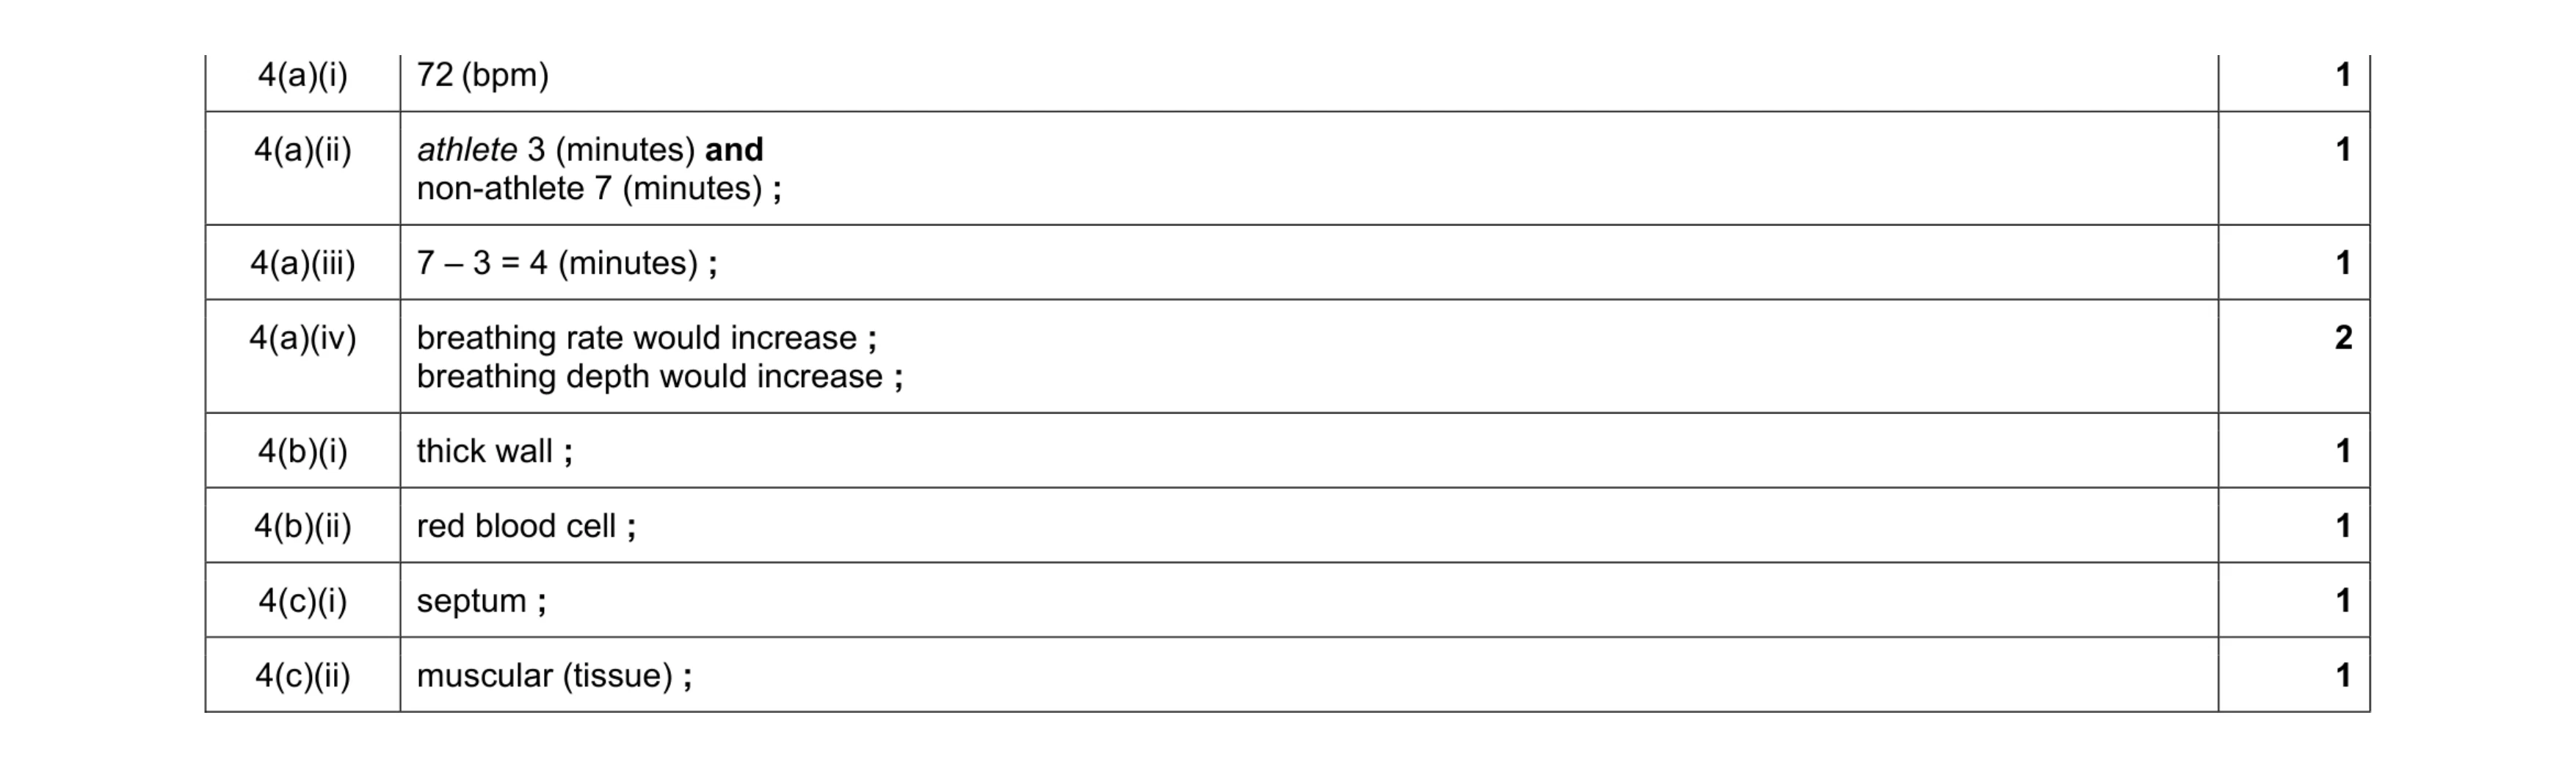 9
9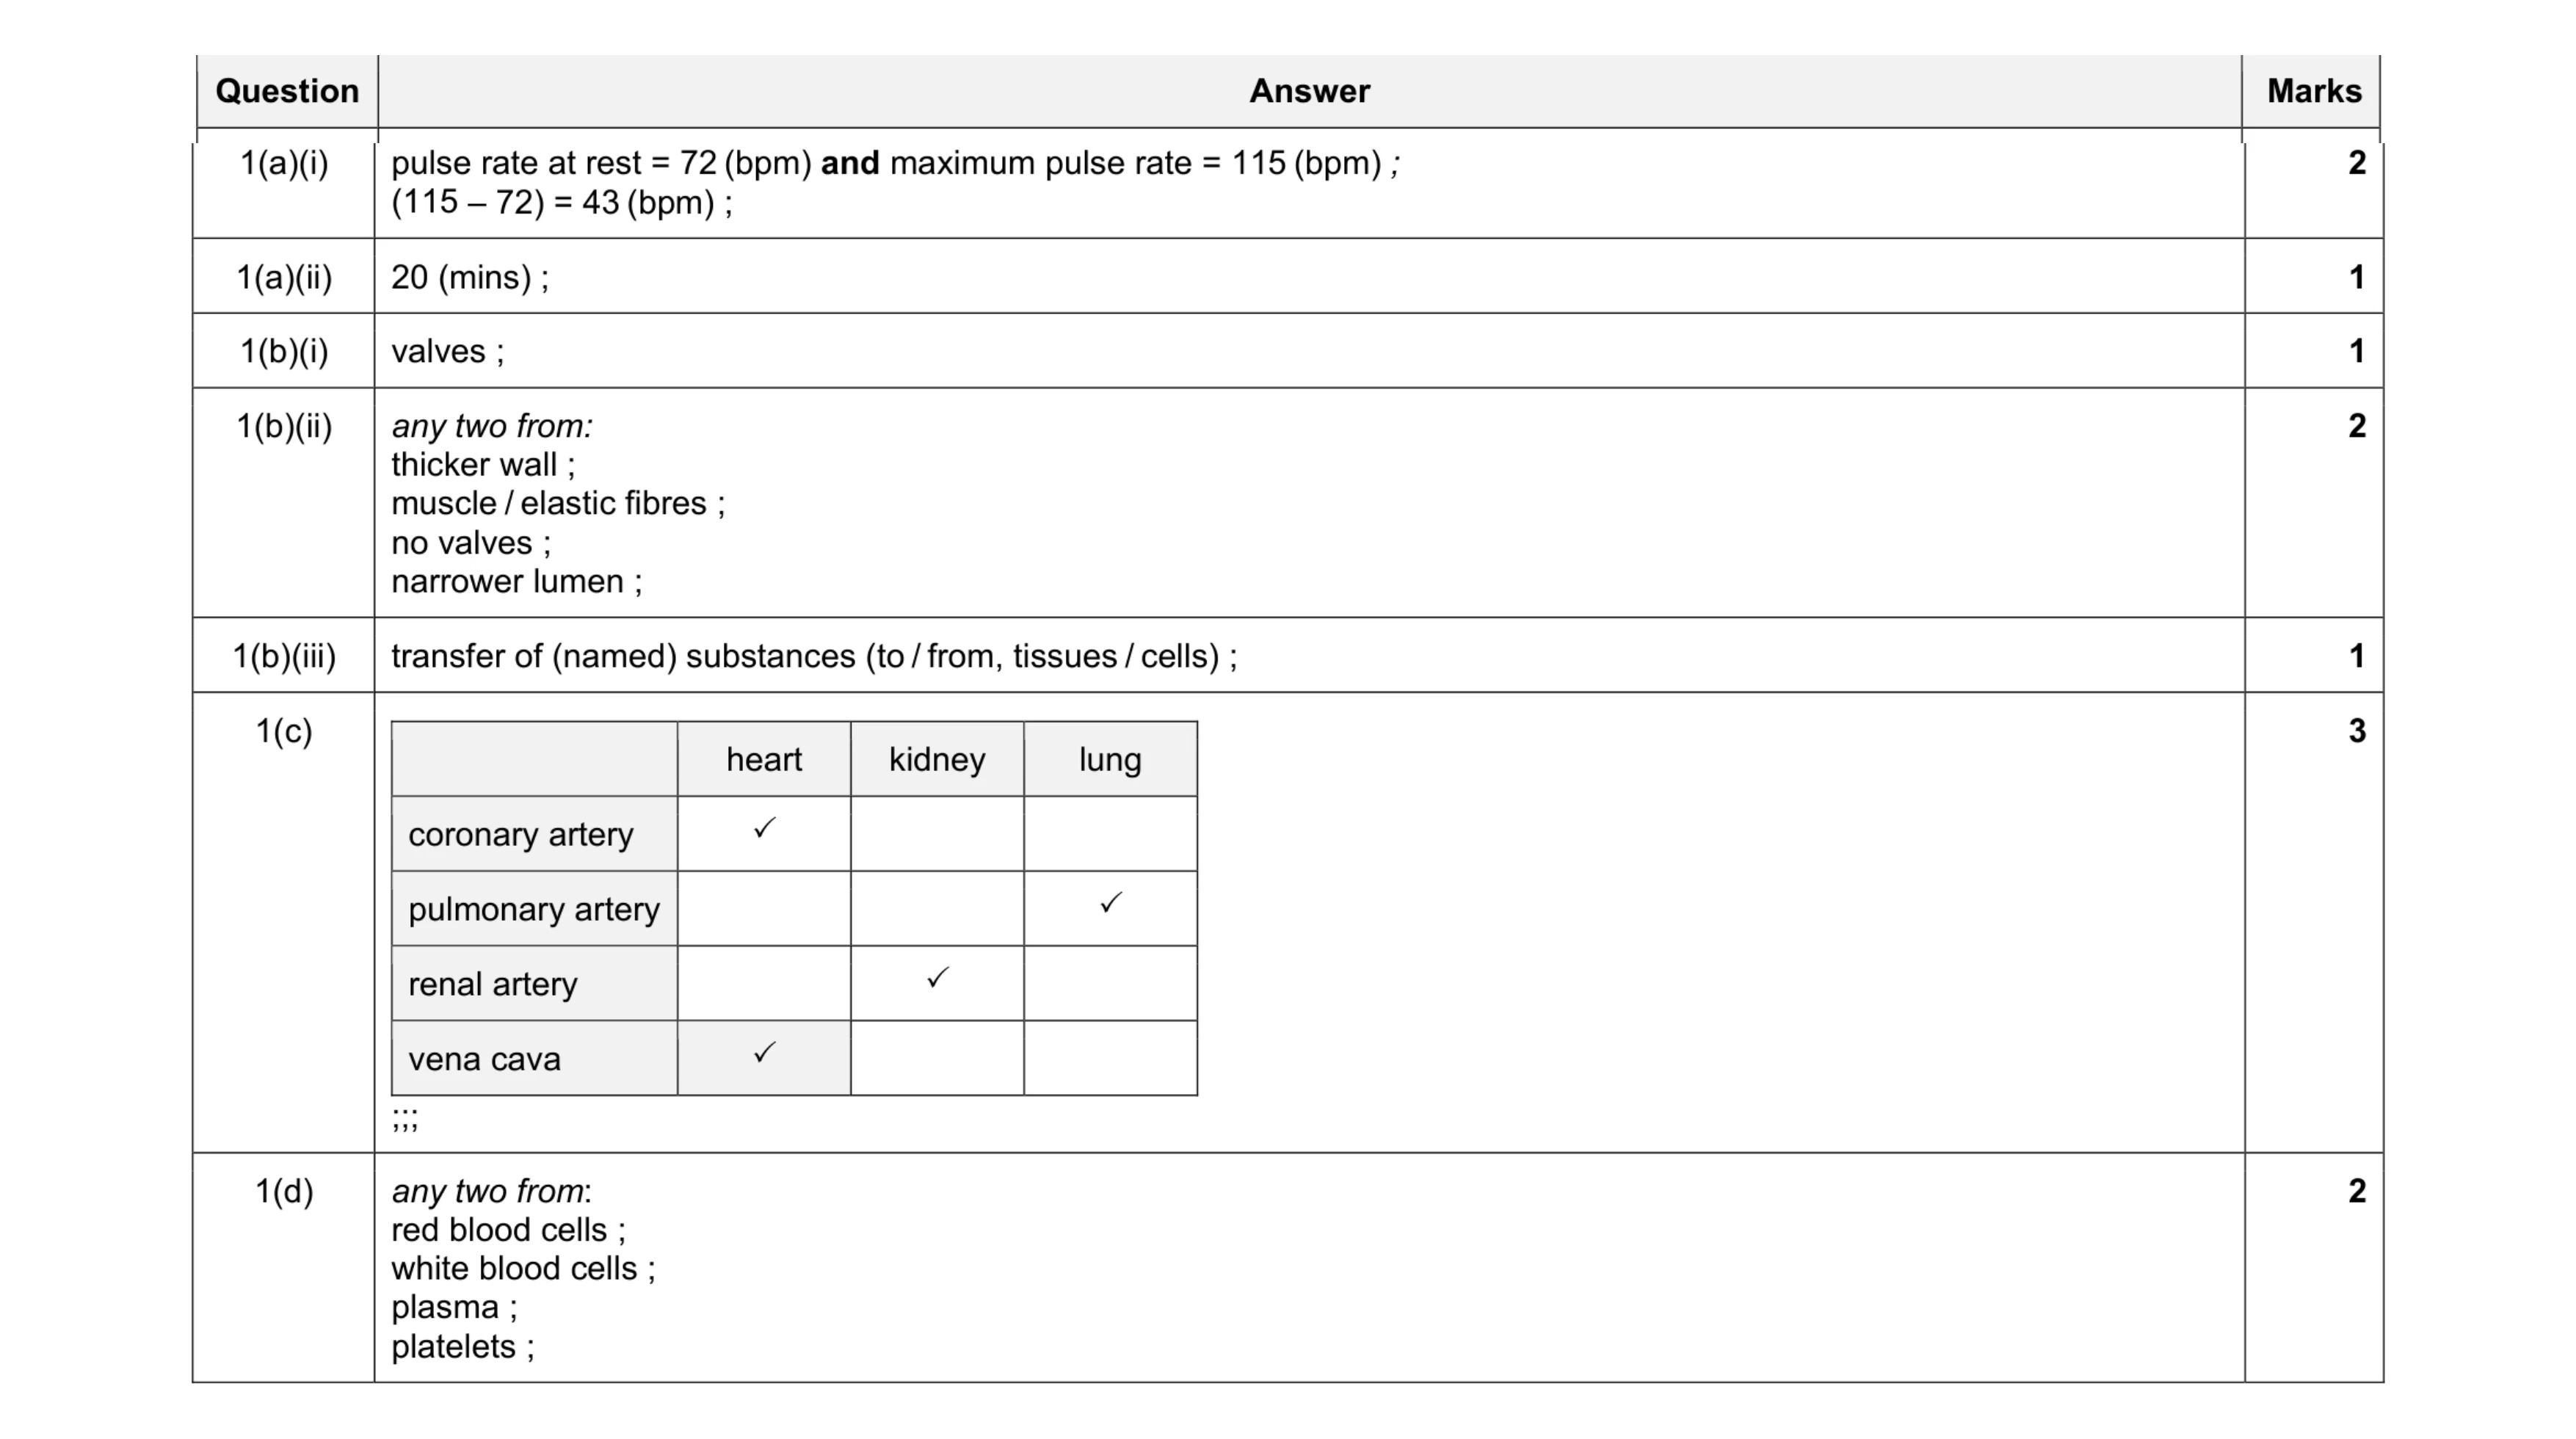 12
12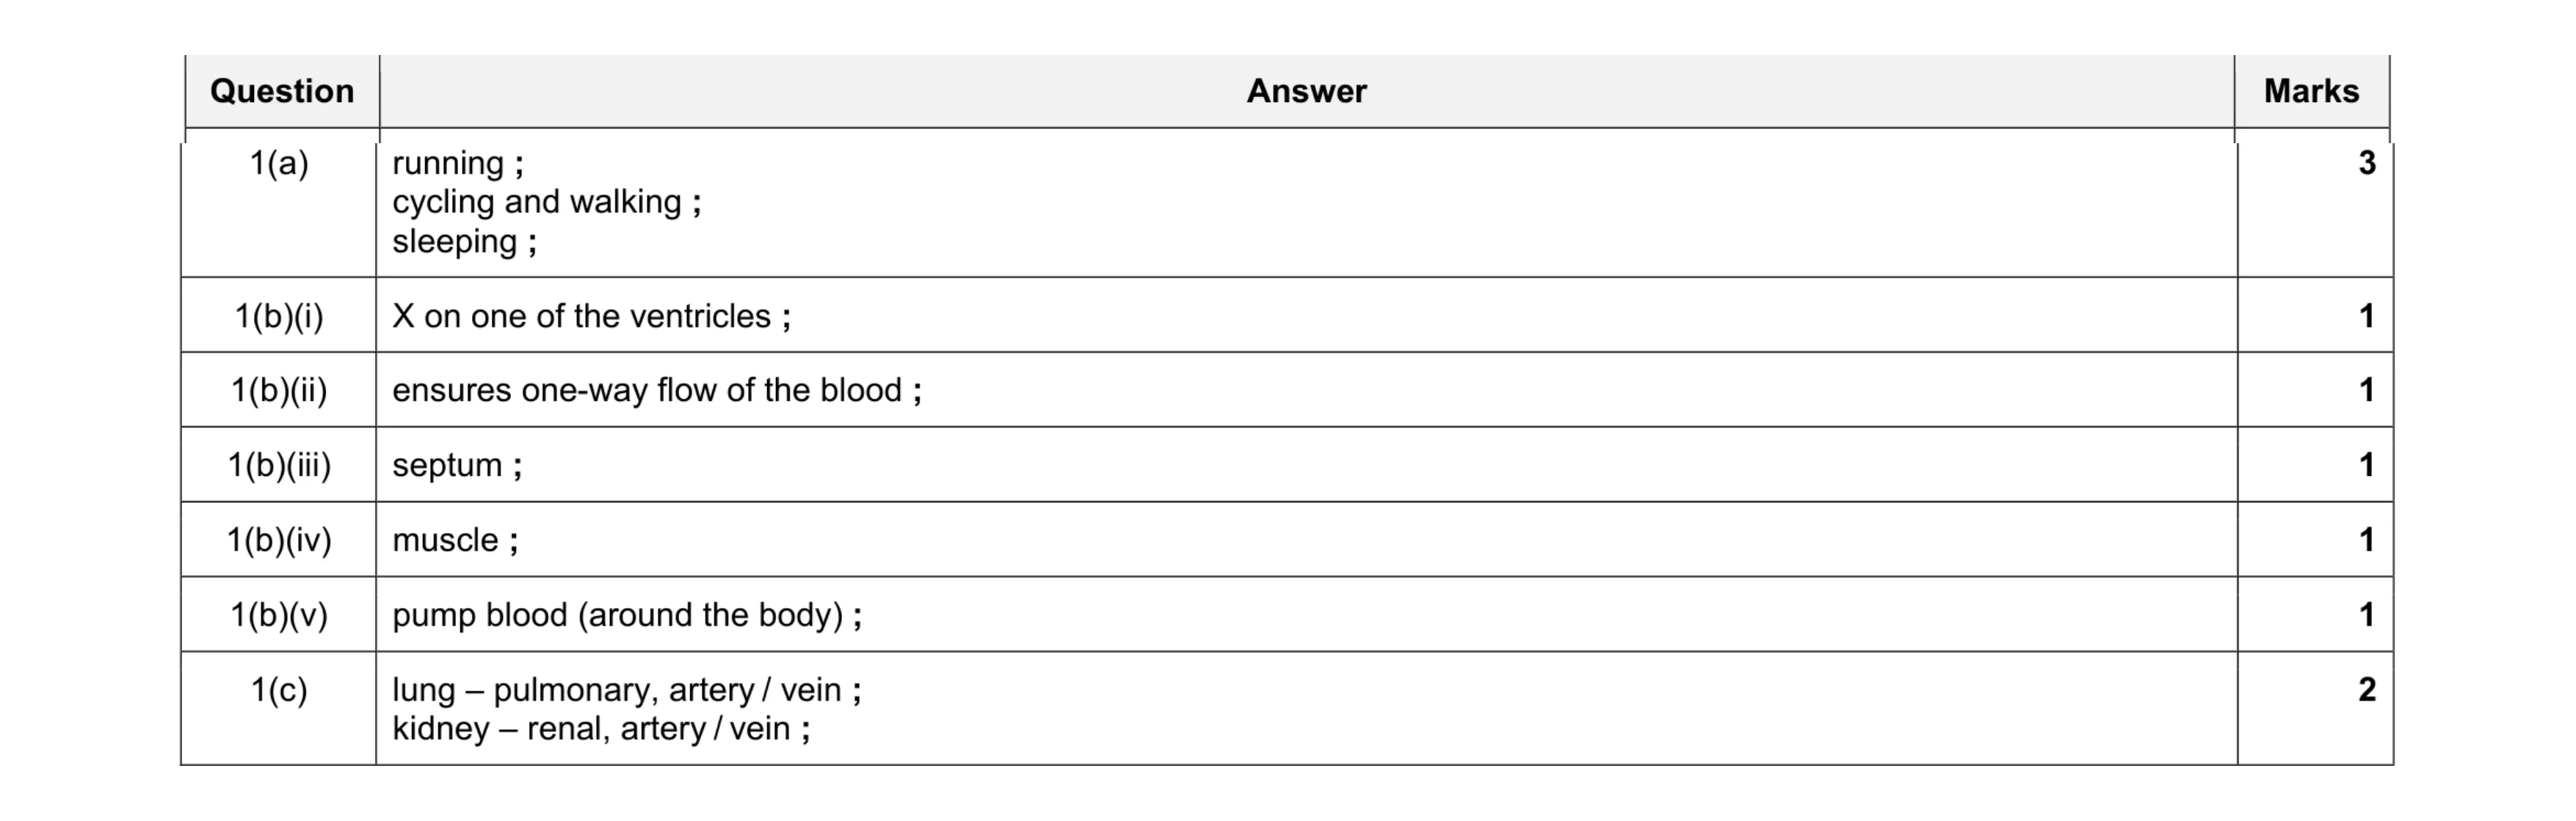 10
10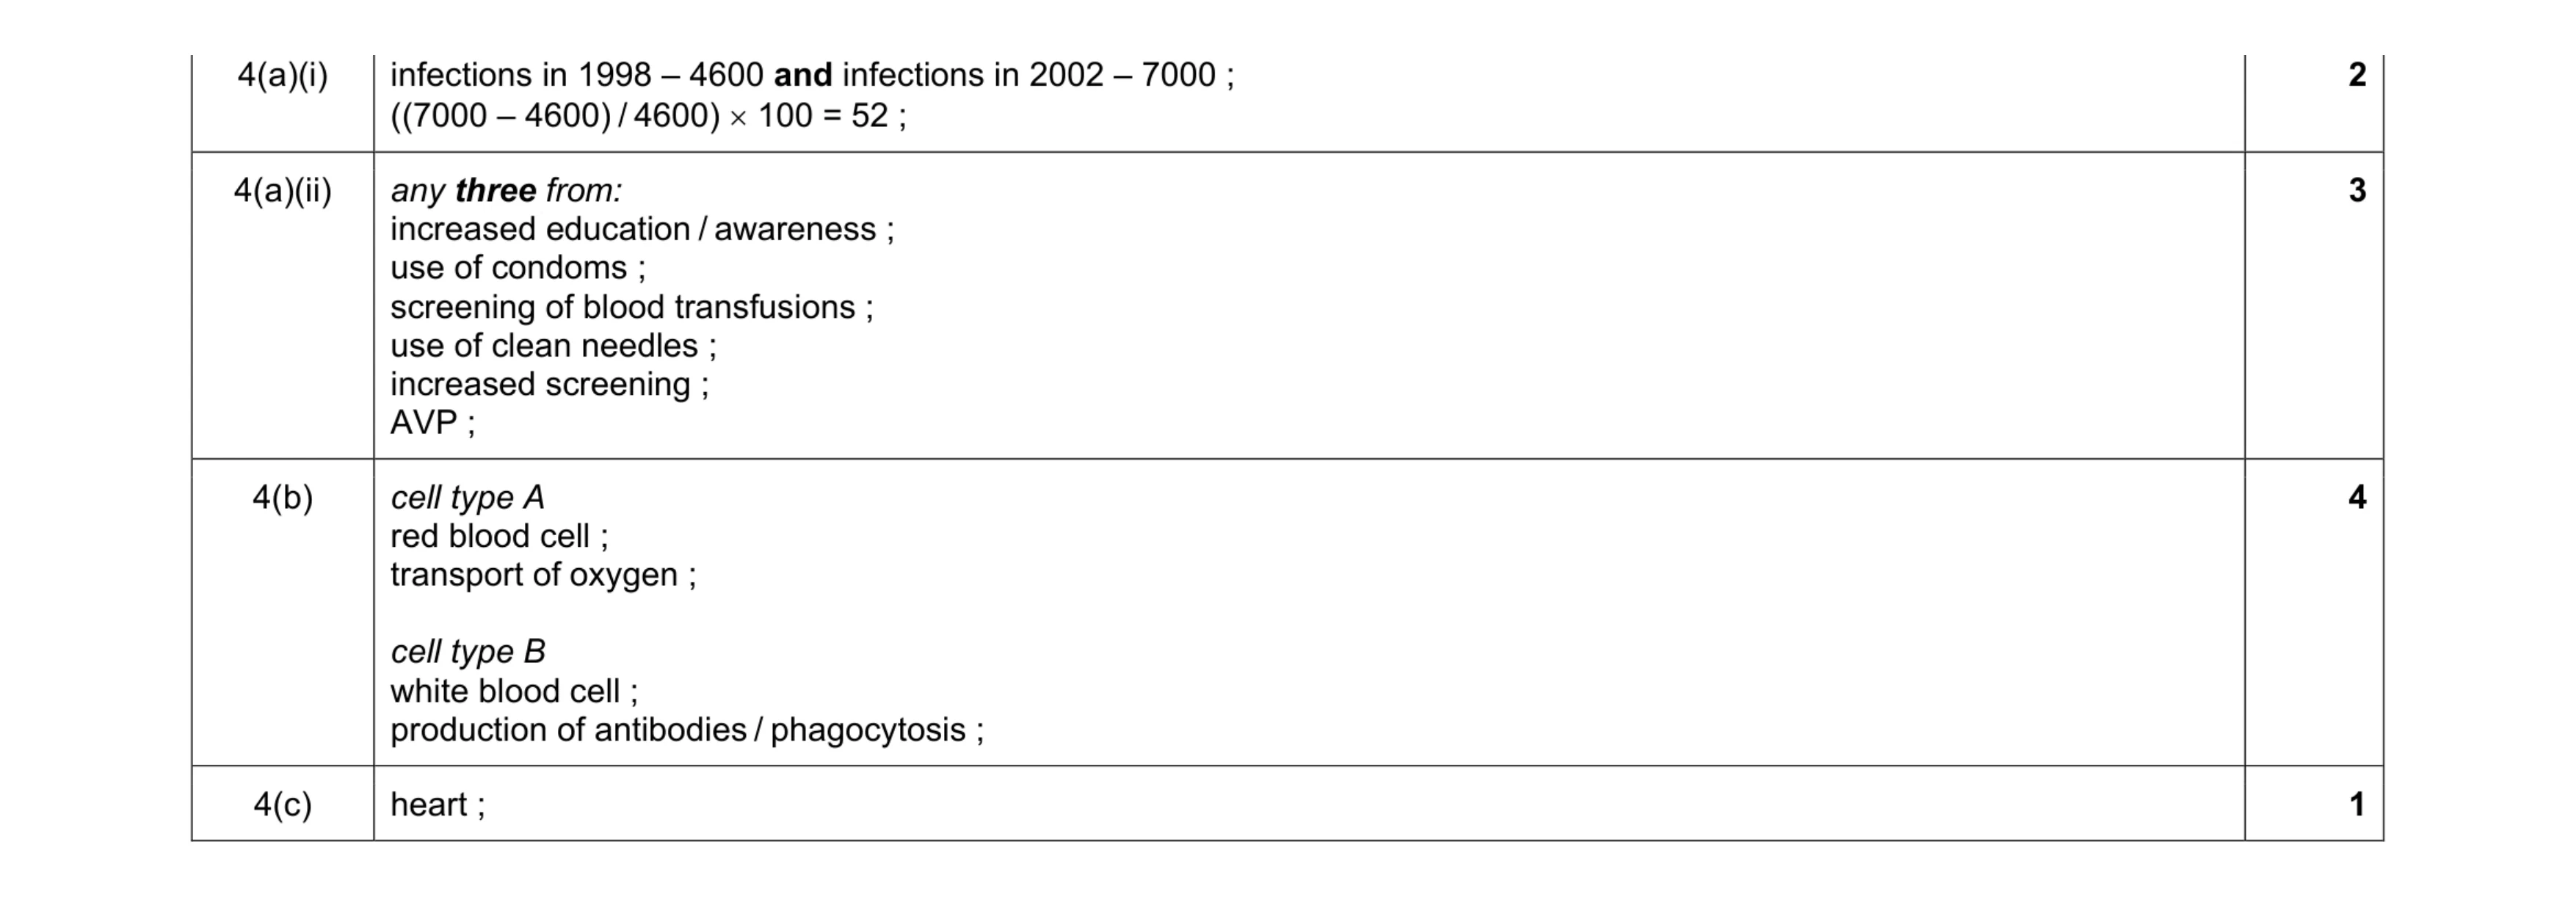 10
10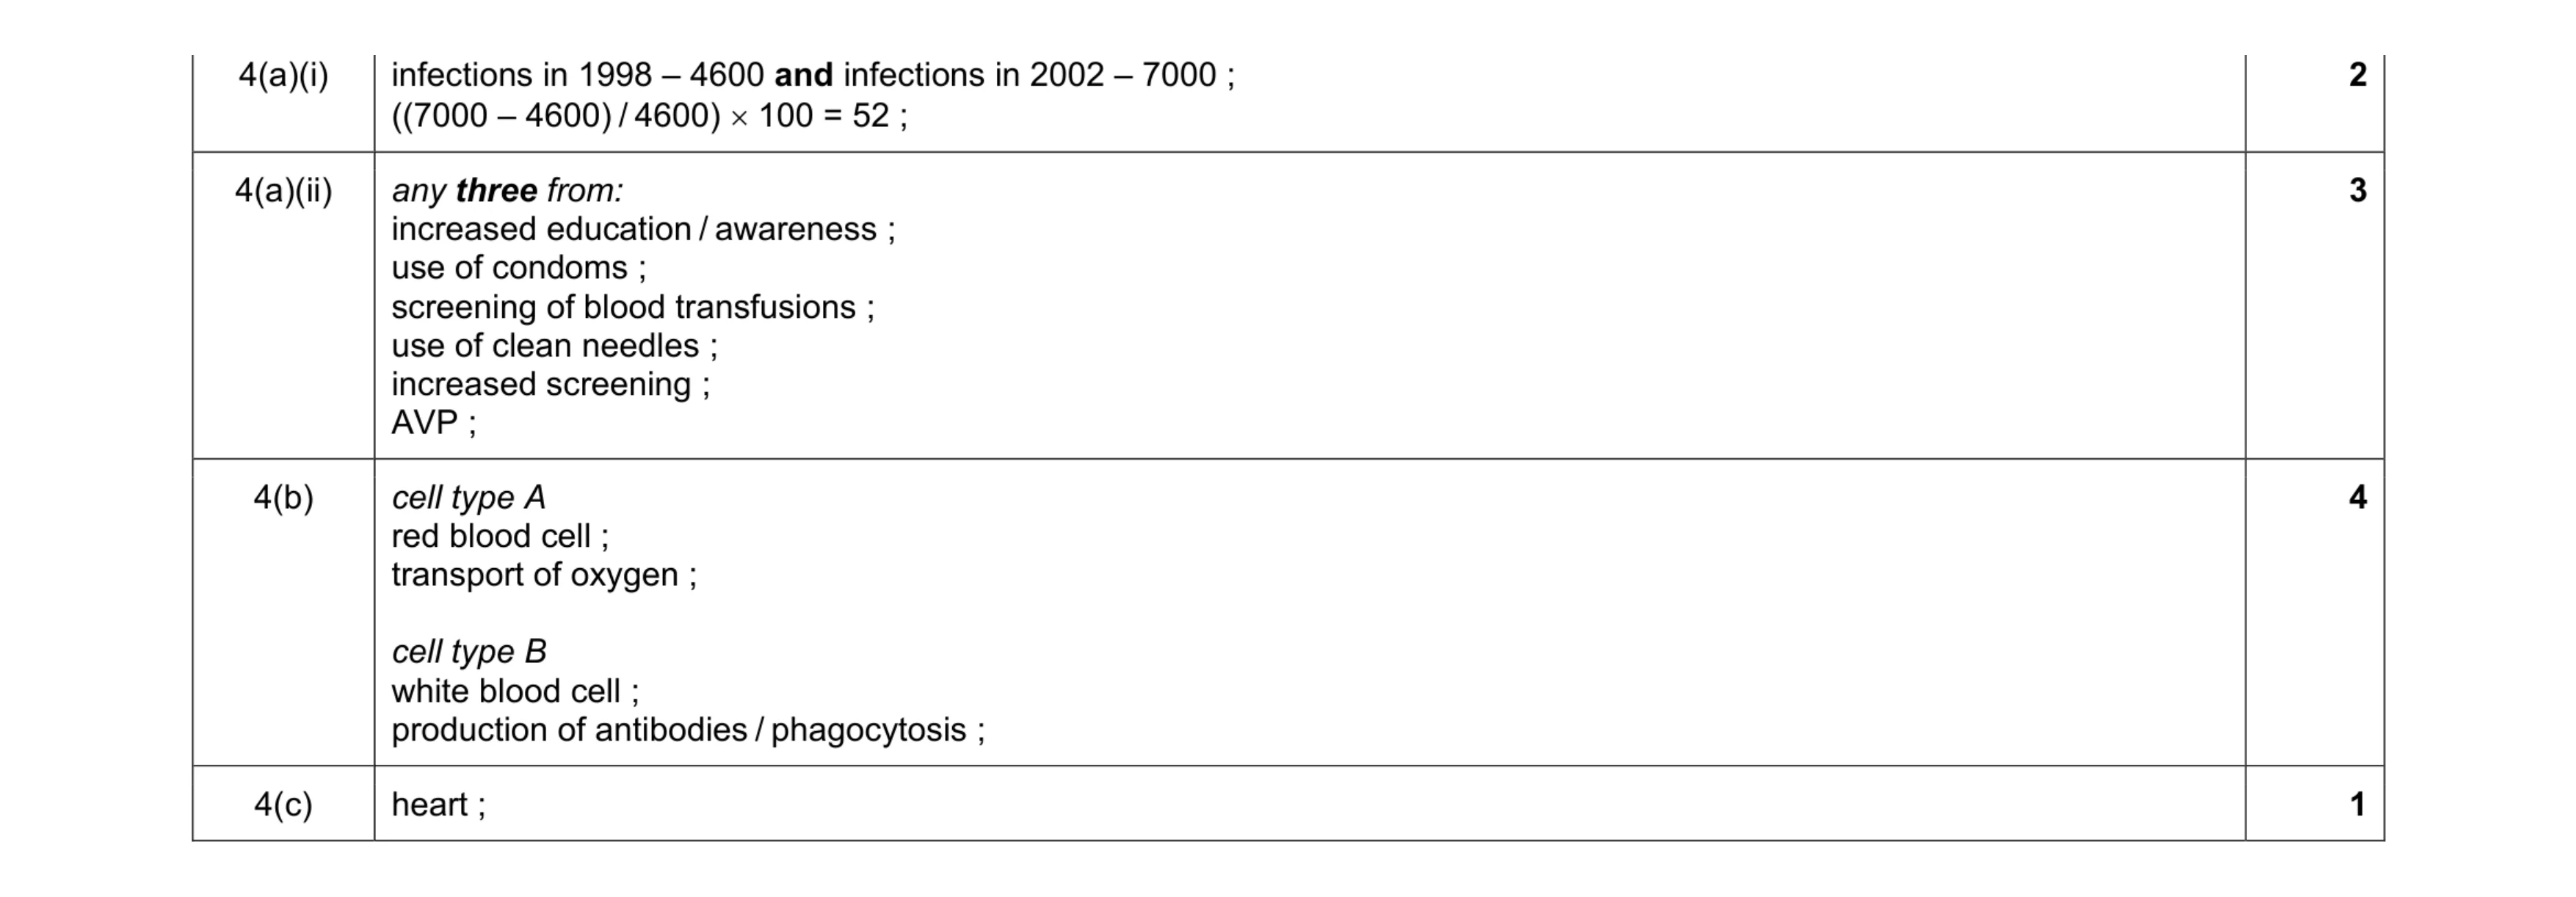 10
10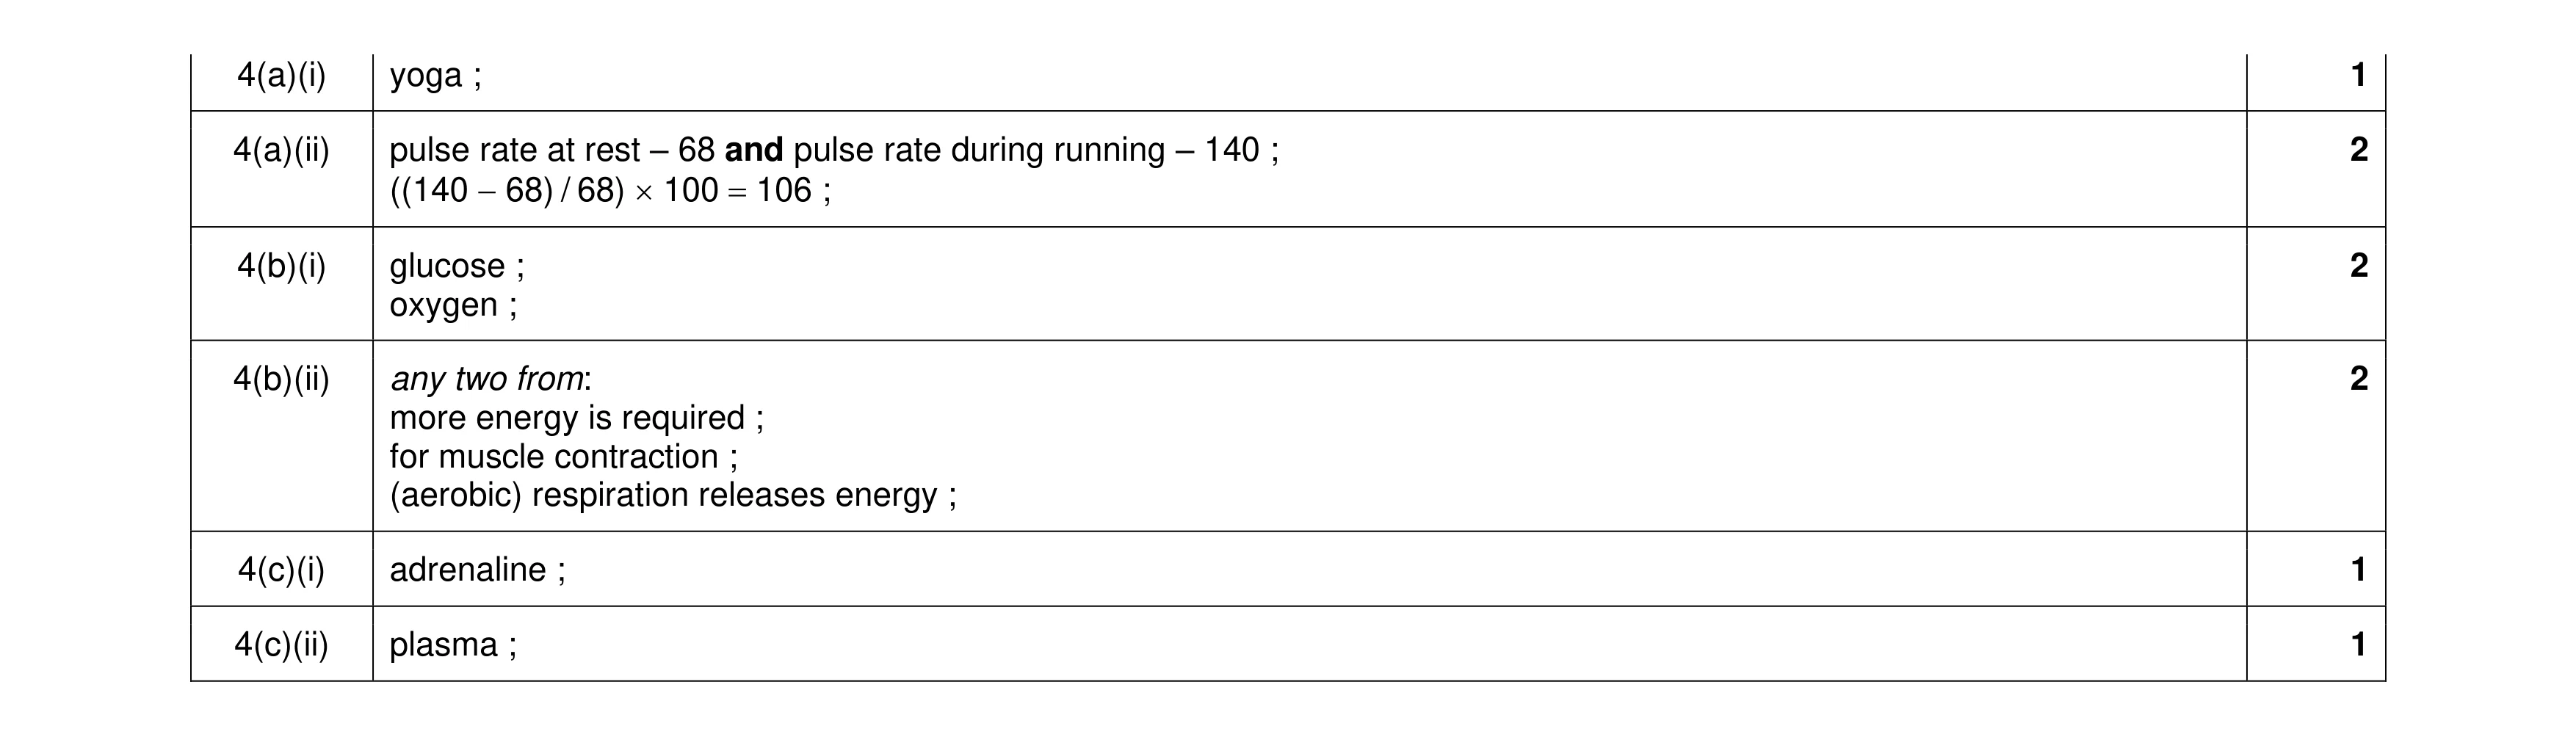 9
9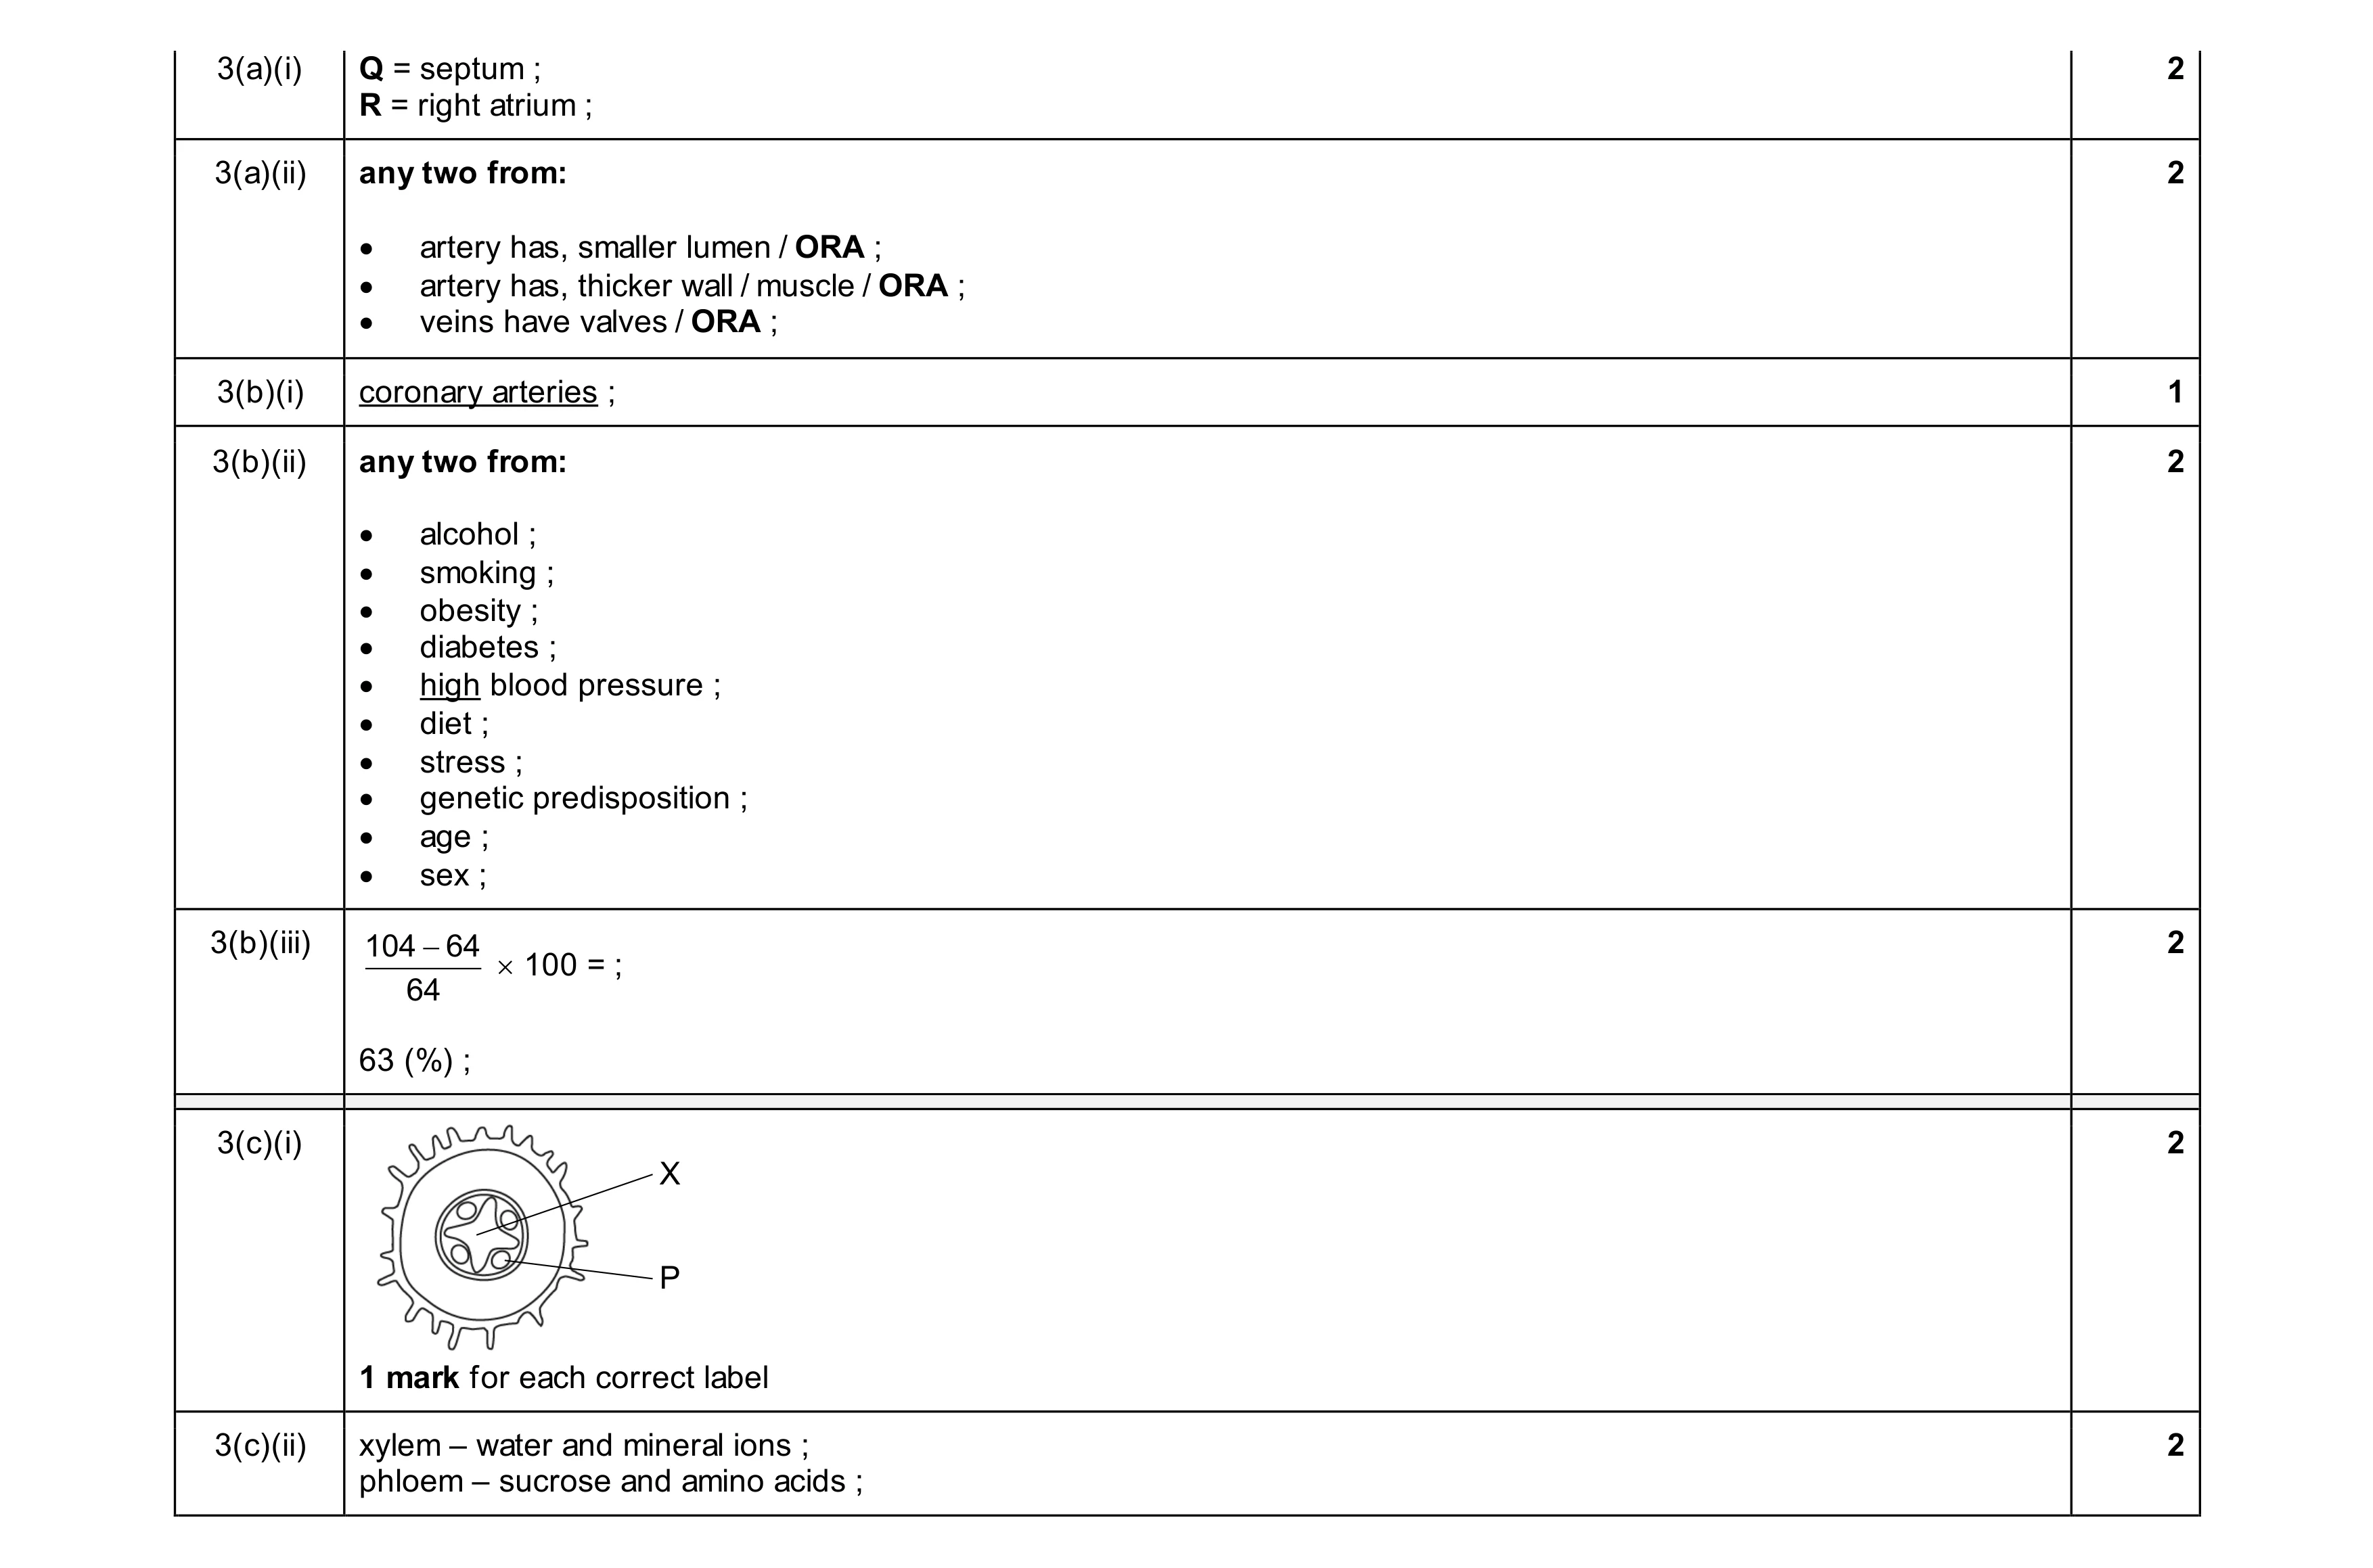 13
13