Questions as text
Q1 · A farmer sorts the grapefruit he grows into sizes, according to their diameter 0607/42 May/June 2017
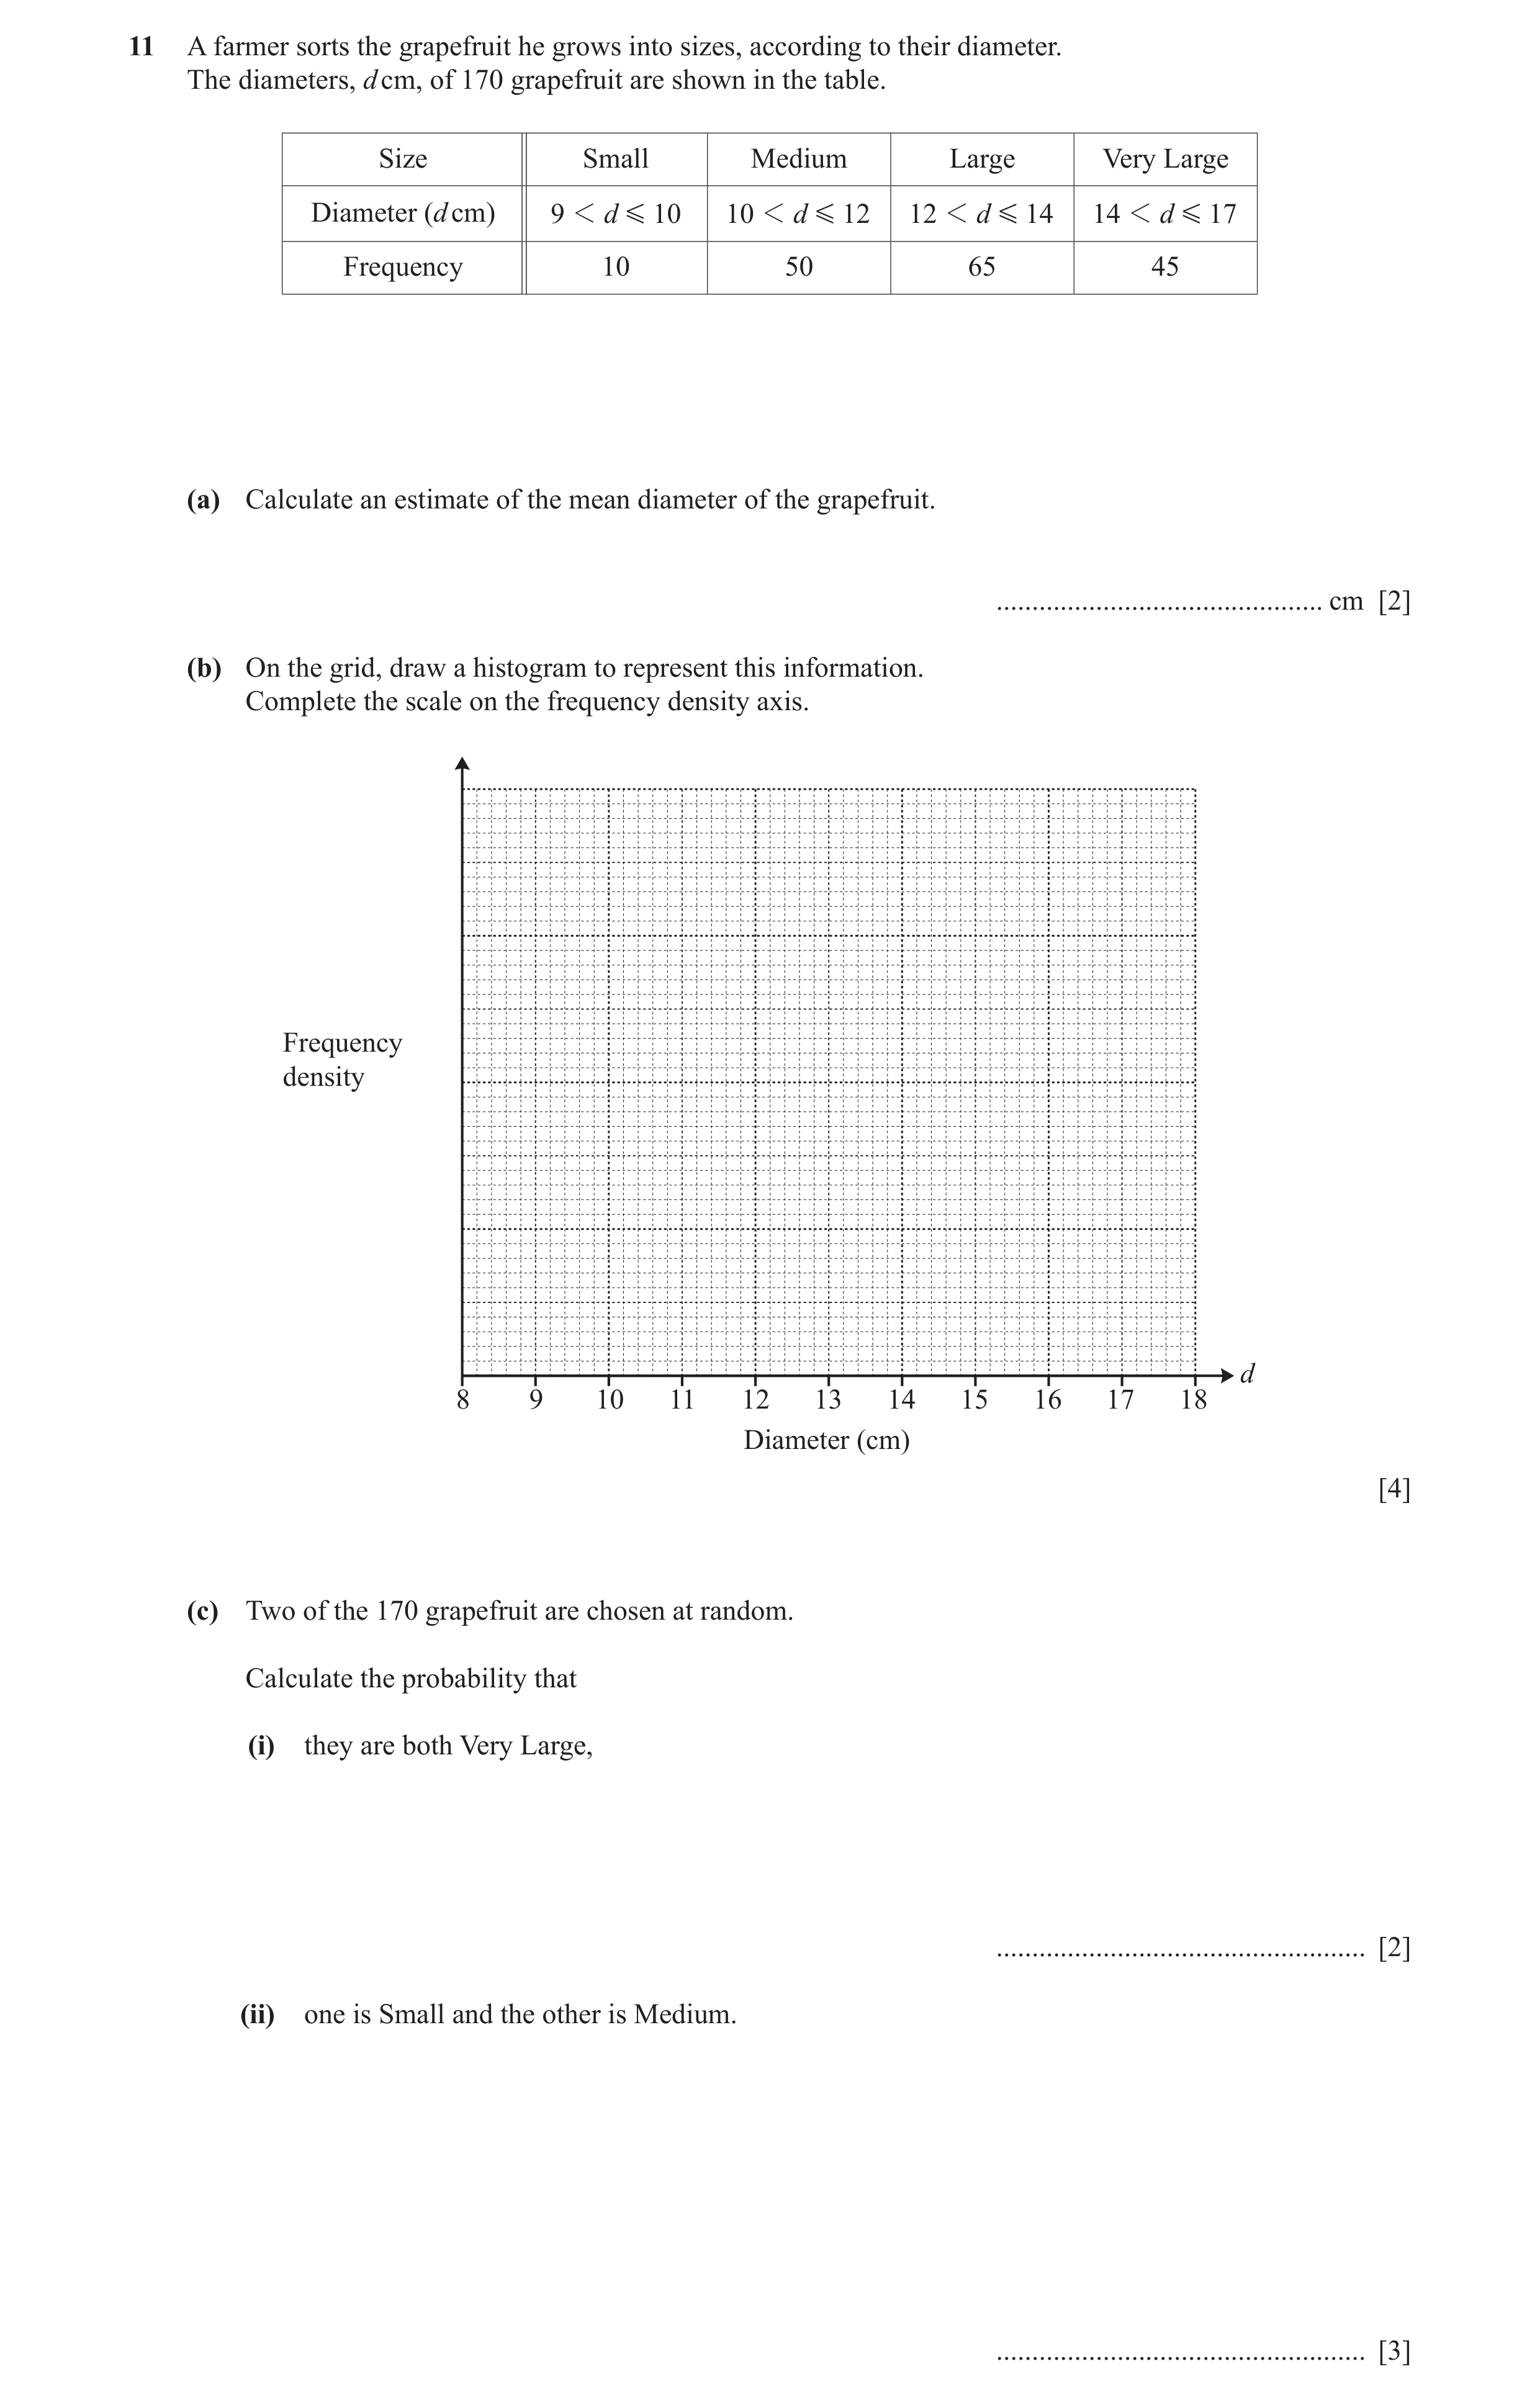
11 A farmer sorts the grapefruit he grows into sizes, according to their diameter. The diameters, d cm, of 170 grapefruit are shown in the table. Size Small Medium Large Very Large Diameter (d cm) 9 1 d G 10 10 1 d G 12 12 1 d G 14 14 1 d G 17 Frequency 10 50 65 45 (a) Calculate an estimate of the mean diameter of the grapefruit. … cm [2] (b) On the grid, draw a histogram to represent this information. Complete the scale on the frequency density axis. Frequency density d 8 9 10 11 12 13 14 15 16 17 18 Diameter (cm) [4] (c) Two of the 170 grapefruit are chosen at random. Calculate the probability that (i) they are both Very Large, … [2] (ii) one is Small and the other is Medium. … [3]
11 marks
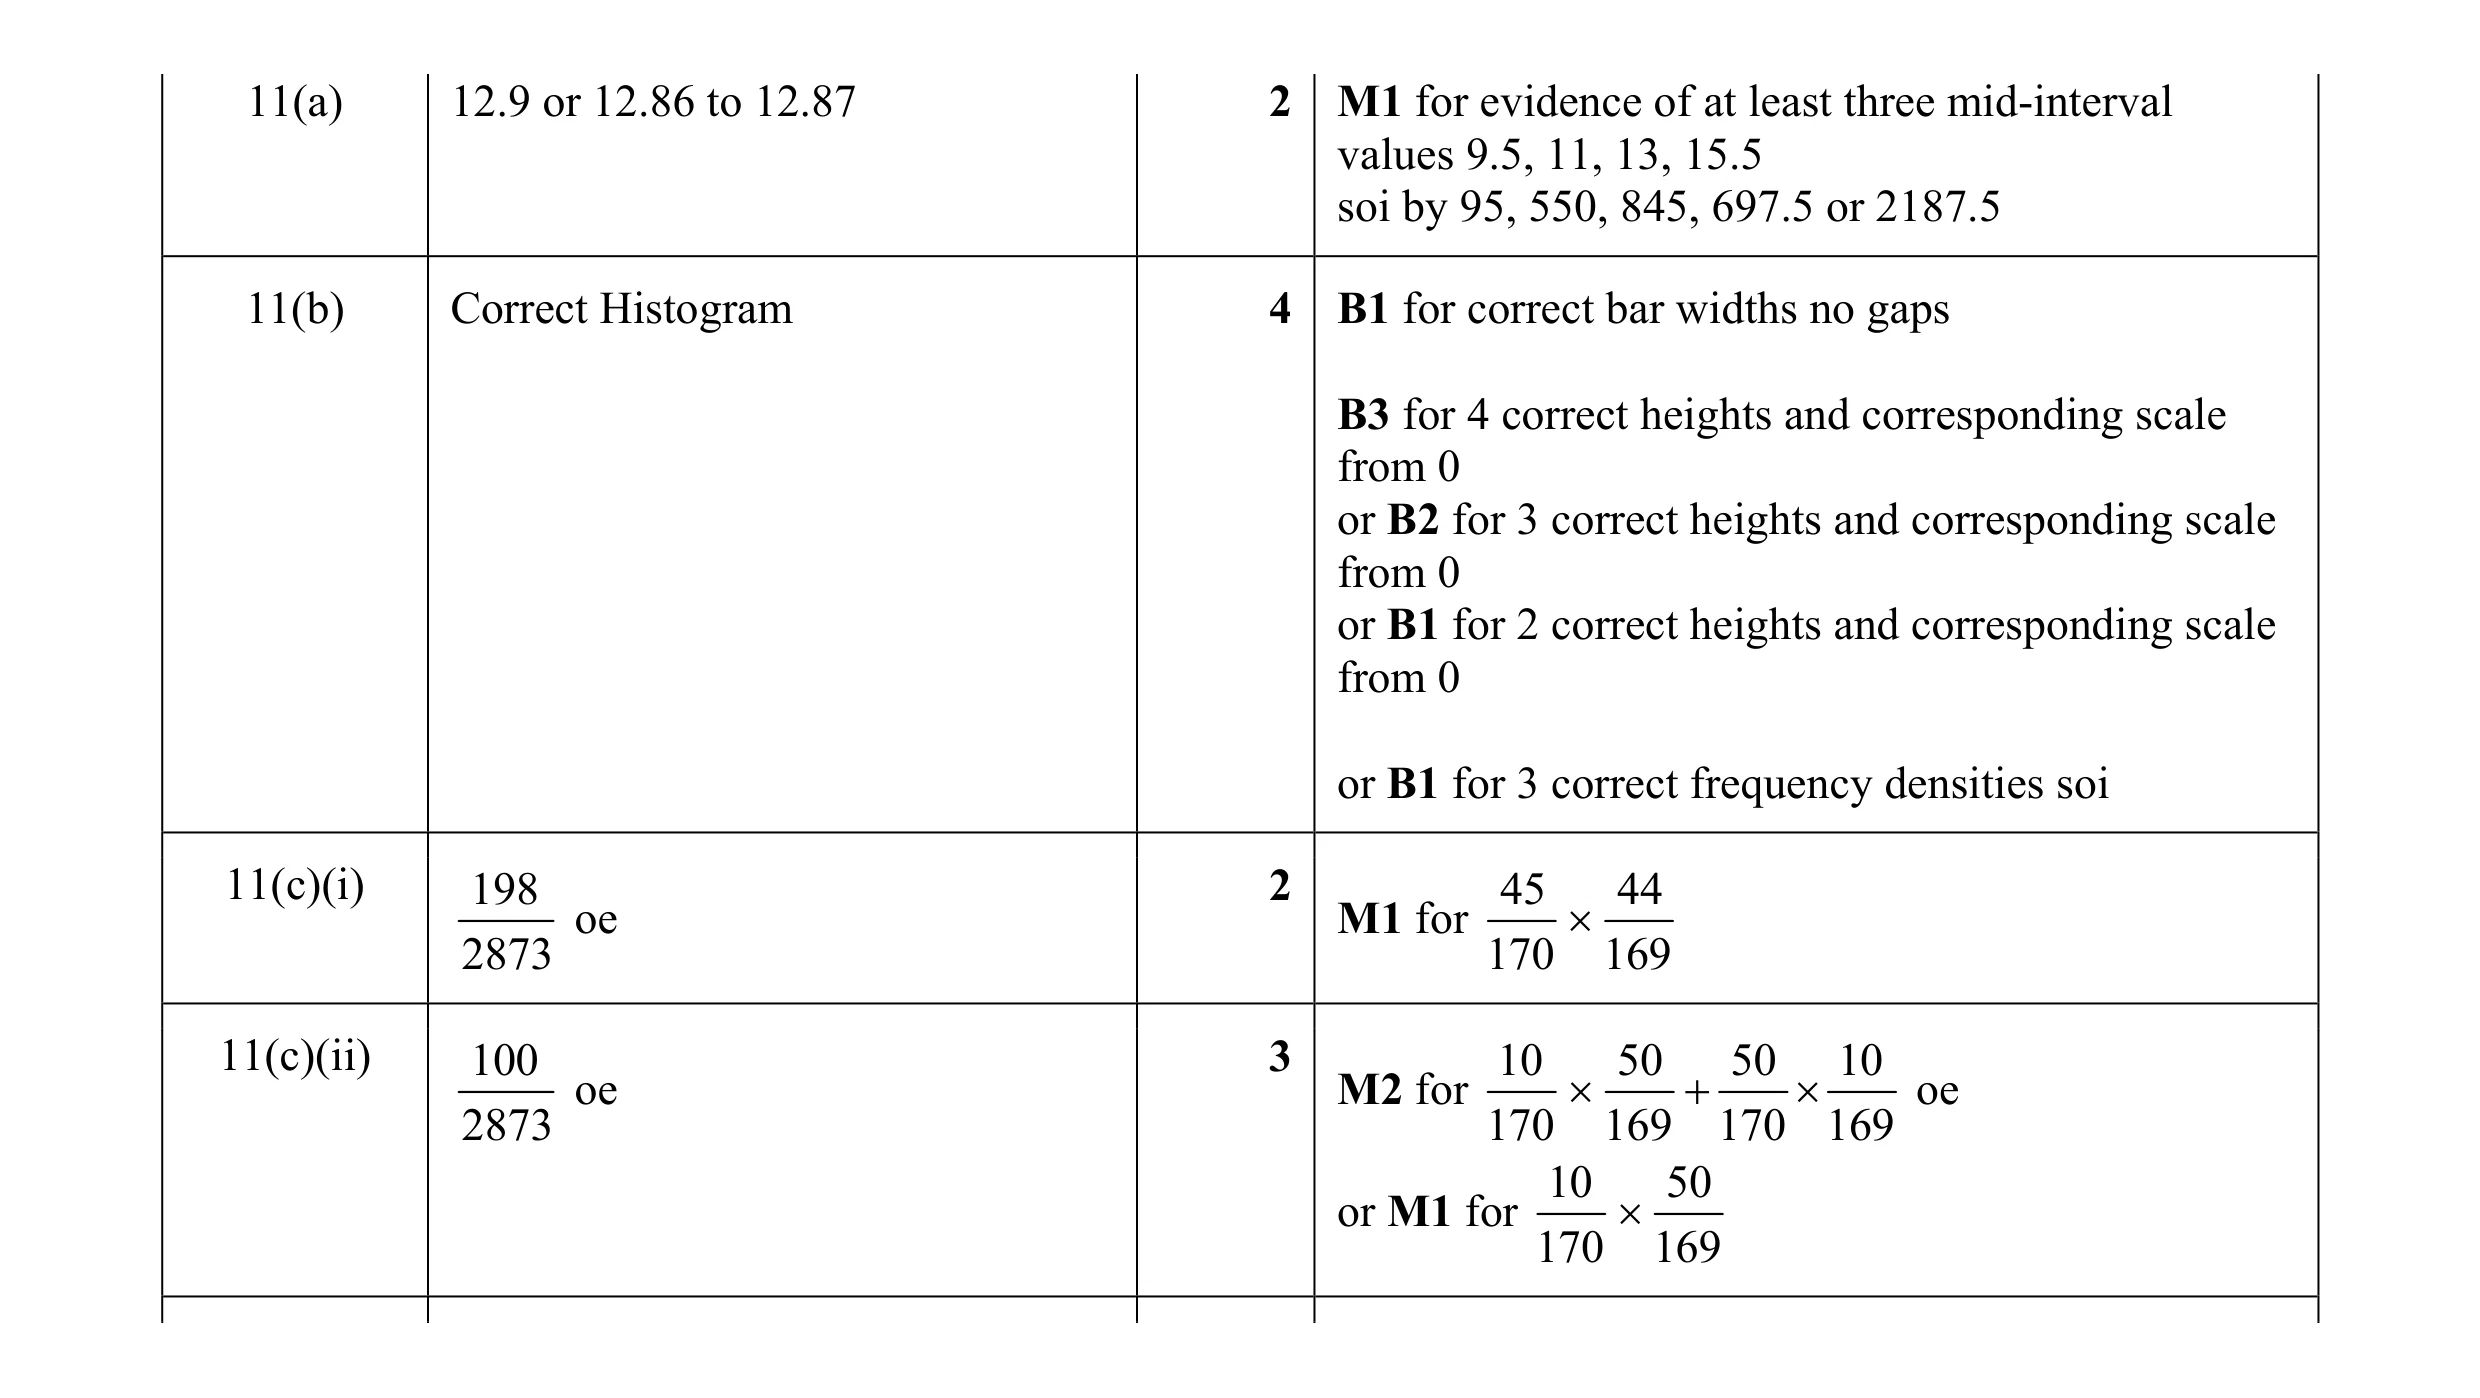
Mark scheme: 11(a) 12.9 or 12.86 to 12.87 2 M1 for evidence of at least three mid-interval values 9.5, 11, 13, 15.5 soi by 95, 550, 845, 697.5 or 2187.5 11(b) Correct Histogram 4 B1 for correct bar widths no gaps B3 for 4 correct heights and corresponding scale from 0 or B2 for 3 correct heights and corresponding scale from 0 or B1 for 2 correct heights and corresponding scale from 0 or B1 for 3 correct frequency densities soi 11(c)(i) 198 2 45 44 oe M1 for × 2873 170 169 11(c)(ii) 100 3 10 50 50 10 oe M2 for × + × oe 2873 170 169 170 169 10 50 or M1 for × 170 169
This question in 0607/42 May/June 2017
Q2 · The masses of 120 peaches are recorded in the table 0607/43 Oct/Nov 2017
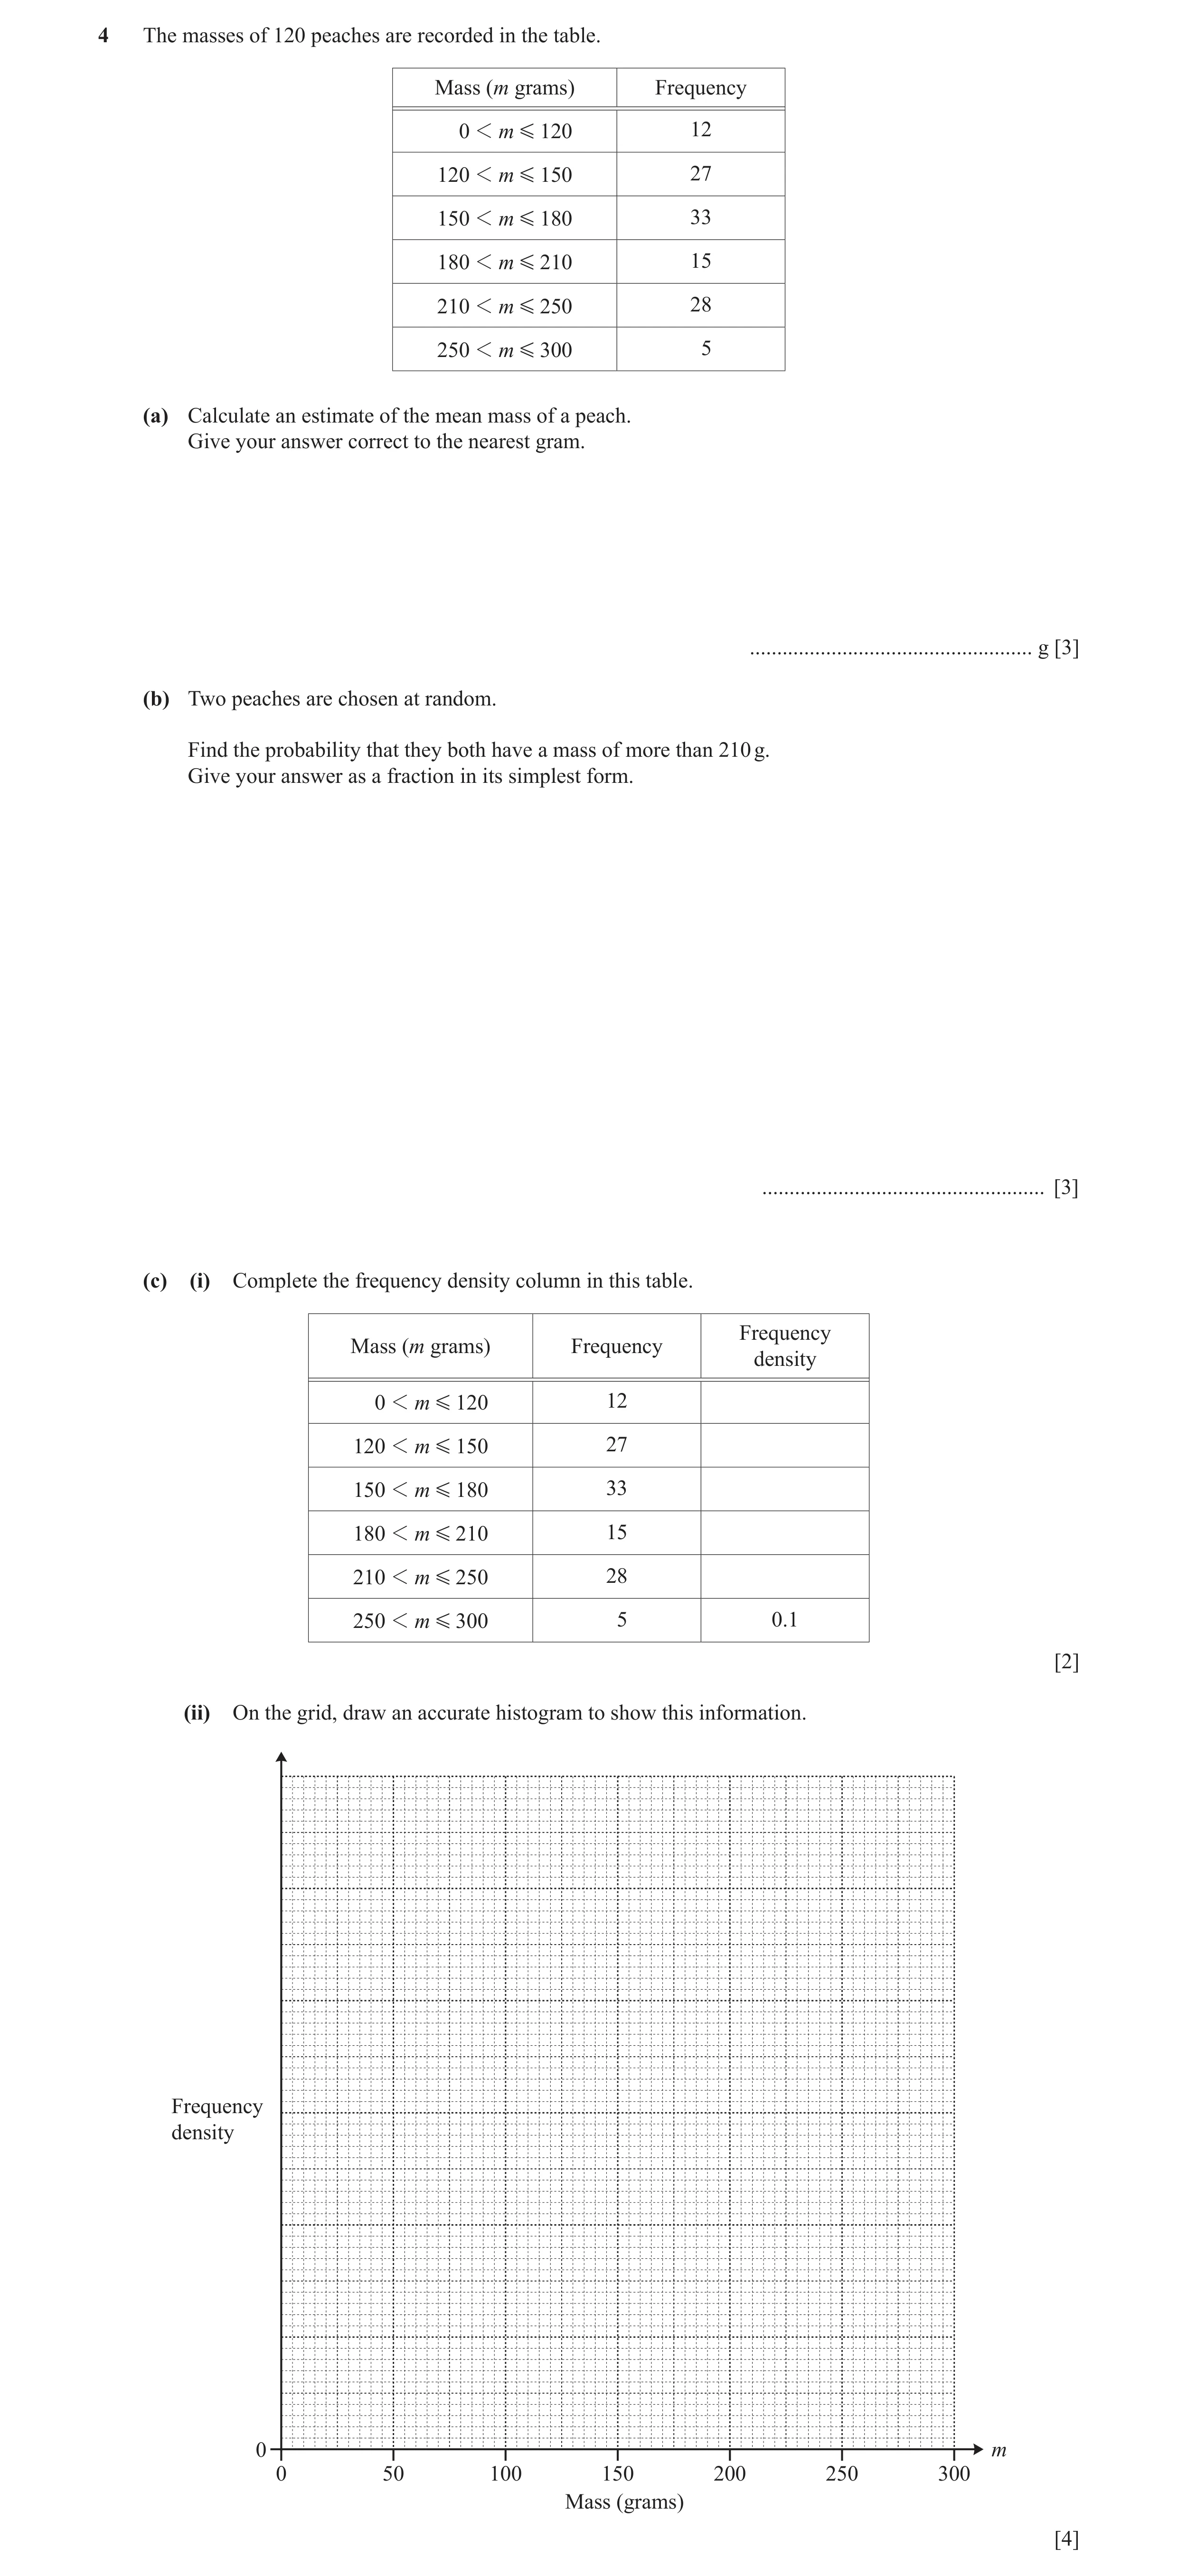
4 The masses of 120 peaches are recorded in the table. Mass (m grams) Frequency 0 1 m G 120 12 120 1 m G 150 27 150 1 m G 180 33 180 1 m G 210 15 210 1 m G 250 28 250 1 m G 300 5 (a) Calculate an estimate of the mean mass of a peach. Give your answer correct to the nearest gram. … g [3] (b) Two peaches are chosen at random. Find the probability that they both have a mass of more than 210 g. Give your answer as a fraction in its simplest form. … [3] (c) (i) Complete the frequency density column in this table. Frequency Mass (m grams) Frequency density 0 1 m G 120 12 120 1 m G 150 27 150 1 m G 180 33 180 1 m G 210 15 210 1 m G 250 28 250 1 m G 300 5 0.1 [2] (ii) On the grid, draw an accurate histogram to show this information. Frequency density 0 m 0 50 100 150 200 250 300 Mass (grams) [4]
12 marks
Mark scheme: 4(a) 171 cao nfww 3 B2 for 171.25 or 171.3 or M2 for complete method with 1 numerical error or M1 for at least 3 mid-pts (60, 135, 165, 195, 230, 275) soi 4(b) 44 3 1056 cao B2 for oe accept 0.0739 or 0.07394 to 595 14280 0.07395 33 32 or M1 for × 120 119 4(c)(i) 0.1, 0.9, 1.1, 0.5, 0.7, [0.1] 2 B1 for 3 or 4 correct 4(c)(ii) Correct histogram 4 B1 for suitable scale B1 for correct column widths B1FT for 4 or more correct heights
This question in 0607/43 Oct/Nov 2017
Q3 · The list shows the temperature, in degrees Celsius, at noon in Paris on each of 14 days 0607/41 May/June 2018
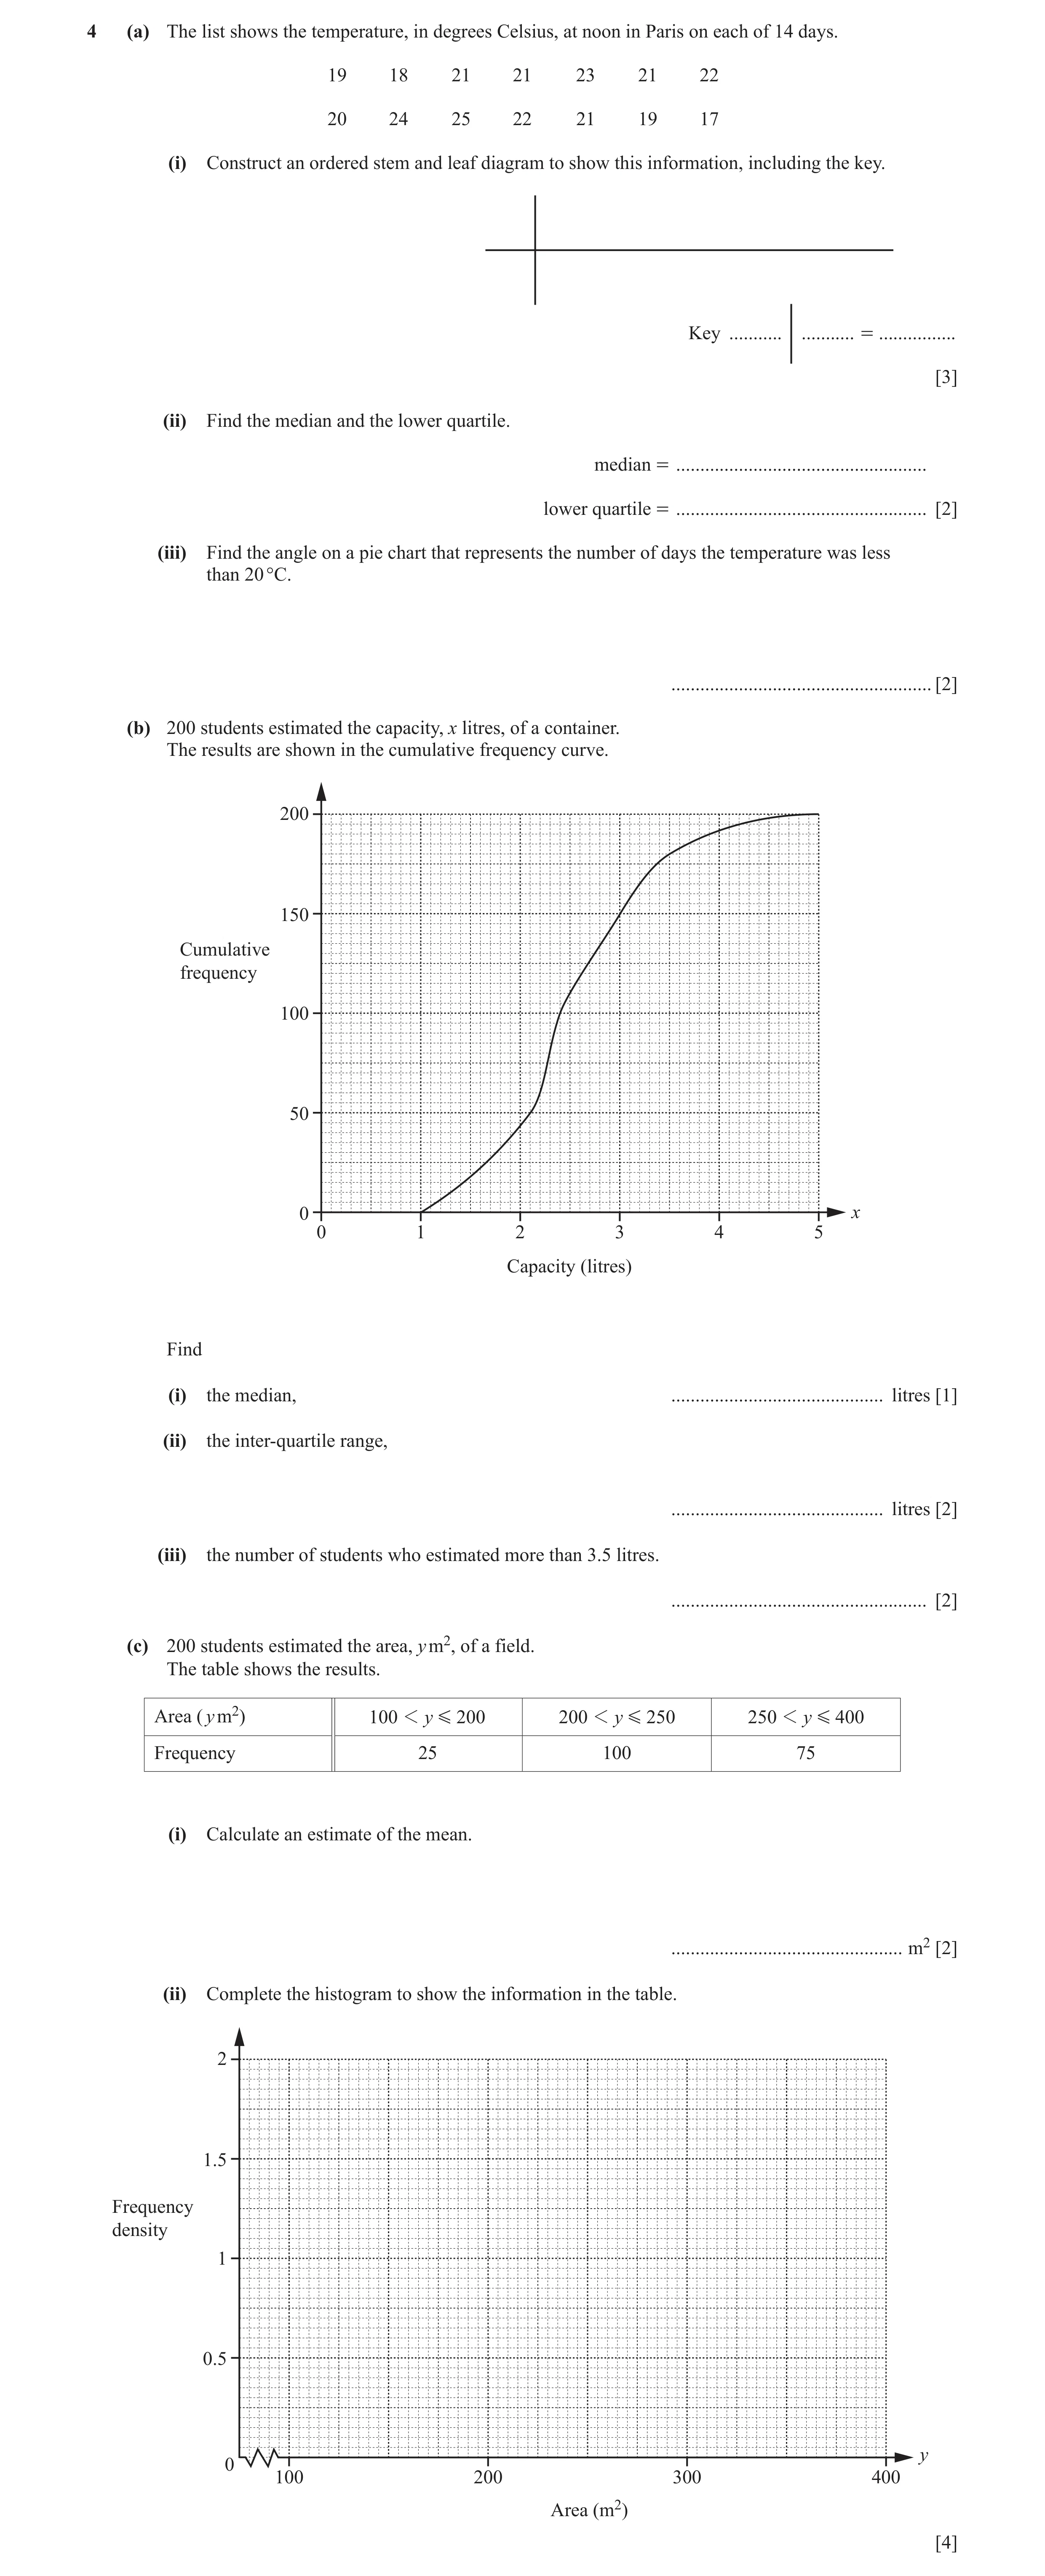
4 (a) The list shows the temperature, in degrees Celsius, at noon in Paris on each of 14 days. 19 18 21 21 23 21 22 20 24 25 22 21 19 17 (i) Construct an ordered stem and leaf diagram to show this information, including the key. Key … … = … [3] (ii) Find the median and the lower quartile. median = … lower quartile = … [2] (iii) Find the angle on a pie chart that represents the number of days the temperature was less than 20 °C. … [2] (b) 200 students estimated the capacity, x litres, of a container. The results are shown in the cumulative frequency curve. 200 150 Cumulative frequency 100 50 0 x 0 1 2 3 4 5 Capacity (litres) Find (i) the median, … litres [1] (ii) the inter-quartile range, … litres [2] (iii) the number of students who estimated more than 3.5 litres. … [2] (c) 200 students estimated the area, y m2, of a field. The table shows the results. Area (y m2) 100 1 y G 200 200 1 y G 250 250 1 y G 400 Frequency 25 100 75 (i) Calculate an estimate of the mean. … m2 [2] (ii) Complete the histogram to show the information in the table. 2 1.5 Frequency density 1 0.5 y 0 100 200 300 400 Area (m2) [4]
18 marks
Mark scheme: 4(a)(i) 1 7 8 9 9 3 B1for each row 2 0 1 1 1 1 2 2 3 4 5 B1 for key e.g. 2|3 = 23 4(a)(ii) 21 2 B1 for each 19 4(a)(iii) 102.8 to 102.9 2 4 360 M1 for oe or oe 14 14 4(b)(i) 2.4 1 4(b)(ii) 0.9 2 B1 for 3 or 2.1 seen 4(b)(iii) 20 2 M1 for 180 seen 4(c)(i) 253.125 2 M1 for evidence of at least two mid-values or 253.13 or 253.1 or 253 150, 225, 325 soi by e.g. 50625 4(c)(ii) Correct histogram 4 B1 for bars with correct widths B1 for first bar with height 0.25 B1 for second bar with height 2 B1 for third bar with height 0.5 If 0 scored SC1 for three correct frequency densities seen
This question in 0607/41 May/June 2018
Q4 · The mass, x grams, of each of 100 oranges is found 0607/42 May/June 2018
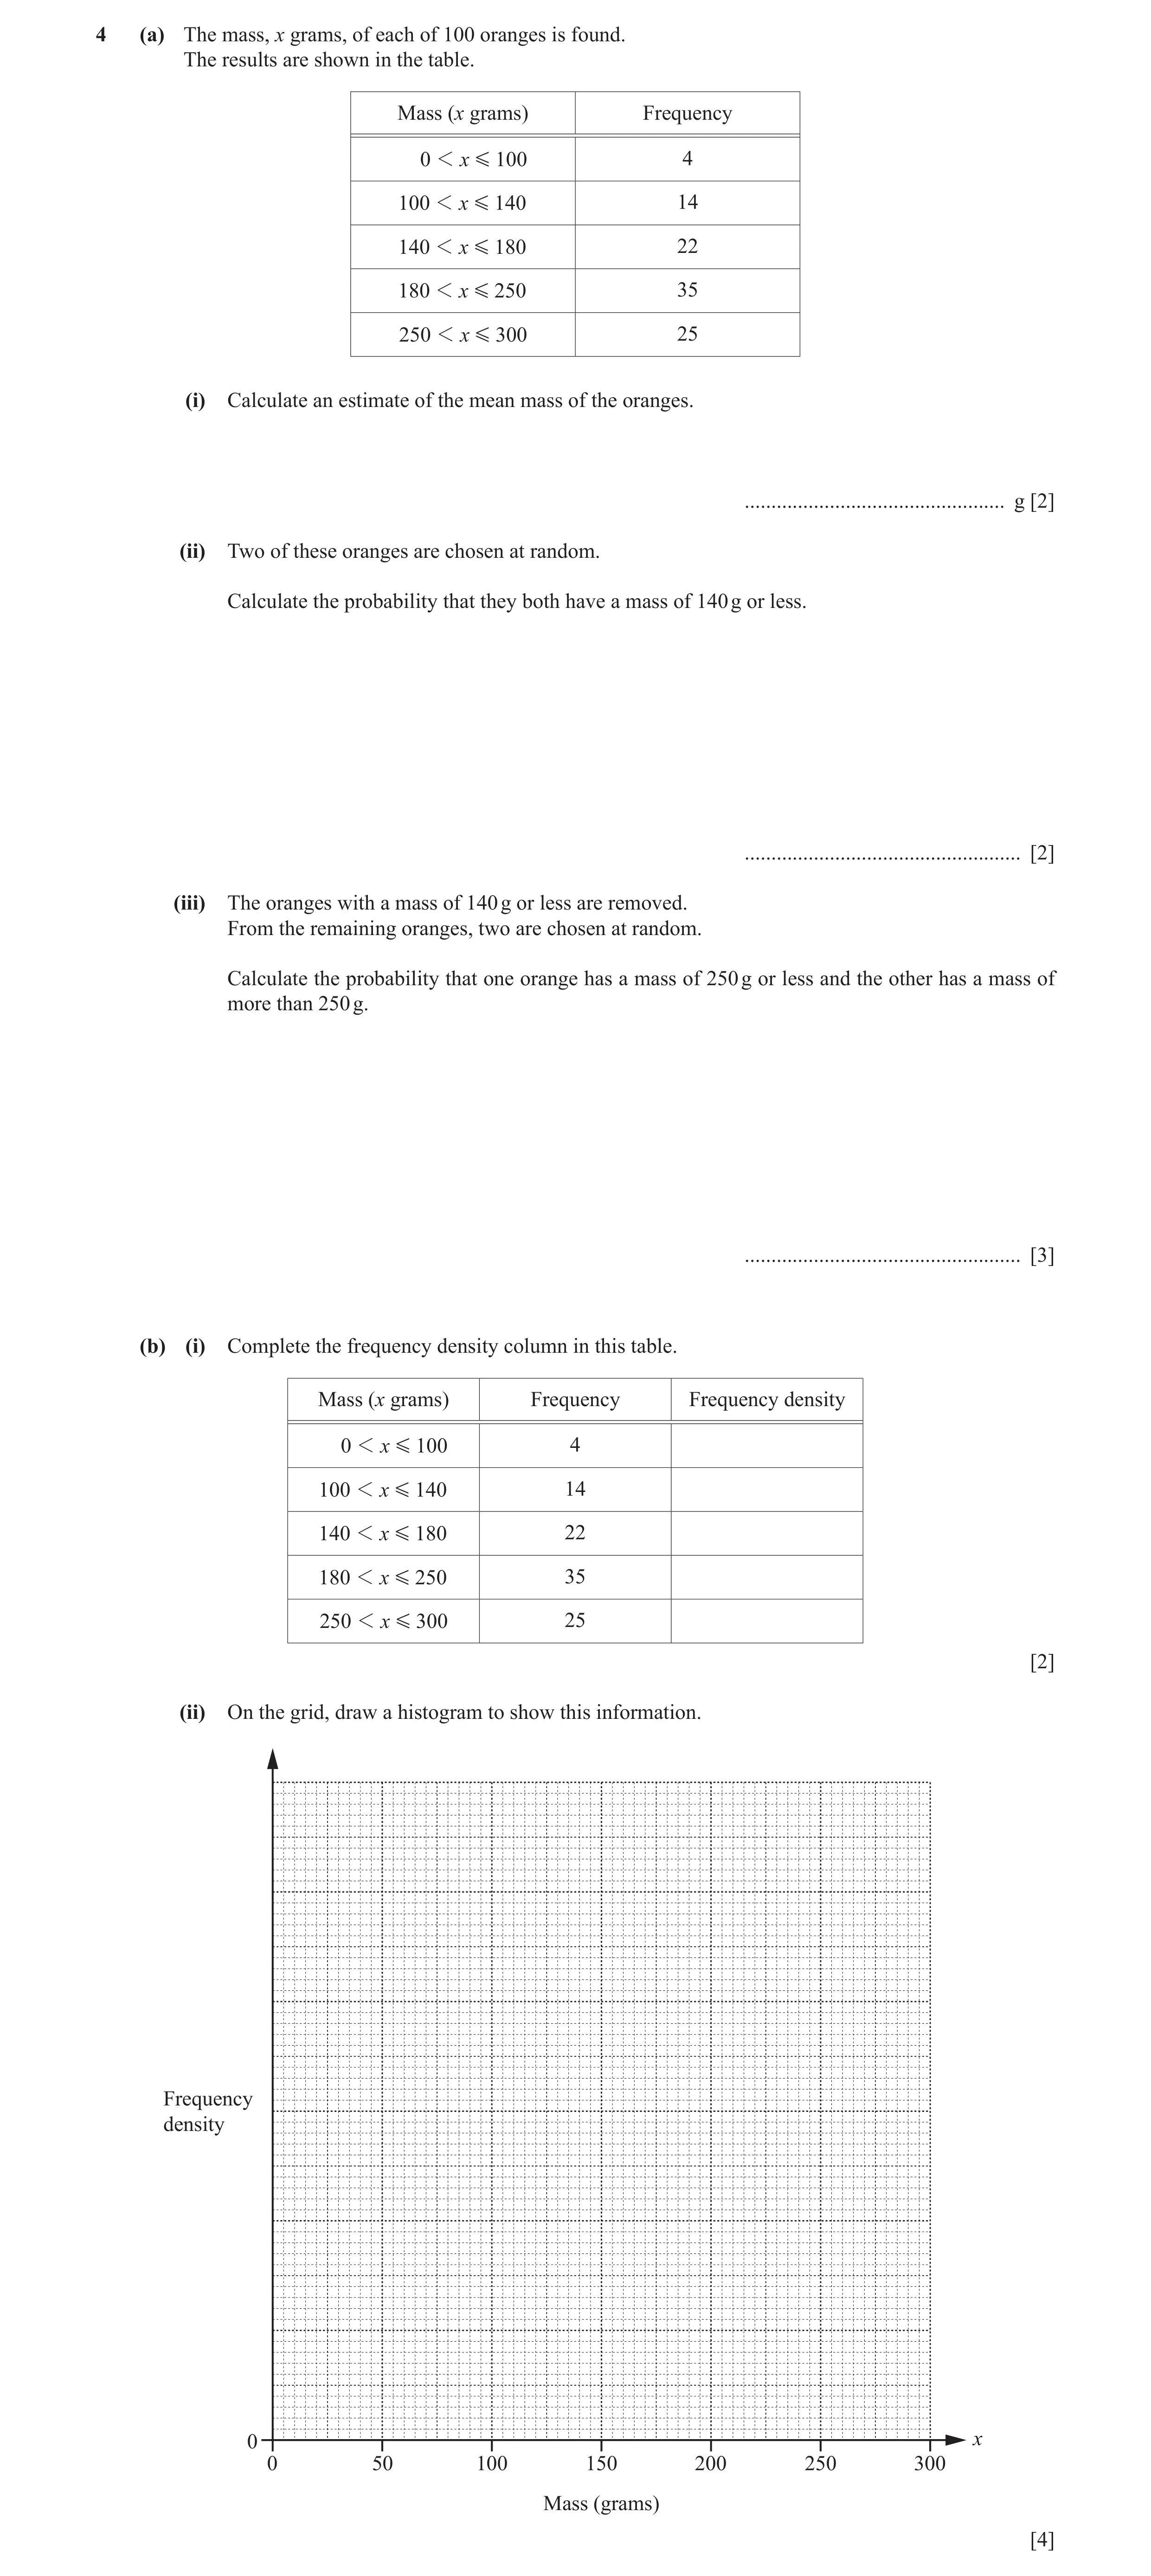
4 (a) The mass, x grams, of each of 100 oranges is found. The results are shown in the table. Mass (x grams) Frequency 0 1 x G 100 4 100 1 x G 140 14 140 1 x G 180 22 180 1 x G 250 35 250 1 x G 300 25 (i) Calculate an estimate of the mean mass of the oranges. … g [2] (ii) Two of these oranges are chosen at random. Calculate the probability that they both have a mass of 140 g or less. … [2] (iii) The oranges with a mass of 140 g or less are removed. From the remaining oranges, two are chosen at random. Calculate the probability that one orange has a mass of 250 g or less and the other has a mass of more than 250 g. … [3] (b) (i) Complete the frequency density column in this table. Mass (x grams) Frequency Frequency density 0 1 x G 100 4 100 1 x G 140 14 140 1 x G 180 22 180 1 x G 250 35 250 1 x G 300 25 [2] (ii) On the grid, draw a histogram to show this information. Frequency density 0 x 0 50 100 150 200 250 300 Mass (grams) [4]
13 marks
Mark scheme: 4(a)(i) 198 2 M1 for 3 or more 50, 120, 160, 215, 275 soi 4(a)(ii) 306 2 18 17 oe or 0.0309 M1 for × 9900 100 99 or 0.030 90 to 0.030 91 4(a)(iii) 2850 3 57 25 25 57 oe or 0.429 M2 for × + × oe 6642 82 81 82 81 or 0.4290 to 0.4291 57 25 25 57 or M1 for × or × 82 81 82 81 4(b)(i) 0.04, 0.35, 0.55, 0.5, 0.5 2 B1 for 3 correct 4(b)(ii) Correct histogram 4 FT their fully completed table in (b)(i) with linear scale B1 for suitable scale (must include all heights) B1 for correct column widths B2FT for columns with all heights correct or B1FT for 3 or 4 columns with correct heights
This question in 0607/42 May/June 2018
Q5 · Rani planted some seeds in her garden 0607/41 May/June 2019
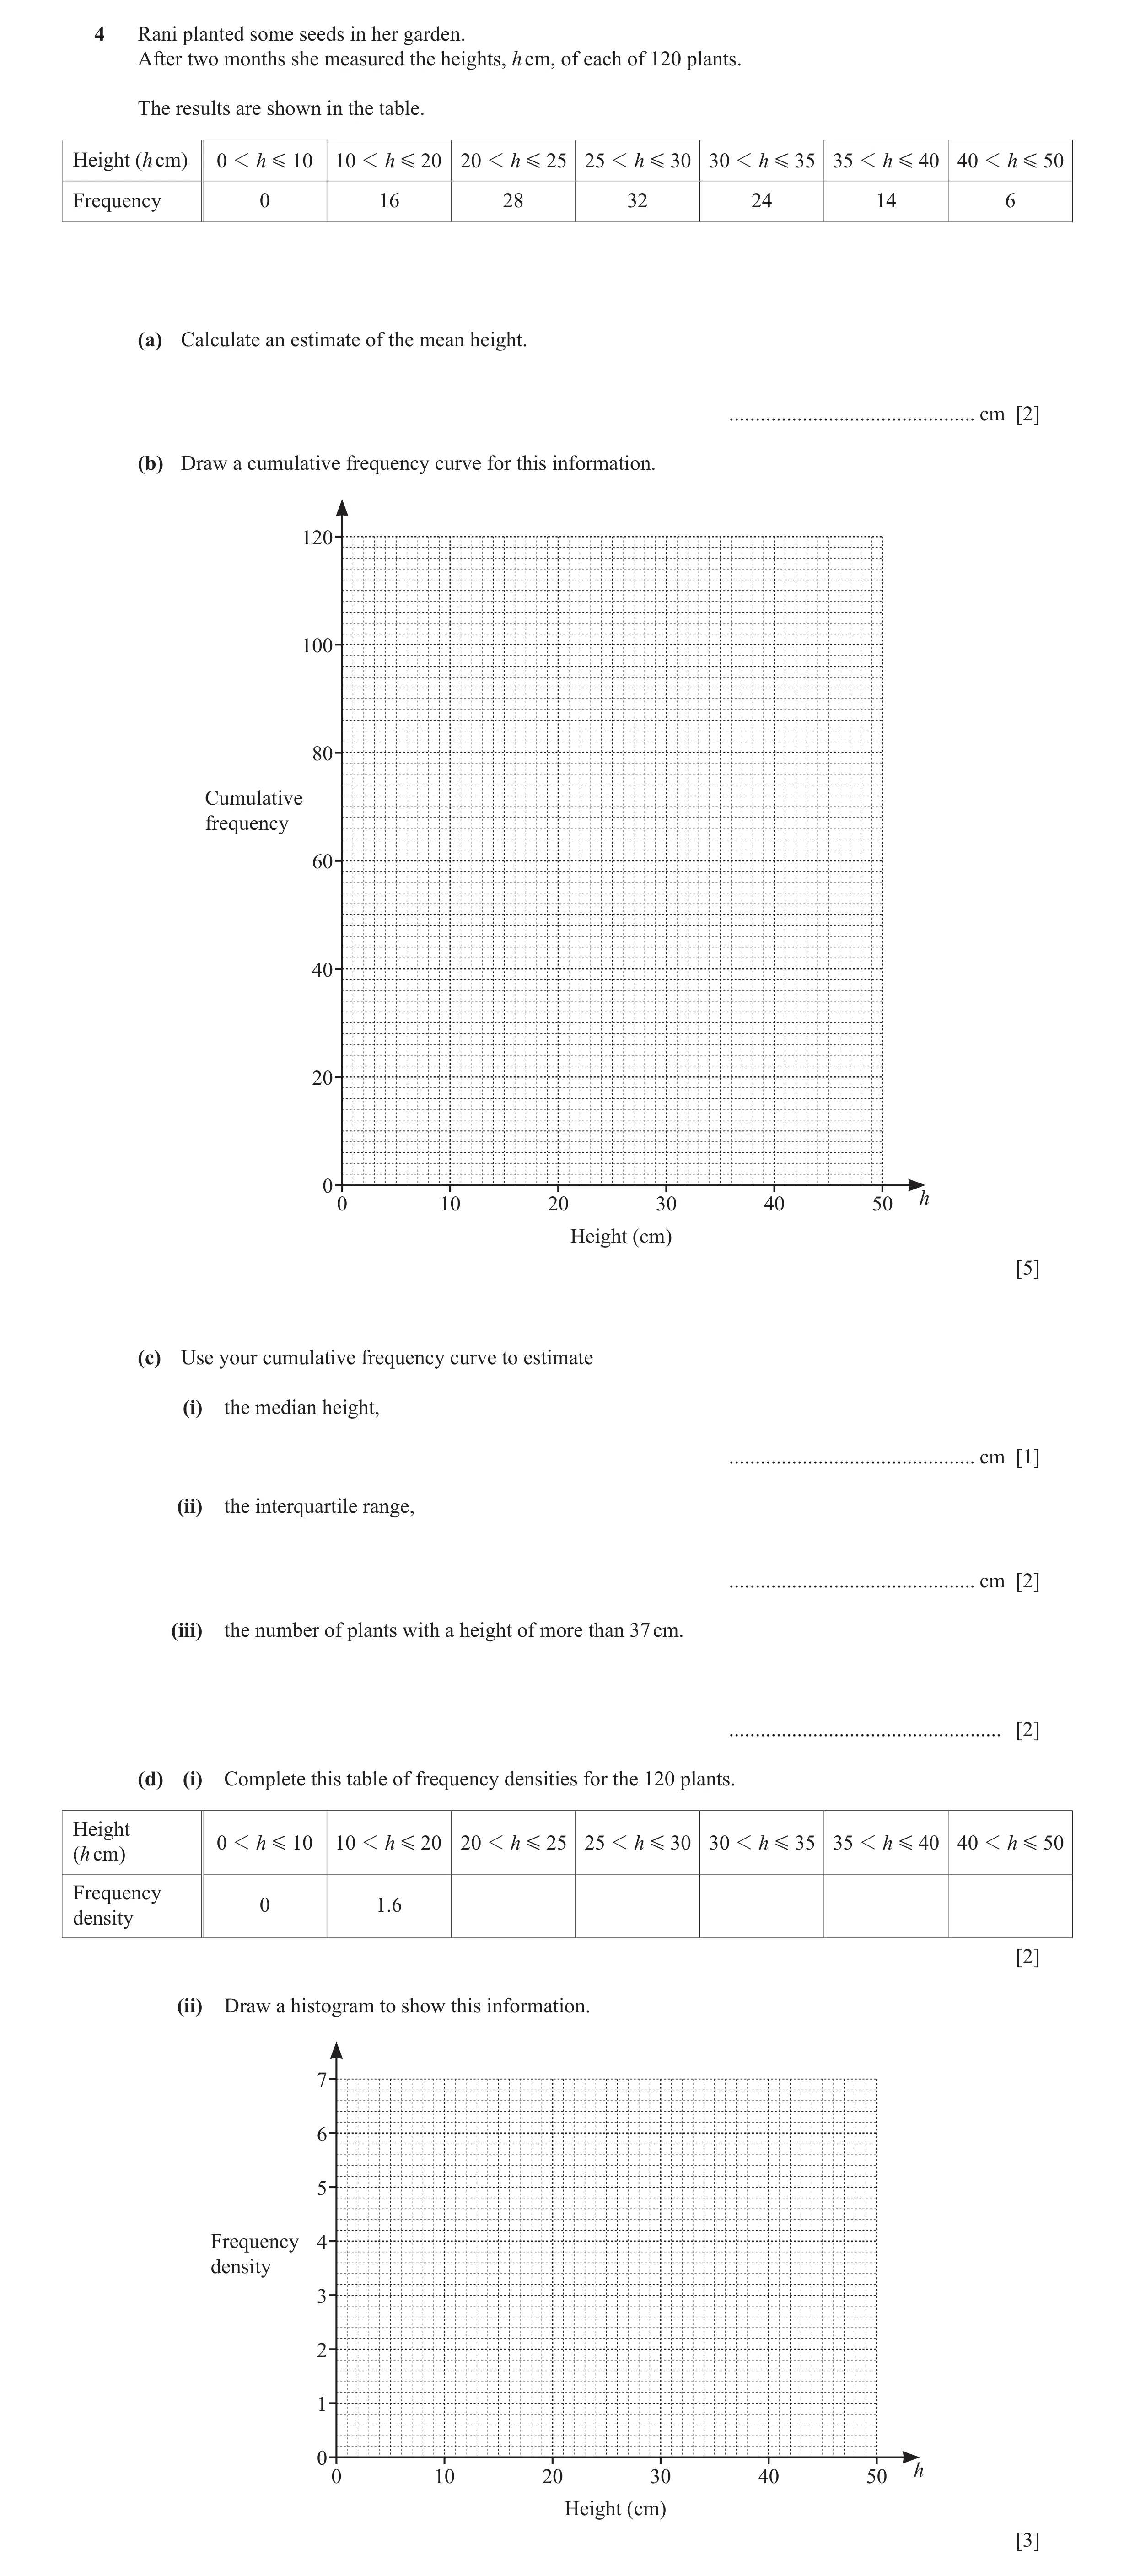
4 Rani planted some seeds in her garden. After two months she measured the heights, h cm, of each of 120 plants. The results are shown in the table. Height (h cm) 0 1 h G 10 10 1 h G 20 20 1 h G 25 25 1 h G 30 30 1 h G 35 35 1 h G 40 40 1 h G 50 Frequency 0 16 28 32 24 14 6 (a) Calculate an estimate of the mean height. … cm [2] (b) Draw a cumulative frequency curve for this information. 120 100 80 Cumulative frequency 60 40 20 0 h 0 10 20 30 40 50 Height (cm) [5] (c) Use your cumulative frequency curve to estimate (i) the median height, … cm [1] (ii) the interquartile range, … cm [2] (iii) the number of plants with a height of more than 37 cm. … [2] (d) (i) Complete this table of frequency densities for the 120 plants. Height 0 1 h G 10 10 1 h G 20 20 1 h G 25 25 1 h G 30 30 1 h G 35 35 1 h G 40 40 1 h G 50(h cm) Frequency 0 1.6density [2] (ii) Draw a histogram to show this information. 7 6 5 Frequency 4 density 3 2 1 0 h 0 10 20 30 40 50 Height (cm) [3]
17 marks
Mark scheme: 4(a) 27.7 or 27.70 to 27.71 2 M1 for at least 3 midpoints soi 4(b) Correct cf curve 5 Curve/polygon through (10, 0), (20, 16), (25, 44), (30, 76), (35, 100), (40, 114), (50, 120) or B4 for curve through 5 or 6 points or 7 points with no curve or B3 for 'correct curve' through all other consistent points in interval or B2 for all correct cfs or B1 for 4 or 5 correct cfs. If 0 scored SC1 for any cumulative frequency diagram. 4(c)(i) 26 to 28 1 Dep on increasing curve FT 4(c)(ii) 9 to 11.5 2 Dep on increasing curve FT B1 for lq = 22 to 23.5 or uq = 32.5 to 33.5 4(c)(iii) 10 to 15 2 Dep on increasing curve FT B1 for 105 to 110 seen 4(d)(i) 5.6, 6.4, 4.8, 2.8, 0.6 2 B1 for 3 or 4 correct 4(d)(ii) Correct histogram 3 B2 FT for bars with their heights or B1FT for 3 or 4 bars with their heights or bars with all correct widths
This question in 0607/41 May/June 2019
Q6 · Jian asks 60 people what their favourite type of television programme is 0607/41 May/June 2019
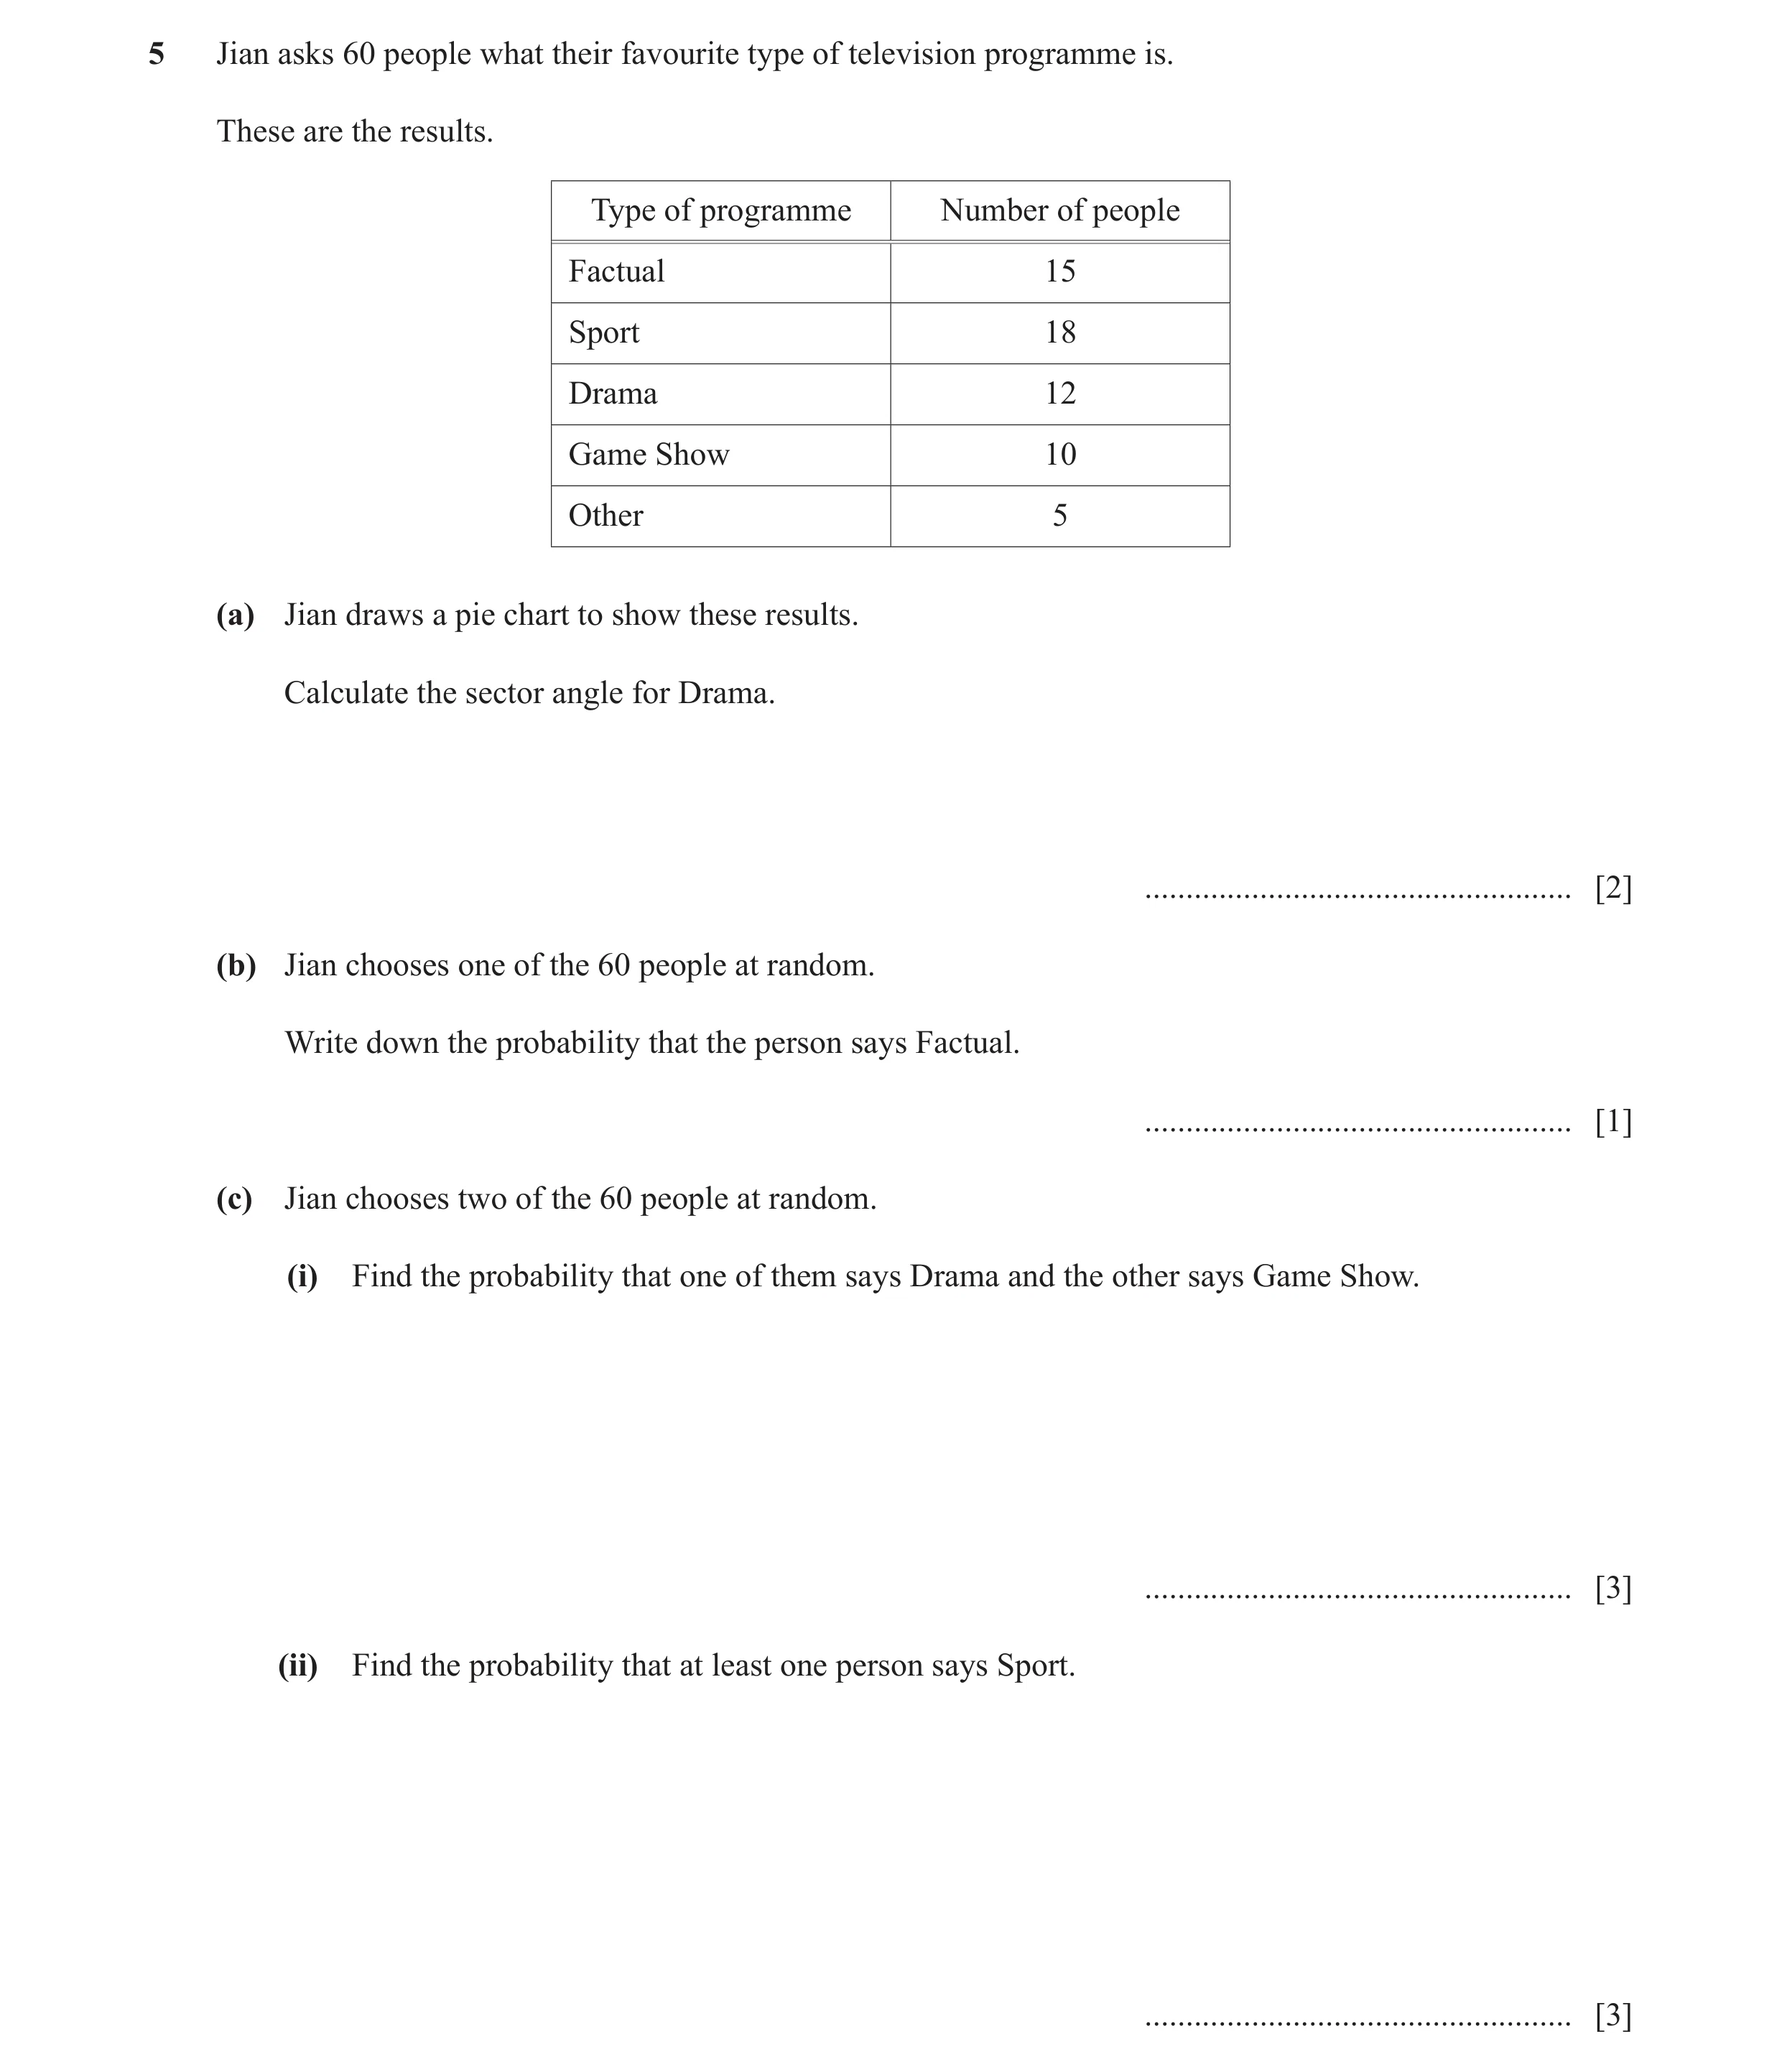
5 Jian asks 60 people what their favourite type of television programme is. These are the results. Type of programme Number of people Factual 15 Sport 18 Drama 12 Game Show 10 Other 5 (a) Jian draws a pie chart to show these results. Calculate the sector angle for Drama. … [2] (b) Jian chooses one of the 60 people at random. Write down the probability that the person says Factual. … [1] (c) Jian chooses two of the 60 people at random. (i) Find the probability that one of them says Drama and the other says Game Show. … [3] (ii) Find the probability that at least one person says Sport. … [3]
9 marks
Mark scheme: 5(a) 72 2 12 M1 for × 360 60 5(b) 1 1 oe 4 5(c)(i) 4 3 12 10 10 12 oe M2 for × + × oe 59 60 59 60 59 12 10 10 12 2 or M1 for × or × soi 60 59 60 59 59 5(c)(ii) 303 3 42 41 oe M2 for 1 – × oe 590 60 59 18 42 42 18 18 17 or × + × + × 60 59 60 59 60 59 18 42 42 18 18 17 or M1 for × or × or × 60 59 60 59 60 59 42 41 or × 60 59
This question in 0607/41 May/June 2019
Q7 · 240 students take part in a charity run 0607/42 May/June 2019
9 240 students take part in a charity run. The table shows information about the times, t minutes, taken to complete the run. Time (t minutes) 20 1 t G 40 40 1 t G 50 50 1 t G 55 55 1 t G 75 Number of students 20 70 120 30 (a) Write down the time interval that contains the median. … 1 t G … [1] (b) Calculate an estimate of the mean. … min [2] (c) Complete the histogram to show the information in the table. 25 20 Frequency 15 density 10 5 0 t 20 30 40 50 60 70 80 Time (minutes) [4] (d) (i) One of the 240 students is chosen at random. Find the probability that this student took more than 55 minutes to complete the run. … [1] (ii) Two students are chosen at random from the 240 students. Calculate the probability that they both took more than 50 minutes. … [2] (iii) Two students are chosen at random from the 240 students. Complete the statement. 161 The probability that they both had times in the interval … 1 t G … is . 1912 [2]
12 marks
Mark scheme: 9(a) 50 < t ⩽ 55 1 Allow e.g. 50 to 55 9(b) 50 2 M1 for at least three of 30, 45, 52.5, 65 soi 9(c) Correct histogram 4 B1 for each correct column height. B1 for all widths correct If 0 scored, SC1 for 7, 24, 1.5 seen 9(d)(i) 30 1 oe 240 9(d)(ii) 22350 2 150 149 oe M1 for × 57360 240 239 9(d)(iii) 40 ... 50 2 k k − 1 M1 for × attempted 240 239
This question in 0607/42 May/June 2019
Q8 · The mass of each of 80 apples is shown in the table 0607/42 Oct/Nov 2019
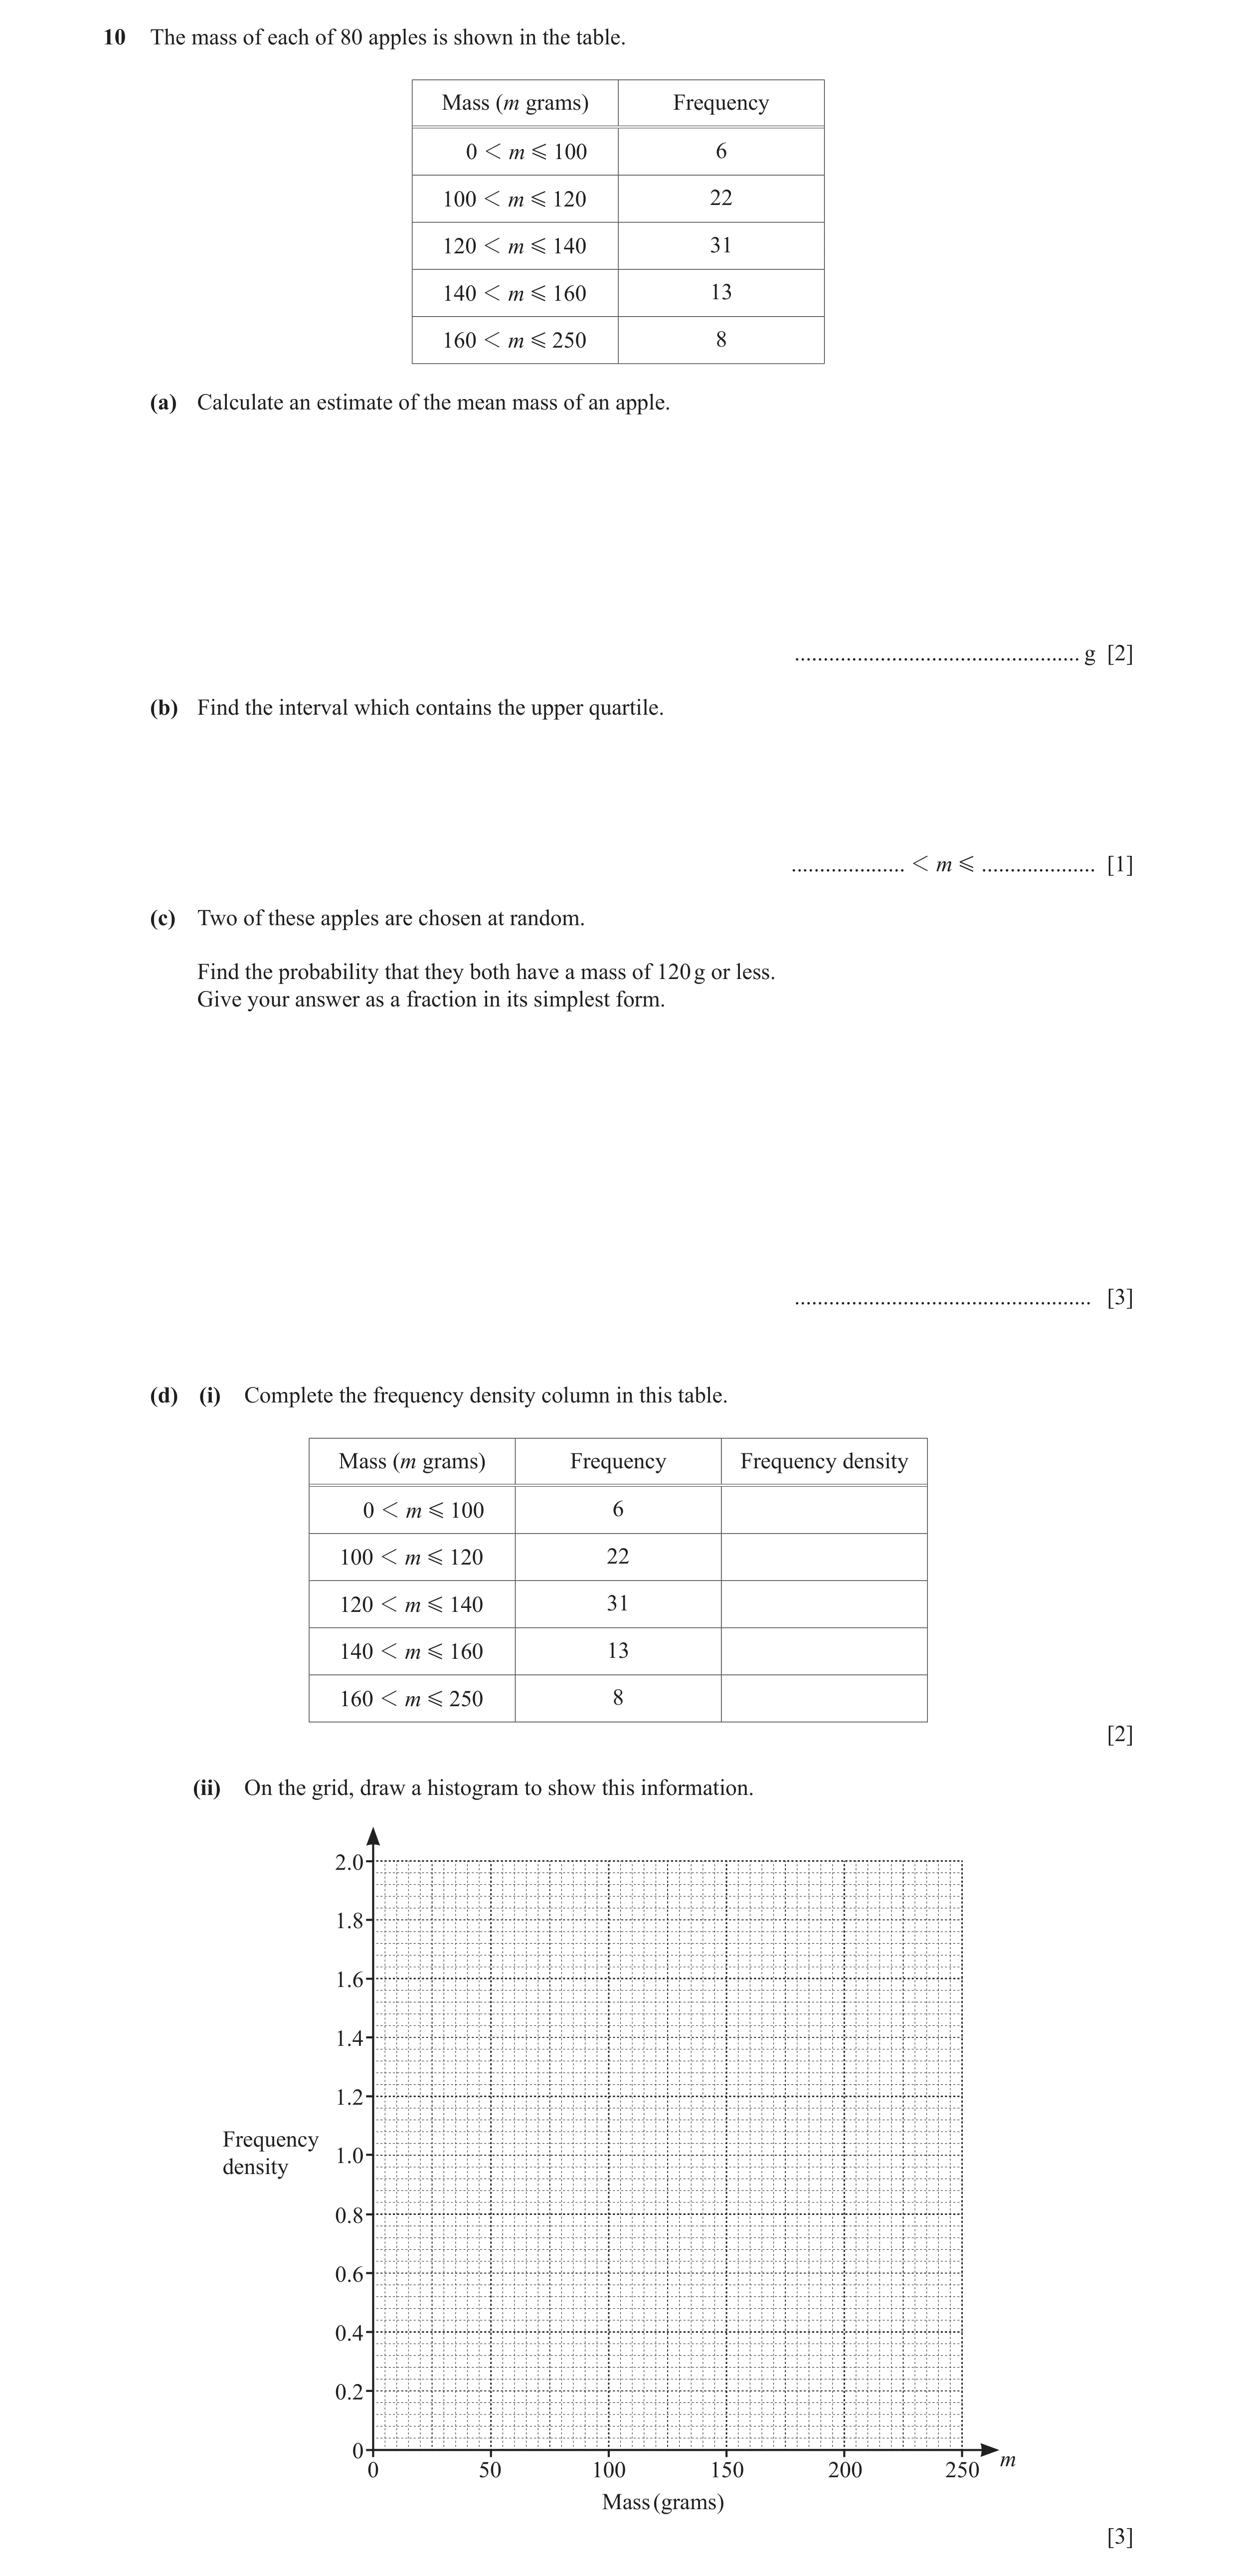
10 The mass of each of 80 apples is shown in the table. Mass (m grams) Frequency 0 1 m G 100 6 100 1 m G 120 22 120 1 m G 140 31 140 1 m G 160 13 160 1 m G 250 8 (a) Calculate an estimate of the mean mass of an apple. … g [2] (b) Find the interval which contains the upper quartile. … 1 m G … [1] (c) Two of these apples are chosen at random. Find the probability that they both have a mass of 120 g or less. Give your answer as a fraction in its simplest form. … [3] (d) (i) Complete the frequency density column in this table. Mass (m grams) Frequency Frequency density 0 1 m G 100 6 100 1 m G 120 22 120 1 m G 140 31 140 1 m G 160 13 160 1 m G 250 8 [2] (ii) On the grid, draw a histogram to show this information. 2.0 1.8 1.6 1.4 1.2 Frequency 1.0 density 0.8 0.6 0.4 0.2 0 m 0 50 100 150 200 250 Mass (grams) [3]
11 marks
Mark scheme: 10(a) 129.25 2 M1 for at least 3 of 50, 110, 130, 150, 205 seen 10(b) 140[ < m ⩽] 160 1 10(c) 189 3 756 B2 for 0.12[0] or 0.1196... or oe 1580 6320 28 27 or M1 for × 80 79 10(d)(i) 0.06, 1.1, 1.55, 0.65, 0.0889 or 2 B1 for 3 or 4 correct 0.08888 to 0.08889 10(d)(ii) Correct histogram 3 B1 for correct widths B2 FT for all heights correct or B1 FT for 3 or 4 correct heights
This question in 0607/42 Oct/Nov 2019
Q9 · The table shows the masses of 30 sheep 0607/42 May/June 2021
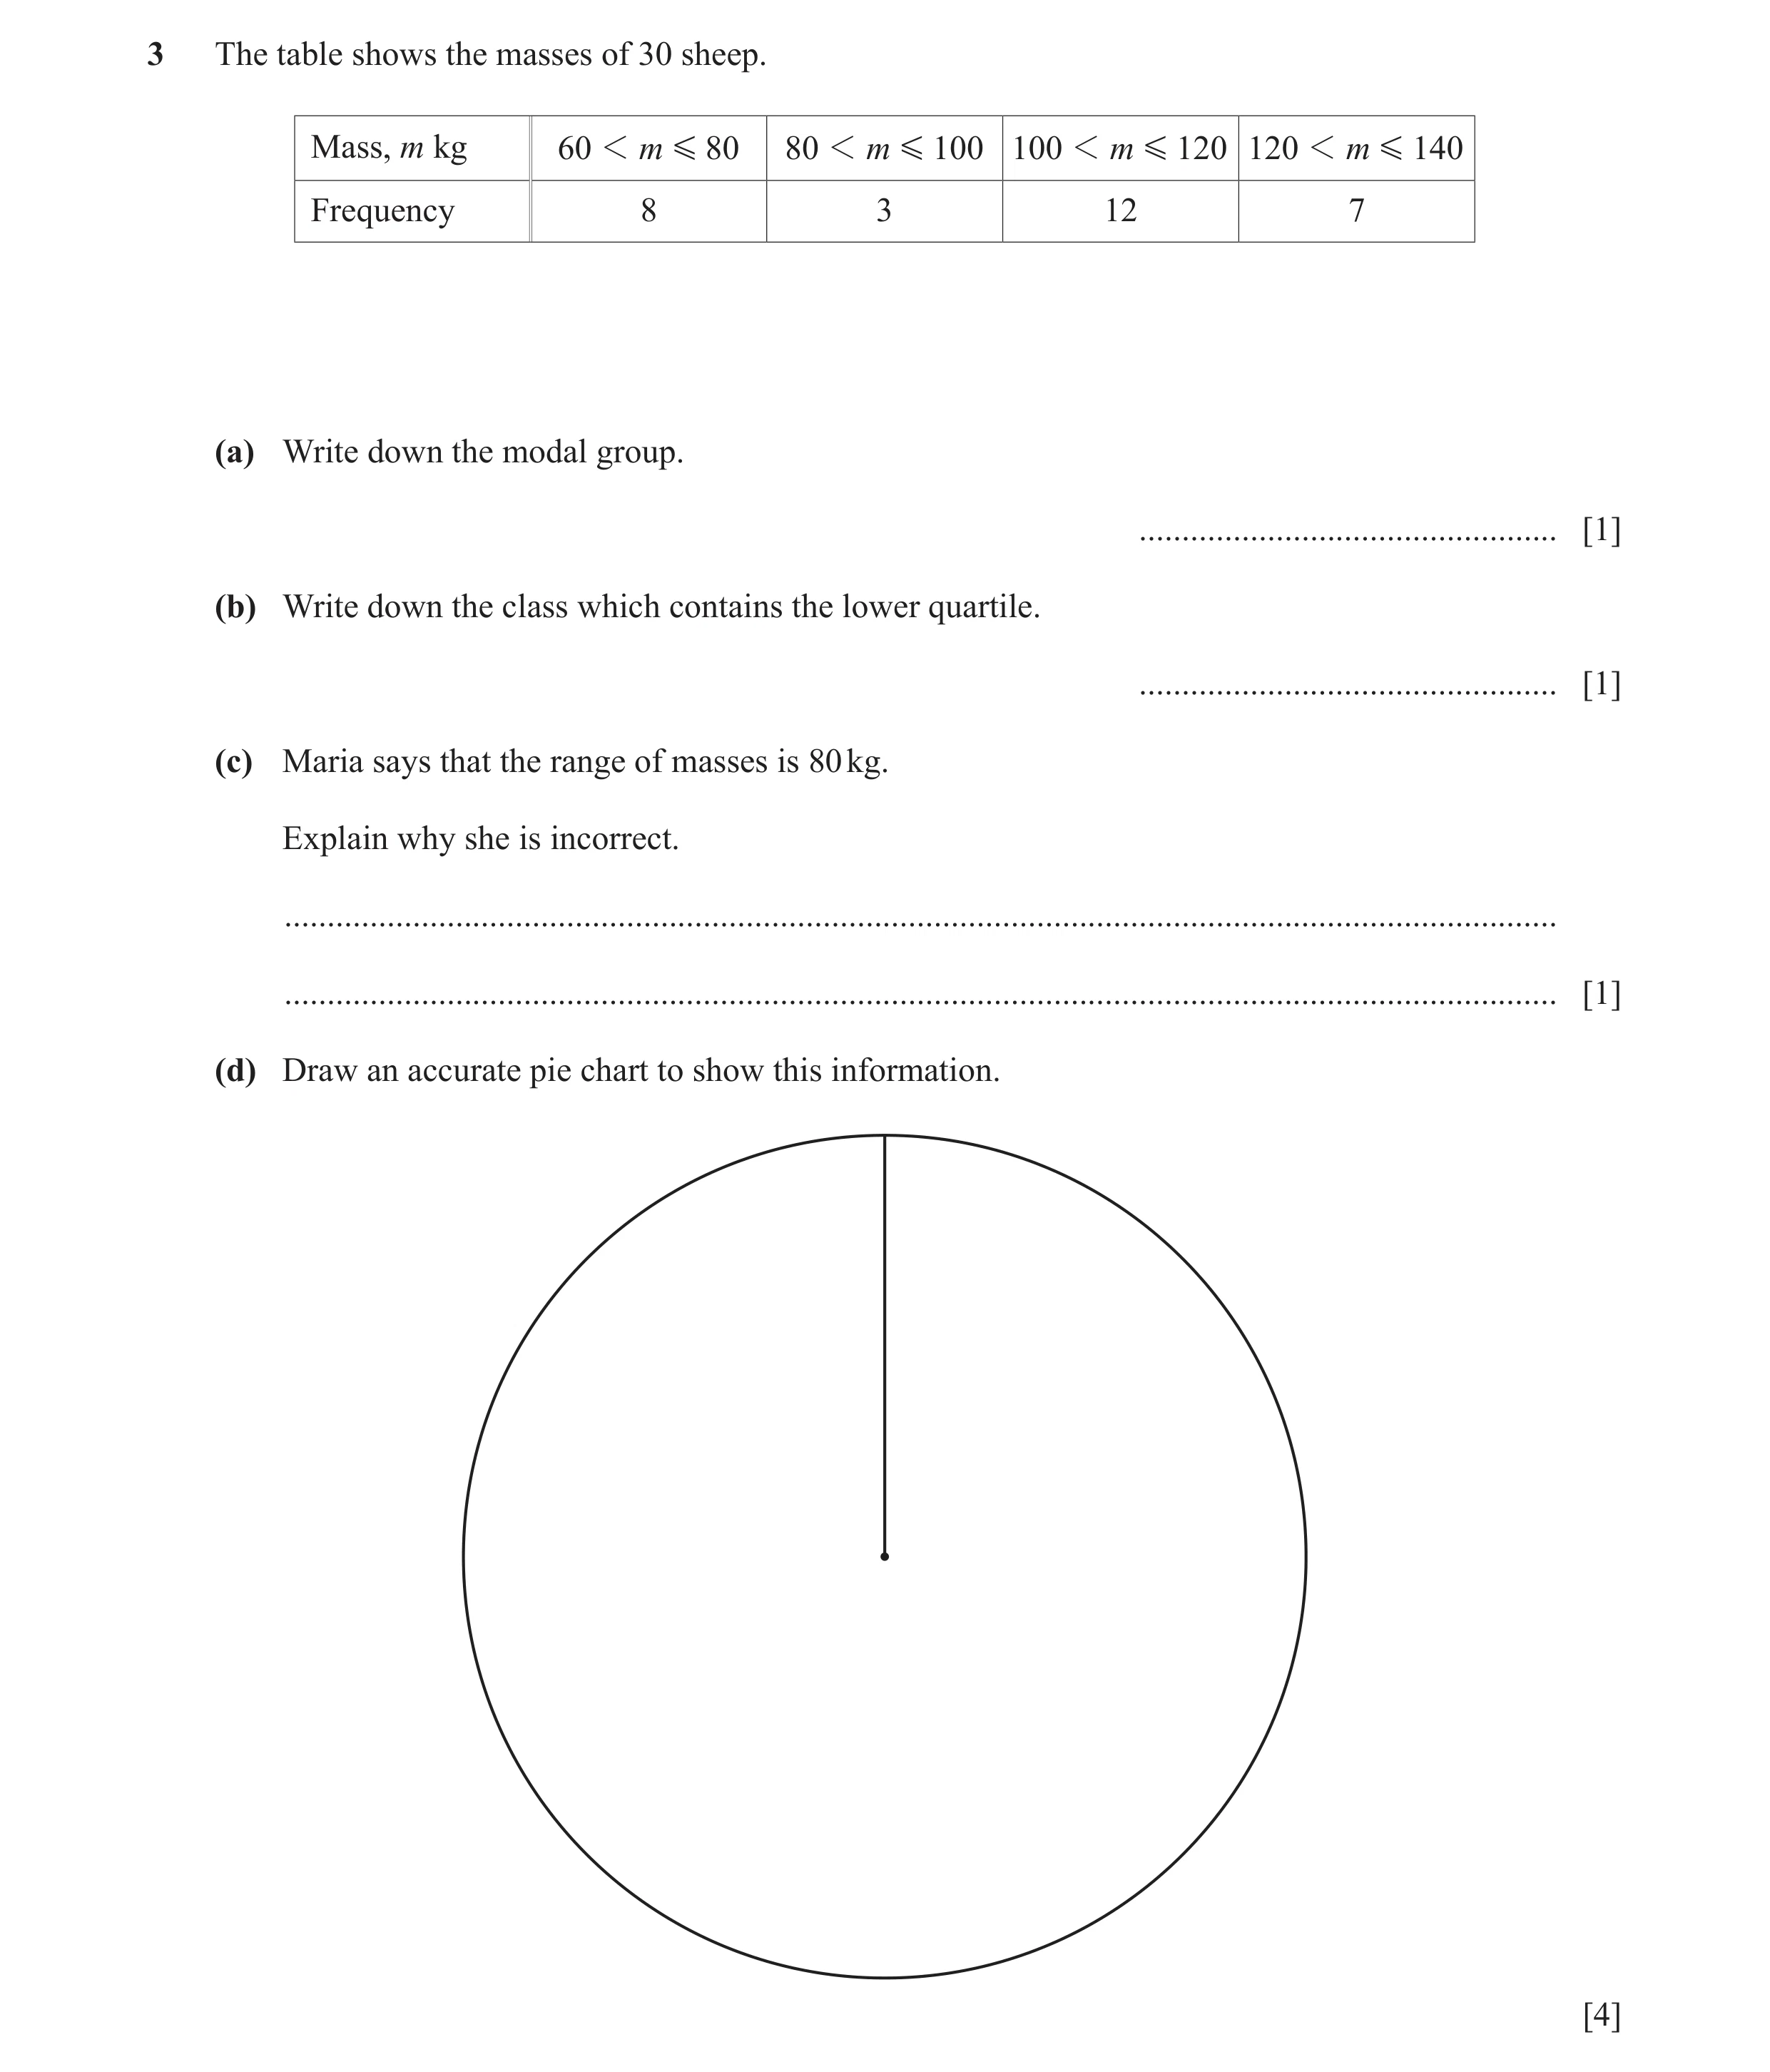
3 The table shows the masses of 30 sheep. Mass, m kg 60 1 m G 80 80 1 m G 100 100 1 m G 120 120 1 m G 140 Frequency 8 3 12 7 (a) Write down the modal group. … [1] (b) Write down the class which contains the lower quartile. … [1] (c) Maria says that the range of masses is 80 kg. Explain why she is incorrect. … … [1] (d) Draw an accurate pie chart to show this information. [4]
7 marks
Mark scheme: 3(a) 100 < m ⩽ 120 1 3(b) 60 < m ⩽ 80 1 3(c) Any correct statement 1 3(d) Correct labelled pie chart (labels 4 B3 for pie chart with all angles correct indicating masses) or B2 for pie chart with two angles correct or B1 for 2 correct angles calculated B1 for correct labels on sectors.
This question in 0607/42 May/June 2021
Q10 · 25 students each record the number of logic problems they solve in one hour 0607/41 May/June 2023
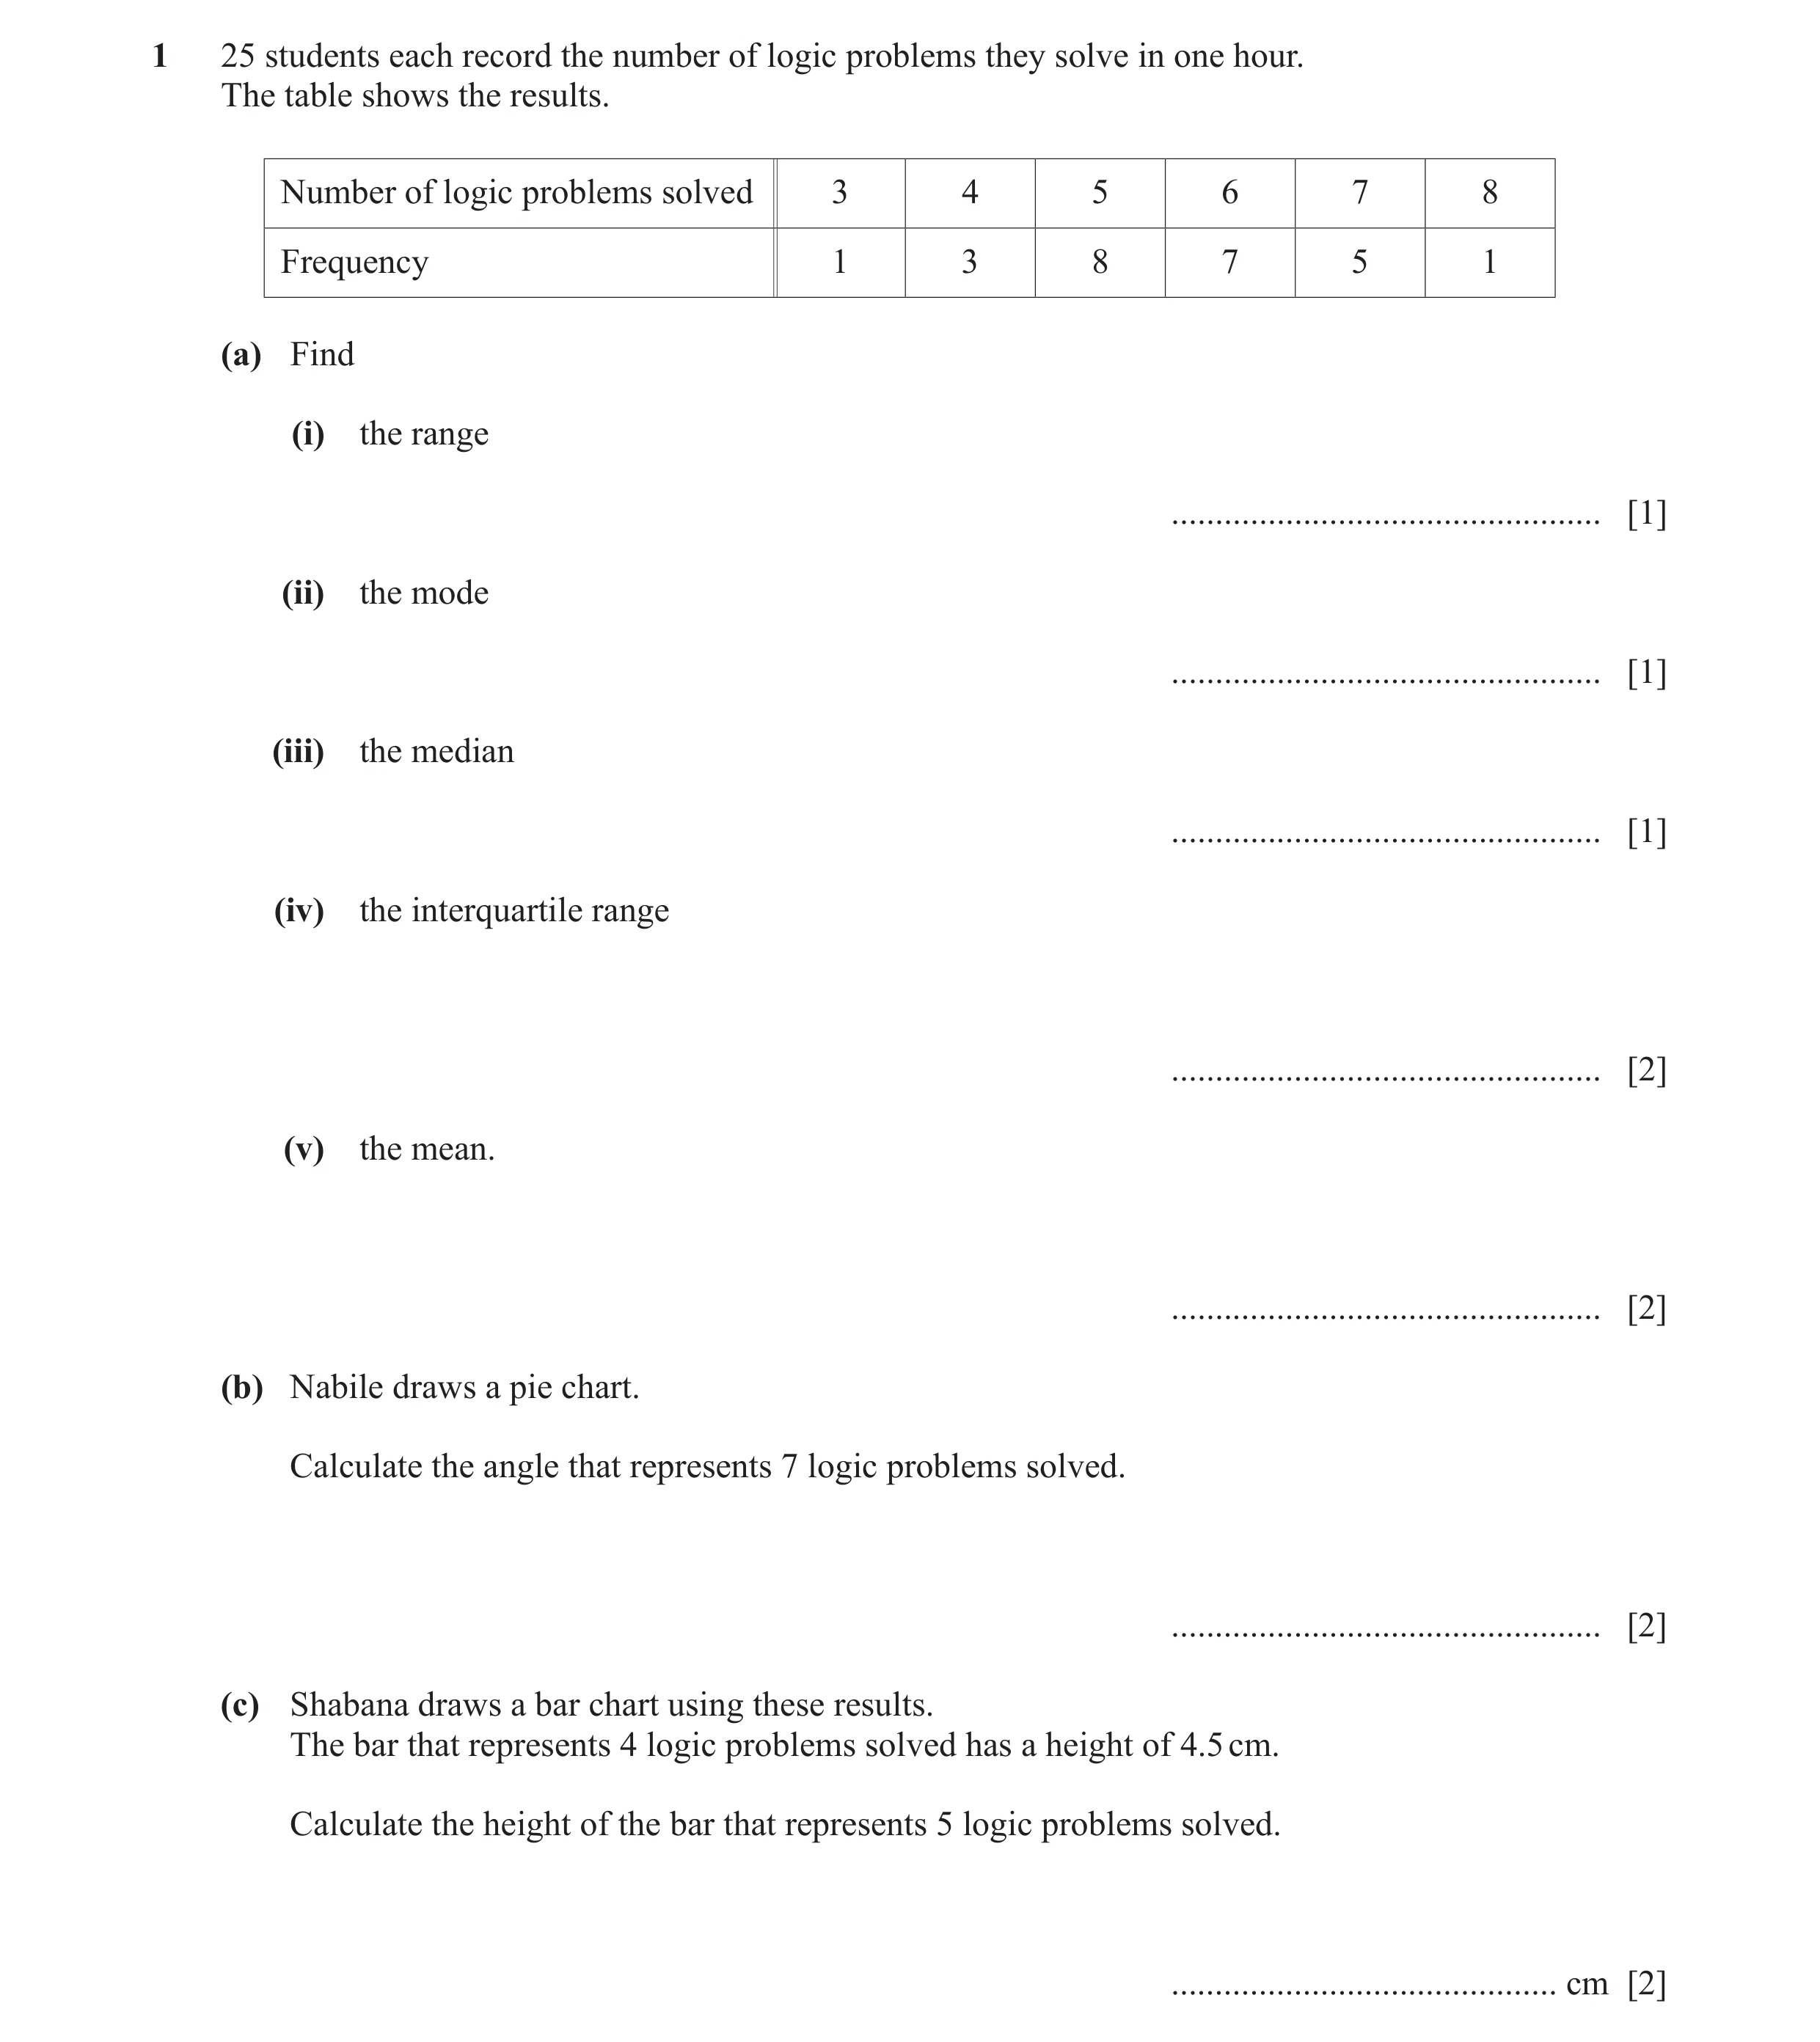
1 25 students each record the number of logic problems they solve in one hour. The table shows the results. Number of logic problems solved 3 4 5 6 7 8 Frequency 1 3 8 7 5 1 (a) Find (i) the range … [1] (ii) the mode … [1] (iii) the median … [1] (iv) the interquartile range … [2] (v) the mean. … [2] (b) Nabile draws a pie chart. Calculate the angle that represents 7 logic problems solved. … [2] (c) Shabana draws a bar chart using these results. The bar that represents 4 logic problems solved has a height of 4.5 cm. Calculate the height of the bar that represents 5 logic problems solved. … cm [2]
11 marks
Mark scheme: Question Answer Marks Partial Marks 1(a)(i) 5 1 1(a)(ii) 5 1 1(a)(iii) 6 1 1(a)(iv) 1.5 2 B1 for [u.q. = ] 6.5 or [l.q. = ] 5 1(a)(v) 3 2 M1 for 5.6 or 5 5 (1 3 + 3 4 + 8 5 + 7 6 + 7 5 + 1 8) 25 1(b) 72 2 5 360 M1 for [360] or [5] 25 25 1(c) 12 2 8 4.5 M1 for [4.5] or [8] 3 3
This question in 0607/41 May/June 2023
 10 / 15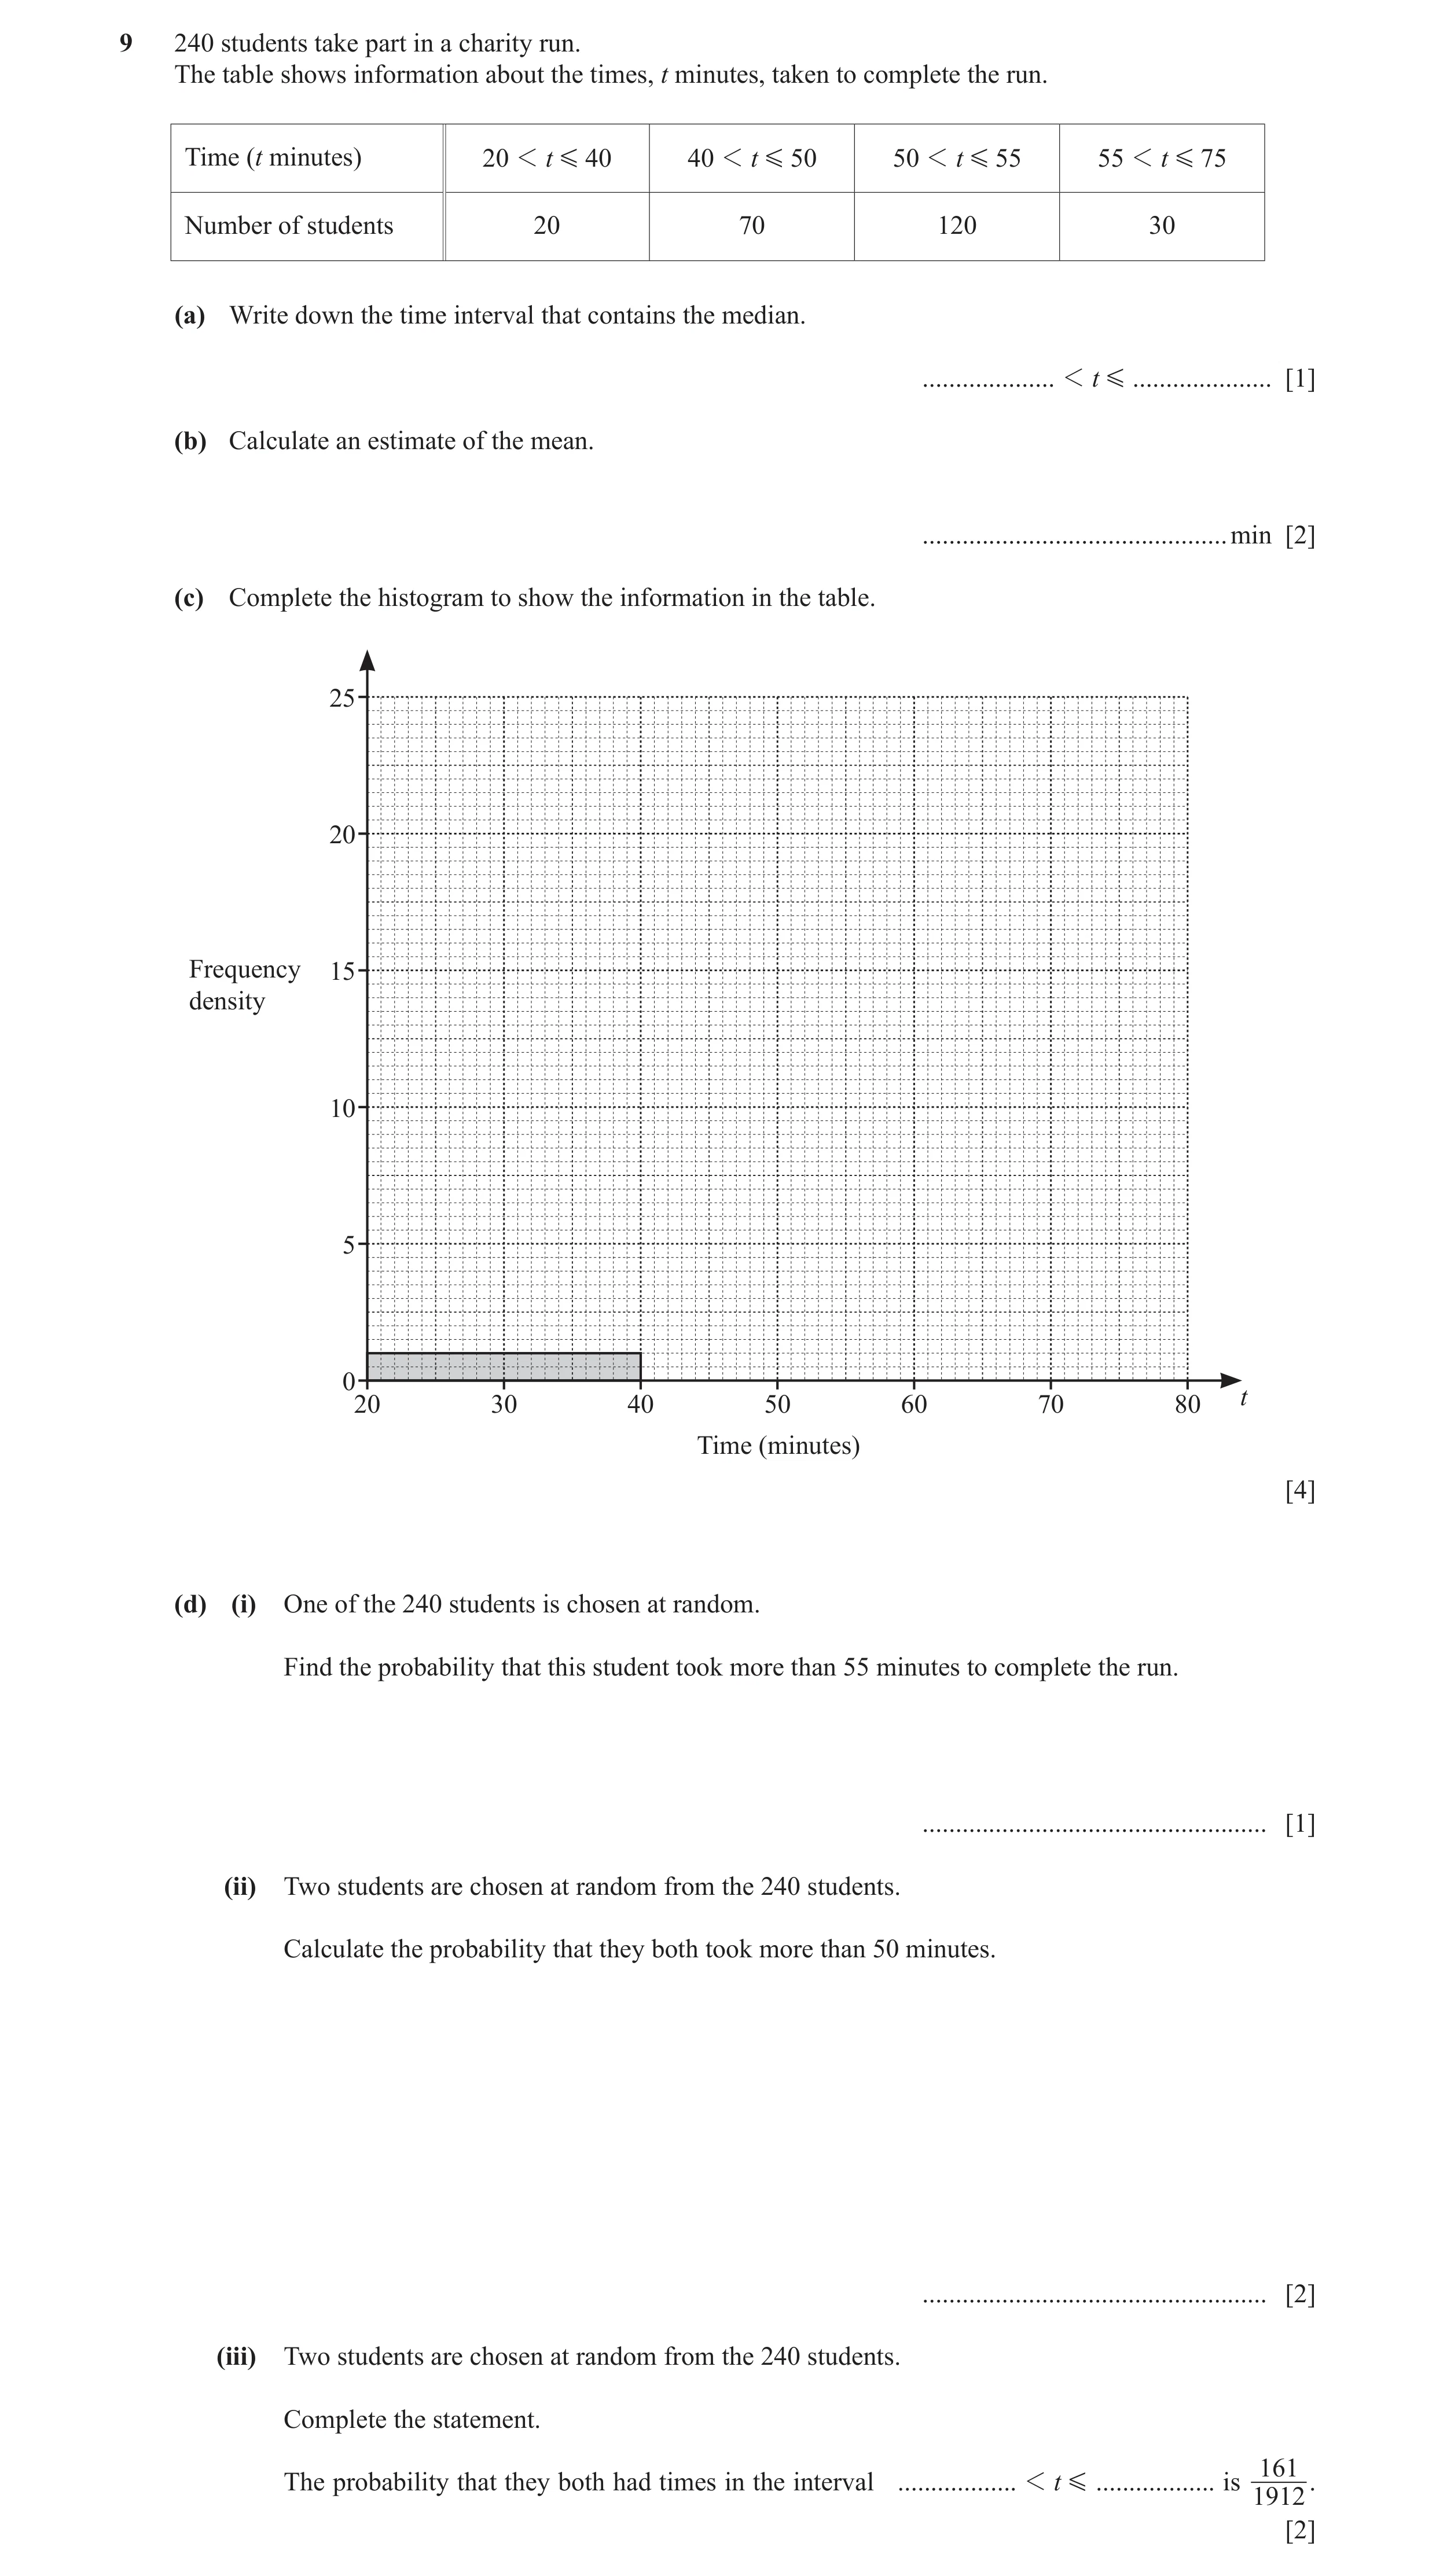
 14 / 15
 15 / 15
 11
11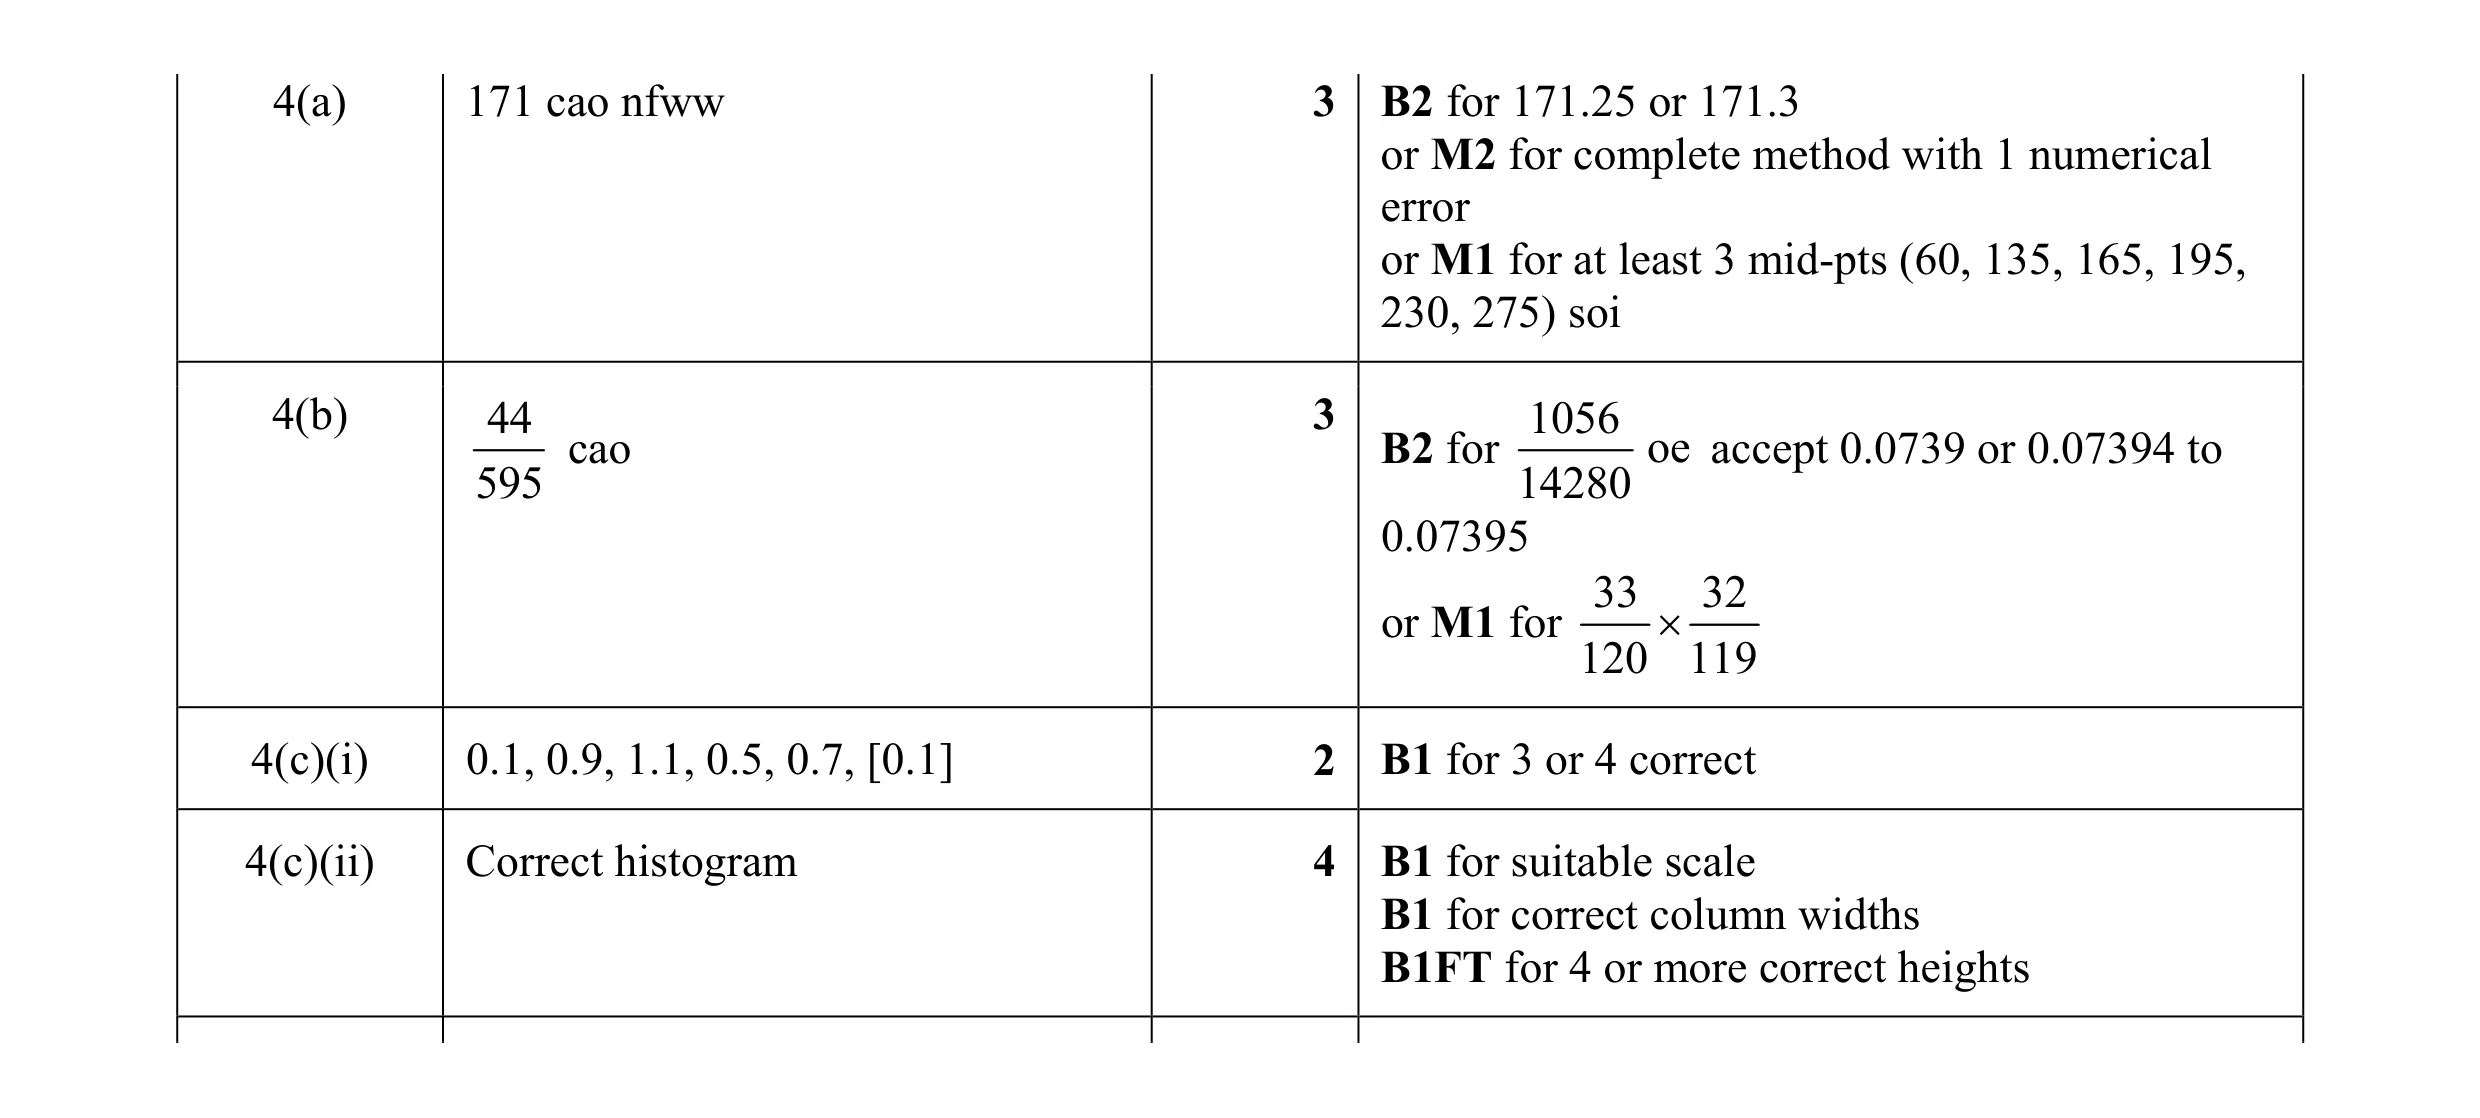 12
12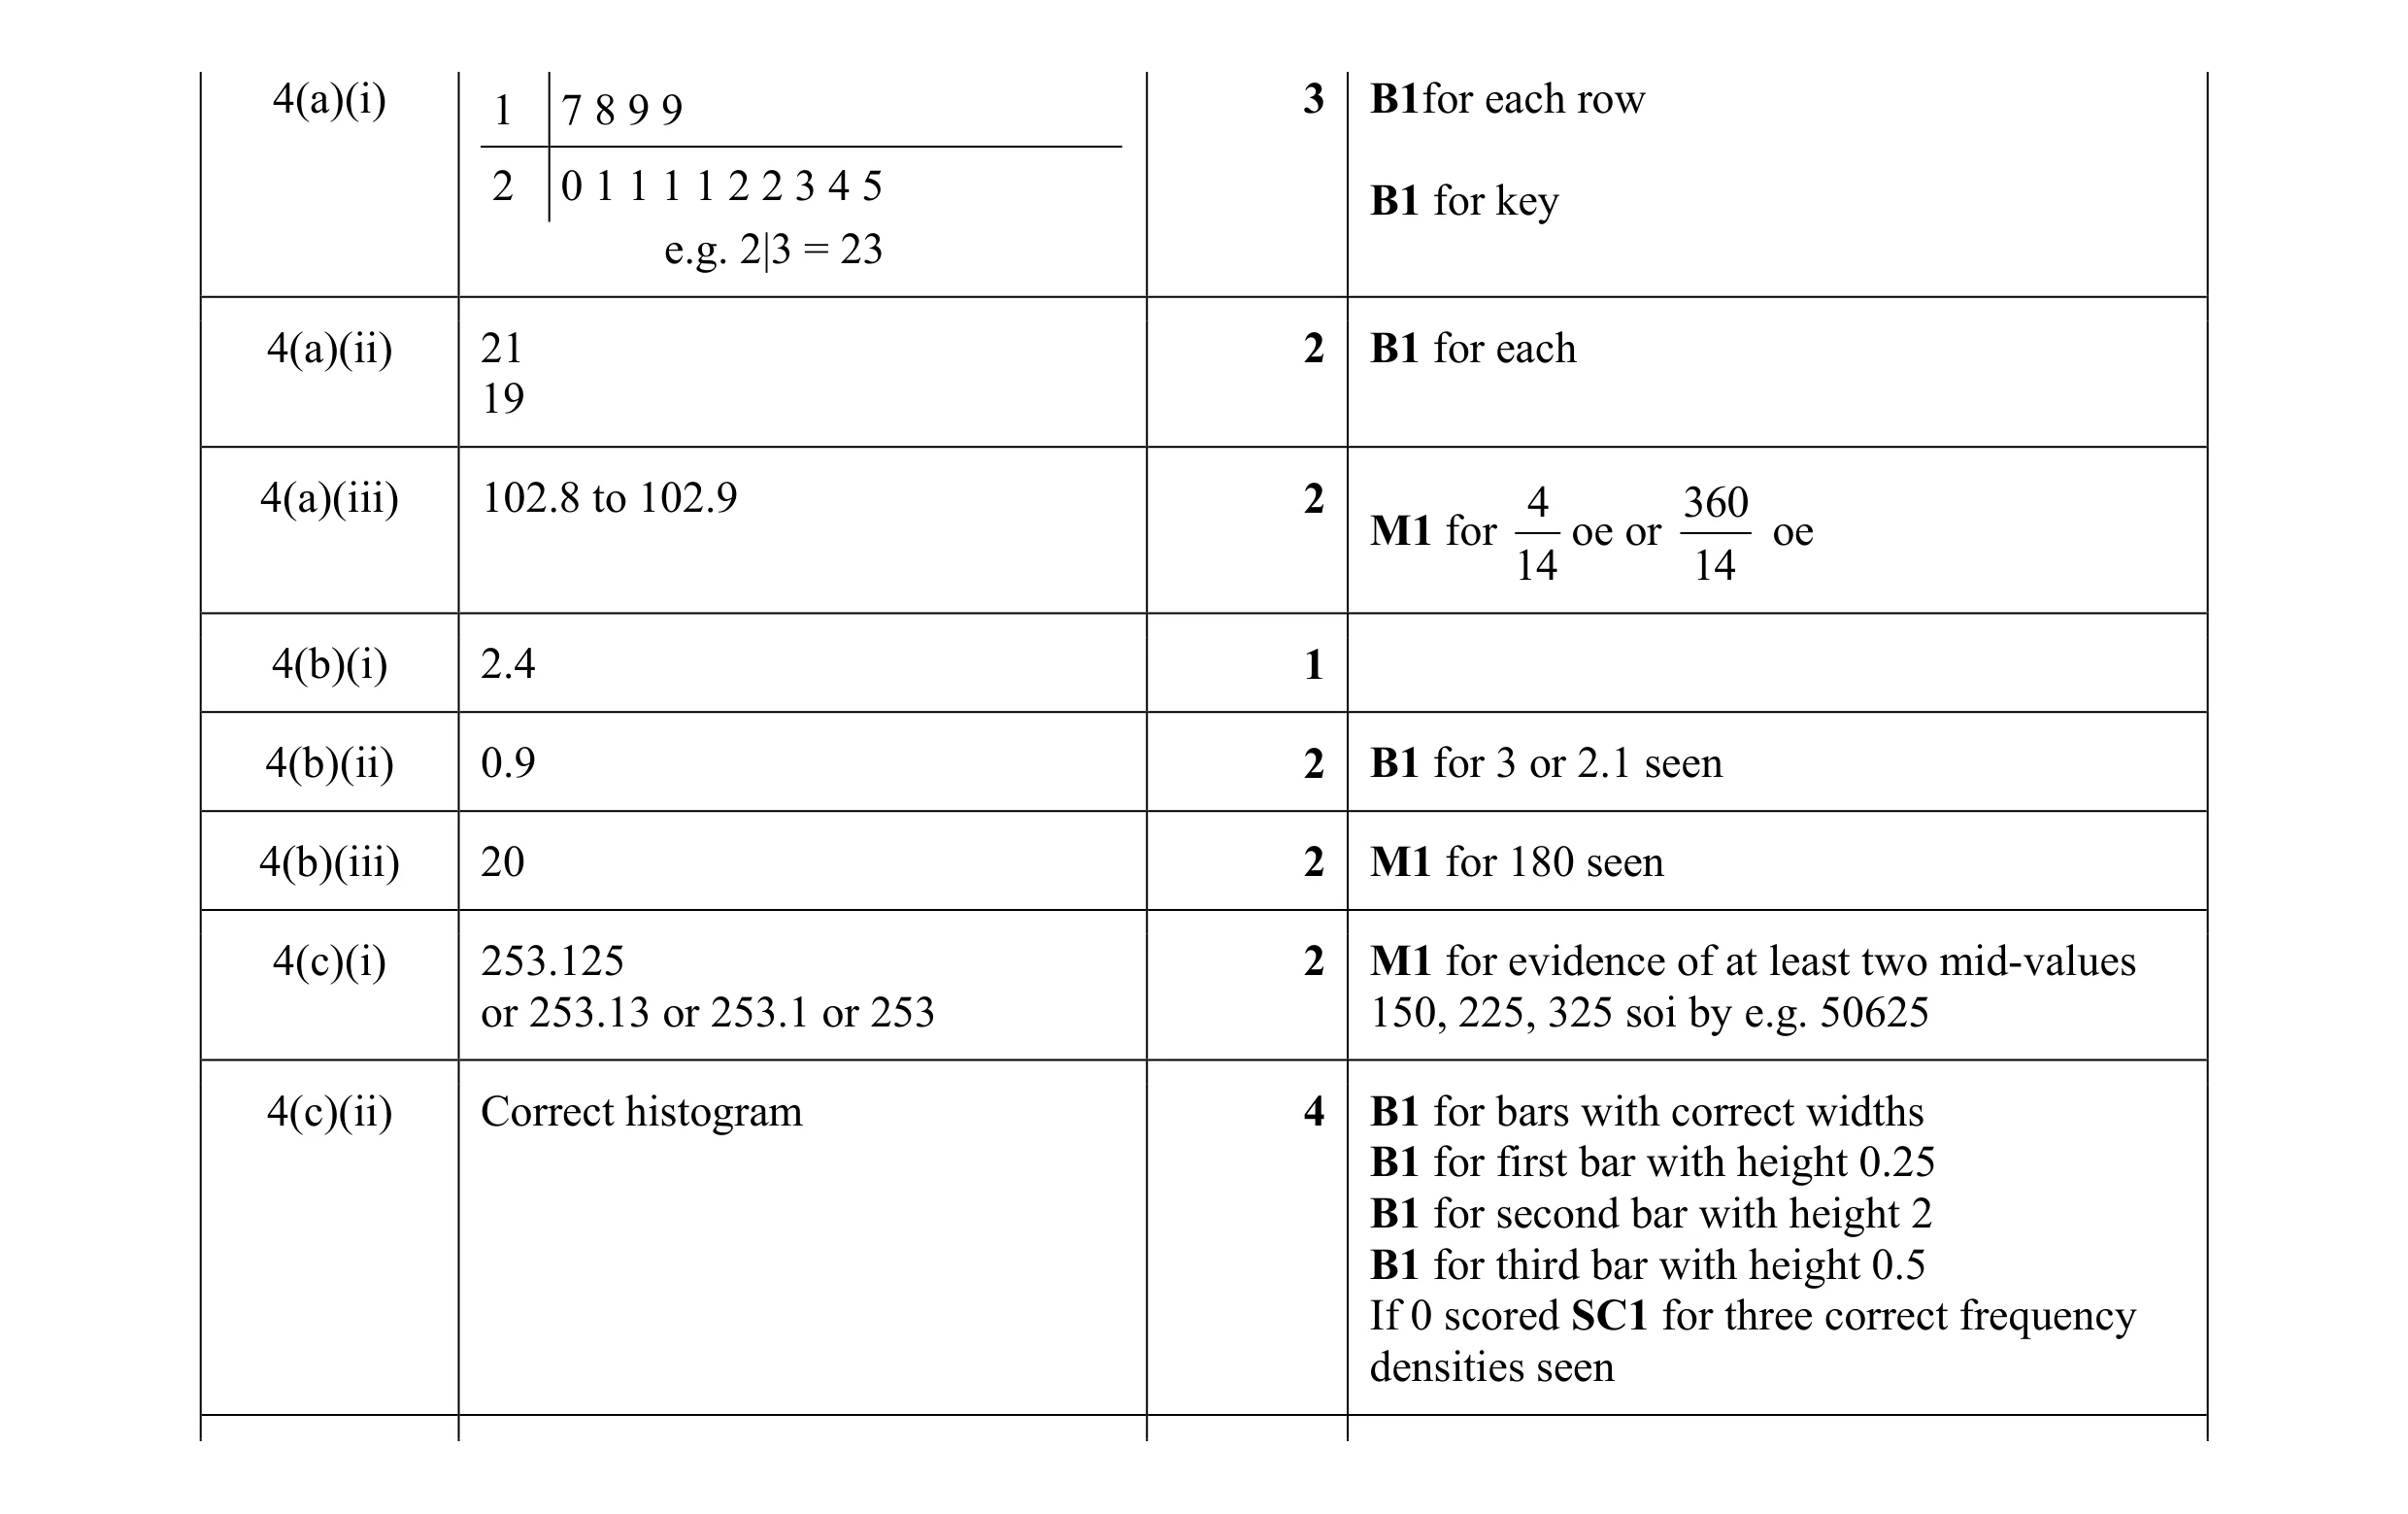 18
18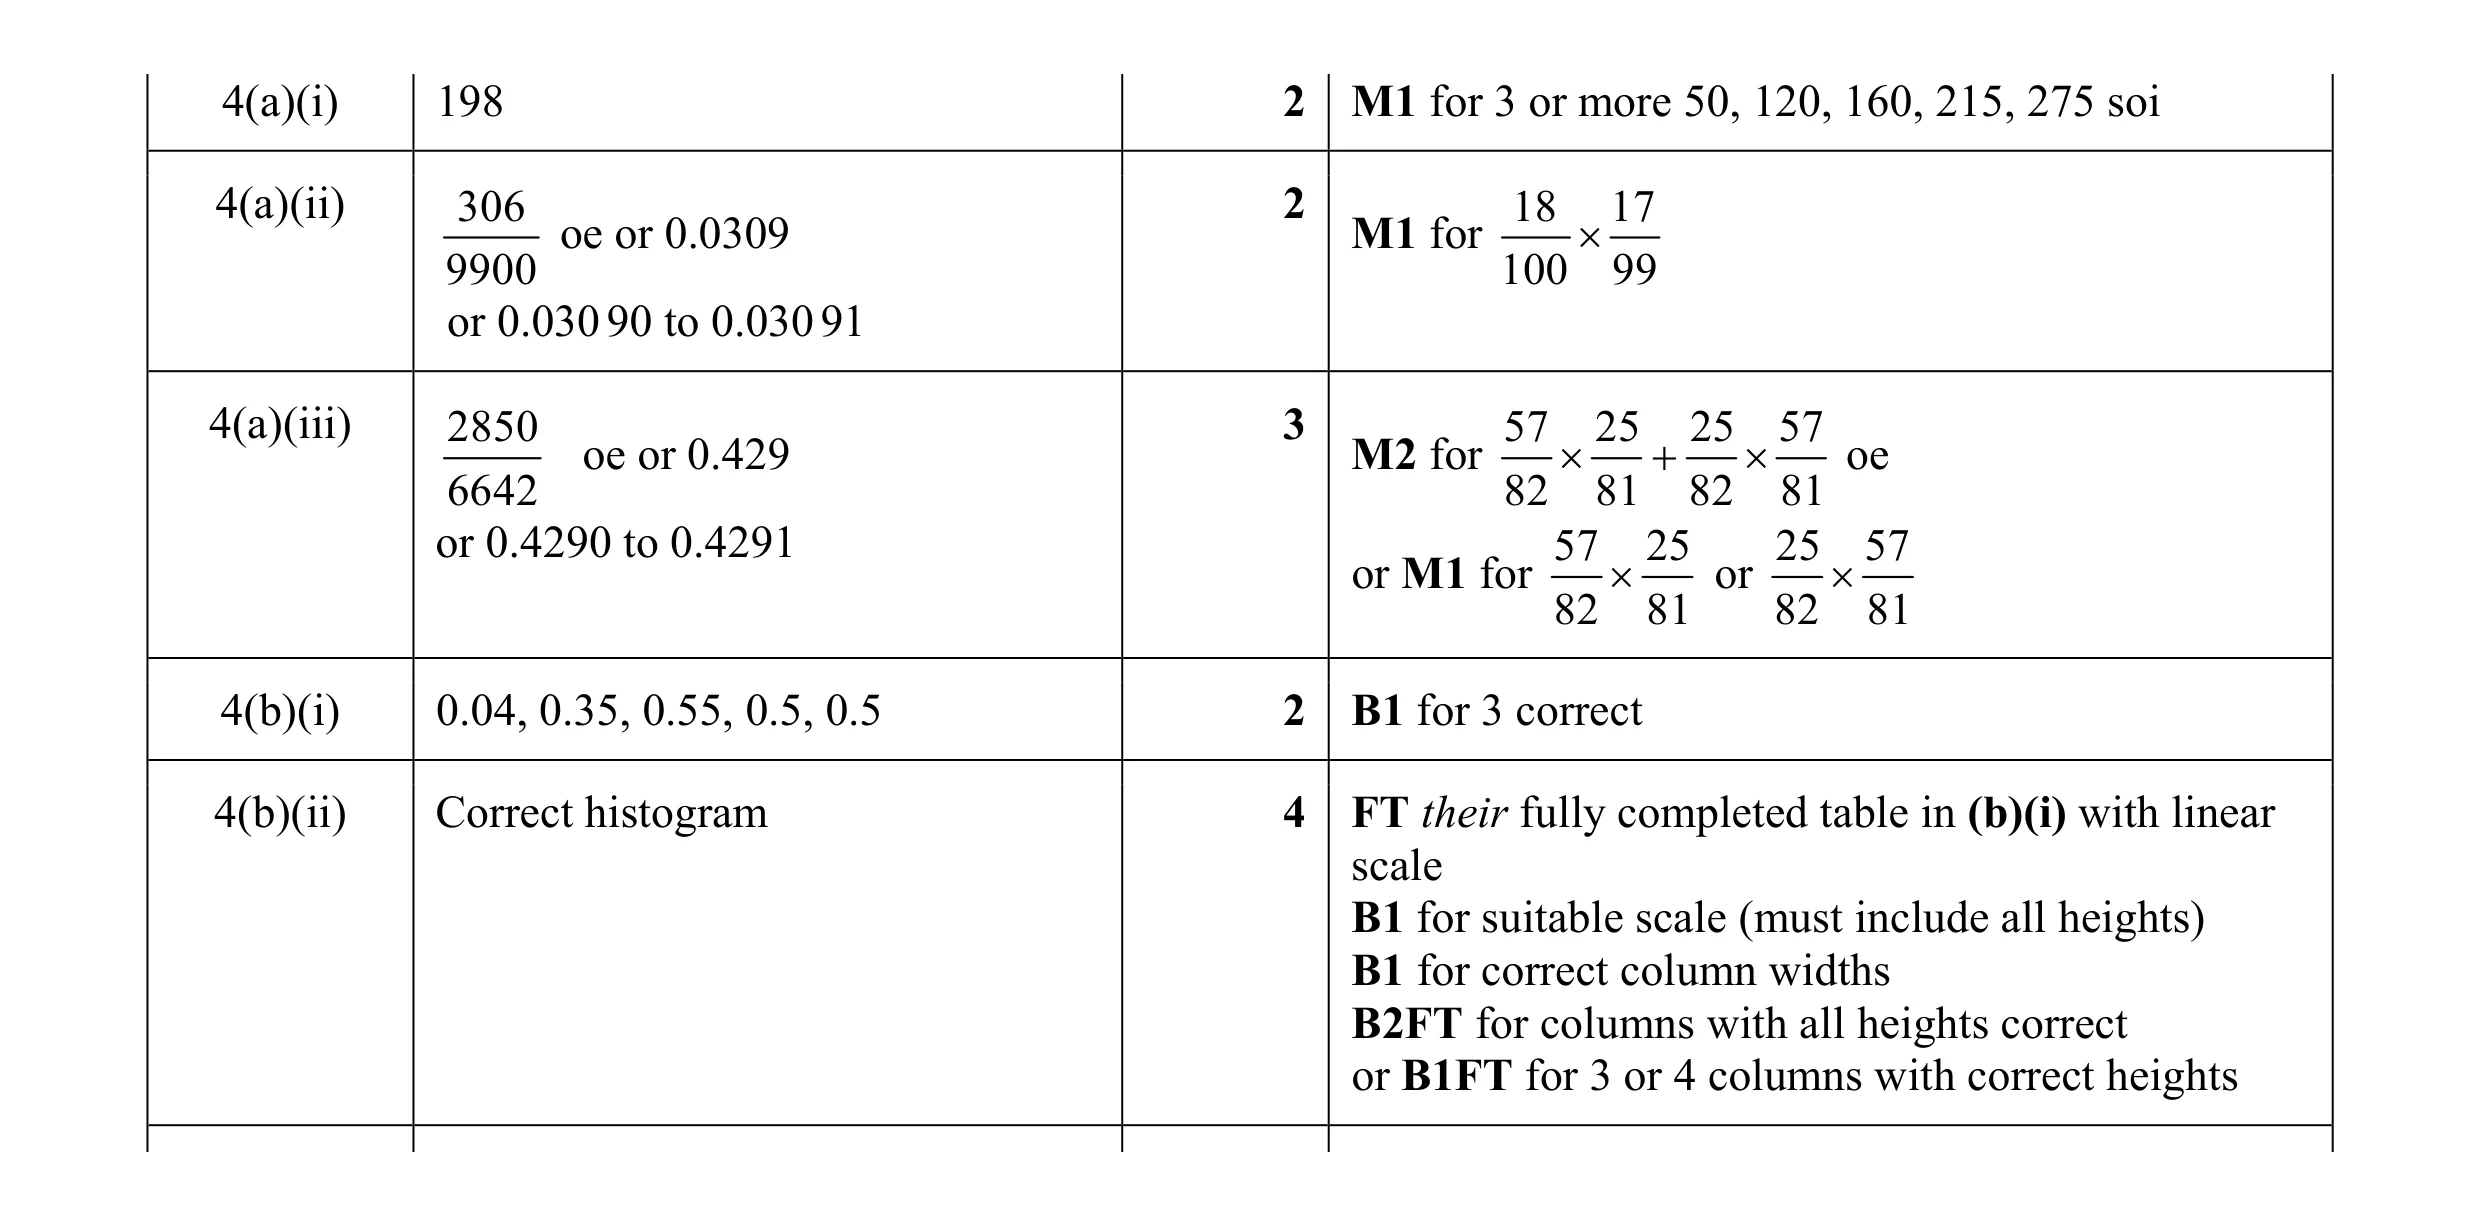 13
13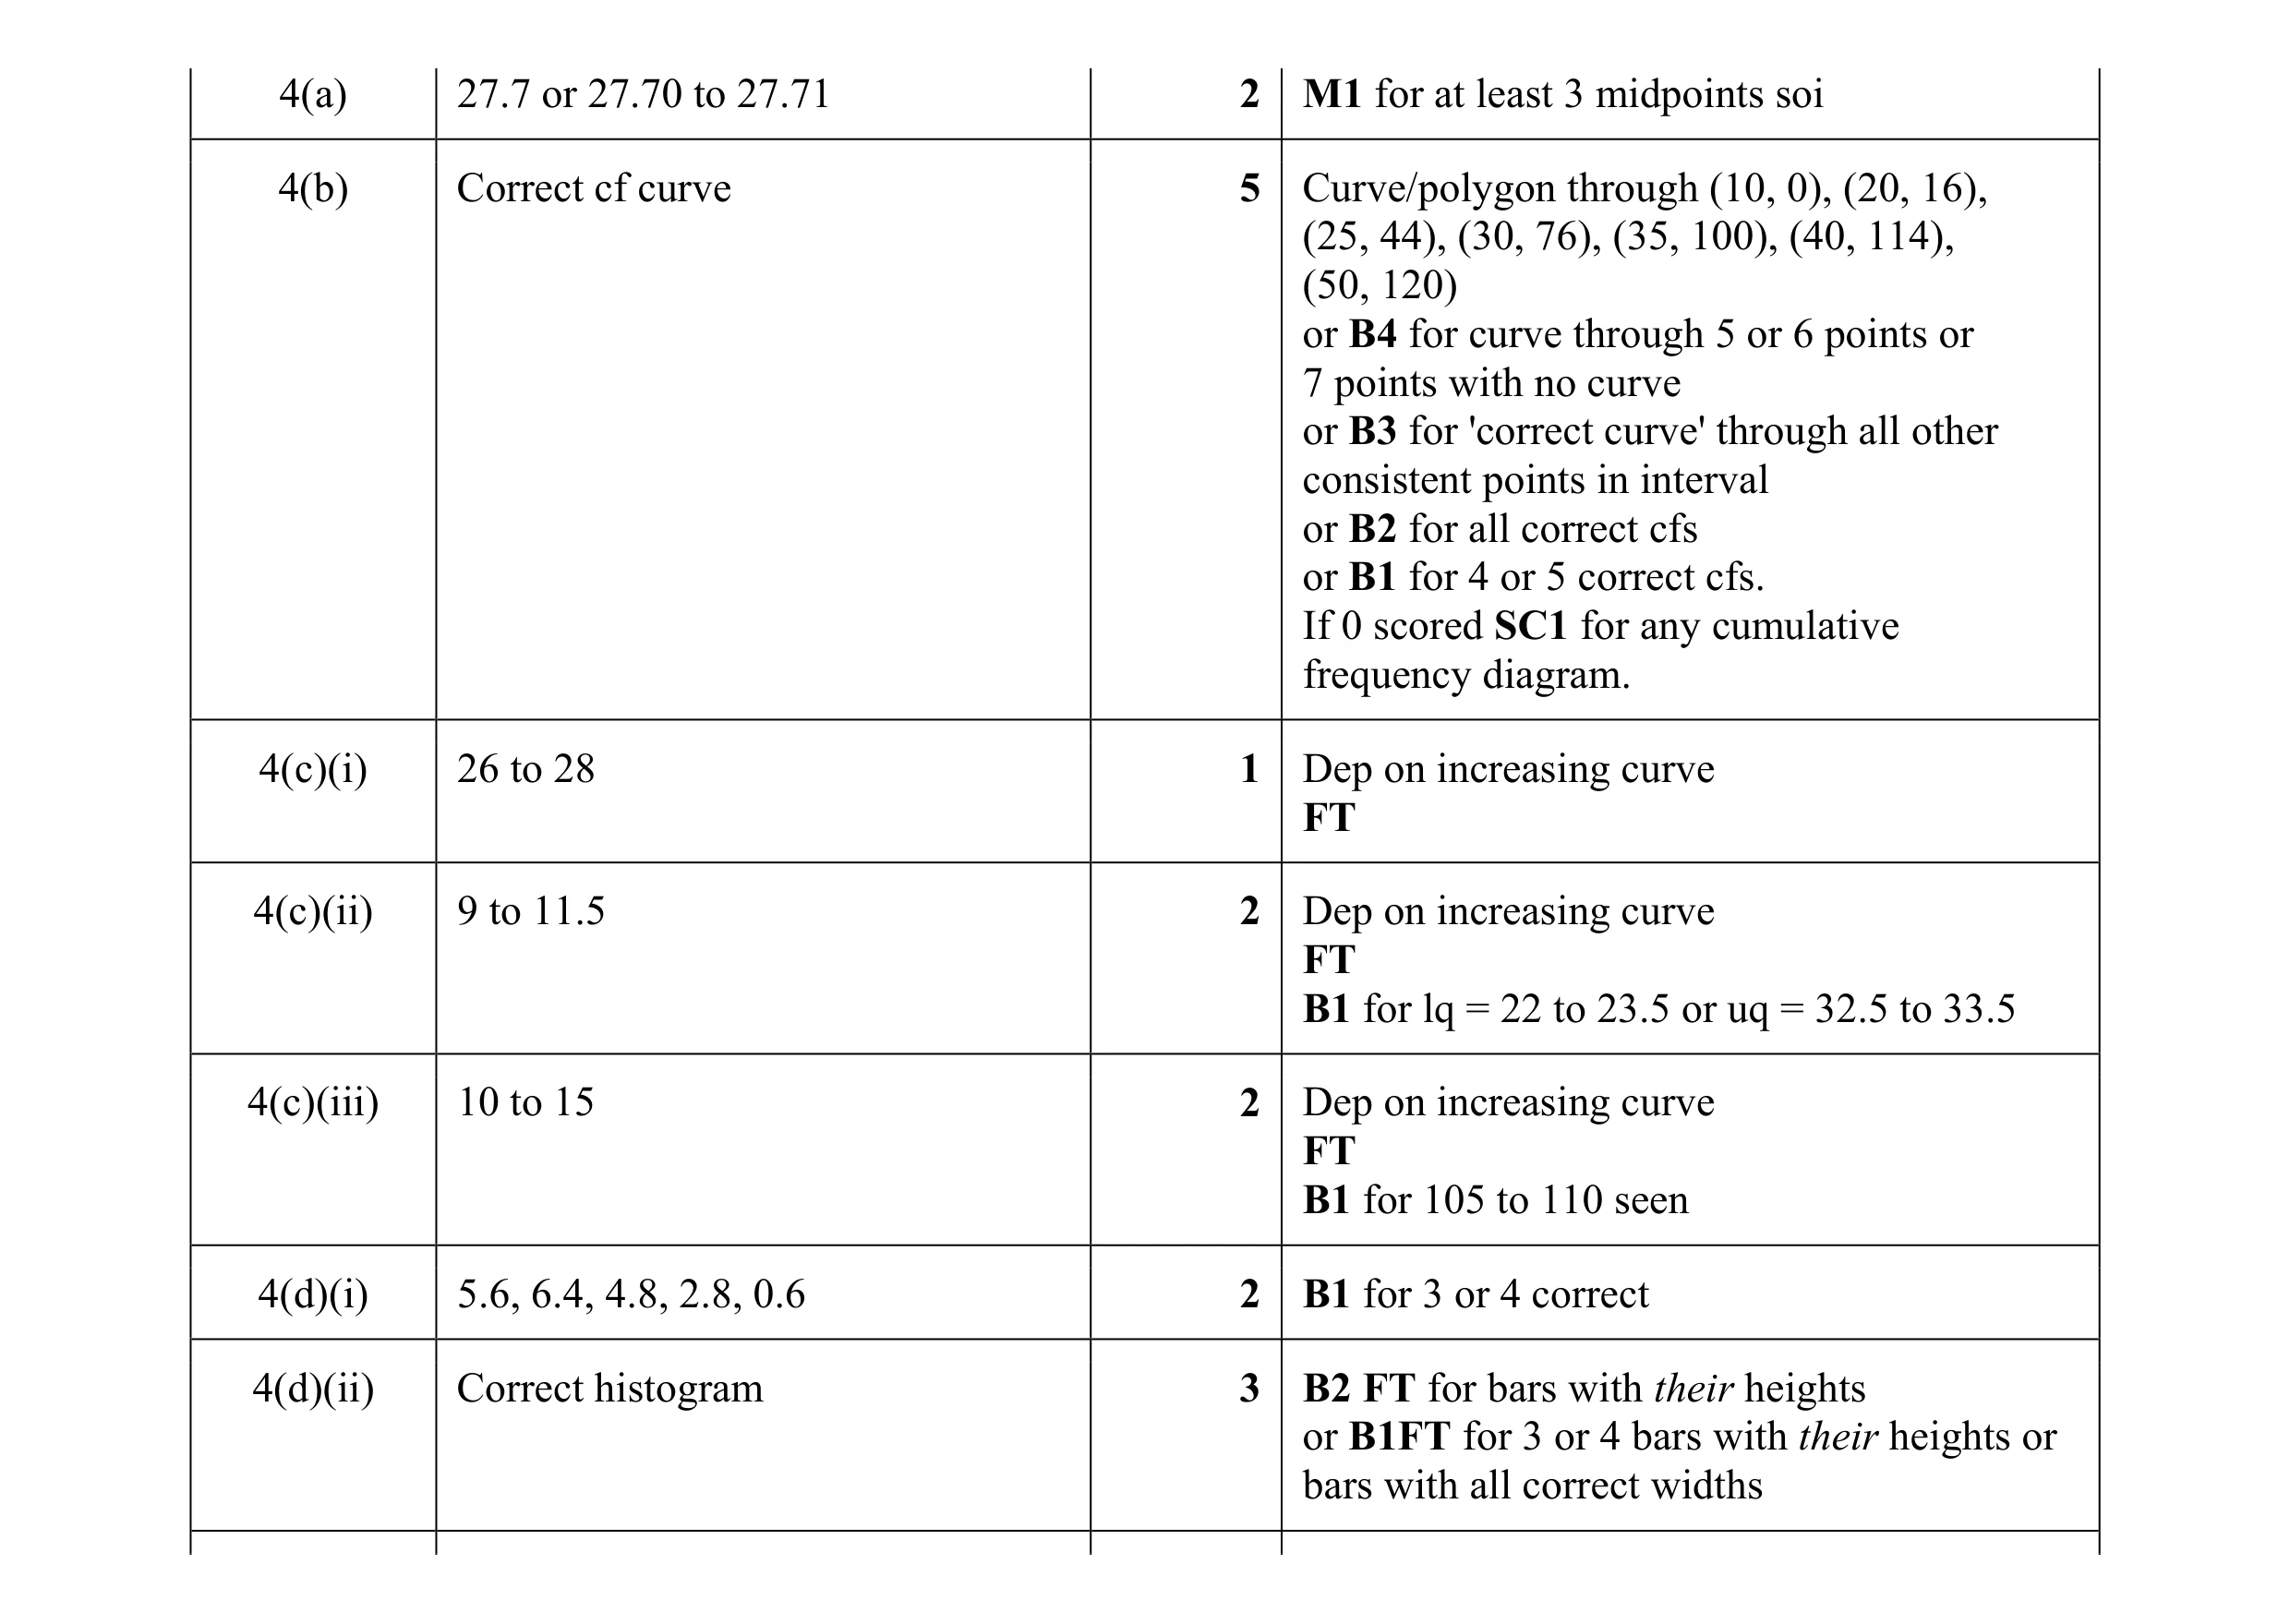 17
17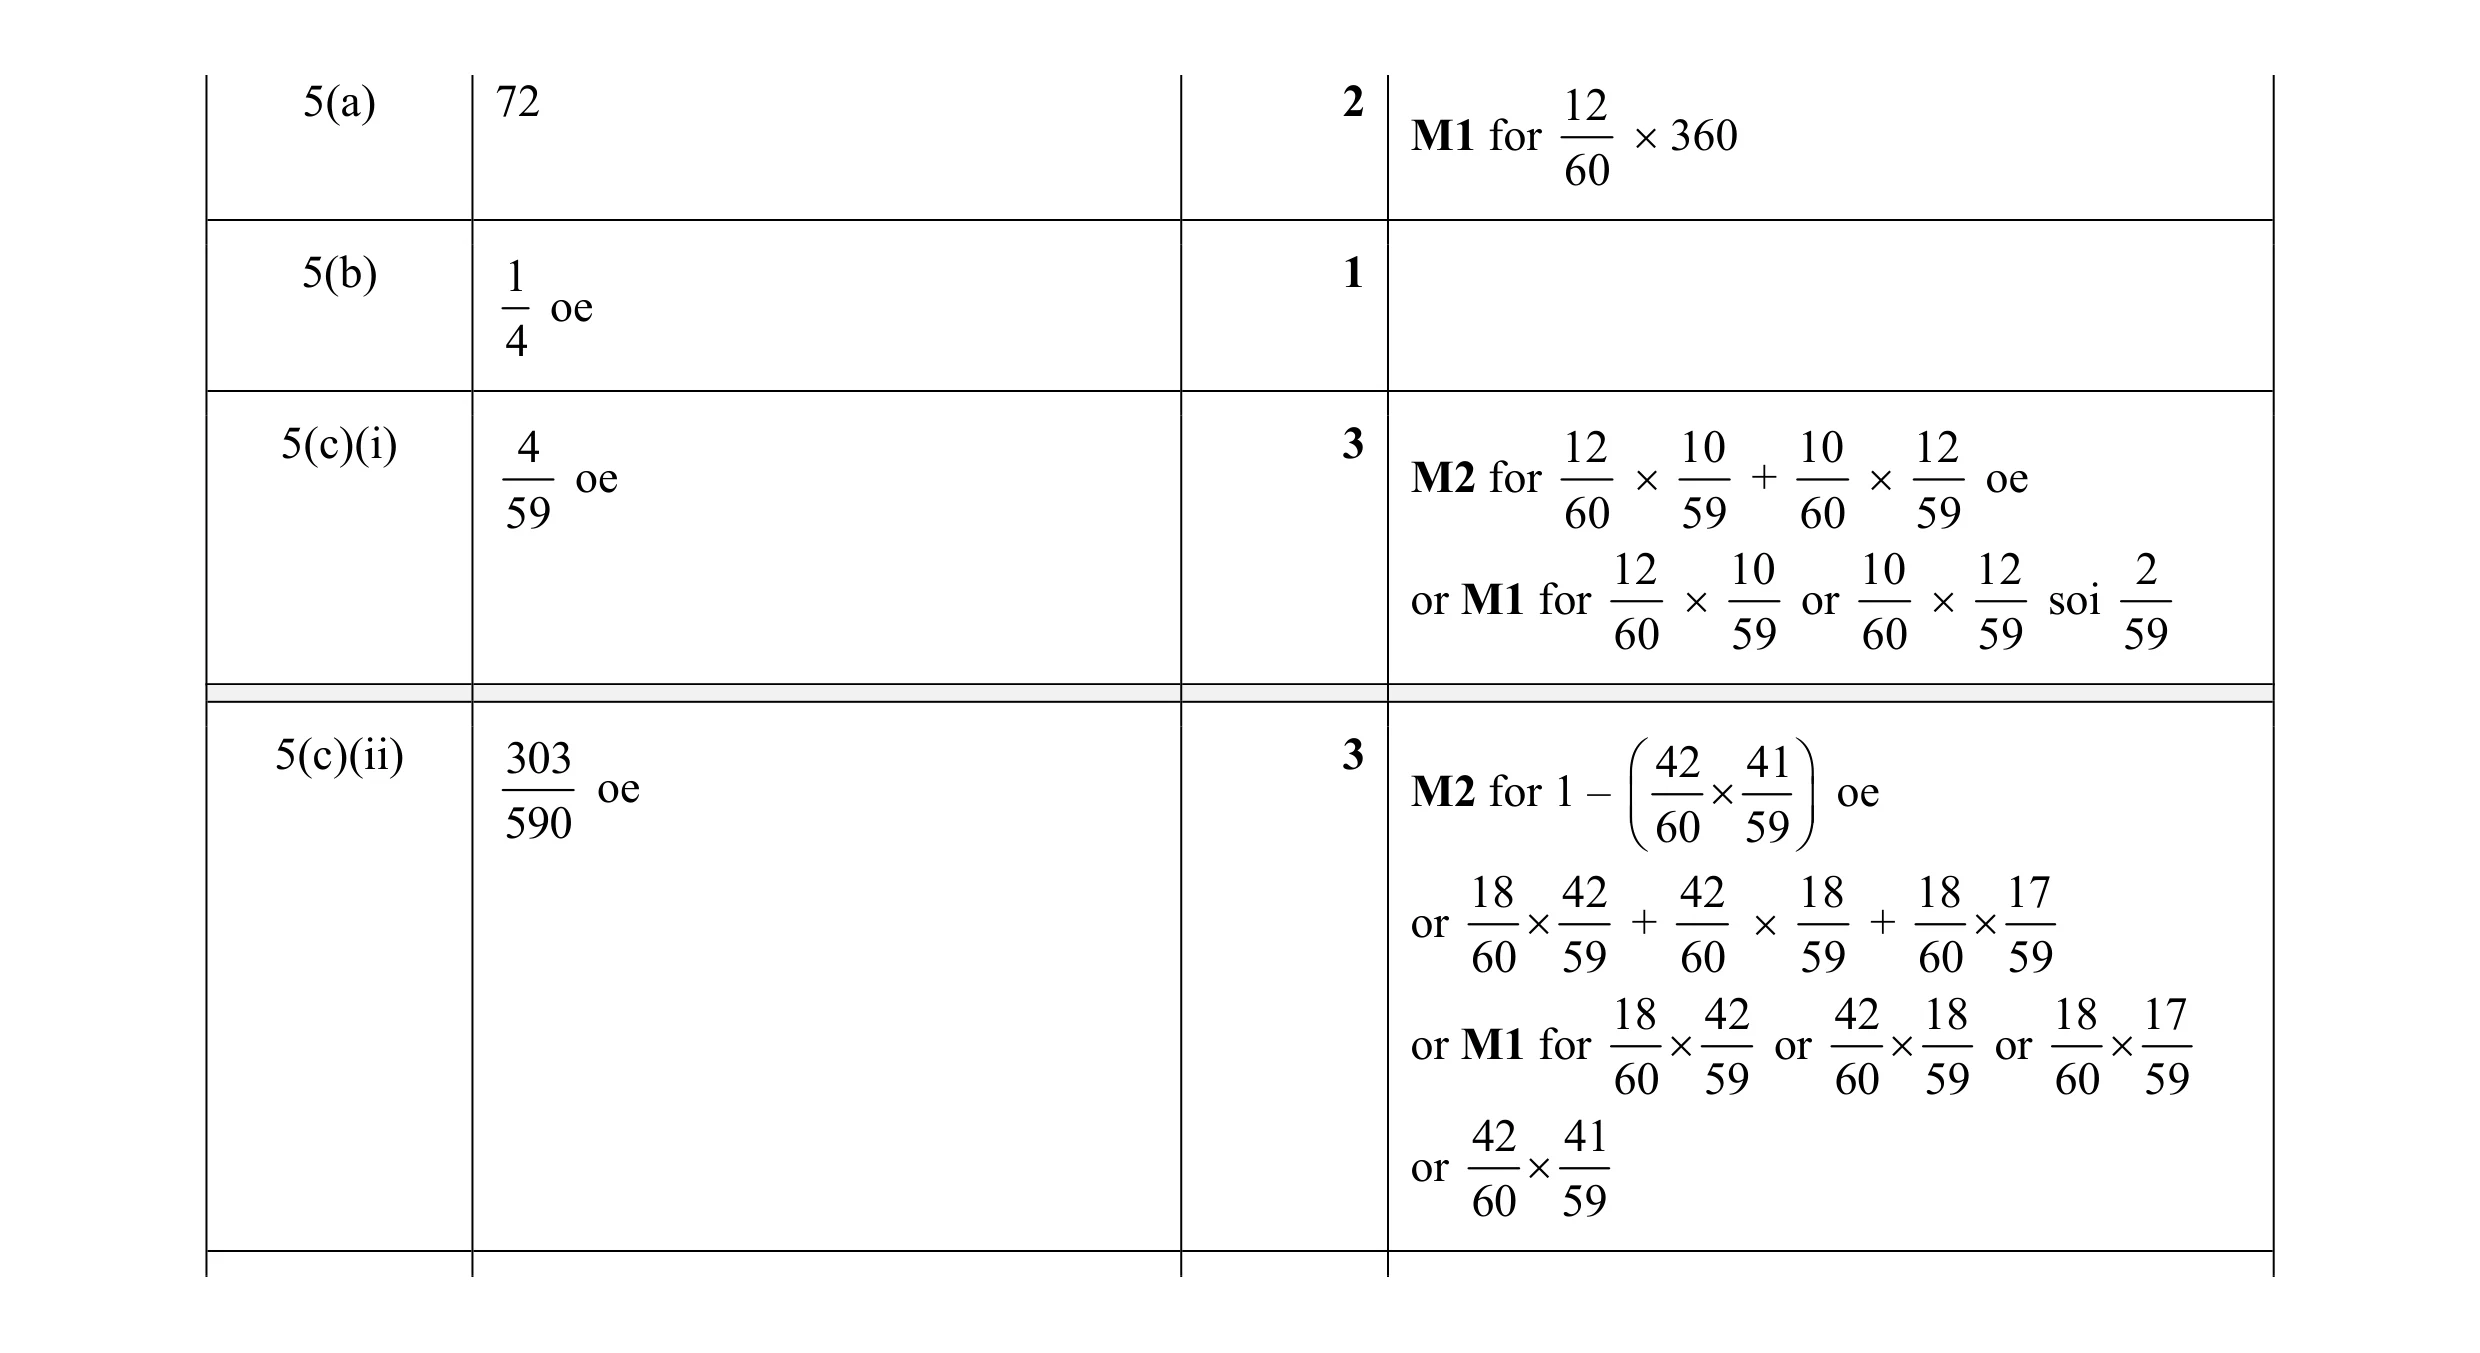 9
9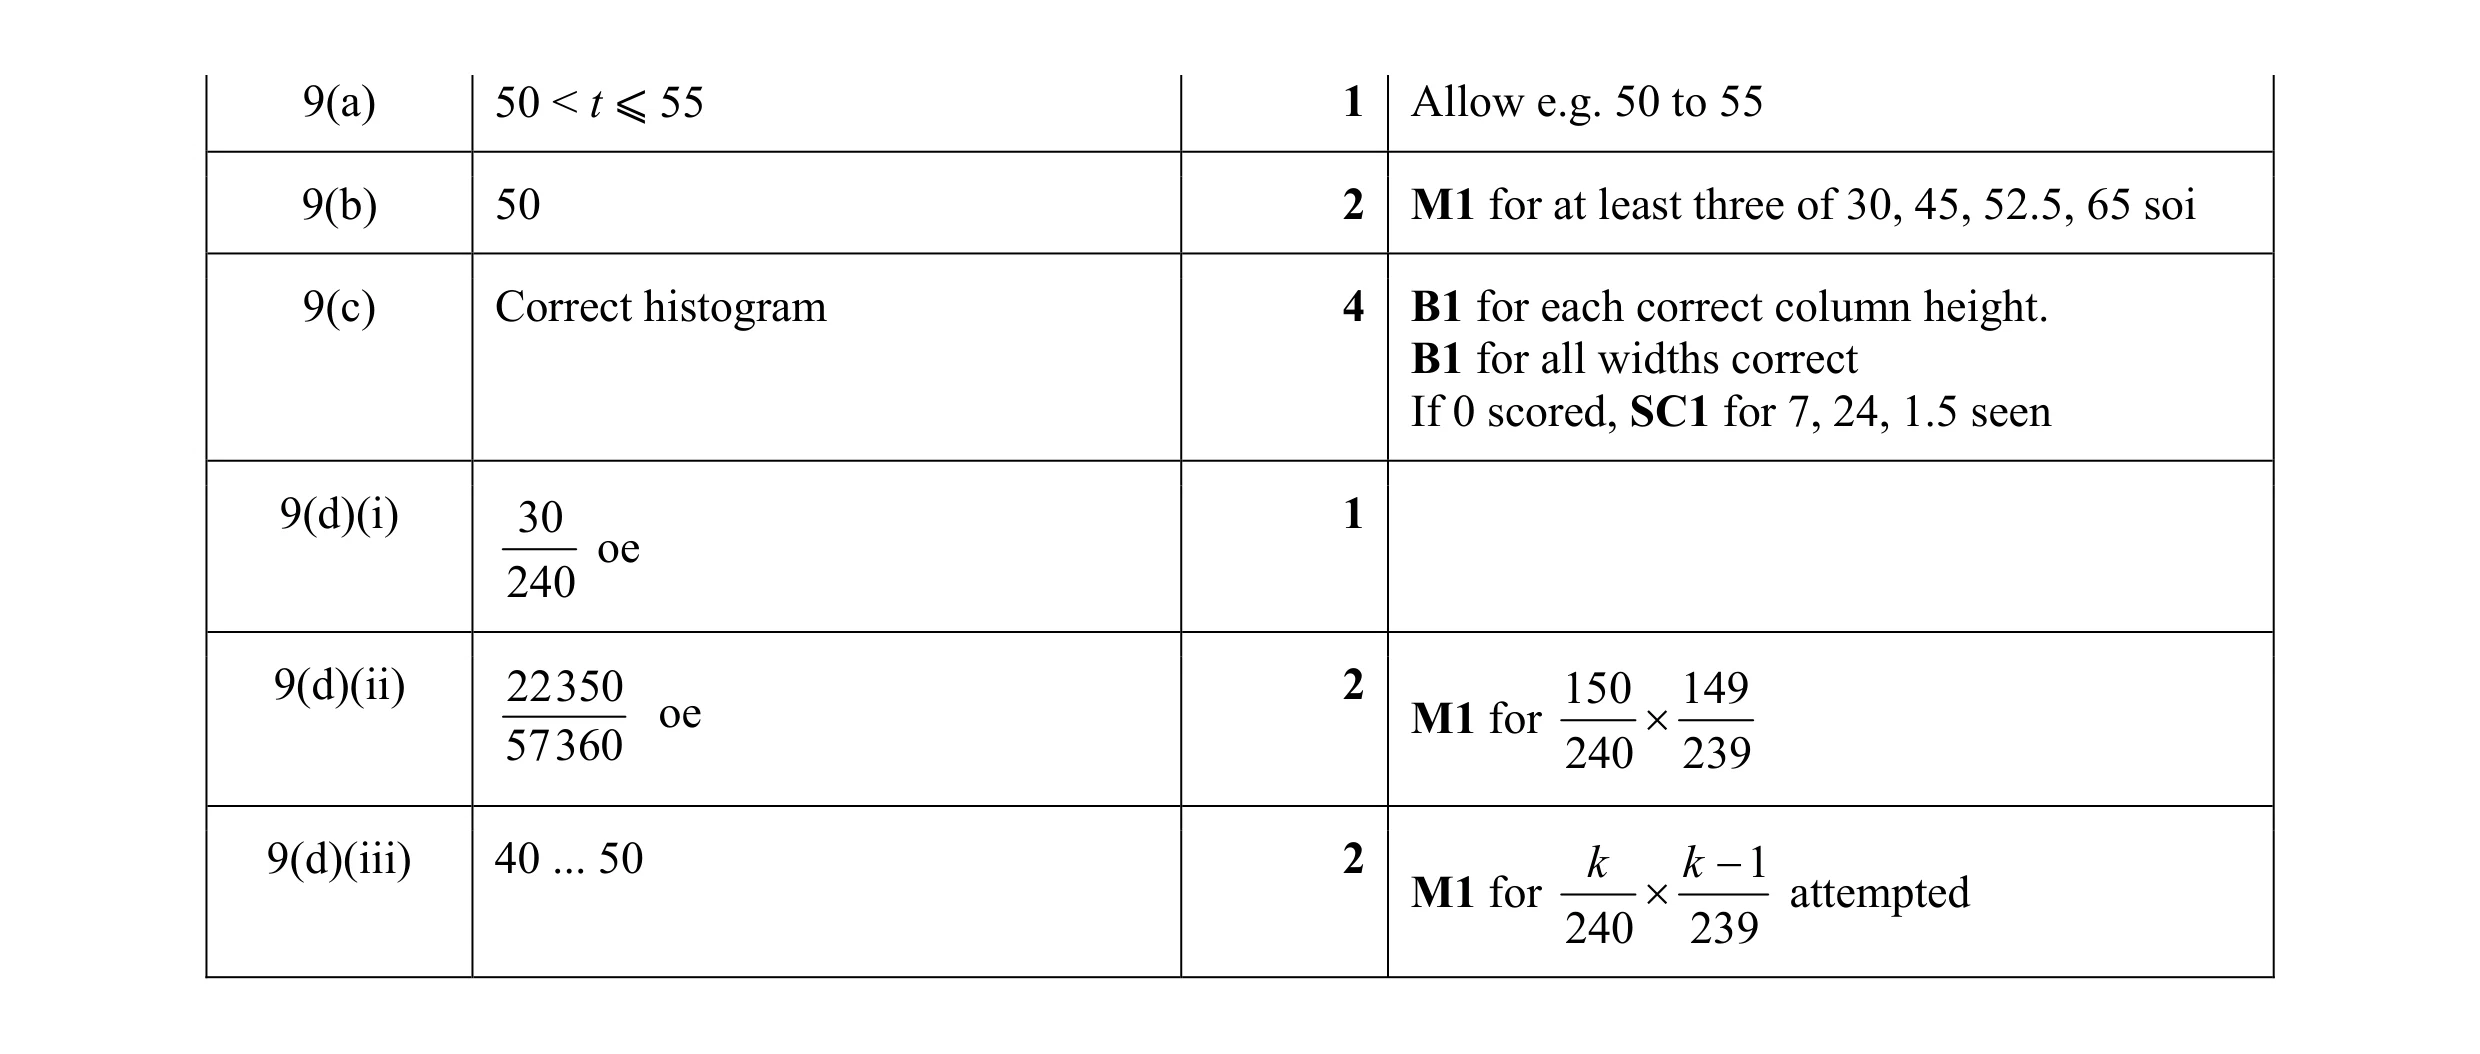 12
12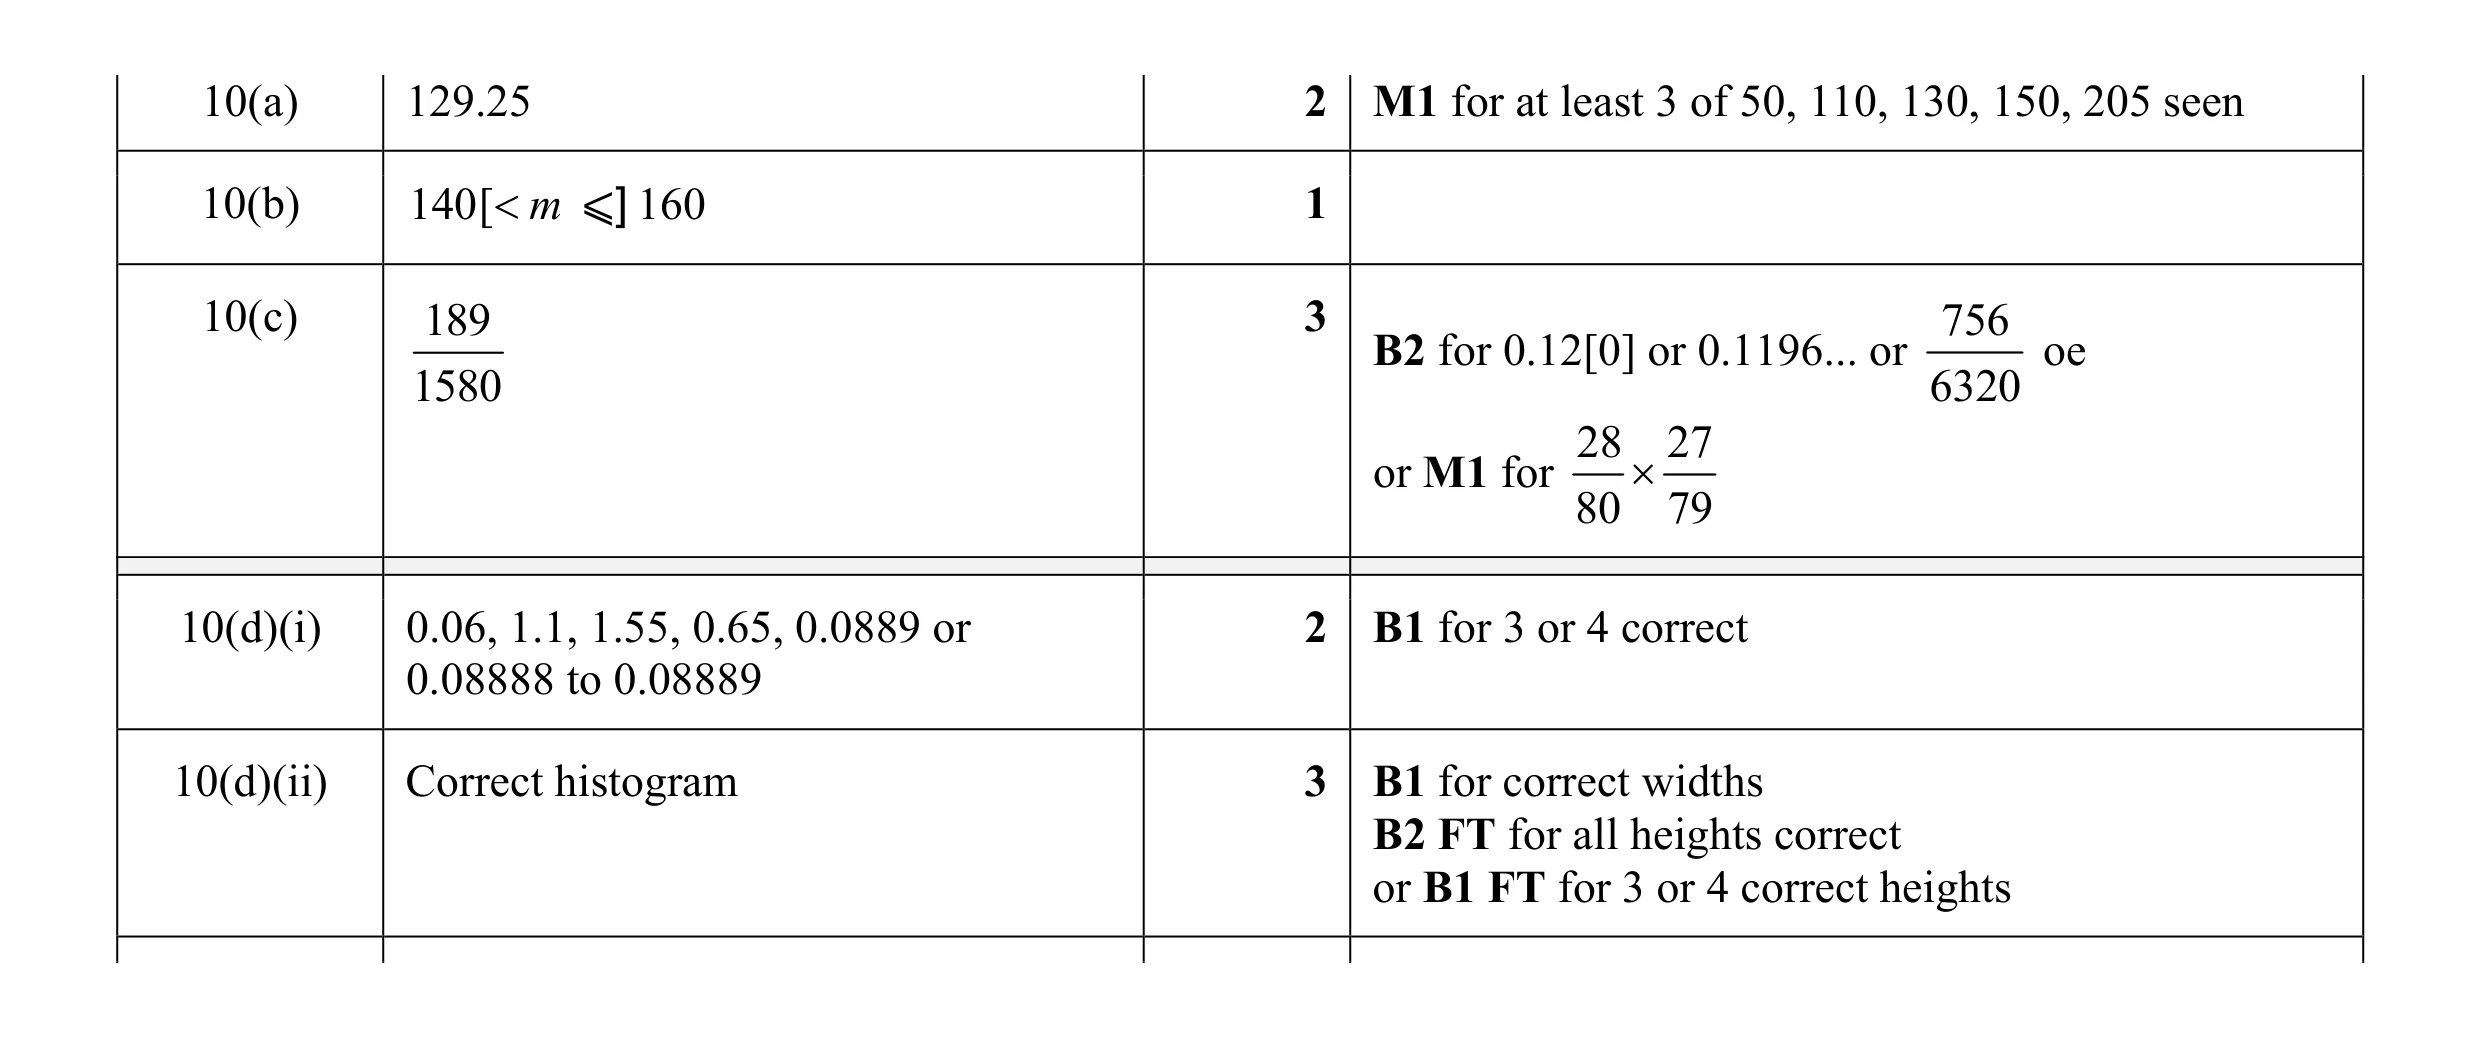 11
11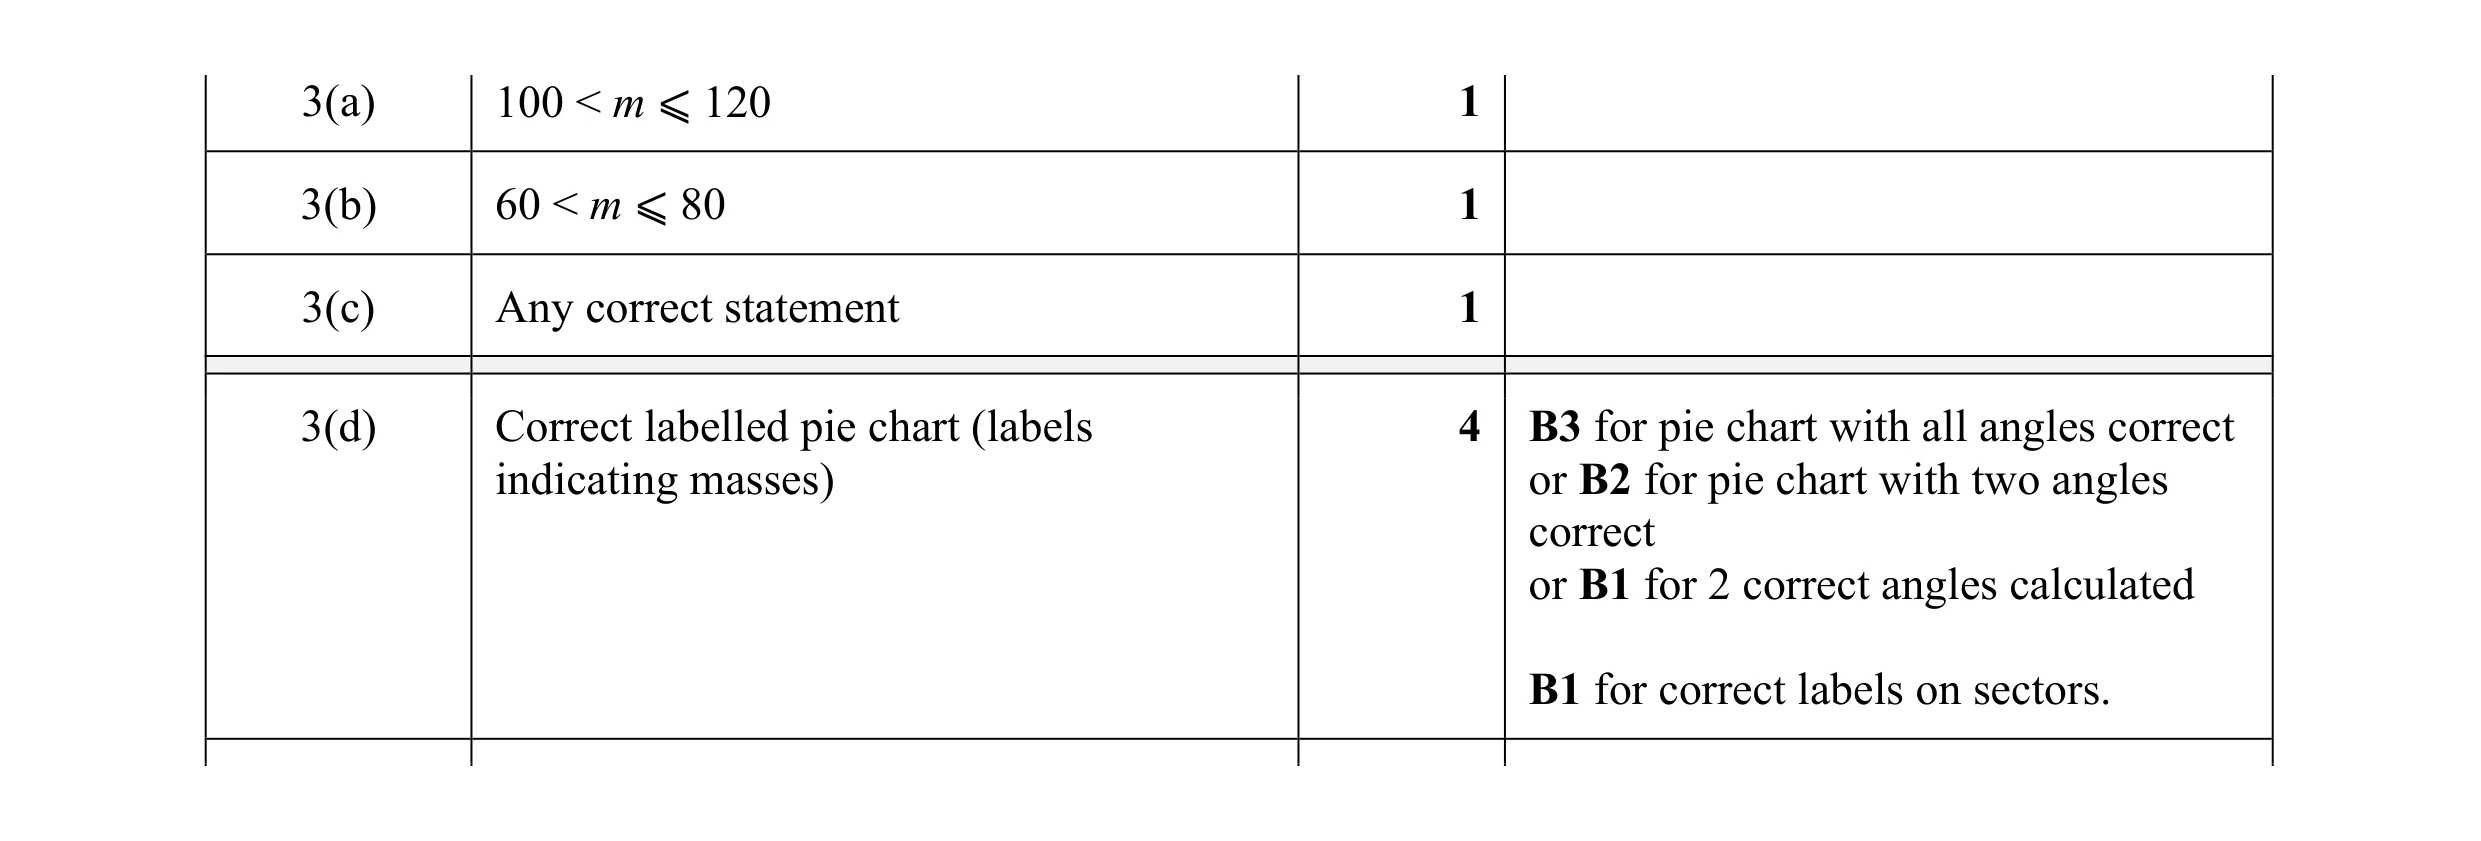 7
7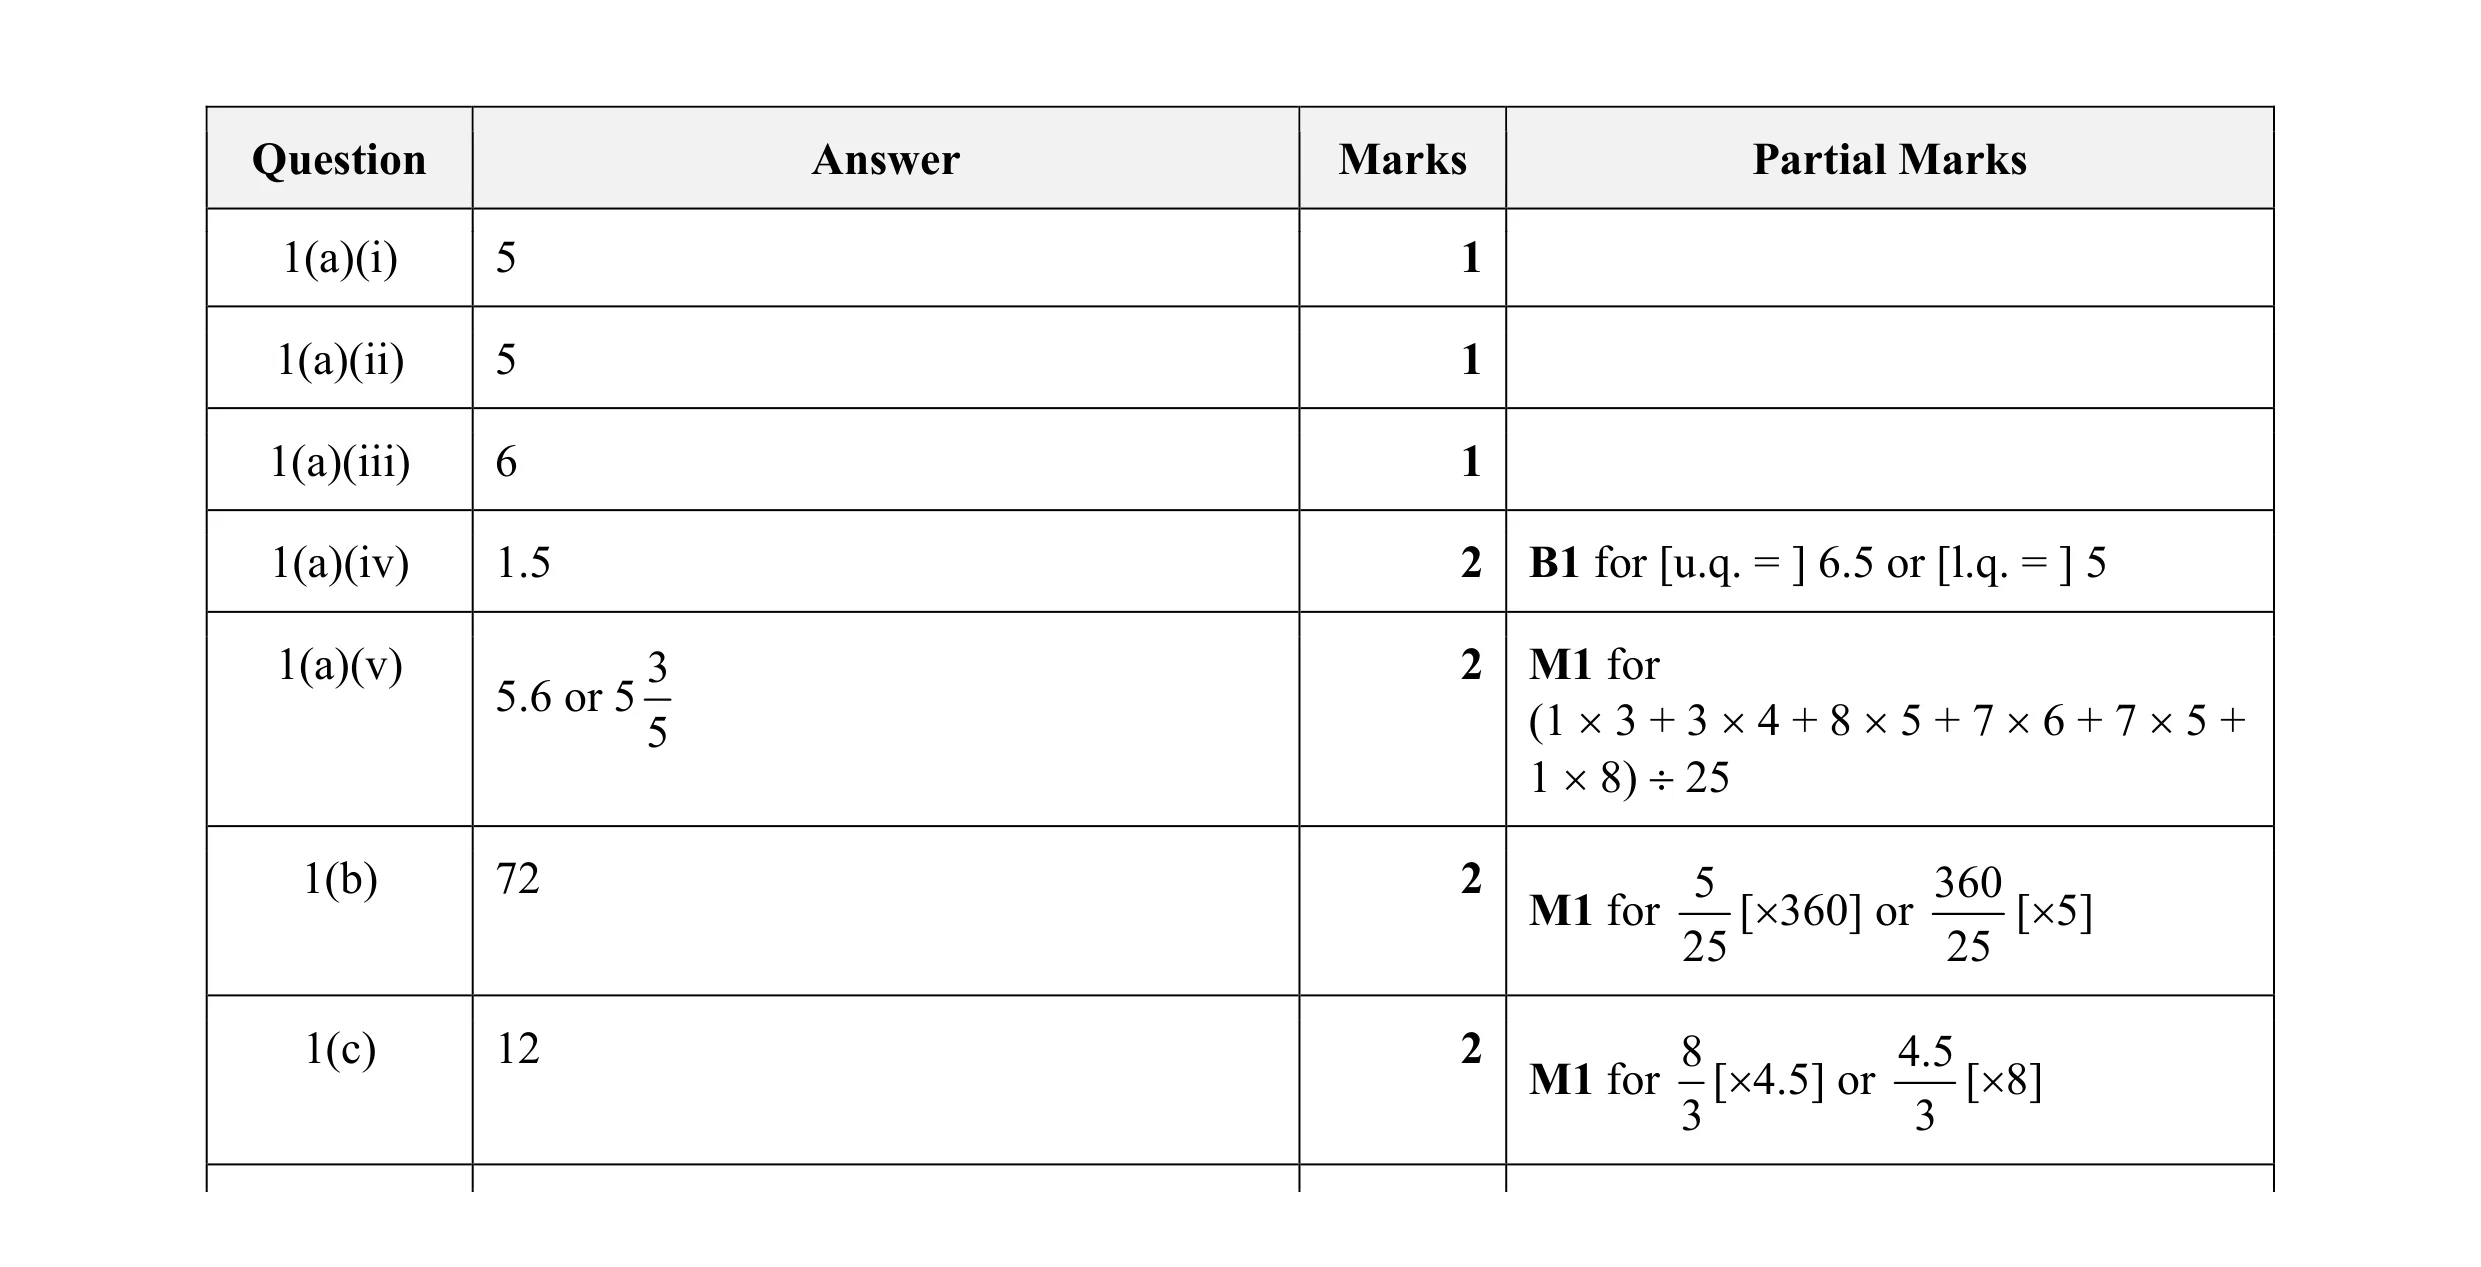 11
11