Questions as text
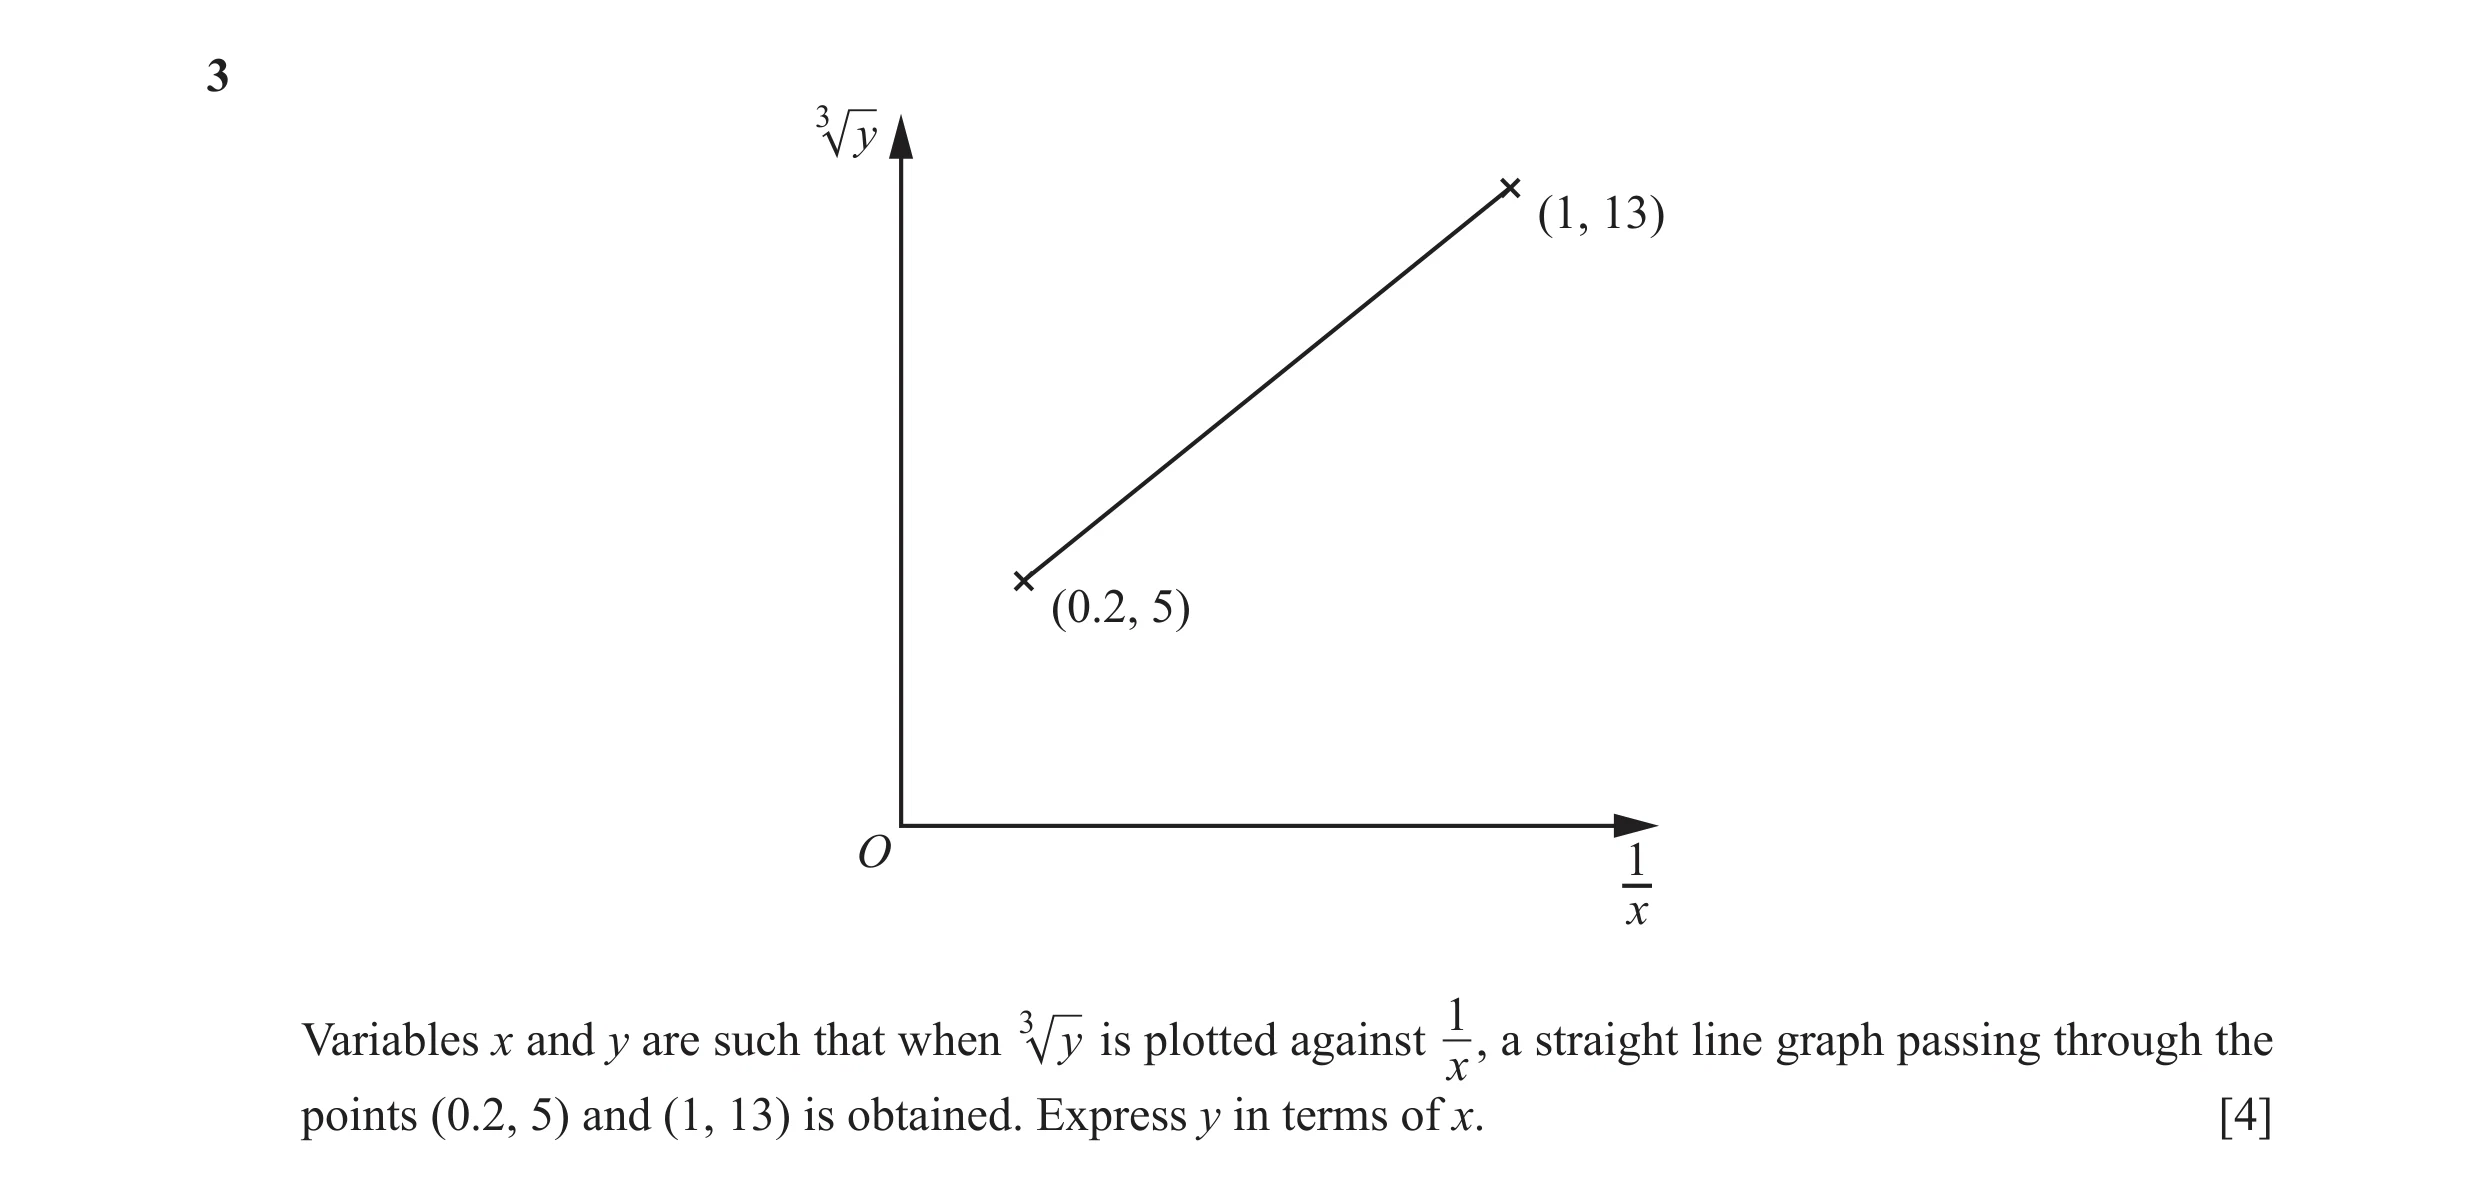
Q1 · 3 y (1, 13) (0.2, 5) O 1 x Variables x and y are such that when 3 y is plotted against 1… 0606/23 May/June 2017
3 3 y (1, 13) (0.2, 5) O 1 x Variables x and y are such that when 3 y is plotted against 1, a straight line graph passing through the x points (0.2, 5) and (1, 13) is obtained. Express y in terms of x. [4]
4 marks
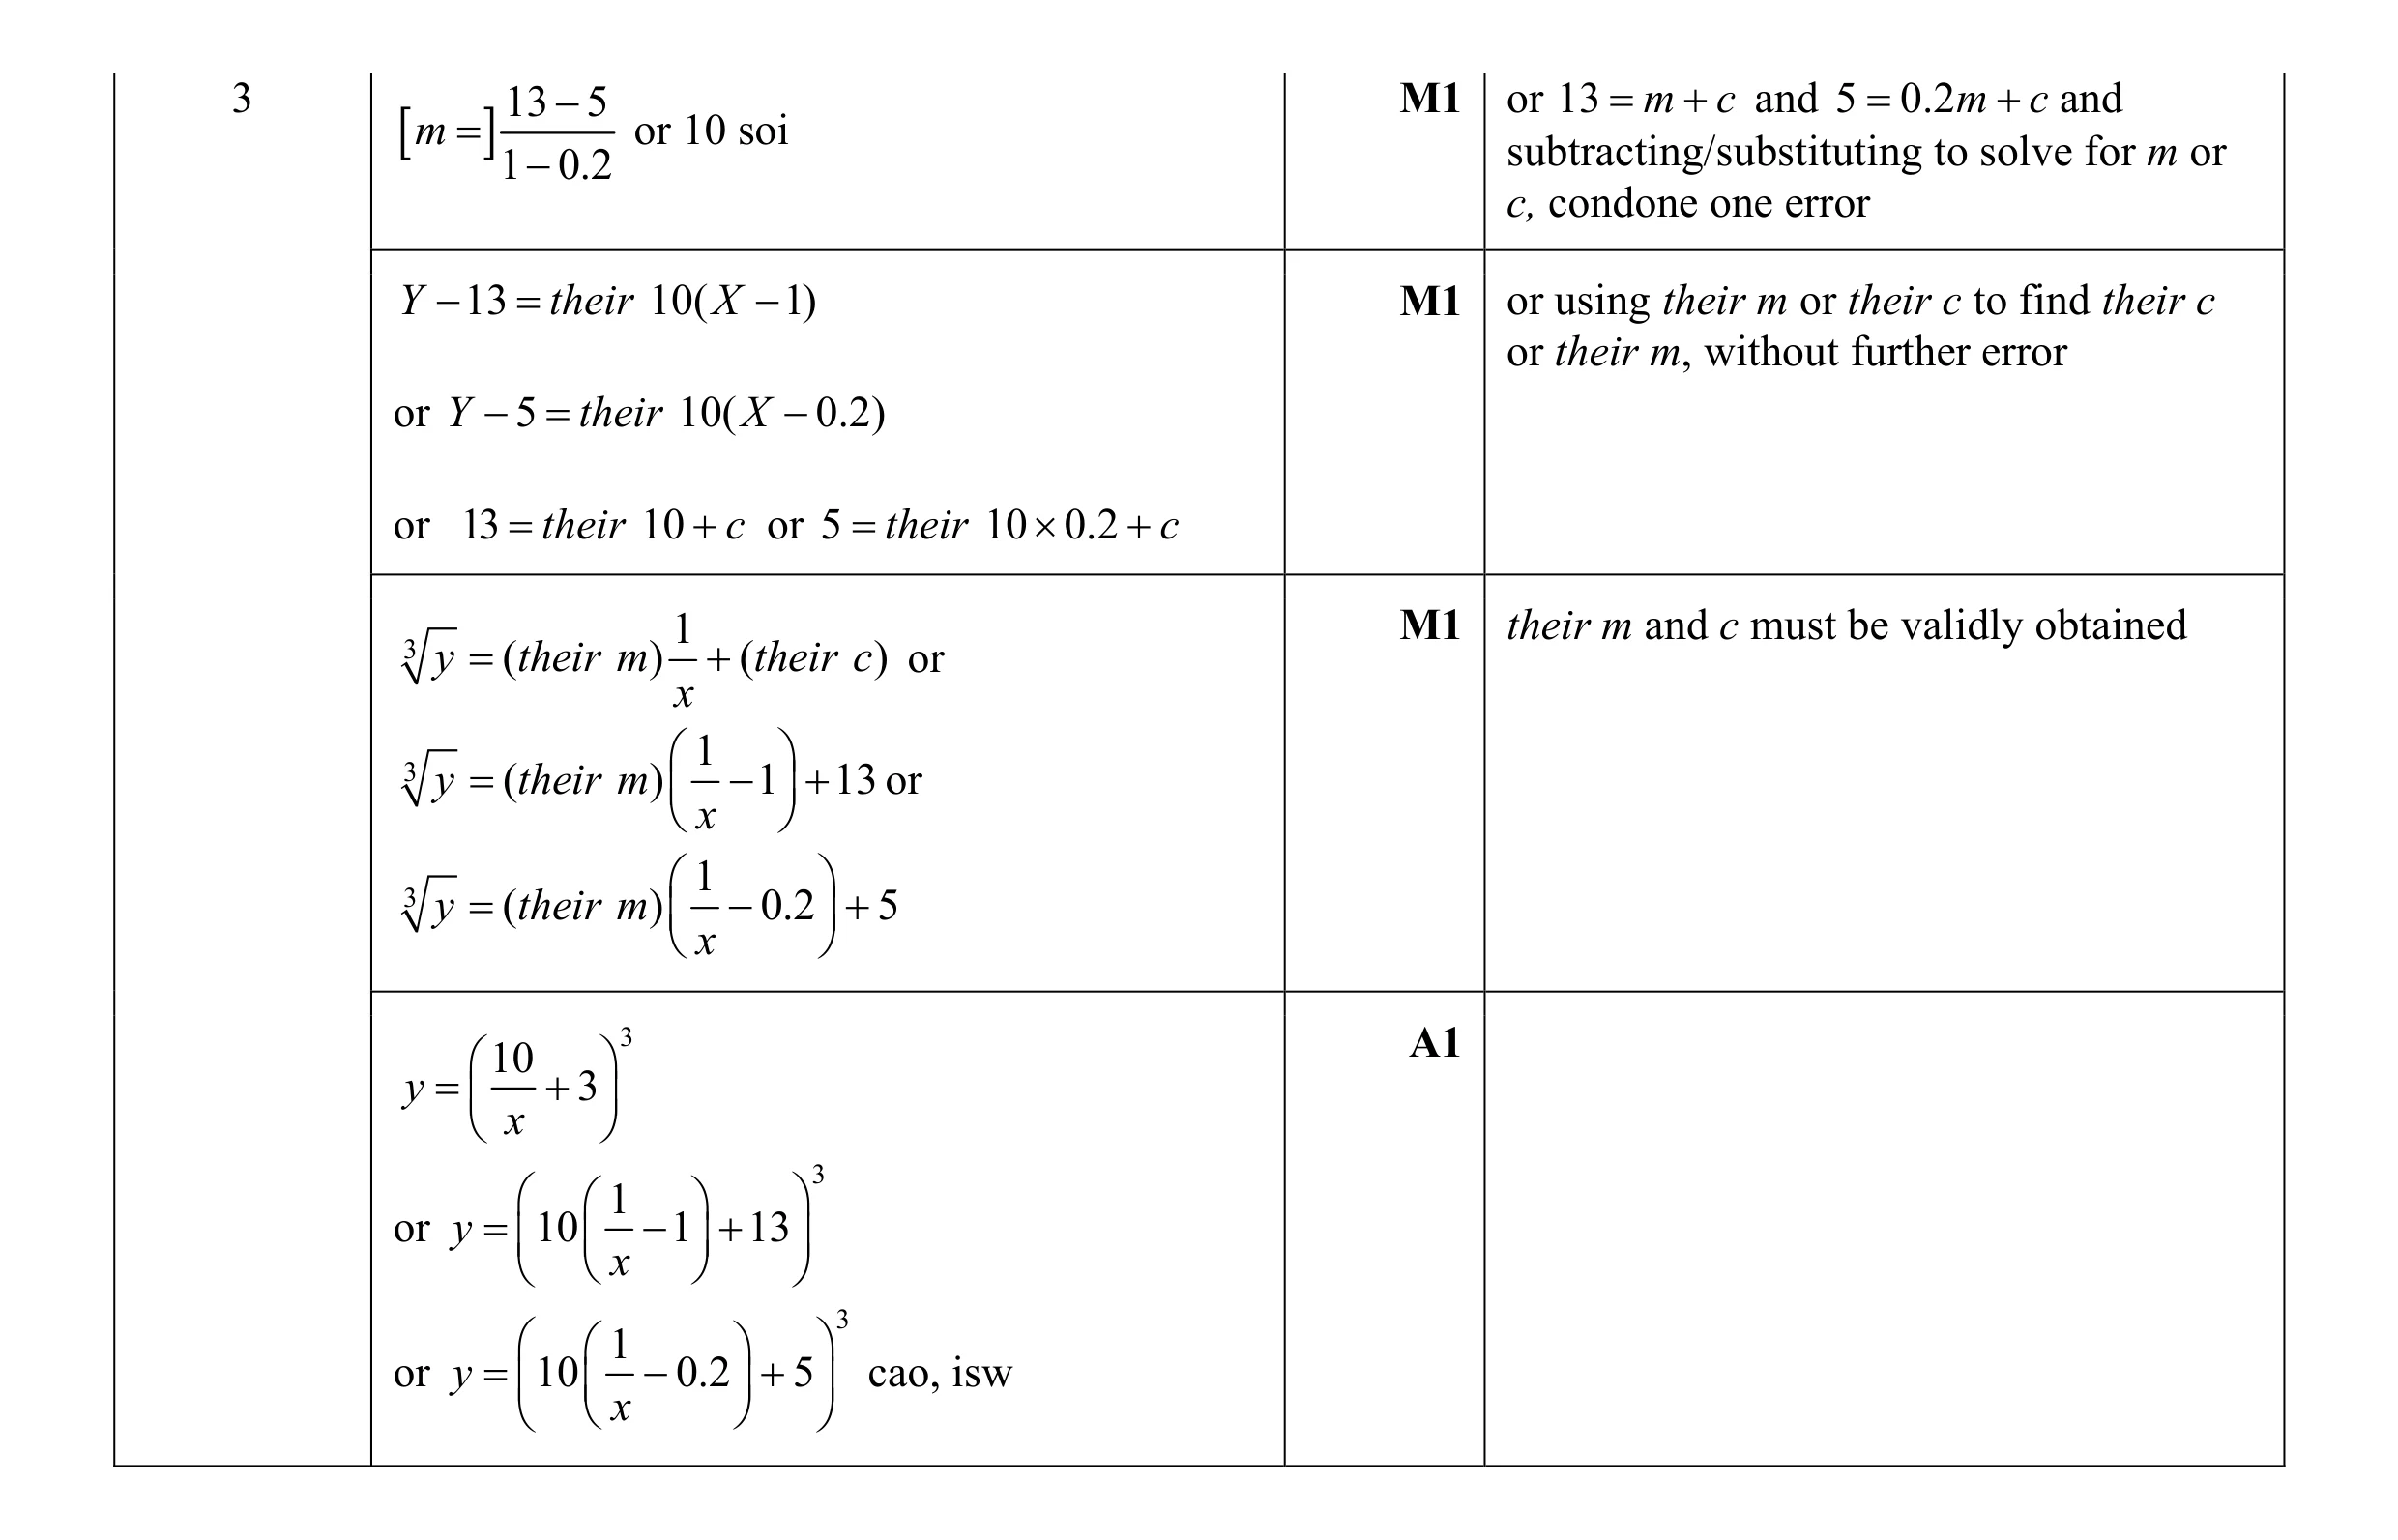
Mark scheme: 3 13 − 5 M1 or 13 = m + c and 5 = 0.2 m + c and [ m = ] or 10 soi subtracting/substituting to solve for m or 1 − 0.2 c, condone one error Y − 13 = their 10( X − 1) M1 or using their m or their c to find their c or their m, without further error or Y − 5 = their 10( X − 0.2) or 13 = their 10 + c or 5 = their 10 × 0.2 + c 1 M1 their m and c must be validly obtained 3 y = (their m ) + (their c ) or x 3 1 y = (their m ) − 1 + 13 or x 3 1 y = (their m ) − 0.2 + 5 x 3 A1 10 y = + 3 x 1 3 or y = 10 − 1 + 13 x 1 3 or y = 10 − 0.2 + 5 cao, isw x
This question in 0606/23 May/June 2017
Q2 · An experiment was carried out recording values of y for certain values of x 0606/21 May/June 2018
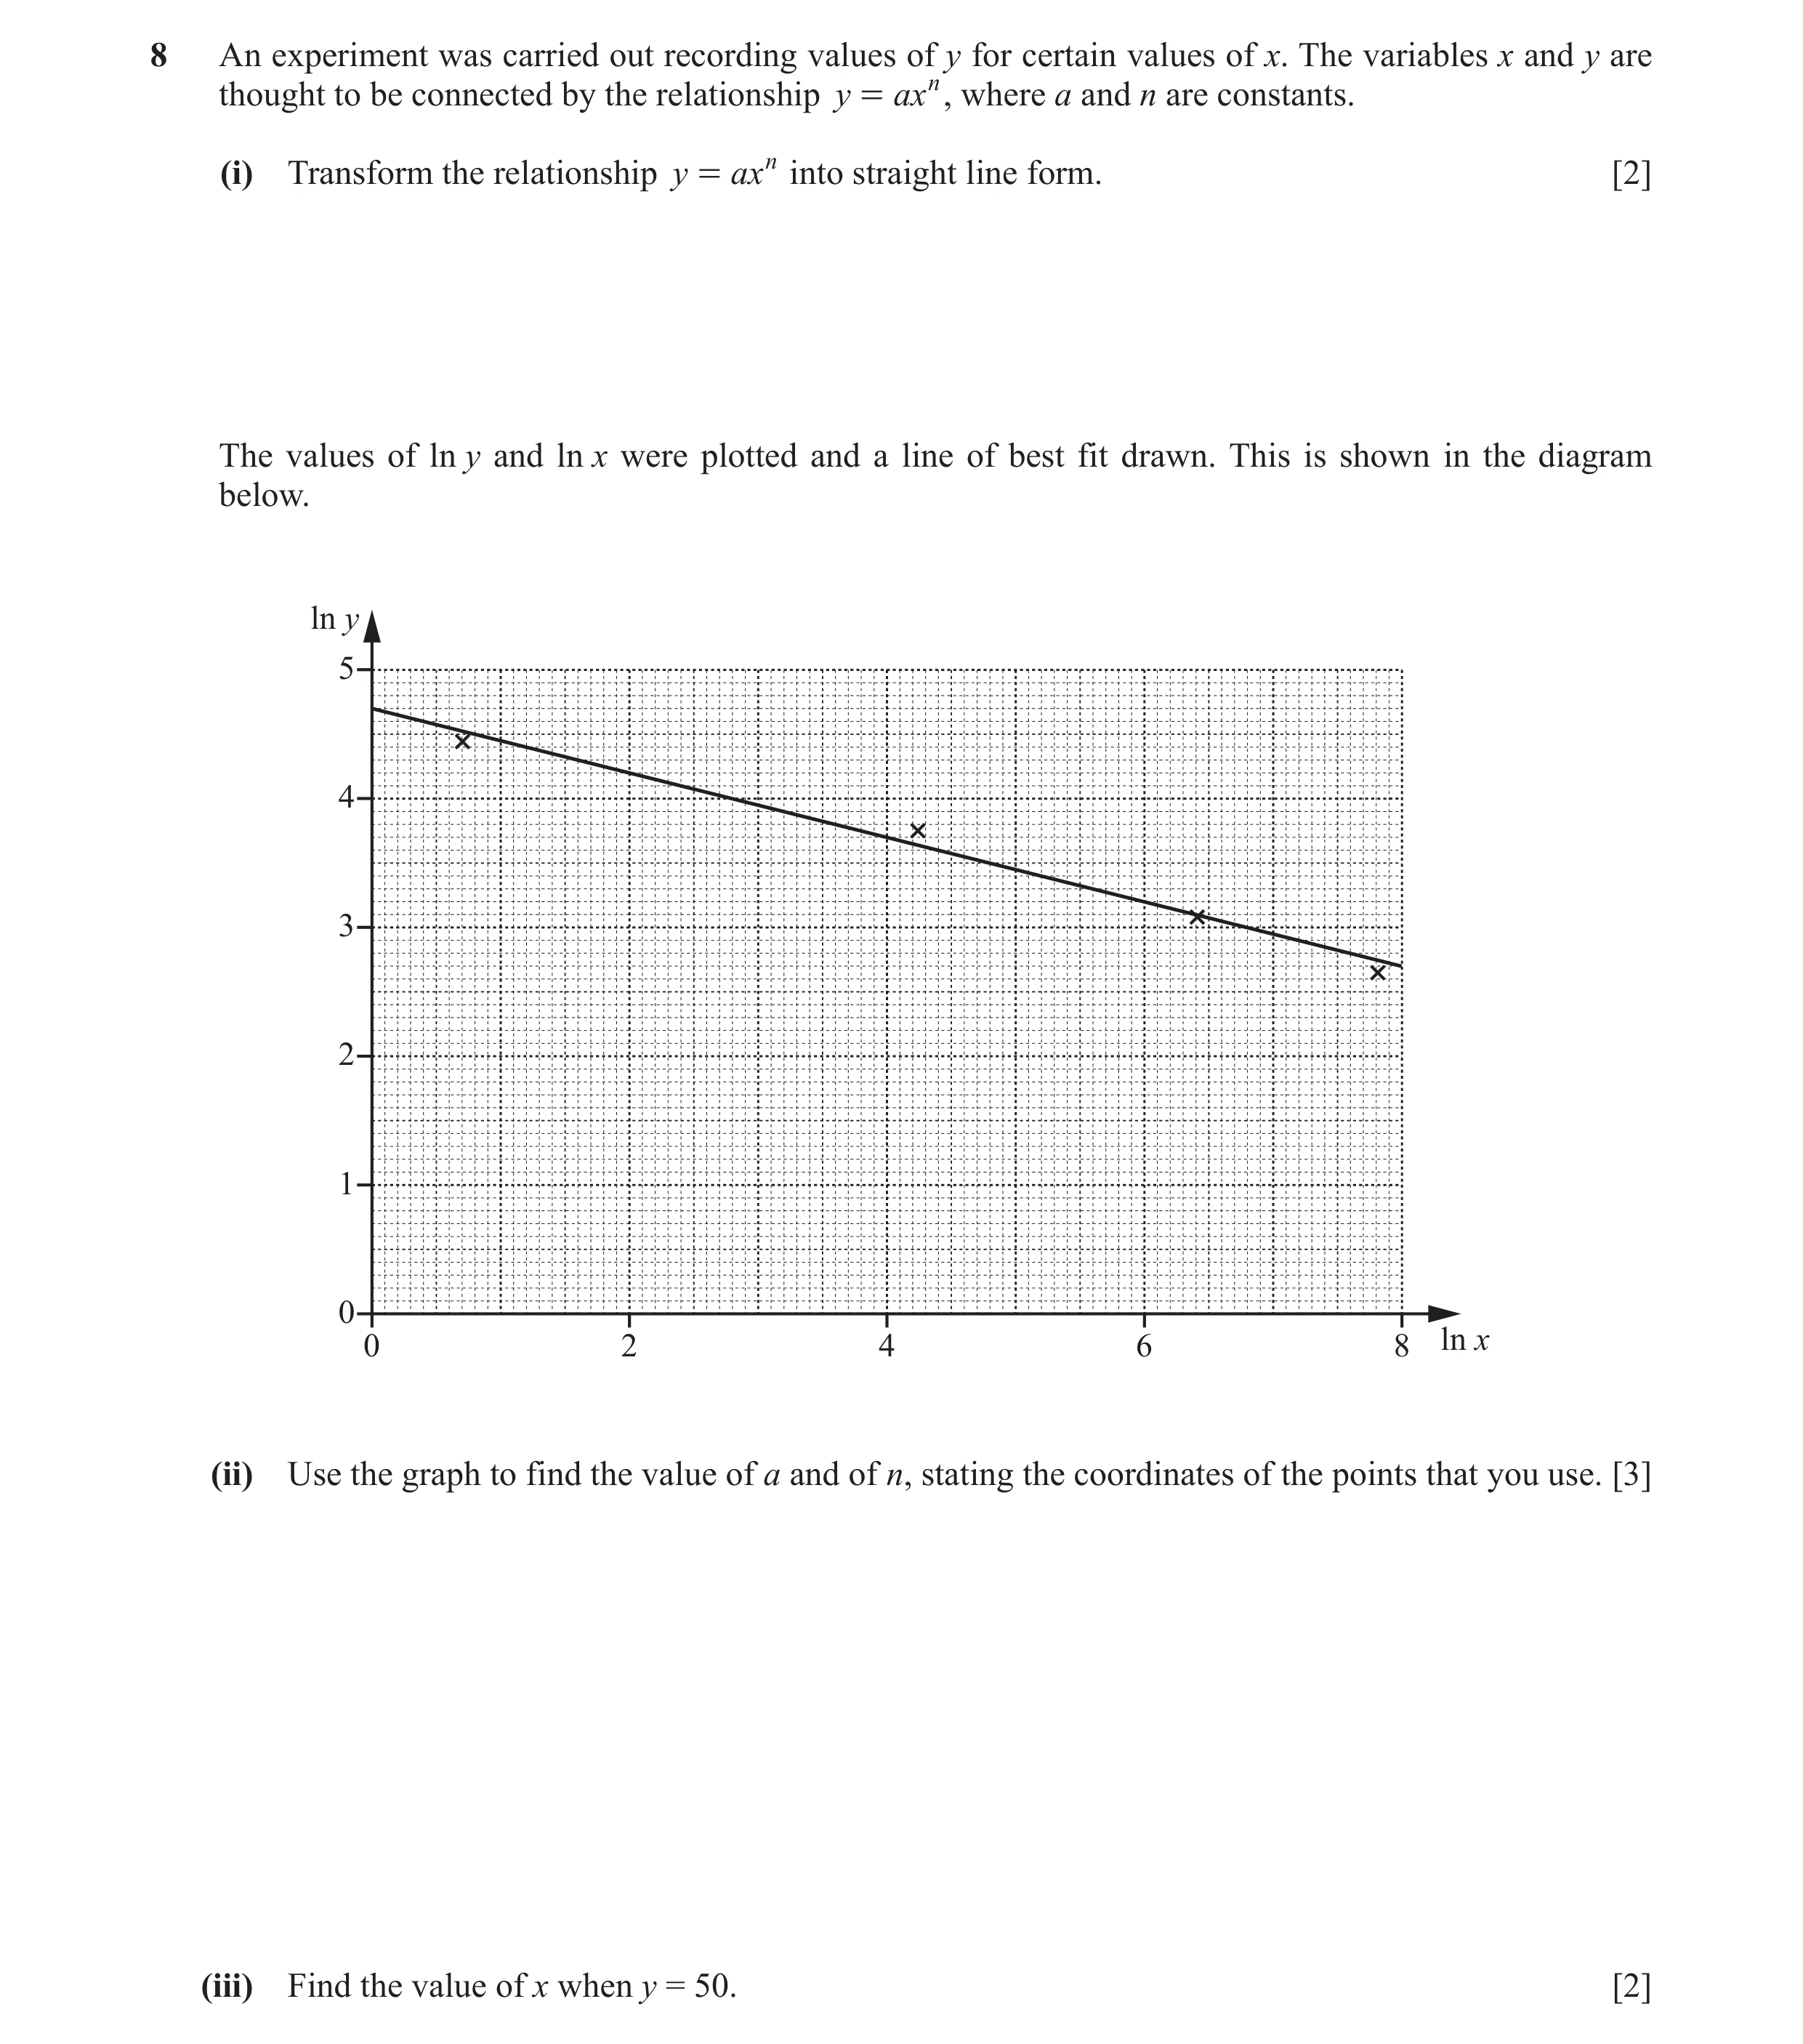
8 An experiment was carried out recording values of y for certain values of x. The variables x and y are thought to be connected by the relationship y = axn , where a and n are constants. (i) Transform the relationship y = axn into straight line form. [2] The values of ln y and ln x were plotted and a line of best fit drawn. This is shown in the diagram below. ln y 5 4 3 2 1 0 0 2 4 6 8 ln x (ii) Use the graph to find the value of a and of n, stating the coordinates of the points that you use. [3] (iii) Find the value of x when y = 50. [2]
7 marks
Mark scheme: 8(i) Takes logs of both sides M1 ln y = ln a + n ln x A1 or lg y = lg a + n lg x 8(ii) n = −0.2 to −0.3 nfww B1 attempts to equate y-intercept to ln a M1 or forms their ln equation with their gradient and a point on the line or uses two points on the line to form a pair of simultaneous equations a = e4.7 isw or 110 or 109.9[47…] A1 maximum of 2 marks if no coordinates stated 8(iii) use of ln(50) and lnx = 3 to 3.2 M1 50 their n or for = x or better theira or for ln50 = ln(theira ) + (their n )ln x oe awrt 22 or 23 to 2 significant figures A1 implies M1
This question in 0606/21 May/June 2018
Q3 · An experiment was carried out recording values of y for certain values of x 0606/23 May/June 2018
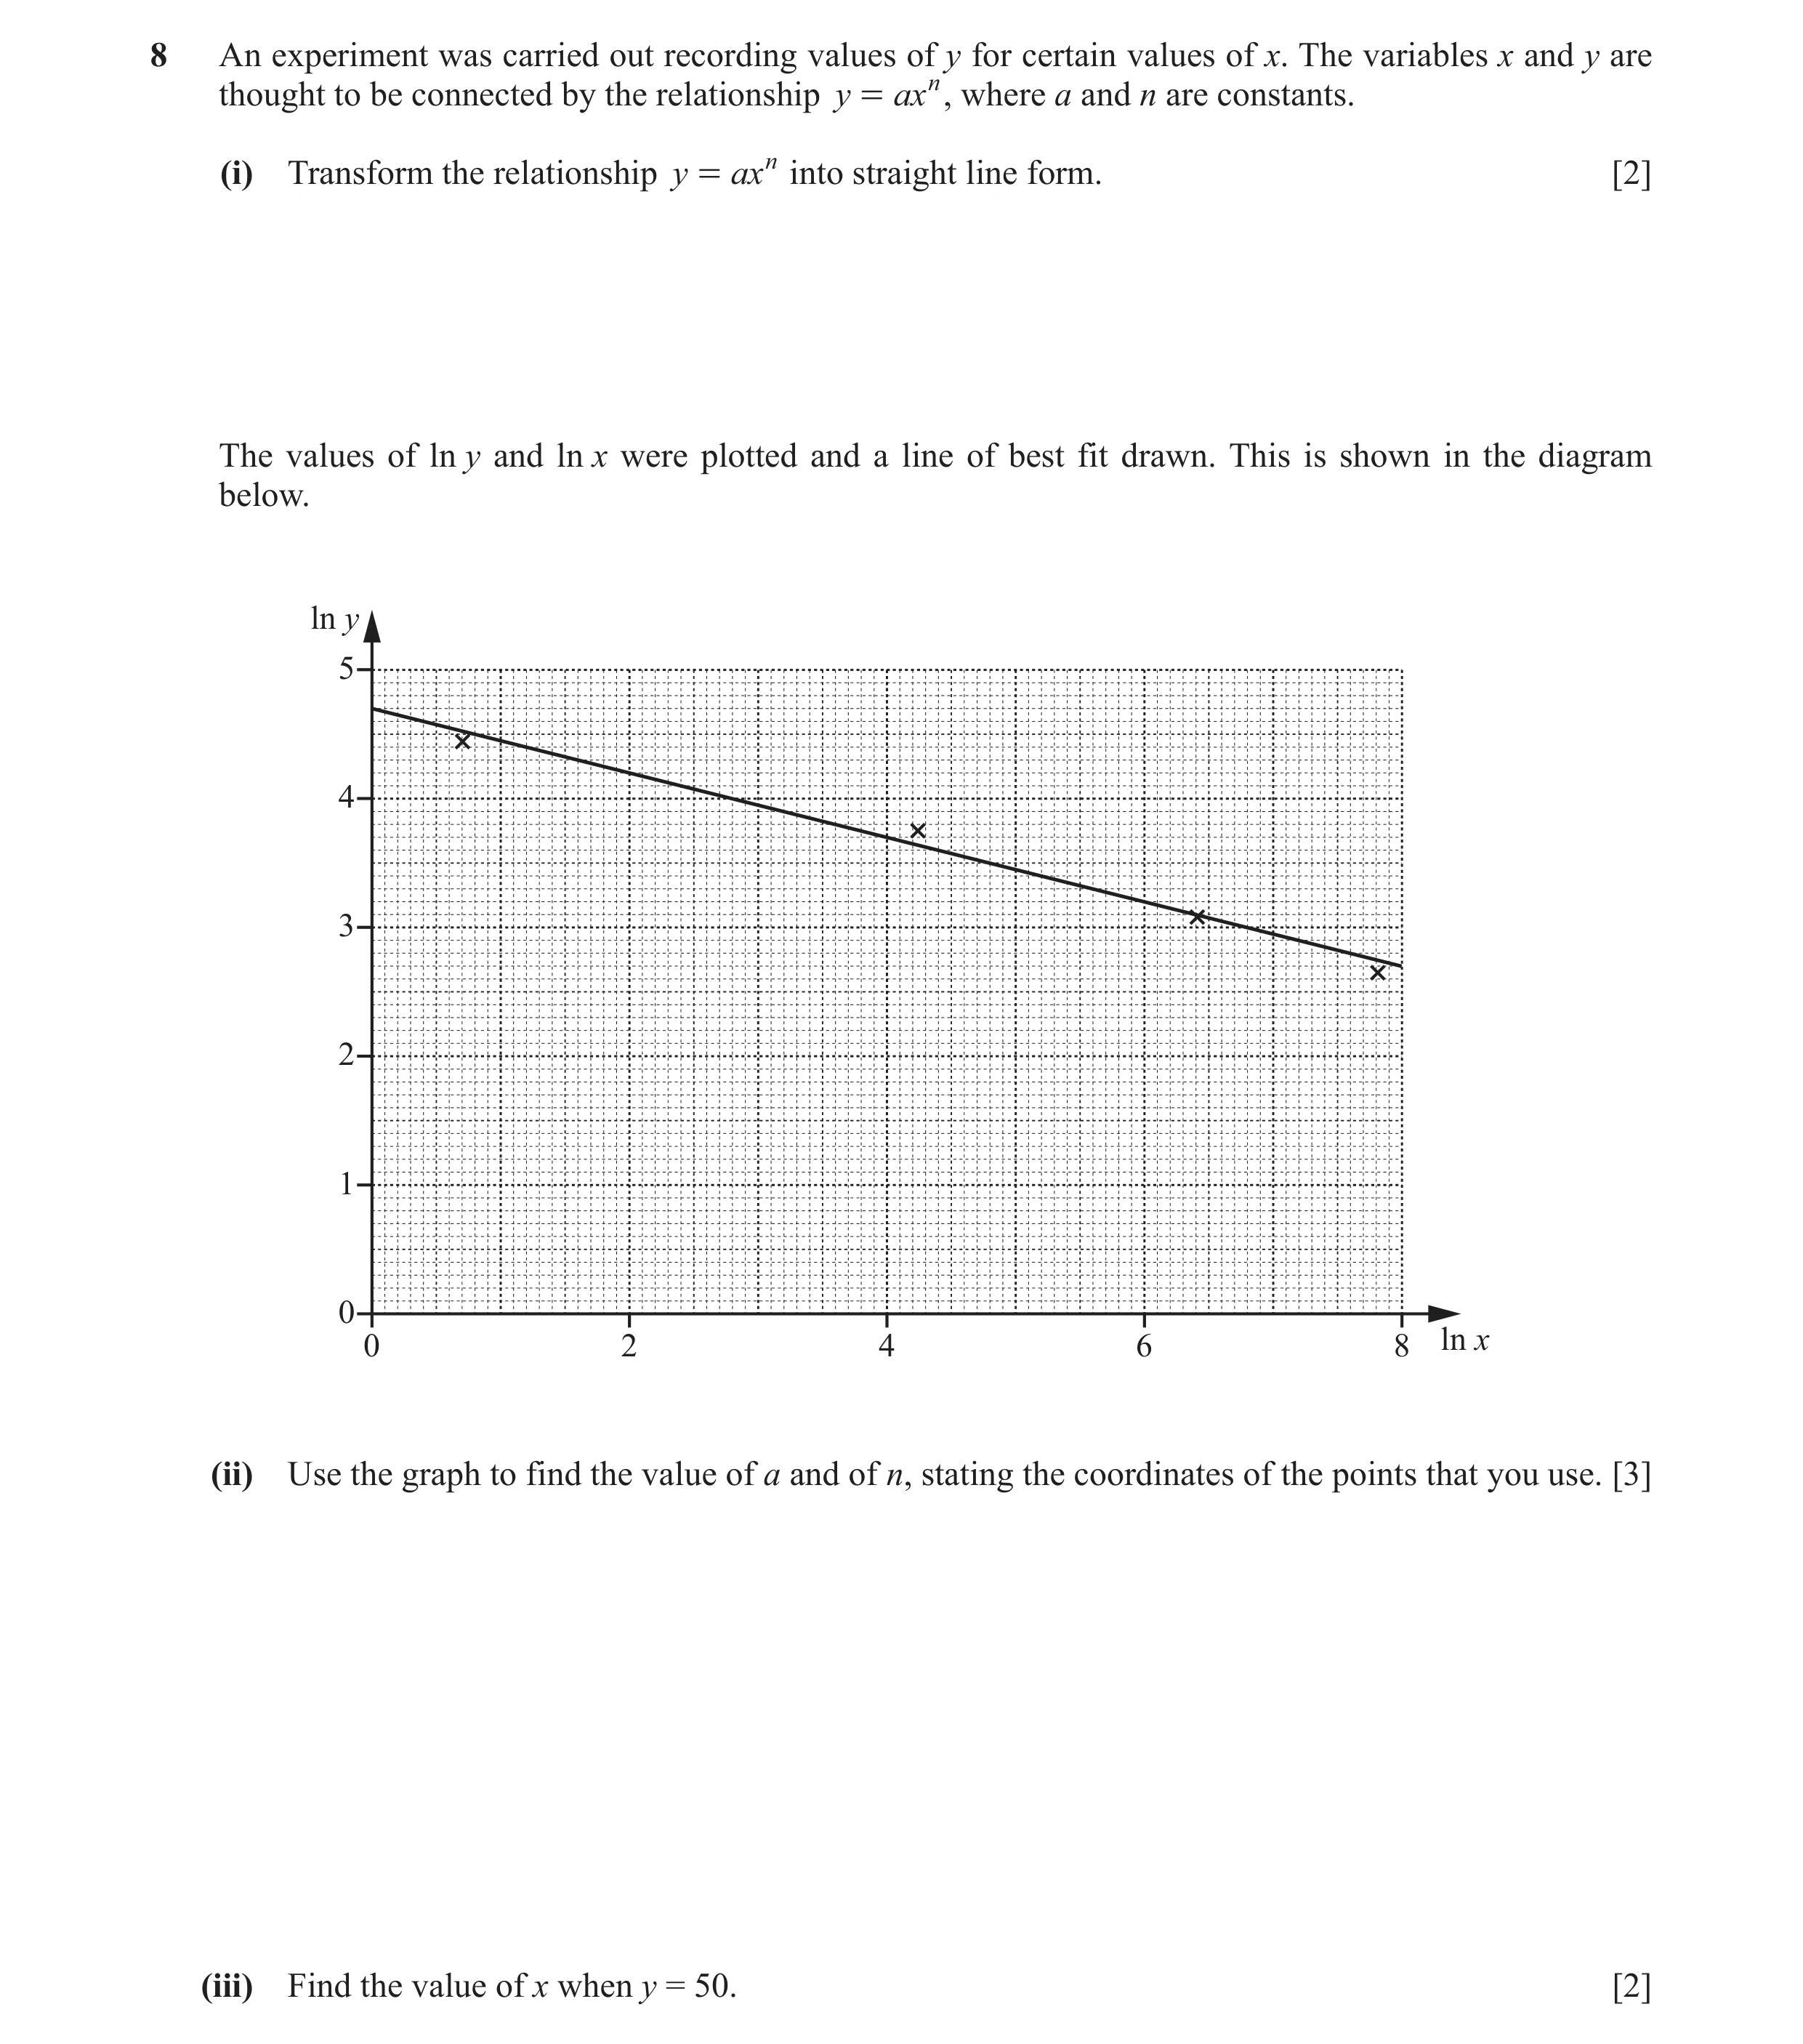
8 An experiment was carried out recording values of y for certain values of x. The variables x and y are thought to be connected by the relationship y = axn , where a and n are constants. (i) Transform the relationship y = axn into straight line form. [2] The values of ln y and ln x were plotted and a line of best fit drawn. This is shown in the diagram below. ln y 5 4 3 2 1 0 0 2 4 6 8 ln x (ii) Use the graph to find the value of a and of n, stating the coordinates of the points that you use. [3] (iii) Find the value of x when y = 50. [2]
7 marks
Mark scheme: 8(i) Takes logs of both sides M1 ln y = ln a + n ln x A1 or lg y = lg a + n lg x 8(ii) n = −0.2 to −0.3 nfww B1 attempts to equate y-intercept to ln a M1 or forms their ln equation with their gradient and a point on the line or uses two points on the line to form a pair of simultaneous equations a = e4.7 isw or 110 or 109.9[47…] A1 maximum of 2 marks if no coordinates stated 8(iii) use of ln(50) and lnx = 3 to 3.2 M1 50 their n or for = x or better theira or for ln50 = ln(theira ) + (their n )ln x oe awrt 22 or 23 to 2 significant figures A1 implies M1
This question in 0606/23 May/June 2018
Q4 · In this question, all lengths are in metres 0606/21 Oct/Nov 2018
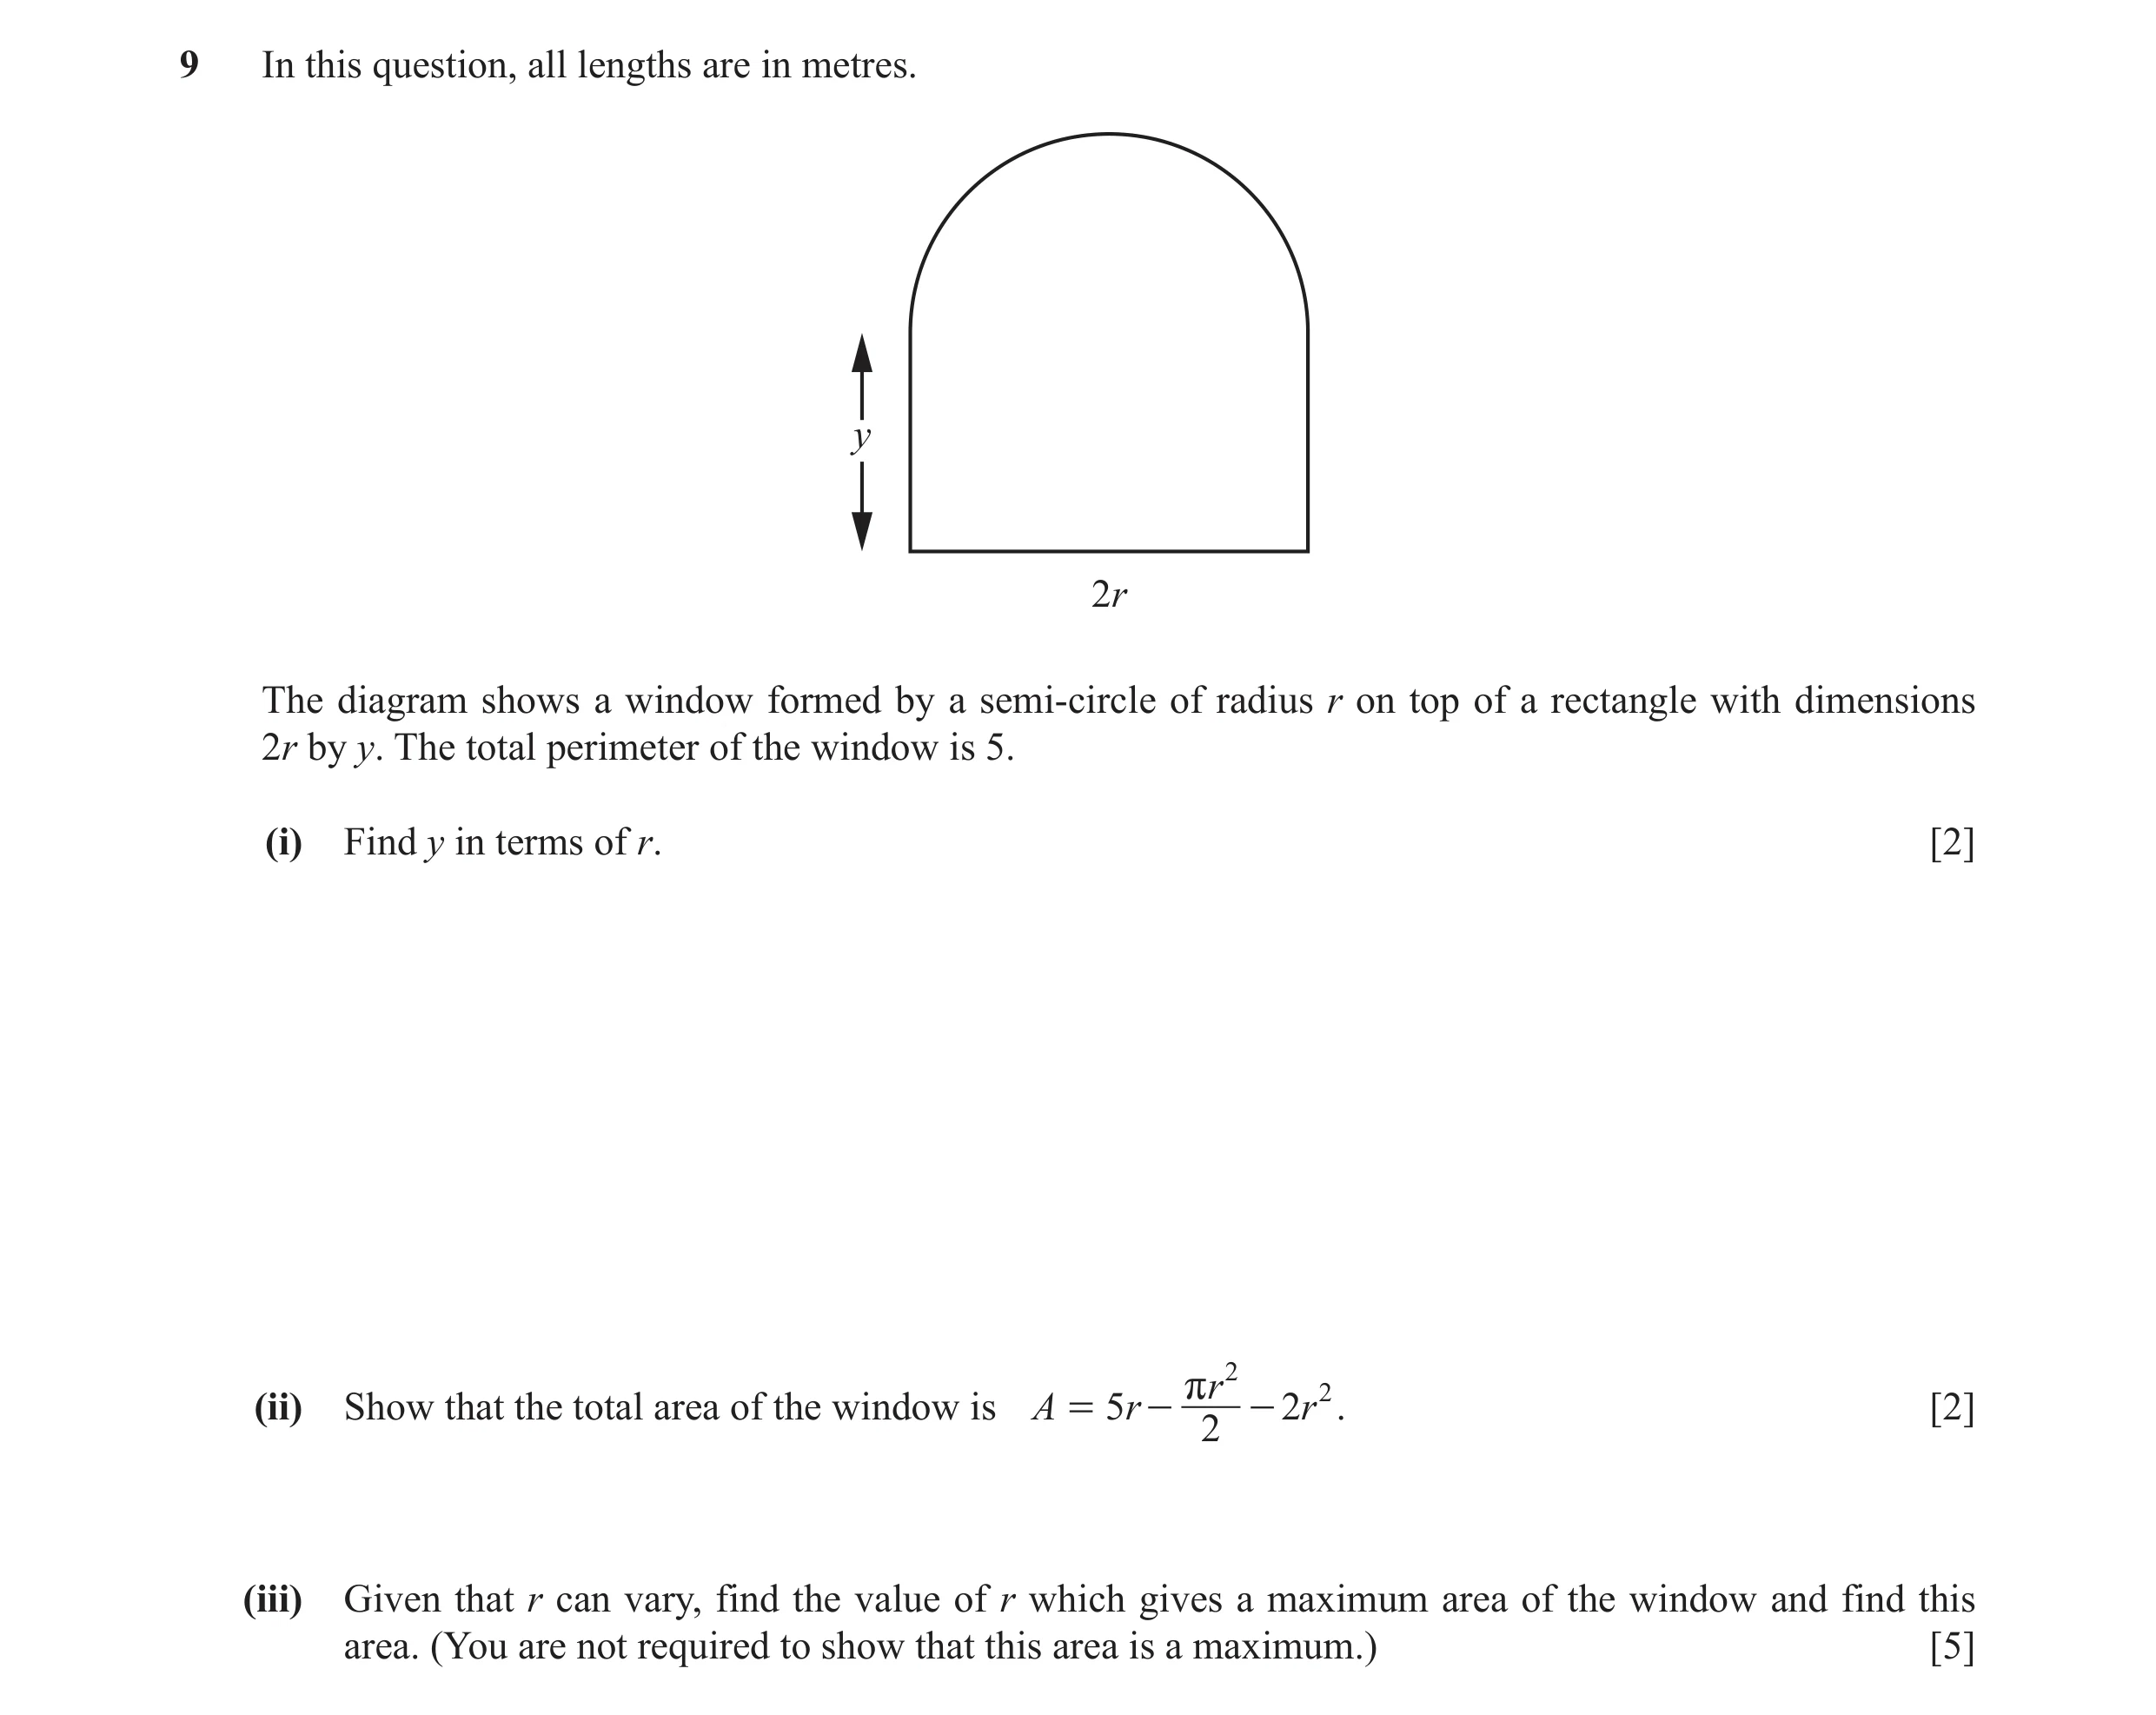
9 In this question, all lengths are in metres. y 2r The diagram shows a window formed by a semi-circle of radius r on top of a rectangle with dimensions 2r by y. The total perimeter of the window is 5. (i) Find y in terms of r. [2] 2 r r 2 (ii) Show that the total area of the window is A = 5r - - 2r . [2] 2 (iii) Given that r can vary, find the value of r which gives a maximum area of the window and find this area. (You are not required to show that this area is a maximum.) [5]
9 marks
Mark scheme: 9(i) 2 y + 2r + πr = 5 B1 5 − 2 r −πr B1 Dep y = 2 9(ii) πr 2 M1 A = 2 yr + 2 πr 2 A1 = r ( 5 − 2 r −πr ) + 2 2 πr 2 = 5 r − 2 r − 2 9(iii) M1 differentiate dA A1 = 5 −πr − 4 r dr dA M1 set to zero and attempt to solve = 0 dr 5 A1 r = = 0.7 π+ 4 A = 1.75 A1
This question in 0606/21 Oct/Nov 2018
Q5 · The relationship between experimental values of two variables, x and y, is given by y =… 0606/22 Feb/March 2019
6 The relationship between experimental values of two variables, x and y, is given by y = Abx , where A and b are constants. (i) Transform the relationship y = Abx into straight line form. [2] The diagram shows ln y plotted against x for ten different pairs of values of x and y. The line of best fit has been drawn. ln y 8 7 6 5 4 3 2 1 0 1 2 3 4 x (ii) Find the equation of the line of best fit and the value, correct to 1 significant figure, of A and of b. [4] (iii) Find the value, correct to 1 significant figure, of y when x = 2.7. [2]
8 marks
Mark scheme: 6(i) Takes logs, to any base, of both sides and applies M1 the addition/multiplication law for logs ln y = ln( Ab x ) ⇒ ln y = ln A + ln b x ⇒ ln y = ln A + x ln b A1 6(ii) ln y = 1.4x + 2.2 oe B2 B1 for either m = 1.4 or ln b = 1.4 or c = or ln y = xln 4 + ln 9 oe 2.2 or ln A = 2.2 [ A = e their 2.2 = ]9 and B2 FT their 2.2 and their 1.4 [b = e their 1.4 = ] 4 their 2.2 their 1.4 B1 FT for A = e or b = e or correct FT decimal rounded to more than 1 sf 6(iii) ln y = 6 M1 or y = their 9(their 4 2.7 ) or y = e their 2.2 (e their 1.4 × 2.7 ) or ln y = their1.4(2.7) + their 2.2 or ln y = (2.7)ln(their 4) + ln( their 9) awrt 400 correct to 1 sf A1
This question in 0606/22 Feb/March 2019
Q6 · Variables x and y are such that, when 1g y is plotted against x3 , a straight line graph… 0606/22 Feb/March 2020
2 Variables x and y are such that, when 1g y is plotted against x3 , a straight line graph passing through the points (6, 7) and (10, 9) is obtained. Find y as a function of x. [4]
4 marks
Mark scheme: 2 Valid method to find m M1 9 − 7 1 m = = 10 − 6 2 Valid method to find c M1 FT their m 1 e.g. 7 = their × 6 + c 2 1 3 M1 lg y = their x + their 4 2 1 x 3 + 4 A1 y = 10 2 oe, isw
This question in 0606/22 Feb/March 2020
Q7 · Variables x and y are such that, when 4 y is plotted against ,x a straight line graph… 0606/21 May/June 2020
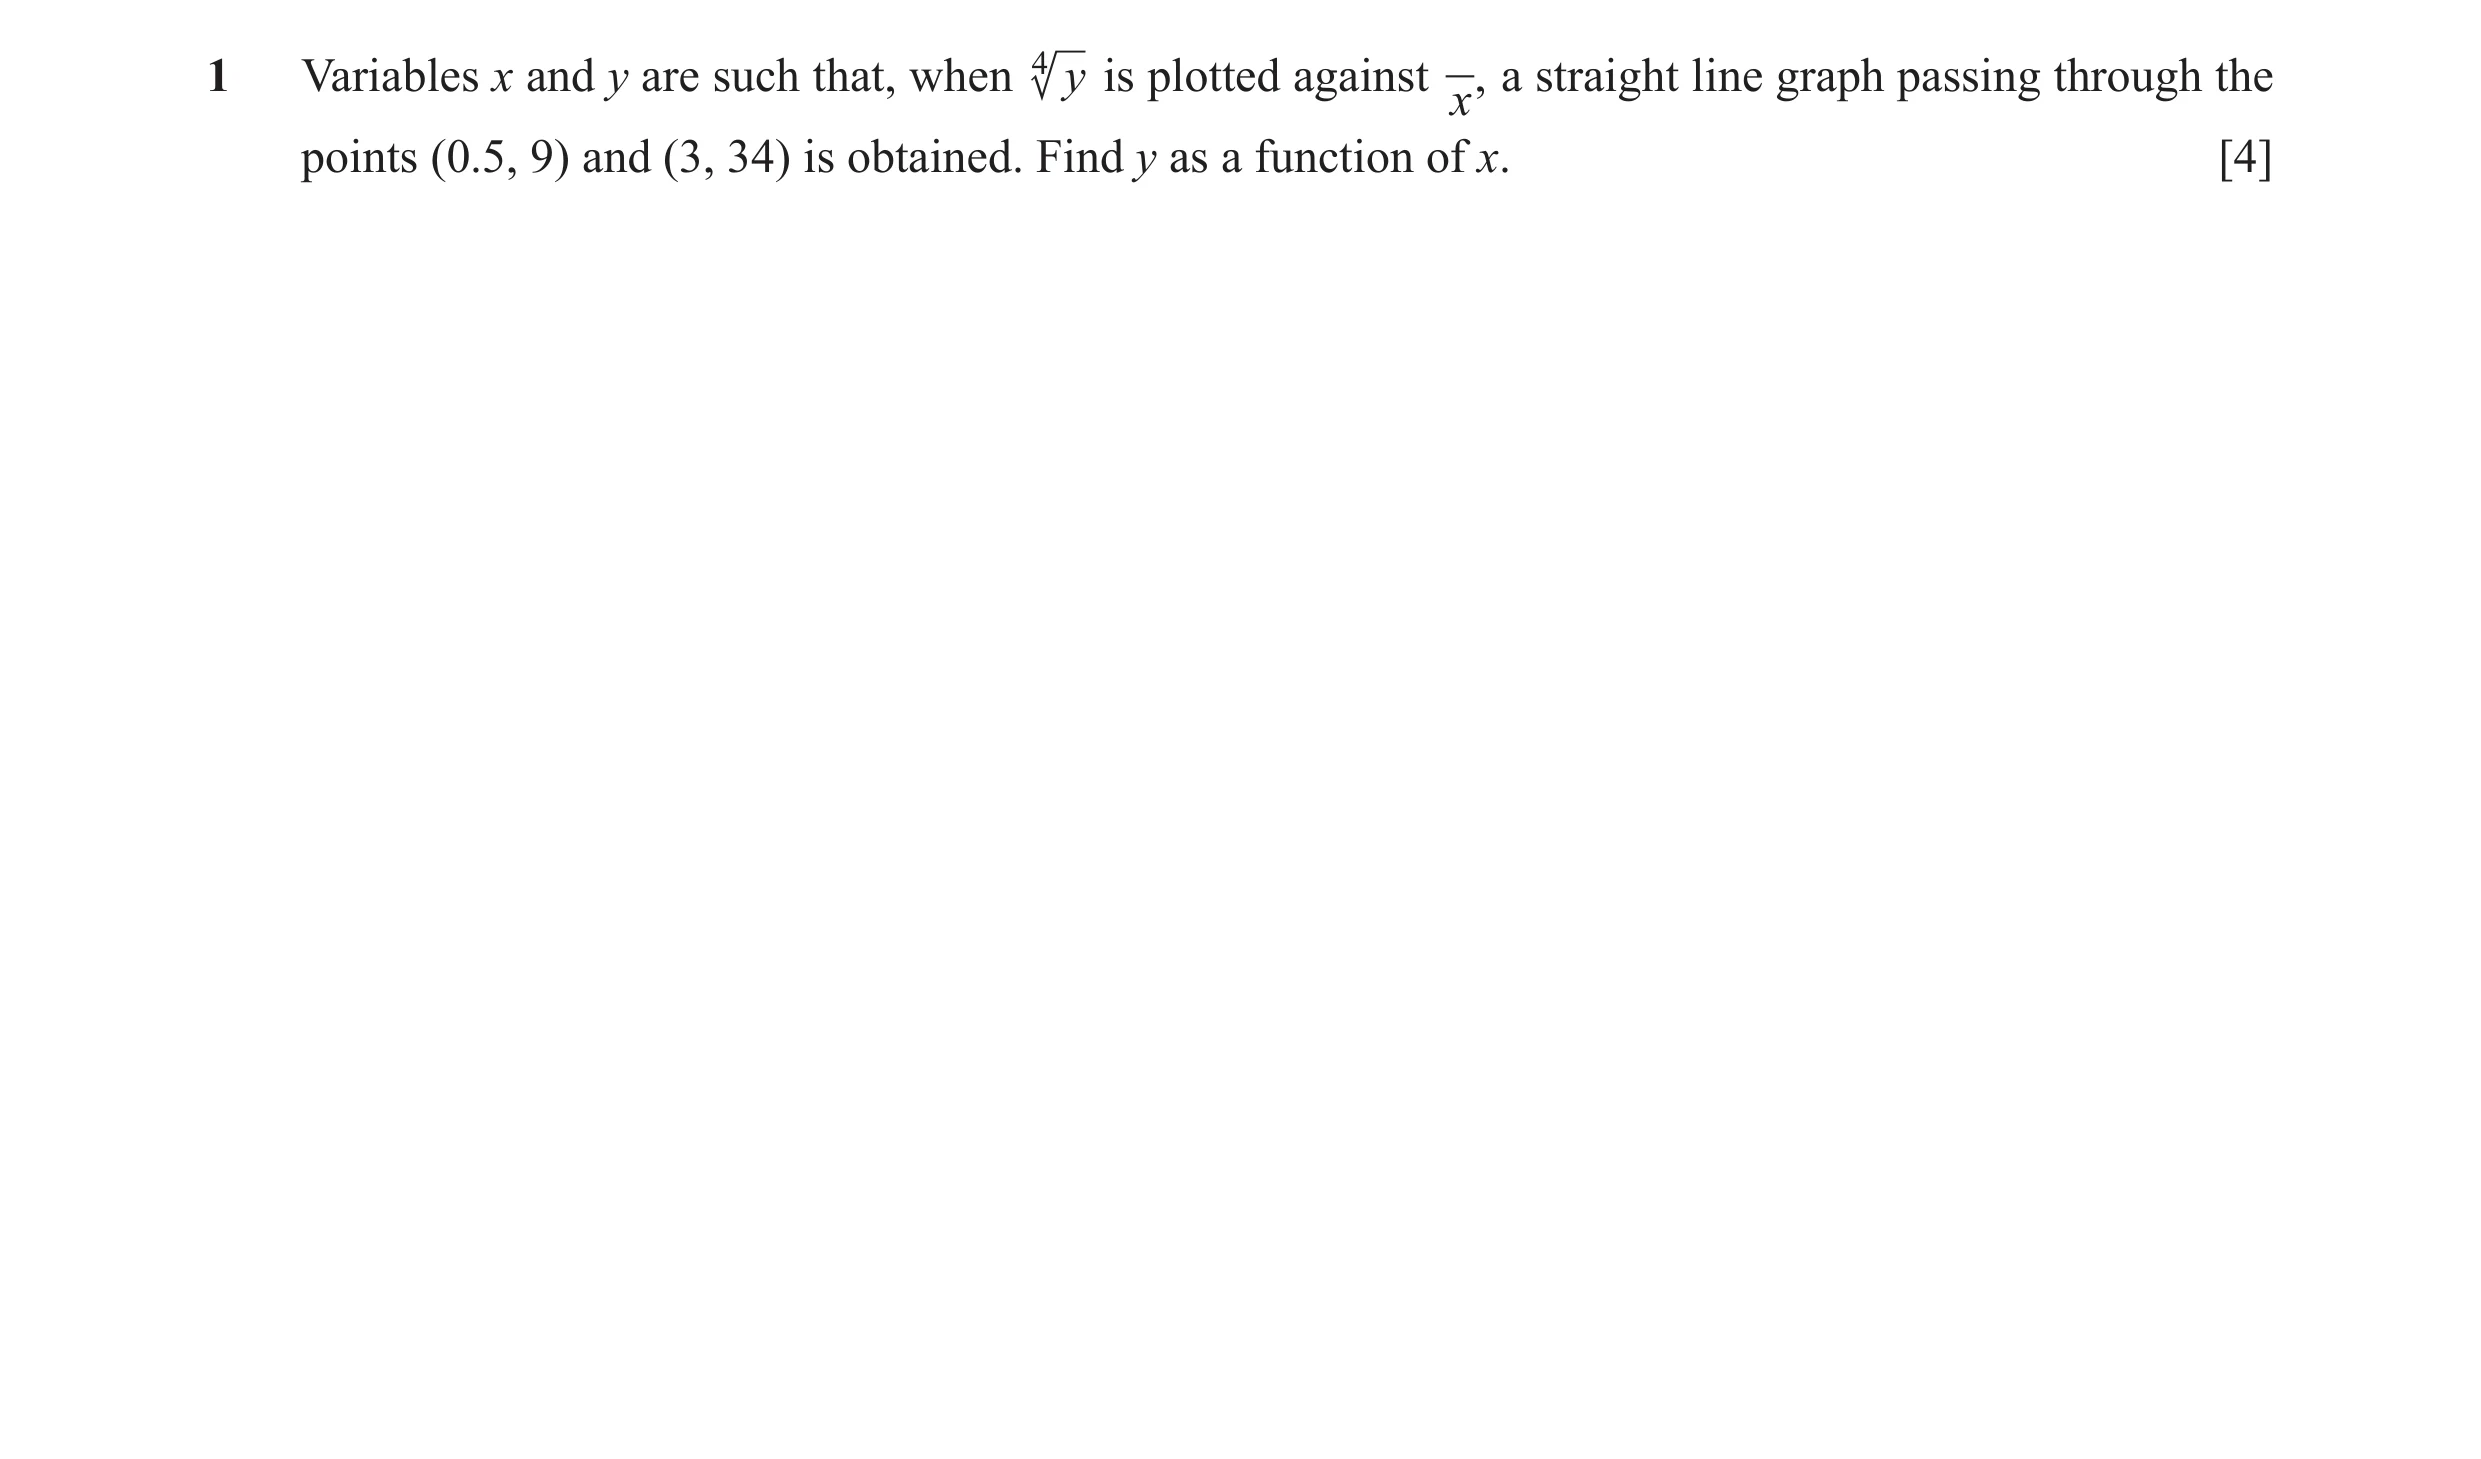
1 Variables x and y are such that, when 4 y is plotted against ,x a straight line graph passing through the points (0.5, 9) and (3, 34) is obtained. Find y as a function of x. [4]
4 marks
Mark scheme: Question Answer Marks Partial Marks 1 Valid method to find m M1 34 − 9 m = [ = 10 ] oe 3 − 0.5 Valid method to find c, e.g. M1 34 = their 10 × 3 + c 1 M1 4 y = ( their10 ) + their 4 x 4 A1 10 y = + 4 oe, cao x
This question in 0606/21 May/June 2020
Q8 · Variables x and y are connected by the relationship y = Axn , where A and n are constants 0606/23 May/June 2020
7 Variables x and y are connected by the relationship y = Axn , where A and n are constants. (a) Transform the relationship y = Axn to straight line form. [2] When ln y is plotted against ln x a straight line graph passing through the points (0, 0.5) and (3.2, 1.7) is obtained. (b) Find the value of n and of A. [4] (c) Find the value of y when x = 11. [2]
8 marks
Mark scheme: 7(a) ln y = ln( Ax n ) and so M1 ln y = ln A + ln x n ln y = ln A + n ln x A1 7(b) lnA = 0.5 M1 A = e 0.5 or 1.6 A1 n = 1.7 − 0.5 M1 3.2 − 0 3 A1 n = oe 8 7(c) their 3 M1 y = their e 0.5 (11) 8 oe 4.05 or 4.05200... rot to four or more figs A1
This question in 0606/23 May/June 2020
Q9 · Variables x and y are such that when 3 y is plotted against x2 , a straight line passing… 0606/21 May/June 2022
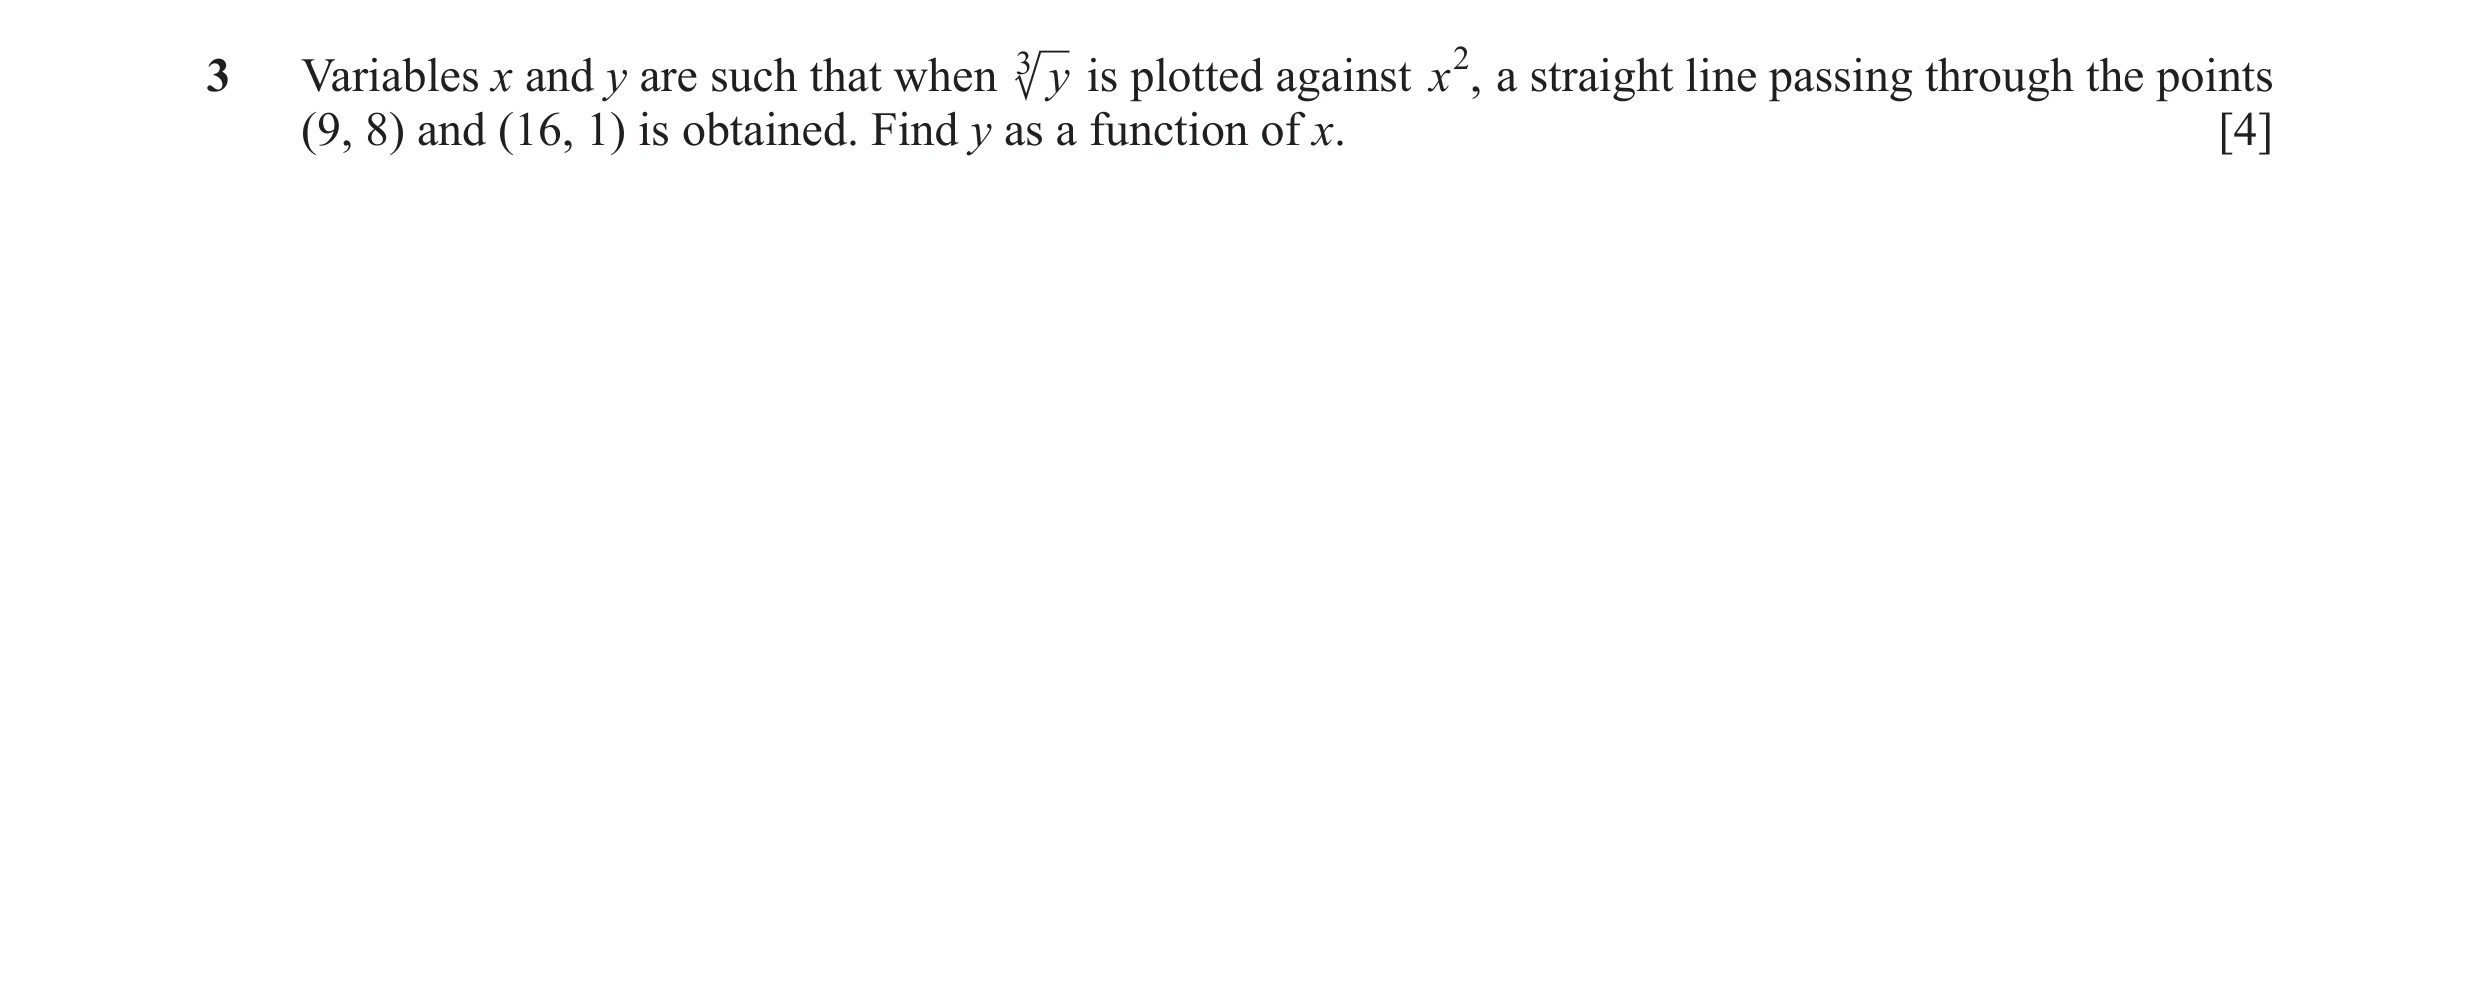
3 Variables x and y are such that when 3 y is plotted against x2 , a straight line passing through the points (9, 8) and (16, 1) is obtained. Find y as a function of x. [4]
4 marks
Mark scheme: 3 Valid method to find m M1 8 1 m = 1 9 16 Valid method to find c e.g. M1 FT their m 1 their ( 1) 16 c 3 y their ( 1) x 2 their17 A1 Equation with correct variables and 3 y = 3 y x 2 17 oe, isw A1
This question in 0606/21 May/June 2022
Q10 · Variables P and T are known to be connected by the relationship P = AbT , where A and b… 0606/22 May/June 2023
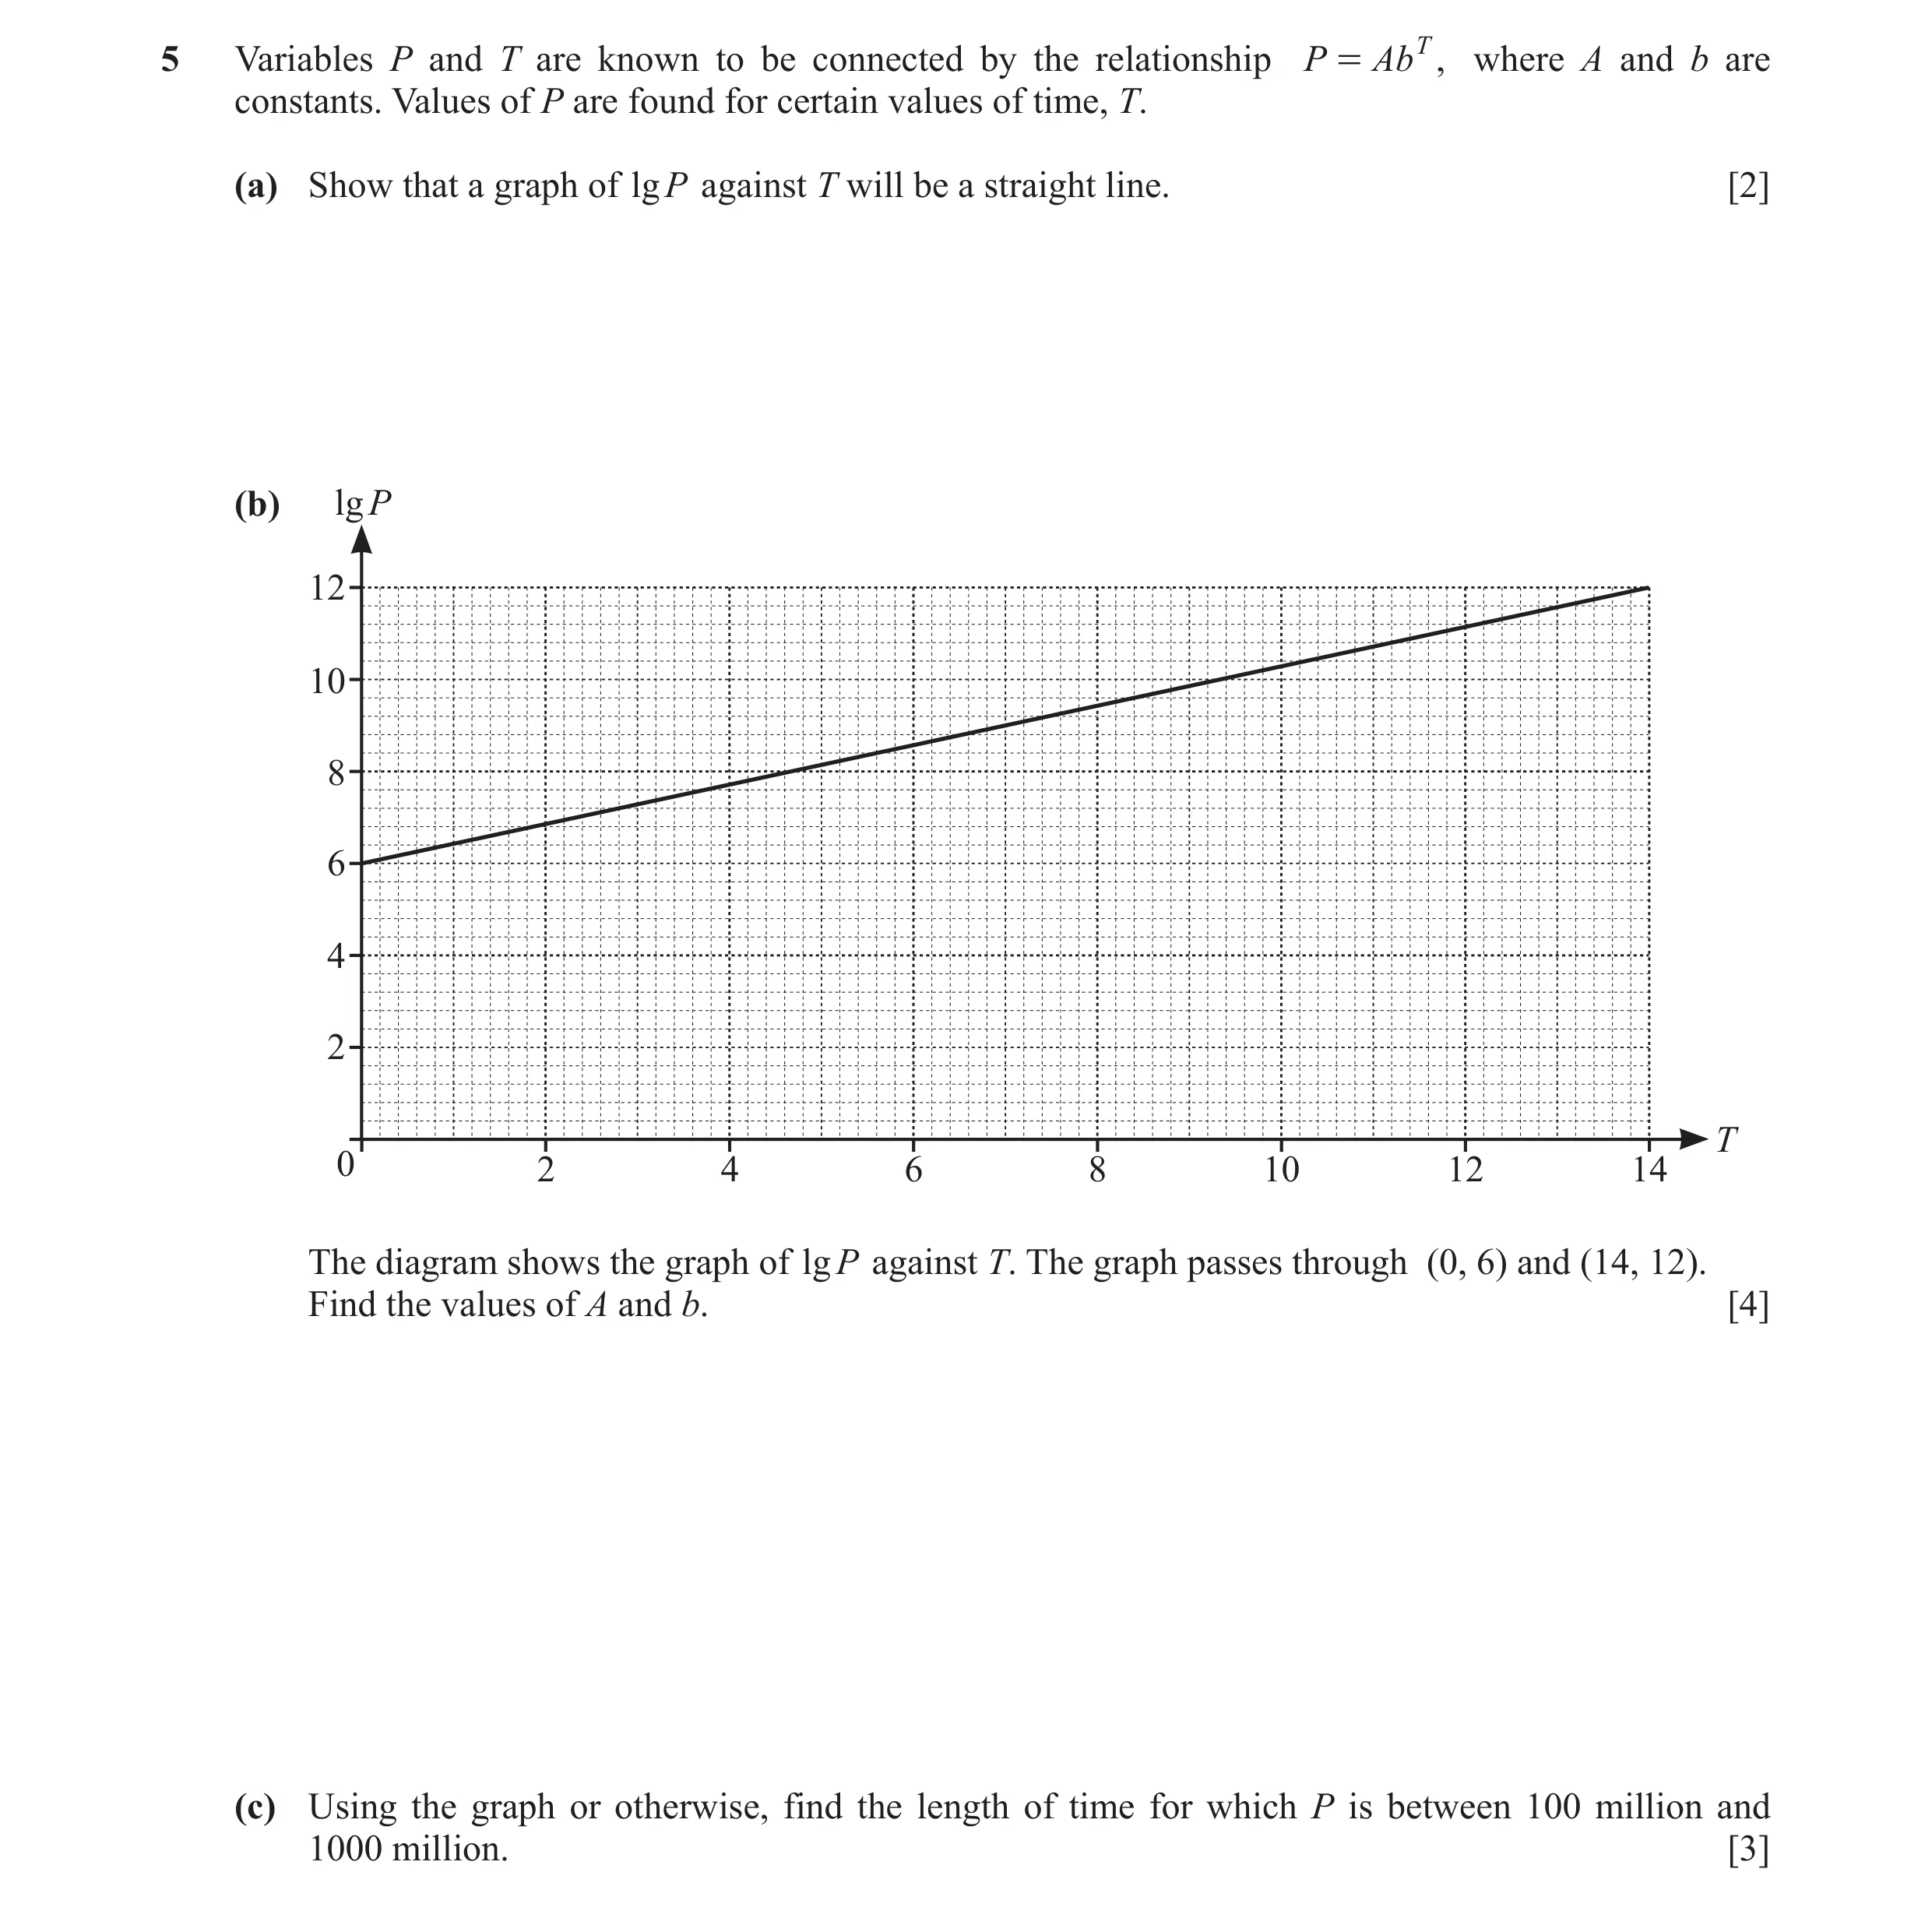
5 Variables P and T are known to be connected by the relationship P = AbT , where A and b are constants. Values of P are found for certain values of time, T. (a) Show that a graph of lgP against T will be a straight line. [2] (b) lg P 12 10 8 6 4 2 T 0 2 4 6 8 10 12 14 The diagram shows the graph of lgP against T. The graph passes through (0, 6) and (14, 12). Find the values of A and b. [4] (c) Using the graph or otherwise, find the length of time for which P is between 100 million and 1000 million. [3]
9 marks
Mark scheme: 5(a) lg P lg A T lg b oe nfww B2 Must be seen and not from wrong working and correct comparison with y = mx + c soi B1 for lg P lg A T lg b isw, nfww 5(b) A = 106 oe isw and 4 B2 for A = 106 oe isw 3 or B1correct method which could be used b = 10 7 oe isw to find A e.g. 3 lgA = 6 or 12 = 14 lg A 7 3 B2 for b = 10 7 oe isw or B1correct method which could be used to find b e.g. 12 6 lgb = oe or 12 = 14lg b 6 14 0 5(c) lg P1 = 8 and lg P2 = 9 soi M1 If graph not used then allow M1 for substitution of their A and their b in the leading to exponential equation as far as 108 10 9 (theirb )T and (theirb )T T1 = 4.6 to 4.8 theirA theirA or T2 = 6.8 to 7.2 OR substitution of their A and their b or their lgA and their lg b in the log equation lg108 their lg A T (their lg b ) or better and lg109 their lg A T (their lg b ) or better Difference of correct times: M1 T2 T1 where T2 = 6.8 to 7.2 T1 = 4.6 to 4.8 Answer in range 2.2 to 2.4 nfww A1 Alternative method 9 8 (M2) M1 for lg108 = 8 and lg109 = 9 and Change in T = 3 Change in lg P 3 7 Change in T 7 Answer in range 2.2 to 2.4 nfww (A1)
This question in 0606/22 May/June 2023
Q11 · DO NOT USE A CALCULATOR IN THIS QUESTION 0606/23 May/June 2023
2 DO NOT USE A CALCULATOR IN THIS QUESTION. 98x 12 Write the expression in the form a b + c xd where a, b, c and d are integers. [4] 3 + 2 ` j
4 marks
Mark scheme: 2 6 M2 12 7 2 x 3 2 98 x 3 2 6 M1 for 7 2x or or 3 2 3 2 3 2 3 2 98 x 6 3 2 or 3 2 3 2 their 7 2 x 6 3 2 3 2 3 2 21 2 x 6 14 x 6 7 x 6 (3 2 2) A1 or oe 9 2 9 2 (3 2 2) x 6 A1 Alternative method 12 6 (M1) 98 x 3 2 98 x 3 2 or 3 2 3 2 3 2 3 2 12 12 6 6 (M1) 3 98 x 196 x 3 98 x 196 x or 9 2 9 2 12 12 6 6 (A1) 3 98 x 196 x 3 7 2 x 14 x or oe 49 7 (3 2 2) x 6 (A1)
This question in 0606/23 May/June 2023
Q12 · DO NOT USE A CALCULATOR IN THIS QUESTION 0606/22 Feb/March 2024
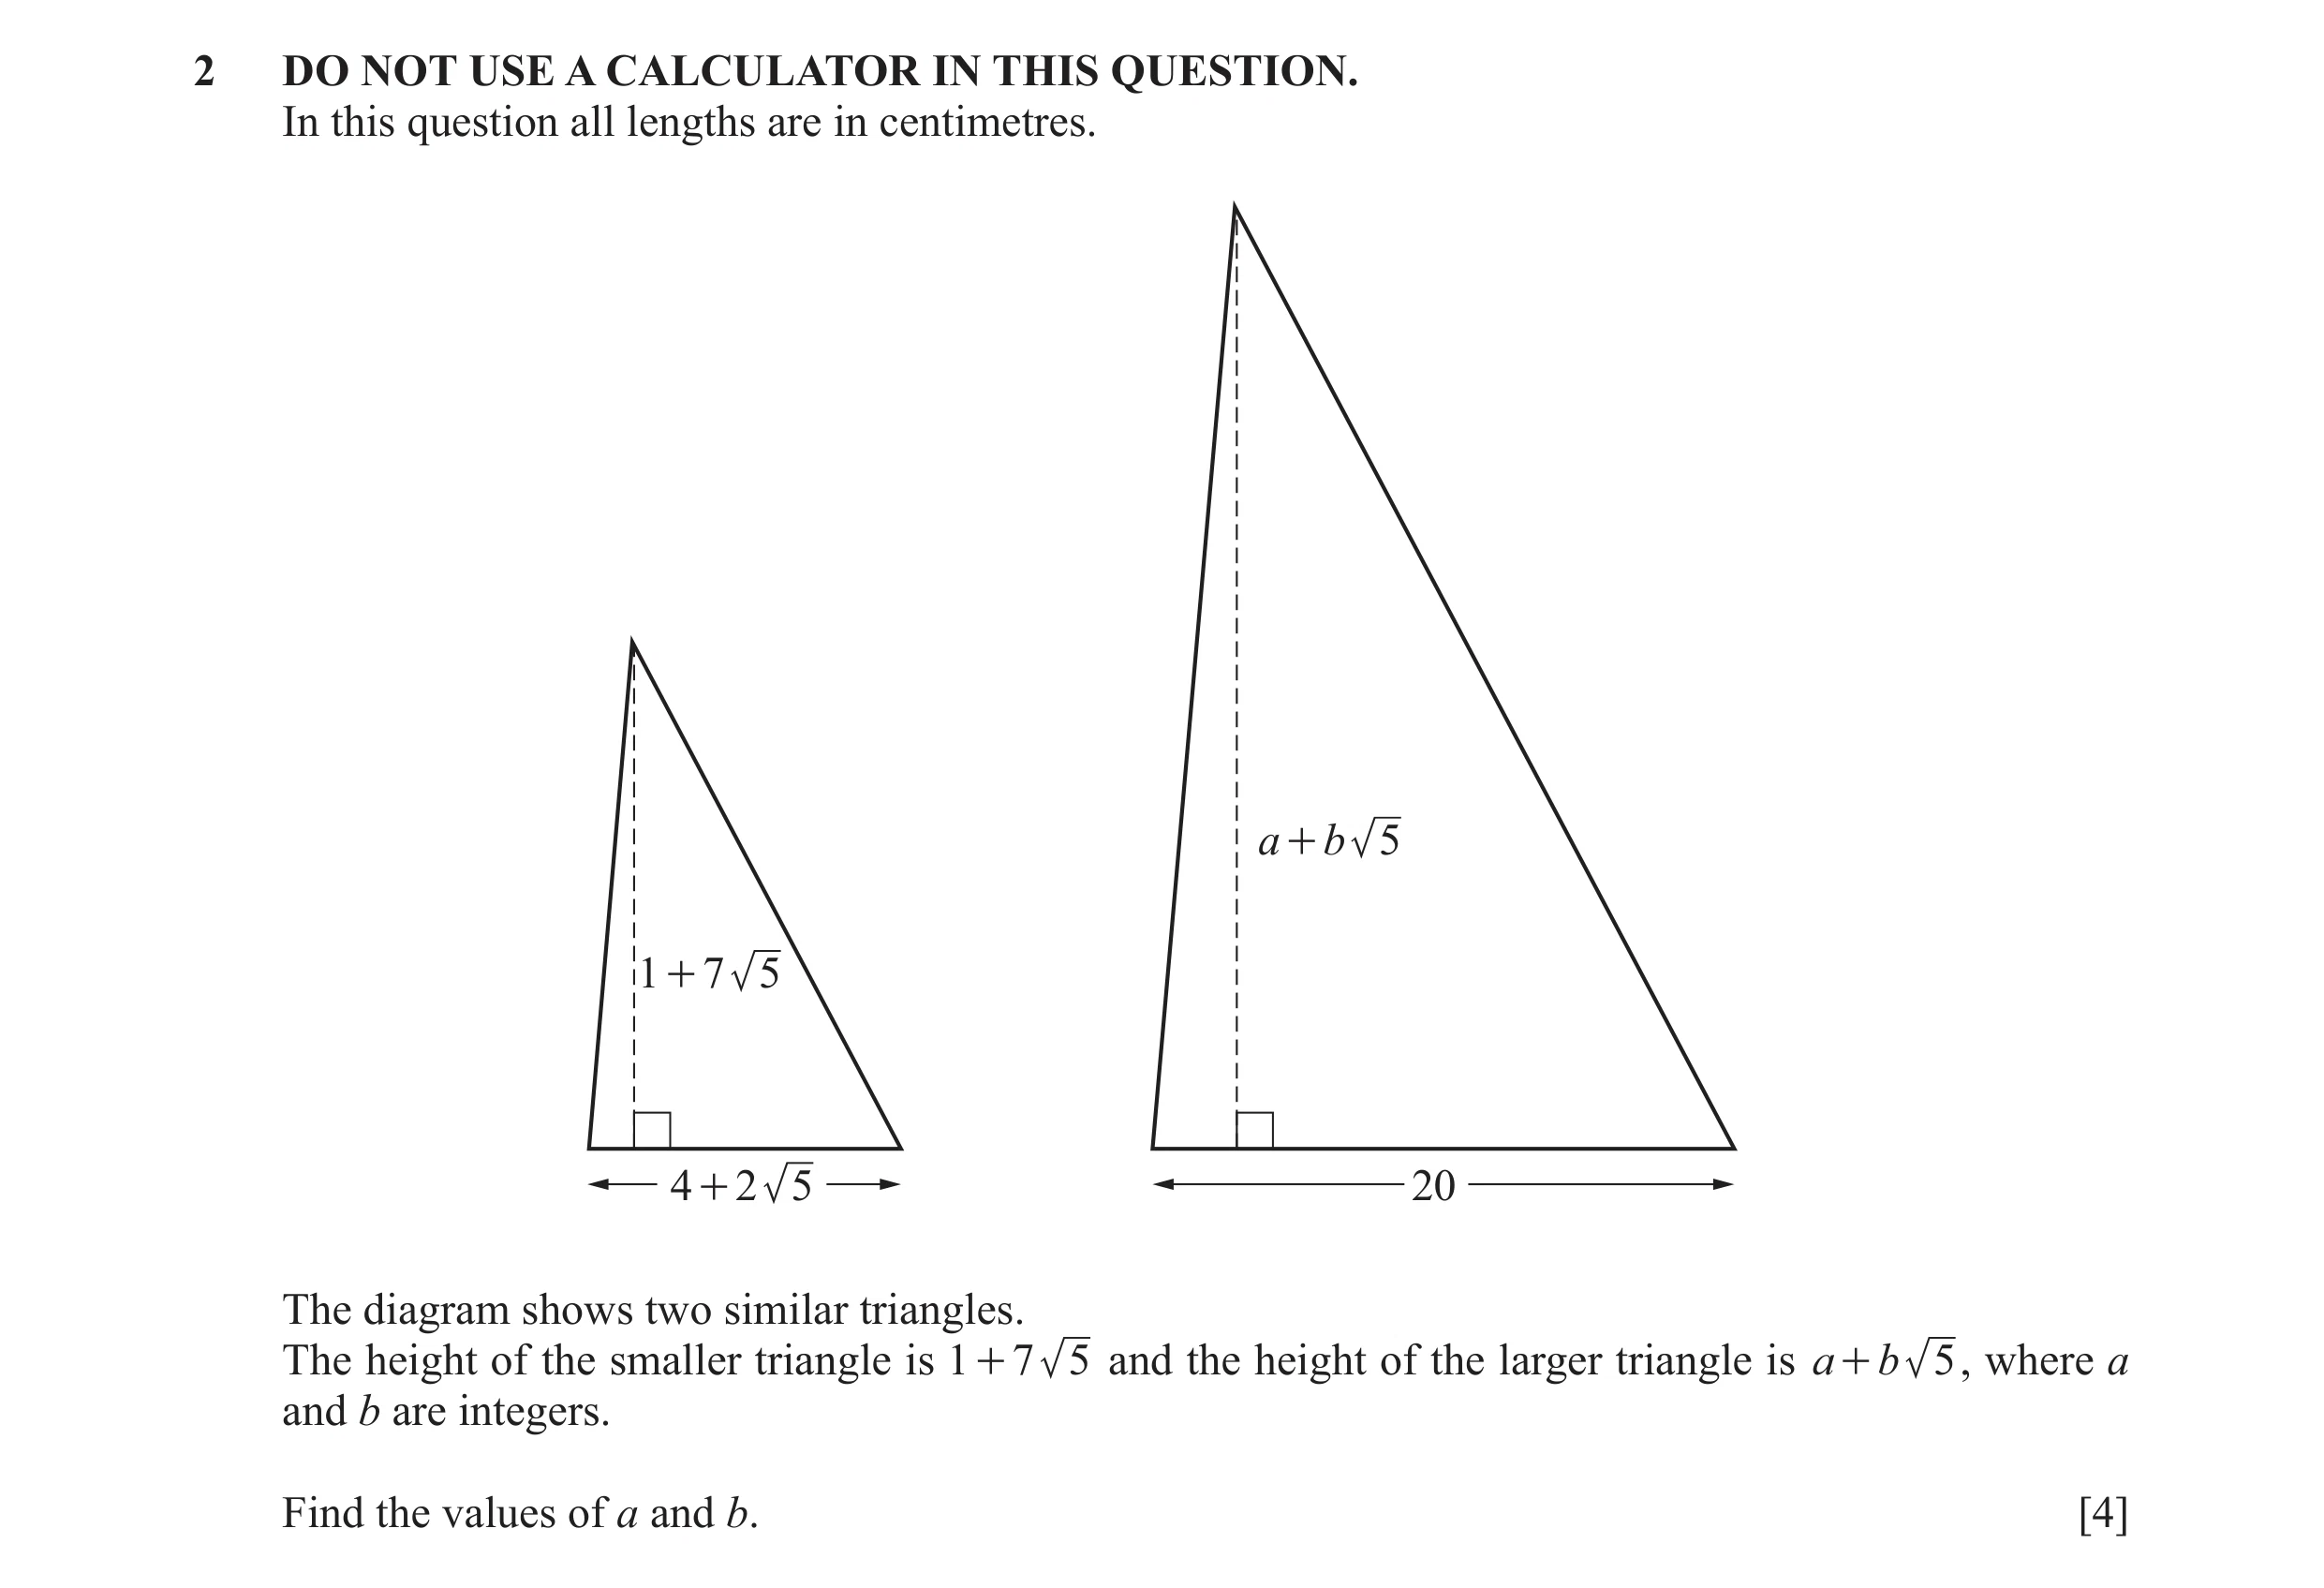
2 DO NOT USE A CALCULATOR IN THIS QUESTION. In this question all lengths are in centimetres. a + b 5 1 + 7 5 4 + 2 5 20 The diagram shows two similar triangles. The height of the smaller triangle is 1 + 7 5 and the height of the larger triangle is a + b 5 , where a and b are integers. Find the values of a and b. [4]
4 marks
Mark scheme: 2 a + b 5 20 20(1 + 7 5) B1 = or oe, soi 1 + 7 5 4 + 2 5 4 + 2 5 + 7 5 4 − 2 5 M1 condone one slip providing it is not in 20 1 the rationalisation factor 4 + 2 5 4 − 2 5 + 7 5 2 − 5 or 10 1 oe 2 + 5 2 − 5 A1 20(28 5 − 70 + 4 − 2 5) 16 − 20 10(14 5 − 35 + 2 − 5) or oe 4 − 5 a = 330 and b = −130 oe, nfww A1 Alternative method a + b 5 20 (B1) = oe, soi 1 + 7 5 4 + 2 5 Cross multiplies and multiplies out: (M1) condone one sign or arithmetic error 20 + 140 5 = 4 a + 4b 5 + 2 a 5 + 10b Correct pair of simultaneous equations (A1) 4a + 10b = 20 oe 2a + 4b = 140 oe and solves for a = 330 or b = −130 a = 330 and b = −130 oe, nfww (A1)
This question in 0606/22 Feb/March 2024
Q13 · Variables y and x are known to be connected by the relationship y = Abx where A and b are… 0606/22 Feb/March 2024
8 Variables y and x are known to be connected by the relationship y = Abx where A and b are constants. The table shows values of y for certain values of x. x 1 3 5 10 12 y 38 150 600 20 500 82 000 (a) Draw the graph of lgy against x. [2] lg y 5 4 3 2 1 0 2 4 6 8 10 12 x (b) Use your graph to find values of A and b, giving each to 1 significant figure. [6] (c) Find an estimate of x when y = 1500 . [2]
10 marks
Mark scheme: 8(a) Points plotted at B2 B1 for at least 4 correctly plotted points x 1 3 5 10 12 lg y 1.6 2.2 2.8 4.3 4.9 soi and ruled, single straight line of best fit 8(b) lgy = lgA + xlgb soi B1 lgA = their 1.3 soi M1 dep on using linear points 4.9 − 1.6 M1 dep on using linear points lgb = their oe or lgb = 0.3 oe soi 12 − 1 3 A2 3 A = 101.3 isw and b = 10 10 isw A1 for A = 101.3 isw or b = 10 10 isw A = 20 and b = 2 nfww A1 If zero scored, award SC1 for A = 20 and SC1 for b = 2 found without using the graph in any way 8(c) lg1500 = 3.2 or 3.17[60...] M1 1500 FT their A and b OR x = log theirb theirA lg1500 − their lg A FT their lgA and lgb OR x = their lg b awrt 6.2 to awrt 6.4 isw A1
This question in 0606/22 Feb/March 2024
 1 / 11
 2 / 11
 3 / 11
 4 / 11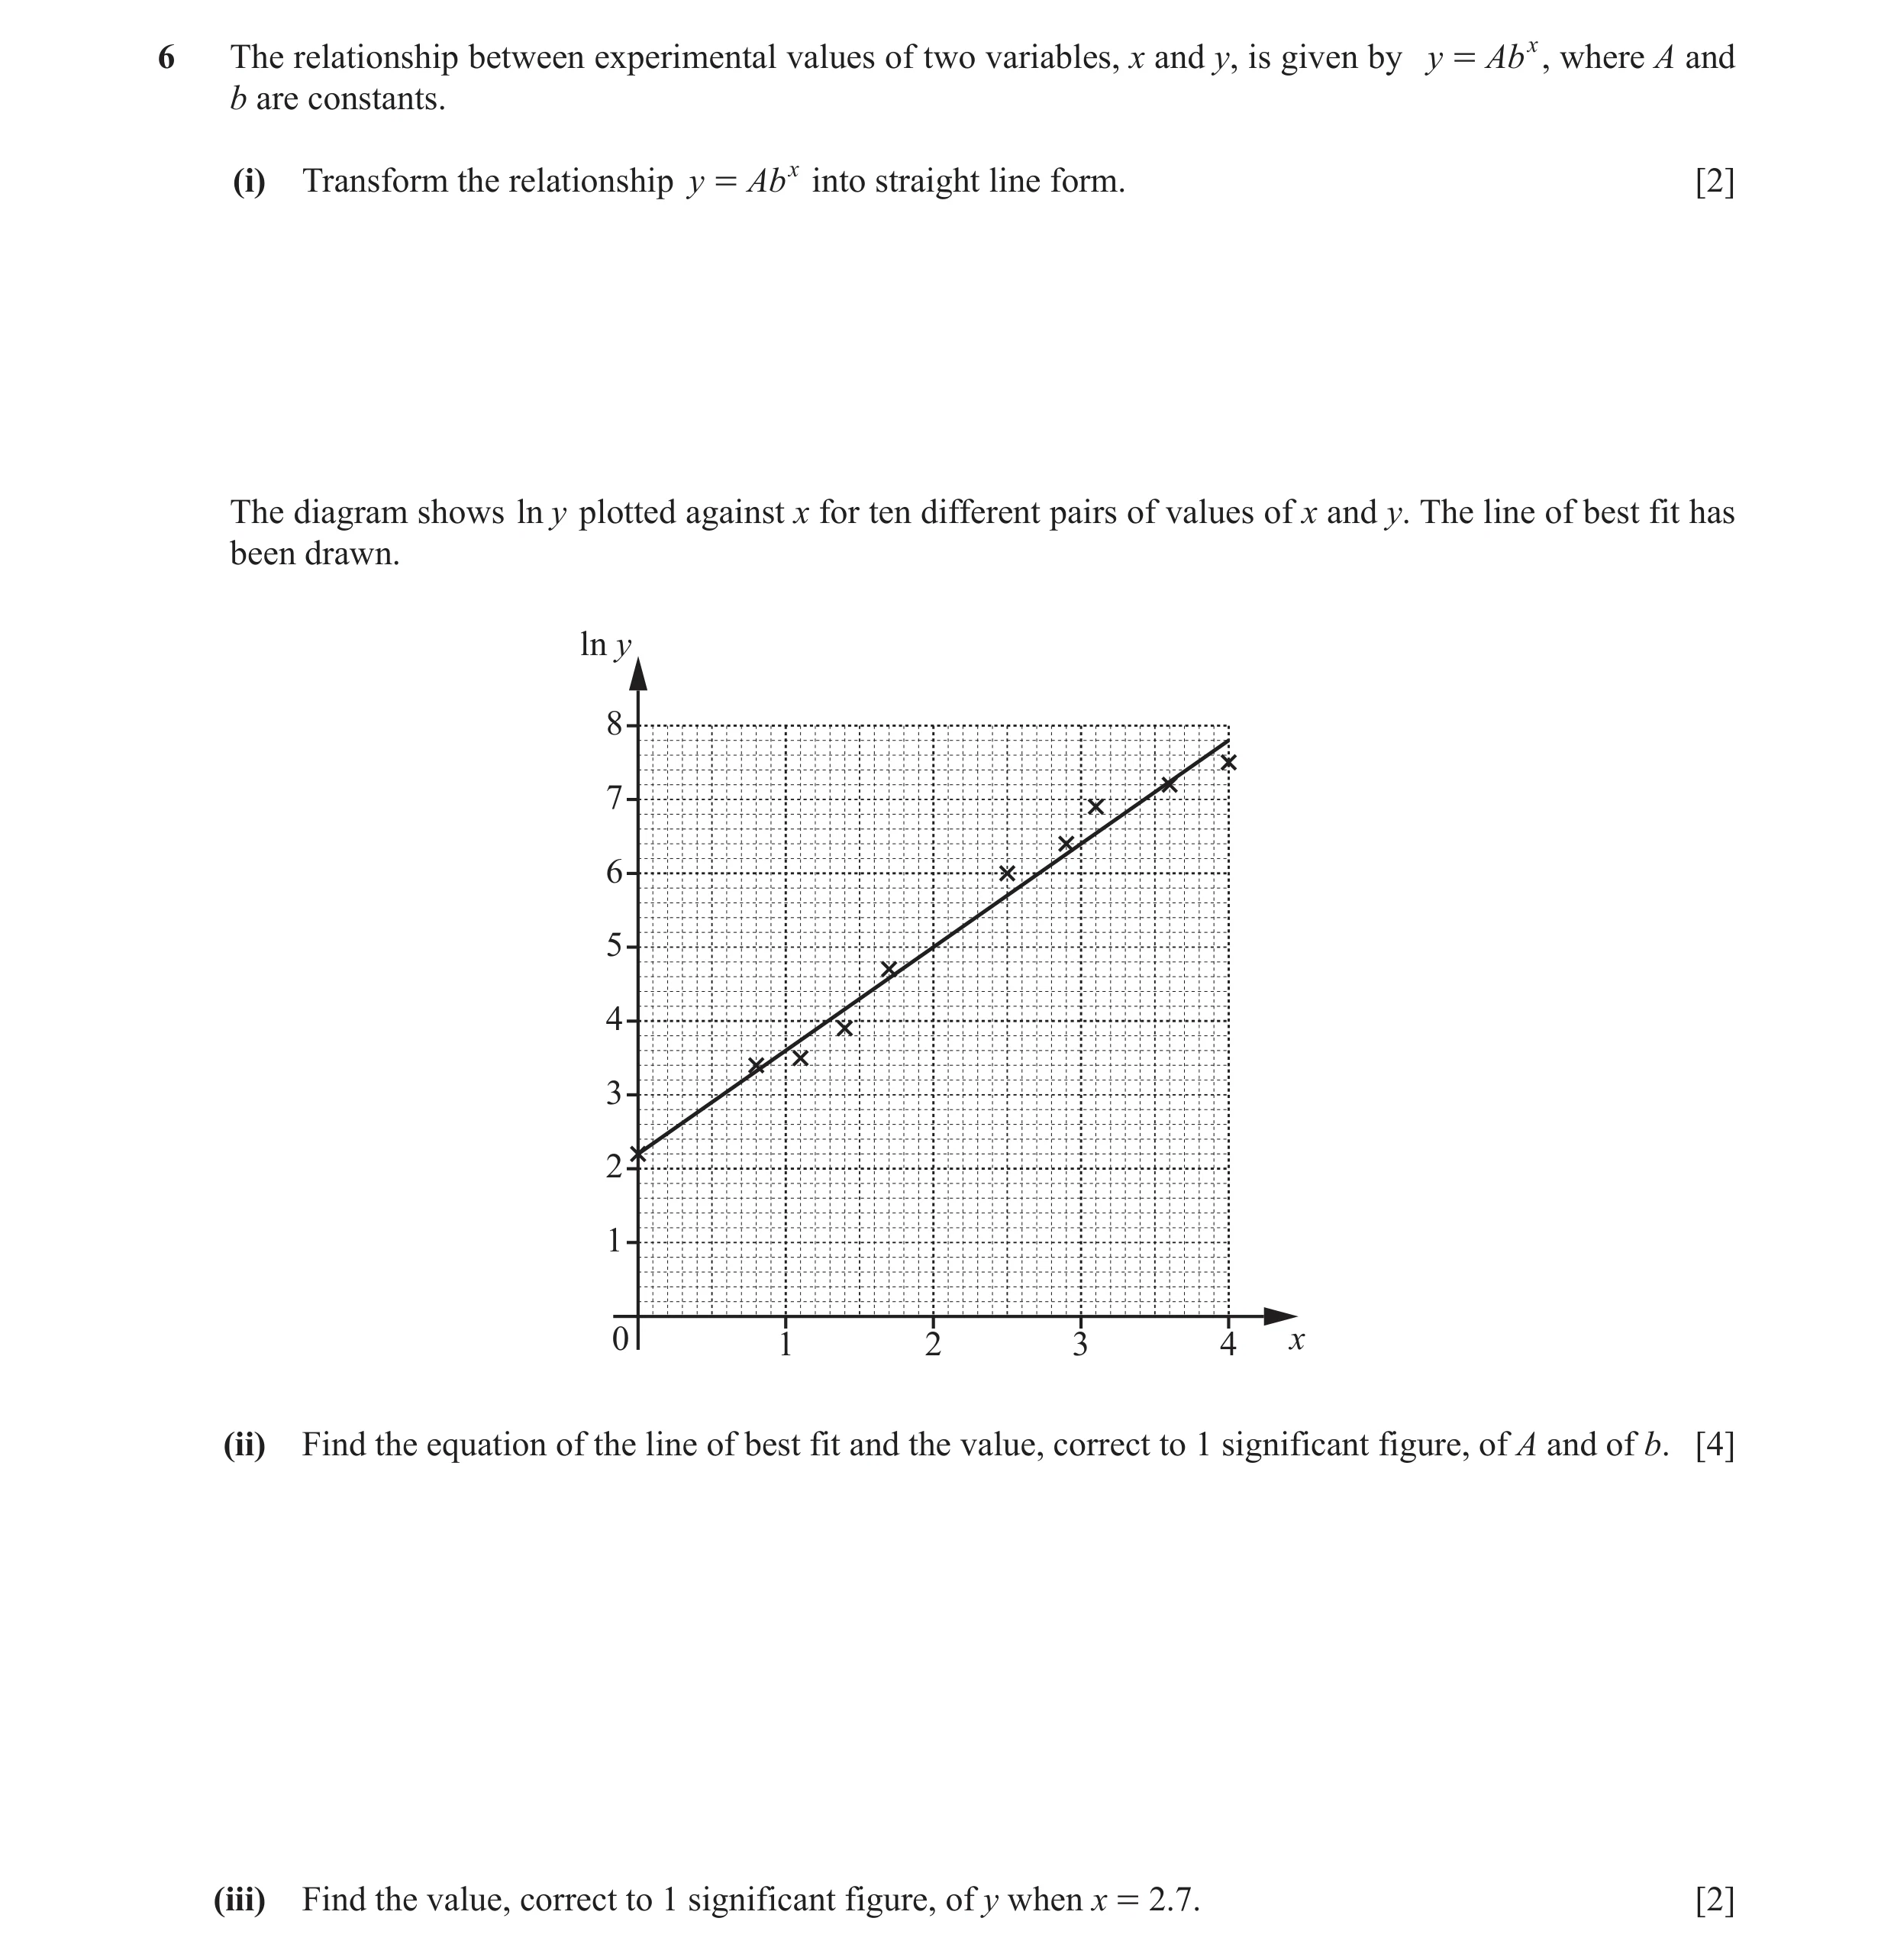
 5 / 11
 6 / 11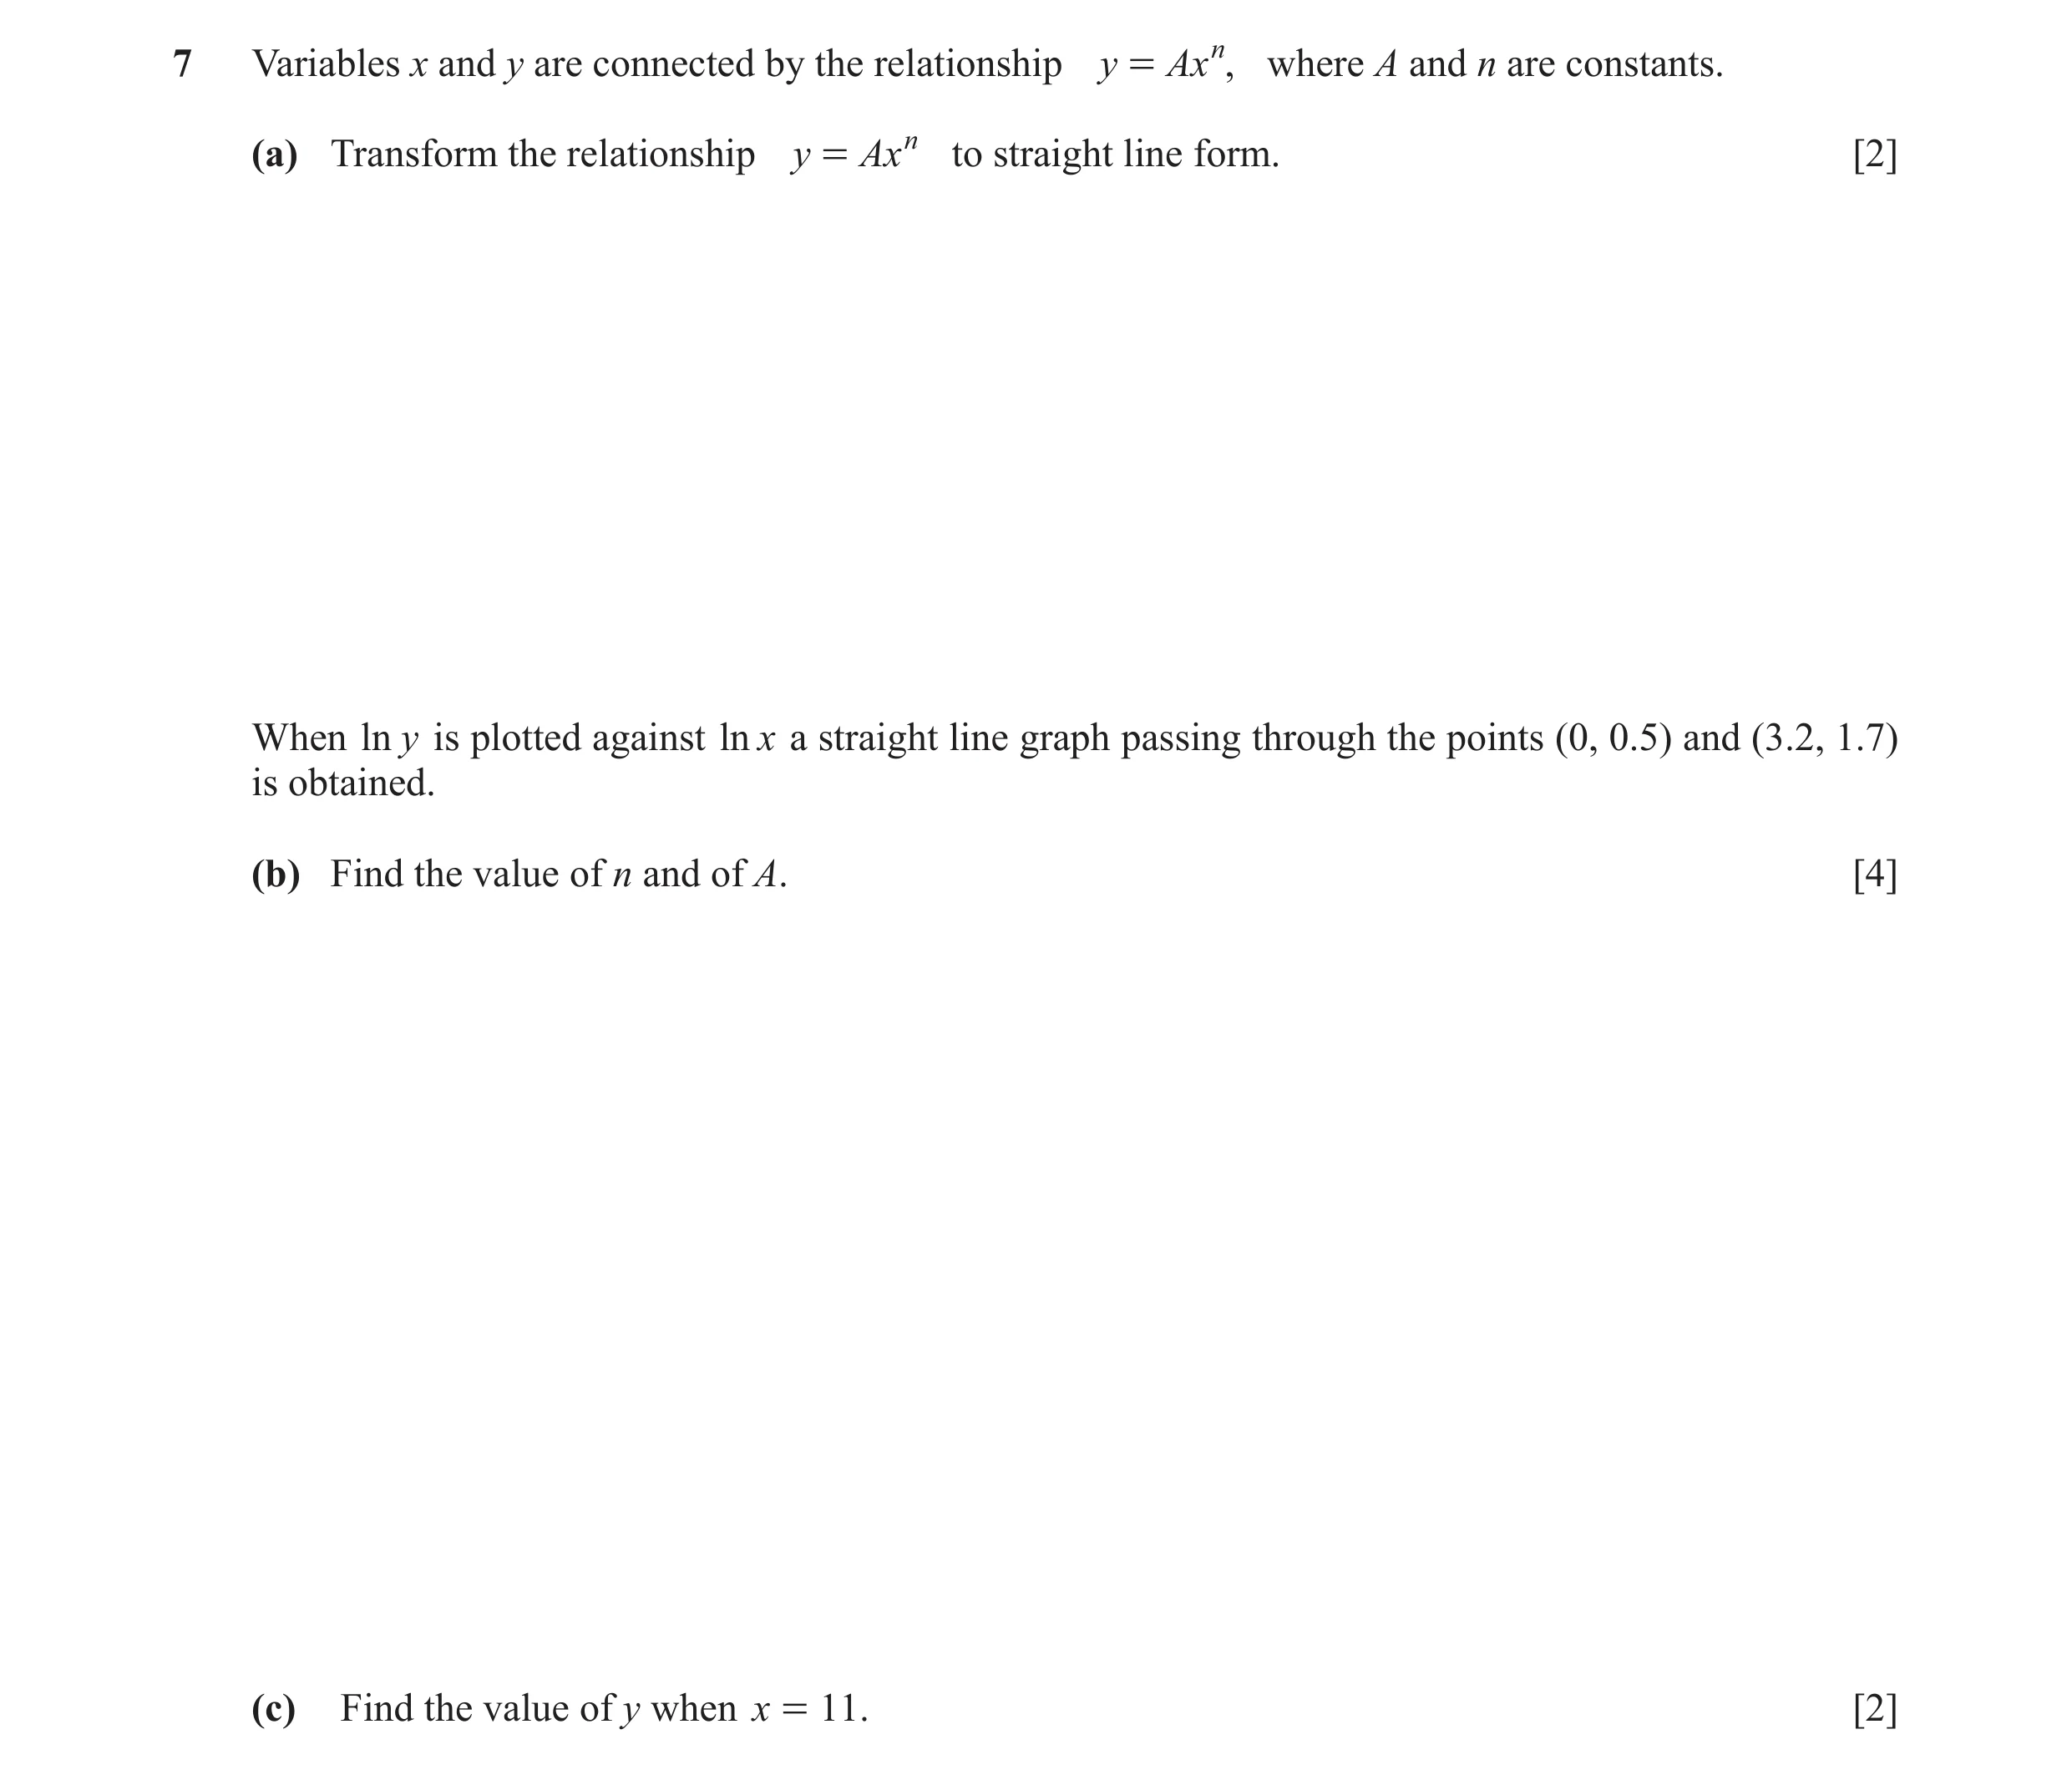
 7 / 11
 8 / 11
![Question 11: DO NOT USE A CALCULATOR IN THIS QUESTION. 98x 12 Write the expression in the form a b + c xd where a, b, c and d are integers. [4] 3 + 2 ` j](https://img.pastlit.com/crops/babbe620-45f8-4fd0-82f4-1914d4b67dbb/q2.webp)
 9 / 11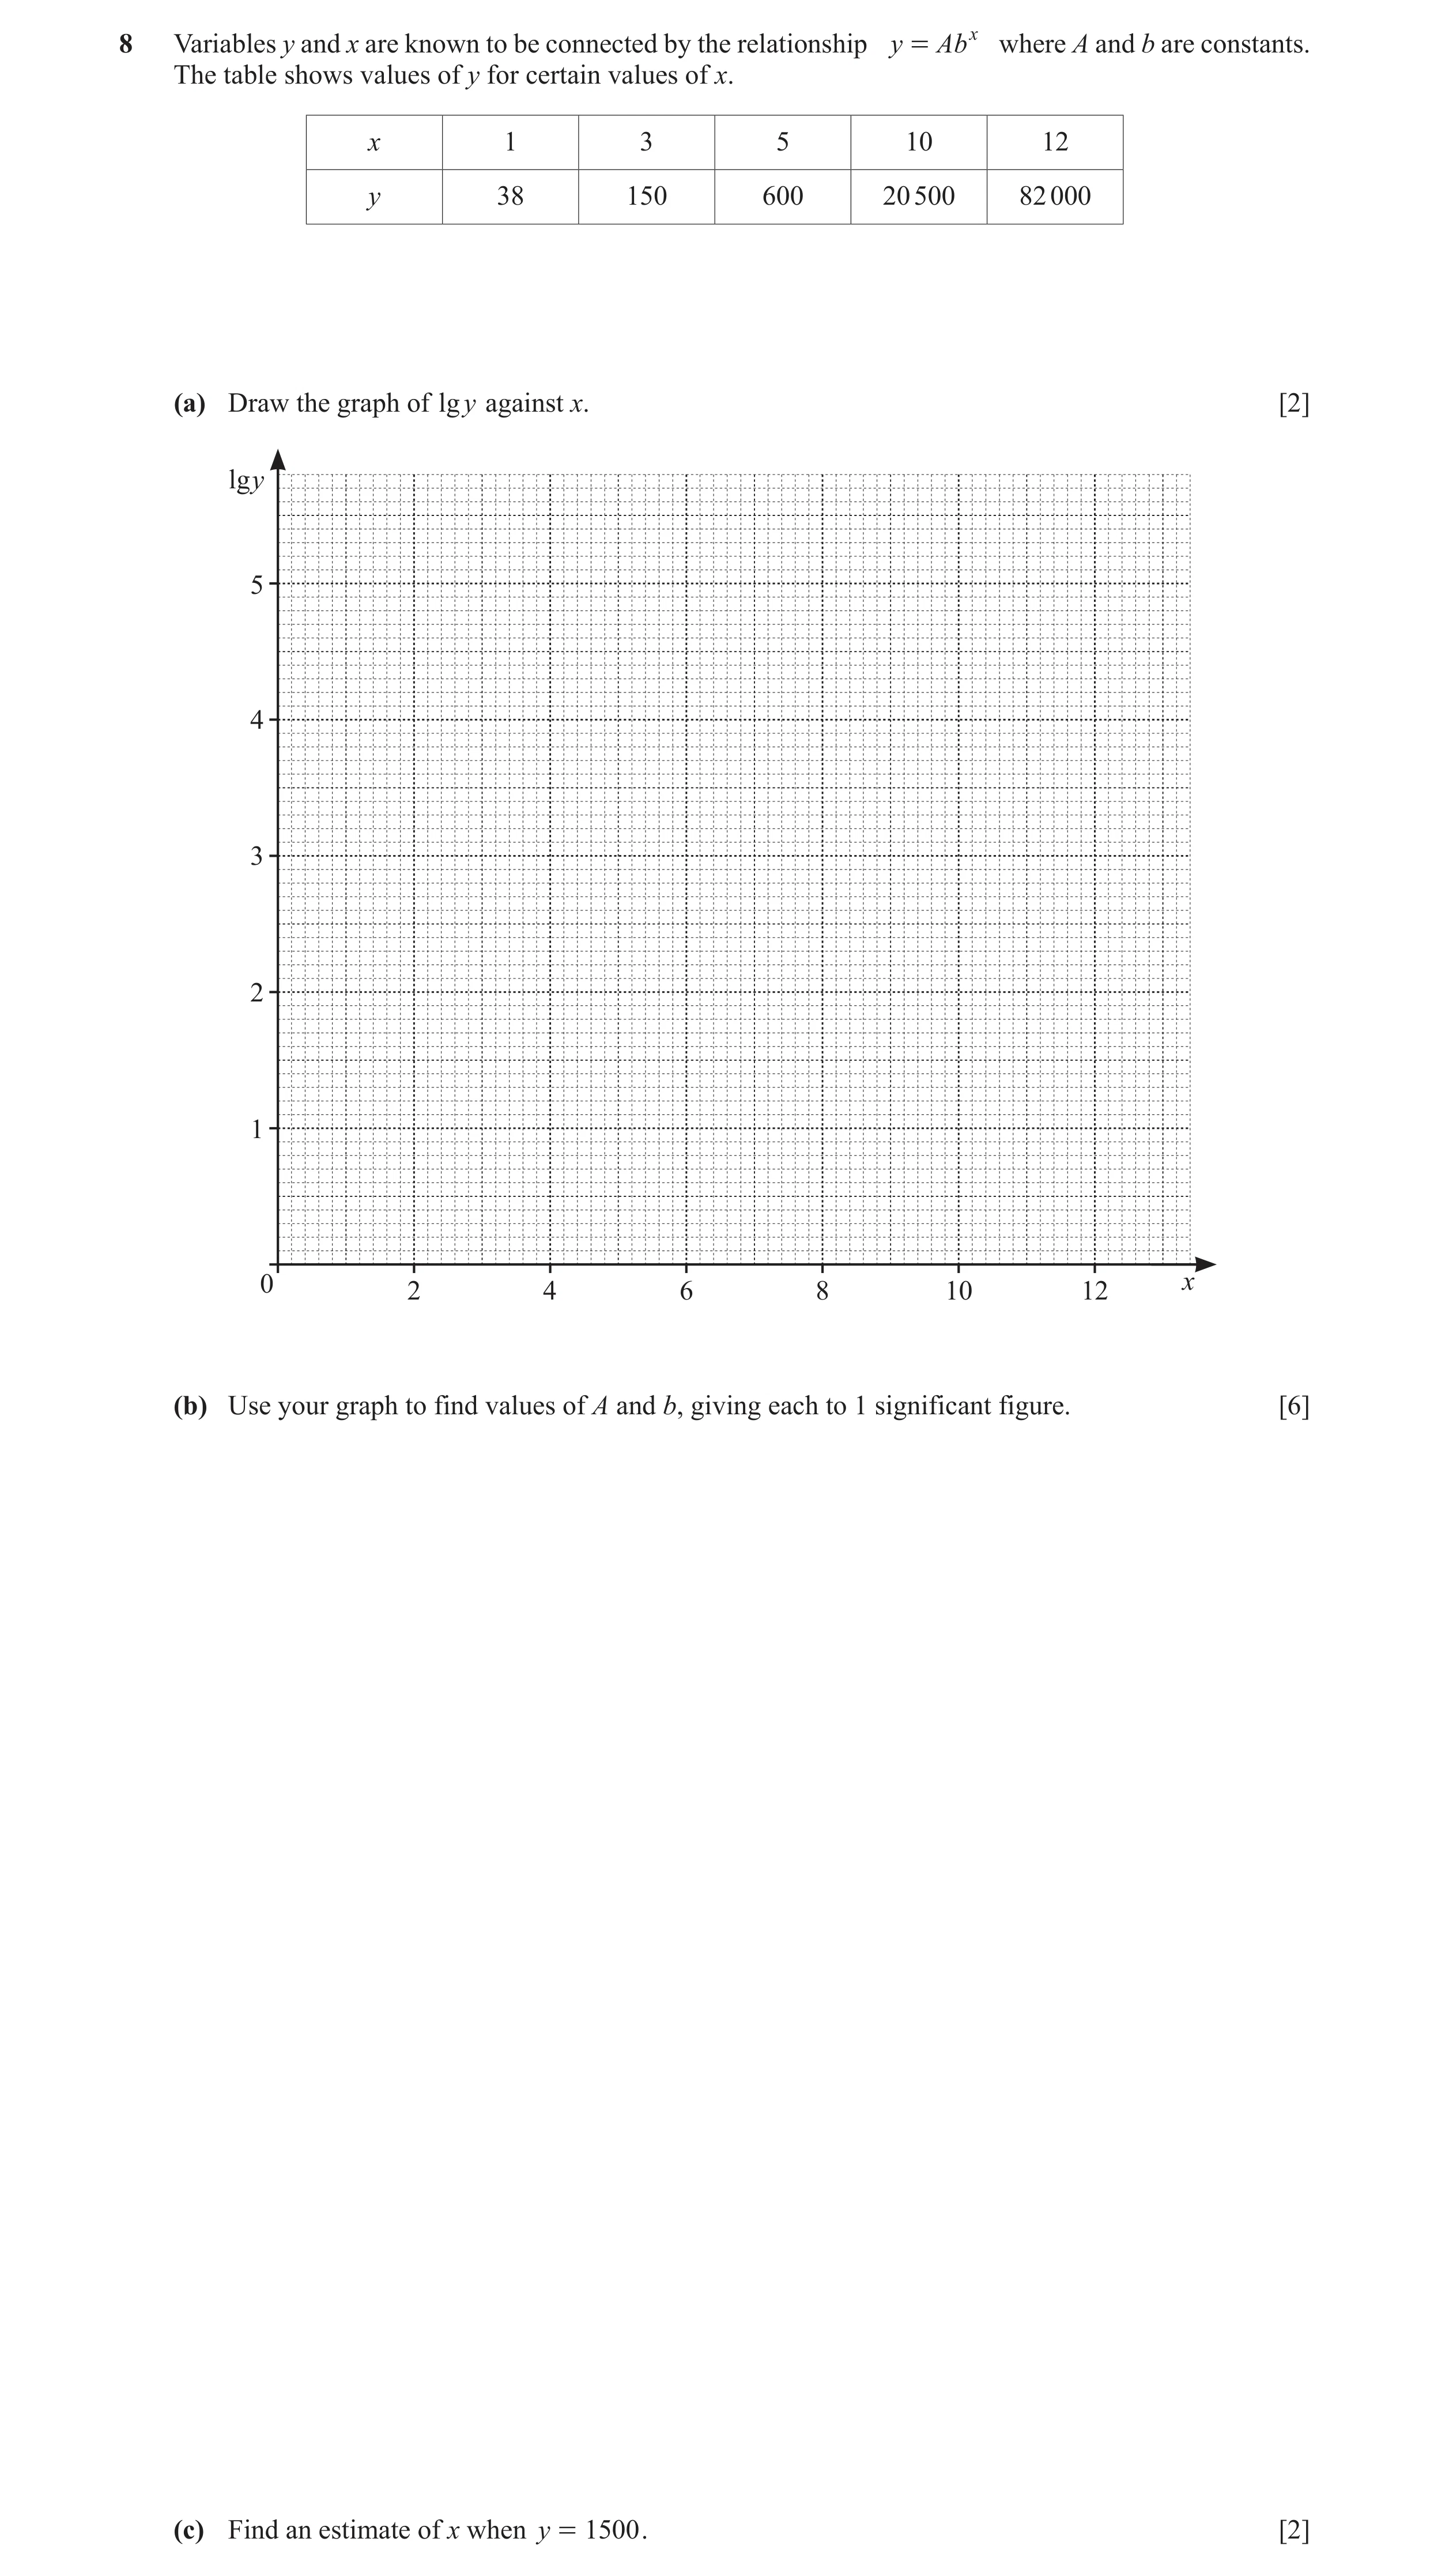
 4
4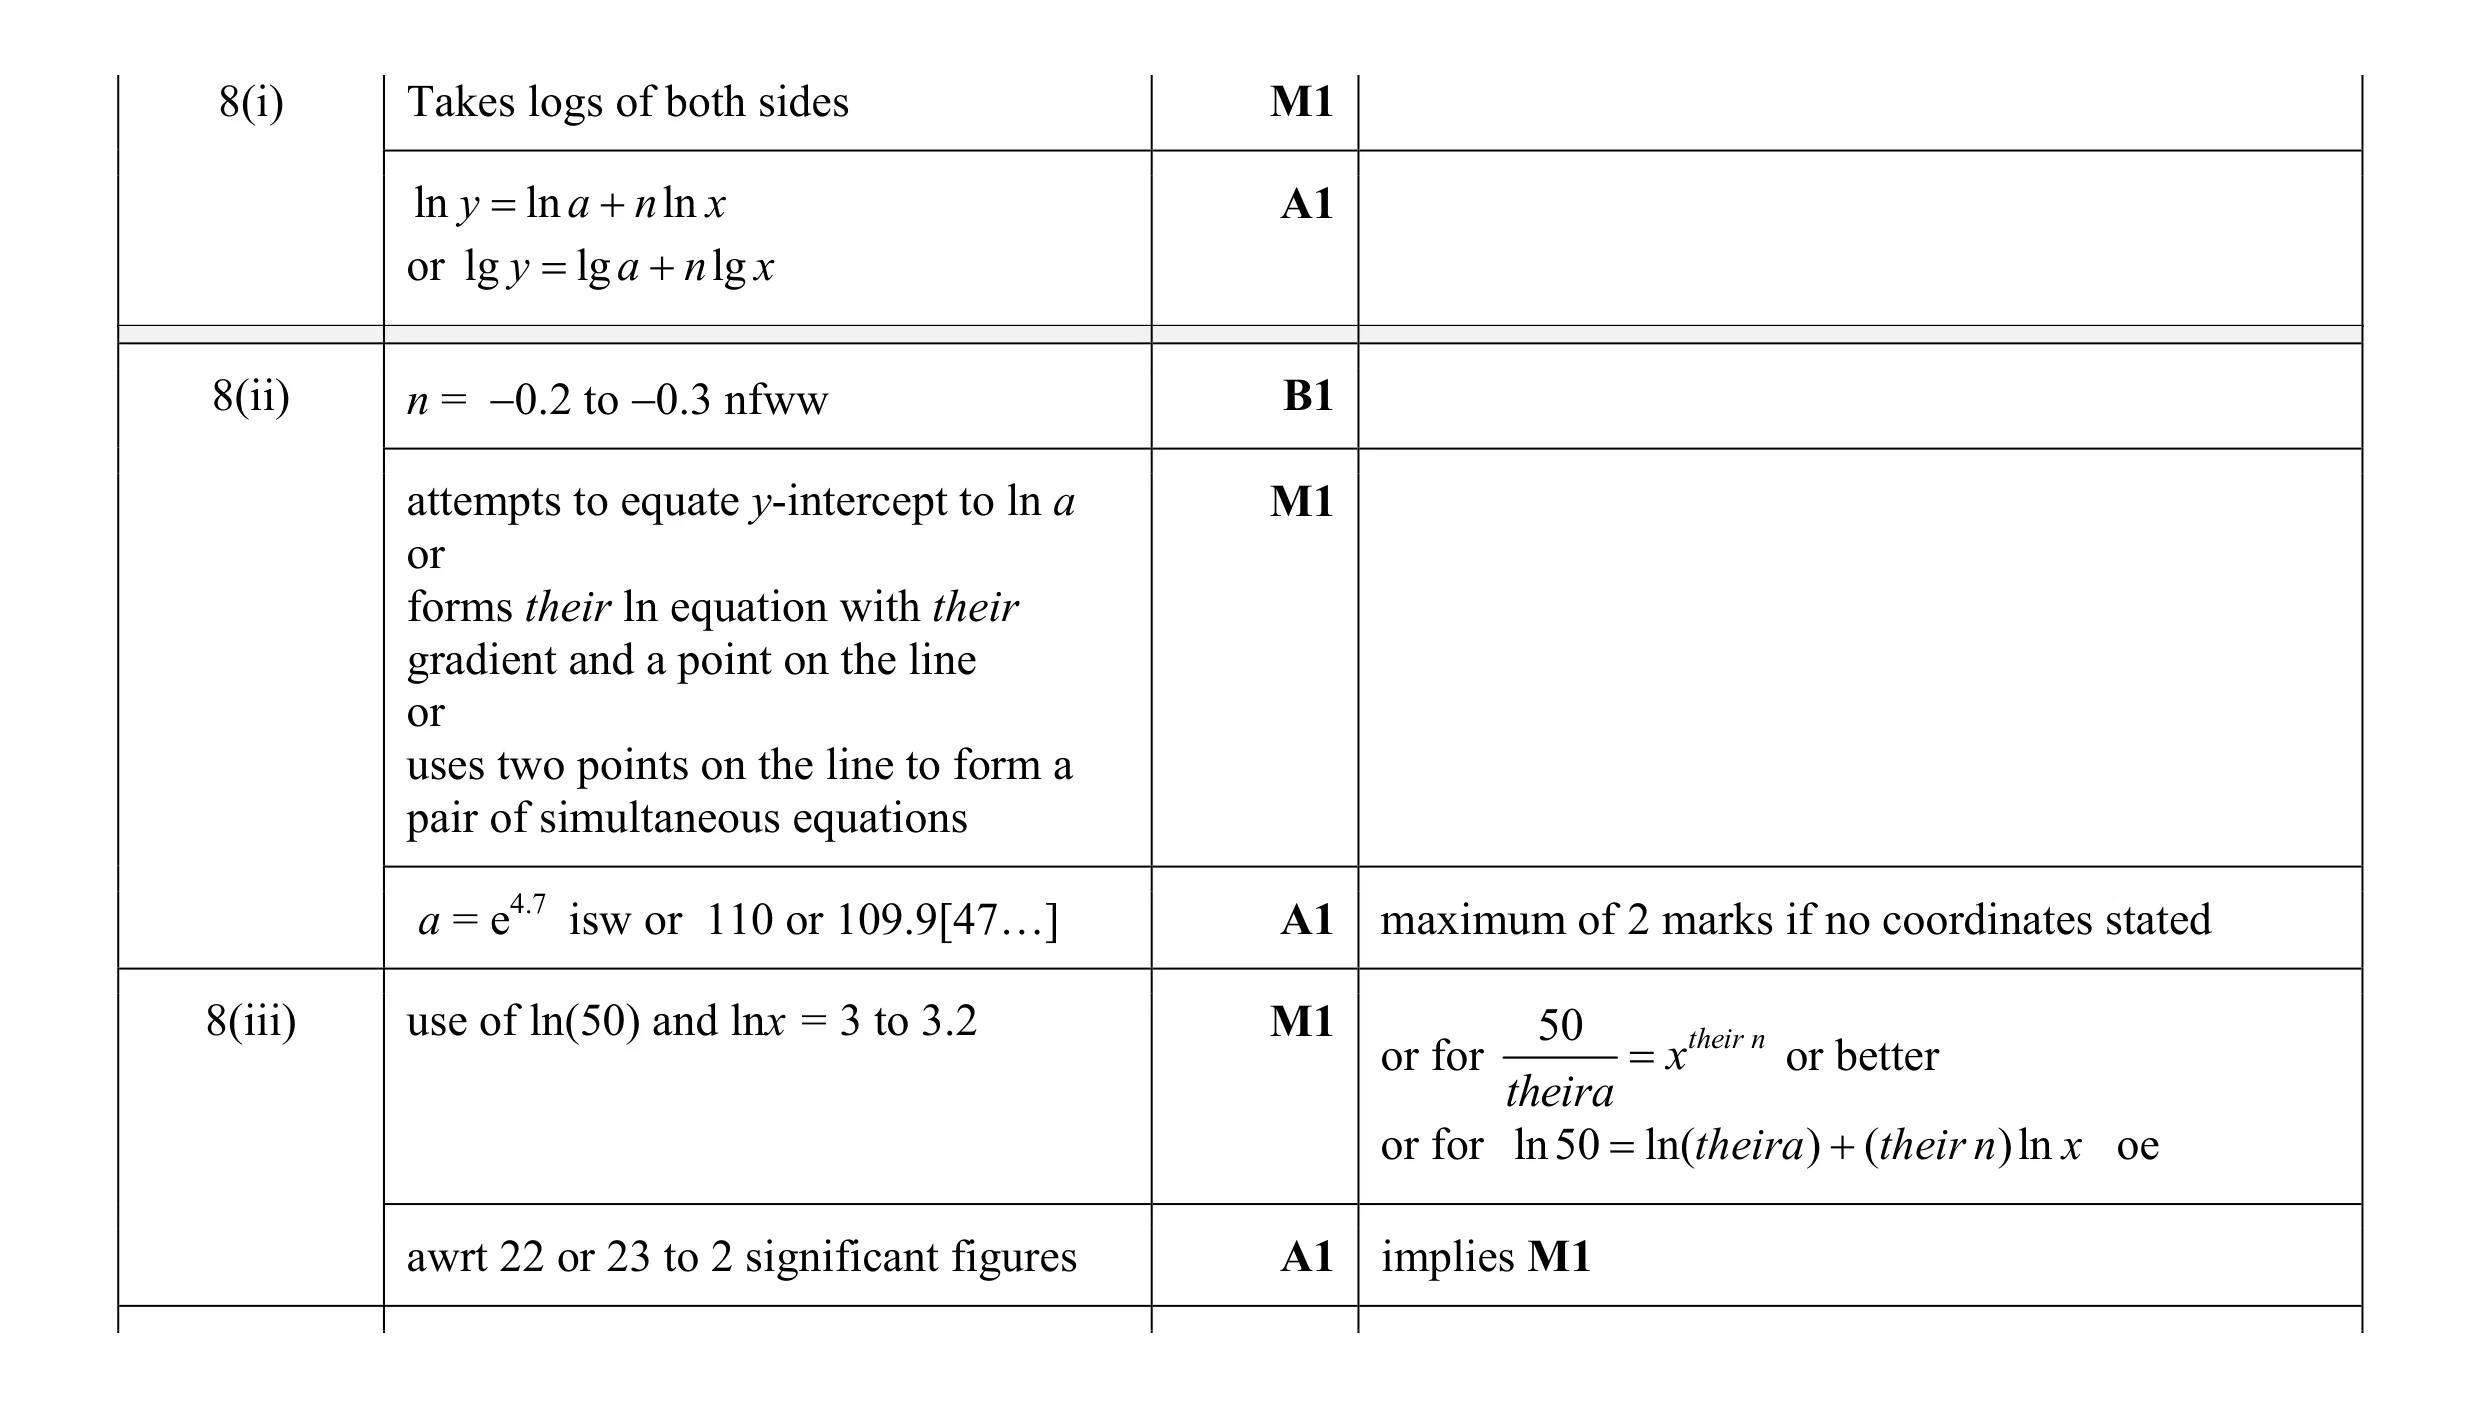 7
7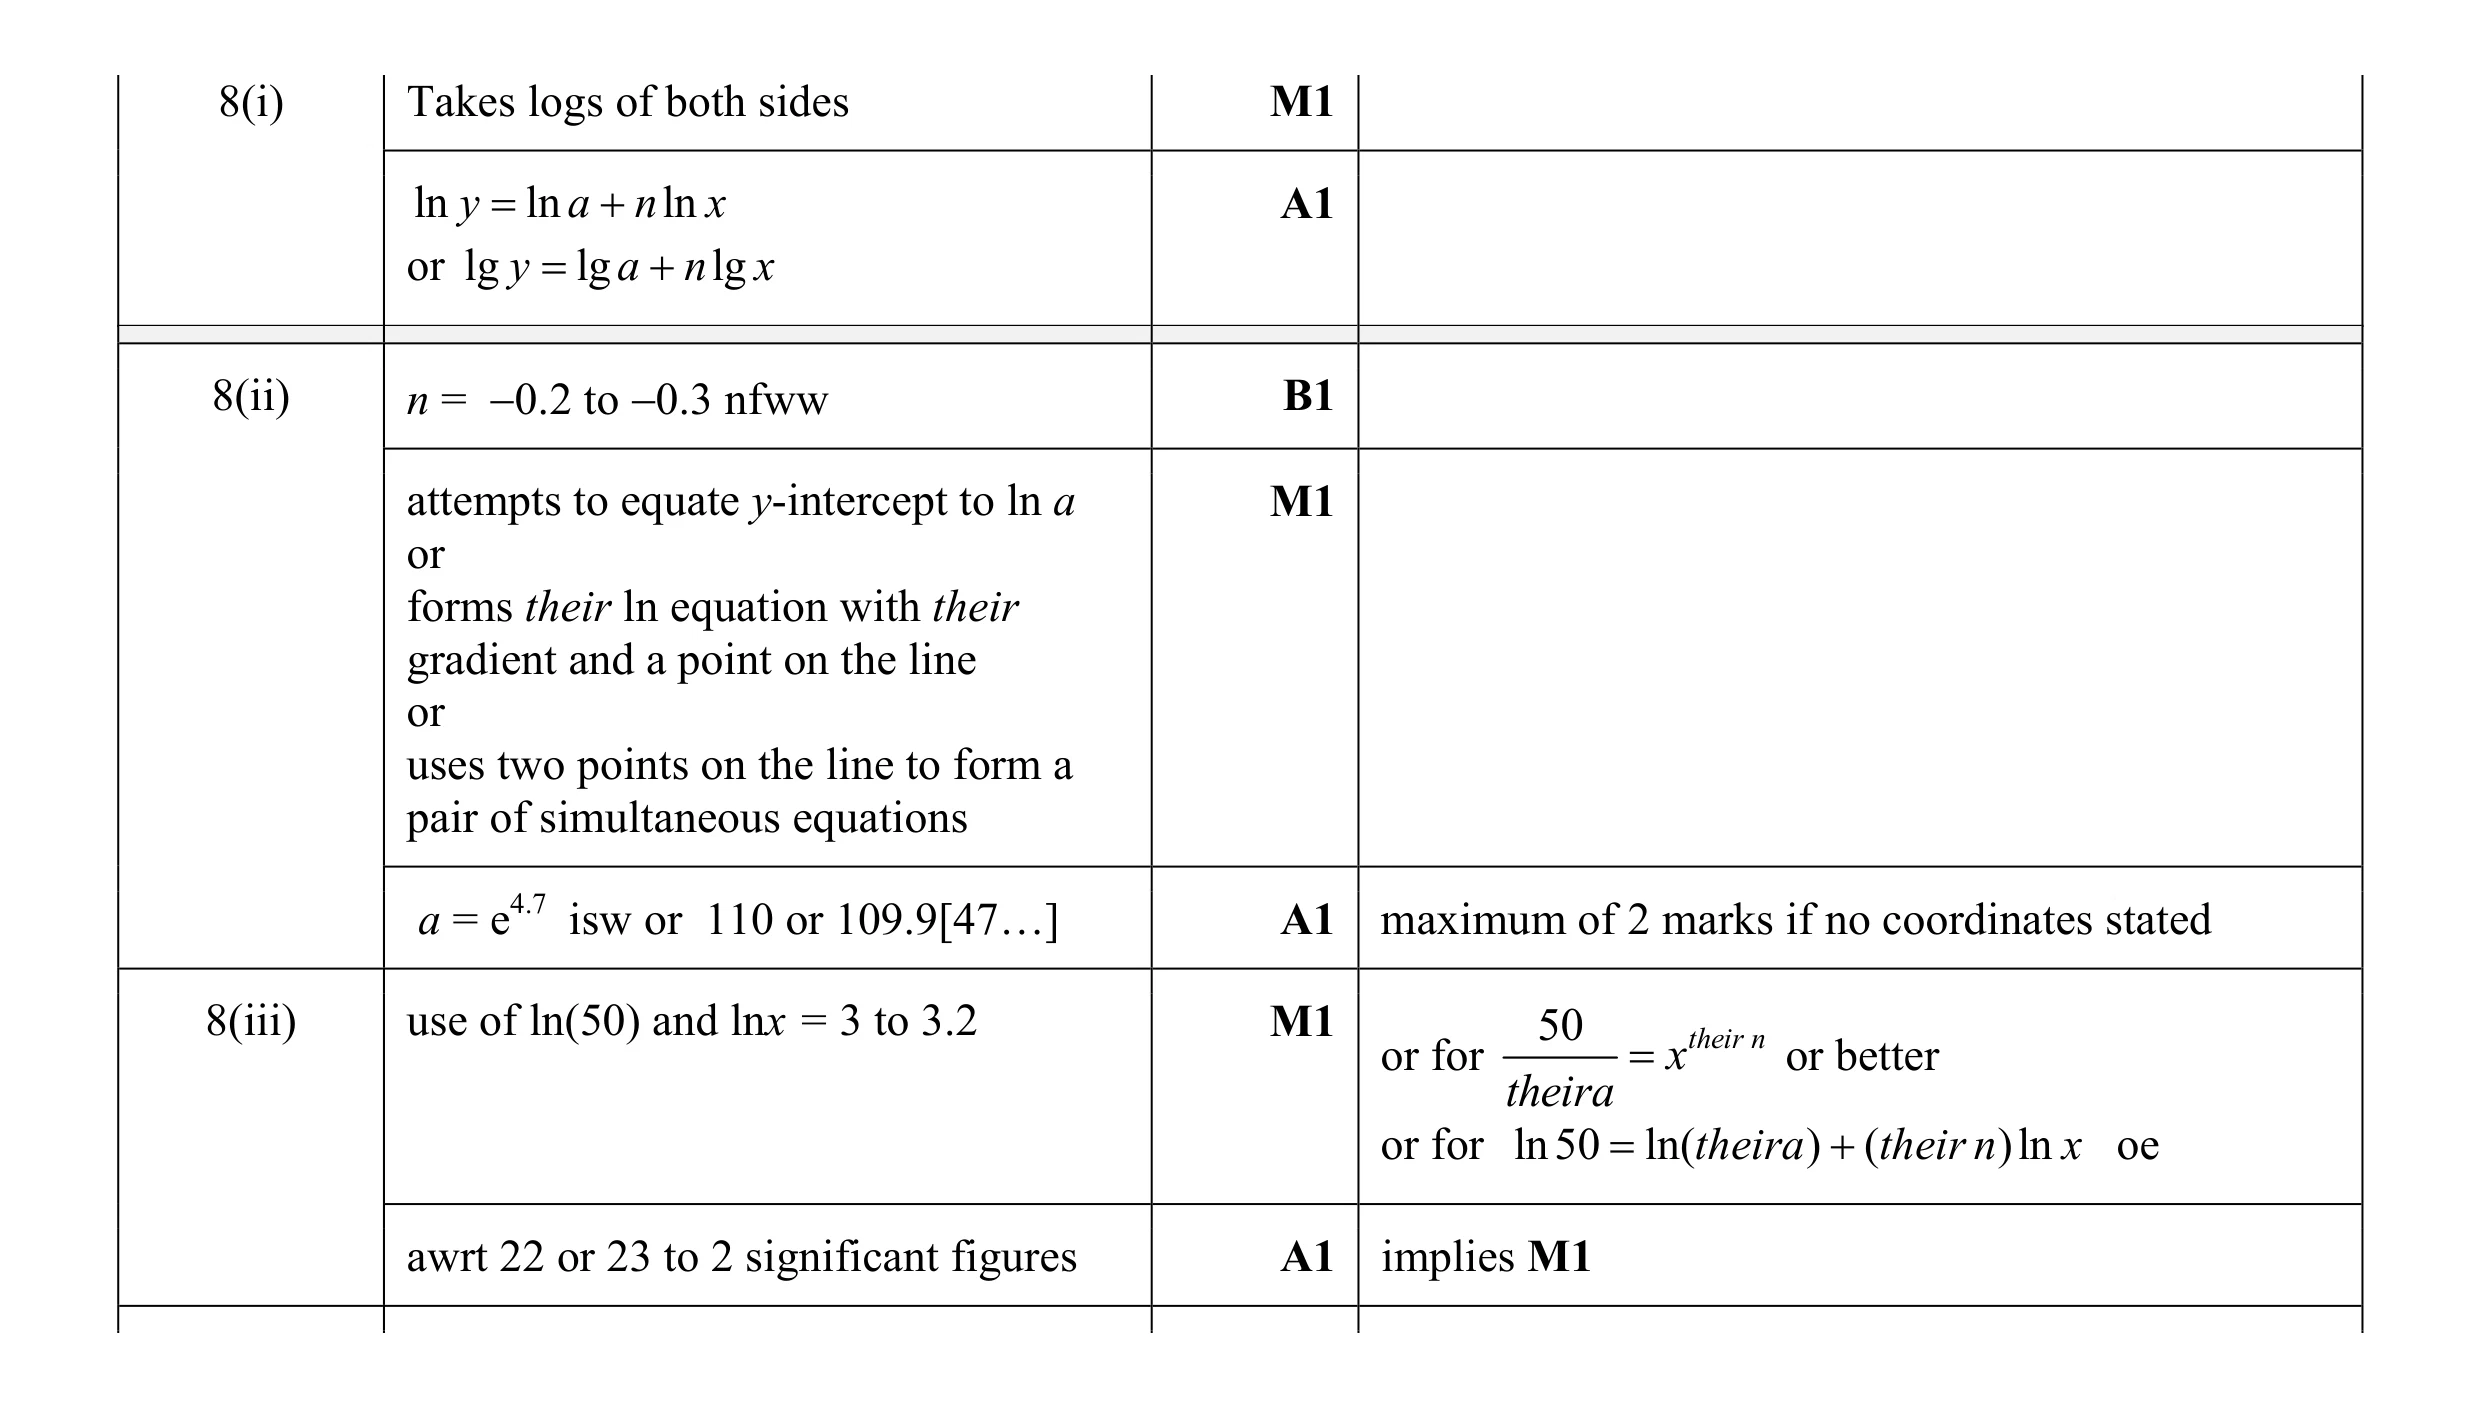 7
7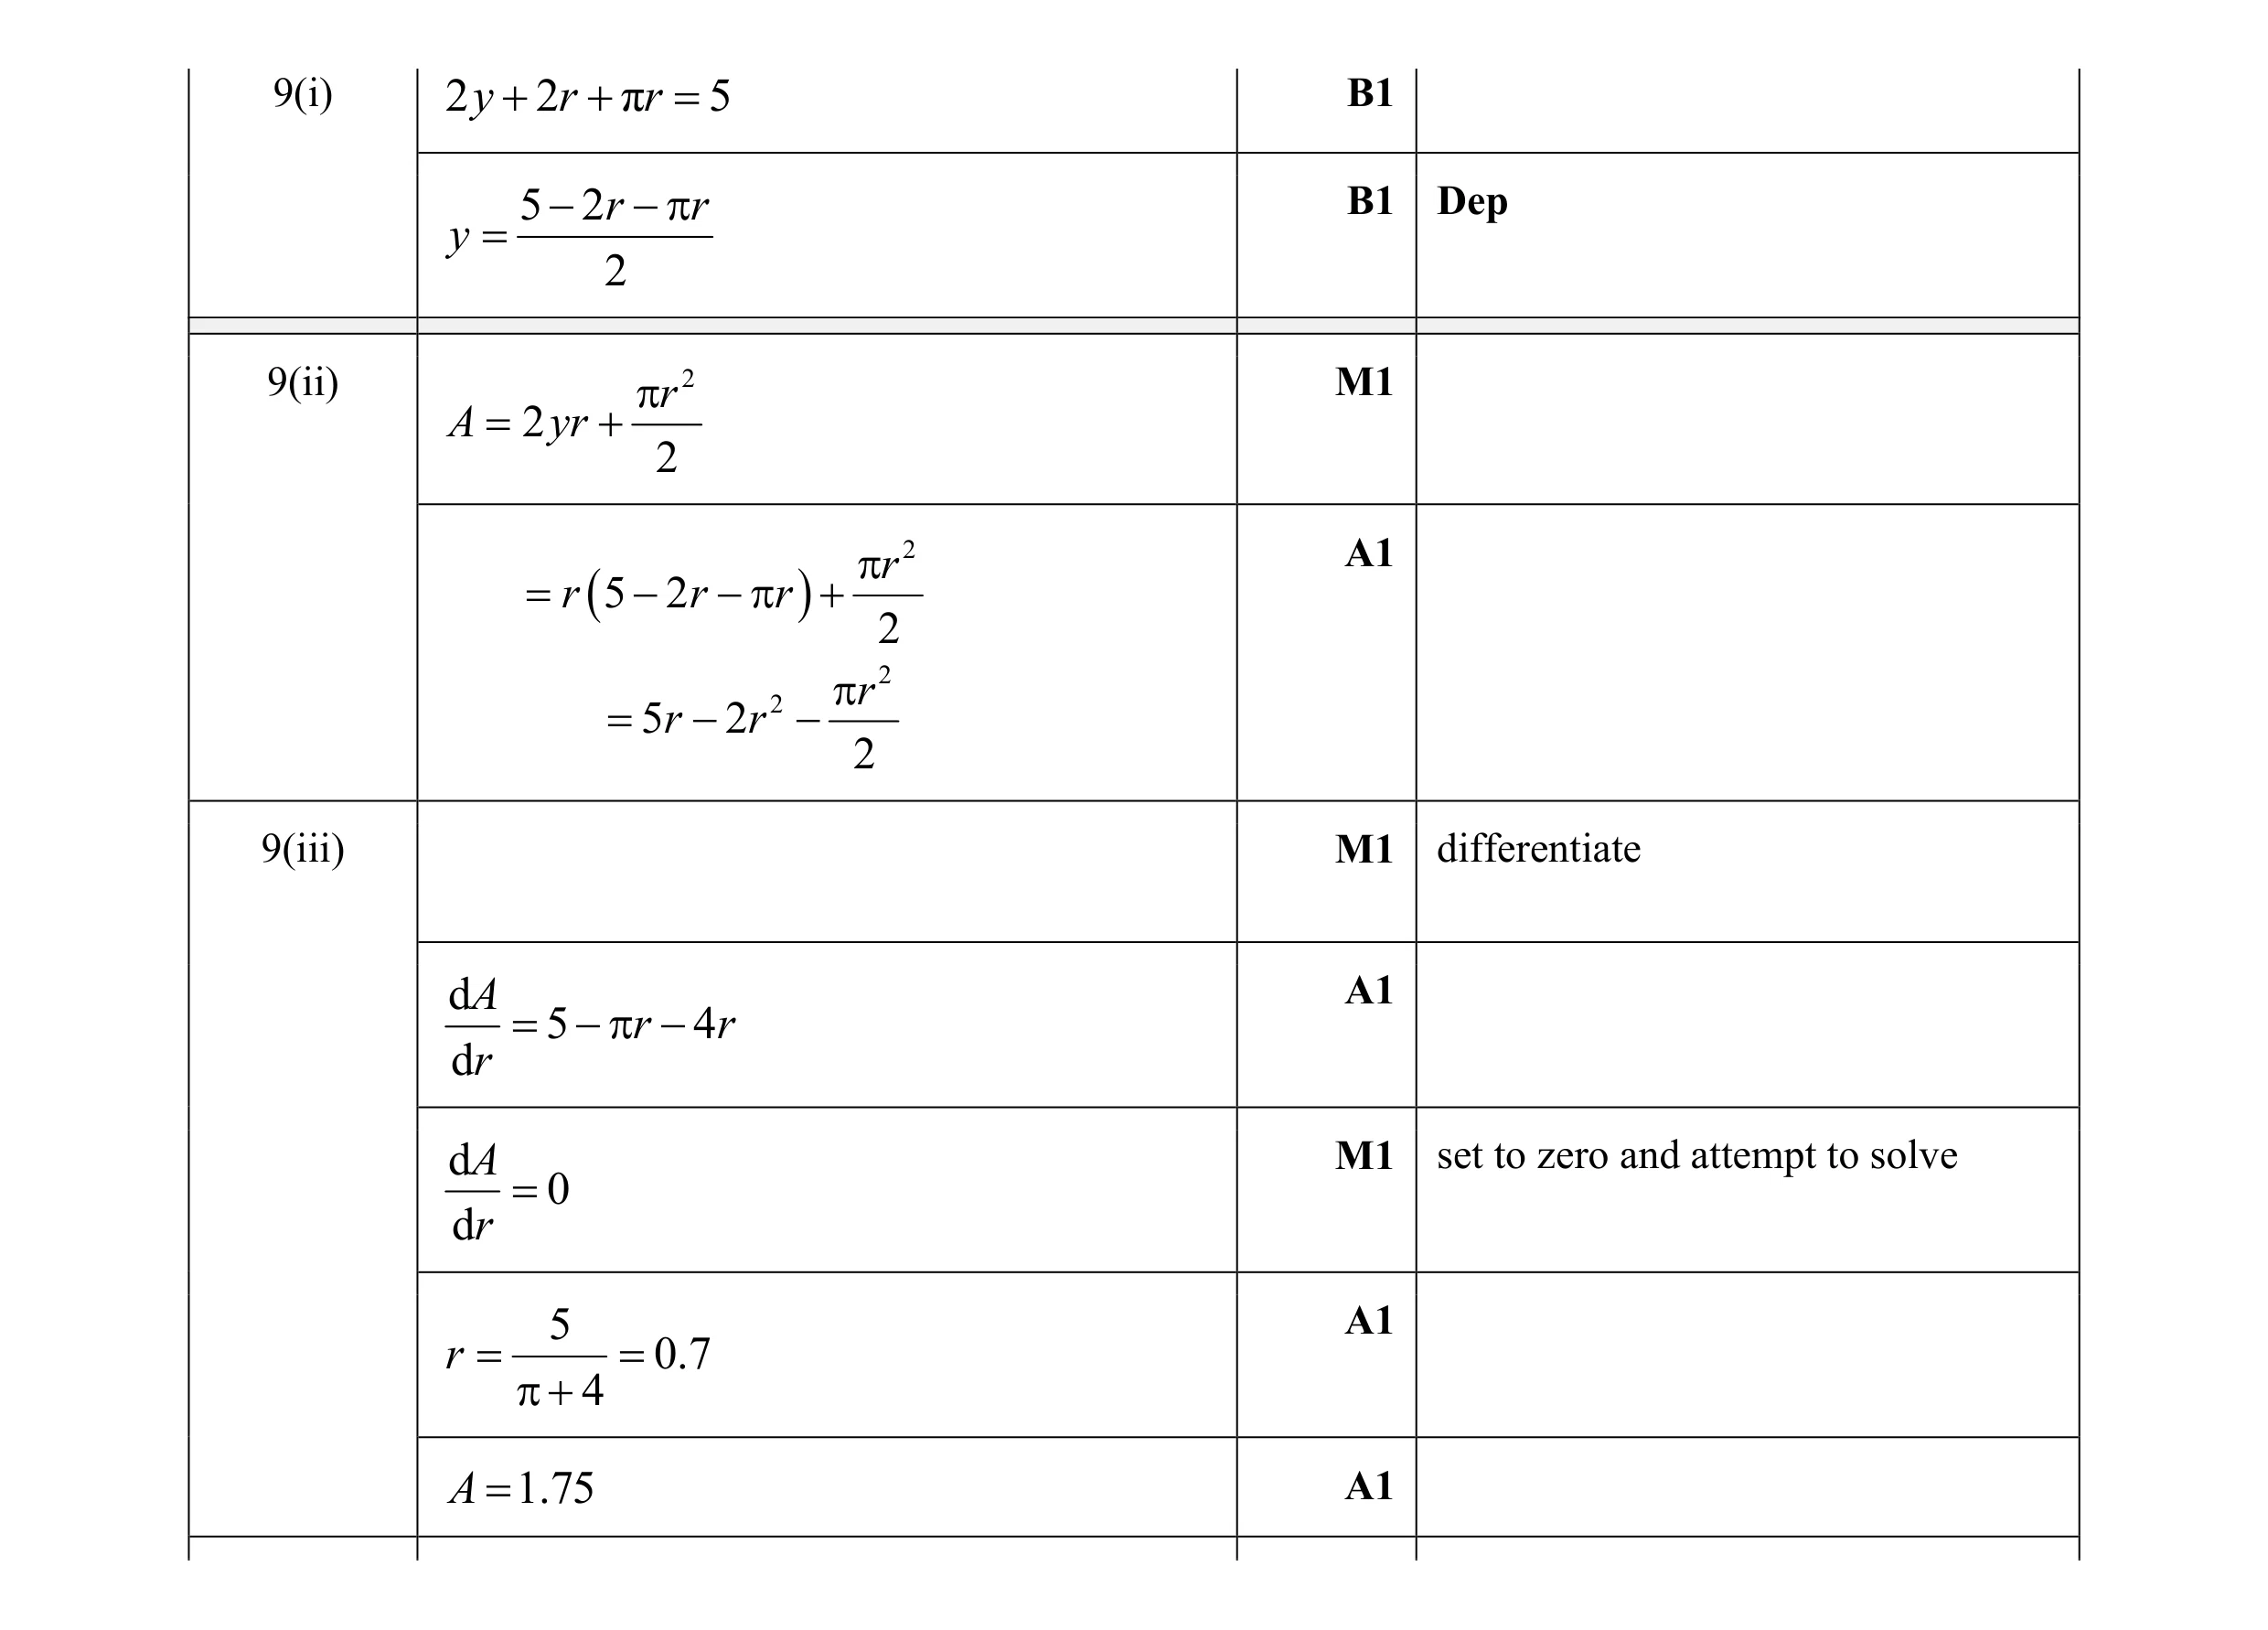 9
9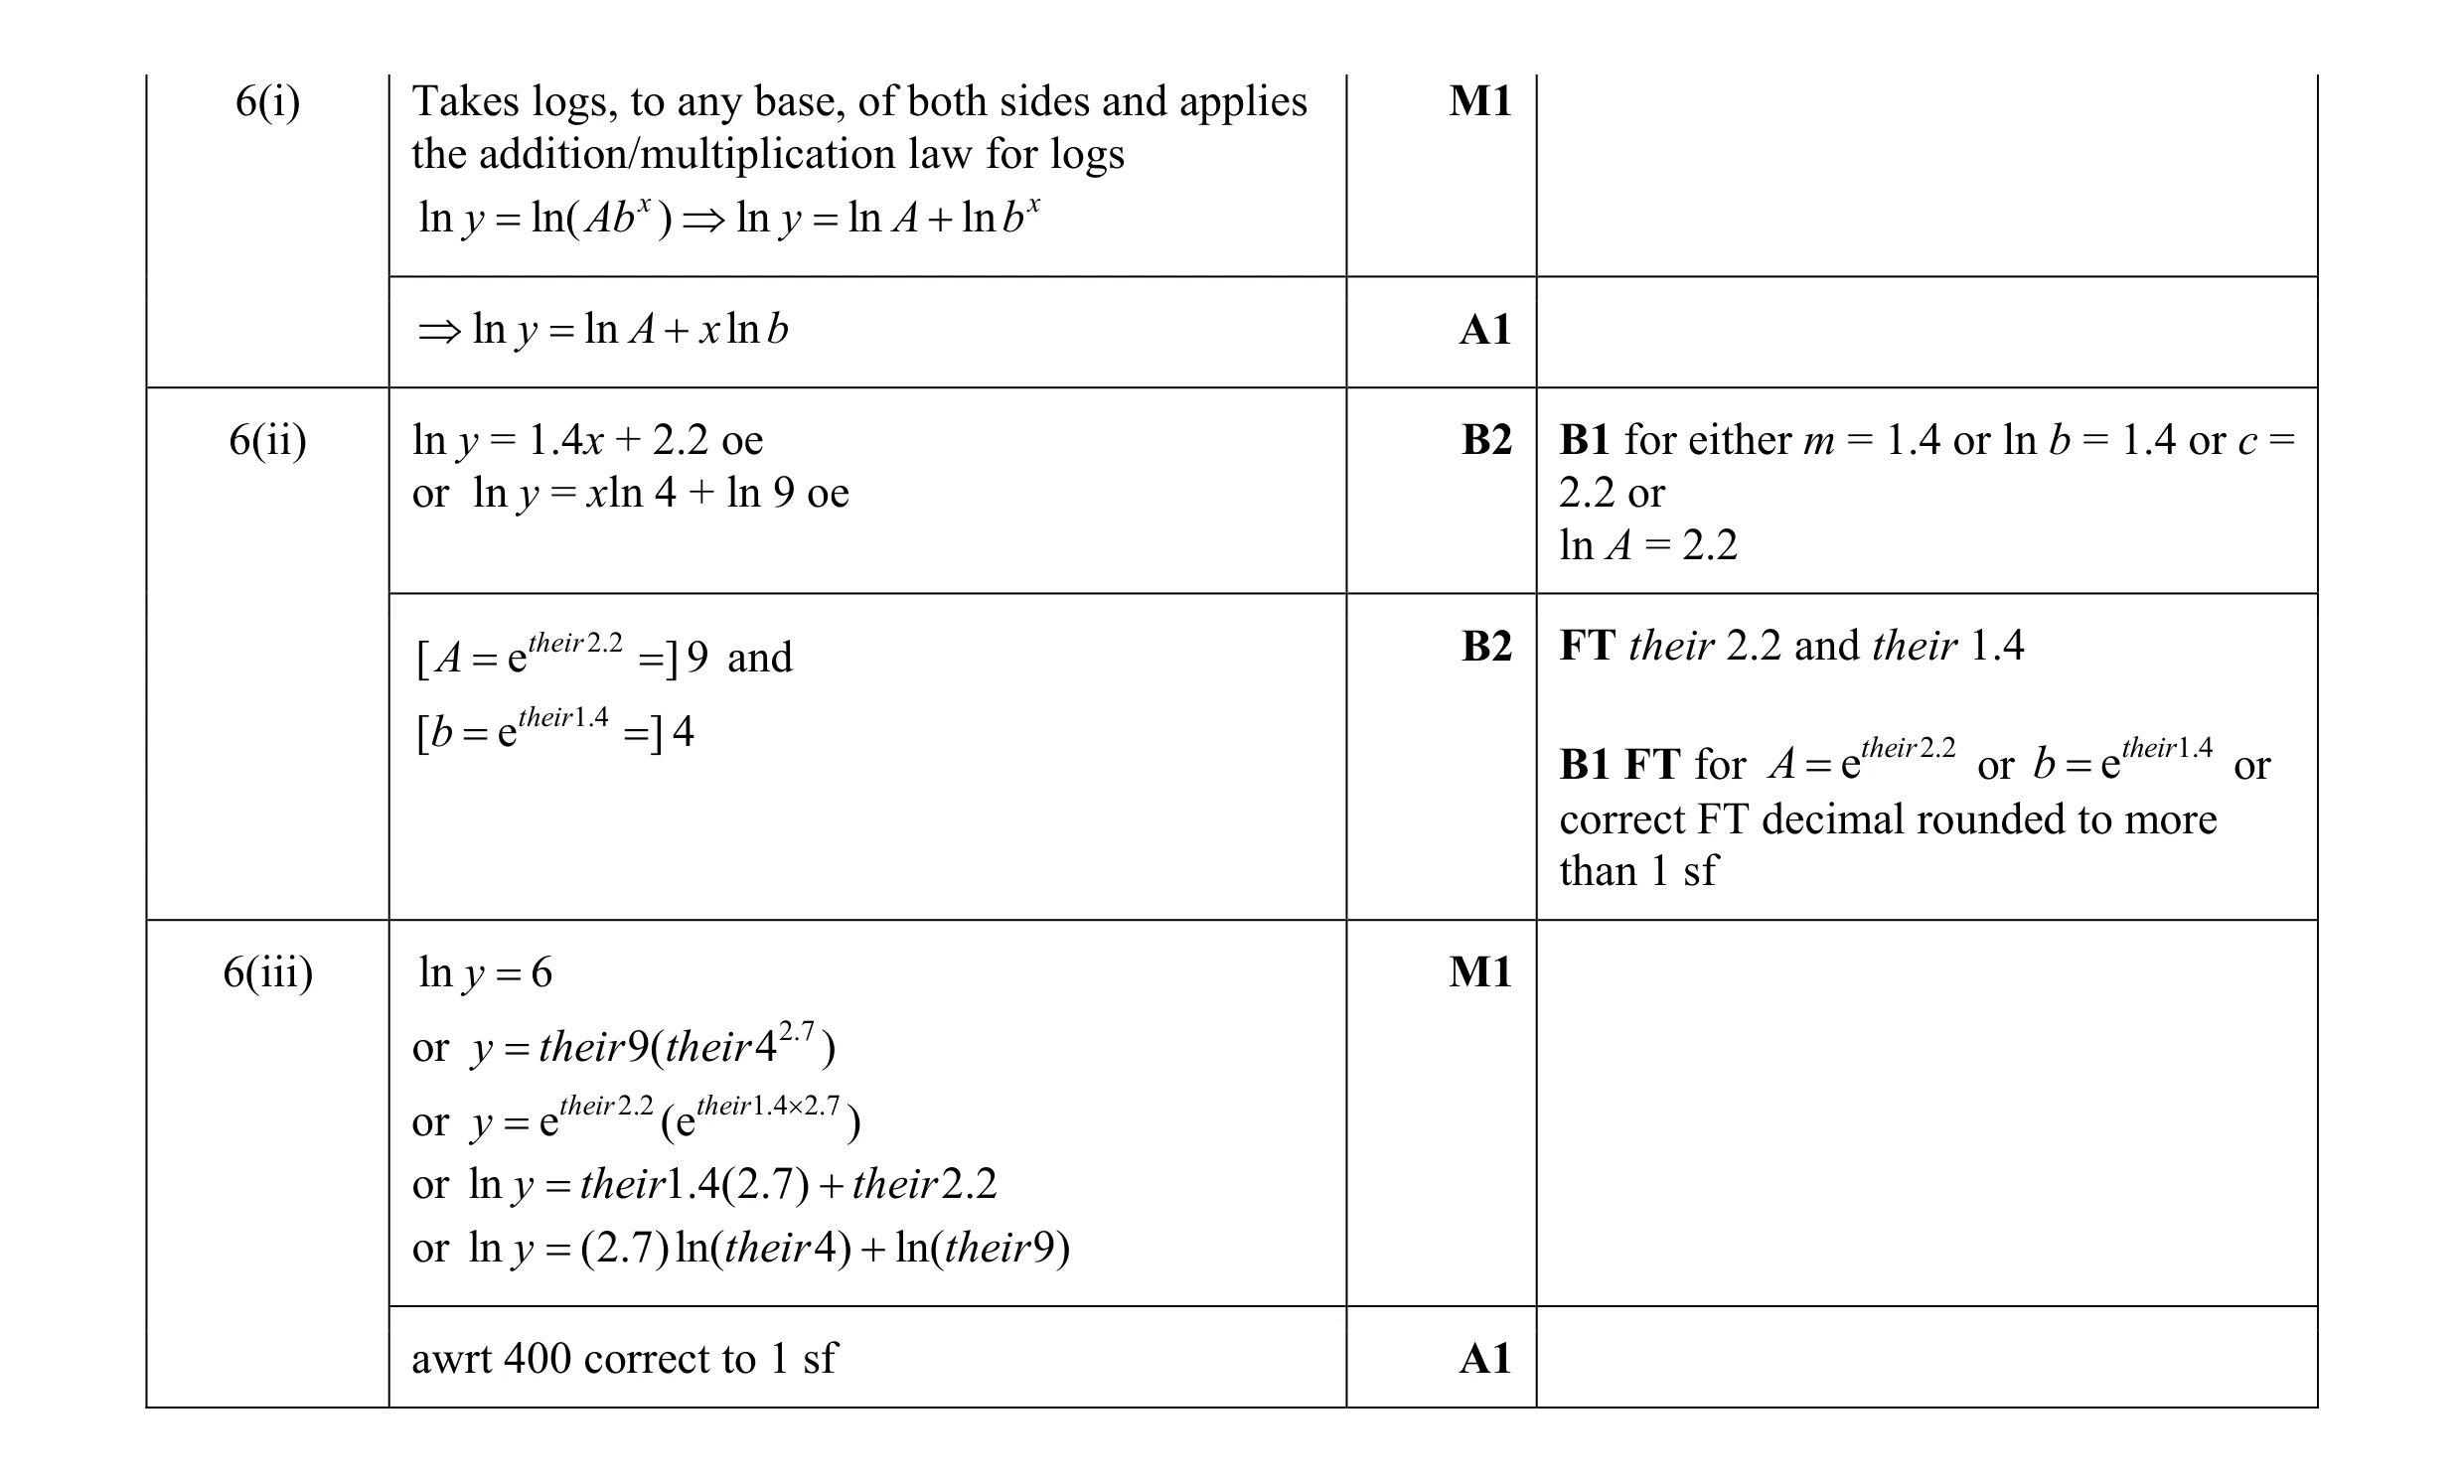 8
8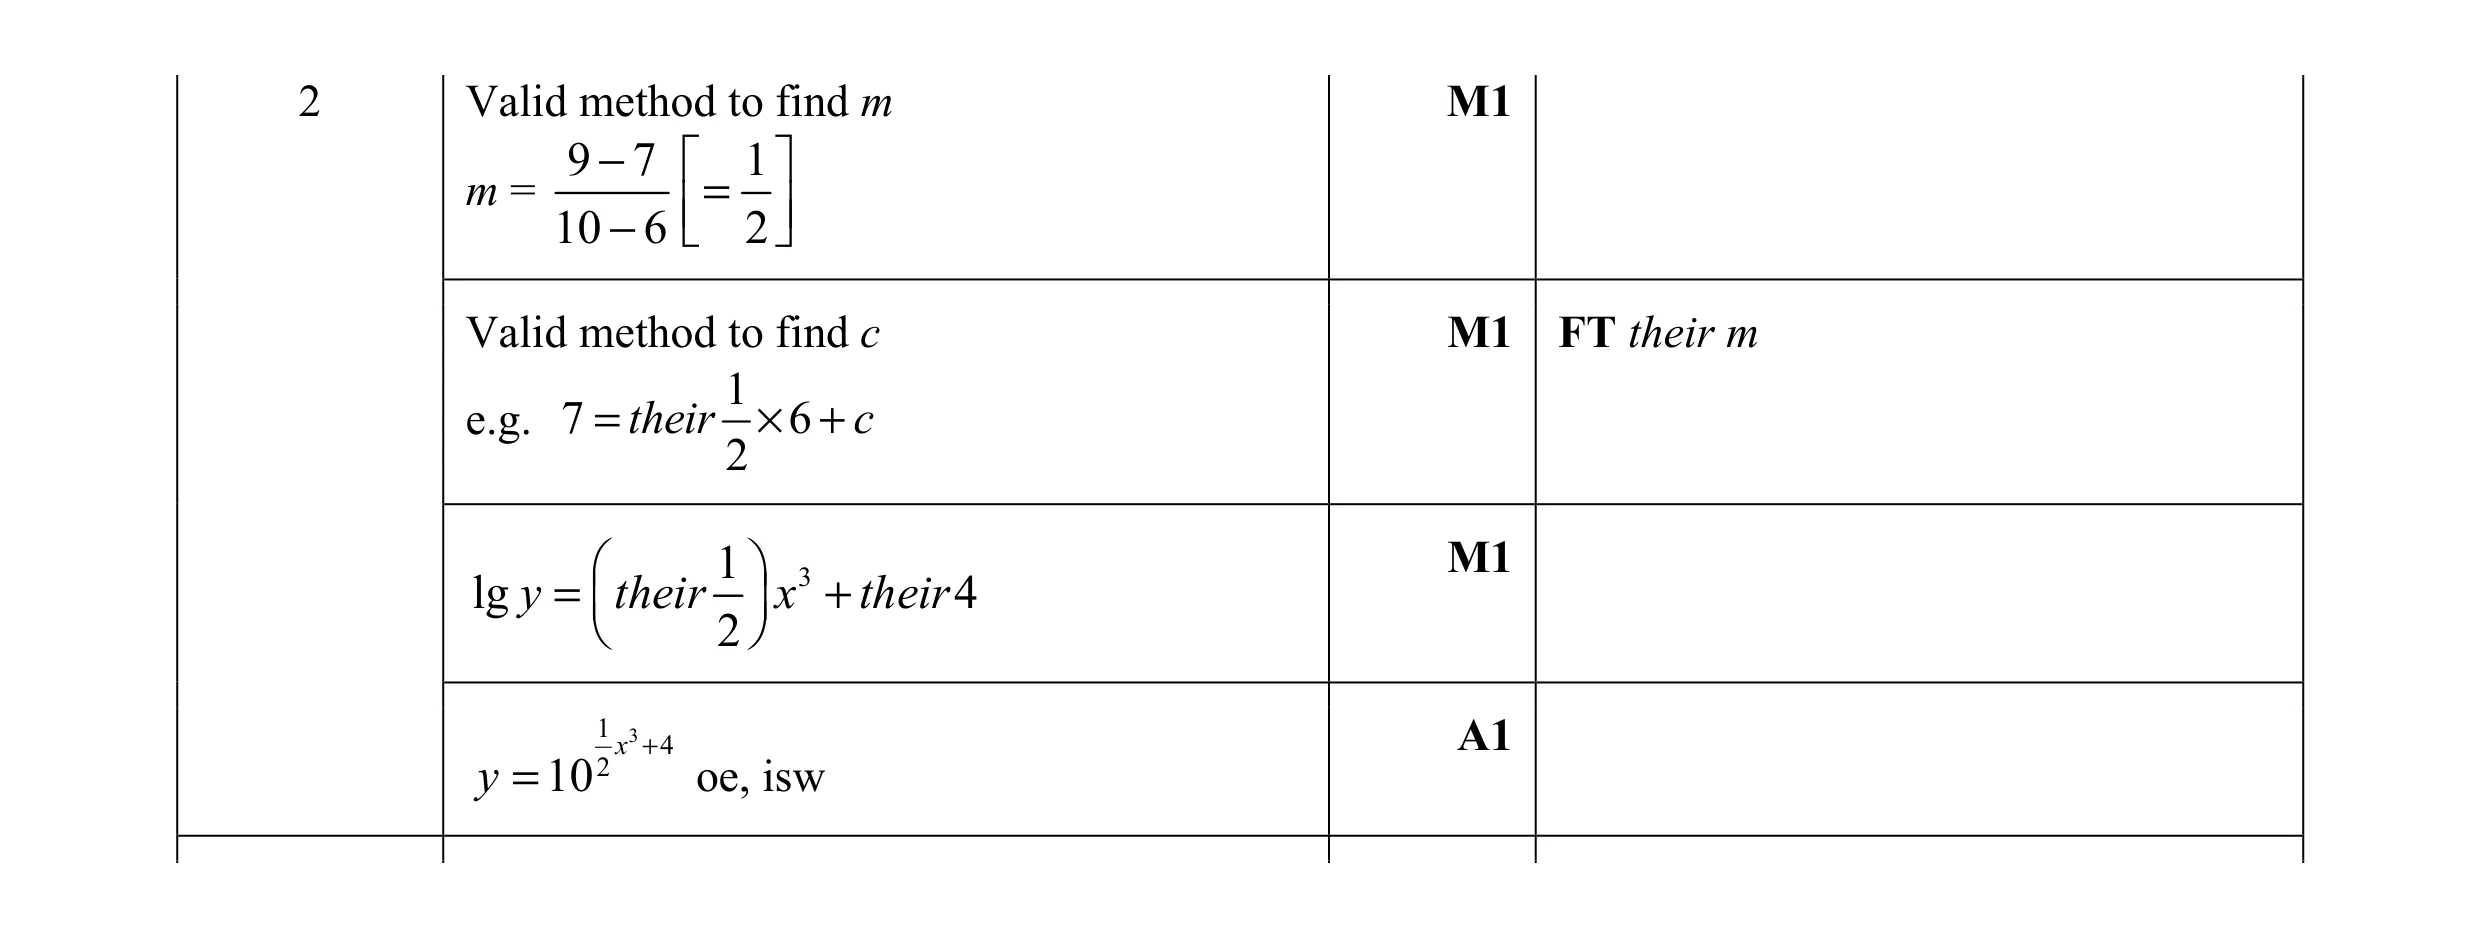 4
4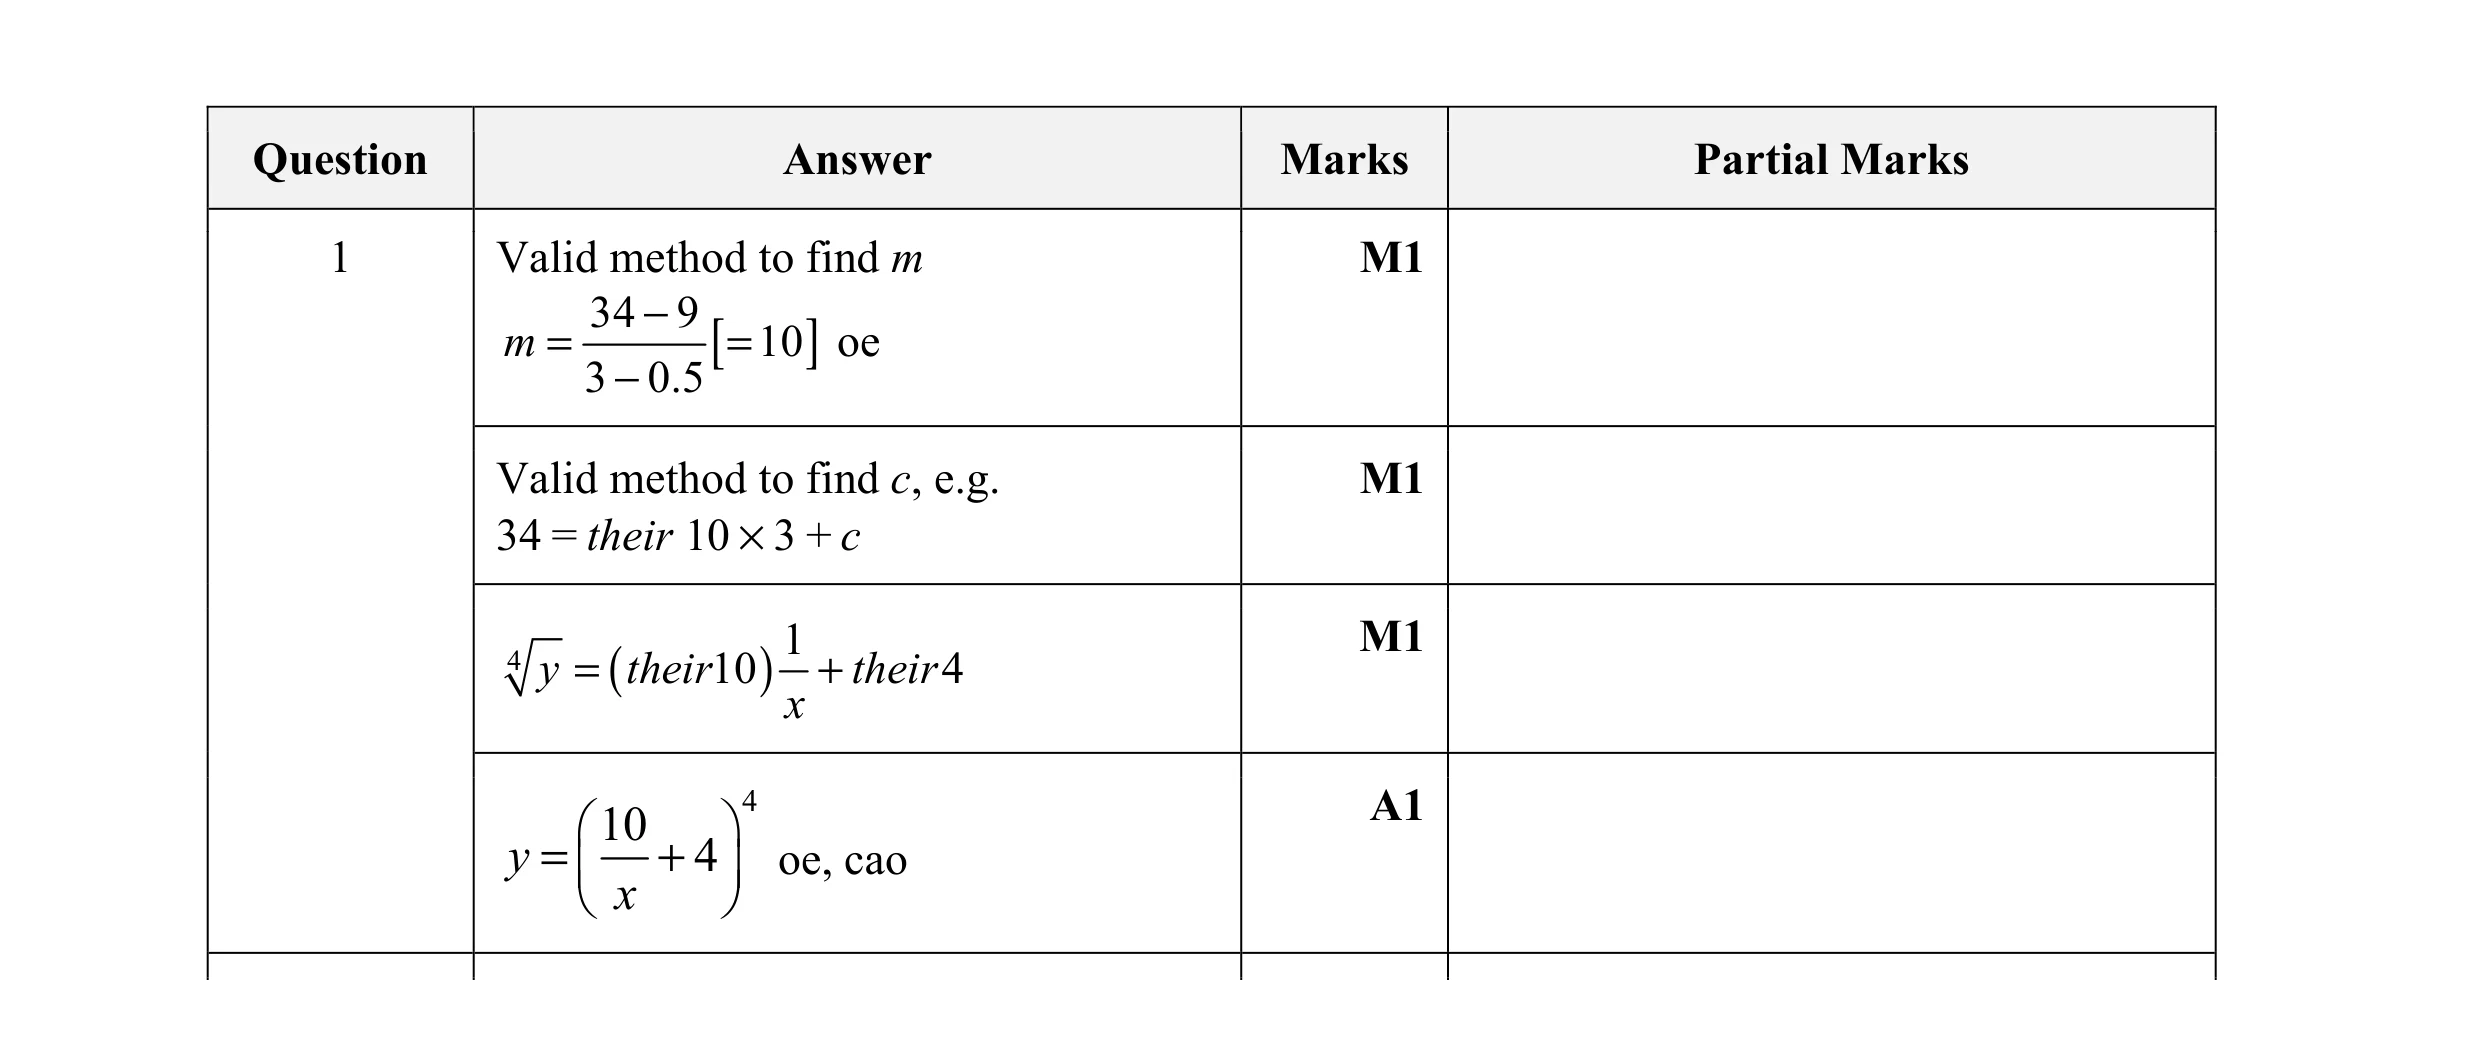 4
4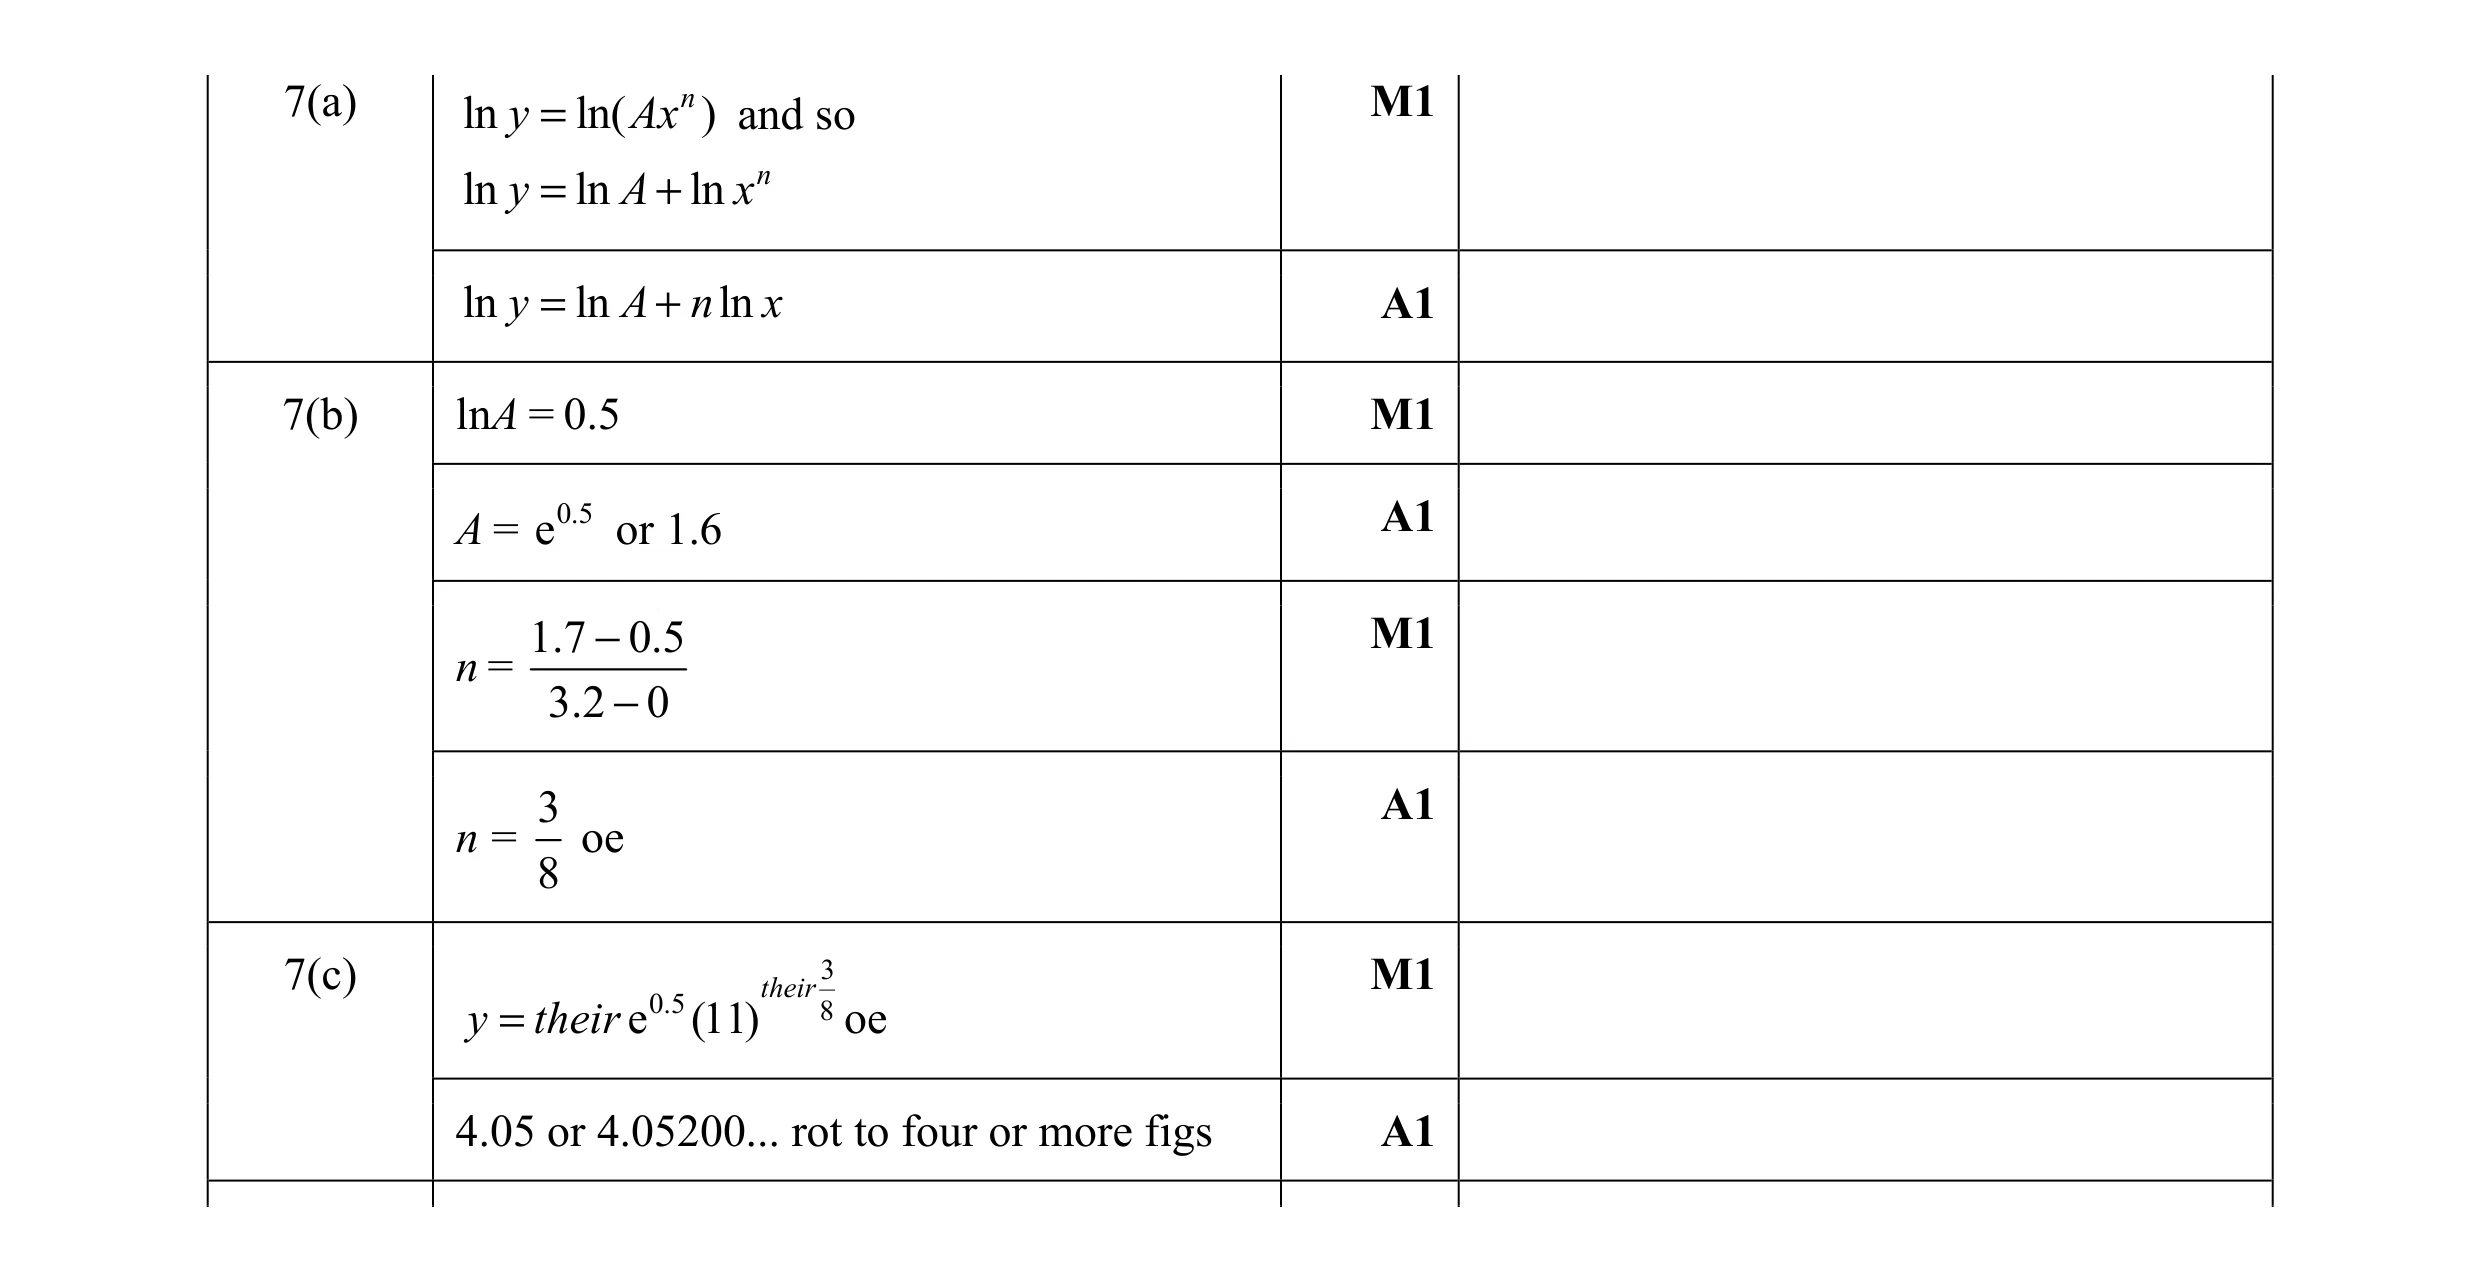 8
8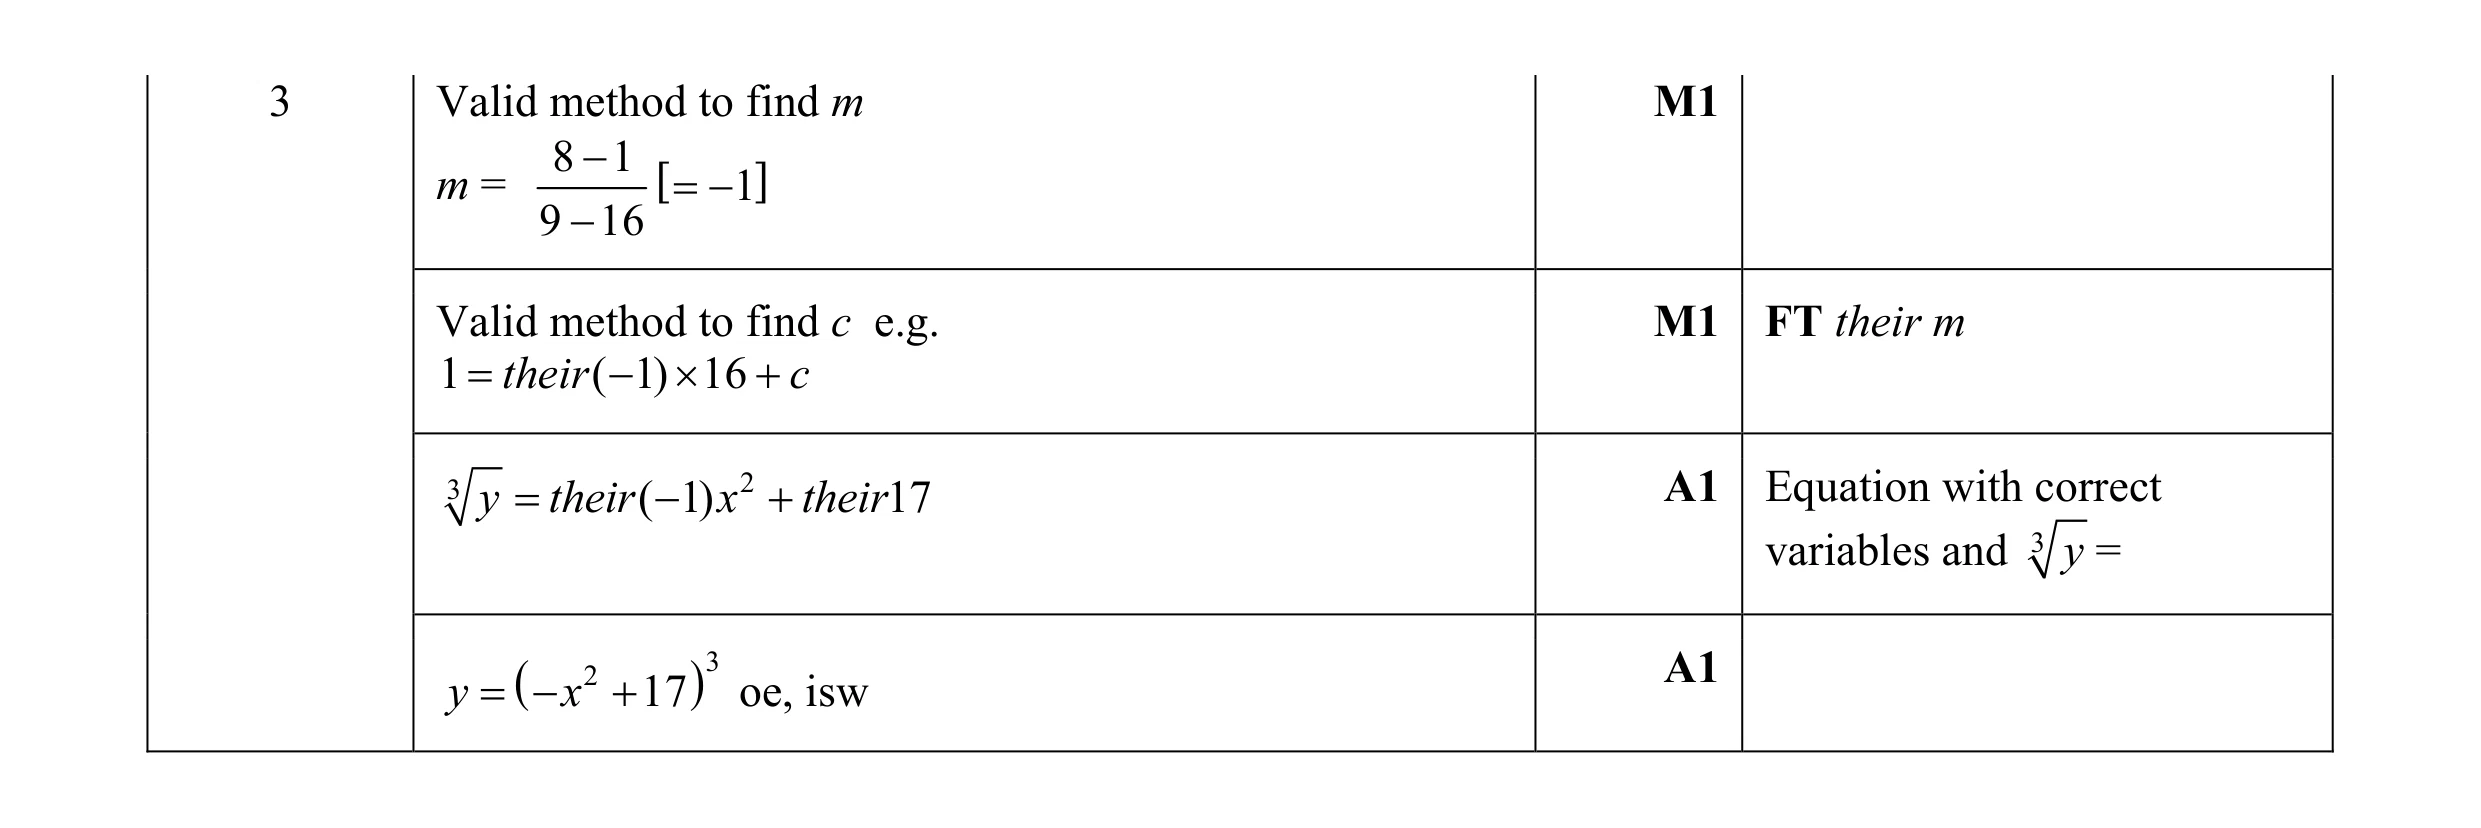 4
4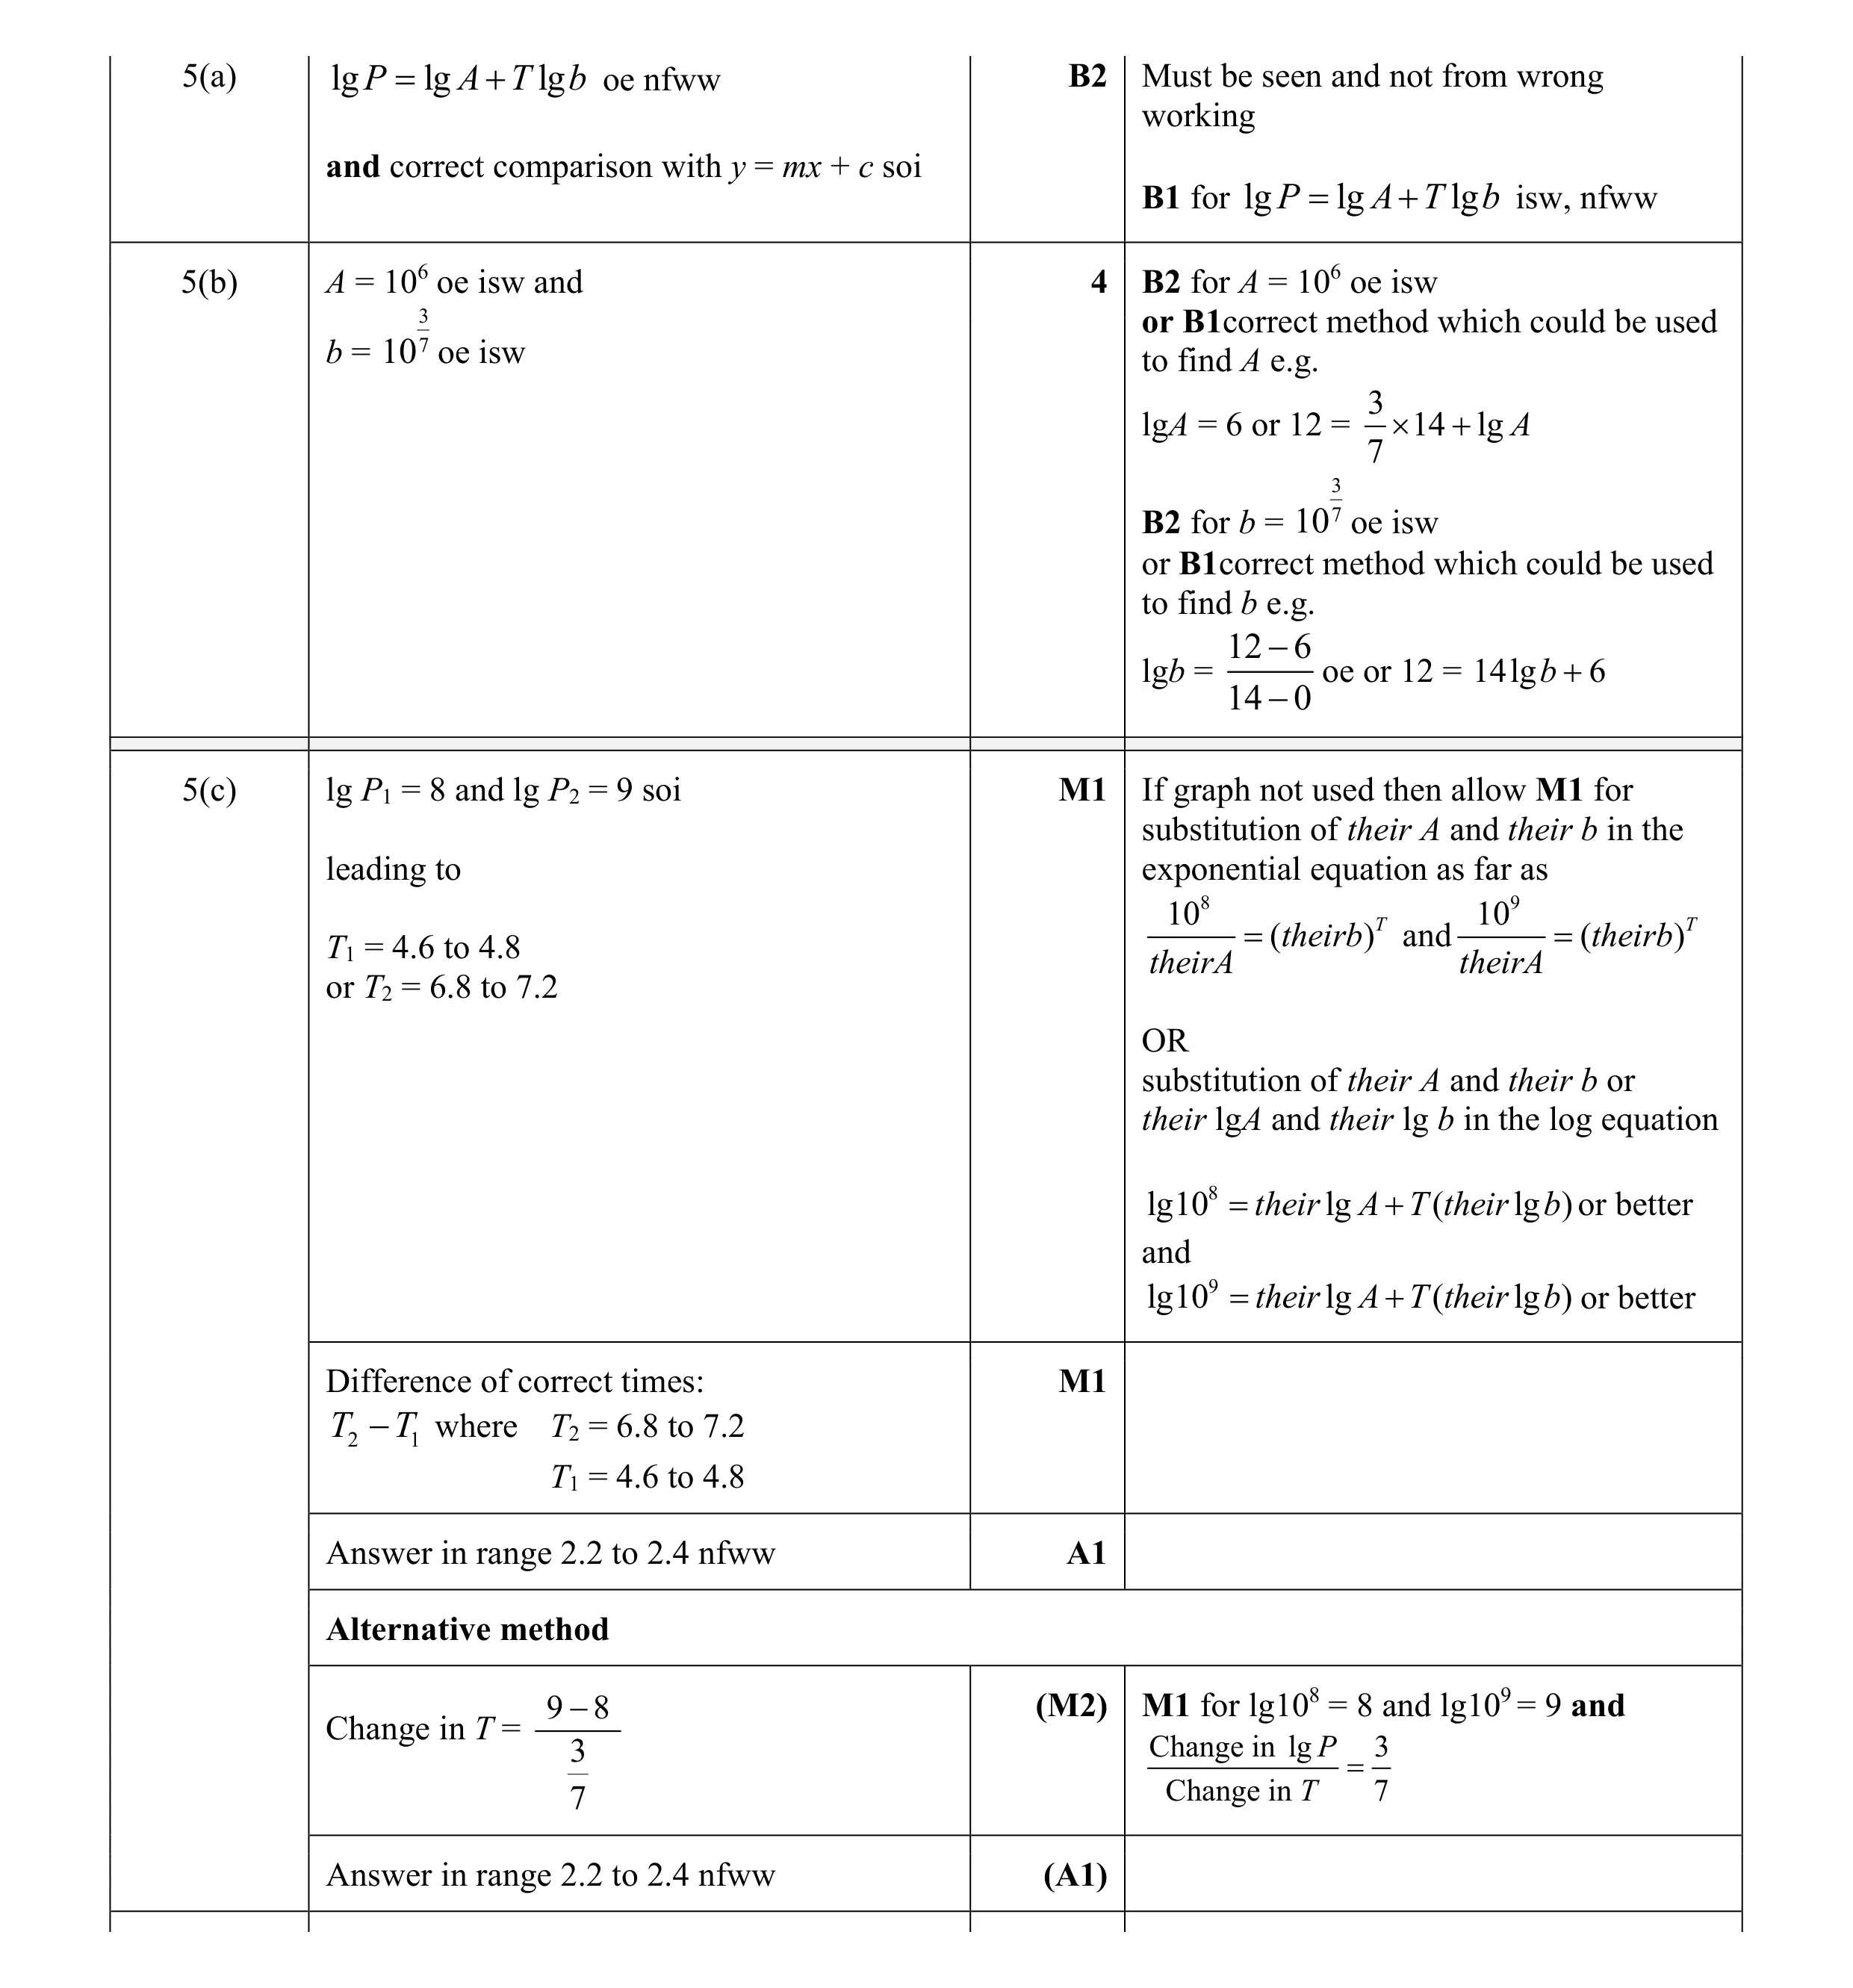 9
9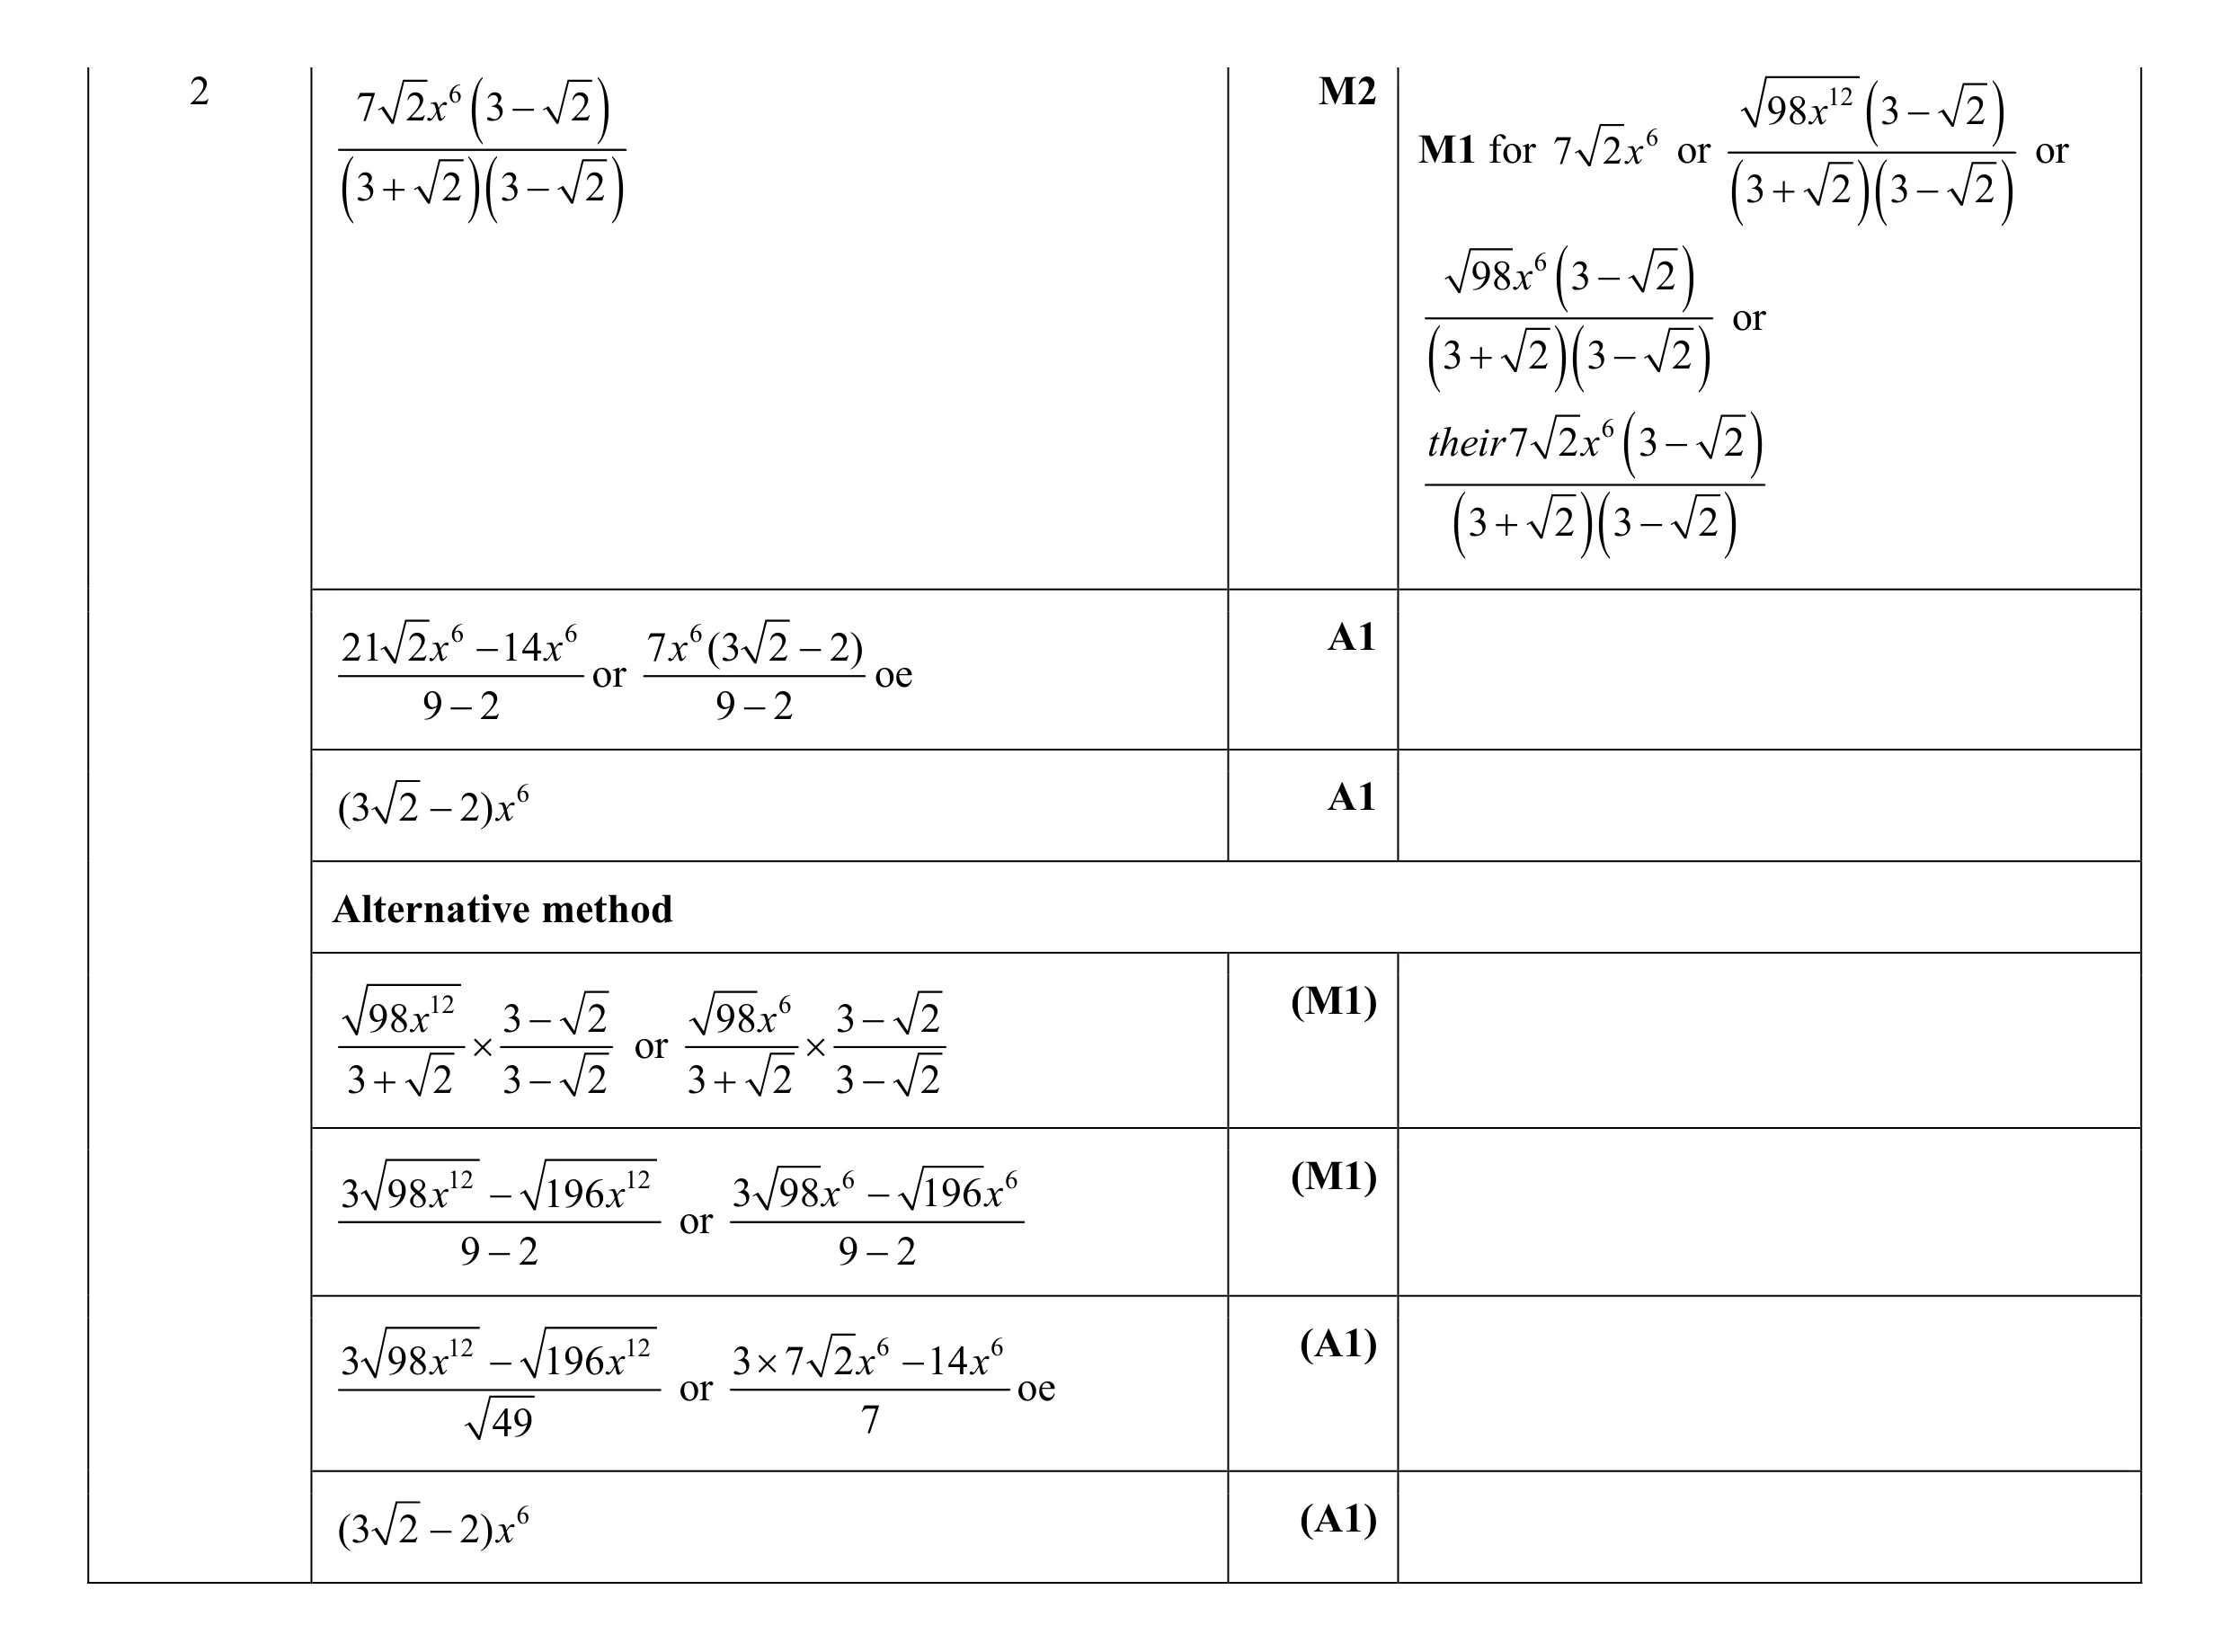 4
4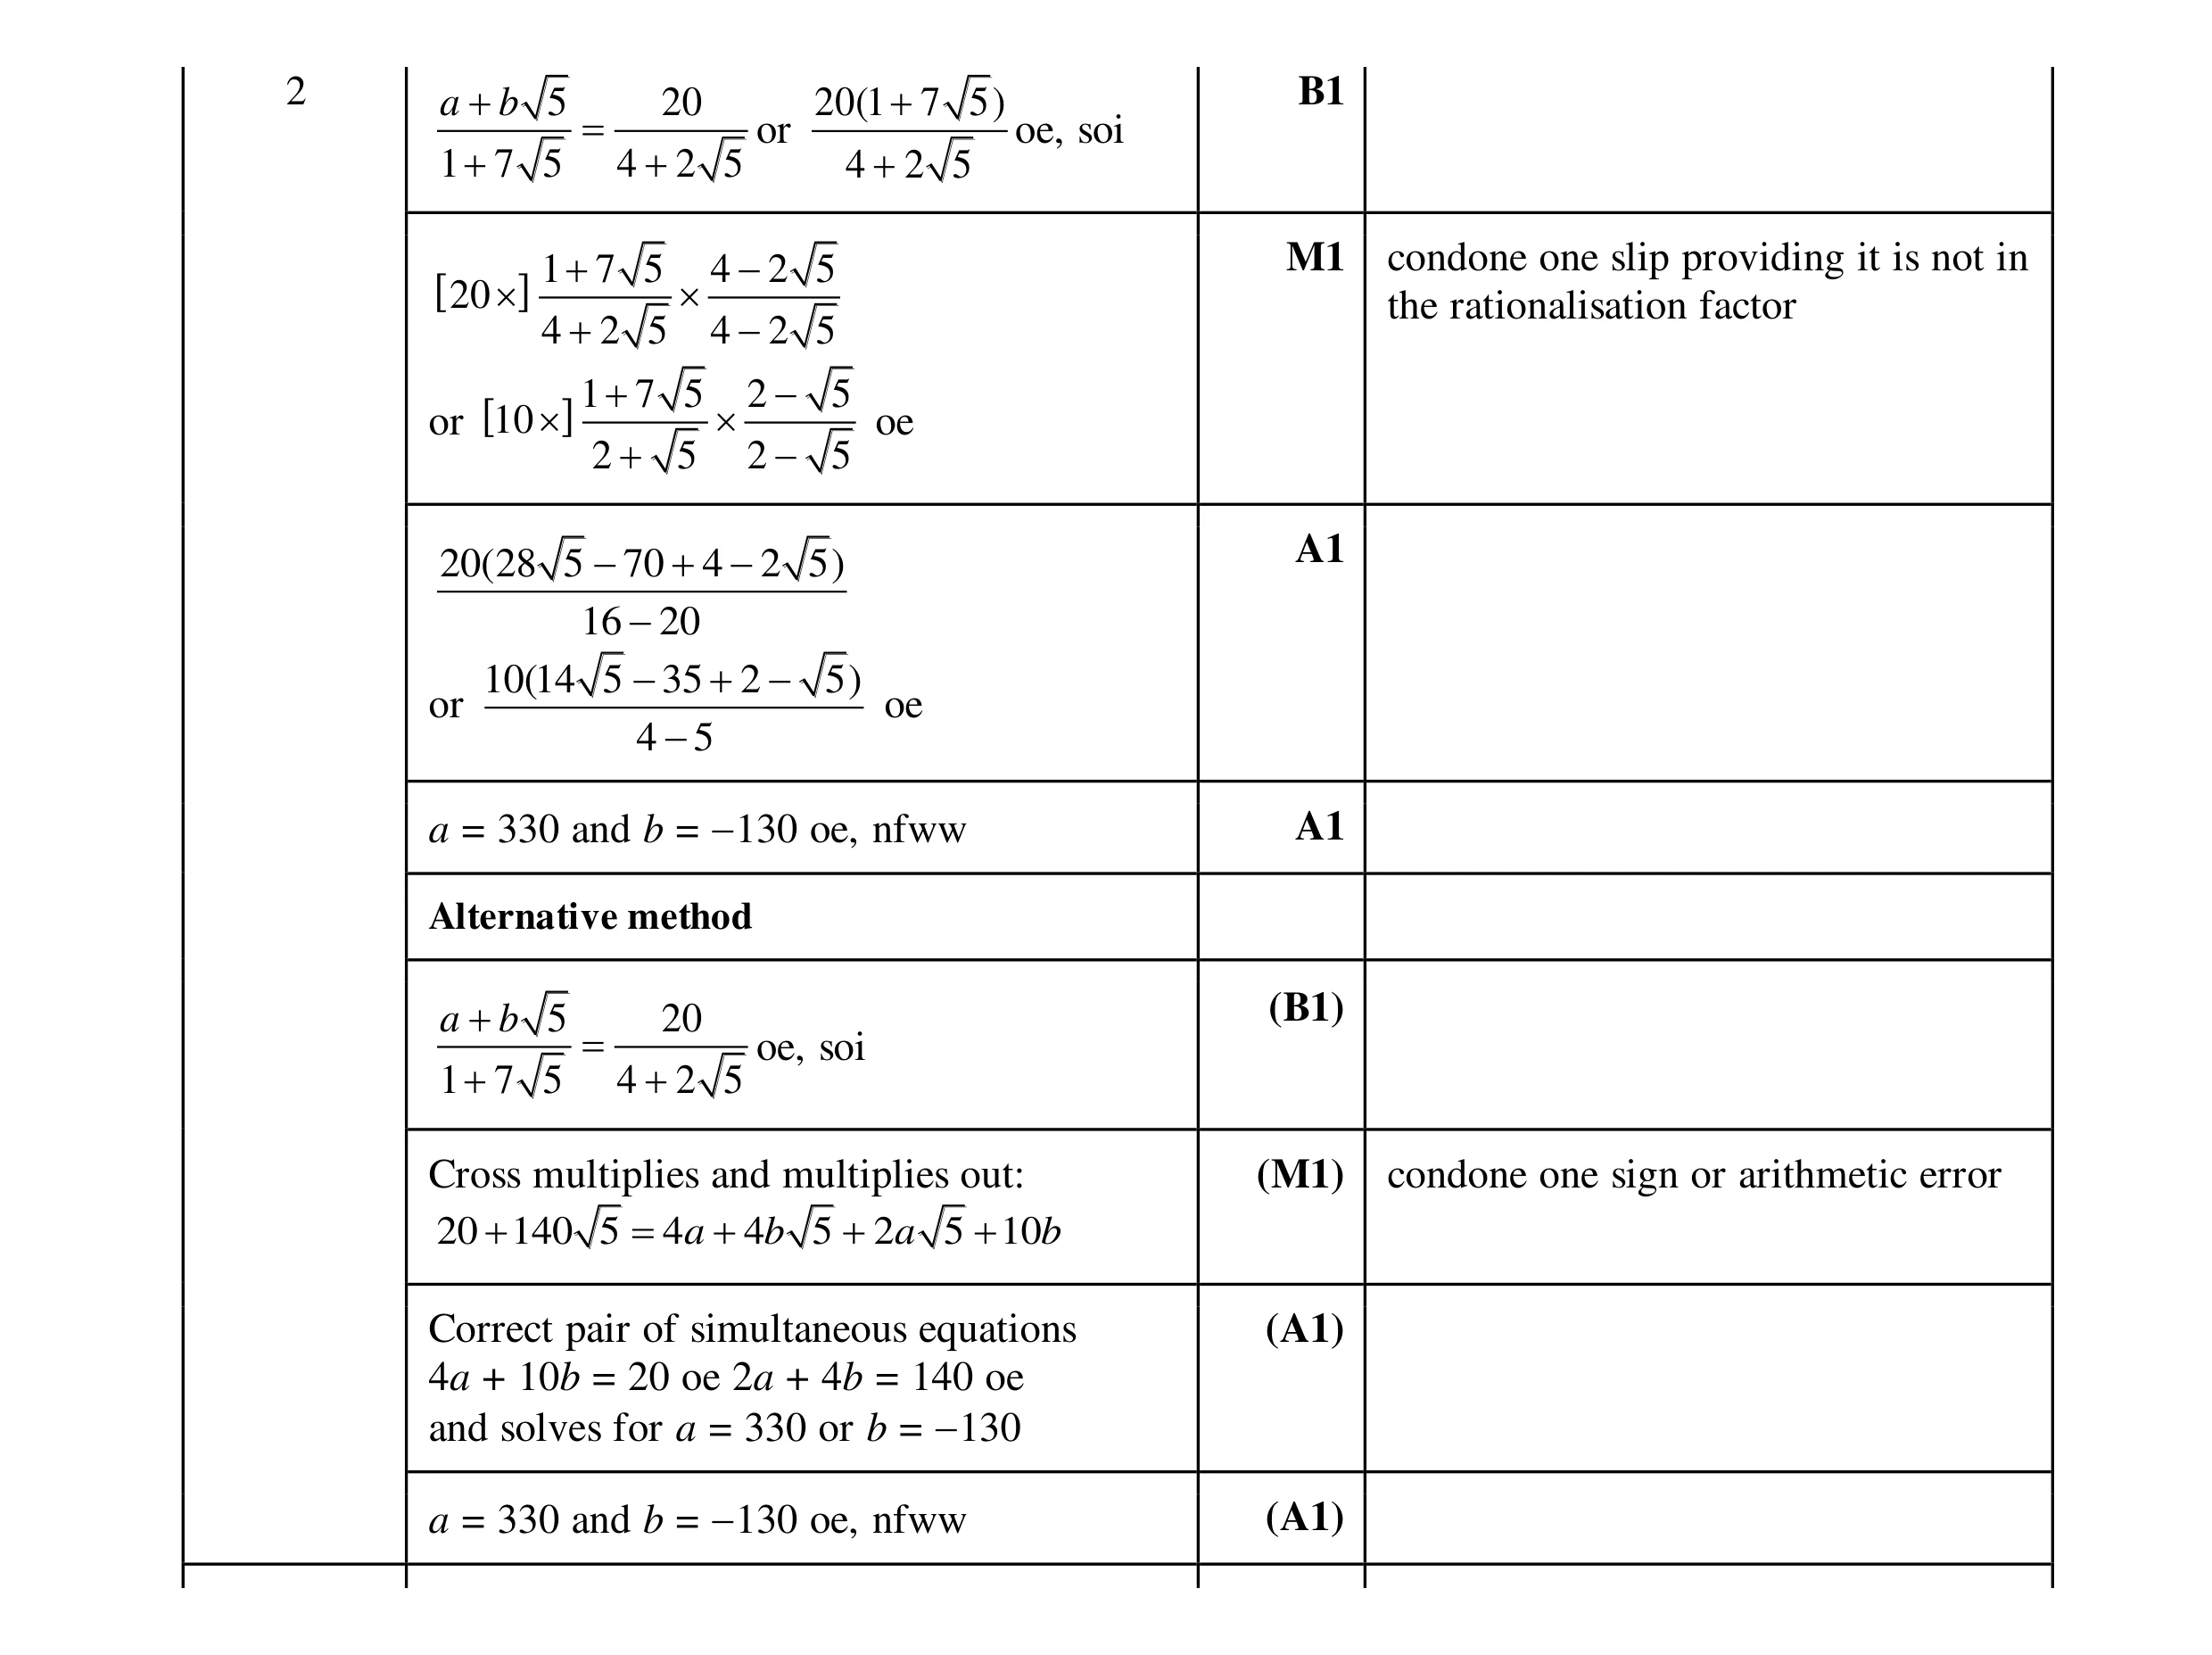 4
4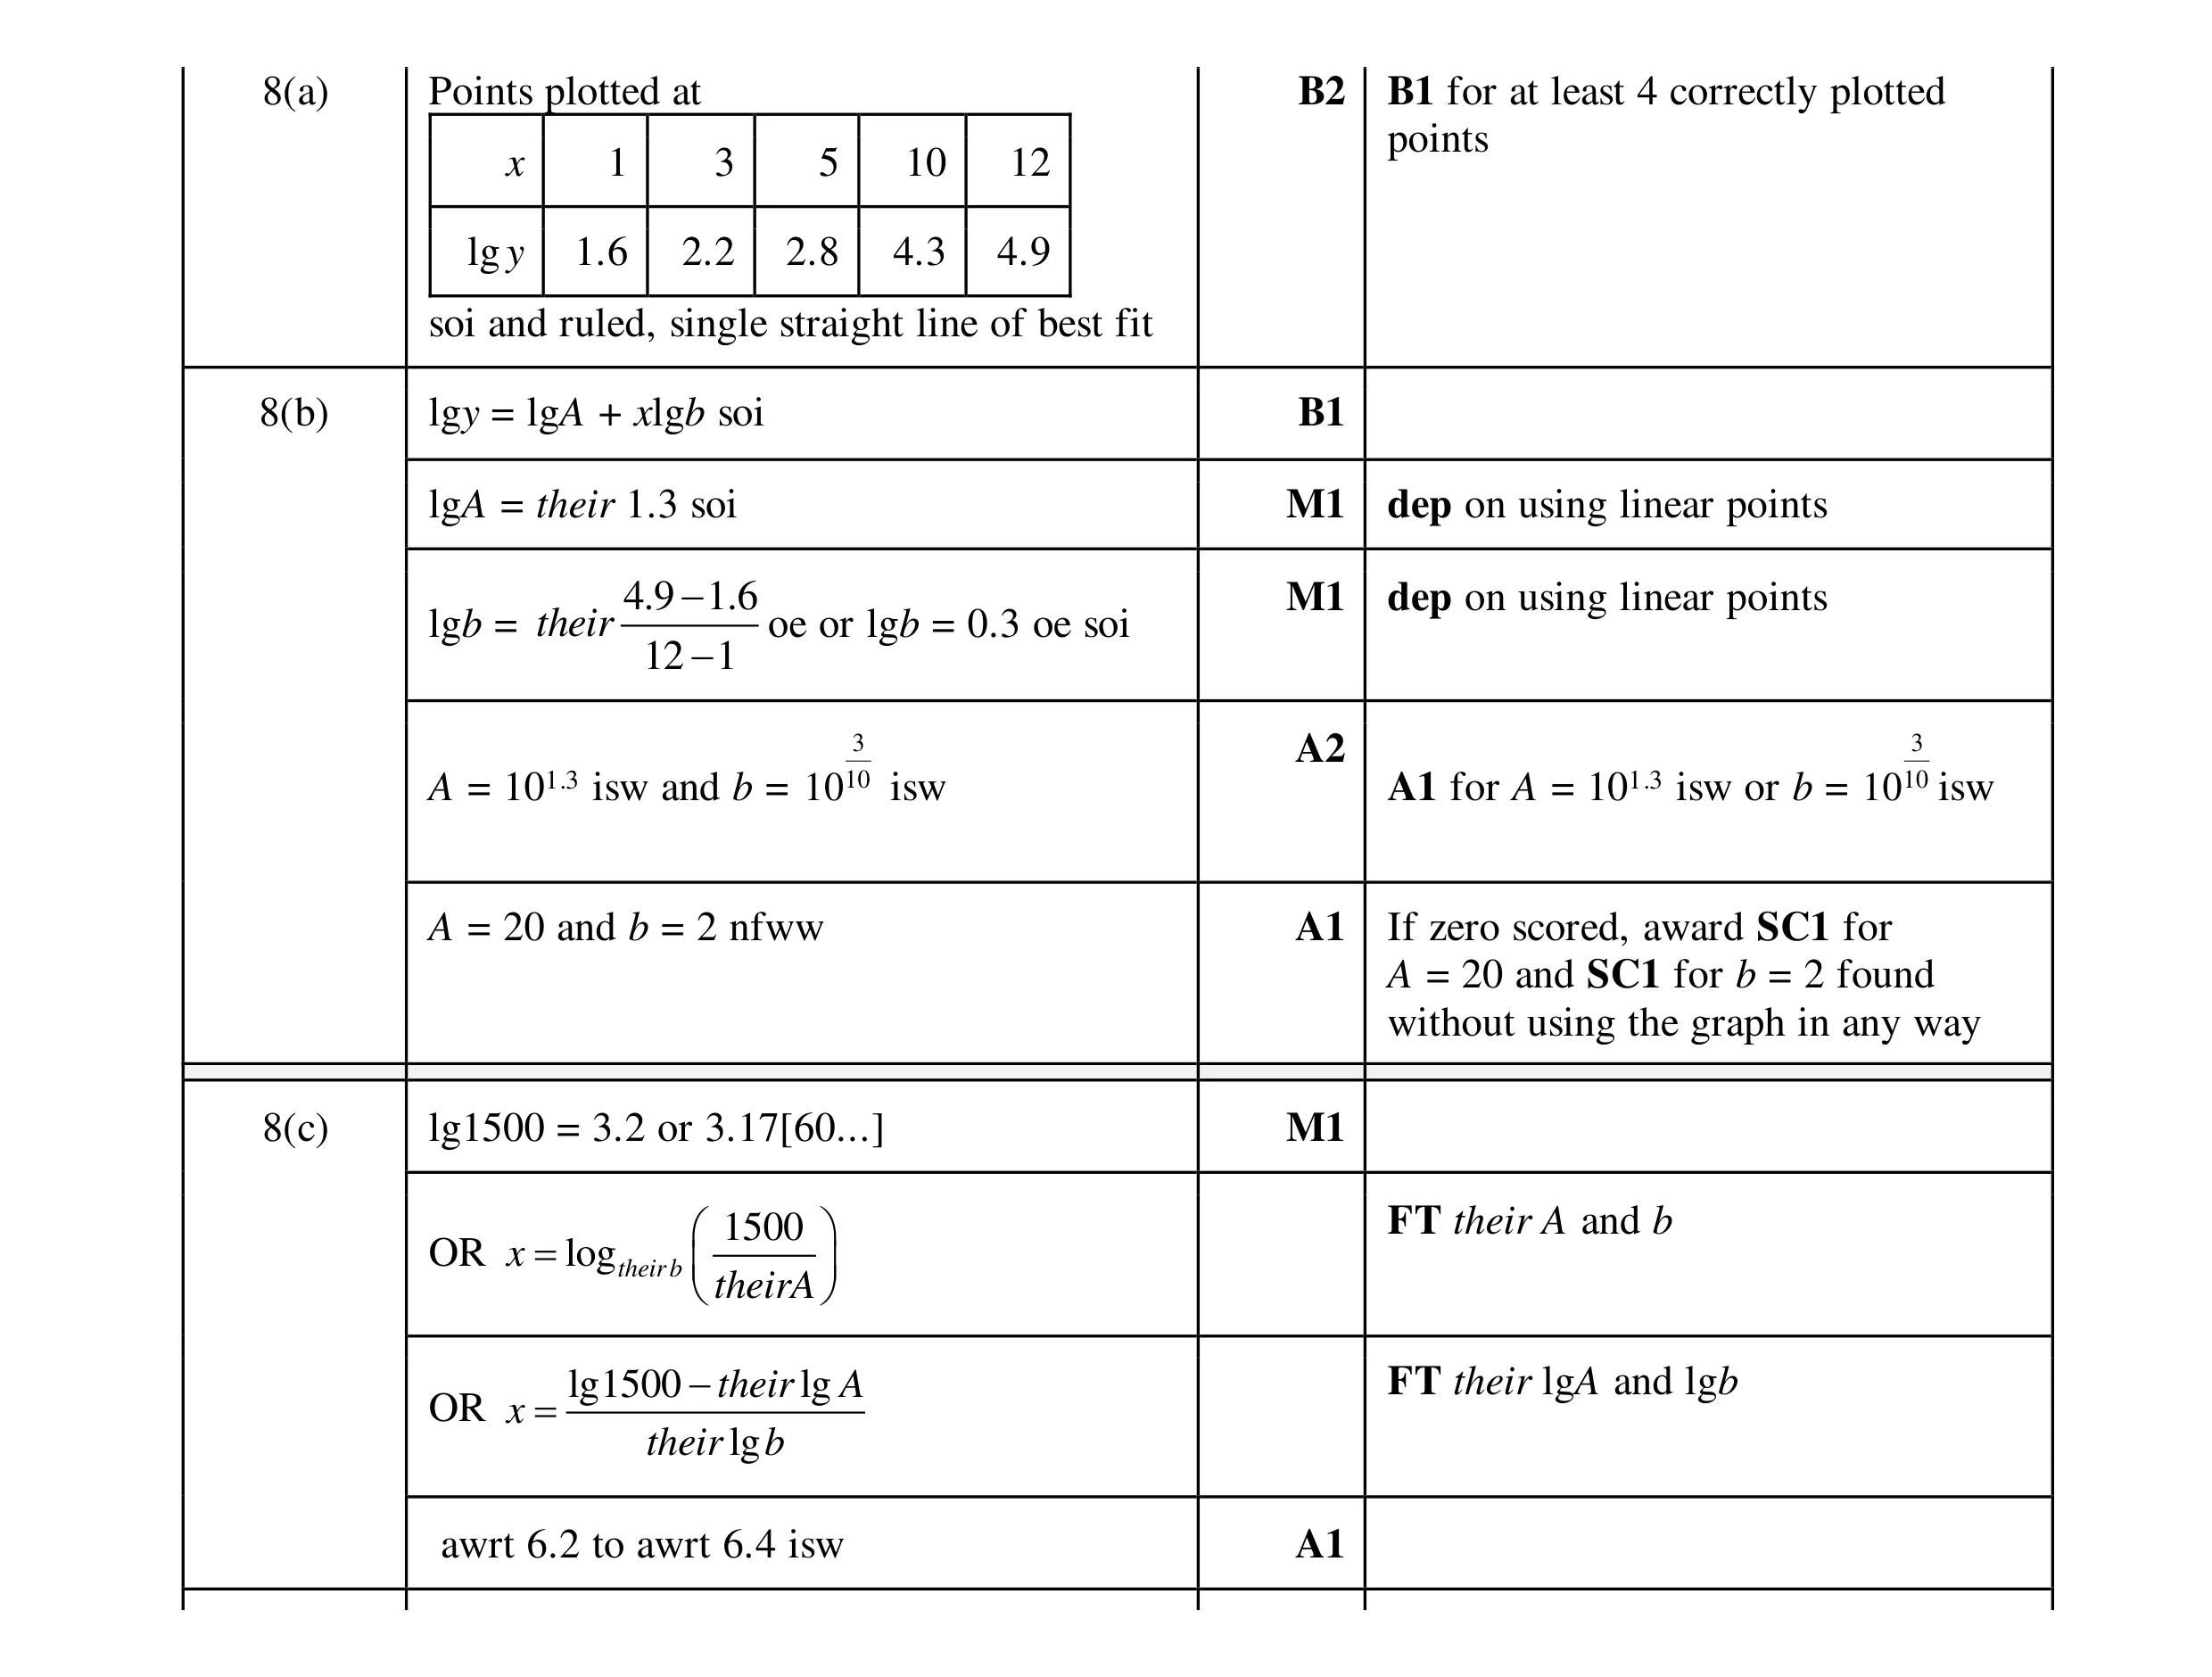 10
10