Questions as text
Q1 · = {21, 22, 23, 24, 25, 26, 27, 28, 29, 30} A = { x : x is a multiple of 3} B = { x : x… 0580/43 May/June 2017
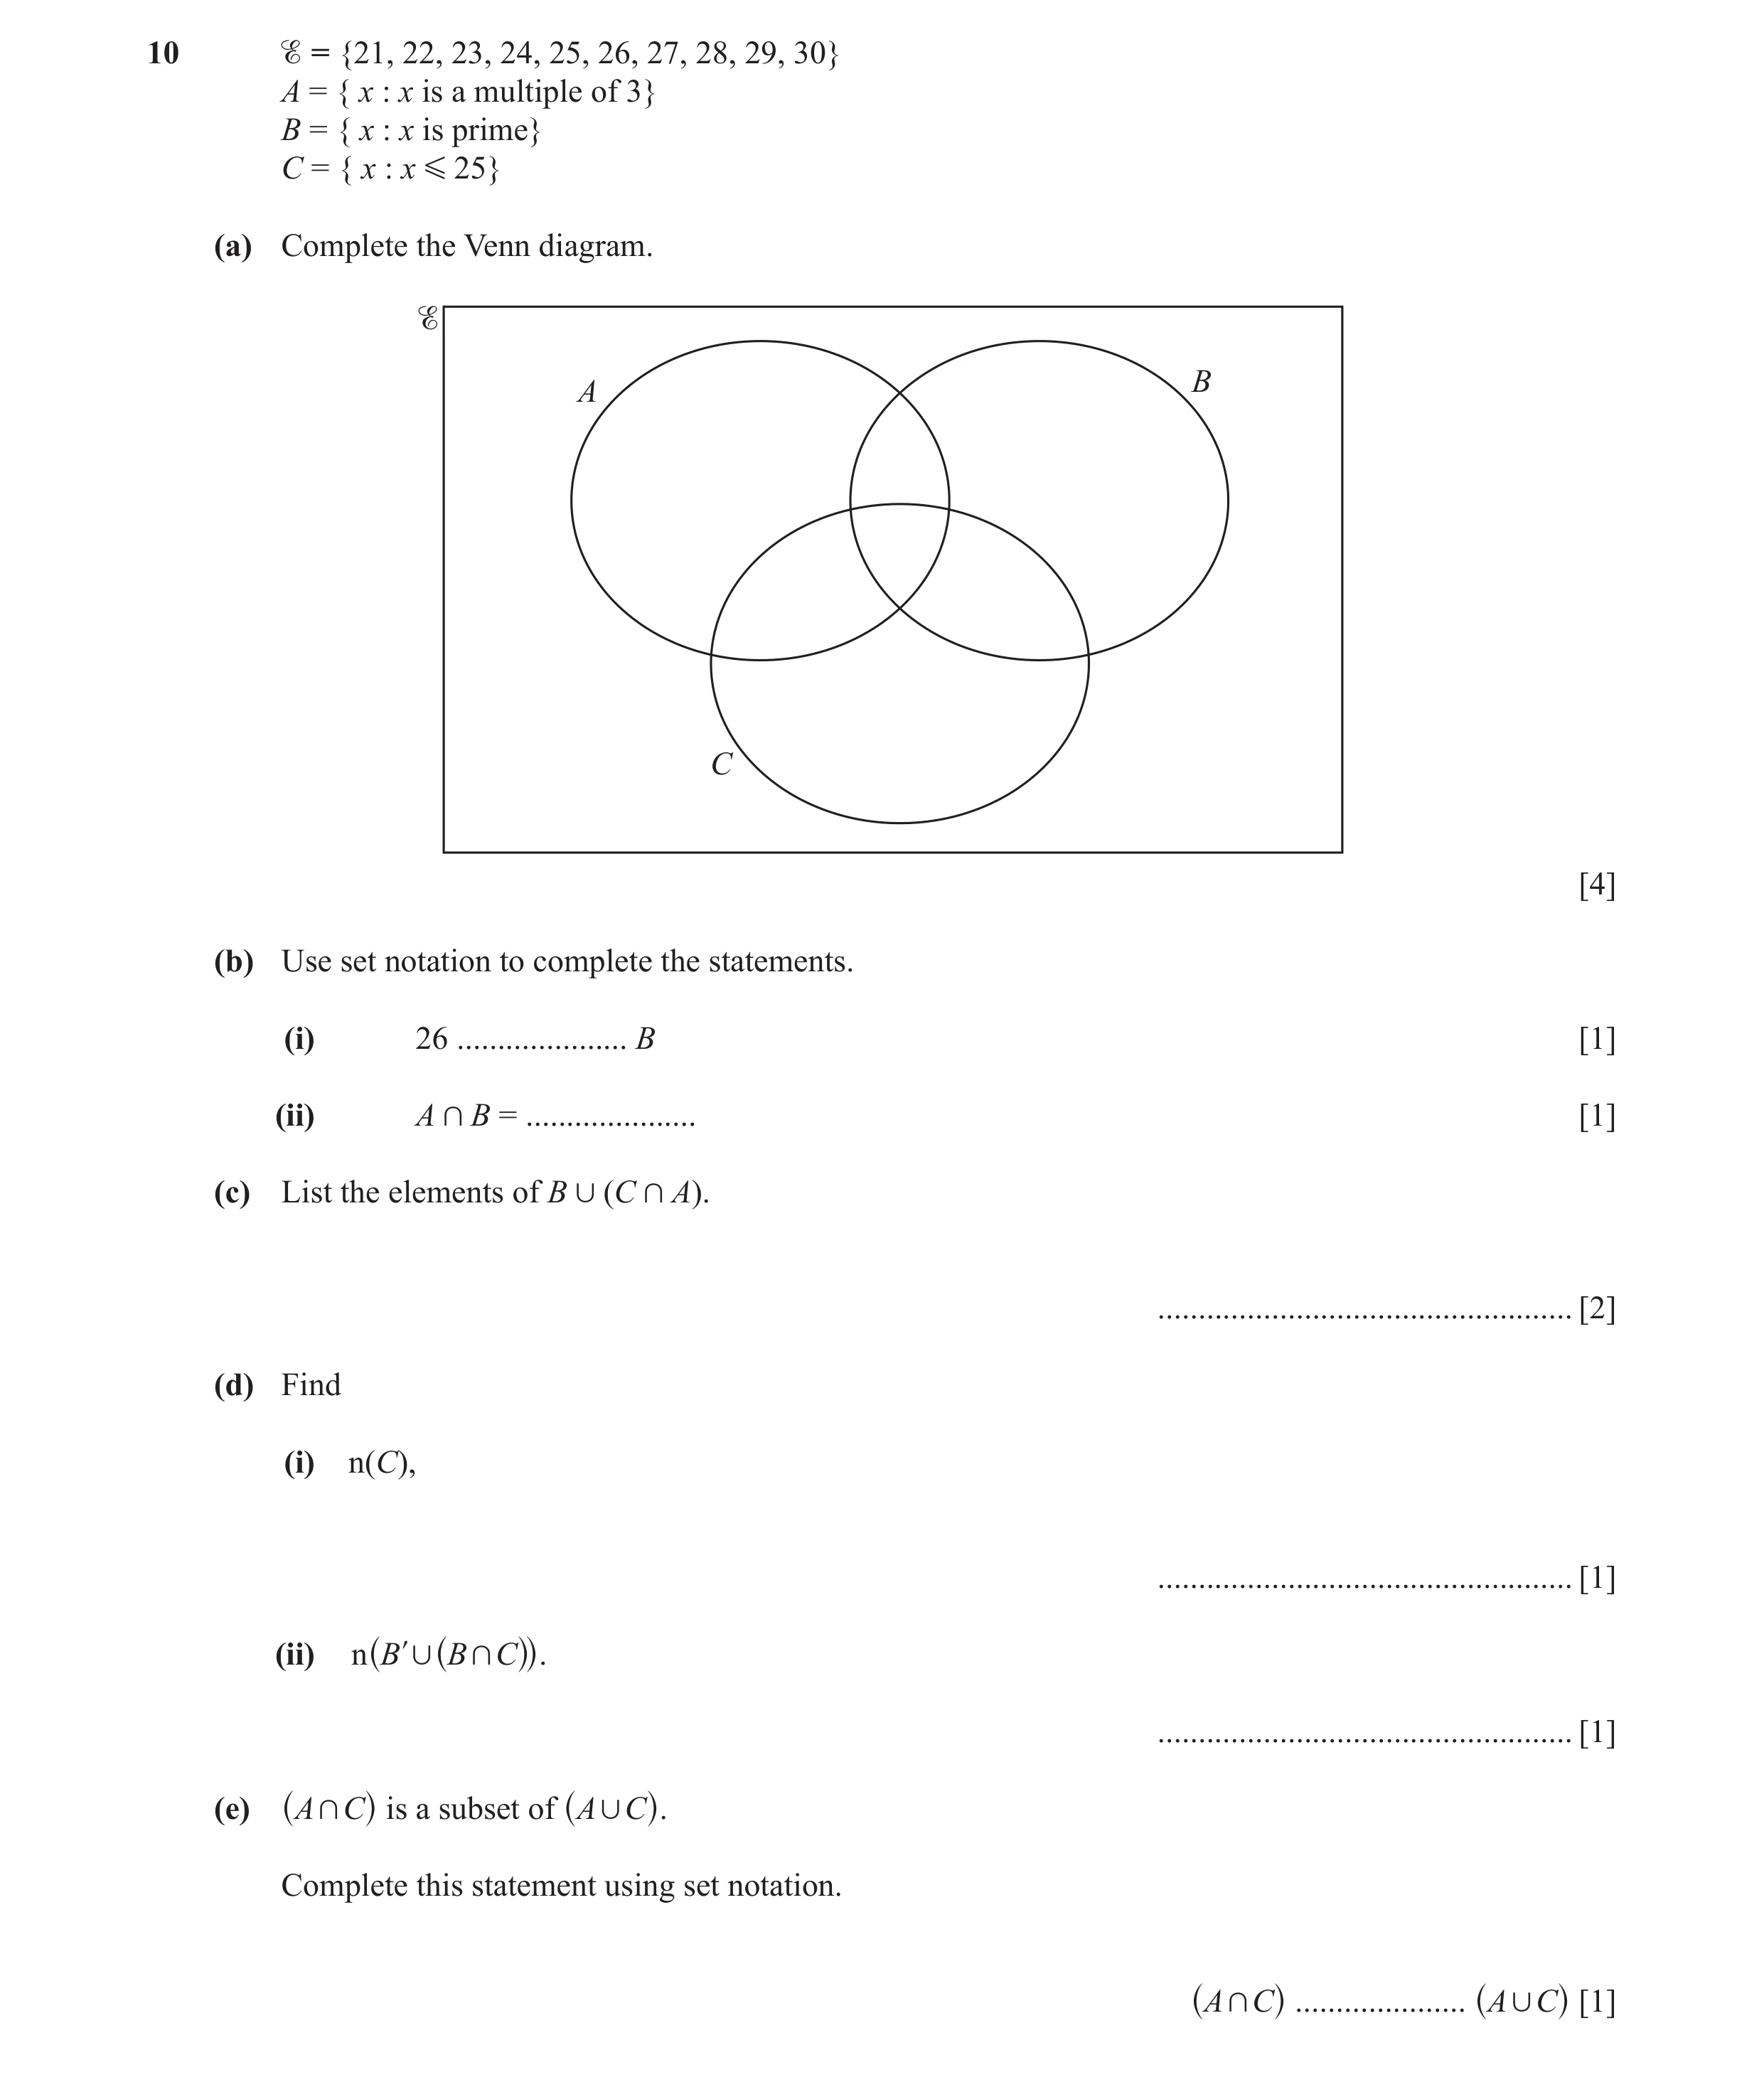
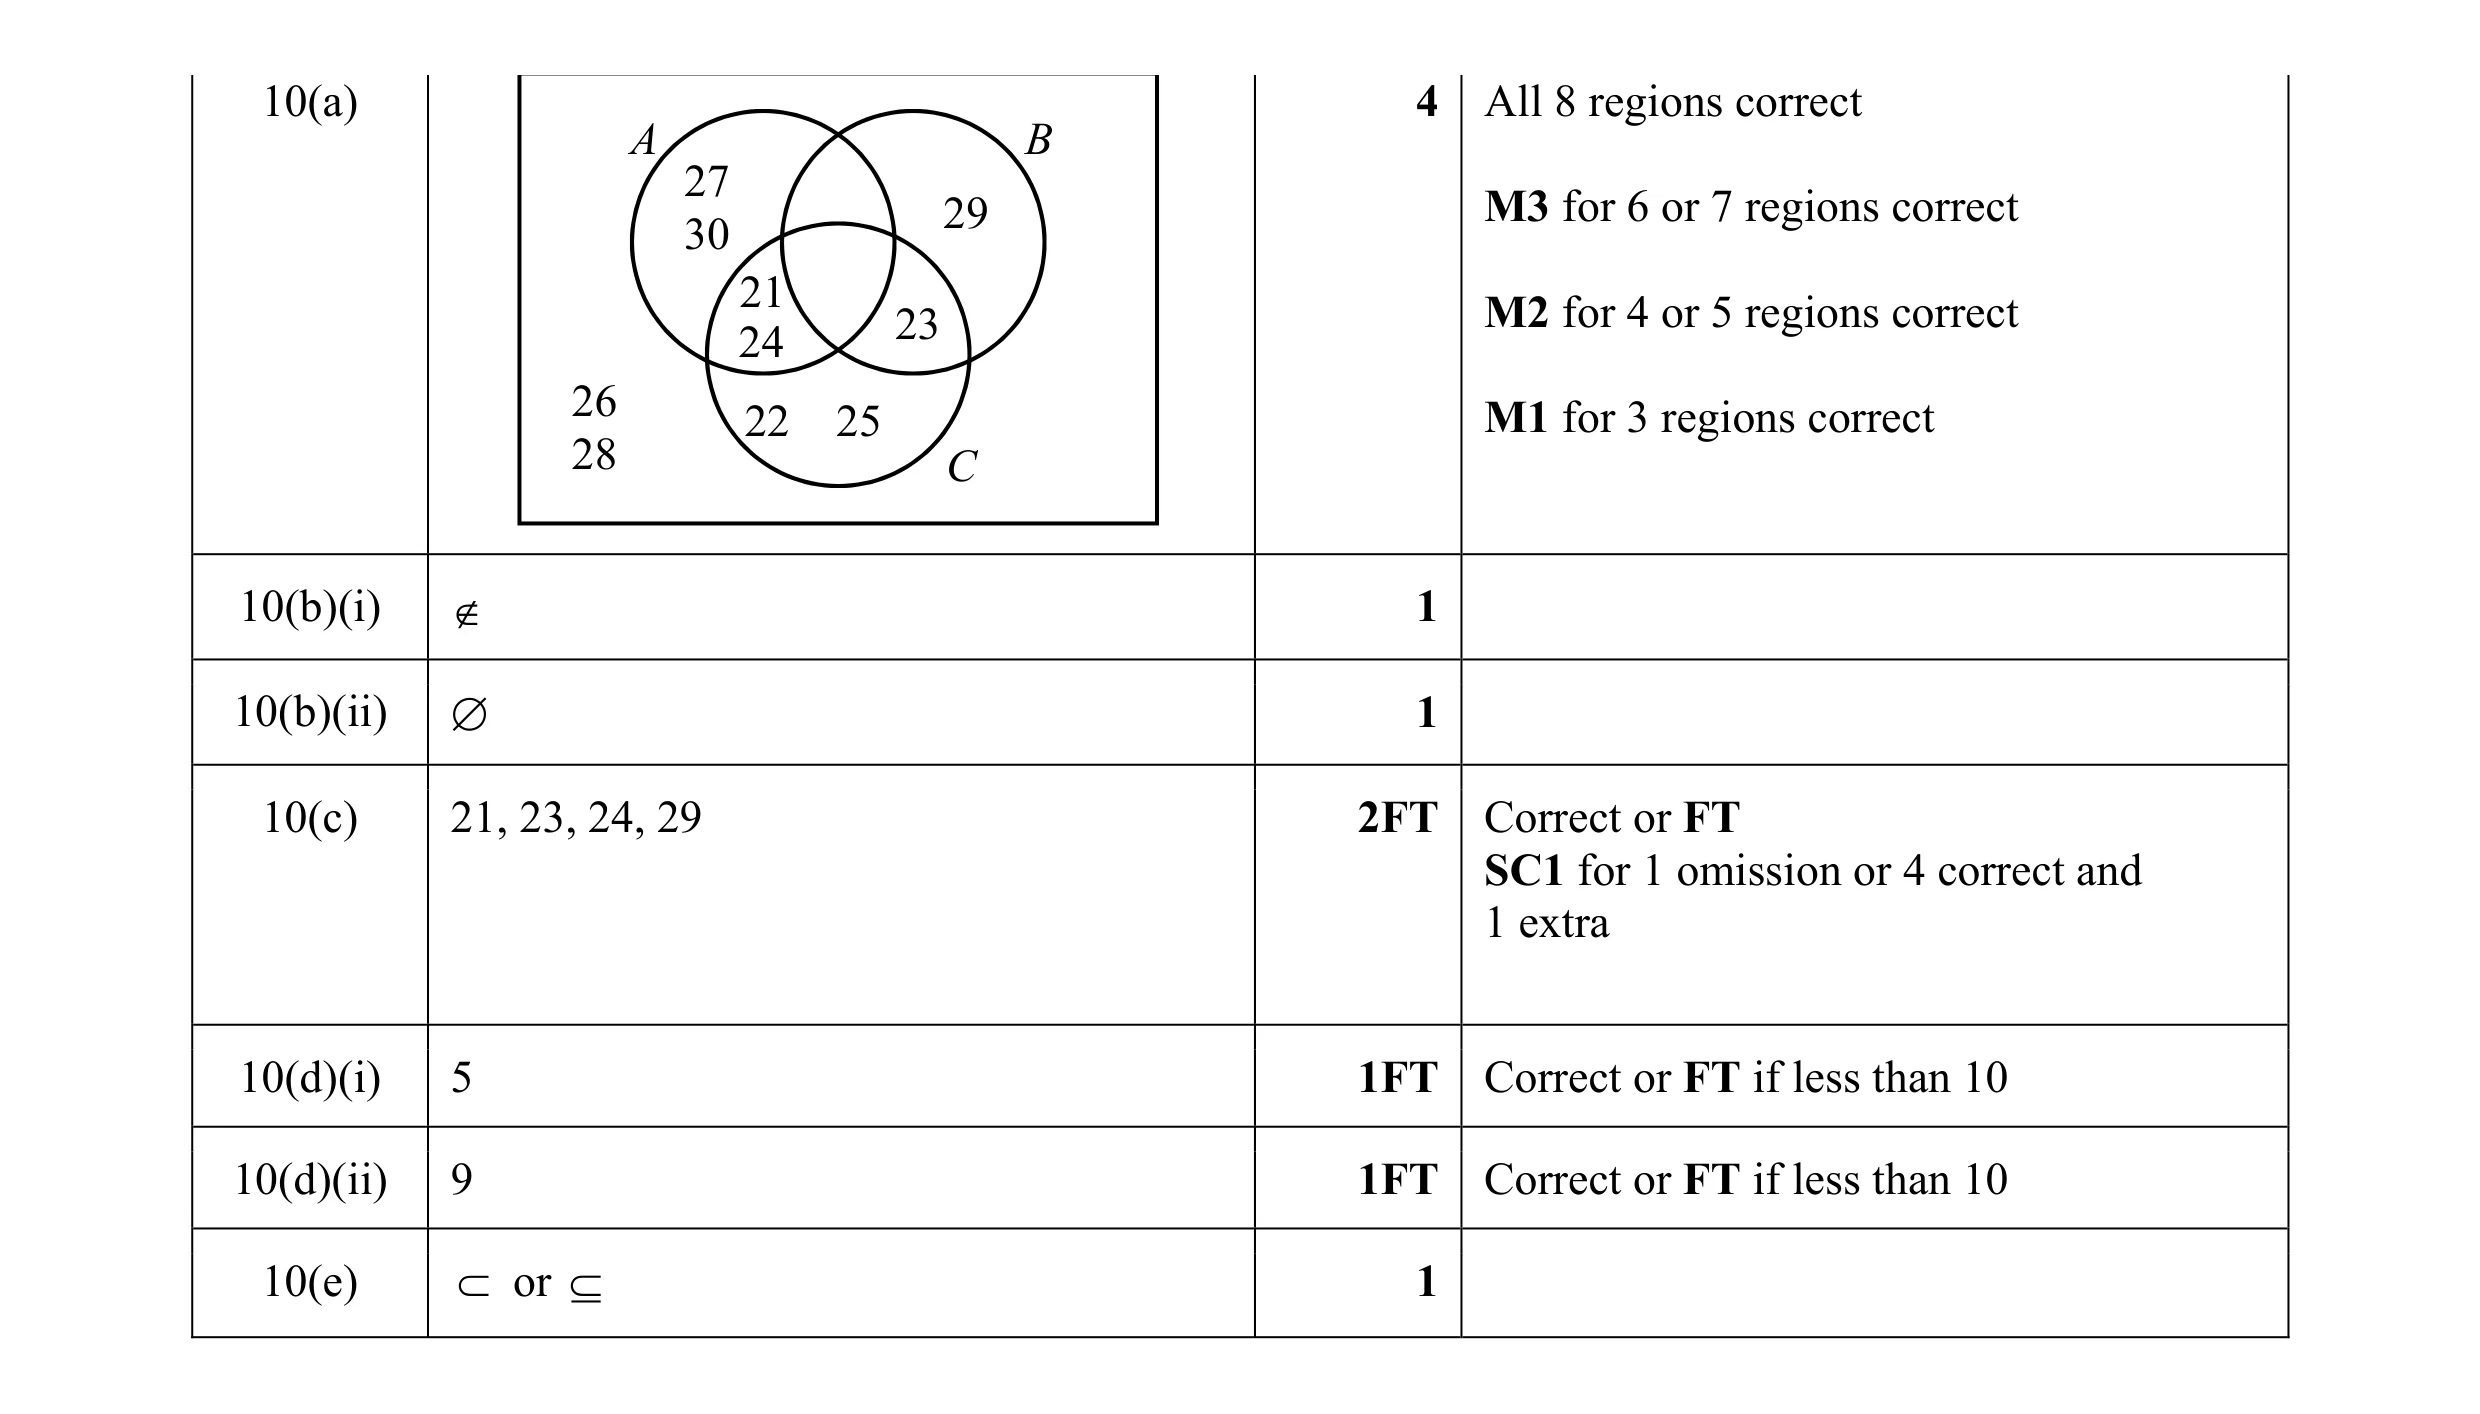
10 = {21, 22, 23, 24, 25, 26, 27, 28, 29, 30} A = { x : x is a multiple of 3} B = { x : x is prime} C = { x : x G 25} (a) Complete the Venn diagram. B A C [4] (b) Use set notation to complete the statements. (i) 26 … B [1] (ii) A + B = … [1] (c) List the elements of B , (C + A). … [2] (d) Find (i) n(C), … [1] (ii) n B l , B + C ^ ^ hh. … [1] (e) A + C is a subset of A , C ^ h ^ h. Complete this statement using set notation. A + C … A , C [1] ^ h ^ h
11 marks
Mark scheme: 10(a) 4 All 8 regions correct A B 27 29 M3 for 6 or 7 regions correct 30 21 23 M2 for 4 or 5 regions correct 24 26 22 25 M1 for 3 regions correct 28 C 10(b)(i) ∉ 1 10(b)(ii) ∅ 1 10(c) 21, 23, 24, 29 2FT Correct or FT SC1 for 1 omission or 4 correct and 1 extra 10(d)(i) 5 1FT Correct or FT if less than 10 10(d)(ii) 9 1FT Correct or FT if less than 10 10(e) ⊂ or ⊆ 1
This question in 0580/43 May/June 2017
Q2 · M D 5 3 8 2 4 9 12 G The Venn diagram above shows information about the number of… 0580/41 Oct/Nov 2018
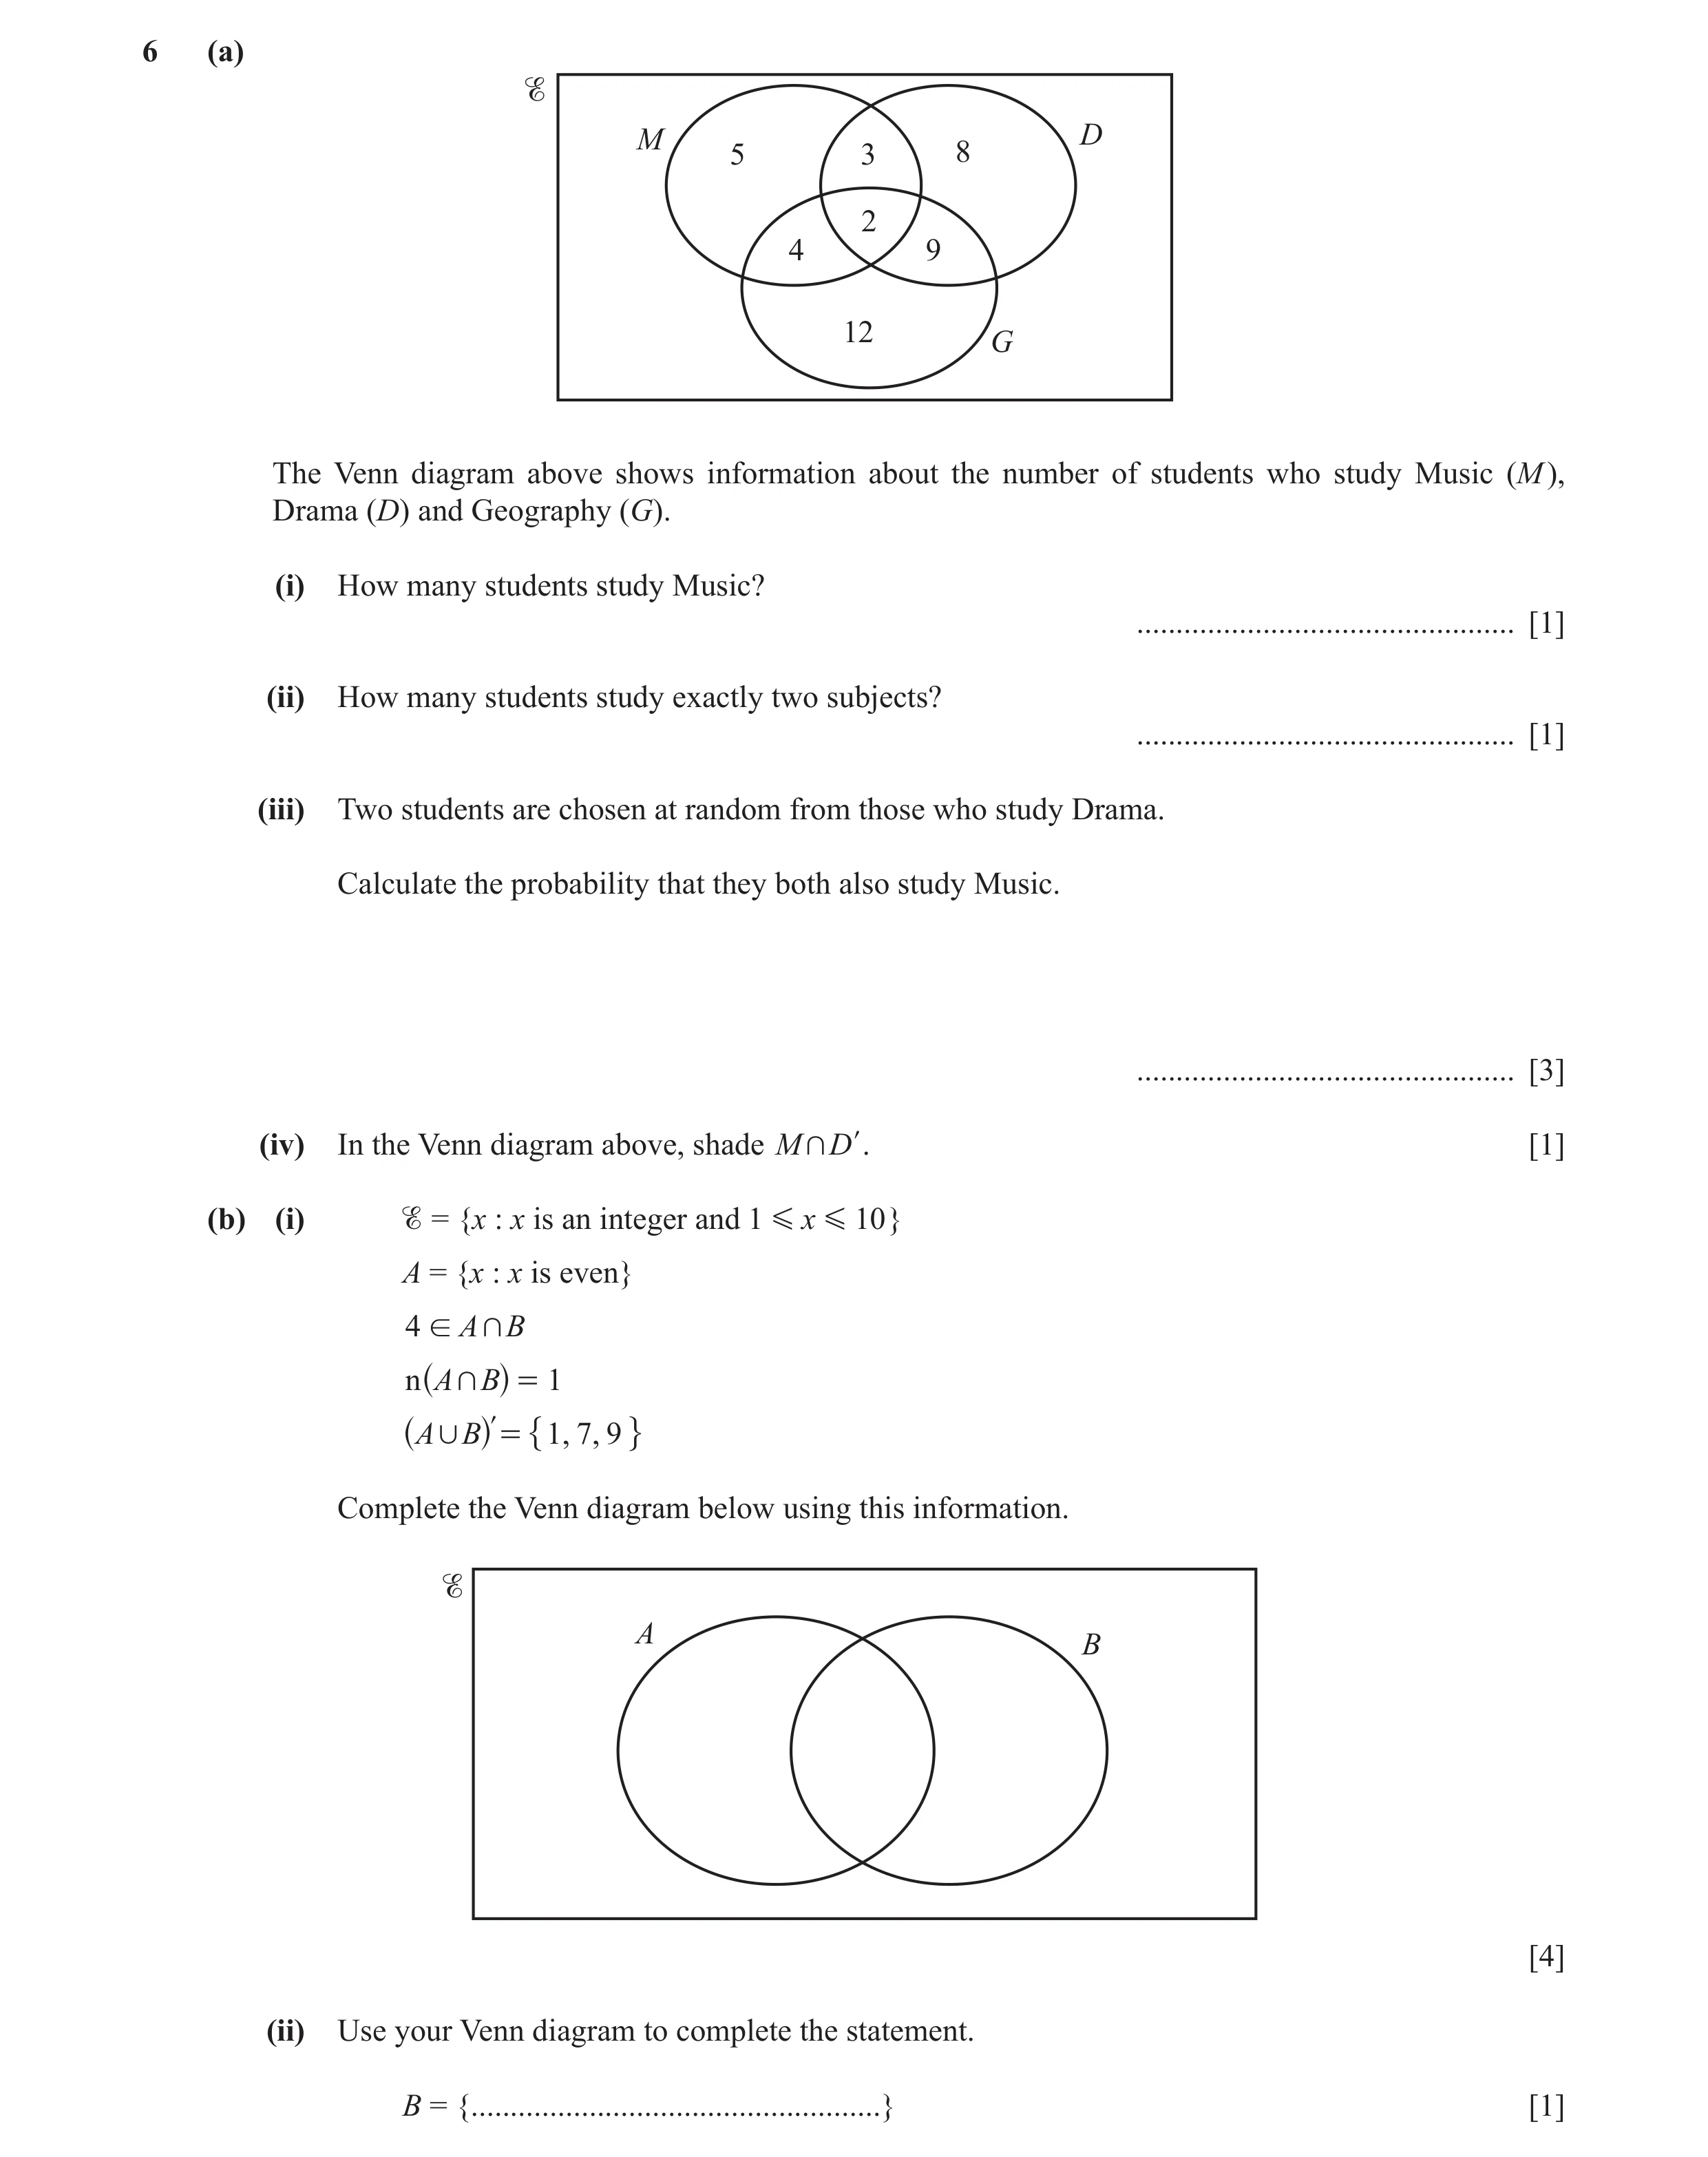
6 (a) M D 5 3 8 2 4 9 12 G The Venn diagram above shows information about the number of students who study Music (M ), Drama (D) and Geography (G). (i) How many students study Music? … [1] (ii) How many students study exactly two subjects? … [1] (iii) Two students are chosen at random from those who study Drama. Calculate the probability that they both also study Music. … [3] (iv) In the Venn diagram above, shade M + D l. [1] (b) (i) = {x : x is an integer and 1 G x G 10 } A = {x : x is even} 4 ! A + B n A + B = 1 ^ h A , B l = 1, 7, 9 ^ h " , Complete the Venn diagram below using this information. A B [4] (ii) Use your Venn diagram to complete the statement. B = { … } [1]
11 marks
Mark scheme: 6(a)(i) 14 1 6(a)(ii) 16 1 6(a)(iii) 20 3 5 4 oe M2 for × 462 22 21 5 or M1 for seen 22 6(a)(iv) Correct shading 1 6(b)(i) Fully correct Venn diagram 4 B1 for each correct region A B 2 3 1 6 4 5 7 8 9 10 6(b)(ii) 3 4 5 1 FT their (b)(i)
This question in 0580/41 Oct/Nov 2018
Q3 · The Venn diagram shows two sets, A and B 0580/42 Feb/March 2019
9 (a) The Venn diagram shows two sets, A and B. A B h c f m d g k e j q p (i) Use set notation to complete the statements. (a) d … A [1] (b) { f , g} = … [1] (ii) Complete the statement. n ( … ) = 6 [1] (b) In the Venn diagram below, shade C + D l. C D [1] (c) 50 students study at least one of the subjects geography (G ), mathematics (M ) and history (H ). 18 study only mathematics. 19 study two or three of these subjects. 23 study geography. The Venn diagram below is to be used to show this information. G M x … … 7 x x … H (i) Show that x = 4. [2] (ii) Complete the Venn diagram. [2] (iii) Use set notation to complete this statement. (G , M , H ) l = … [1] (iv) Find n(G + (M , H )) . … [1]
10 marks
Mark scheme: 9(a)(i)(a) ∈ 1 9(a)(i)(b) A ∩ B 1 9(a)(ii) B or A′ 1 9(b) 1 9(c)(i) 3 x + 7 = 19 oe M1 must see 19 and 7 3 x = 19 − 7 or better leading to x = 4 A1 with no errors seen 9(c)(ii) 2 B1 for 2 correct 8 18 5 9(c)(iii) ∅ or { } 1 9(c)(iv) 15 1
This question in 0580/42 Feb/March 2019
Q4 · = {students in a school} F = {students who play football} B = {students who play… 0580/41 May/June 2019
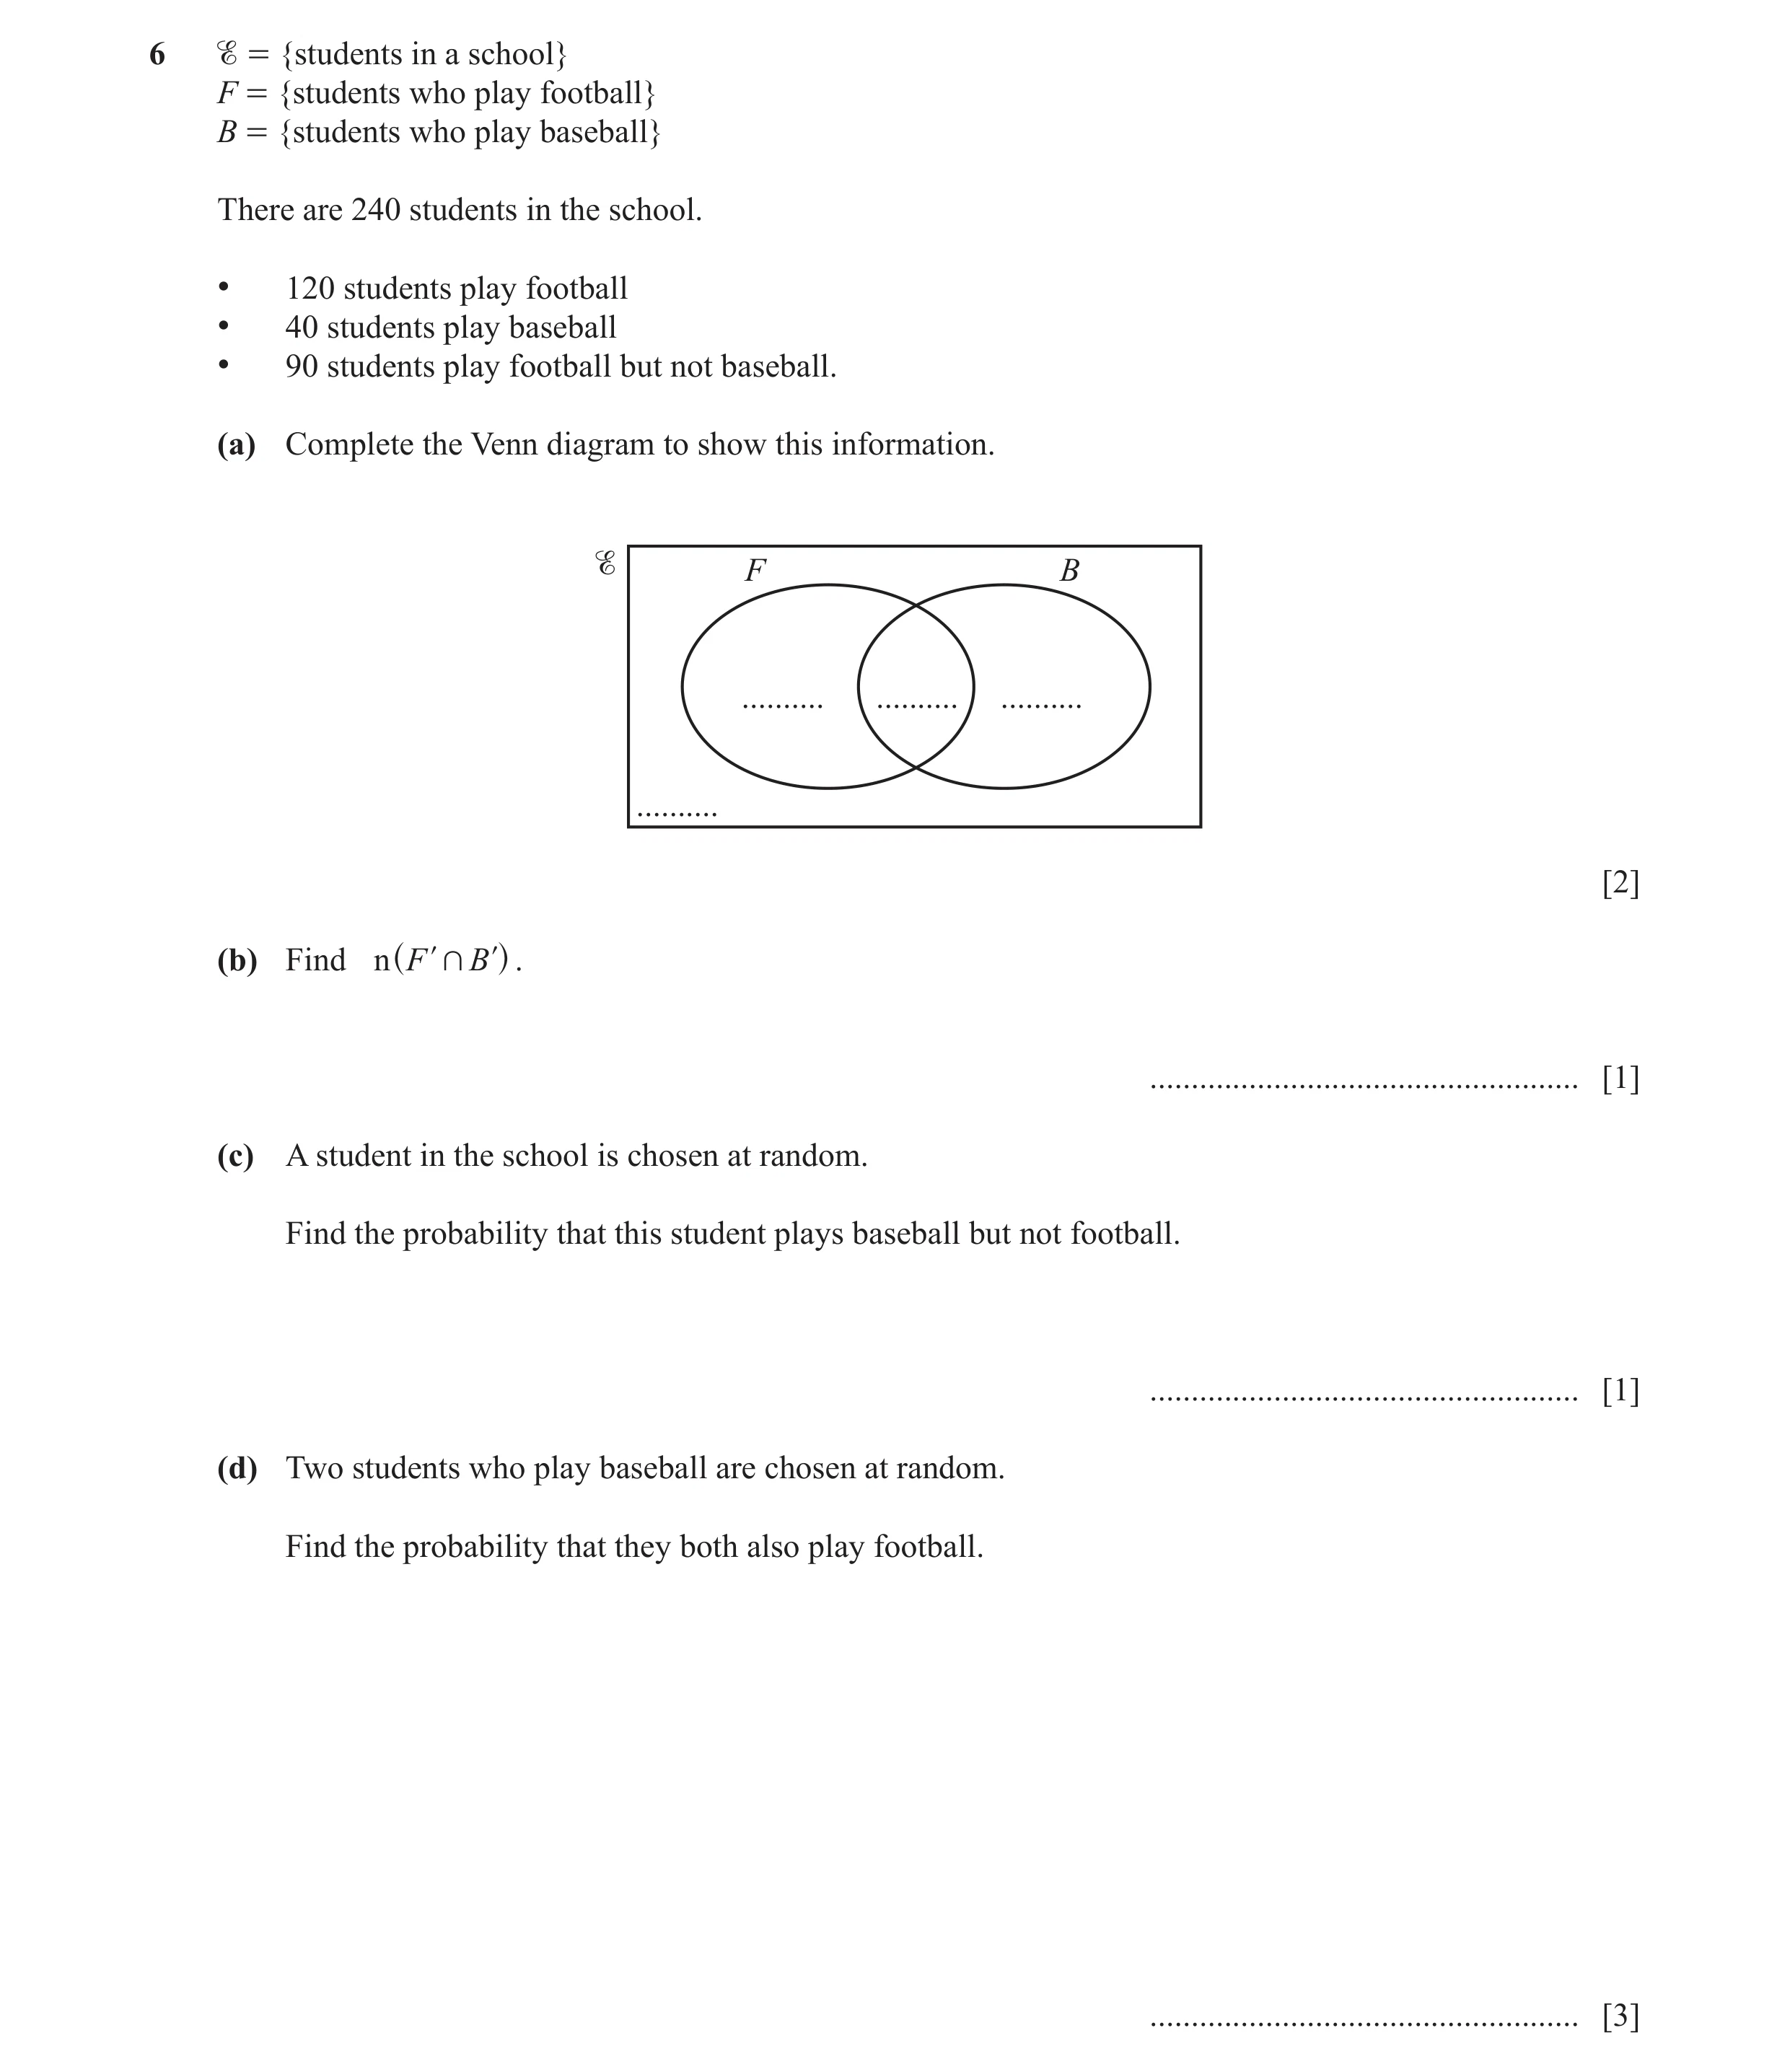
6 = {students in a school} F = {students who play football} B = {students who play baseball} There are 240 students in the school. • 120 students play football • 40 students play baseball • 90 students play football but not baseball. (a) Complete the Venn diagram to show this information. F B … … … … [2] (b) Find n F l + B l . ^ h … [1] (c) A student in the school is chosen at random. Find the probability that this student plays baseball but not football. … [1] (d) Two students who play baseball are chosen at random. Find the probability that they both also play football. … [3]
7 marks
Mark scheme: 6(a) 2 B1 for any one correct 90 30 10 110 6(b) 110 1 FT their 110 in Venn diagram 6(c) 10 1 their10 oe FT 240 240 6(d) 870 3 their 30 their 30 − 1 oe M2 for × 1560 40 39 p p − 1 their 30 or M1 for × p < q or for q q − 1 40 soi
This question in 0580/41 May/June 2019
Q5 · This year, 40 students have each travelled by one or more of plane (P), train (T) or boat… 0580/42 Feb/March 2020
9 This year, 40 students have each travelled by one or more of plane (P), train (T) or boat (B). 7 have travelled only by plane. 11 have travelled only by train. 9 have travelled only by boat. n ( P + T ) = 8 n ( B + T ) = 3 n ( B + P ) = 6 P T B (a) Complete the Venn diagram. [3] (b) Find n ( P , B ) l . ` j … [1] (c) Use set notation to complete the statement. ( P , T , B ) l = … [1] (d) Two students are chosen at random. Calculate the probability that they both have travelled only by plane. … [2] (e) Two students are chosen at random from those who have travelled by train. Calculate the probability that they both have also travelled by plane. … [2]
9 marks
Mark scheme: 9(a) 3 B2 for 5 correct entries including ‘2’ correctly placed at the intersection of the P 3 sets T 6 7 11 or M1 for 2 k + 8 − k + 3 − k + 6 − k = 40 − (7 + 9 + 11) oe 4 1 or for k, 8 – k, 3 – k, 6 – k, seen correctly placed on diagram with 7, 11 and 9 9 correctly placed B 9(b) 11 1 9(c) Ø or { } 1 9(d) 7 2 7 6 oe M1 for × oe 260 40 39 9(e) 14 2 FT their Venn diagram oe 95 8 7 M1 for × 20 19
This question in 0580/42 Feb/March 2020
Q6 · X is an integer 0580/41 May/June 2020
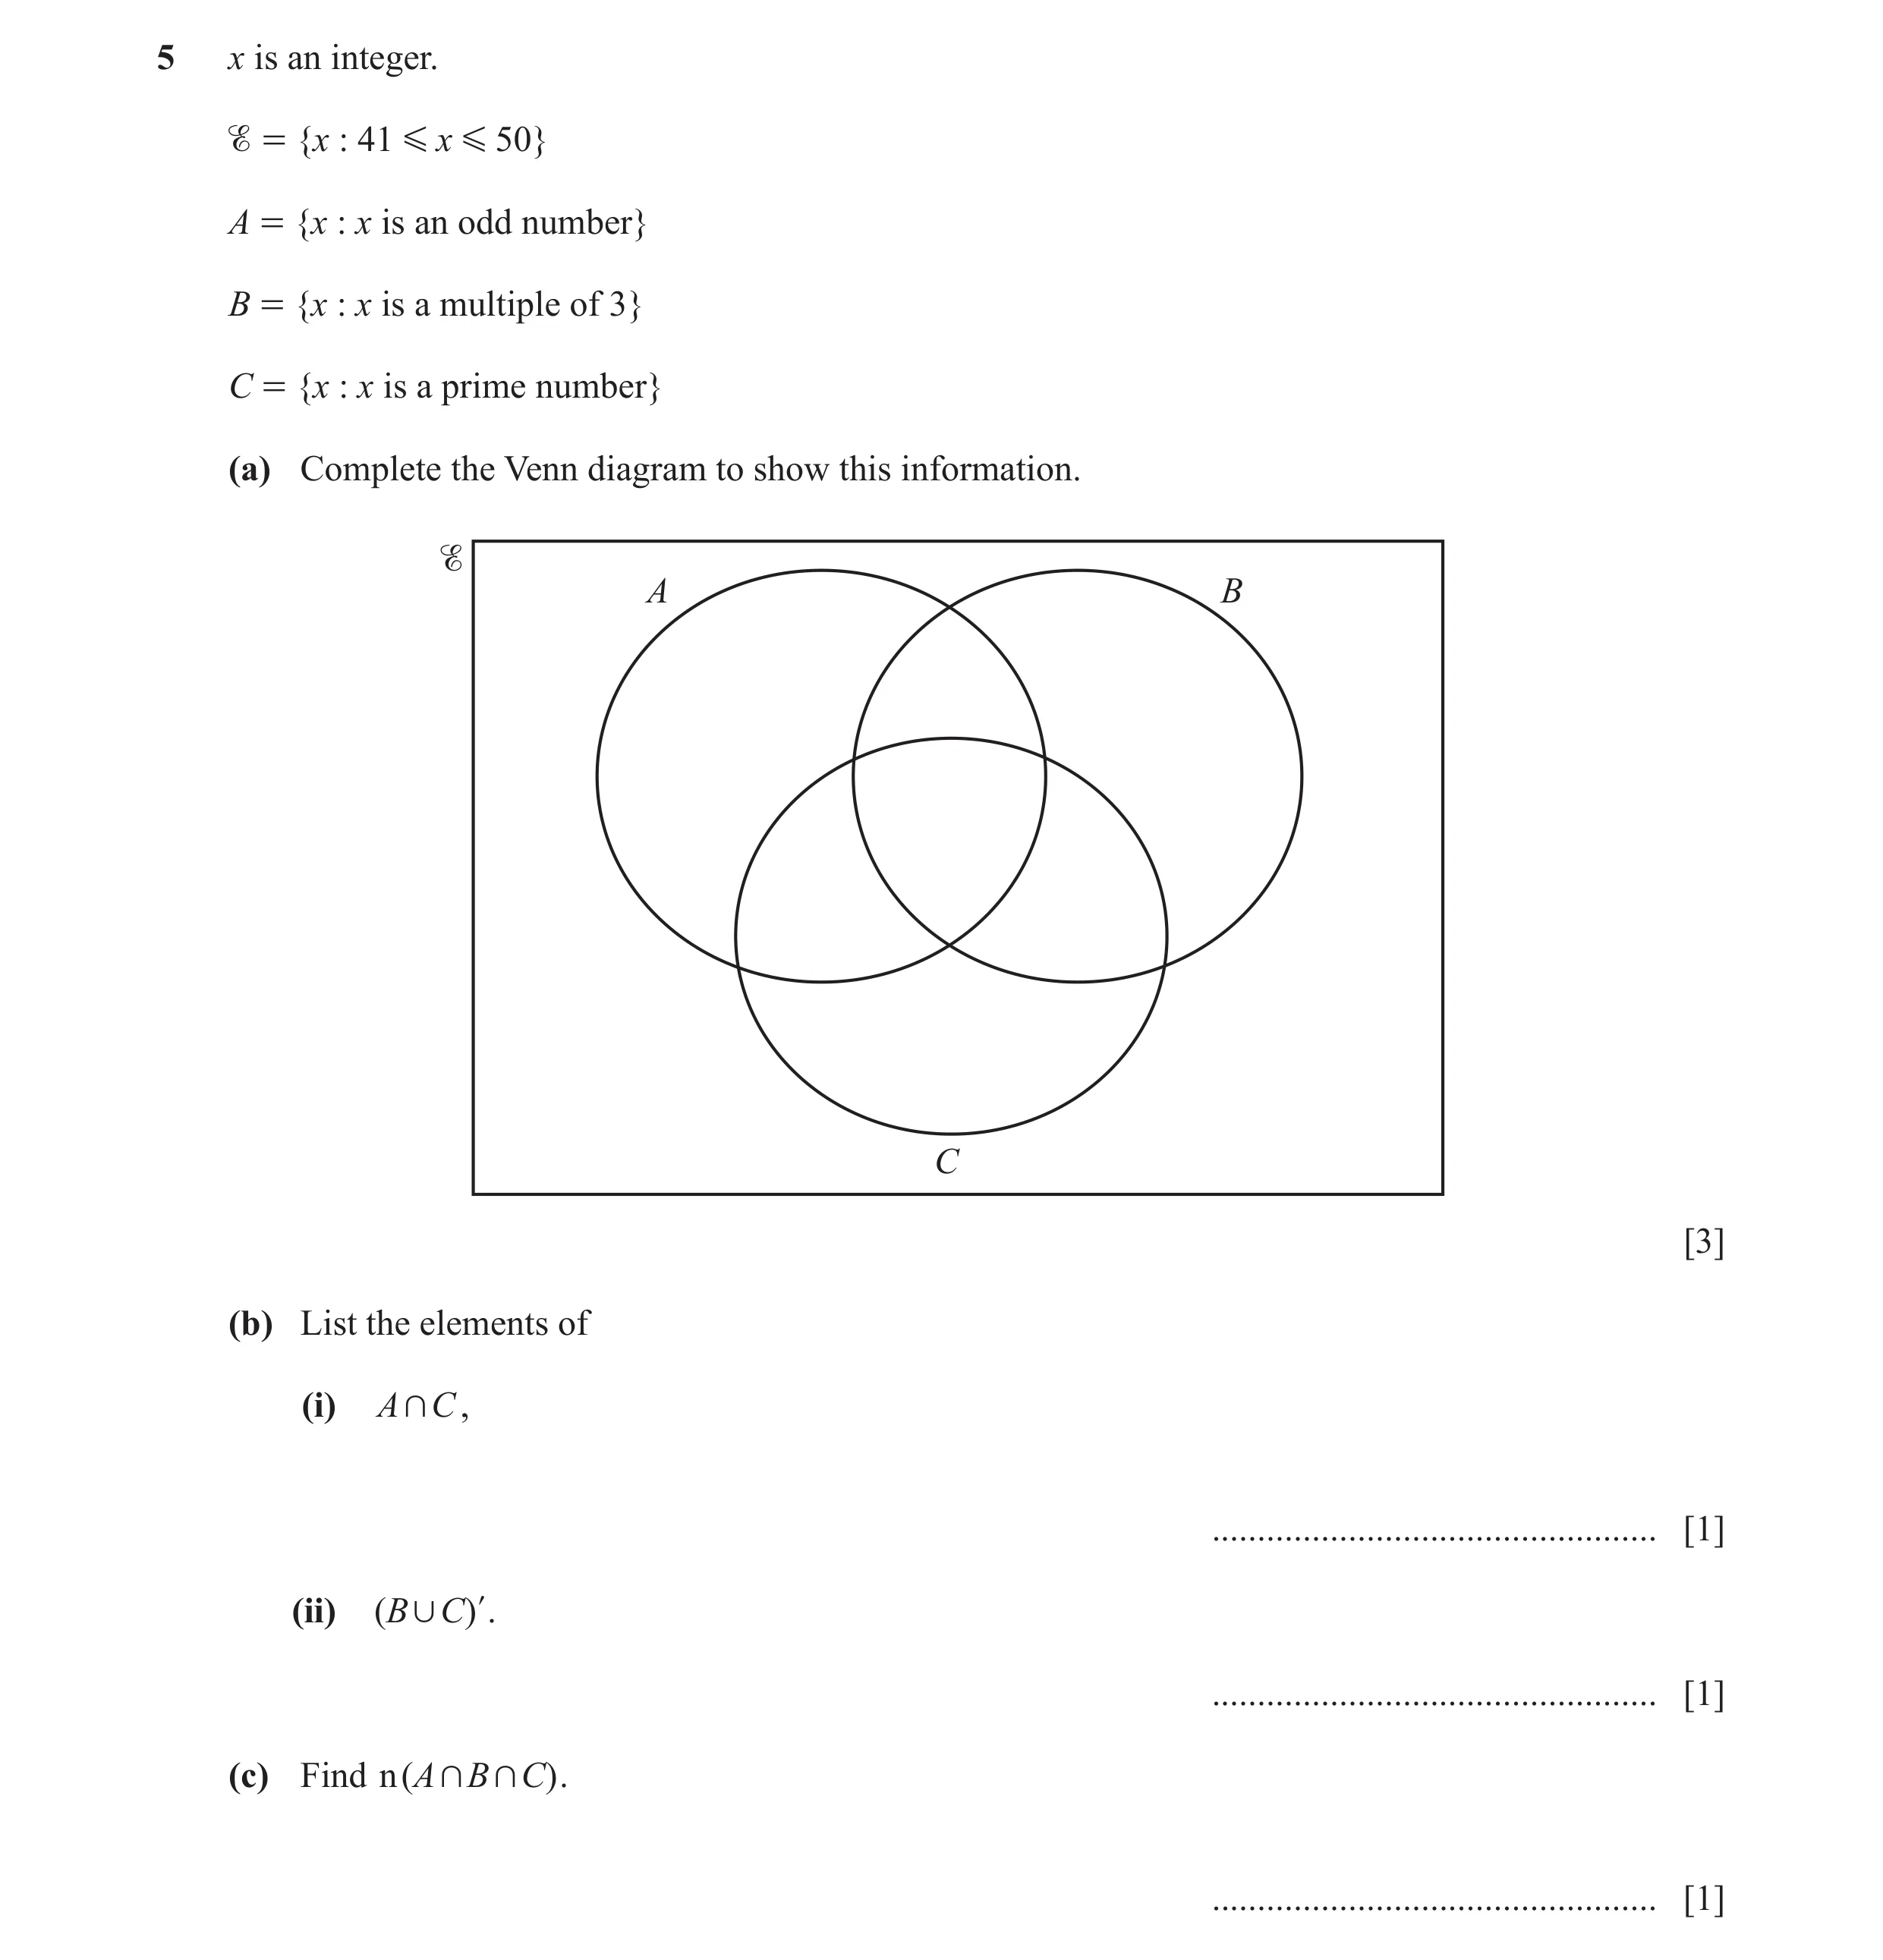
5 x is an integer. = {x : 41 G x G 50} A = {x : x is an odd number} B = {x : x is a multiple of 3} C = {x : x is a prime number} (a) Complete the Venn diagram to show this information. A B C [3] (b) List the elements of (i) A + C , … [1] (ii) ( B , C) l. … [1] (c) Find n ( A + B + C) . … [1]
6 marks
Mark scheme: 5(a) Correct Venn diagram 3 B2 for 8 or 9 numbers correct or B1 for 6 or 7 numbers correct 5(b)(i) 41, 43, 47 1 FT their Venn diagram 5(b)(ii) 44, 46, 49, 50 1 FT their Venn diagram 5(c) 0 1 FT their Venn diagram
This question in 0580/41 May/June 2020
Q7 · There are 32 students in a class 0580/41 Oct/Nov 2020
9 (a) There are 32 students in a class. 5 do not study any languages. 15 study German (G). 18 study Spanish (S). G S (i) Complete the Venn diagram to show this information. [2] (ii) A student is chosen at random. Find the probability that the student studies Spanish but not German. … [1] (iii) A student who studies German is chosen at random. Find the probability that this student also studies Spanish. … [1] (b) A bag contains 54 red marbles and some blue marbles. 36% of the marbles in the bag are red. Find the number of blue marbles in the bag. … [2] (c) Another bag contains 15 red beads and 10 yellow beads. Ariana picks a bead at random, records its colour and replaces it in the bag. She then picks another bead at random. (i) Find the probability that she picks two red beads. … [2] (ii) Find the probability that she does not pick two red beads. … [1] (d) A box contains 15 red pencils, 8 yellow pencils and 2 green pencils. Two pencils are picked at random without replacement. Find the probability that at least one pencil is red. … [3]
12 marks
Mark scheme: 9(a)(i) 2 B1 for two correct values 5 Or 9 6 12 B1 5 outside and total in G = 15 and total in G S S = 18 9(a)(ii) 3 1 their 12 oe FT 8 32 9(a)(iii) 2 1 their 6 oe FT 5 15 9(b) 96 2 36 54 54 M1 for = oe or 36 = × 100 64 x ( 54 + b ) oe If 0 scored SC1 for answer 150 9(c)(i) 9 2 15 15 oe M1 for × oe 25 25 25 9(c)(ii) 16 1 FT 1 – their (c)(i) oe 25 9(d) 17 3 10 9 oe M2 for 1 − × oe 20 25 24 15 14 15 8 15 2 8 15 or for × + × + × + × 25 24 25 24 25 24 25 24 2 15 + × oe 25 24 or M1 for one correct relevant product
This question in 0580/41 Oct/Nov 2020
Q8 · In the Venn diagram, shade the region P l , Q 0580/41 May/June 2021
6 (a) In the Venn diagram, shade the region P l , Q . P Q [1] (b) There are 50 students in a group. 34 have a mobile phone (M ). 39 have a computer (C ). 5 have no mobile phone and no computer. Complete the Venn diagram to show this information. M C … … … … [2] (c) The Venn diagram shows the number of students in a group of 30 who have brothers (B ), sisters (S ) or cousins (C ). B S 2 2 5 1 3 7 8 2 C (i) Write down the number of students who have brothers. … [1] (ii) Write down the number of students who have cousins but do not have sisters. … [1] (iii) Find n ( B , S , C ) l. … [1] (iv) Use set notation to describe the set of students who have both cousins and sisters but do not have brothers. … [1] (v) One student is picked at random from the 30 students. Find the probability that this student has cousins. … [1] (vi) Two students are picked at random from the students who have cousins. Calculate the probability that both these students have brothers. … [3] (vii) One student is picked at random from the 30 students. Event A This student has sisters. Event B This student has cousins but does not have brothers. Explain why event A and event B are equally likely. … … [1]
12 marks
Mark scheme: 6(a) 1 6(b) 2 B1 for 2 or 3 correct elements or M1 for 34 – x , x and 39 – x correctly placed 28 11 on diagram and x = 28 6 5 6(c)(i) 8 1 6(c)(ii) 11 1 6(c)(iii) 2 1 6(c)(iv) C ∩ S ∩ B′ oe 1 6(c)(v) 19 1 oe 30 6(c)(vi) 2 3 4 3 oe M2 for × 57 19 18 4 or M1 for seen 19 6(c)(vii) Equal numbers 15 1 15 or equal probability oe 30
This question in 0580/41 May/June 2021
Q9 · In a class of 24 students, 18 students like homework (H ), 15 students like tests (T )… 0580/43 May/June 2021
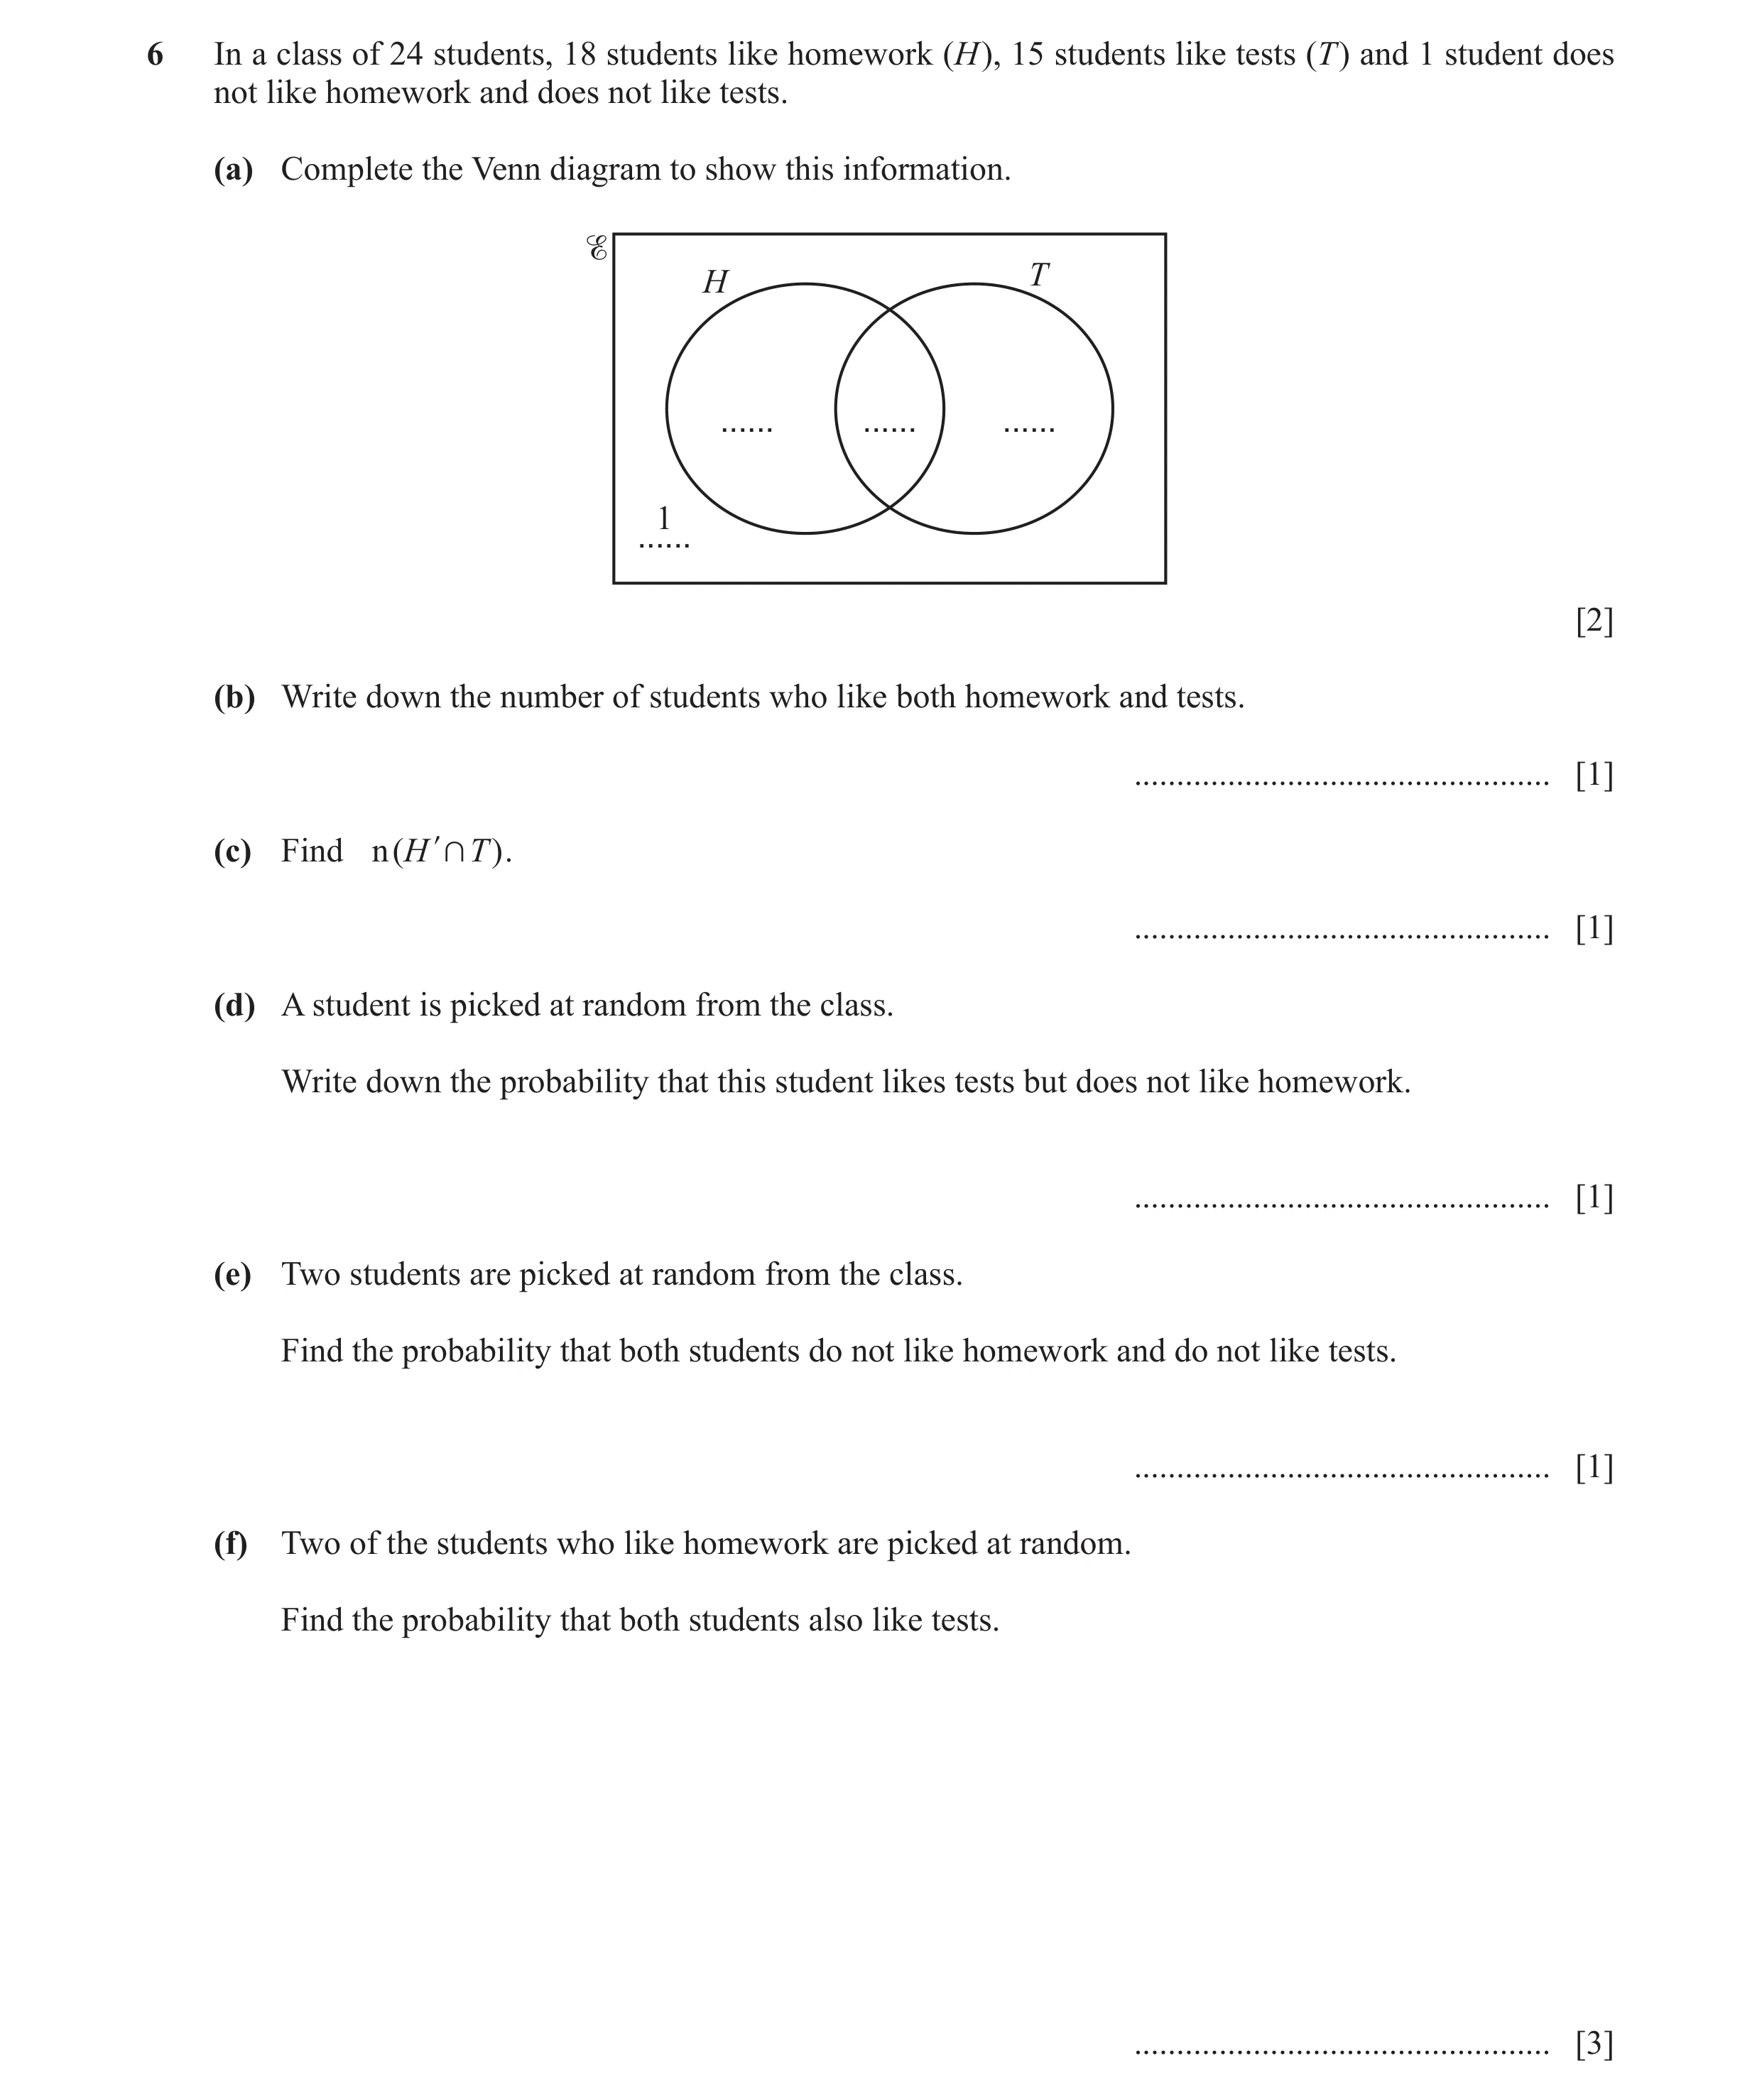
6 In a class of 24 students, 18 students like homework (H ), 15 students like tests (T ) and 1 student does not like homework and does not like tests. (a) Complete the Venn diagram to show this information. H T … … … 1 … [2] (b) Write down the number of students who like both homework and tests. … [1] (c) Find n (H l + T ) . … [1] (d) A student is picked at random from the class. Write down the probability that this student likes tests but does not like homework. … [1] (e) Two students are picked at random from the class. Find the probability that both students do not like homework and do not like tests. … [1] (f) Two of the students who like homework are picked at random. Find the probability that both students also like tests. … [3]
9 marks
Mark scheme: 6(a) 2 i.e. 8, 10 and 5 correctly placed T H B1 for 10 correctly placed or M1 for 18 – x , x and 15 – x correctly 8 10 5 placed on diagram and x = 10 seen 1 6(b) 10 1 FT their Venn diagram 6(c) 5 1 FT their Venn diagram 6(d) 5 1 FT their 5 on the Venn diagram oe 24 6(e) 0 1 6(f) 5 3 their10 their 9 oe M2 for × 17 18 17 their10 their 9 or B1FT for or seen 18 17 25 After 0 scored, SC1 for answer oe 81
This question in 0580/43 May/June 2021
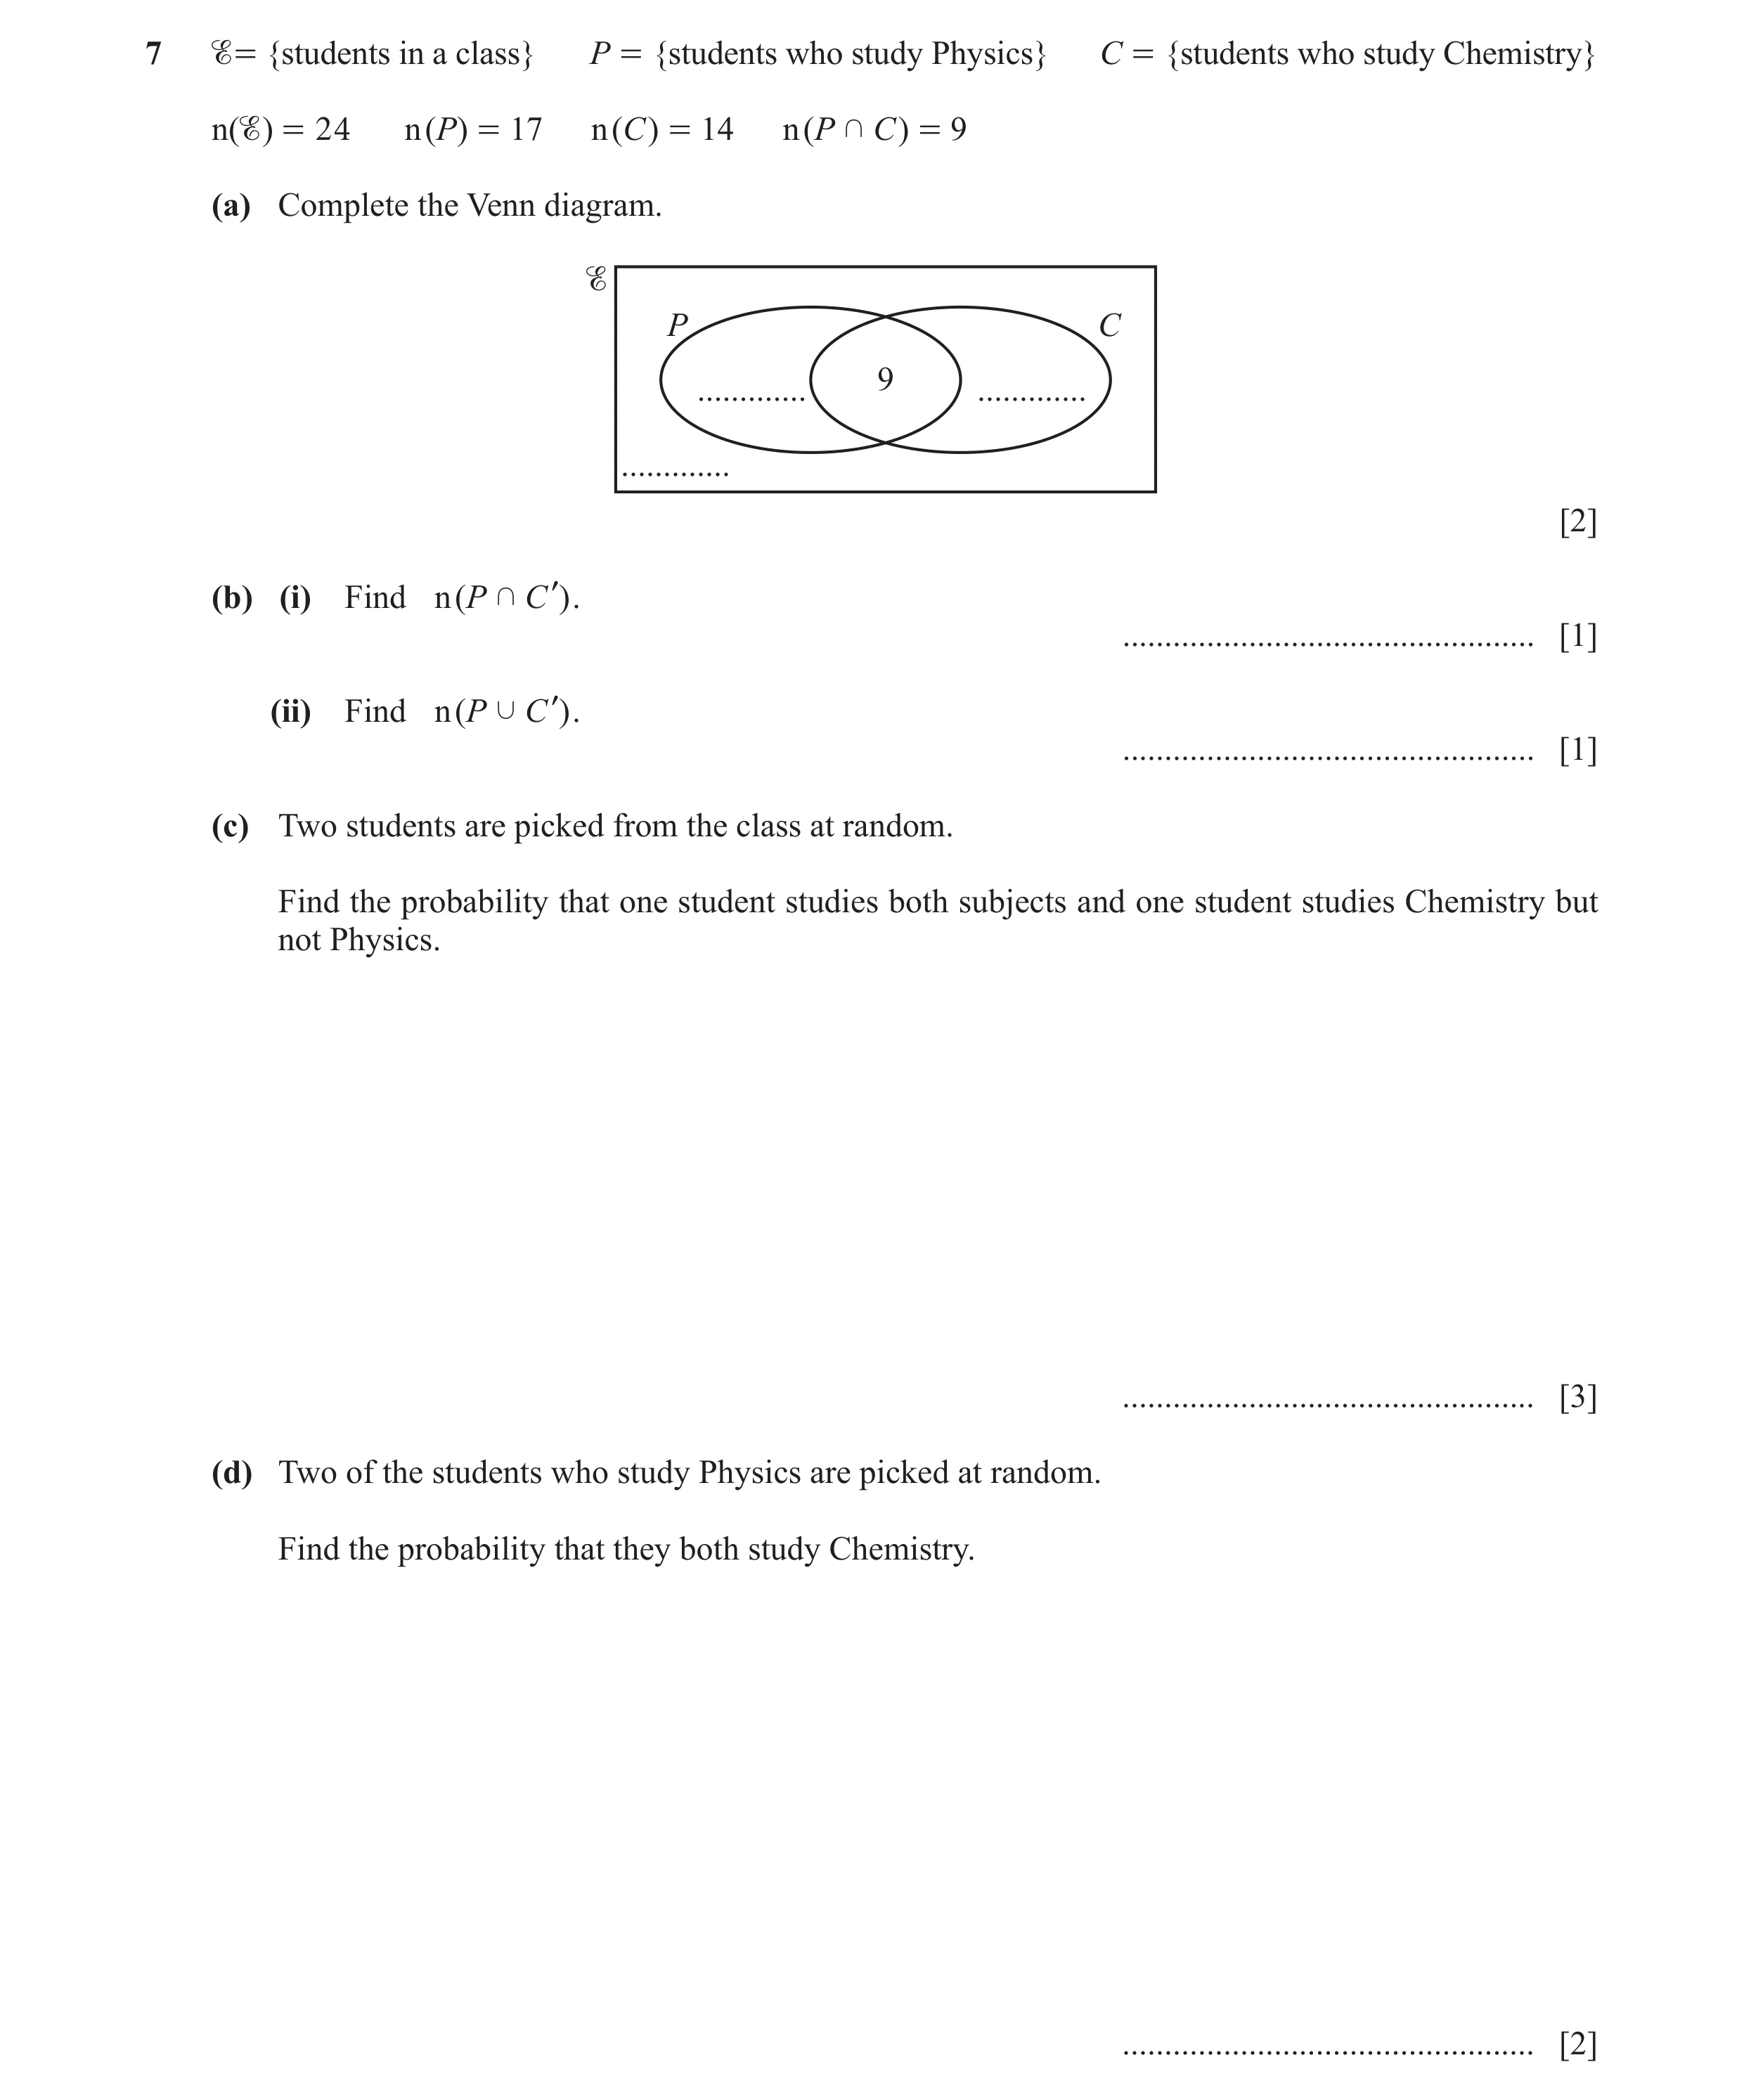
Q10 · = {students in a class} P = {students who study Physics} C = {students who study… 0580/42 Feb/March 2023
7 = {students in a class} P = {students who study Physics} C = {students who study Chemistry} n() = 24 n ( P) = 17 n ( C ) = 14 n ( P k C ) = 9 (a) Complete the Venn diagram. P C 9 … … … [2] (b) (i) Find n ( P k C l) . … [1] (ii) Find n ( P j C l) . … [1] (c) Two students are picked from the class at random. Find the probability that one student studies both subjects and one student studies Chemistry but not Physics. … [3] (d) Two of the students who study Physics are picked at random. Find the probability that they both study Chemistry. … [2]
9 marks
Mark scheme: 7(a) Completed Venn diagram. 2 B1 for two correct values Ɛ C P 8 [9] 5 2 7(b)(i) 8 1 FT their (a) their 8 dep < 24 7(b)(ii) 19 1 FT their (a) 24 – their 5 dep on positive answer 7(c) 15 3 oe 92 9 their 5 M2 for [2]24 23 oe 9 their 5 their 5 9 or M1 for and or and 24 23 24 23 5 If 0 scored SC1 for answer oe 32 7(d) 9 2 9 oe B1 for seen 34 17
This question in 0580/42 Feb/March 2023
Q11 · The Venn diagram shows set X and set Y 0580/41 May/June 2023
9 (a) The Venn diagram shows set X and set Y. X Y r t h e c a s l (i) List the elements of X. … [1] (ii) Find n ( Y l ) . … [1] (b) In each Venn diagram, shade the required region. P Q P Q P, Q P l+ Q [2] (c) = {positive integers 1 13 } A = {x : x 1 9 } B = {x : x is even} C = {x : x is a multiple of 3} A B C (i) Complete the Venn diagram. [3] (ii) Find n ( Al , ( B + C )) . … [1] Question 10 is printed on the next page.
8 marks
Mark scheme: 9(a)(i) r, l, t, e, a 1 9(a)(ii) 2 1 9(b) 1 1 9(c)(i) Fully correct 3 B2 for 7, 6, or 5 sections correct or B1 for 4, 3 or 2 sections correct 1 2 10 5 4 8 7 6 12 3 11 9 9(c)(ii) 5 1FT strict FT from their diagram
This question in 0580/41 May/June 2023
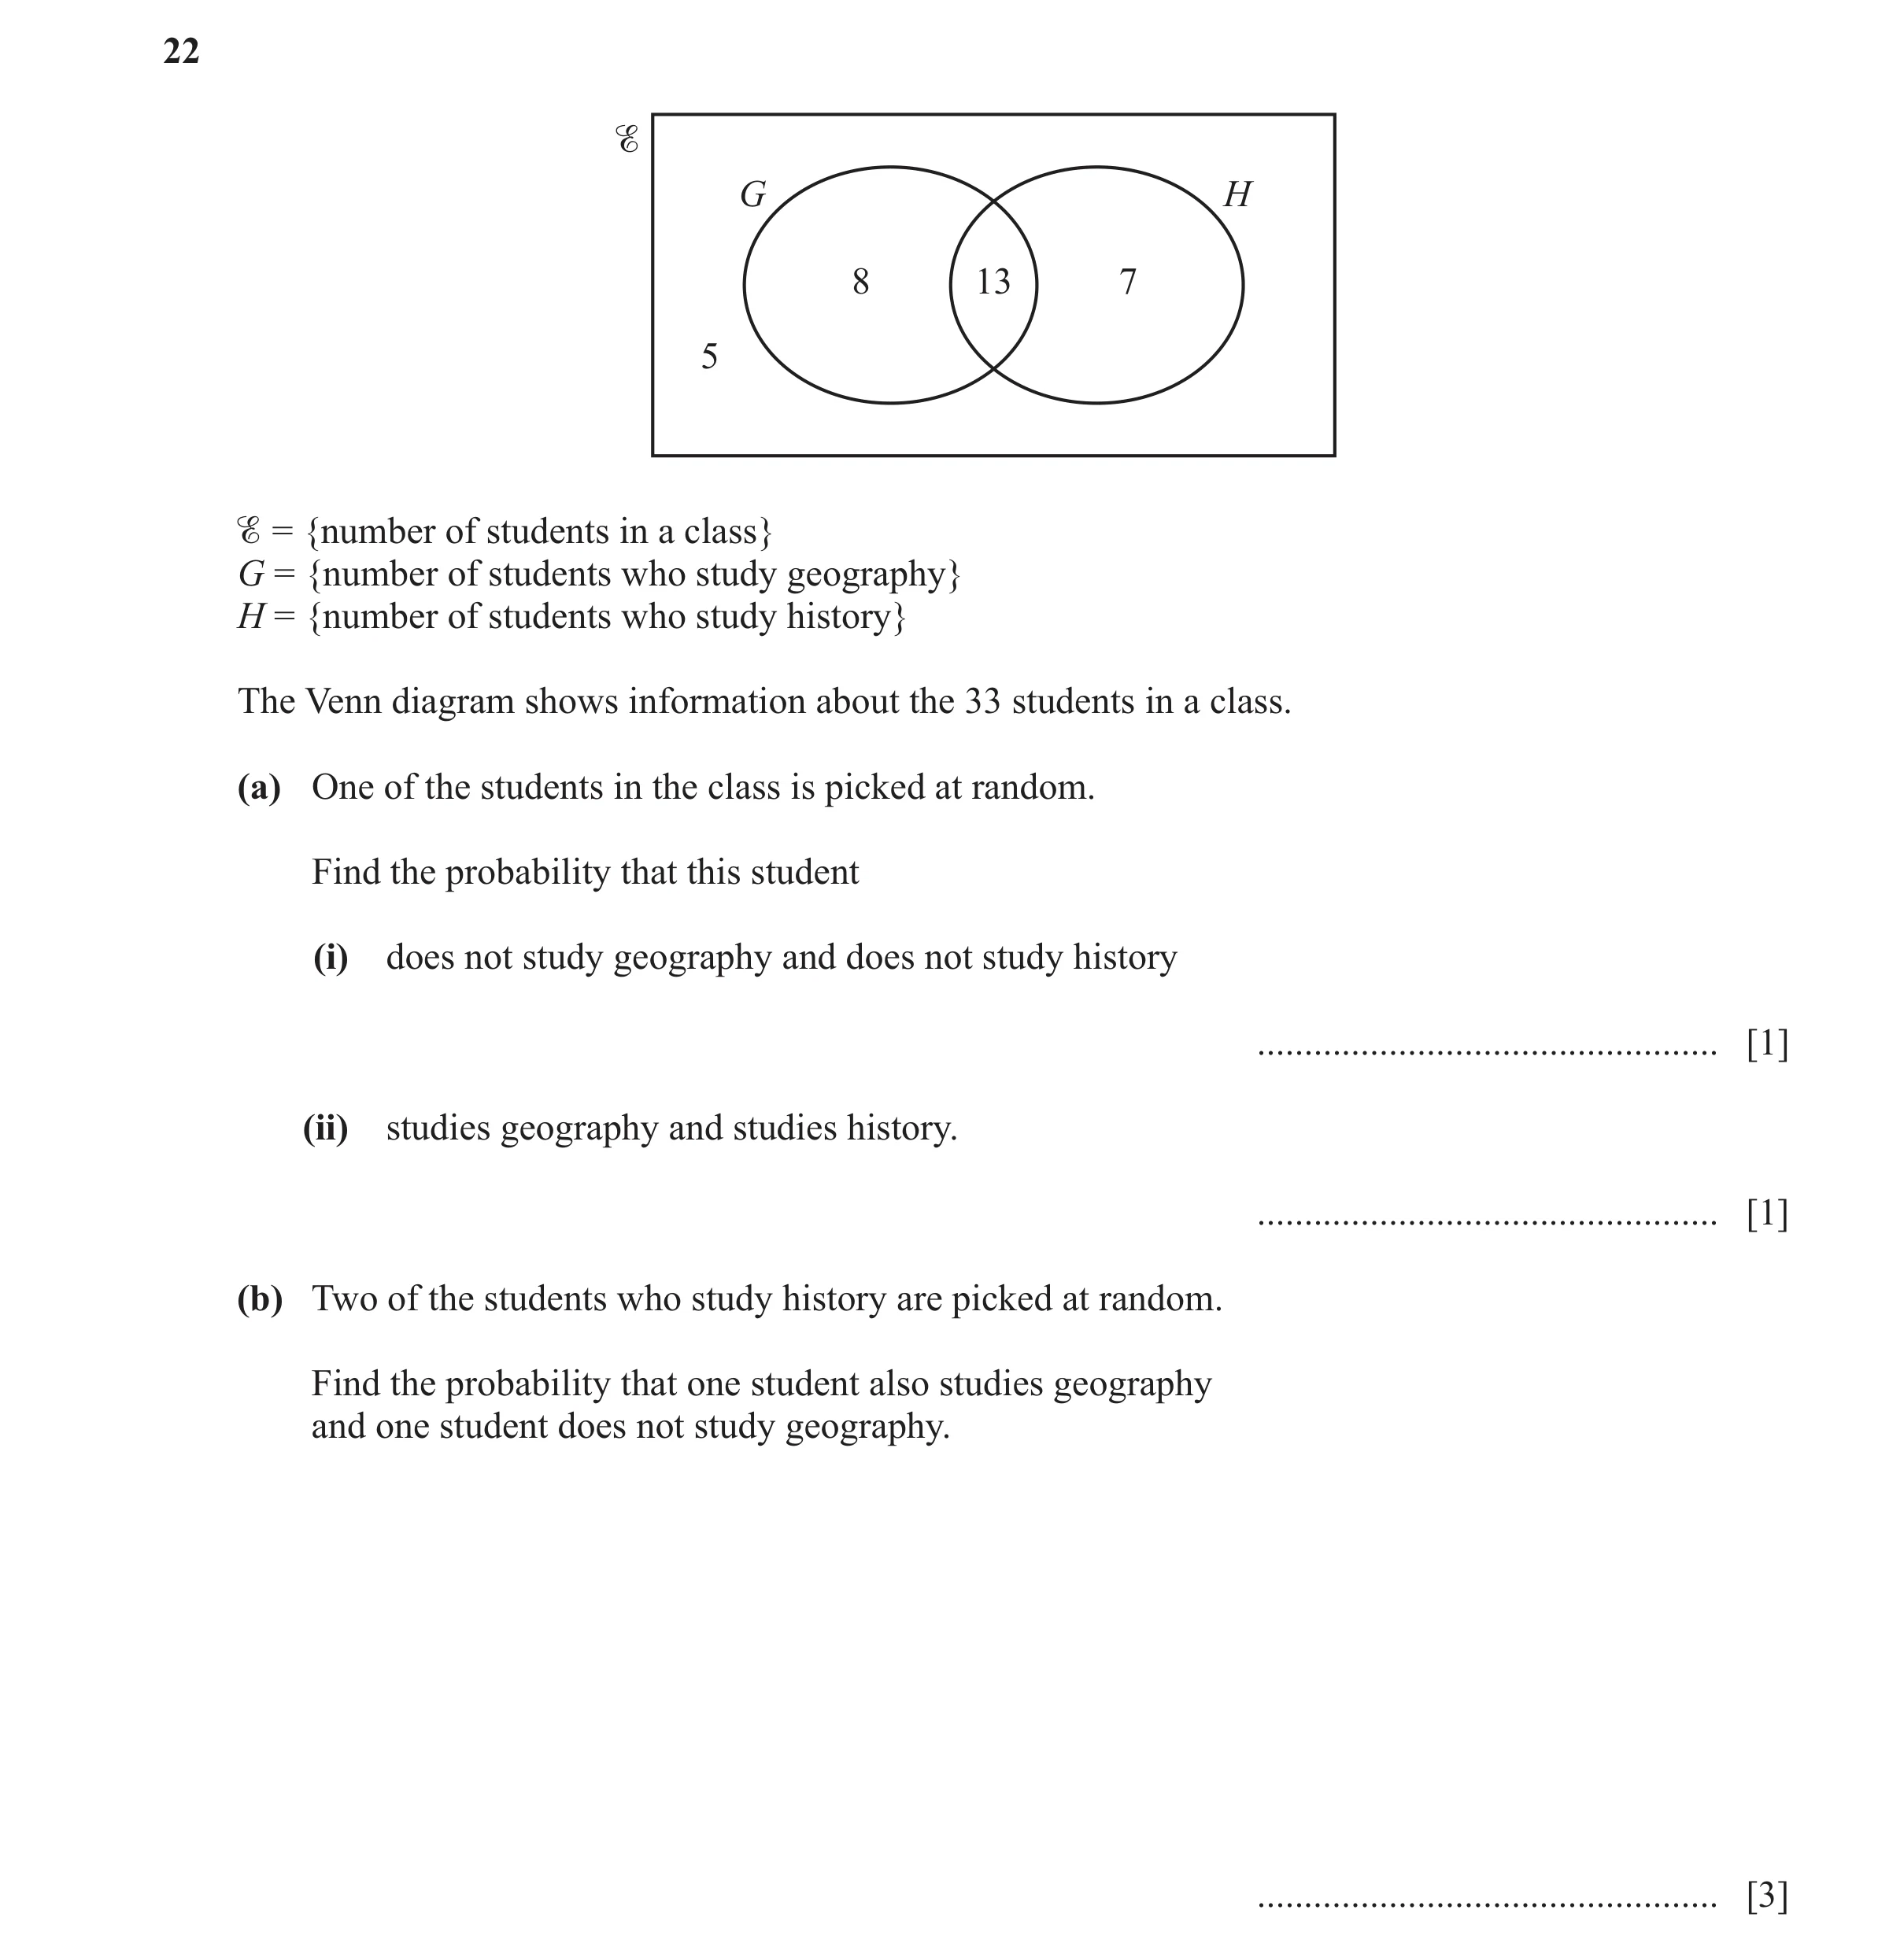
Q12 · % G H 8 13 7 5 % = {number of students in a class} G = {number of students who study… 0580/42 May/June 2025
22 % G H 8 13 7 5 % = {number of students in a class} G = {number of students who study geography} H = {number of students who study history} The Venn diagram shows information about the 33 students in a class. (a) One of the students in the class is picked at random. Find the probability that this student (i) does not study geography and does not study history … [1] (ii) studies geography and studies history. … [1] (b) Two of the students who study history are picked at random. Find the probability that one student also studies geography and one student does not study geography. … [3]
5 marks
Mark scheme: 22(a)(i) 5 1 oe 33 22(a)(ii) 13 1 oe 33 22(b) 91 3 13 7 oe M2 for [2×] oe 190 20 19 13 12 7 6 or for 1 − − oe 20 19 20 19 13 13 7 7 or M1 for or or or oe seen 20 19 20 19 91 If 0 scored, SC1 for answer oe 200
This question in 0580/42 May/June 2025
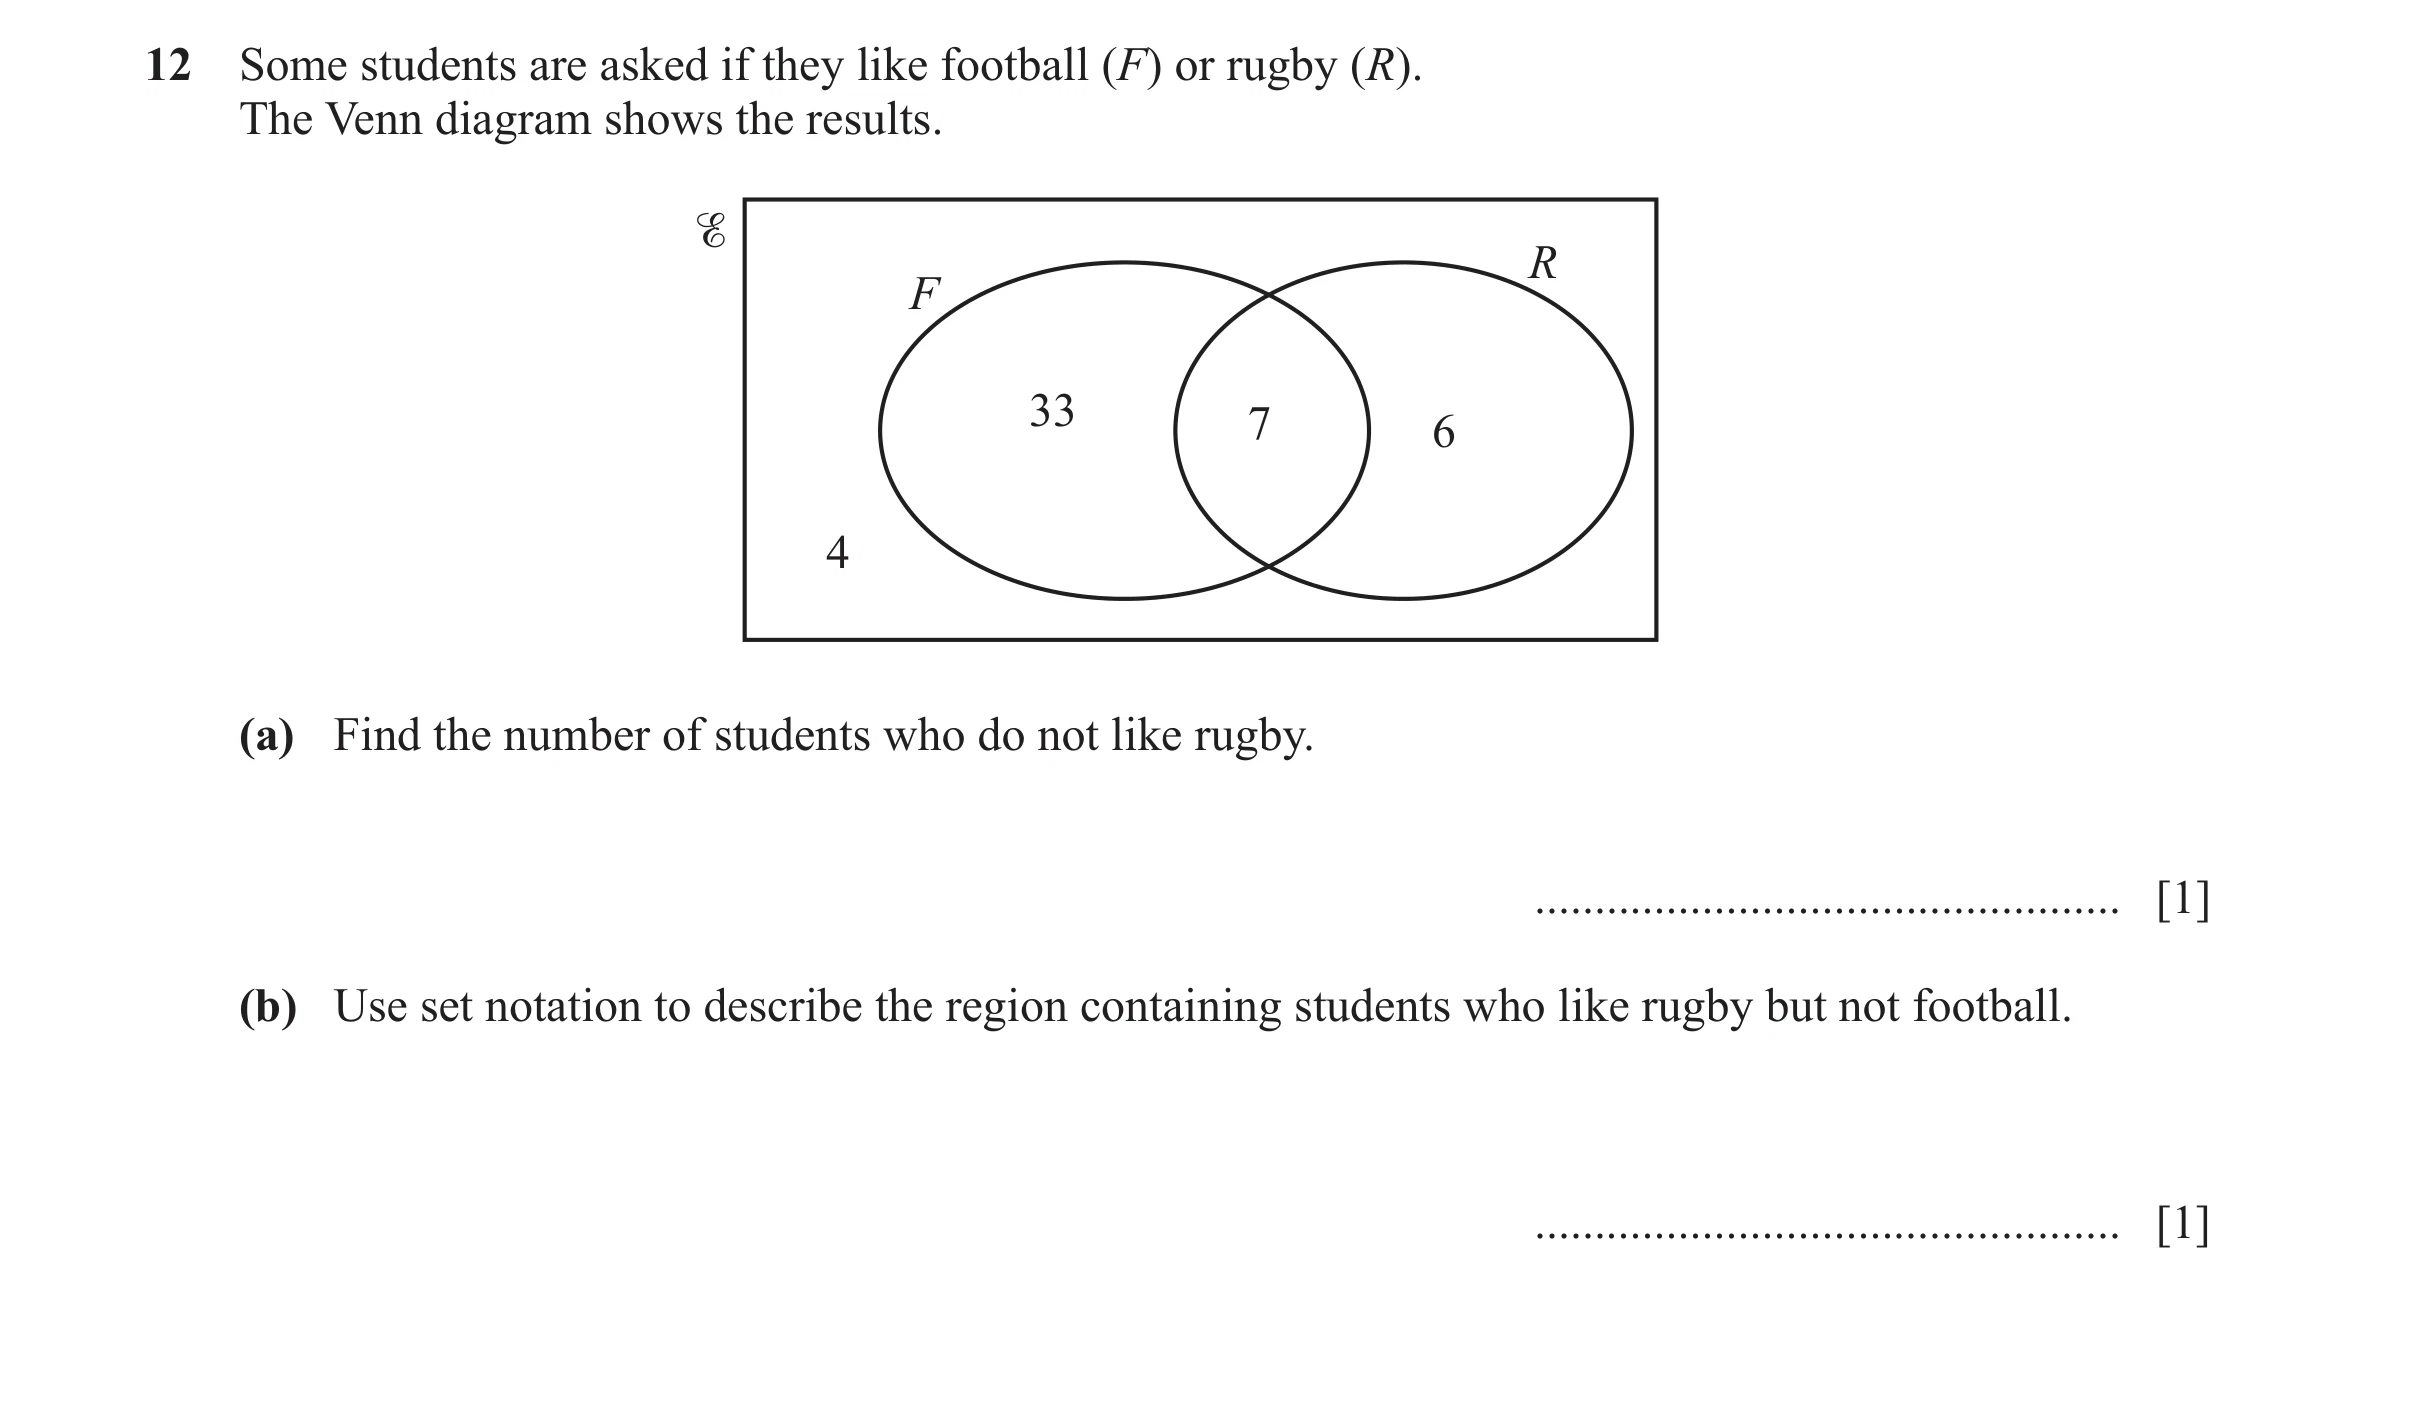
Q13 · Some students are asked if they like football (F) or rugby (R) 0580/41 Oct/Nov 2025
12 Some students are asked if they like football (F) or rugby (R). The Venn diagram shows the results. % R F 33 7 6 4 (a) Find the number of students who do not like rugby. … [1] (b) Use set notation to describe the region containing students who like rugby but not football. … [1]
2 marks
Mark scheme: 12(a) 37 1 12(b) F R oe 1
This question in 0580/41 Oct/Nov 2025
 1 / 17
 2 / 17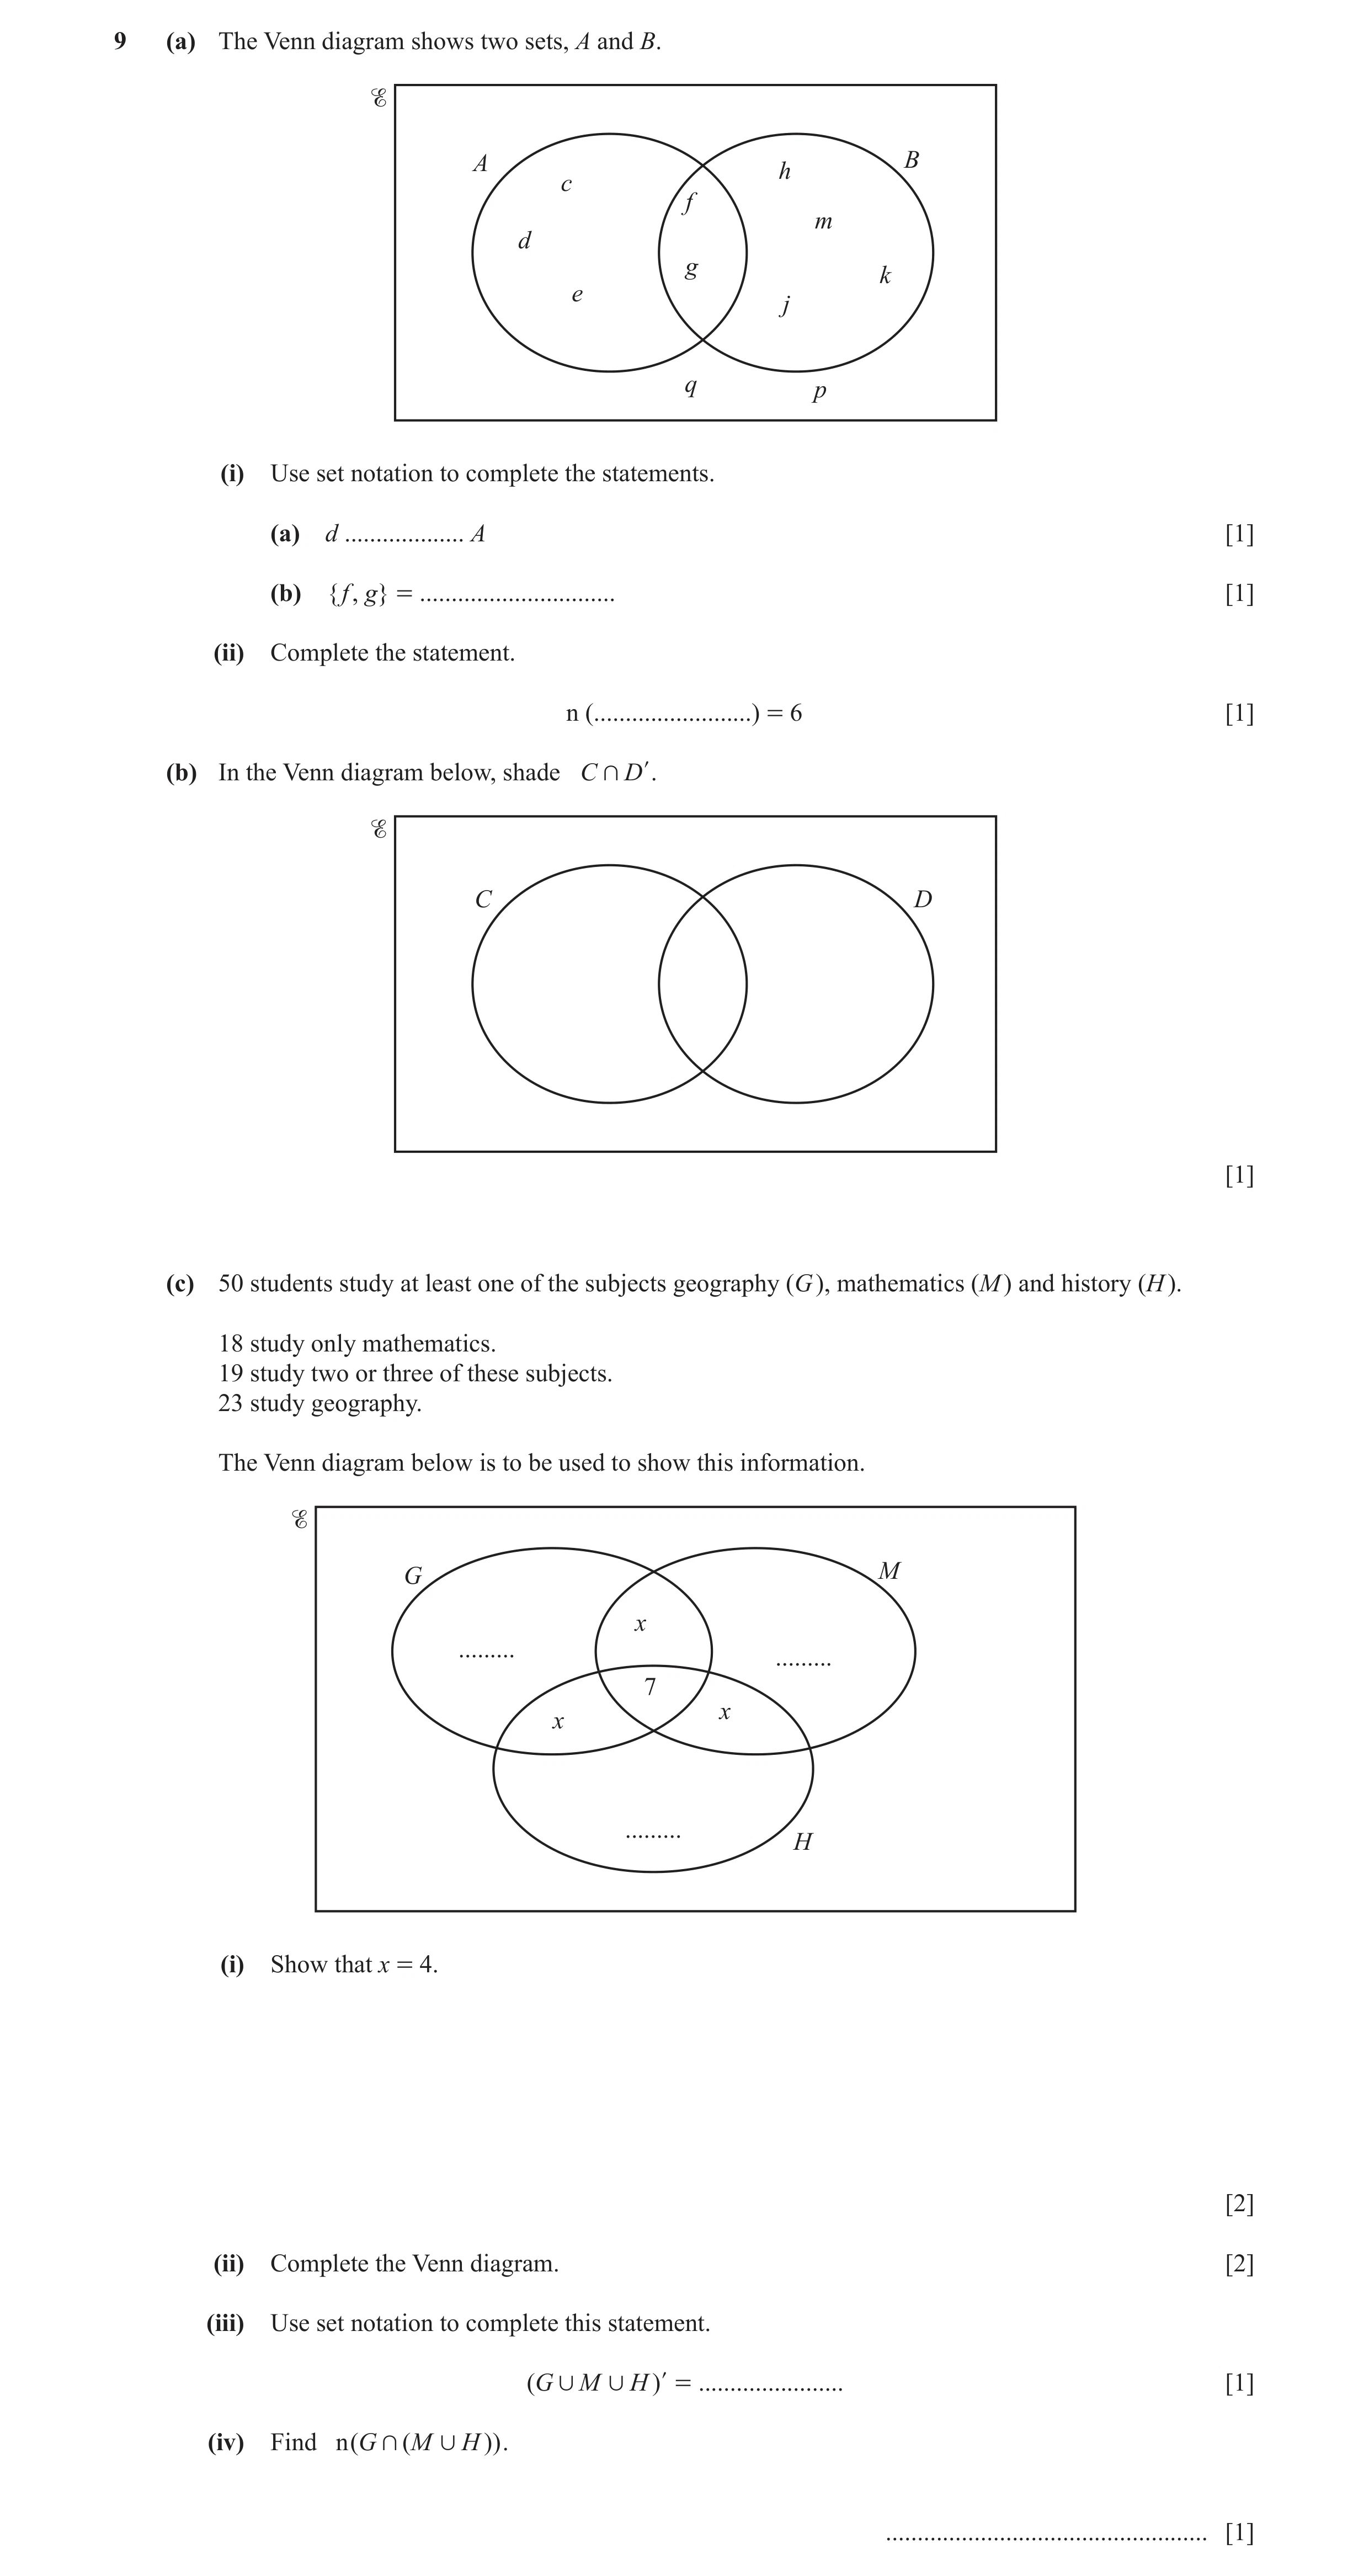
 5 / 17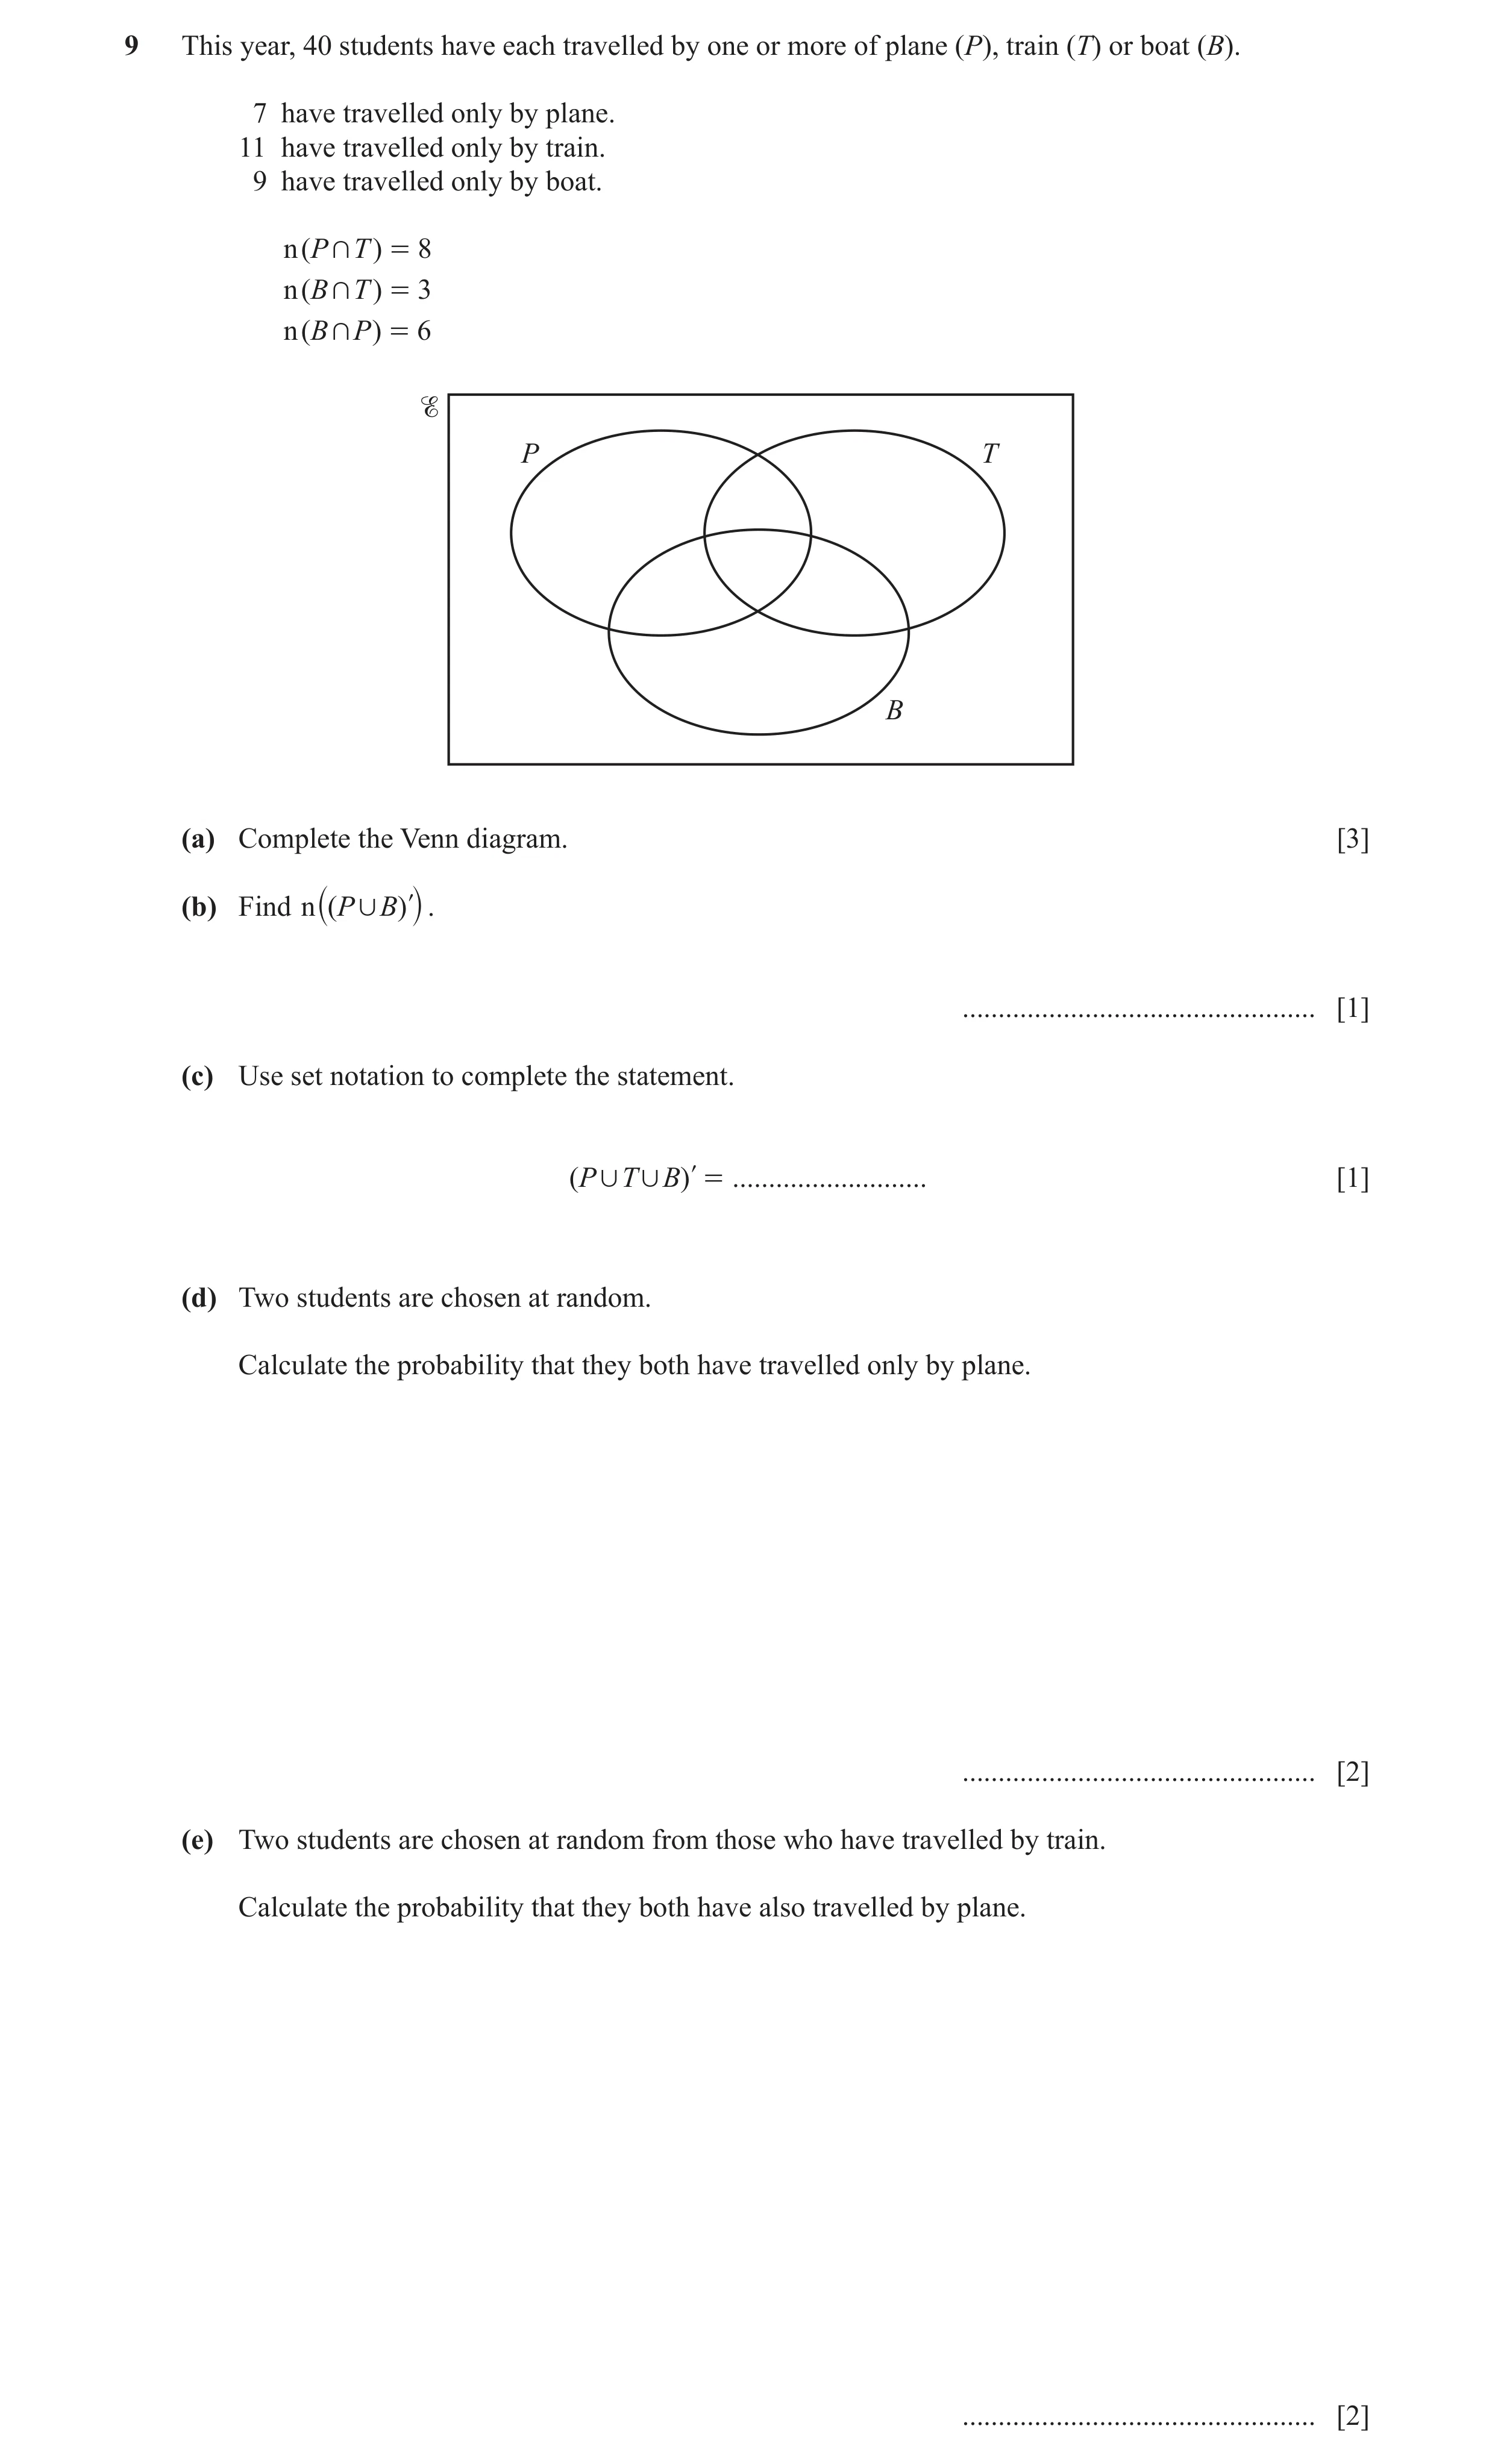
 8 / 17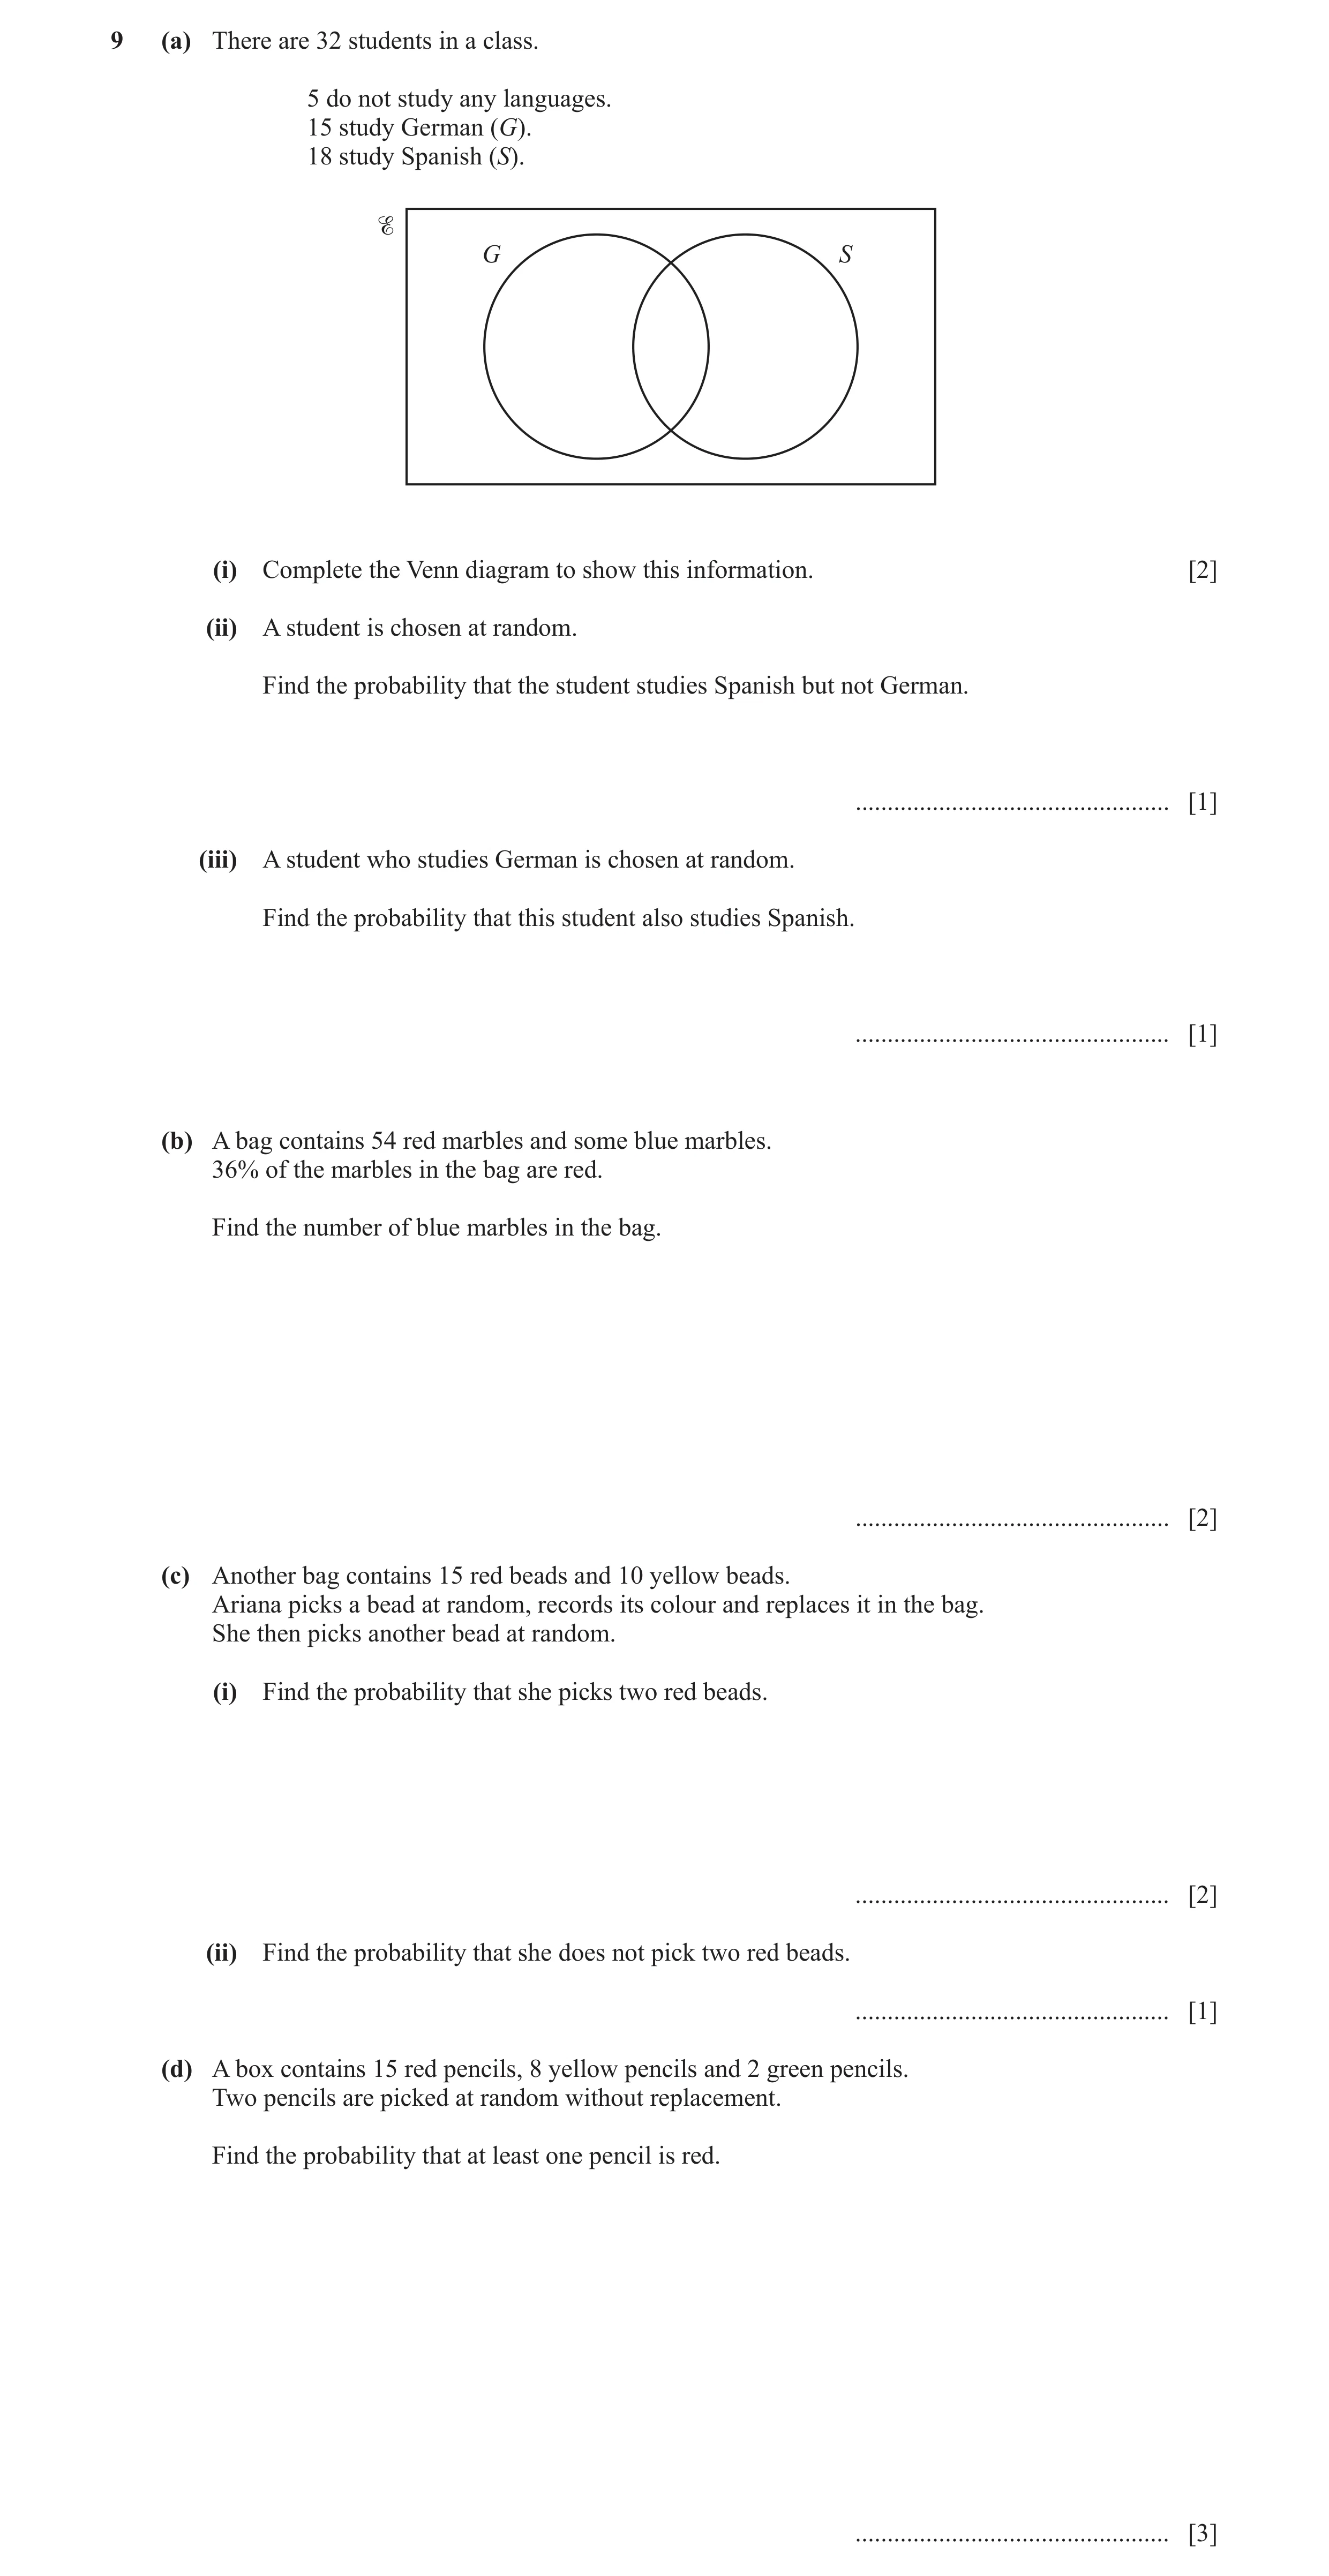
![Question 8: (a) In the Venn diagram, shade the region P l , Q . P Q [1] (b) There are 50 students in a group. 34 have a mobile phone (M ). 39 have a co…](https://img.pastlit.com/crops/3bc86dec-41c7-4584-9063-548c0708b750/q6.webp)
 12 / 17
 13 / 17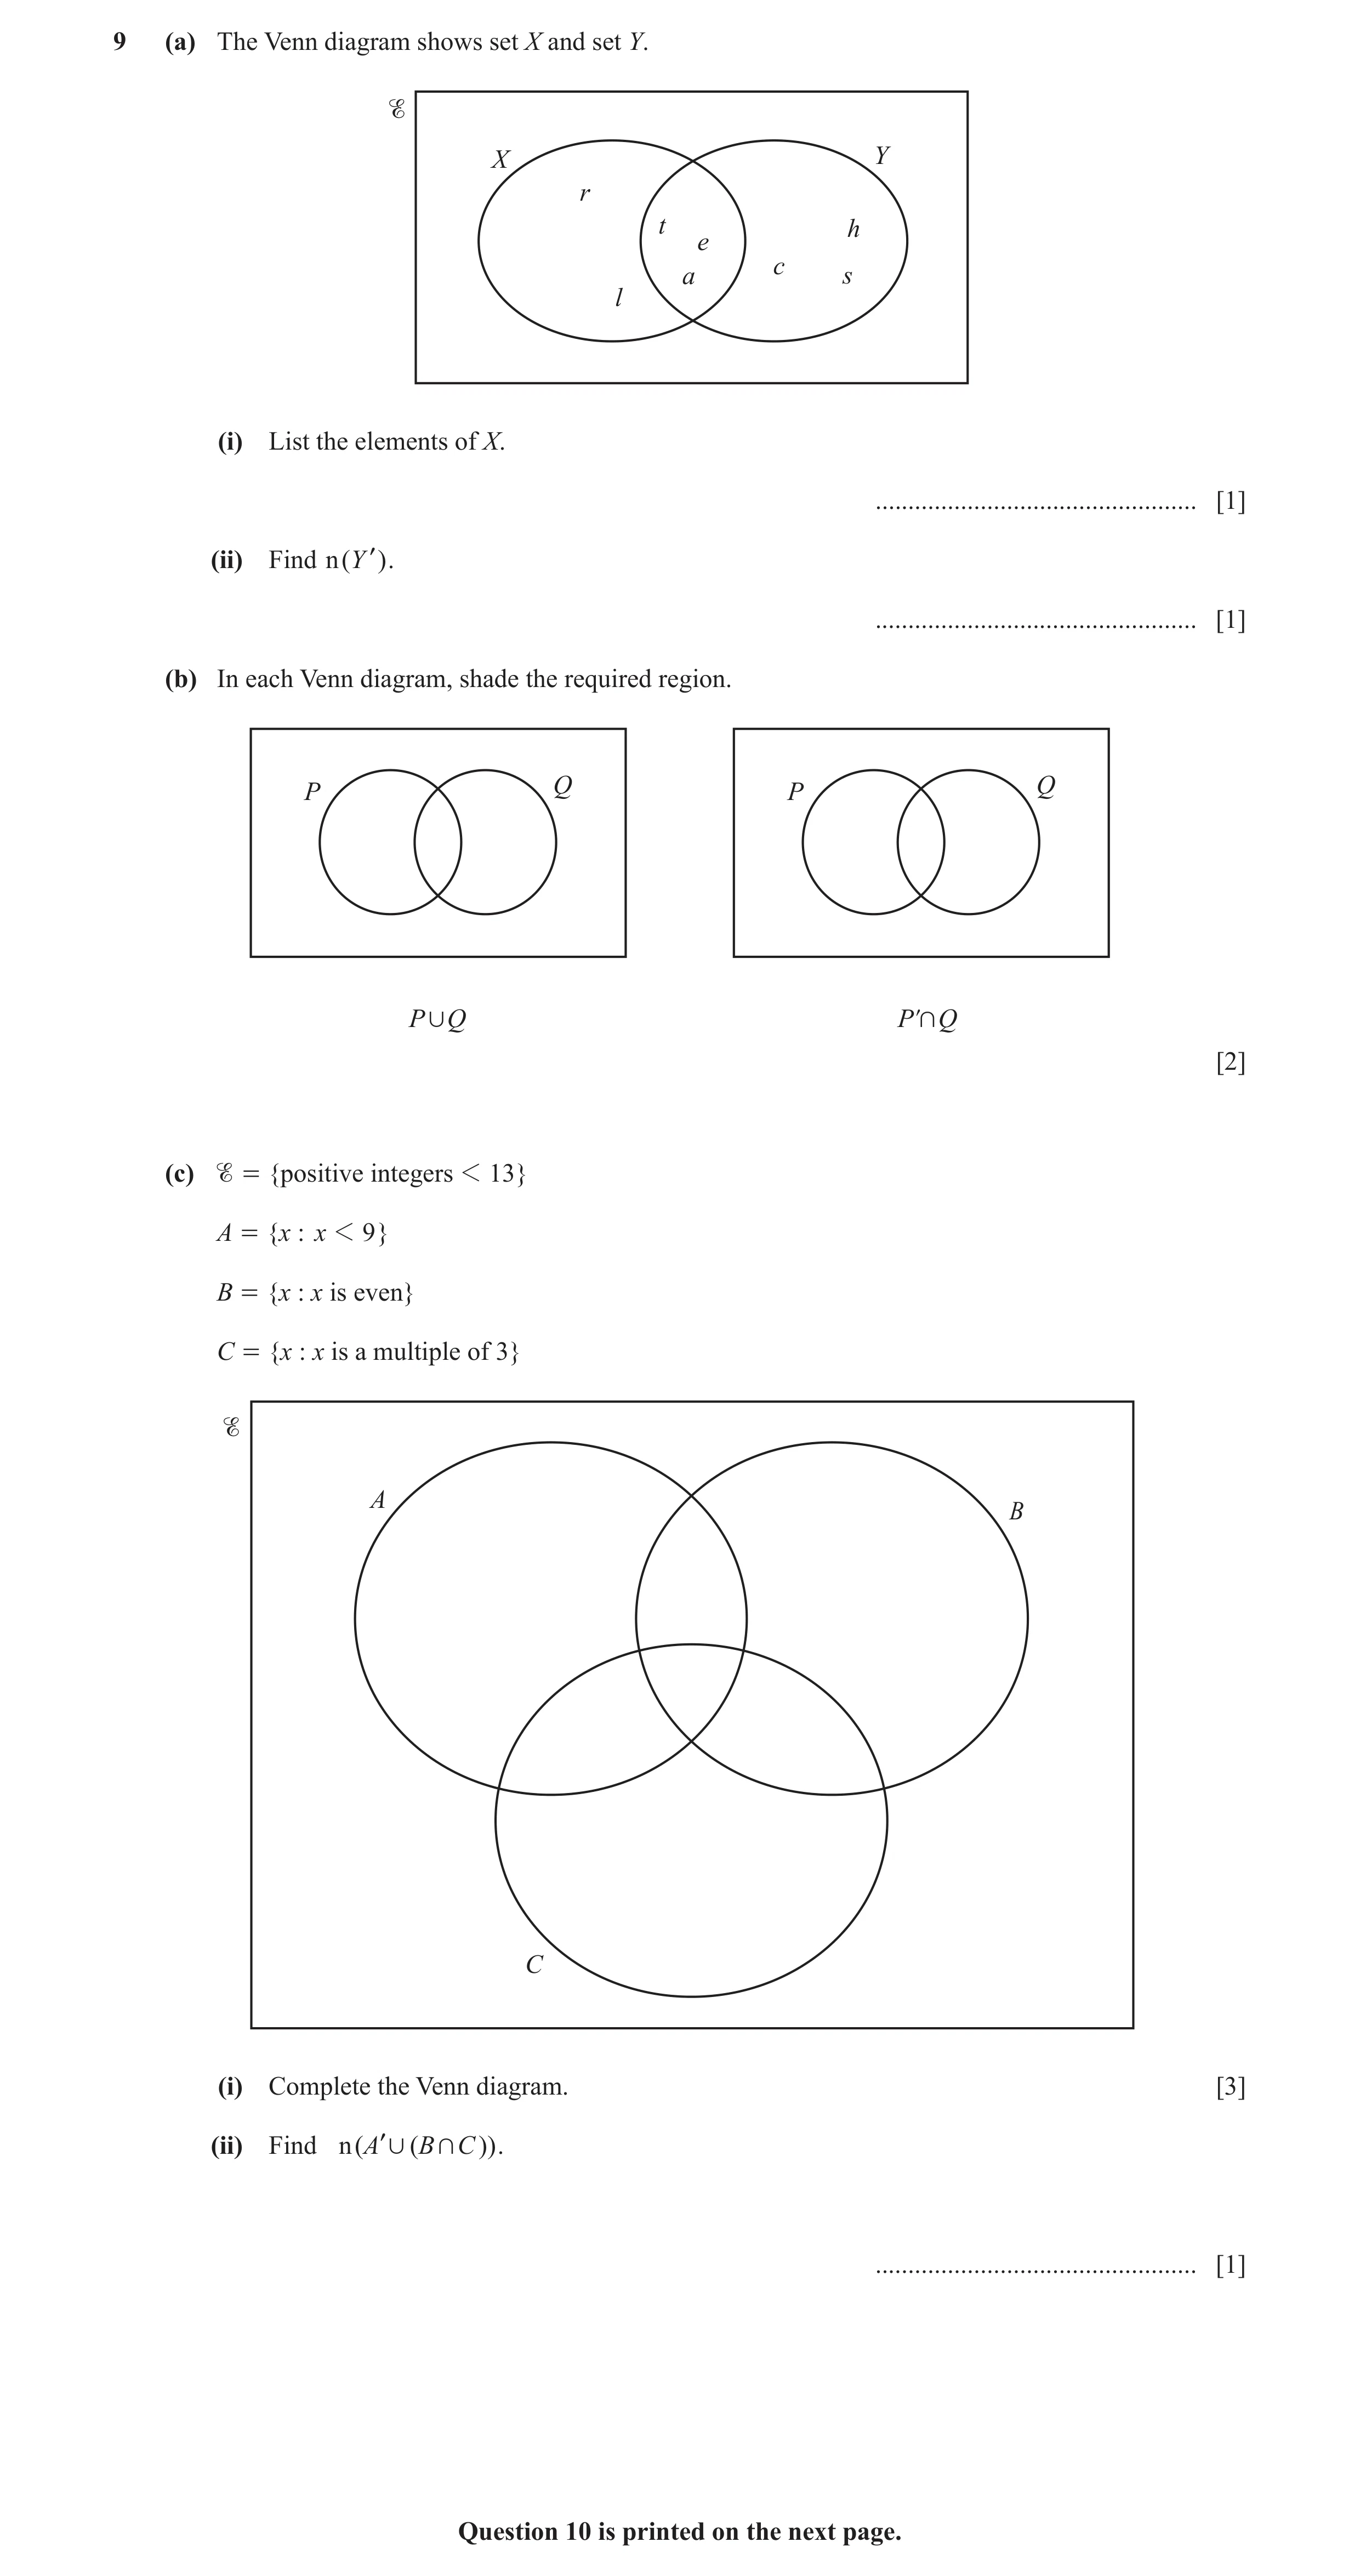
 16 / 17
 17 / 17
 11
11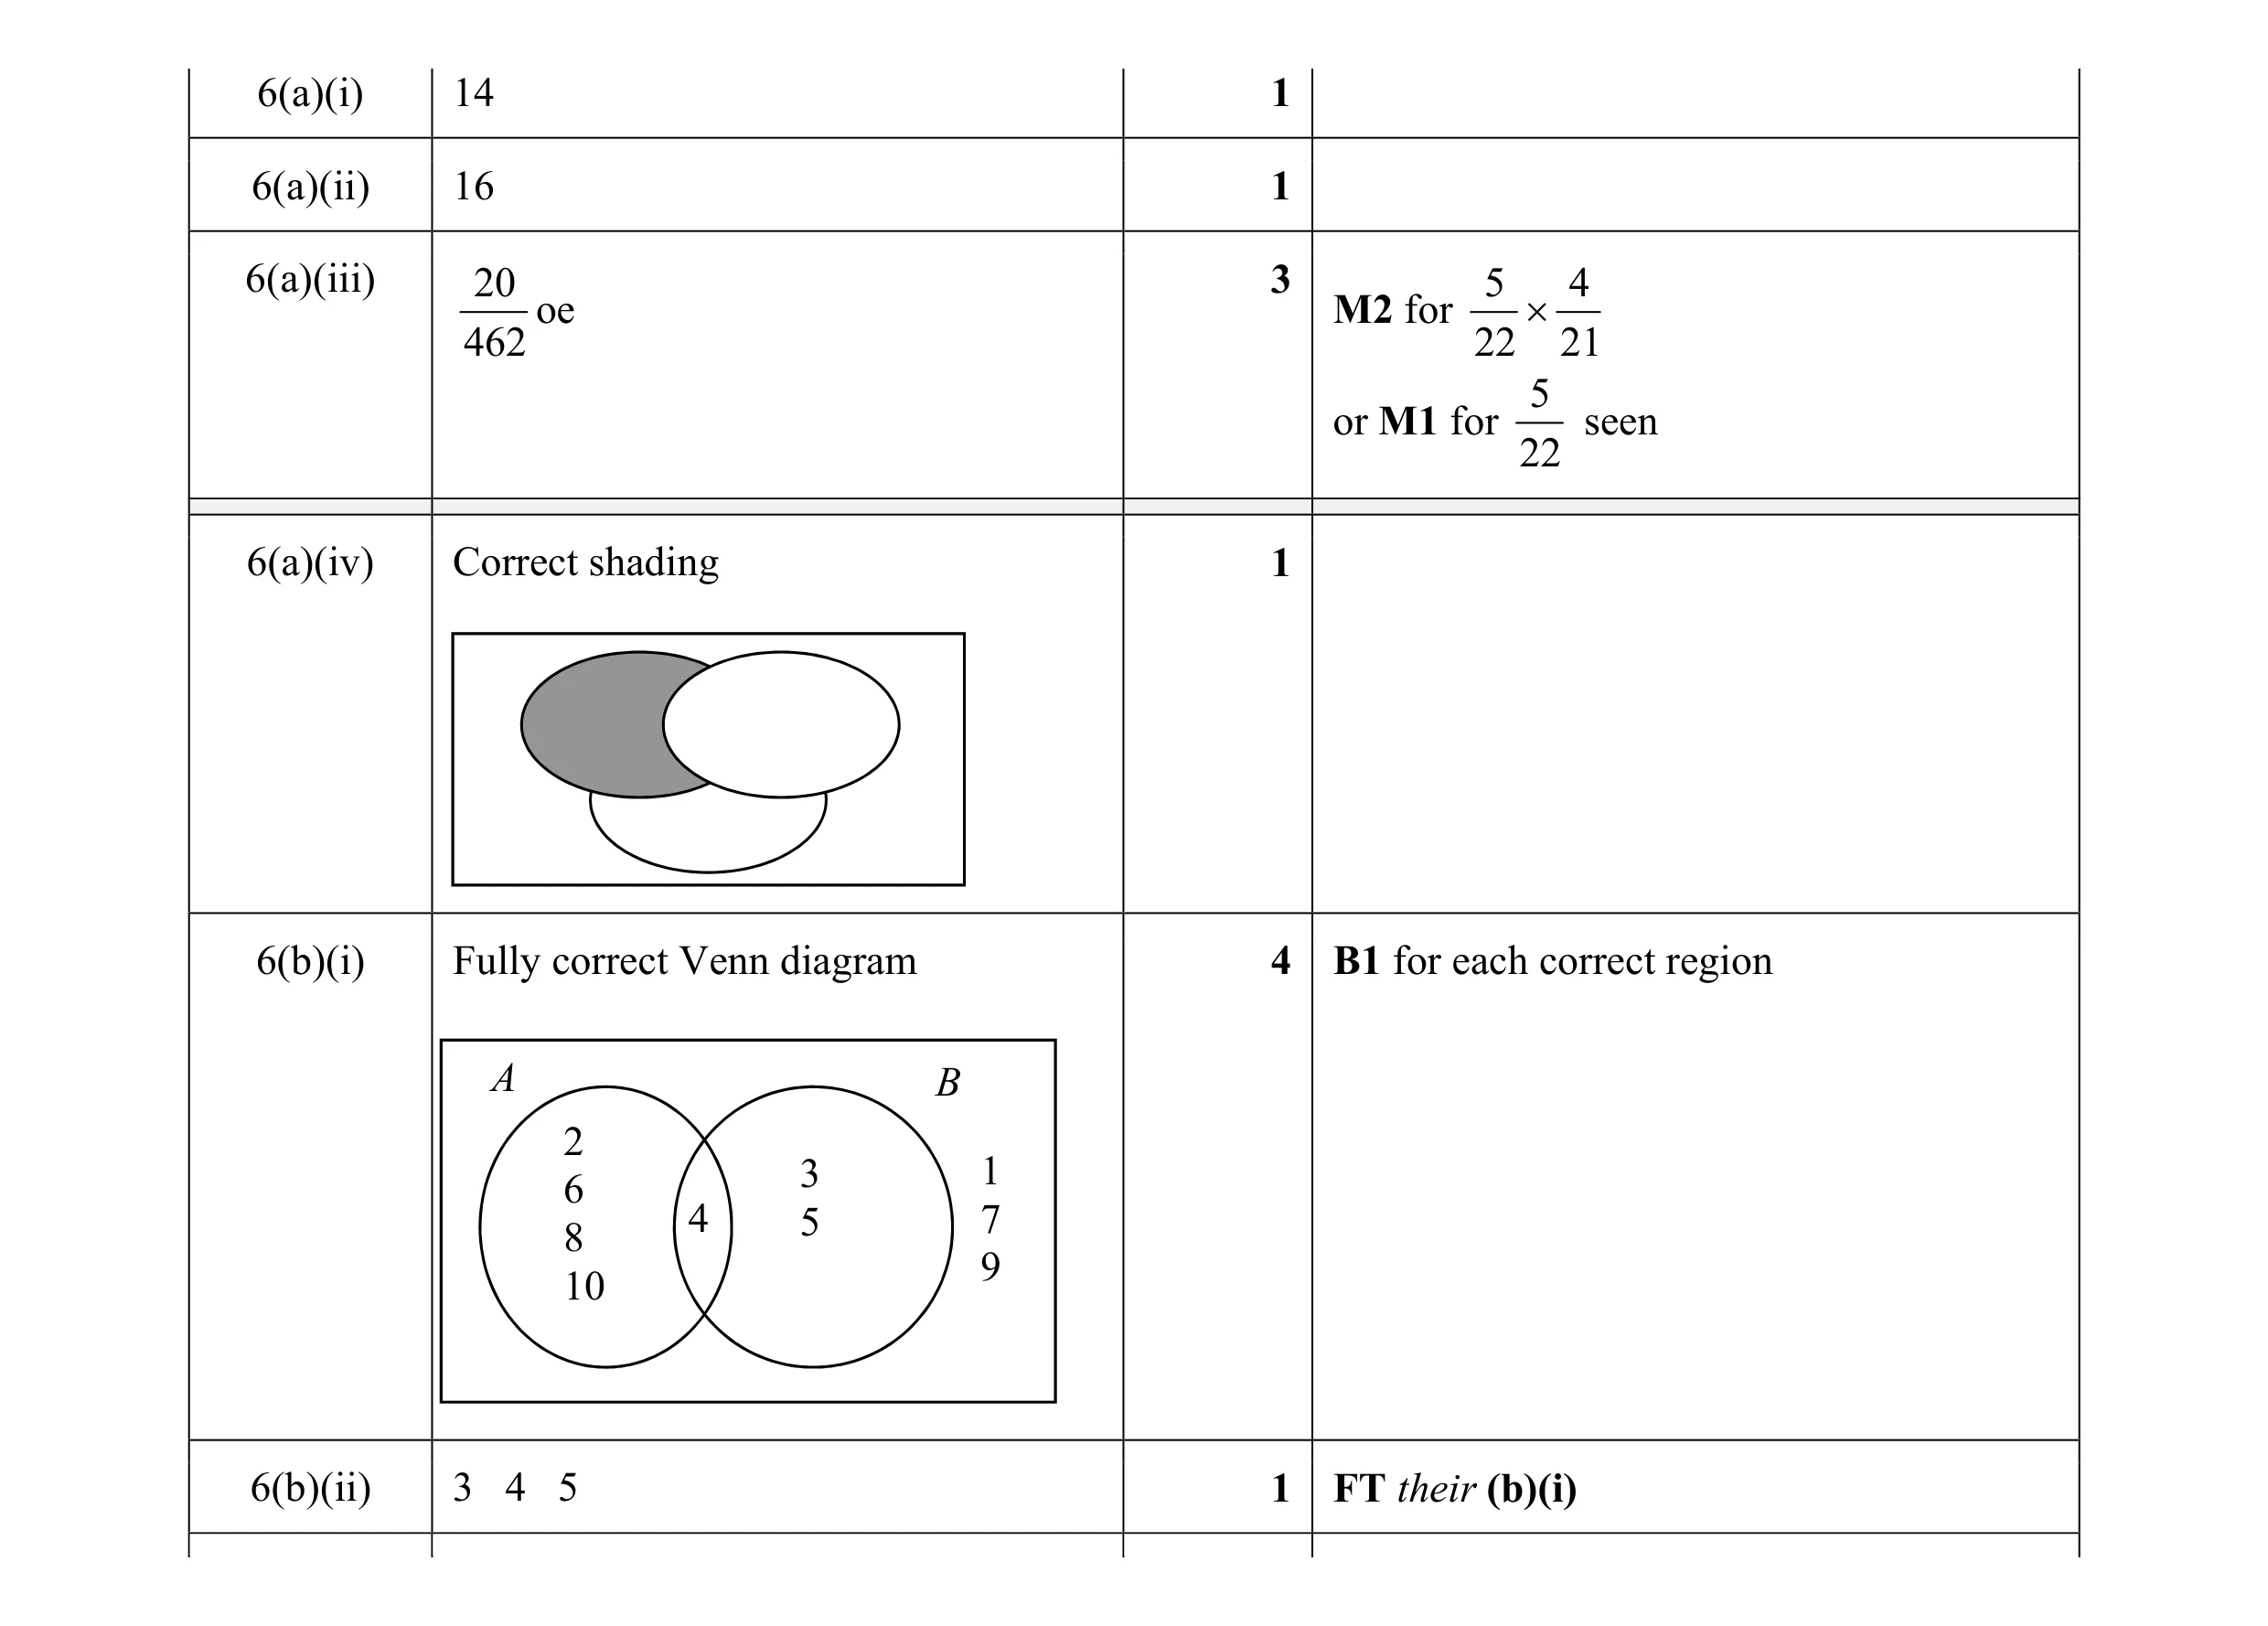 11
11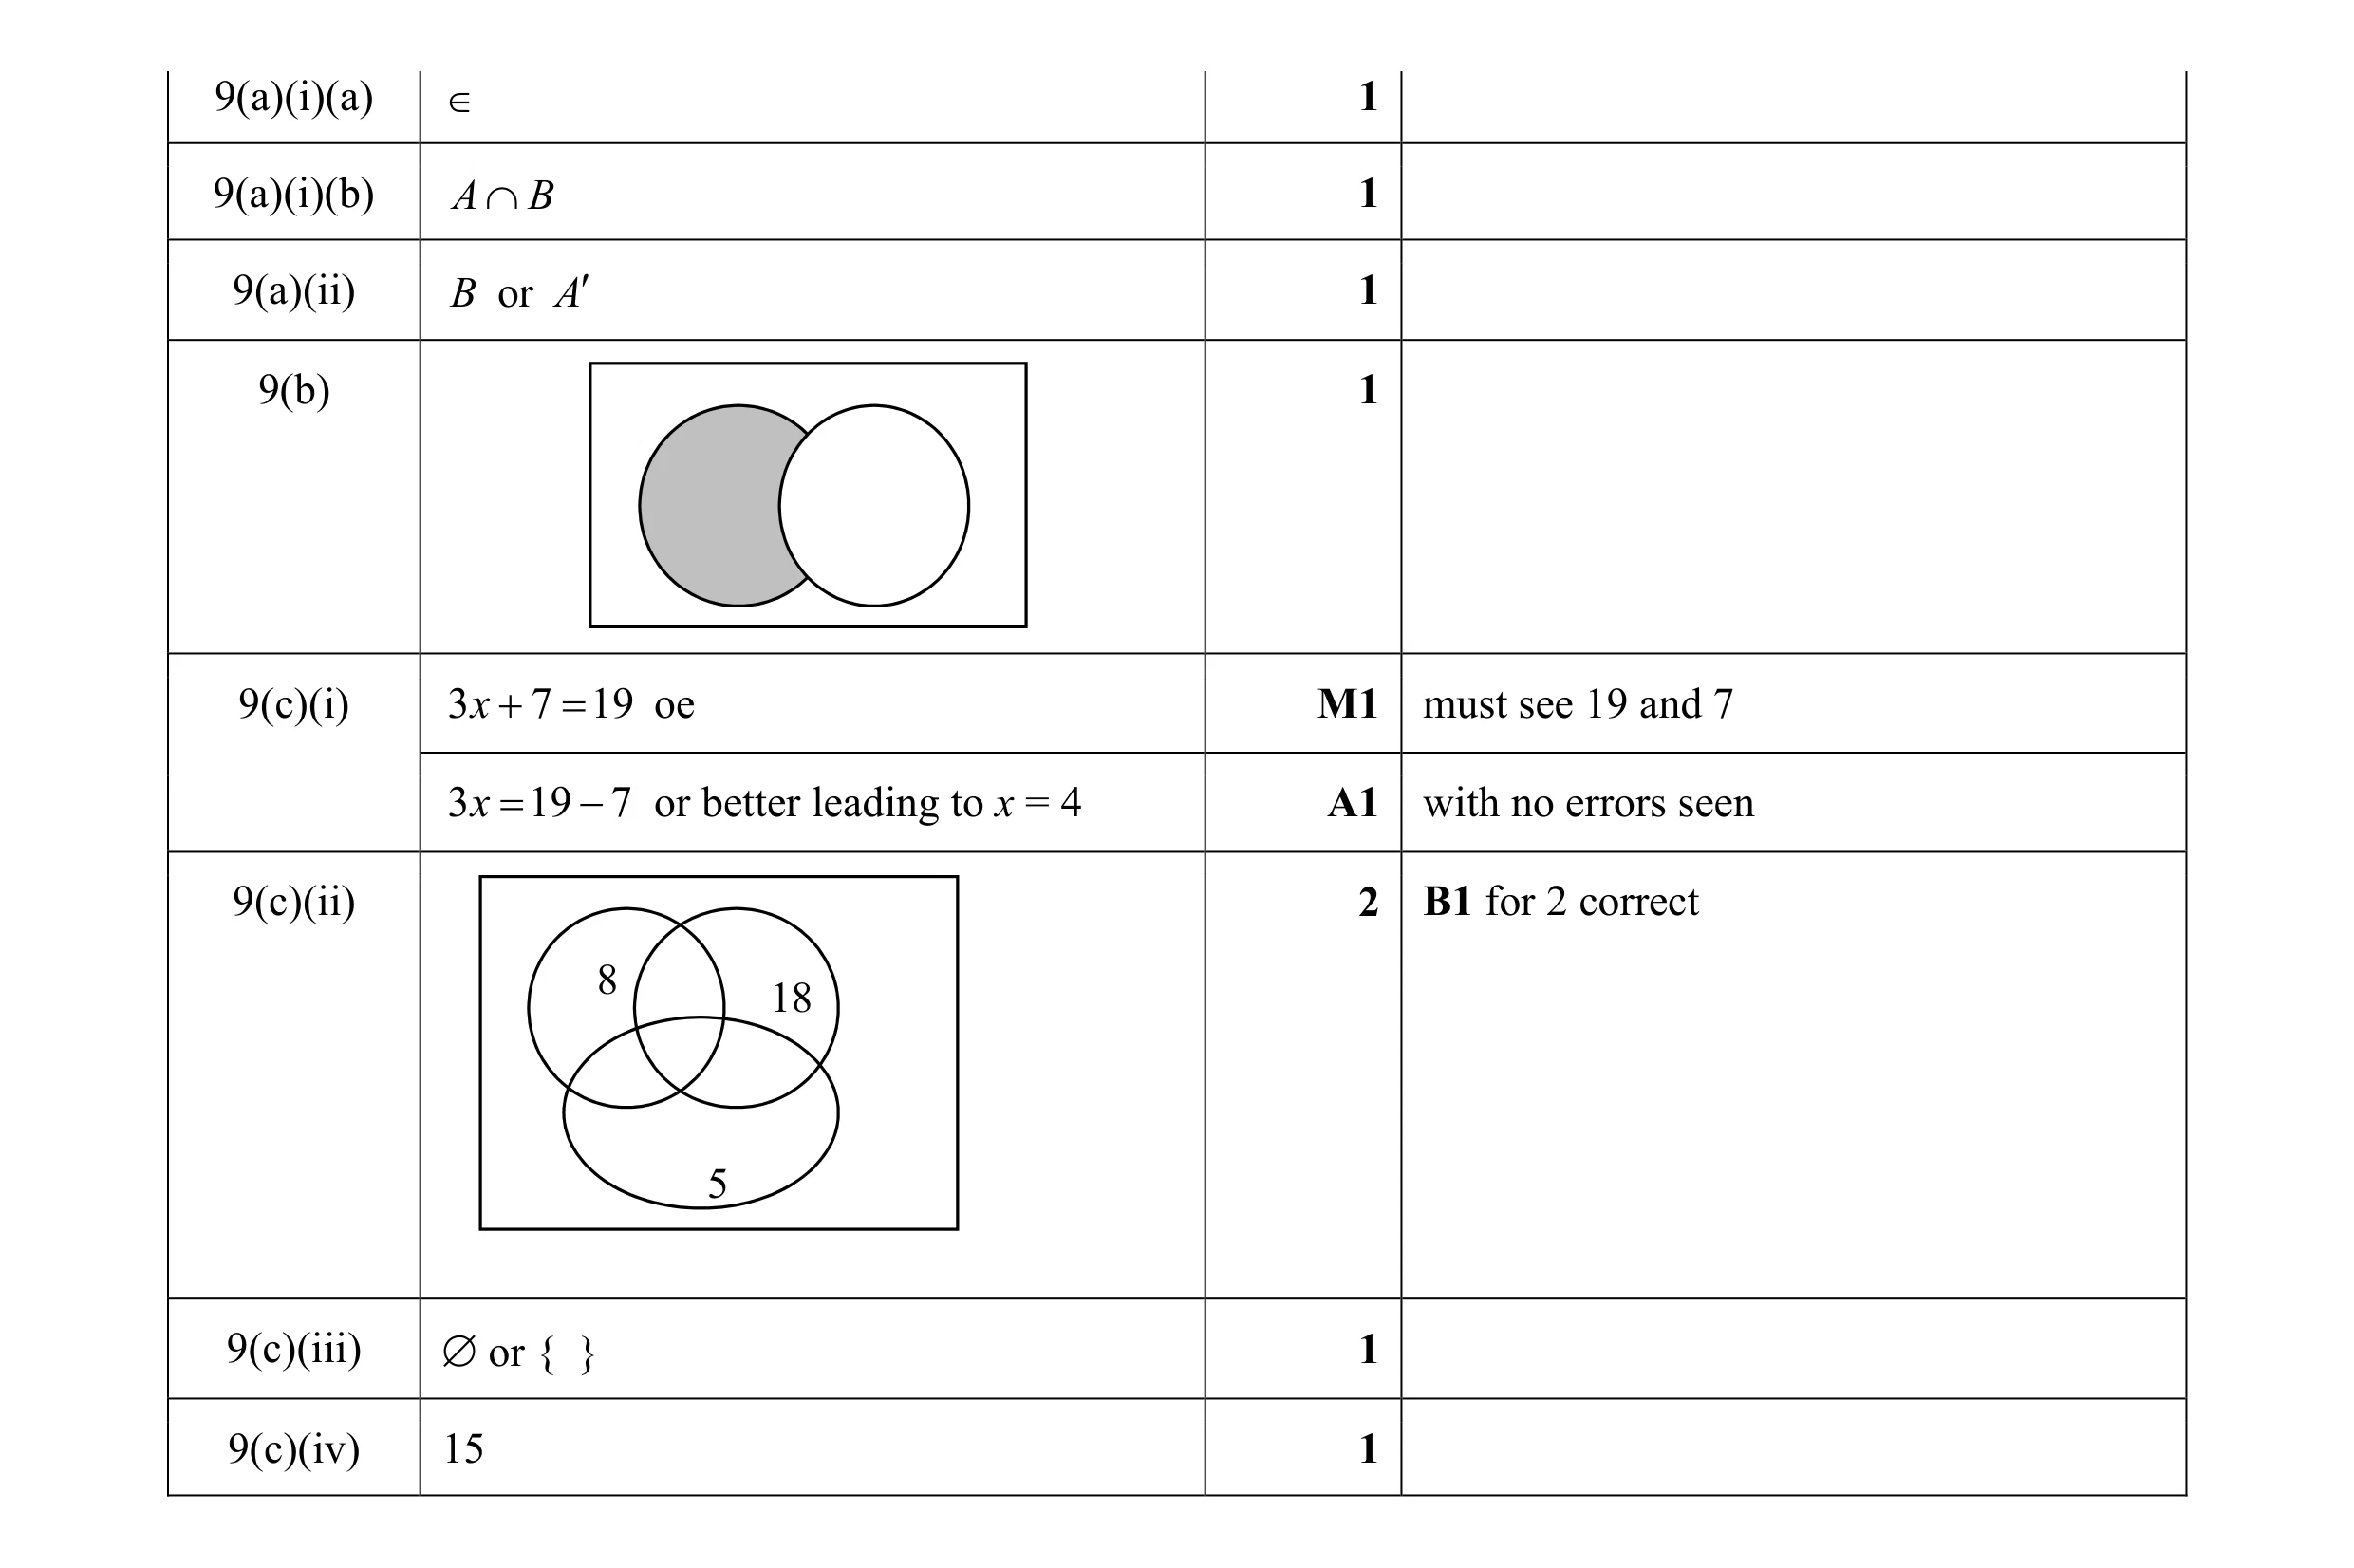 10
10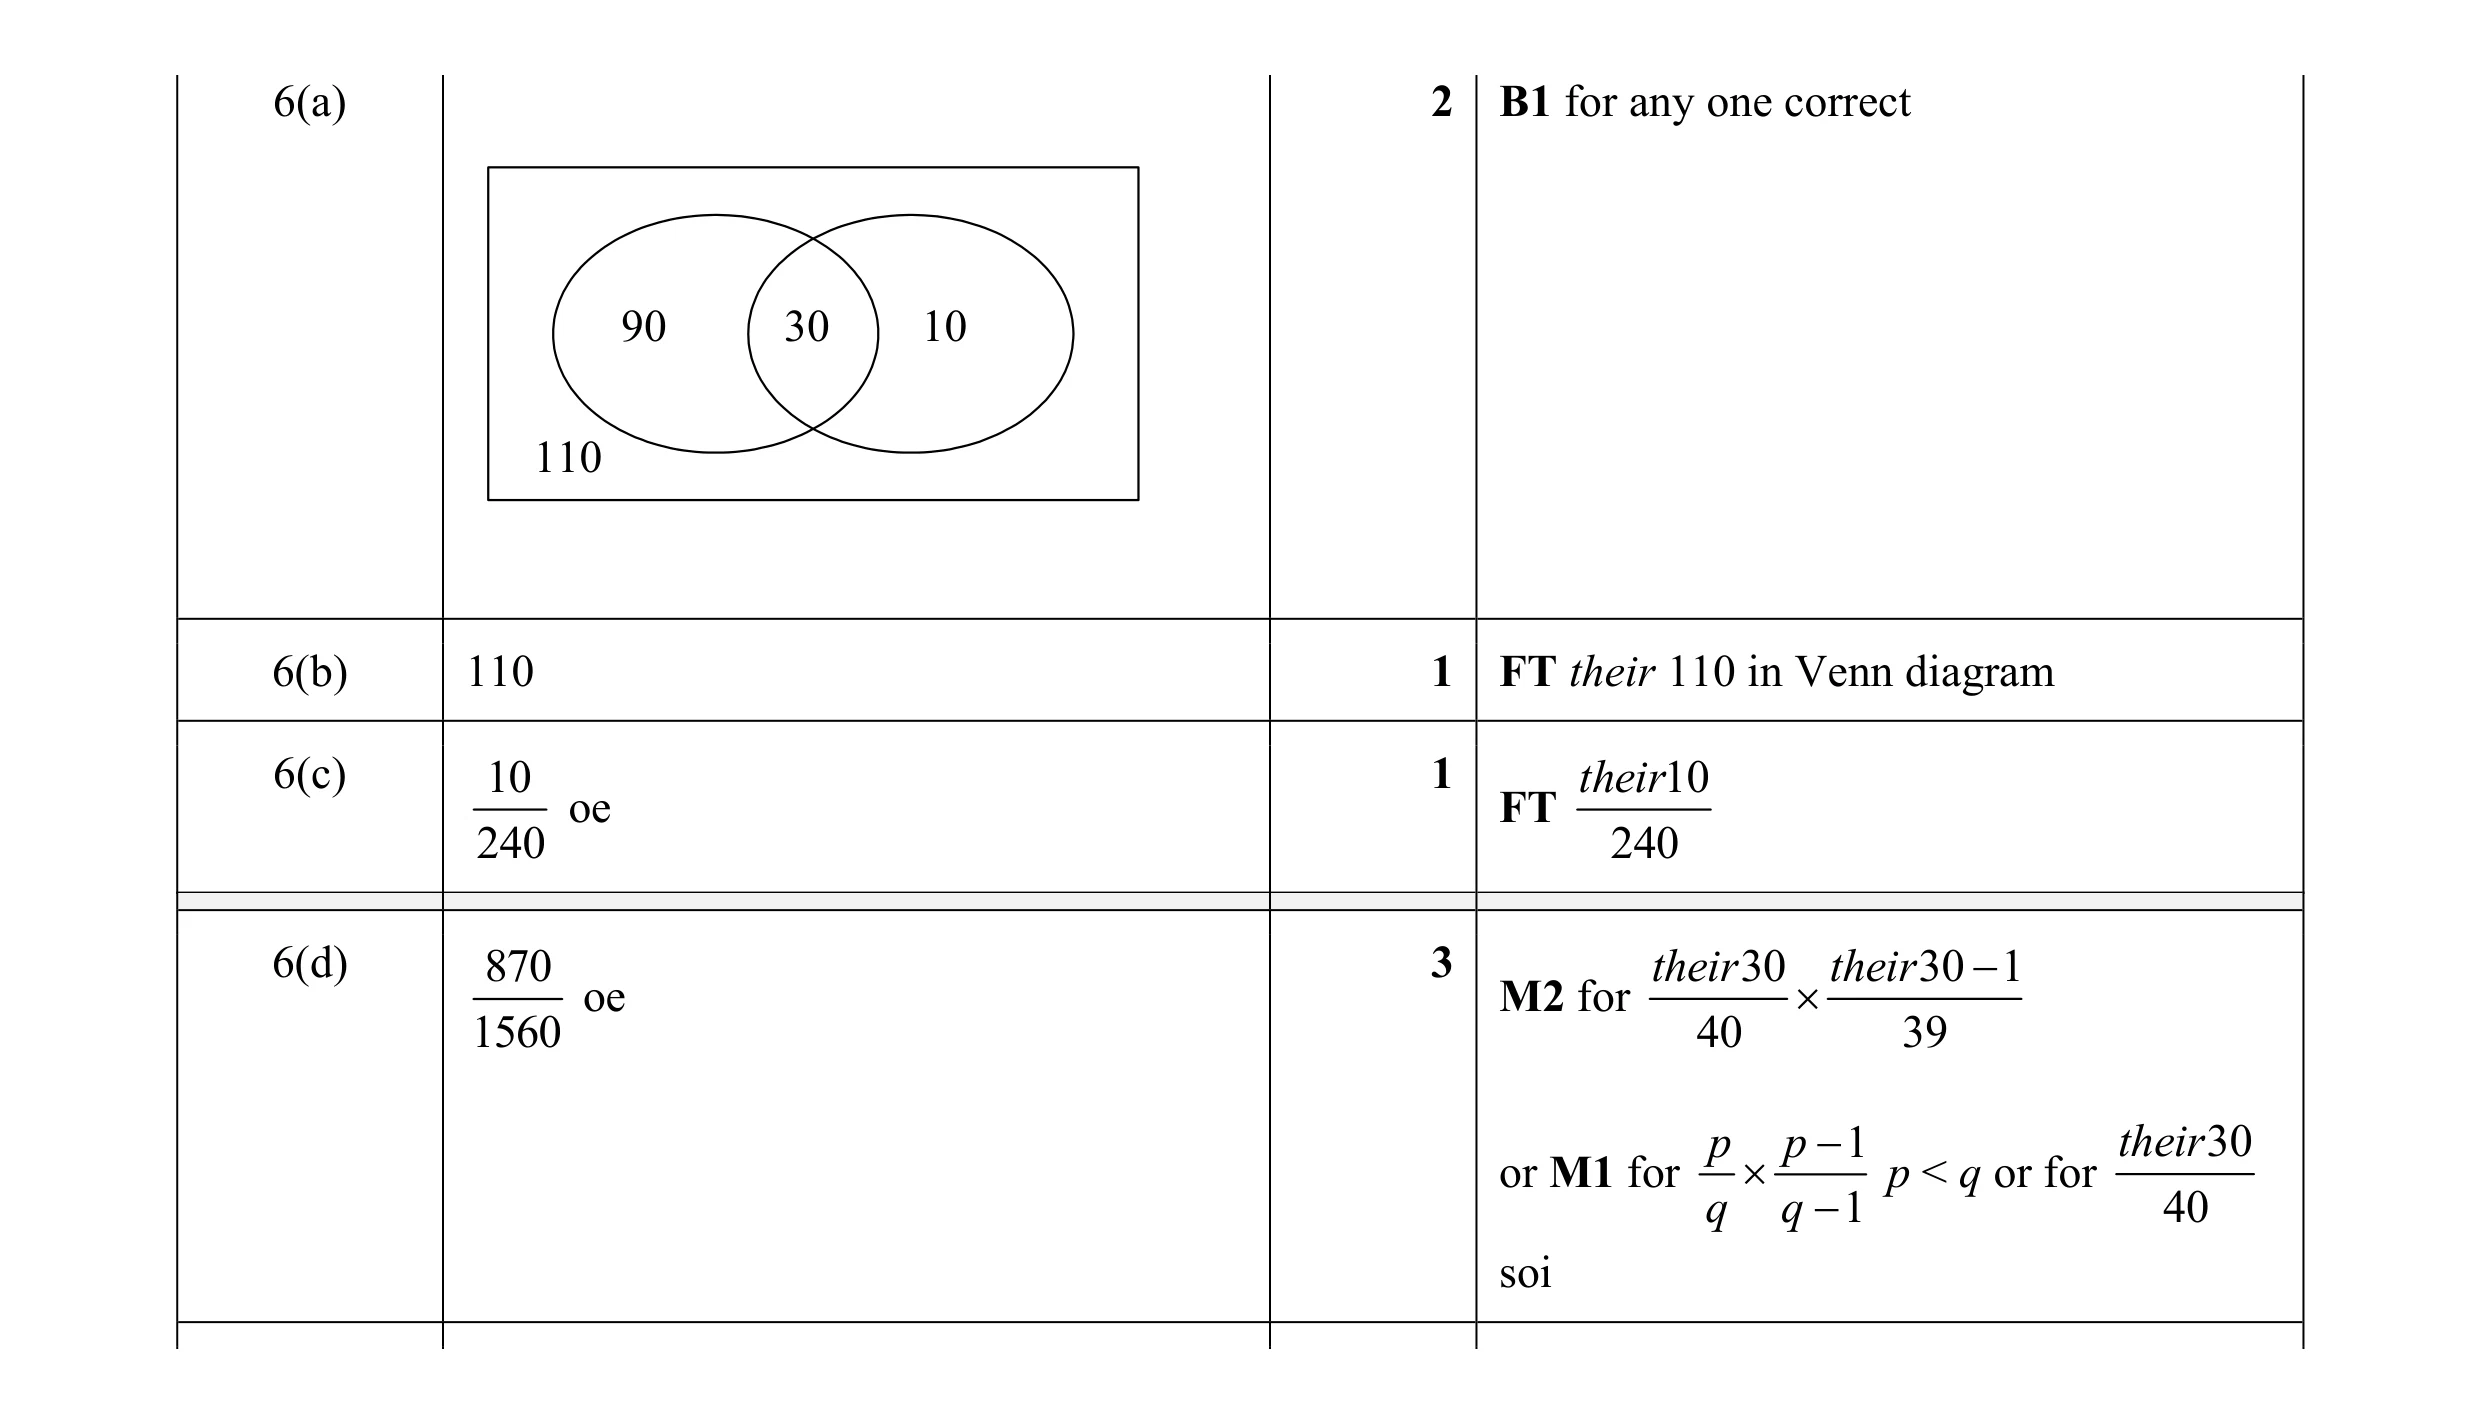 7
7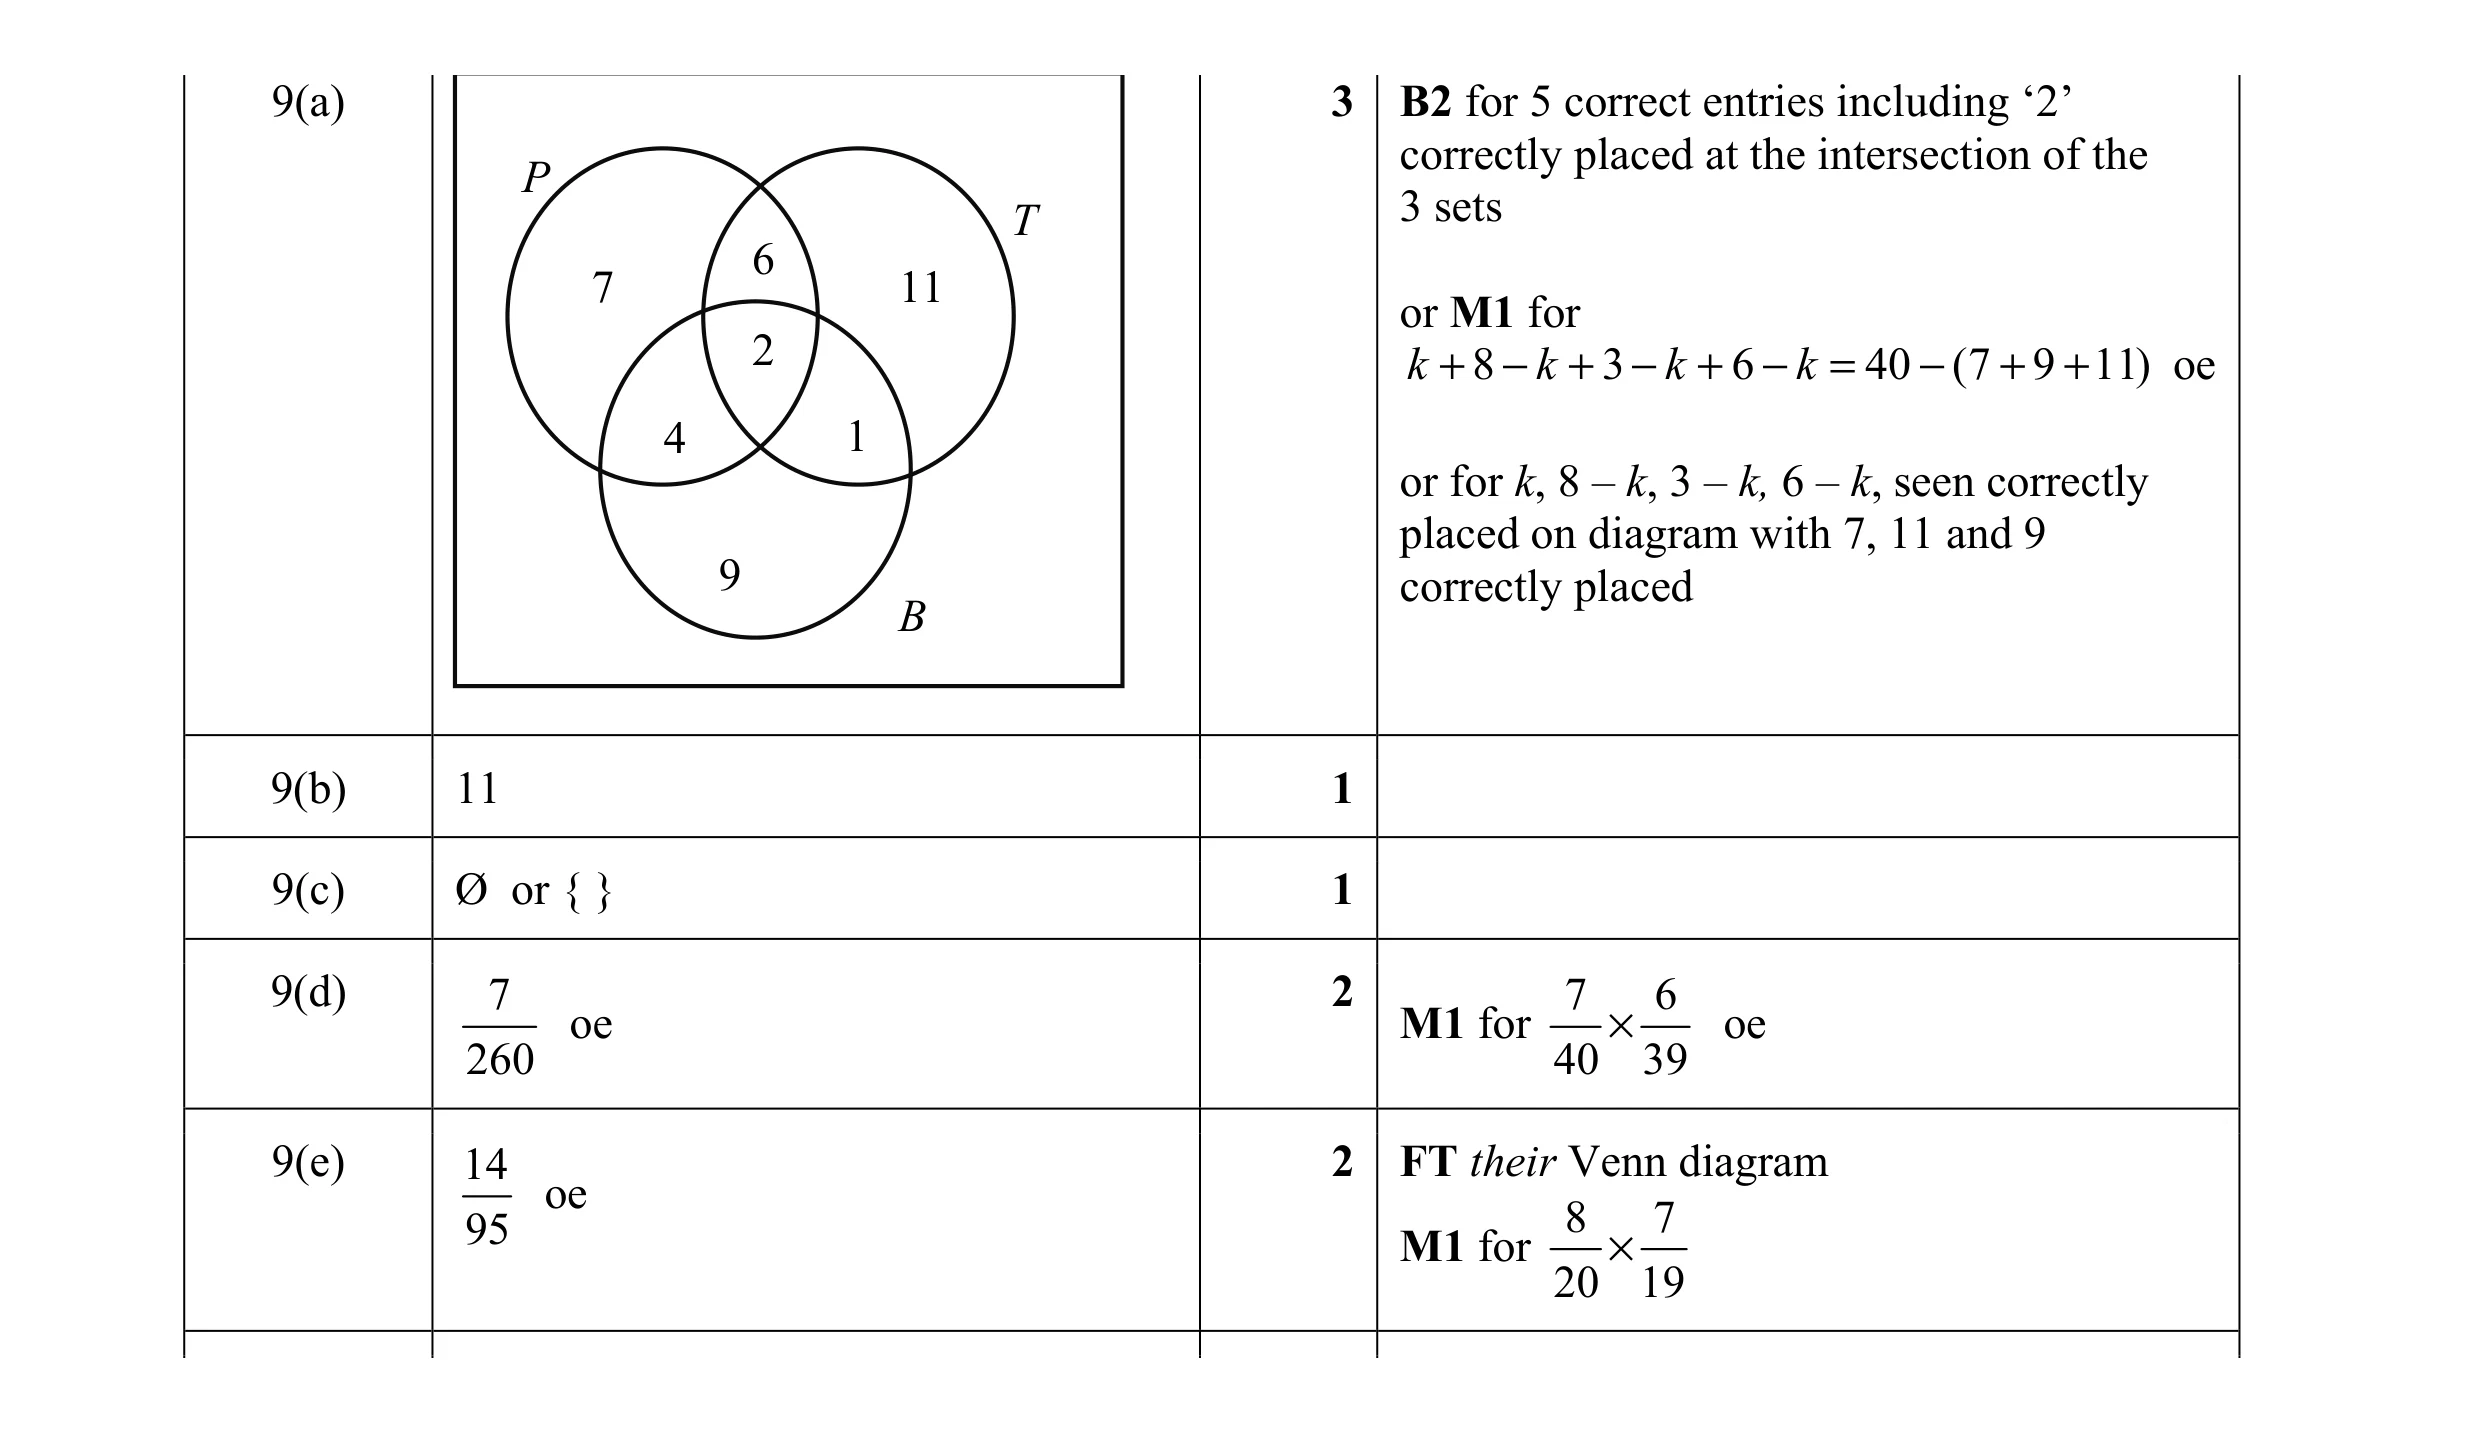 9
9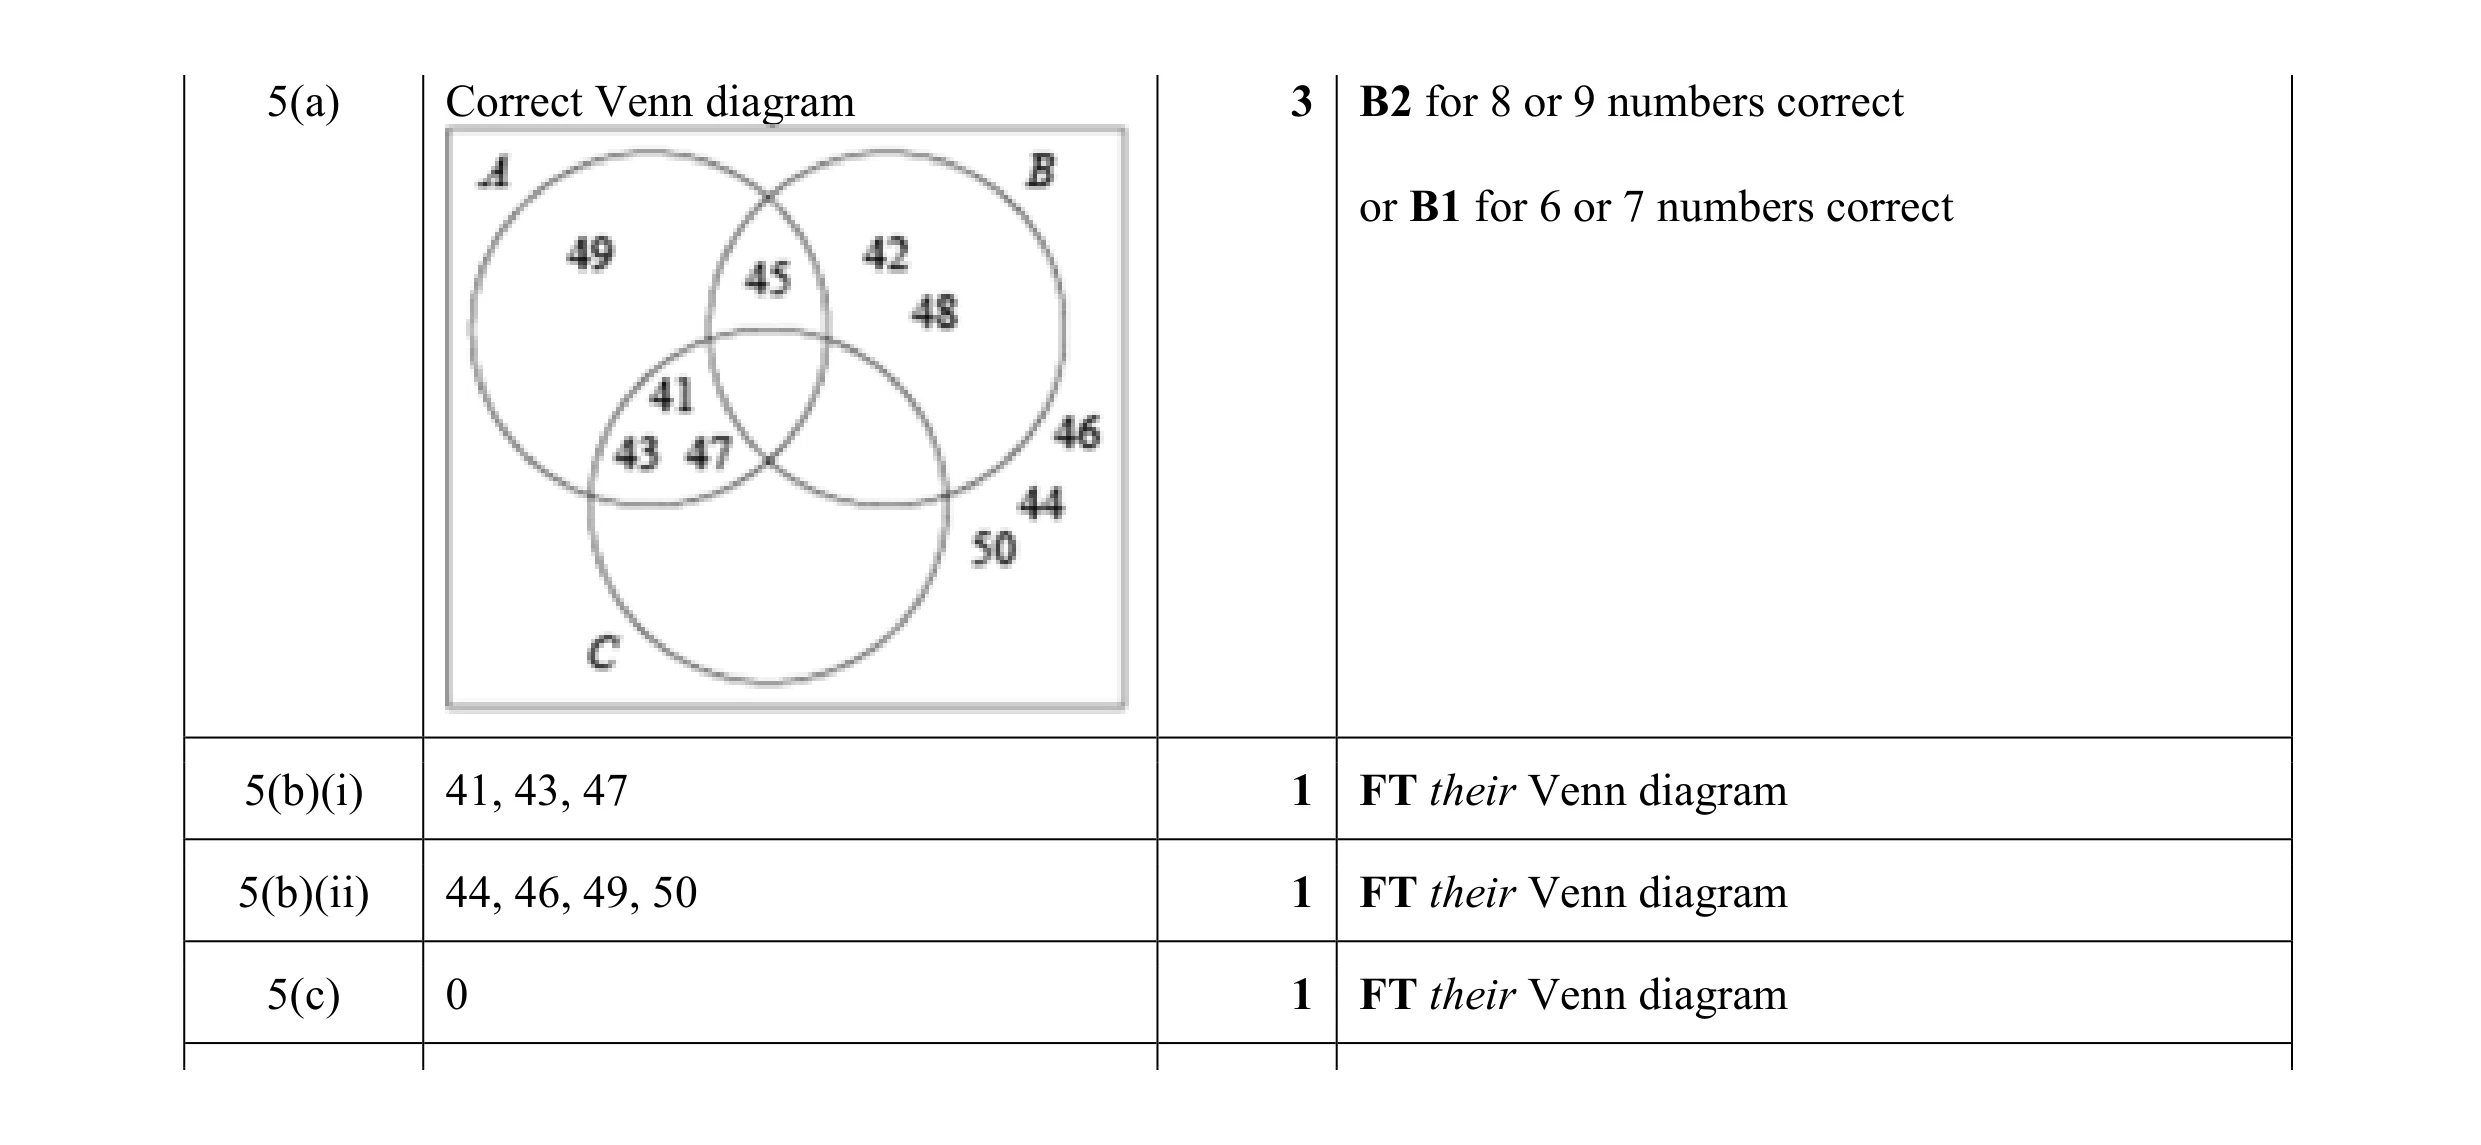 6
6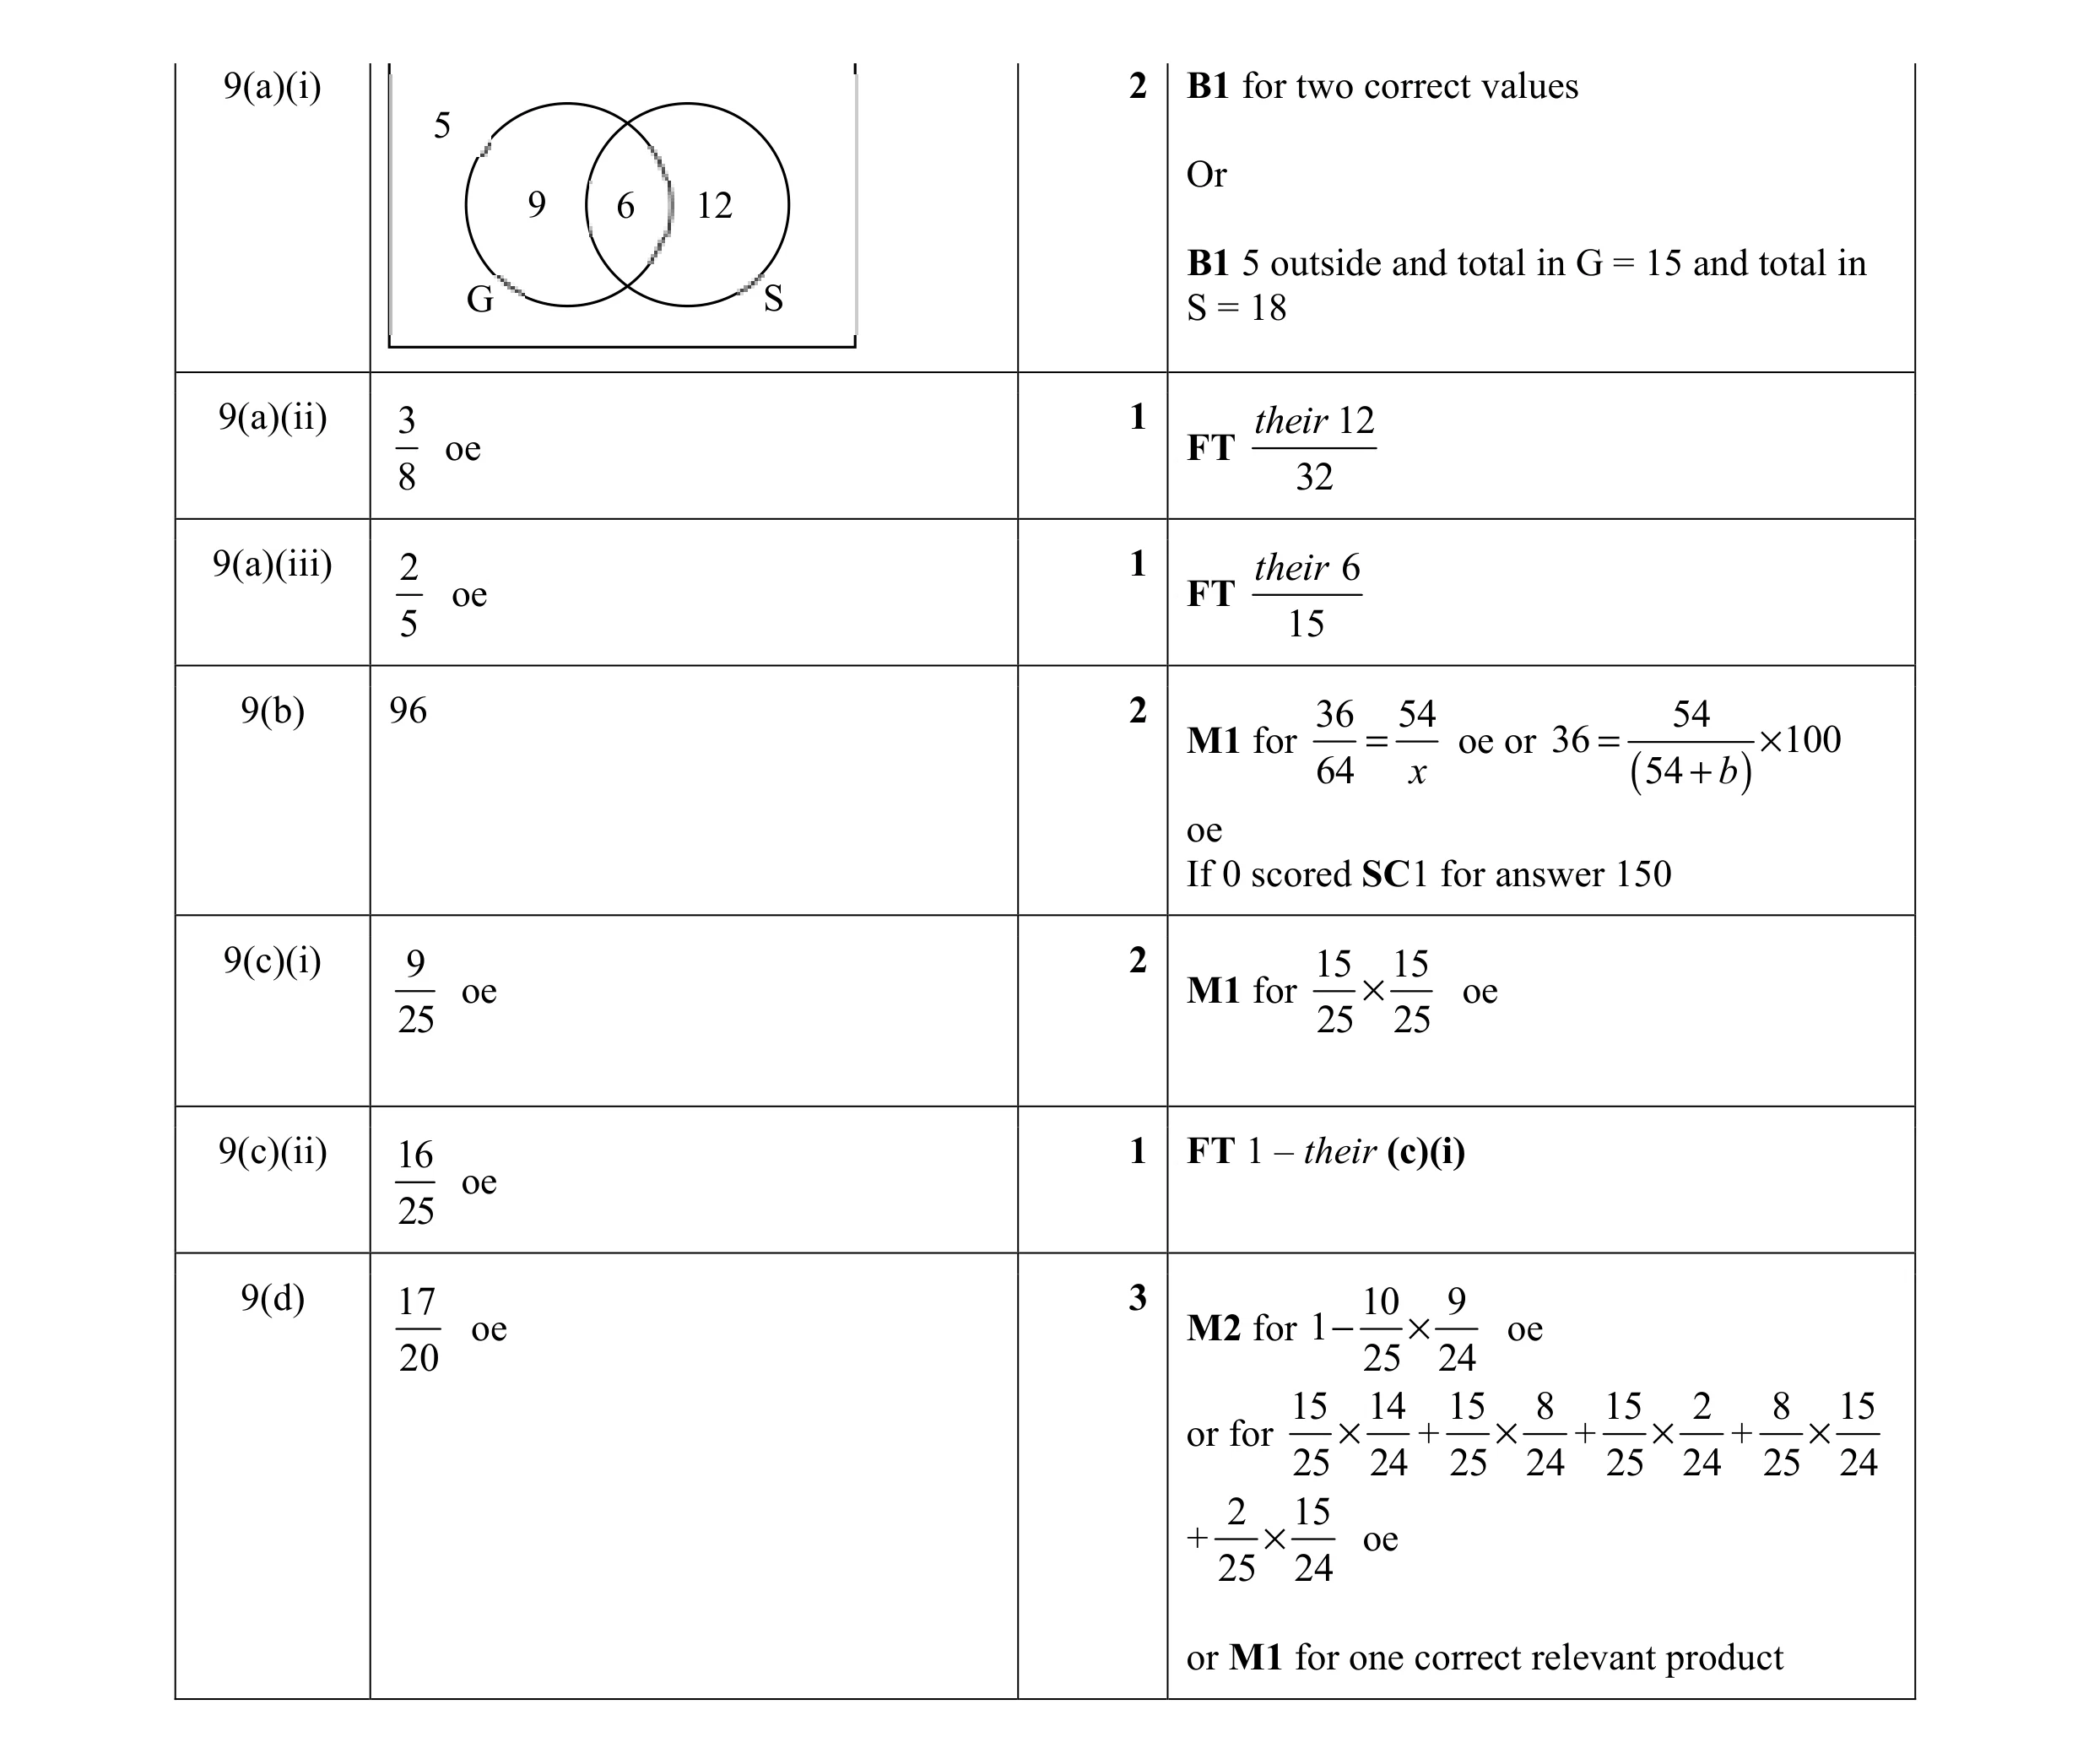 12
12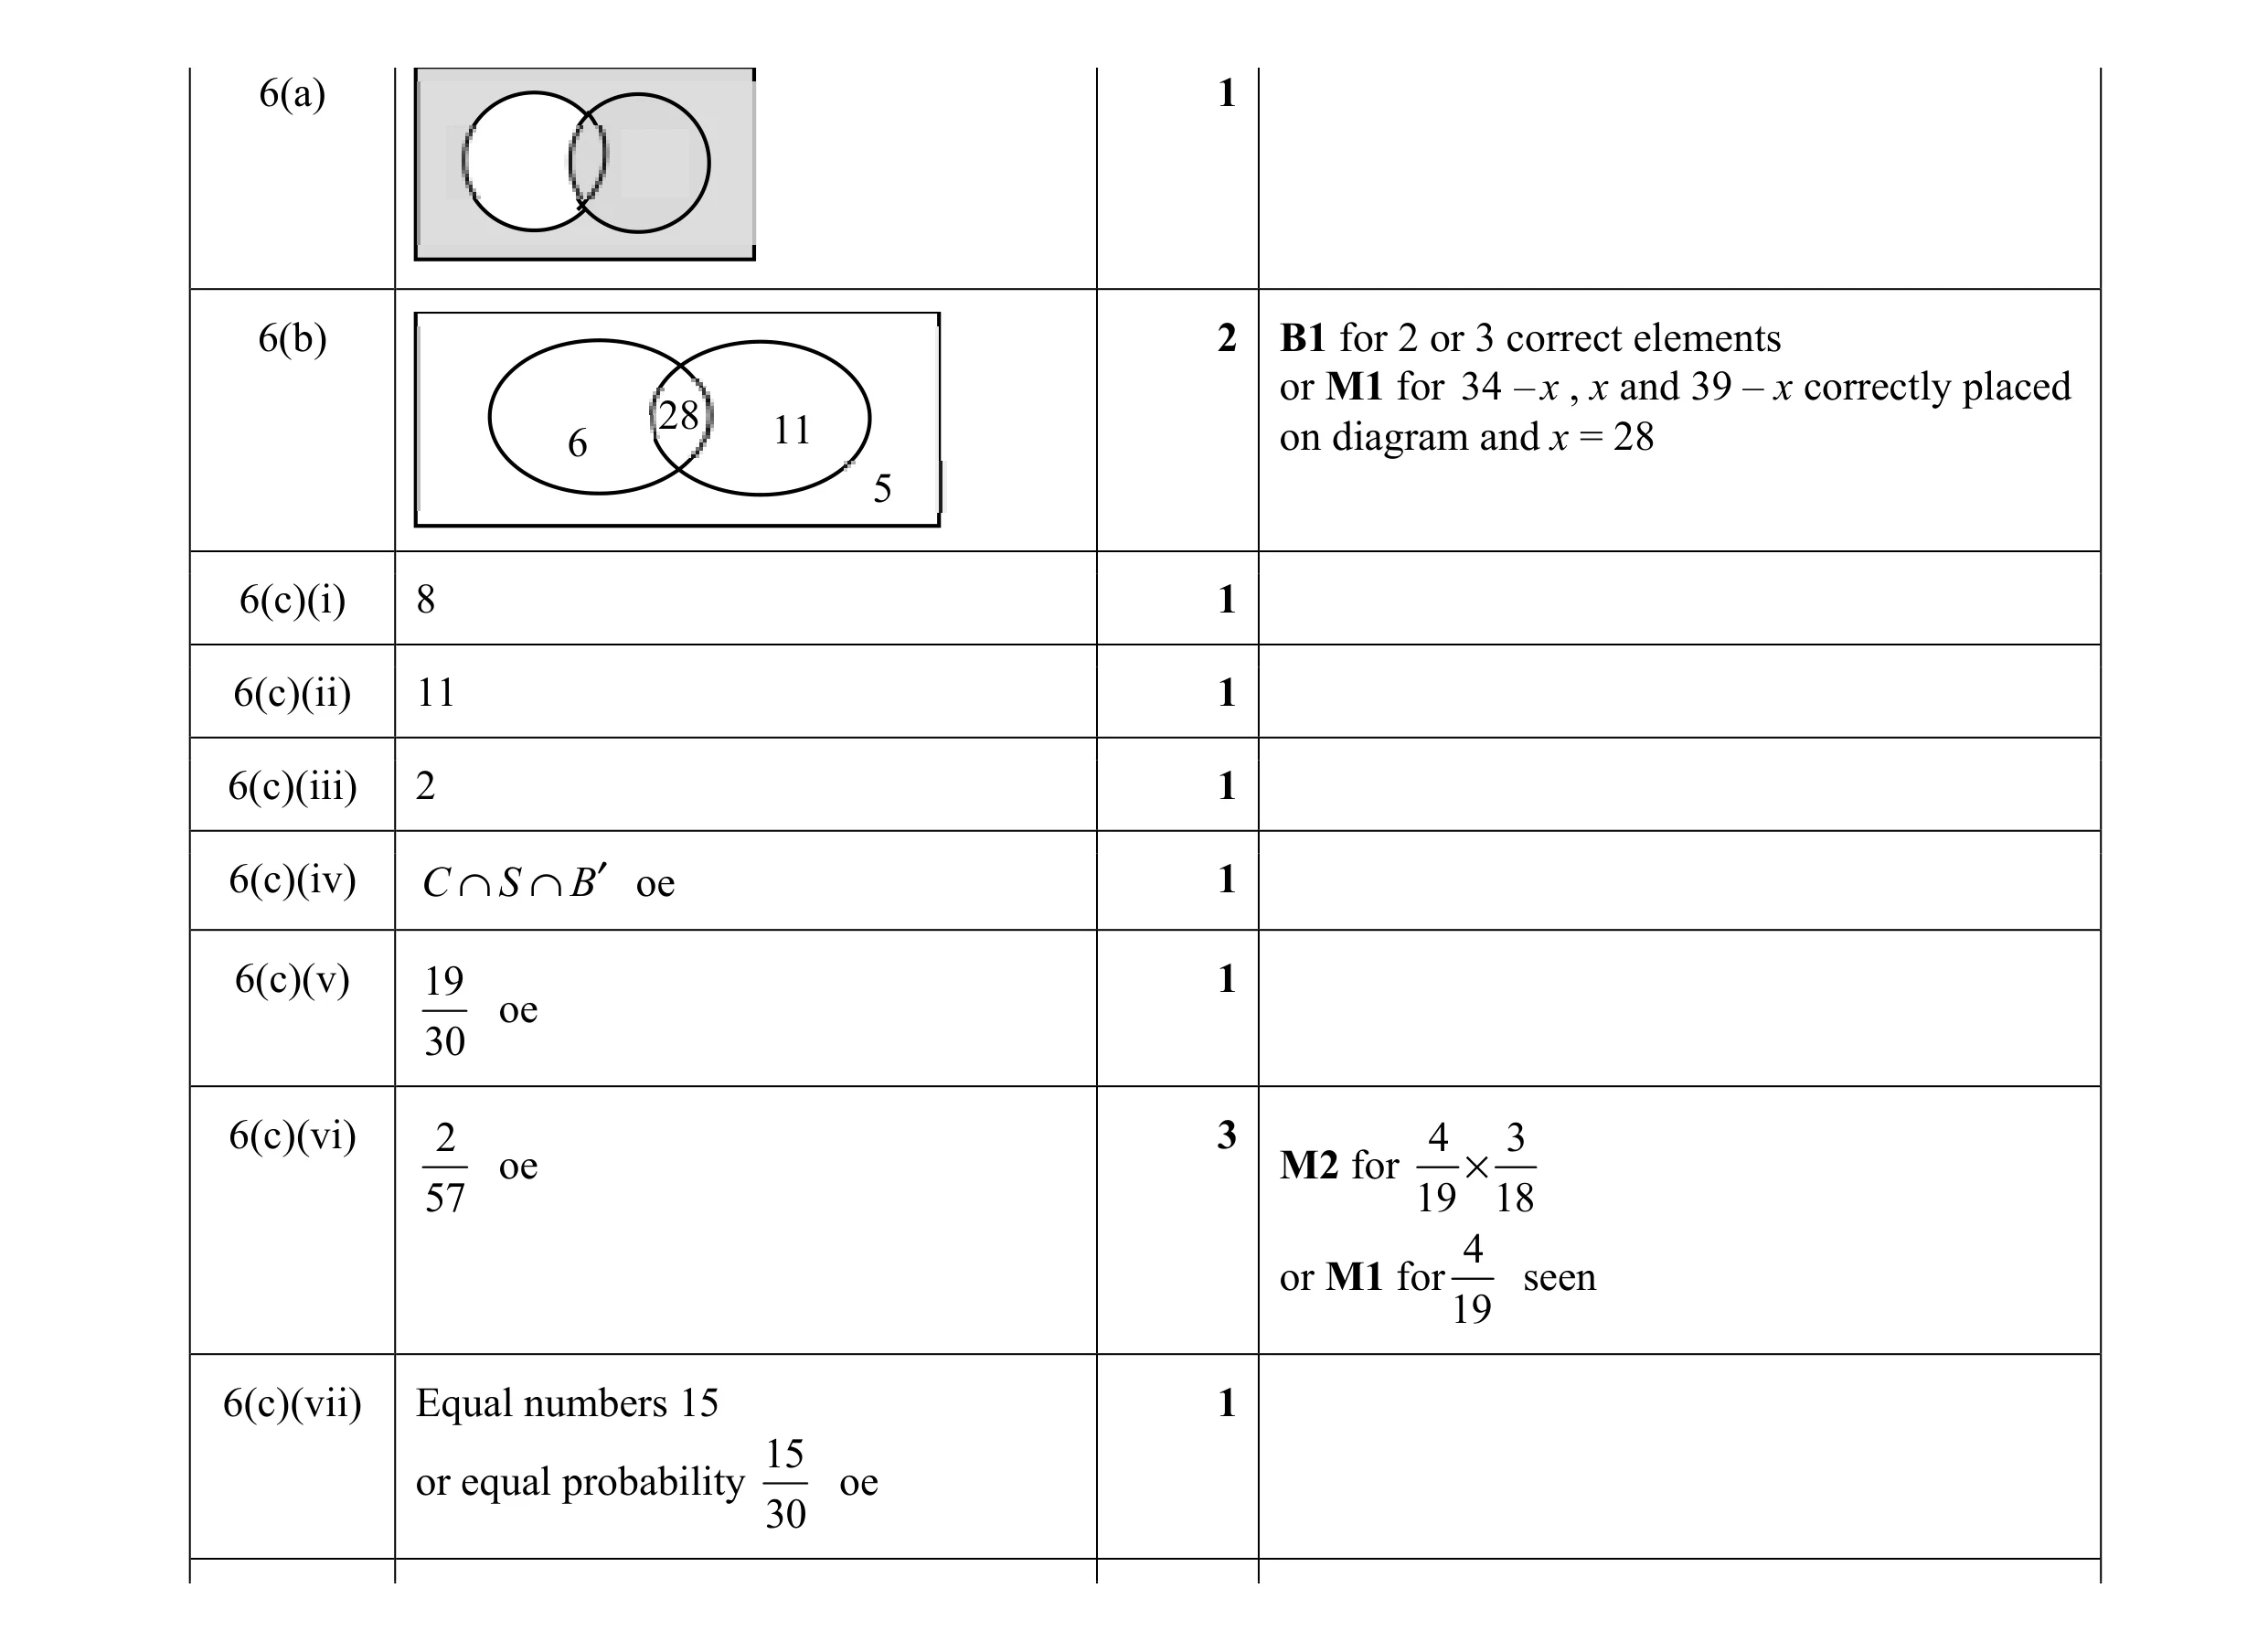 12
12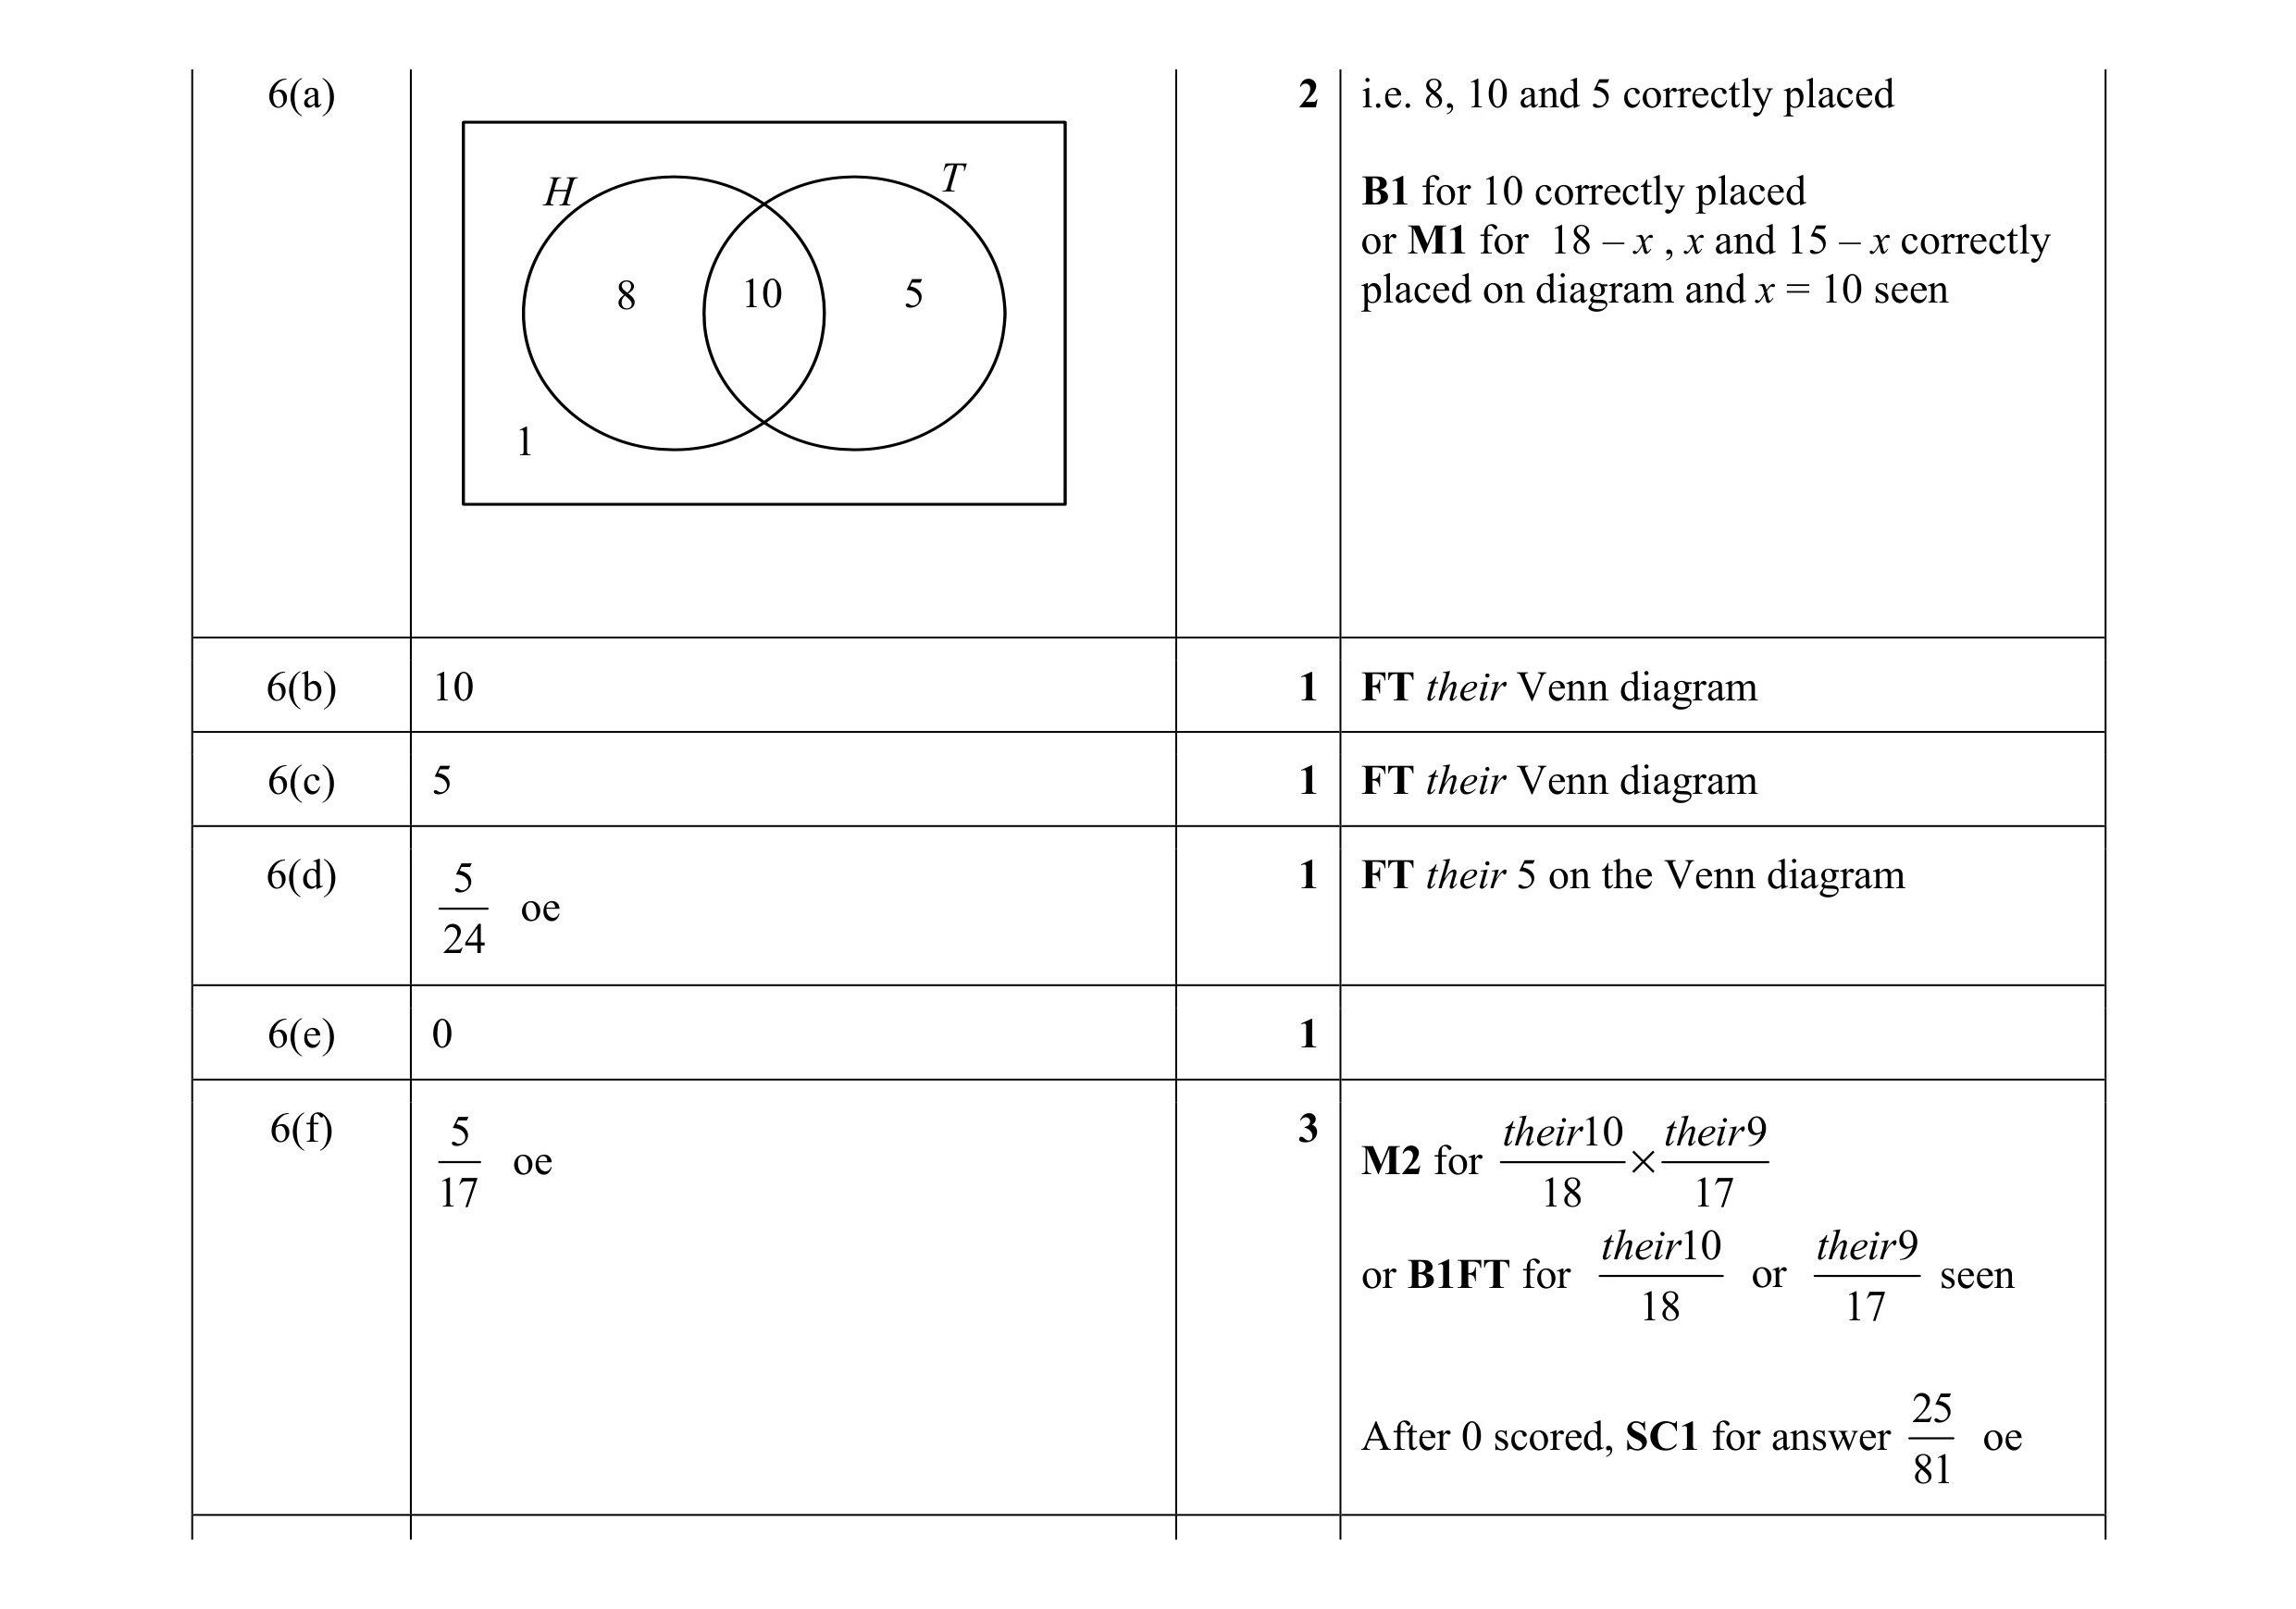 9
9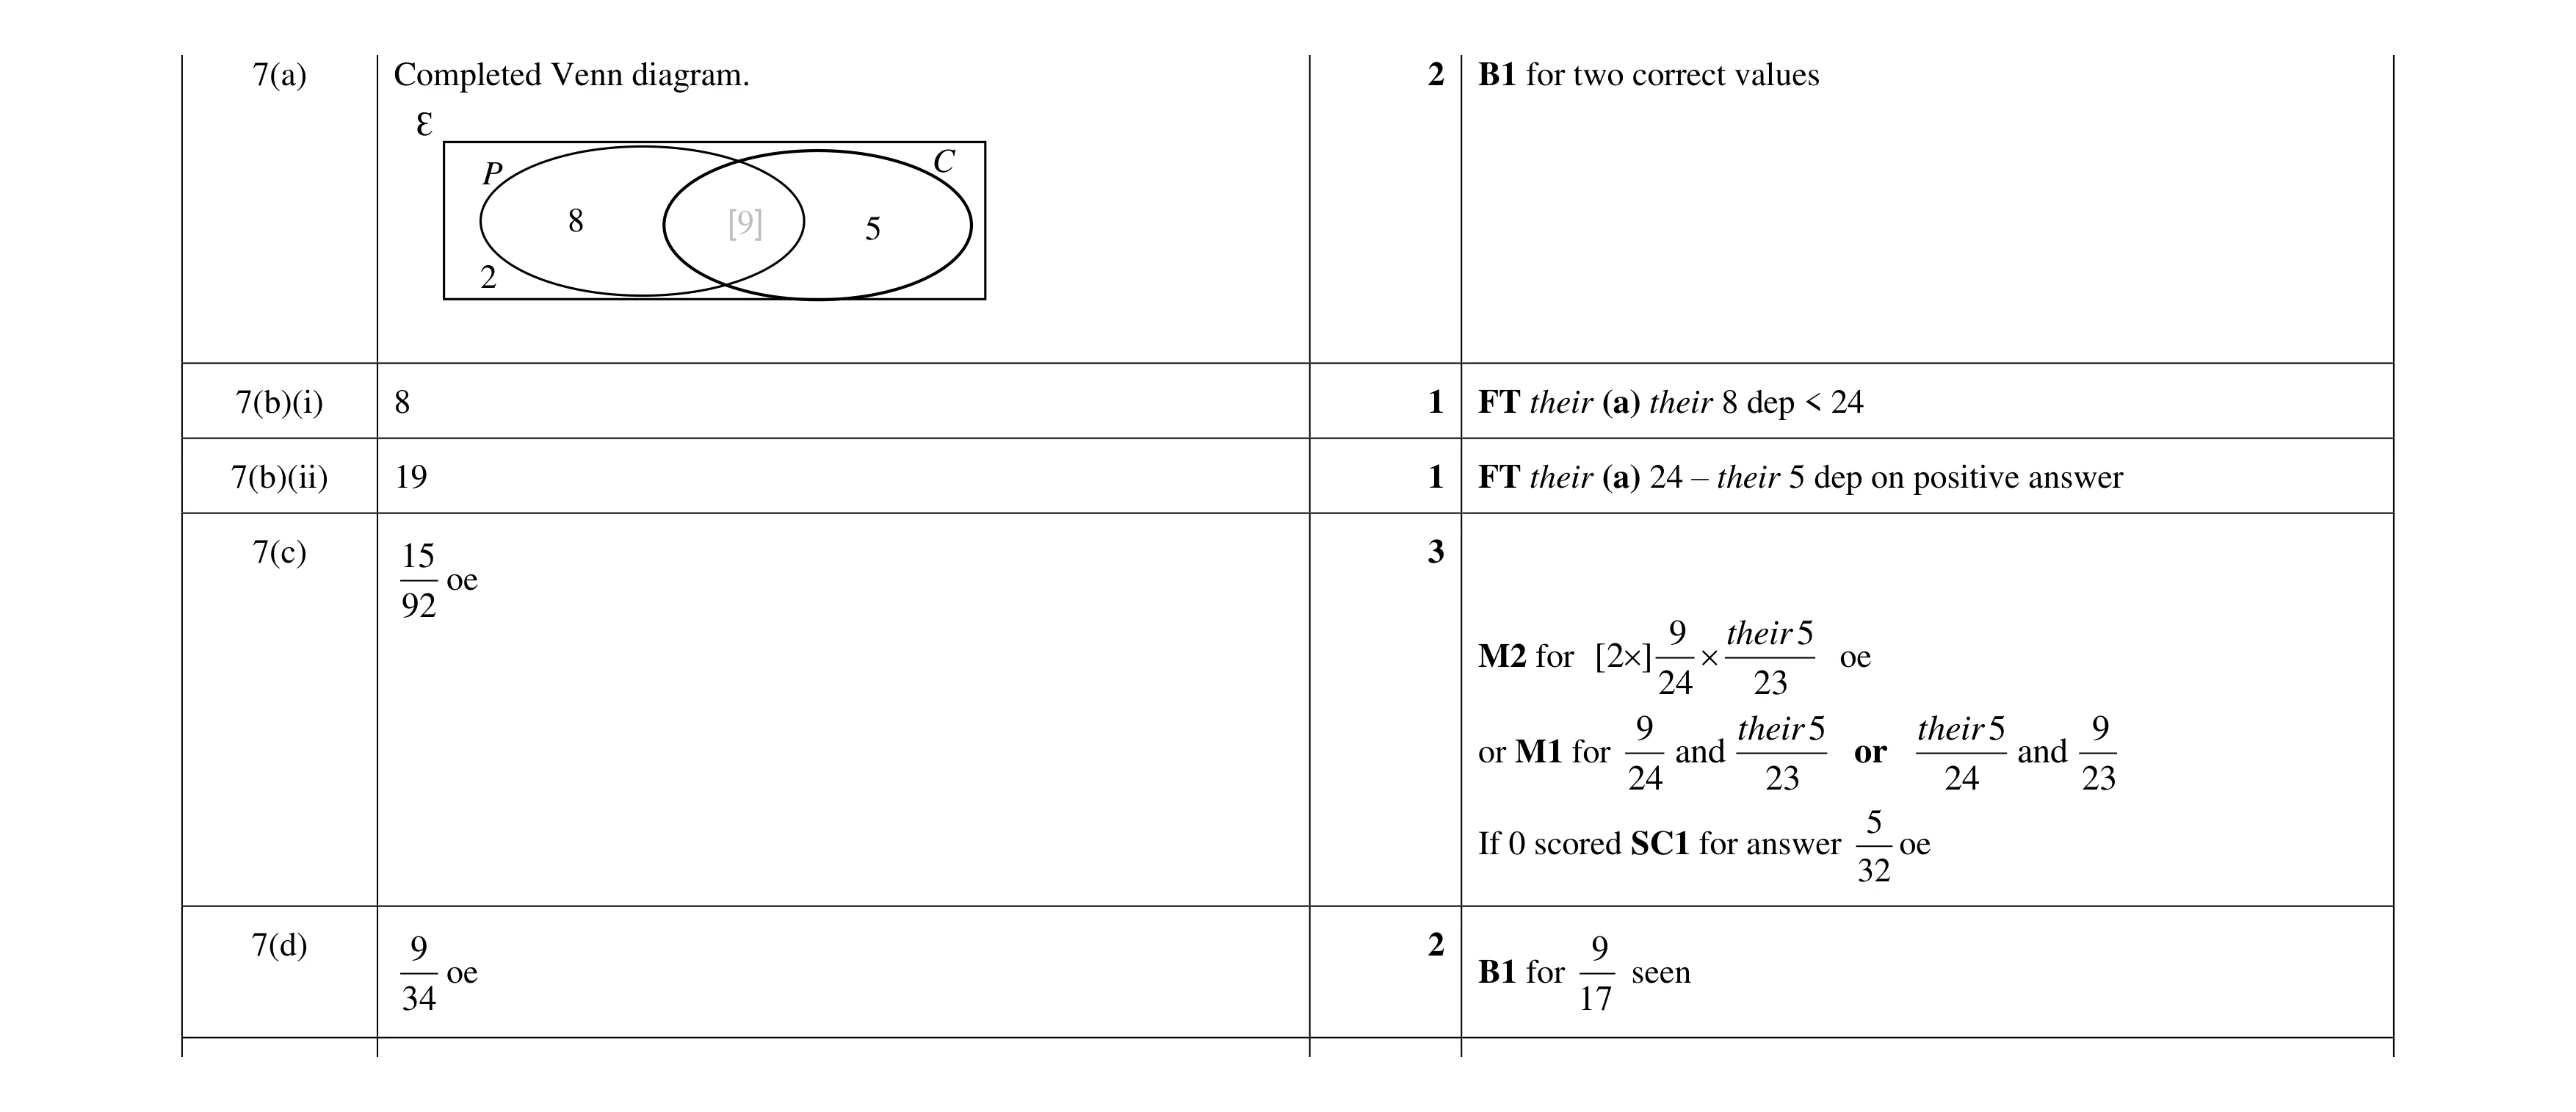 9
9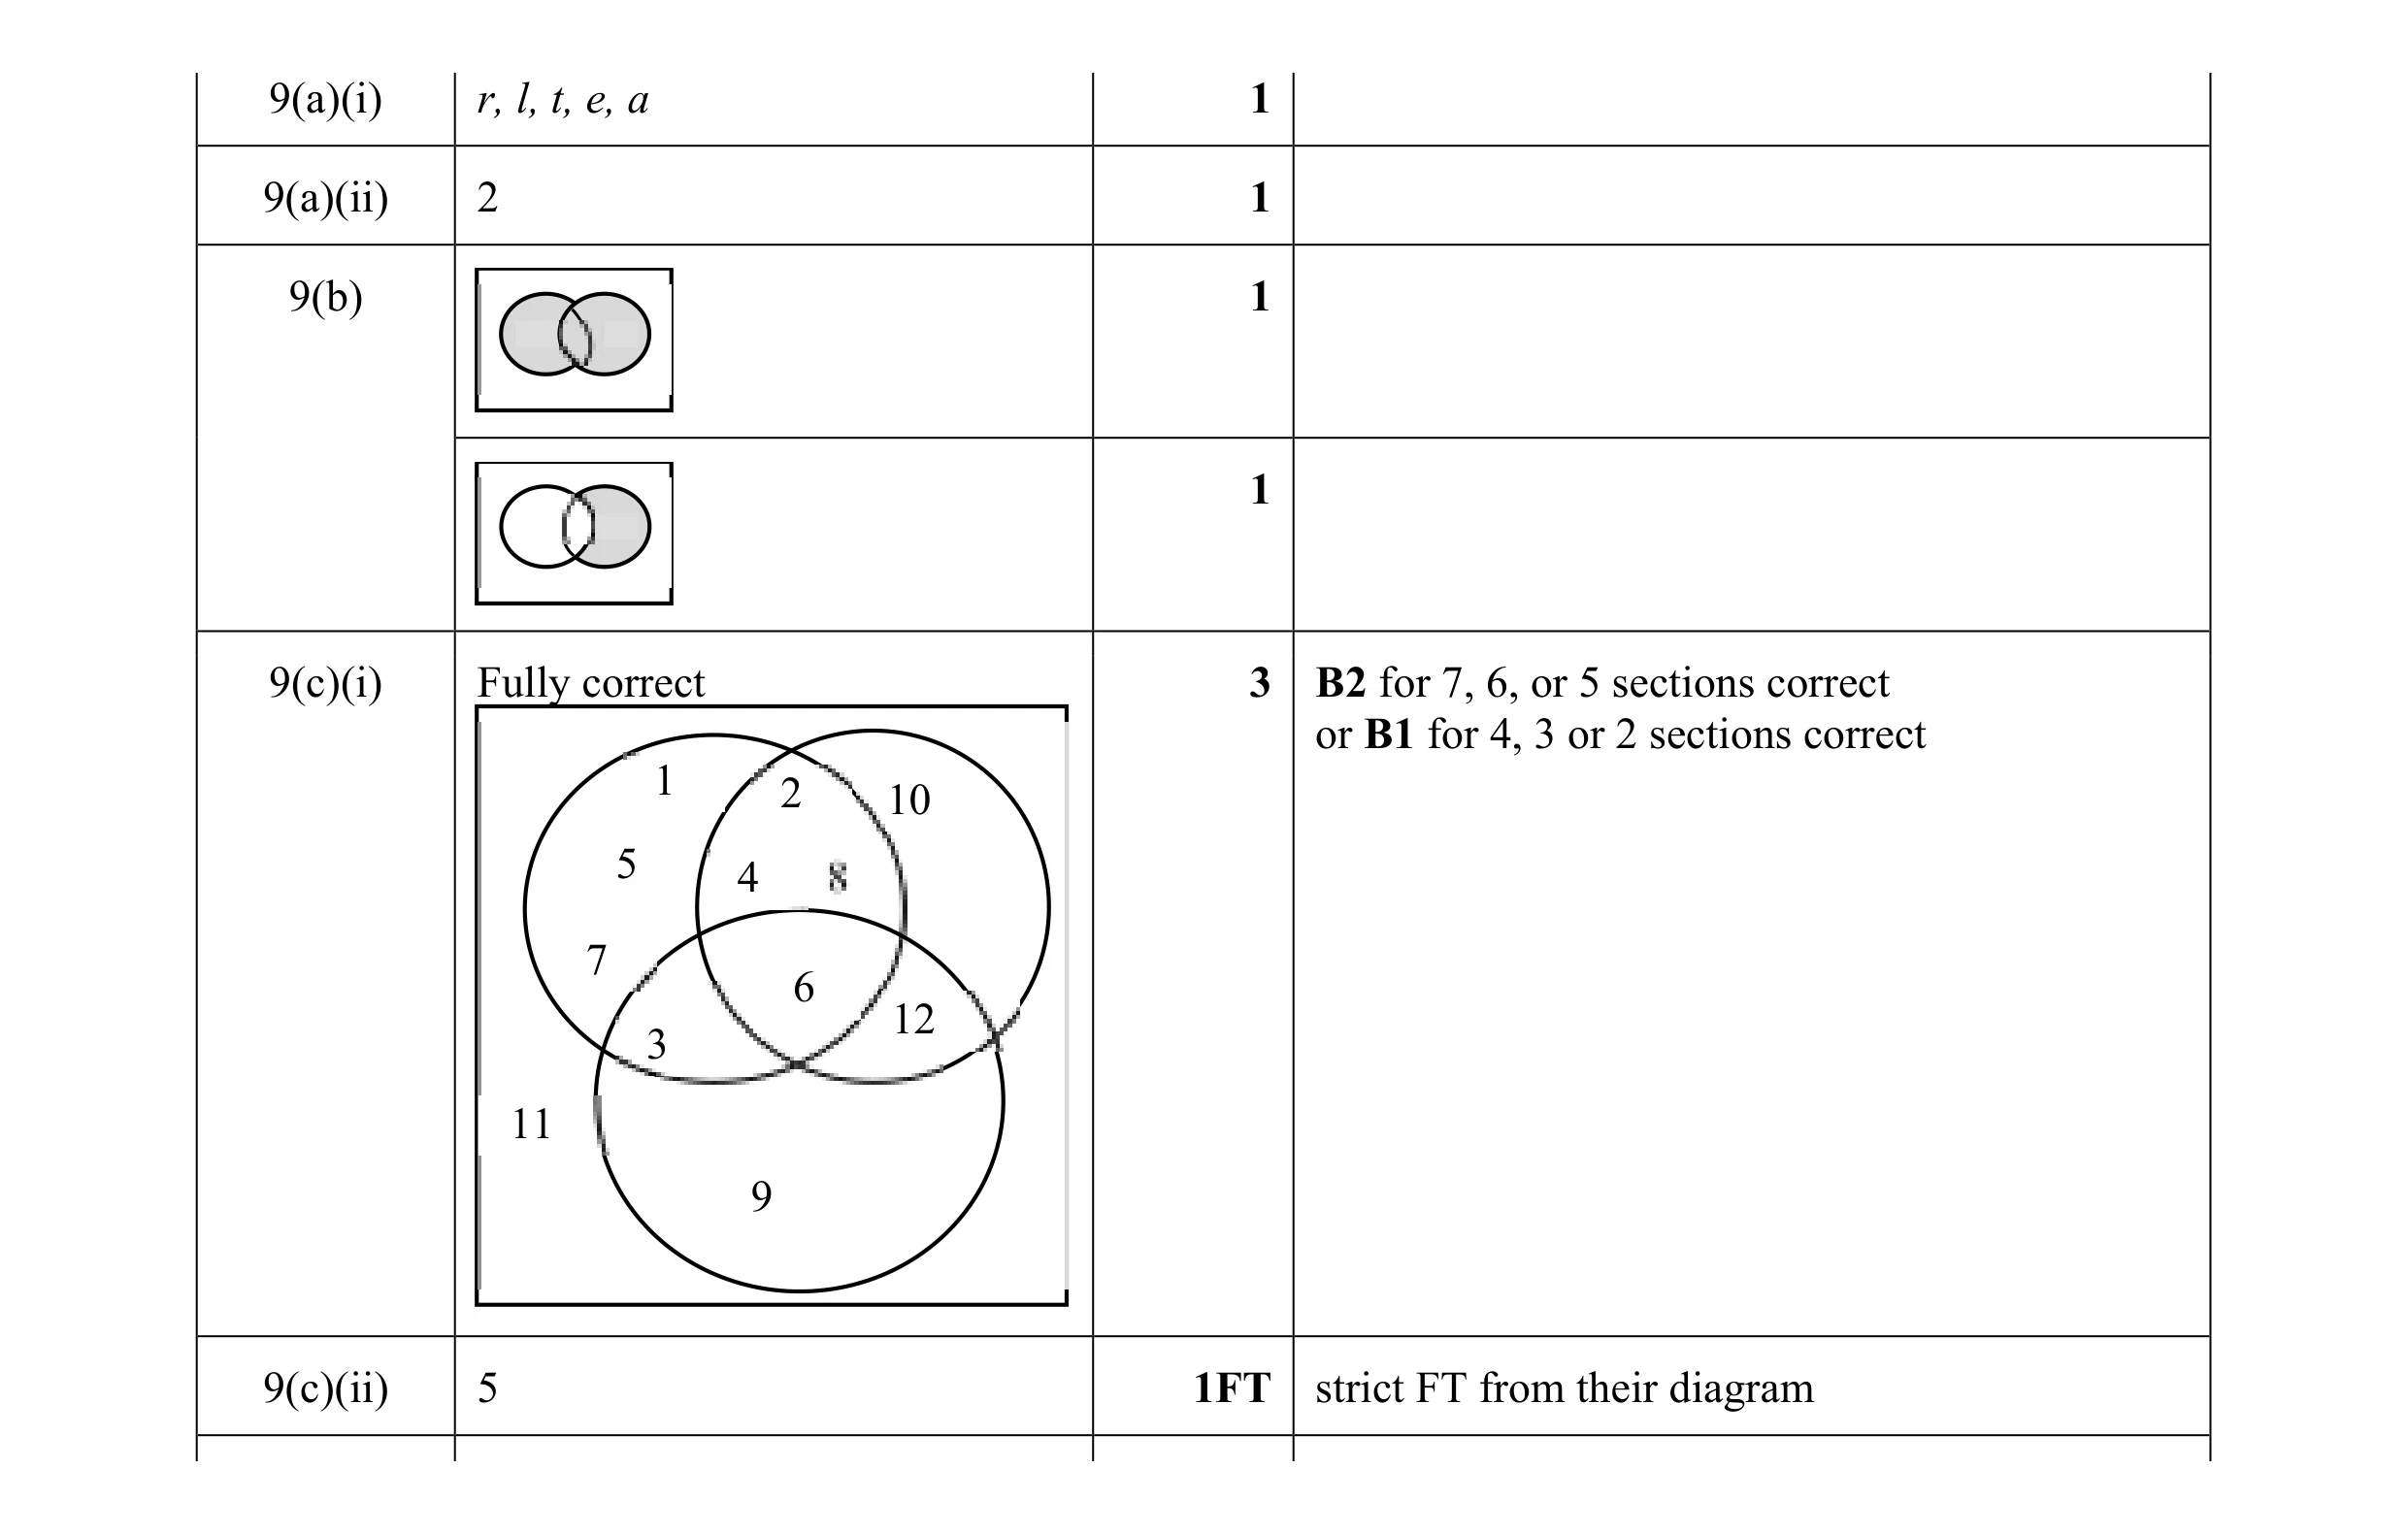 8
8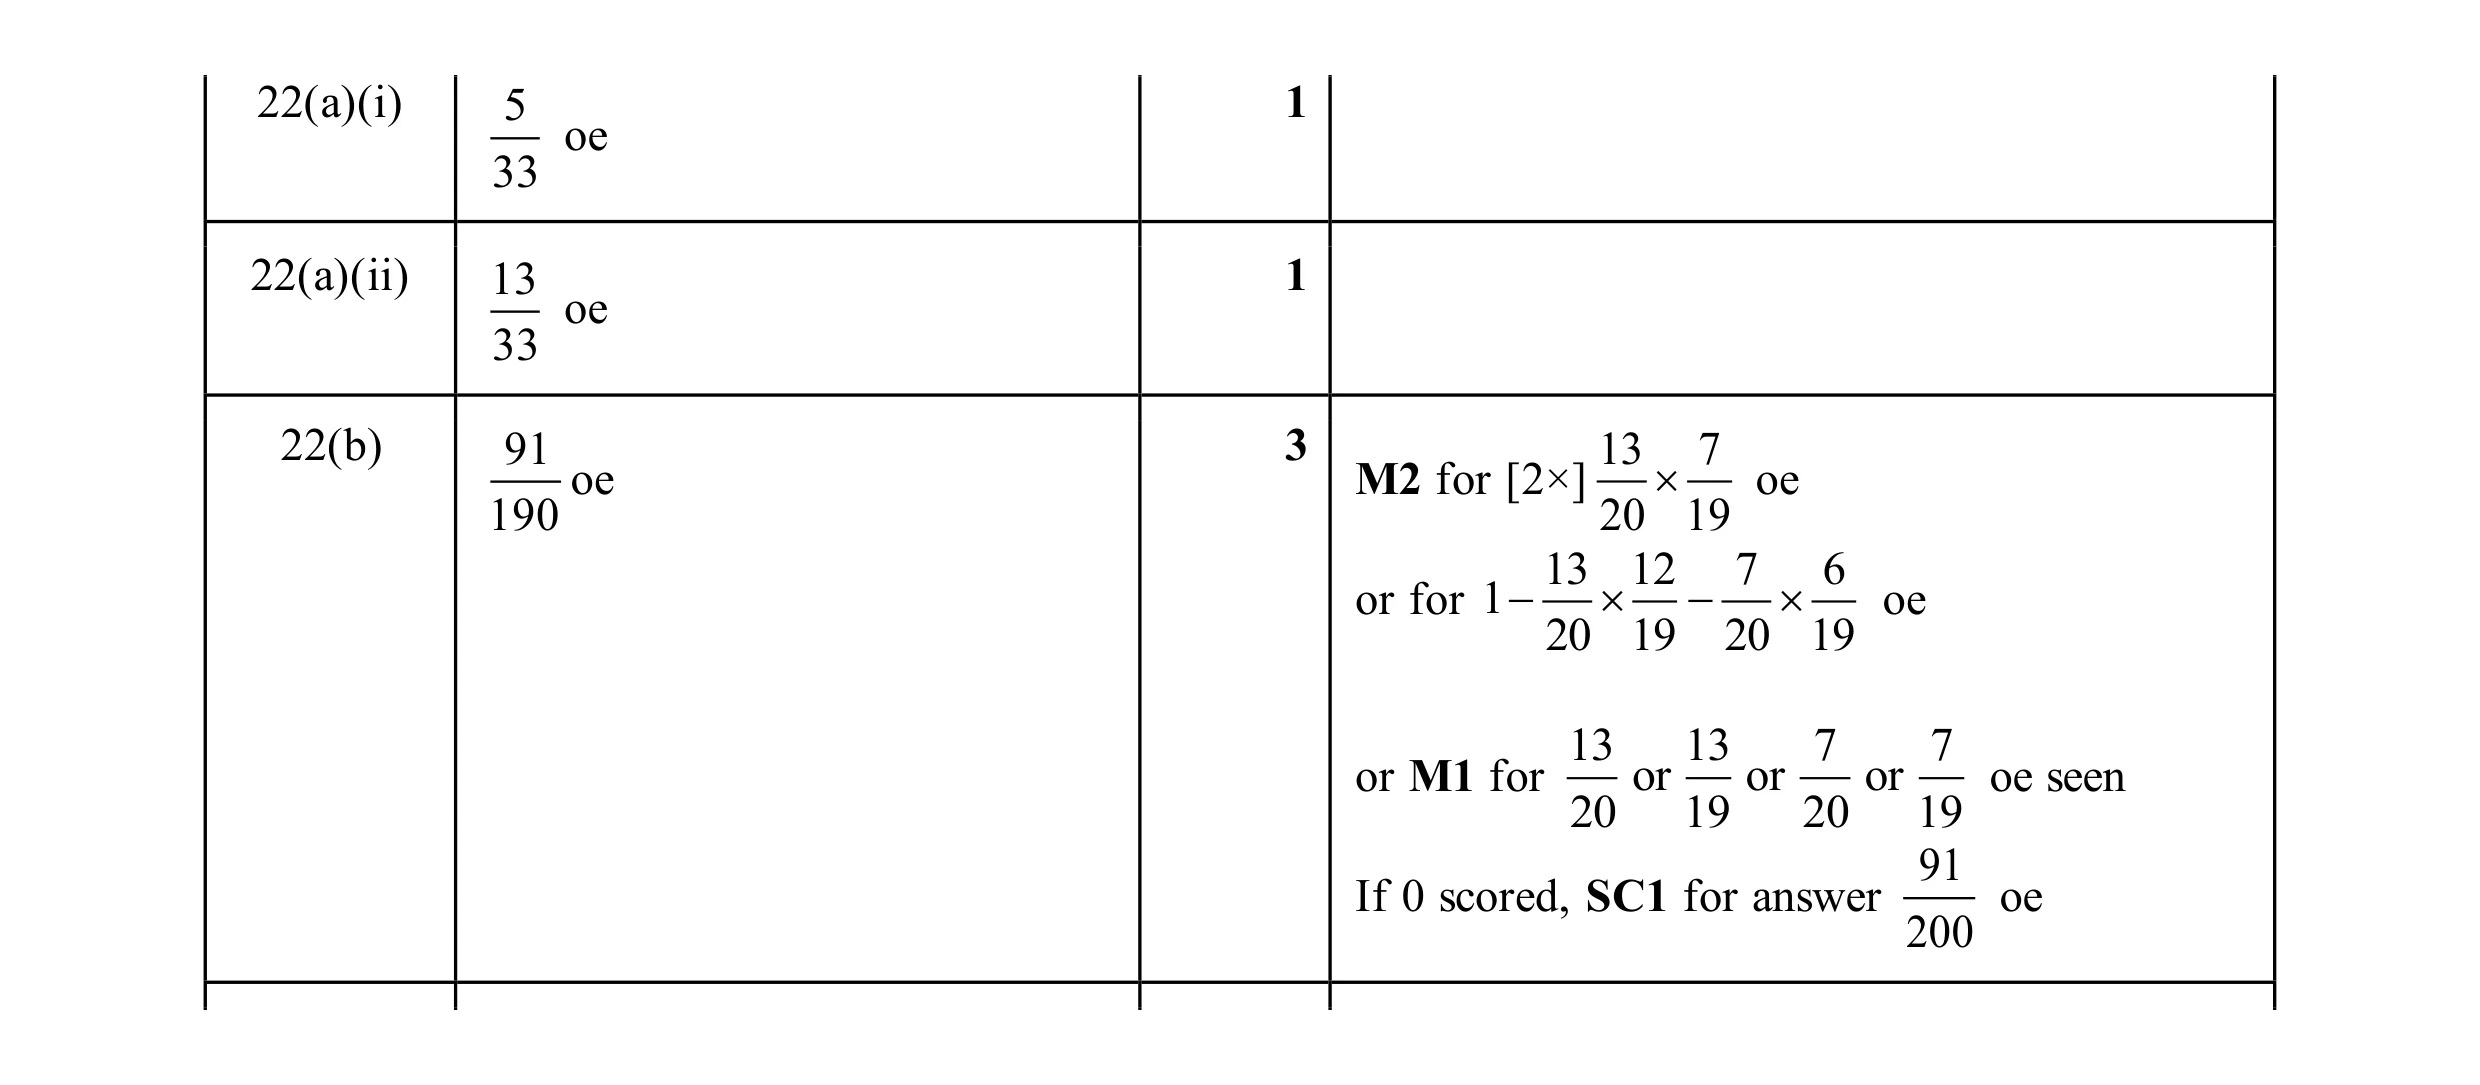 5
5 2
2