Questions as text
Q1 · Urbanisation is the increase in the proportion of a country’s population that live in… 0460/22 Oct/Nov 2018
3 Urbanisation is the increase in the proportion of a country’s population that live in towns and cities. Rapid urbanisation leads to the development of residential areas like those shown in Figs. 3.1 and 3.2 (Insert). (a) Describe the residential area shown in Fig. 3.1. … … … … … … … … … … … … … … [5] (b) Using evidence from the photographs, describe three advantages of living in the residential area in Fig. 3.2 compared to the residential area in Fig. 3.1. 1 … … … 2 … … … 3 … … … [3] [Total: 8]
8 marks
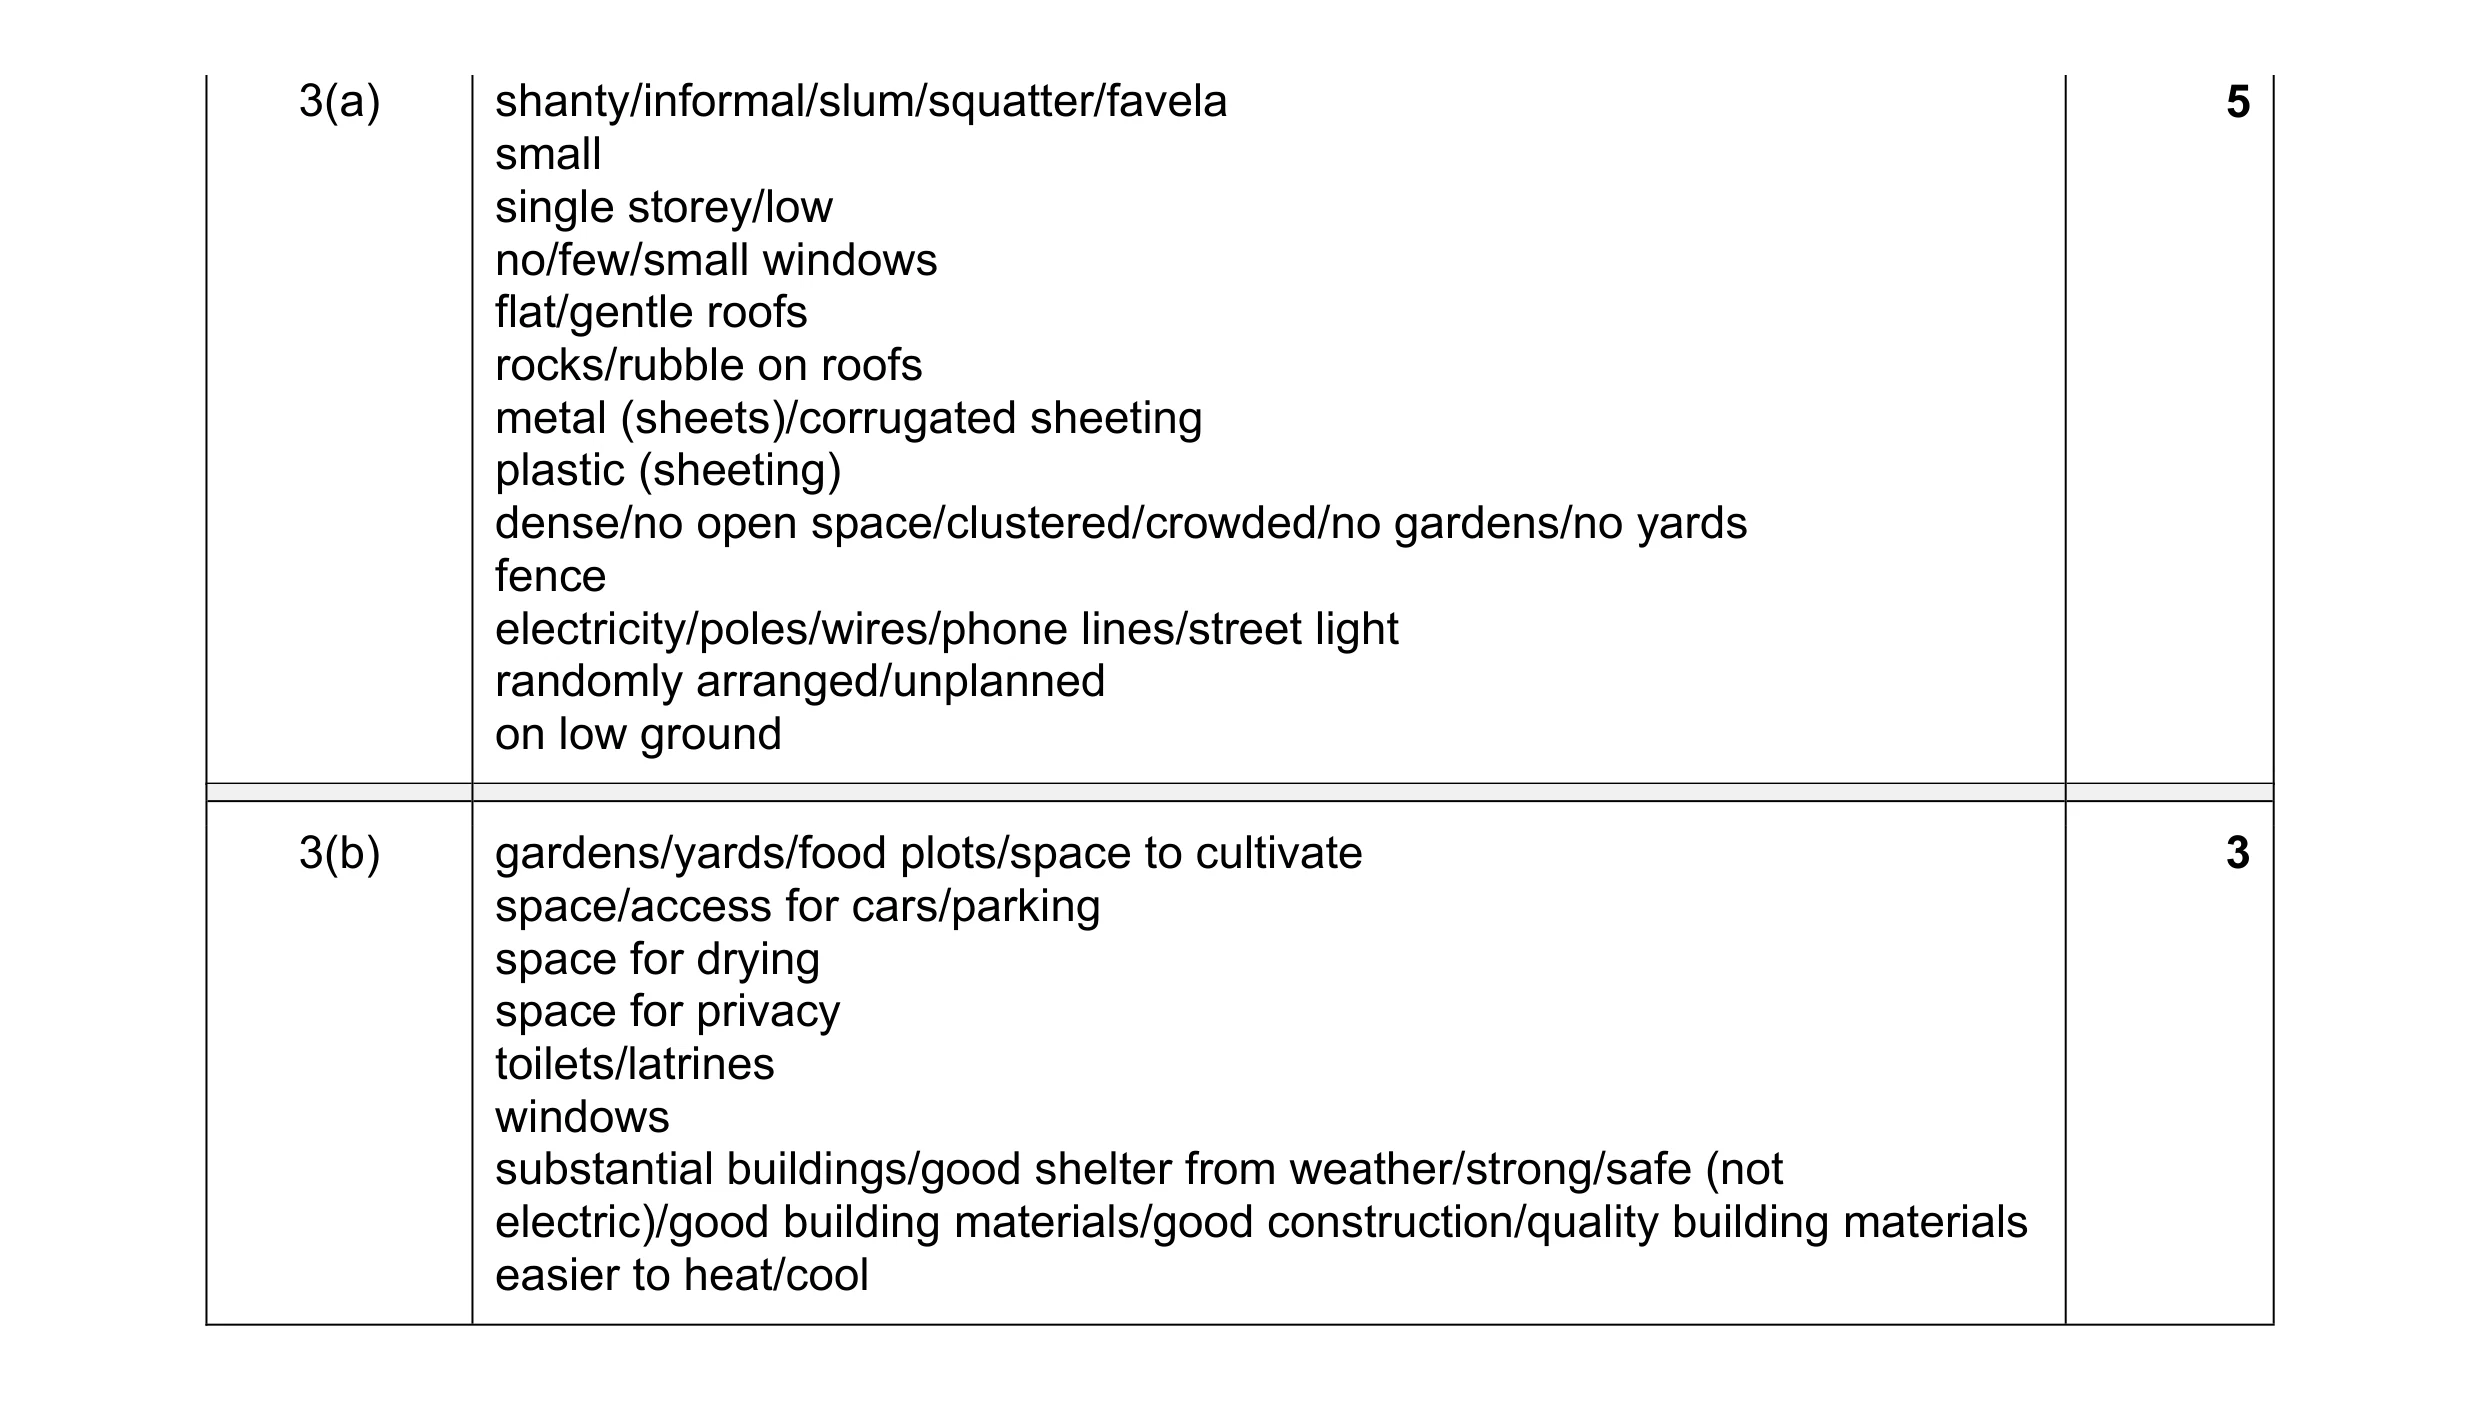
Mark scheme: 3(a) shanty/informal/slum/squatter/favela 5 small single storey/low no/few/small windows flat/gentle roofs rocks/rubble on roofs metal (sheets)/corrugated sheeting plastic (sheeting) dense/no open space/clustered/crowded/no gardens/no yards fence electricity/poles/wires/phone lines/street light randomly arranged/unplanned on low ground 3(b) gardens/yards/food plots/space to cultivate 3 space/access for cars/parking space for drying space for privacy toilets/latrines windows substantial buildings/good shelter from weather/strong/safe (not electric)/good building materials/good construction/quality building materials easier to heat/cool
This question in 0460/22 Oct/Nov 2018
Q2 · Urbanisation is the increase in the proportion of the population that lives in towns and… 0460/22 May/June 2019
6 Urbanisation is the increase in the proportion of the population that lives in towns and cities. (a) Which two of the following are causes of urbanisation? Tick two boxes. Tick (✓) under-population globalisation growth of industry sustainable development urban-rural migration rural-urban migration [2] (b) In 2016, 54% of the world’s population lived in urban areas but the distribution was not even between the continents. Fig. 6.1 shows levels of urbanisation and GDP per capita (a measure of wealth production) in the continents. 90 80 South America North America Europe 70 60 population World 50 in urban Asia areas 40 (%) Africa 30 20 10 0 0 5 10 15 20 25 30 35 40 GDP per capita (US$ 000’s) Fig. 6.1 (i) Australasia has a GDP per capita of 35 000 US$ and 70% of the population live in towns and cities. Plot this information on Fig. 6.1. [1] (ii) What is the relationship between GDP per capita and urbanisation shown on Fig. 6.1? Tick one correct answer below. Tick (✓) positive correlation (as one increases the other increases) negative correlation (as one increases the other decreases) no relationship [1] (iii) Describe how South America is an exception to the relationship shown by Fig. 6.1. … … … [1] (c) Table 6.1 gives information about urbanisation in different parts of the world between 1960 and 2015. Table 6.1 Area Percentage of the population living in towns and cities 1960 2015 North America 70 82 Europe 62 76 South America 49 80 Sub-Saharan Africa 15 38 Urbanisation is the increase in the proportion of the population that lives in towns and cities. Using Table 6.1 only, compare urbanisation in the four parts of the world. … … … … … … … [3] [Total: 8] Additional Pages If you use the following lined pages to complete the answer(s) to any question(s), the question number(s) must be clearly shown. … … … … … … … … … … … … … … … … … … … … … … … … …
8 marks
Mark scheme: 6(a) growth of industry, 2 rural-urban migration 6(b)(i) correct plot of Australasia with GDP per capita of 35 thousand US$ and 70% 1 in towns and cities (name not needed) 6(b)(ii) positive correlation, 1 6(b)(iii) highly urbanised with low GDP, 1 more urbanised than expected, less GDP than expected 6(c) all increased (must state this to get the mark), 3 great(est) change / rapid urbanisation in Africa / more than doubled, great(est) change / rapid urbanisation in South America, Africa still less urbanised in 2015 small(est) change in North America, small(est) change in Europe, North America / Europe urbanised early / already urbanised in 1960
This question in 0460/22 May/June 2019
Q3 · The change in the percentage of the rural population in the world between 1960 and 2015 0460/22 Feb/March 2021
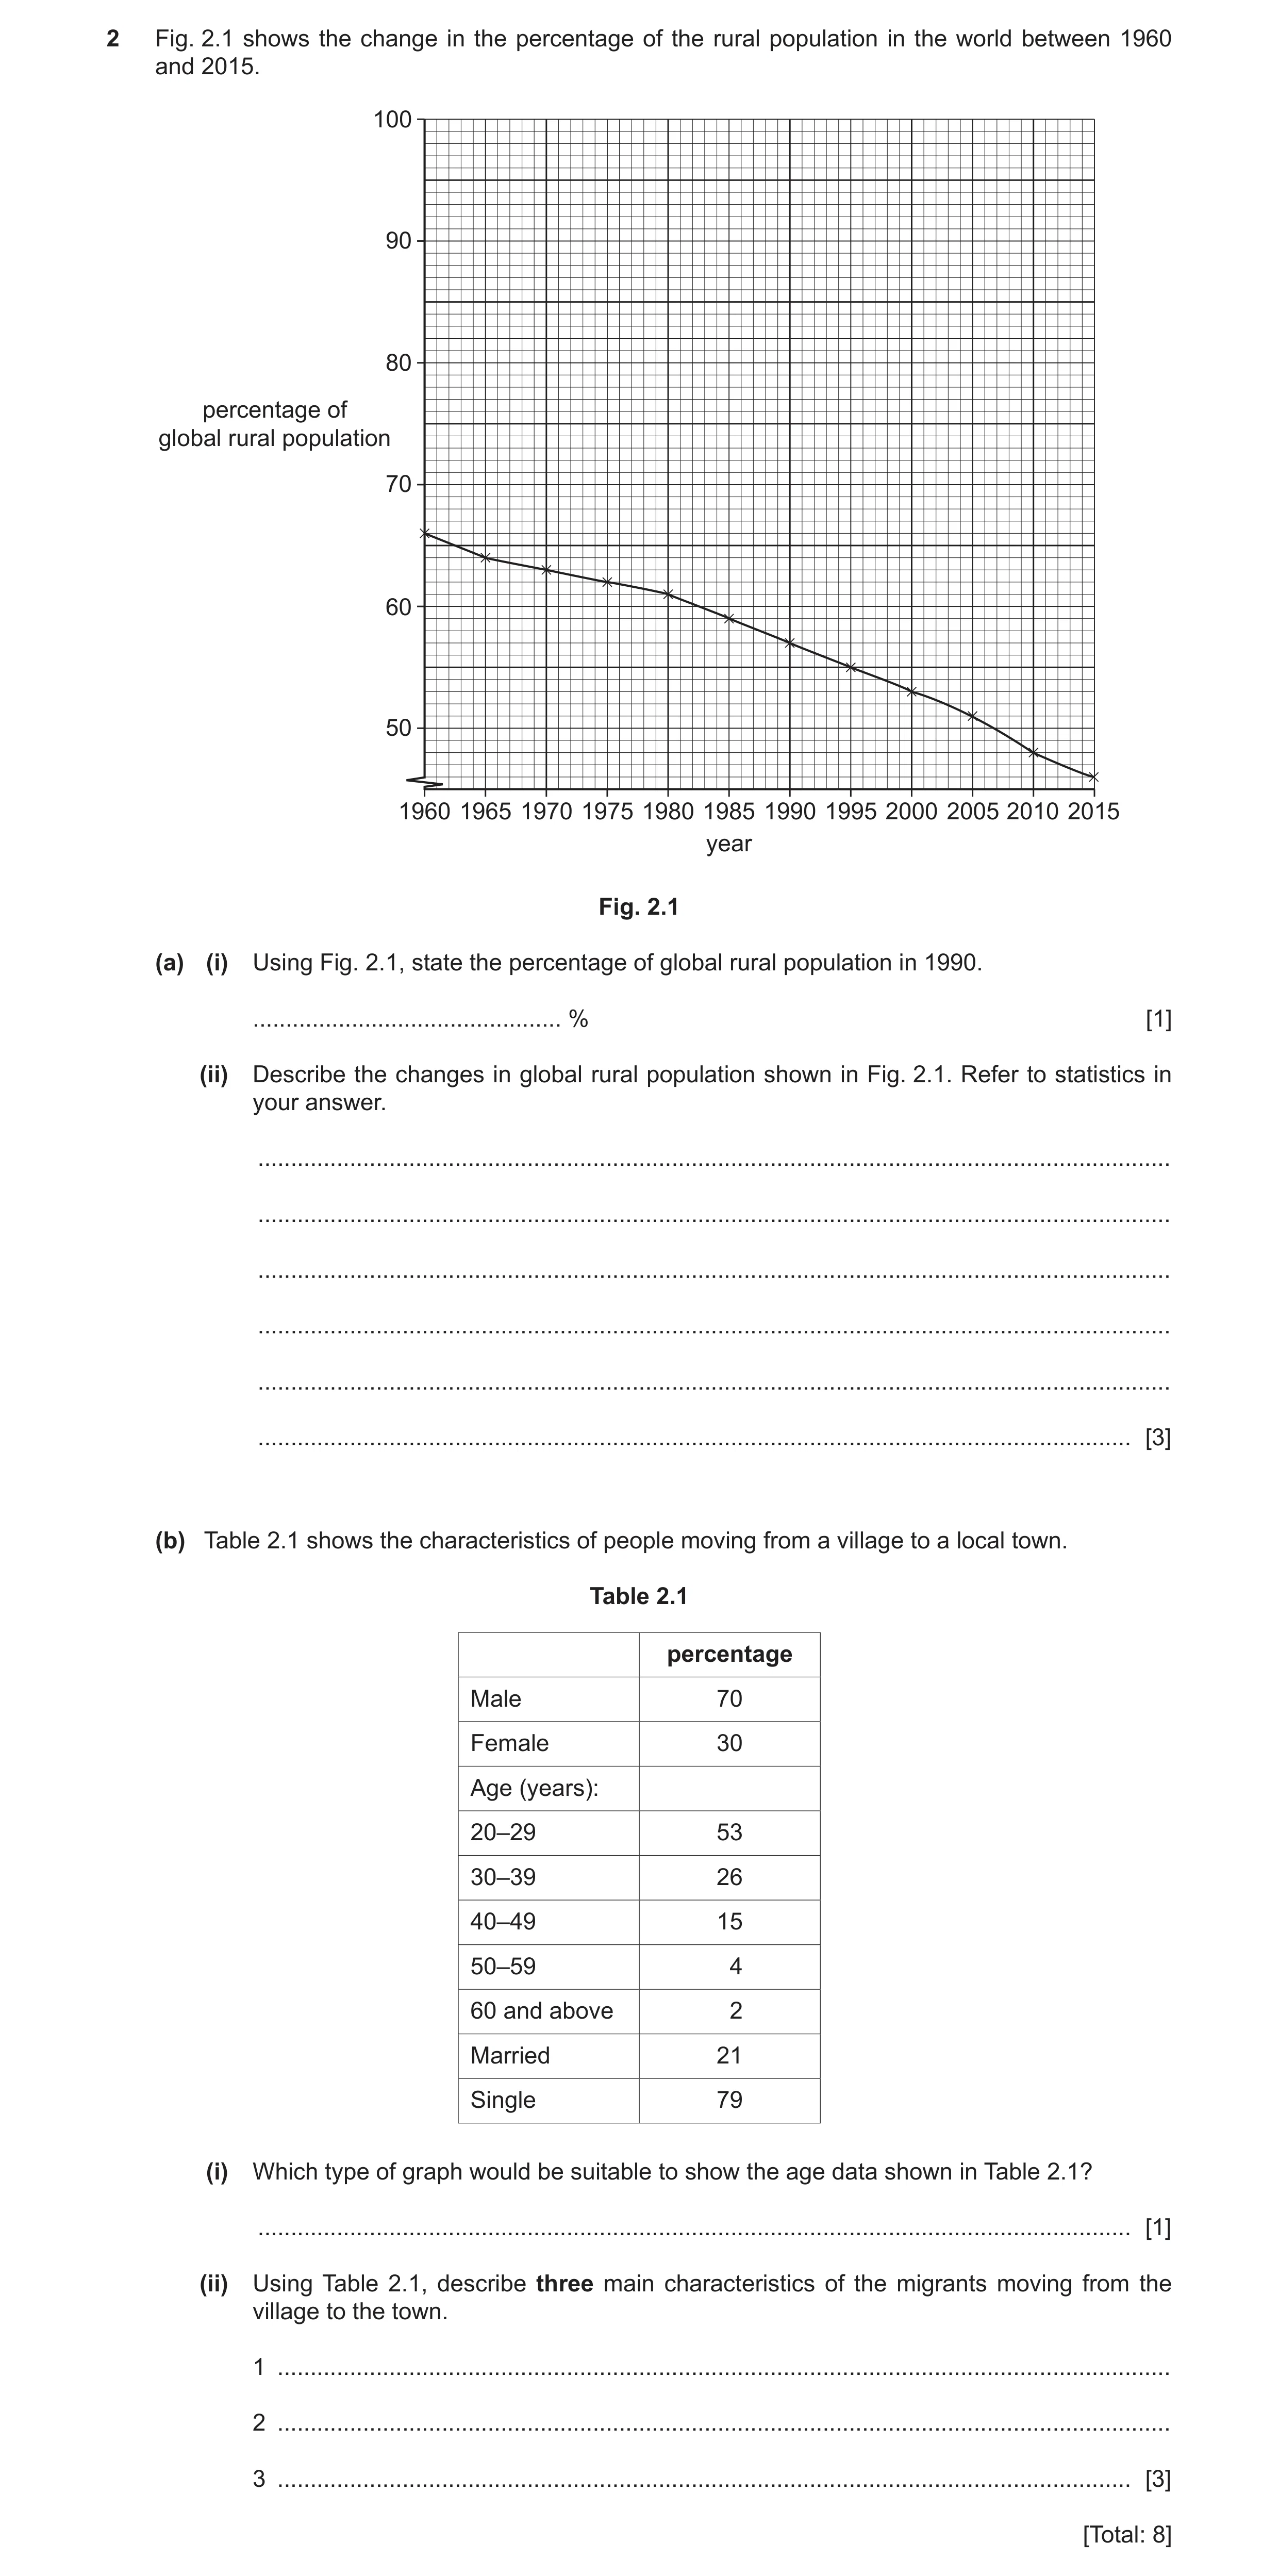
2 Fig. 2.1 shows the change in the percentage of the rural population in the world between 1960 and 2015. 100 90 80 percentage of global rural population 70 60 50 1960 1965 1970 1975 1980 1985 1990 1995 2000 2005 2010 2015 year Fig. 2.1 (a) (i) Using Fig. 2.1, state the percentage of global rural population in 1990. … % [1] (ii) Describe the changes in global rural population shown in Fig. 2.1. Refer to statistics in your answer. … … … … … … [3] (b) Table 2.1 shows the characteristics of people moving from a village to a local town. Table 2.1 percentage Male 70 Female 30 Age (years): 20–29 53 30–39 26 40–49 15 50–59 4 60 and above 2 Married 21 Single 79 (i) Which type of graph would be suitable to show the age data shown in Table 2.1? … [1] (ii) Using Table 2.1, describe three main characteristics of the migrants moving from the village to the town. 1 … 2 … 3 … [3] [Total: 8]
8 marks
Mark scheme: 2(a)(i) 57(%), 1 2(a)(ii) decrease, 3 constant/slower then faster, 66 to 46/by 20%, 2(b)(i) pie/bar(s)/divided bar, 1 2(b)(ii) male, 3 young/working age/decrease with age/under 40/20–29, single,
This question in 0460/22 Feb/March 2021
Q4 · What is the correct term for the growth in the percentage of people living in towns and… 0460/22 Feb/March 2021
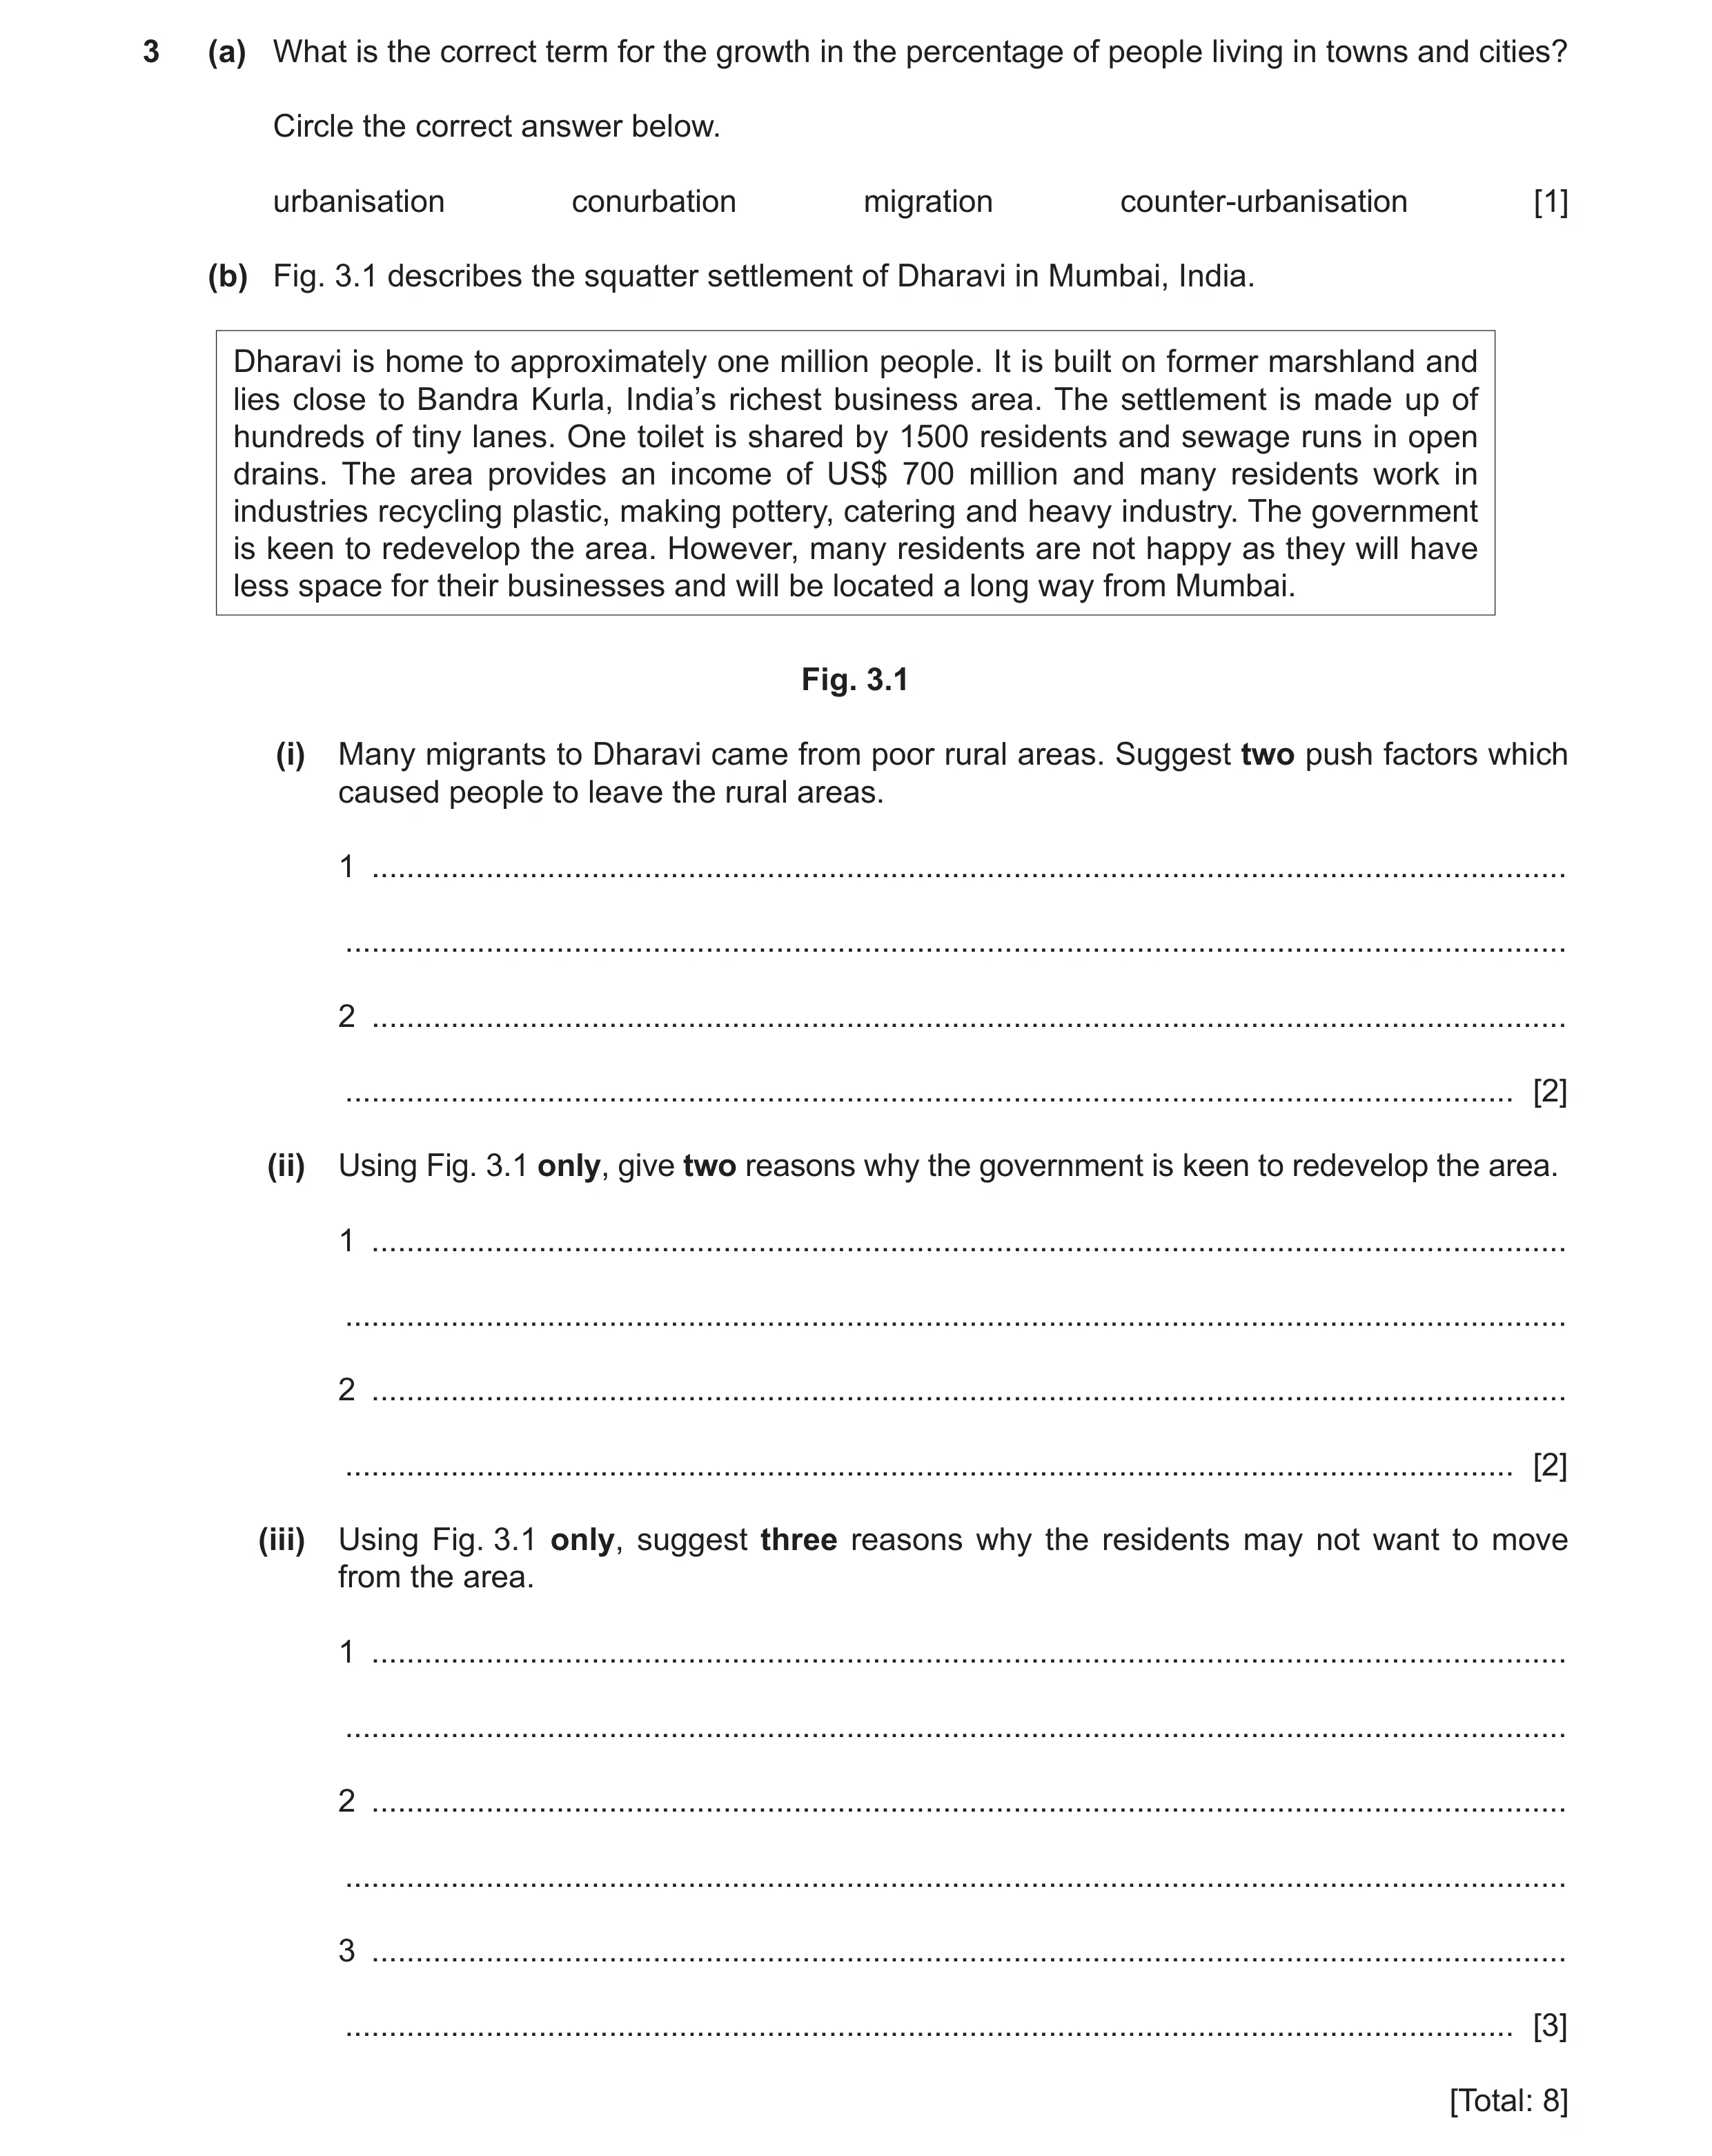
3 (a) What is the correct term for the growth in the percentage of people living in towns and cities? Circle the correct answer below. urbanisation conurbation migration counter-urbanisation [1] (b) Fig. 3.1 describes the squatter settlement of Dharavi in Mumbai, India. Dharavi is home to approximately one million people. It is built on former marshland and lies close to Bandra Kurla, India’s richest business area. The settlement is made up of hundreds of tiny lanes. One toilet is shared by 1500 residents and sewage runs in open drains. The area provides an income of US$ 700 million and many residents work in industries recycling plastic, making pottery, catering and heavy industry. The government is keen to redevelop the area. However, many residents are not happy as they will have less space for their businesses and will be located a long way from Mumbai. Fig. 3.1 (i) Many migrants to Dharavi came from poor rural areas. Suggest two push factors which caused people to leave the rural areas. 1 … … 2 … … [2] (ii) Using Fig. 3.1 only, give two reasons why the government is keen to redevelop the area. 1 … … 2 … … [2] (iii) Using Fig. 3.1 only, suggest three reasons why the residents may not want to move from the area. 1 … … 2 … … 3 … … [3] [Total: 8]
8 marks
Mark scheme: 3(a) urbanisation, 1 3(b)(i) lack of jobs/low income, 2 famine/failure of crops, small plots of land/lack of opportunity in agriculture, lack of education, disease/lack of medical facilities, lack of water supply/electricity/sanitation natural disaster/drought/flood/earthquake/cyclone, war, remoteness, lack of entertainment/recreation/shops, 3(b)(ii) close to business district/Bandra Kurla, 2 insanitary conditions, visual pollution, 3(b)(iii) close community/near friends/family, 3 business will close/have jobs there/lose jobs/need to find new jobs, less new space for business, moved a long way away/away from Mumbai, away from amenities of CBD,
This question in 0460/22 Feb/March 2021
Q5 · Shenzhen, China has undergone extensive urbanisation 0460/21 May/June 2021
3 Shenzhen, China has undergone extensive urbanisation. Table 3.1 shows the changes in the area covered by different urban land uses from 2001–2005. Table 3.1 year land use 2001 2002 2003 2004 2005 (km2) industrial 137 153 204 240 254 residential 136 143 174 169 184 roads 57 64 71 72 83 (a) (i) Use the information in Table 3.1 to complete Fig. 3.1. [2] 250 200 land use Key (km2) 150 industrial residential roads 100 50 0 2001 2002 2003 2004 2005 year Fig. 3.1 (ii) Using Table 3.1 and Fig. 3.1, state the land use that showed the largest increase between 2001 and 2005. … [1] (iii) Many new industries such as electronics have been located in the rural-urban fringe. Suggest reasons why they have located there. … … … … [2] (b) Study Fig. 3.2 (Insert), which is a photograph showing new residential development in Shenzhen. Using evidence from Fig. 3.2 only, describe three advantages of living there. 1 … … 2 … … 3 … … [3] [Total: 8]
8 marks
Mark scheme: 3(a)(i) correct plots of 204 and 174, 2 both lines drawn correctly using key, 3(a)(ii) industrial, 1 3(a)(iii) market in town, 2 labour from town, space/sites available, cheap land/cheaper to build, pleasant surroundings, good road links/accessibility/little traffic congestion, Allow converse inner city problems. 3(b) close city centre/CBD, 3 open space/landscaped/gardens/greenery/trees, (large) windows, road/good accessibility/no traffic congestion, pedestrian crossings, newly/recently built,
This question in 0460/21 May/June 2021
Q6 · Urbanisation causes many problems, including air pollution 0460/23 May/June 2021
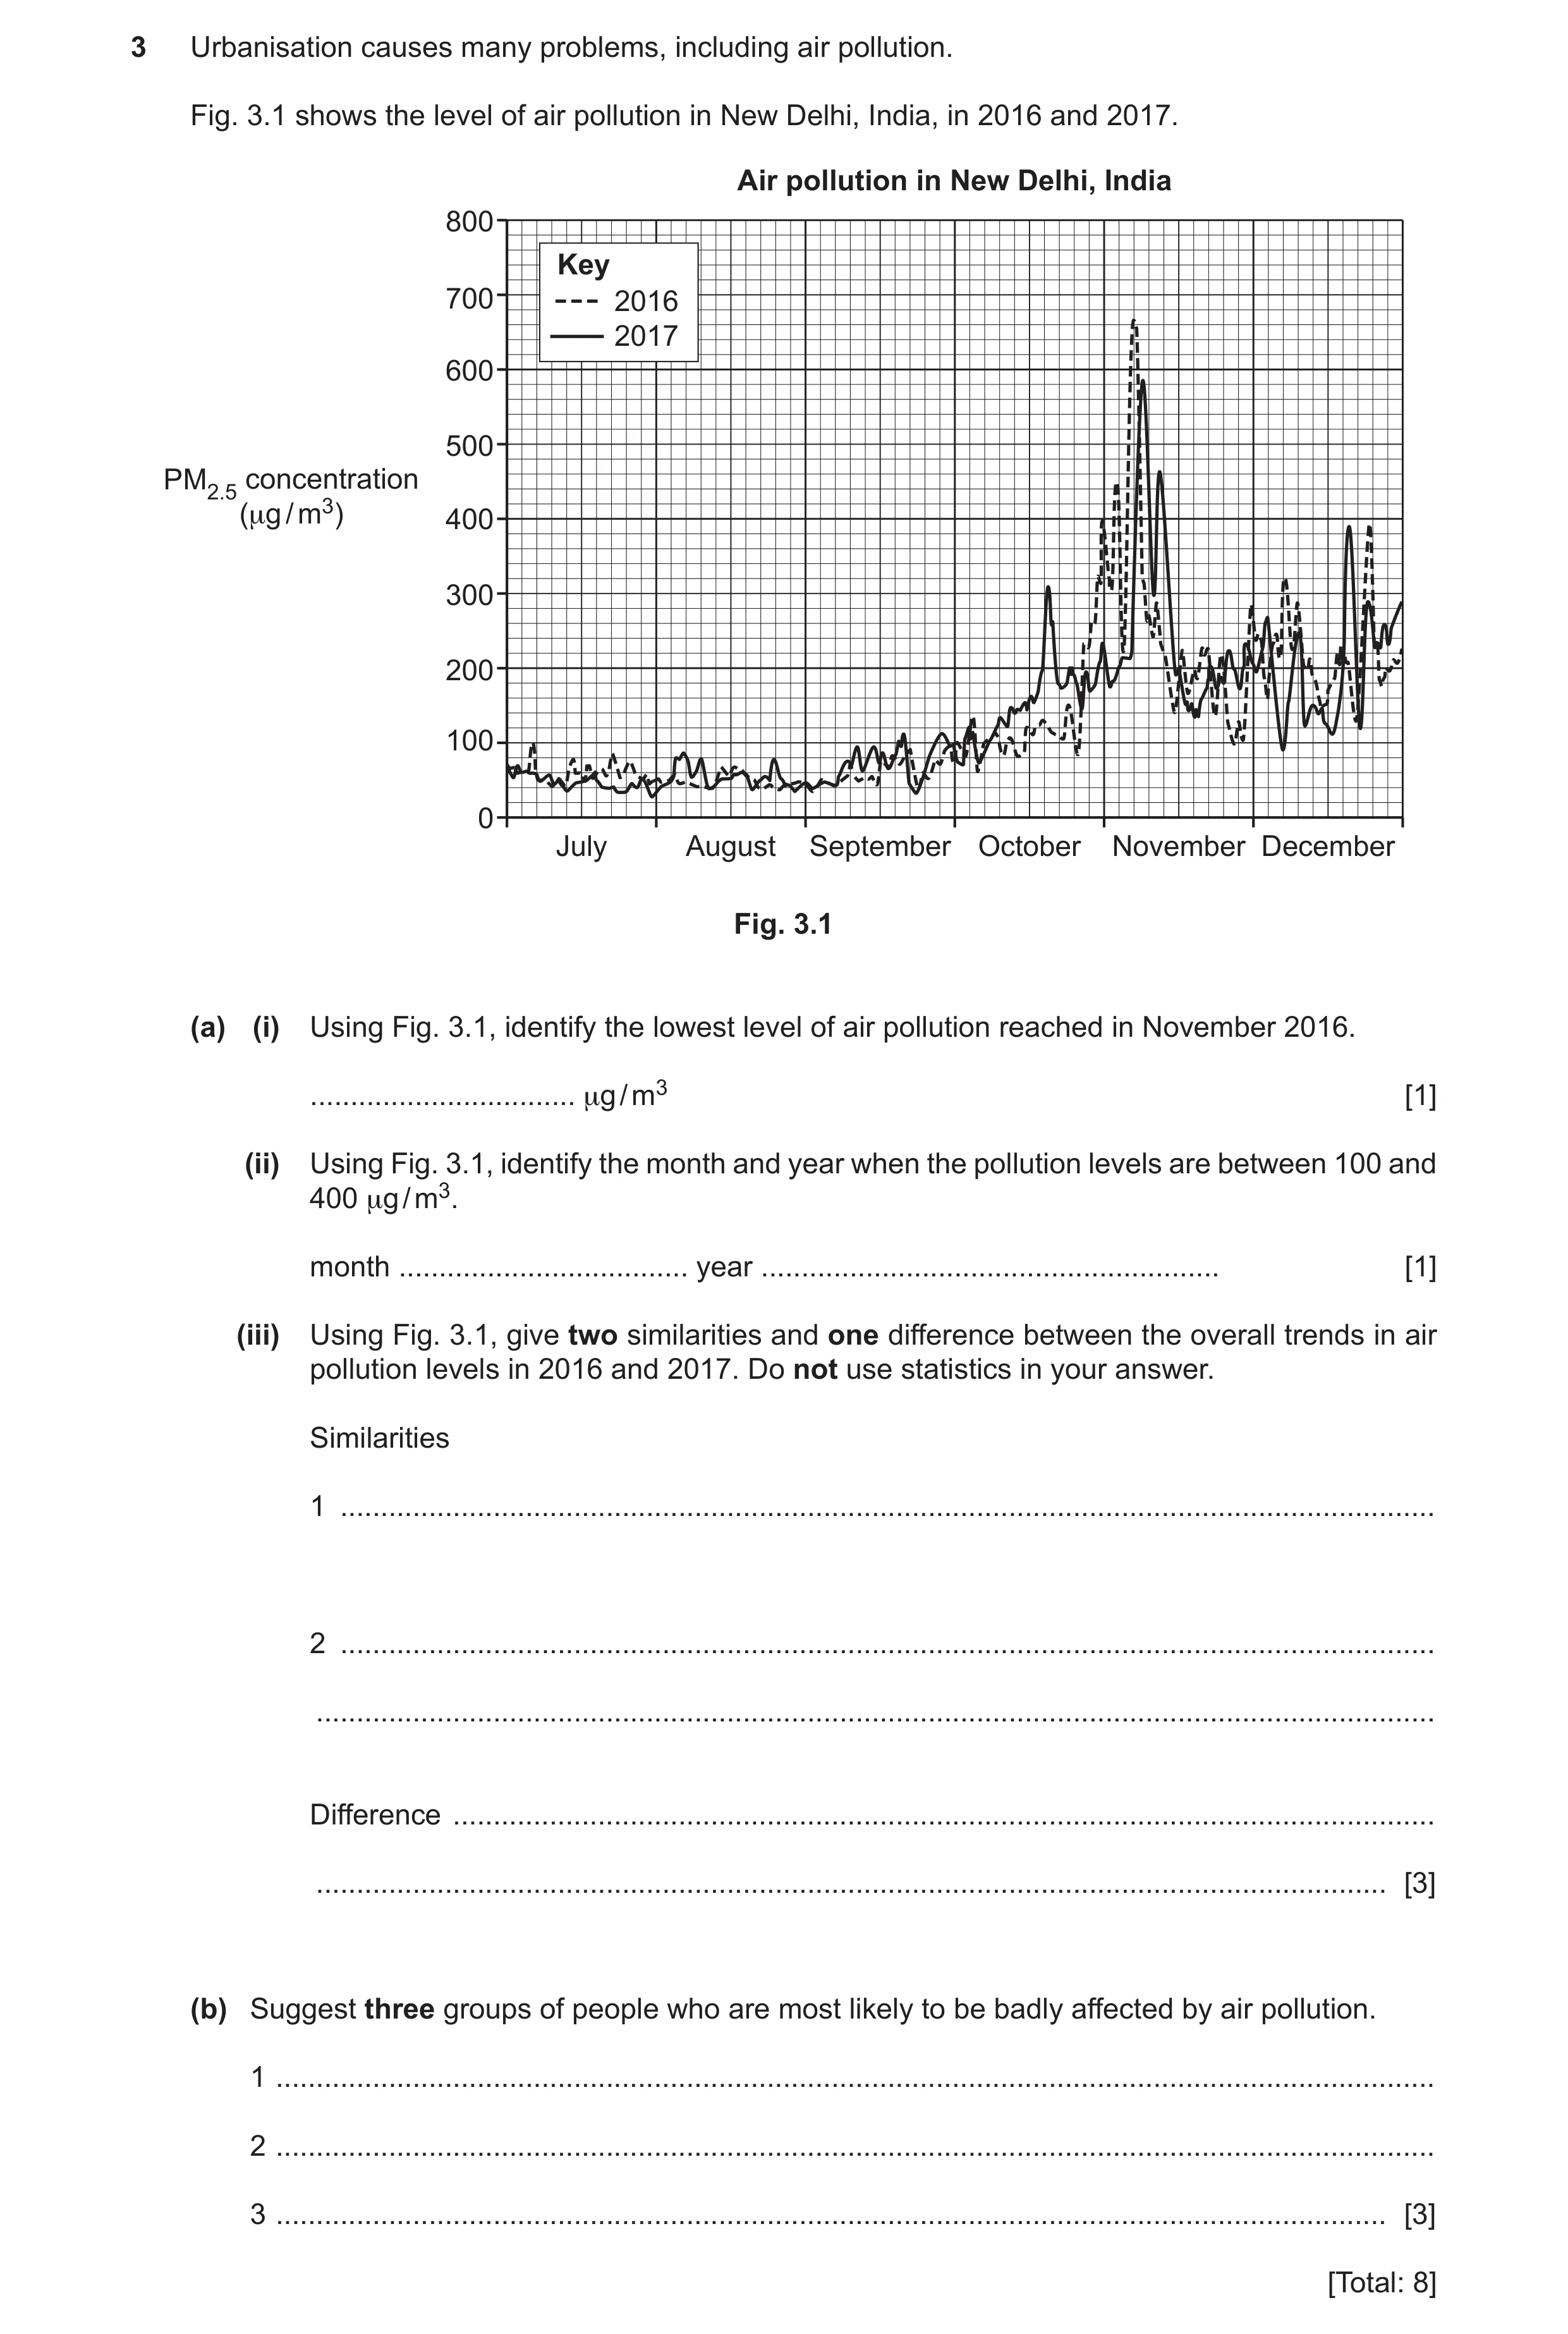
3 Urbanisation causes many problems, including air pollution. Fig. 3.1 shows the level of air pollution in New Delhi, India, in 2016 and 2017. Air pollution in New Delhi, India 800 Key 700 2016 2017 600 500 PM2.5 concentration (μg / m3) 400 300 200 100 0 July August September October November December Fig. 3.1 (a) (i) Using Fig. 3.1, identify the lowest level of air pollution reached in November 2016. … μg / m3 [1] (ii) Using Fig. 3.1, identify the month and year when the pollution levels are between 100 and 400 μg / m3. month … year … [1] (iii) Using Fig. 3.1, give two similarities and one difference between the overall trends in air pollution levels in 2016 and 2017. Do not use statistics in your answer. Similarities 1 … 2 … … Difference … … [3] (b) Suggest three groups of people who are most likely to be badly affected by air pollution. 1 … 2 … 3 … [3] [Total: 8]
8 marks
Mark scheme: 3(a)(i) 100 (μg/m3), 1 3(a)(ii) December 2016 (both needed), 1 3(a)(iii) Similarities: = 2 3 low July/August/September, similar July/August/September, rise in October/November, high(est) in November, fluctuate, increase overall/towards the end of the year, Differences: = 1 higher overall peak in 2016, lower overall trough in 2017, October: 2017 higher/2016 lower/2017 increases but not 2016, November: 2016 higher/2017 lower, 3(b) young/babies/children/infants/young dependents, 3 elderly/old dependents, people with asthma/lung conditions, people who spend time outside or an example, commuters, people who live beside main roads, work in certain industries,
This question in 0460/23 May/June 2021
Q7 · Urbanisation is the increase in the percentage of the population living in towns and… 0460/22 Oct/Nov 2021
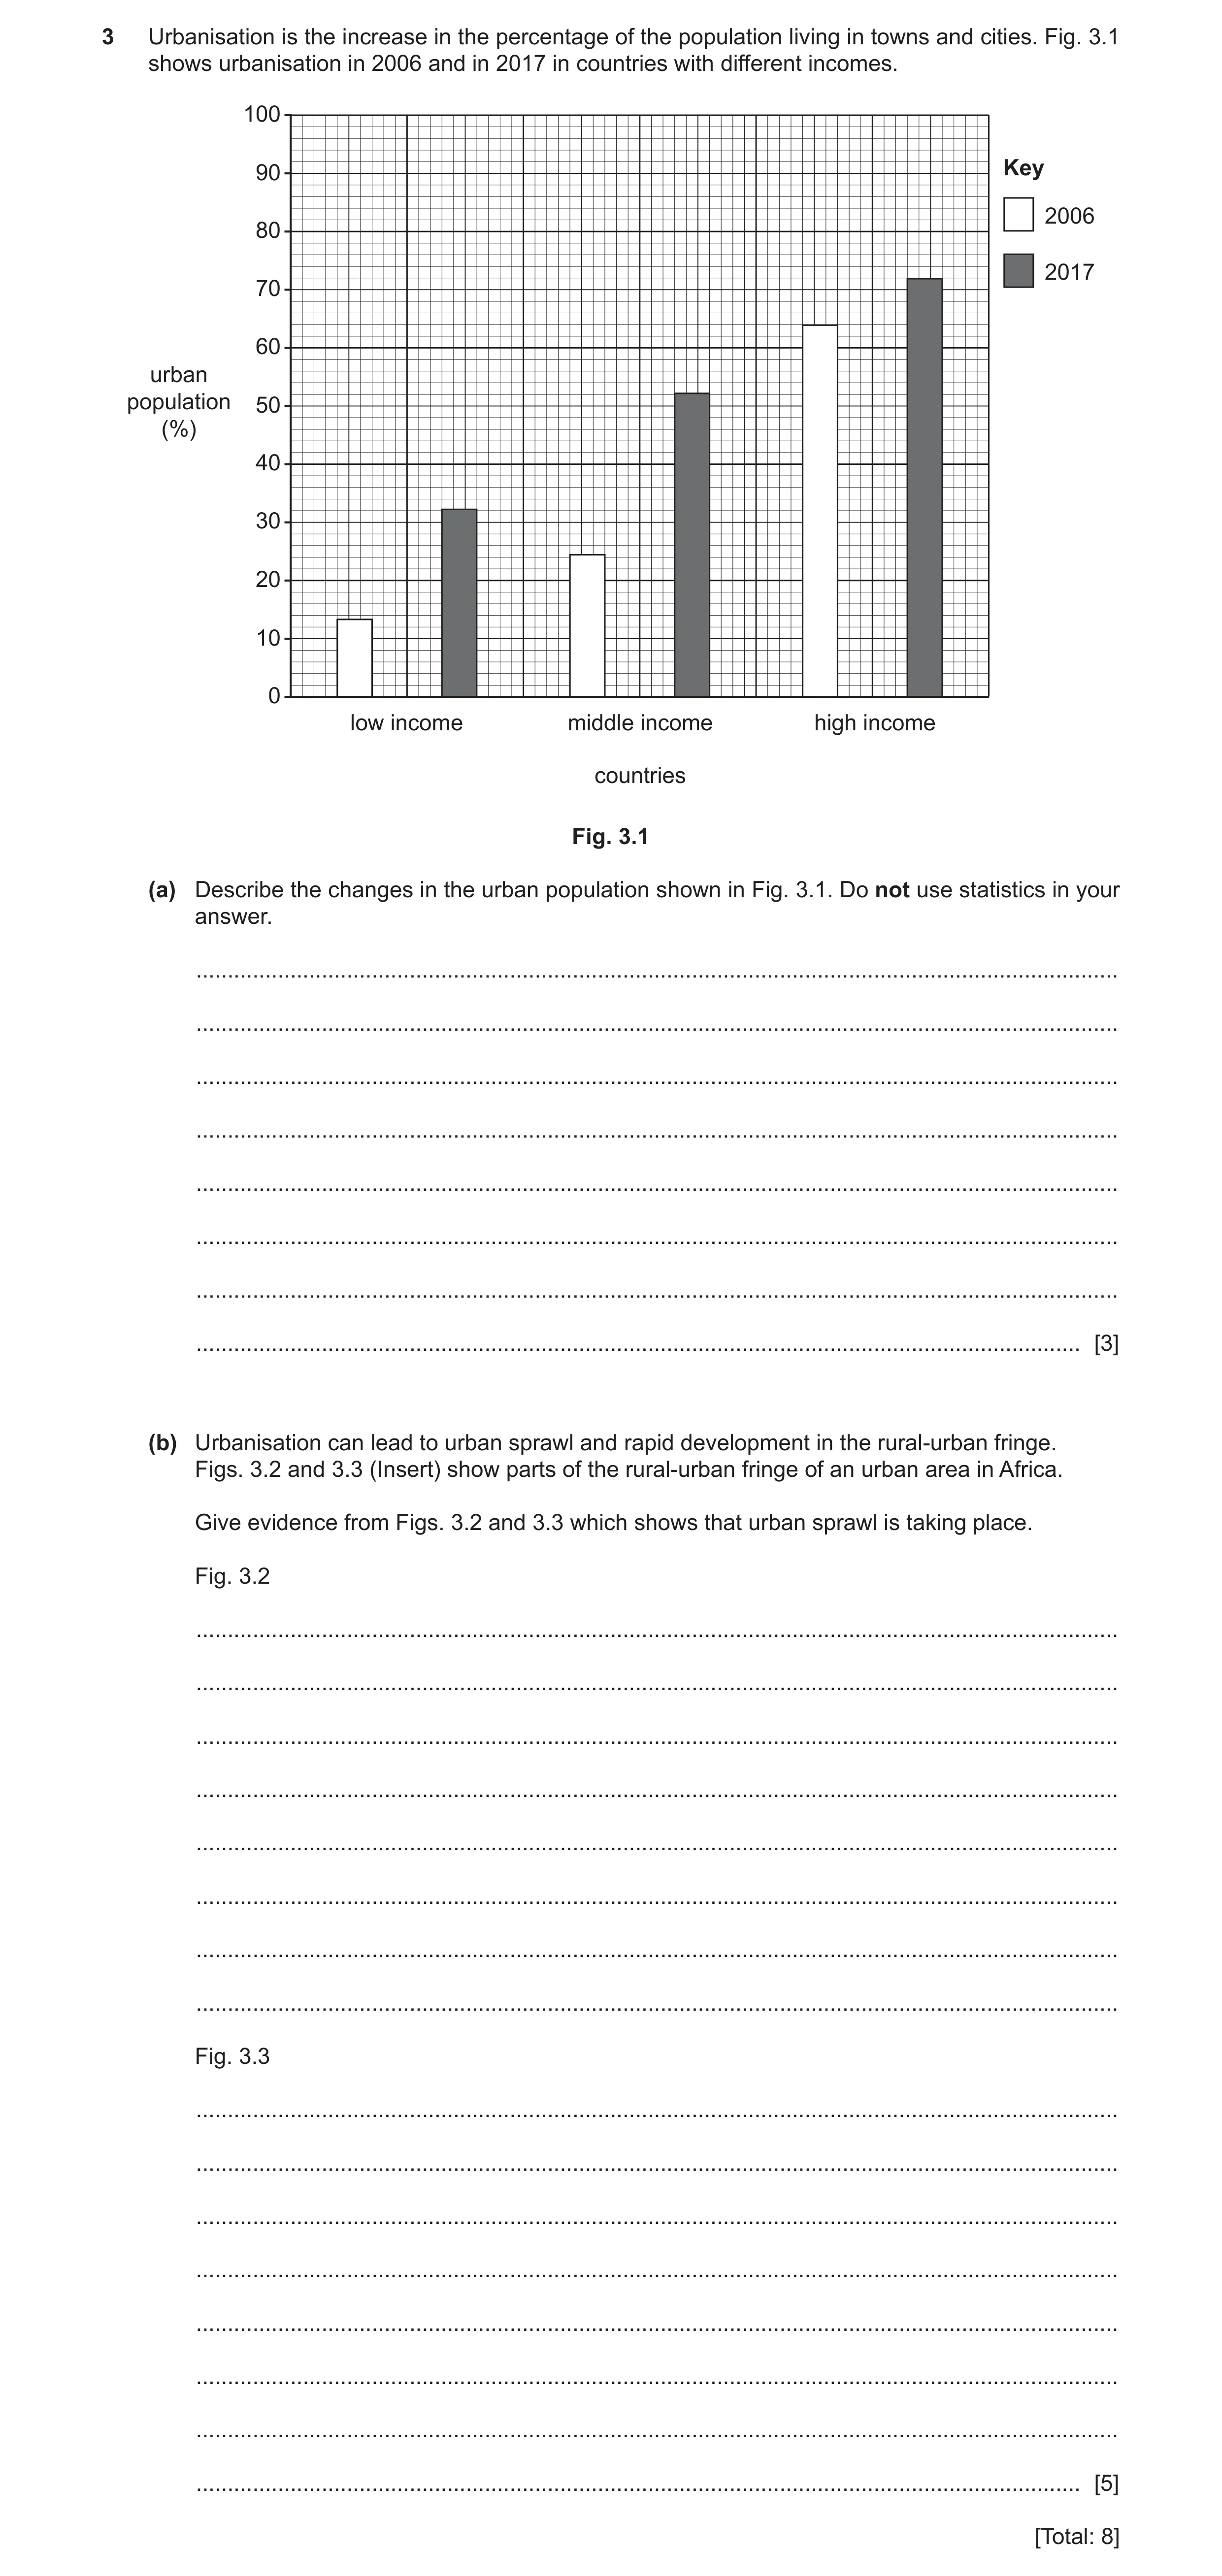
3 Urbanisation is the increase in the percentage of the population living in towns and cities. Fig. 3.1 shows urbanisation in 2006 and in 2017 in countries with different incomes. 100 90 Key 2006 80 2017 70 60 urban population 50 (%) 40 30 20 10 0 low income middle income high income countries Fig. 3.1 (a) Describe the changes in the urban population shown in Fig. 3.1. Do not use statistics in your answer. … … … … … … … … [3] (b) Urbanisation can lead to urban sprawl and rapid development in the rural-urban fringe. Figs. 3.2 and 3.3 (Insert) show parts of the rural-urban fringe of an urban area in Africa. Give evidence from Figs. 3.2 and 3.3 which shows that urban sprawl is taking place. Fig. 3.2 … … … … … … … … Fig. 3.3 … … … … … … … … [5] [Total: 8]
8 marks
Mark scheme: 3(a) increase in all types, 3 high income countries small(est) increase/already urbanised, middle income countries large(est) increase/doubled, low income countries large(est) increase/doubled, 3(b) Fig. 3.2 5 construction (site)/area cleared (of vegetation), free space/unused areas (for development), motorway/main road/ring road/wide road/new road, sports ground/stadium/recreational area, golf course, residential, offices/factory, low rise/single storey/double storey, Fig. 3.3 shanty/informal settlement/poor quality/squatter/shacks/houses in poor condition/unstable houses, unplanned/randomly arranged/irregular pattern, dirt/sand/gravel/dusty/unbuilt/beginning to be tarred roads, (some) new/modern/brick/well-built houses (on right), main road/wide road (in background), Reserve one mark for each part.
This question in 0460/22 Oct/Nov 2021
Q8 · Urbanisation can lead to urban sprawl which can affect the natural environment 0460/23 May/June 2022
3 Urbanisation can lead to urban sprawl which can affect the natural environment. Figs. 3.1 and 3.2 (Insert) show new industrial units and housing in the rural–urban fringe. (a) (i) Using evidence from Fig. 3.1, suggest three ways in which the developments are causing a negative impact on the natural environment. 1 … … 2 … … 3 … … [3] (ii) Using evidence from Fig. 3.2, identify two ways in which planners have attempted to reduce the impact on the natural environment. 1 … … 2 … … [2] (b) Fig. 3.3 (Insert) shows a new shopping development in the rural–urban fringe. Using evidence from Fig. 3.3 only, suggest three reasons why people choose to shop there. 1 … … 2 … … 3 … … … [3] [Total: 8]
8 marks
Mark scheme: 3(a)(i) natural vegetation cut down/reduced/damaged/deforestation; 3 less interception/more surface runoff/impermeable surfaces/tarmac; loss of habitat/disruption of food chains; reduced biodiversity/less species; more air pollution/fumes/CO2/greenhouse gases from cars/chimneys/house; noise pollution scaring wildlife; light pollution disturbs animals; cars kill wildlife; 3(a)(ii) leaving some trees in place; 2 planting new trees/plants/vegetation/replanting/afforestation; leaving/creating green open spaces/wildlife corridors/zones/parks; fencing/barrier; Focus must be on the natural environment. 3(b) Parking; 3 security/lighting; large(r) store–more choice of goods/more stock; wide roads/accessible by road; lack of traffic congestion/clear roads; covered/under one roof/indoors; lack of crowds/quiet; pavements/pedestrian access; level site/on one level/disabled access;
This question in 0460/23 May/June 2022
Q9 · Information about migration in the nine provinces of South Africa 0460/23 Oct/Nov 2022
3 Fig. 3.1 shows information about migration in the nine provinces of South Africa. emigration 207 662 emigration 544 875 emigration 417 453 immigration 317 261 immigration 1 595 106 immigration 278 847 net migration 109 599 net migration 1 050 231 net migration –138 606 ZIMBABWE BOTSWANA MOZAMBIQUE emigration 212 271 Limpopo immigration 285 678 NAMIBIA net migration 73 407 Mpumalanga Gauteng North West ESWATINI emigration 160 107 immigration 147 246 Free State net migration KwaZulu- Northern Cape Natal LESOTHO emigration 360 830 immigration 307 123 N Atlantic Eastern Cape net migration –53 707 Ocean Western Cape 0 300 Indian km Ocean Key emigration 175 831 emigration 76 832 emigration 515 648 country borders immigration 485 560 immigration 82 502 immigration 191 435 province borders net migration 309 729 net migration 5670 net migration –324 213 Fig. 3.1 (a) (i) Using Fig. 3.1, calculate the net migration of Free State province. … [1] (ii) Put the following states in order of their net migration gain. Gauteng Northern Cape North West Western Cape … highest … … … lowest [2] (b) Fig. 3.2 shows information about poverty in the South African provinces. ZIMBABWE BOTSWANA MOZ NAMIBIA ESWATINI LESOTHO N Atlantic Ocean 0 300 Indian km Ocean Key percentage of households in poverty more than 11 7.1–11 3.1–7 3 or less MOZ Mozambique Fig. 3.2 Migrants move from the poorest areas to the richest areas. Using Figs. 3.1 and 3.2, describe how far this is true for the two poorest provinces (more than 11% of households in poverty). … … … … … … [3] (c) Gauteng is one of the richer provinces, however it has some of the worst housing conditions in South Africa. Using Figs. 3.1 and 3.2, suggest what causes this. … … … … … [2] [Total: 8]
8 marks
Mark scheme: 3(a)(i) 12 861 1 3(a)(ii) Gauteng 2 Western Cape Northwest Northern Cape 3(b) Both (Limpopo and Eastern Cape) have negative net migration/higher 3 number of emigrants than immigrants; Both have high numbers of emigrants/people moving away; However, Limpopo also has a large number/proportion of immigrants. 3(c) Large numbers of immigrants/too many migrants/high(est) net migration; 2 Lack of space to build housing/Gauteng small(est) province/high population density; Who live in informal/squatter settlements/overcrowded housing; Shortage of housing/only poor-quality housing available/can’t build housing fast enough/authorities cannot afford to provide housing for them/provides low quality cheap housing; Lack of services e.g., running water/schools etc.
This question in 0460/23 Oct/Nov 2022
Q10 · Information about urban population 0460/21 Oct/Nov 2024
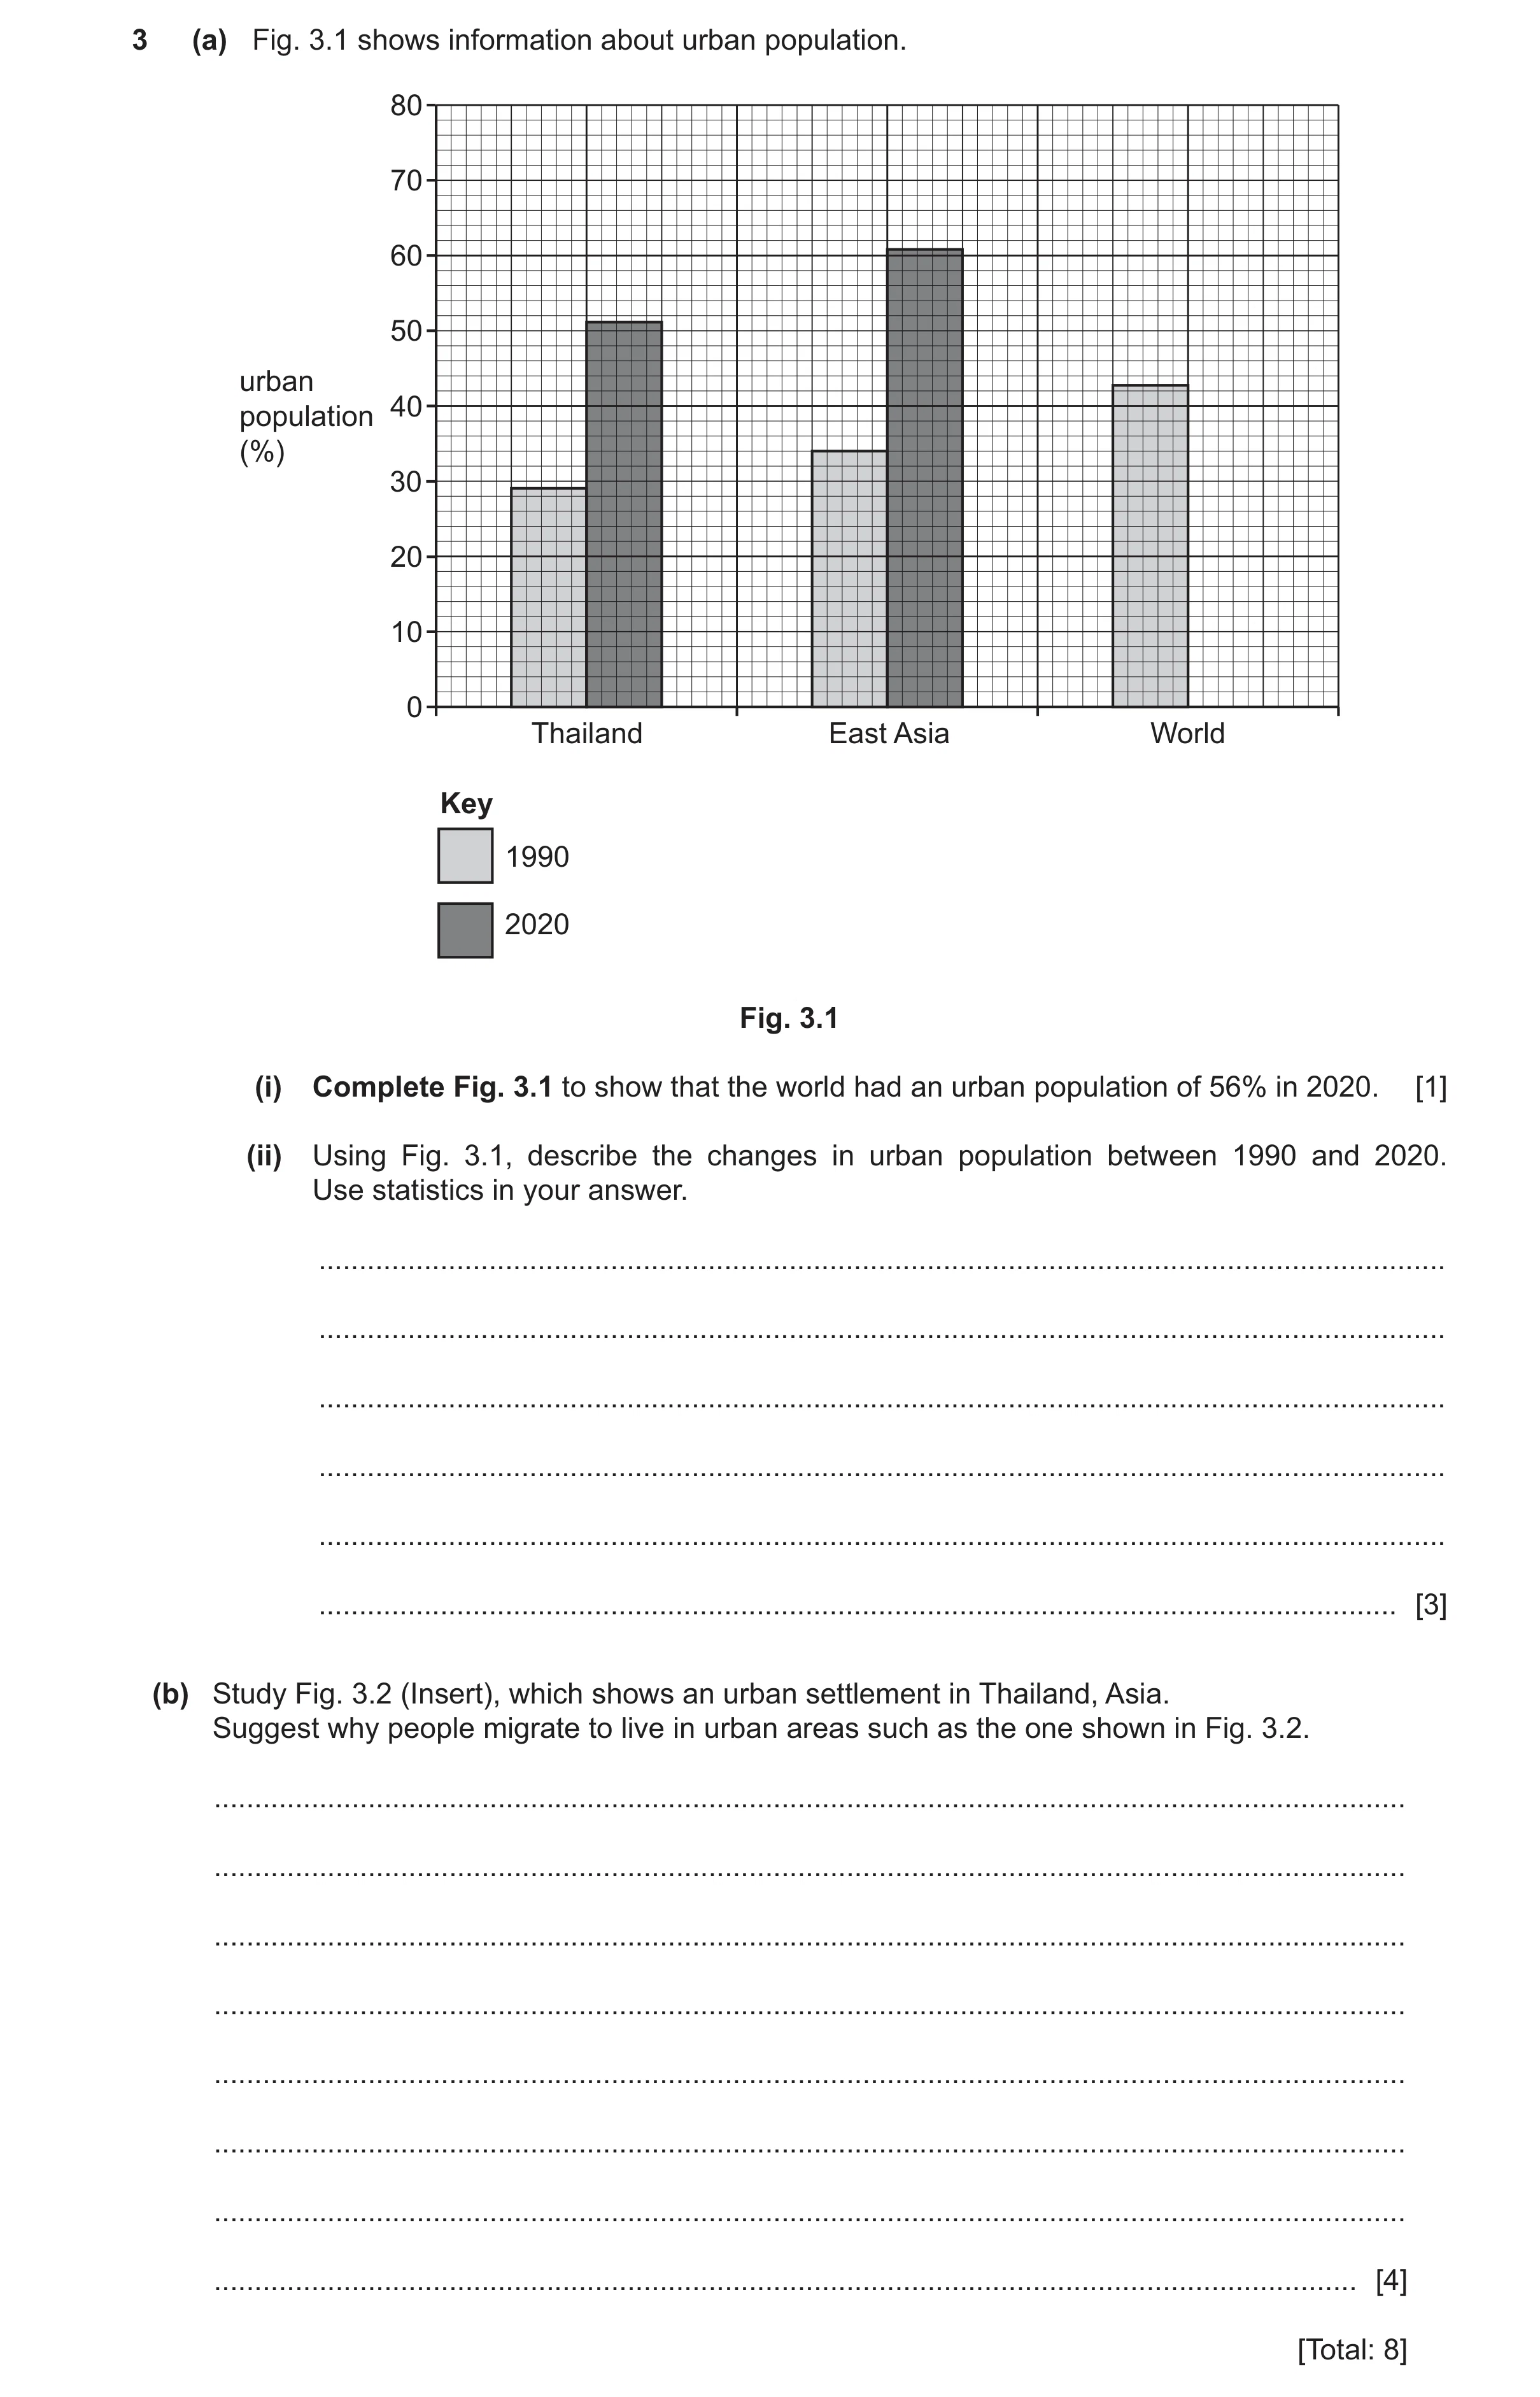
3 (a) Fig. 3.1 shows information about urban population. 80 70 60 50 urban 40 population (%) 30 20 10 0 Thailand East Asia World Key 1990 2020 Fig. 3.1 (i) Complete Fig. 3.1 to show that the world had an urban population of 56% in 2020. [1] (ii) Using Fig. 3.1, describe the changes in urban population between 1990 and 2020. Use statistics in your answer. … … … … … … [3] (b) Study Fig. 3.2 (Insert), which shows an urban settlement in Thailand, Asia. Suggest why people migrate to live in urban areas such as the one shown in Fig. 3.2. … … … … … … … … [4] [Total: 8]
8 marks
Mark scheme: 3(a)(i) Correct plot of 56% 1 3(a)(ii) (All) increased; 3 Thailand almost doubled/29–51%/grew 22%; East Asia almost doubled/34–61%/grew 27%; Smaller/est increase in World/43-56%/grew 13%/larger/est increase in Thailand/East Asia. NOTE Reserve 1 mark for statistics 3(b) 4 Push Pull Crop failure/famine/starvation in Better food supply in urban rural areas areas Lack of employment Employment opportunities in opportunities in rural areas urban areas/better working (farming)/mechanisation of conditions in urban areas farming Need to make a living/low Higher wages in urban areas wages in rural areas Poor quality housing in rural Better quality/modern housing areas in urban areas Lack of healthcare Better healthcare facilities/hospitals/doctors/ facilities/hospitals/doctors/ medicine in rural areas medicine in urban areas Lack of education Better education facilities/schools/teachers/ facilities/schools/teachers/ universities in rural areas universities in urban areas Lack of transport/roads/railways Better transport/roads/railways in rural areas/rural area is in urban areas/urban area is remote less remote Rural areas have fewer Urban areas have more entertainment/shops/smaller entertainment/shops/larger range of products/low order range of products/high order services services Rural areas have poorer Urban areas have better electricity/gas/energy electricity/gas/energy supplies/internet/telephone supplies/internet/telephone services (e.g. mobile network) services (e.g. mobile network) Dirty/contaminated water in Clean/piped water in urban rural areas areas Poorer security/police patrols in Better security/police patrols in rural areas urban areas Migrate to join family (who are already living there) Natural disasters in rural areas/or e.g. drought/flood
This question in 0460/21 Oct/Nov 2024
 1 / 15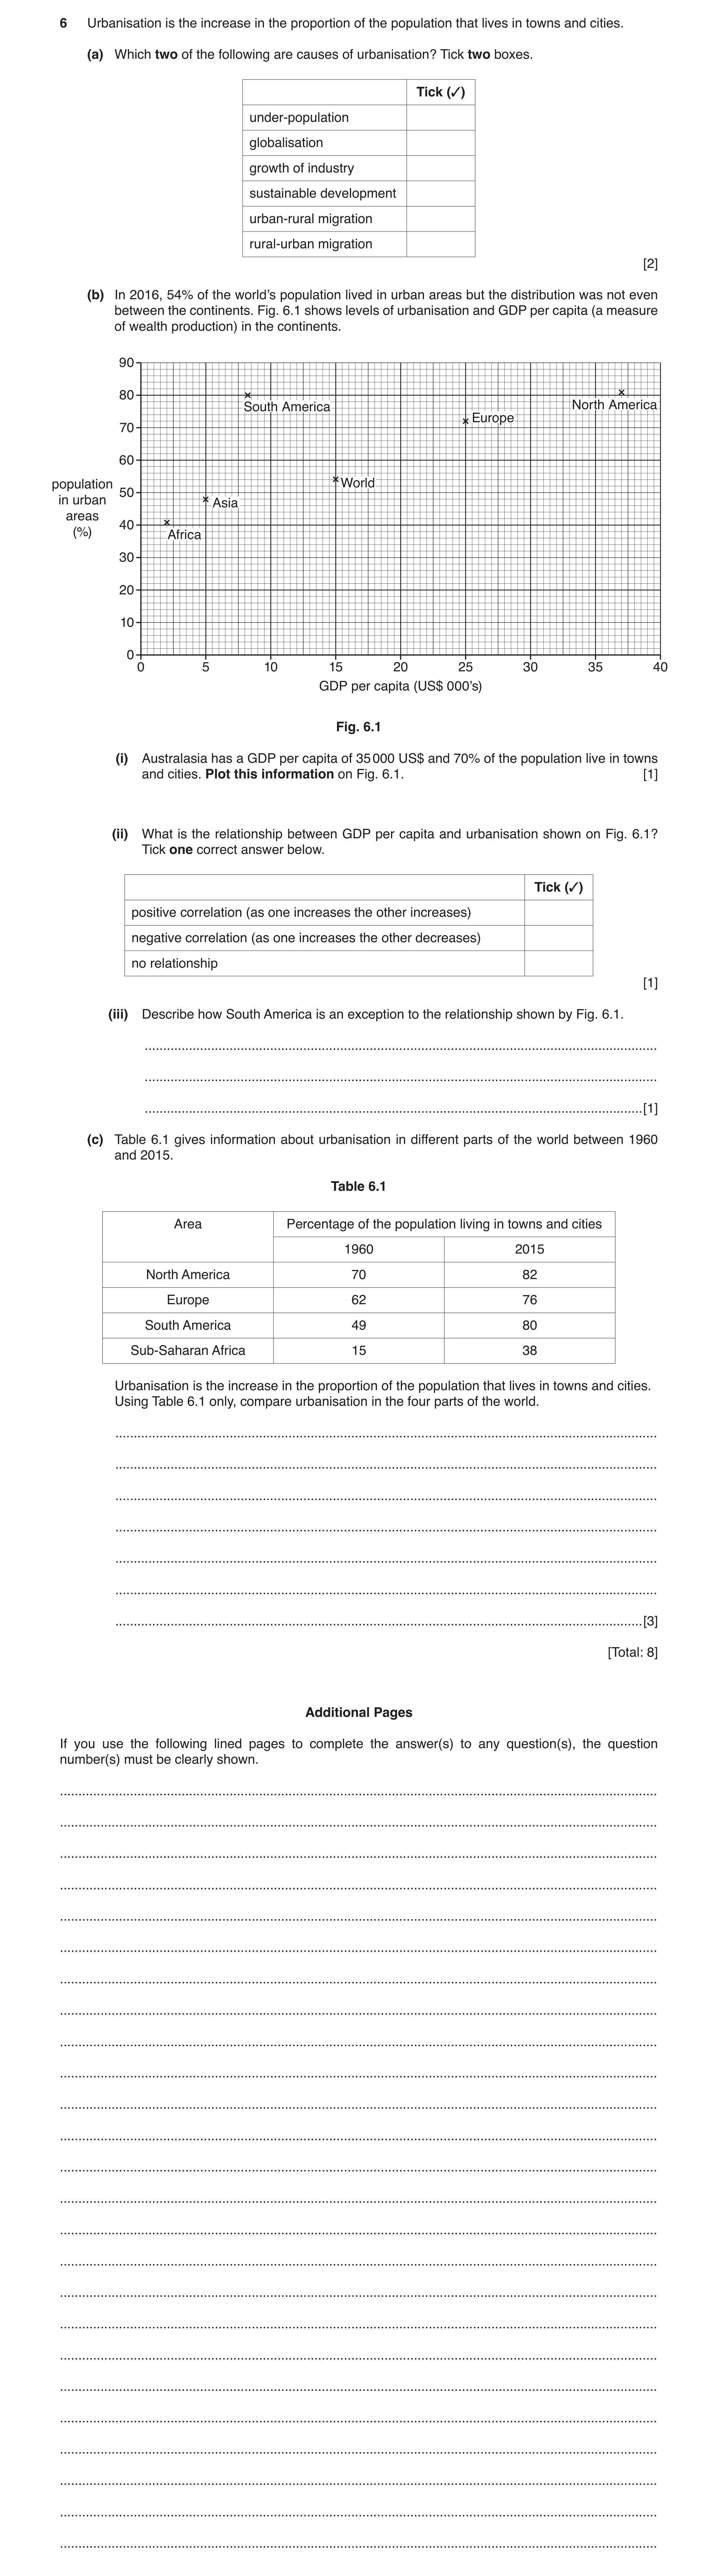
 6 / 15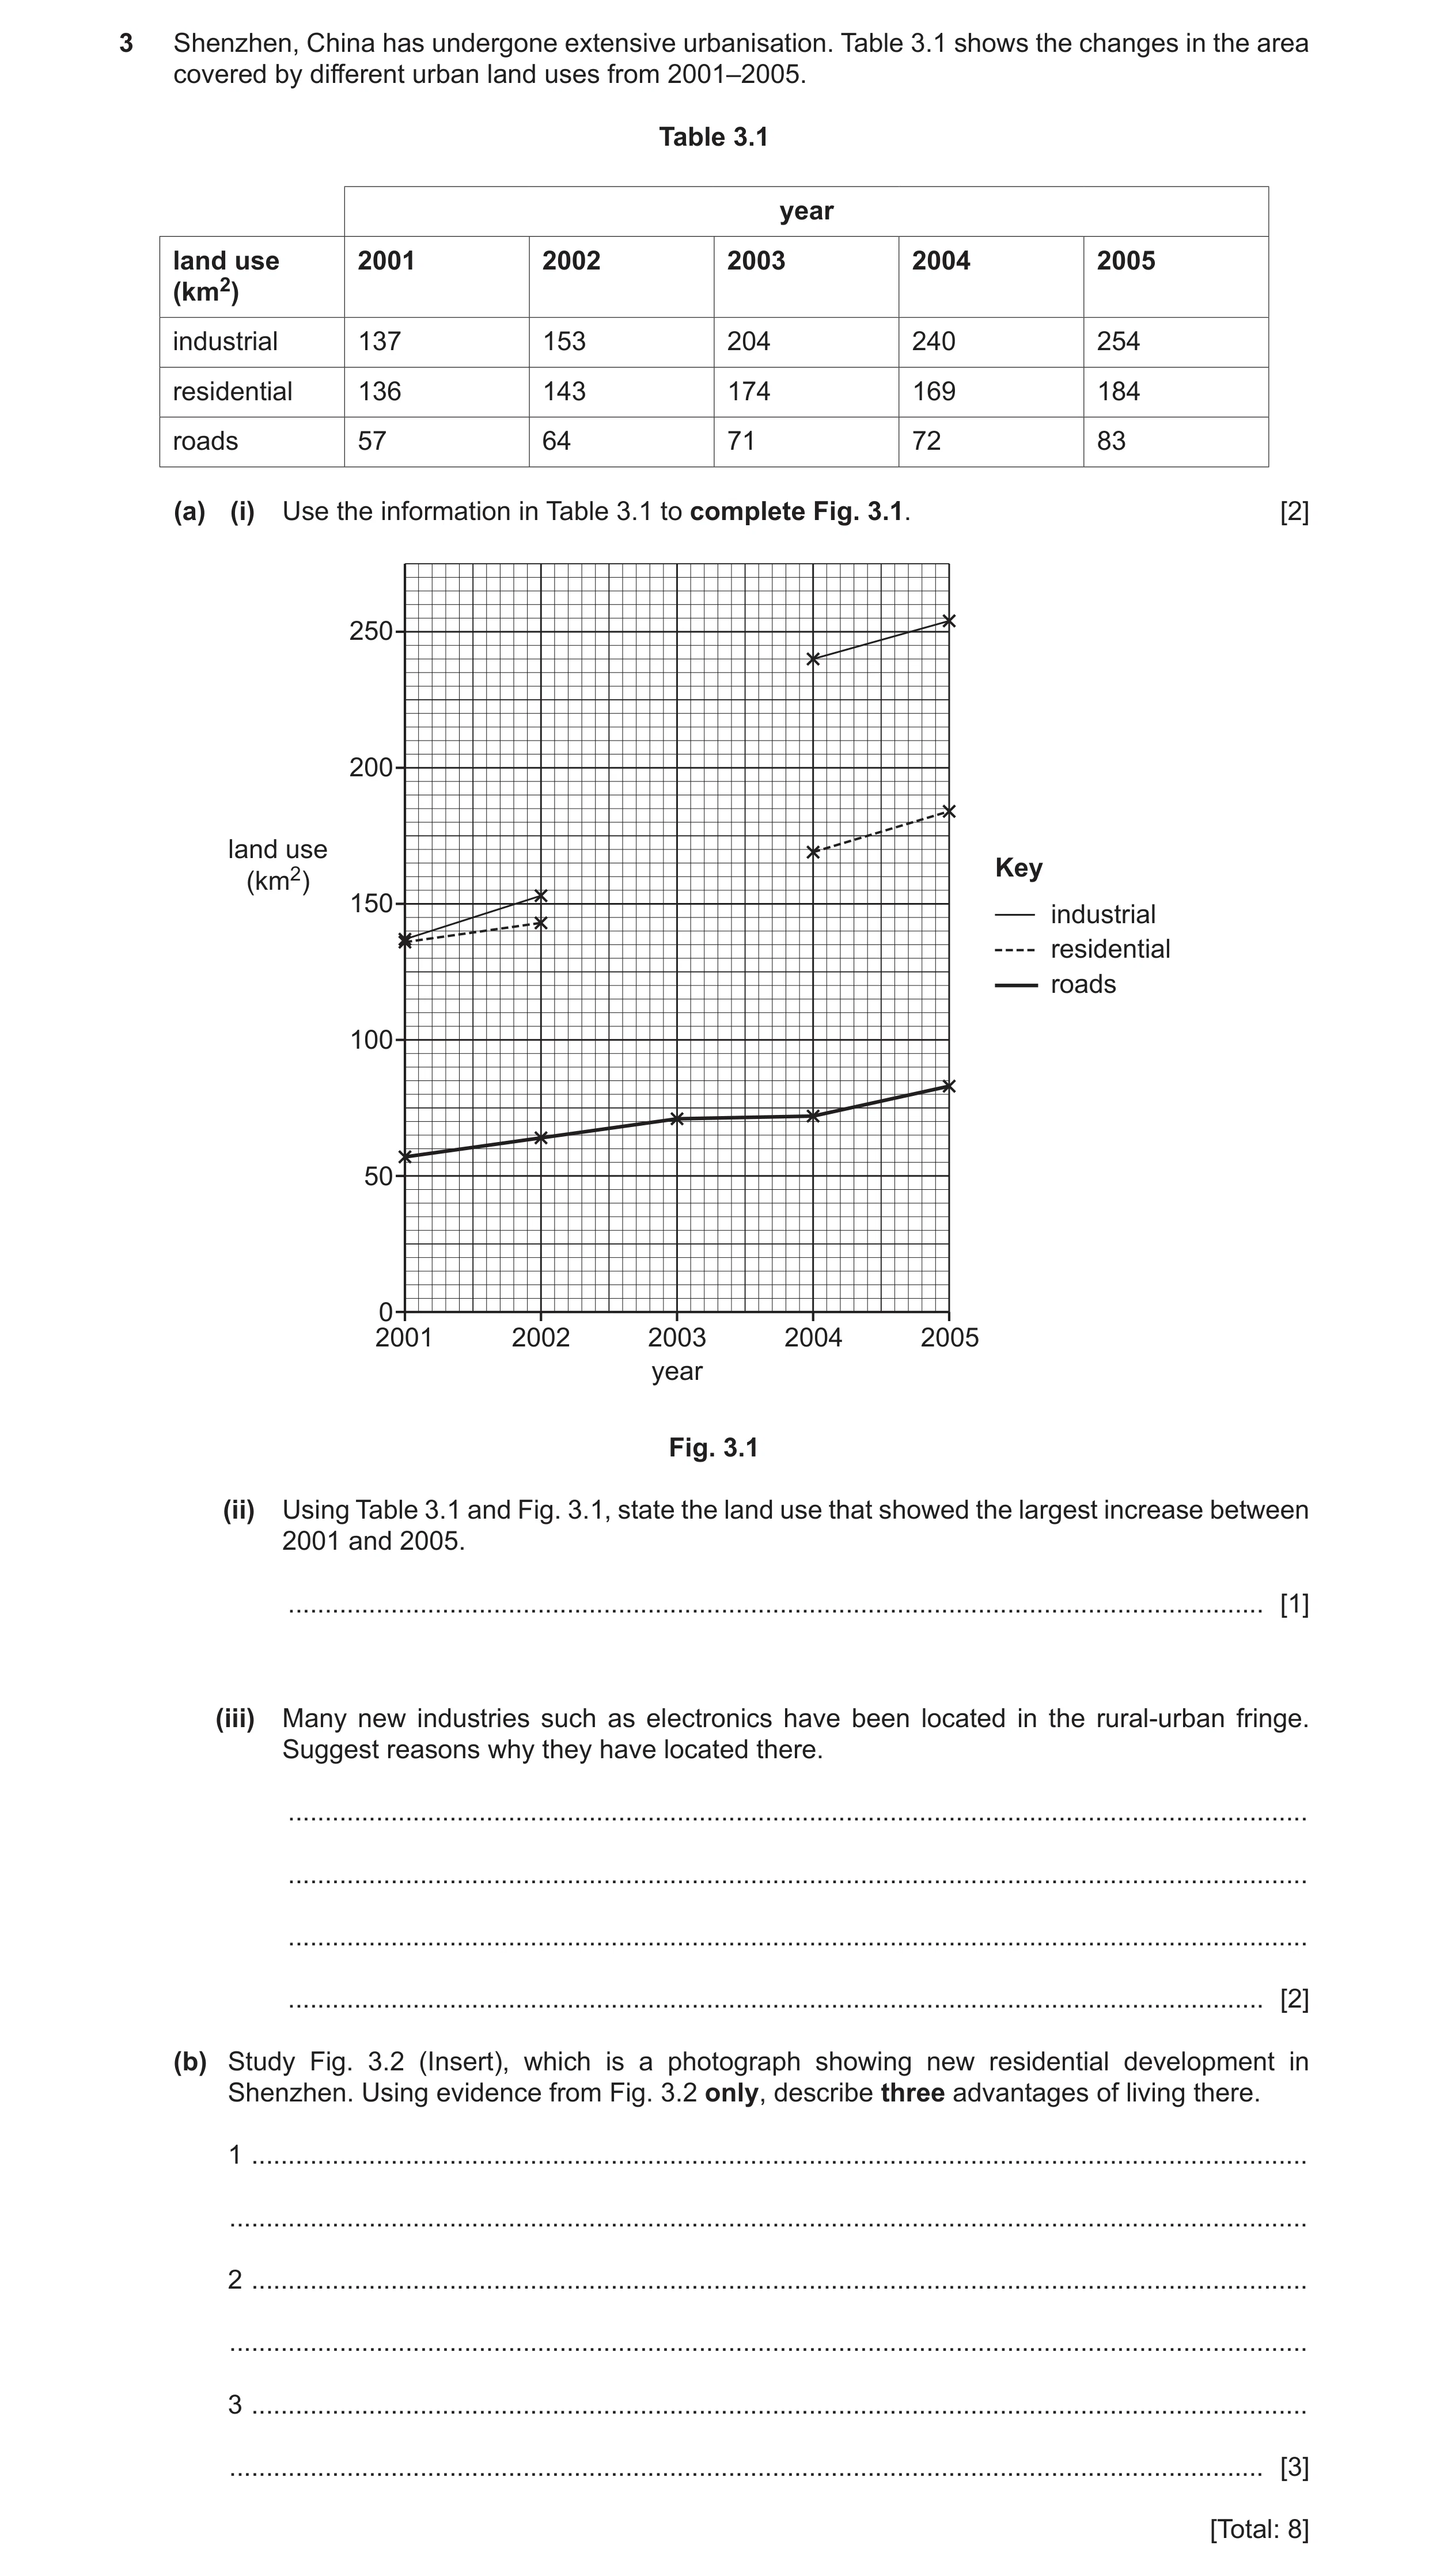
 11 / 15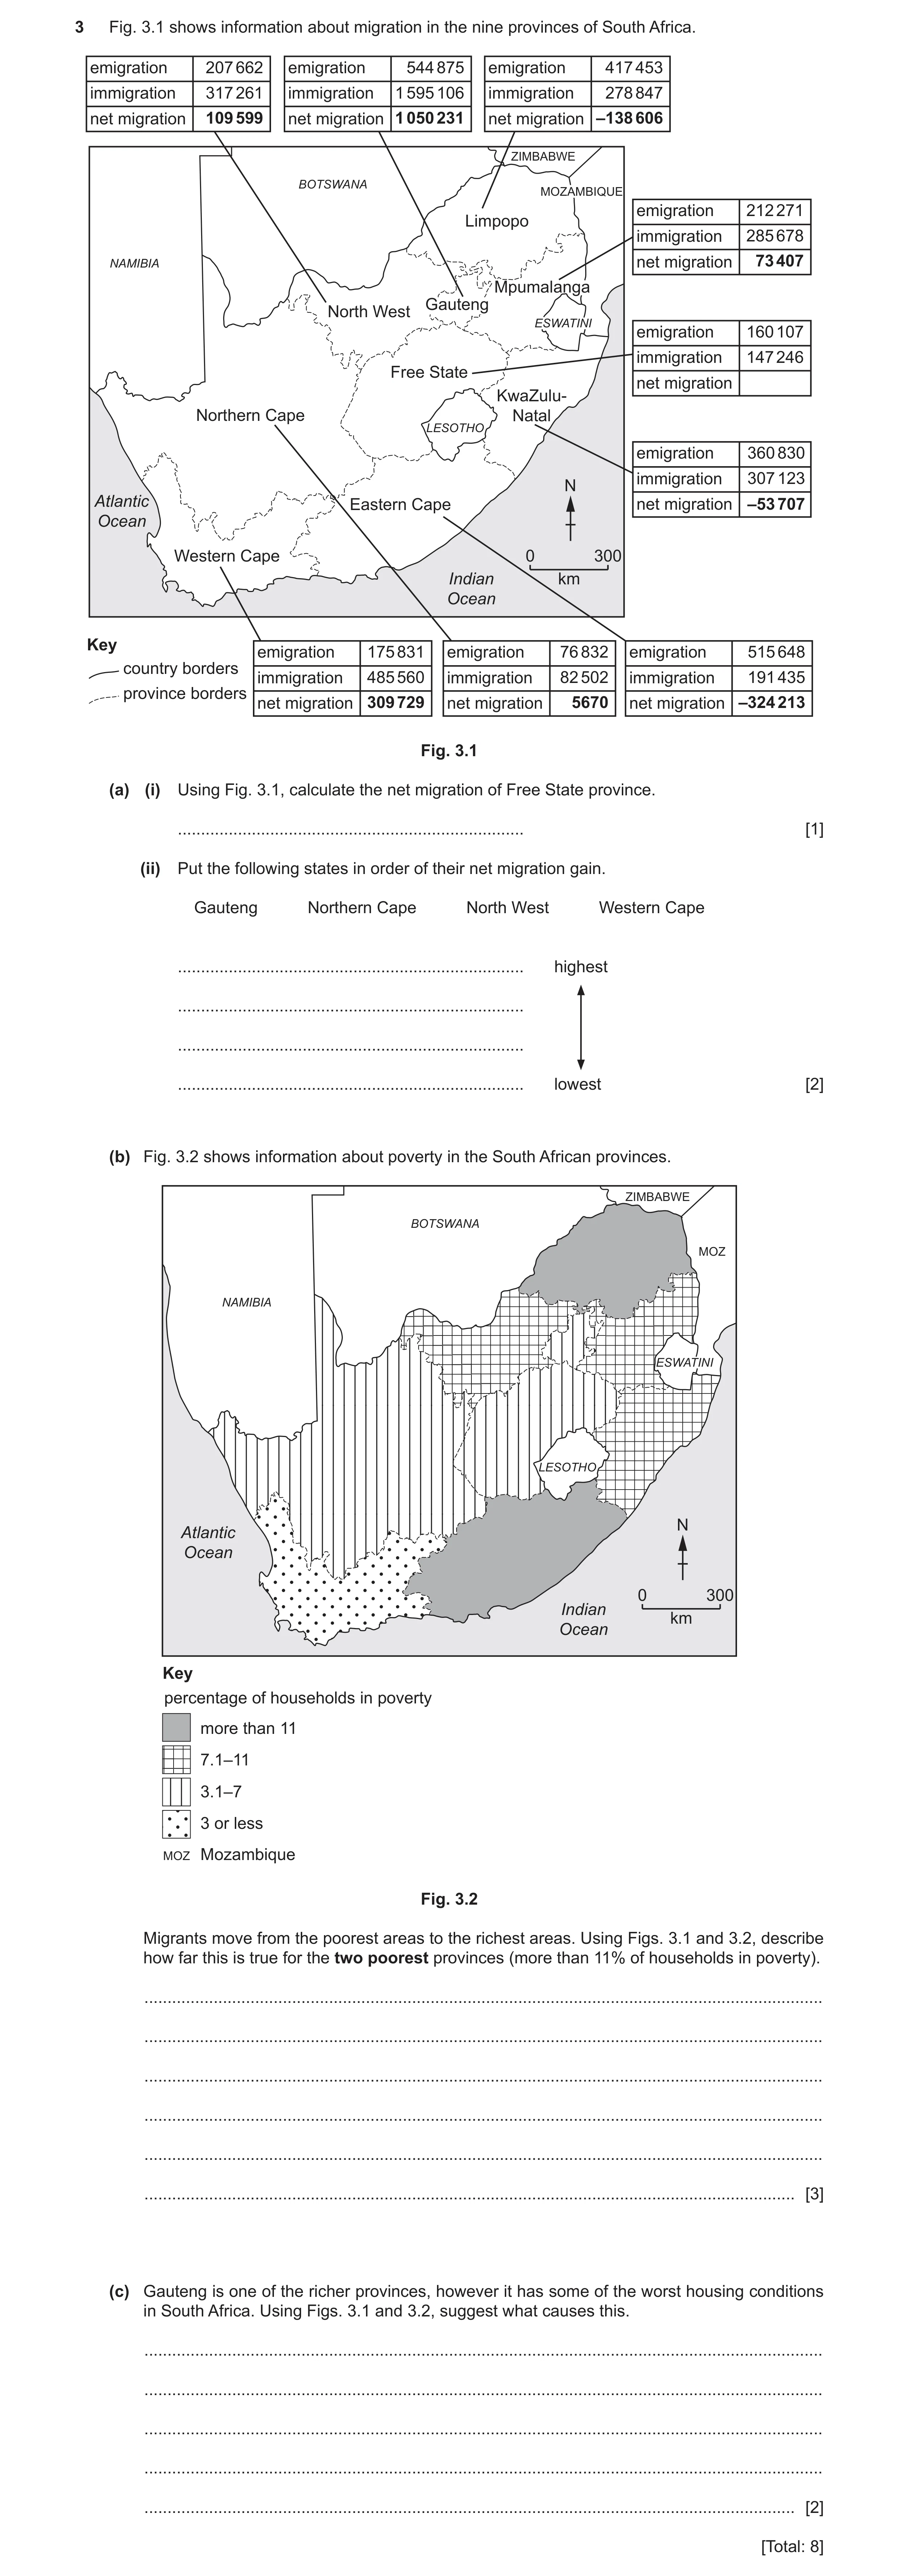
 8
8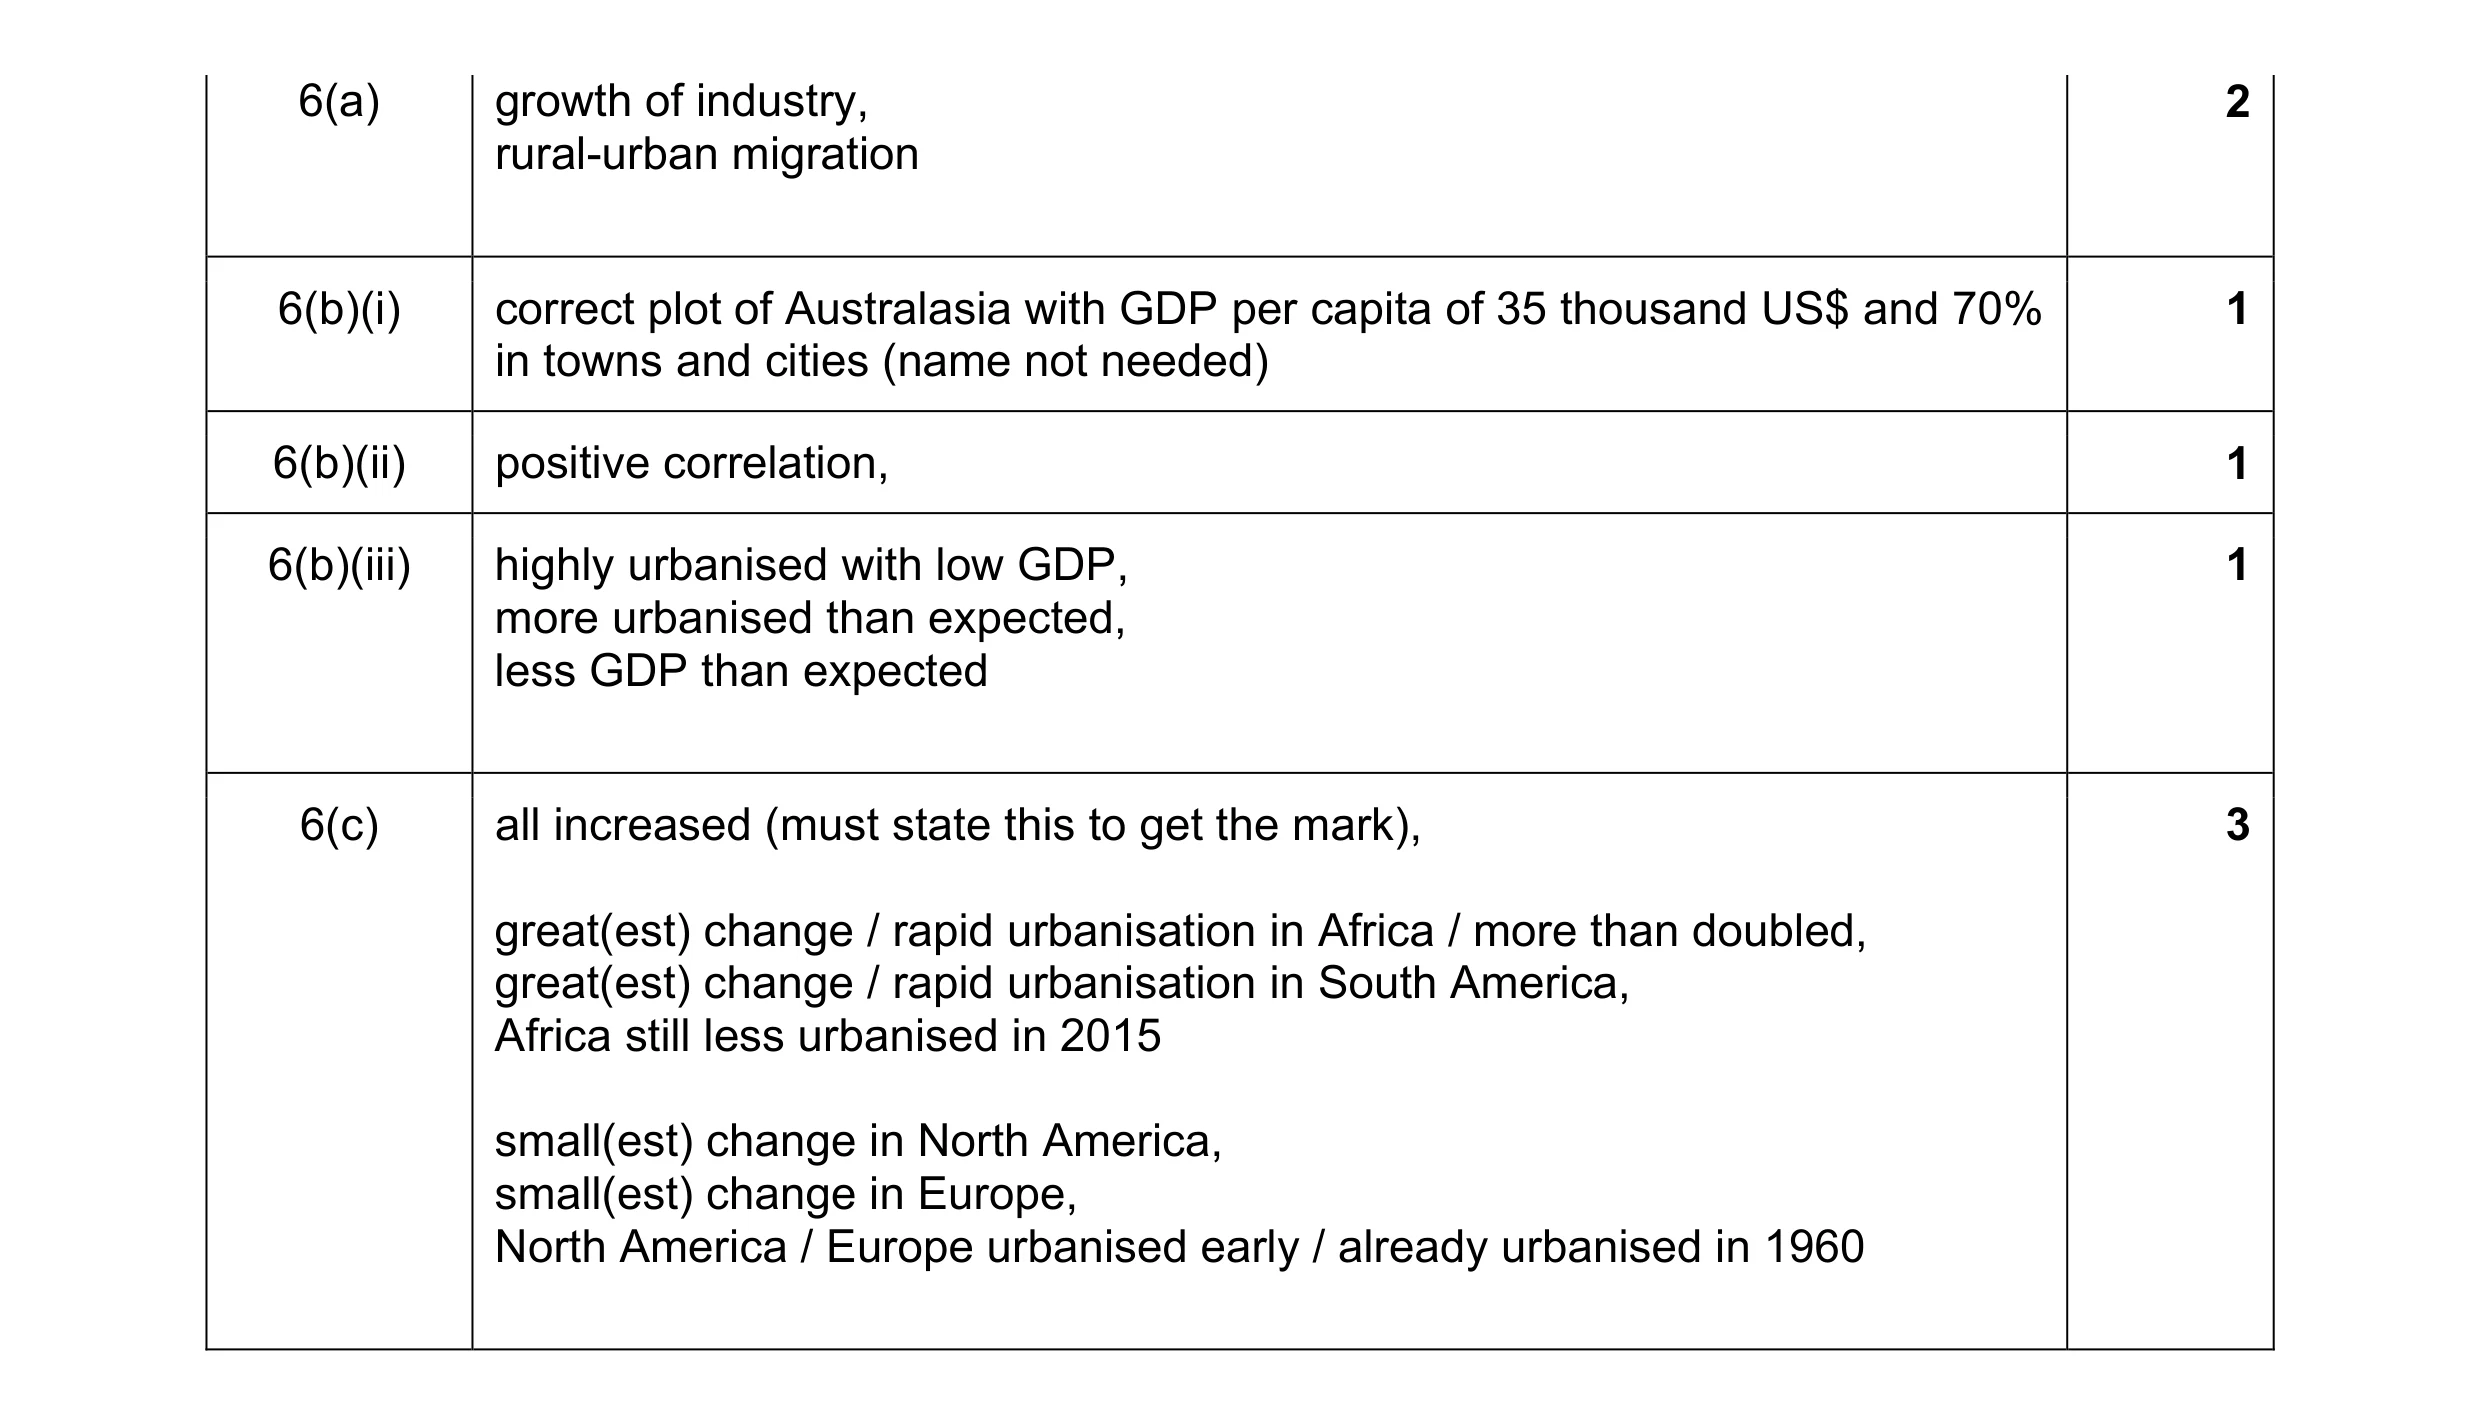 8
8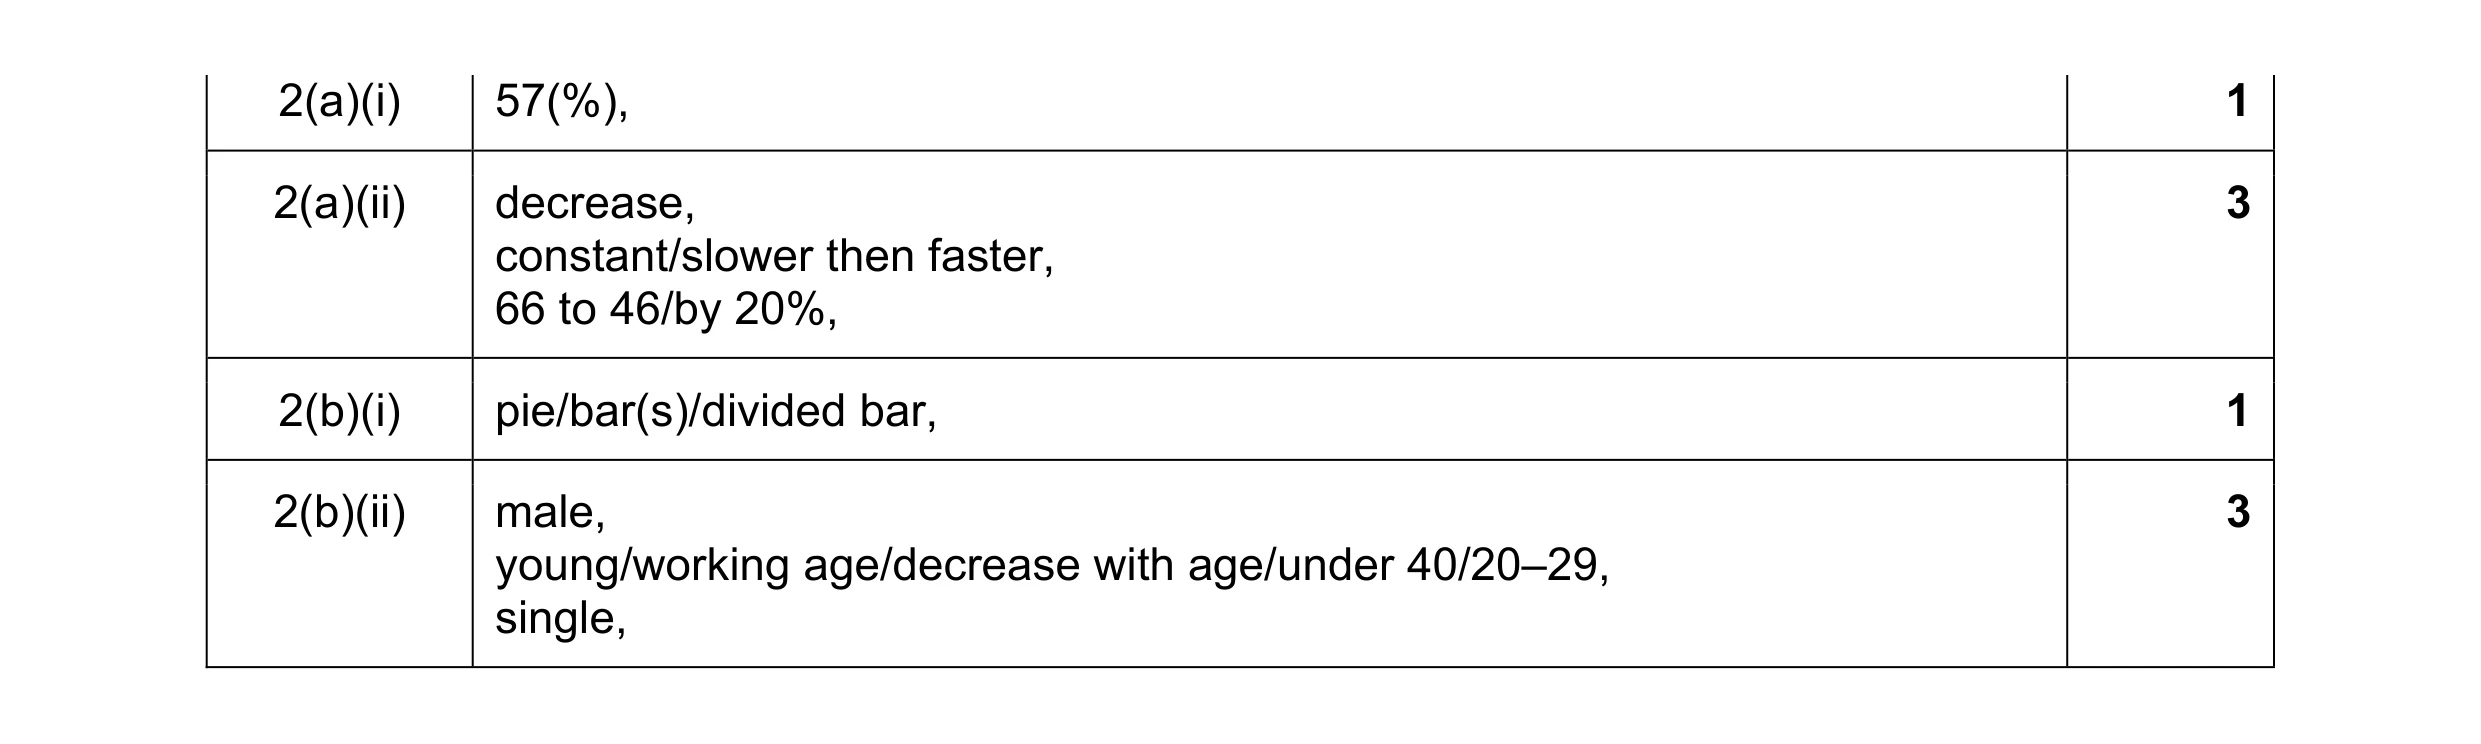 8
8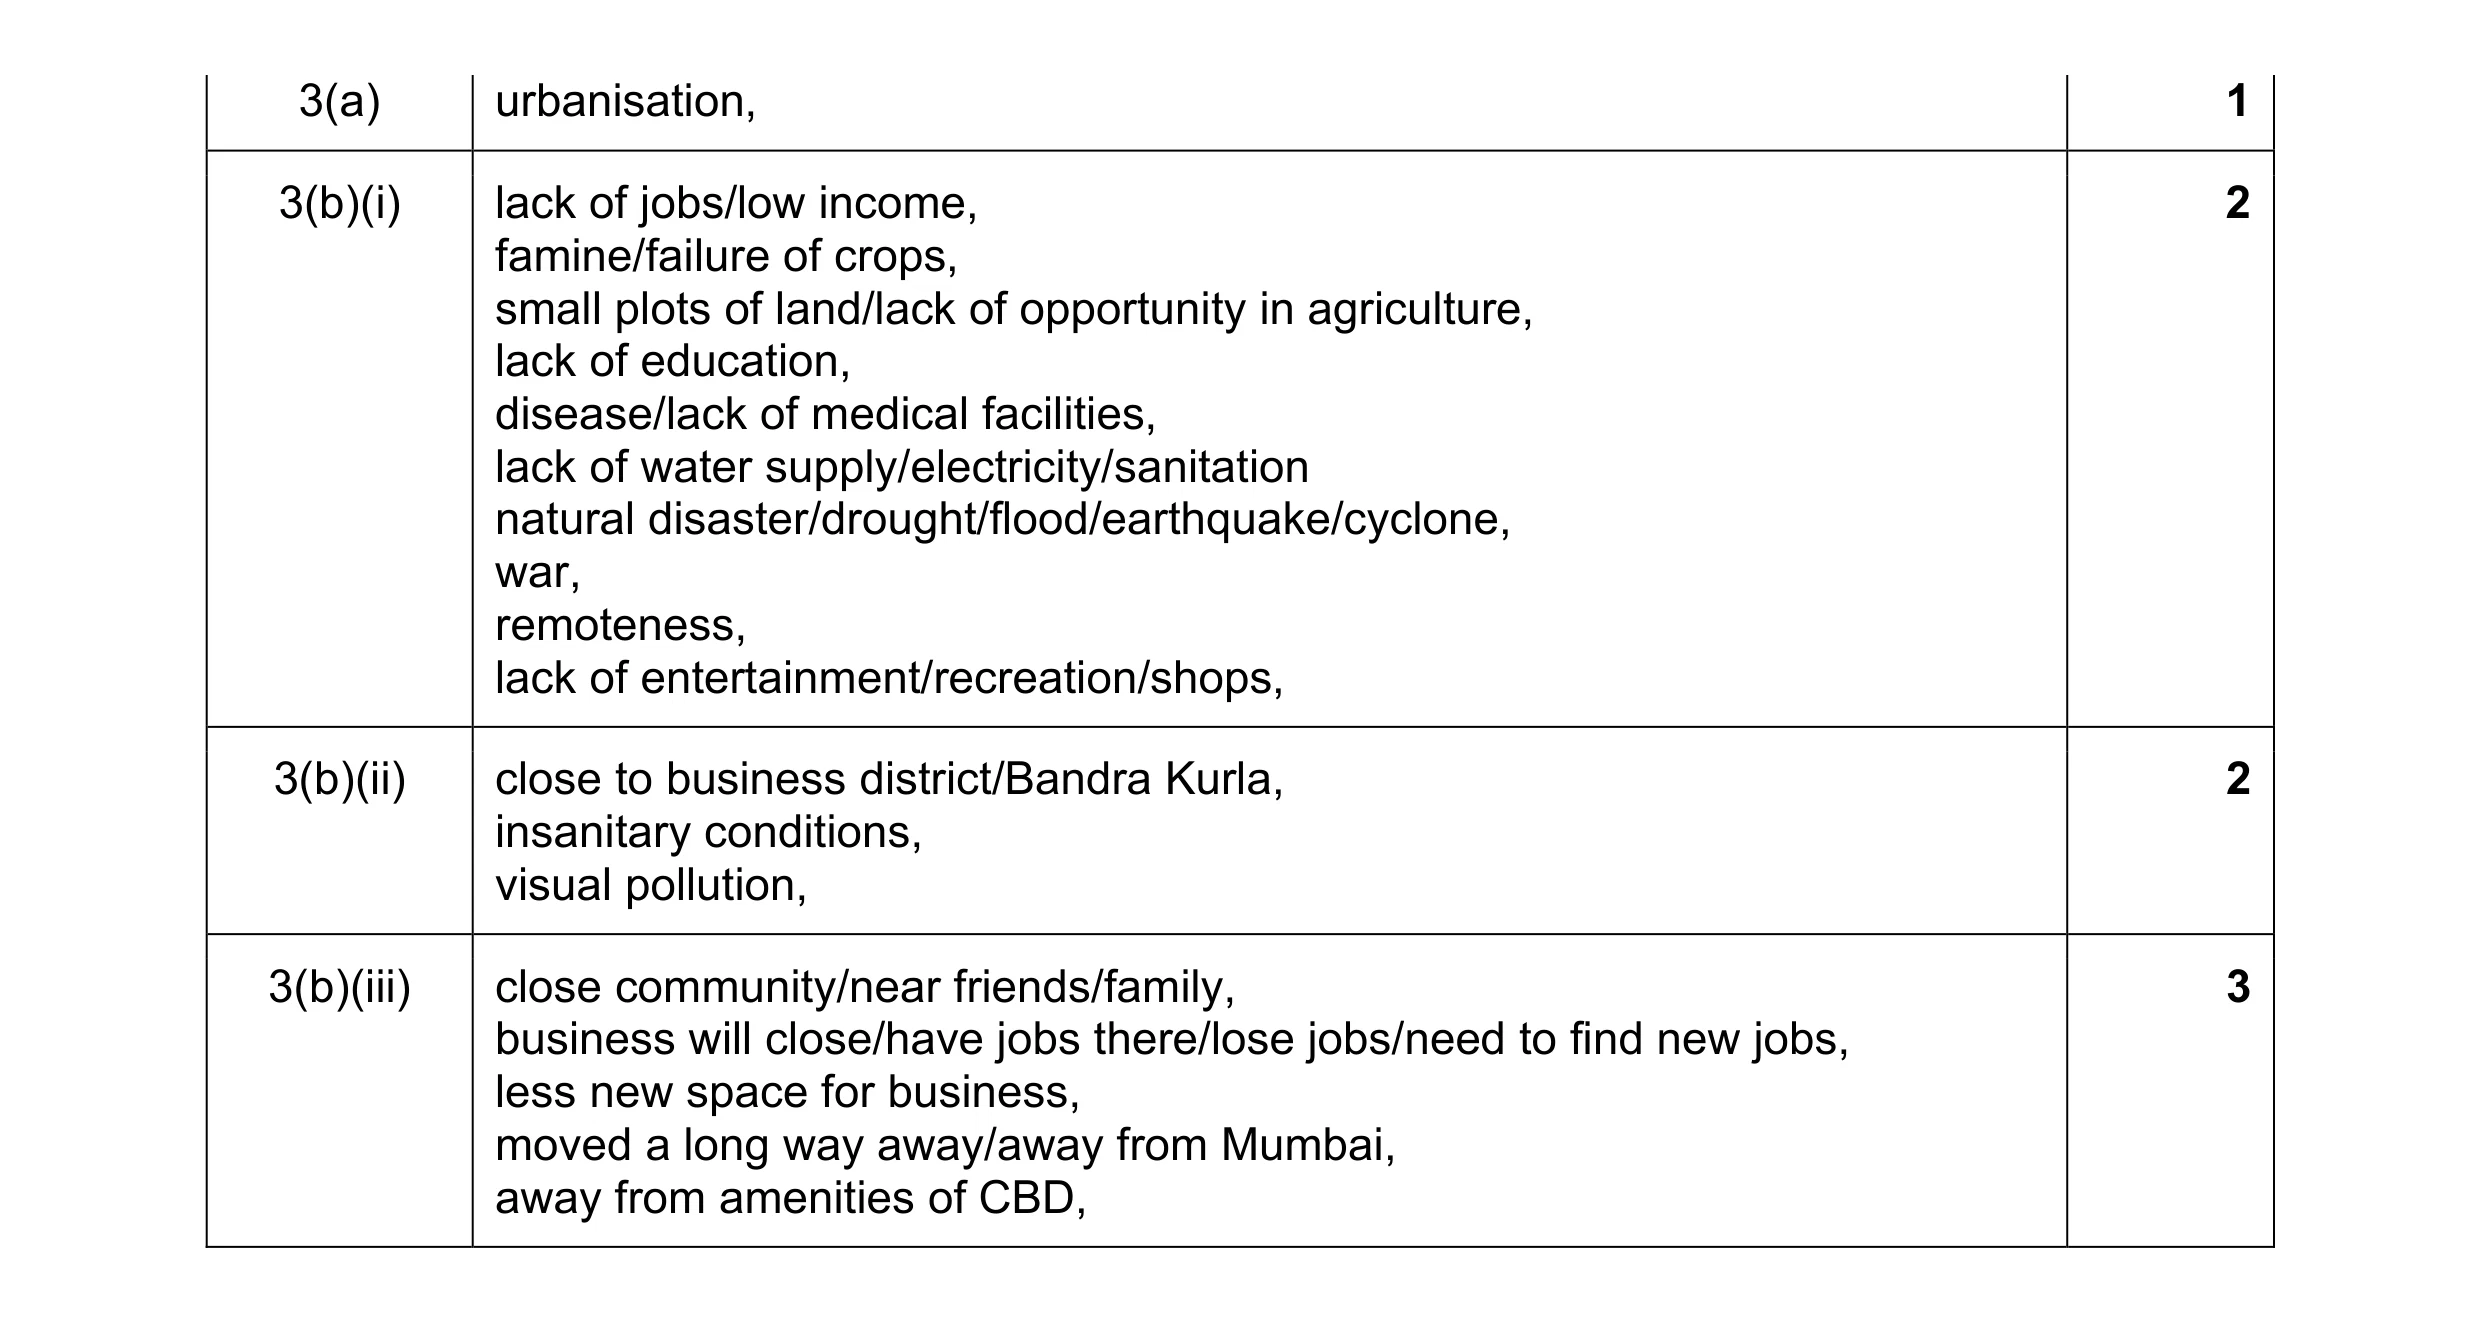 8
8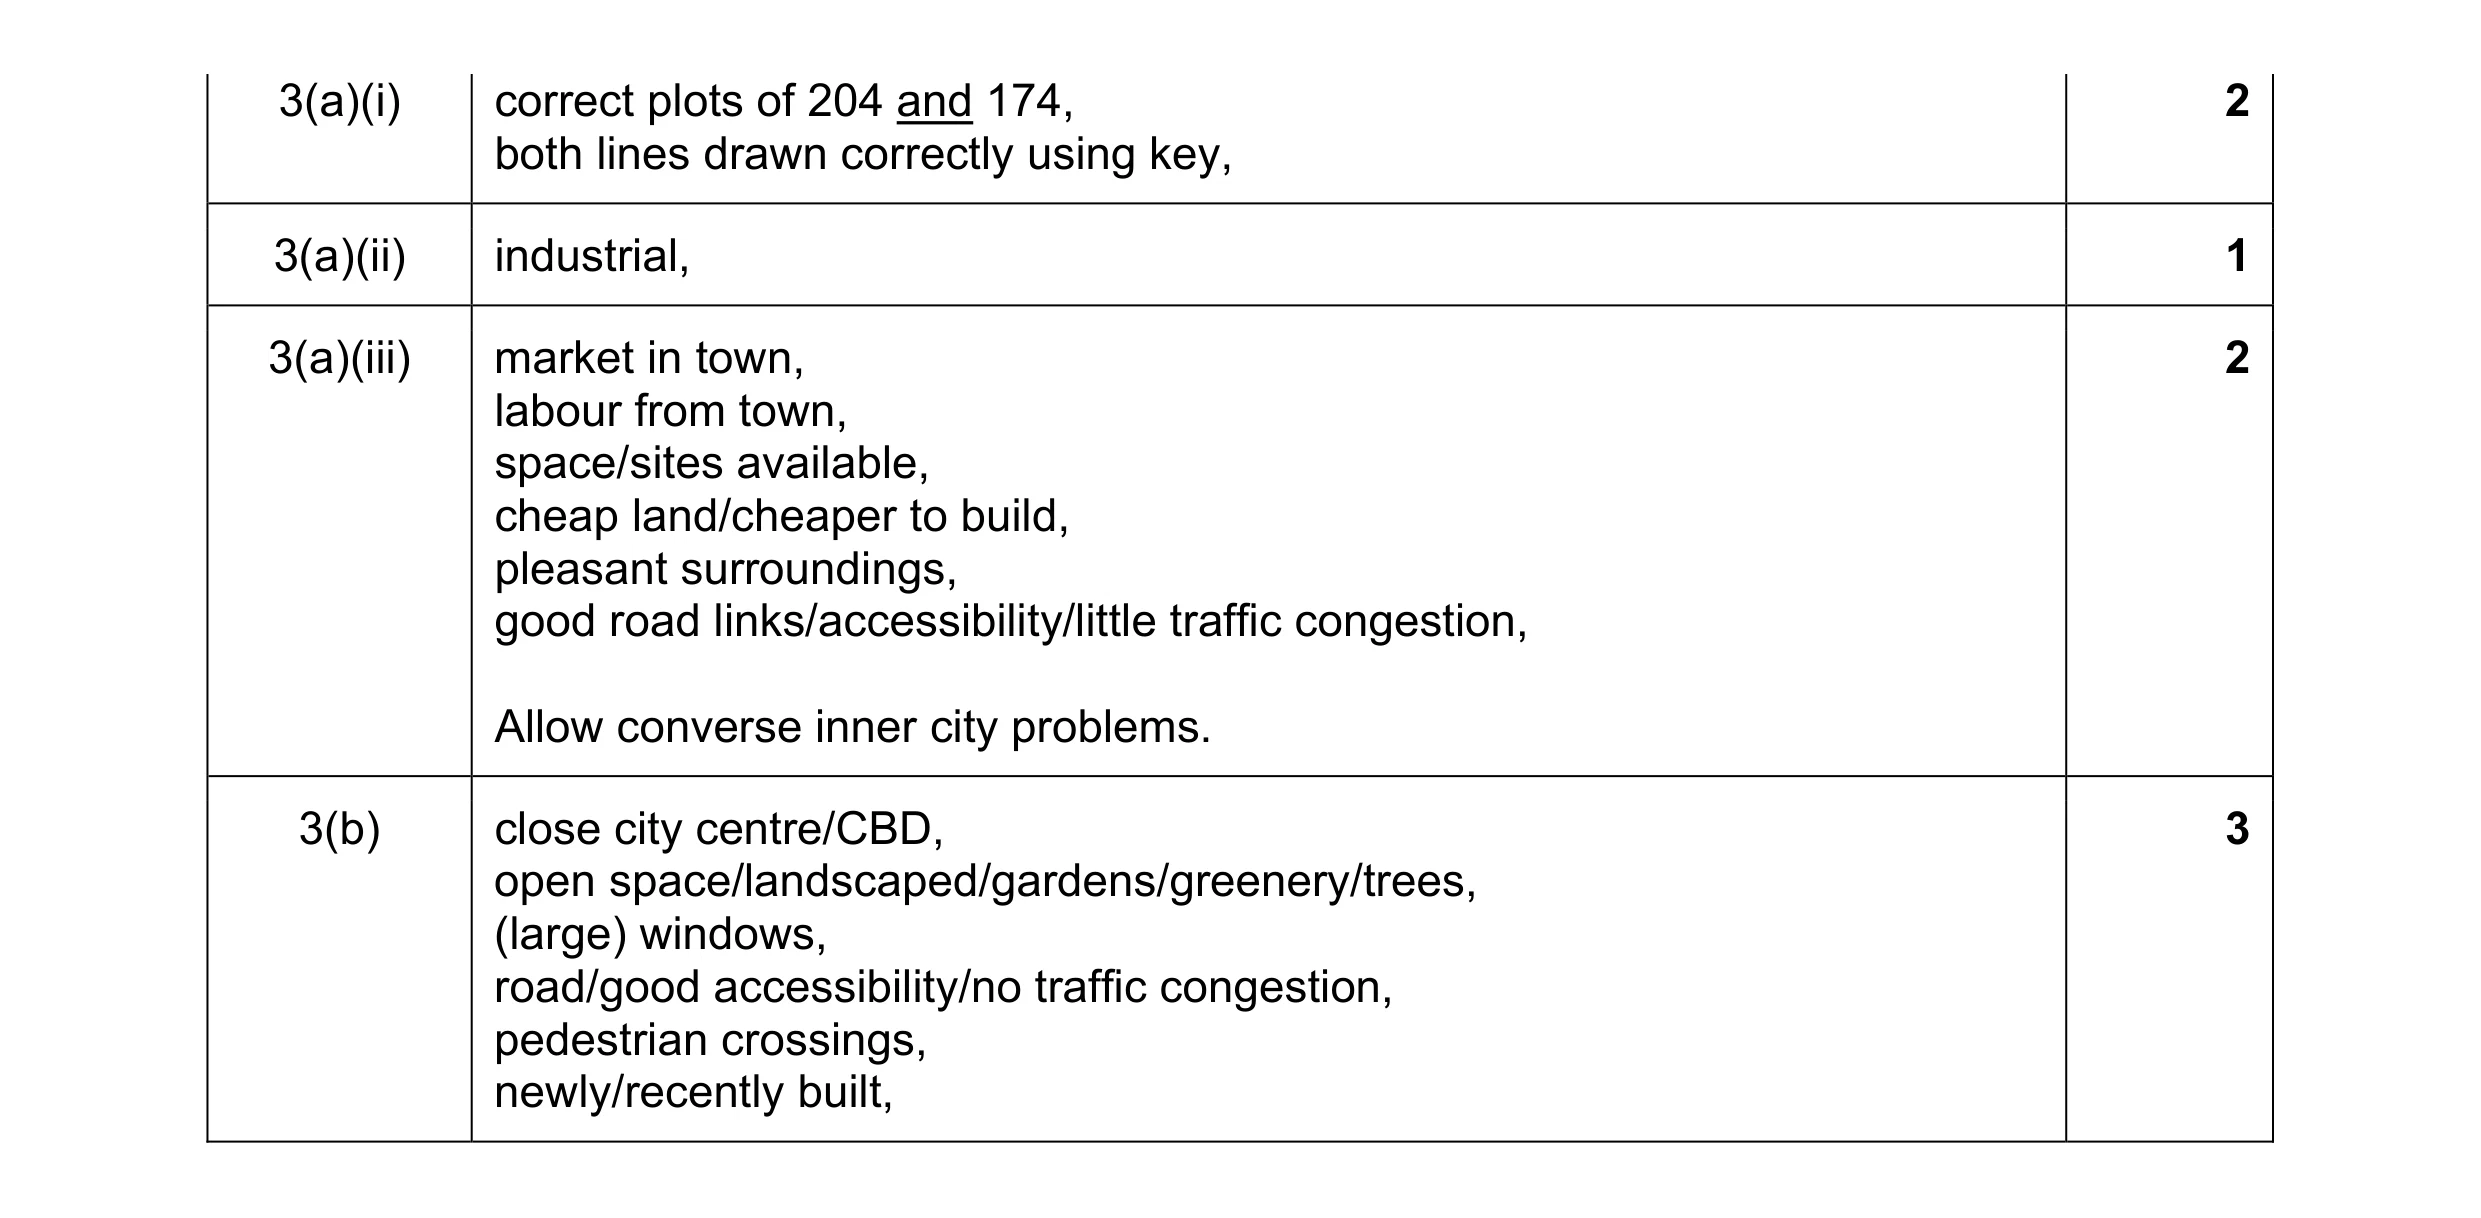 8
8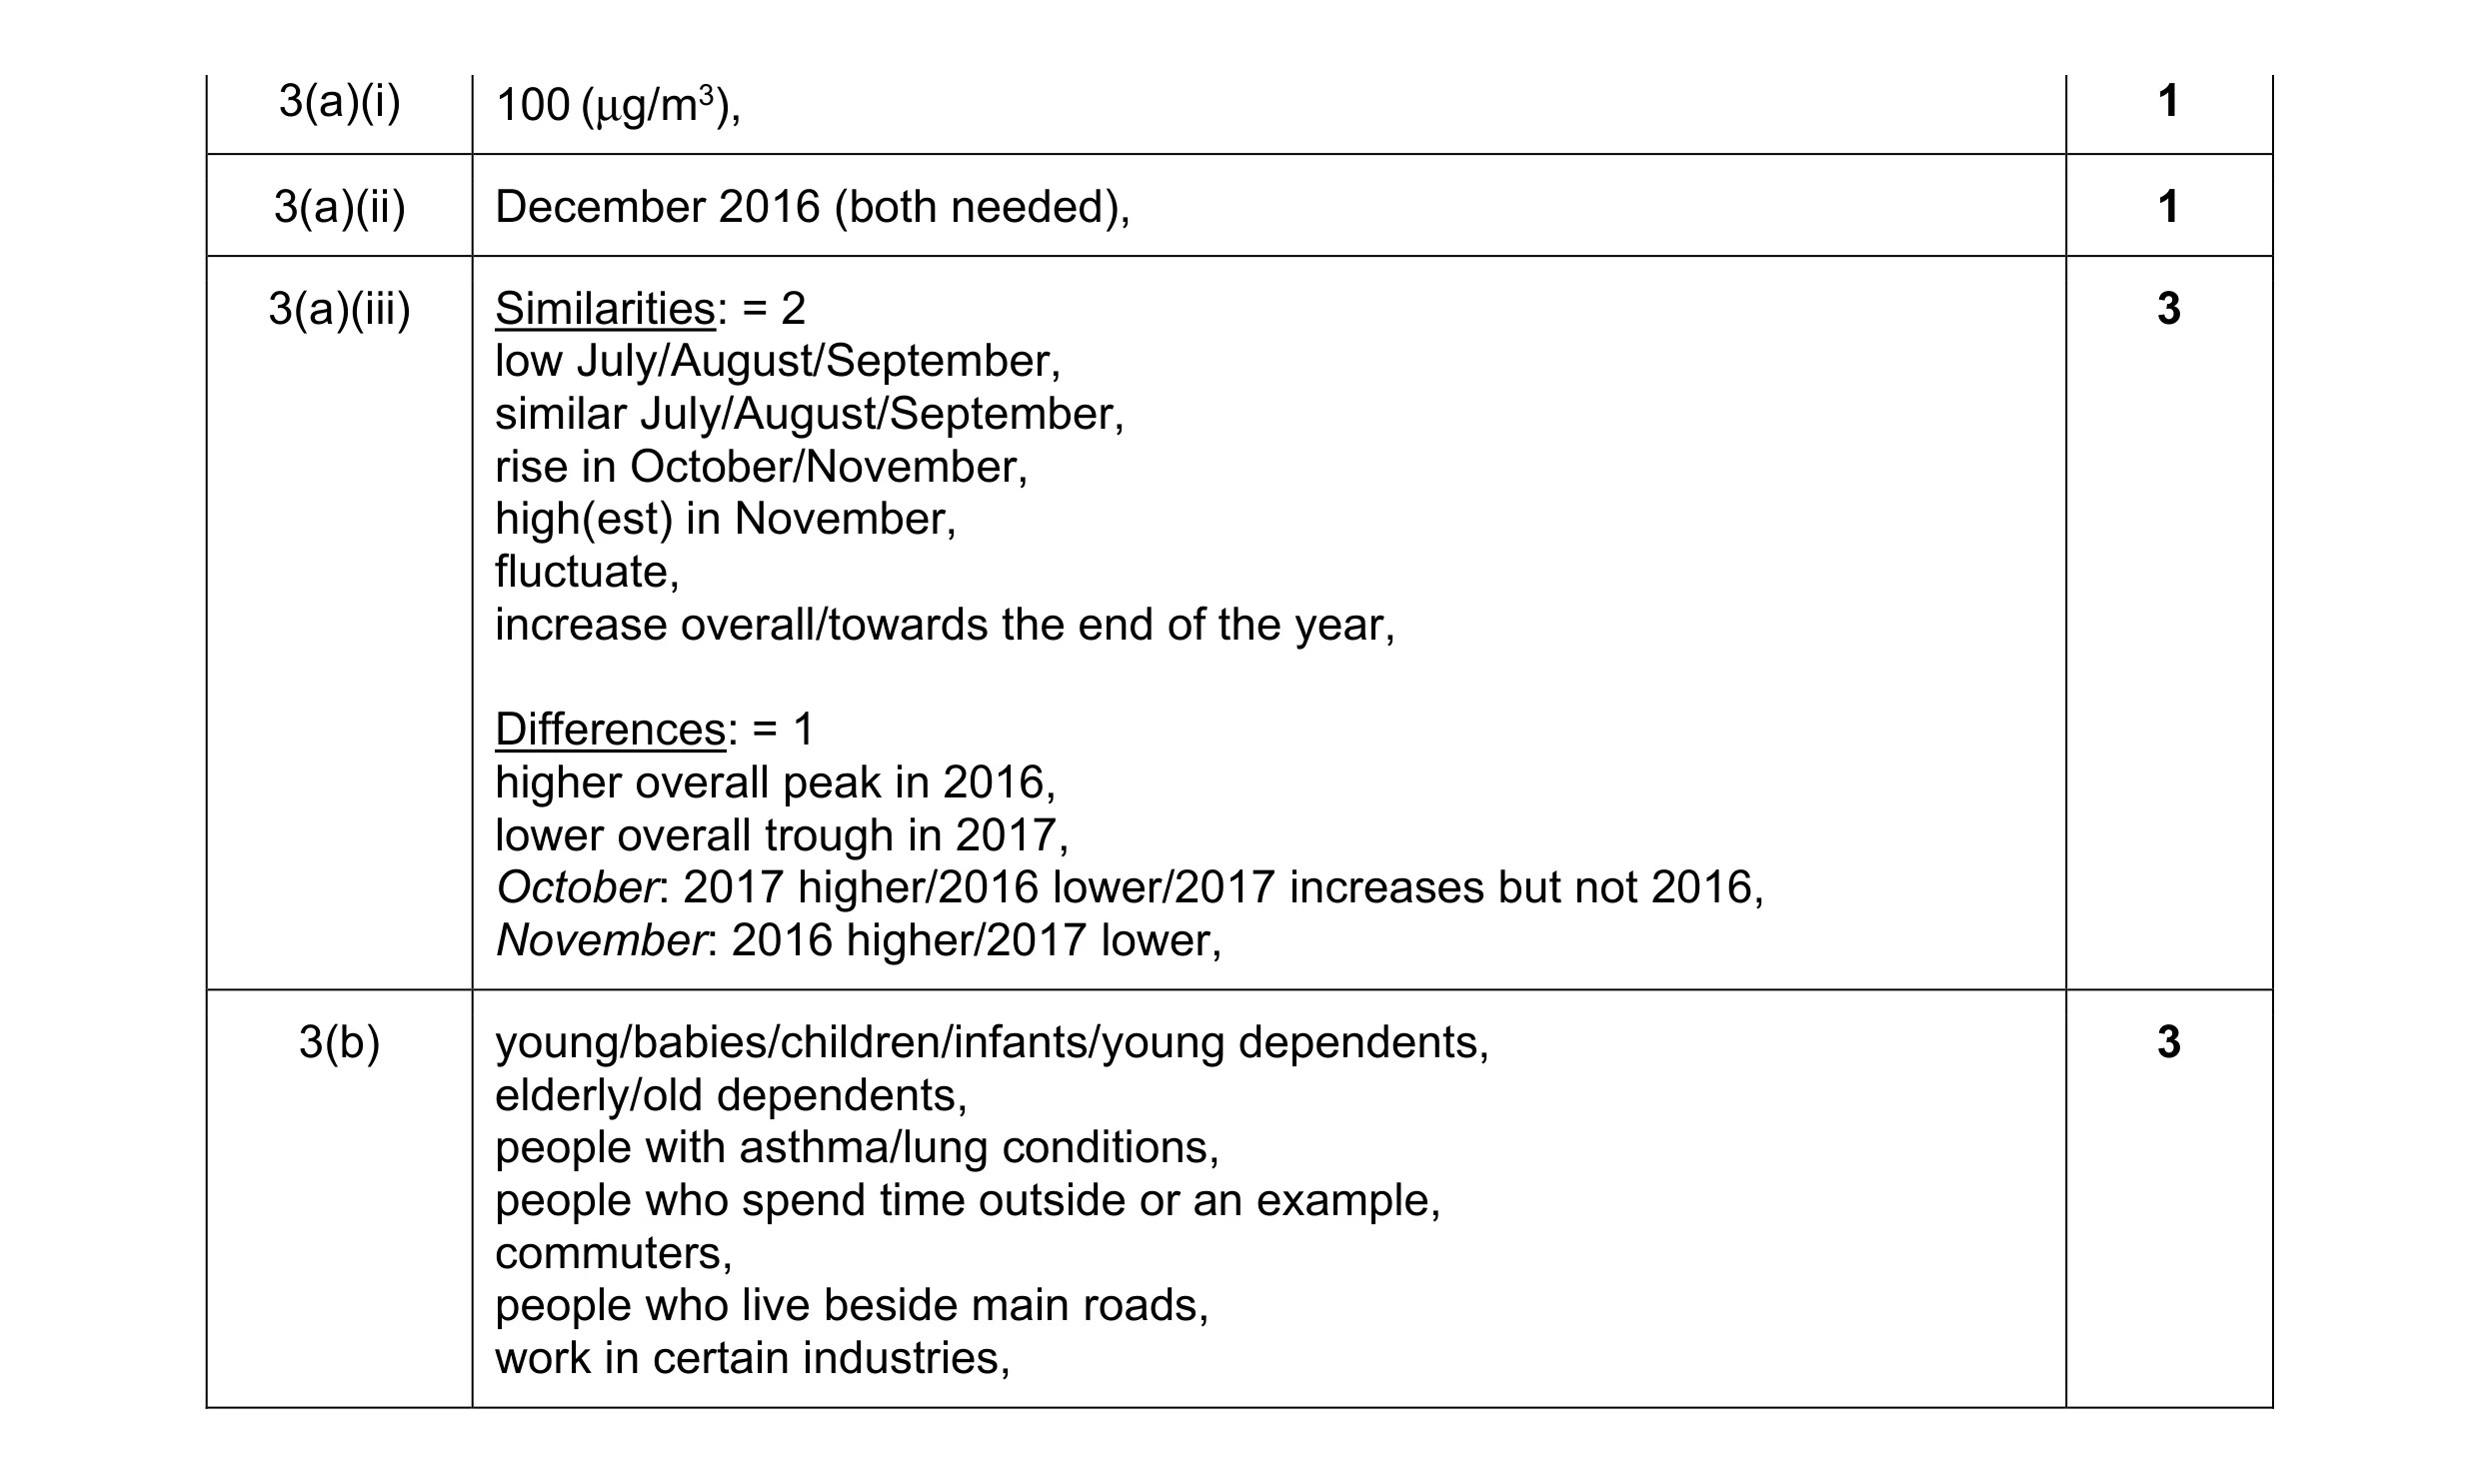 8
8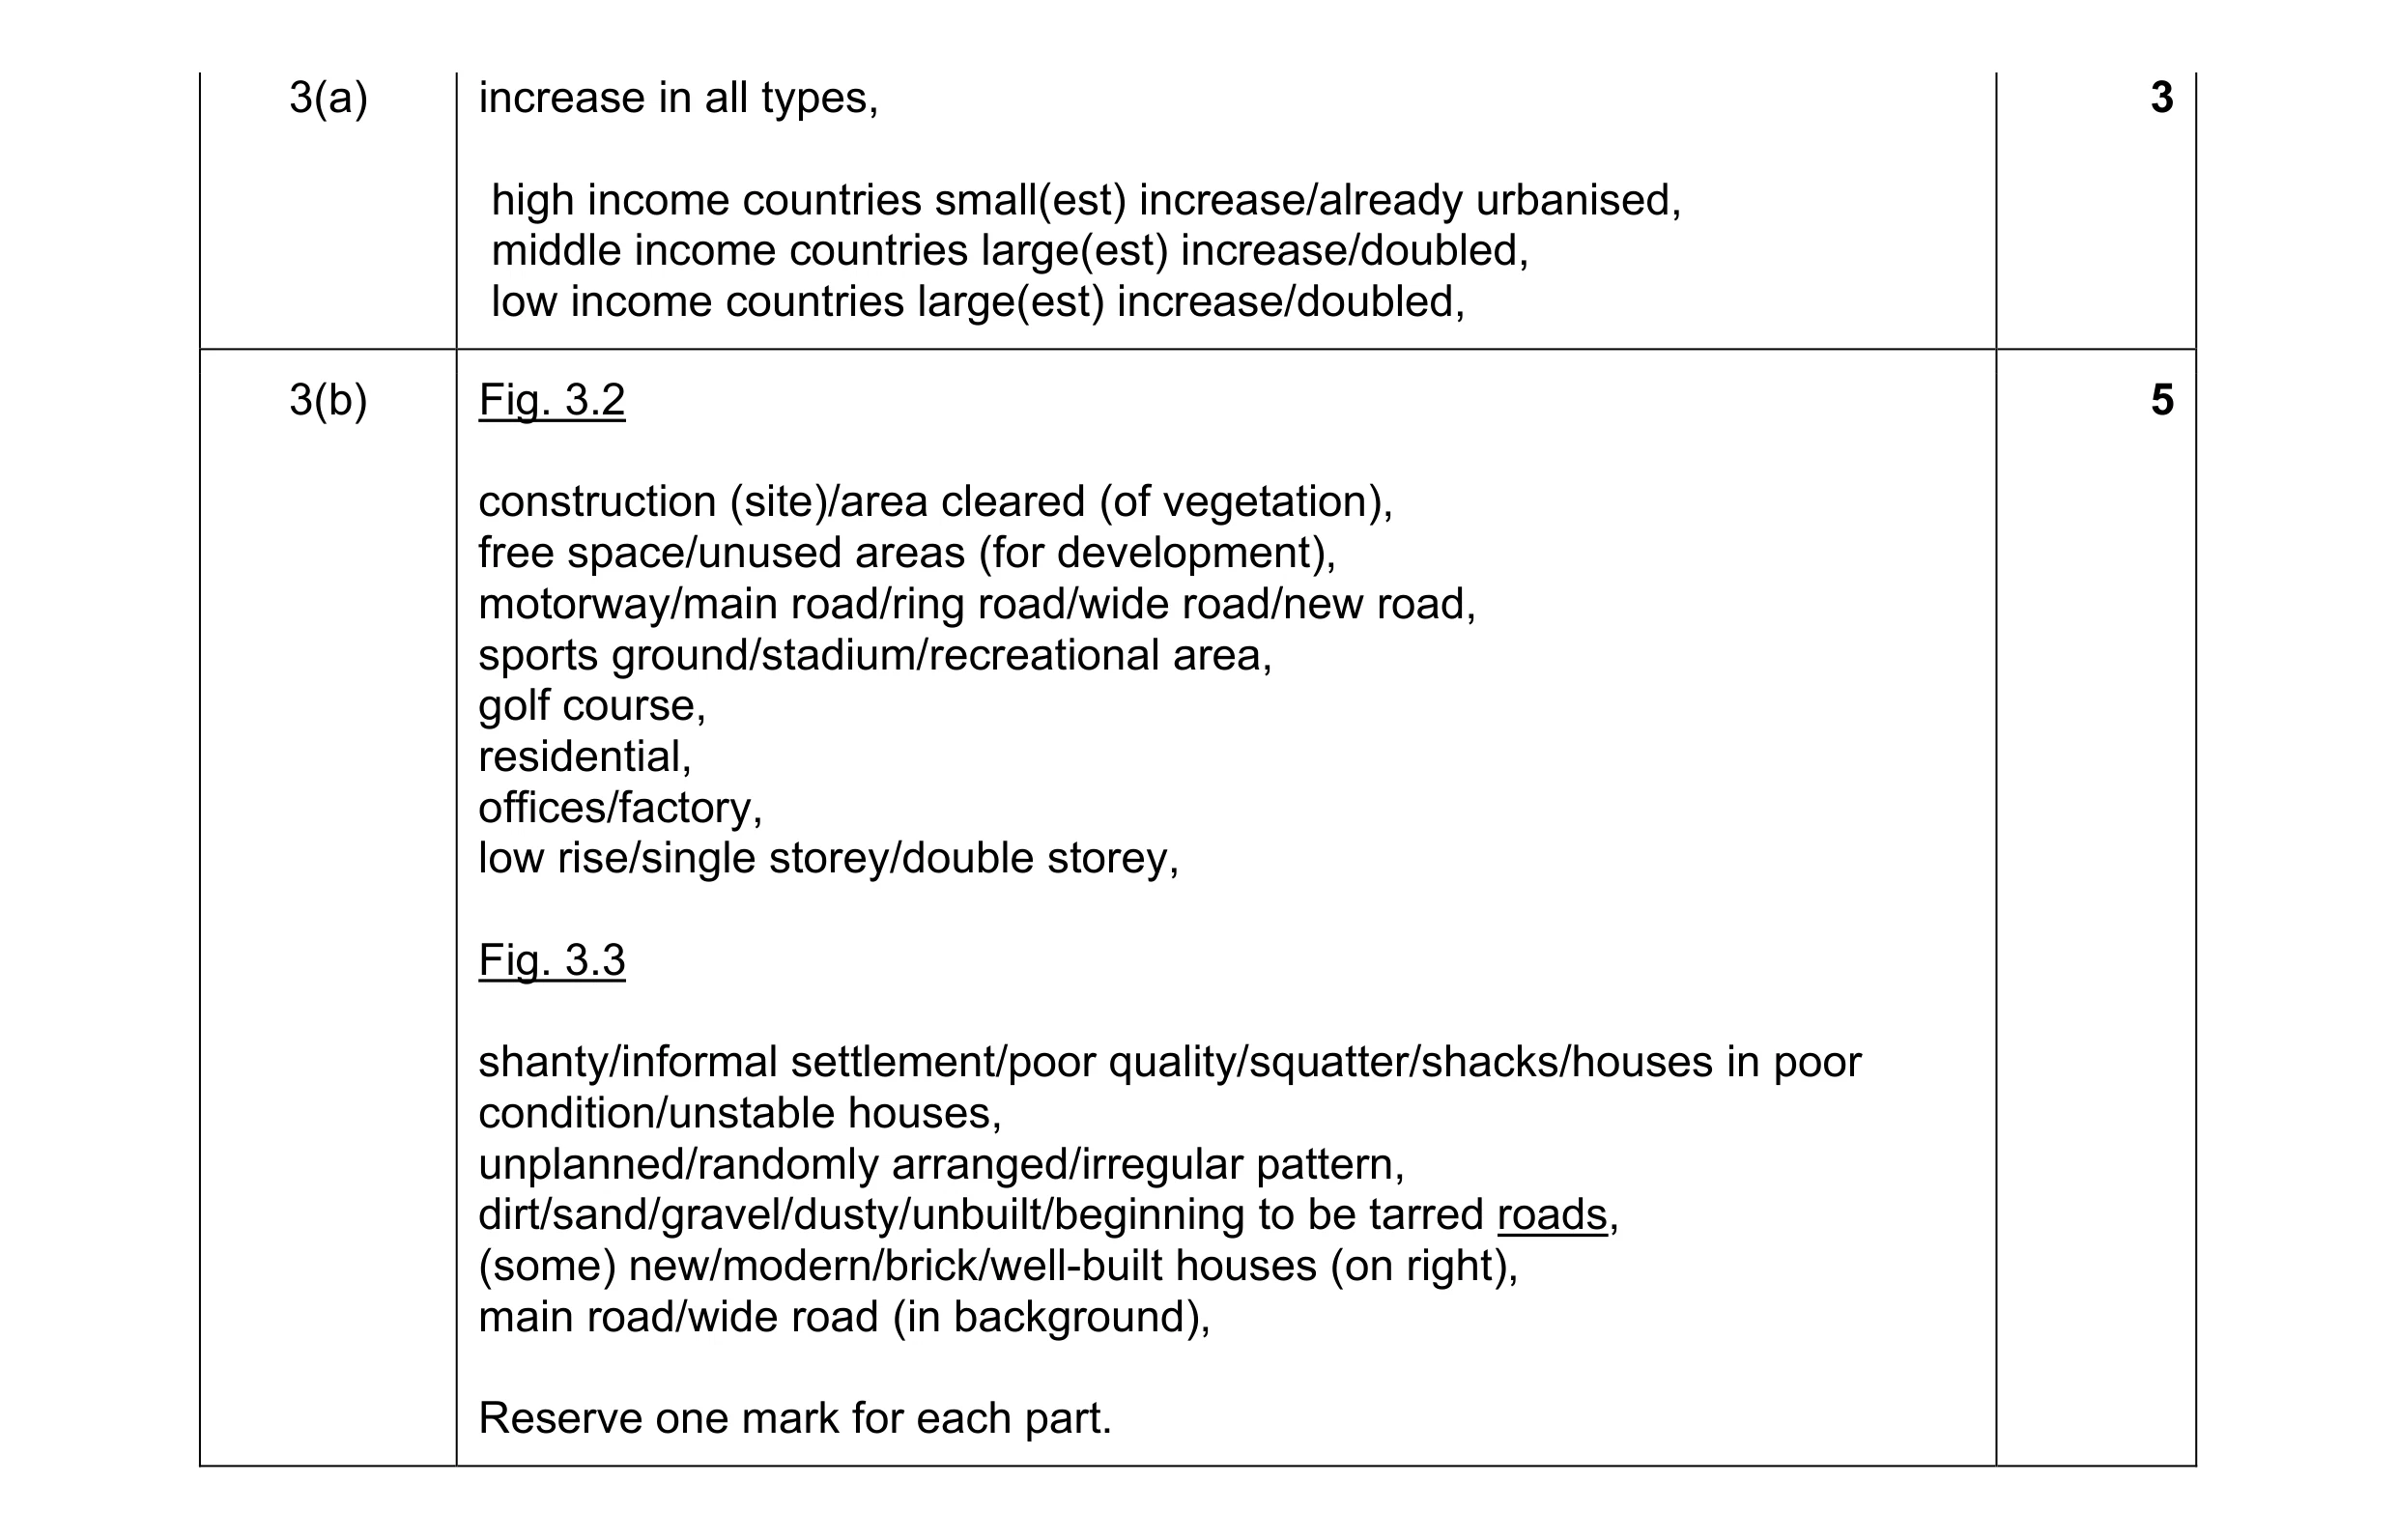 8
8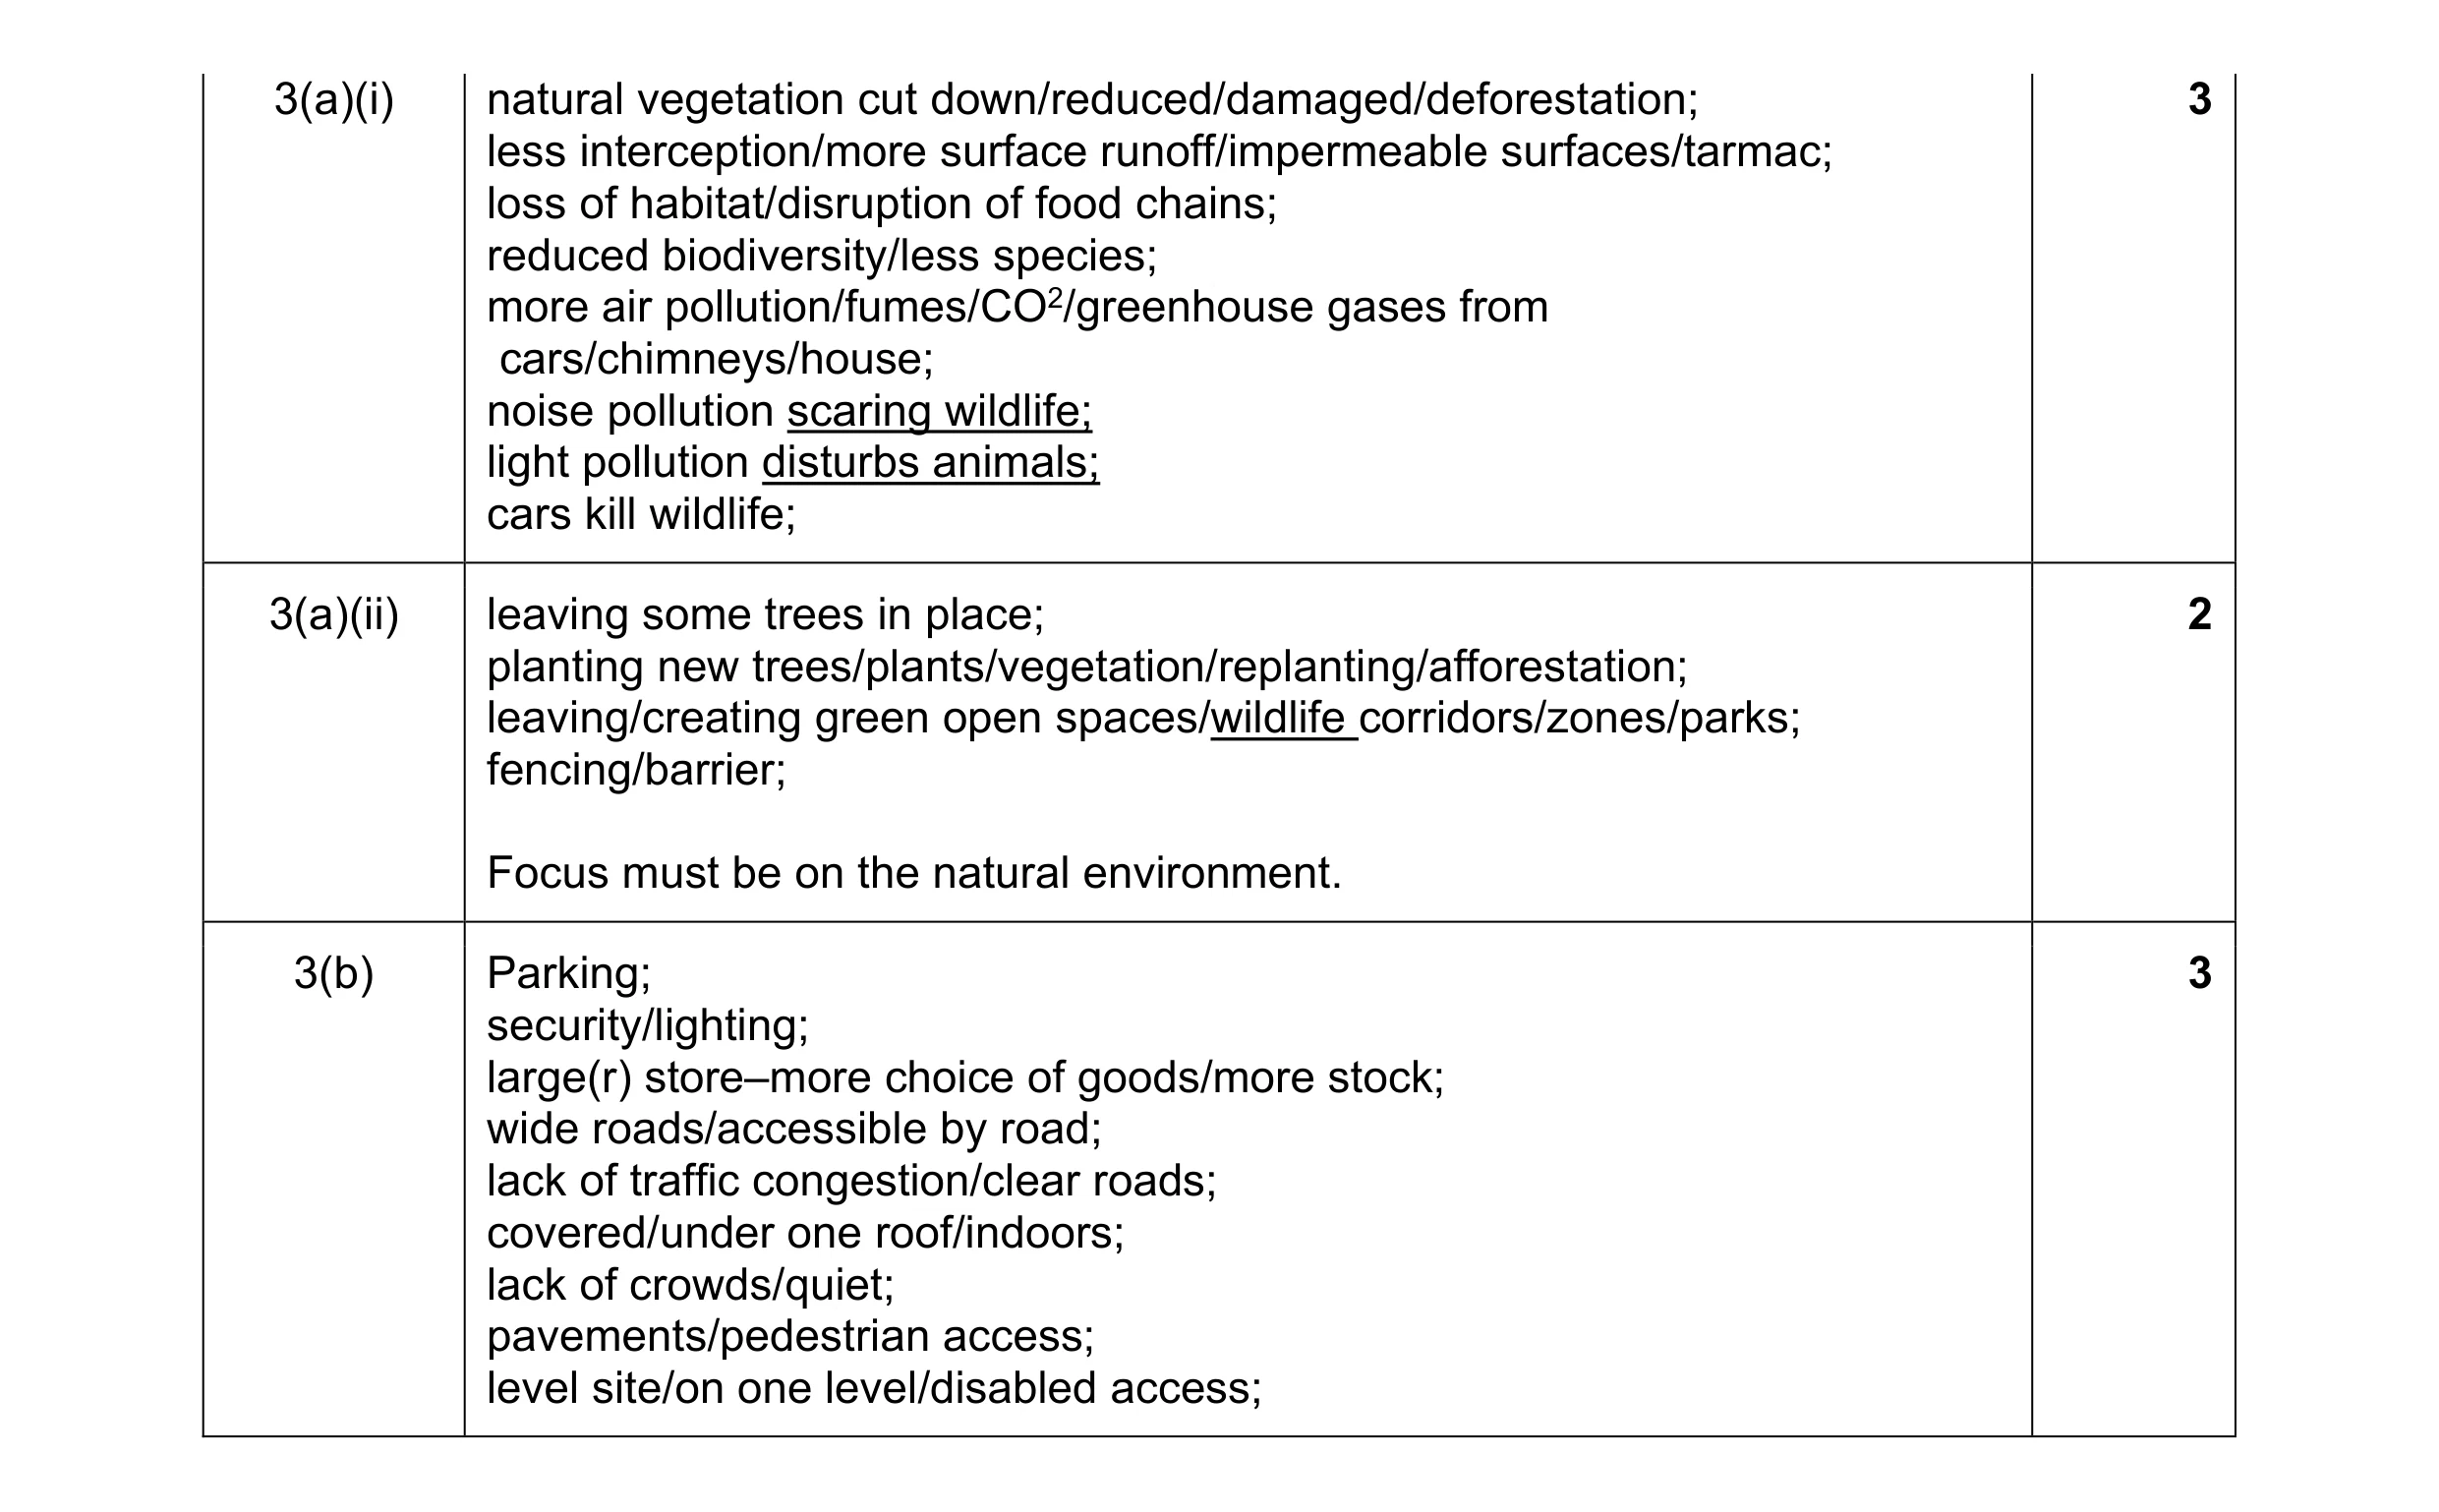 8
8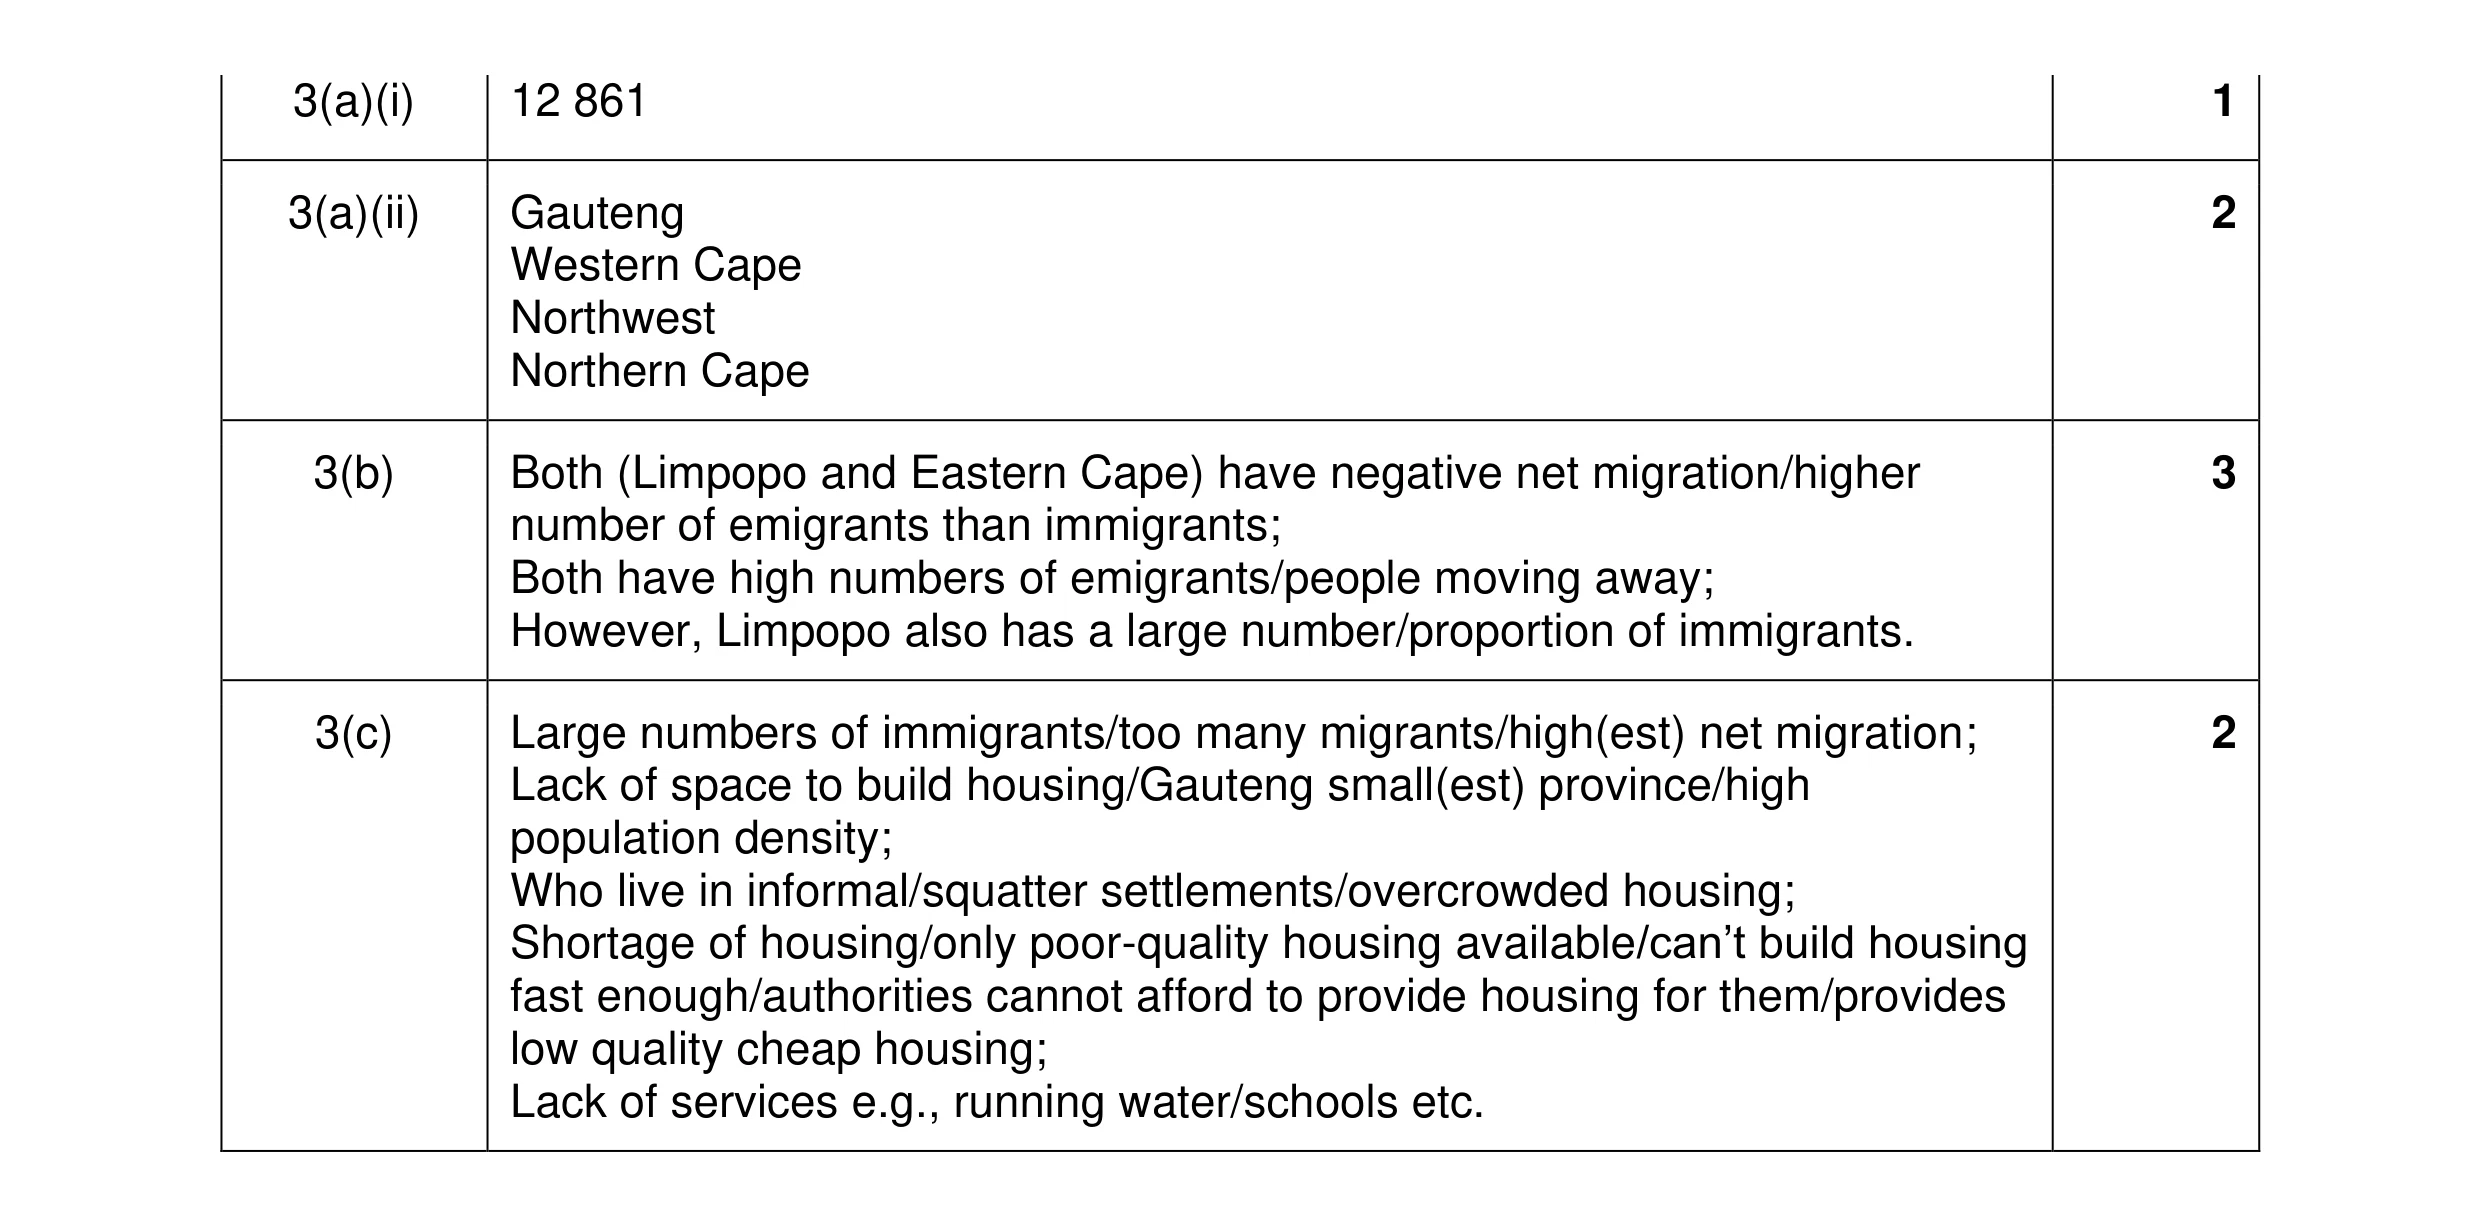 8
8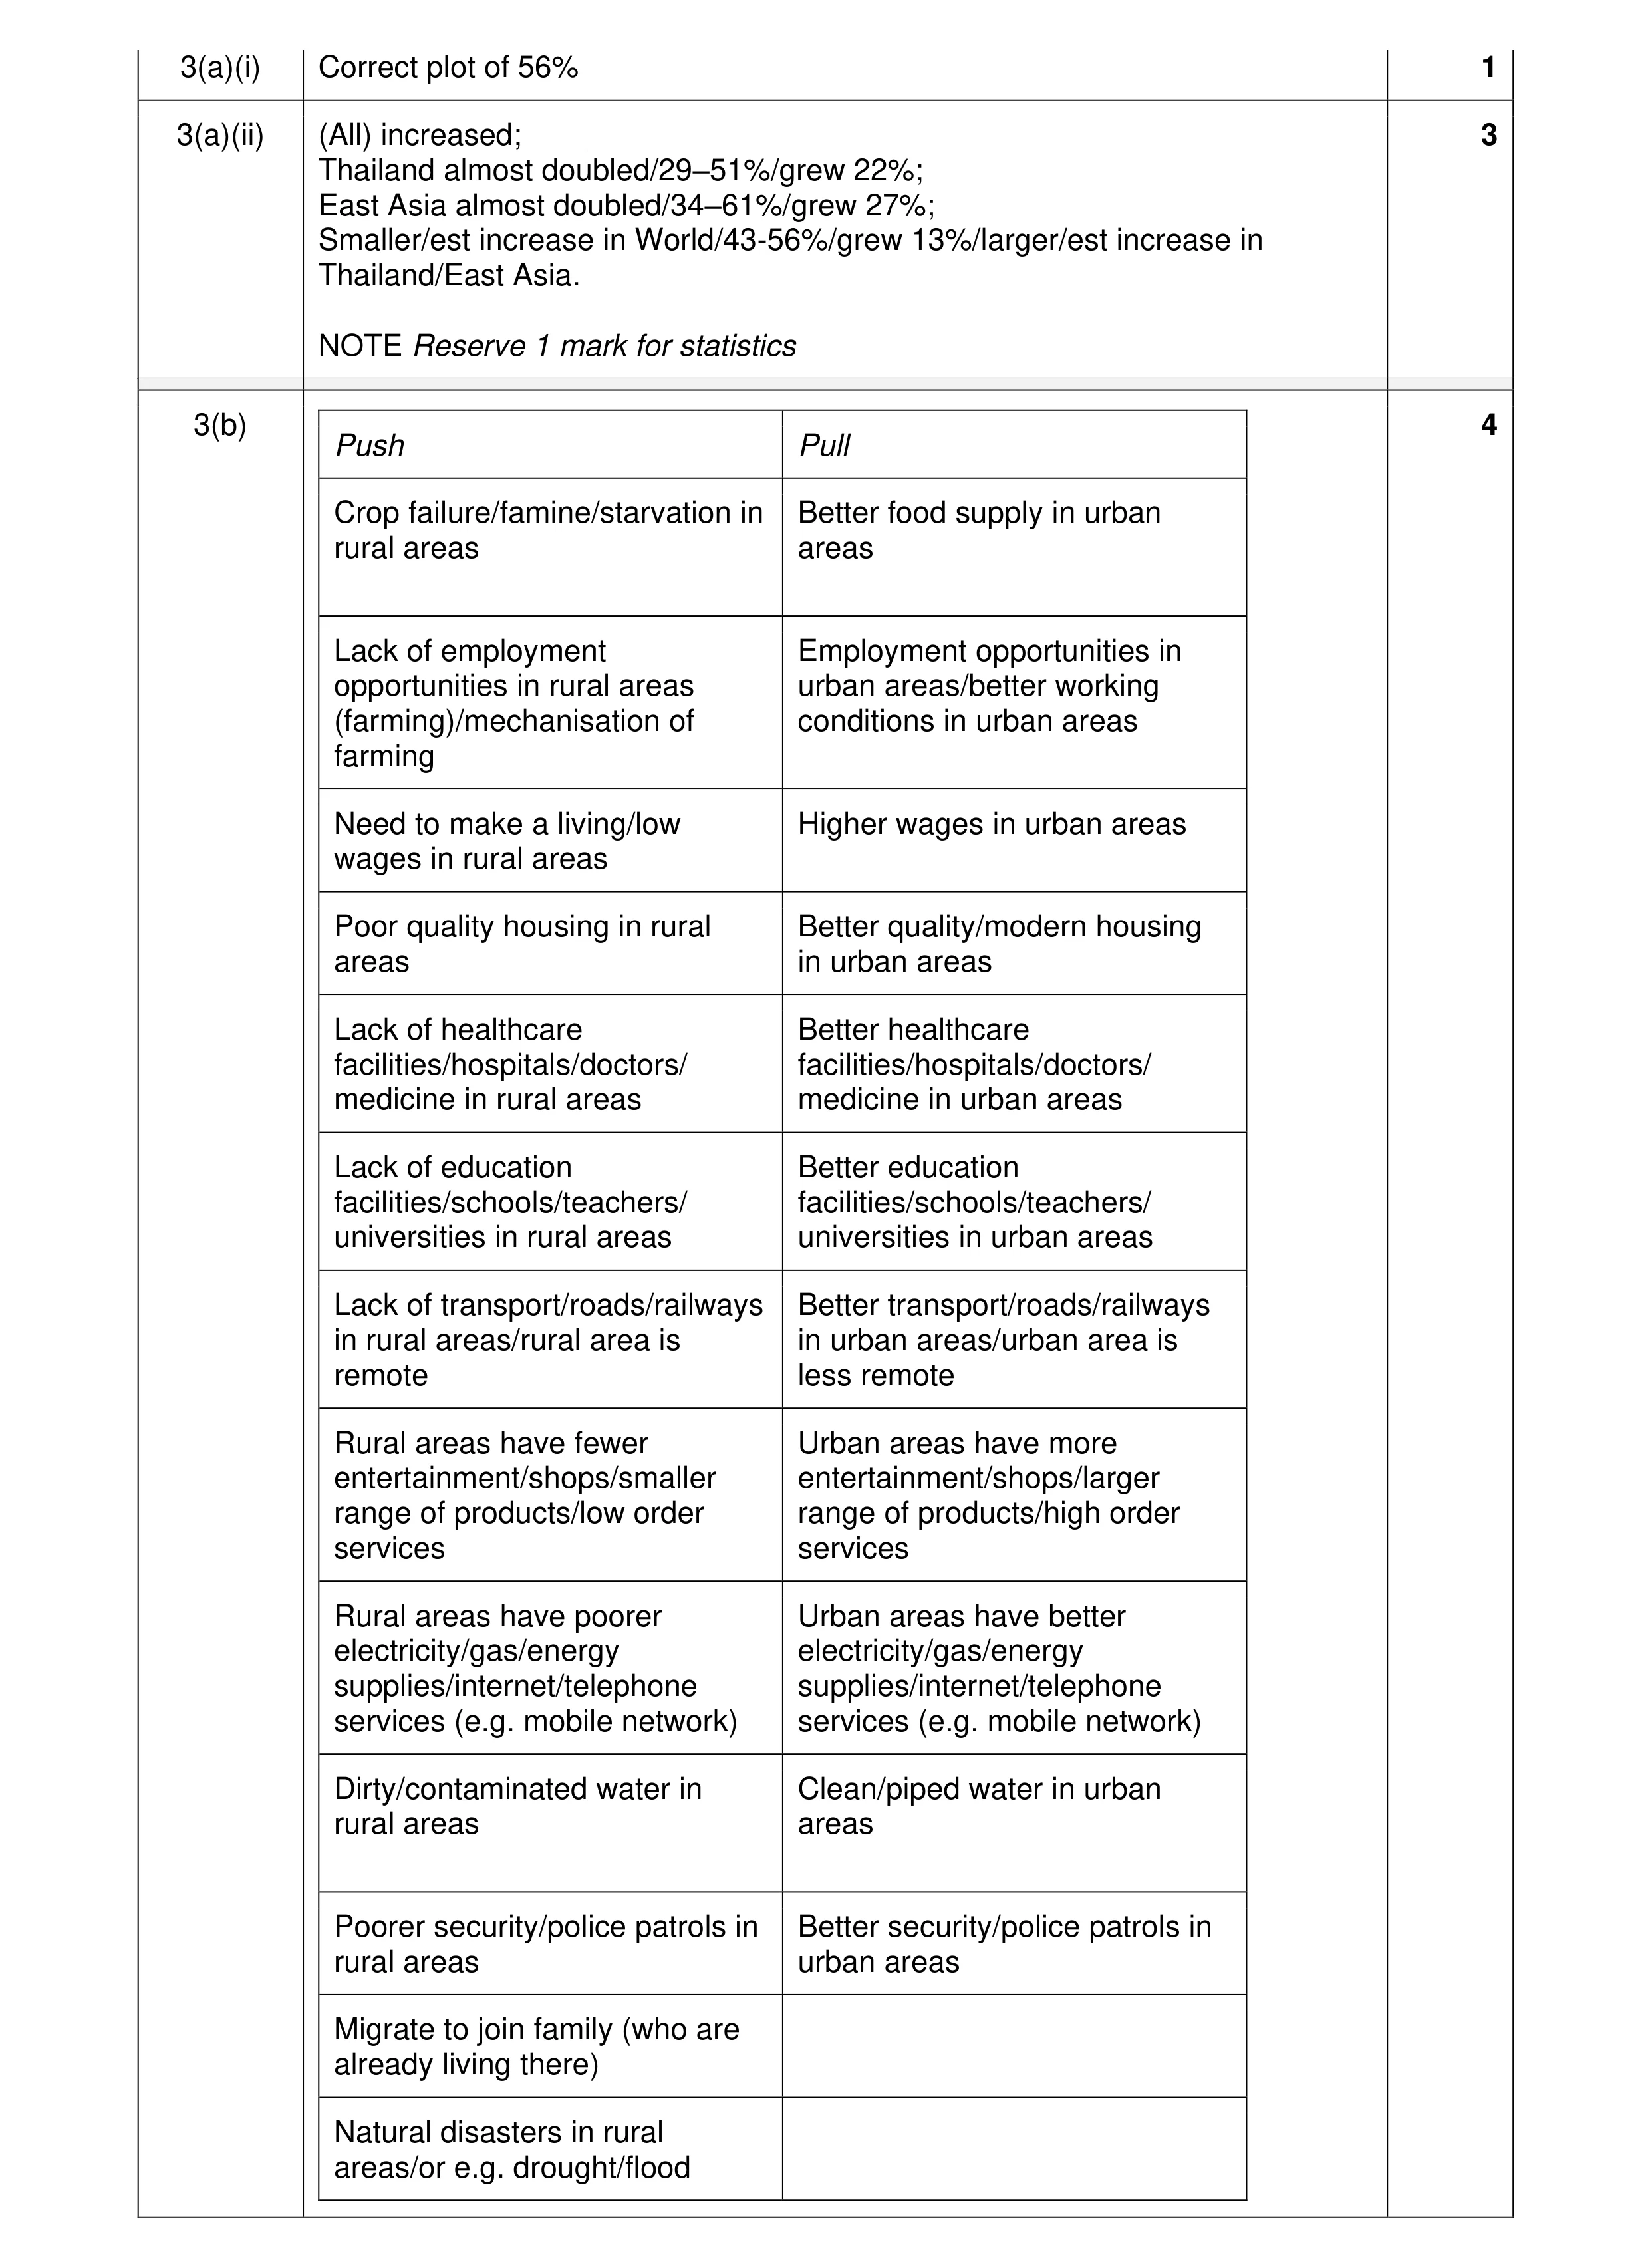 8
8