Cambridge IGCSE Geography 0460 — 2019 May/June Paper 2 · Variant 2
0460/22/M/J/19 · 6 questions · 60 marks · ≈68 min
The question paper and its mark scheme, free to read here and free to download. This is Cambridge’s own paper, exactly as it was sat.
Question paper24 pages

Mark scheme8 pages
Answers below. Sit the paper first if you are practising.
Questions as text
Q1 · Study the map extract for Tollarp, Sweden
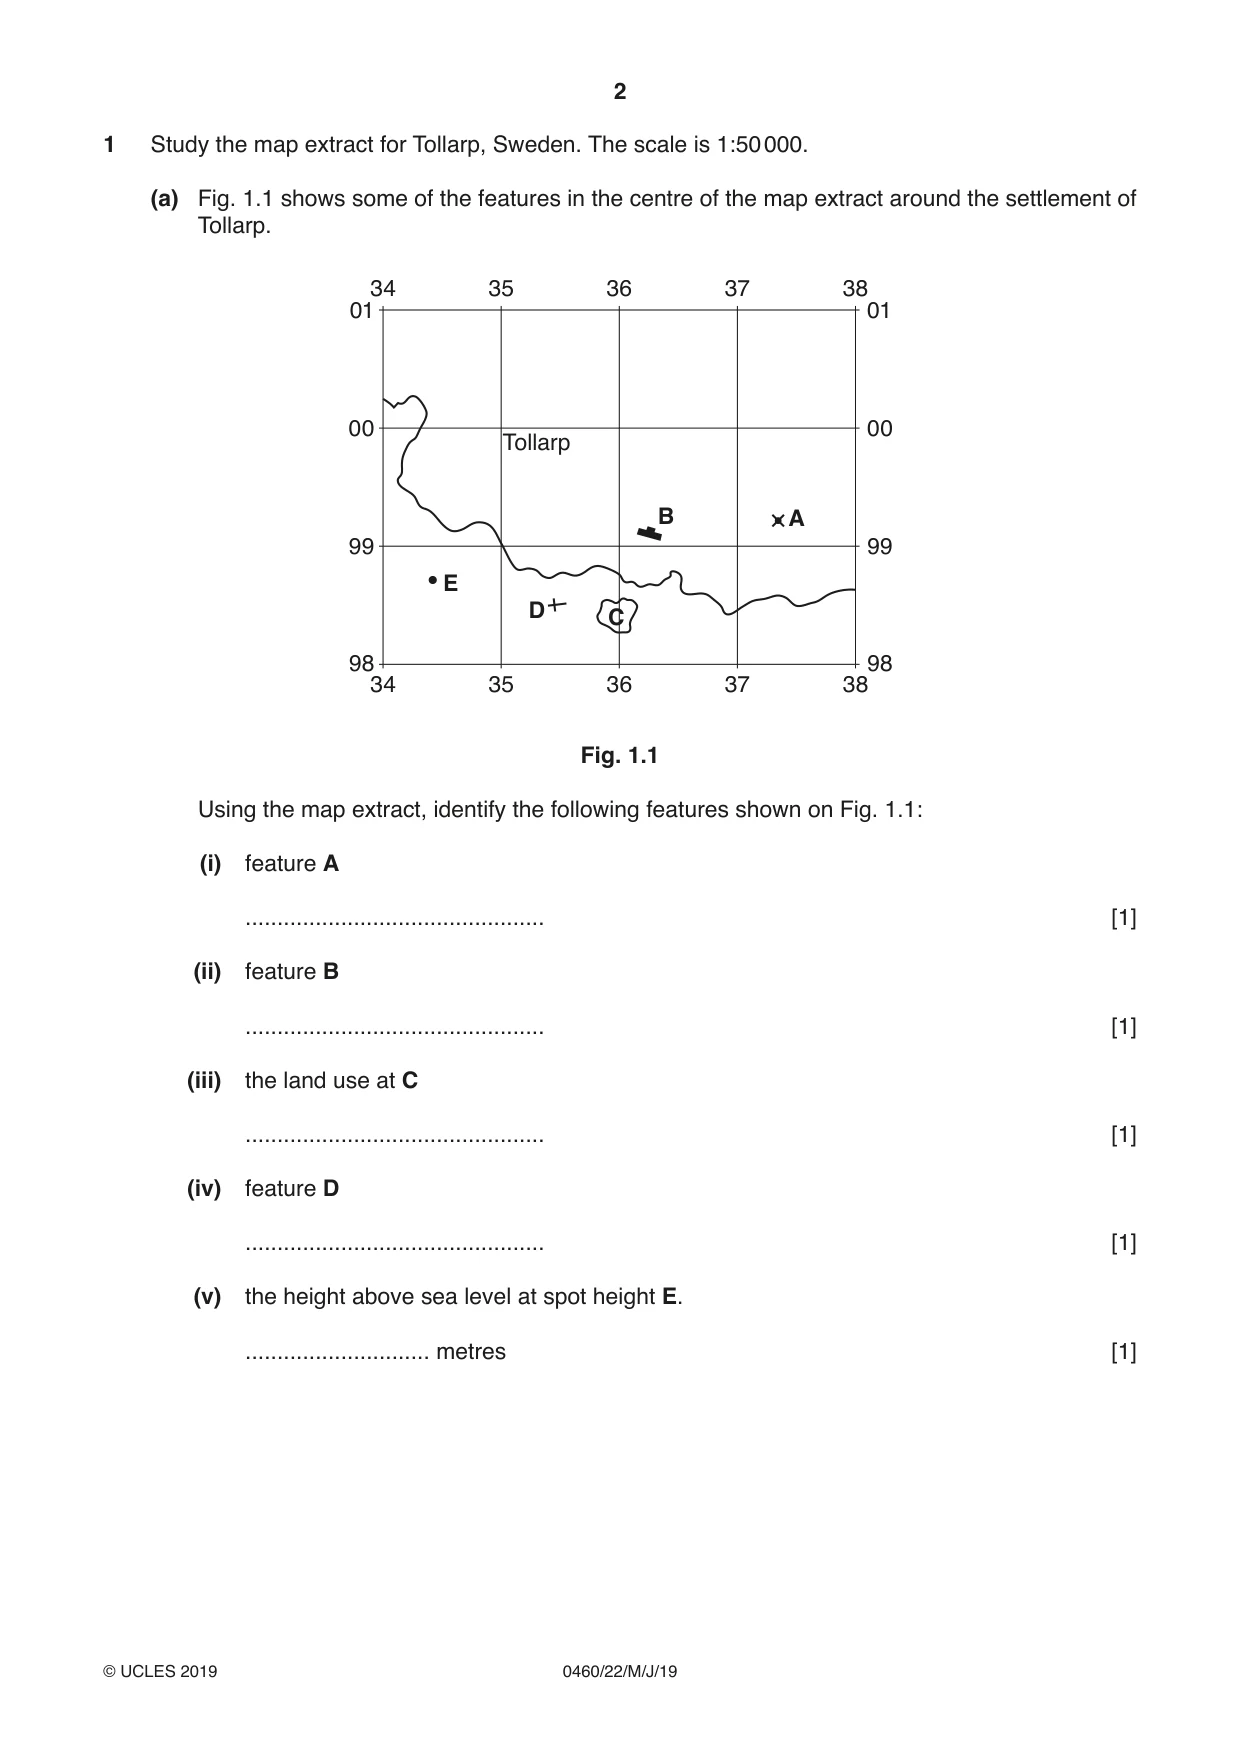
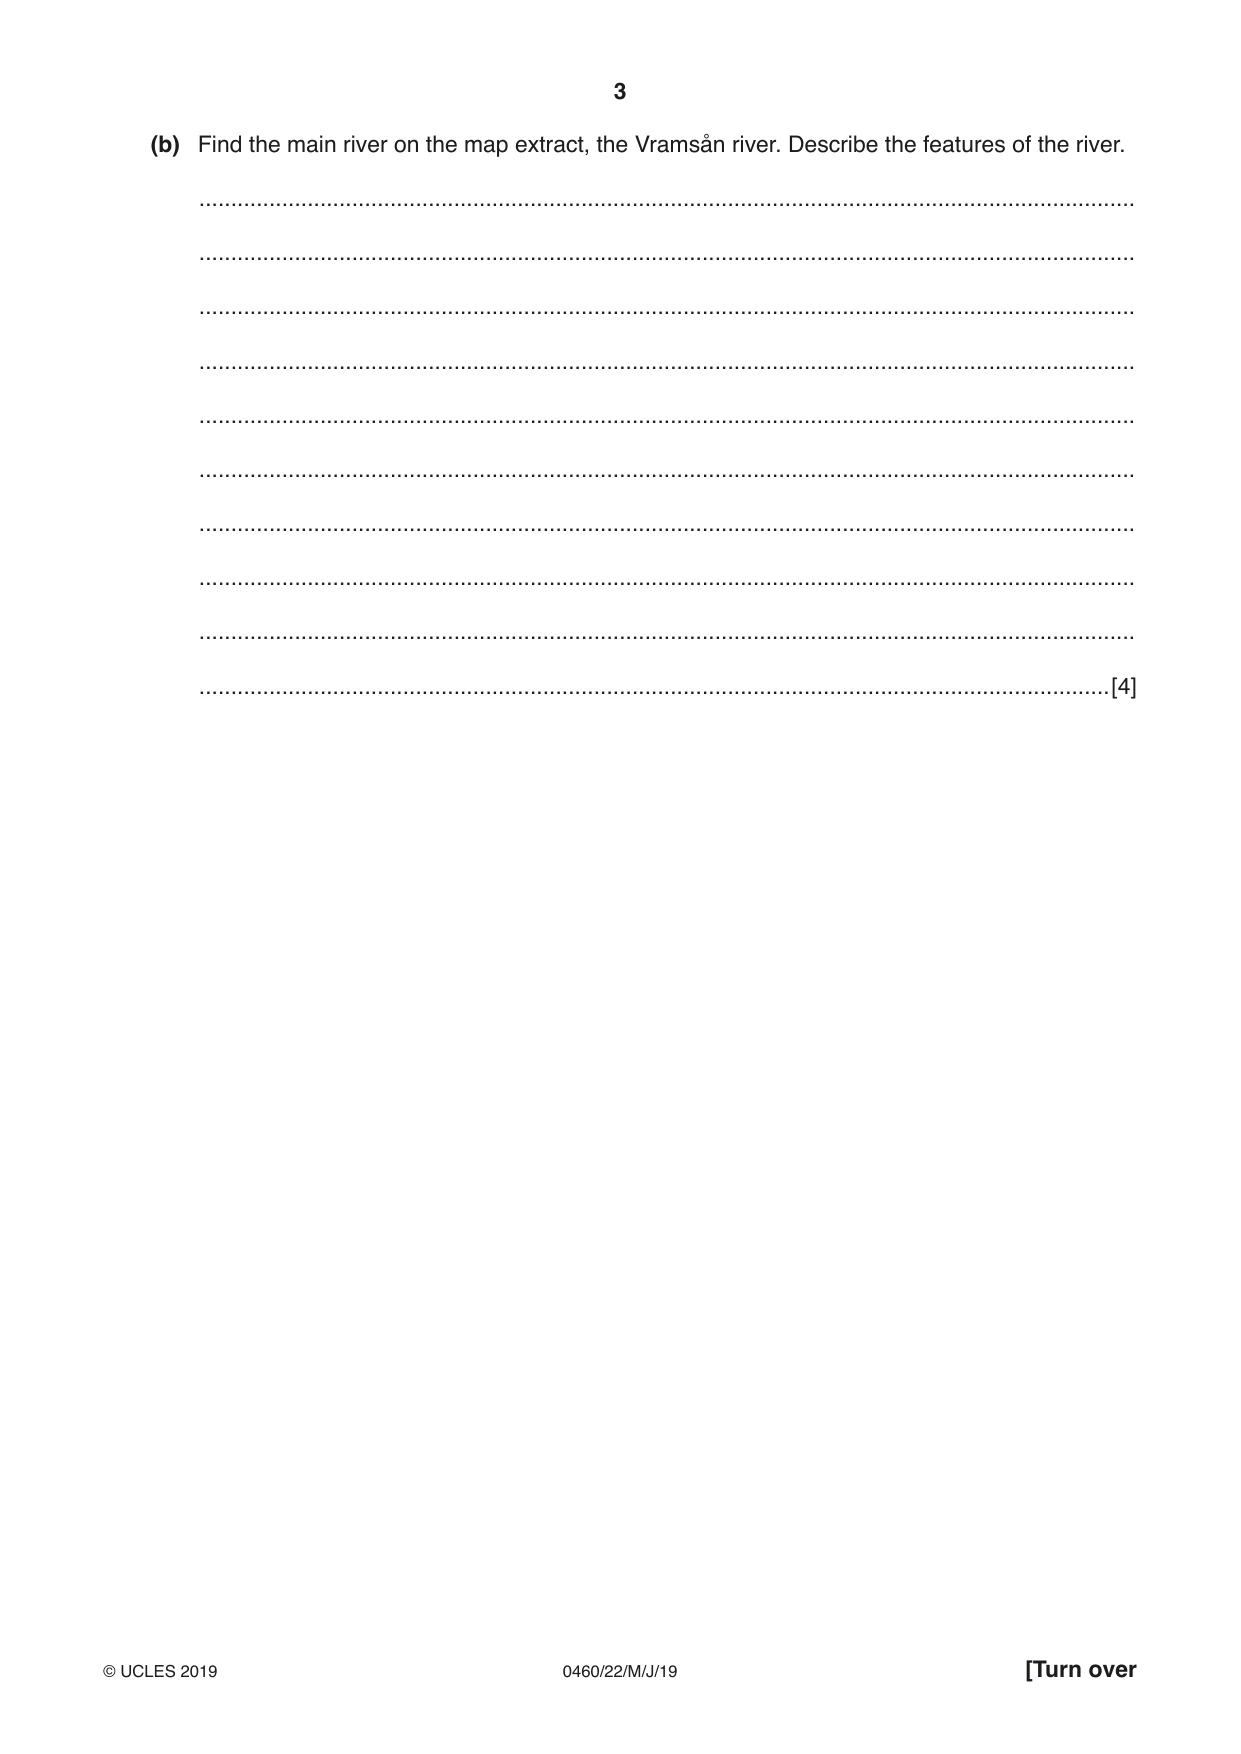
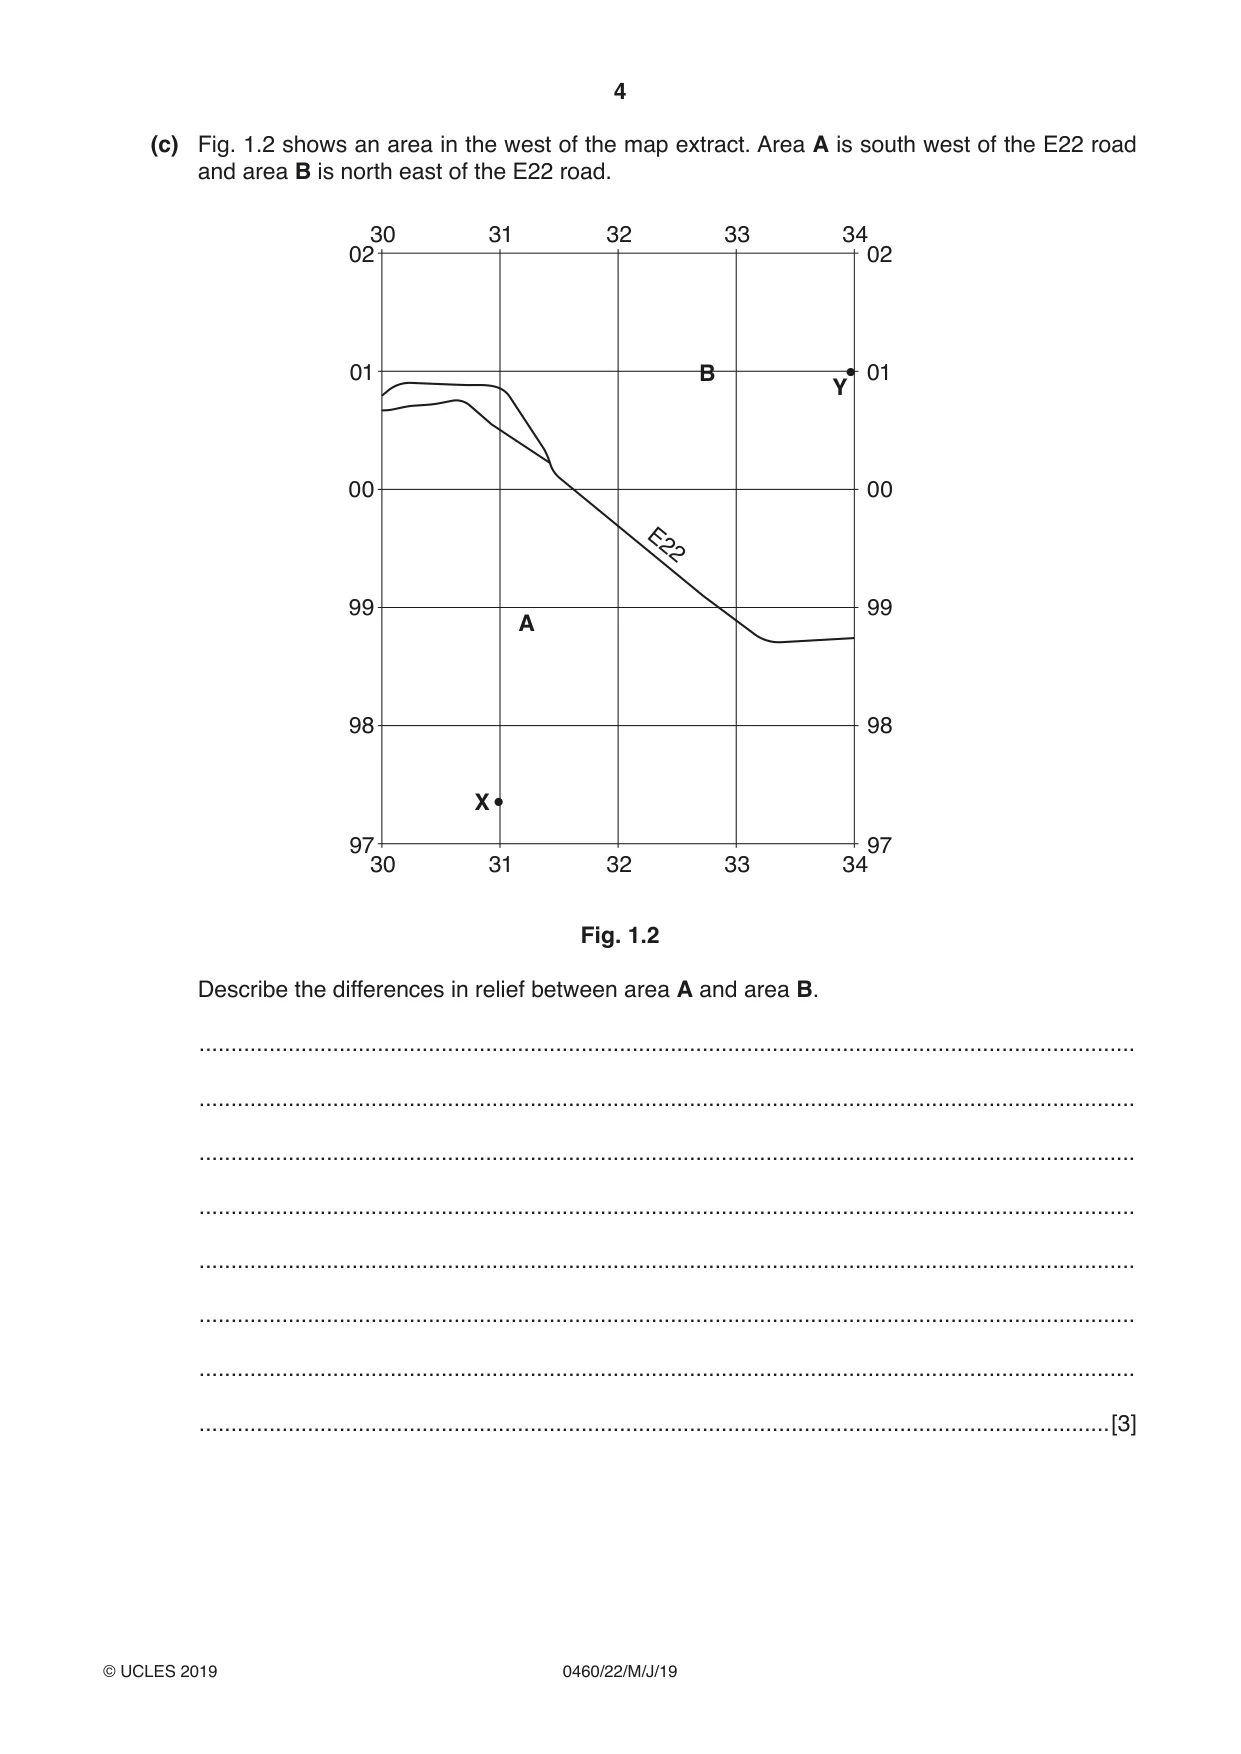
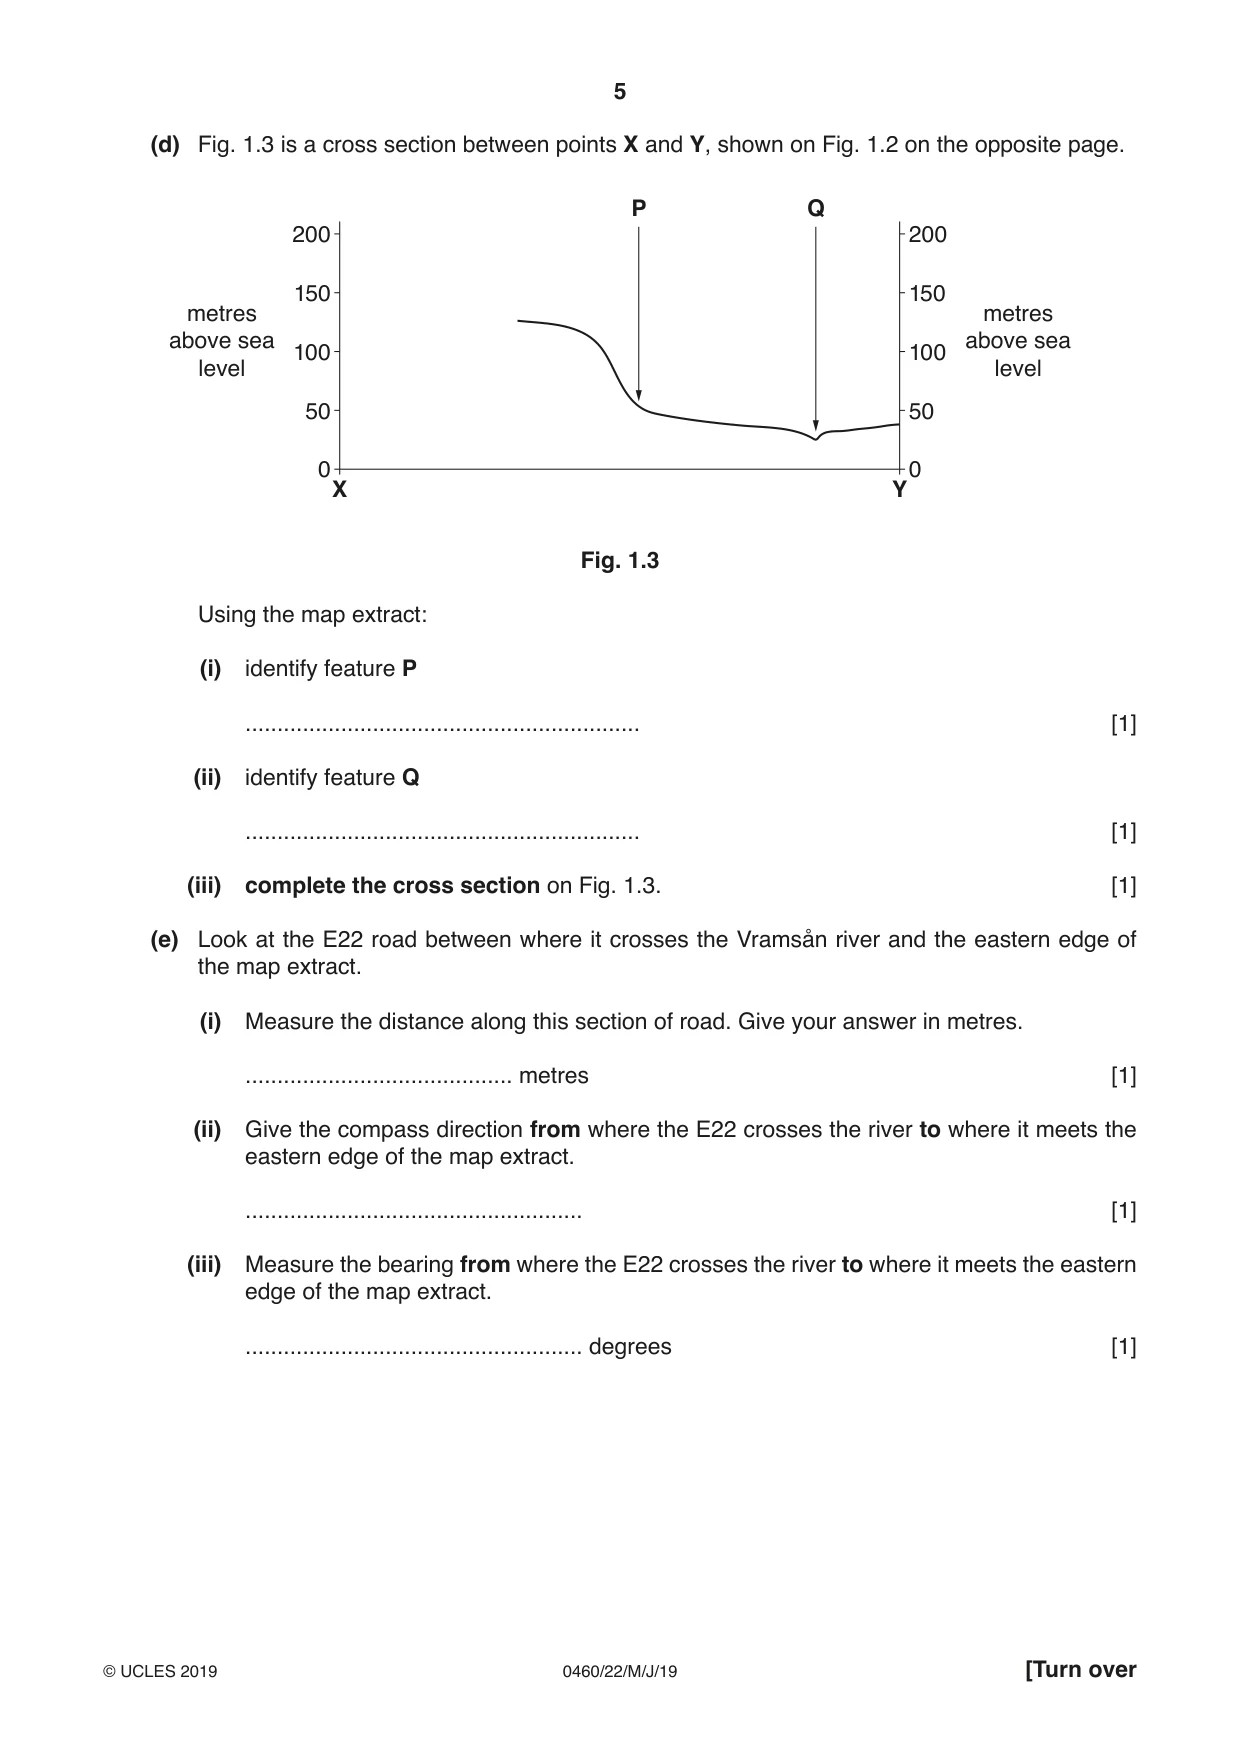
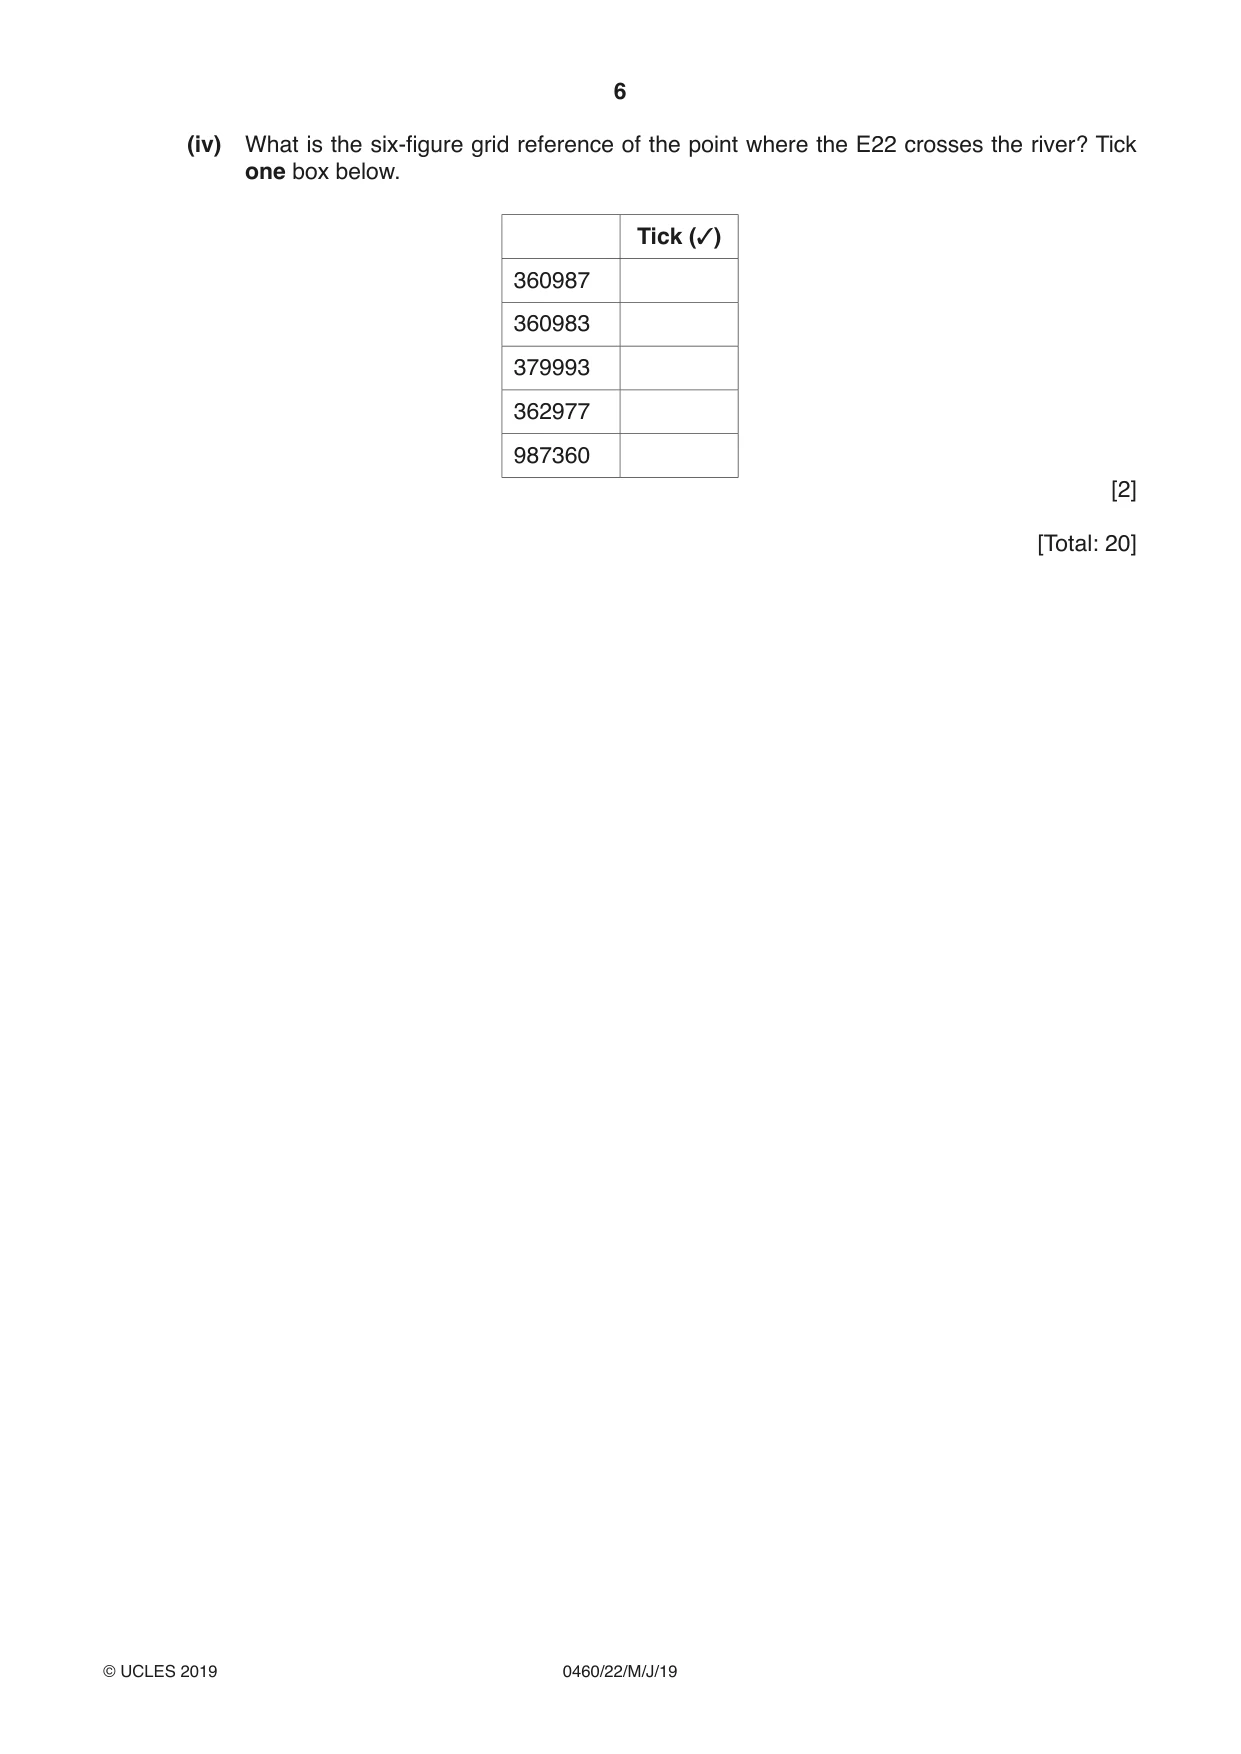
1 Study the map extract for Tollarp, Sweden. The scale is 1:50 000. (a) Fig. 1.1 shows some of the features in the centre of the map extract around the settlement of Tollarp. 34 35 36 37 38 01 01 00 00 Tollarp B A 99 99 E D C 98 98 34 35 36 37 38 Fig. 1.1 Using the map extract, identify the following features shown on Fig. 1.1: (i) feature A ............................................... [1] (ii) feature B ............................................... [1] (iii) the land use at C ............................................... [1] (iv) feature D ............................................... [1] (v) the height above sea level at spot height E. ............................. metres [1] (b) Find the main river on the map extract, the Vramsån river. Describe the features of the river. ................................................................................................................................................... ................................................................................................................................................... ................................................................................................................................................... ................................................................................................................................................... ................................................................................................................................................... ................................................................................................................................................... ................................................................................................................................................... ................................................................................................................................................... ................................................................................................................................................... ...............................................................................................................................................[4] (c) Fig. 1.2 shows an area in the west of the map extract. Area A is south west of the E22 road and area B is north east of the E22 road. 30 31 32 33 34 02 02 01 B 01 Y 00 00 E22 99 99 A 98 98 X 97 97 30 31 32 33 34 Fig. 1.2 Describe the differences in relief between area A and area B. ................................................................................................................................................... ................................................................................................................................................... ................................................................................................................................................... ................................................................................................................................................... ................................................................................................................................................... ................................................................................................................................................... ................................................................................................................................................... ...............................................................................................................................................[3] (d) Fig. 1.3 is a cross section between points X and Y, shown on Fig. 1.2 on the opposite page. P Q 200 200 150 150 metres metres above sea above sea 100 100 level level 50 50 0 0 X Y Fig. 1.3 Using the map extract: (i) identify feature P .............................................................. [1] (ii) identify feature Q .............................................................. [1] (iii) complete the cross section on Fig. 1.3. [1] (e) Look at the E22 road between where it crosses the Vramsån river and the eastern edge of the map extract. (i) Measure the distance along this section of road. Give your answer in metres. .......................................... metres [1] (ii) Give the compass direction from where the E22 crosses the river to where it meets the eastern edge of the map extract. ..................................................... [1] (iii) Measure the bearing from where the E22 crosses the river to where it meets the eastern edge of the map extract. ..................................................... degrees [1] (iv) What is the six-figure grid reference of the point where the E22 crosses the river? Tick one box below. Tick (✓) 360987 360983 379993 362977 987360 [2] [Total: 20]
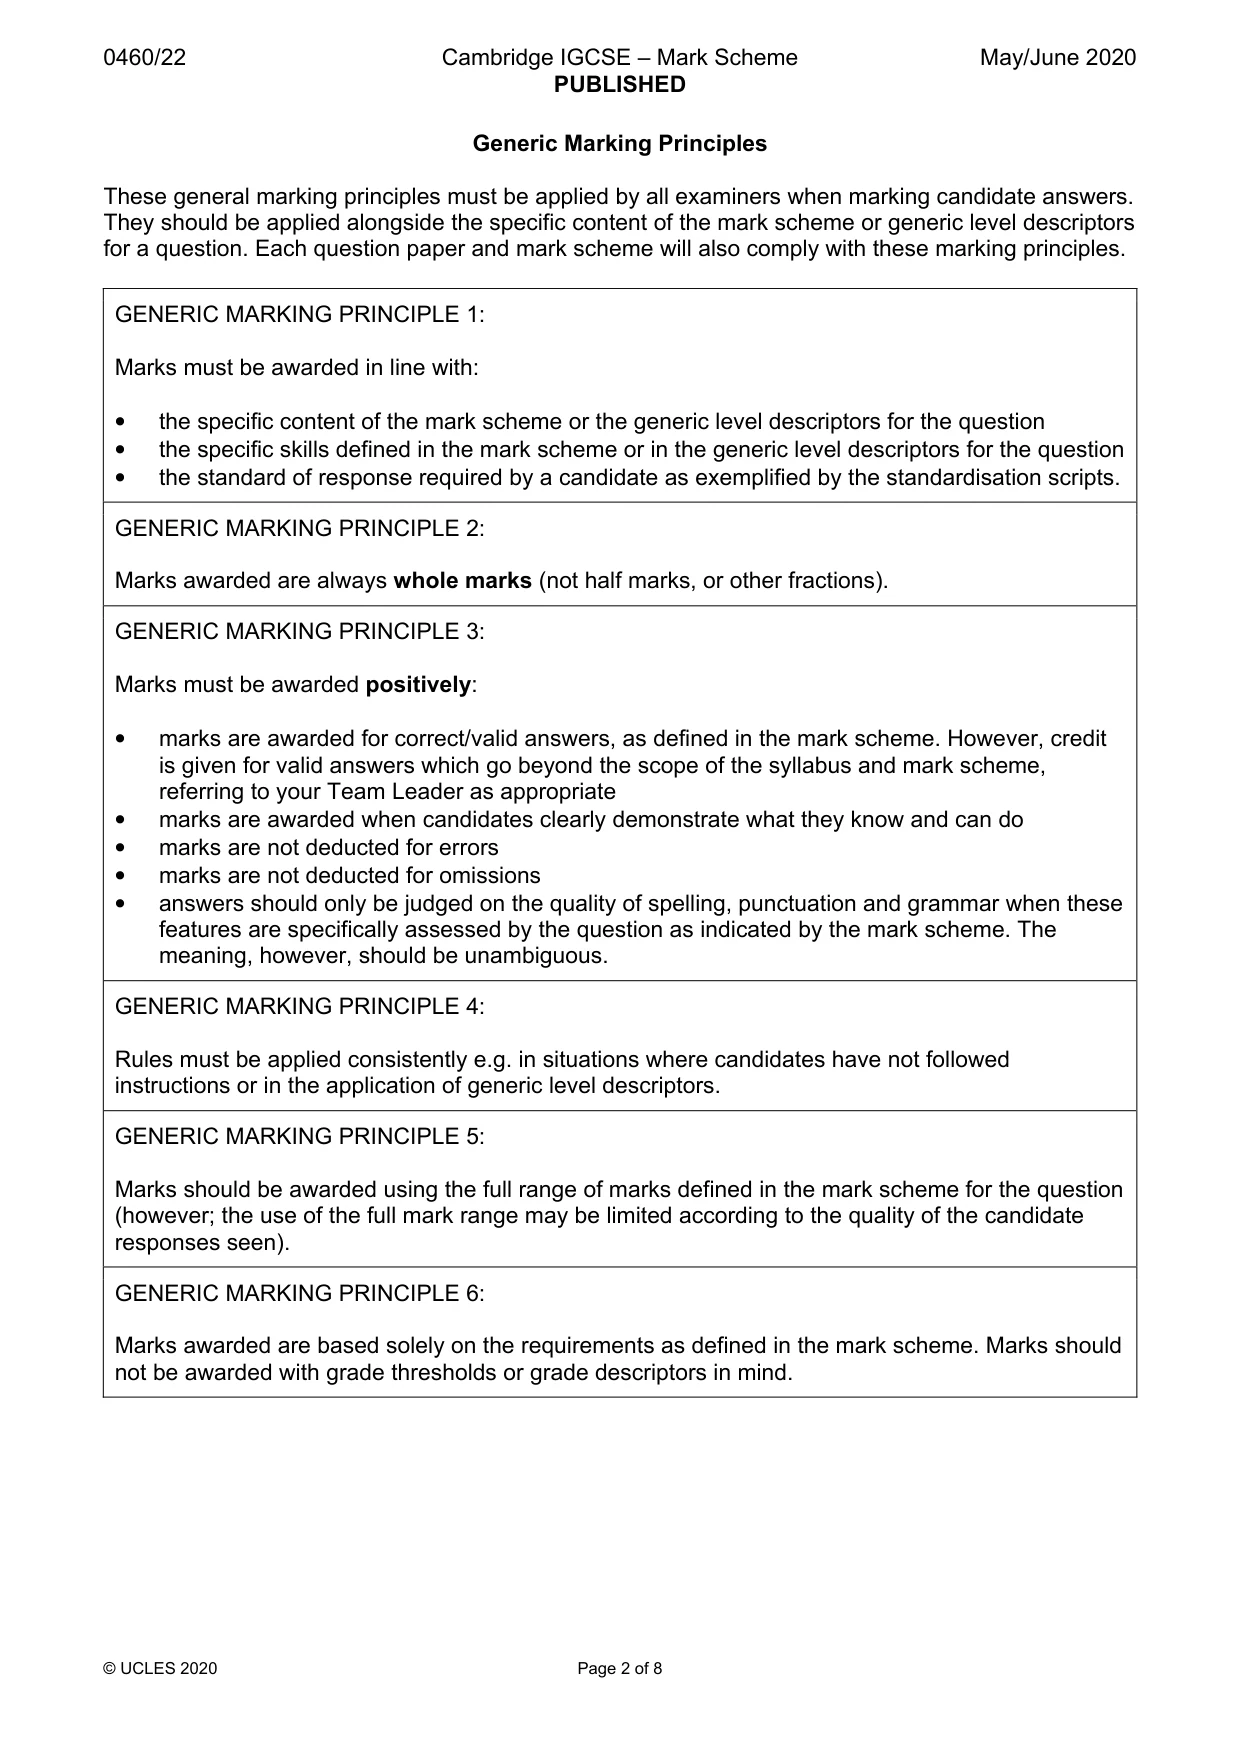
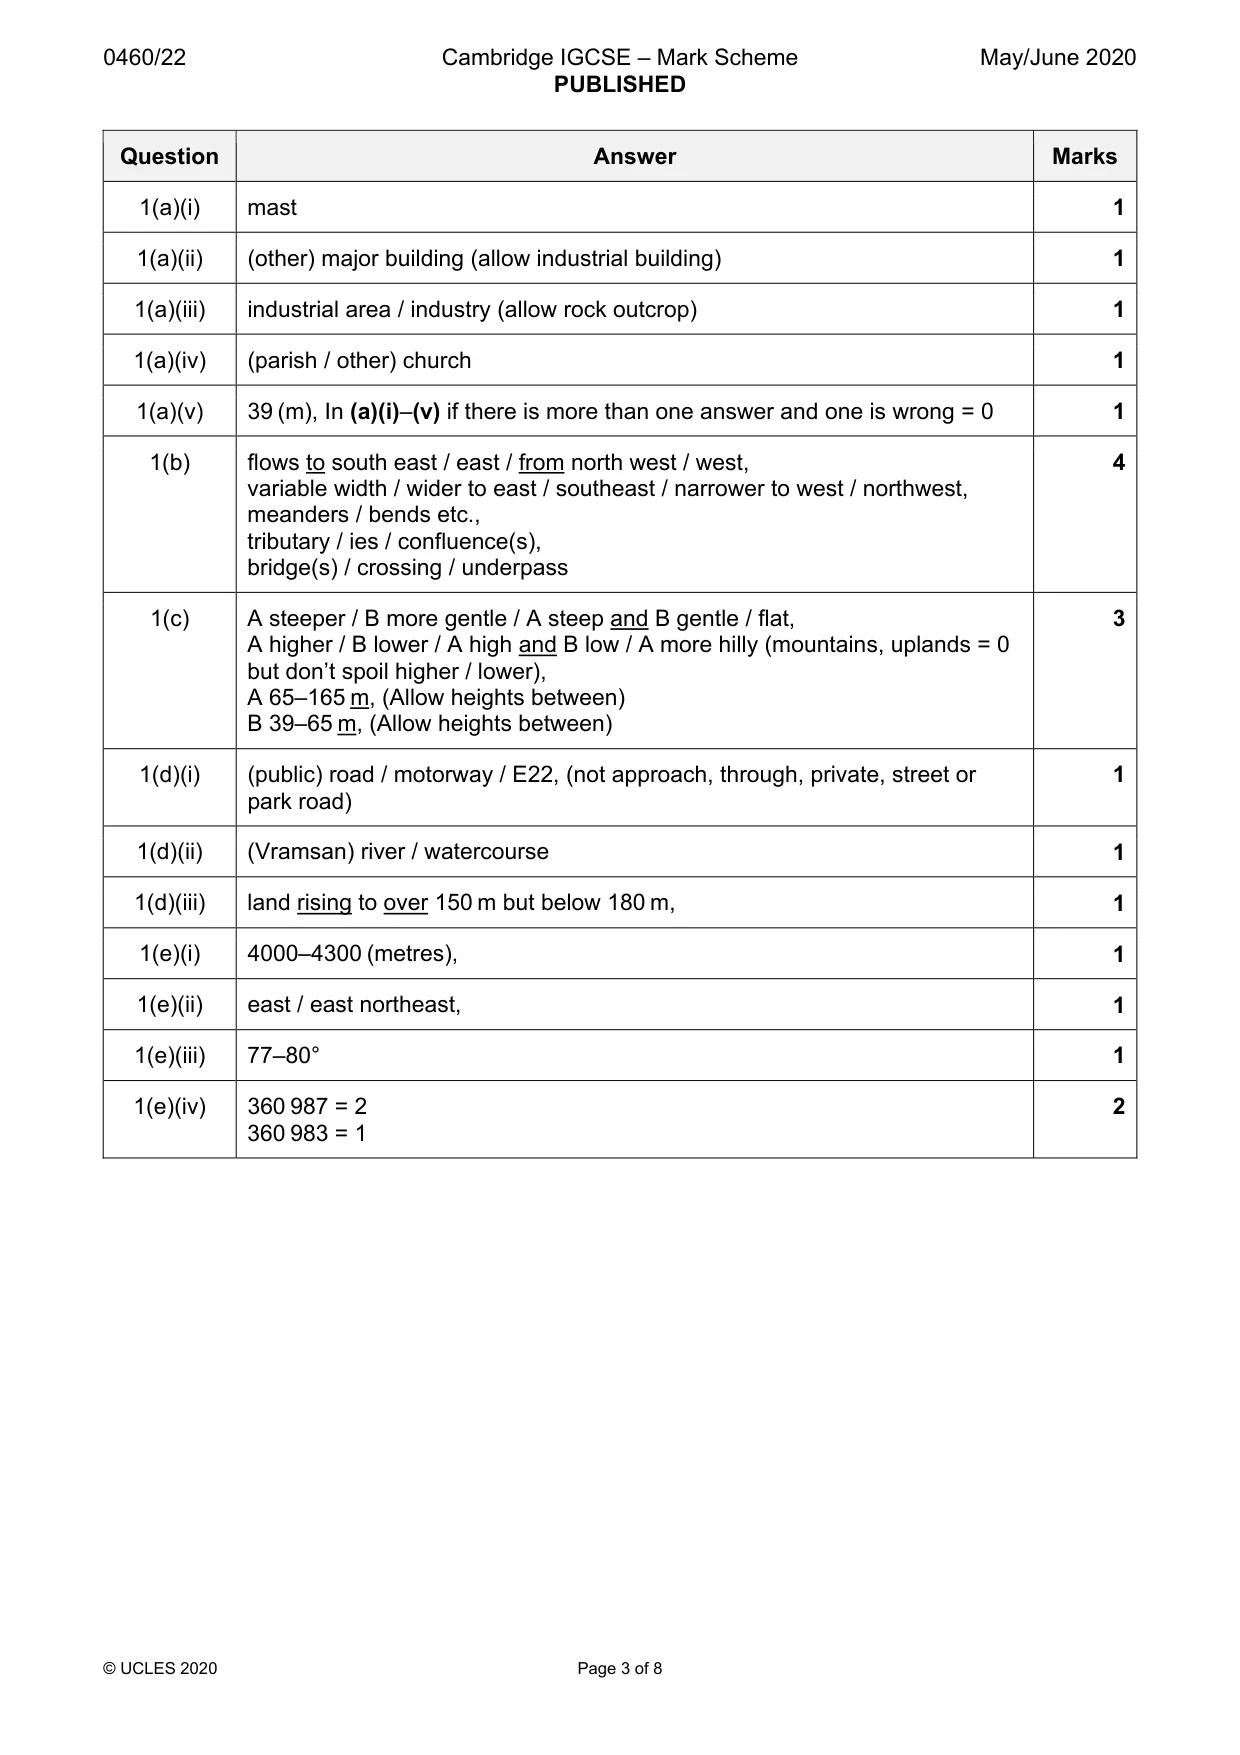
Mark scheme: Question Answer Marks 1(a)(i) mast 1 1(a)(ii) (other) major building (allow industrial building) 1 1(a)(iii) industrial area / industry (allow rock outcrop) 1 1(a)(iv) (parish / other) church 1 1(a)(v) 39 (m), In (a)(i)–(v) if there is more than one answer and one is wrong = 0 1 1(b) flows to south east / east / from north west / west, 4 variable width / wider to east / southeast / narrower to west / northwest, meanders / bends etc., tributary / ies / confluence(s), bridge(s) / crossing / underpass 1(c) A steeper / B more gentle / A steep and B gentle / flat, 3 A higher / B lower / A high and B low / A more hilly (mountains, uplands = 0 but don’t spoil higher / lower), A 65–165 m, (Allow heights between) B 39–65 m, (Allow heights between) 1(d)(i) (public) road / motorway / E22, (not approach, through, private, street or 1 park road) 1(d)(ii) (Vramsan) river / watercourse 1 1(d)(iii) land rising to over 150 m but below 180 m, 1 1(e)(i) 4000–4300 (metres), 1 1(e)(ii) east / east northeast, 1 1(e)(iii) 77–80° 1 1(e)(iv) 360 987 = 2 2 360 983 = 1
More questions on Settlements (rural and urban) and service provision
Q2 · Which one of the following statements describes a transnational corporation?
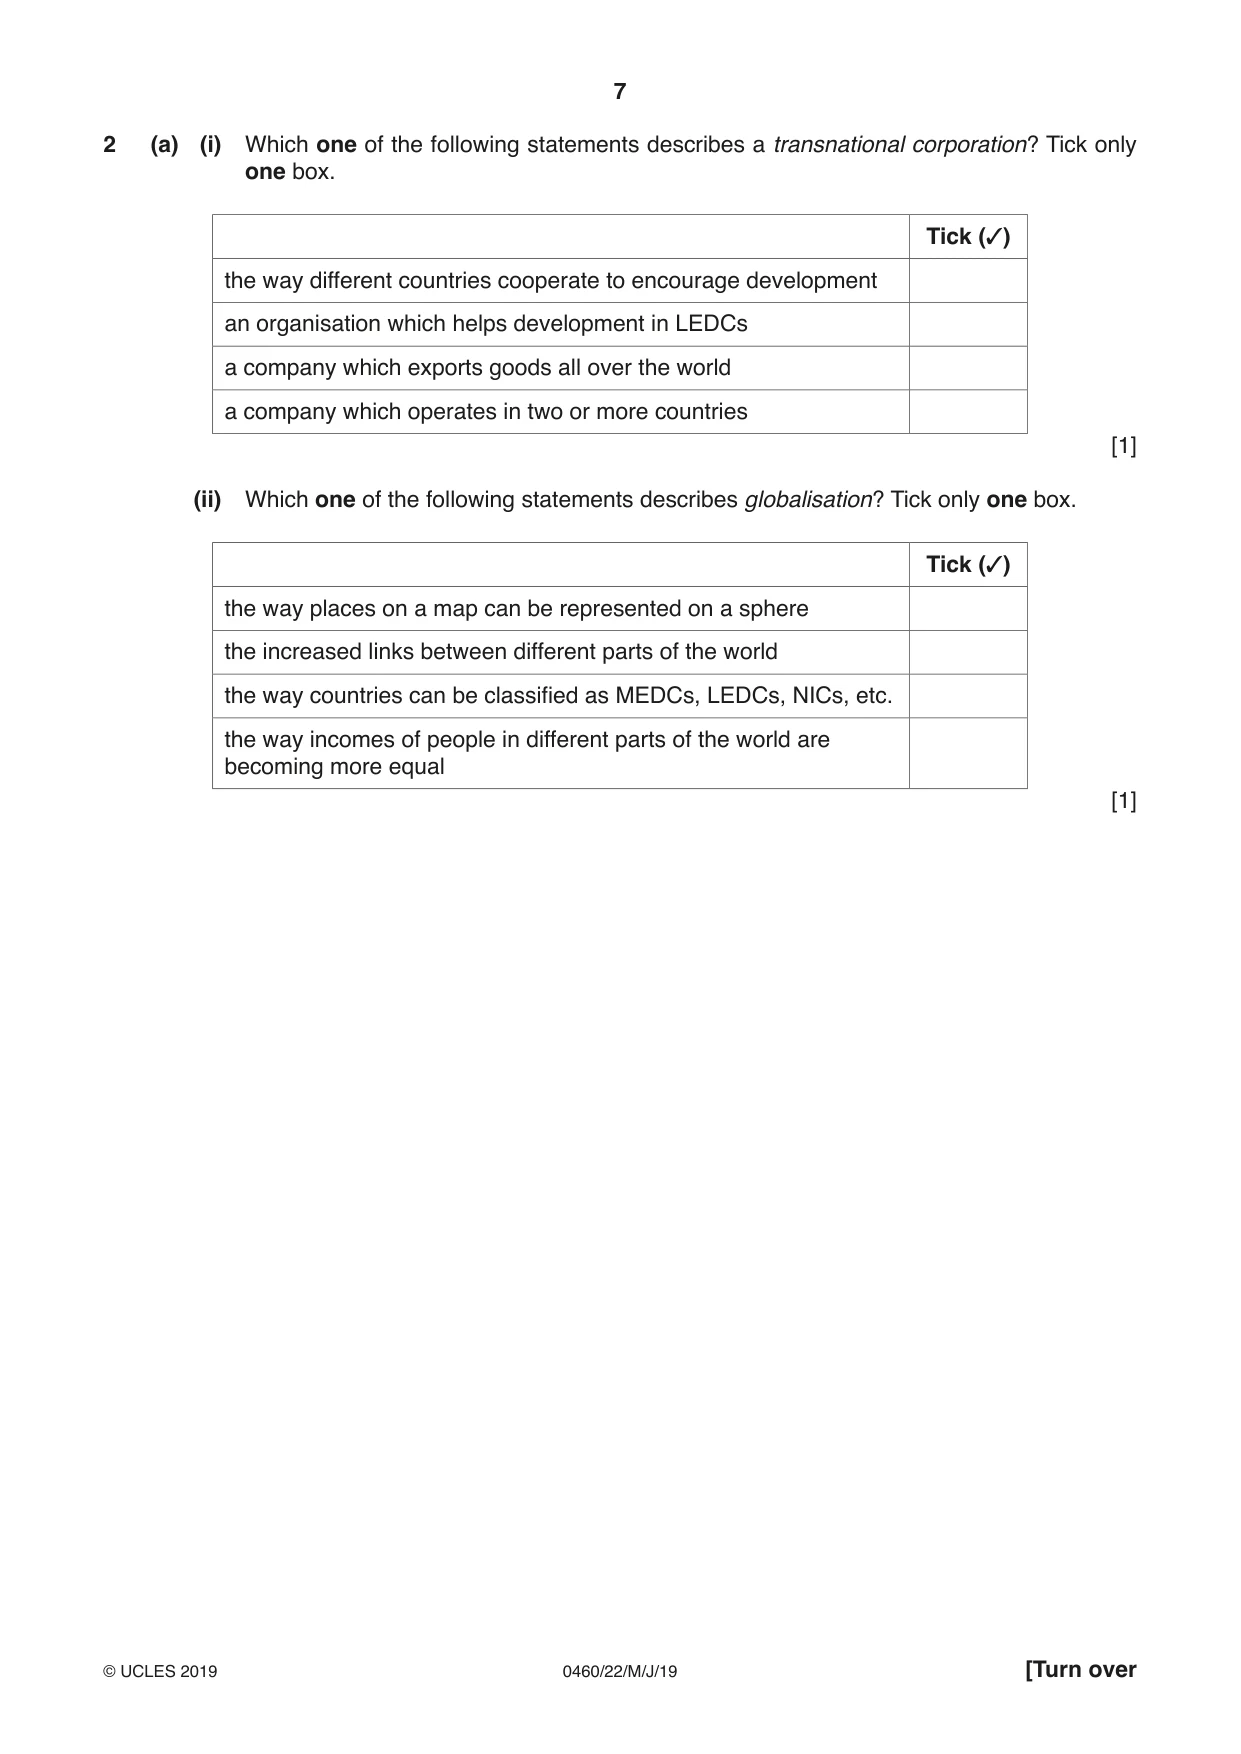
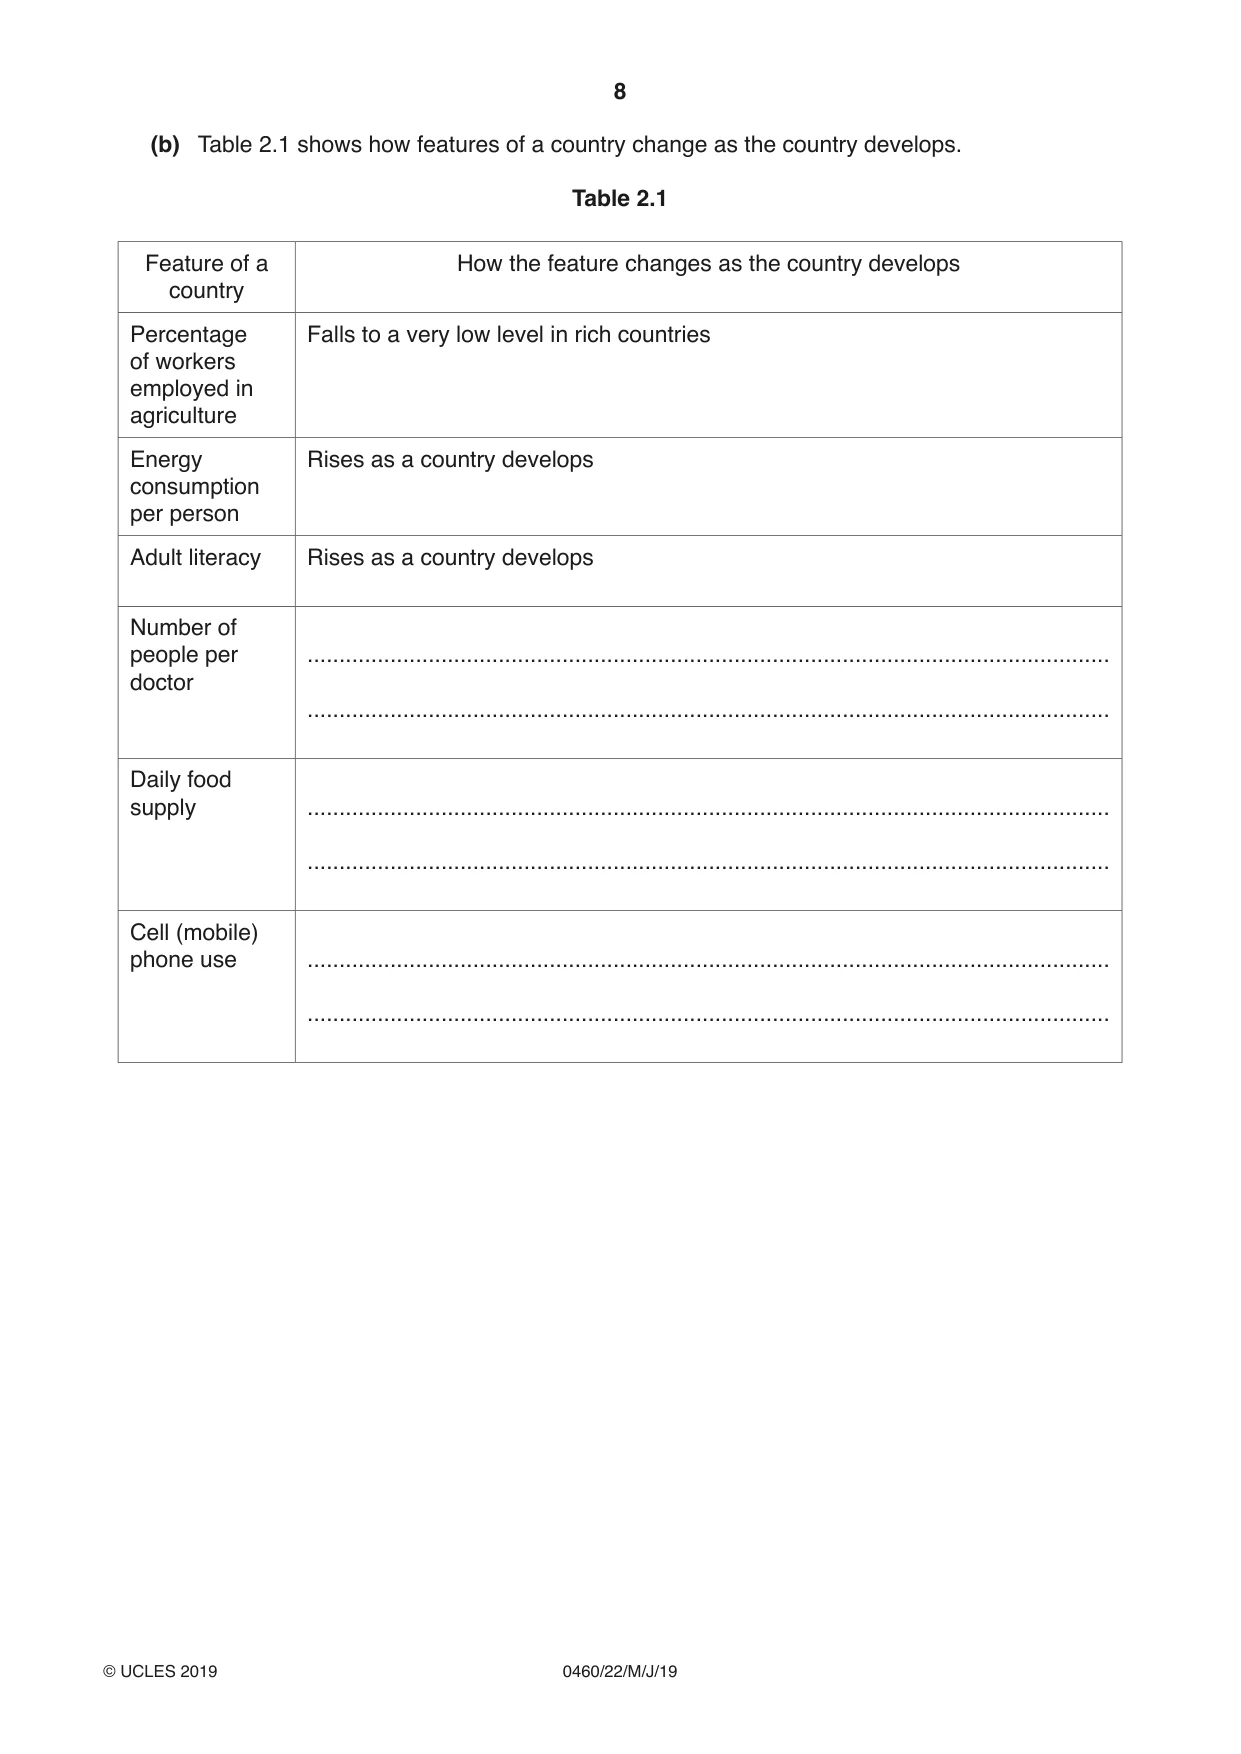
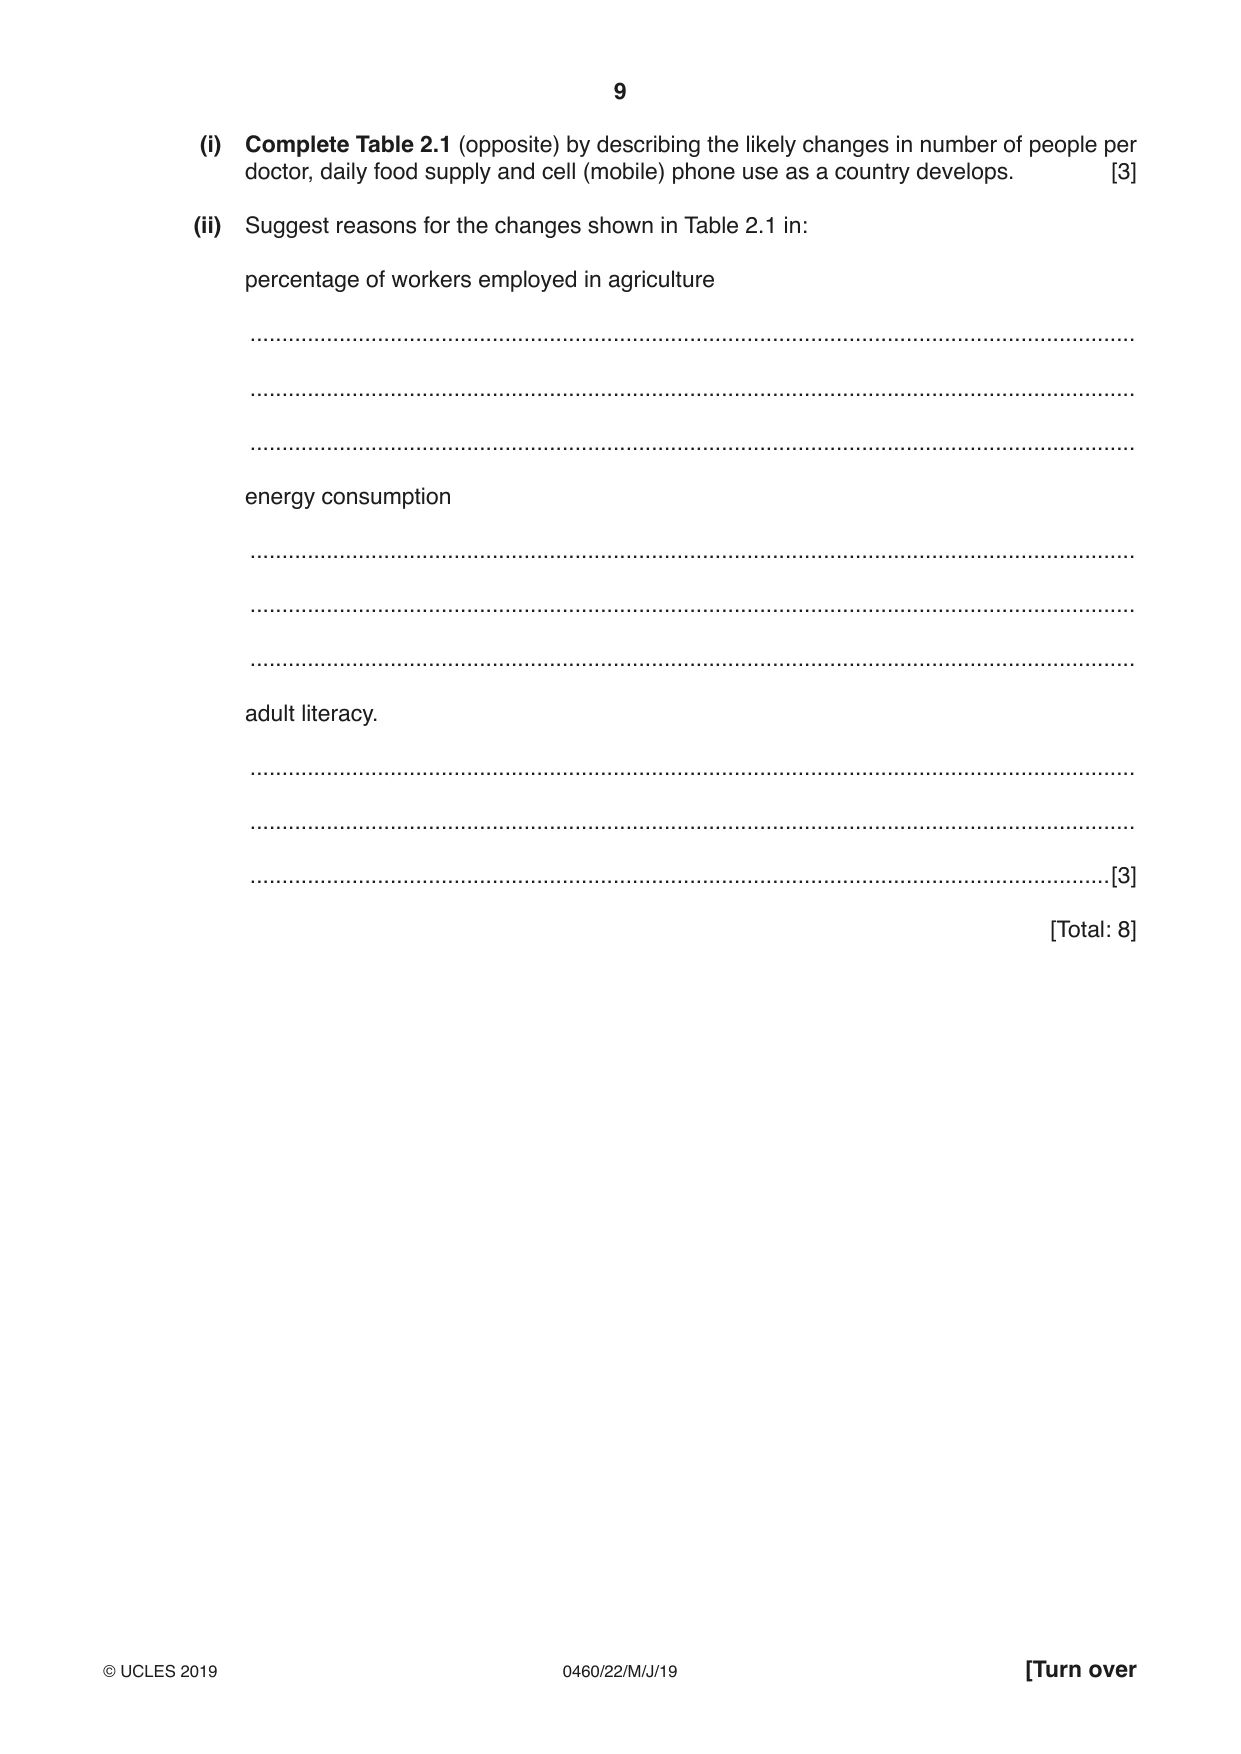
2 (a) (i) Which one of the following statements describes a transnational corporation? Tick only one box. Tick (✓) the way different countries cooperate to encourage development an organisation which helps development in LEDCs a company which exports goods all over the world a company which operates in two or more countries [1] (ii) Which one of the following statements describes globalisation? Tick only one box. Tick (✓) the way places on a map can be represented on a sphere the increased links between different parts of the world the way countries can be classified as MEDCs, LEDCs, NICs, etc. the way incomes of people in different parts of the world are becoming more equal [1] (b) Table 2.1 shows how features of a country change as the country develops. Table 2.1 Feature of a How the feature changes as the country develops country Percentage Falls to a very low level in rich countries of workers employed in agriculture Energy Rises as a country develops consumption per person Adult literacy Rises as a country develops Number of people per .............................................................................................................................. doctor .............................................................................................................................. Daily food supply .............................................................................................................................. .............................................................................................................................. Cell (mobile) phone use .............................................................................................................................. .............................................................................................................................. (i) Complete Table 2.1 (opposite) by describing the likely changes in number of people per doctor, daily food supply and cell (mobile) phone use as a country develops. [3] (ii) Suggest reasons for the changes shown in Table 2.1 in: percentage of workers employed in agriculture ........................................................................................................................................... ........................................................................................................................................... ........................................................................................................................................... energy consumption ........................................................................................................................................... ........................................................................................................................................... ........................................................................................................................................... adult literacy. ........................................................................................................................................... ........................................................................................................................................... .......................................................................................................................................[3] [Total: 8]
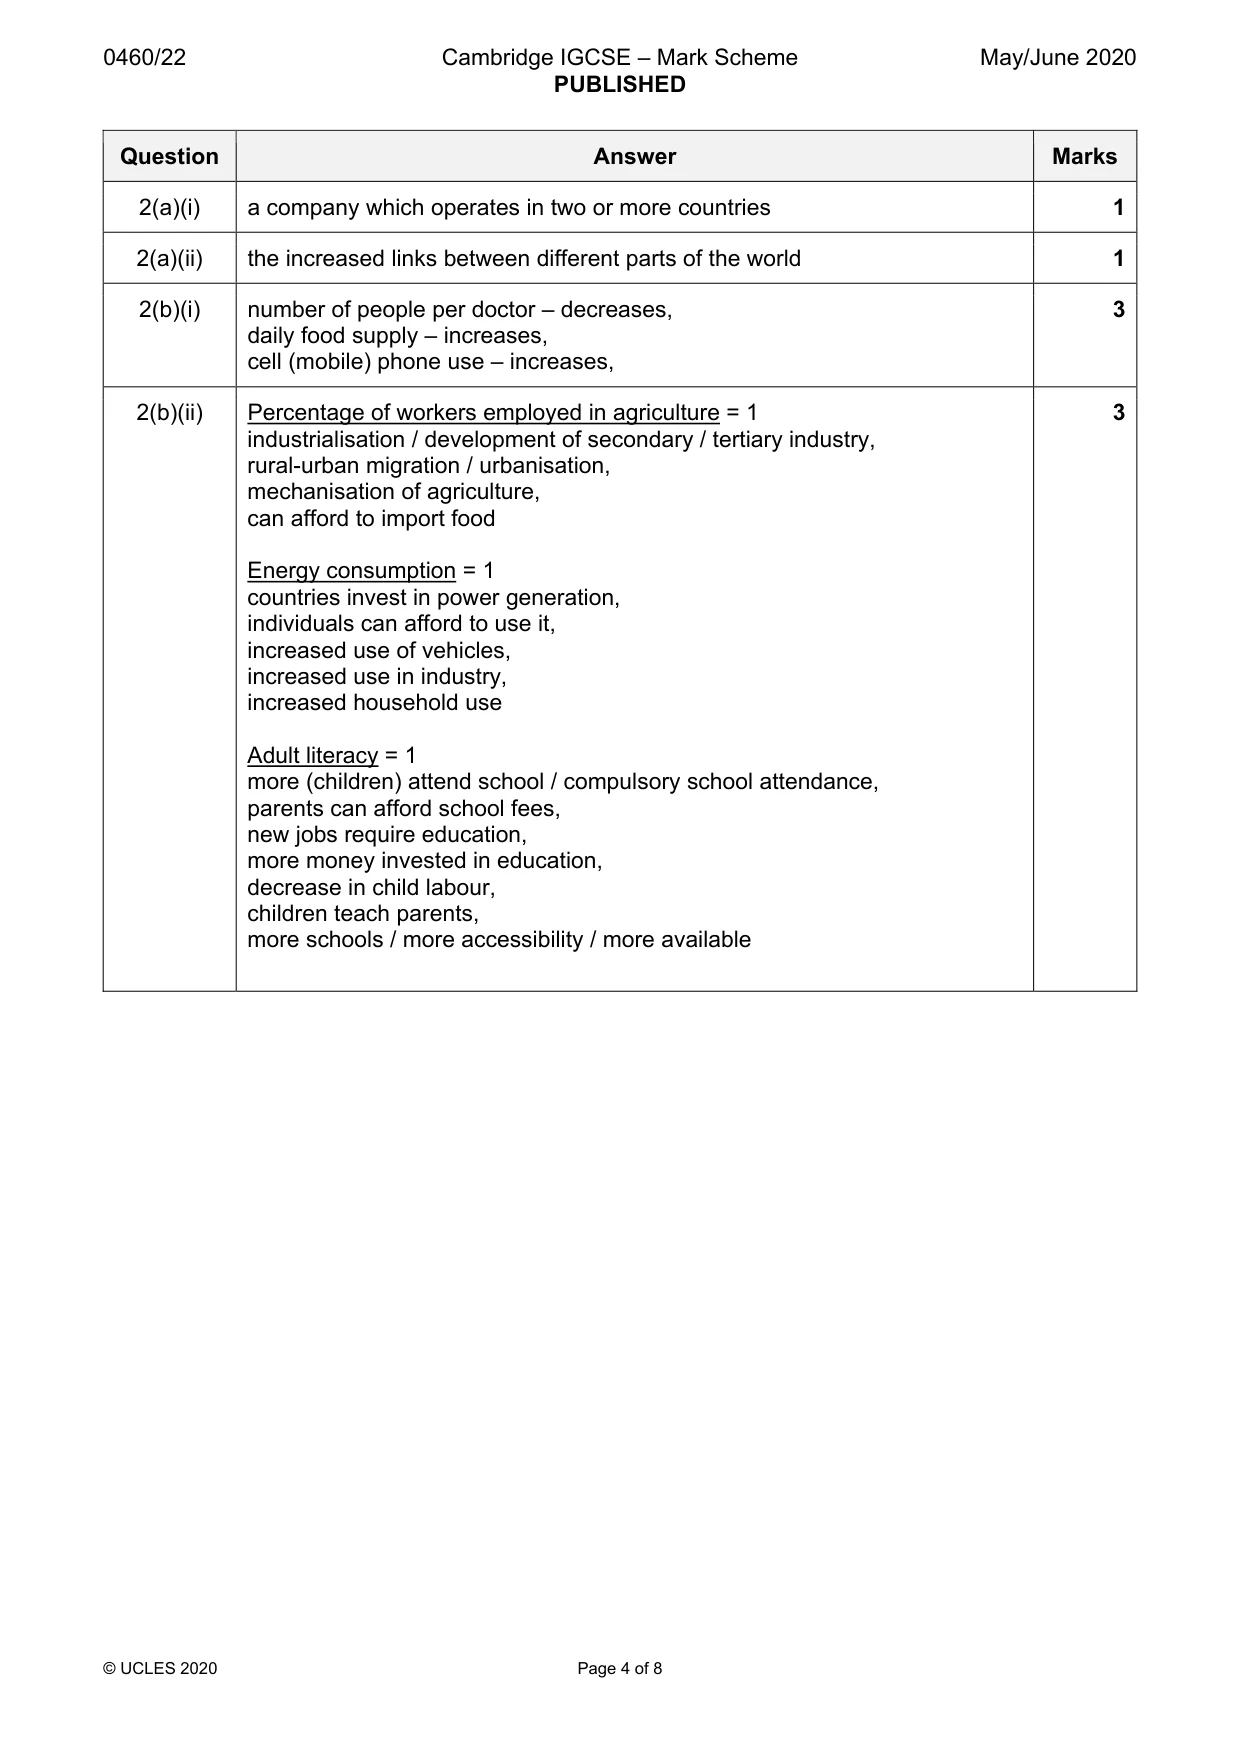
Mark scheme: 2(a)(i) a company which operates in two or more countries 1 2(a)(ii) the increased links between different parts of the world 1 2(b)(i) number of people per doctor – decreases, 3 daily food supply – increases, cell (mobile) phone use – increases, 2(b)(ii) Percentage of workers employed in agriculture = 1 3 industrialisation / development of secondary / tertiary industry, rural-urban migration / urbanisation, mechanisation of agriculture, can afford to import food Energy consumption = 1 countries invest in power generation, individuals can afford to use it, increased use of vehicles, increased use in industry, increased household use Adult literacy = 1 more (children) attend school / compulsory school attendance, parents can afford school fees, new jobs require education, more money invested in education, decrease in child labour, children teach parents, more schools / more accessibility / more available
Question 3
3 (a) Figs. 3.1 and 3.2 (Insert) are photographs which show two bay and headland coastlines. Describe the features of each coastline. Fig. 3.1 ................................................................................................................................................... ................................................................................................................................................... ................................................................................................................................................... ................................................................................................................................................... ................................................................................................................................................... ................................................................................................................................................... ................................................................................................................................................... ................................................................................................................................................... ................................................................................................................................................... Fig. 3.2 ................................................................................................................................................... ................................................................................................................................................... ................................................................................................................................................... ................................................................................................................................................... ................................................................................................................................................... ................................................................................................................................................... ................................................................................................................................................... ................................................................................................................................................... ...............................................................................................................................................[6] (b) Explain how differences in rock type can lead to the formation of bays and headlands. ................................................................................................................................................... ................................................................................................................................................... ................................................................................................................................................... ................................................................................................................................................... ................................................................................................................................................... ...............................................................................................................................................[2] [Total: 8]
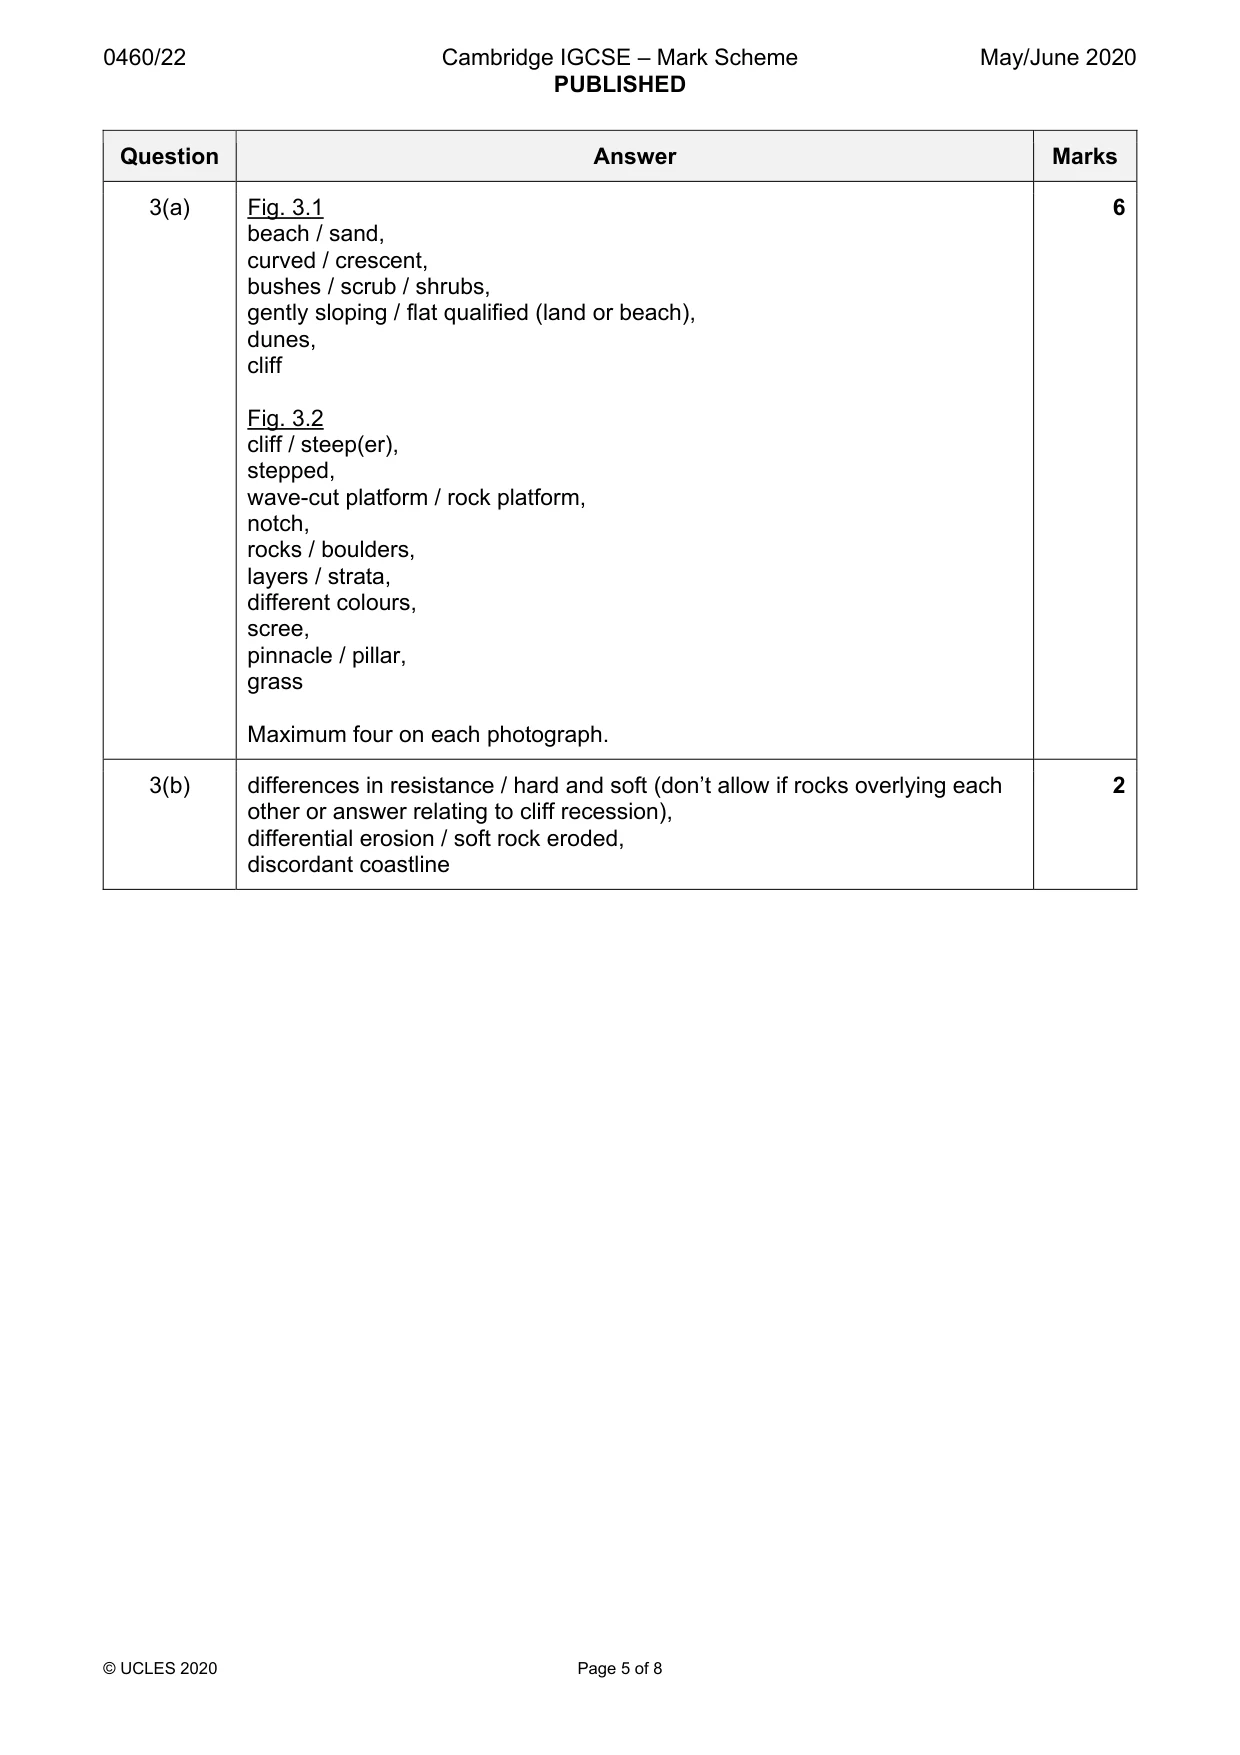
Mark scheme: 3(a) Fig. 3.1 6 beach / sand, curved / crescent, bushes / scrub / shrubs, gently sloping / flat qualified (land or beach), dunes, cliff Fig. 3.2 cliff / steep(er), stepped, wave-cut platform / rock platform, notch, rocks / boulders, layers / strata, different colours, scree, pinnacle / pillar, grass Maximum four on each photograph. 3(b) differences in resistance / hard and soft (don’t allow if rocks overlying each 2 other or answer relating to cliff recession), differential erosion / soft rock eroded, discordant coastline
Question 4
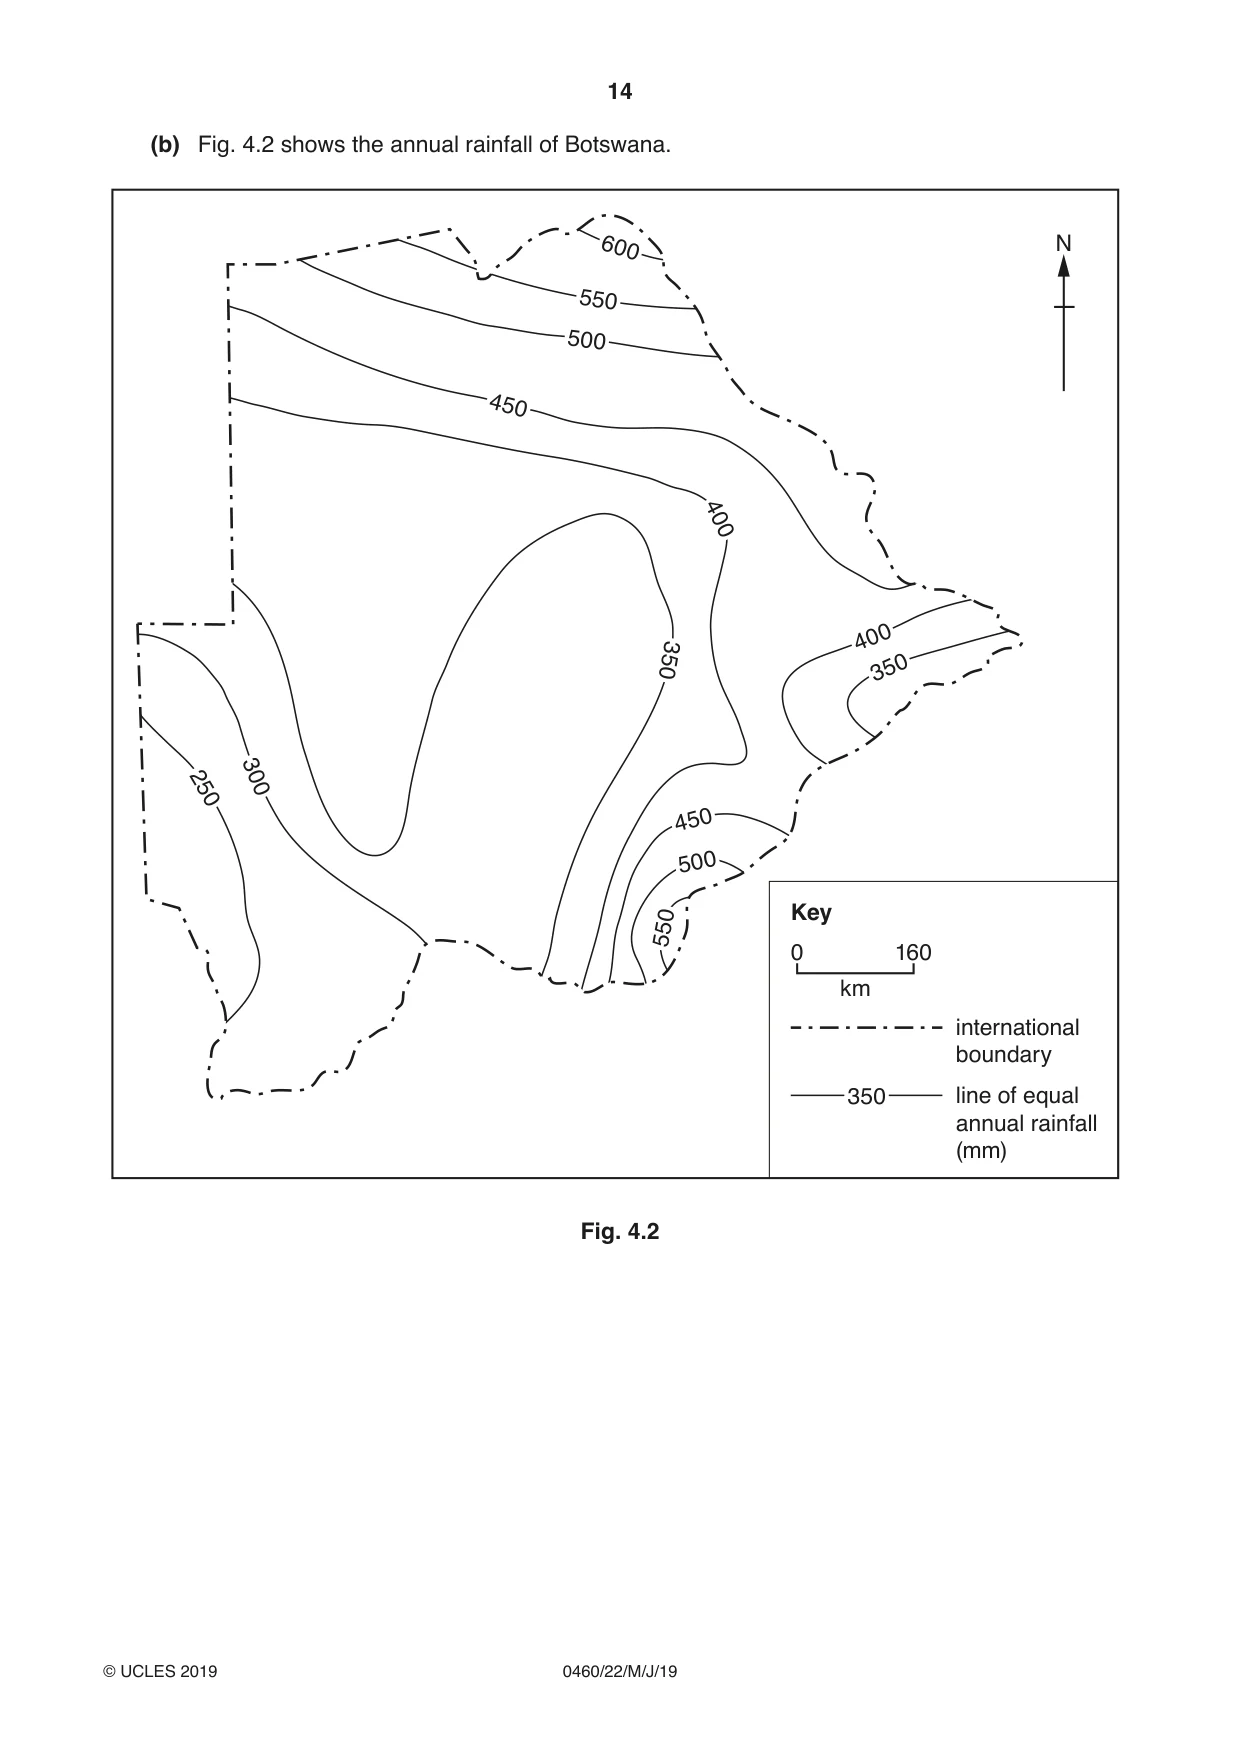
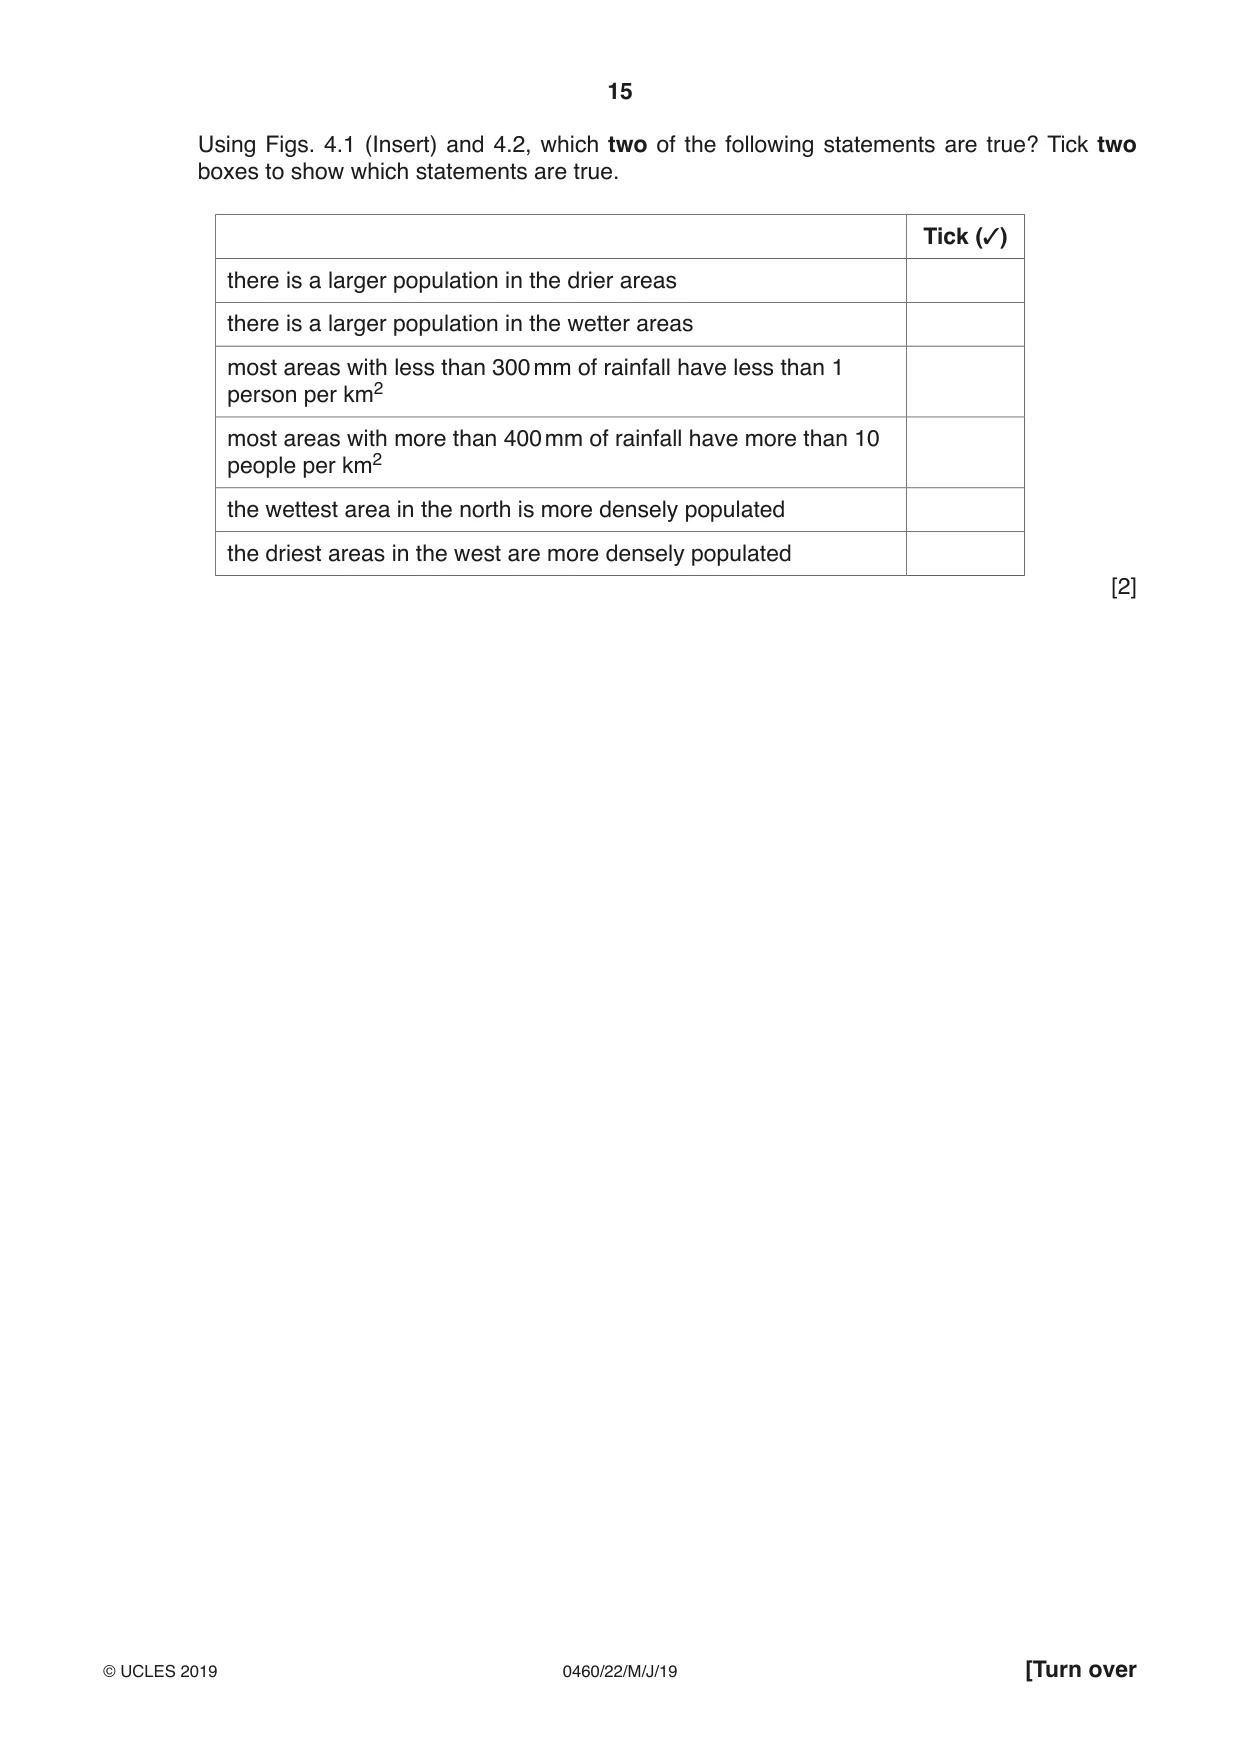
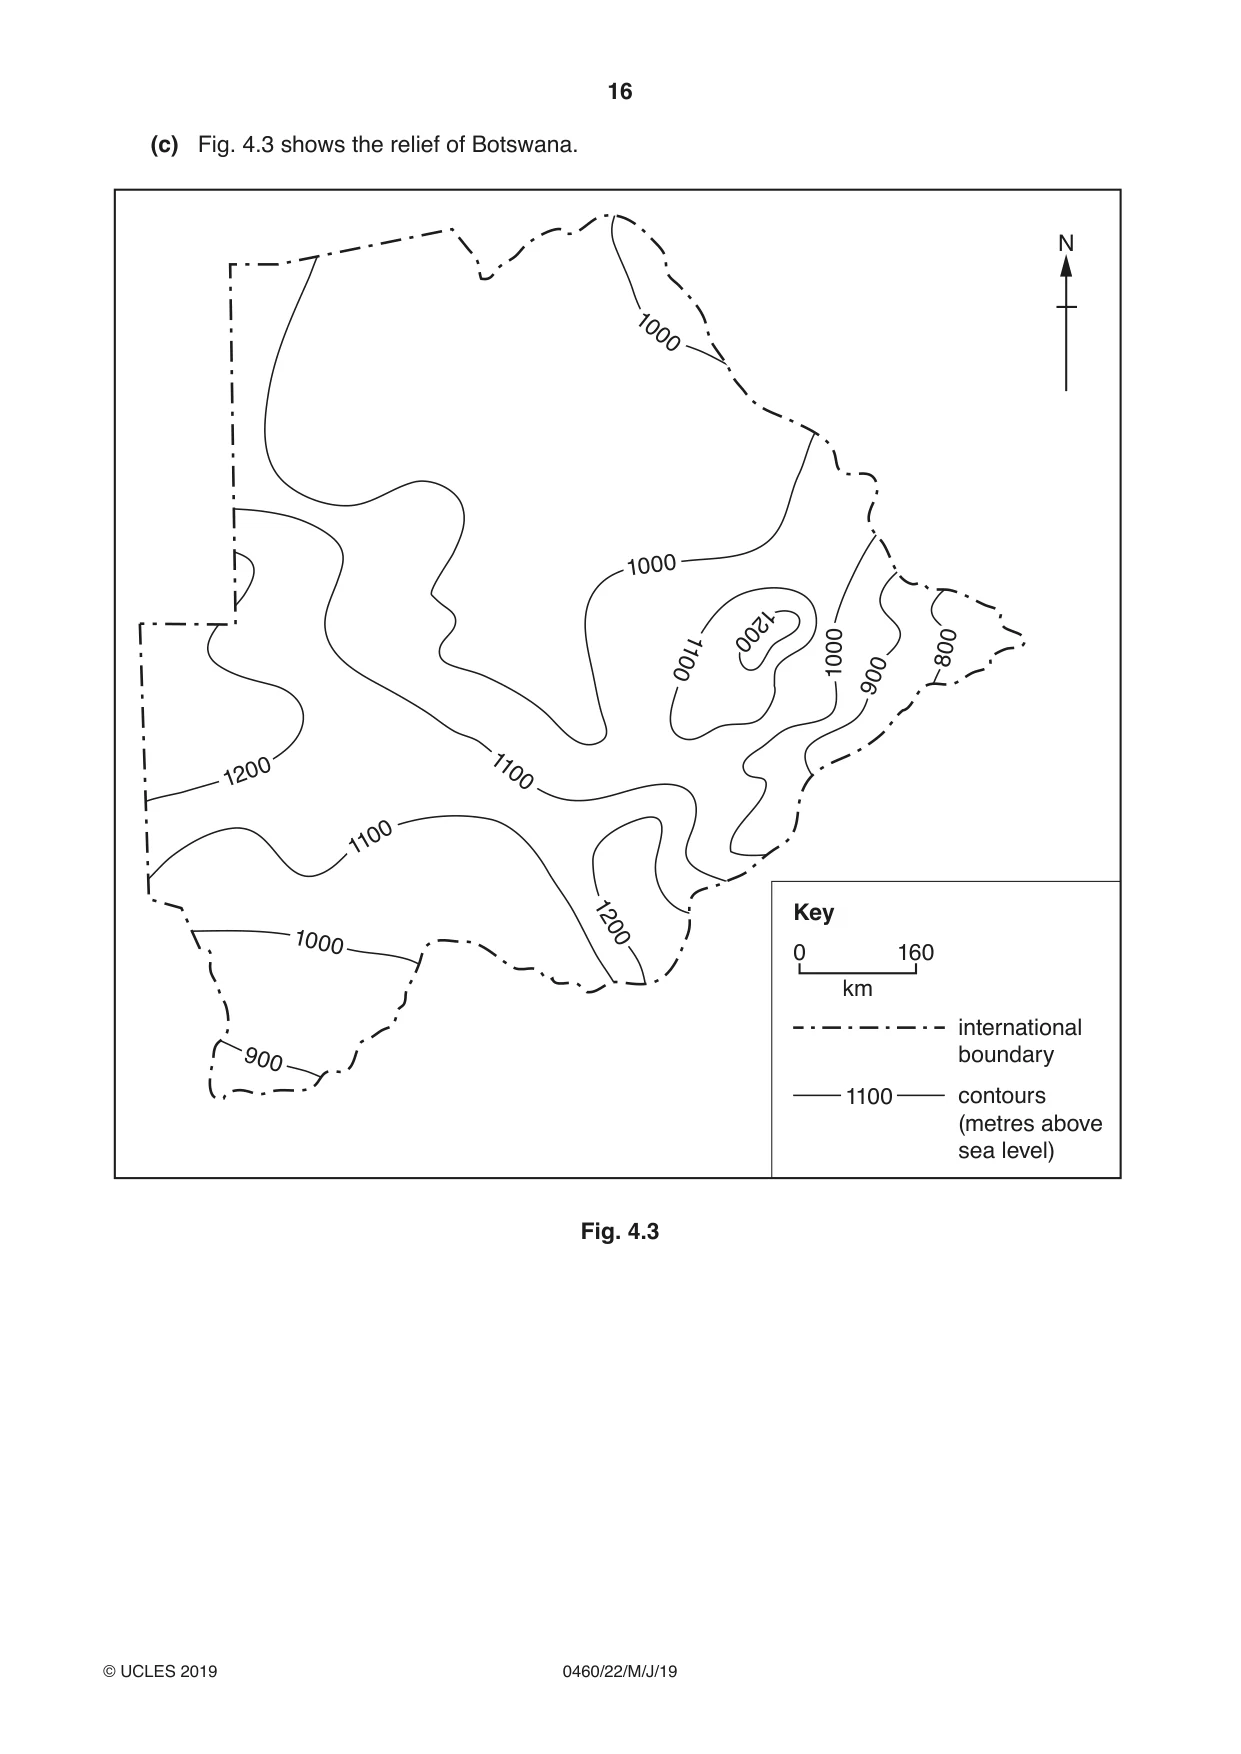
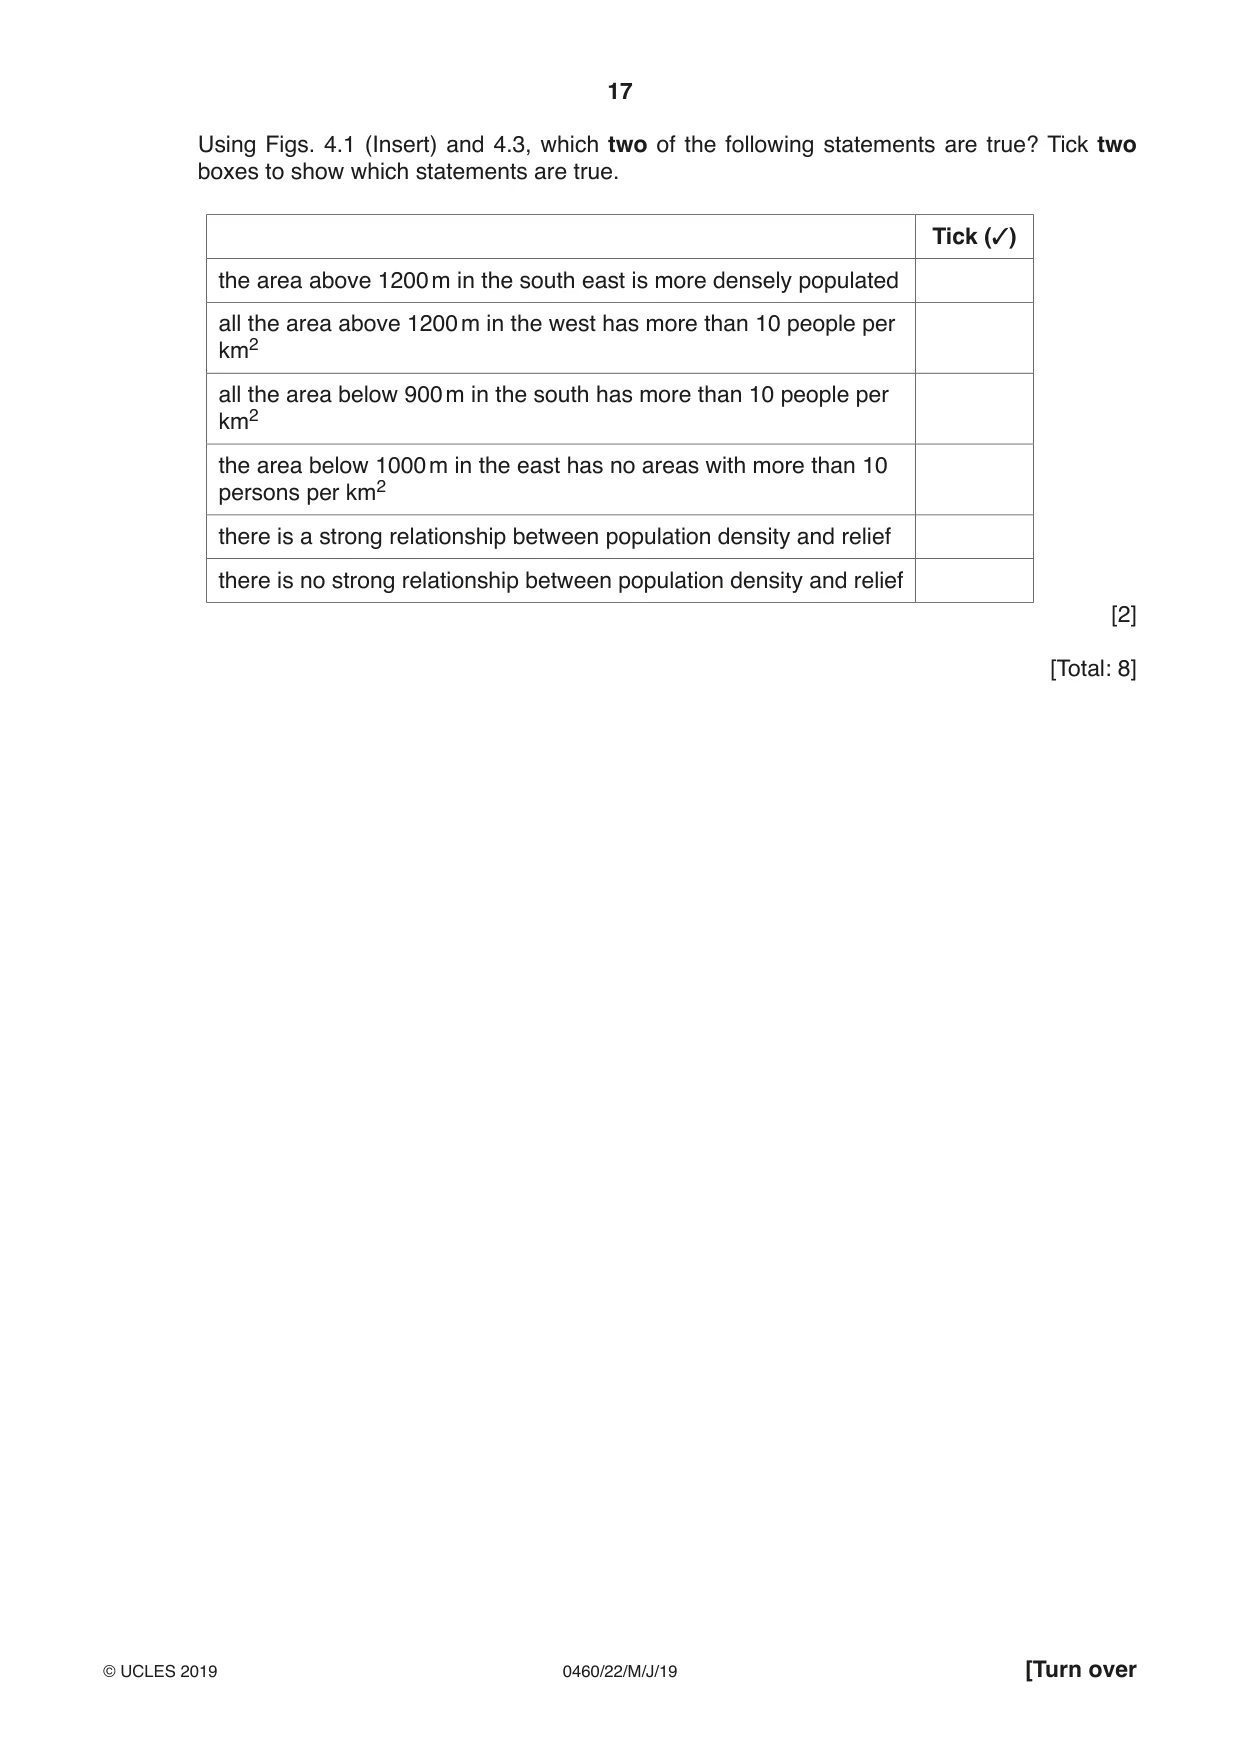
4 Fig. 4.1 (Insert) shows the distribution of population in Botswana, southern Africa. (a) Describe the distribution of population shown on Fig. 4.1. ................................................................................................................................................... ................................................................................................................................................... ................................................................................................................................................... ................................................................................................................................................... ................................................................................................................................................... ................................................................................................................................................... ................................................................................................................................................... ................................................................................................................................................... ...............................................................................................................................................[4] (b) Fig. 4.2 shows the annual rainfall of Botswana. 600 N 550 500 450 400 400 350 350 300 250 450 500 Key 550 0 160 km international boundary 350 line of equal annual rainfall (mm) Fig. 4.2 Using Figs. 4.1 (Insert) and 4.2, which two of the following statements are true? Tick two boxes to show which statements are true. Tick (✓) there is a larger population in the drier areas there is a larger population in the wetter areas most areas with less than 300 mm of rainfall have less than 1 person per km2 most areas with more than 400 mm of rainfall have more than 10 people per km2 the wettest area in the north is more densely populated the driest areas in the west are more densely populated [2] (c) Fig. 4.3 shows the relief of Botswana. N 1000 1000 1200 1100 1000 800 900 1200 1100 1100 1200 Key 1000 0 160 km international 900 boundary 1100 contours (metres above sea level) Fig. 4.3 Using Figs. 4.1 (Insert) and 4.3, which two of the following statements are true? Tick two boxes to show which statements are true. Tick (✓) the area above 1200 m in the south east is more densely populated all the area above 1200 m in the west has more than 10 people per km2 all the area below 900 m in the south has more than 10 people per km2 the area below 1000 m in the east has no areas with more than 10 persons per km2 there is a strong relationship between population density and relief there is no strong relationship between population density and relief [2] [Total: 8]
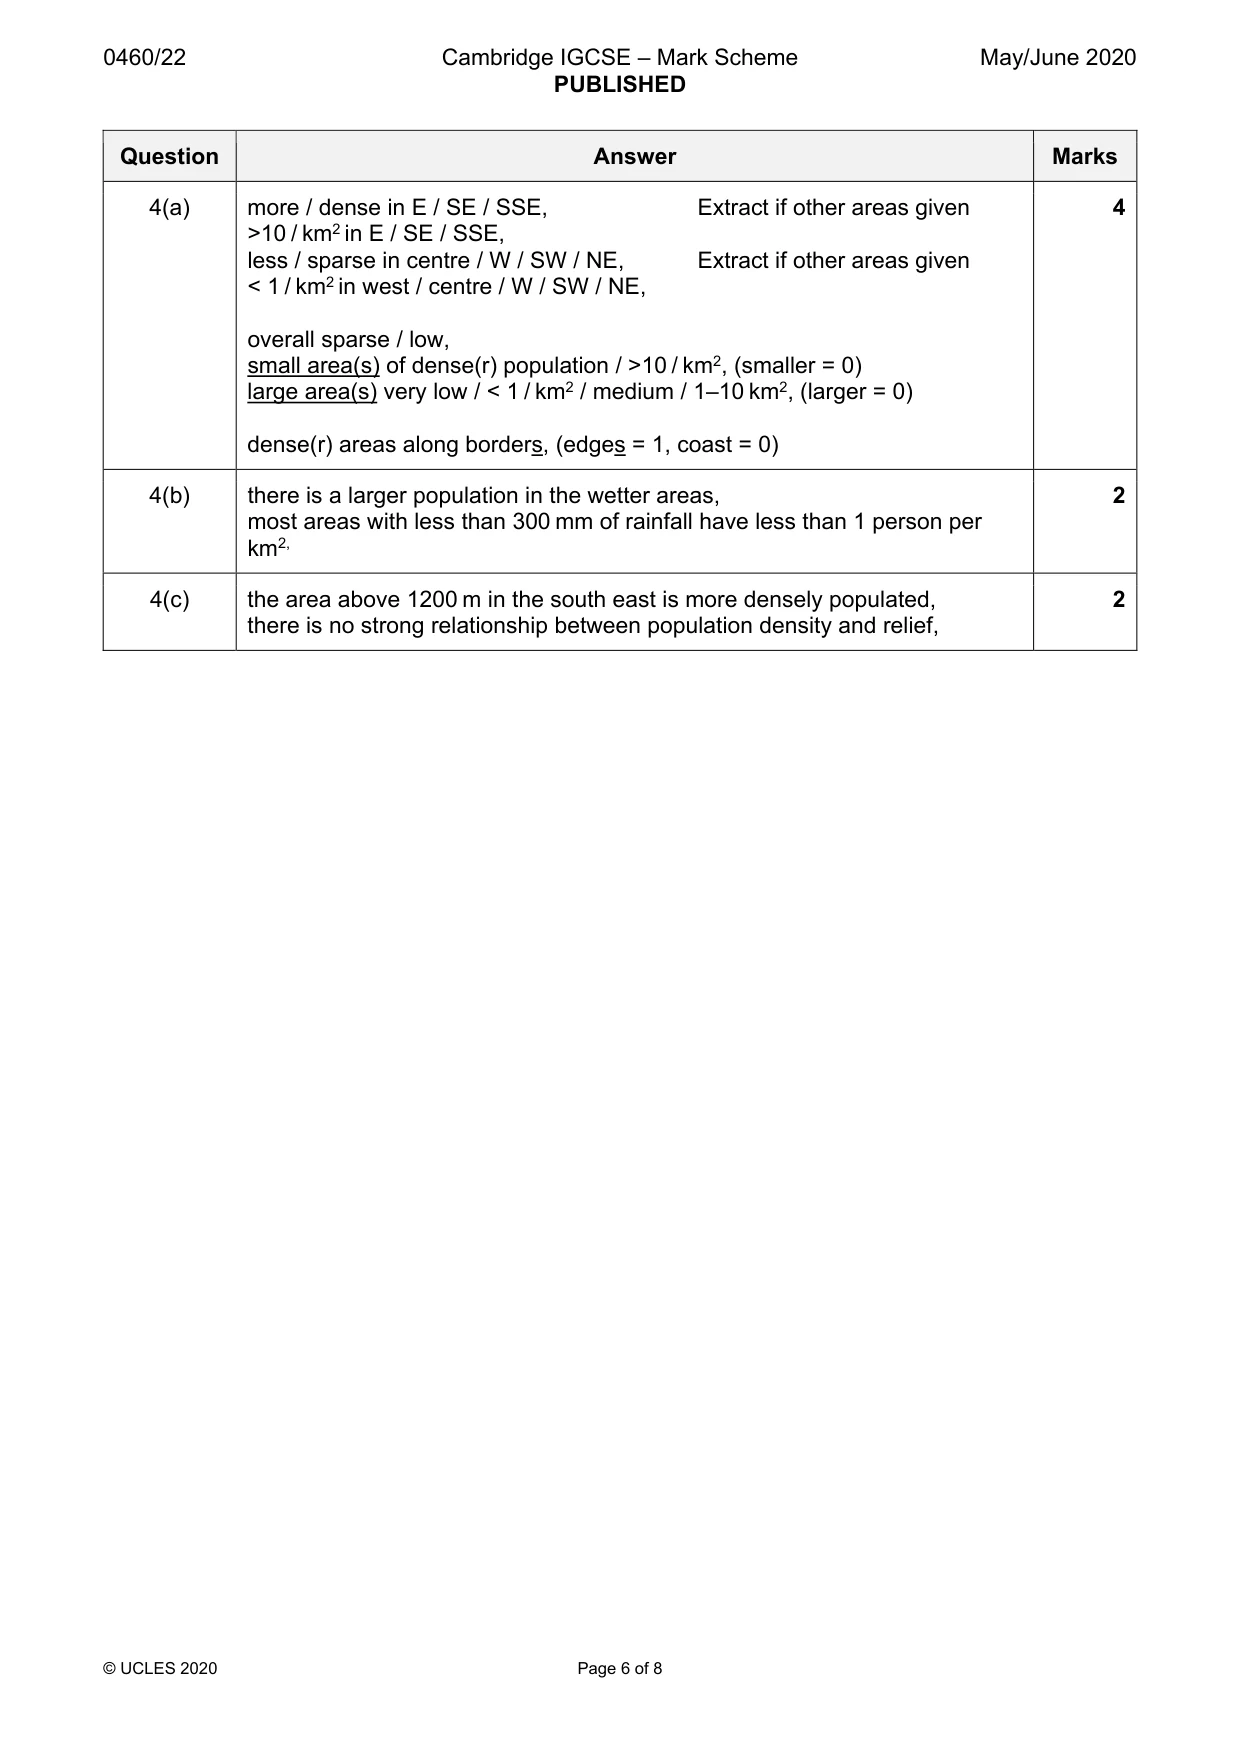
Mark scheme: 4(a) more / dense in E / SE / SSE, Extract if other areas given 4 >10 / km2 in E / SE / SSE, less / sparse in centre / W / SW / NE, Extract if other areas given < 1 / km2 in west / centre / W / SW / NE, overall sparse / low, small area(s) of dense(r) population / >10 / km2, (smaller = 0) large area(s) very low / < 1 / km2 / medium / 1–10 km2, (larger = 0) dense(r) areas along borders, (edges = 1, coast = 0) 4(b) there is a larger population in the wetter areas, 2 most areas with less than 300 mm of rainfall have less than 1 person per km2, 4(c) the area above 1200 m in the south east is more densely populated, 2 there is no strong relationship between population density and relief,
Question 5
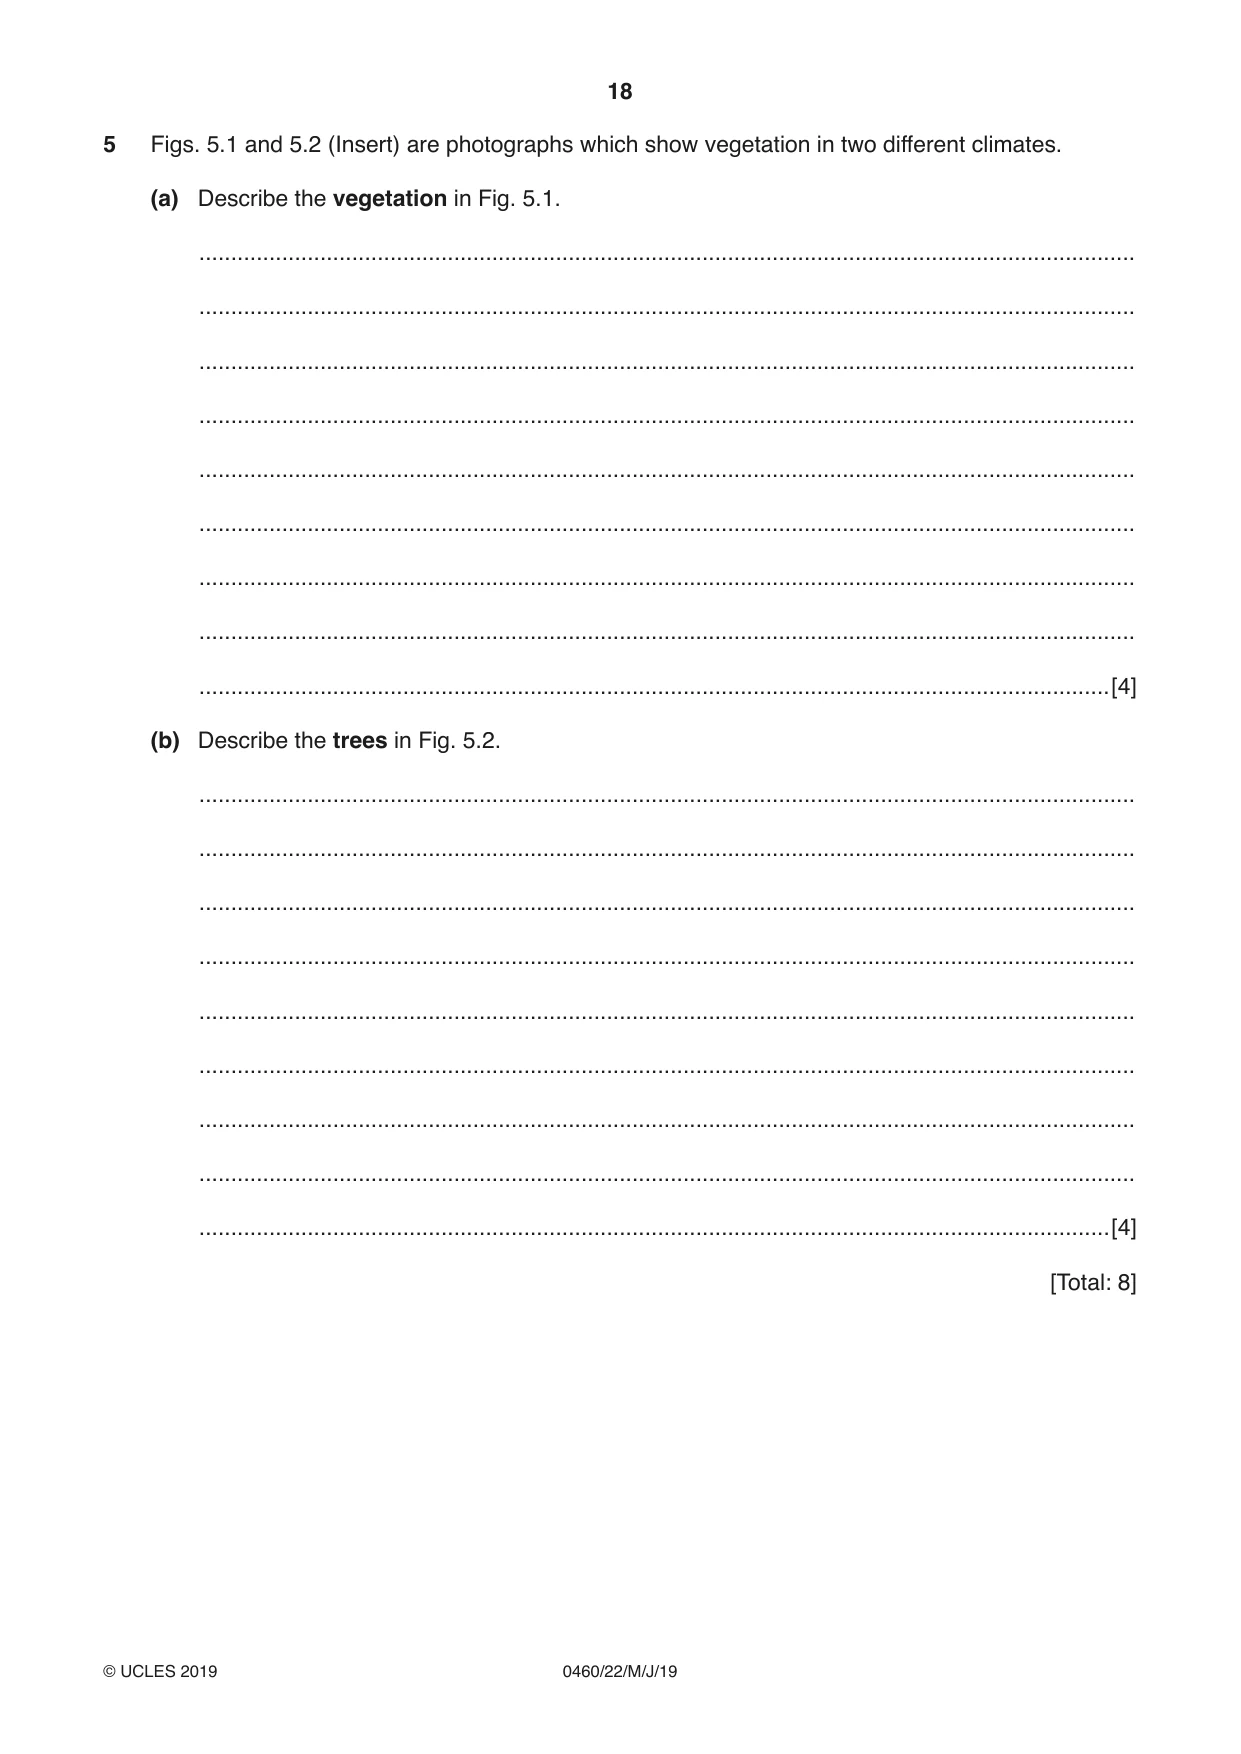
5 Figs. 5.1 and 5.2 (Insert) are photographs which show vegetation in two different climates. (a) Describe the vegetation in Fig. 5.1. ................................................................................................................................................... ................................................................................................................................................... ................................................................................................................................................... ................................................................................................................................................... ................................................................................................................................................... ................................................................................................................................................... ................................................................................................................................................... ................................................................................................................................................... ...............................................................................................................................................[4] (b) Describe the trees in Fig. 5.2. ................................................................................................................................................... ................................................................................................................................................... ................................................................................................................................................... ................................................................................................................................................... ................................................................................................................................................... ................................................................................................................................................... ................................................................................................................................................... ................................................................................................................................................... ...............................................................................................................................................[4] [Total: 8]
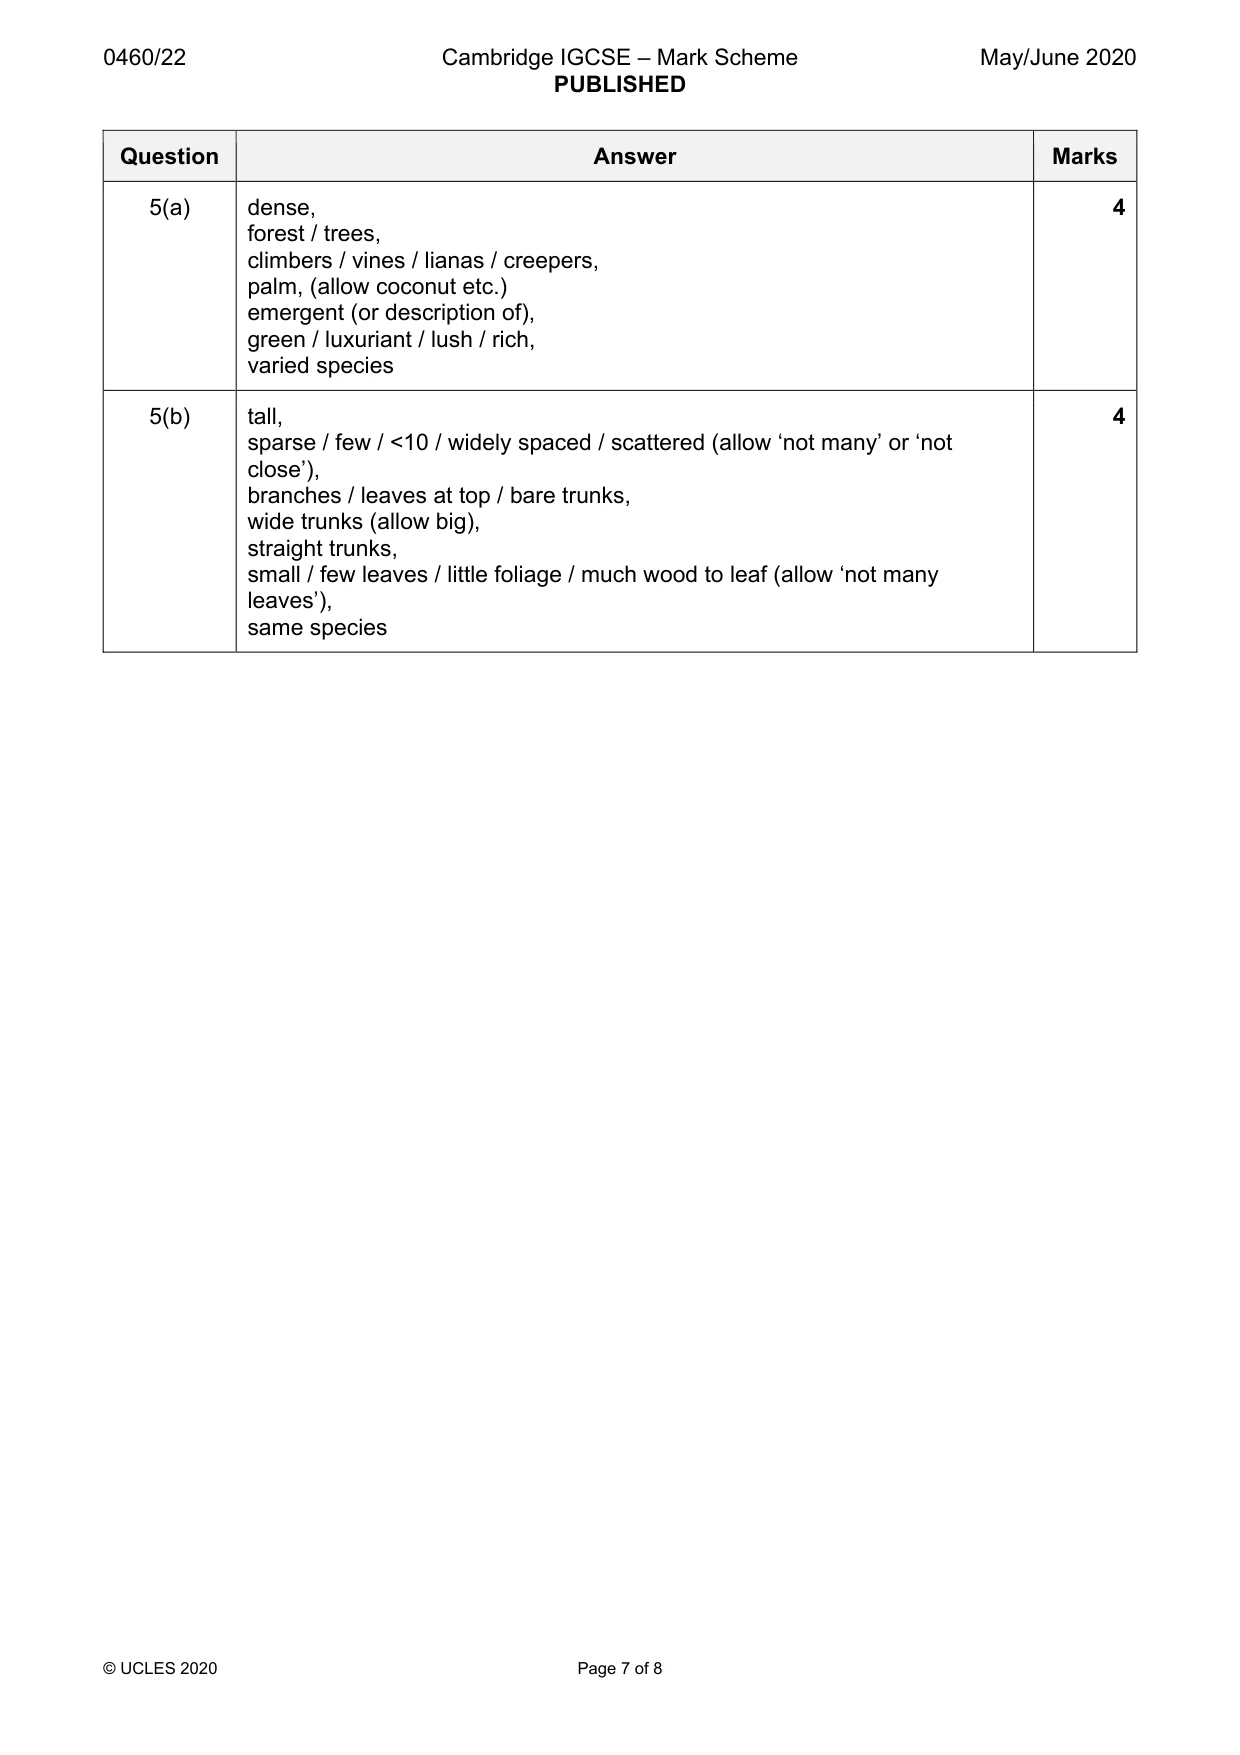
Mark scheme: 5(a) dense, 4 forest / trees, climbers / vines / lianas / creepers, palm, (allow coconut etc.) emergent (or description of), green / luxuriant / lush / rich, varied species 5(b) tall, 4 sparse / few / <10 / widely spaced / scattered (allow ‘not many’ or ‘not close’), branches / leaves at top / bare trunks, wide trunks (allow big), straight trunks, small / few leaves / little foliage / much wood to leaf (allow ‘not many leaves’), same species
Q6 · Urbanisation is the increase in the proportion of the population that lives in towns and…
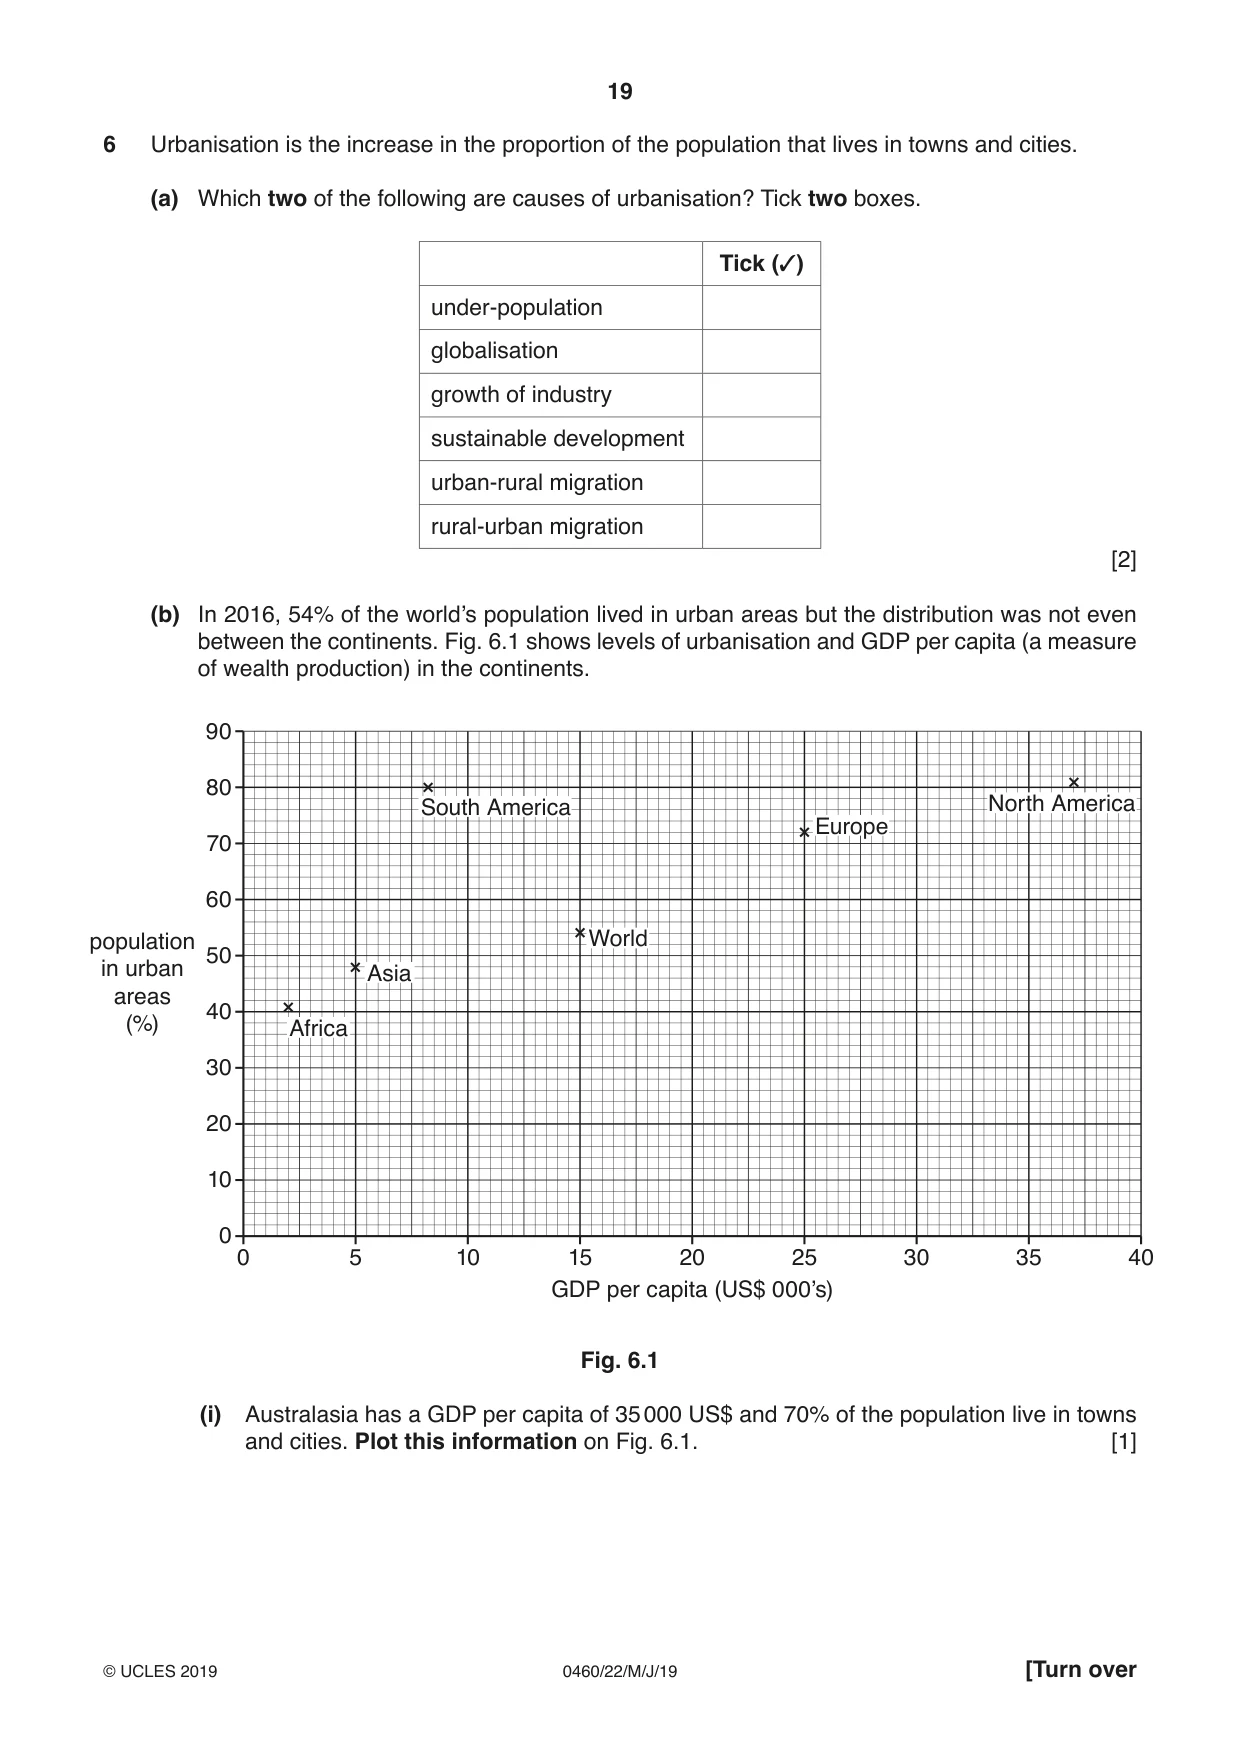
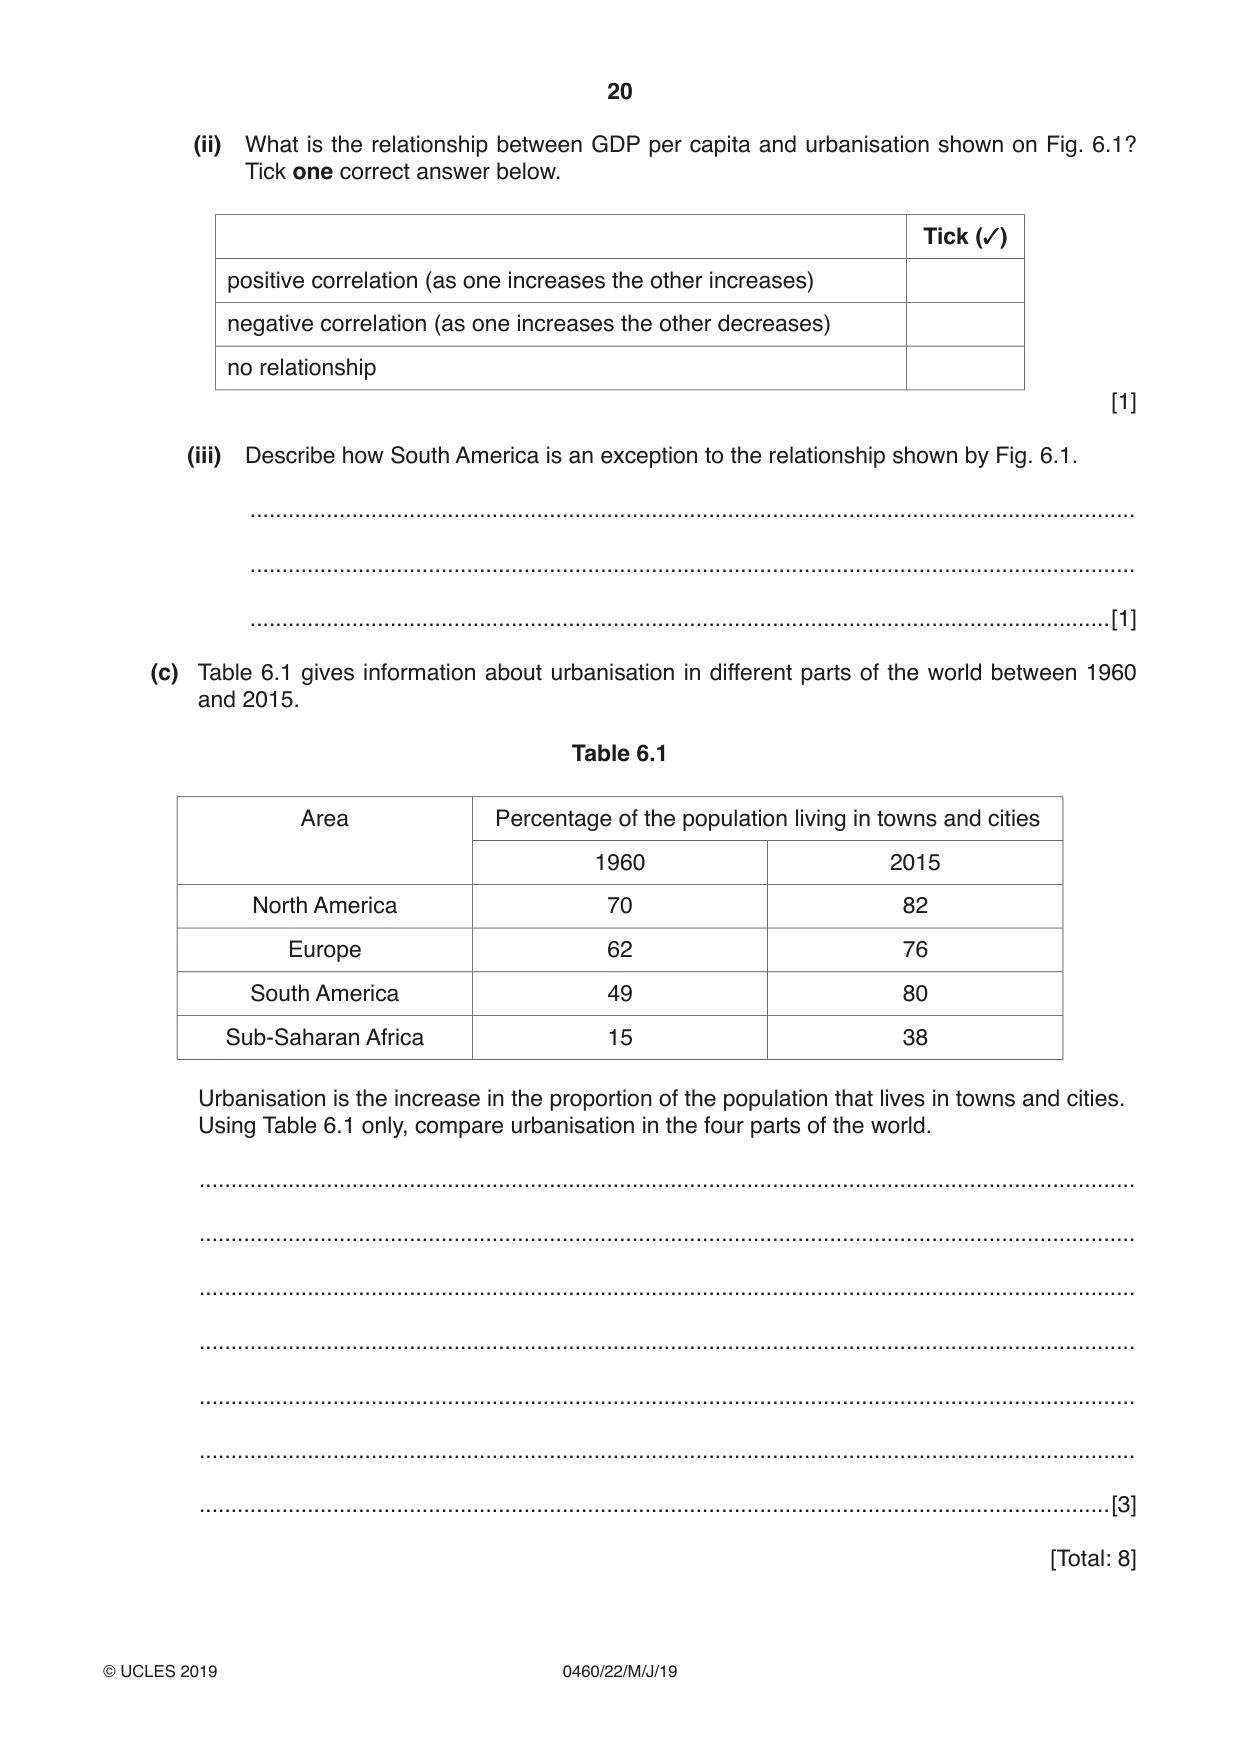
6 Urbanisation is the increase in the proportion of the population that lives in towns and cities. (a) Which two of the following are causes of urbanisation? Tick two boxes. Tick (✓) under-population globalisation growth of industry sustainable development urban-rural migration rural-urban migration [2] (b) In 2016, 54% of the world’s population lived in urban areas but the distribution was not even between the continents. Fig. 6.1 shows levels of urbanisation and GDP per capita (a measure of wealth production) in the continents. 90 80 South America North America Europe 70 60 population World 50 in urban Asia areas 40 (%) Africa 30 20 10 0 0 5 10 15 20 25 30 35 40 GDP per capita (US$ 000’s) Fig. 6.1 (i) Australasia has a GDP per capita of 35 000 US$ and 70% of the population live in towns and cities. Plot this information on Fig. 6.1. [1] (ii) What is the relationship between GDP per capita and urbanisation shown on Fig. 6.1? Tick one correct answer below. Tick (✓) positive correlation (as one increases the other increases) negative correlation (as one increases the other decreases) no relationship [1] (iii) Describe how South America is an exception to the relationship shown by Fig. 6.1. ........................................................................................................................................... ........................................................................................................................................... .......................................................................................................................................[1] (c) Table 6.1 gives information about urbanisation in different parts of the world between 1960 and 2015. Table 6.1 Area Percentage of the population living in towns and cities 1960 2015 North America 70 82 Europe 62 76 South America 49 80 Sub-Saharan Africa 15 38 Urbanisation is the increase in the proportion of the population that lives in towns and cities. Using Table 6.1 only, compare urbanisation in the four parts of the world. ................................................................................................................................................... ................................................................................................................................................... ................................................................................................................................................... ................................................................................................................................................... ................................................................................................................................................... ................................................................................................................................................... ...............................................................................................................................................[3] [Total: 8] Additional Pages If you use the following lined pages to complete the answer(s) to any question(s), the question number(s) must be clearly shown. .................................................................................................................................................................. .................................................................................................................................................................. .................................................................................................................................................................. .................................................................................................................................................................. .................................................................................................................................................................. .................................................................................................................................................................. .................................................................................................................................................................. .................................................................................................................................................................. .................................................................................................................................................................. .................................................................................................................................................................. .................................................................................................................................................................. .................................................................................................................................................................. .................................................................................................................................................................. .................................................................................................................................................................. .................................................................................................................................................................. .................................................................................................................................................................. .................................................................................................................................................................. .................................................................................................................................................................. .................................................................................................................................................................. .................................................................................................................................................................. .................................................................................................................................................................. .................................................................................................................................................................. .................................................................................................................................................................. .................................................................................................................................................................. ..................................................................................................................................................................
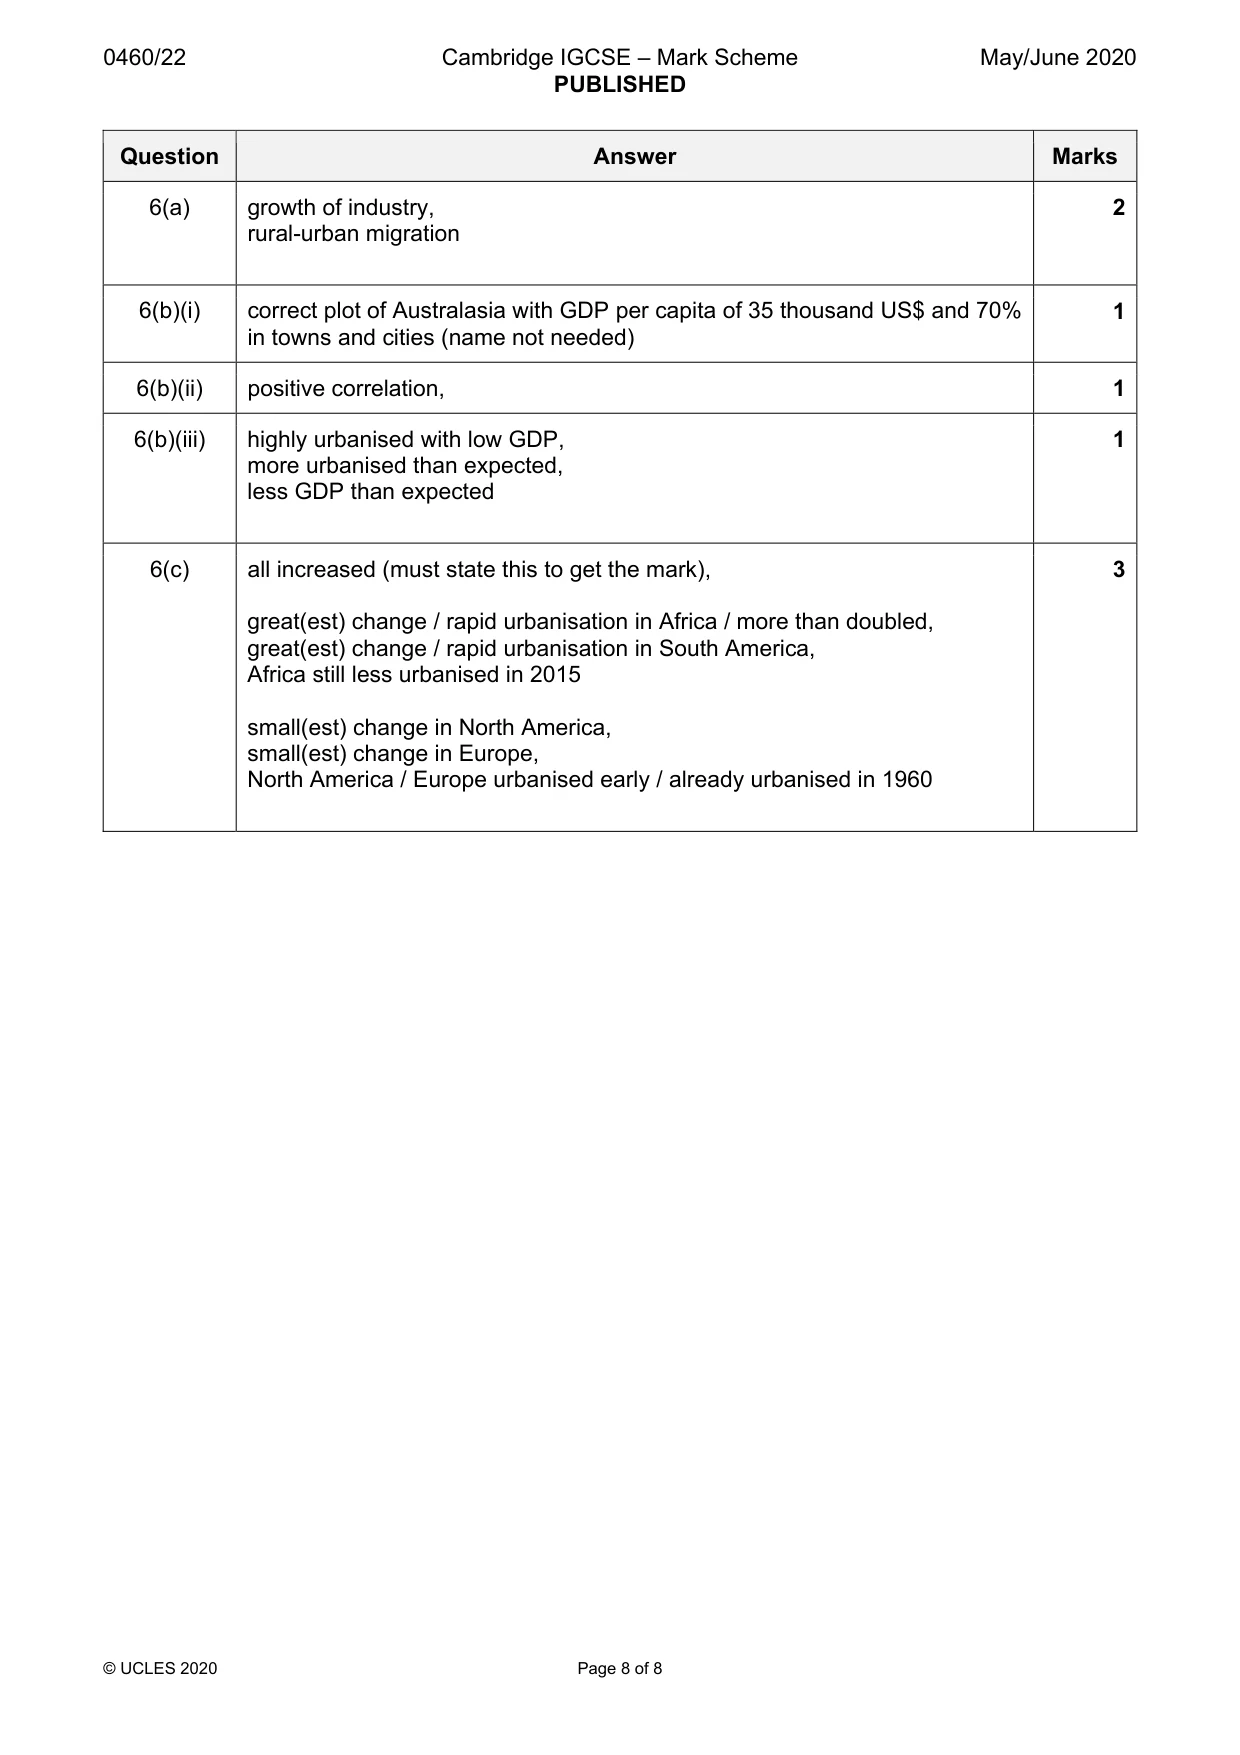
Mark scheme: 6(a) growth of industry, 2 rural-urban migration 6(b)(i) correct plot of Australasia with GDP per capita of 35 thousand US$ and 70% 1 in towns and cities (name not needed) 6(b)(ii) positive correlation, 1 6(b)(iii) highly urbanised with low GDP, 1 more urbanised than expected, less GDP than expected 6(c) all increased (must state this to get the mark), 3 great(est) change / rapid urbanisation in Africa / more than doubled, great(est) change / rapid urbanisation in South America, Africa still less urbanised in 2015 small(est) change in North America, small(est) change in Europe, North America / Europe urbanised early / already urbanised in 1960
What was in this paper
The subtopics covered by these 6 questions, and how many questions each got. Open one in a new tab to see every Cambridge question on it.
What you needed in this session
Cambridge’s own grade thresholds for 2019 May/June, Paper 2 · Variant 2. A higher threshold means an easier paper — the bar moves with how the cohort did.