Questions as text
Q1 · Marine organisms are adapted for life in their particular habitat 9693/41 Oct/Nov 2017
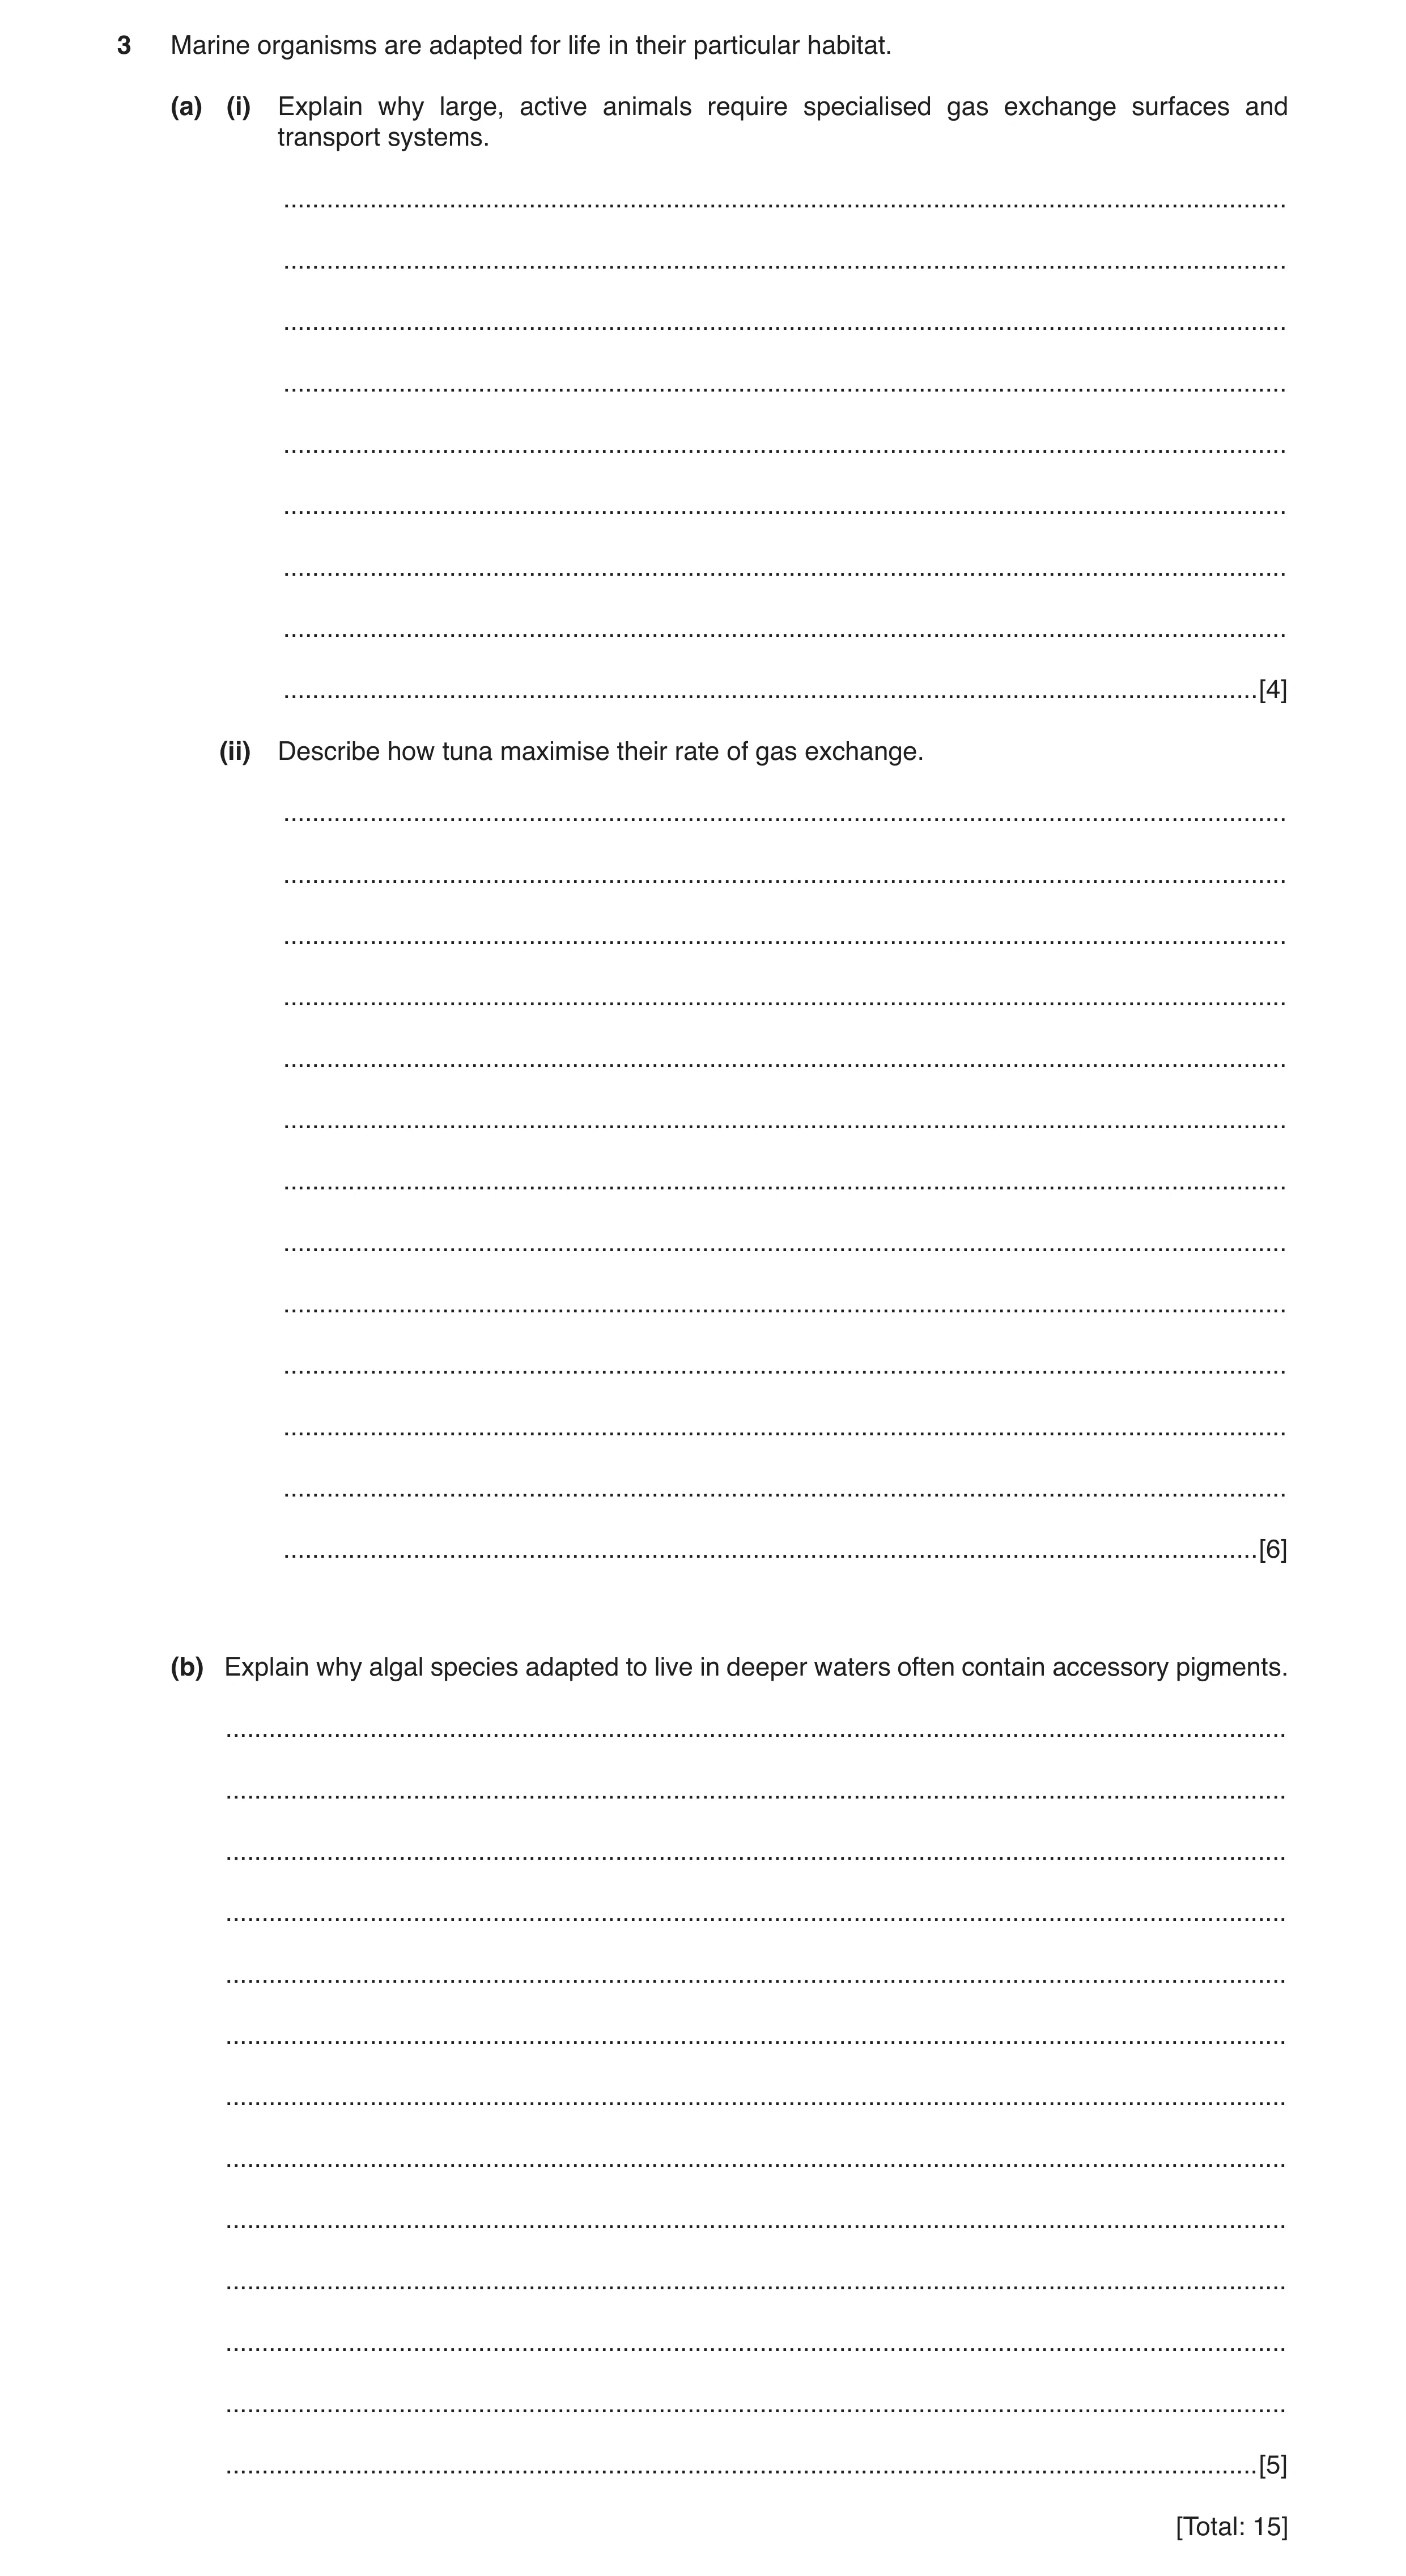
3 Marine organisms are adapted for life in their particular habitat. (a) (i) Explain why large, active animals require specialised gas exchange surfaces and transport systems. … … … … … … … … … [4] (ii) Describe how tuna maximise their rate of gas exchange. … … … … … … … … … … … … … [6] (b) Explain why algal species adapted to live in deeper waters often contain accessory pigments. … … … … … … … … … … … … … [5] [Total: 15]
15 marks
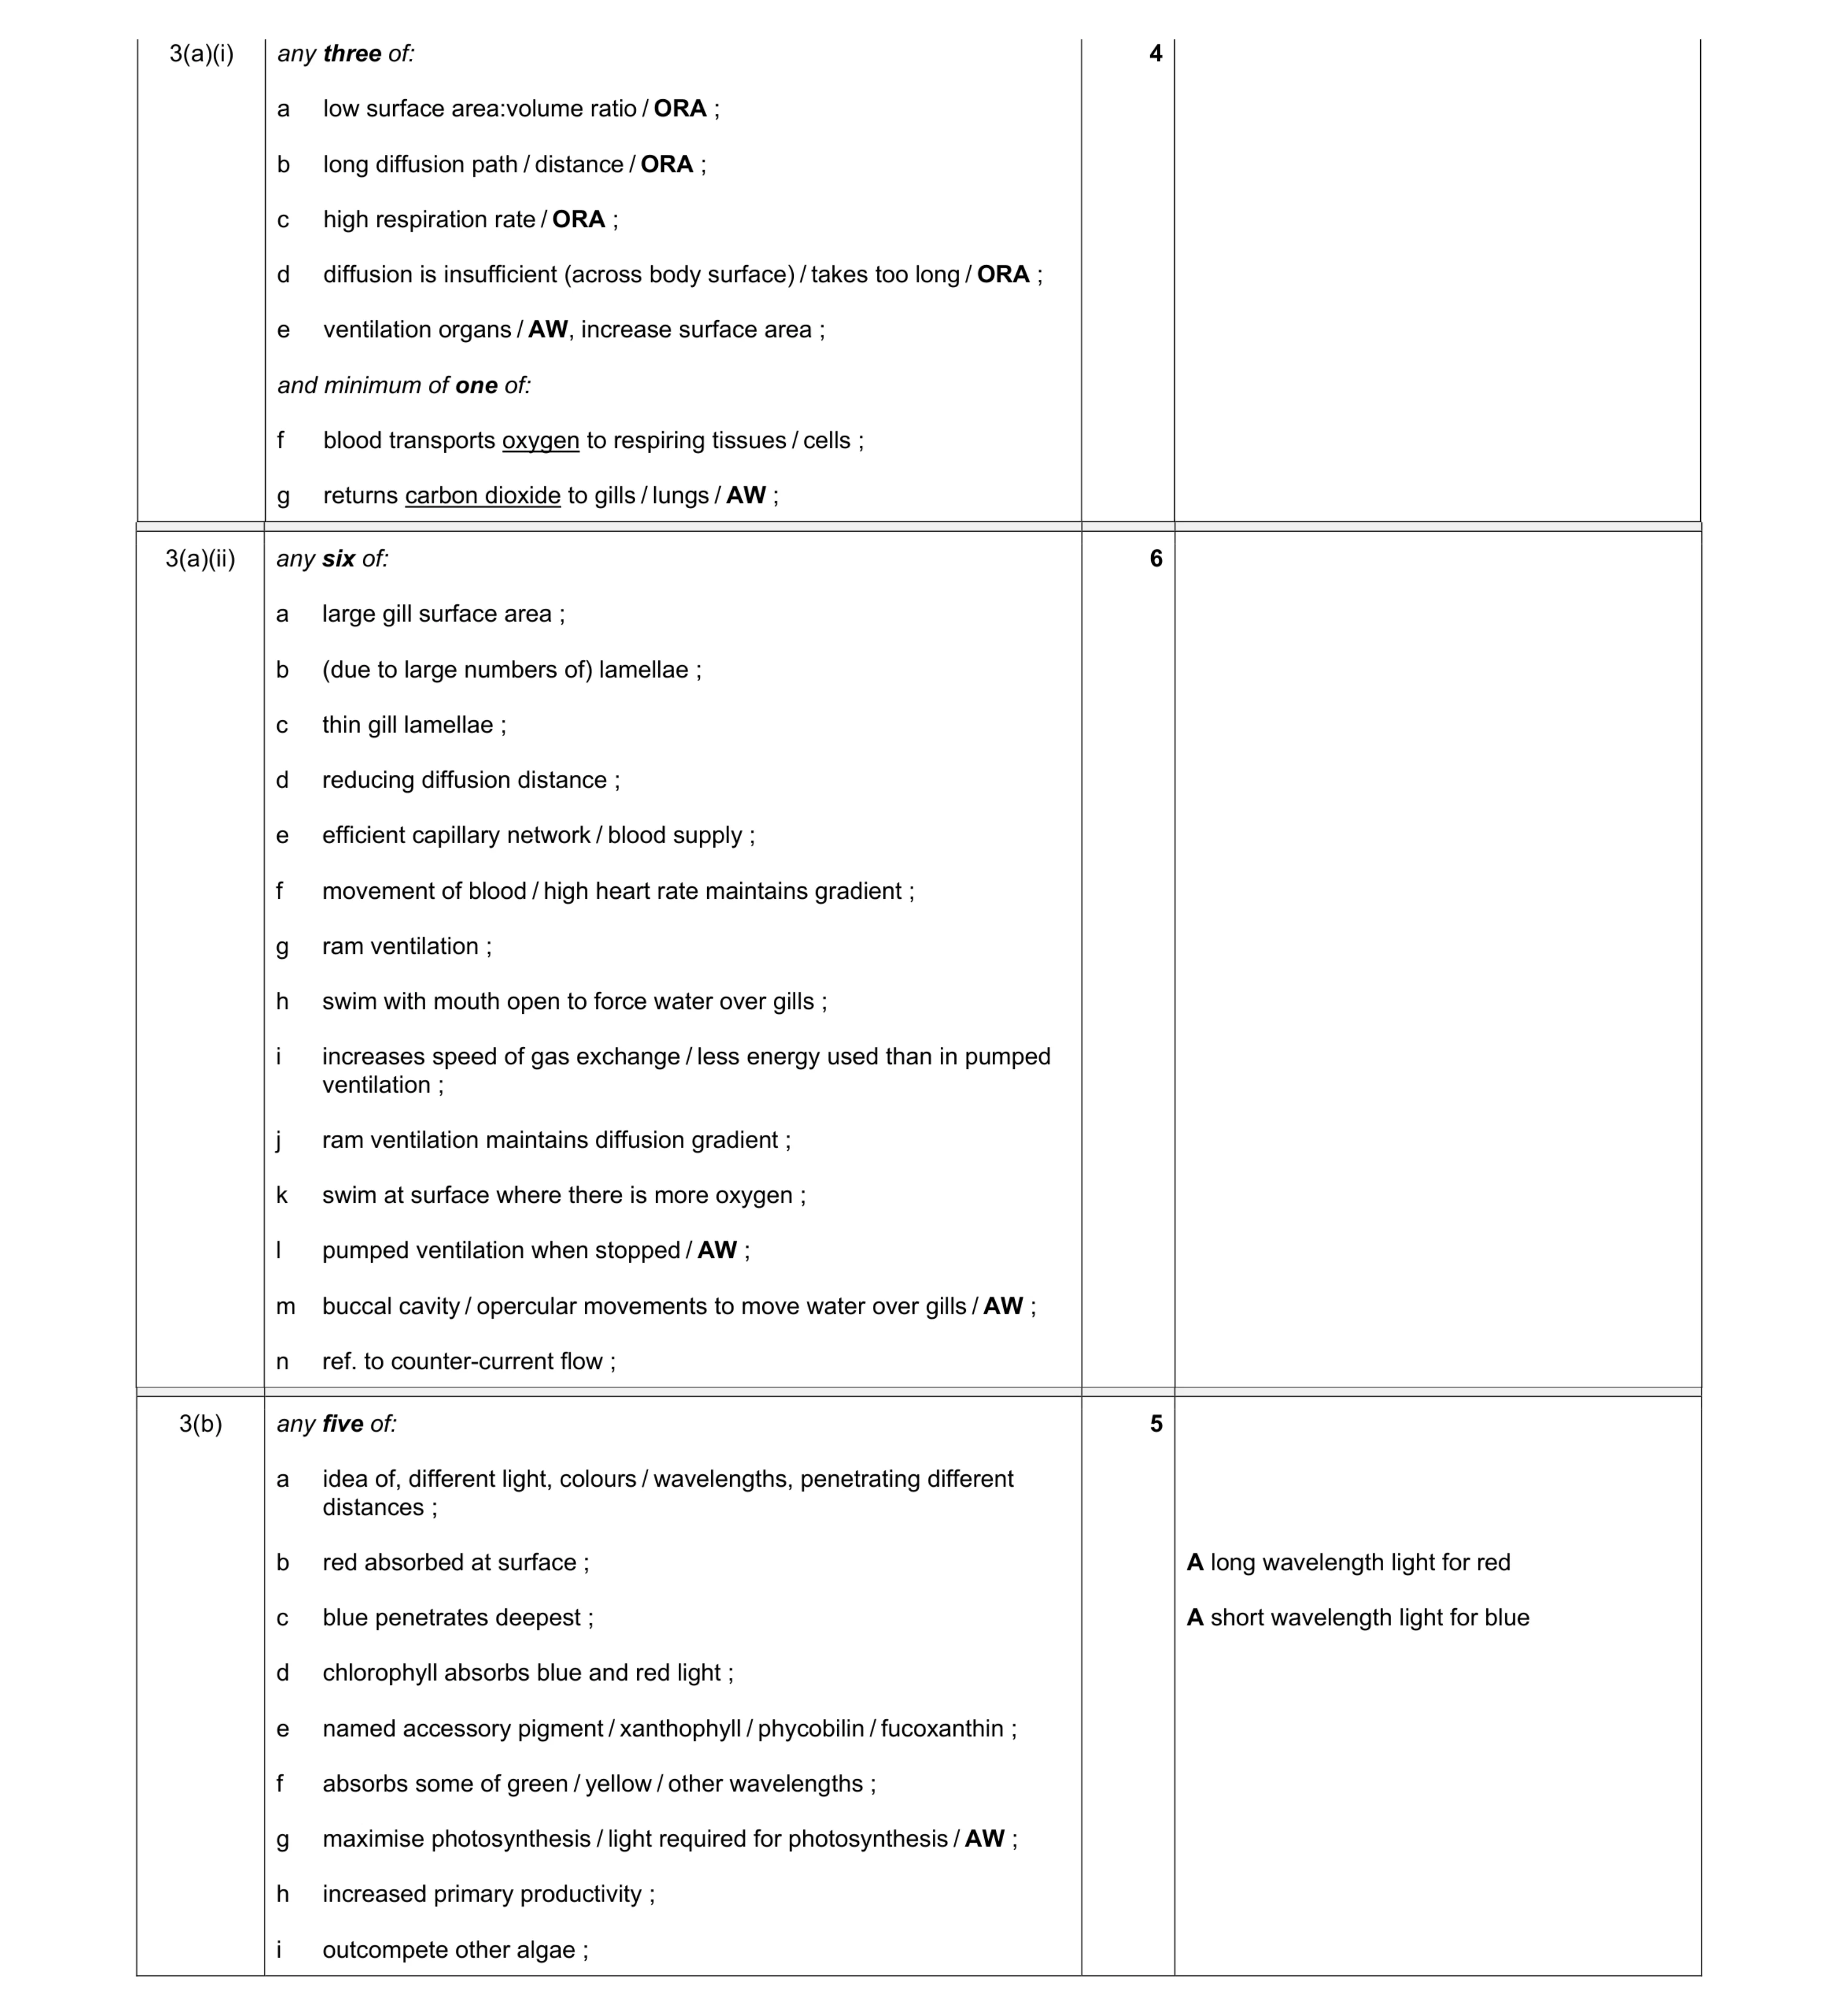
Mark scheme: 3(a)(i) any three of: a low surface area:volume ratio / ORA ; b long diffusion path / distance / ORA ; c high respiration rate / ORA ; d diffusion is insufficient (across body surface) / takes too long / ORA ; e ventilation organs / AW, increase surface area ; and minimum of one of: f blood transports oxygen to respiring tissues / cells ; g returns carbon dioxide to gills / lungs / AW ; 4 Question Answer Marks Guidance 3(a)(ii) any six of: a large gill surface area ; b (due to large numbers of) lamellae ; c thin gill lamellae ; d reducing diffusion distance ; e efficient capillary network / blood supply ; f movement of blood / high heart rate maintains gradient ; g ram ventilation ; h swim with mouth open to force water over gills ; i increases speed of gas exchange / less energy used than in pumped ventilation ; j ram ventilation maintains diffusion gradient ; k swim at surface where there is more oxygen ; l pumped ventilation when stopped / AW ; m buccal cavity / opercular movements to move water over gills / AW ; n ref. to counter-current flow ; 6 Question Answer Marks Guidance 3(b) any five of: a idea of, different light, colours / wavelengths, penetrating different distances ; b red absorbed at surface ; c blue penetrates deepest ; d chlorophyll absorbs blue and red light ; e named accessory pigment / xanthophyll / phycobilin / fucoxanthin ; f absorbs some of green / yellow / other wavelengths ; g maximise photosynthesis / light required for photosynthesis / AW ; h increased primary productivity ; i outcompete other algae ; 5 A long wavelength light for red A short wavelength light for blue
This question in 9693/41 Oct/Nov 2017
Q2 · A student carried out an investigation into the effect of size on the time taken for dye… 9693/40 May/June 2018
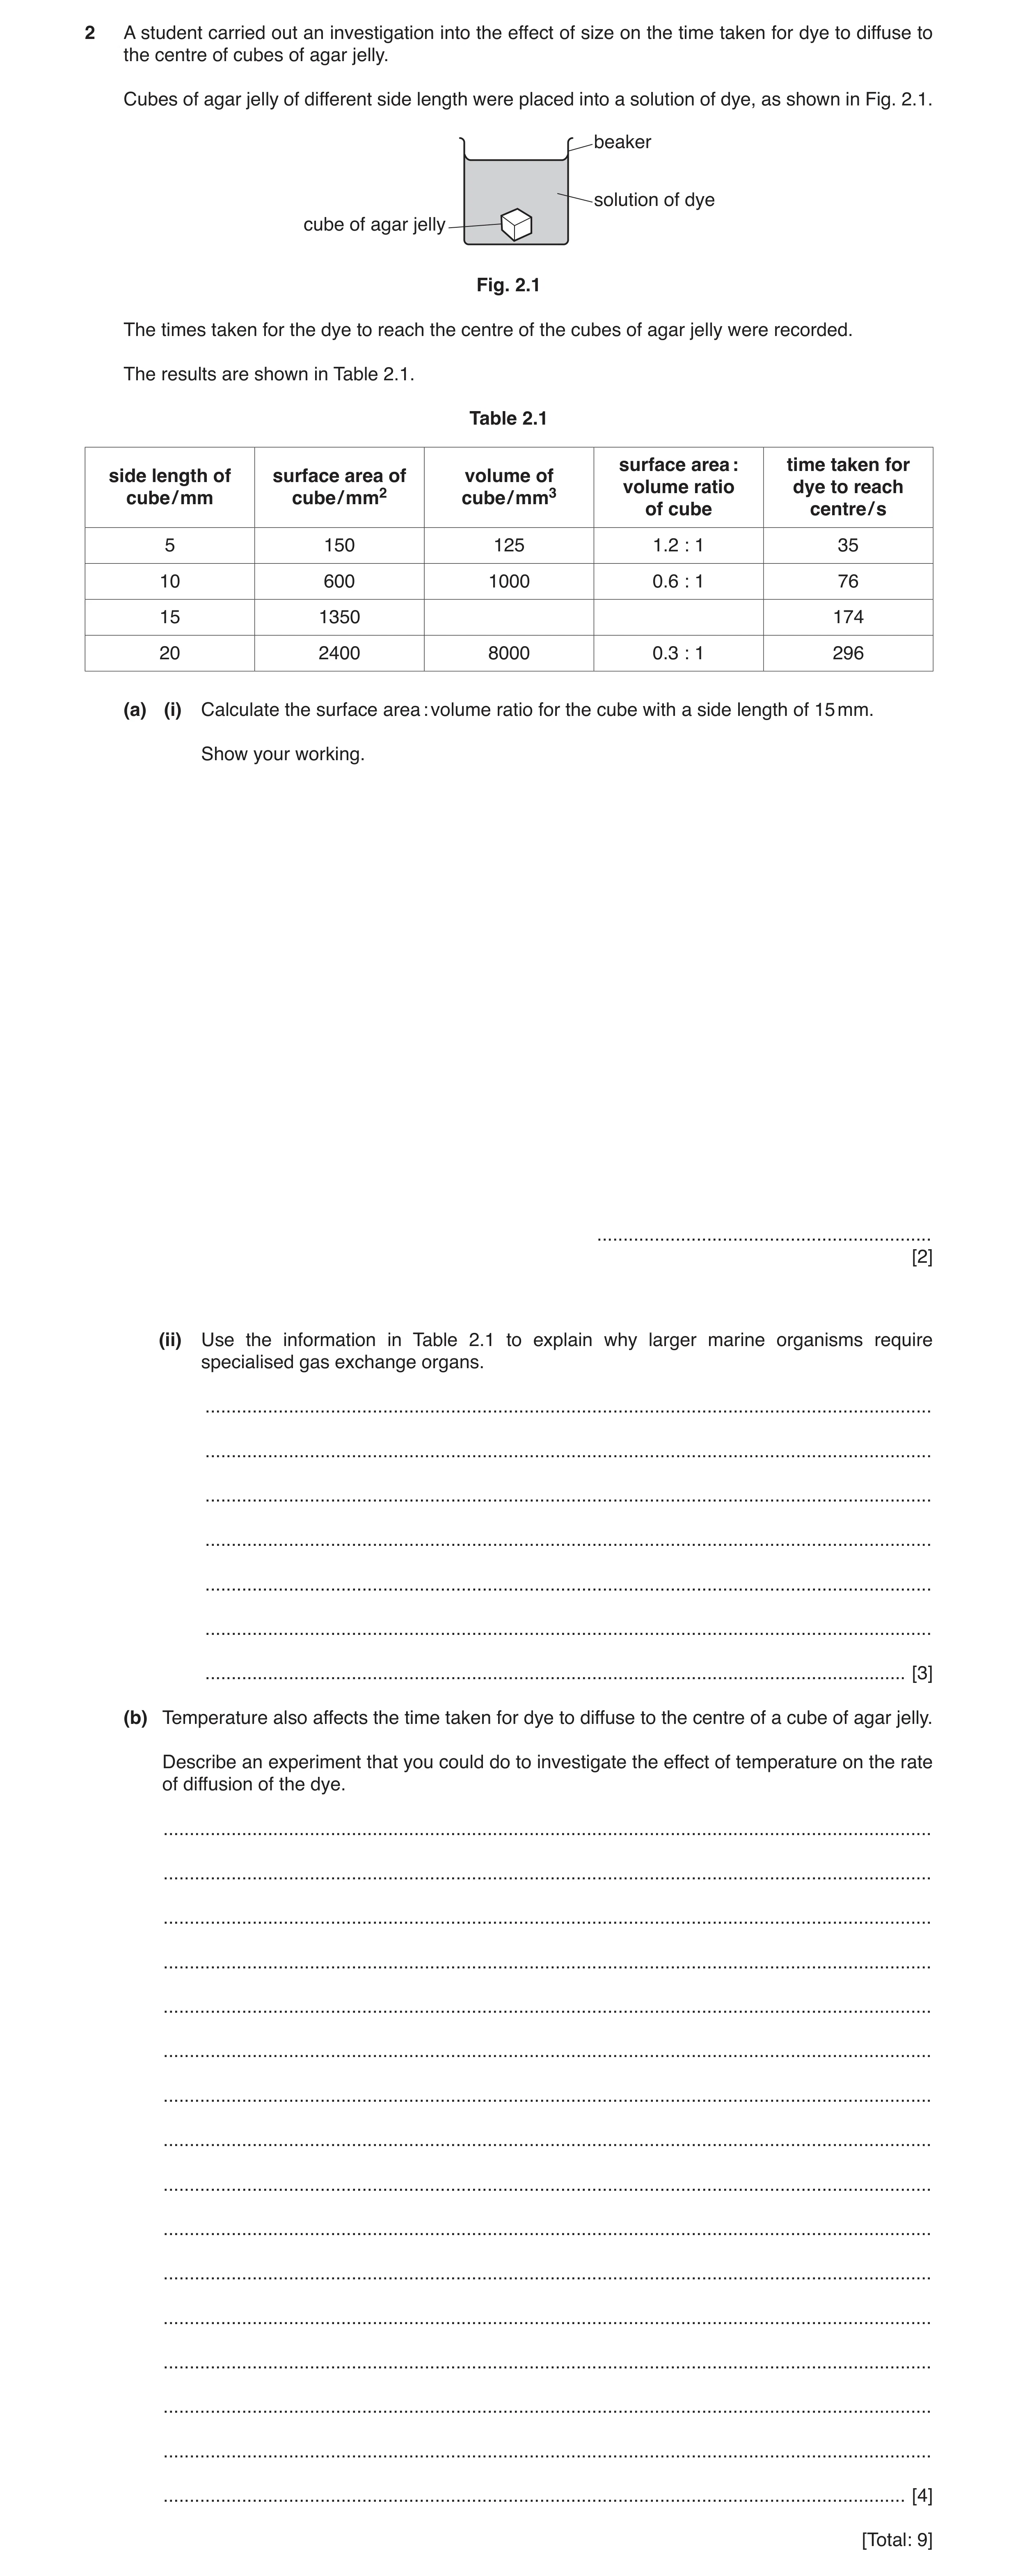
2 A student carried out an investigation into the effect of size on the time taken for dye to diffuse to the centre of cubes of agar jelly. Cubes of agar jelly of different side length were placed into a solution of dye, as shown in Fig. 2.1. beaker solution of dye cube of agar jelly Fig. 2.1 The times taken for the dye to reach the centre of the cubes of agar jelly were recorded. The results are shown in Table 2.1. Table 2.1 surface area : time taken for side length of surface area of volume of volume ratio dye to reach cube / mm cube / mm2 cube / mm3 of cube centre / s 5 150 125 1.2 : 1 35 10 600 1000 0.6 : 1 76 15 1350 174 20 2400 8000 0.3 : 1 296 (a) (i) Calculate the surface area : volume ratio for the cube with a side length of 15 mm. Show your working. … [2] (ii) Use the information in Table 2.1 to explain why larger marine organisms require specialised gas exchange organs. … … … … … … … [3] (b) Temperature also affects the time taken for dye to diffuse to the centre of a cube of agar jelly. Describe an experiment that you could do to investigate the effect of temperature on the rate of diffusion of the dye. … … … … … … … … … … … … … … … … [4] [Total: 9]
9 marks
This question in 9693/40 May/June 2018
Q3 · A student investigated the effect of water temperature on the ventilation rate of tilapia 9693/40 Oct/Nov 2018
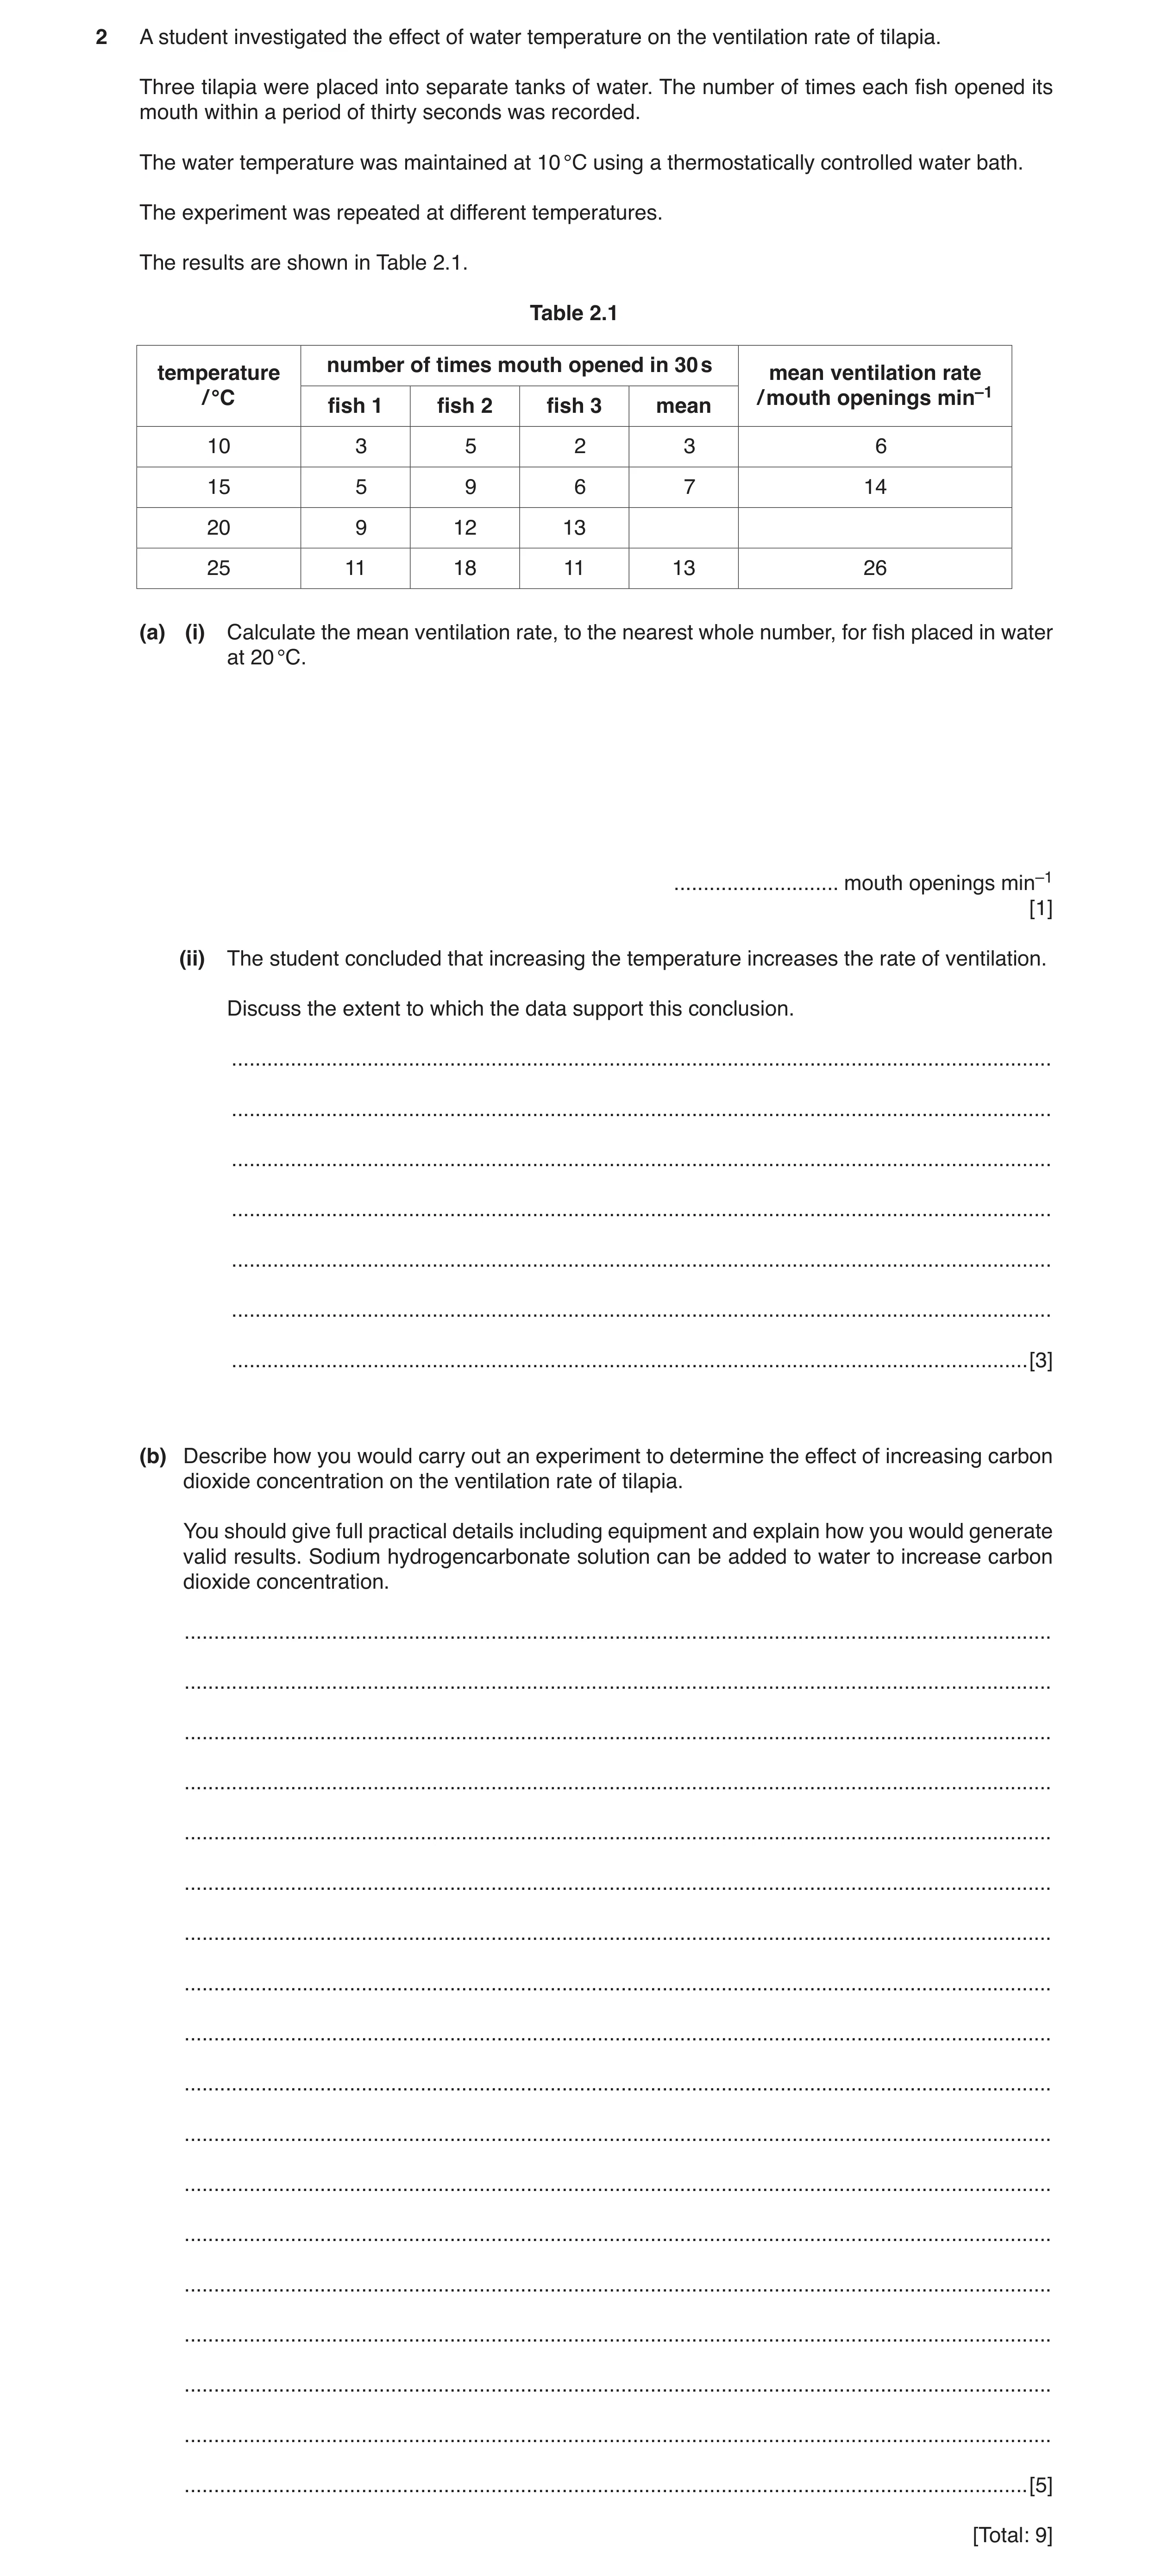
2 A student investigated the effect of water temperature on the ventilation rate of tilapia. Three tilapia were placed into separate tanks of water. The number of times each fish opened its mouth within a period of thirty seconds was recorded. The water temperature was maintained at 10 °C using a thermostatically controlled water bath. The experiment was repeated at different temperatures. The results are shown in Table 2.1. Table 2.1 number of times mouth opened in 30 s temperature mean ventilation rate / °C / mouth openings min–1 fish 1 fish 2 fish 3 mean 10 3 5 2 3 6 15 5 9 6 7 14 20 9 12 13 25 11 18 11 13 26 (a) (i) Calculate the mean ventilation rate, to the nearest whole number, for fish placed in water at 20 °C. … mouth openings min–1 [1] (ii) The student concluded that increasing the temperature increases the rate of ventilation. Discuss the extent to which the data support this conclusion. … … … … … … … [3] (b) Describe how you would carry out an experiment to determine the effect of increasing carbon dioxide concentration on the ventilation rate of tilapia. You should give full practical details including equipment and explain how you would generate valid results. Sodium hydrogencarbonate solution can be added to water to increase carbon dioxide concentration. … … … … … … … … … … … … … … … … … … [5] [Total: 9]
9 marks
This question in 9693/40 Oct/Nov 2018
Q4 · Describe how oxygen concentrations in water differ from those in air 9693/40 Oct/Nov 2019
3 (a) Describe how oxygen concentrations in water differ from those in air. … … … … [2] (b) There are many different methods of gaseous exchange used by marine organisms. Compare the methods of gaseous exchange in coral polyps and grouper. … … … … … … … … … … … … … … … … [8] (c) Explain the negative ecological impacts of the disposal of untreated sewage into the marine environment. … … … … … … … … … … [5] [Total: 15]
15 marks
This question in 9693/40 Oct/Nov 2019
Q5 · The ratio of the gill surface area : body mass of fish is calculated using the following… 9693/40 May/June 2020
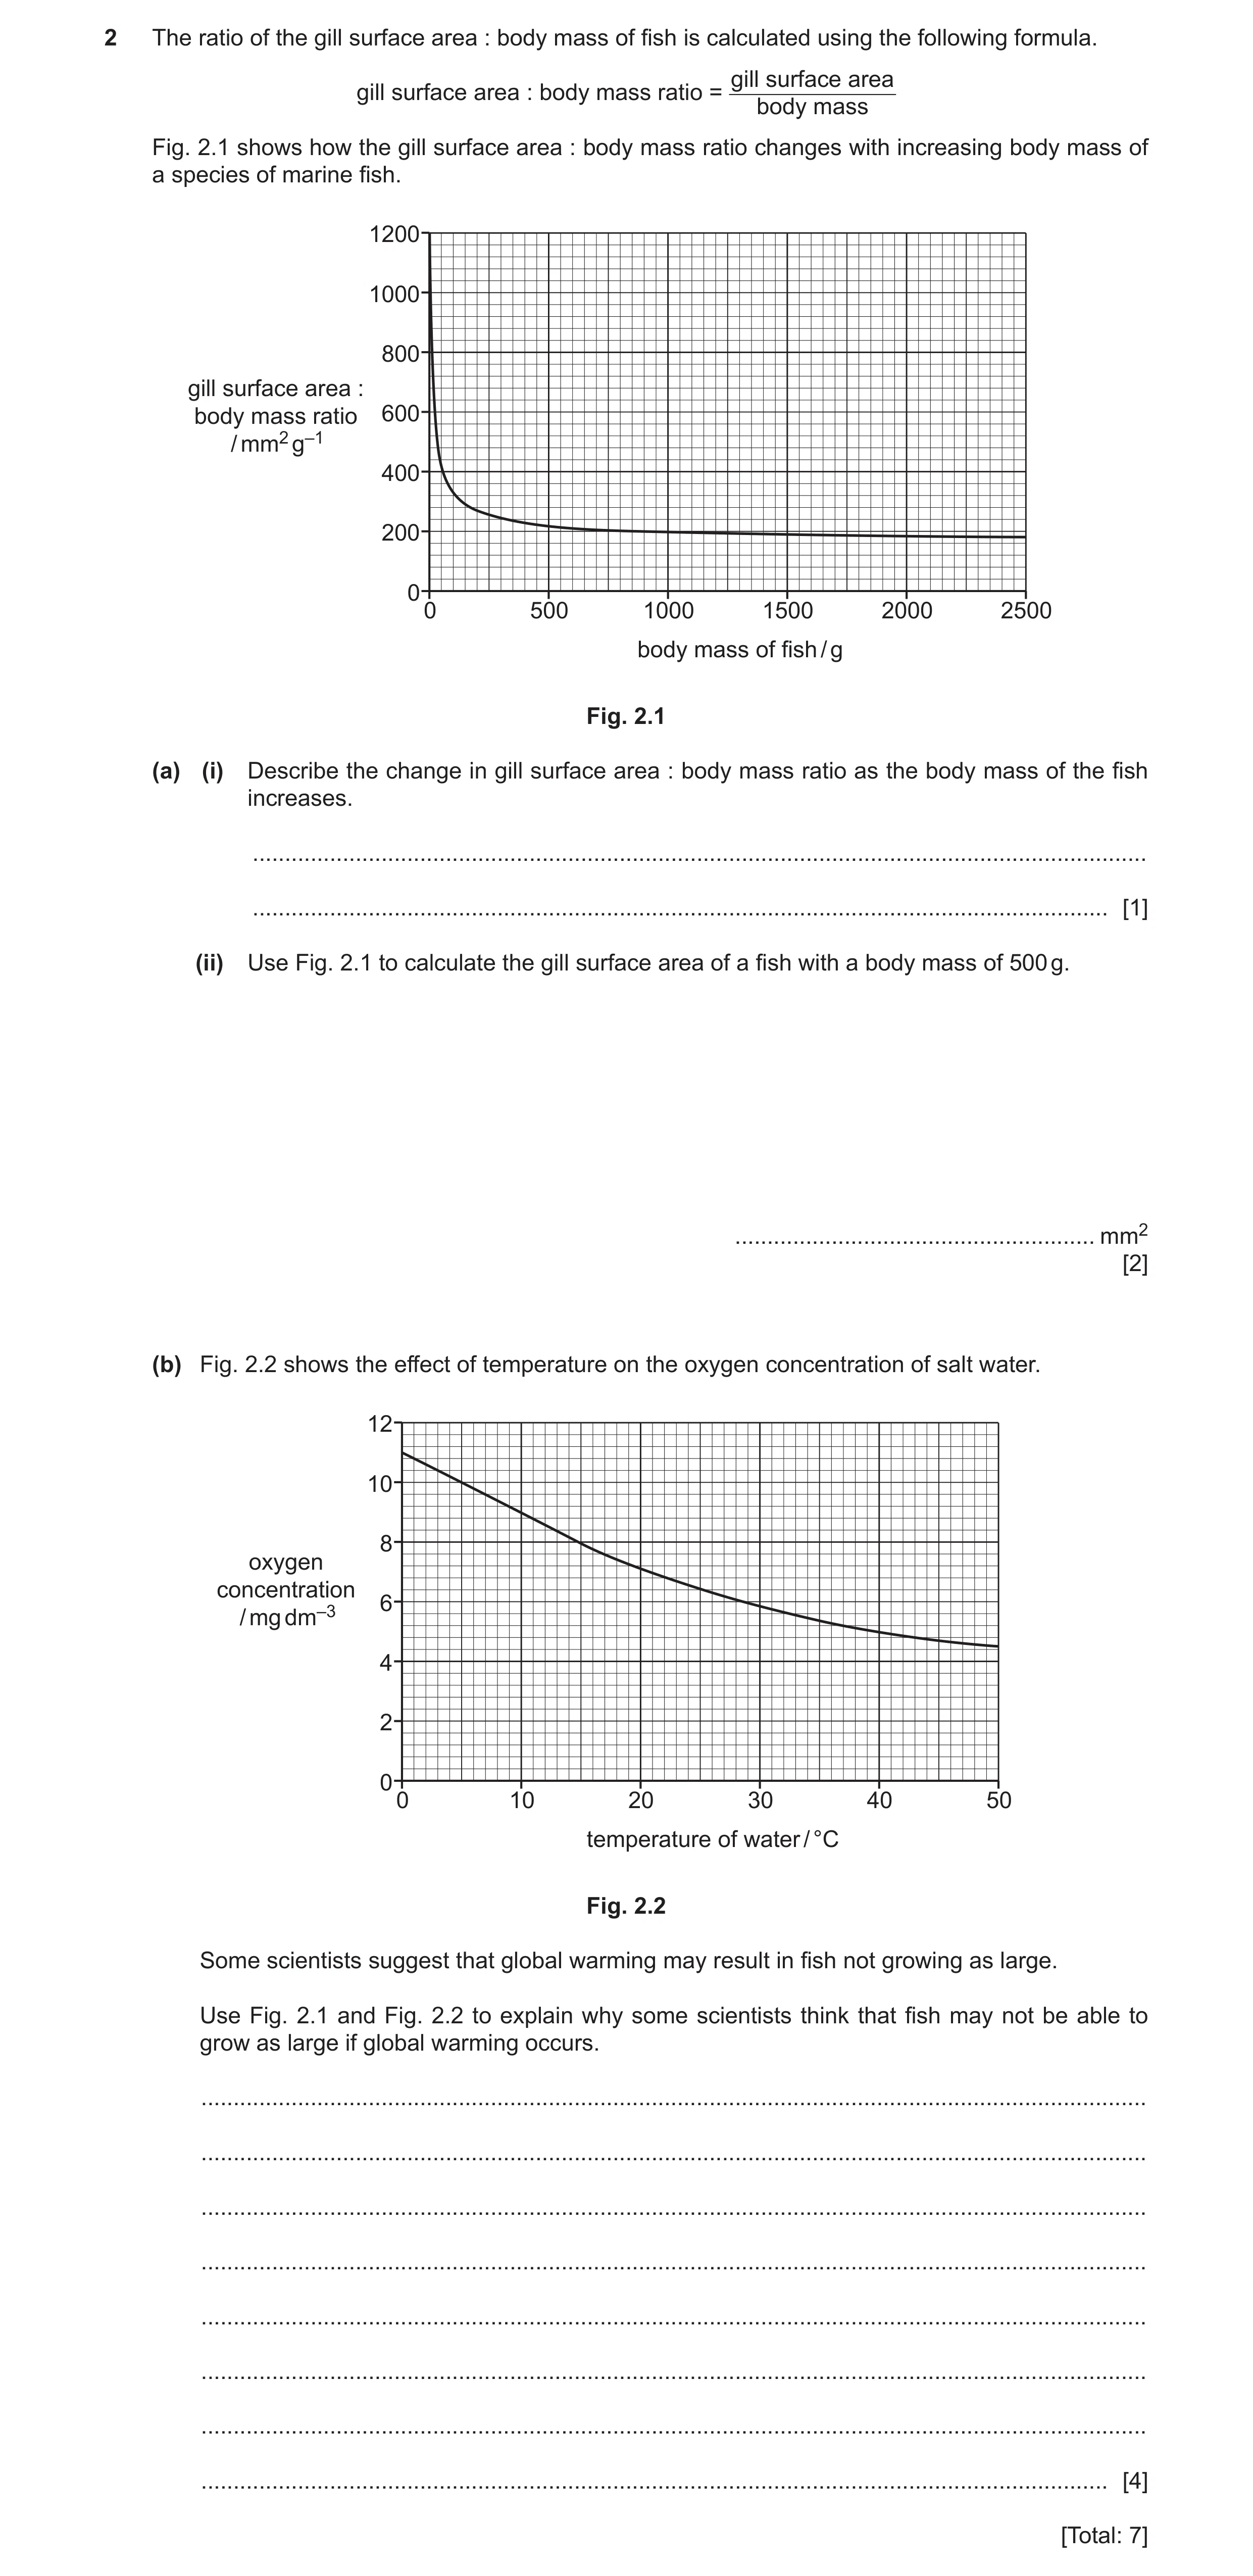
2 The ratio of the gill surface area : body mass of fish is calculated using the following formula. gill surface area gill surface area : body mass ratio = body mass Fig. 2.1 shows how the gill surface area : body mass ratio changes with increasing body mass of a species of marine fish. 1200 1000 800 gill surface area : body mass ratio 600 / mm2 g–1 400 200 0 0 500 1000 1500 2000 2500 body mass of fish / g Fig. 2.1 (a) (i) Describe the change in gill surface area : body mass ratio as the body mass of the fish increases. … … [1] (ii) Use Fig. 2.1 to calculate the gill surface area of a fish with a body mass of 500 g. … mm2 [2] (b) Fig. 2.2 shows the effect of temperature on the oxygen concentration of salt water. 12 10 8 oxygen concentration 6 / mg dm–3 4 2 0 0 10 20 30 40 50 temperature of water / °C Fig. 2.2 Some scientists suggest that global warming may result in fish not growing as large. Use Fig. 2.1 and Fig. 2.2 to explain why some scientists think that fish may not be able to grow as large if global warming occurs. … … … … … … … … [4] [Total: 7]
7 marks
This question in 9693/40 May/June 2020
Q6 · Organisms require oxygen for aerobic respiration 9693/41 Oct/Nov 2023
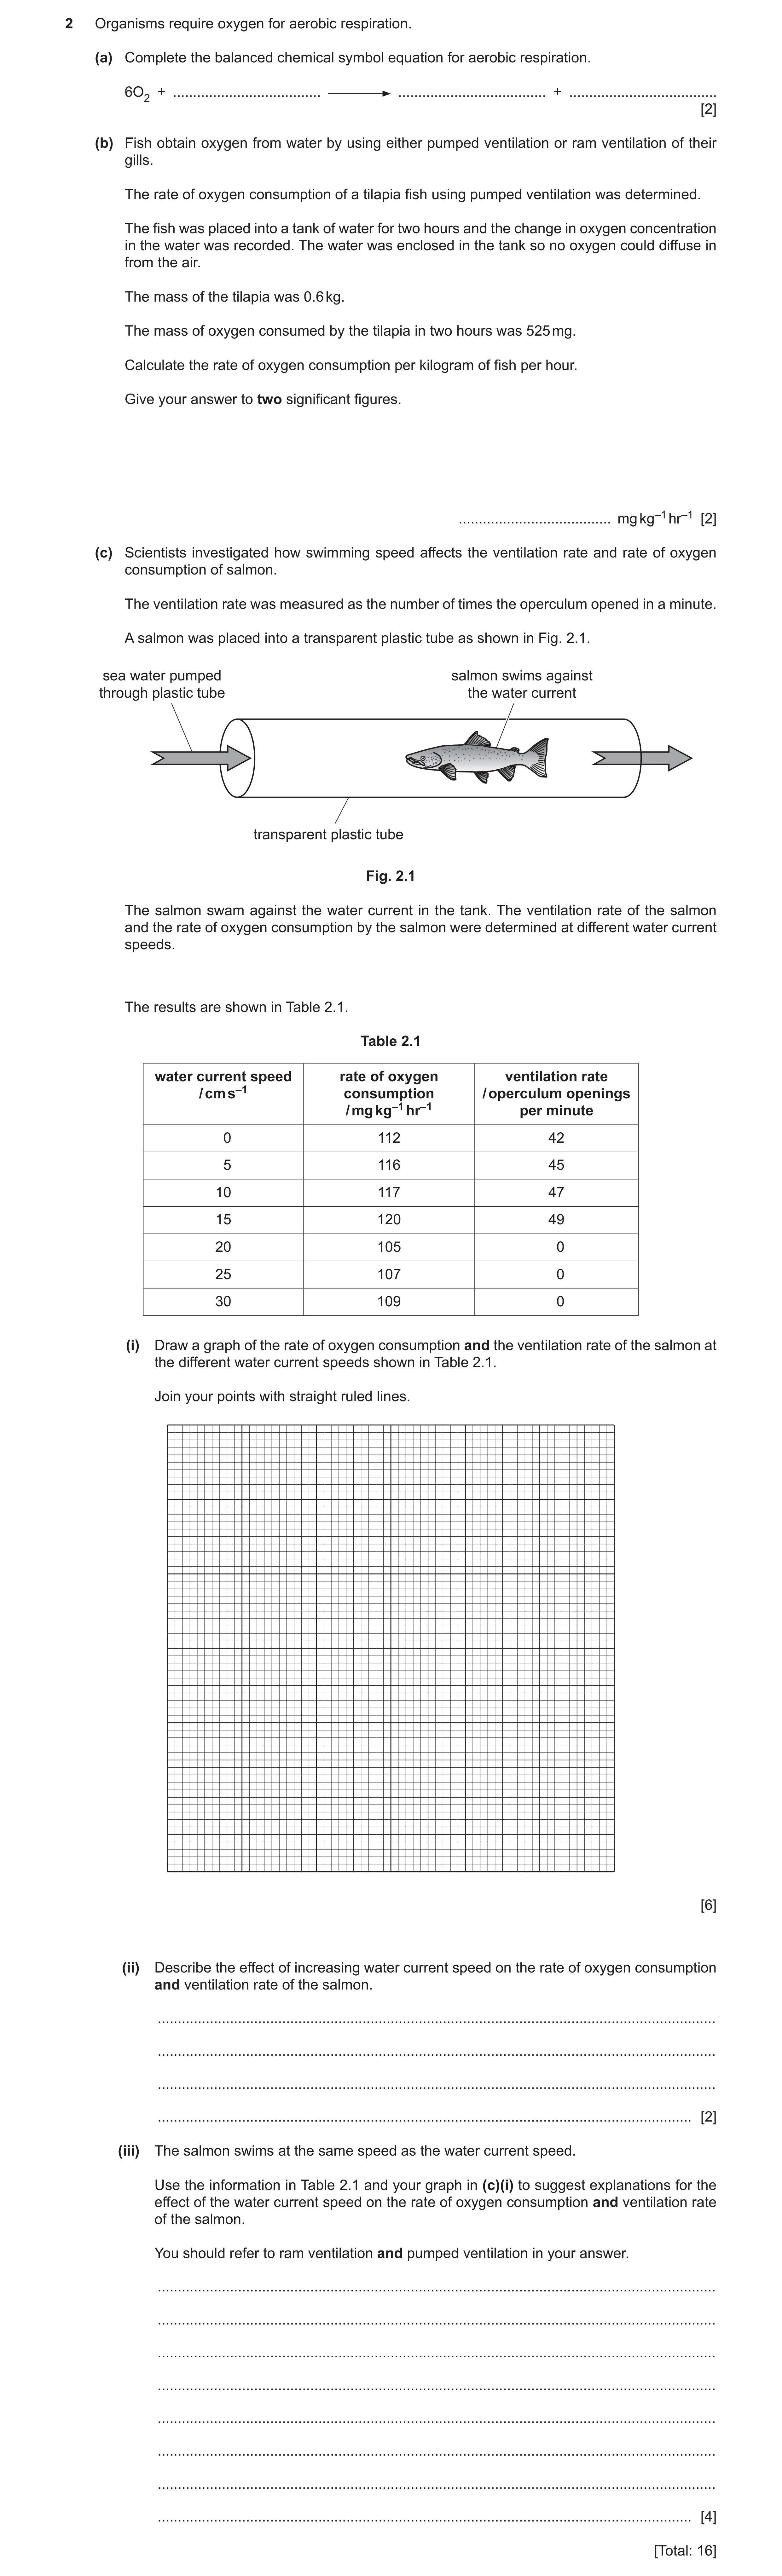
2 Organisms require oxygen for aerobic respiration. (a) Complete the balanced chemical symbol equation for aerobic respiration. 6O2 + … … + … [2] (b) Fish obtain oxygen from water by using either pumped ventilation or ram ventilation of their gills. The rate of oxygen consumption of a tilapia fish using pumped ventilation was determined. The fish was placed into a tank of water for two hours and the change in oxygen concentration in the water was recorded. The water was enclosed in the tank so no oxygen could diffuse in from the air. The mass of the tilapia was 0.6 kg. The mass of oxygen consumed by the tilapia in two hours was 525 mg. Calculate the rate of oxygen consumption per kilogram of fish per hour. Give your answer to two significant figures. … mg kg–1 hr–1 [2] (c) Scientists investigated how swimming speed affects the ventilation rate and rate of oxygen consumption of salmon. The ventilation rate was measured as the number of times the operculum opened in a minute. A salmon was placed into a transparent plastic tube as shown in Fig. 2.1. sea water pumped salmon swims against through plastic tube the water current transparent plastic tube Fig. 2.1 The salmon swam against the water current in the tank. The ventilation rate of the salmon and the rate of oxygen consumption by the salmon were determined at different water current speeds. The results are shown in Table 2.1. Table 2.1 water current speed rate of oxygen ventilation rate / cm s–1 consumption / operculum openings / mg kg–1 hr–1 per minute 0 112 42 5 116 45 10 117 47 15 120 49 20 105 0 25 107 0 30 109 0 (i) Draw a graph of the rate of oxygen consumption and the ventilation rate of the salmon at the different water current speeds shown in Table 2.1. Join your points with straight ruled lines. [6] (ii) Describe the effect of increasing water current speed on the rate of oxygen consumption and ventilation rate of the salmon. … … … … [2] (iii) The salmon swims at the same speed as the water current speed. Use the information in Table 2.1 and your graph in (c)(i) to suggest explanations for the effect of the water current speed on the rate of oxygen consumption and ventilation rate of the salmon. You should refer to ram ventilation and pumped ventilation in your answer. … … … … … … … … [4] [Total: 16]
16 marks
Mark scheme: 2(a) C6H12O6 ; 2 6CO2 + 6H2O ; 2(b) 525 ÷ 0.6 ÷ 2 = 437.5 ; 2 440 ; 2(c)(i) two separate linear y axes scales for oxygen and ventilation rate that use at least half the grid ; 6 both y axes and x axis labelled and with units ; x axis has linear scale ; ruled straight lines with key ; plots ;; 2(c)(ii) both oxygen consumption and ventilation rate increase then decrease ; 2 both increase up to water current speed of 15 cm s–1 / decrease after 20 cm s–1 ; 2(c)(iii) any 4 of: 4 1 pumped ventilation, uses, operculum / muscles / has open and closing mouth, to force water over gills and ram ventilation uses open mouth to allow water to flow over gills / AW ; 2 swaps to ram ventilation after 15 cm s–1 / from 20 cm s–1 ; 3 increased water speed causes more muscle contraction / AW ; 4 (from 0 to 15 cm s-1) more oxygen for more respiration ; 5 (pumped) ventilation rate increases to supply oxygen ; 6 pumped ventilation is more energetically costly compared with ram ventilation / pumped ventilation uses more energy / ram ventilation is more efficient / AW ; 7 below 15 cm s-1 water speed is not fast enough to supply sufficient oxygen via ram ventilation / water speed needs to be at least 15 for ram ventilation ;
This question in 9693/41 Oct/Nov 2023
Q7 · Organisms require oxygen for aerobic respiration 9693/42 Oct/Nov 2023
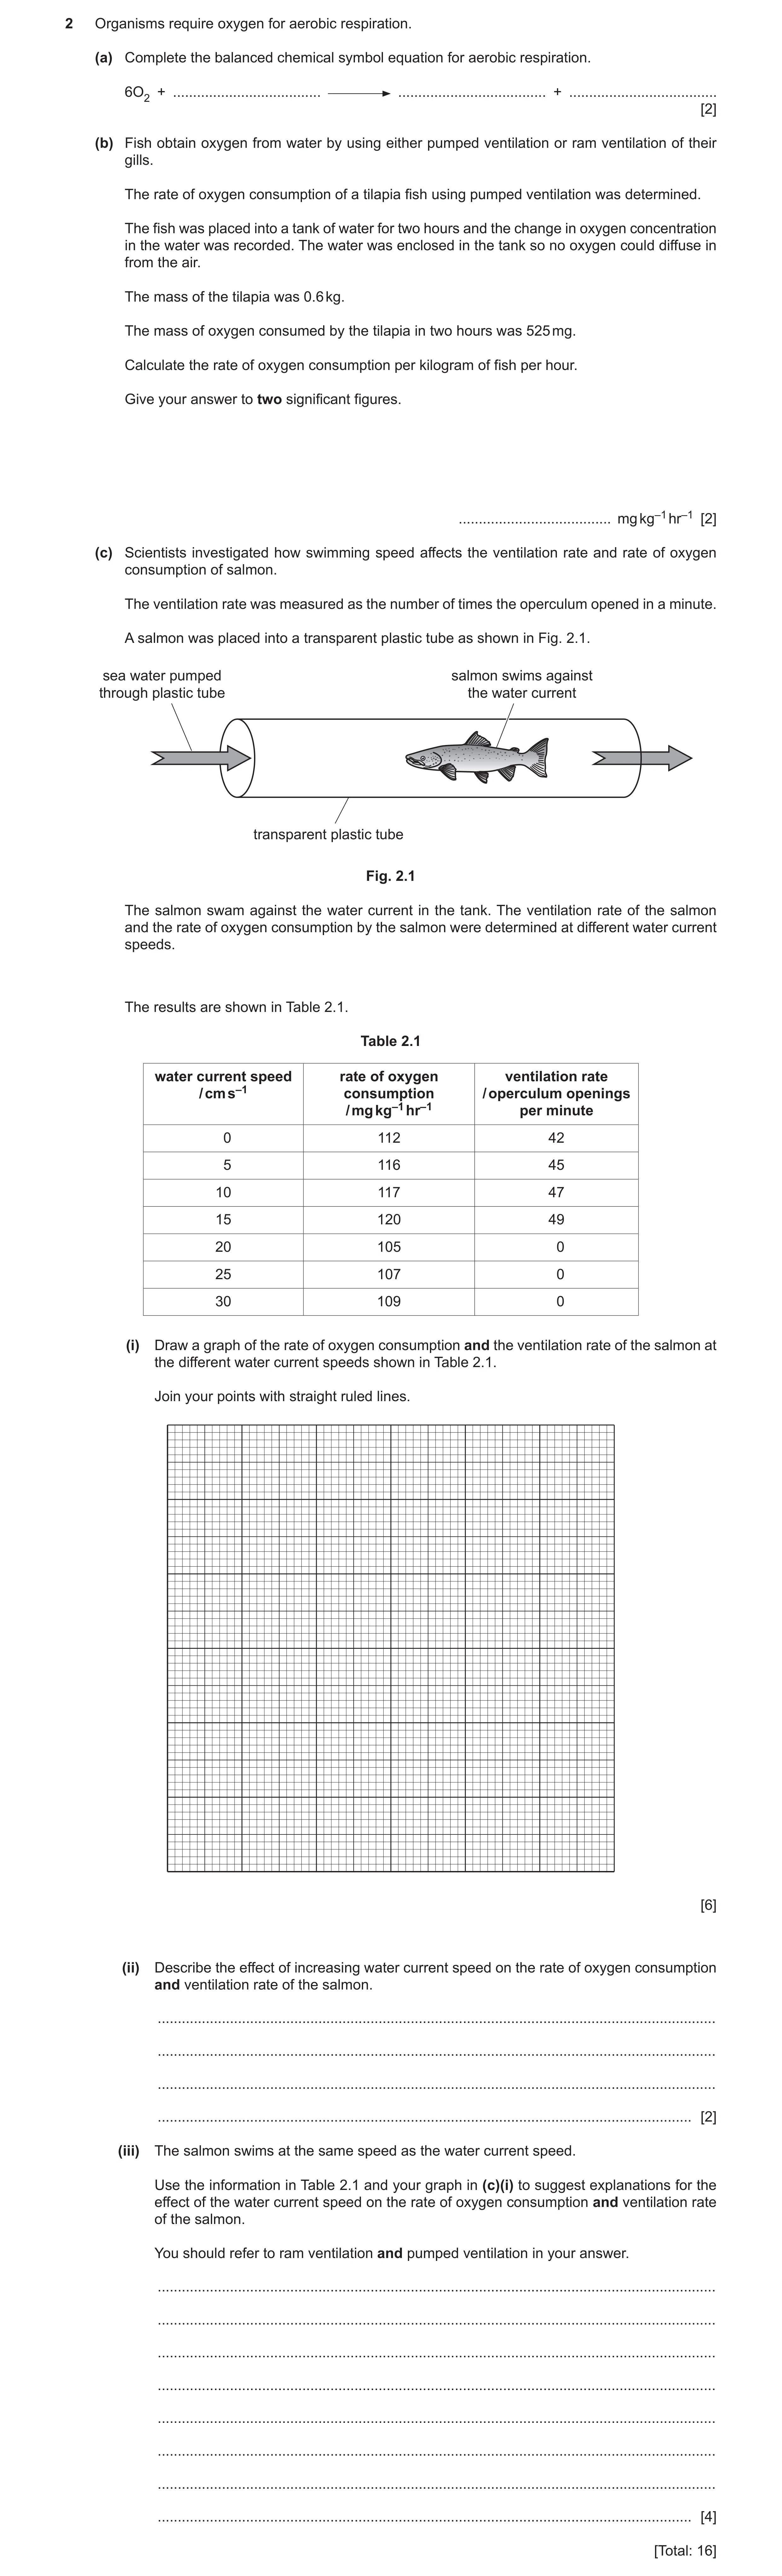
2 Organisms require oxygen for aerobic respiration. (a) Complete the balanced chemical symbol equation for aerobic respiration. 6O2 + … … + … [2] (b) Fish obtain oxygen from water by using either pumped ventilation or ram ventilation of their gills. The rate of oxygen consumption of a tilapia fish using pumped ventilation was determined. The fish was placed into a tank of water for two hours and the change in oxygen concentration in the water was recorded. The water was enclosed in the tank so no oxygen could diffuse in from the air. The mass of the tilapia was 0.6 kg. The mass of oxygen consumed by the tilapia in two hours was 525 mg. Calculate the rate of oxygen consumption per kilogram of fish per hour. Give your answer to two significant figures. … mg kg–1 hr–1 [2] (c) Scientists investigated how swimming speed affects the ventilation rate and rate of oxygen consumption of salmon. The ventilation rate was measured as the number of times the operculum opened in a minute. A salmon was placed into a transparent plastic tube as shown in Fig. 2.1. sea water pumped salmon swims against through plastic tube the water current transparent plastic tube Fig. 2.1 The salmon swam against the water current in the tank. The ventilation rate of the salmon and the rate of oxygen consumption by the salmon were determined at different water current speeds. The results are shown in Table 2.1. Table 2.1 water current speed rate of oxygen ventilation rate / cm s–1 consumption / operculum openings / mg kg–1 hr–1 per minute 0 112 42 5 116 45 10 117 47 15 120 49 20 105 0 25 107 0 30 109 0 (i) Draw a graph of the rate of oxygen consumption and the ventilation rate of the salmon at the different water current speeds shown in Table 2.1. Join your points with straight ruled lines. [6] (ii) Describe the effect of increasing water current speed on the rate of oxygen consumption and ventilation rate of the salmon. … … … … [2] (iii) The salmon swims at the same speed as the water current speed. Use the information in Table 2.1 and your graph in (c)(i) to suggest explanations for the effect of the water current speed on the rate of oxygen consumption and ventilation rate of the salmon. You should refer to ram ventilation and pumped ventilation in your answer. … … … … … … … … [4] [Total: 16]
16 marks
Mark scheme: 2(a) C6H12O6 ; 2 6CO2 + 6H2O ; 2(b) 525 ÷ 0.6 ÷ 2 = 437.5 ; 2 440 ; 2(c)(i) two separate linear y axes scales for oxygen and ventilation rate that use at least half the grid ; 6 both y axes and x axis labelled and with units ; x axis has linear scale ; ruled straight lines with key ; plots ;; 2(c)(ii) both oxygen consumption and ventilation rate increase then decrease ; 2 both increase up to water current speed of 15 cm s–1 / decrease after 20 cm s–1 ; 2(c)(iii) any 4 of: 4 1 pumped ventilation, uses, operculum / muscles / has open and closing mouth, to force water over gills and ram ventilation uses open mouth to allow water to flow over gills / AW ; 2 swaps to ram ventilation after 15 cm s–1 / from 20 cm s–1 ; 3 increased water speed causes more muscle contraction / AW ; 4 (from 0 to 15 cm s-1) more oxygen for more respiration ; 5 (pumped) ventilation rate increases to supply oxygen ; 6 pumped ventilation is more energetically costly compared with ram ventilation / pumped ventilation uses more energy / ram ventilation is more efficient / AW ; 7 below 15 cm s-1 water speed is not fast enough to supply sufficient oxygen via ram ventilation / water speed needs to be at least 15 for ram ventilation ;
This question in 9693/42 Oct/Nov 2023
Q8 · Organisms require oxygen for aerobic respiration 9693/43 Oct/Nov 2023
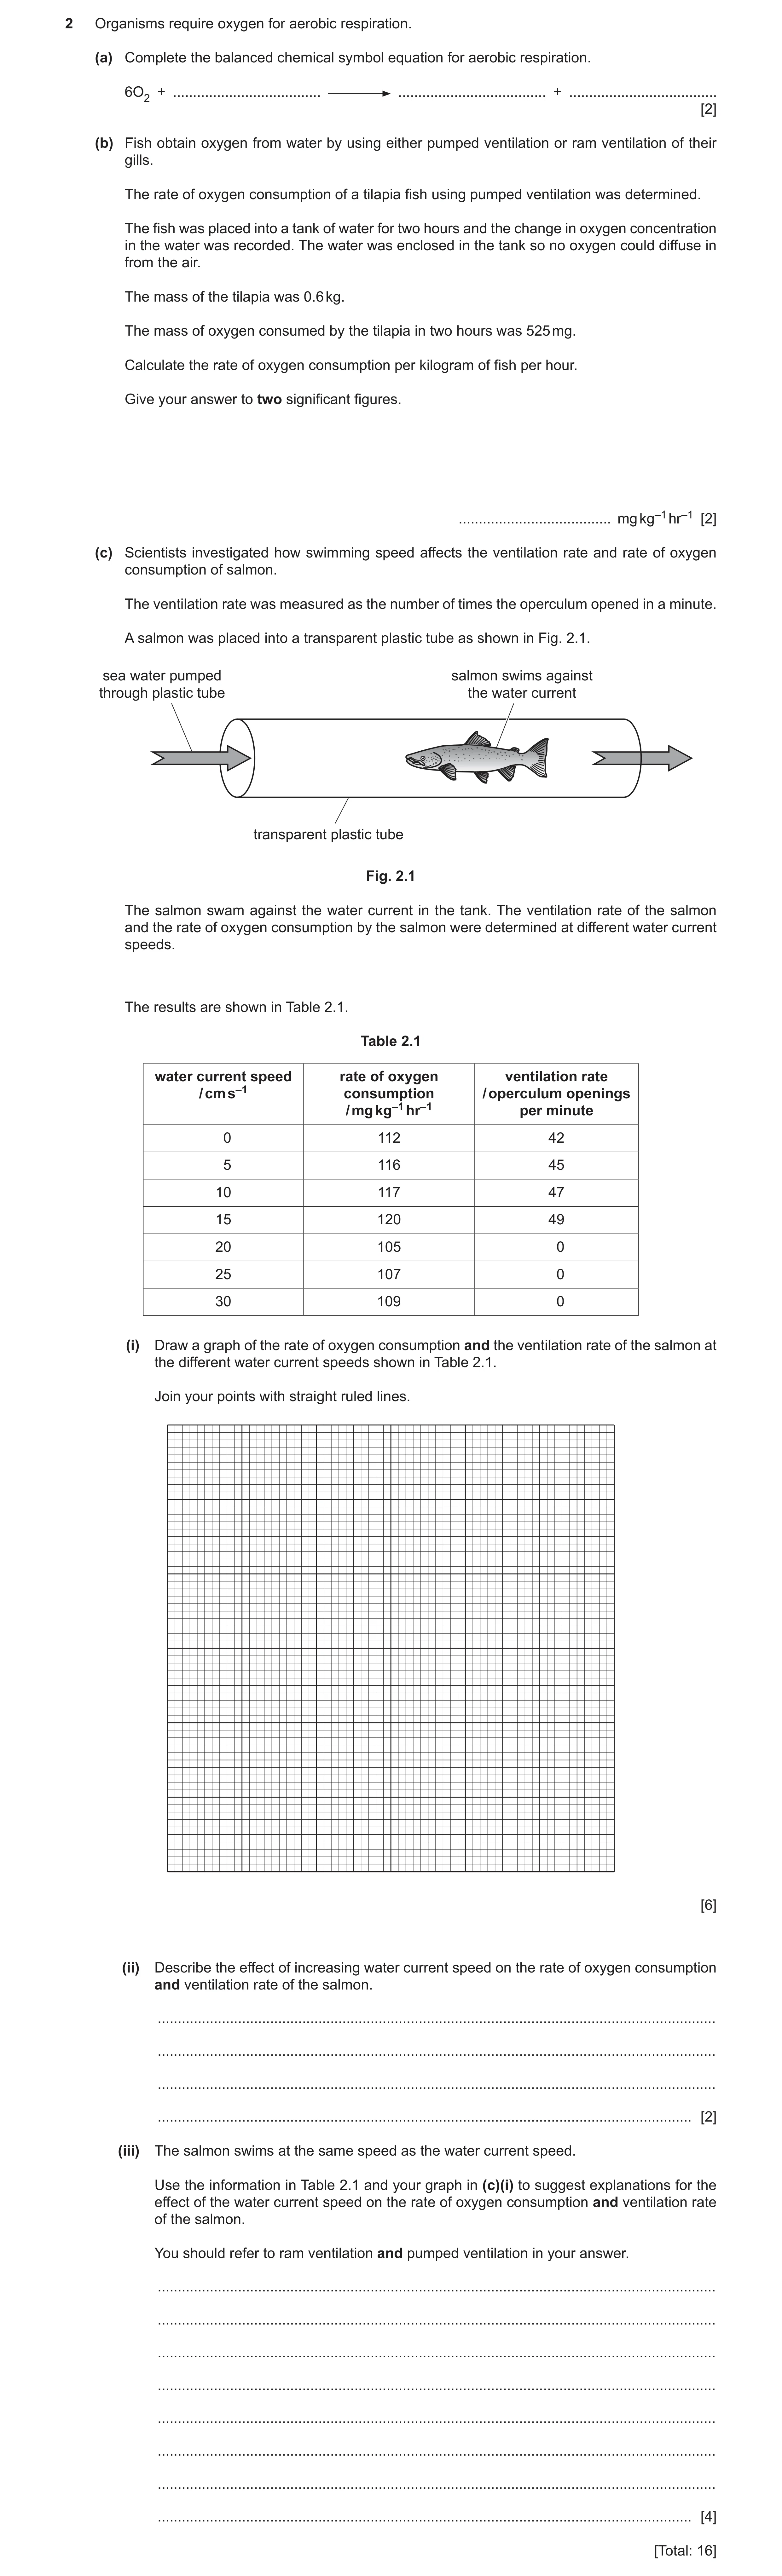
2 Organisms require oxygen for aerobic respiration. (a) Complete the balanced chemical symbol equation for aerobic respiration. 6O2 + … … + … [2] (b) Fish obtain oxygen from water by using either pumped ventilation or ram ventilation of their gills. The rate of oxygen consumption of a tilapia fish using pumped ventilation was determined. The fish was placed into a tank of water for two hours and the change in oxygen concentration in the water was recorded. The water was enclosed in the tank so no oxygen could diffuse in from the air. The mass of the tilapia was 0.6 kg. The mass of oxygen consumed by the tilapia in two hours was 525 mg. Calculate the rate of oxygen consumption per kilogram of fish per hour. Give your answer to two significant figures. … mg kg–1 hr–1 [2] (c) Scientists investigated how swimming speed affects the ventilation rate and rate of oxygen consumption of salmon. The ventilation rate was measured as the number of times the operculum opened in a minute. A salmon was placed into a transparent plastic tube as shown in Fig. 2.1. sea water pumped salmon swims against through plastic tube the water current transparent plastic tube Fig. 2.1 The salmon swam against the water current in the tank. The ventilation rate of the salmon and the rate of oxygen consumption by the salmon were determined at different water current speeds. The results are shown in Table 2.1. Table 2.1 water current speed rate of oxygen ventilation rate / cm s–1 consumption / operculum openings / mg kg–1 hr–1 per minute 0 112 42 5 116 45 10 117 47 15 120 49 20 105 0 25 107 0 30 109 0 (i) Draw a graph of the rate of oxygen consumption and the ventilation rate of the salmon at the different water current speeds shown in Table 2.1. Join your points with straight ruled lines. [6] (ii) Describe the effect of increasing water current speed on the rate of oxygen consumption and ventilation rate of the salmon. … … … … [2] (iii) The salmon swims at the same speed as the water current speed. Use the information in Table 2.1 and your graph in (c)(i) to suggest explanations for the effect of the water current speed on the rate of oxygen consumption and ventilation rate of the salmon. You should refer to ram ventilation and pumped ventilation in your answer. … … … … … … … … [4] [Total: 16]
16 marks
Mark scheme: 2(a) C6H12O6 ; 2 6CO2 + 6H2O ; 2(b) 525 ÷ 0.6 ÷ 2 = 437.5 ; 2 440 ; 2(c)(i) two separate linear y axes scales for oxygen and ventilation rate that use at least half the grid ; 6 both y axes and x axis labelled and with units ; x axis has linear scale ; ruled straight lines with key ; plots ;; 2(c)(ii) both oxygen consumption and ventilation rate increase then decrease ; 2 both increase up to water current speed of 15 cm s–1 / decrease after 20 cm s–1 ; 2(c)(iii) any 4 of: 4 1 pumped ventilation, uses, operculum / muscles / has open and closing mouth, to force water over gills and ram ventilation uses open mouth to allow water to flow over gills / AW ; 2 swaps to ram ventilation after 15 cm s–1 / from 20 cm s–1 ; 3 increased water speed causes more muscle contraction / AW ; 4 (from 0 to 15 cm s-1) more oxygen for more respiration ; 5 (pumped) ventilation rate increases to supply oxygen ; 6 pumped ventilation is more energetically costly compared with ram ventilation / pumped ventilation uses more energy / ram ventilation is more efficient / AW ; 7 below 15 cm s-1 water speed is not fast enough to supply sufficient oxygen via ram ventilation / water speed needs to be at least 15 for ram ventilation ;
This question in 9693/43 Oct/Nov 2023
Q9 · A student investigated if the surface area of fish gills has a correlation with the… 9693/41 May/June 2025
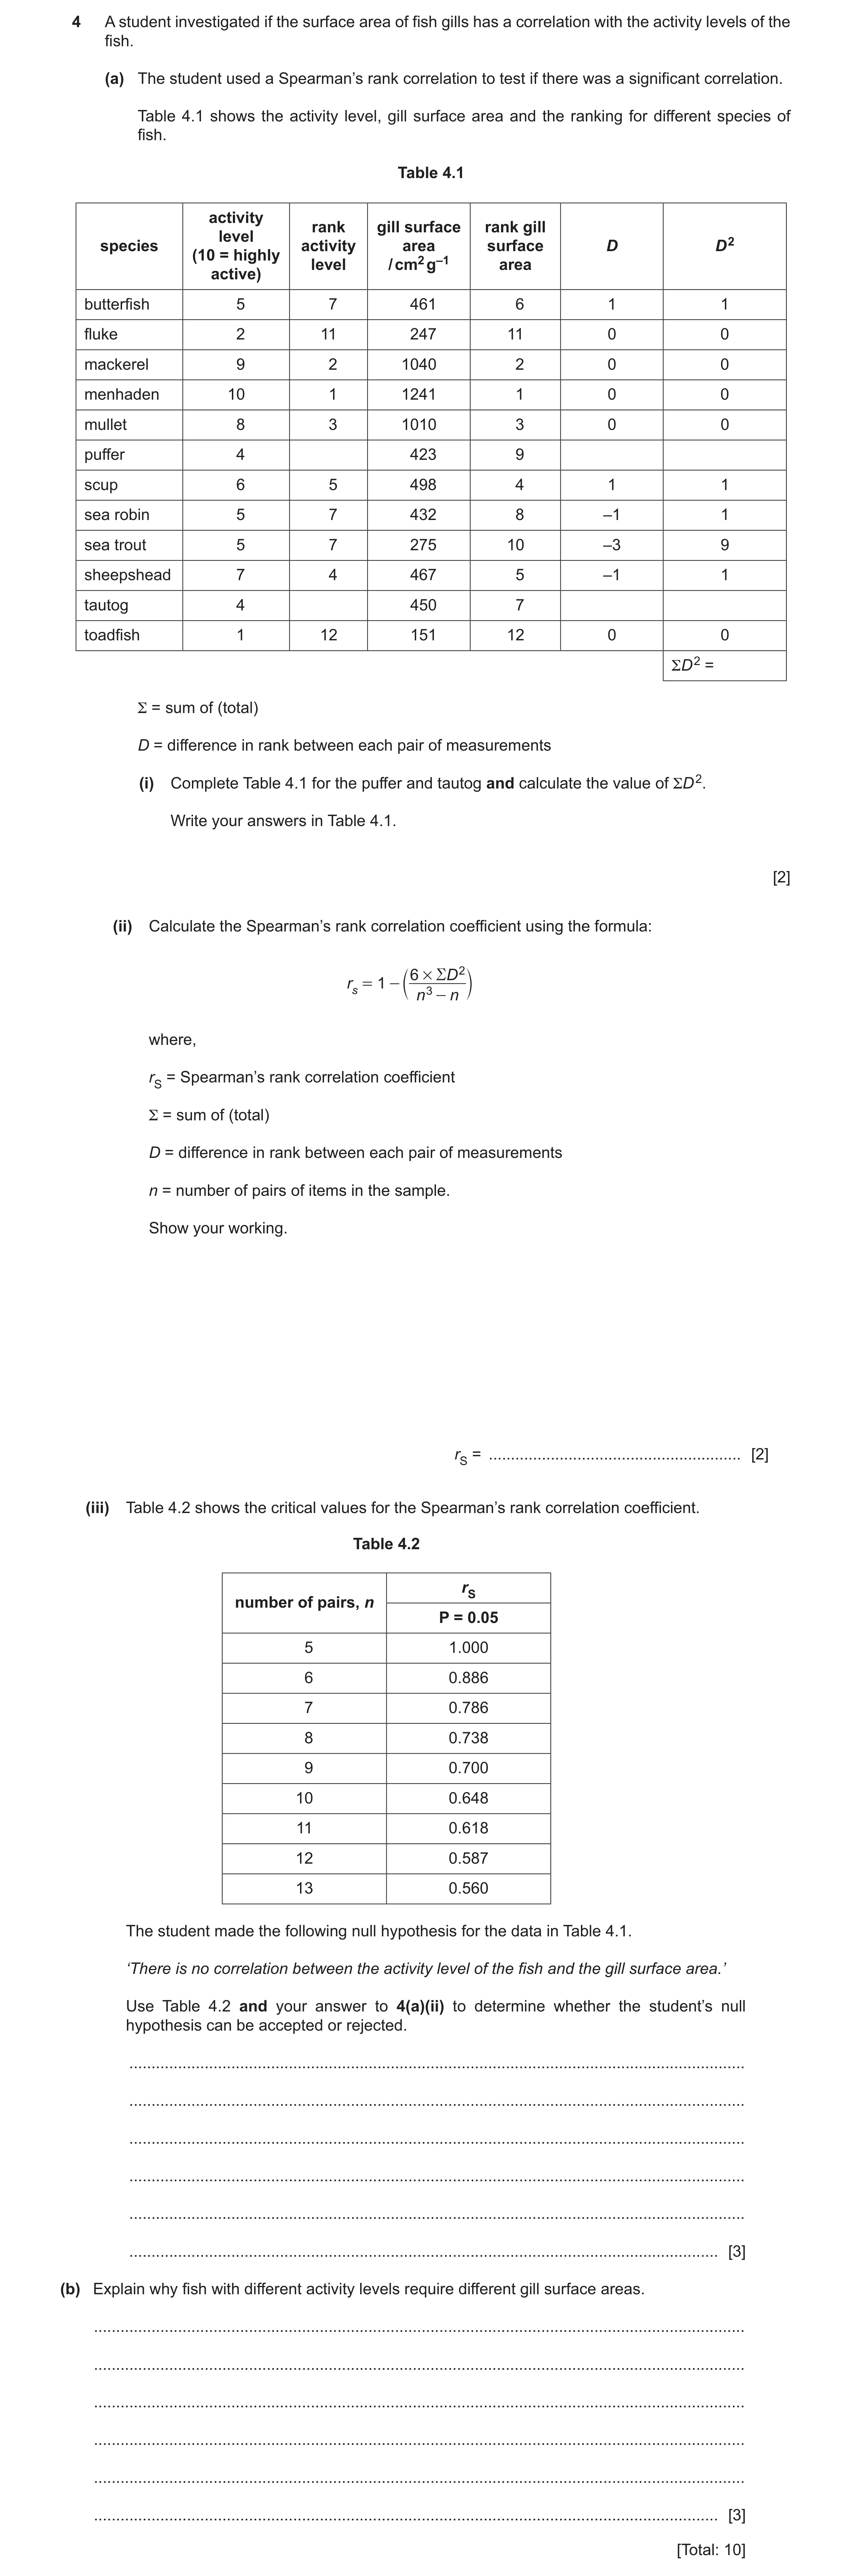
4 A student investigated if the surface area of fish gills has a correlation with the activity levels of the fish. (a) The student used a Spearman’s rank correlation to test if there was a significant correlation. Table 4.1 shows the activity level, gill surface area and the ranking for different species of fish. Table 4.1 activity rank gill surface rank gill level species activity area surface D D 2 (10 = highly level / cm2 g–1 area active) butterfish 5 7 461 6 1 1 fluke 2 11 247 11 0 0 mackerel 9 2 1040 2 0 0 menhaden 10 1 1241 1 0 0 mullet 8 3 1010 3 0 0 puffer 4 423 9 scup 6 5 498 4 1 1 sea robin 5 7 432 8 –1 1 sea trout 5 7 275 10 –3 9 sheepshead 7 4 467 5 –1 1 tautog 4 450 7 toadfish 1 12 151 12 0 0 ΣD 2 = Σ = sum of (total) D = difference in rank between each pair of measurements (i) Complete Table 4.1 for the puffer and tautog and calculate the value of ΣD 2. Write your answers in Table 4.1. [2] (ii) Calculate the Spearman’s rank correlation coefficient using the formula: 6 # R D 2 r = 1 - c m s n 3 - n where, rS = Spearman’s rank correlation coefficient Σ = sum of (total) D = difference in rank between each pair of measurements n = number of pairs of items in the sample. Show your working. rS = … [2] (iii) Table 4.2 shows the critical values for the Spearman’s rank correlation coefficient. Table 4.2 rS number of pairs, n P = 0.05 5 1.000 6 0.886 7 0.786 8 0.738 9 0.700 10 0.648 11 0.618 12 0.587 13 0.560 The student made the following null hypothesis for the data in Table 4.1. ‘There is no correlation between the activity level of the fish and the gill surface area.’ Use Table 4.2 and your answer to 4(a)(ii) to determine whether the student’s null hypothesis can be accepted or rejected. … … … … … … [3] (b) Explain why fish with different activity levels require different gill surface areas. … … … … … … [3] [Total: 10]
10 marks
Mark scheme: 4(a)(i) 2 species activity level rank activity gill surface rank gill D D2 (10 = highly level area / cm2 g–1 surface area active) butterfish 5 7 461 6 1 1 fluke 2 11 247 11 0 0 mackerel 9 2 1040 2 0 0 menhaden 10 1 1241 1 0 0 mullet 8 3 1010 3 0 0 puffer 4 9.5 423 9 0.5 0.25 scup 6 5 498 4 1 1 sea Robin 5 7 432 8 –1 1 sea Trout 5 7 275 10 –3 9 sheepshead 7 4 467 5 –1 1 tautog 4 9.5 450 7 2.5 6.25 ; toadfish 1 12 151 12 0 0 19.5 ; 4(a)(ii) 0.93(1818181818181818….) (2 marks) ;; 2 one mark for 1716 OR (123 – 12) OR 12(122 – 1) OR 12(144 – 1) OR 12(143) OR (1728 – 12) OR 0.068(….) in working 4(a)(iii) any 3 from: 3 1 the calculated value is greater than the critical value ; 2 of 0.587 ; 3 so the null hypothesis is rejected ; 4 there is a significant positive correlation ; 5 probability of less than 0.05, that the correlation is due to chance ; NOTE: If no calculated value, then only mp2 awarded for recognition of 0.587 4(b) any 3 from: 3 1 more active fish require a larger (gill) surface area / ORA / AW ; 2 for fast diffusion of oxygen (into blood) / AW ; 3 for fast diffusion of carbon dioxide (out) / AW ; 4 (more) (aerobic) respiration ; 5 produce ATP / release energy, for muscle contraction ;
This question in 9693/41 May/June 2025
Q10 · A photograph of a sea trout 9693/42 May/June 2025
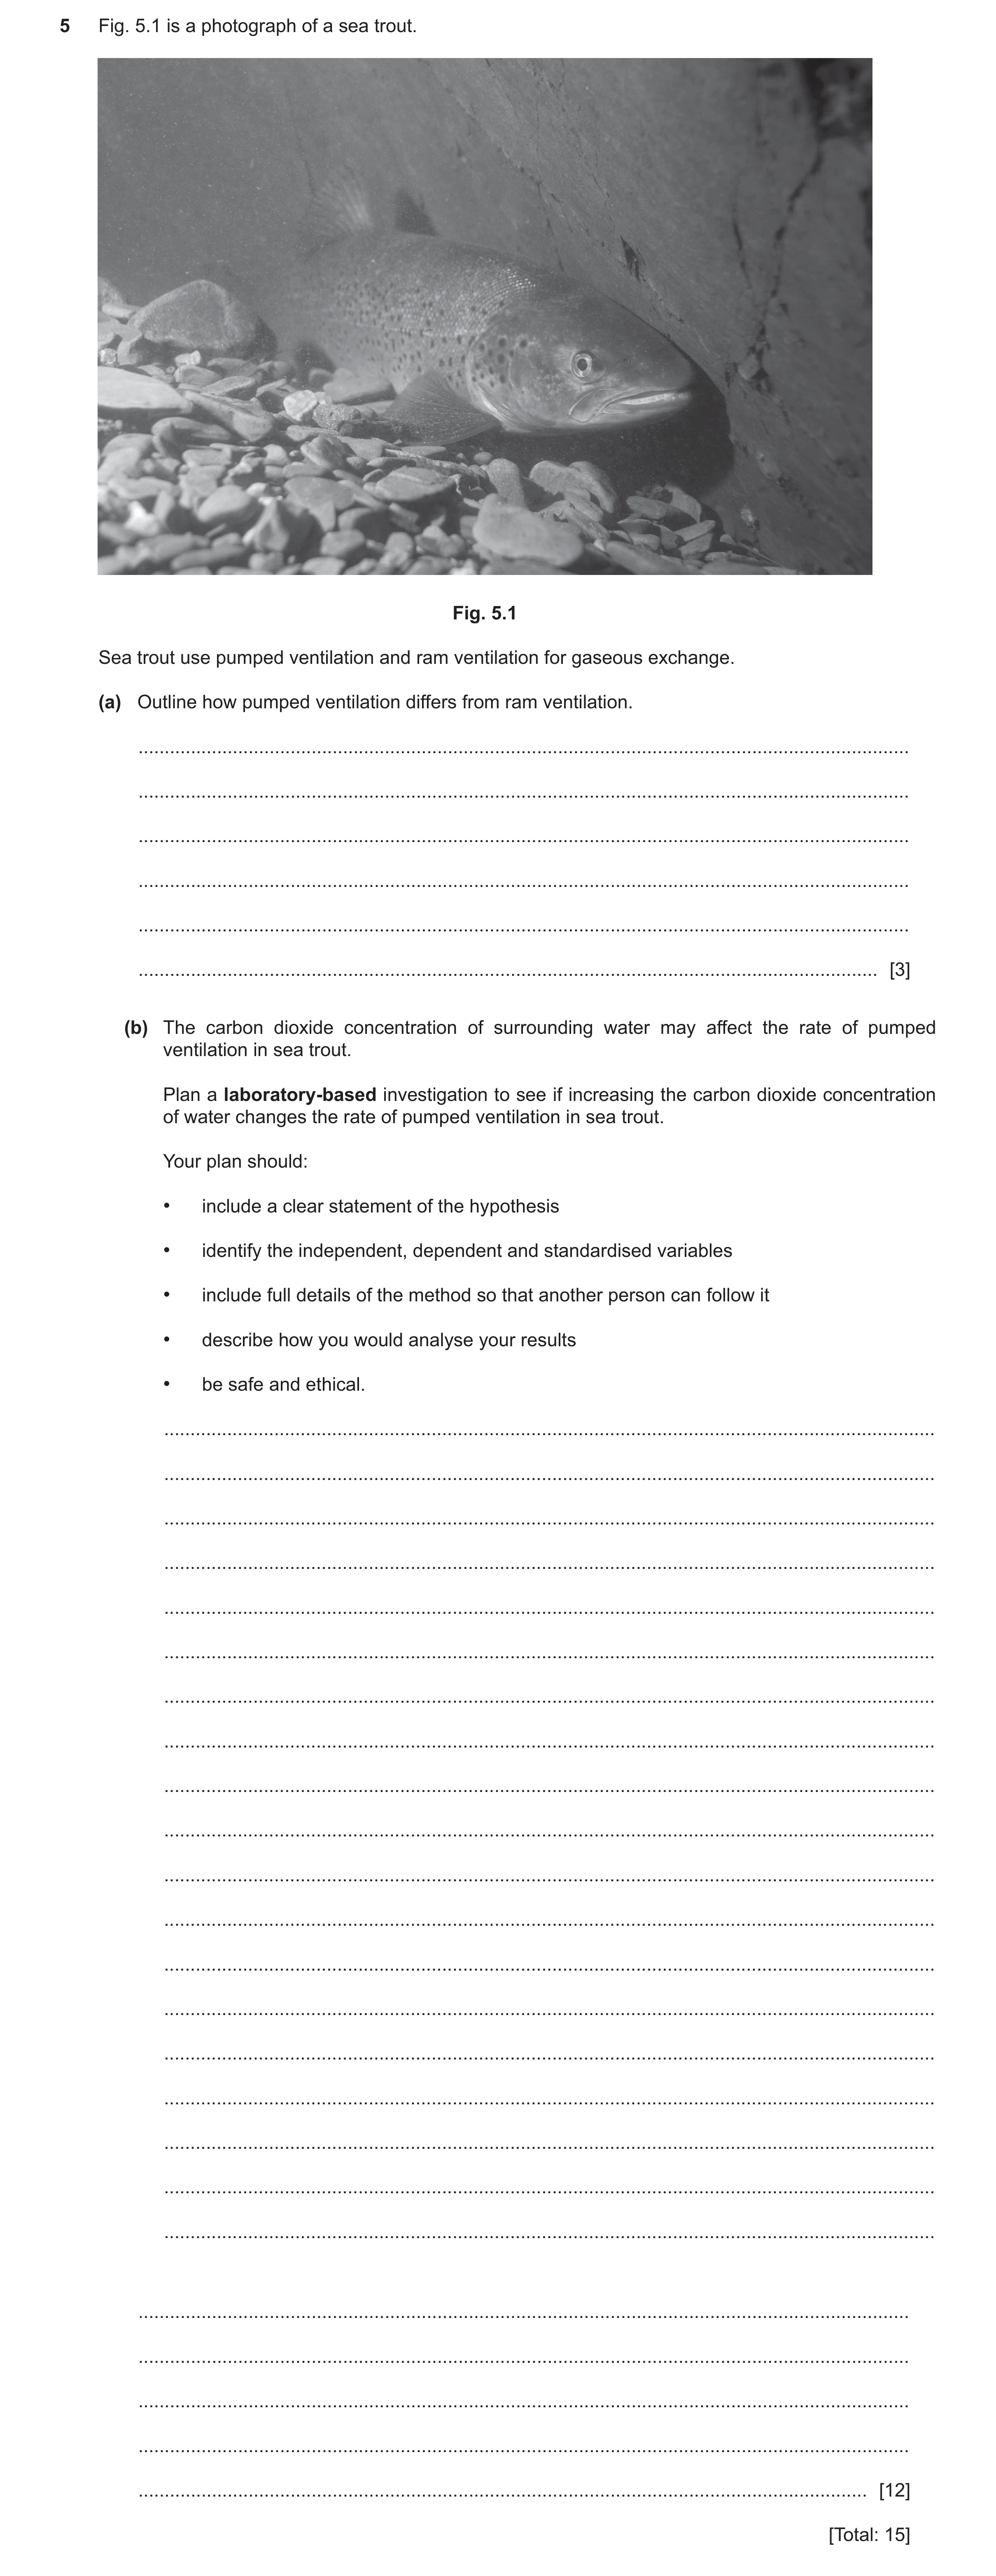
5 Fig. 5.1 is a photograph of a sea trout. Fig. 5.1 Sea trout use pumped ventilation and ram ventilation for gaseous exchange. (a) Outline how pumped ventilation differs from ram ventilation. … … … … … … [3] (b) The carbon dioxide concentration of surrounding water may affect the rate of pumped ventilation in sea trout. Plan a laboratory-based investigation to see if increasing the carbon dioxide concentration of water changes the rate of pumped ventilation in sea trout. Your plan should: • include a clear statement of the hypothesis • identify the independent, dependent and standardised variables • include full details of the method so that another person can follow it • describe how you would analyse your results • be safe and ethical. … … … … … … … … … … … … … … … … … … … … … … … … [12] [Total: 15]
15 marks
Mark scheme: 5(a) any 3 of: 3 1 in pumped ventilation mouth opens and closes / buccal cavity opens and closes / ORA ; 2 in pumped ventilation operculum opens and closes / ORA ; 3 pumped ventilation can be used when fish not moving / is not continuous / ORA ; 4 pumped ventilation, requires more energy / is an active process / ORA ; 5 pumped ventilation requires more muscle contractions / ORA ; 5(b) hypothesis (h): 12 • changing concentration of carbon dioxide affects the rate of ventilation / carbon dioxide content affects rate of ventilation / AW ; and 11 from: independent variable (i): • carbon dioxide concentration / different concentrations of sodium hydrogen carbonate / AW ; • minimum of five concentrations / AW ; dependent variable (d): • rate of ventilation / number of times fish opens mouth / operculum / AW ; • count opening / closing, in stated time period ; standardised variables (c): MAX 3 of: • species of fish / sex of fish / age / mass of fish ; • (frequency of) feeding ; • temperature of water ; • (starting) pH of water ; • volume of water / tank ; • salinity / stated salinity ; • speed of current / water flow ; • light intensity ; • oxygen concentration (of water) ; 5(b) experimental details (m): MAX 3 of • method for maintaining temperature, e.g. thermostatically controlled water bath / heat lamp ; • use of, serial / proportional dilutions, e.g. use of pipettes ; • use of buffer solutions ; • use of oxygenator / bubbler / AW ; • use of sodium hydrogen carbonate / bubbling carbon dioxide gas into water / AW ; • allowing fish to equilibrate to different concentrations / AW ; safety / ethics (e): • relevant precaution and reason / AW ; • ethical statement / AW ; analysis (a): MAX 3 of: • example of table for results ; • detail about graph to be plotted ; • repeat at least twice / replicates and calculating means / median ; • use of a correct statistical test and reason ;
This question in 9693/42 May/June 2025
Q11 · A photograph of a sea trout 9693/43 May/June 2025
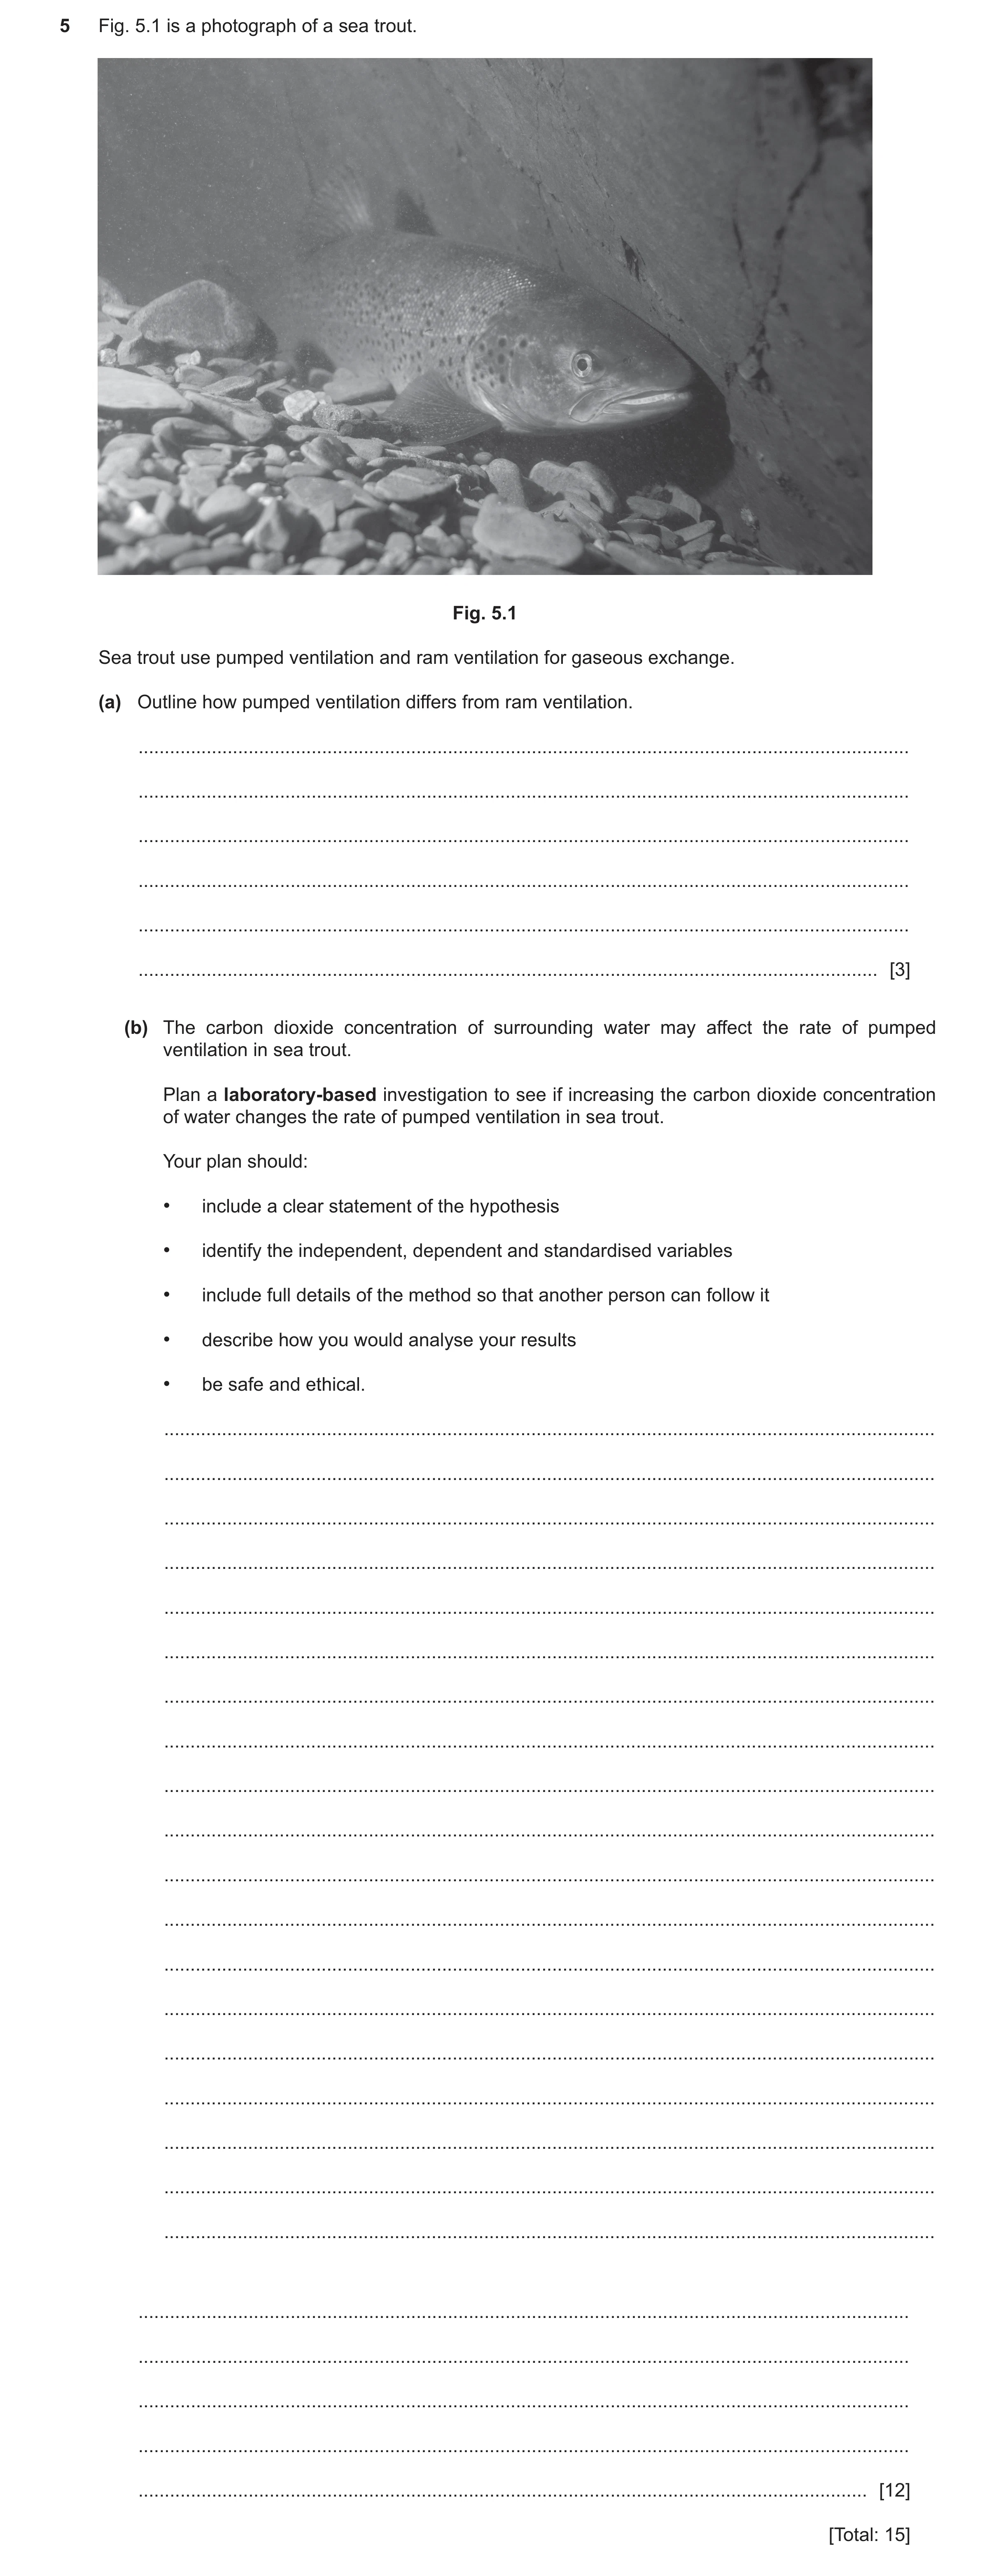
5 Fig. 5.1 is a photograph of a sea trout. Fig. 5.1 Sea trout use pumped ventilation and ram ventilation for gaseous exchange. (a) Outline how pumped ventilation differs from ram ventilation. … … … … … … [3] (b) The carbon dioxide concentration of surrounding water may affect the rate of pumped ventilation in sea trout. Plan a laboratory-based investigation to see if increasing the carbon dioxide concentration of water changes the rate of pumped ventilation in sea trout. Your plan should: • include a clear statement of the hypothesis • identify the independent, dependent and standardised variables • include full details of the method so that another person can follow it • describe how you would analyse your results • be safe and ethical. … … … … … … … … … … … … … … … … … … … … … … … … [12] [Total: 15]
15 marks
Mark scheme: 5(a) any 3 of: 3 1 in pumped ventilation mouth opens and closes / buccal cavity opens and closes / ORA ; 2 in pumped ventilation operculum opens and closes / ORA ; 3 pumped ventilation can be used when fish not moving / is not continuous / ORA ; 4 pumped ventilation, requires more energy / is an active process / ORA ; 5 pumped ventilation requires more muscle contractions / ORA ; 5(b) hypothesis (h): 12 • changing concentration of carbon dioxide affects the rate of ventilation / carbon dioxide content affects rate of ventilation / AW ; and 11 from: independent variable (i): • carbon dioxide concentration / different concentrations of sodium hydrogen carbonate / AW ; • minimum of five concentrations / AW ; dependent variable (d): • rate of ventilation / number of times fish opens mouth / operculum / AW ; • count opening / closing, in stated time period ; standardised variables (c): MAX 3 of: • species of fish / sex of fish / age / mass of fish ; • (frequency of) feeding ; • temperature of water ; • (starting) pH of water ; • volume of water / tank ; • salinity / stated salinity ; • speed of current / water flow ; • light intensity ; • oxygen concentration (of water) ; 5(b) experimental details (m): MAX 3 of • method for maintaining temperature, e.g. thermostatically controlled water bath / heat lamp ; • use of, serial / proportional dilutions, e.g. use of pipettes ; • use of buffer solutions ; • use of oxygenator / bubbler / AW ; • use of sodium hydrogen carbonate / bubbling carbon dioxide gas into water / AW ; • allowing fish to equilibrate to different concentrations / AW ; safety / ethics (e): • relevant precaution and reason / AW ; • ethical statement / AW ; analysis (a): MAX 3 of: • example of table for results ; • detail about graph to be plotted ; • repeat at least twice / replicates and calculating means / median ; • use of a correct statistical test and reason ;
This question in 9693/43 May/June 2025
 15
15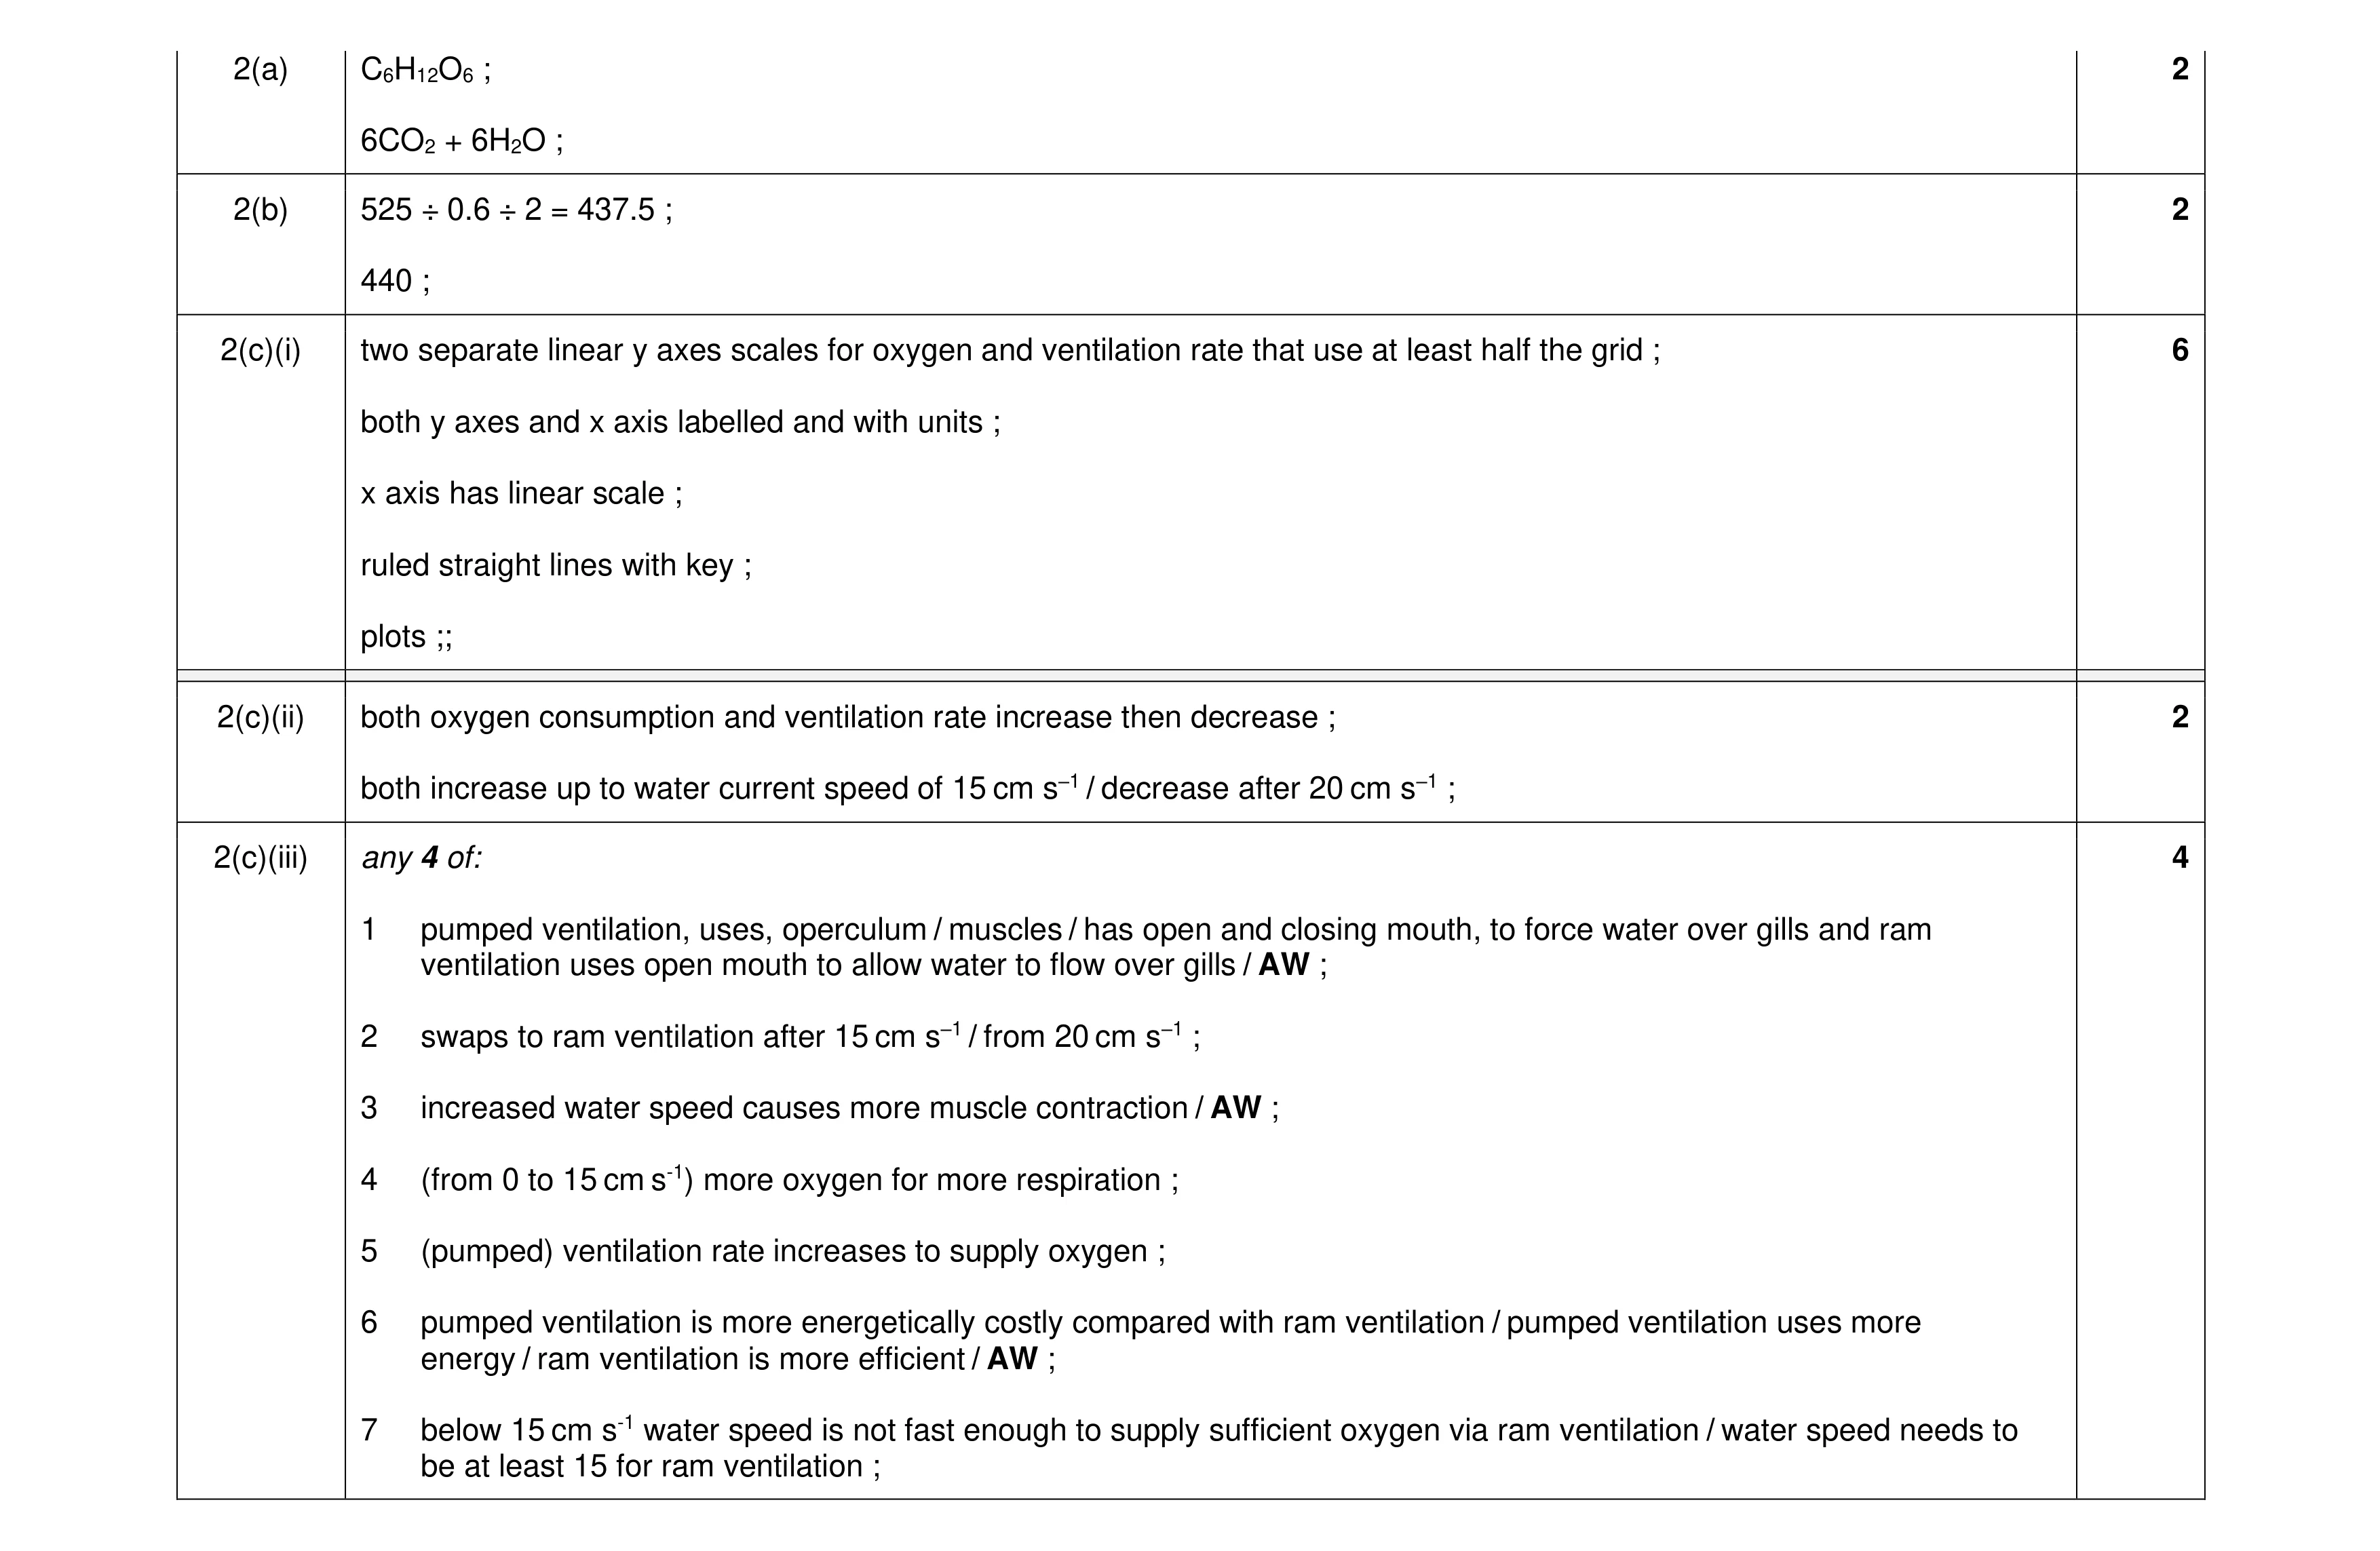 16
16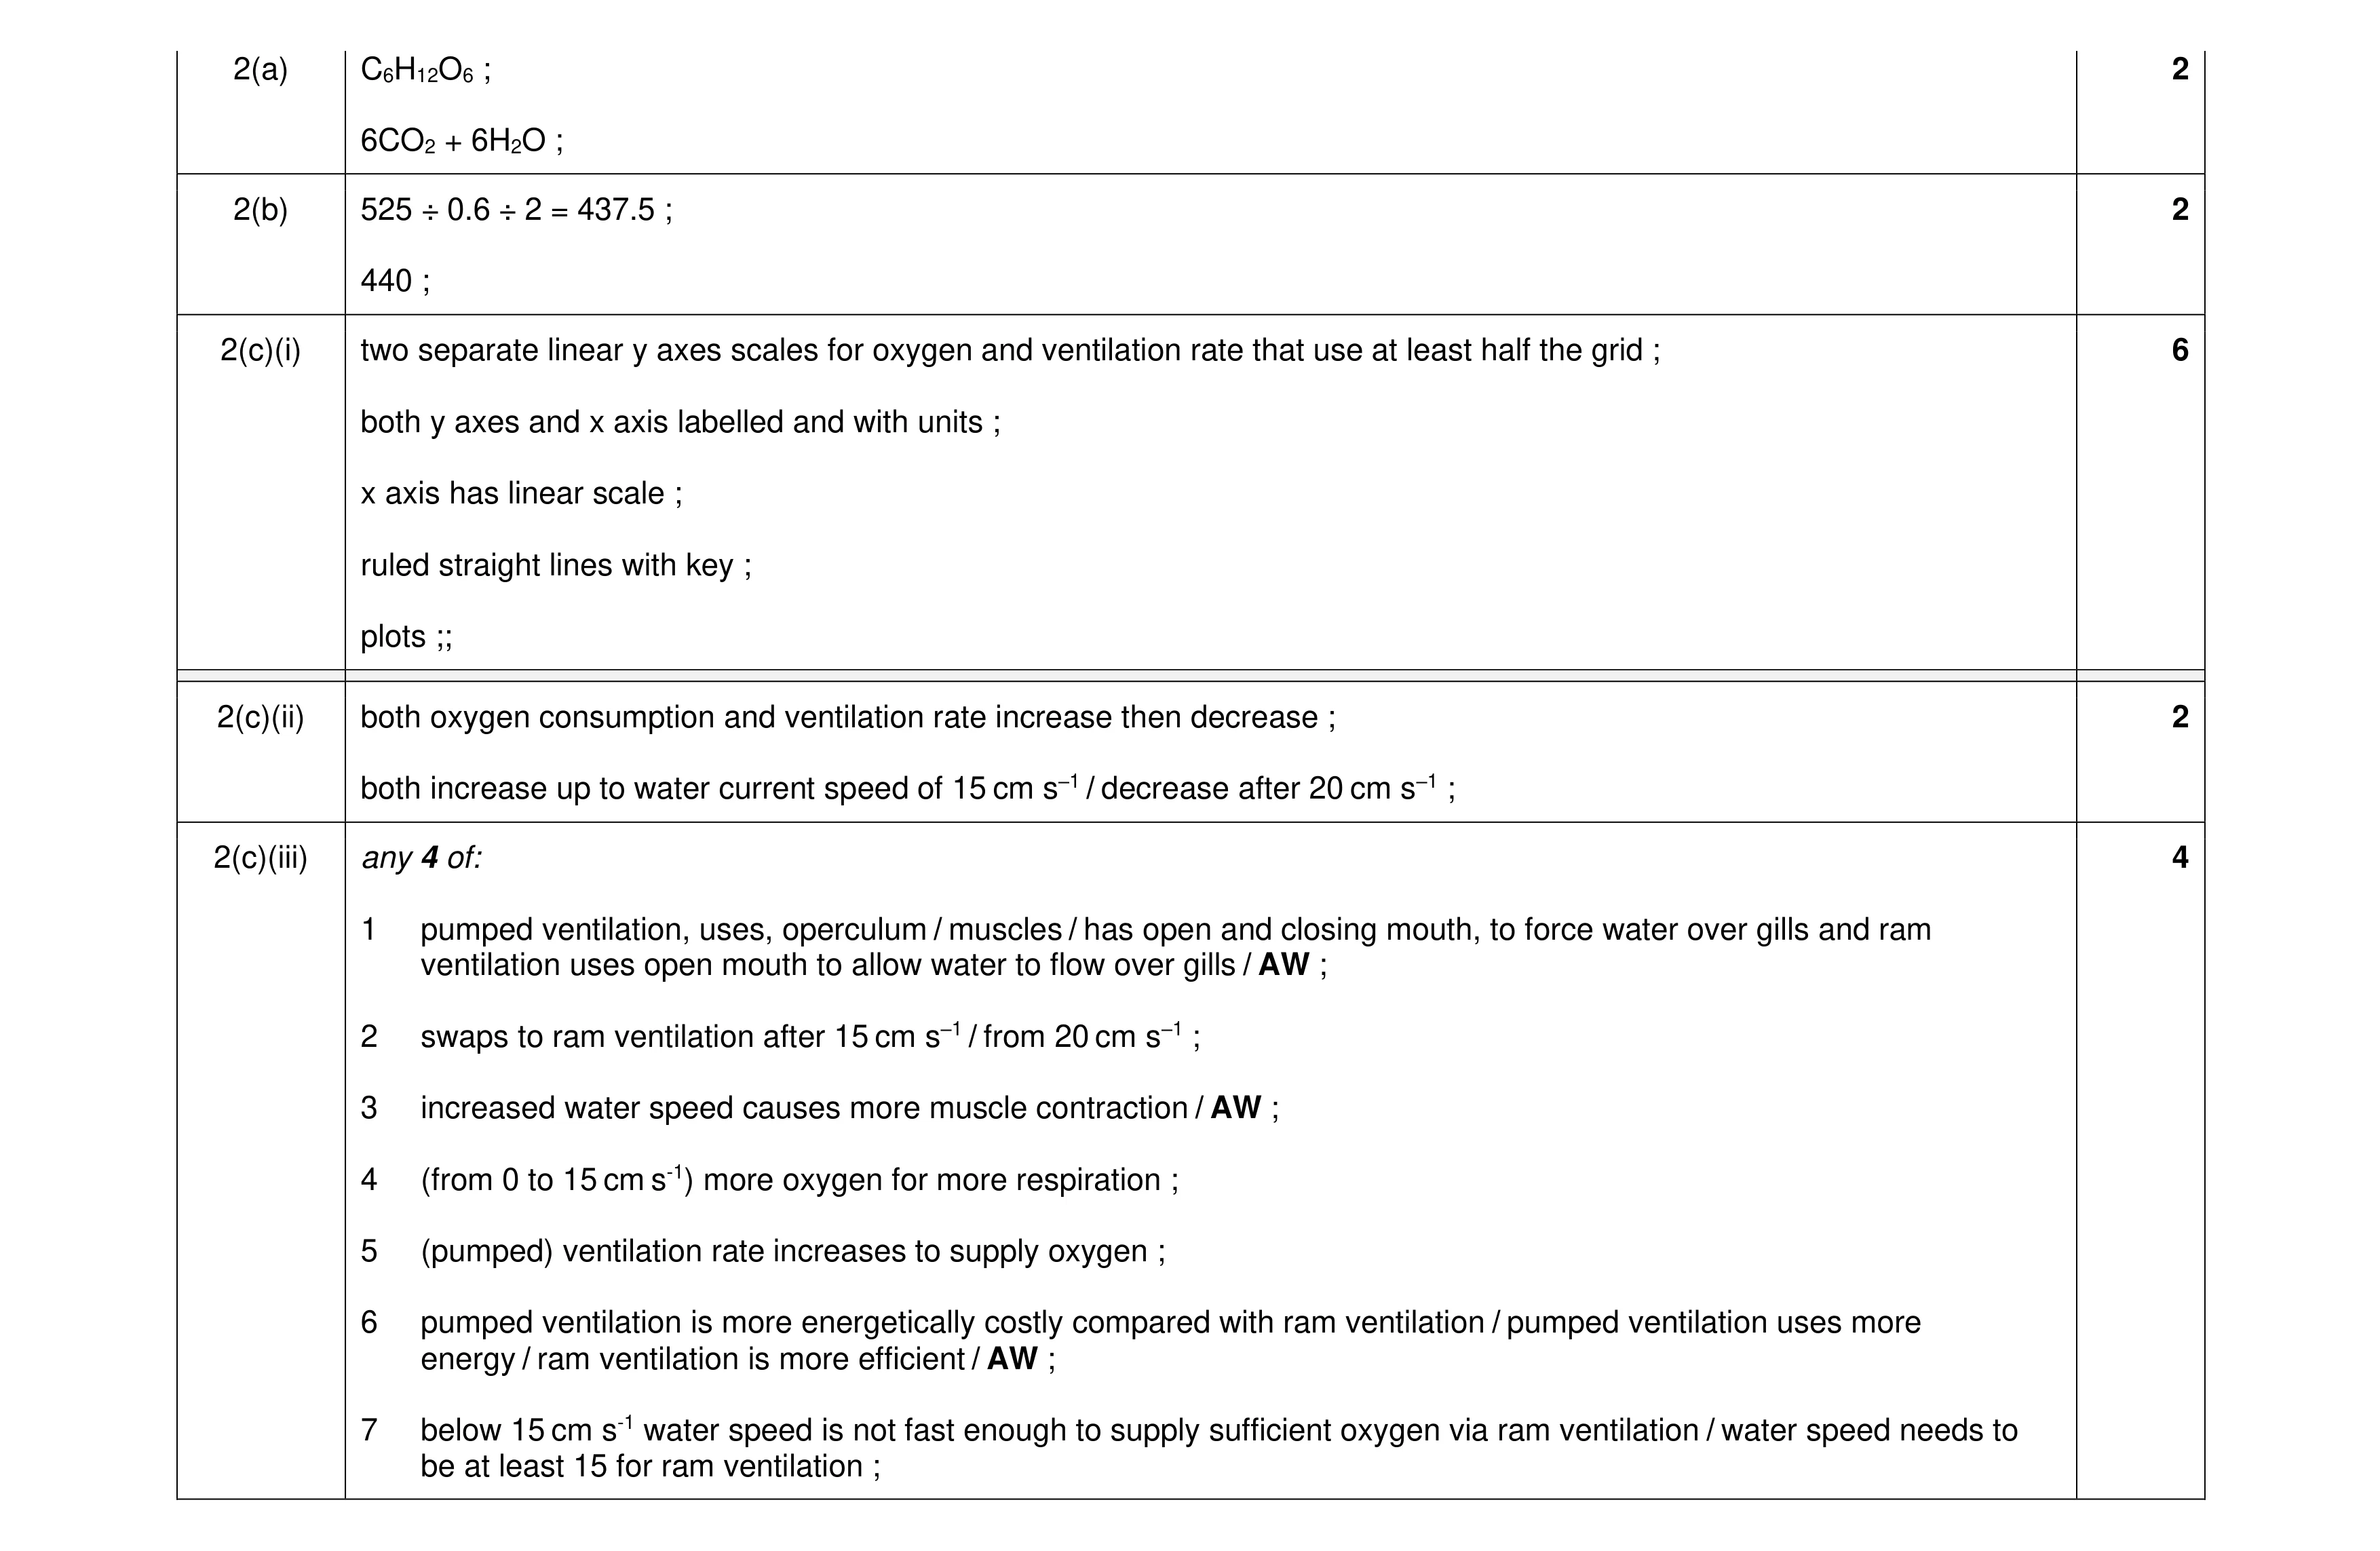 16
16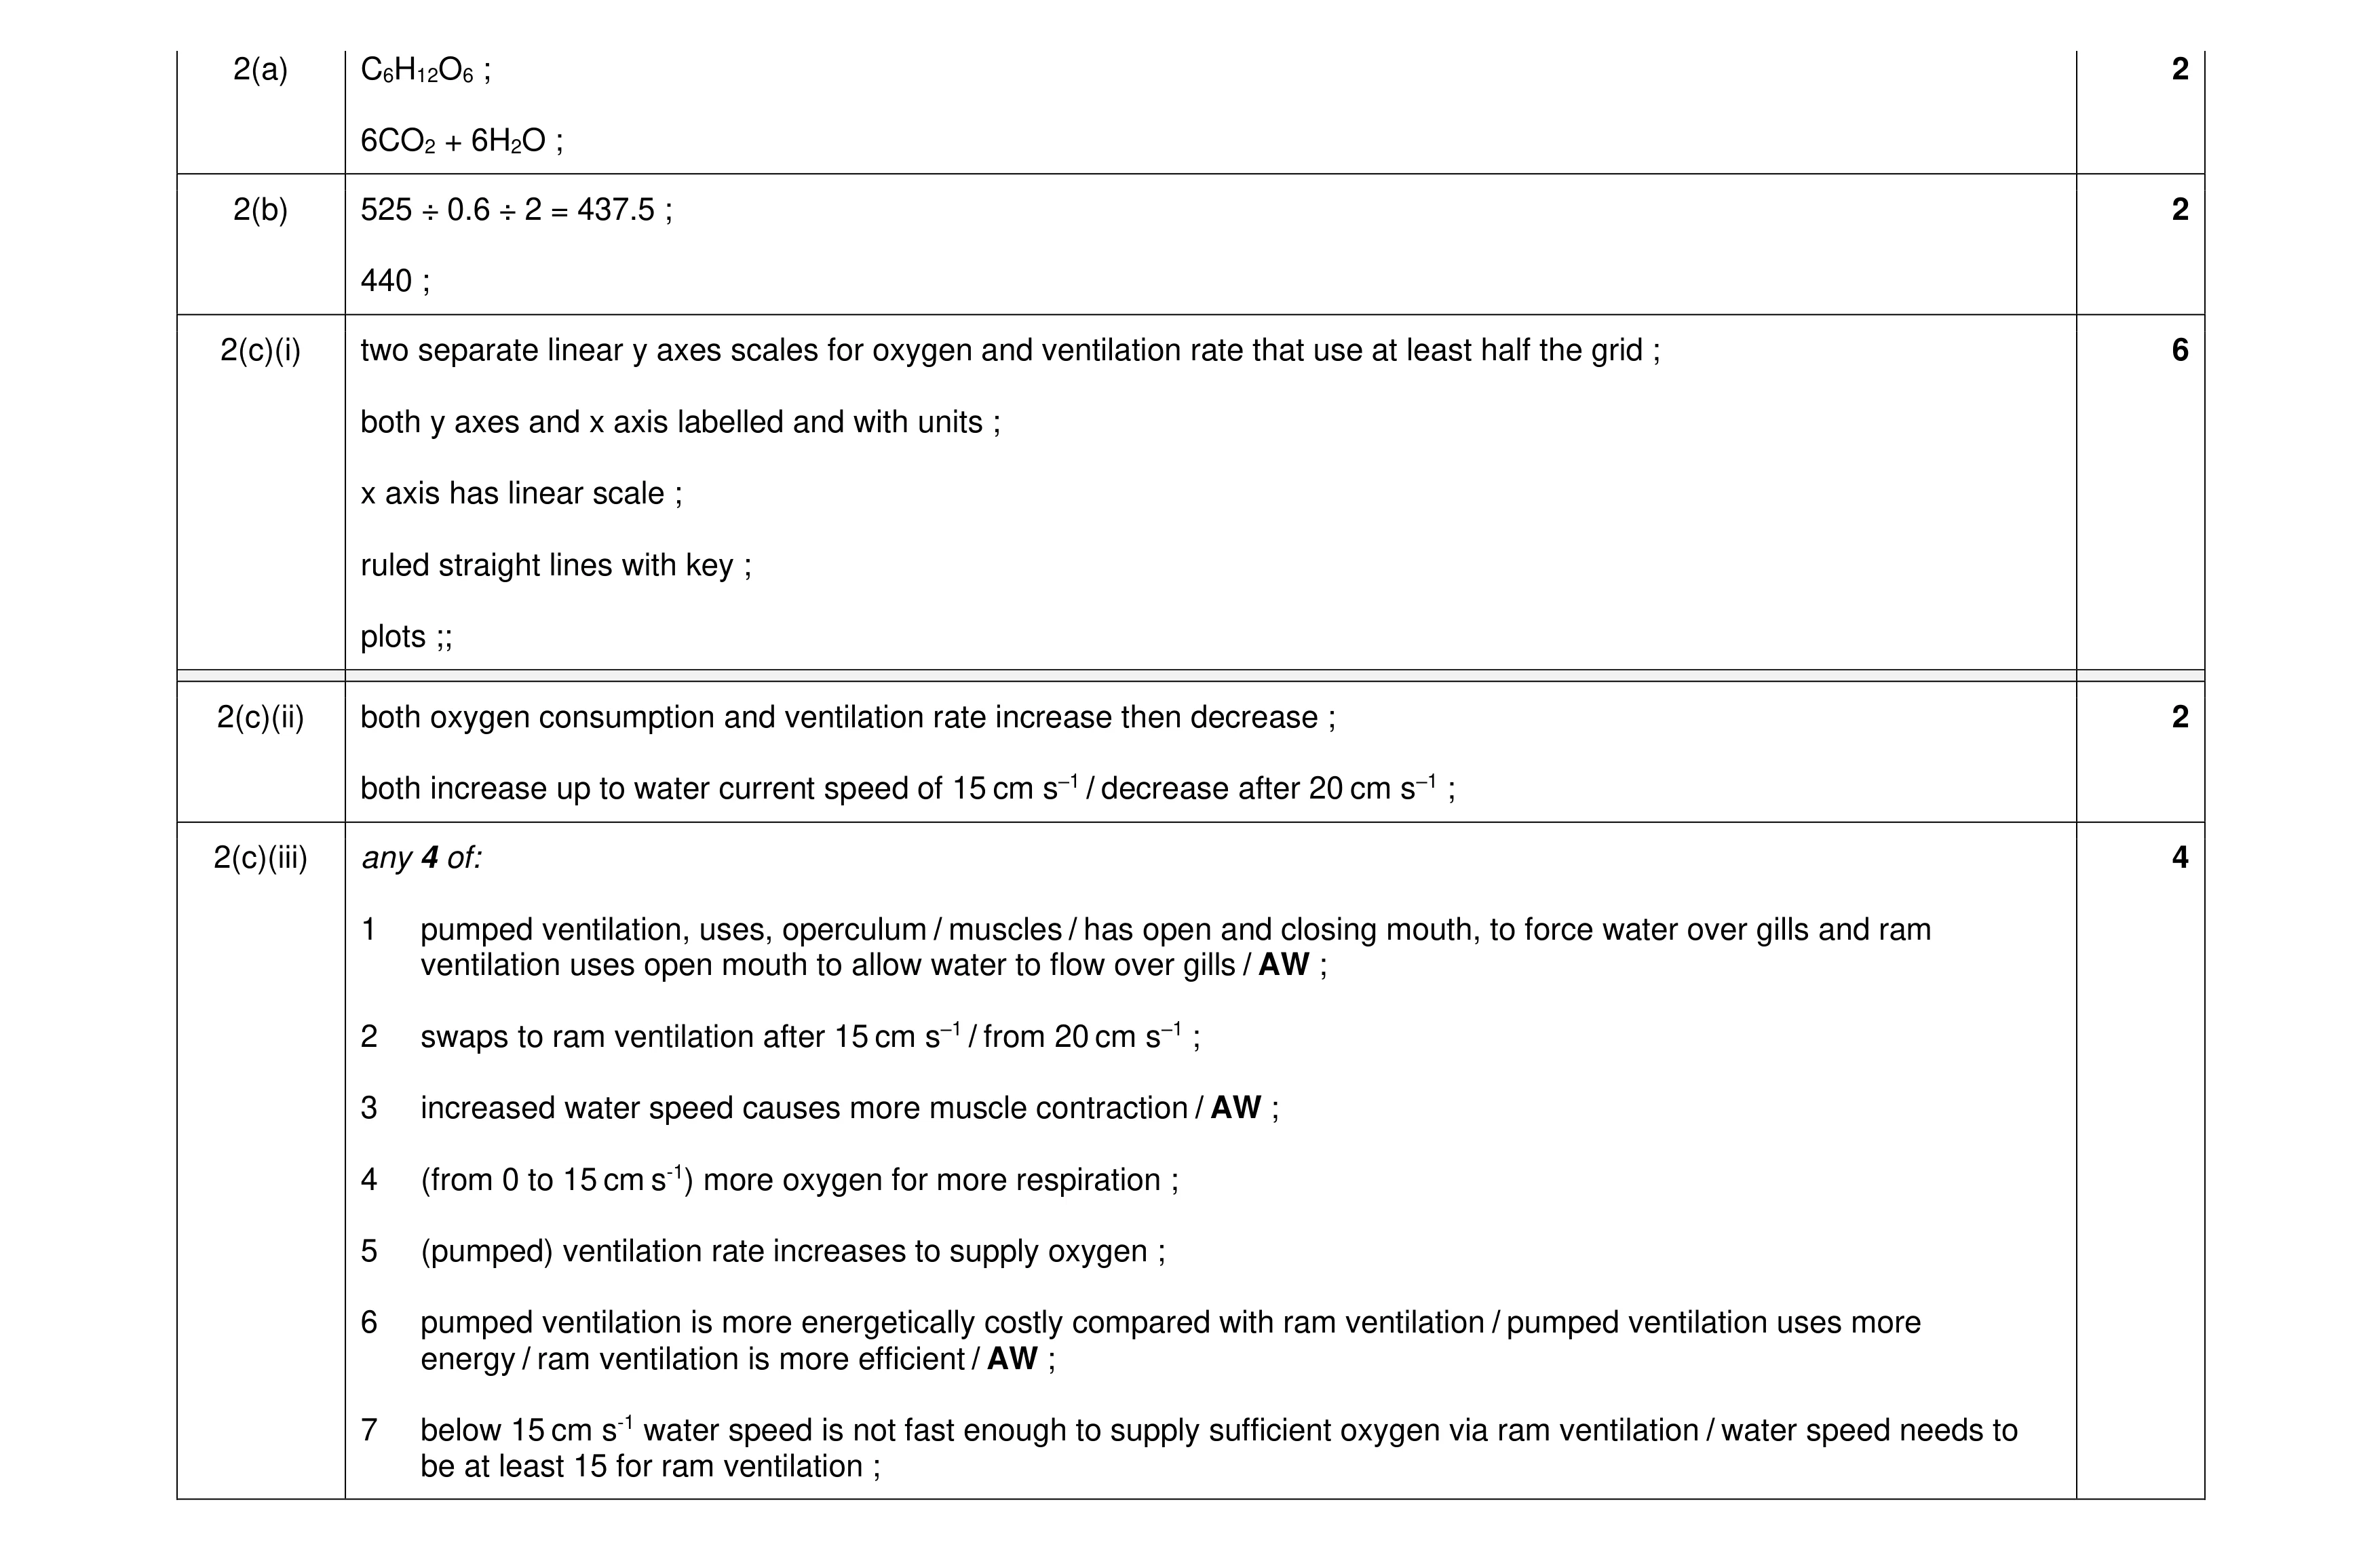 16
16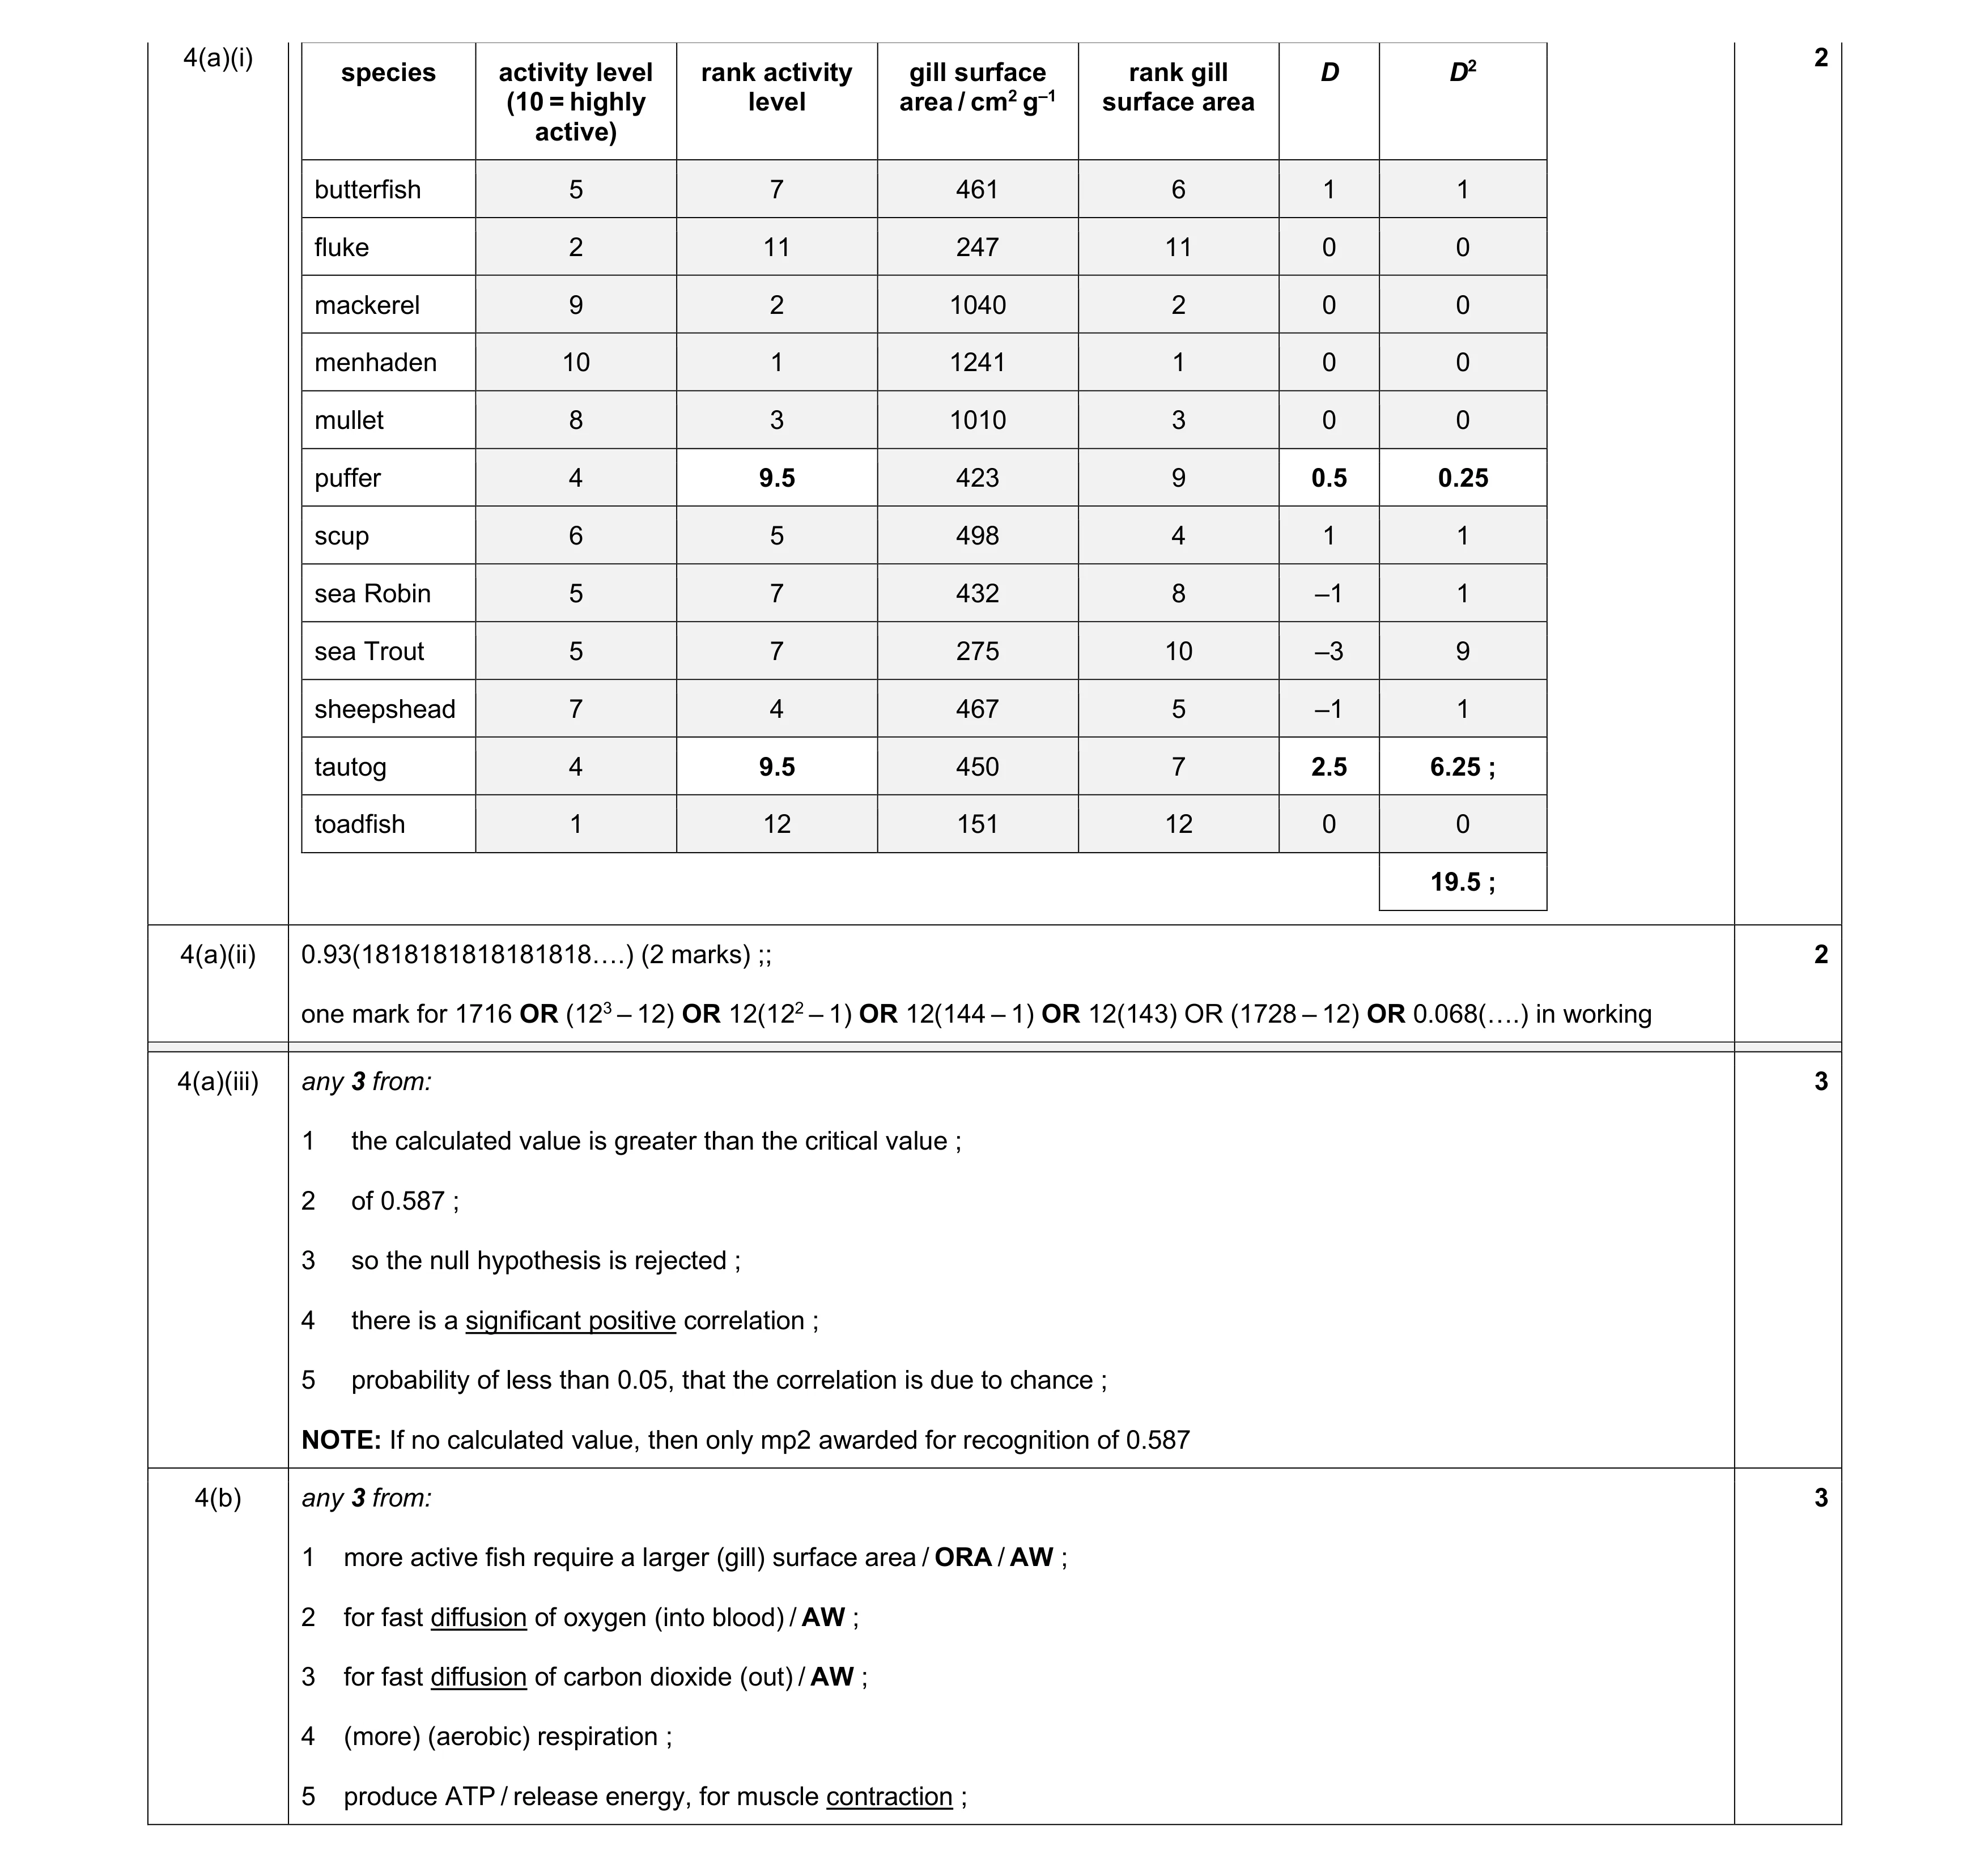 10
10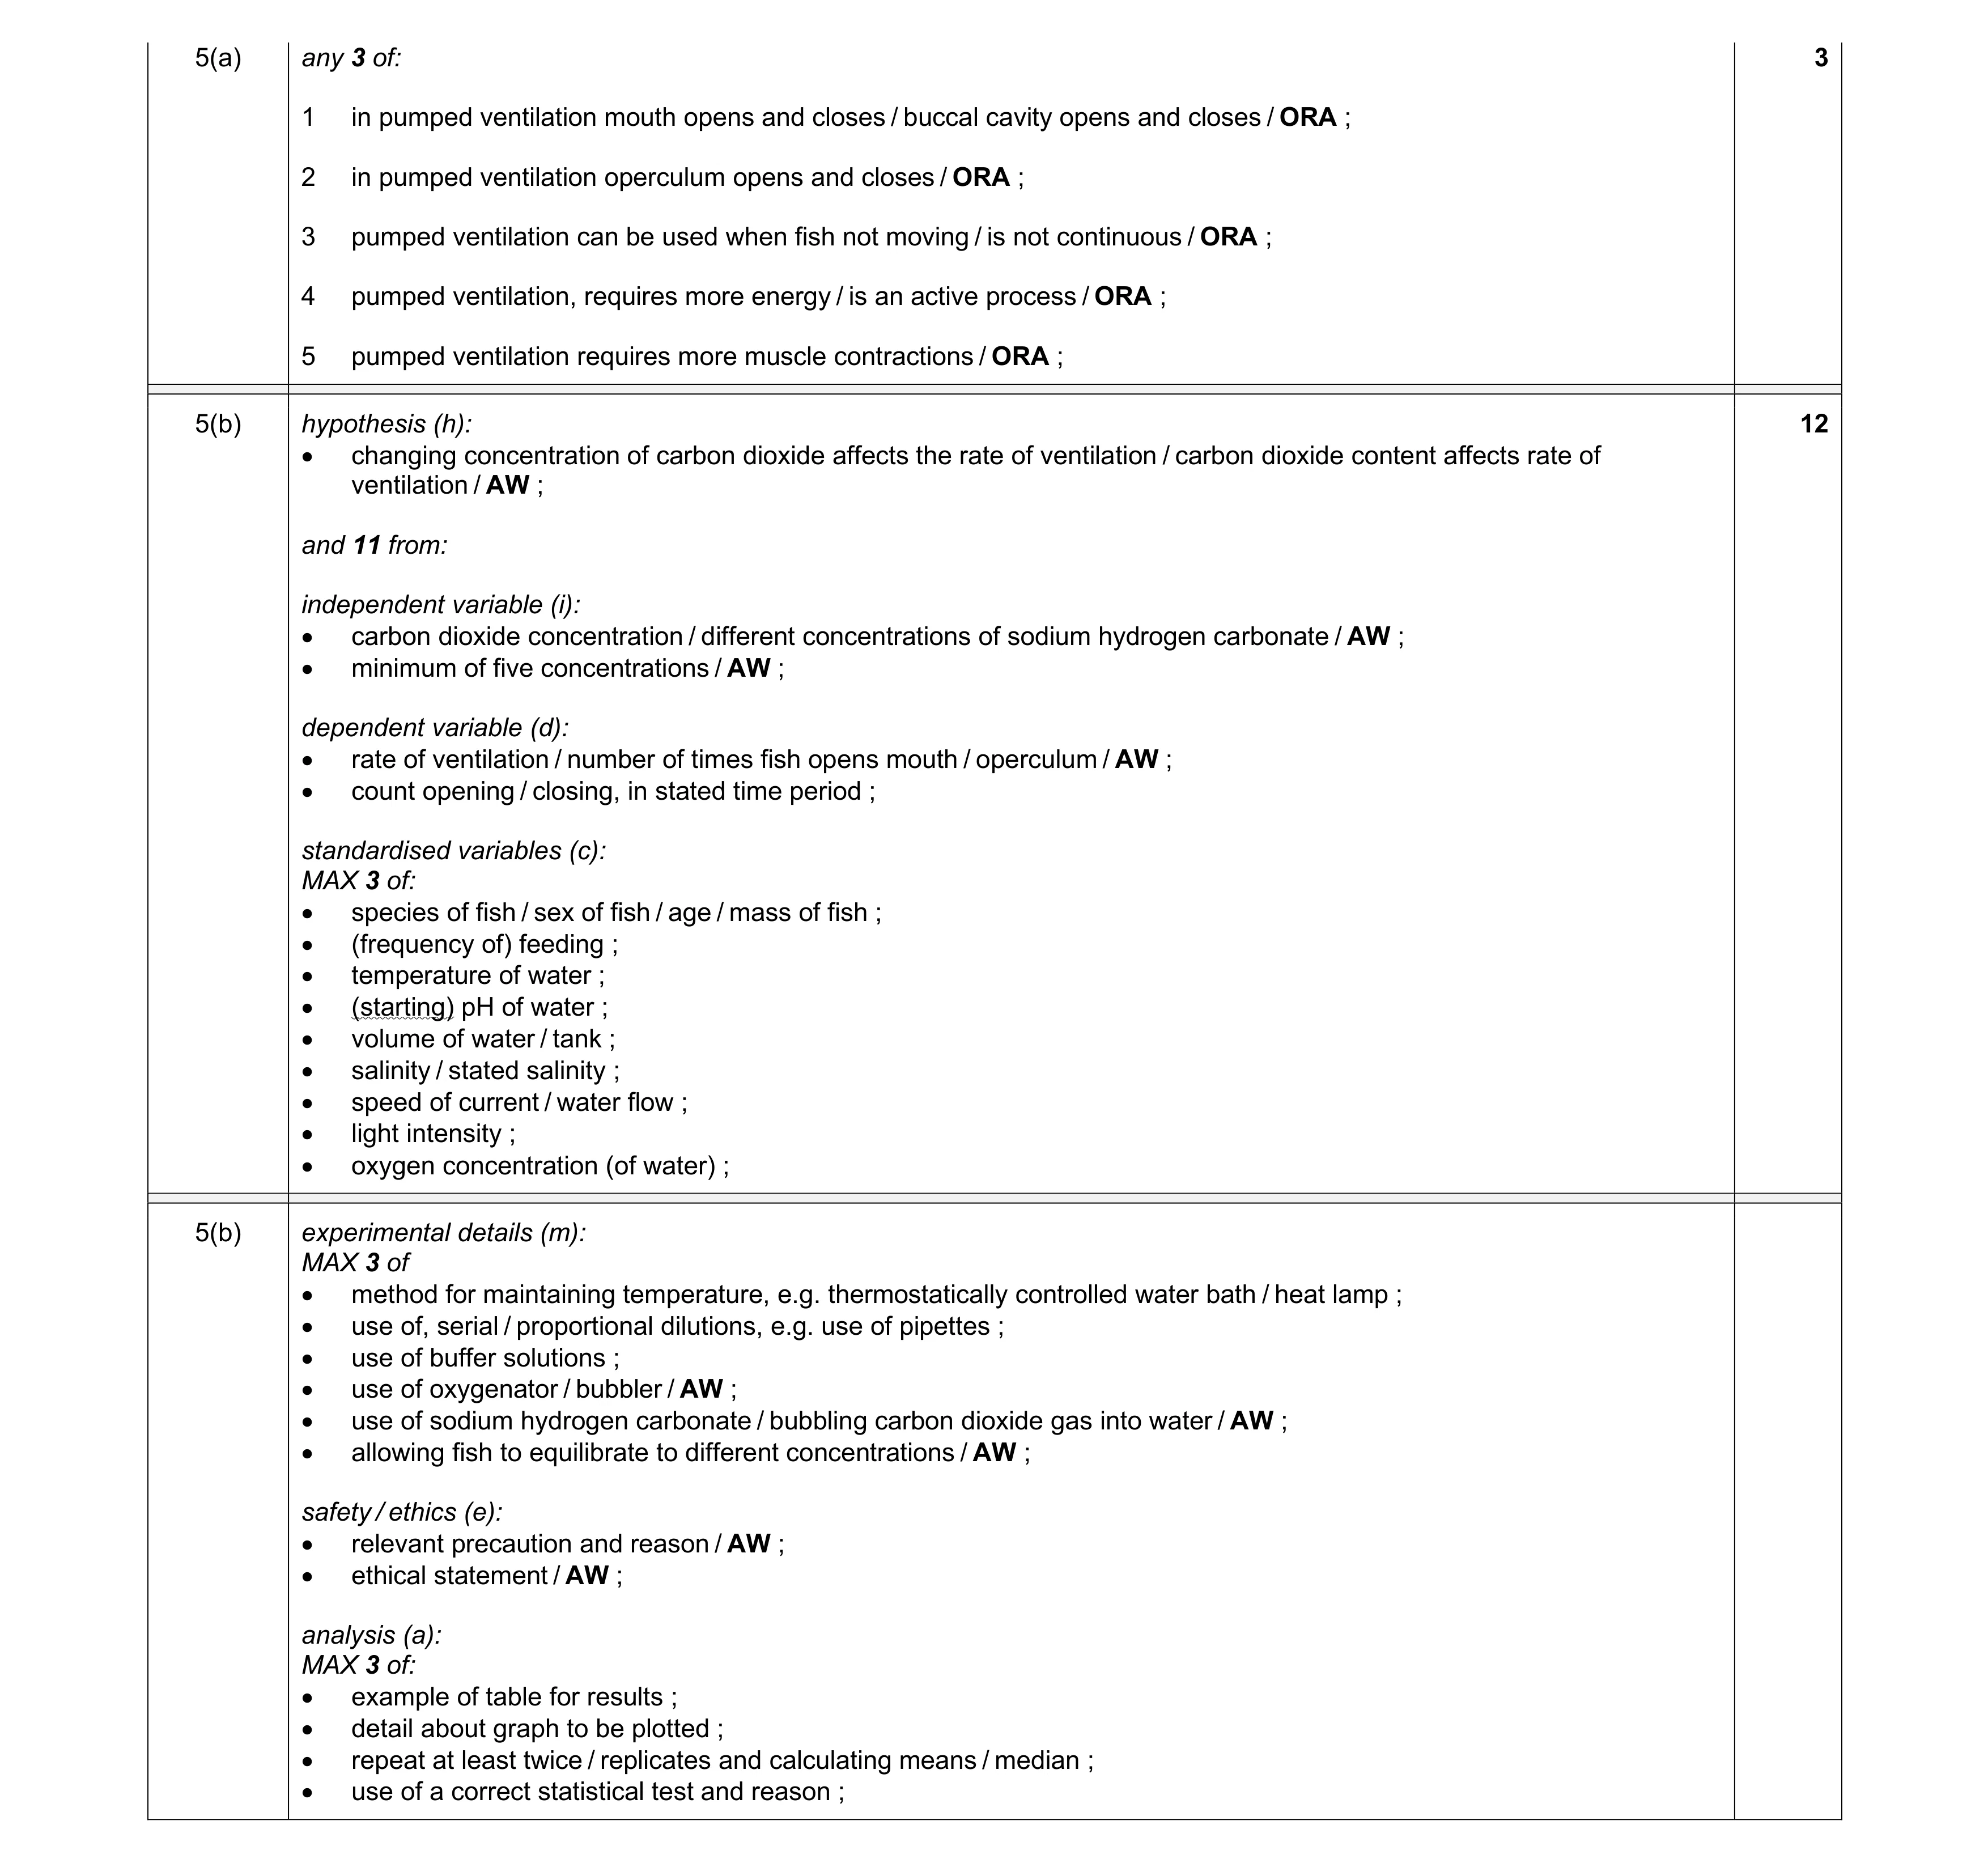 15
15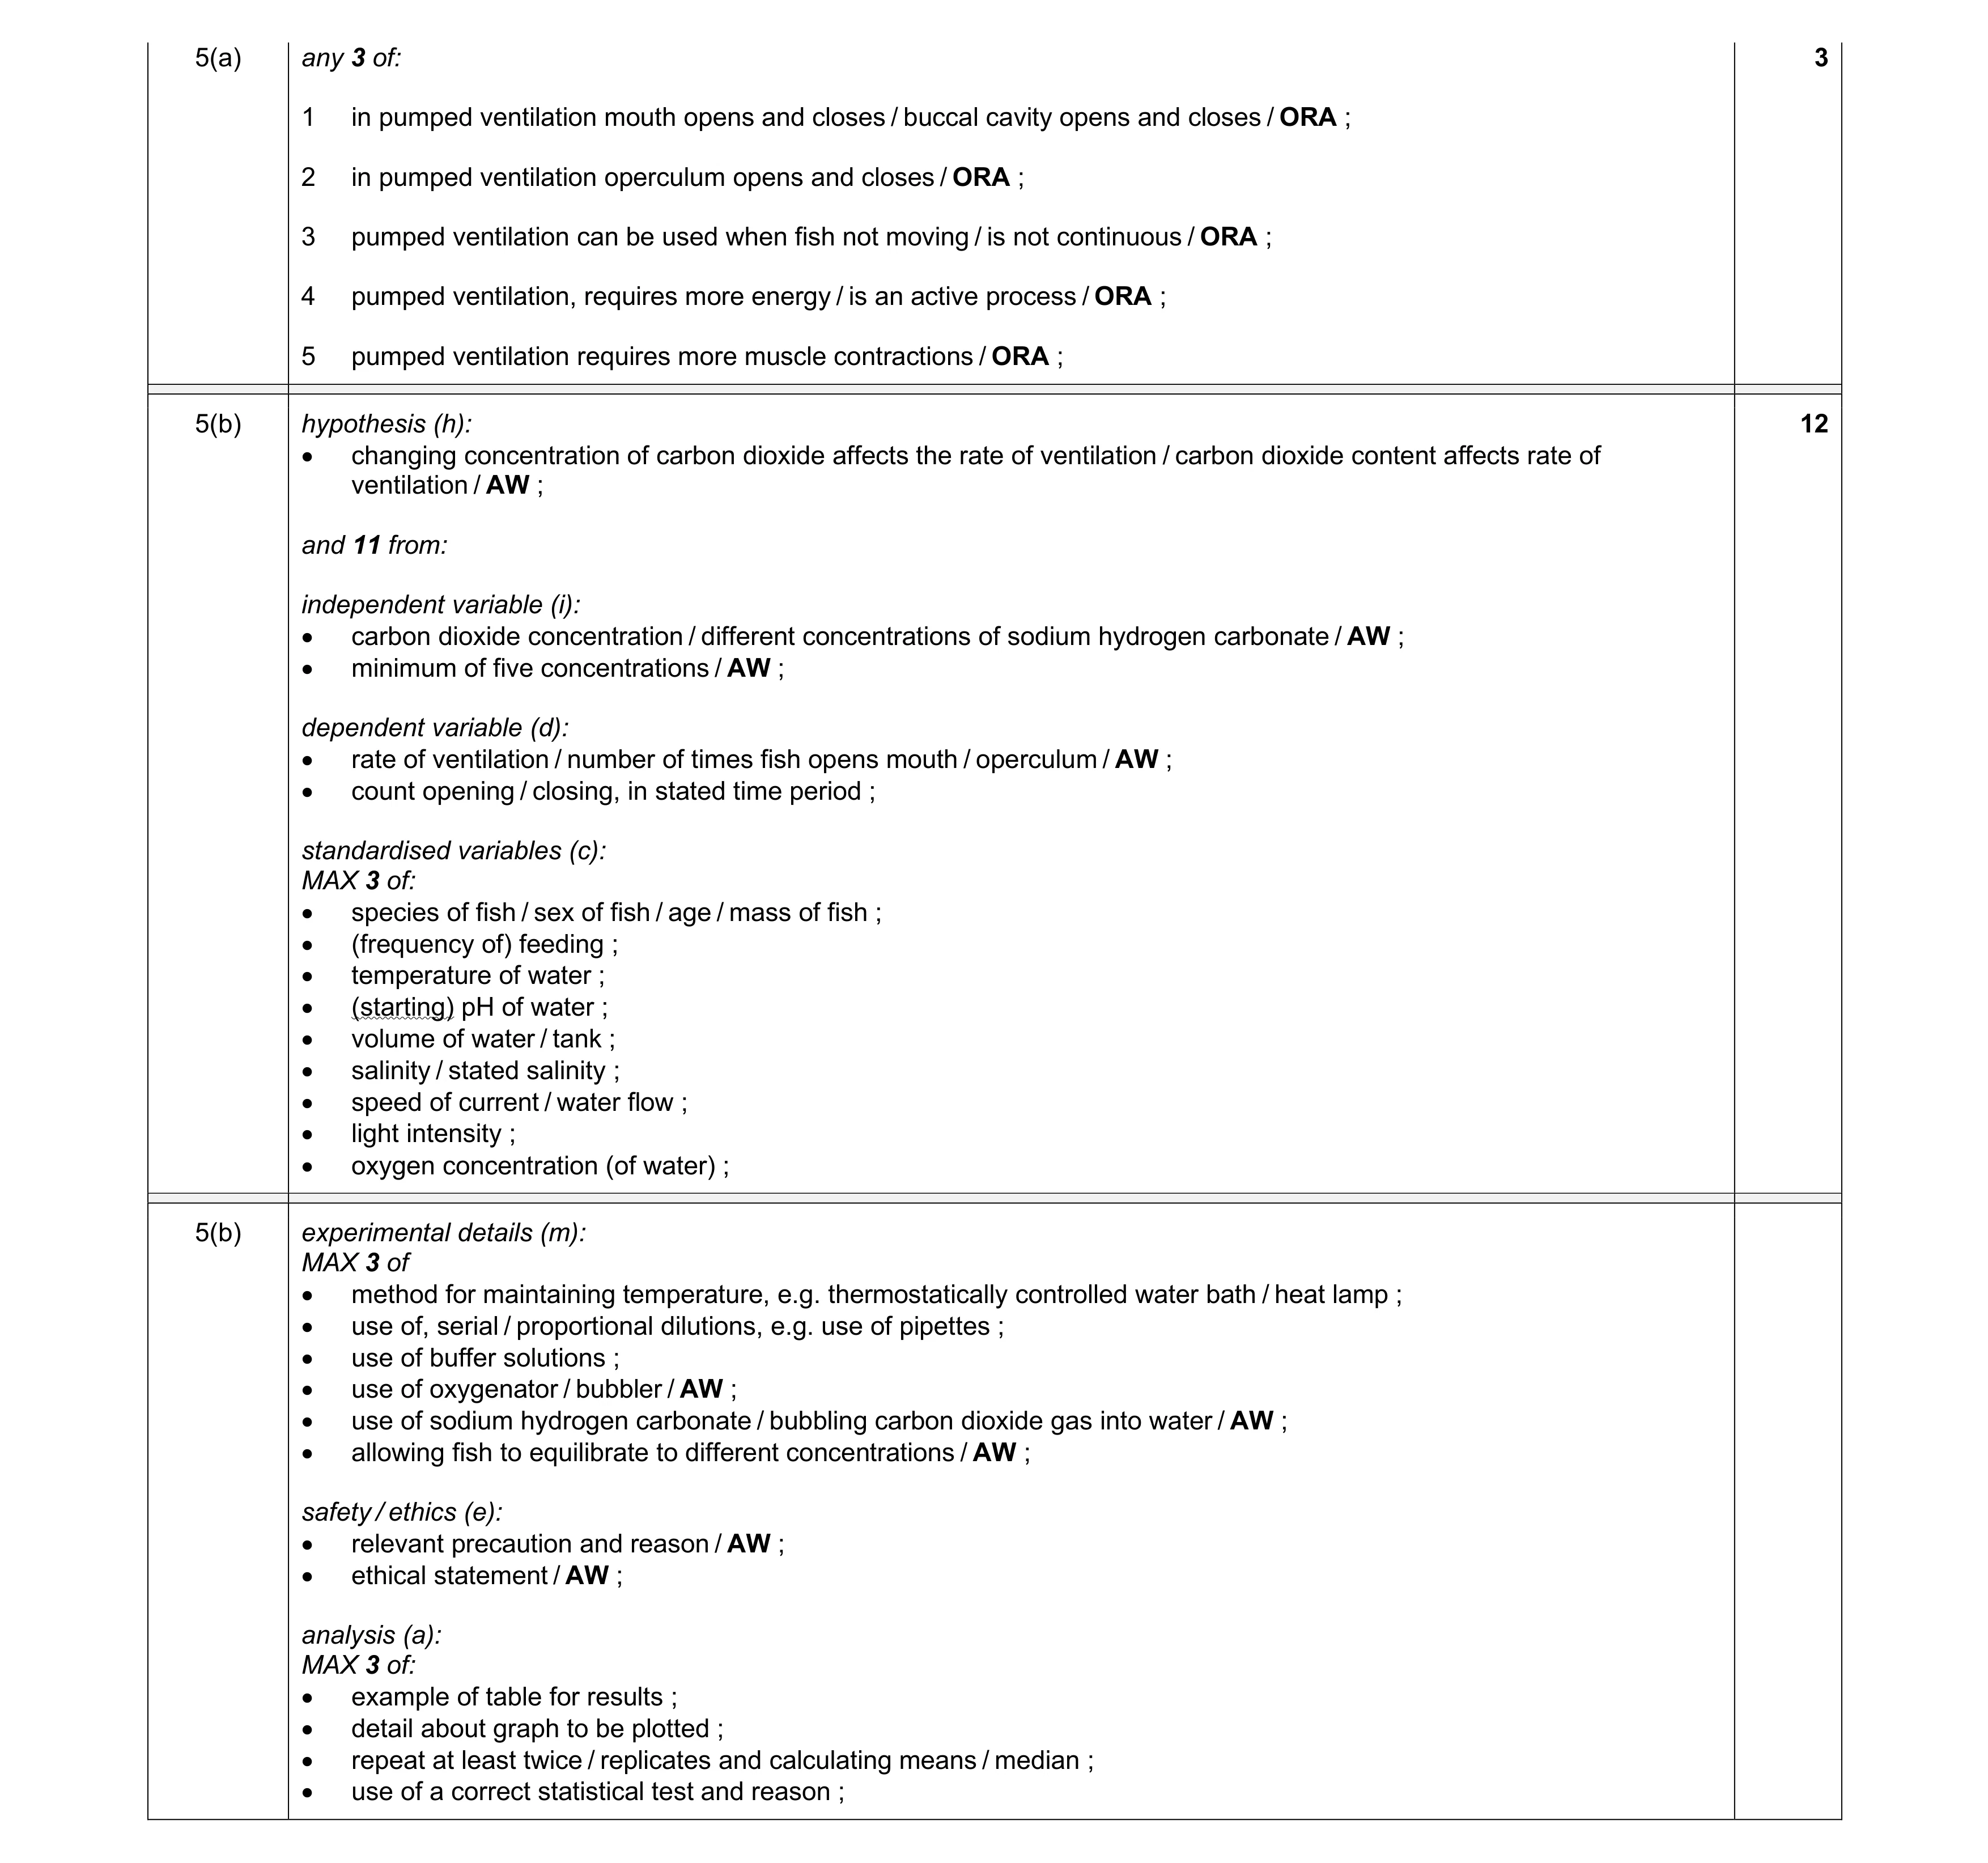 15
15