Cambridge A Level Marine Science 9693 — 2023 Oct/Nov Paper 4 · Variant 2
9693/42/O/N/23 · 5 questions · 75 marks · ≈84 min
The question paper and its mark scheme, free to read here and free to download. This is Cambridge’s own paper, exactly as it was sat.
Question paper20 pages

Mark scheme16 pages
Answers below. Sit the paper first if you are practising.
Questions as text
Q1 · Desalination plants are industrial factories that produce fresh water from sea water
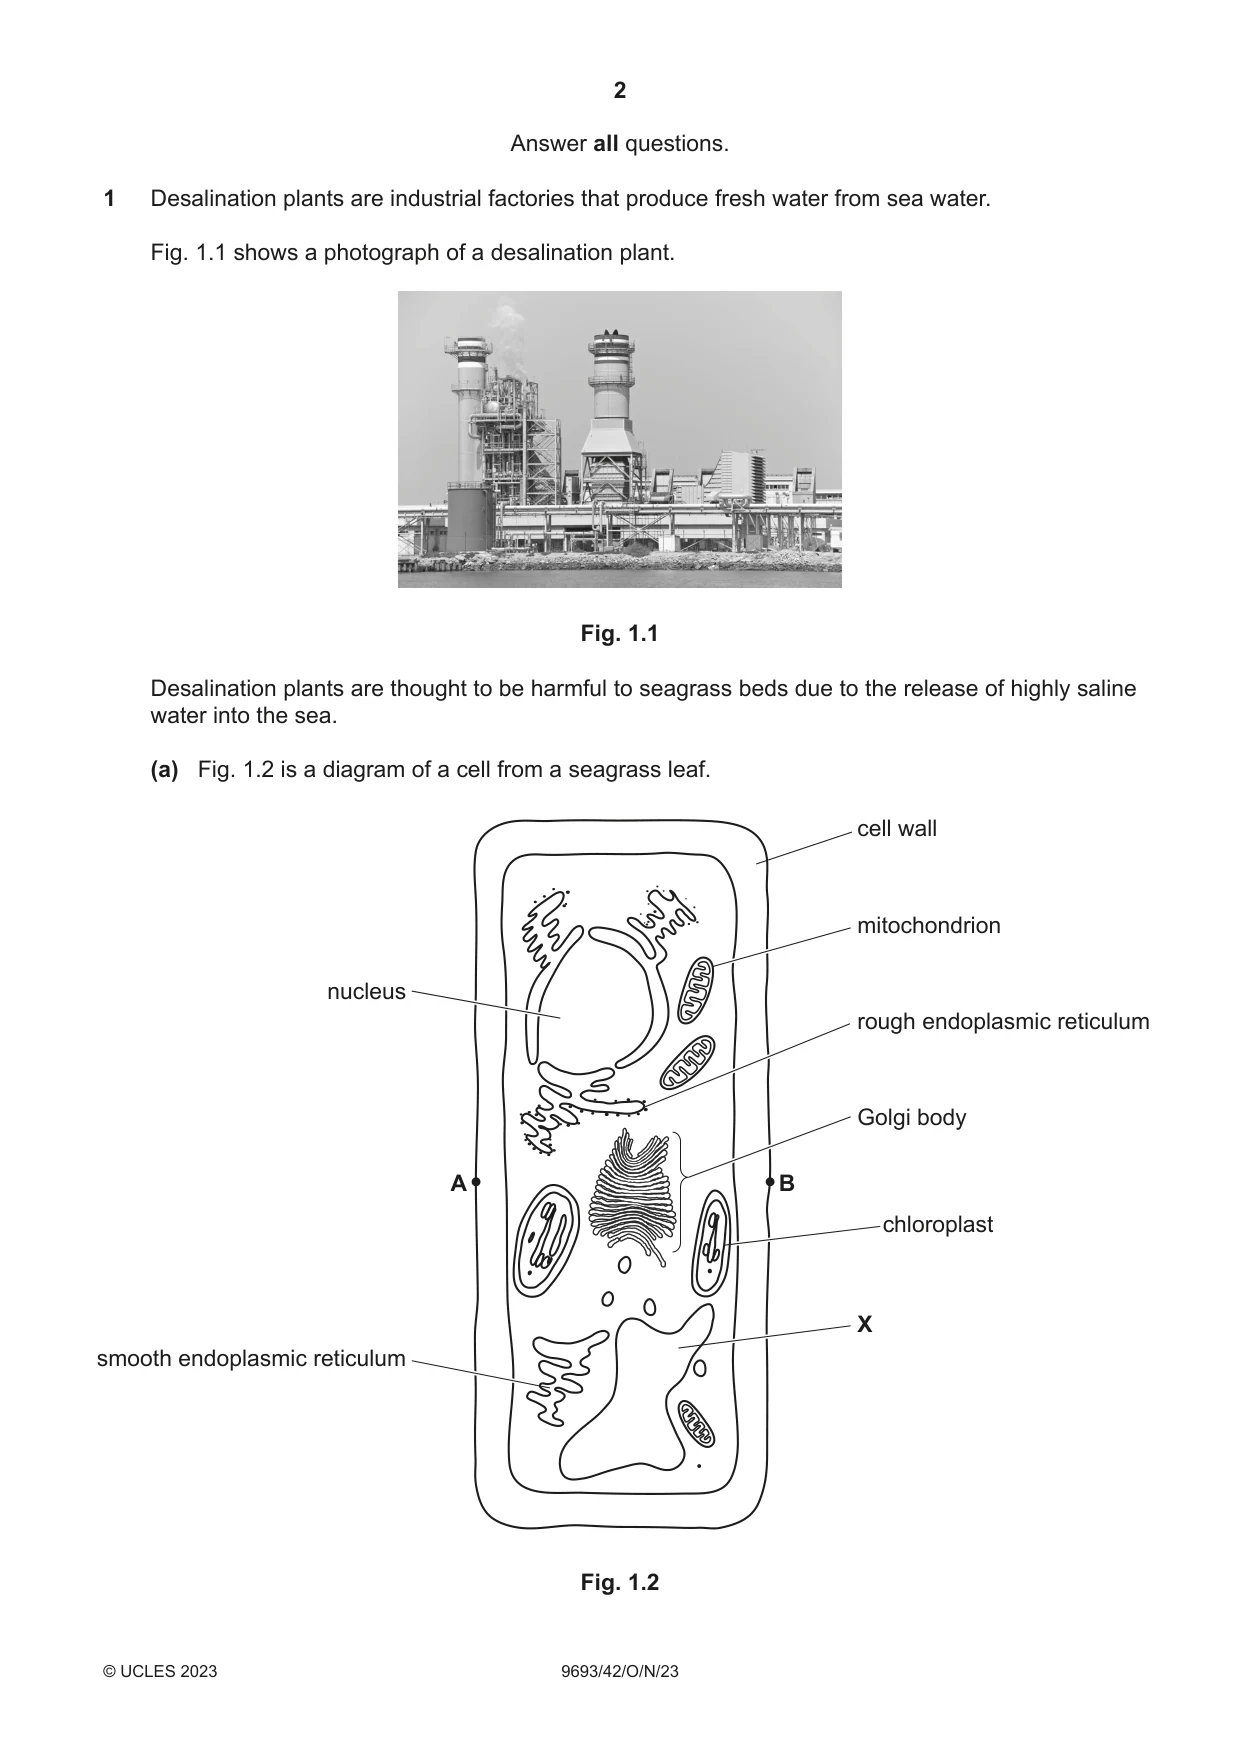
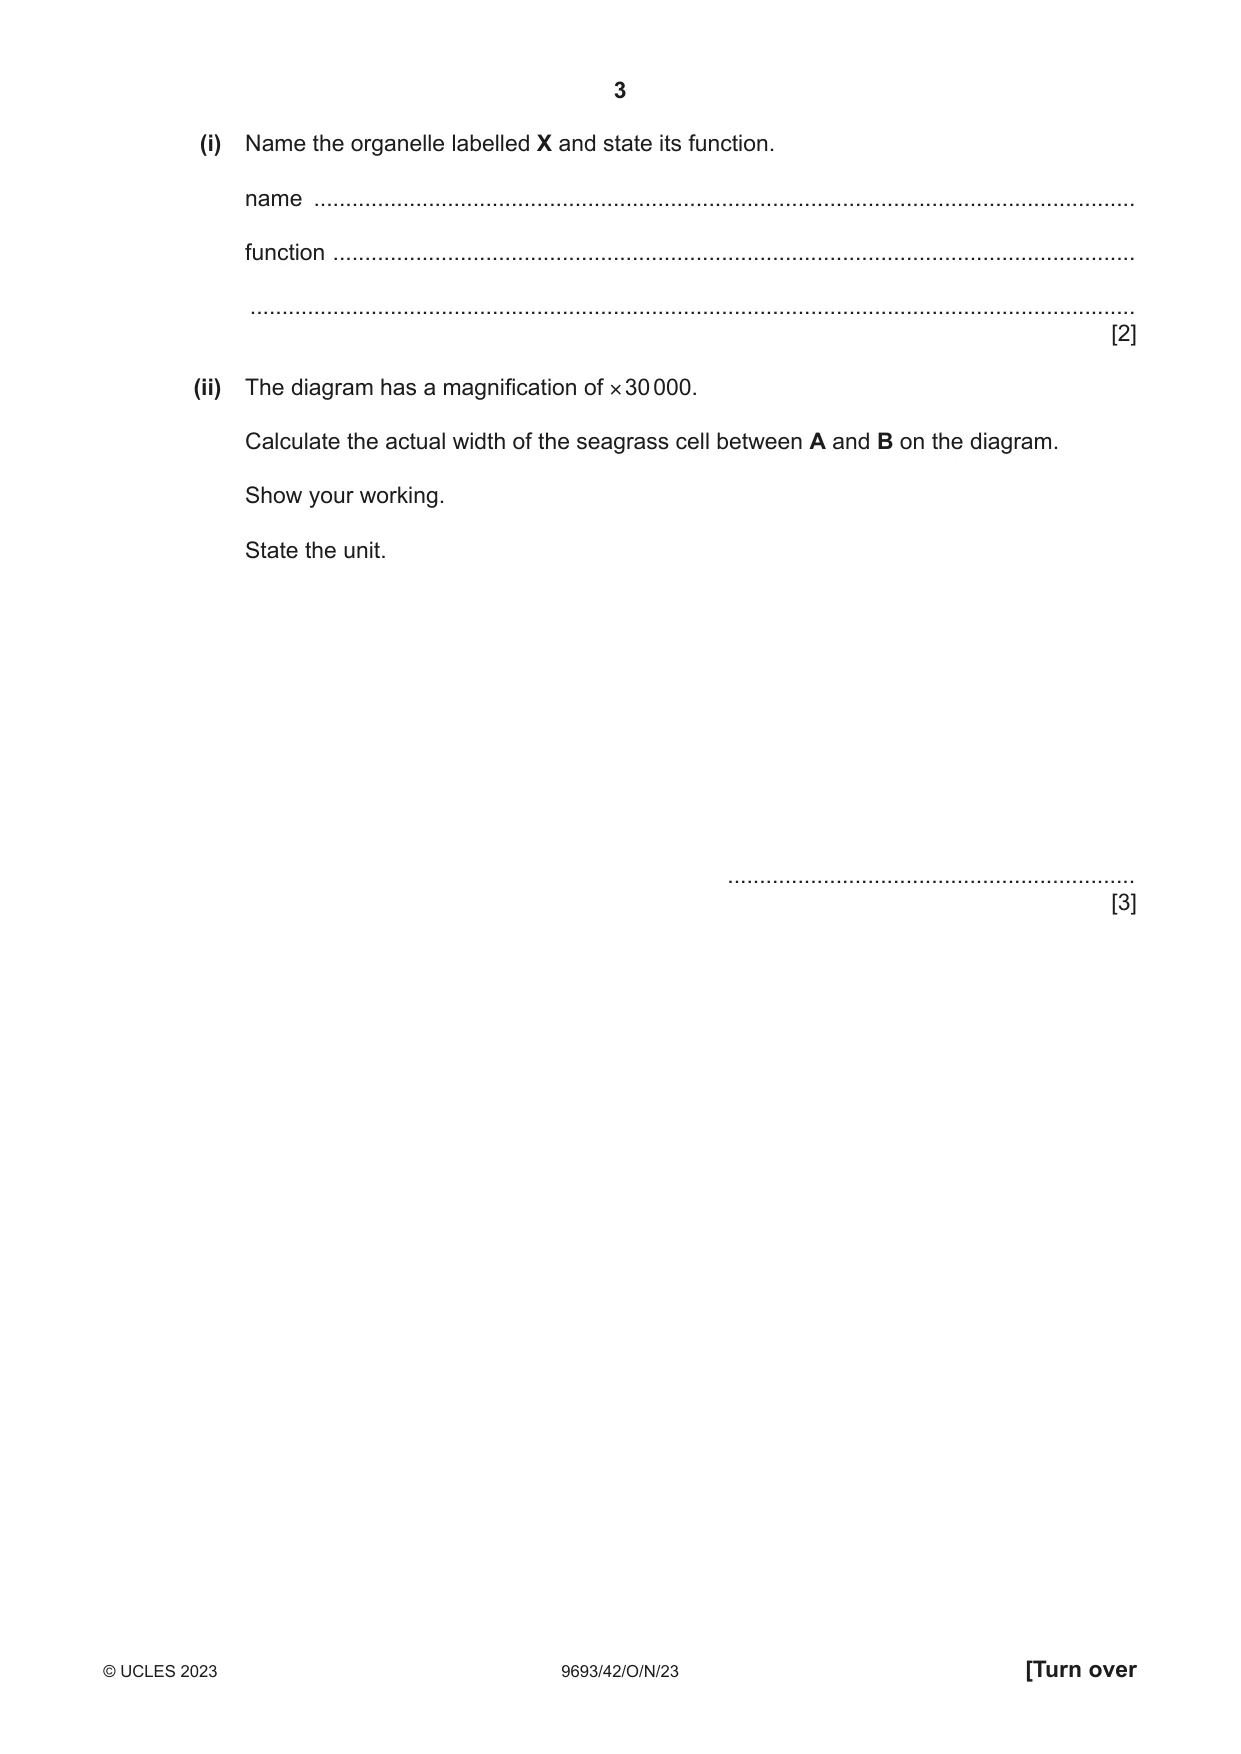
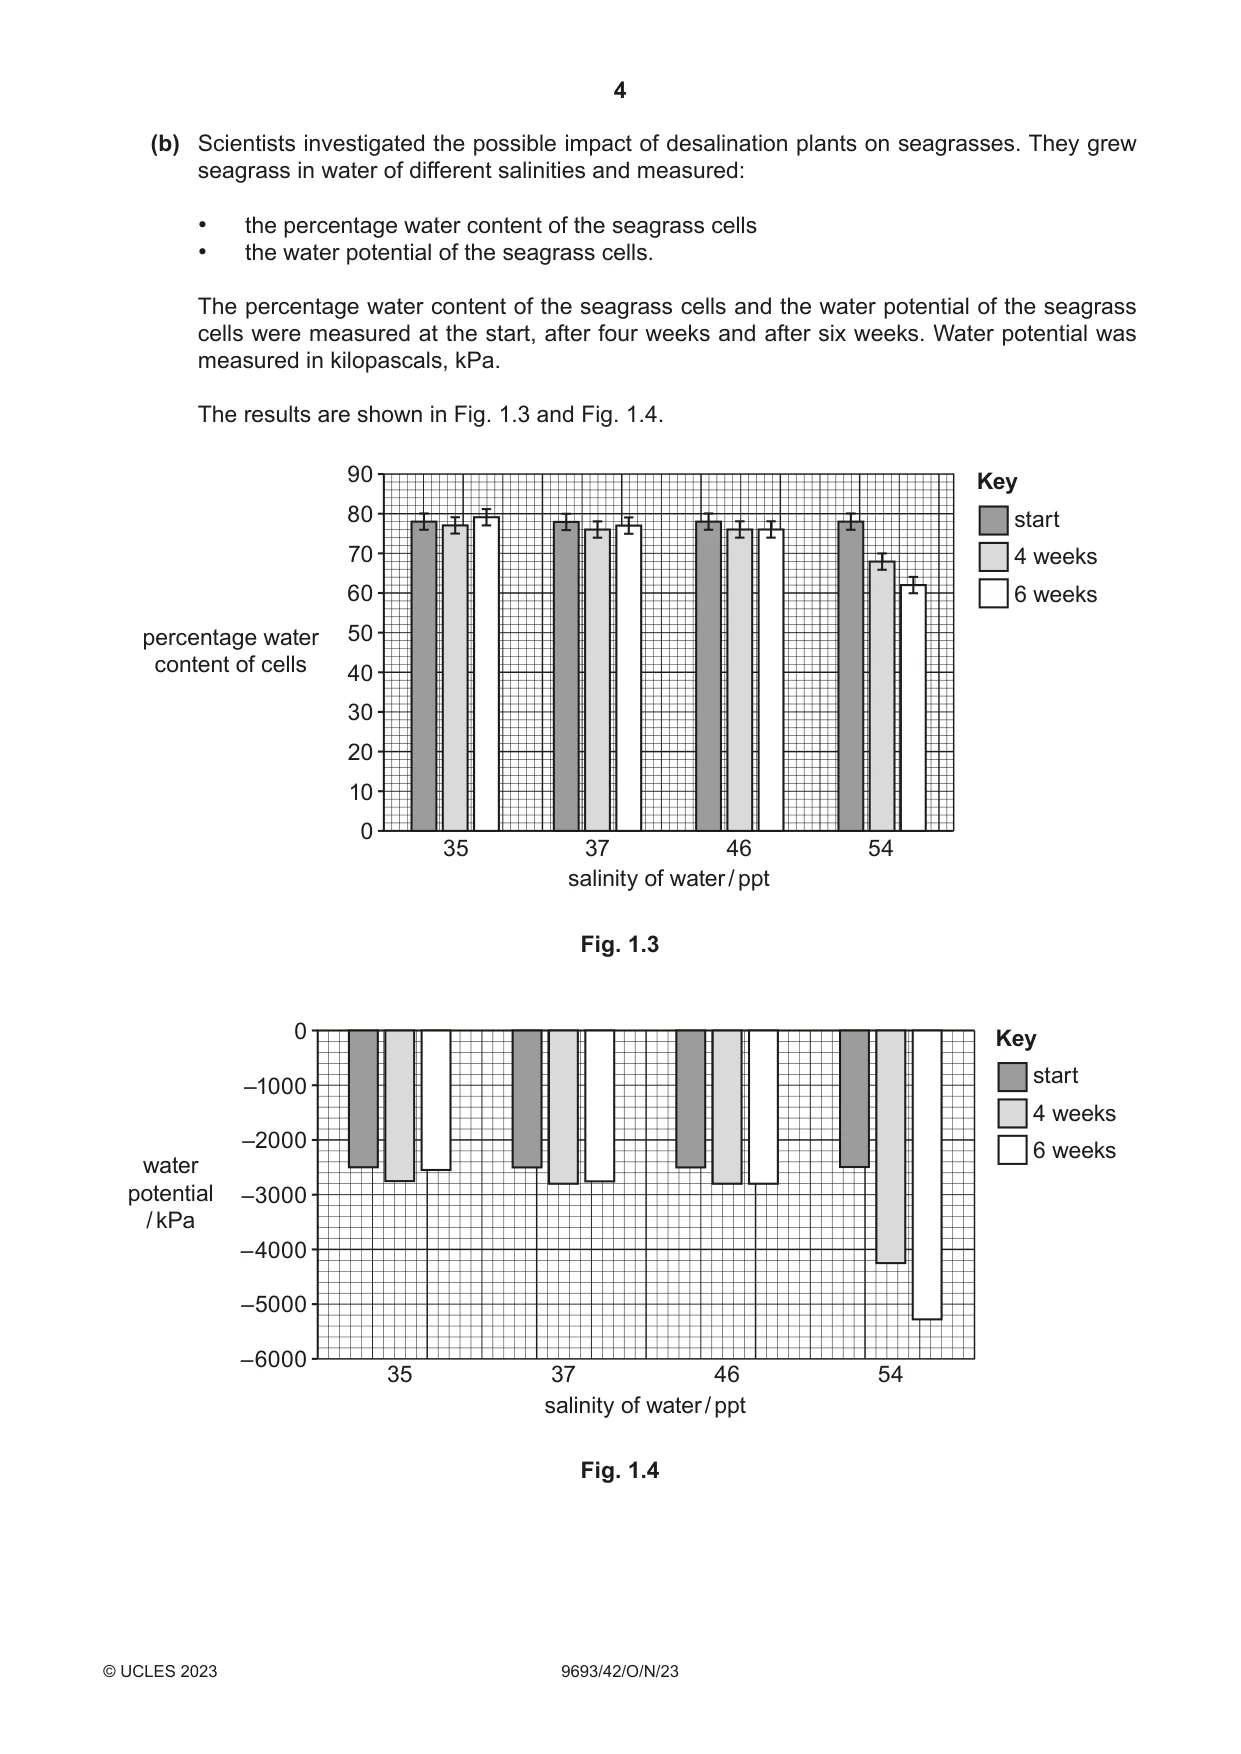
1 Desalination plants are industrial factories that produce fresh water from sea water. Fig. 1.1 shows a photograph of a desalination plant. Fig. 1.1 Desalination plants are thought to be harmful to seagrass beds due to the release of highly saline water into the sea. (a) Fig. 1.2 is a diagram of a cell from a seagrass leaf. cell wall mitochondrion nucleus rough endoplasmic reticulum Golgi body A B chloroplast X smooth endoplasmic reticulum Fig. 1.2 (i) Name the organelle labelled X and state its function. name ................................................................................................................................. function .............................................................................................................................. ........................................................................................................................................... [2] (ii) The diagram has a magnification of × 30 000. Calculate the actual width of the seagrass cell between A and B on the diagram. Show your working. State the unit. ................................................................ [3] (b) Scientists investigated the possible impact of desalination plants on seagrasses. They grew seagrass in water of different salinities and measured: • the percentage water content of the seagrass cells • the water potential of the seagrass cells. The percentage water content of the seagrass cells and the water potential of the seagrass cells were measured at the start, after four weeks and after six weeks. Water potential was measured in kilopascals, kPa. The results are shown in Fig. 1.3 and Fig. 1.4. 90 Key 80 start 70 4 weeks 60 6 weeks percentage water 50 content of cells 40 30 20 10 0 35 37 46 54 salinity of water / ppt Fig. 1.3 0 Key start –1000 4 weeks –2000 6 weeks water potential –3000 / kPa –4000 –5000 –6000 35 37 46 54 salinity of water / ppt Fig. 1.4 (i) Use the data in Fig. 1.3 to describe the effect of growing the seagrass in water of different salinities. ........................................................................................................................................... ........................................................................................................................................... ........................................................................................................................................... ........................................................................................................................................... ........................................................................................................................................... ..................................................................................................................................... [3] (ii) Use the data in Fig. 1.3 and Fig. 1.4 to explain the changes in water potential over time when the seagrass is placed into water of 54 ppt salinity. ........................................................................................................................................... ........................................................................................................................................... ........................................................................................................................................... ........................................................................................................................................... ........................................................................................................................................... ..................................................................................................................................... [3] (c) Desalination plants also release toxic heavy metal ions into the sea water. Explain why the release of heavy metal ions is harmful for top predator organisms in ecosystems. ................................................................................................................................................... ................................................................................................................................................... ................................................................................................................................................... ................................................................................................................................................... ................................................................................................................................................... ............................................................................................................................................. [3] [Total: 14]
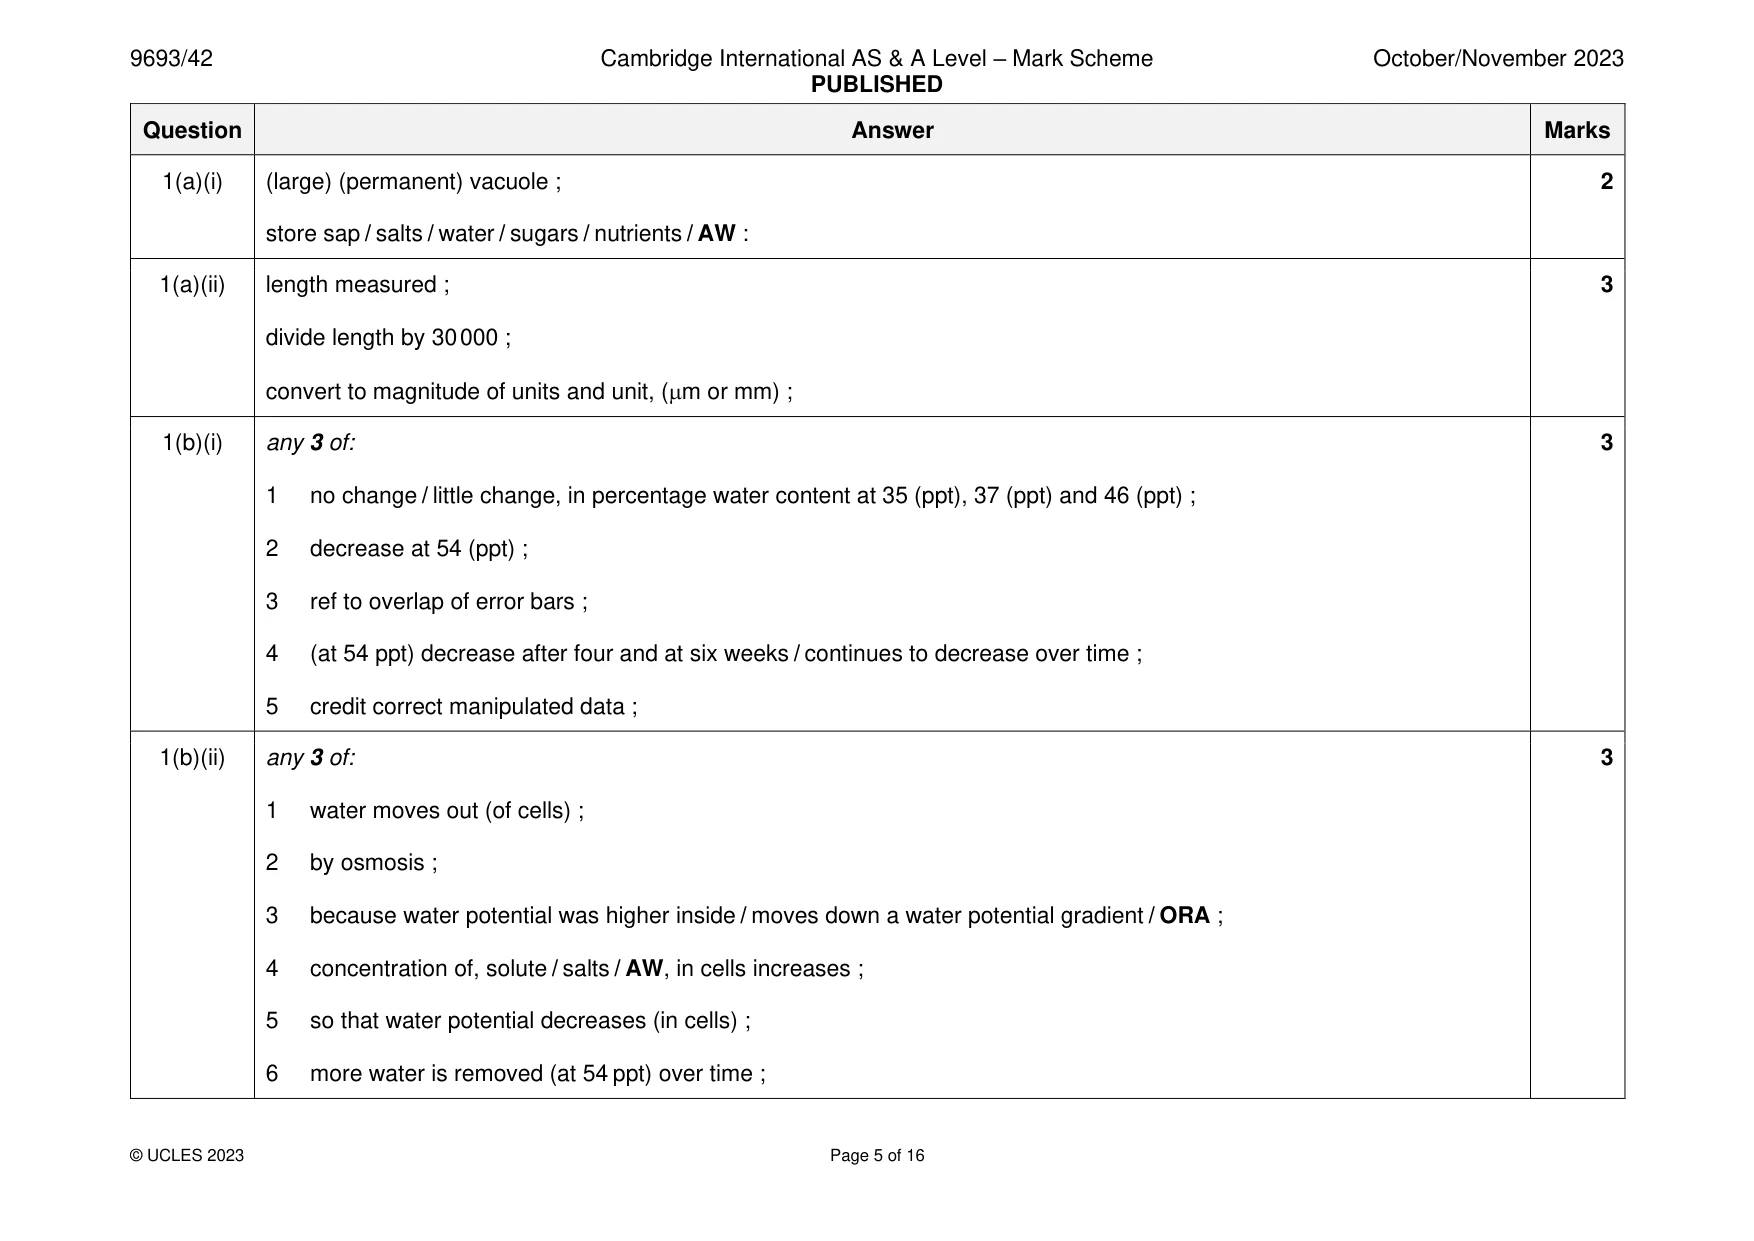
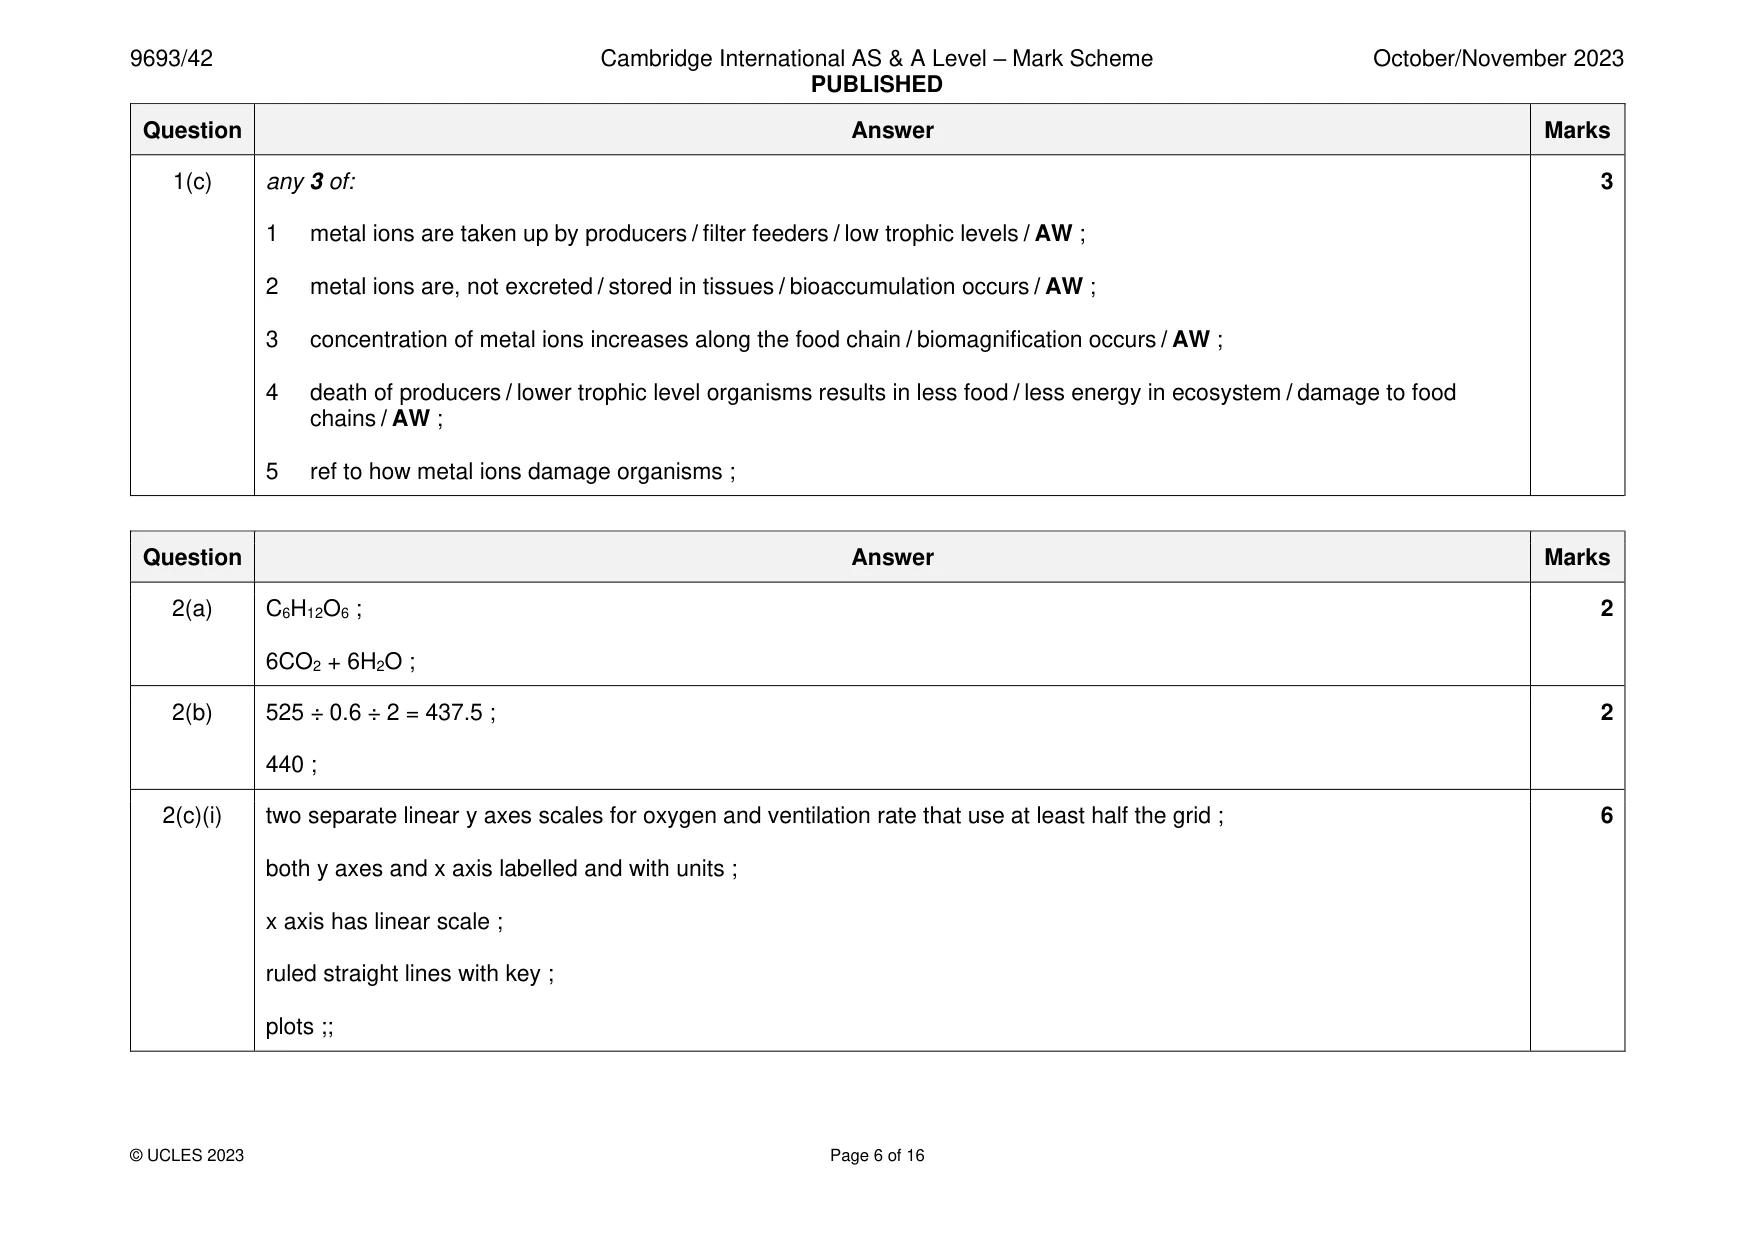
Mark scheme: Question Answer Marks 1(a)(i) (large) (permanent) vacuole ; 2 store sap / salts / water / sugars / nutrients / AW : 1(a)(ii) length measured ; 3 divide length by 30 000 ; convert to magnitude of units and unit, (m or mm) ; 1(b)(i) any 3 of: 3 1 no change / little change, in percentage water content at 35 (ppt), 37 (ppt) and 46 (ppt) ; 2 decrease at 54 (ppt) ; 3 ref to overlap of error bars ; 4 (at 54 ppt) decrease after four and at six weeks / continues to decrease over time ; 5 credit correct manipulated data ; 1(b)(ii) any 3 of: 3 1 water moves out (of cells) ; 2 by osmosis ; 3 because water potential was higher inside / moves down a water potential gradient / ORA ; 4 concentration of, solute / salts / AW, in cells increases ; 5 so that water potential decreases (in cells) ; 6 more water is removed (at 54 ppt) over time ; 1(c) any 3 of: 3 1 metal ions are taken up by producers / filter feeders / low trophic levels / AW ; 2 metal ions are, not excreted / stored in tissues / bioaccumulation occurs / AW ; 3 concentration of metal ions increases along the food chain / biomagnification occurs / AW ; 4 death of producers / lower trophic level organisms results in less food / less energy in ecosystem / damage to food chains / AW ; 5 ref to how metal ions damage organisms ;
Q2 · Organisms require oxygen for aerobic respiration
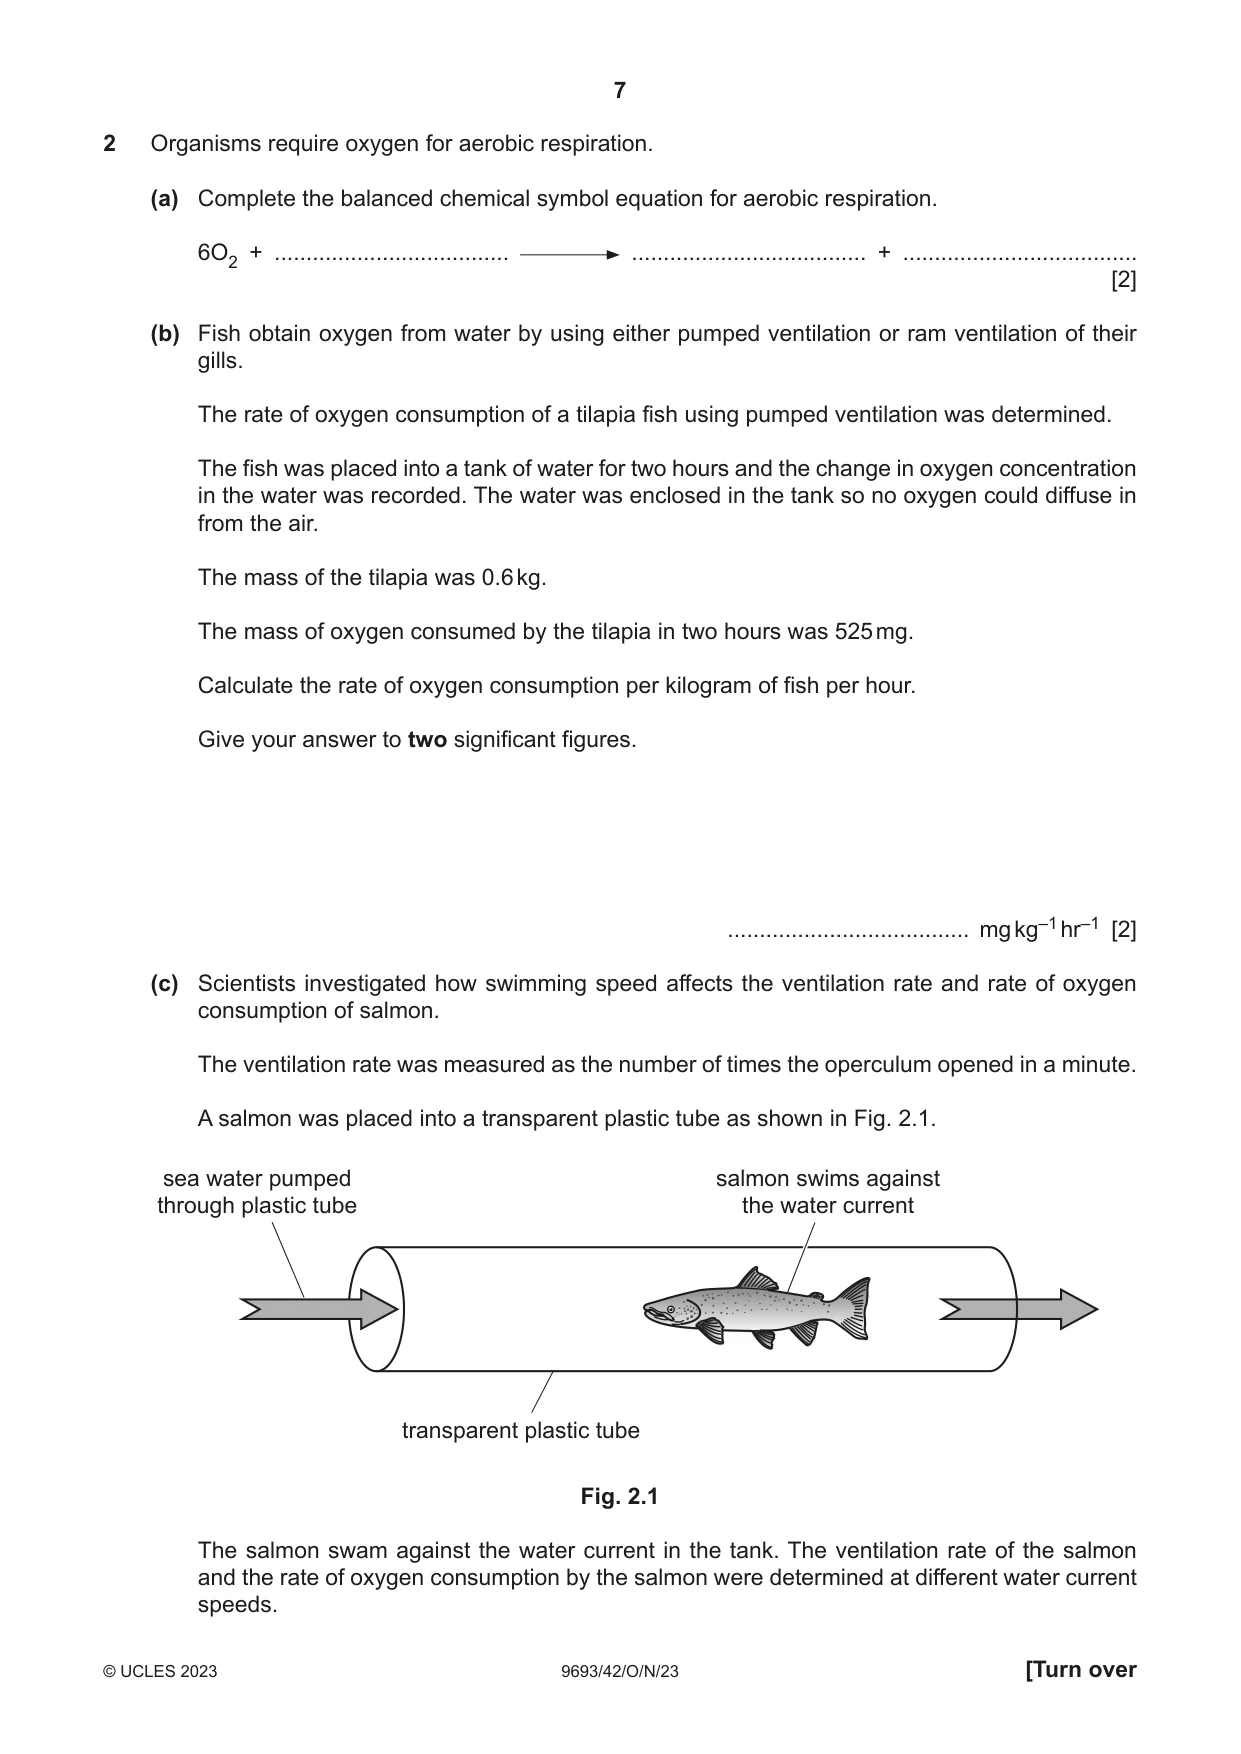
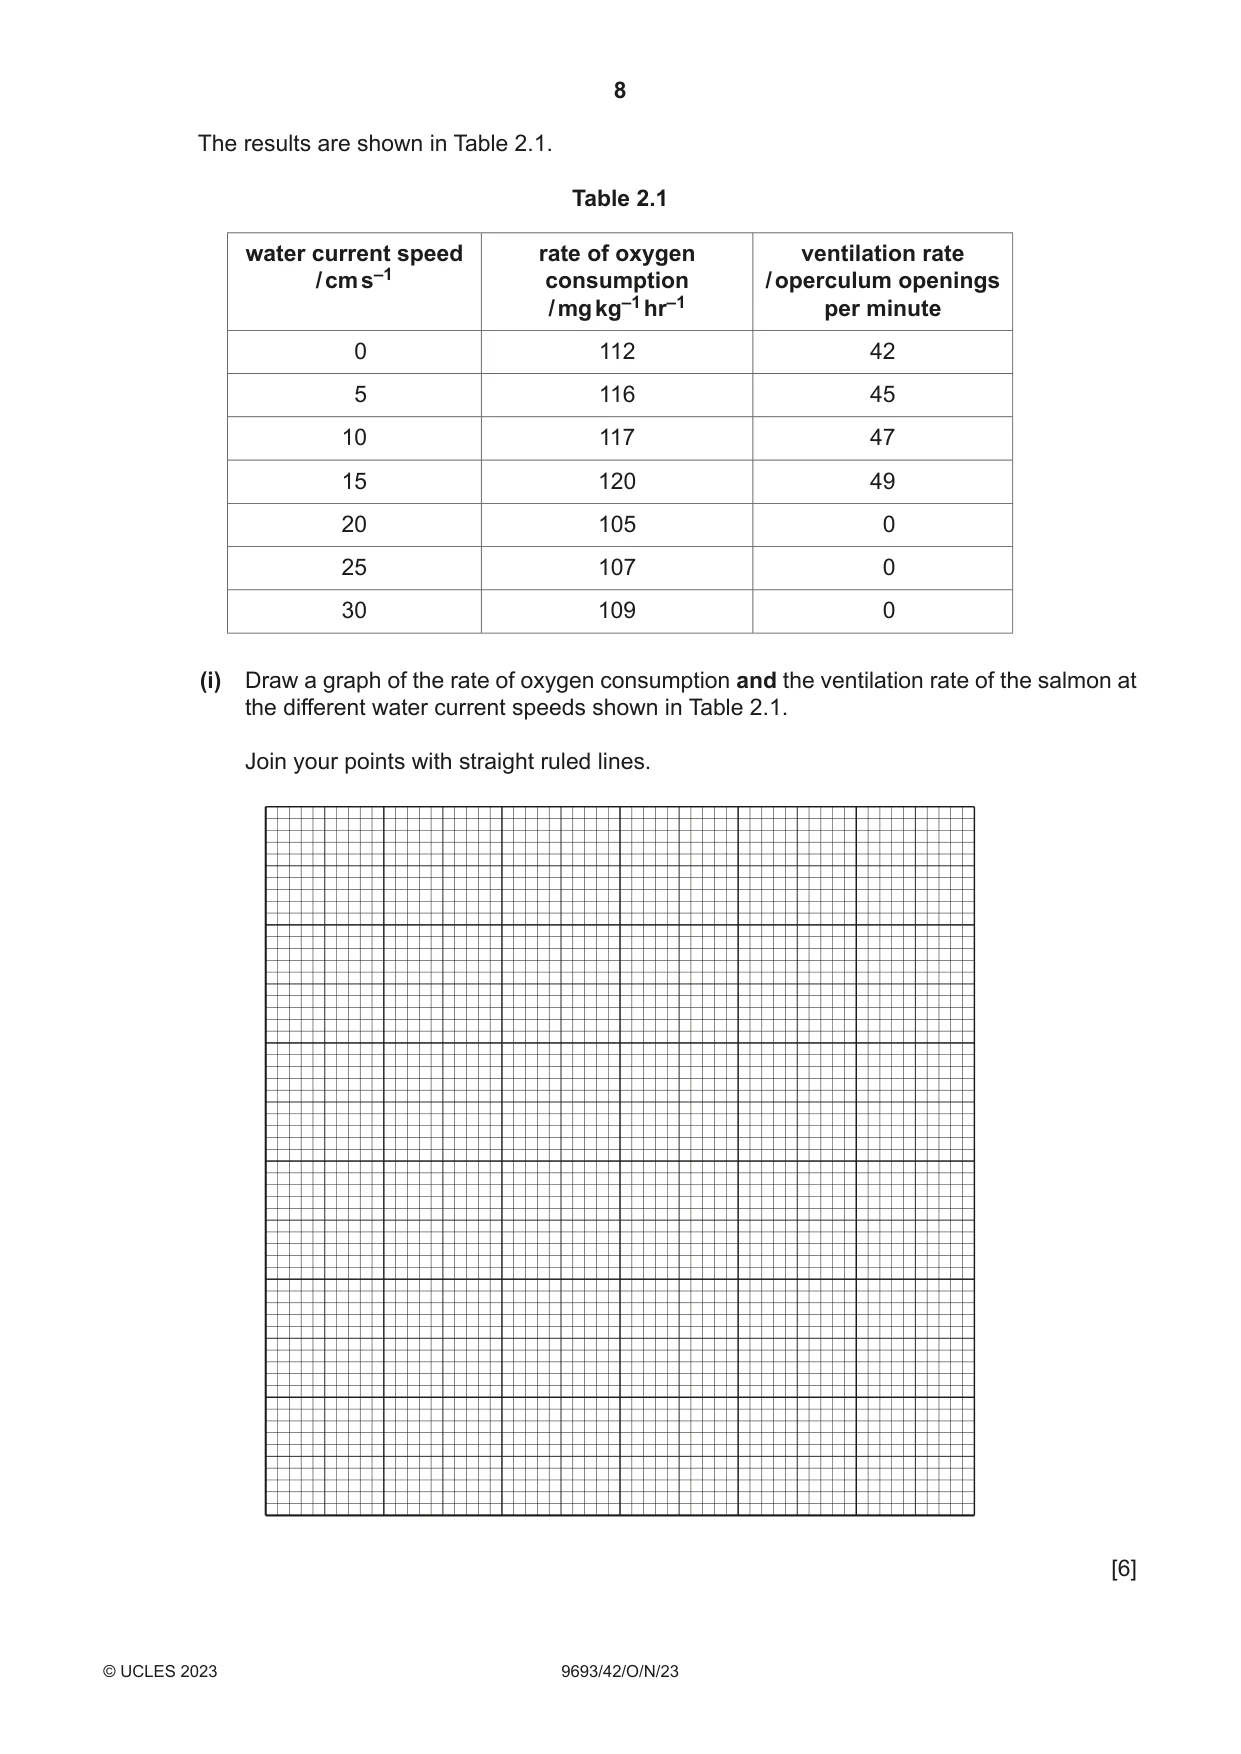
2 Organisms require oxygen for aerobic respiration. (a) Complete the balanced chemical symbol equation for aerobic respiration. 6O2 + ..................................... ..................................... + ..................................... [2] (b) Fish obtain oxygen from water by using either pumped ventilation or ram ventilation of their gills. The rate of oxygen consumption of a tilapia fish using pumped ventilation was determined. The fish was placed into a tank of water for two hours and the change in oxygen concentration in the water was recorded. The water was enclosed in the tank so no oxygen could diffuse in from the air. The mass of the tilapia was 0.6 kg. The mass of oxygen consumed by the tilapia in two hours was 525 mg. Calculate the rate of oxygen consumption per kilogram of fish per hour. Give your answer to two significant figures. ...................................... mg kg–1 hr–1 [2] (c) Scientists investigated how swimming speed affects the ventilation rate and rate of oxygen consumption of salmon. The ventilation rate was measured as the number of times the operculum opened in a minute. A salmon was placed into a transparent plastic tube as shown in Fig. 2.1. sea water pumped salmon swims against through plastic tube the water current transparent plastic tube Fig. 2.1 The salmon swam against the water current in the tank. The ventilation rate of the salmon and the rate of oxygen consumption by the salmon were determined at different water current speeds. The results are shown in Table 2.1. Table 2.1 water current speed rate of oxygen ventilation rate / cm s–1 consumption / operculum openings / mg kg–1 hr–1 per minute 0 112 42 5 116 45 10 117 47 15 120 49 20 105 0 25 107 0 30 109 0 (i) Draw a graph of the rate of oxygen consumption and the ventilation rate of the salmon at the different water current speeds shown in Table 2.1. Join your points with straight ruled lines. [6] (ii) Describe the effect of increasing water current speed on the rate of oxygen consumption and ventilation rate of the salmon. ........................................................................................................................................... ........................................................................................................................................... ........................................................................................................................................... ..................................................................................................................................... [2] (iii) The salmon swims at the same speed as the water current speed. Use the information in Table 2.1 and your graph in (c)(i) to suggest explanations for the effect of the water current speed on the rate of oxygen consumption and ventilation rate of the salmon. You should refer to ram ventilation and pumped ventilation in your answer. ........................................................................................................................................... ........................................................................................................................................... ........................................................................................................................................... ........................................................................................................................................... ........................................................................................................................................... ........................................................................................................................................... ........................................................................................................................................... ..................................................................................................................................... [4] [Total: 16]
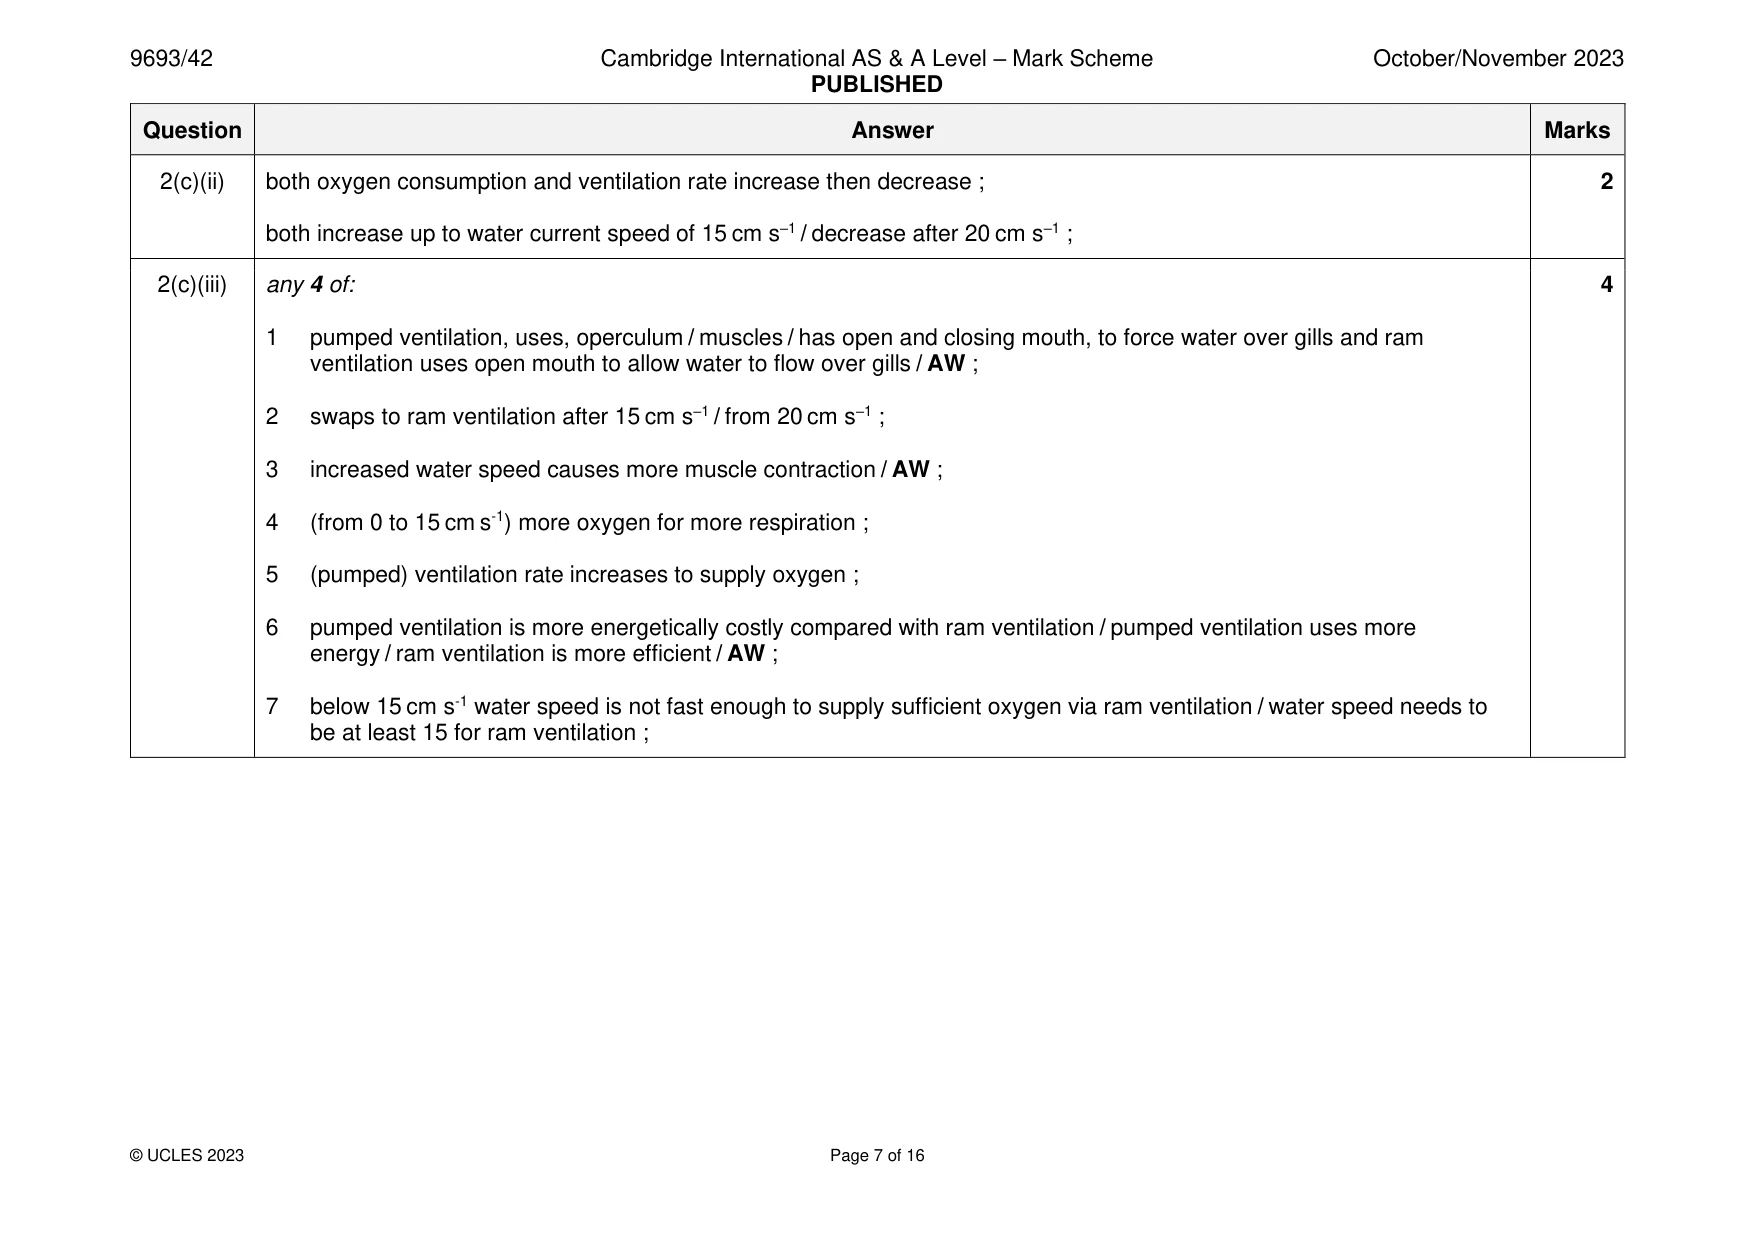
Mark scheme: 2(a) C6H12O6 ; 2 6CO2 + 6H2O ; 2(b) 525 ÷ 0.6 ÷ 2 = 437.5 ; 2 440 ; 2(c)(i) two separate linear y axes scales for oxygen and ventilation rate that use at least half the grid ; 6 both y axes and x axis labelled and with units ; x axis has linear scale ; ruled straight lines with key ; plots ;; 2(c)(ii) both oxygen consumption and ventilation rate increase then decrease ; 2 both increase up to water current speed of 15 cm s–1 / decrease after 20 cm s–1 ; 2(c)(iii) any 4 of: 4 1 pumped ventilation, uses, operculum / muscles / has open and closing mouth, to force water over gills and ram ventilation uses open mouth to allow water to flow over gills / AW ; 2 swaps to ram ventilation after 15 cm s–1 / from 20 cm s–1 ; 3 increased water speed causes more muscle contraction / AW ; 4 (from 0 to 15 cm s-1) more oxygen for more respiration ; 5 (pumped) ventilation rate increases to supply oxygen ; 6 pumped ventilation is more energetically costly compared with ram ventilation / pumped ventilation uses more energy / ram ventilation is more efficient / AW ; 7 below 15 cm s-1 water speed is not fast enough to supply sufficient oxygen via ram ventilation / water speed needs to be at least 15 for ram ventilation ;
Q3 · Salmon are grown commercially around coastal areas using extensive aquaculture systems…
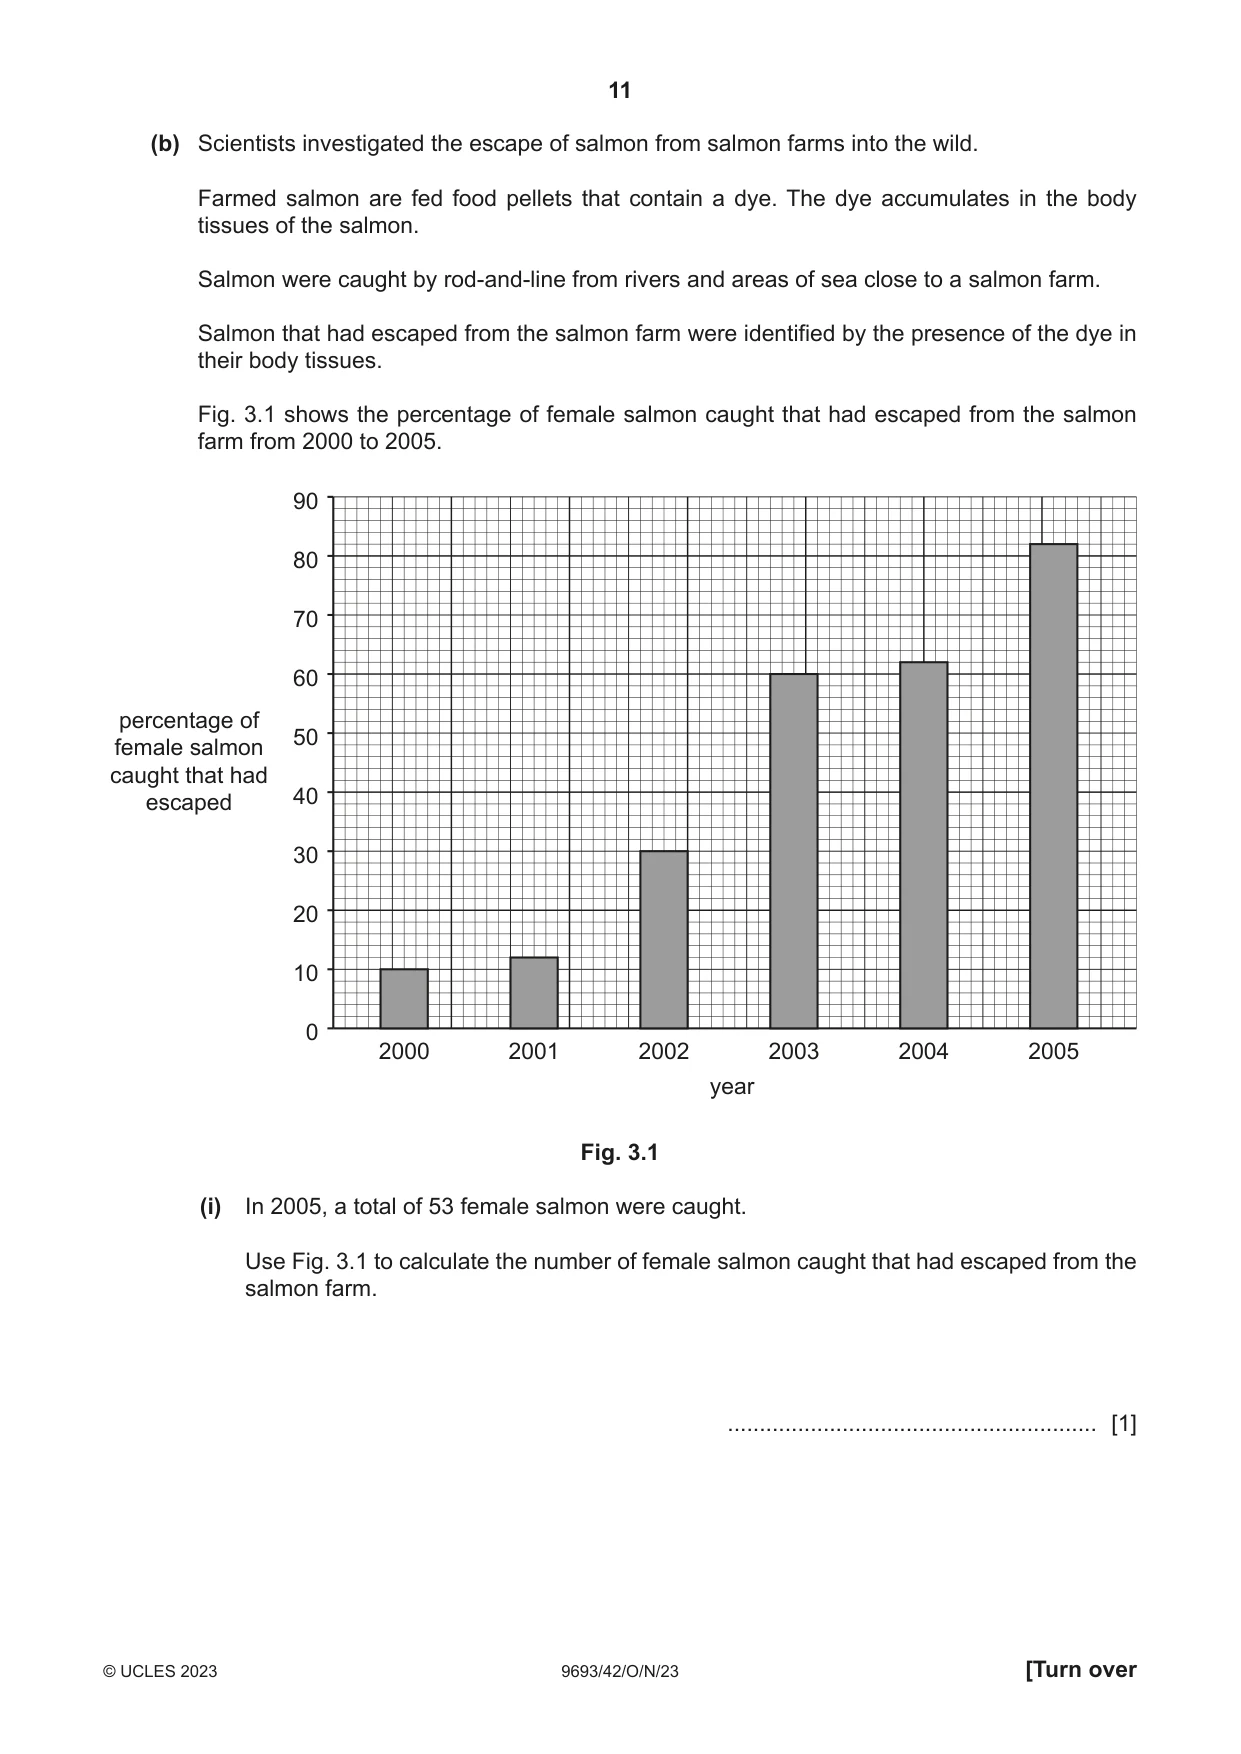
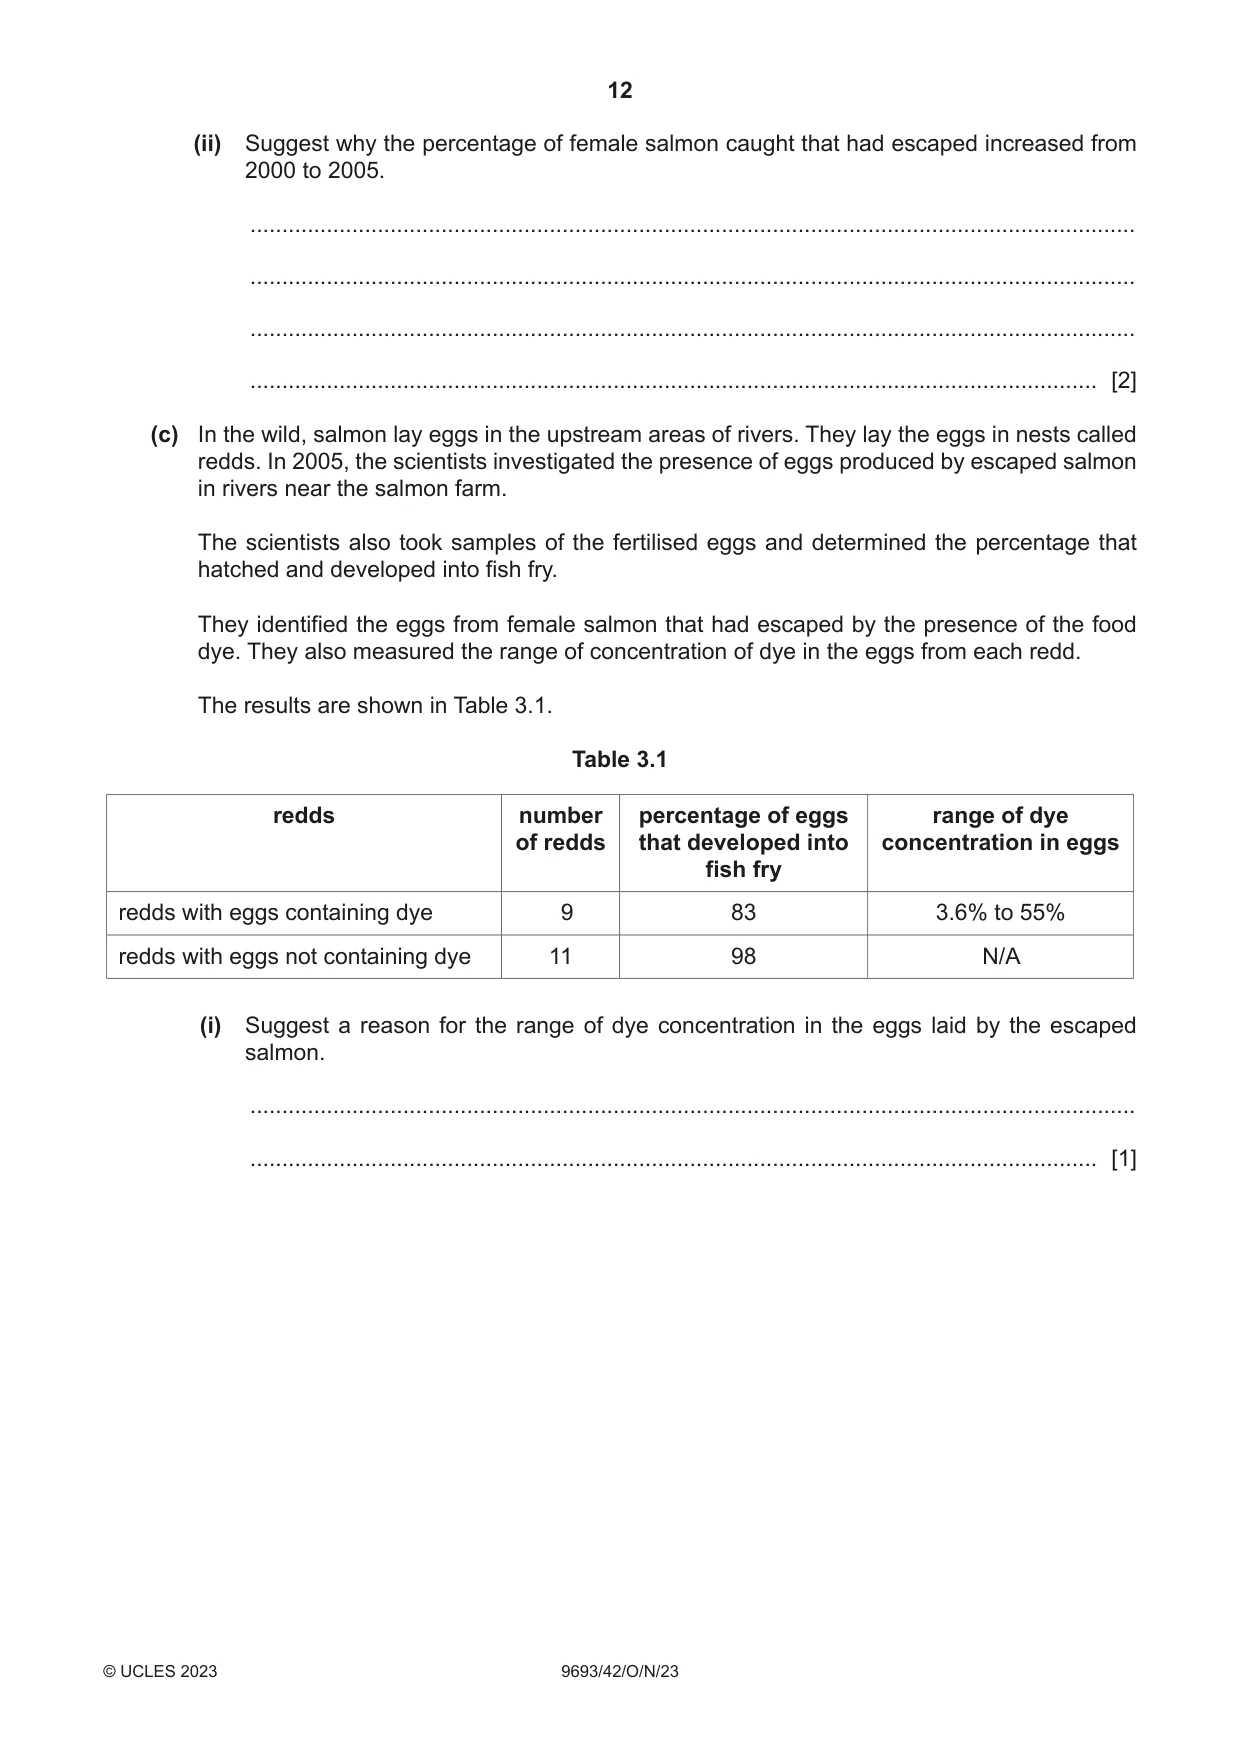
3 Salmon are grown commercially around coastal areas using extensive aquaculture systems called salmon farms. (a) Outline the process of salmon aquaculture in extensive systems. ................................................................................................................................................... ................................................................................................................................................... ................................................................................................................................................... ................................................................................................................................................... ................................................................................................................................................... ................................................................................................................................................... ................................................................................................................................................... ............................................................................................................................................. [4] (b) Scientists investigated the escape of salmon from salmon farms into the wild. Farmed salmon are fed food pellets that contain a dye. The dye accumulates in the body tissues of the salmon. Salmon were caught by rod-and-line from rivers and areas of sea close to a salmon farm. Salmon that had escaped from the salmon farm were identified by the presence of the dye in their body tissues. Fig. 3.1 shows the percentage of female salmon caught that had escaped from the salmon farm from 2000 to 2005. 90 80 70 60 percentage of 50female salmon caught that had escaped 40 30 20 10 0 2000 2001 2002 2003 2004 2005 year Fig. 3.1 (i) In 2005, a total of 53 female salmon were caught. Use Fig. 3.1 to calculate the number of female salmon caught that had escaped from the salmon farm. .......................................................... [1] (ii) Suggest why the percentage of female salmon caught that had escaped increased from 2000 to 2005. ........................................................................................................................................... ........................................................................................................................................... ........................................................................................................................................... ..................................................................................................................................... [2] (c) In the wild, salmon lay eggs in the upstream areas of rivers. They lay the eggs in nests called redds. In 2005, the scientists investigated the presence of eggs produced by escaped salmon in rivers near the salmon farm. The scientists also took samples of the fertilised eggs and determined the percentage that hatched and developed into fish fry. They identified the eggs from female salmon that had escaped by the presence of the food dye. They also measured the range of concentration of dye in the eggs from each redd. The results are shown in Table 3.1. Table 3.1 redds number percentage of eggs range of dye of redds that developed into concentration in eggs fish fry redds with eggs containing dye 9 83 3.6% to 55% redds with eggs not containing dye 11 98 N/A (i) Suggest a reason for the range of dye concentration in the eggs laid by the escaped salmon. ........................................................................................................................................... ..................................................................................................................................... [1] (ii) Discuss the impacts of the escaped salmon on the wild salmon populations. Use the information in Fig. 3.1 and Table 3.1 to support your answer. ........................................................................................................................................... ........................................................................................................................................... ........................................................................................................................................... ........................................................................................................................................... ........................................................................................................................................... ........................................................................................................................................... ........................................................................................................................................... ..................................................................................................................................... [4] (iii) Suggest why the information in Table 3.1 may be insufficient to make a firm conclusion on the impact of escaped salmon on wild salmon populations. ........................................................................................................................................... ........................................................................................................................................... ........................................................................................................................................... ..................................................................................................................................... [2] [Total: 14]
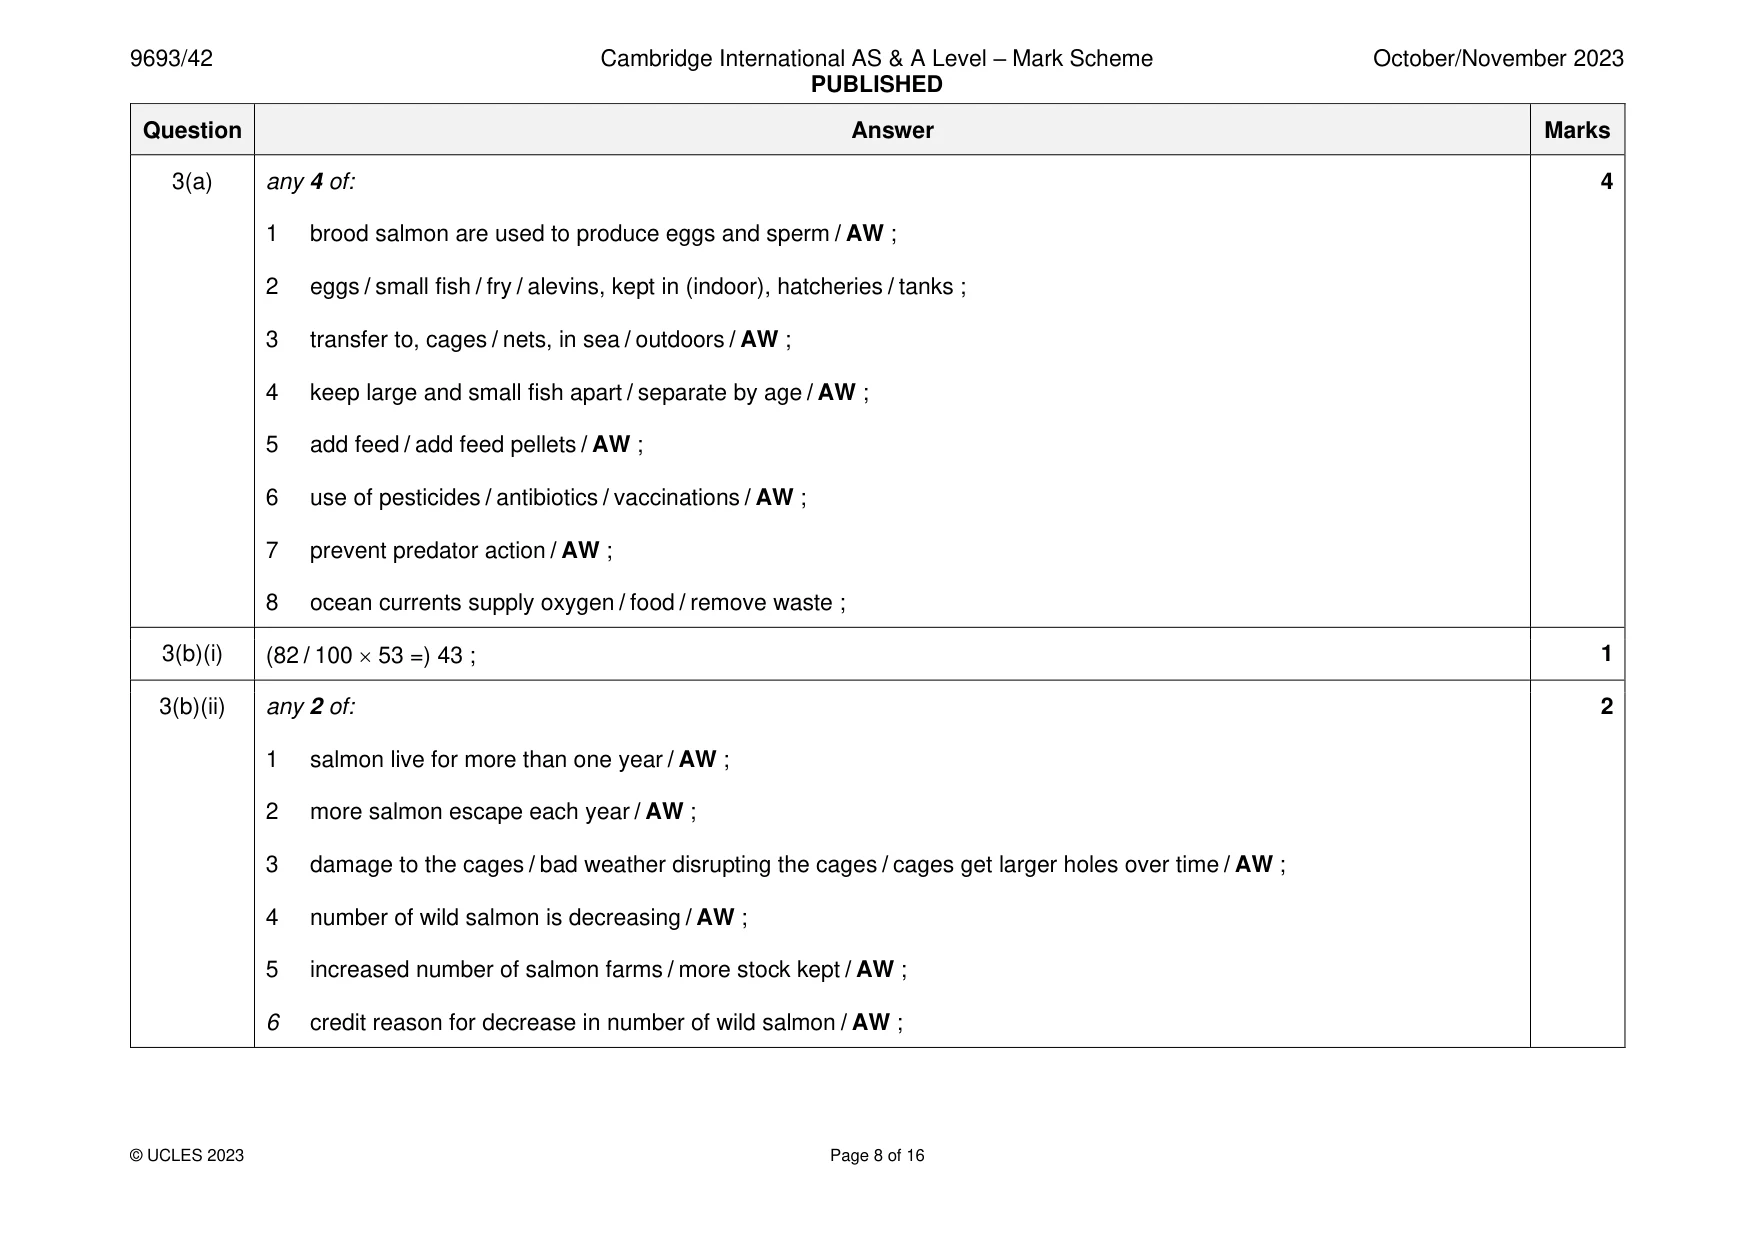
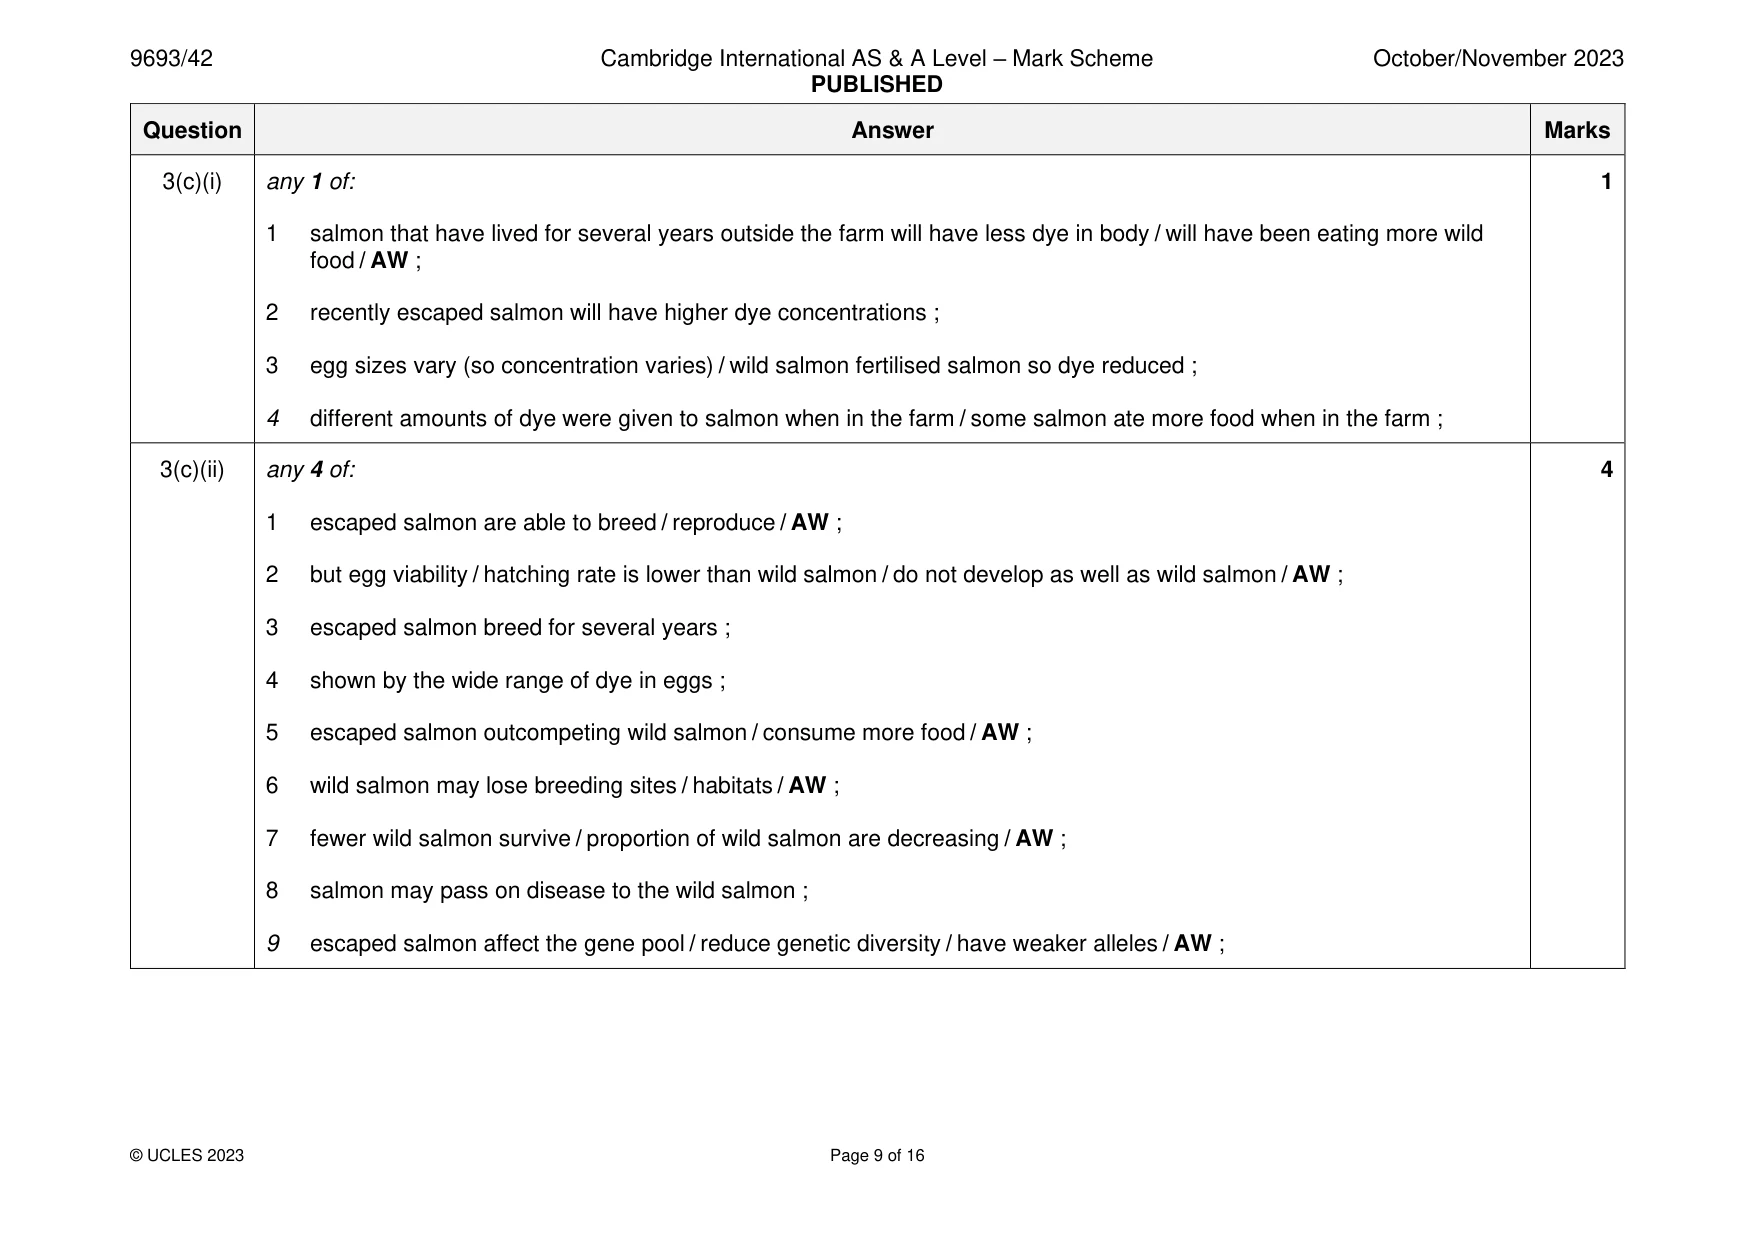
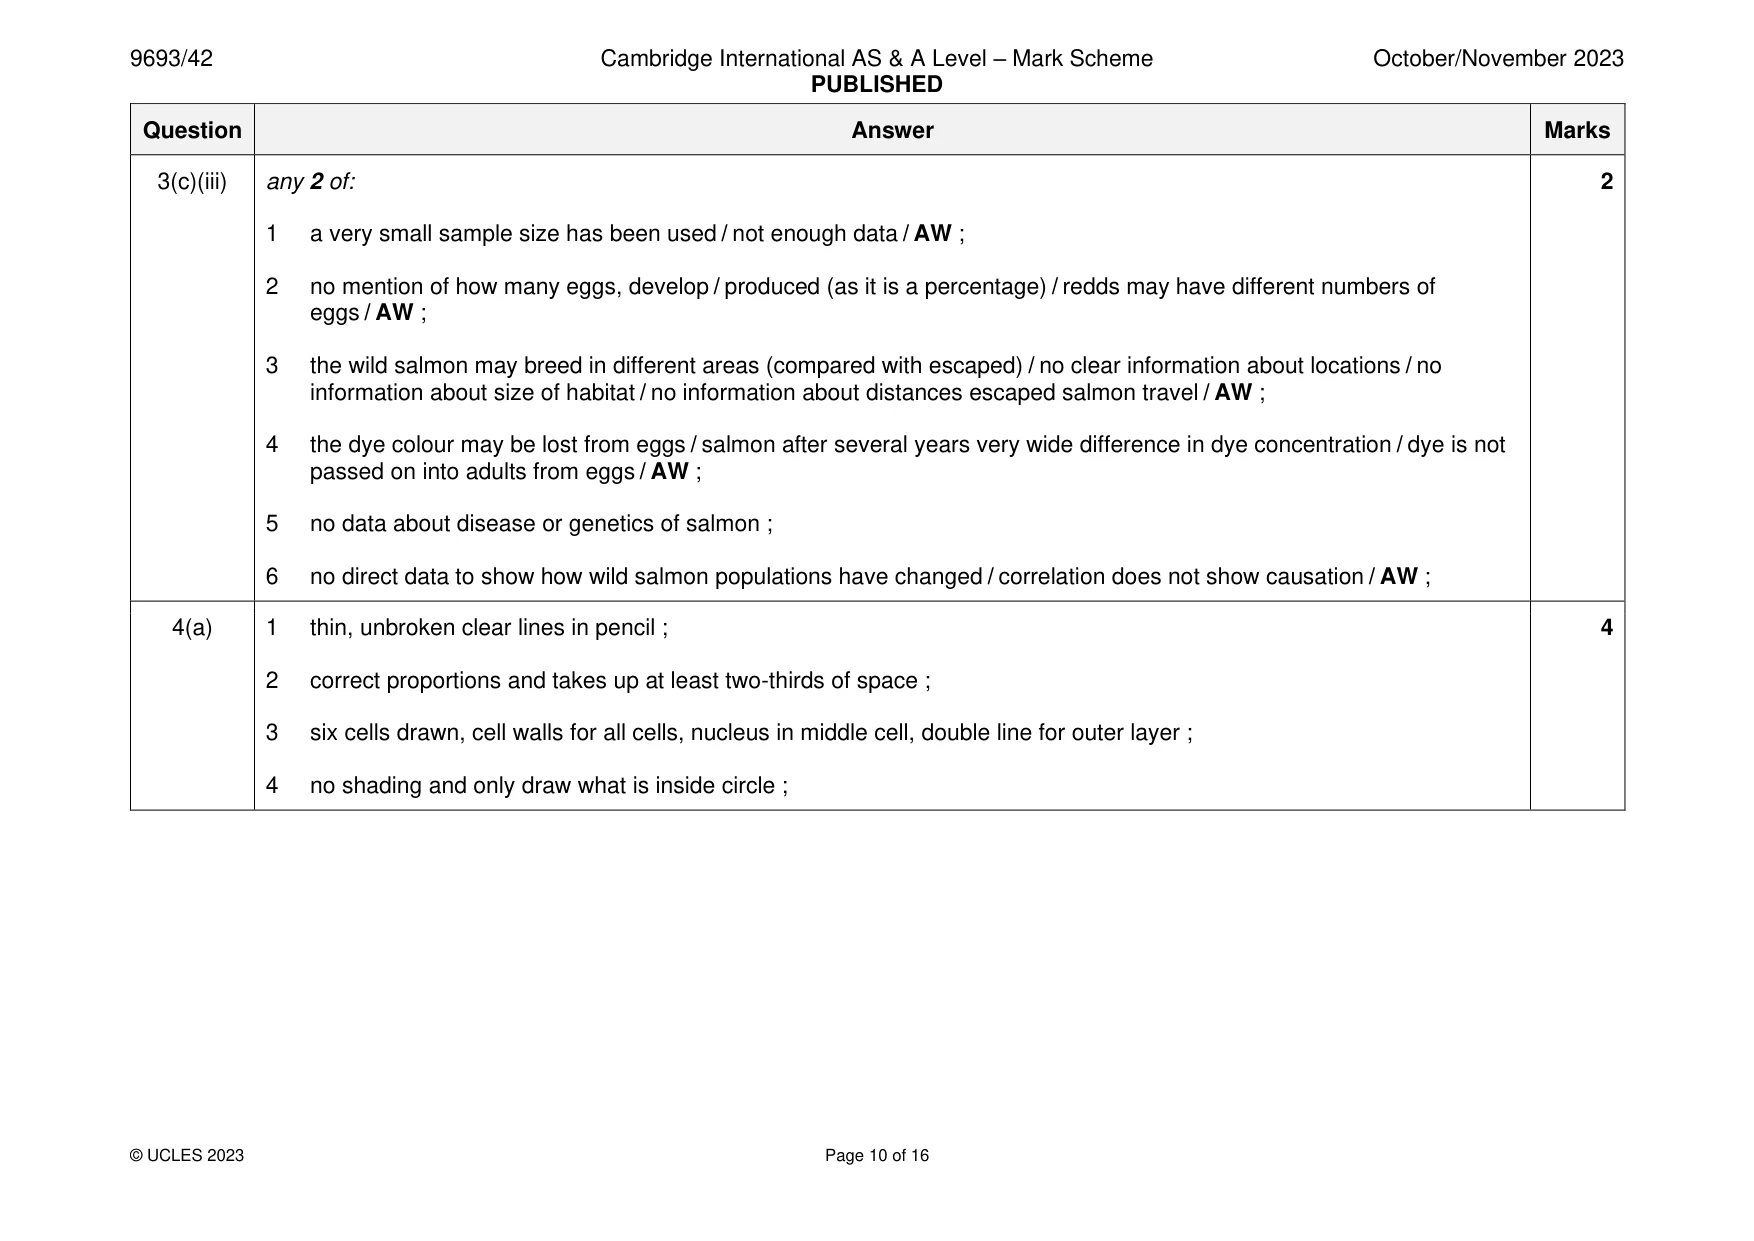
Mark scheme: 3(a) any 4 of: 4 1 brood salmon are used to produce eggs and sperm / AW ; 2 eggs / small fish / fry / alevins, kept in (indoor), hatcheries / tanks ; 3 transfer to, cages / nets, in sea / outdoors / AW ; 4 keep large and small fish apart / separate by age / AW ; 5 add feed / add feed pellets / AW ; 6 use of pesticides / antibiotics / vaccinations / AW ; 7 prevent predator action / AW ; 8 ocean currents supply oxygen / food / remove waste ; 3(b)(i) (82 / 100 53 =) 43 ; 1 3(b)(ii) any 2 of: 2 1 salmon live for more than one year / AW ; 2 more salmon escape each year / AW ; 3 damage to the cages / bad weather disrupting the cages / cages get larger holes over time / AW ; 4 number of wild salmon is decreasing / AW ; 5 increased number of salmon farms / more stock kept / AW ; 6 credit reason for decrease in number of wild salmon / AW ; 3(c)(i) any 1 of: 1 1 salmon that have lived for several years outside the farm will have less dye in body / will have been eating more wild food / AW ; 2 recently escaped salmon will have higher dye concentrations ; 3 egg sizes vary (so concentration varies) / wild salmon fertilised salmon so dye reduced ; 4 different amounts of dye were given to salmon when in the farm / some salmon ate more food when in the farm ; 3(c)(ii) any 4 of: 4 1 escaped salmon are able to breed / reproduce / AW ; 2 but egg viability / hatching rate is lower than wild salmon / do not develop as well as wild salmon / AW ; 3 escaped salmon breed for several years ; 4 shown by the wide range of dye in eggs ; 5 escaped salmon outcompeting wild salmon / consume more food / AW ; 6 wild salmon may lose breeding sites / habitats / AW ; 7 fewer wild salmon survive / proportion of wild salmon are decreasing / AW ; 8 salmon may pass on disease to the wild salmon ; 9 escaped salmon affect the gene pool / reduce genetic diversity / have weaker alleles / AW ; 3(c)(iii) any 2 of: 2 1 a very small sample size has been used / not enough data / AW ; 2 no mention of how many eggs, develop / produced (as it is a percentage) / redds may have different numbers of eggs / AW ; 3 the wild salmon may breed in different areas (compared with escaped) / no clear information about locations / no information about size of habitat / no information about distances escaped salmon travel / AW ; 4 the dye colour may be lost from eggs / salmon after several years very wide difference in dye concentration / dye is not passed on into adults from eggs / AW ; 5 no data about disease or genetics of salmon ; 6 no direct data to show how wild salmon populations have changed / correlation does not show causation / AW ;
Q4 · Mangrove forests are areas of environmental importance
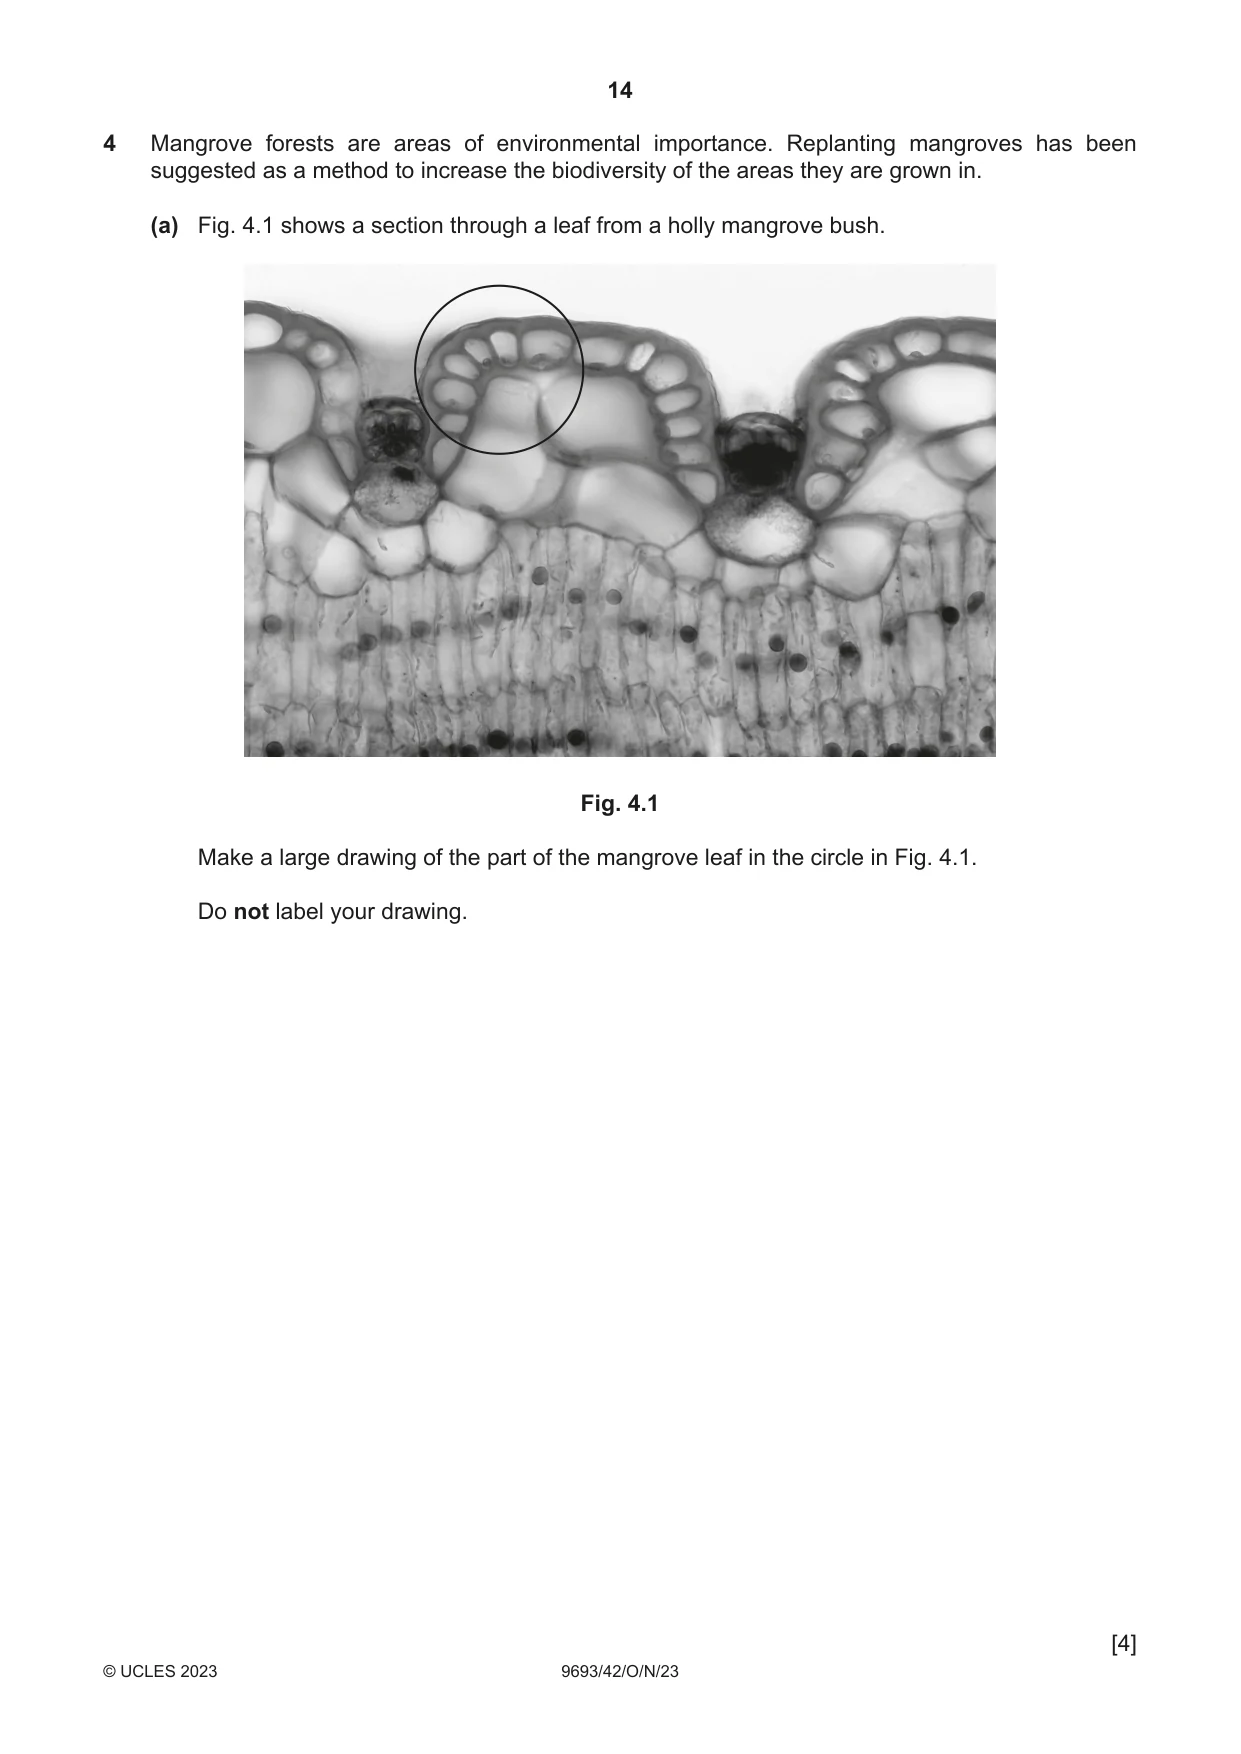
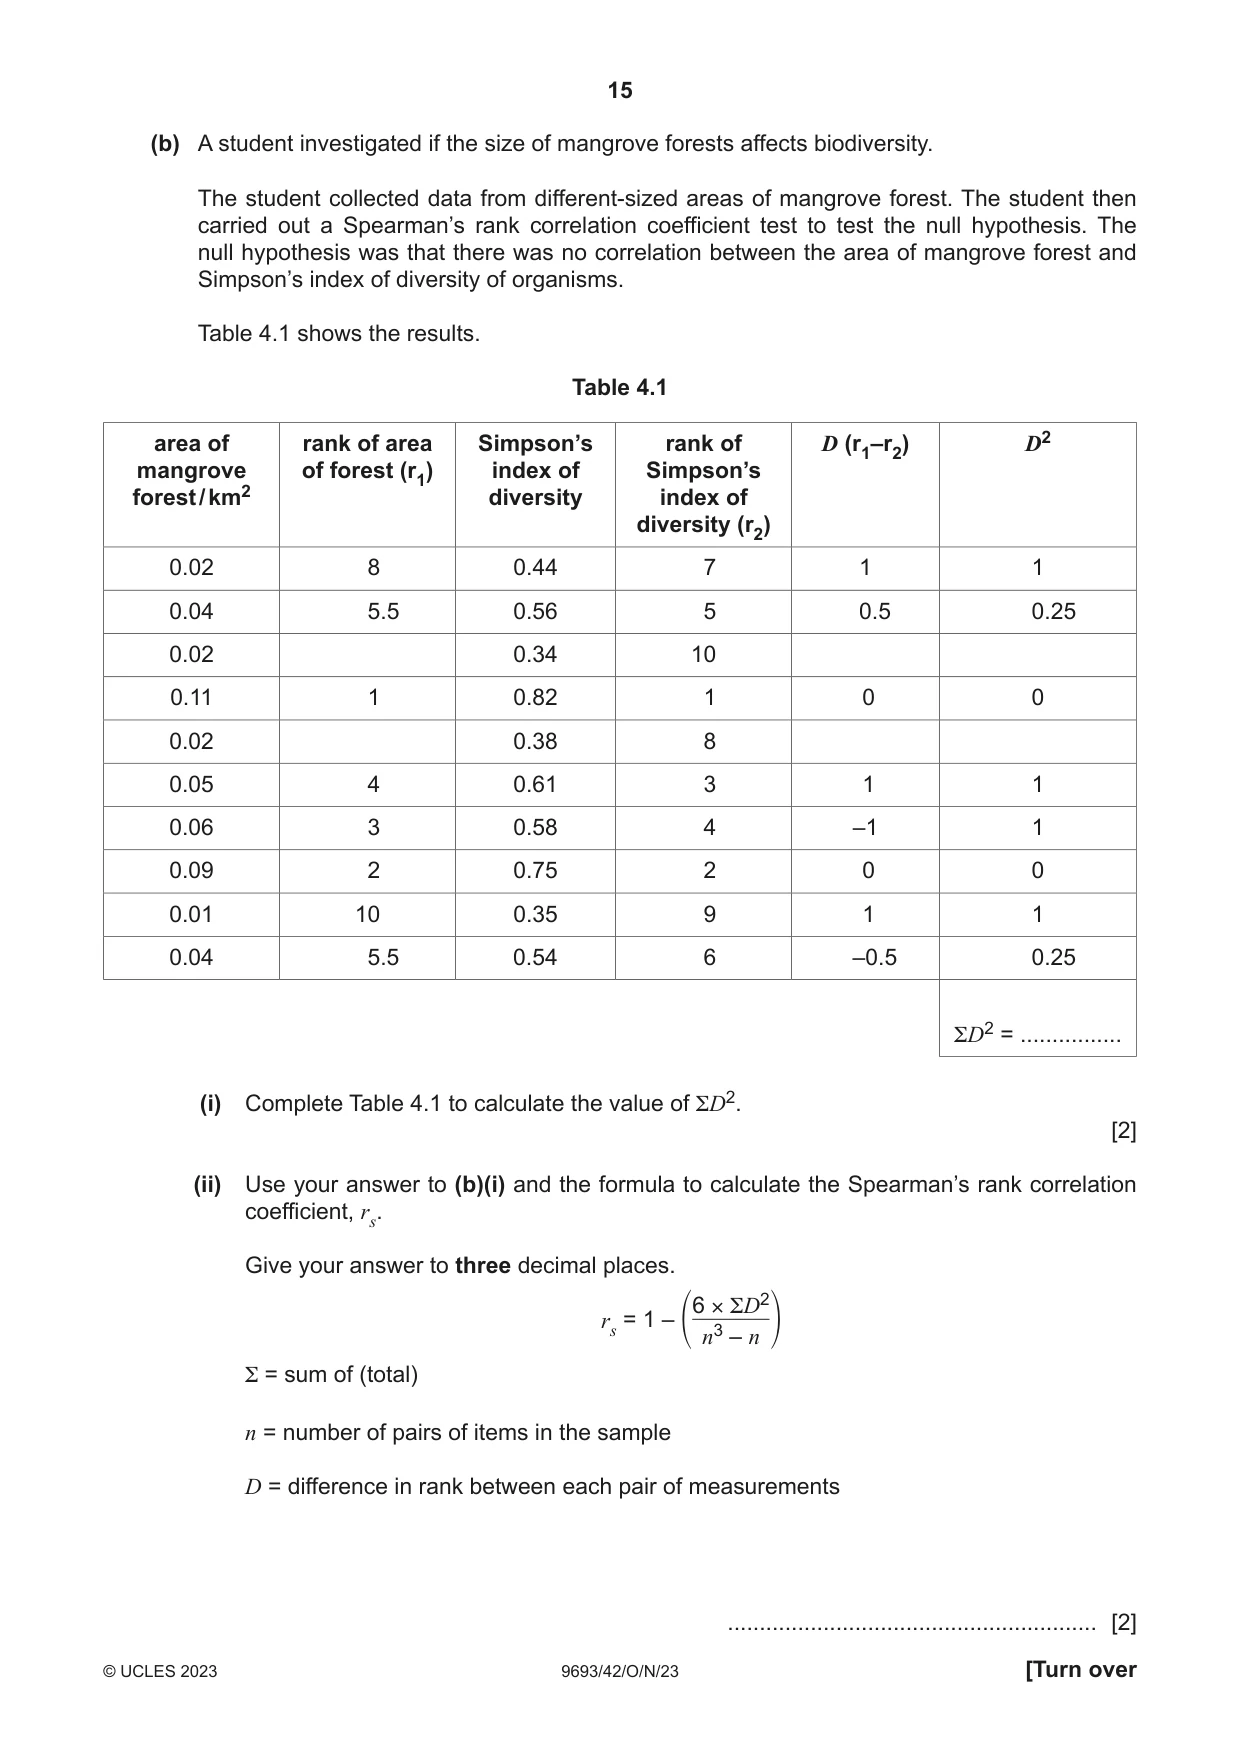
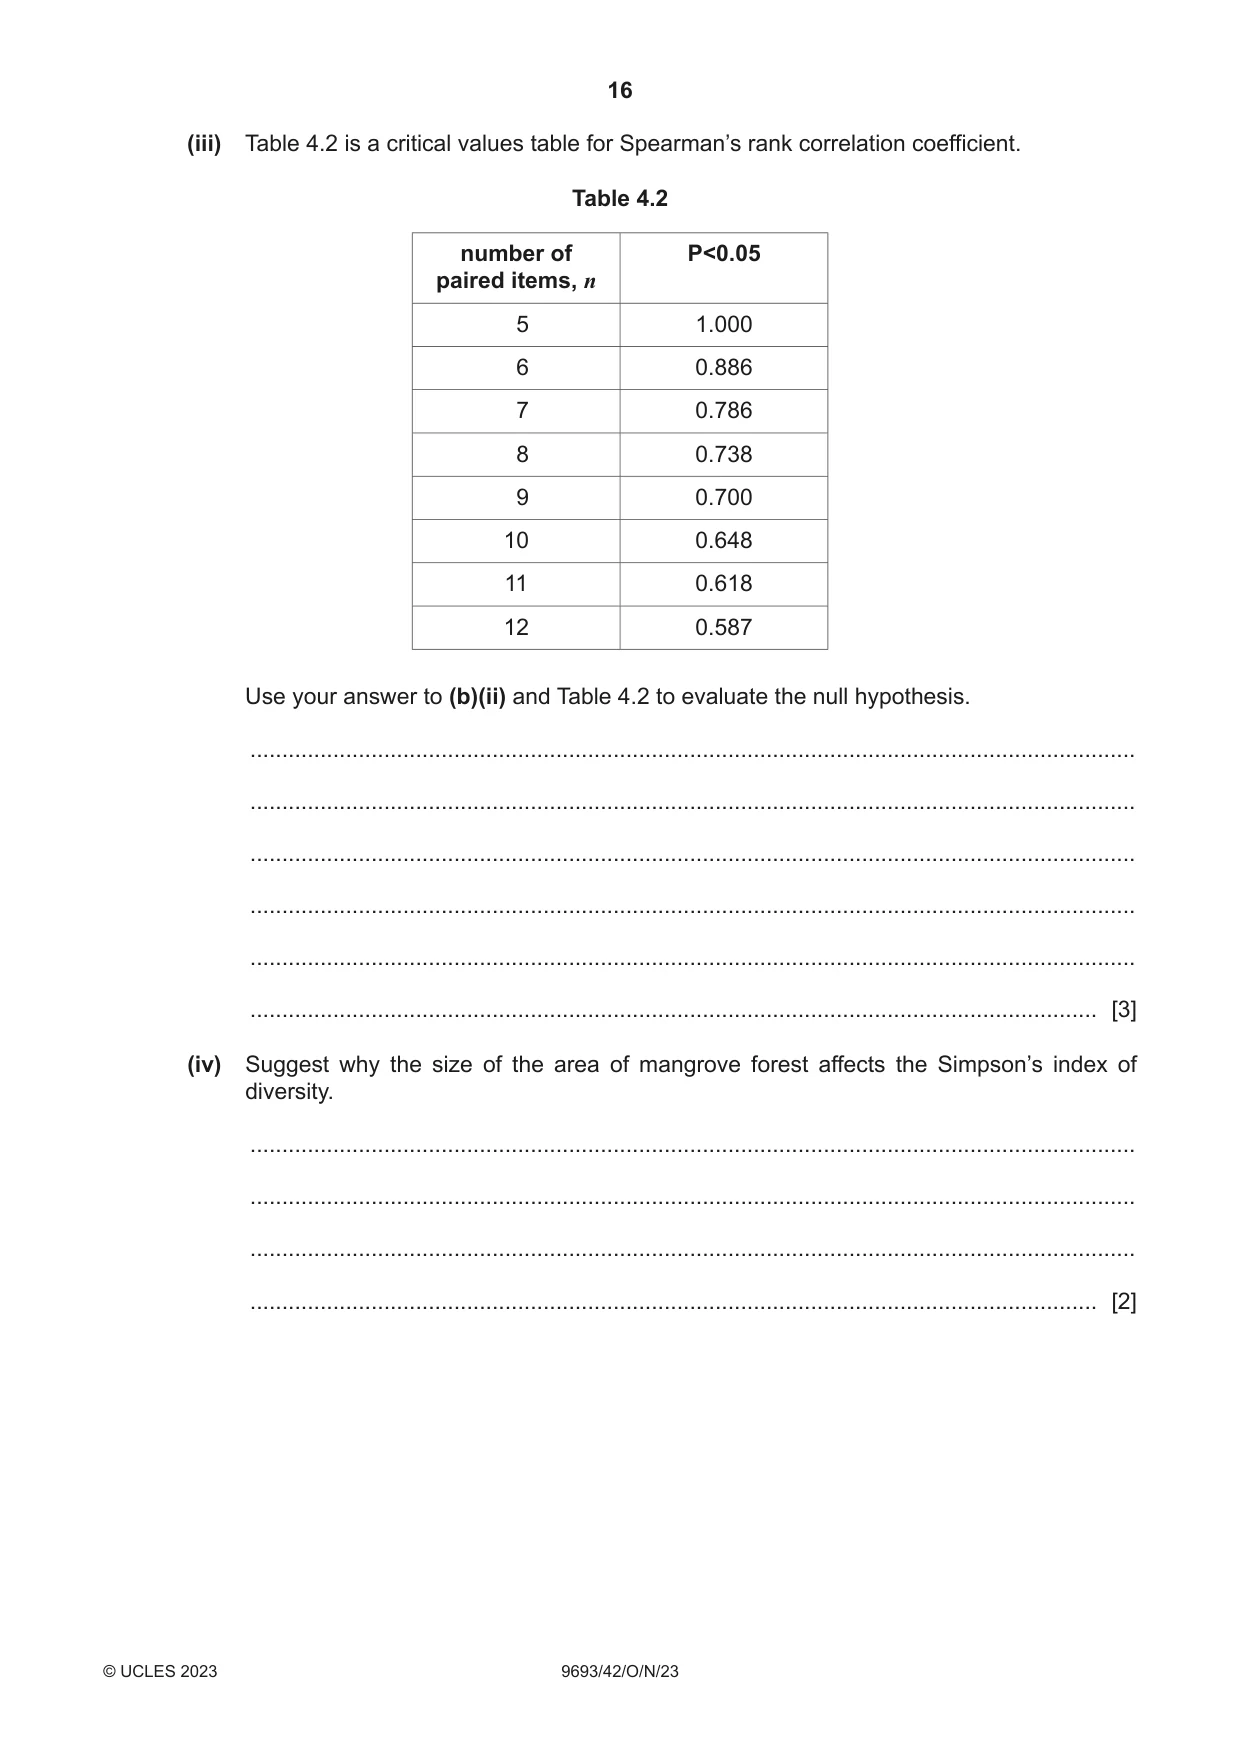
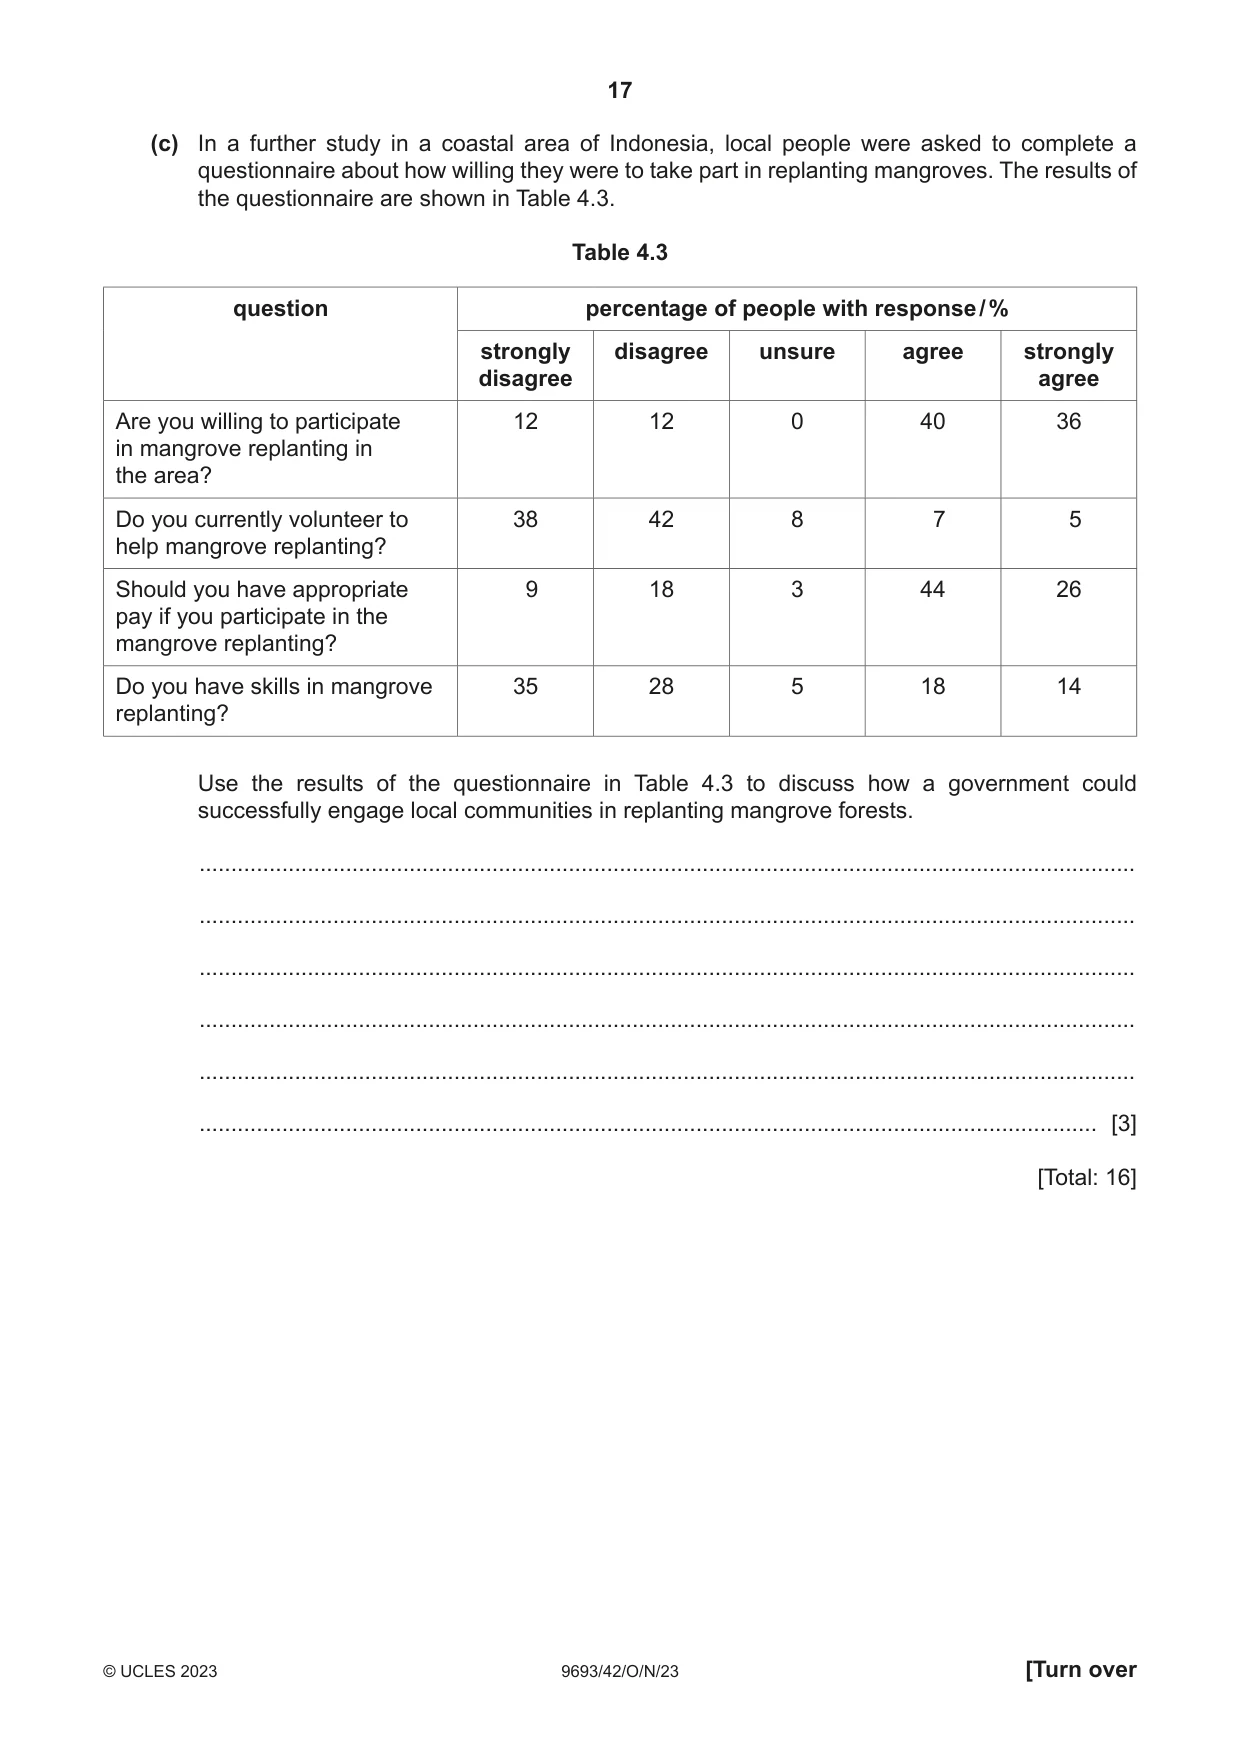
4 Mangrove forests are areas of environmental importance. Replanting mangroves has been suggested as a method to increase the biodiversity of the areas they are grown in. (a) Fig. 4.1 shows a section through a leaf from a holly mangrove bush. Fig. 4.1 Make a large drawing of the part of the mangrove leaf in the circle in Fig. 4.1. Do not label your drawing. [4] (b) A student investigated if the size of mangrove forests affects biodiversity. The student collected data from different-sized areas of mangrove forest. The student then carried out a Spearman’s rank correlation coefficient test to test the null hypothesis. The null hypothesis was that there was no correlation between the area of mangrove forest and Simpson’s index of diversity of organisms. Table 4.1 shows the results. Table 4.1 area of rank of area Simpson’s rank of D (r1–r2) D2 mangrove of forest (r1) index of Simpson’s forest / km2 diversity index of diversity (r2) 0.02 8 0.44 7 1 1 0.04 5.5 0.56 5 0.5 0.25 0.02 0.34 10 0.11 1 0.82 1 0 0 0.02 0.38 8 0.05 4 0.61 3 1 1 0.06 3 0.58 4 –1 1 0.09 2 0.75 2 0 0 0.01 10 0.35 9 1 1 0.04 5.5 0.54 6 –0.5 0.25 ΣD2 = ................ (i) Complete Table 4.1 to calculate the value of ΣD2. [2] (ii) Use your answer to (b)(i) and the formula to calculate the Spearman’s rank correlation coefficient, rs. Give your answer to three decimal places. 6 × ΣD2 rs = 1 – n3 – n Σ = sum of (total) n = number of pairs of items in the sample D = difference in rank between each pair of measurements .......................................................... [2] (iii) Table 4.2 is a critical values table for Spearman’s rank correlation coefficient. Table 4.2 number of P<0.05 paired items, n 5 1.000 6 0.886 7 0.786 8 0.738 9 0.700 10 0.648 11 0.618 12 0.587 Use your answer to (b)(ii) and Table 4.2 to evaluate the null hypothesis. ........................................................................................................................................... ........................................................................................................................................... ........................................................................................................................................... ........................................................................................................................................... ........................................................................................................................................... ..................................................................................................................................... [3] (iv) Suggest why the size of the area of mangrove forest affects the Simpson’s index of diversity. ........................................................................................................................................... ........................................................................................................................................... ........................................................................................................................................... ..................................................................................................................................... [2] (c) In a further study in a coastal area of Indonesia, local people were asked to complete a questionnaire about how willing they were to take part in replanting mangroves. The results of the questionnaire are shown in Table 4.3. Table 4.3 question percentage of people with response / % strongly disagree unsure agree strongly disagree agree Are you willing to participate 12 12 0 40 36 in mangrove replanting in the area? Do you currently volunteer to 38 42 8 7 5 help mangrove replanting? Should you have appropriate 9 18 3 44 26 pay if you participate in the mangrove replanting? Do you have skills in mangrove 35 28 5 18 14 replanting? Use the results of the questionnaire in Table 4.3 to discuss how a government could successfully engage local communities in replanting mangrove forests. ................................................................................................................................................... ................................................................................................................................................... ................................................................................................................................................... ................................................................................................................................................... ................................................................................................................................................... ............................................................................................................................................. [3] [Total: 16]
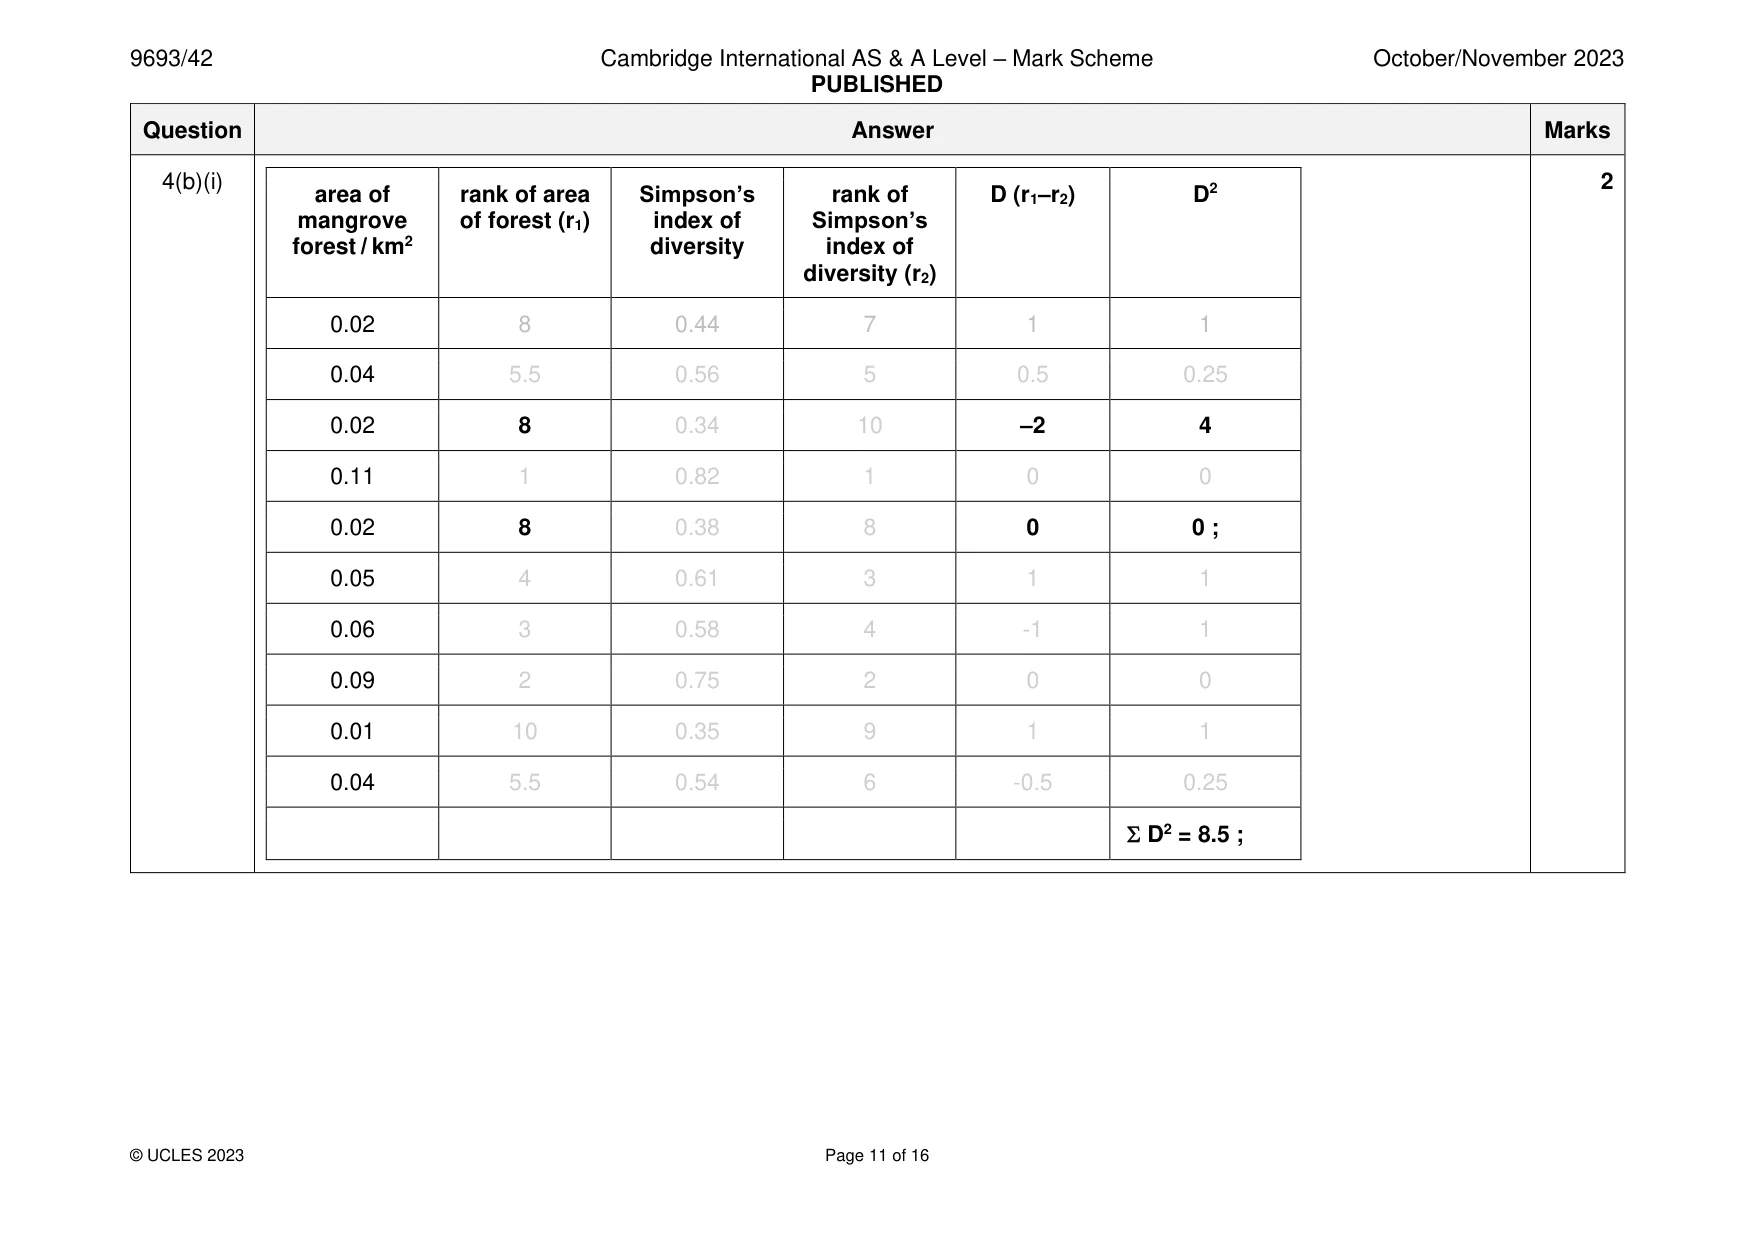
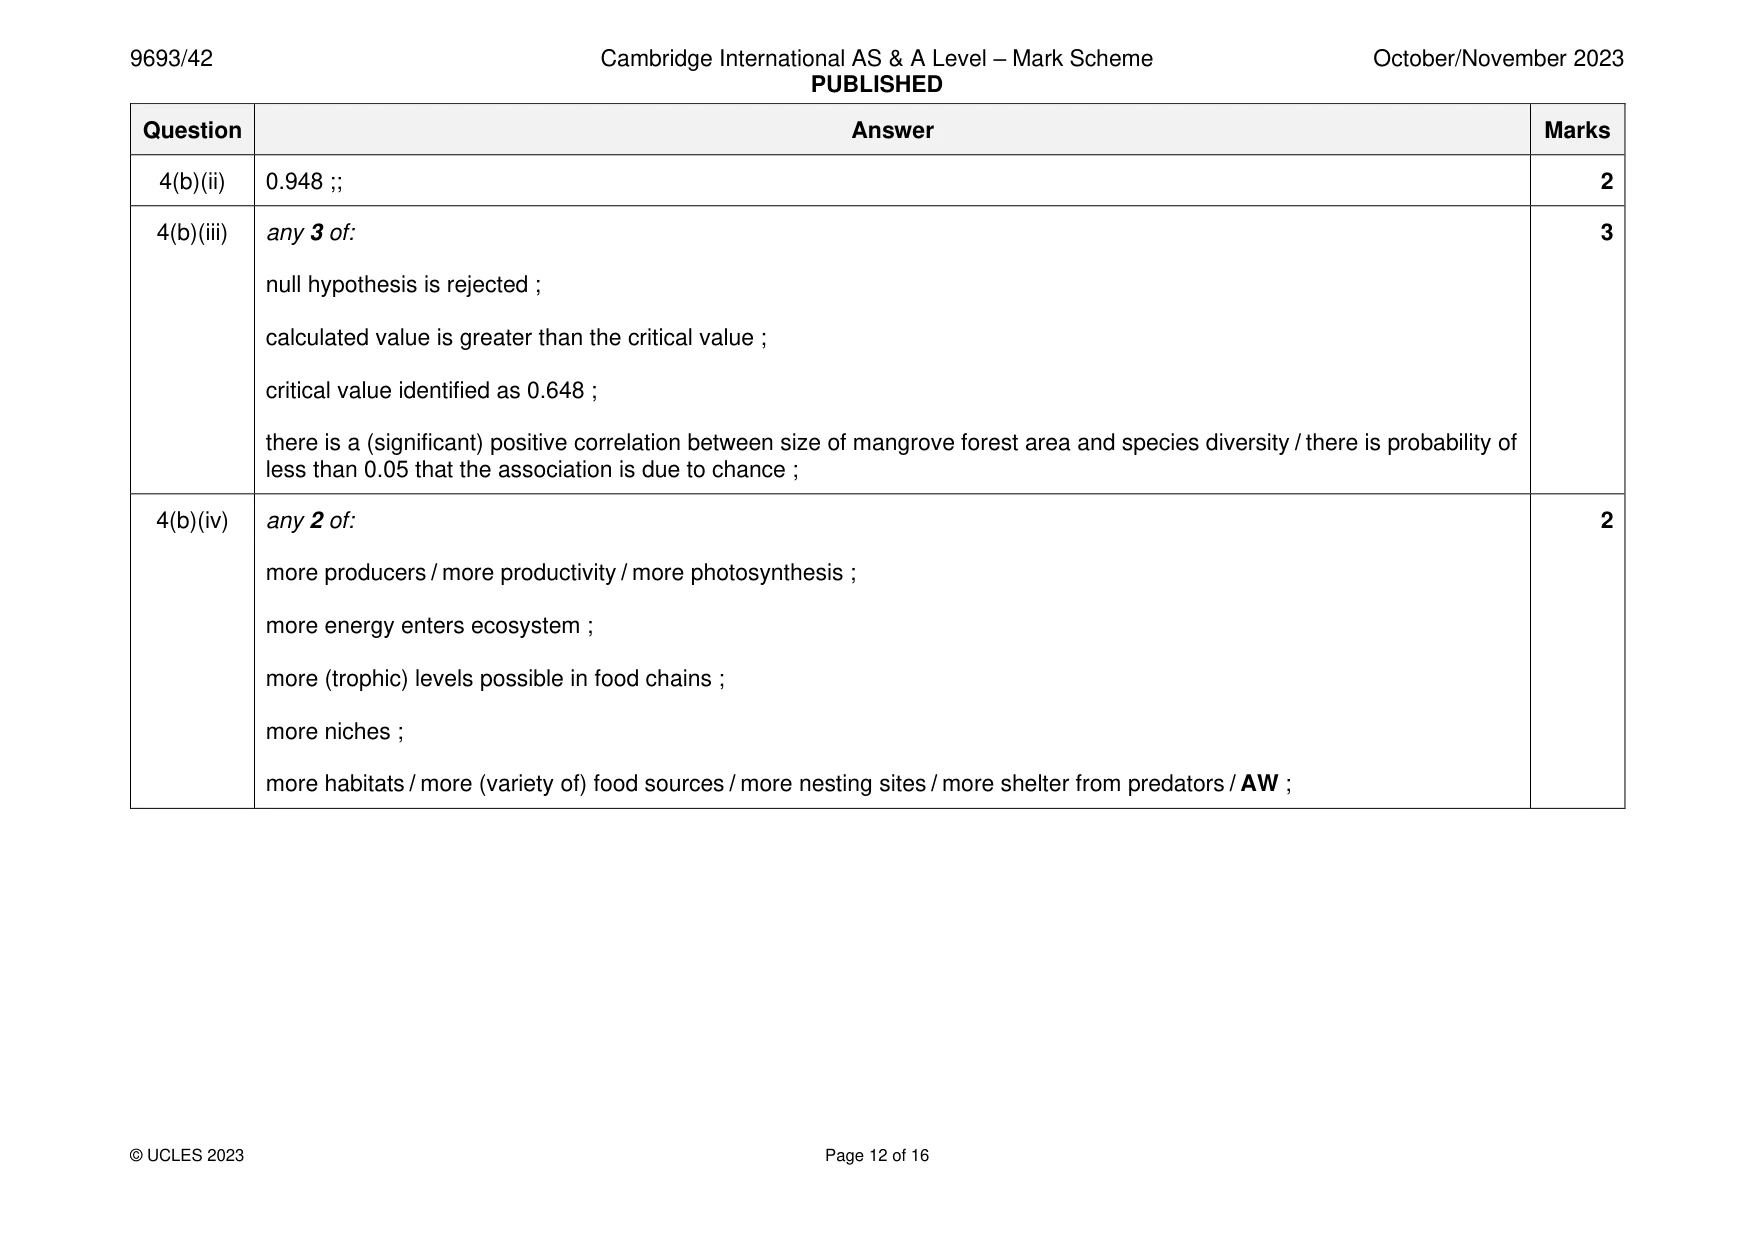
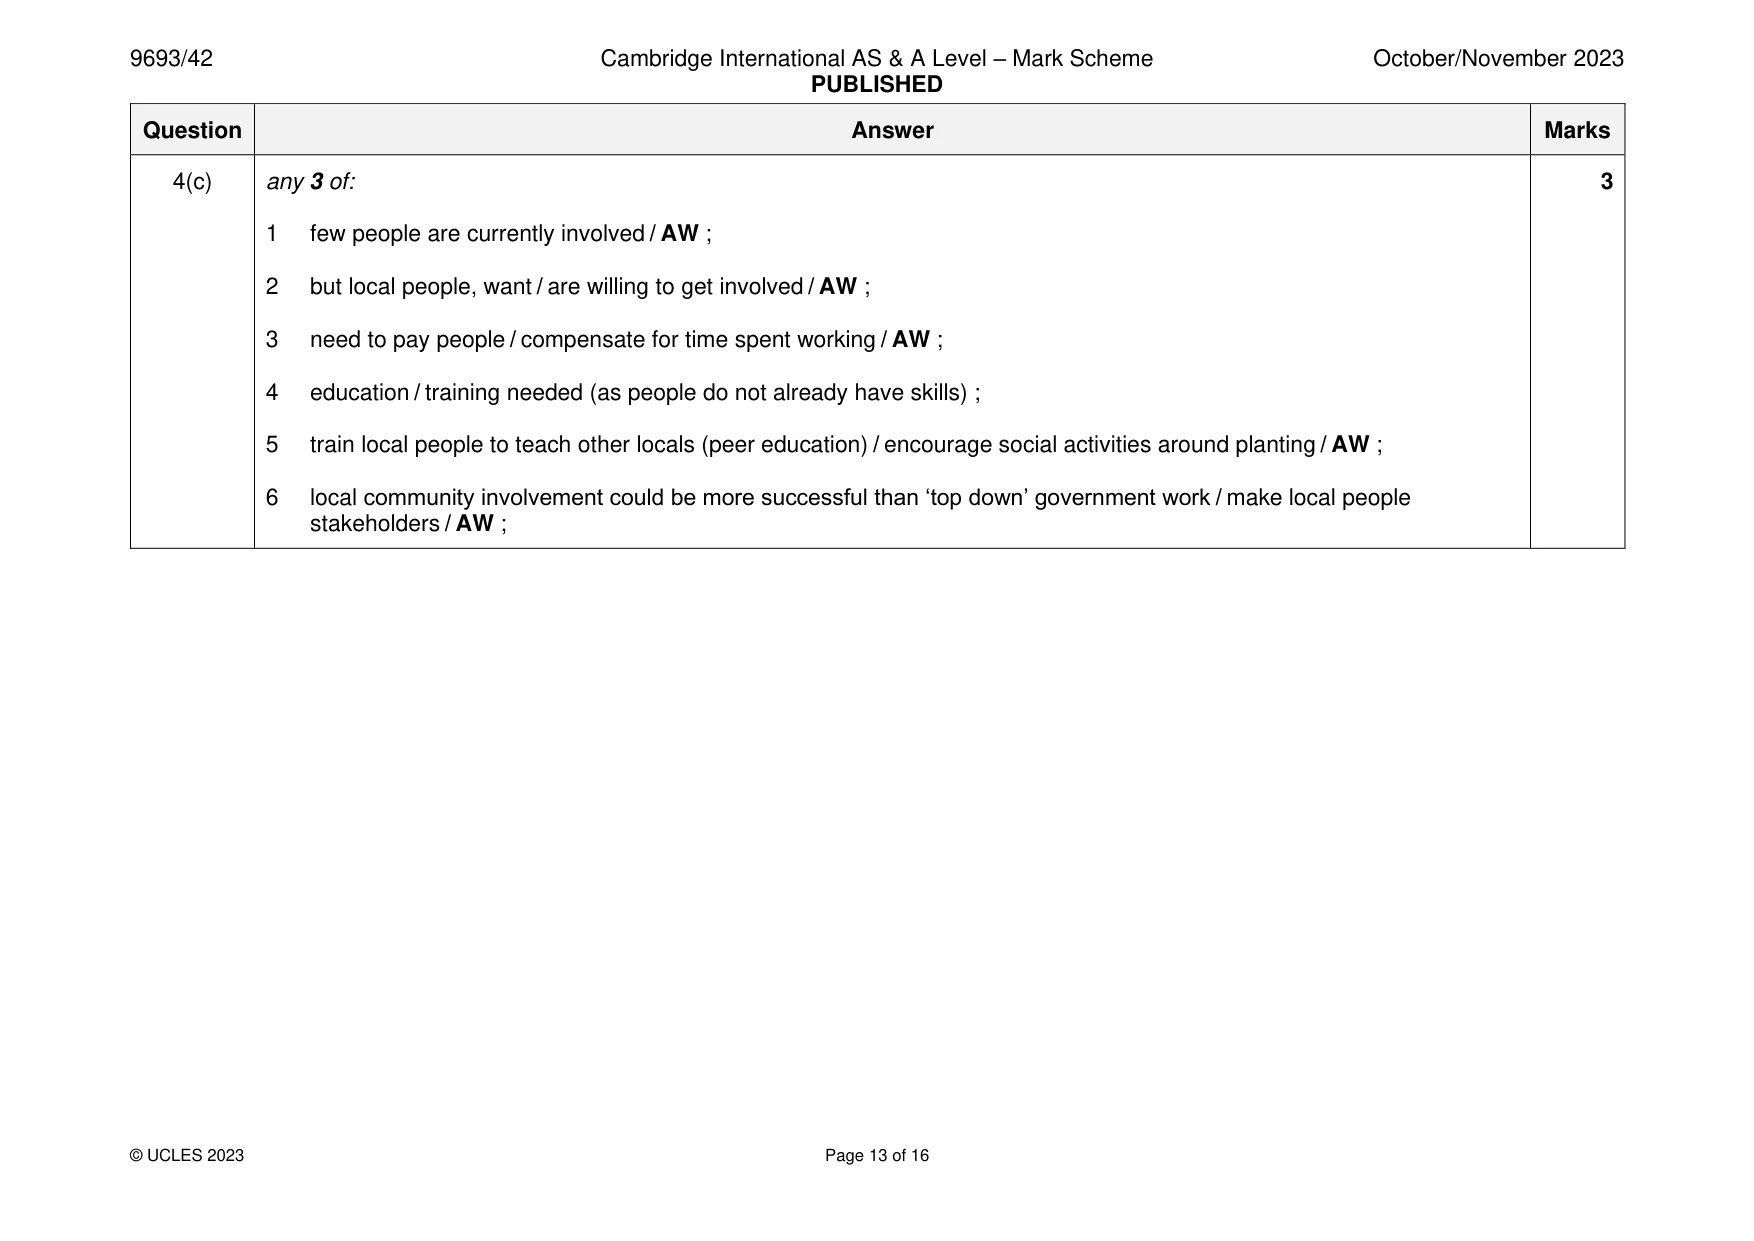
Mark scheme: 4(a) 1 thin, unbroken clear lines in pencil ; 4 2 correct proportions and takes up at least two-thirds of space ; 3 six cells drawn, cell walls for all cells, nucleus in middle cell, double line for outer layer ; 4 no shading and only draw what is inside circle ; 4(b)(i) 2 area of rank of area Simpson’s rank of D (r1–r2) D2 mangrove of forest (r1) index of Simpson’s forest / km2 diversity index of diversity (r2) 0.02 8 0.44 7 1 1 0.04 5.5 0.56 5 0.5 0.25 0.02 8 0.34 10 –2 4 0.11 1 0.82 1 0 0 0.02 8 0.38 8 0 0 ; 0.05 4 0.61 3 1 1 0.06 3 0.58 4 -1 1 0.09 2 0.75 2 0 0 0.01 10 0.35 9 1 1 0.04 5.5 0.54 6 -0.5 0.25 D2 = 8.5 ; 4(b)(ii) 0.948 ;; 2 4(b)(iii) any 3 of: 3 null hypothesis is rejected ; calculated value is greater than the critical value ; critical value identified as 0.648 ; there is a (significant) positive correlation between size of mangrove forest area and species diversity / there is probability of less than 0.05 that the association is due to chance ; 4(b)(iv) any 2 of: 2 more producers / more productivity / more photosynthesis ; more energy enters ecosystem ; more (trophic) levels possible in food chains ; more niches ; more habitats / more (variety of) food sources / more nesting sites / more shelter from predators / AW ; 4(c) any 3 of: 3 1 few people are currently involved / AW ; 2 but local people, want / are willing to get involved / AW ; 3 need to pay people / compensate for time spent working / AW ; 4 education / training needed (as people do not already have skills) ; 5 train local people to teach other locals (peer education) / encourage social activities around planting / AW ; 6 local community involvement could be more successful than ‘top down’ government work / make local people stakeholders / AW ;
Q5 · The rate of photosynthesis of producer organisms can be affected by many abiotic and…
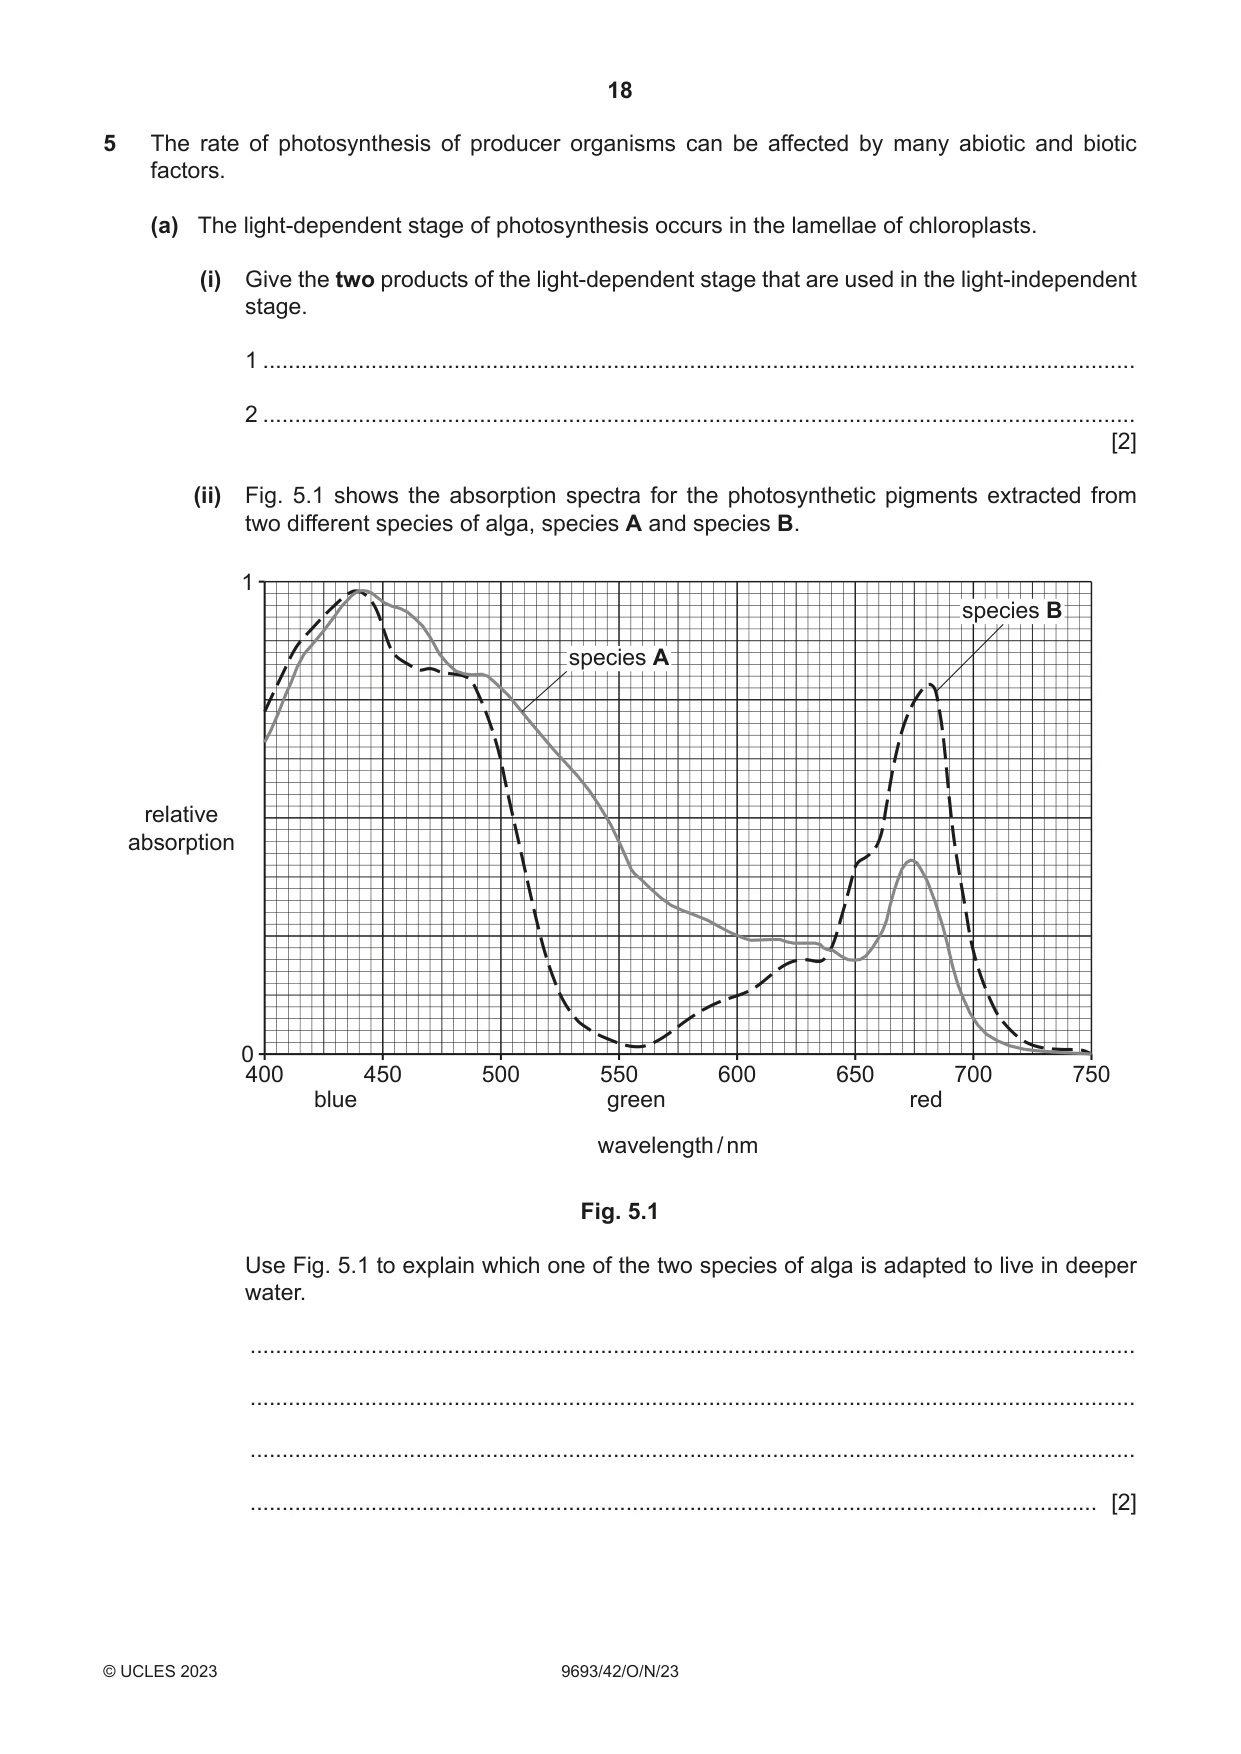
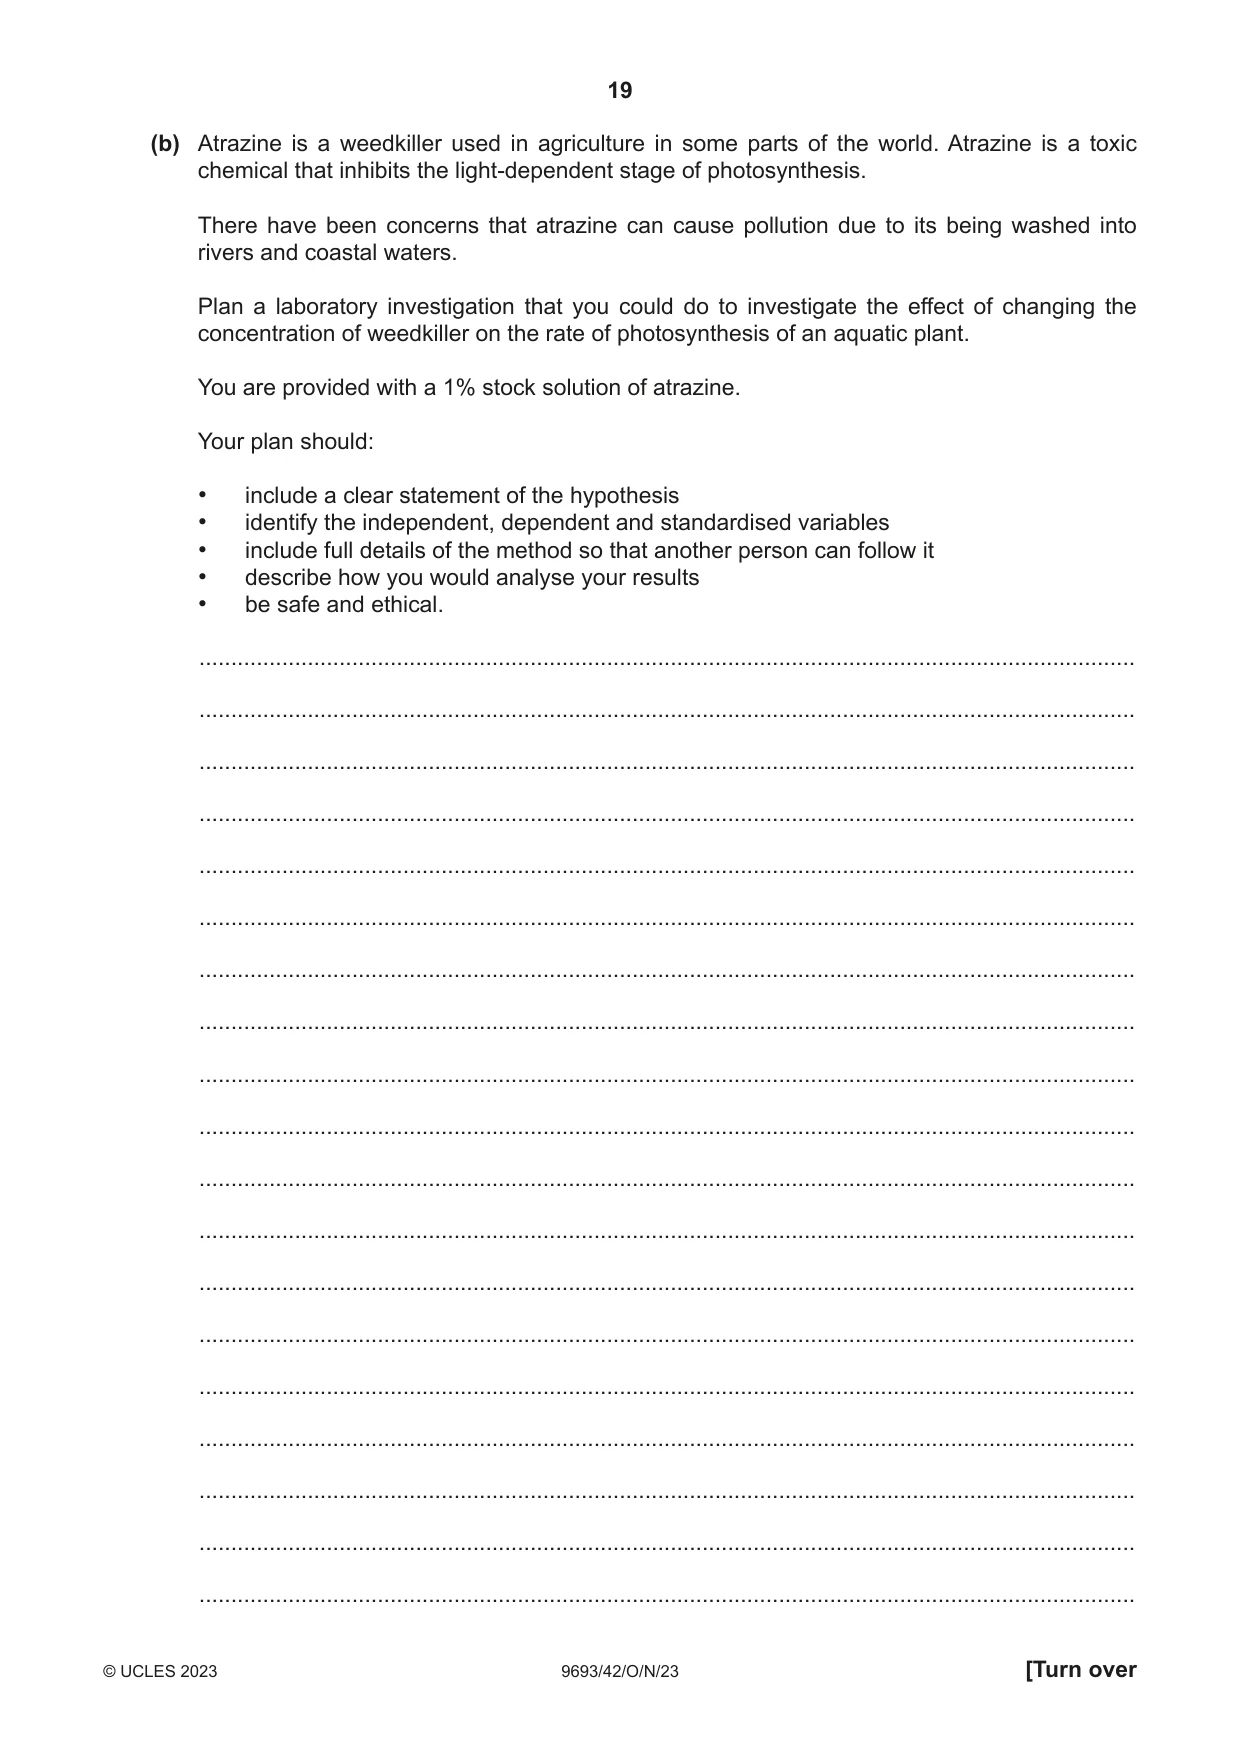
5 The rate of photosynthesis of producer organisms can be affected by many abiotic and biotic factors. (a) The light-dependent stage of photosynthesis occurs in the lamellae of chloroplasts. (i) Give the two products of the light-dependent stage that are used in the light-independent stage. 1 ......................................................................................................................................... 2 ......................................................................................................................................... [2] (ii) Fig. 5.1 shows the absorption spectra for the photosynthetic pigments extracted from two different species of alga, species A and species B. 1 species B species A relative absorption 0 400 450 500 550 600 650 700 750 blue green red wavelength / nm Fig. 5.1 Use Fig. 5.1 to explain which one of the two species of alga is adapted to live in deeper water. ........................................................................................................................................... ........................................................................................................................................... ........................................................................................................................................... ..................................................................................................................................... [2] (b) Atrazine is a weedkiller used in agriculture in some parts of the world. Atrazine is a toxic chemical that inhibits the light-dependent stage of photosynthesis. There have been concerns that atrazine can cause pollution due to its being washed into rivers and coastal waters. Plan a laboratory investigation that you could do to investigate the effect of changing the concentration of weedkiller on the rate of photosynthesis of an aquatic plant. You are provided with a 1% stock solution of atrazine. Your plan should: • include a clear statement of the hypothesis • identify the independent, dependent and standardised variables • include full details of the method so that another person can follow it • describe how you would analyse your results • be safe and ethical. ................................................................................................................................................... ................................................................................................................................................... ................................................................................................................................................... ................................................................................................................................................... ................................................................................................................................................... ................................................................................................................................................... ................................................................................................................................................... ................................................................................................................................................... ................................................................................................................................................... ................................................................................................................................................... ................................................................................................................................................... ................................................................................................................................................... ................................................................................................................................................... ................................................................................................................................................... ................................................................................................................................................... ................................................................................................................................................... ................................................................................................................................................... ................................................................................................................................................... ................................................................................................................................................... ................................................................................................................................................... ................................................................................................................................................... ................................................................................................................................................... ................................................................................................................................................... ................................................................................................................................................... ................................................................................................................................................... ................................................................................................................................................... ................................................................................................................................................... ................................................................................................................................................... ................................................................................................................................................... ................................................................................................................................................... ................................................................................................................................................... ................................................................................................................................................... ................................................................................................................................................... ........................................................................................................................................... [11] [Total: 15] The boundaries and names shown, the designations used and the presentation of material on any maps contained in this question paper/insert do not imply official endorsement or acceptance by Cambridge Assessment International Education concerning the legal status of any country, territory, or area or any of its authorities, or of the delimitation of its frontiers or boundaries.
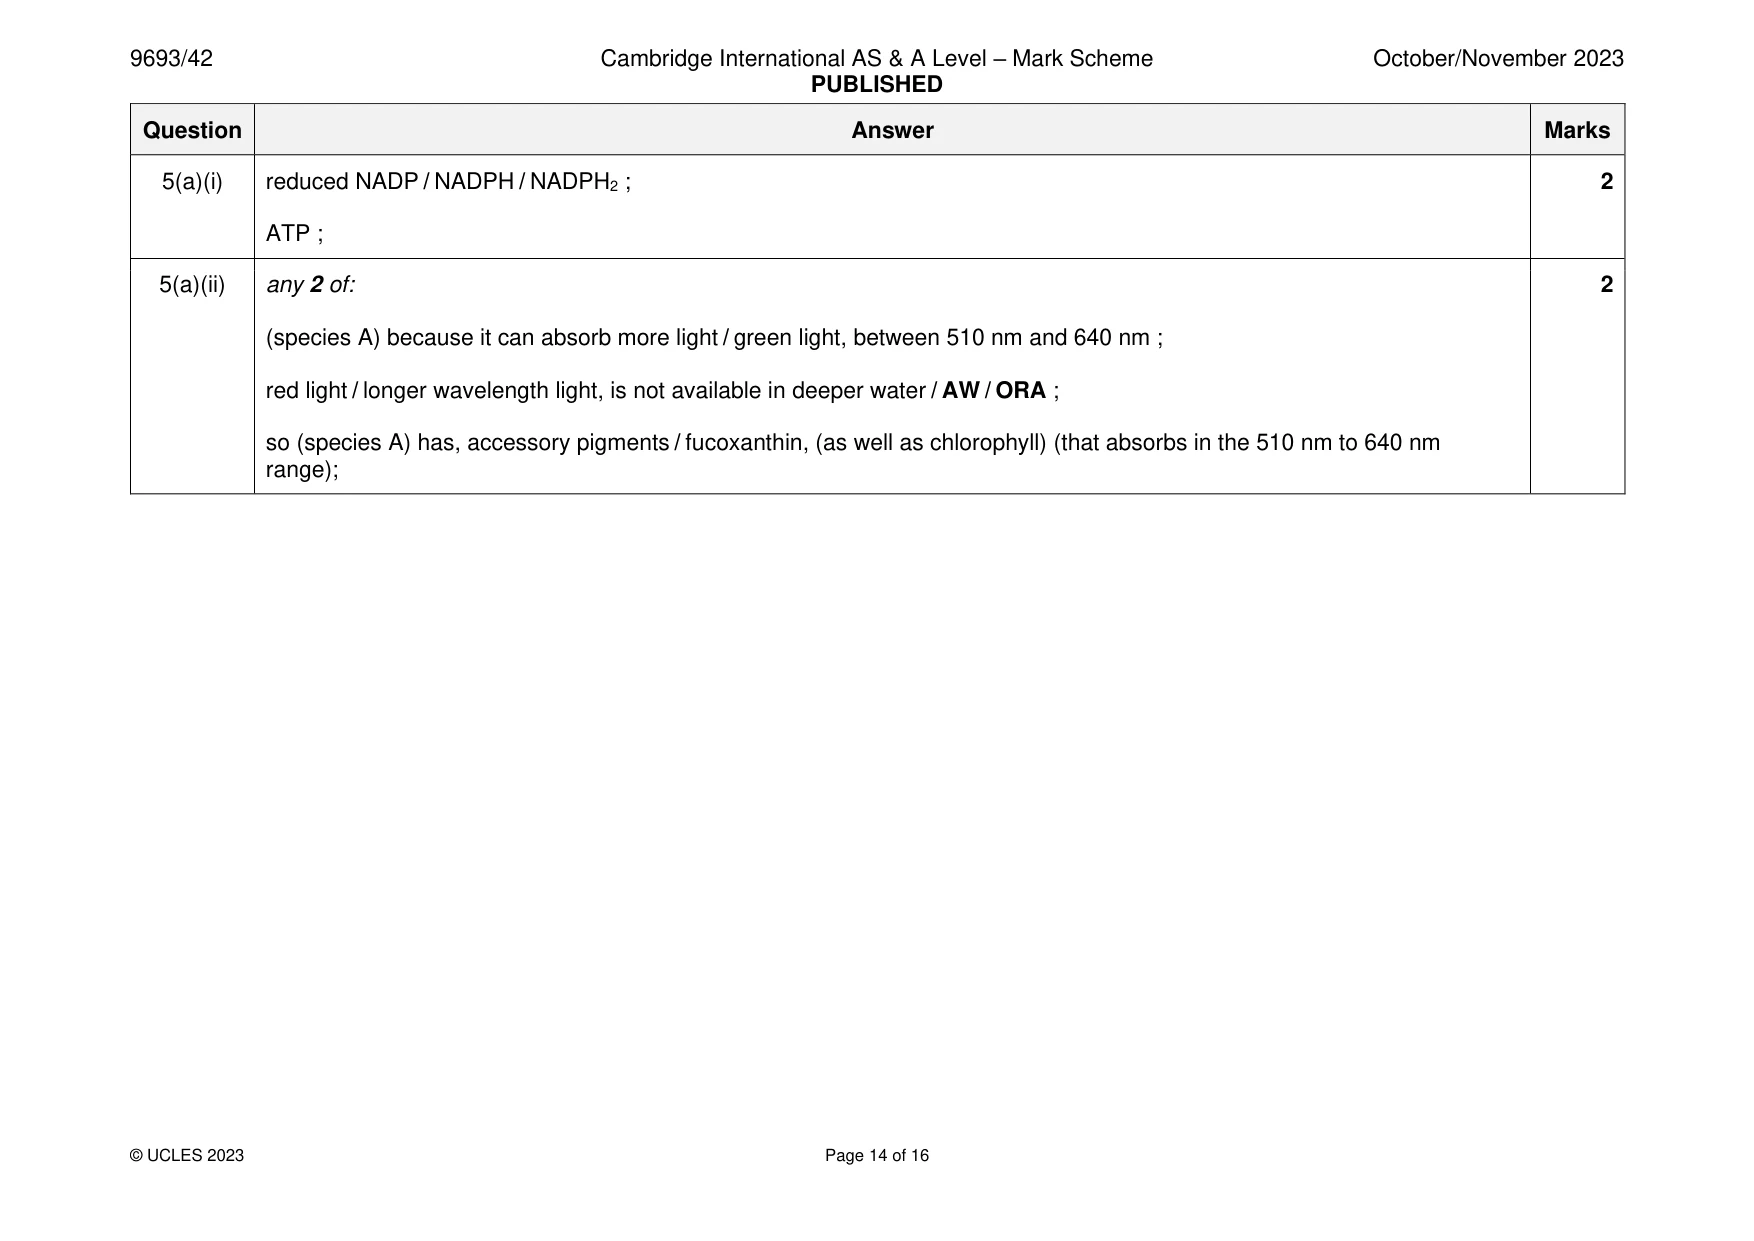
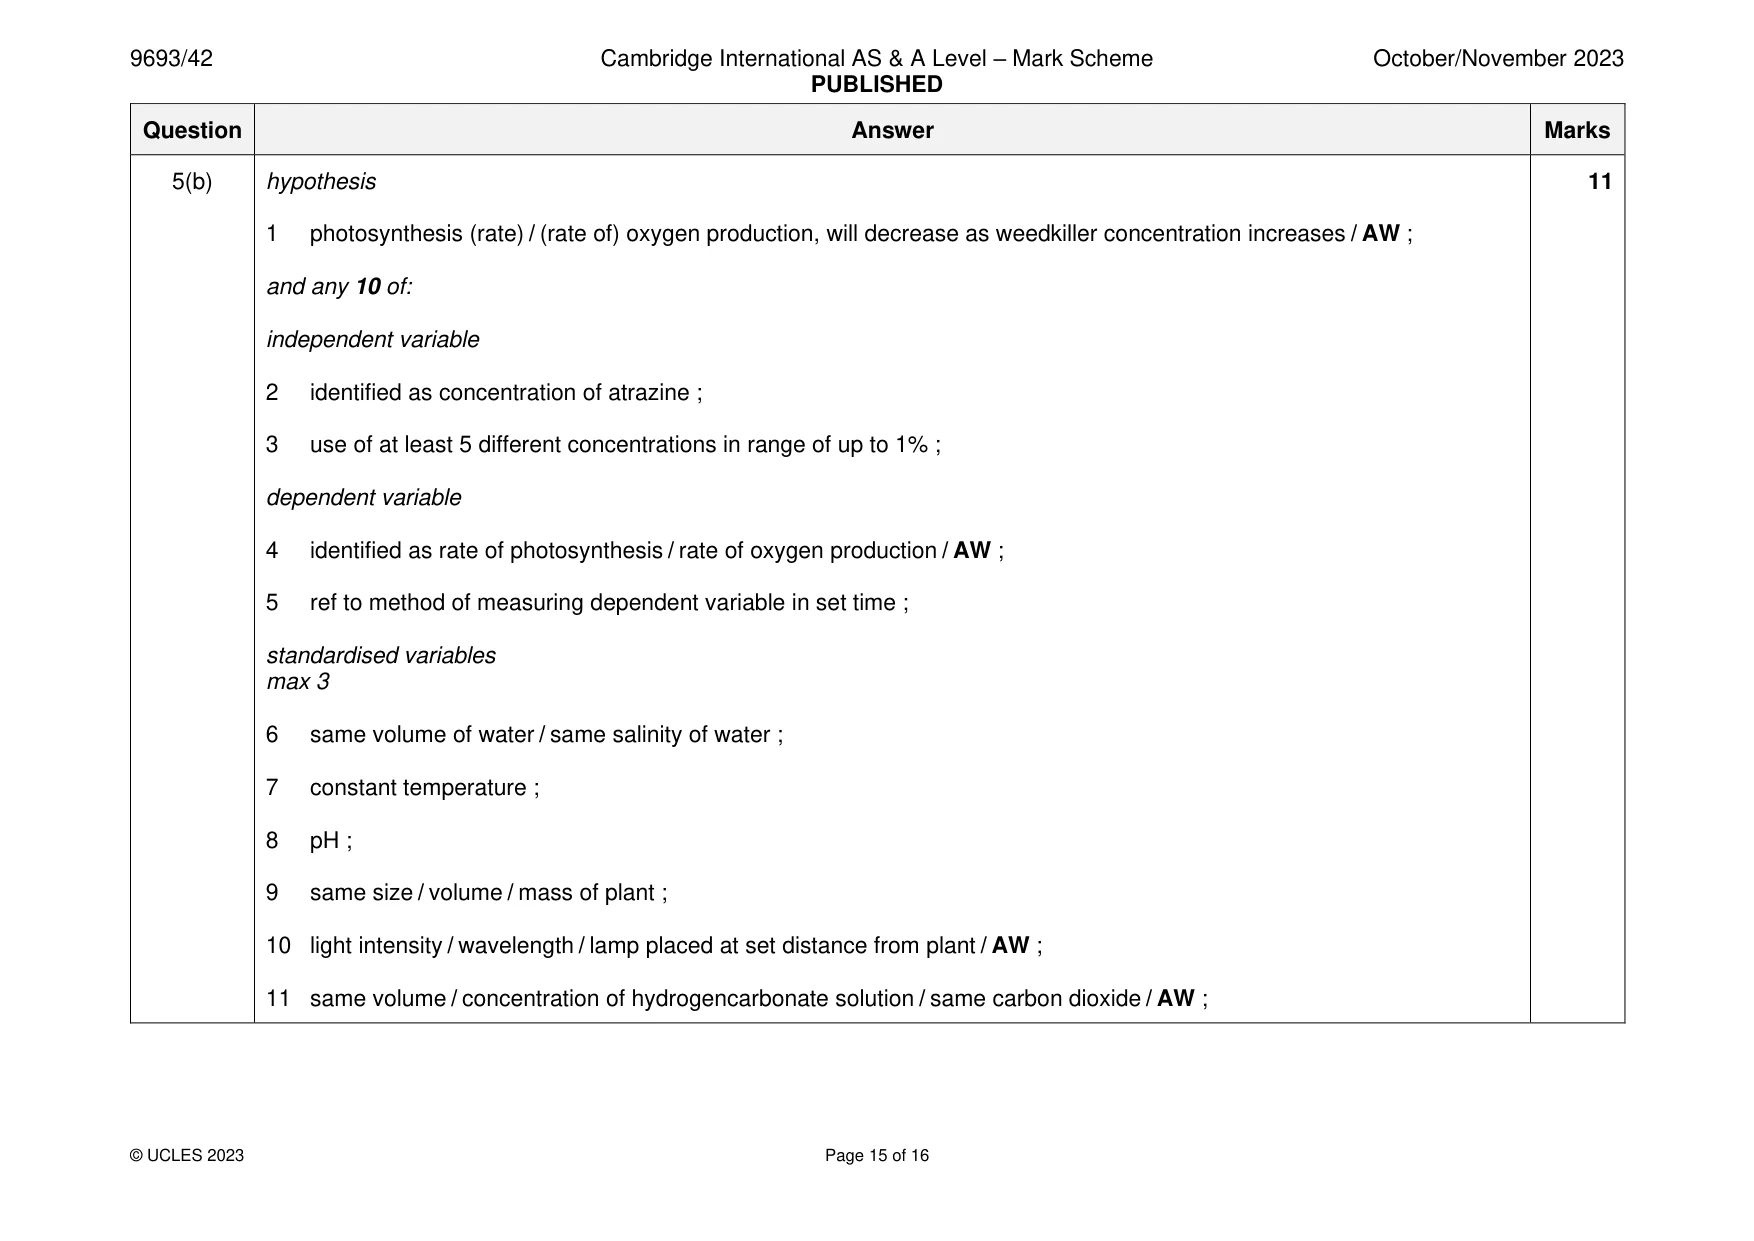
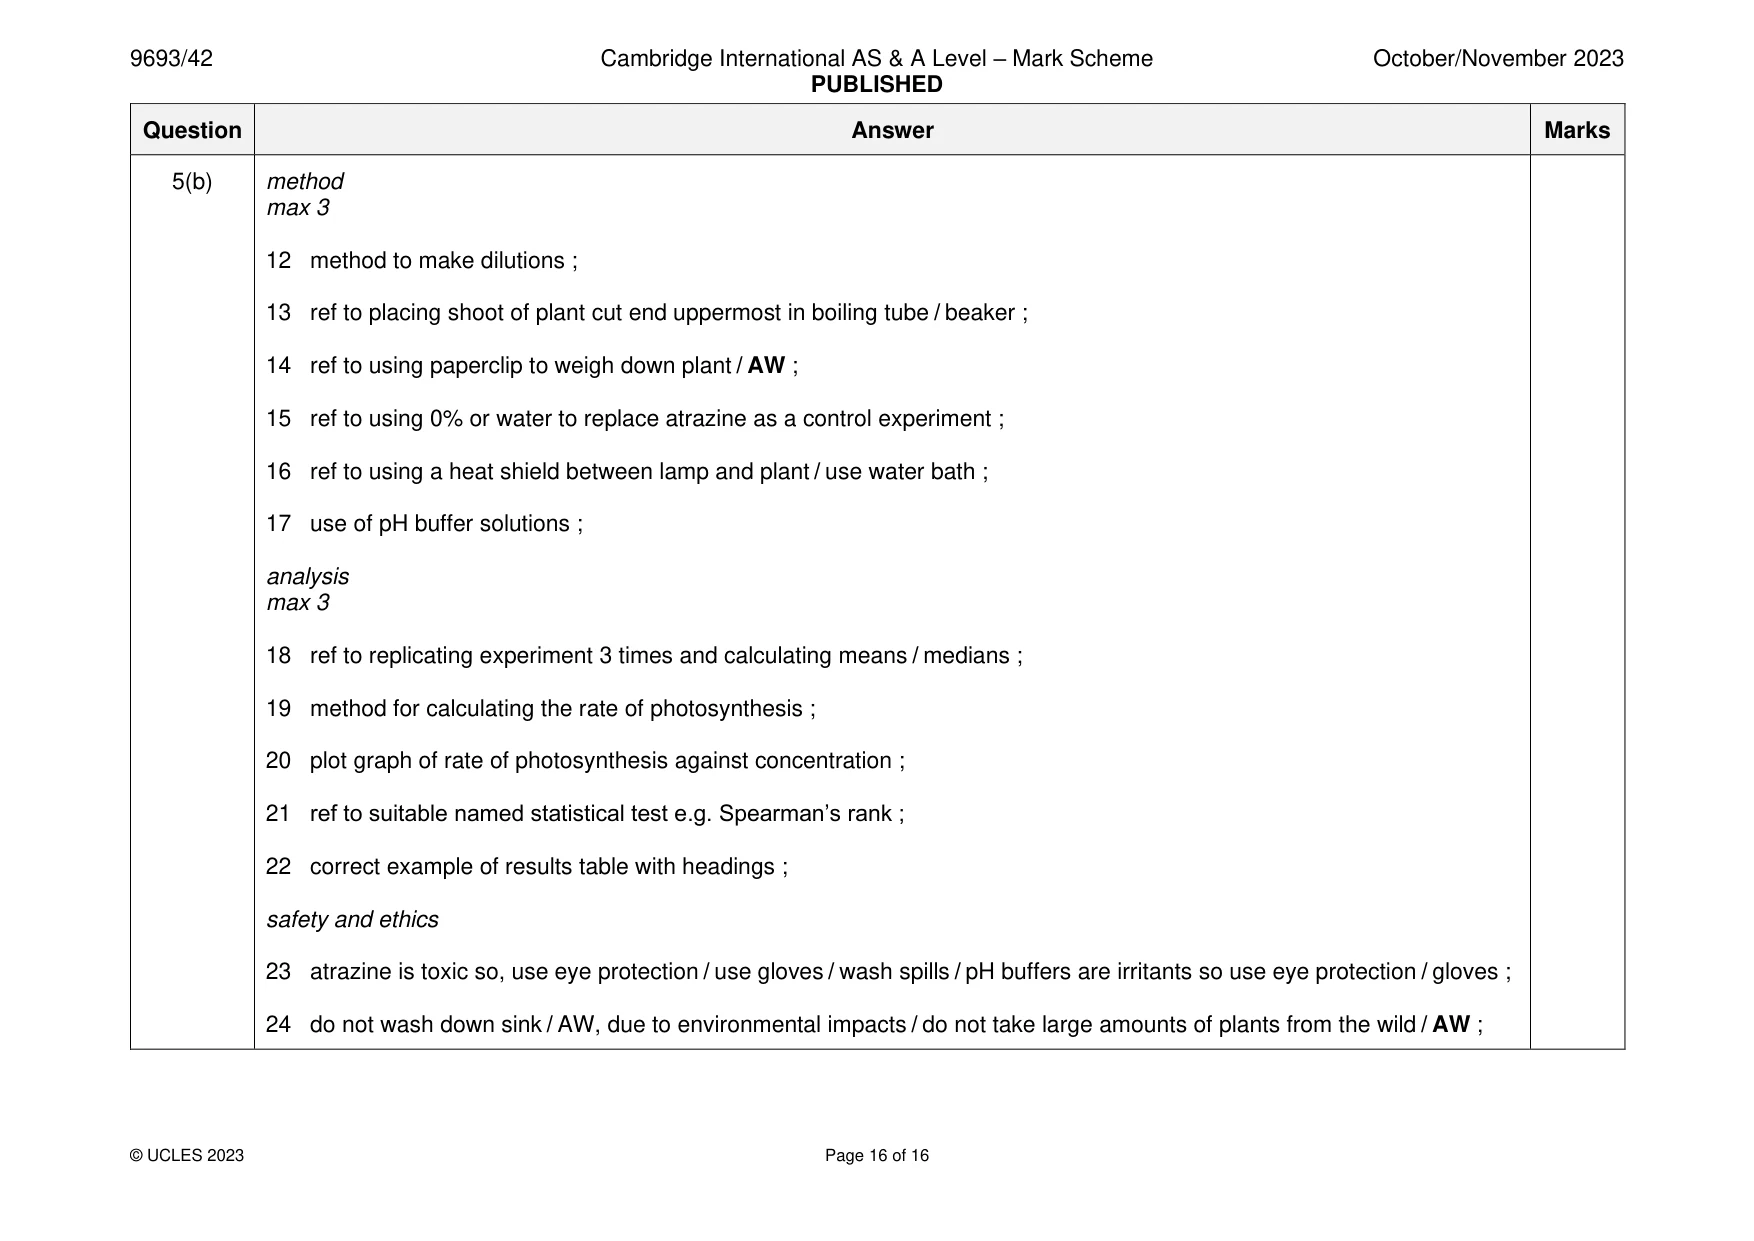
Mark scheme: 5(a)(i) reduced NADP / NADPH / NADPH2 ; 2 ATP ; 5(a)(ii) any 2 of: 2 (species A) because it can absorb more light / green light, between 510 nm and 640 nm ; red light / longer wavelength light, is not available in deeper water / AW / ORA ; so (species A) has, accessory pigments / fucoxanthin, (as well as chlorophyll) (that absorbs in the 510 nm to 640 nm range); 5(b) hypothesis 11 1 photosynthesis (rate) / (rate of) oxygen production, will decrease as weedkiller concentration increases / AW ; and any 10 of: independent variable 2 identified as concentration of atrazine ; 3 use of at least 5 different concentrations in range of up to 1% ; dependent variable 4 identified as rate of photosynthesis / rate of oxygen production / AW ; 5 ref to method of measuring dependent variable in set time ; standardised variables max 3 6 same volume of water / same salinity of water ; 7 constant temperature ; 8 pH ; 9 same size / volume / mass of plant ; 10 light intensity / wavelength / lamp placed at set distance from plant / AW ; 11 same volume / concentration of hydrogencarbonate solution / same carbon dioxide / AW ; 5(b) method max 3 12 method to make dilutions ; 13 ref to placing shoot of plant cut end uppermost in boiling tube / beaker ; 14 ref to using paperclip to weigh down plant / AW ; 15 ref to using 0% or water to replace atrazine as a control experiment ; 16 ref to using a heat shield between lamp and plant / use water bath ; 17 use of pH buffer solutions ; analysis max 3 18 ref to replicating experiment 3 times and calculating means / medians ; 19 method for calculating the rate of photosynthesis ; 20 plot graph of rate of photosynthesis against concentration ; 21 ref to suitable named statistical test e.g. Spearman’s rank ; 22 correct example of results table with headings ; safety and ethics 23 atrazine is toxic so, use eye protection / use gloves / wash spills / pH buffers are irritants so use eye protection / gloves ; 24 do not wash down sink / AW, due to environmental impacts / do not take large amounts of plants from the wild / AW ;
What was in this paper
The subtopics covered by these 5 questions, and how many questions each got. Open one in a new tab to see every Cambridge question on it.
What you needed in this session
Cambridge’s own grade thresholds for 2023 Oct/Nov, Paper 4 · Variant 2. A higher threshold means an easier paper — the bar moves with how the cohort did.