Cambridge A Level Marine Science 9693 — 2025 May/June Paper 4 · Variant 3
9693/43/M/J/25 · 5 questions · 75 marks · 105 min
The question paper and its mark scheme, free to read here and free to download. This is Cambridge’s own paper, exactly as it was sat.
Question paper24 pages






Mark scheme18 pages
Answers below. Sit the paper first if you are practising.
Questions as text
Q1 · A light micrograph of some leaf cells from an aquatic plant
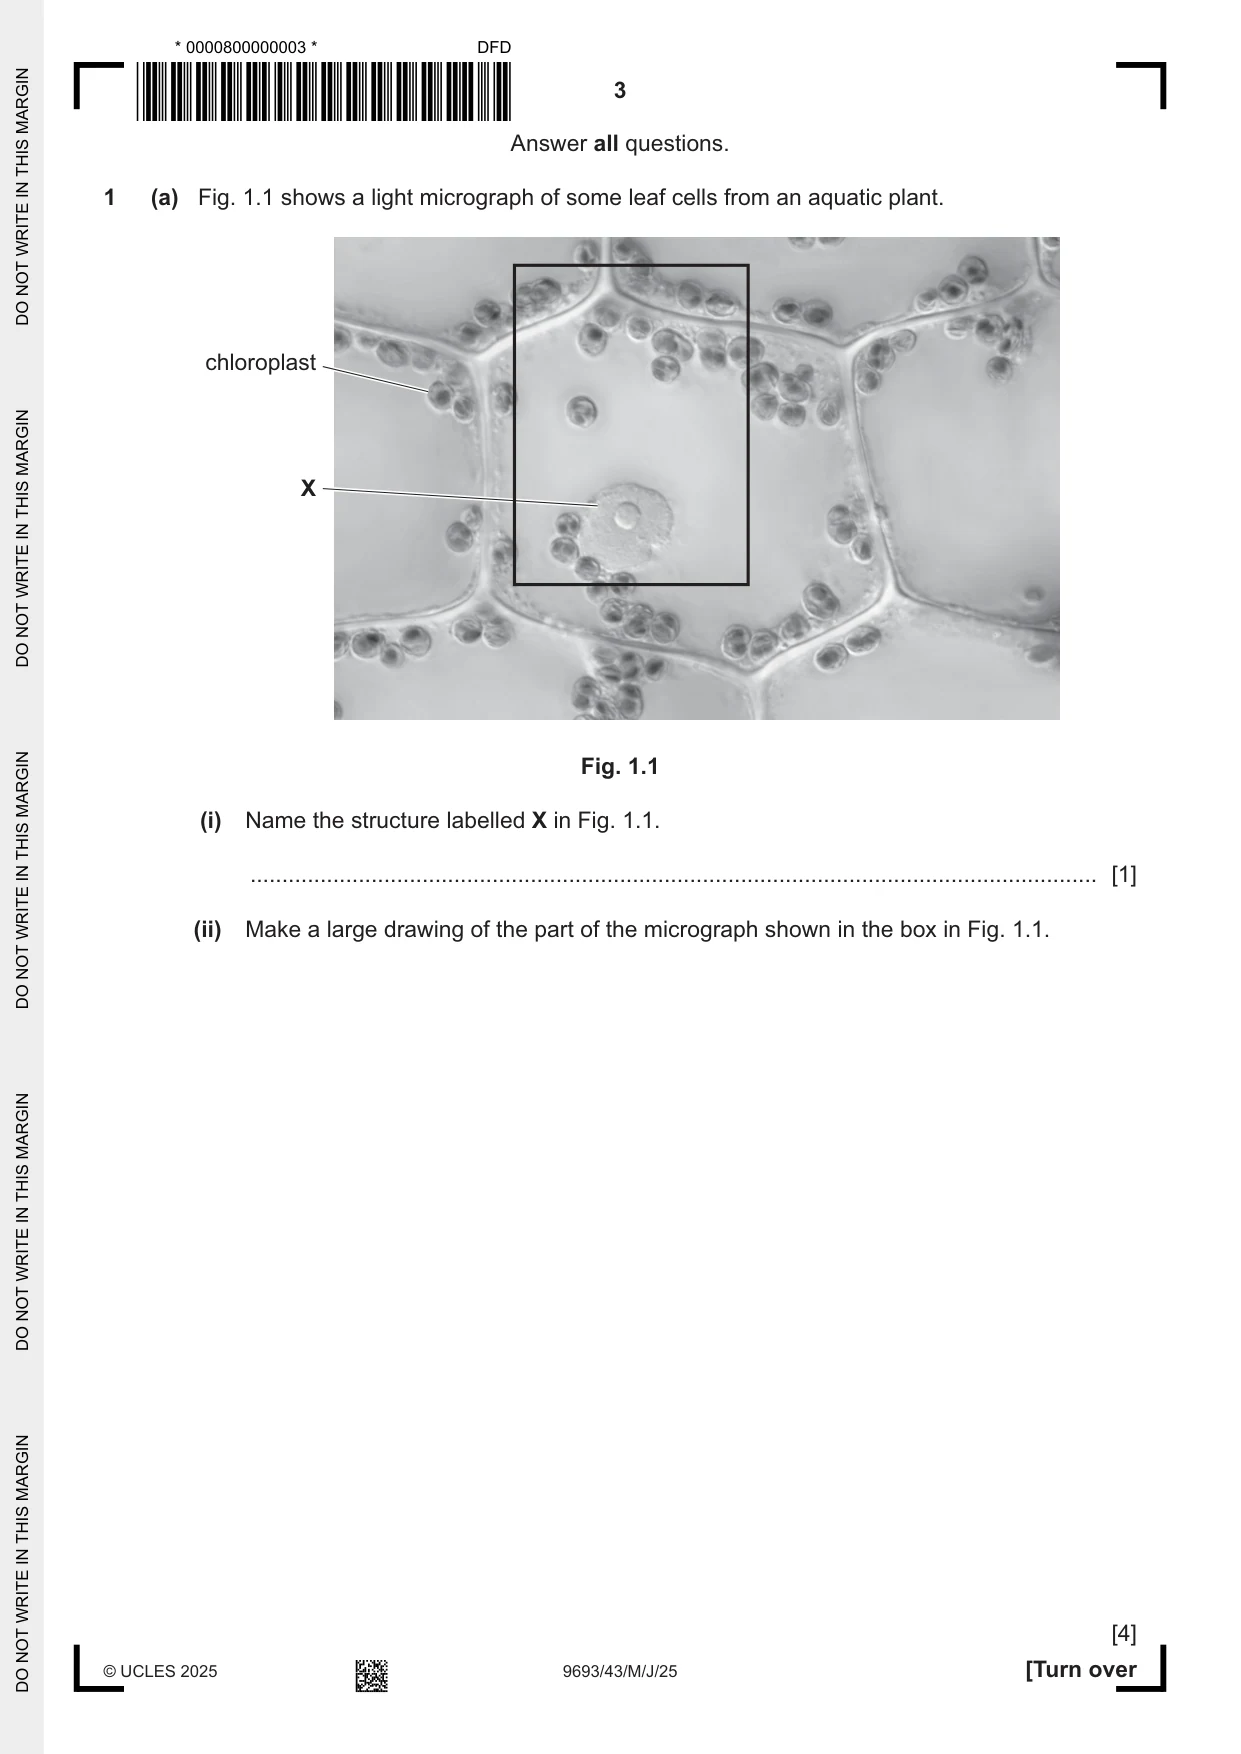
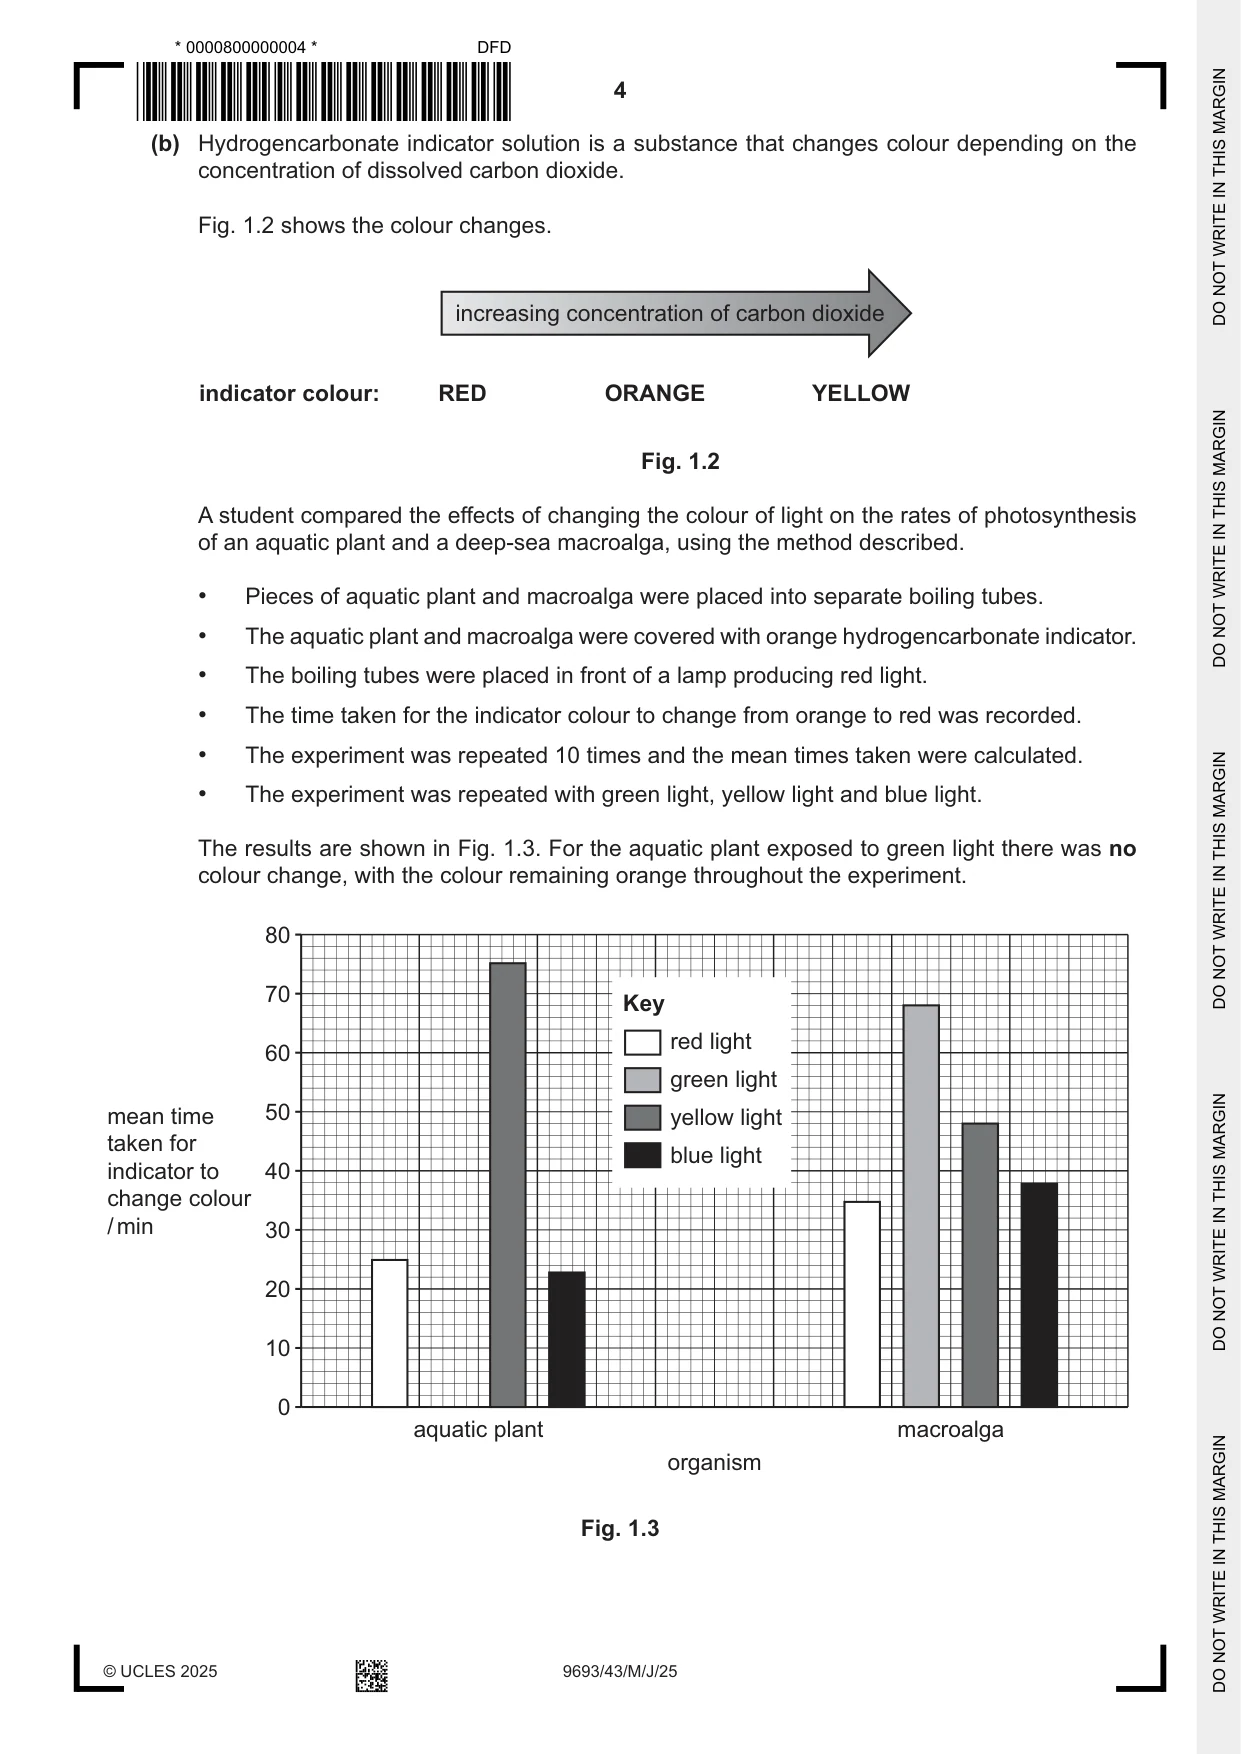
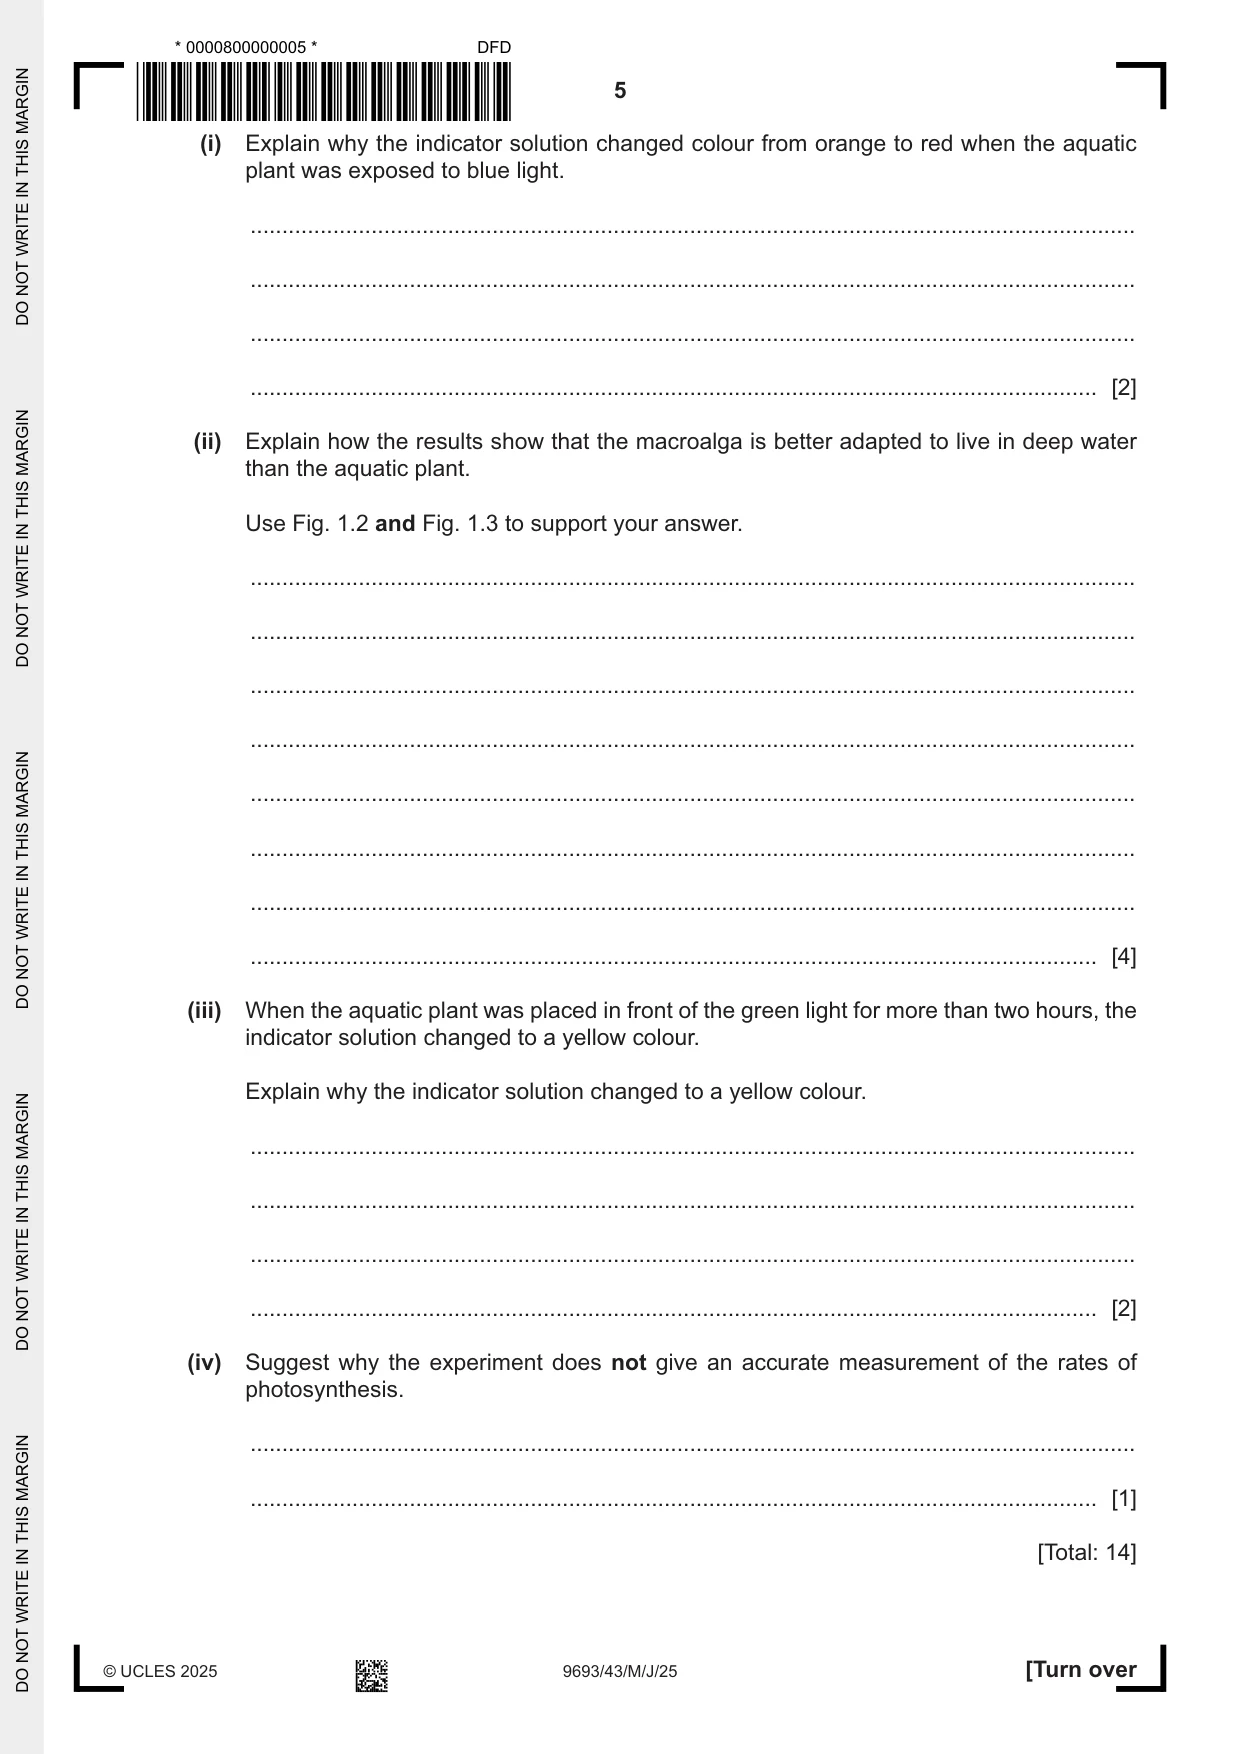
1 (a) Fig. 1.1 shows a light micrograph of some leaf cells from an aquatic plant. chloroplast X Fig. 1.1 (i) Name the structure labelled X in Fig. 1.1. ..................................................................................................................................... [1] (ii) Make a large drawing of the part of the micrograph shown in the box in Fig. 1.1. [4] (b) Hydrogencarbonate indicator solution is a substance that changes colour depending on the concentration of dissolved carbon dioxide. Fig. 1.2 shows the colour changes. increasing concentration of carbon dioxide indicator colour: RED ORANGE YELLOW Fig. 1.2 A student compared the effects of changing the colour of light on the rates of photosynthesis of an aquatic plant and a deep-sea macroalga, using the method described. • Pieces of aquatic plant and macroalga were placed into separate boiling tubes. • The aquatic plant and macroalga were covered with orange hydrogencarbonate indicator. • The boiling tubes were placed in front of a lamp producing red light. • The time taken for the indicator colour to change from orange to red was recorded. • The experiment was repeated 10 times and the mean times taken were calculated. • The experiment was repeated with green light, yellow light and blue light. The results are shown in Fig. 1.3. For the aquatic plant exposed to green light there was no colour change, with the colour remaining orange throughout the experiment. 80 70 Key red light 60 green light mean time 50 yellow light taken for blue light indicator to 40 change colour / min 30 20 10 0 aquatic plant macroalga organism Fig. 1.3 (i) Explain why the indicator solution changed colour from orange to red when the aquatic plant was exposed to blue light. ........................................................................................................................................... ........................................................................................................................................... ........................................................................................................................................... ..................................................................................................................................... [2] (ii) Explain how the results show that the macroalga is better adapted to live in deep water than the aquatic plant. Use Fig. 1.2 and Fig. 1.3 to support your answer. ........................................................................................................................................... ........................................................................................................................................... ........................................................................................................................................... ........................................................................................................................................... ........................................................................................................................................... ........................................................................................................................................... ........................................................................................................................................... ..................................................................................................................................... [4] (iii) When the aquatic plant was placed in front of the green light for more than two hours, the indicator solution changed to a yellow colour. Explain why the indicator solution changed to a yellow colour. ........................................................................................................................................... ........................................................................................................................................... ........................................................................................................................................... ..................................................................................................................................... [2] (iv) Suggest why the experiment does not give an accurate measurement of the rates of photosynthesis. ........................................................................................................................................... ..................................................................................................................................... [1] [Total: 14]
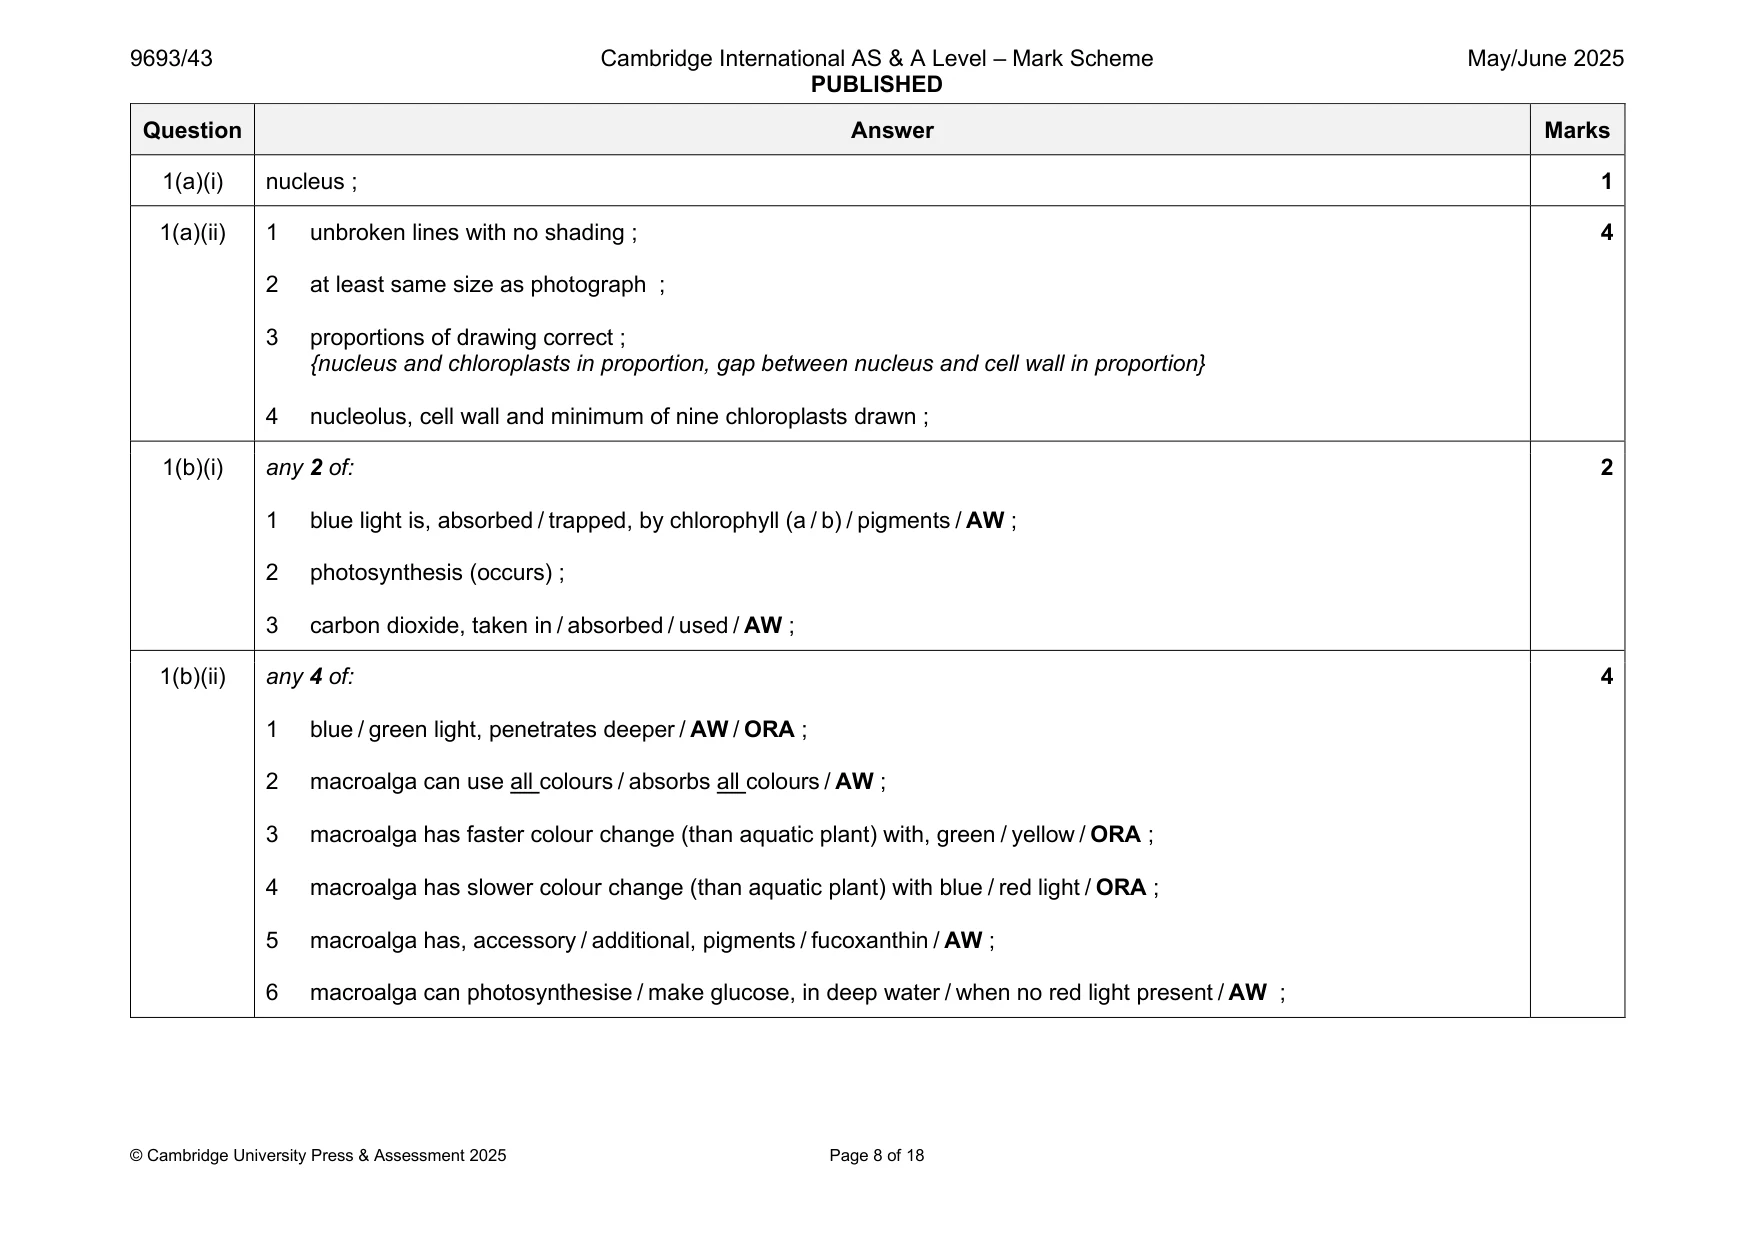
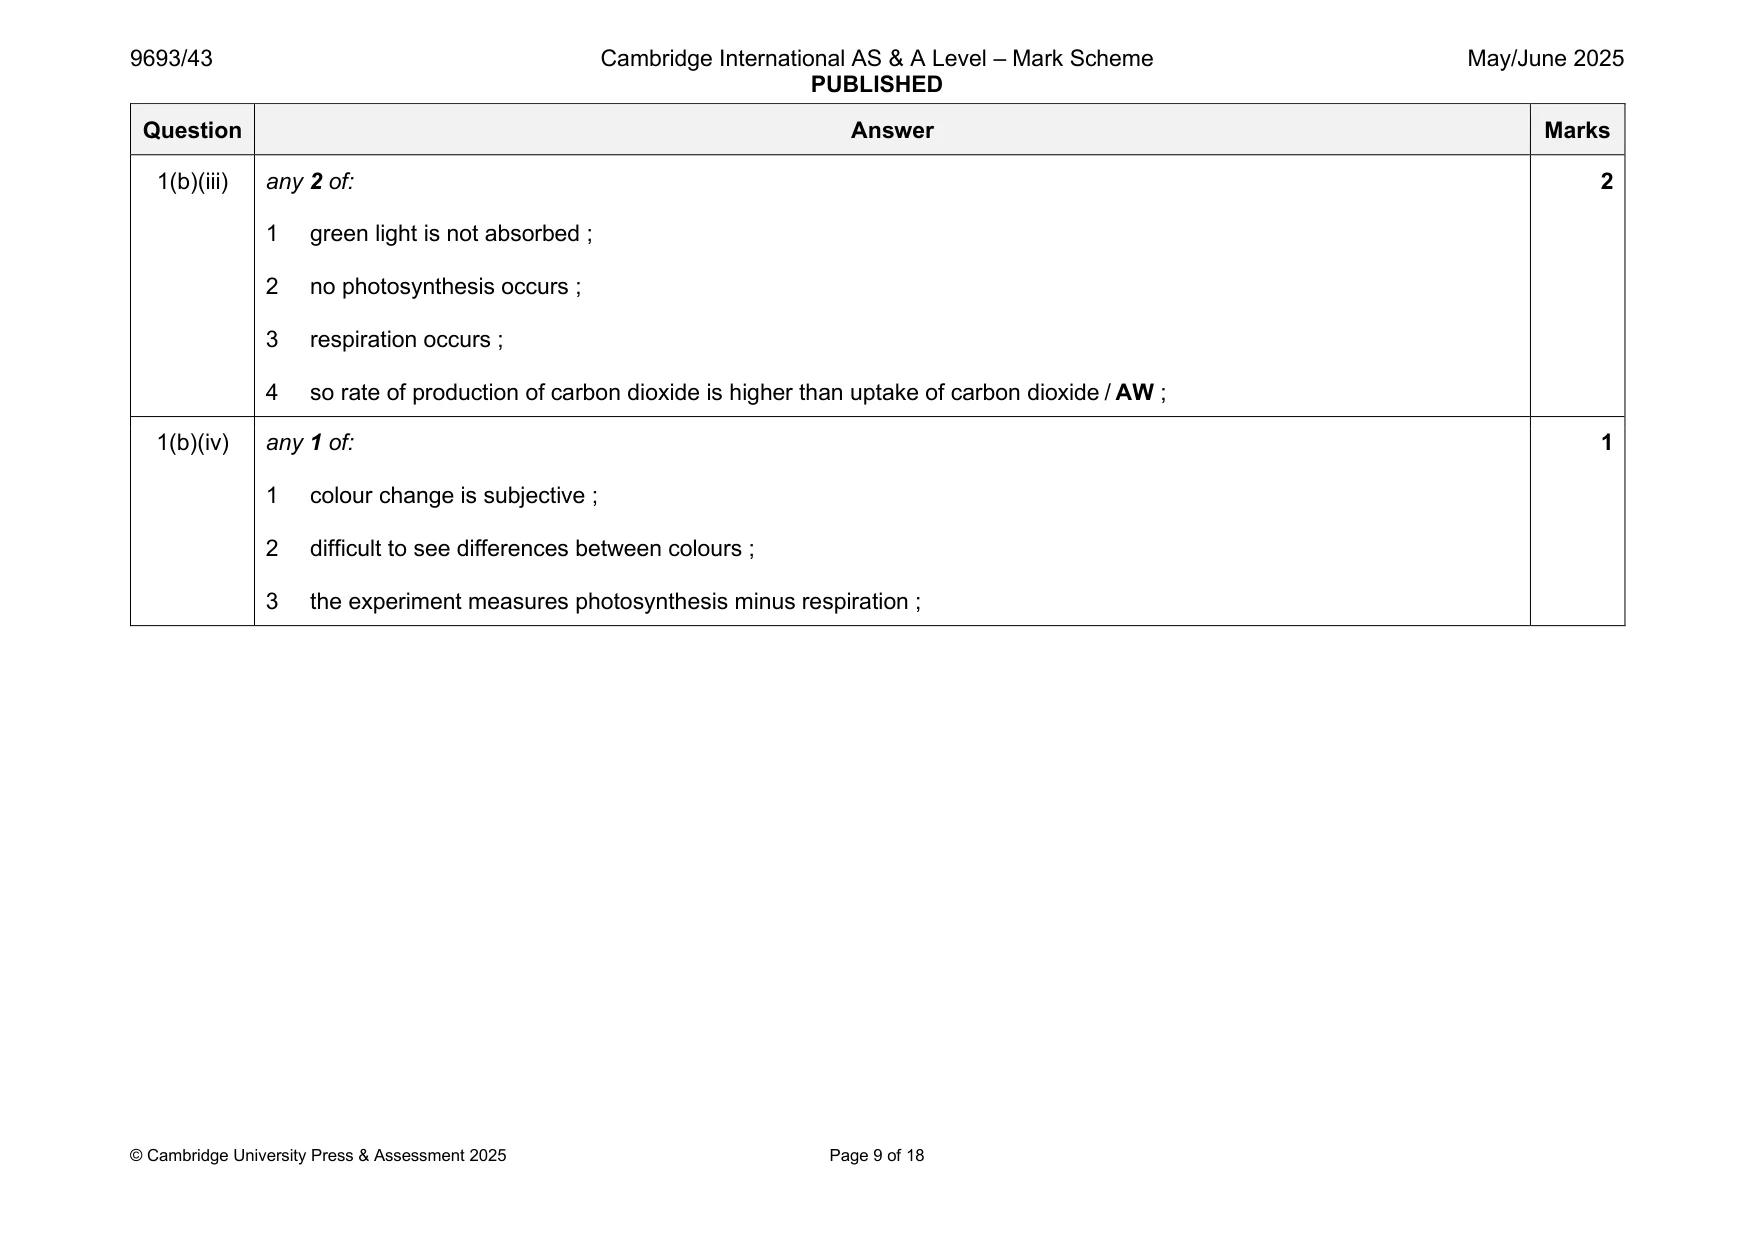
Mark scheme: Question Answer Marks 1(a)(i) nucleus ; 1 1(a)(ii) 1 unbroken lines with no shading ; 4 2 at least same size as photograph ; 3 proportions of drawing correct ; {nucleus and chloroplasts in proportion, gap between nucleus and cell wall in proportion} 4 nucleolus, cell wall and minimum of nine chloroplasts drawn ; 1(b)(i) any 2 of: 2 1 blue light is, absorbed / trapped, by chlorophyll (a / b) / pigments / AW ; 2 photosynthesis (occurs) ; 3 carbon dioxide, taken in / absorbed / used / AW ; 1(b)(ii) any 4 of: 4 1 blue / green light, penetrates deeper / AW / ORA ; 2 macroalga can use all colours / absorbs all colours / AW ; 3 macroalga has faster colour change (than aquatic plant) with, green / yellow / ORA ; 4 macroalga has slower colour change (than aquatic plant) with blue / red light / ORA ; 5 macroalga has, accessory / additional, pigments / fucoxanthin / AW ; 6 macroalga can photosynthesise / make glucose, in deep water / when no red light present / AW ; 1(b)(iii) any 2 of: 2 1 green light is not absorbed ; 2 no photosynthesis occurs ; 3 respiration occurs ; 4 so rate of production of carbon dioxide is higher than uptake of carbon dioxide / AW ; 1(b)(iv) any 1 of: 1 1 colour change is subjective ; 2 difficult to see differences between colours ; 3 the experiment measures photosynthesis minus respiration ;
Q2 · Lionfish are an invasive species around coral reefs in many parts of the West Atlantic…
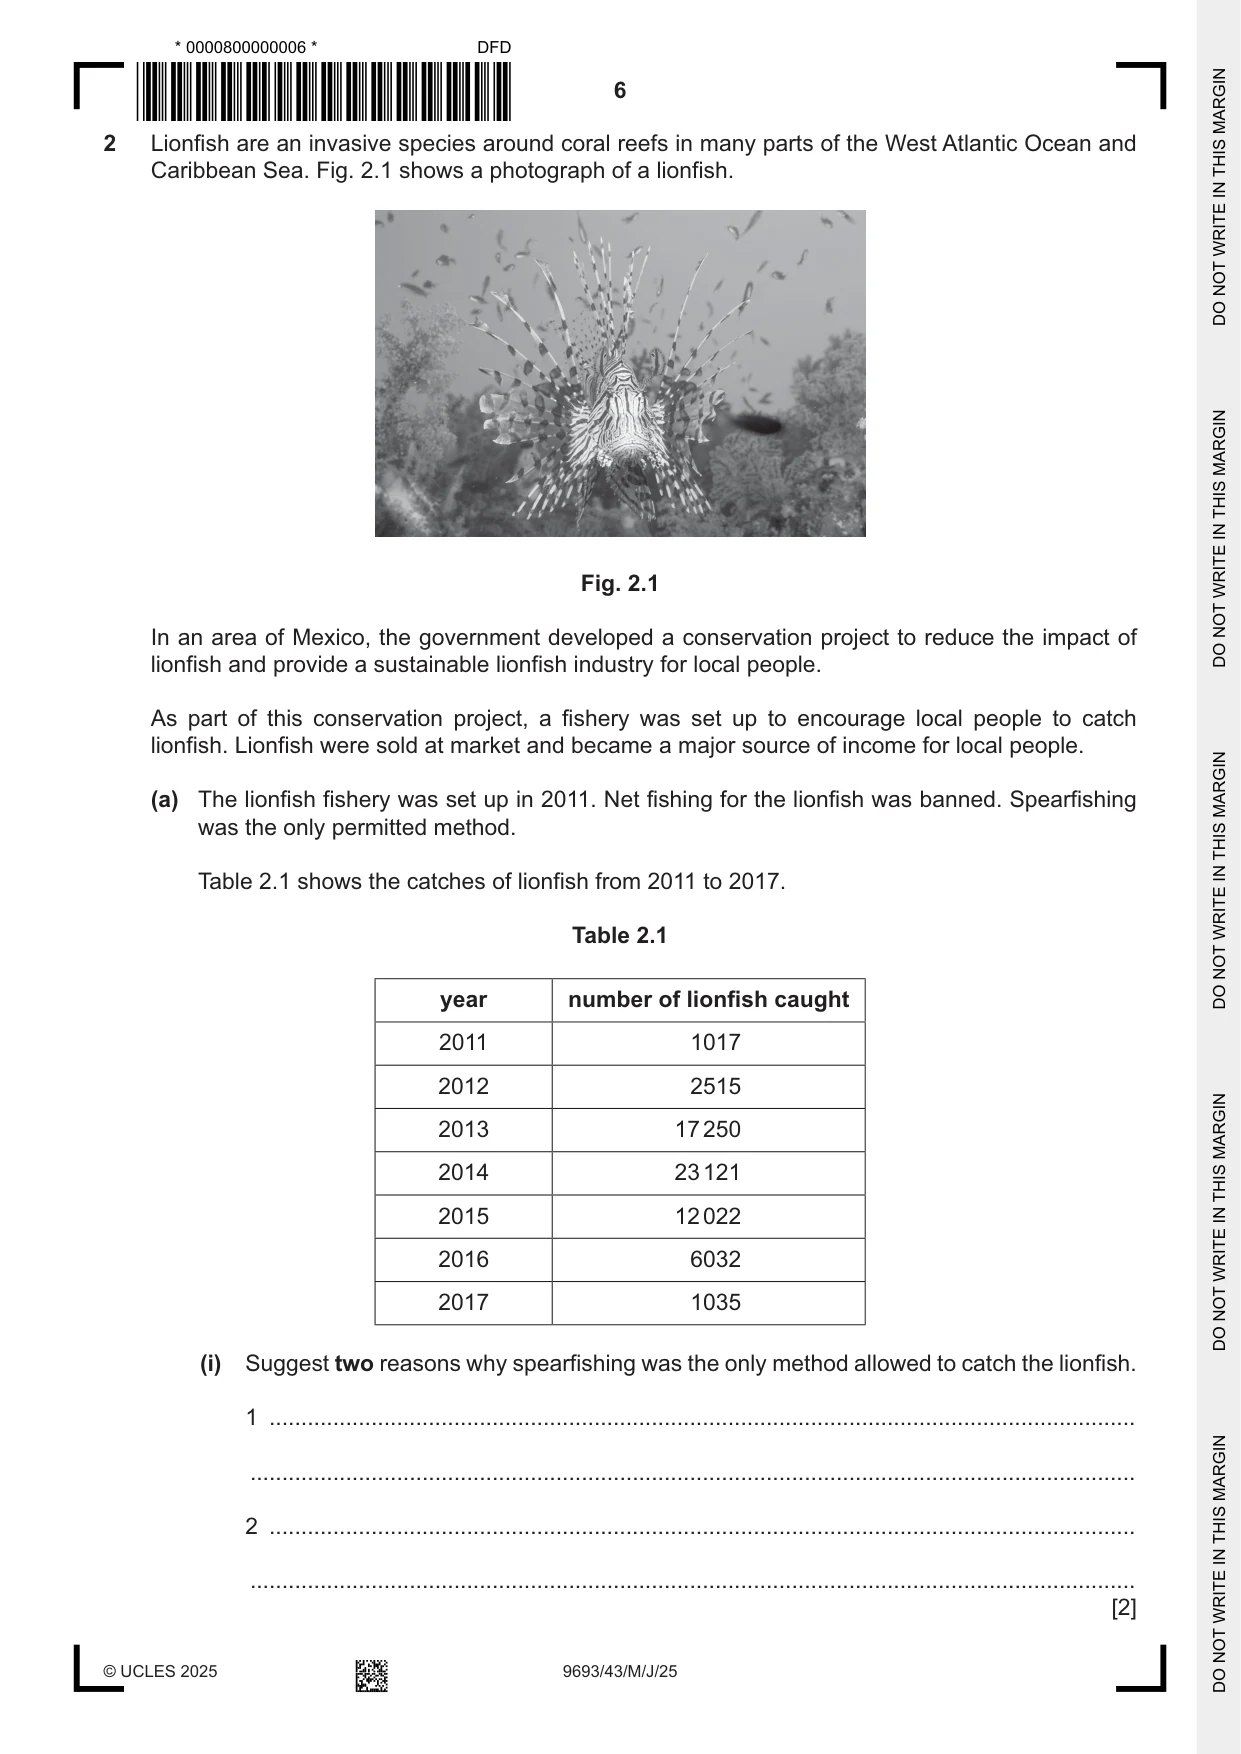
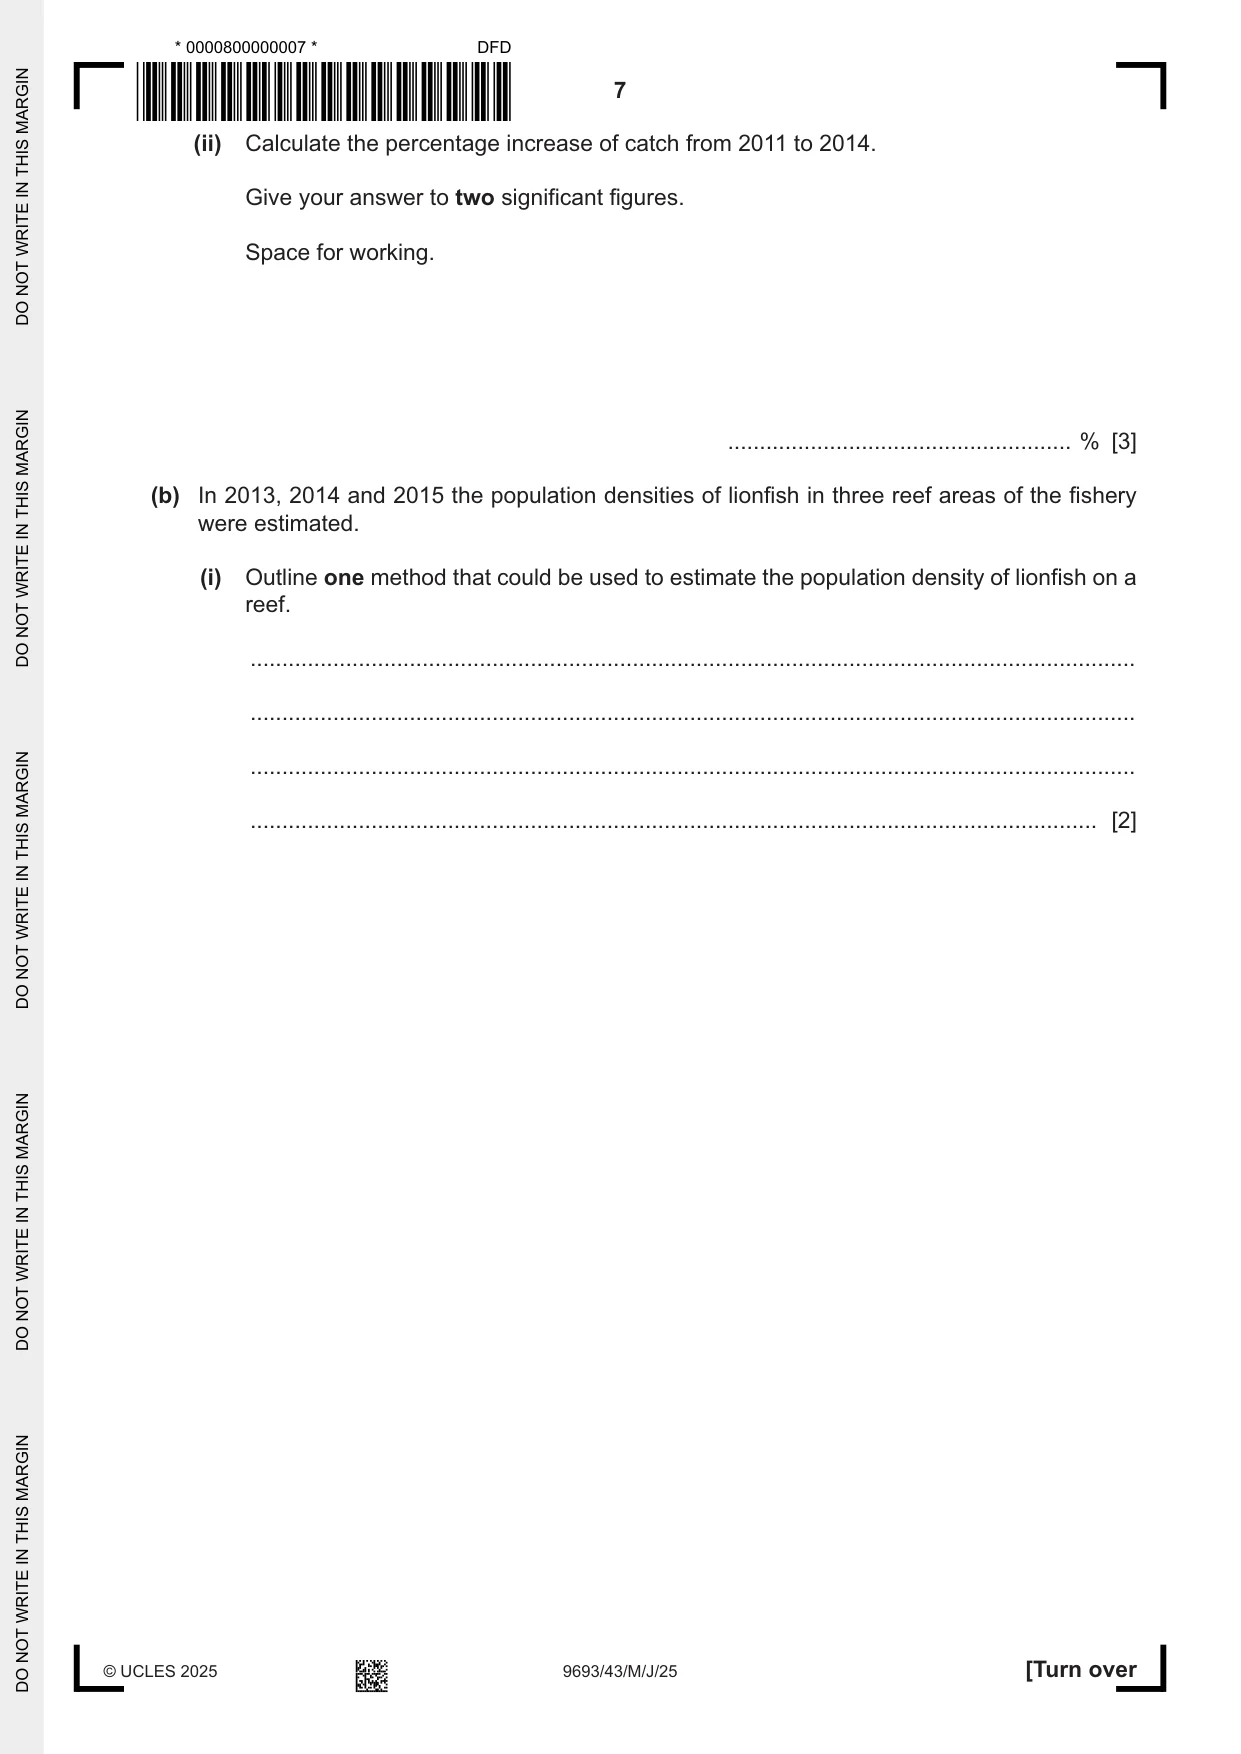
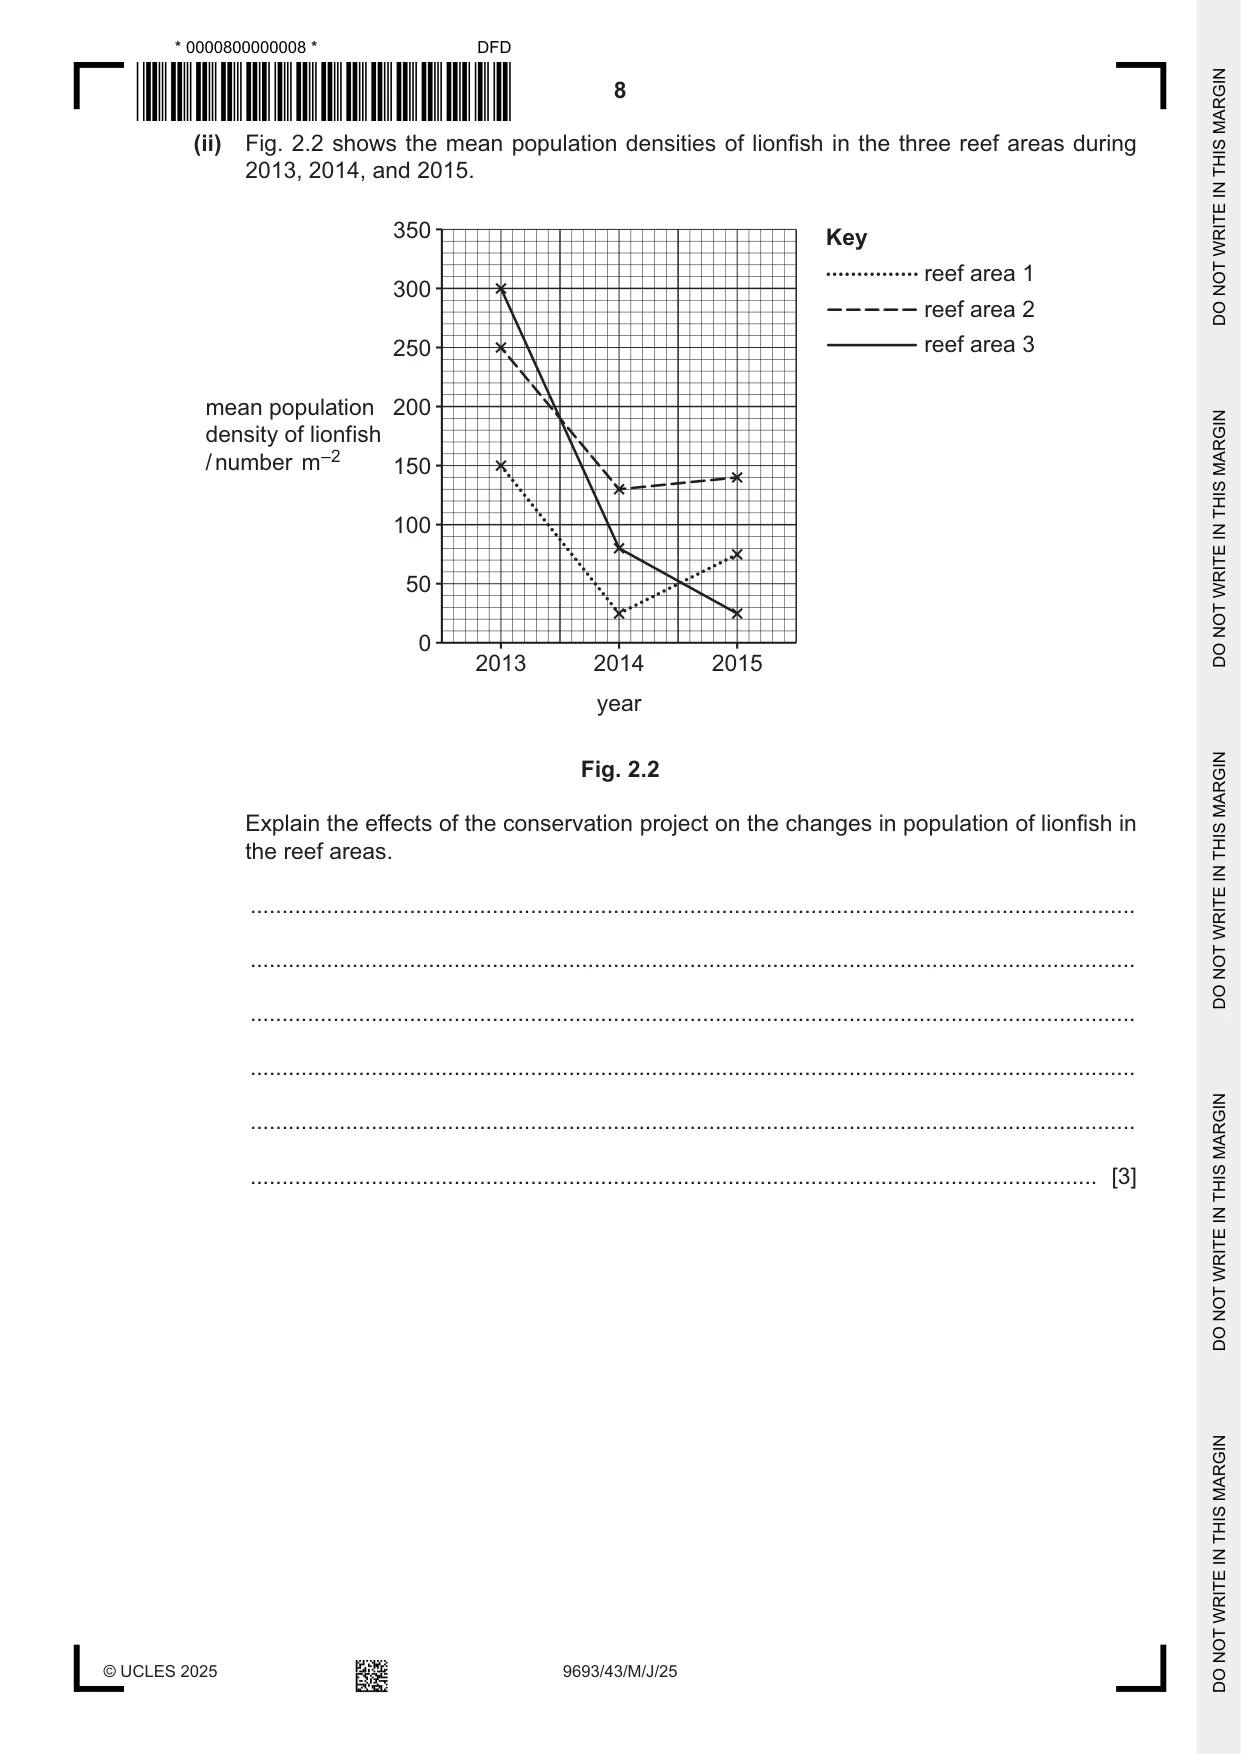
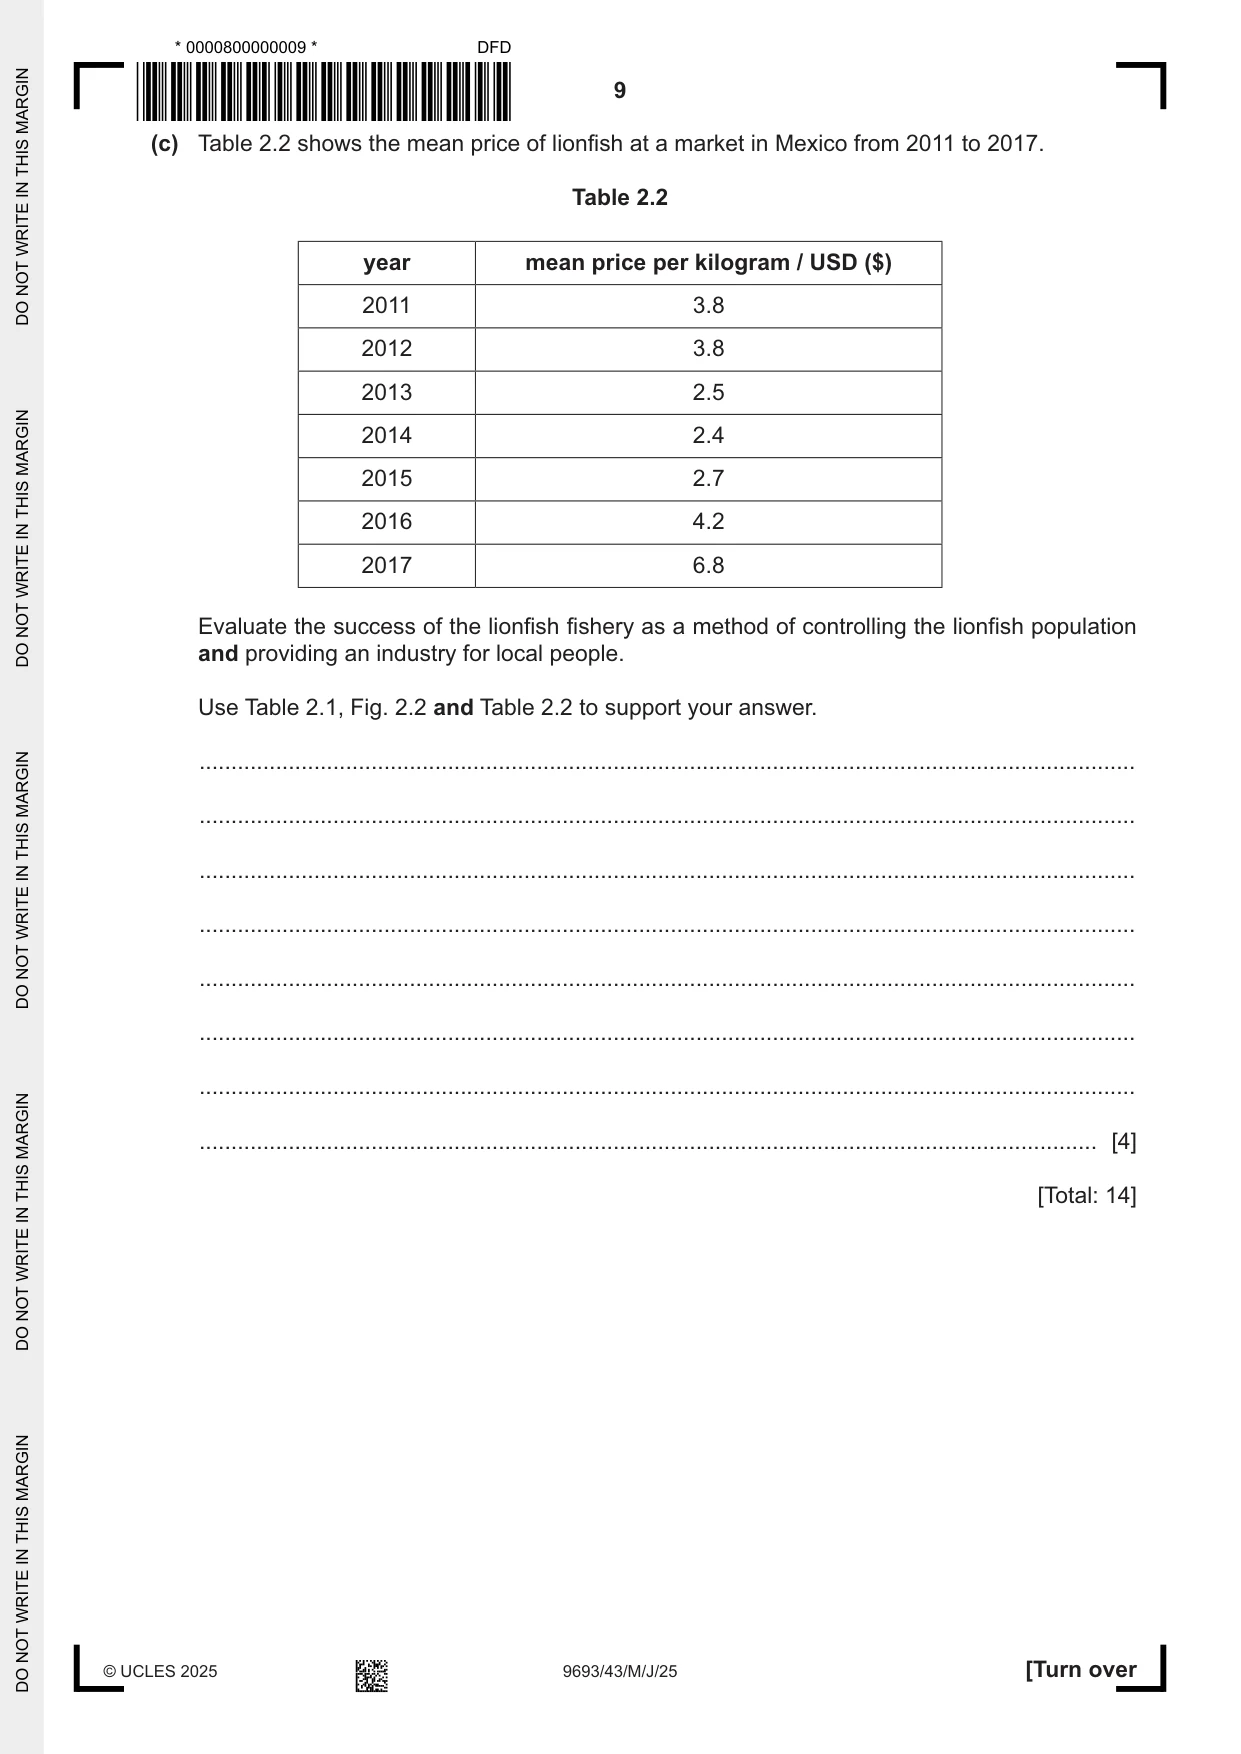
2 Lionfish are an invasive species around coral reefs in many parts of the West Atlantic Ocean and Caribbean Sea. Fig. 2.1 shows a photograph of a lionfish. Fig. 2.1 In an area of Mexico, the government developed a conservation project to reduce the impact of lionfish and provide a sustainable lionfish industry for local people. As part of this conservation project, a fishery was set up to encourage local people to catch lionfish. Lionfish were sold at market and became a major source of income for local people. (a) The lionfish fishery was set up in 2011. Net fishing for the lionfish was banned. Spearfishing was the only permitted method. Table 2.1 shows the catches of lionfish from 2011 to 2017. Table 2.1 year number of lionfish caught 2011 1017 2012 2515 2013 17 250 2014 23 121 2015 12 022 2016 6032 2017 1035 (i) Suggest two reasons why spearfishing was the only method allowed to catch the lionfish. 1 ........................................................................................................................................ ........................................................................................................................................... 2 ........................................................................................................................................ ........................................................................................................................................... [2] (ii) Calculate the percentage increase of catch from 2011 to 2014. Give your answer to two significant figures. Space for working. ...................................................... % [3] (b) In 2013, 2014 and 2015 the population densities of lionfish in three reef areas of the fishery were estimated. (i) Outline one method that could be used to estimate the population density of lionfish on a reef. ........................................................................................................................................... ........................................................................................................................................... ........................................................................................................................................... ..................................................................................................................................... [2] (ii) Fig. 2.2 shows the mean population densities of lionfish in the three reef areas during 2013, 2014, and 2015. 350 Key reef area 1 300 reef area 2 250 reef area 3 mean population 200 density of lionfish / number m–2 150 100 50 0 2013 2014 2015 year Fig. 2.2 Explain the effects of the conservation project on the changes in population of lionfish in the reef areas. ........................................................................................................................................... ........................................................................................................................................... ........................................................................................................................................... ........................................................................................................................................... ........................................................................................................................................... ..................................................................................................................................... [3] (c) Table 2.2 shows the mean price of lionfish at a market in Mexico from 2011 to 2017. Table 2.2 year mean price per kilogram / USD ($) 2011 3.8 2012 3.8 2013 2.5 2014 2.4 2015 2.7 2016 4.2 2017 6.8 Evaluate the success of the lionfish fishery as a method of controlling the lionfish population and providing an industry for local people. Use Table 2.1, Fig. 2.2 and Table 2.2 to support your answer. ................................................................................................................................................... ................................................................................................................................................... ................................................................................................................................................... ................................................................................................................................................... ................................................................................................................................................... ................................................................................................................................................... ................................................................................................................................................... ............................................................................................................................................. [4] [Total: 14]
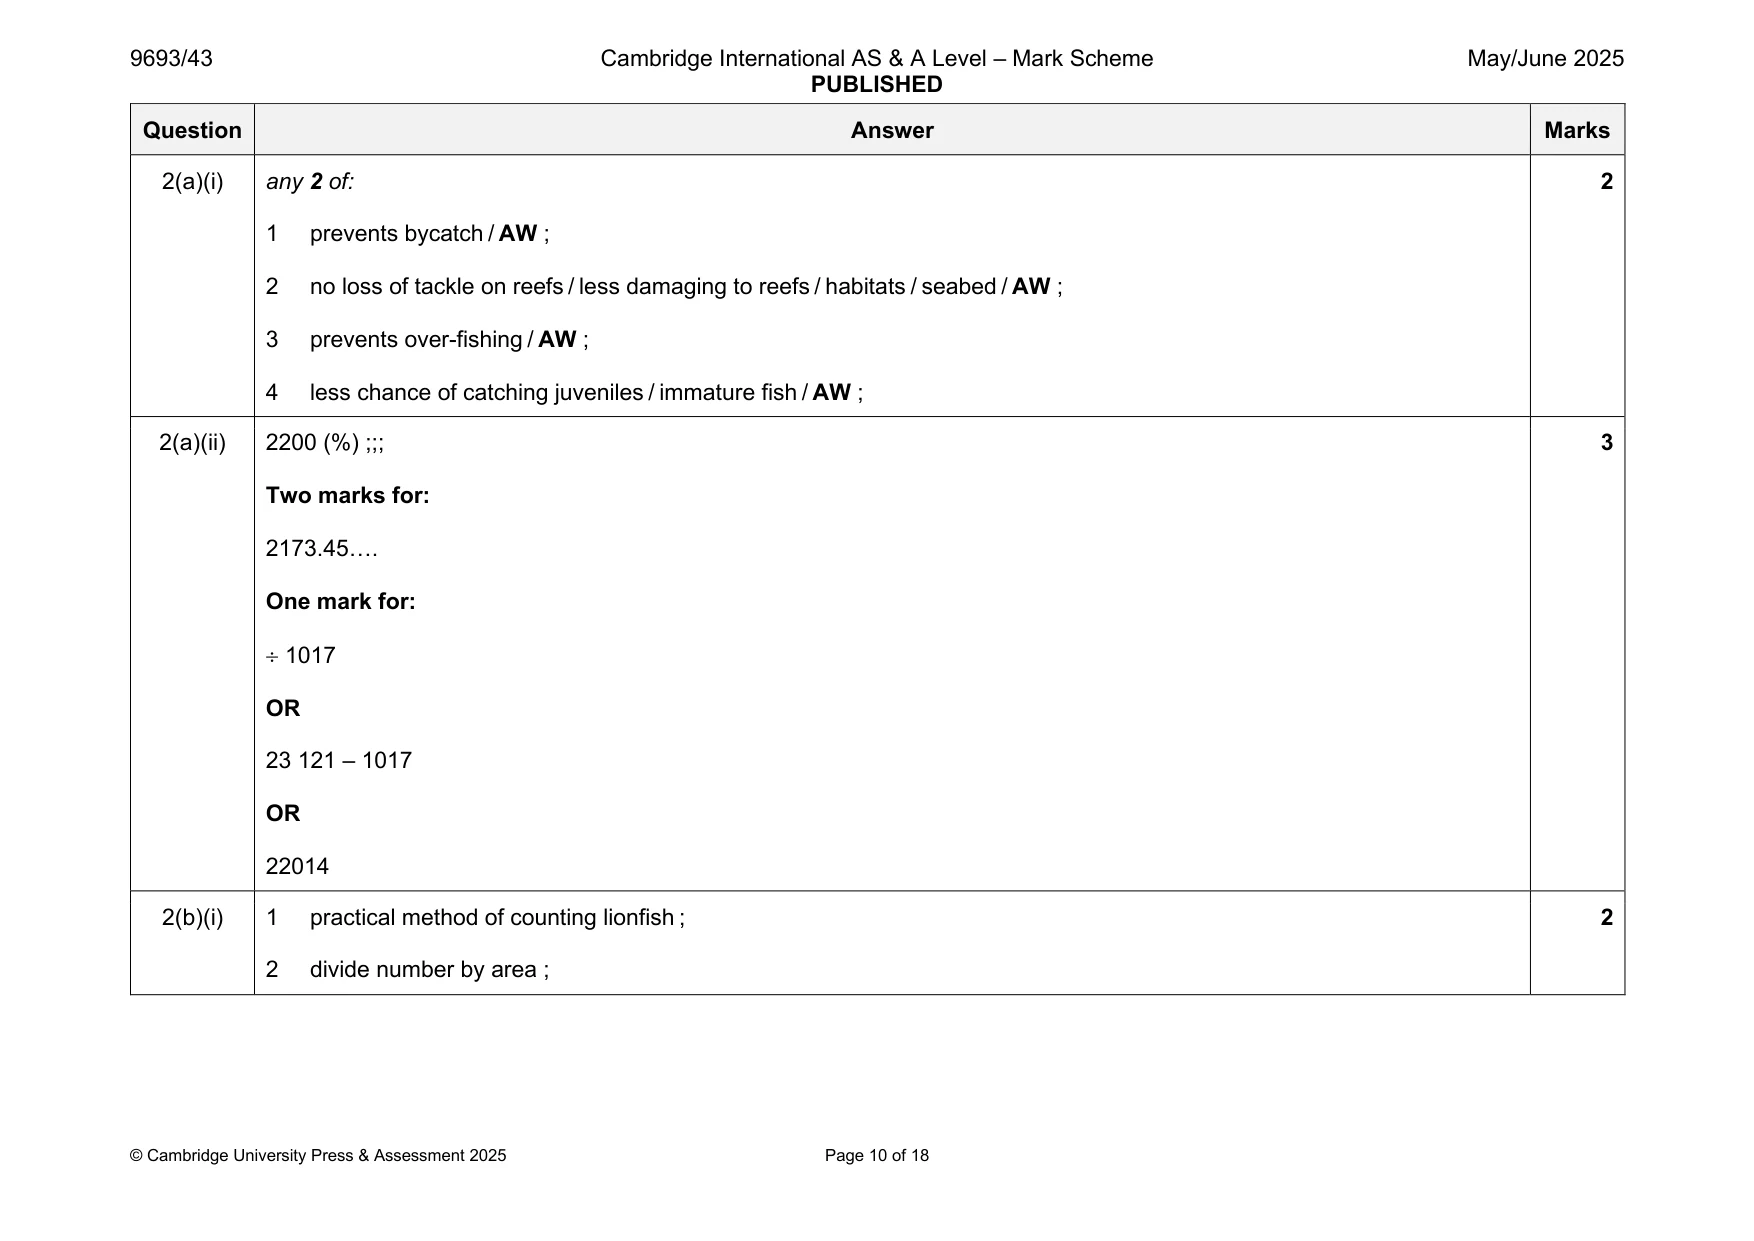
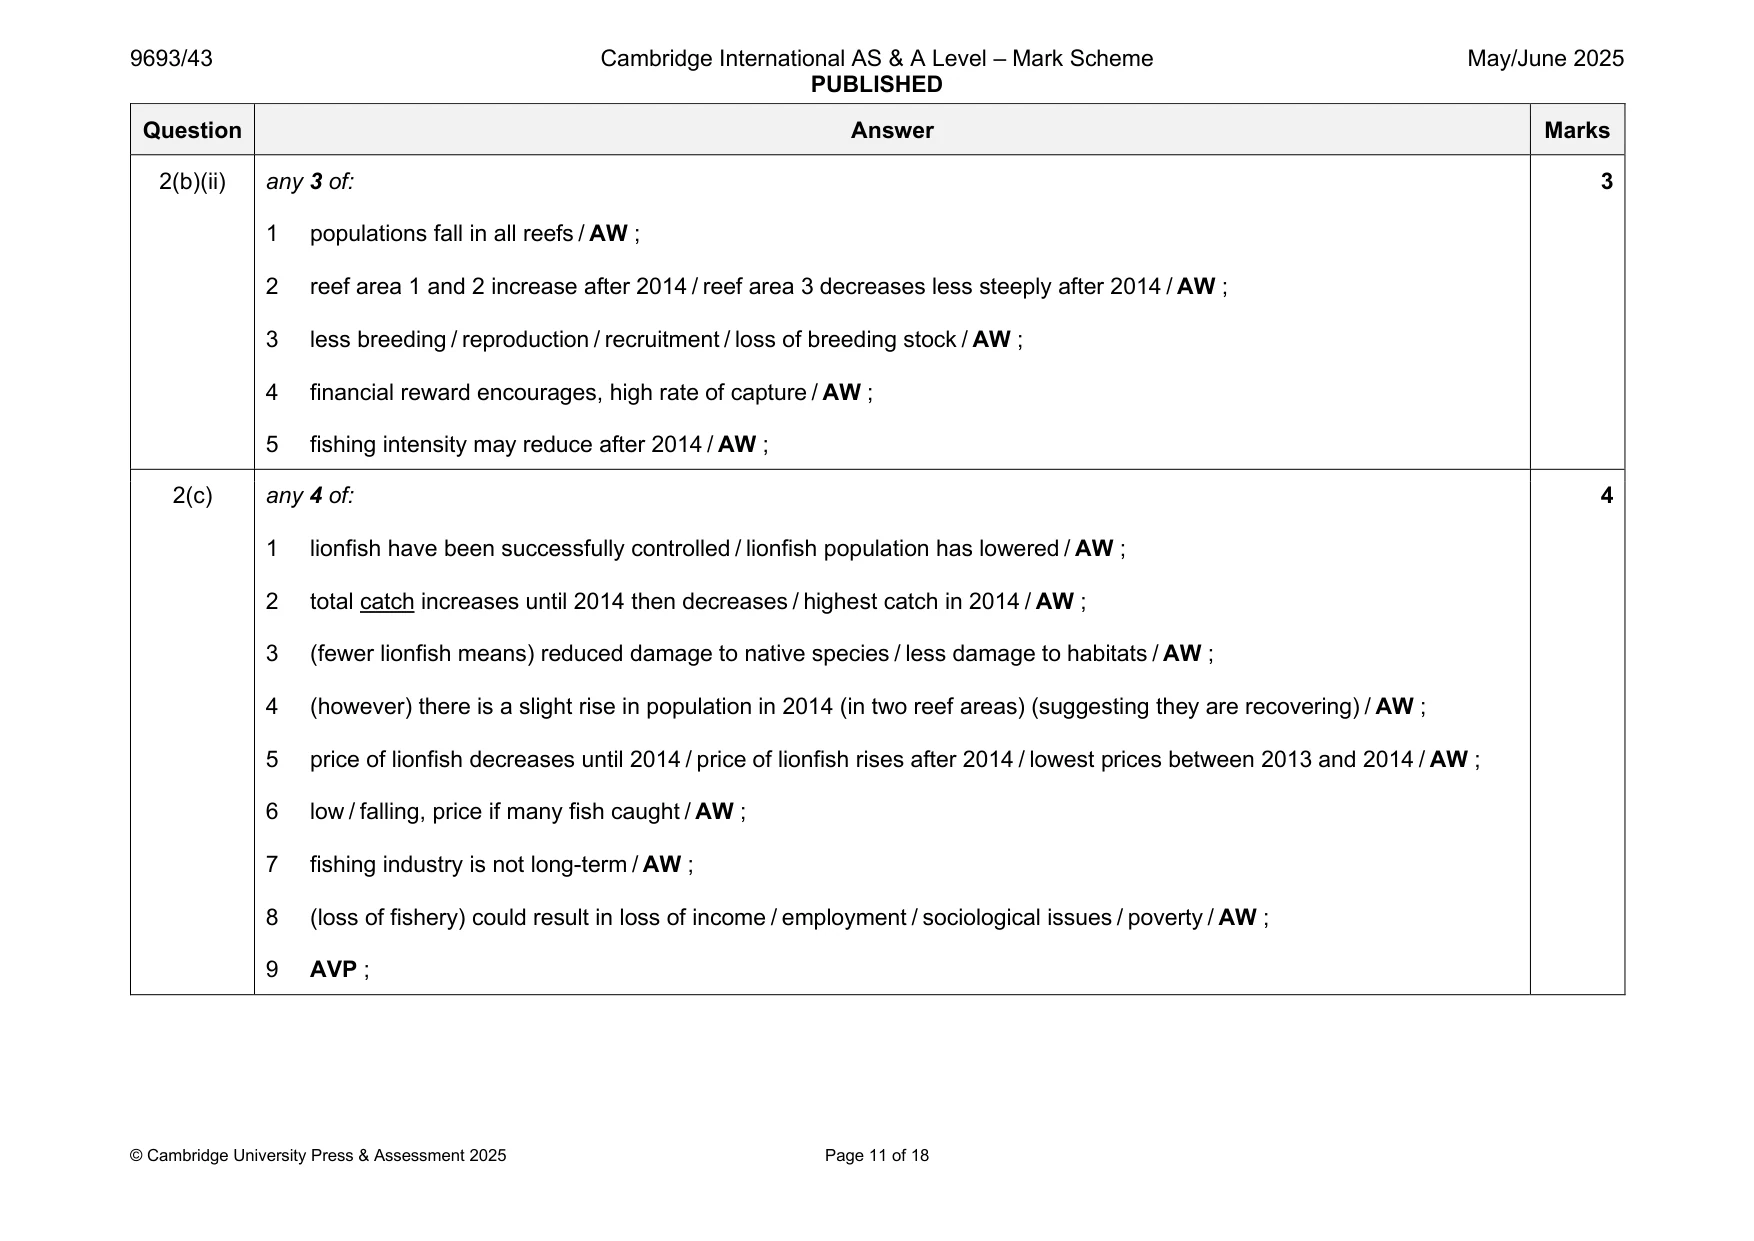
Mark scheme: 2(a)(i) any 2 of: 2 1 prevents bycatch / AW ; 2 no loss of tackle on reefs / less damaging to reefs / habitats / seabed / AW ; 3 prevents over-fishing / AW ; 4 less chance of catching juveniles / immature fish / AW ; 2(a)(ii) 2200 (%) ;;; 3 Two marks for: 2173.45…. One mark for: 1017 OR 23 121 – 1017 OR 22014 2(b)(i) 1 practical method of counting lionfish ; 2 2 divide number by area ; 2(b)(ii) any 3 of: 3 1 populations fall in all reefs / AW ; 2 reef area 1 and 2 increase after 2014 / reef area 3 decreases less steeply after 2014 / AW ; 3 less breeding / reproduction / recruitment / loss of breeding stock / AW ; 4 financial reward encourages, high rate of capture / AW ; 5 fishing intensity may reduce after 2014 / AW ; 2(c) any 4 of: 4 1 lionfish have been successfully controlled / lionfish population has lowered / AW ; 2 total catch increases until 2014 then decreases / highest catch in 2014 / AW ; 3 (fewer lionfish means) reduced damage to native species / less damage to habitats / AW ; 4 (however) there is a slight rise in population in 2014 (in two reef areas) (suggesting they are recovering) / AW ; 5 price of lionfish decreases until 2014 / price of lionfish rises after 2014 / lowest prices between 2013 and 2014 / AW ; 6 low / falling, price if many fish caught / AW ; 7 fishing industry is not long-term / AW ; 8 (loss of fishery) could result in loss of income / employment / sociological issues / poverty / AW ; 9 AVP ;
Q3 · Carbon dioxide produced by the combustion of fossil fuels may lead to ocean acidification
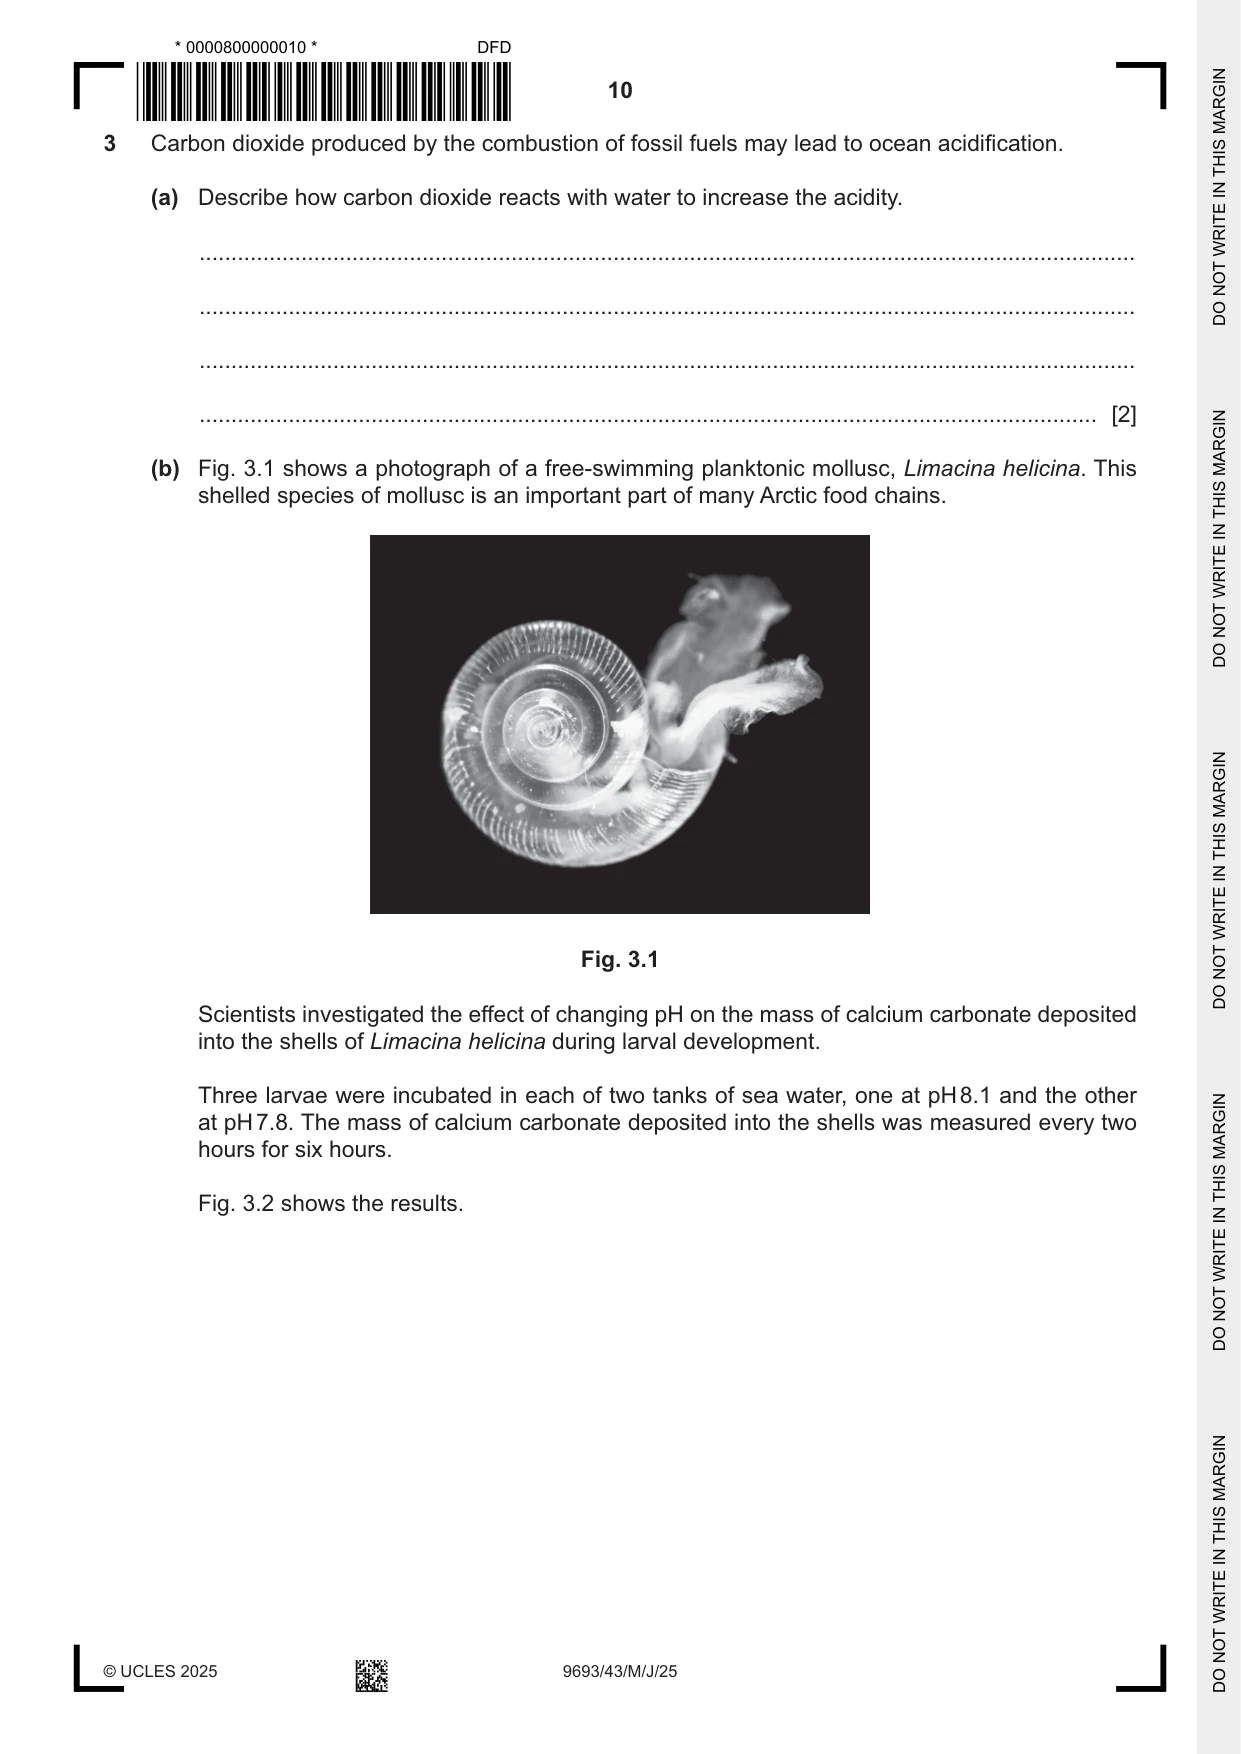
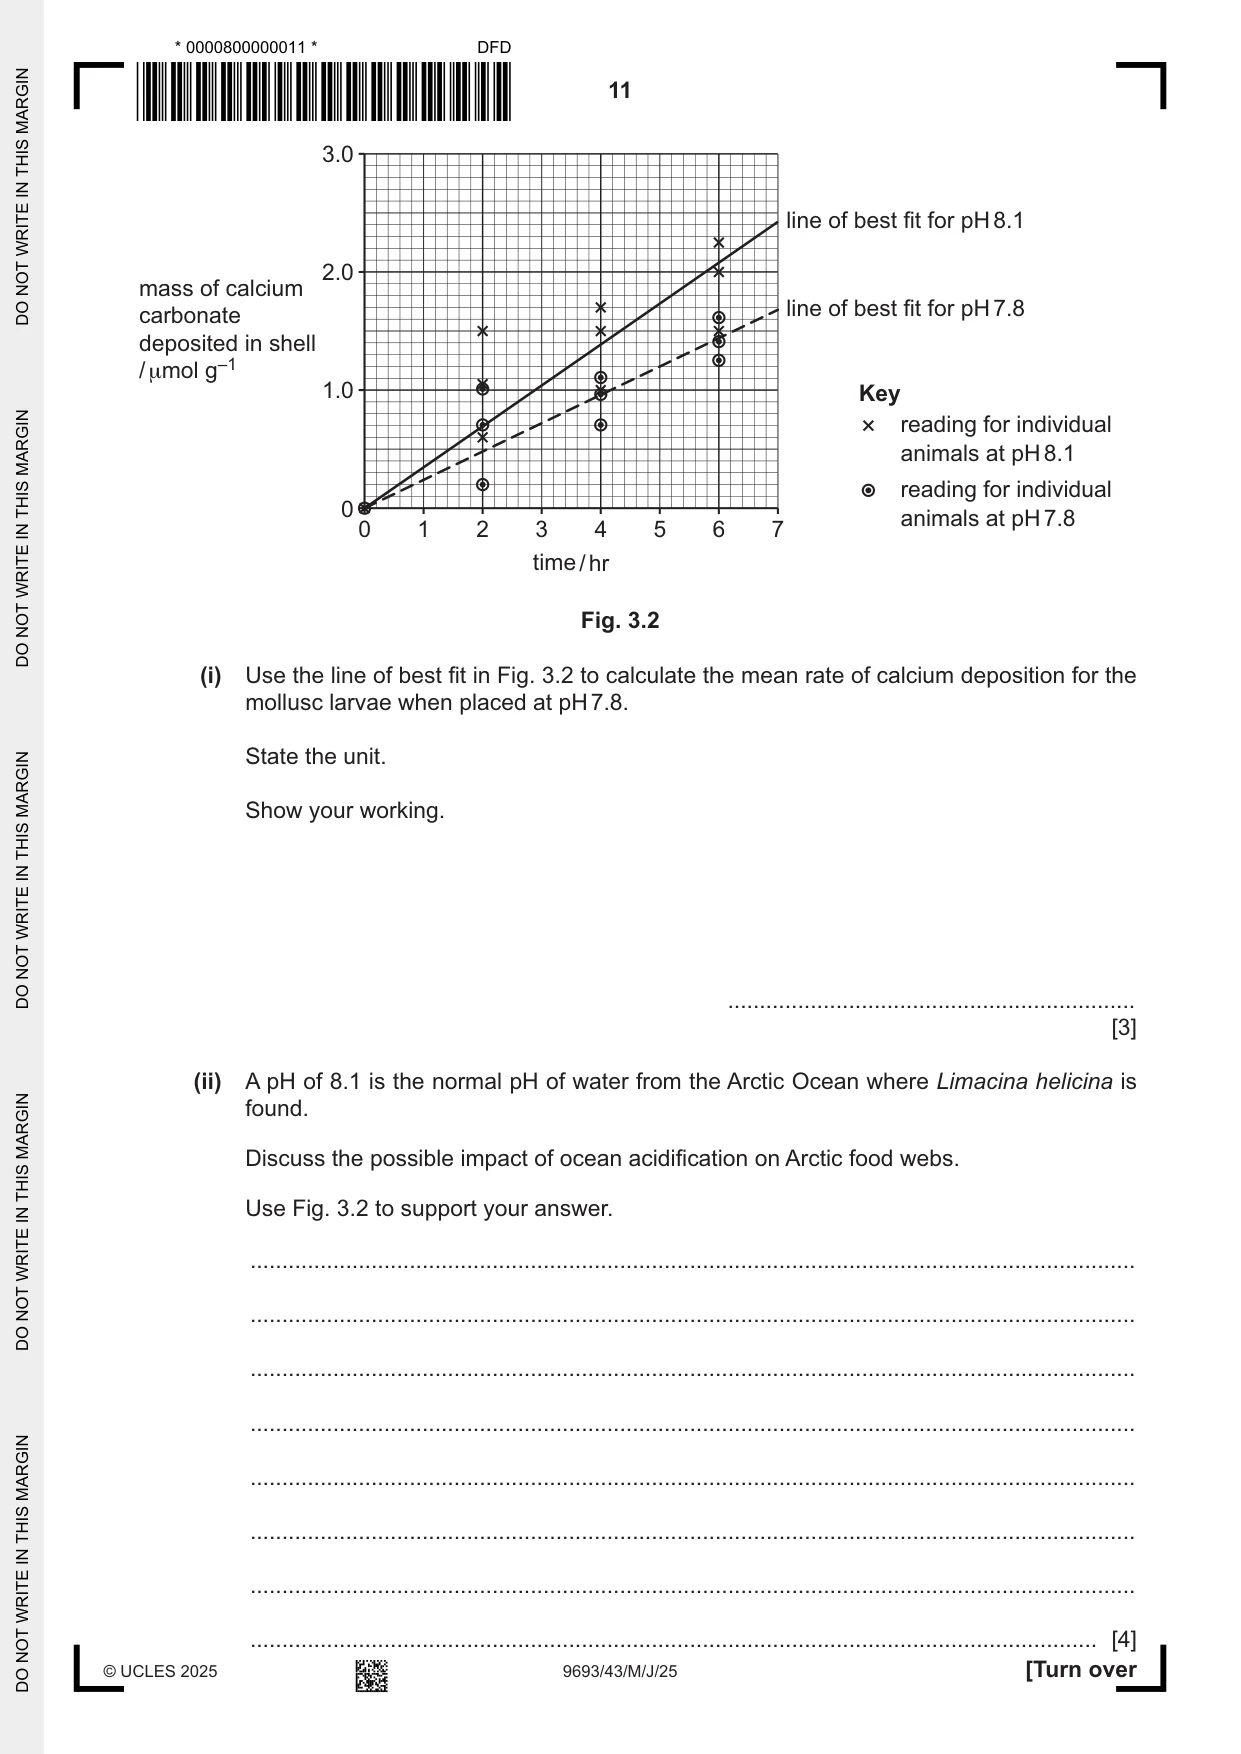
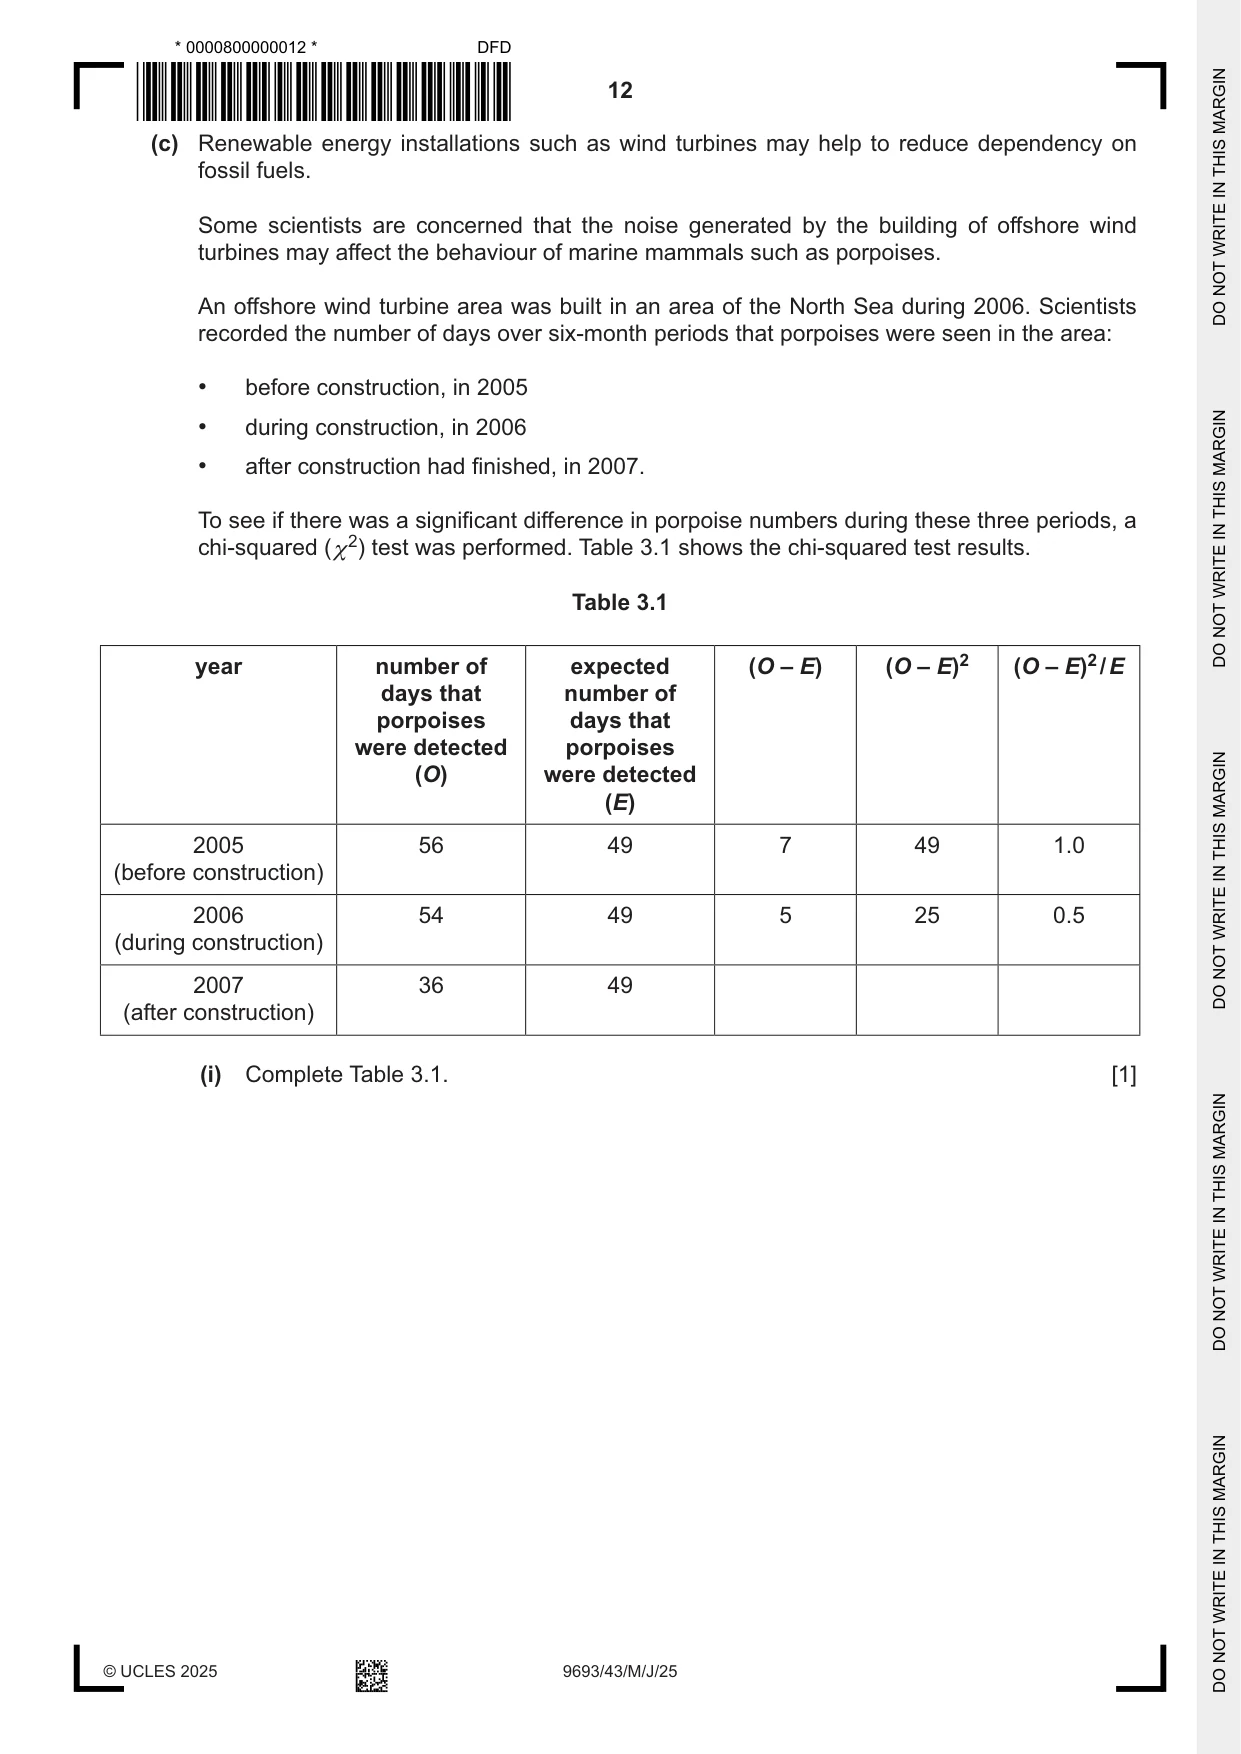
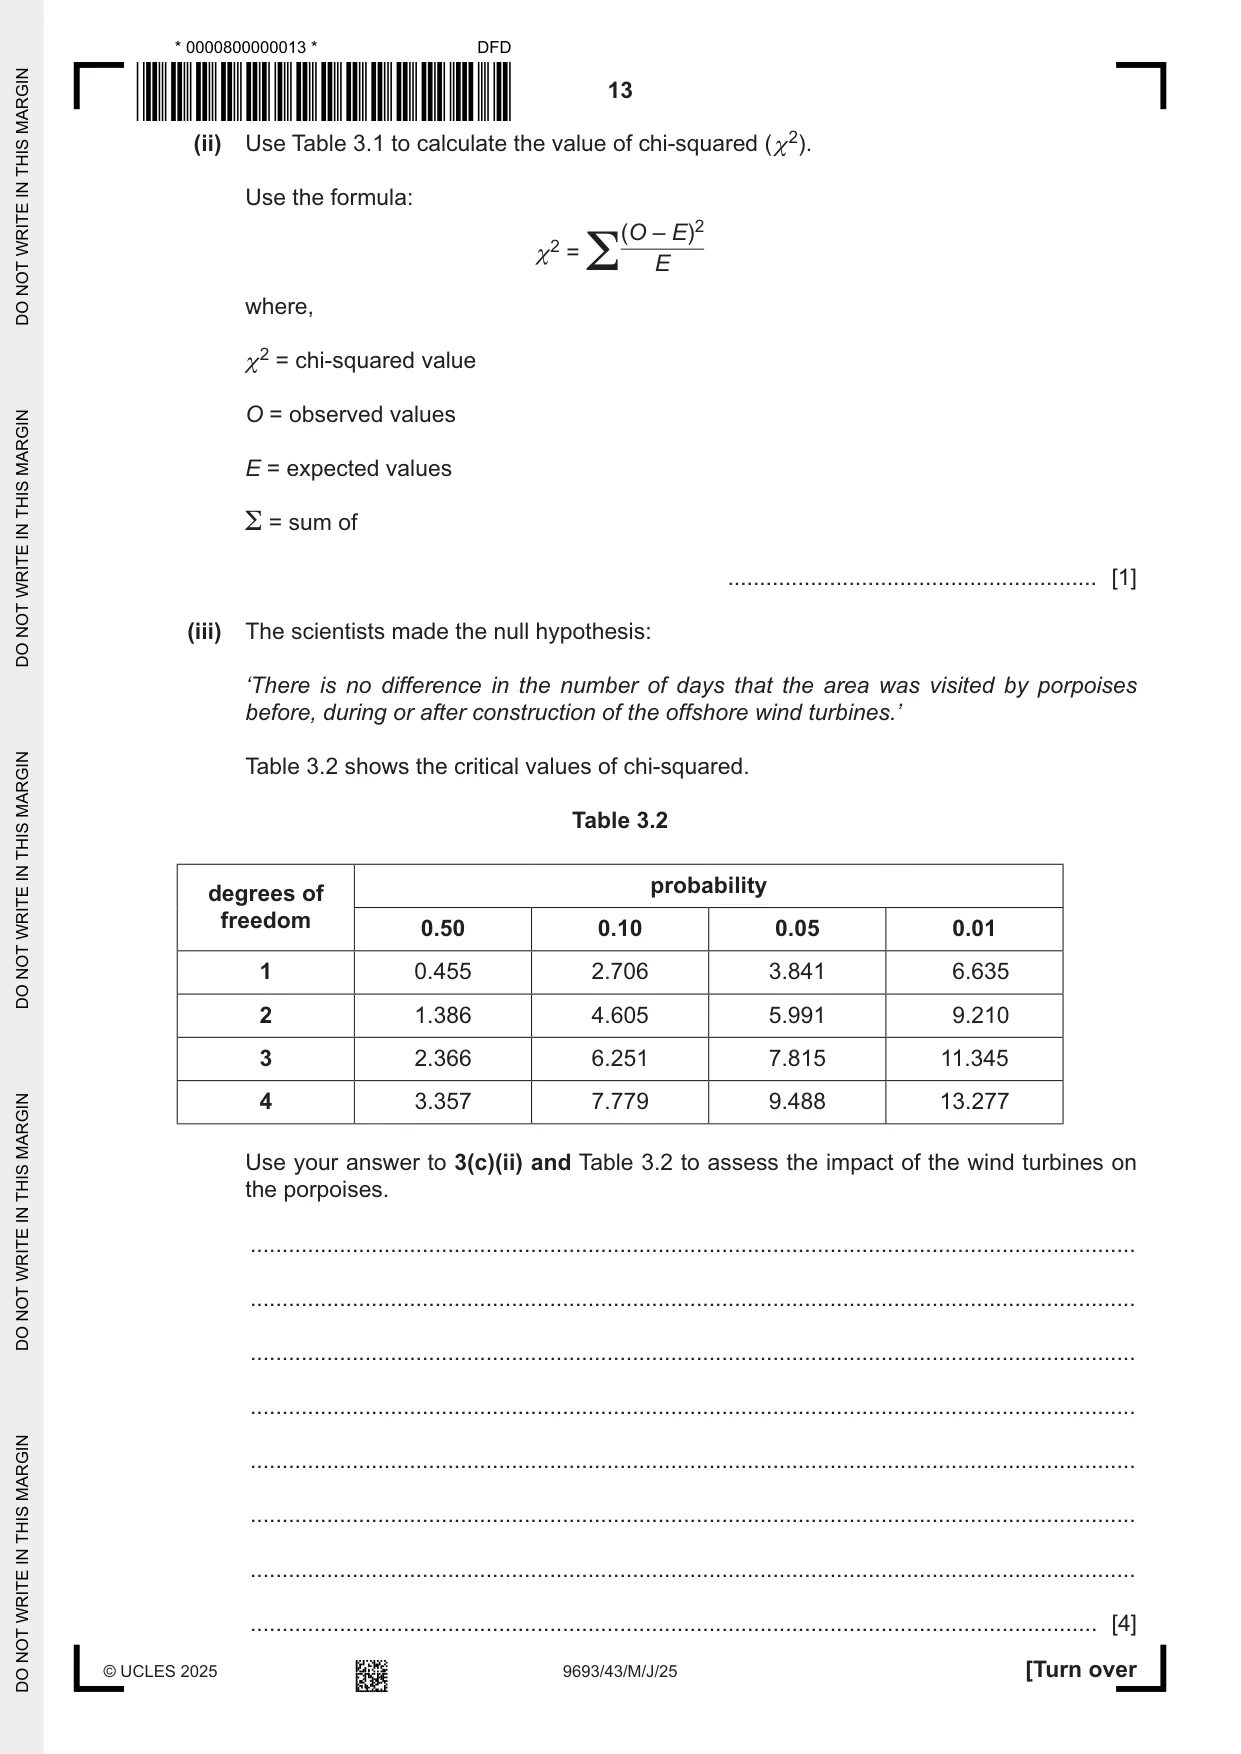
3 Carbon dioxide produced by the combustion of fossil fuels may lead to ocean acidification. (a) Describe how carbon dioxide reacts with water to increase the acidity. ................................................................................................................................................... ................................................................................................................................................... ................................................................................................................................................... ............................................................................................................................................. [2] (b) Fig. 3.1 shows a photograph of a free-swimming planktonic mollusc, Limacina helicina. This shelled species of mollusc is an important part of many Arctic food chains. Fig. 3.1 Scientists investigated the effect of changing pH on the mass of calcium carbonate deposited into the shells of Limacina helicina during larval development. Three larvae were incubated in each of two tanks of sea water, one at pH 8.1 and the other at pH 7.8. The mass of calcium carbonate deposited into the shells was measured every two hours for six hours. Fig. 3.2 shows the results. 3.0 line of best fit for pH 8.1 2.0 mass of calcium line of best fit for pH 7.8carbonate deposited in shell / μmol g–1 1.0 Key reading for individual animals at pH 8.1 reading for individual 0 animals at pH 7.8 0 1 2 3 4 5 6 7 time / hr Fig. 3.2 (i) Use the line of best fit in Fig. 3.2 to calculate the mean rate of calcium deposition for the mollusc larvae when placed at pH 7.8. State the unit. Show your working. ................................................................ [3] (ii) A pH of 8.1 is the normal pH of water from the Arctic Ocean where Limacina helicina is found. Discuss the possible impact of ocean acidification on Arctic food webs. Use Fig. 3.2 to support your answer. ........................................................................................................................................... ........................................................................................................................................... ........................................................................................................................................... ........................................................................................................................................... ........................................................................................................................................... ........................................................................................................................................... ........................................................................................................................................... ..................................................................................................................................... [4] (c) Renewable energy installations such as wind turbines may help to reduce dependency on fossil fuels. Some scientists are concerned that the noise generated by the building of offshore wind turbines may affect the behaviour of marine mammals such as porpoises. An offshore wind turbine area was built in an area of the North Sea during 2006. Scientists recorded the number of days over six-month periods that porpoises were seen in the area: • before construction, in 2005 • during construction, in 2006 • after construction had finished, in 2007. To see if there was a significant difference in porpoise numbers during these three periods, a chi-squared ( χ 2) test was performed. Table 3.1 shows the chi-squared test results. Table 3.1 year number of expected (O – E) (O – E)2 (O – E)2 / E days that number of porpoises days that were detected porpoises (O) were detected (E) 2005 56 49 7 49 1.0 (before construction) 2006 54 49 5 25 0.5 (during construction) 2007 36 49 (after construction) (i) Complete Table 3.1. [1] (ii) Use Table 3.1 to calculate the value of chi-squared ( χ 2). Use the formula: (O – E)2 χ 2 = Σ E where, χ 2 = chi-squared value O = observed values E = expected values Σ = sum of .......................................................... [1] (iii) The scientists made the null hypothesis: ‘There is no difference in the number of days that the area was visited by porpoises before, during or after construction of the offshore wind turbines.’ Table 3.2 shows the critical values of chi-squared. Table 3.2 probability degrees of freedom 0.50 0.10 0.05 0.01 1 0.455 2.706 3.841 6.635 2 1.386 4.605 5.991 9.210 3 2.366 6.251 7.815 11.345 4 3.357 7.779 9.488 13.277 Use your answer to 3(c)(ii) and Table 3.2 to assess the impact of the wind turbines on the porpoises. ........................................................................................................................................... ........................................................................................................................................... ........................................................................................................................................... ........................................................................................................................................... ........................................................................................................................................... ........................................................................................................................................... ........................................................................................................................................... ..................................................................................................................................... [4] (d) The use of renewable energy could reduce the risk of ocean acidification. State two other benefits of increasing the use of renewable energy installations. 1 ................................................................................................................................................ ................................................................................................................................................... 2 ................................................................................................................................................ ................................................................................................................................................... [2] [Total: 17]
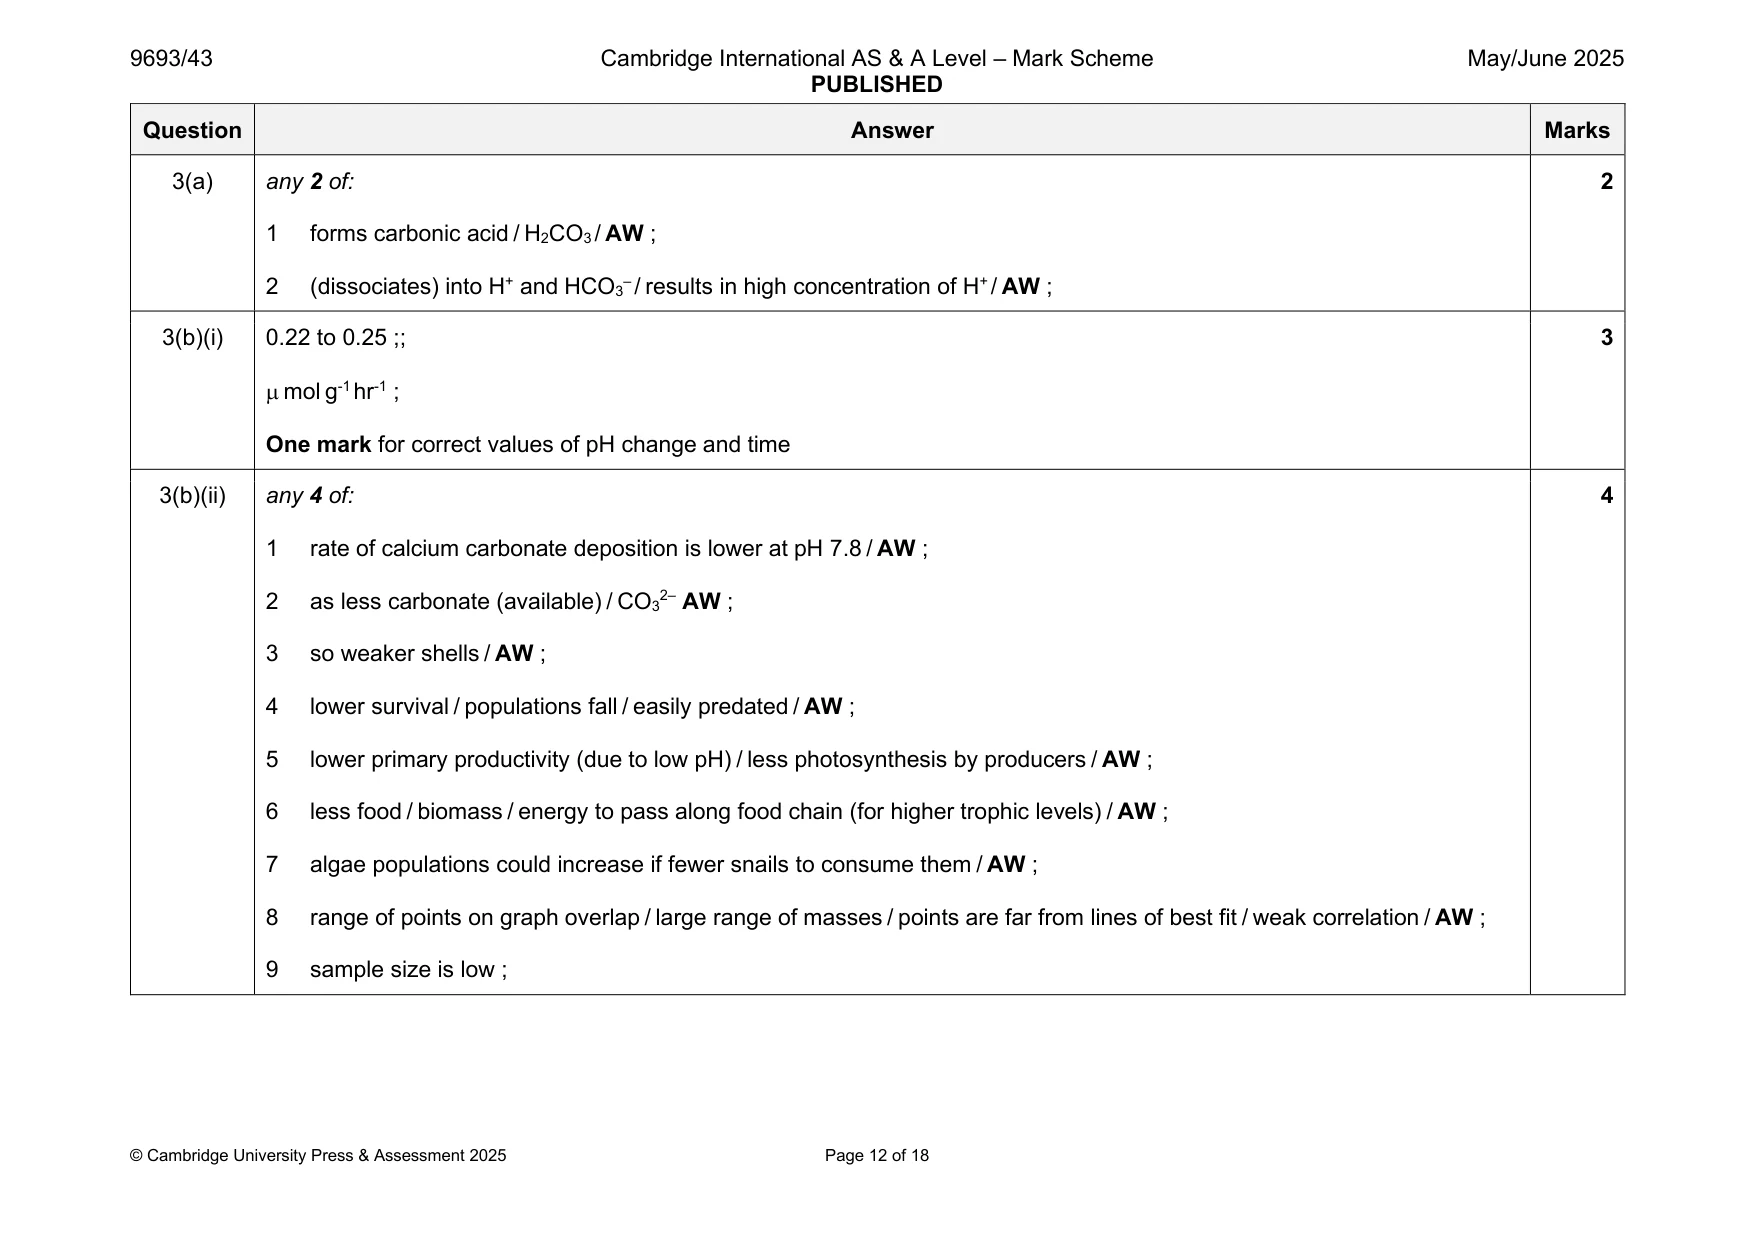
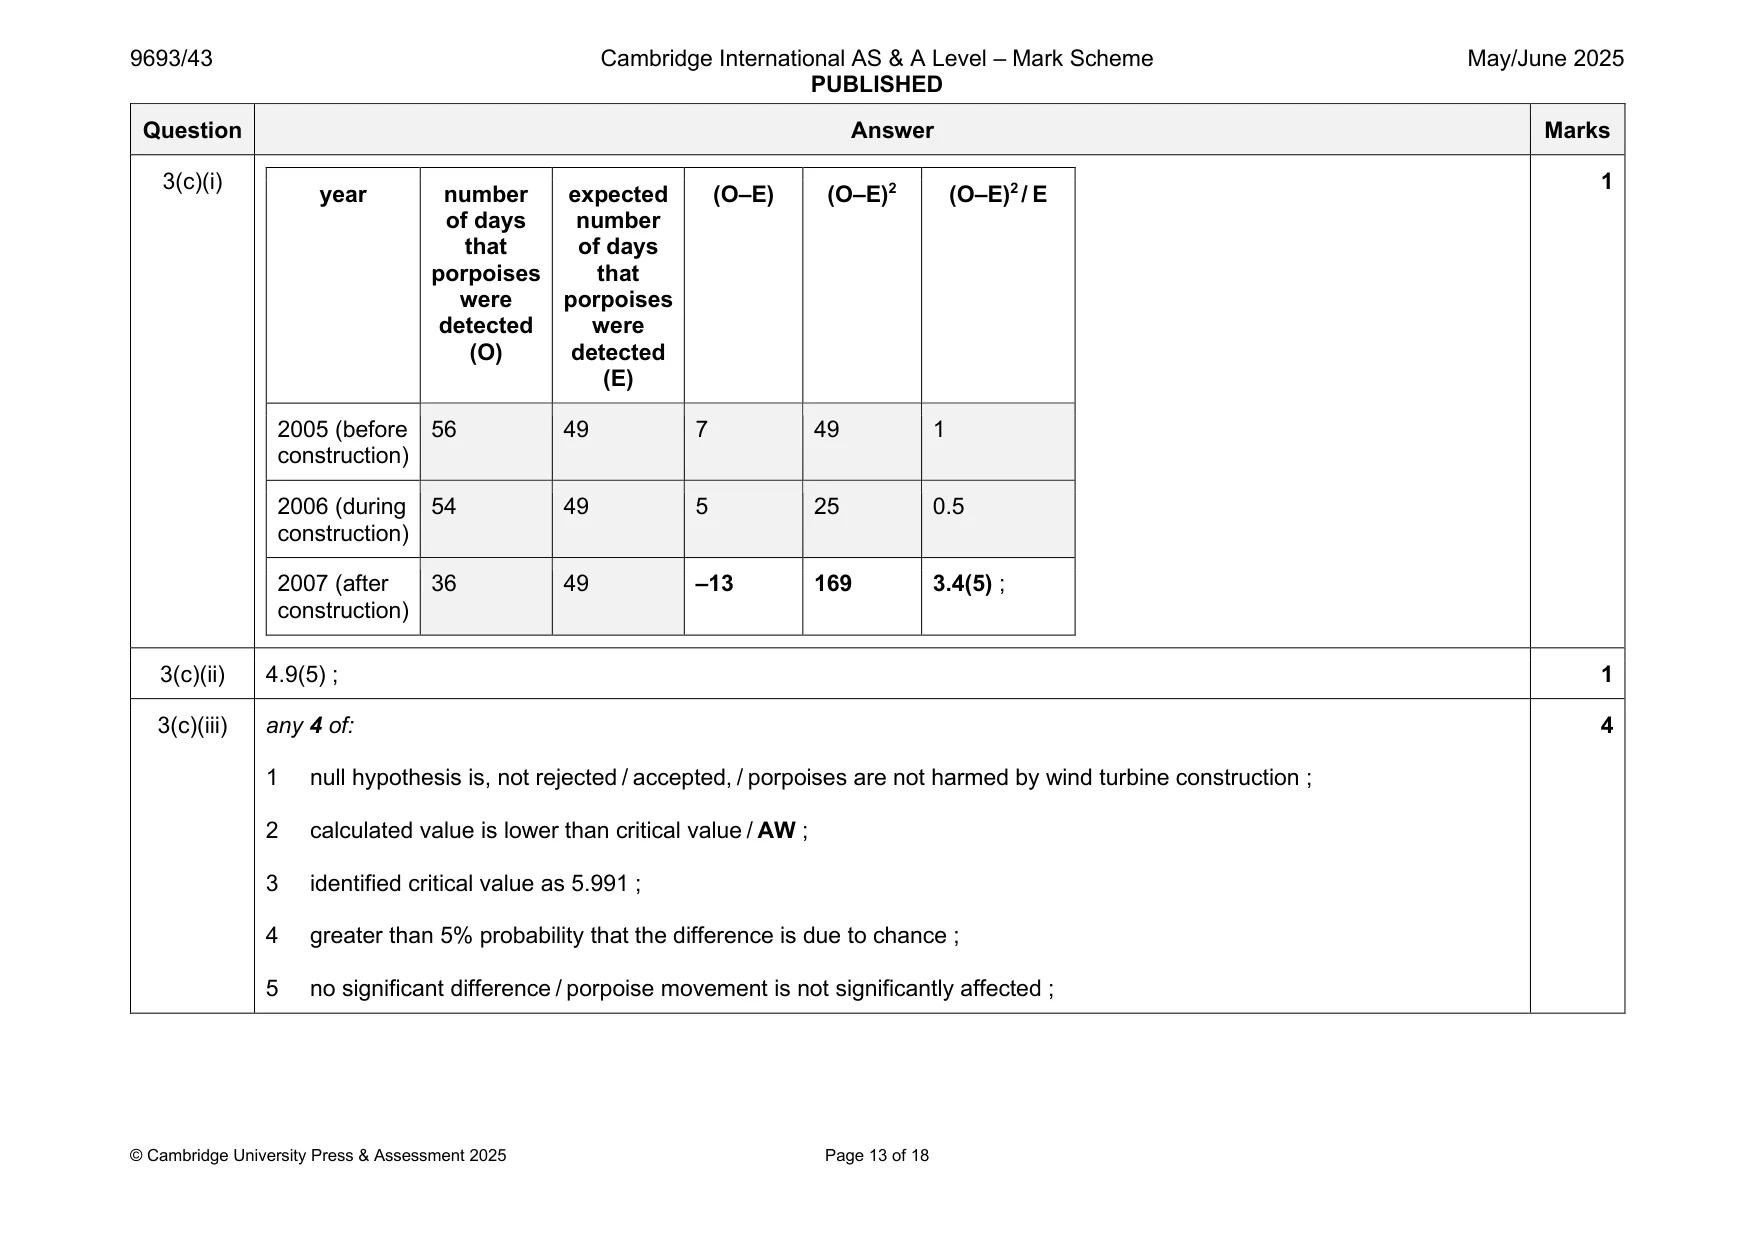
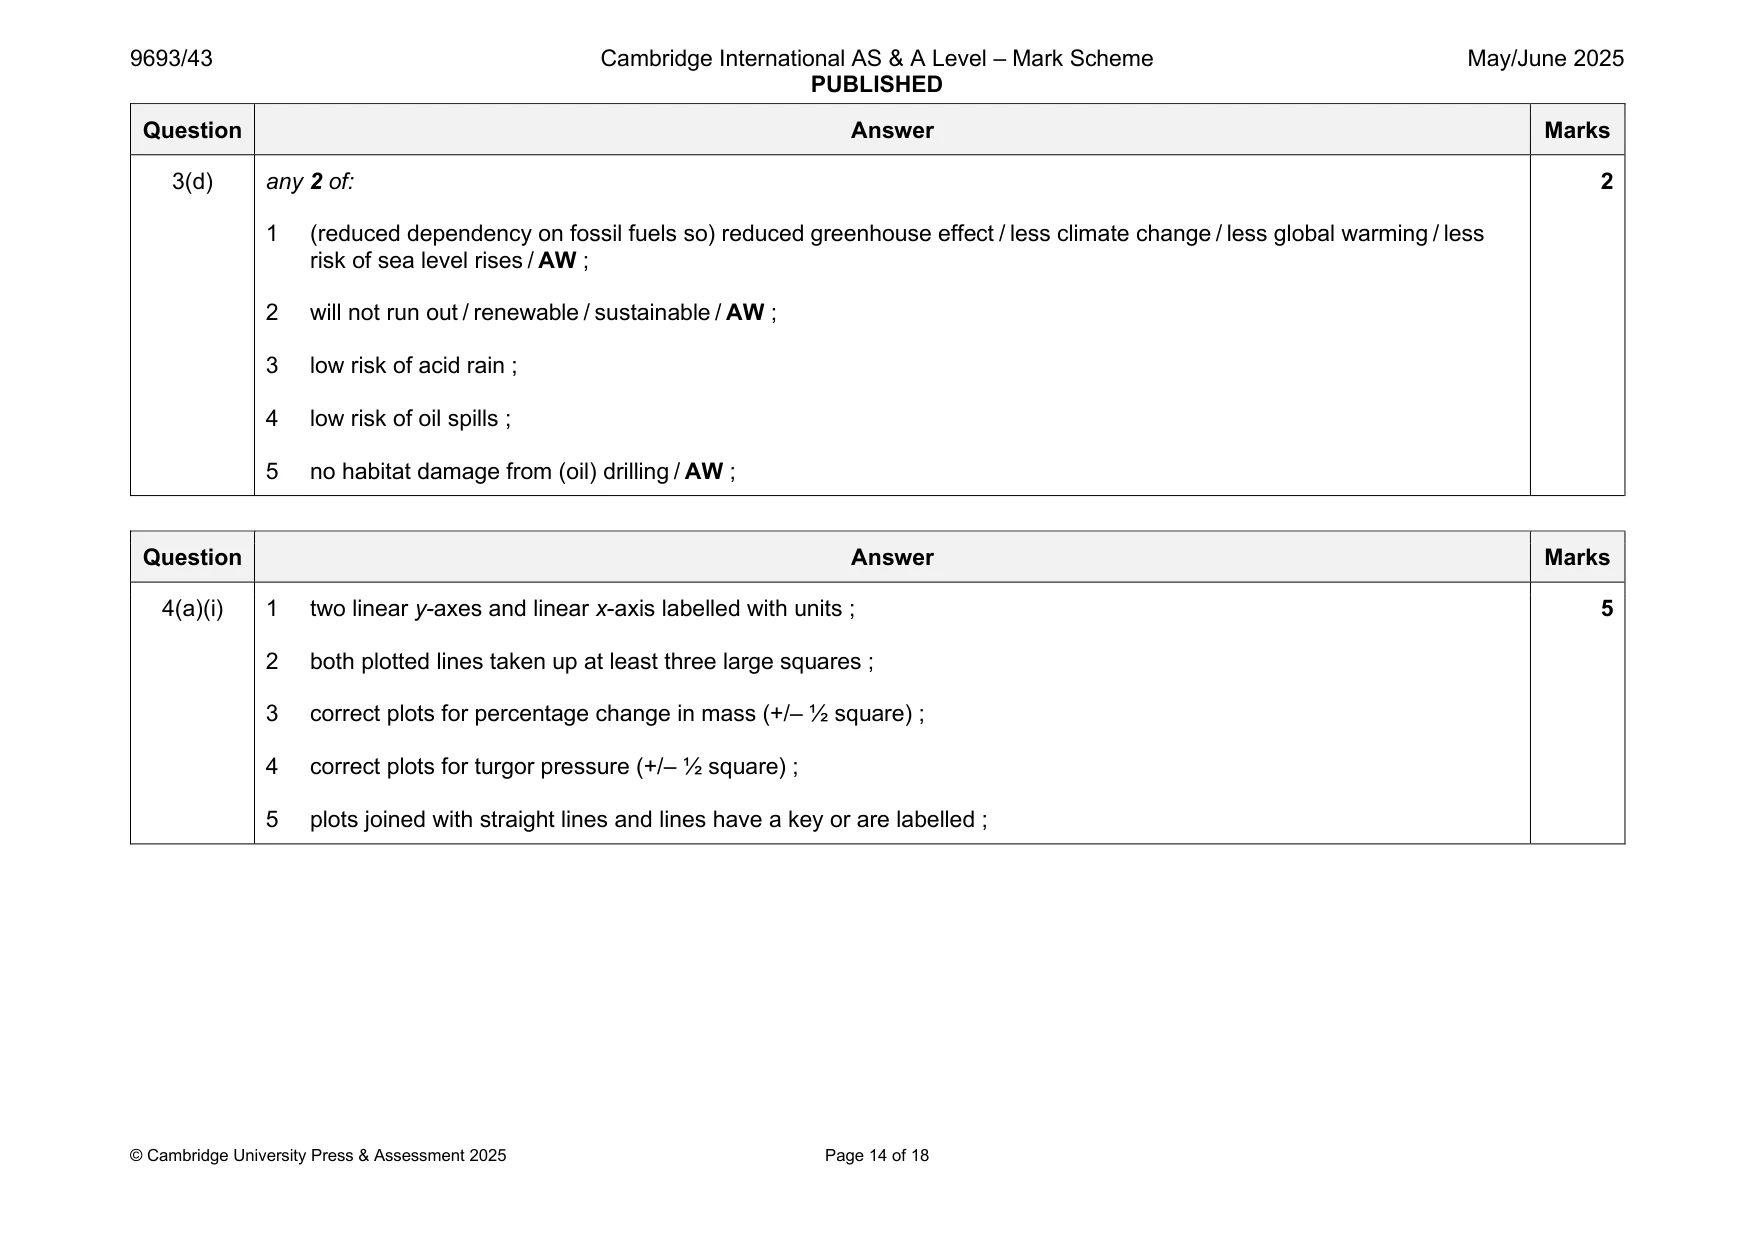
Mark scheme: 3(a) any 2 of: 2 1 forms carbonic acid / H2CO3 / AW ; 2 (dissociates) into H+ and HCO3– / results in high concentration of H+ / AW ; 3(b)(i) 0.22 to 0.25 ;; 3 mol g-1 hr-1 ; One mark for correct values of pH change and time 3(b)(ii) any 4 of: 4 1 rate of calcium carbonate deposition is lower at pH 7.8 / AW ; 2 as less carbonate (available) / CO32– AW ; 3 so weaker shells / AW ; 4 lower survival / populations fall / easily predated / AW ; 5 lower primary productivity (due to low pH) / less photosynthesis by producers / AW ; 6 less food / biomass / energy to pass along food chain (for higher trophic levels) / AW ; 7 algae populations could increase if fewer snails to consume them / AW ; 8 range of points on graph overlap / large range of masses / points are far from lines of best fit / weak correlation / AW ; 9 sample size is low ; 3(c)(i) 1 year number expected (O–E) (O–E)2 (O–E)2 / E of days number that of days porpoises that were porpoises detected were (O) detected (E) 2005 (before 56 49 7 49 1 construction) 2006 (during 54 49 5 25 0.5 construction) 2007 (after 36 49 –13 169 3.4(5) ; construction) 3(c)(ii) 4.9(5) ; 1 3(c)(iii) any 4 of: 4 1 null hypothesis is, not rejected / accepted, / porpoises are not harmed by wind turbine construction ; 2 calculated value is lower than critical value / AW ; 3 identified critical value as 5.991 ; 4 greater than 5% probability that the difference is due to chance ; 5 no significant difference / porpoise movement is not significantly affected ; 3(d) any 2 of: 2 1 (reduced dependency on fossil fuels so) reduced greenhouse effect / less climate change / less global warming / less risk of sea level rises / AW ; 2 will not run out / renewable / sustainable / AW ; 3 low risk of acid rain ; 4 low risk of oil spills ; 5 no habitat damage from (oil) drilling / AW ;
Q4 · Turgor pressure is the force exerted by the contents of the cytoplasm of a plant cell…
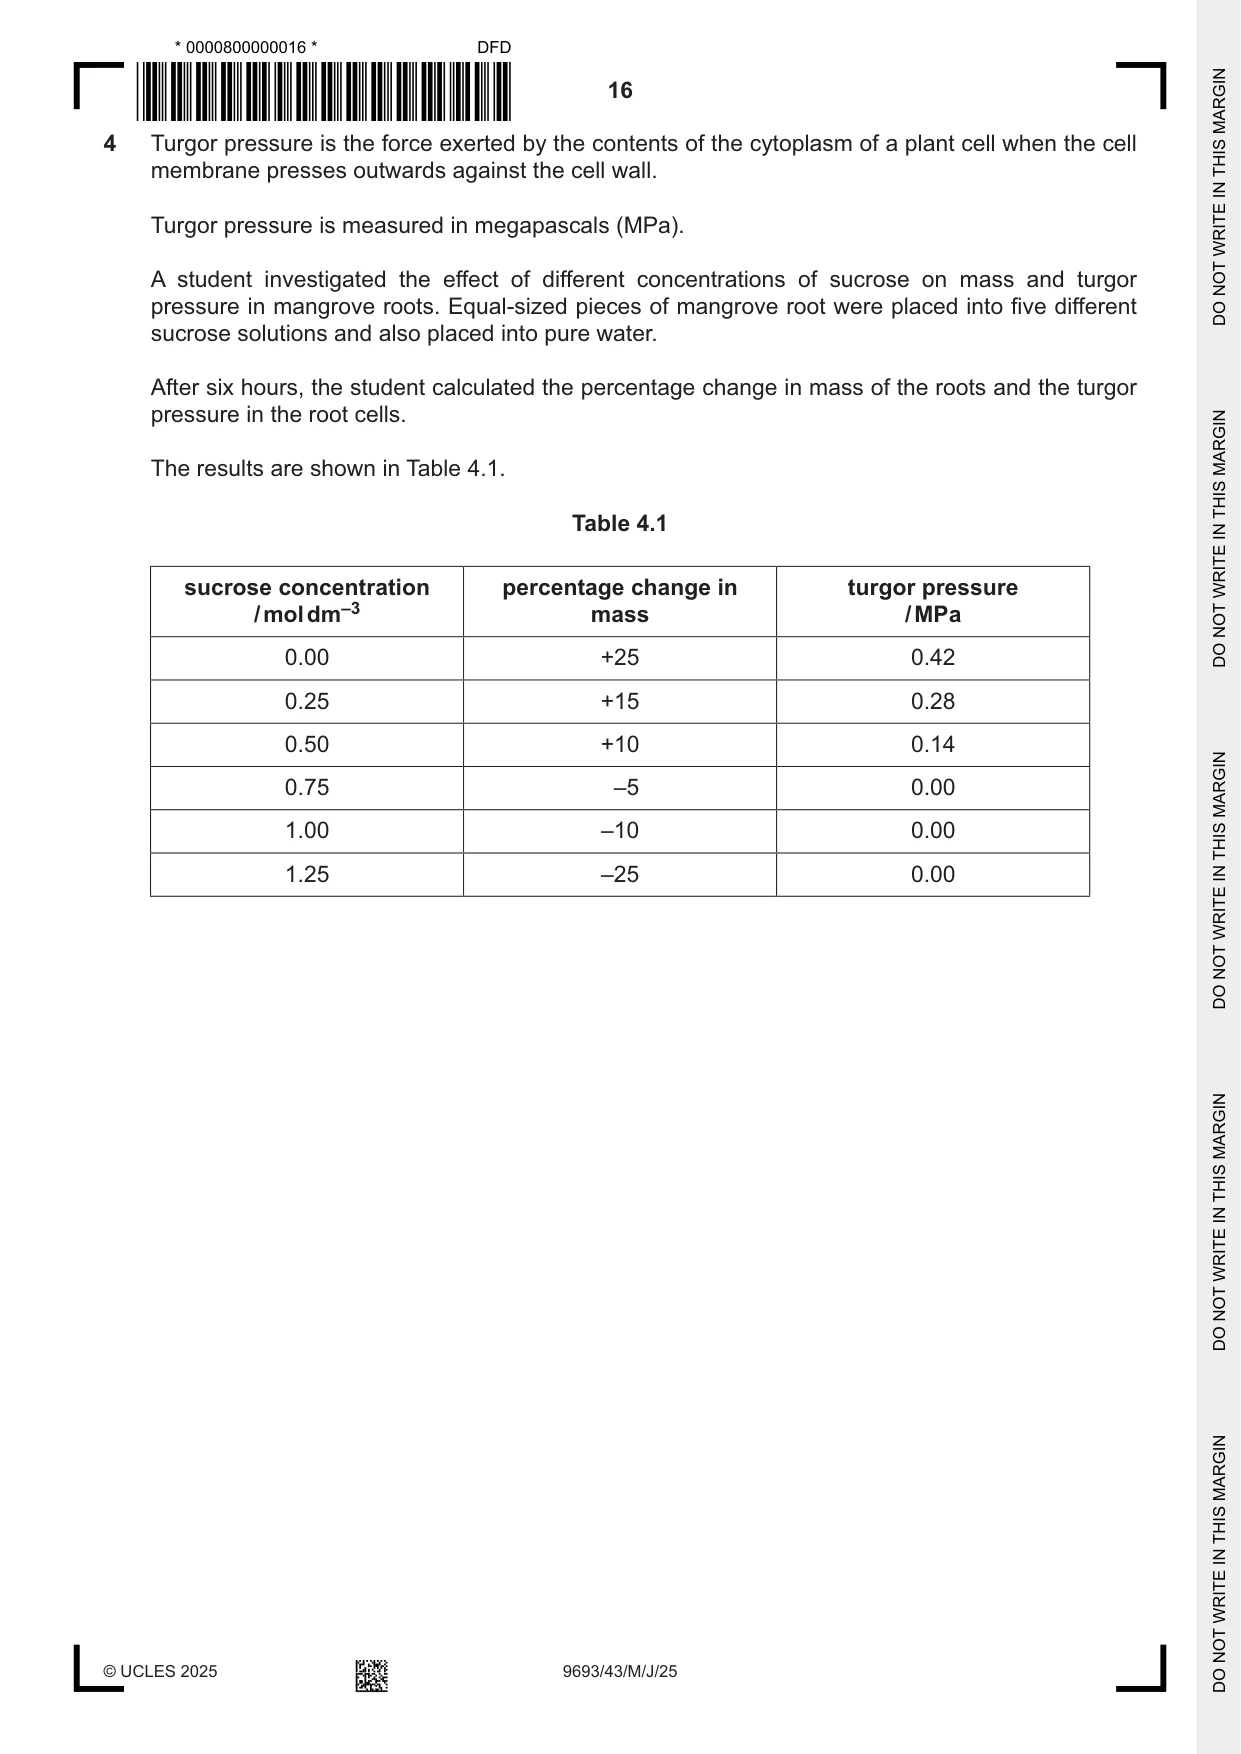
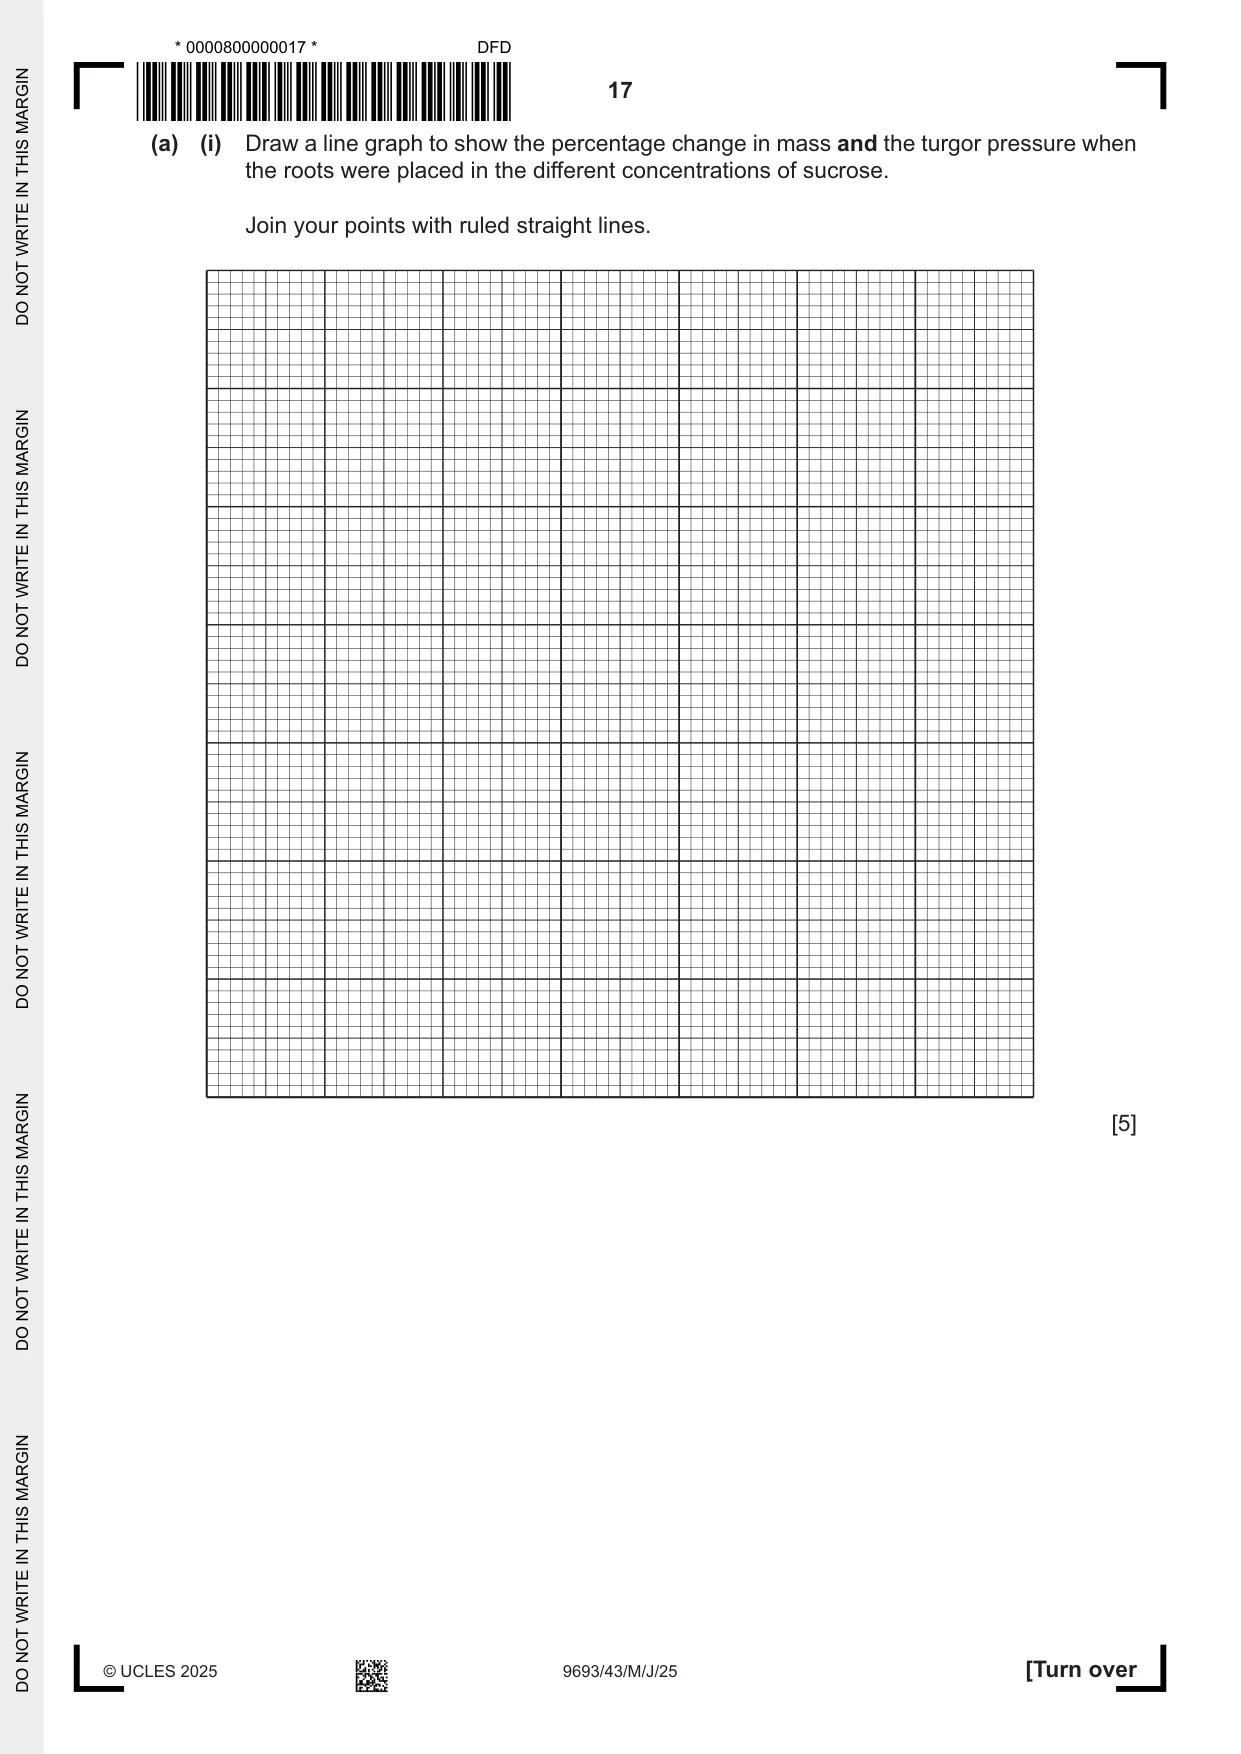
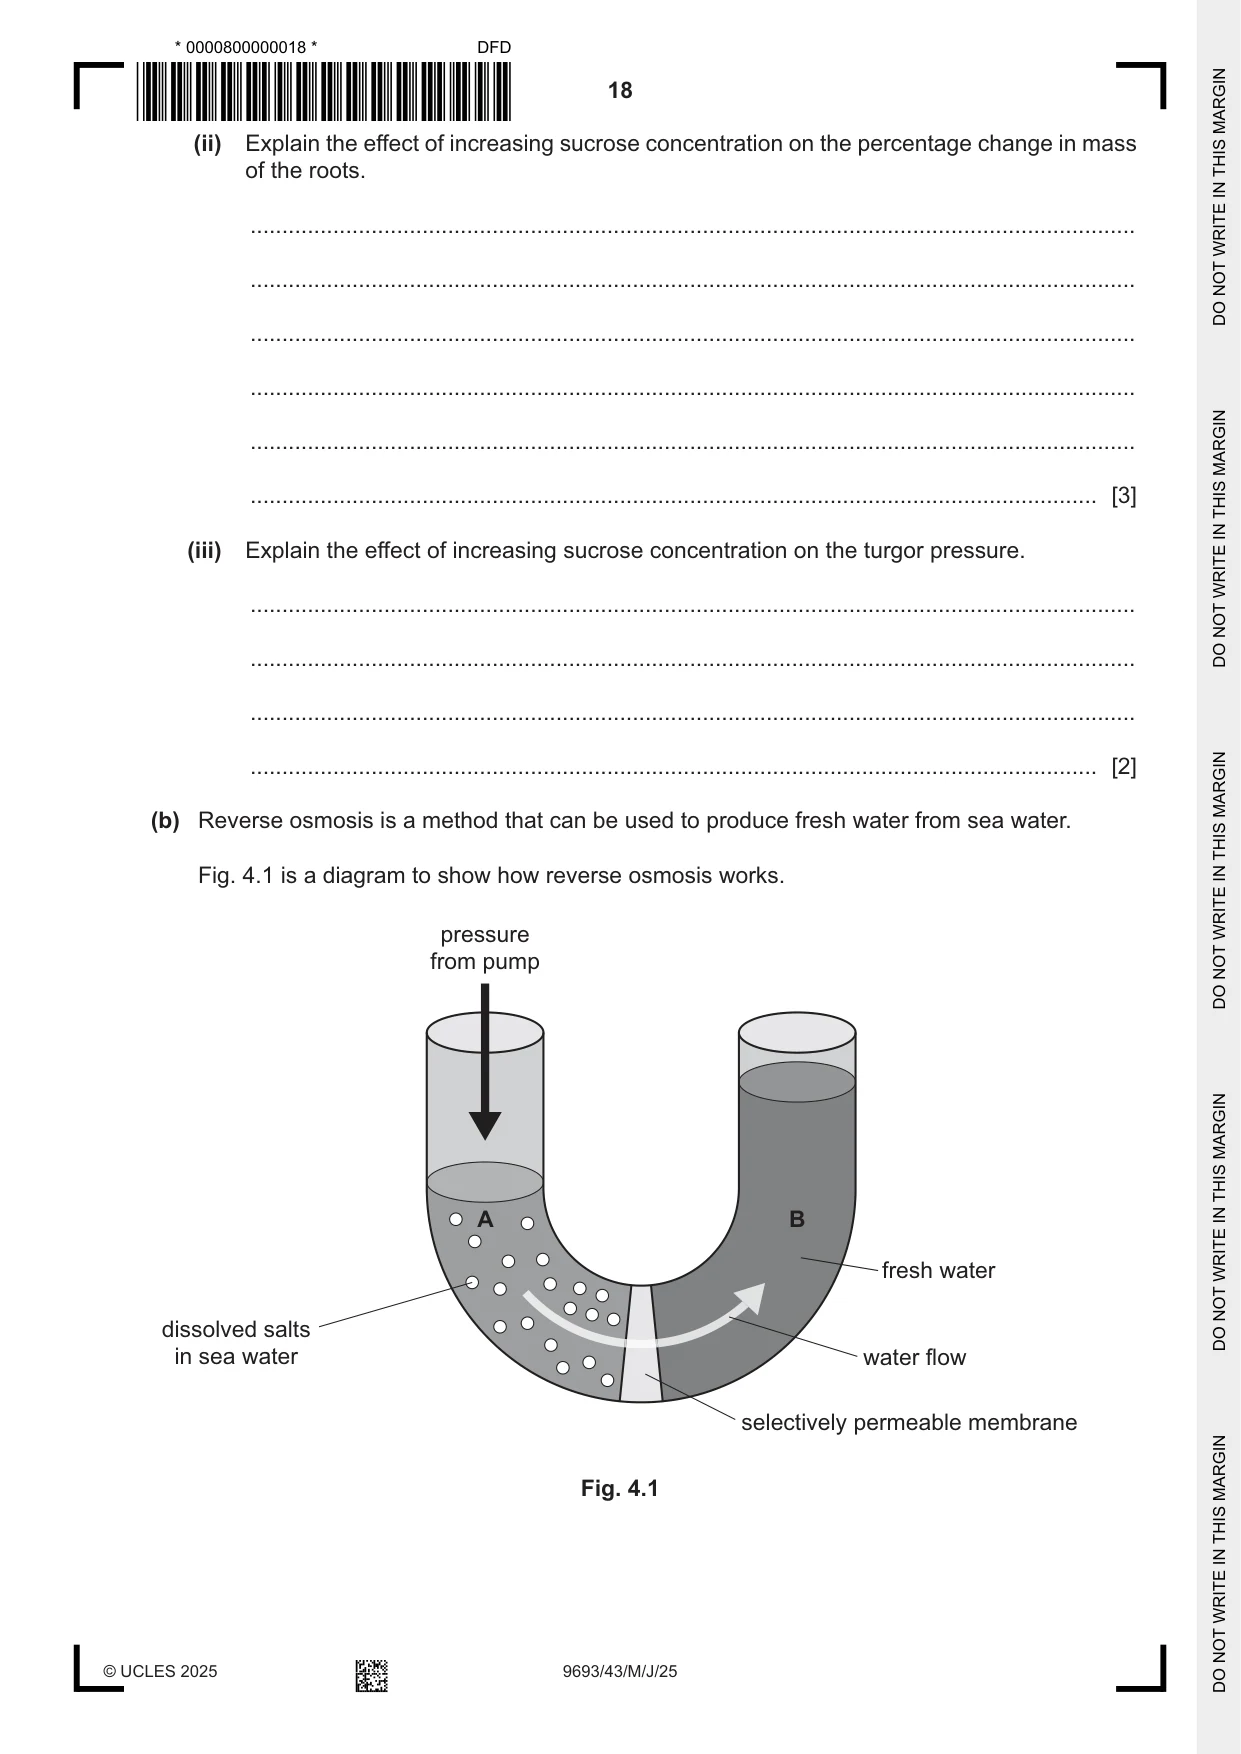
4 Turgor pressure is the force exerted by the contents of the cytoplasm of a plant cell when the cell membrane presses outwards against the cell wall. Turgor pressure is measured in megapascals (MPa). A student investigated the effect of different concentrations of sucrose on mass and turgor pressure in mangrove roots. Equal-sized pieces of mangrove root were placed into five different sucrose solutions and also placed into pure water. After six hours, the student calculated the percentage change in mass of the roots and the turgor pressure in the root cells. The results are shown in Table 4.1. Table 4.1 sucrose concentration percentage change in turgor pressure / mol dm–3 mass / MPa 0.00 +25 0.42 0.25 +15 0.28 0.50 +10 0.14 0.75 –5 0.00 1.00 –10 0.00 1.25 –25 0.00 (a) (i) Draw a line graph to show the percentage change in mass and the turgor pressure when the roots were placed in the different concentrations of sucrose. Join your points with ruled straight lines. [5] (ii) Explain the effect of increasing sucrose concentration on the percentage change in mass of the roots. ........................................................................................................................................... ........................................................................................................................................... ........................................................................................................................................... ........................................................................................................................................... ........................................................................................................................................... ..................................................................................................................................... [3] (iii) Explain the effect of increasing sucrose concentration on the turgor pressure. ........................................................................................................................................... ........................................................................................................................................... ........................................................................................................................................... ..................................................................................................................................... [2] (b) Reverse osmosis is a method that can be used to produce fresh water from sea water. Fig. 4.1 is a diagram to show how reverse osmosis works. pressure from pump A B fresh water dissolved salts in sea water water flow selectively permeable membrane Fig. 4.1 (i) A pump forces sea water under pressure into chamber A. Fresh water is produced in chamber B. Explain why pressure is needed to produce the fresh water in chamber B. ........................................................................................................................................... ........................................................................................................................................... ........................................................................................................................................... ..................................................................................................................................... [2] (ii) Chamber A contains a very concentrated solution of salts after the reverse osmosis process has finished. Explain why this solution in chamber A should not be returned to the sea. ........................................................................................................................................... ........................................................................................................................................... ........................................................................................................................................... ........................................................................................................................................... ........................................................................................................................................... ..................................................................................................................................... [3] [Total: 15]
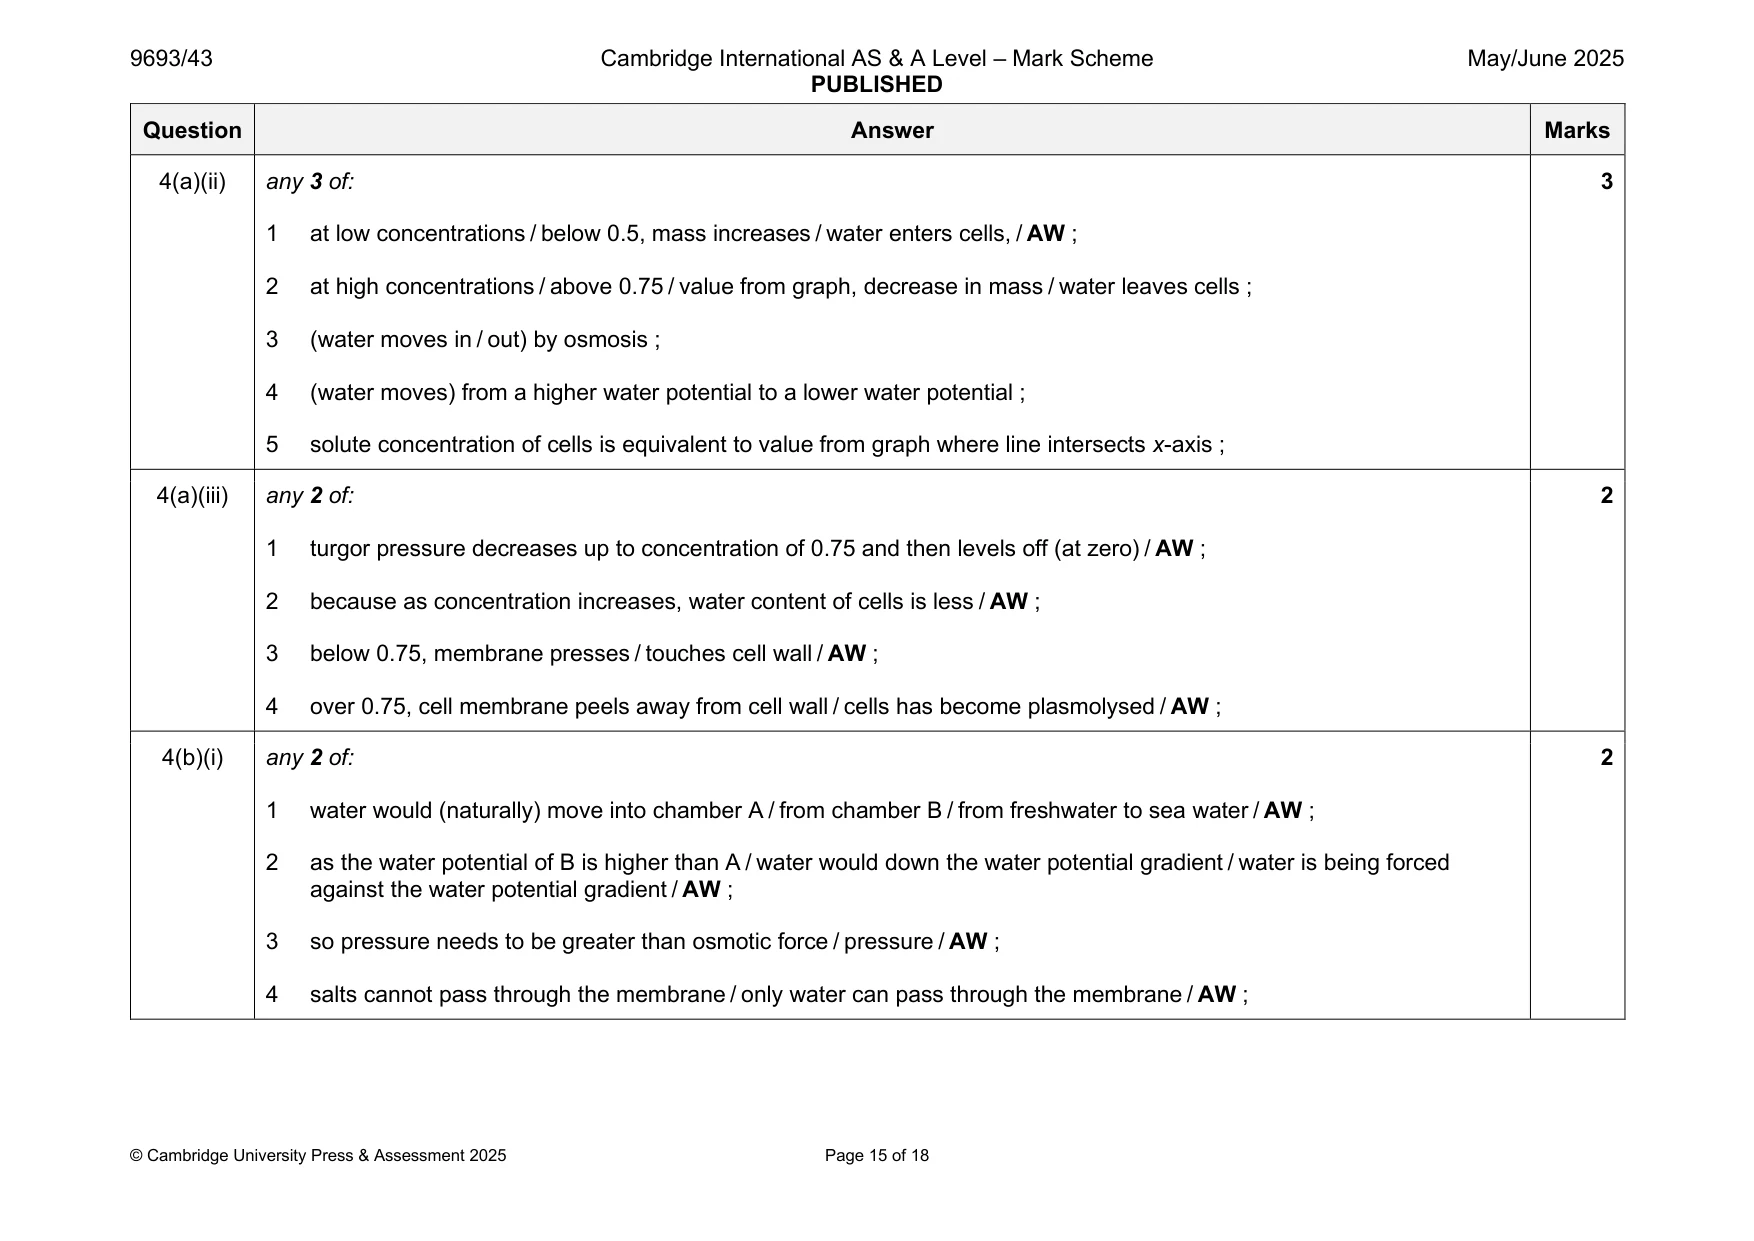
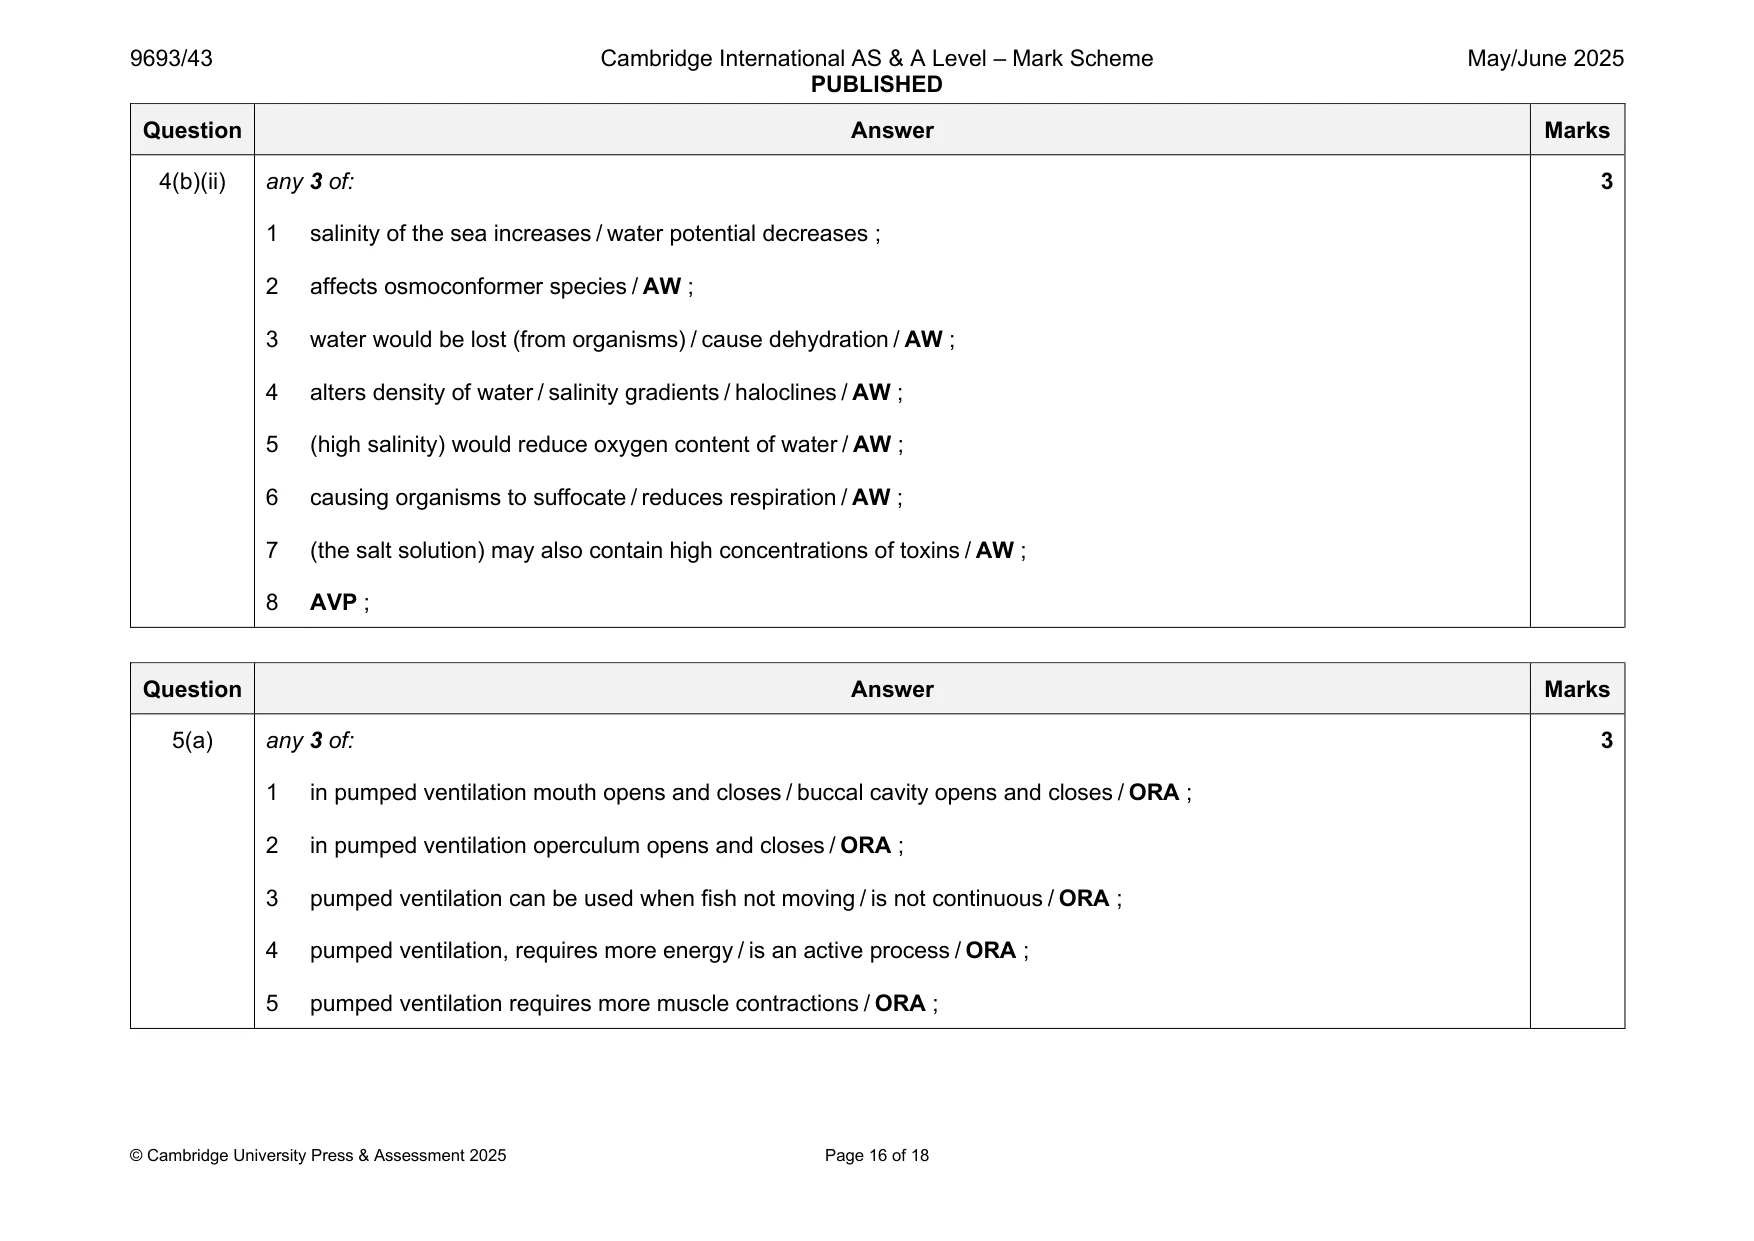
Mark scheme: 4(a)(i) 1 two linear y-axes and linear x-axis labelled with units ; 5 2 both plotted lines taken up at least three large squares ; 3 correct plots for percentage change in mass (+/– ½ square) ; 4 correct plots for turgor pressure (+/– ½ square) ; 5 plots joined with straight lines and lines have a key or are labelled ; 4(a)(ii) any 3 of: 3 1 at low concentrations / below 0.5, mass increases / water enters cells, / AW ; 2 at high concentrations / above 0.75 / value from graph, decrease in mass / water leaves cells ; 3 (water moves in / out) by osmosis ; 4 (water moves) from a higher water potential to a lower water potential ; 5 solute concentration of cells is equivalent to value from graph where line intersects x-axis ; 4(a)(iii) any 2 of: 2 1 turgor pressure decreases up to concentration of 0.75 and then levels off (at zero) / AW ; 2 because as concentration increases, water content of cells is less / AW ; 3 below 0.75, membrane presses / touches cell wall / AW ; 4 over 0.75, cell membrane peels away from cell wall / cells has become plasmolysed / AW ; 4(b)(i) any 2 of: 2 1 water would (naturally) move into chamber A / from chamber B / from freshwater to sea water / AW ; 2 as the water potential of B is higher than A / water would down the water potential gradient / water is being forced against the water potential gradient / AW ; 3 so pressure needs to be greater than osmotic force / pressure / AW ; 4 salts cannot pass through the membrane / only water can pass through the membrane / AW ; 4(b)(ii) any 3 of: 3 1 salinity of the sea increases / water potential decreases ; 2 affects osmoconformer species / AW ; 3 water would be lost (from organisms) / cause dehydration / AW ; 4 alters density of water / salinity gradients / haloclines / AW ; 5 (high salinity) would reduce oxygen content of water / AW ; 6 causing organisms to suffocate / reduces respiration / AW ; 7 (the salt solution) may also contain high concentrations of toxins / AW ; 8 AVP ;
Q5 · A photograph of a sea trout
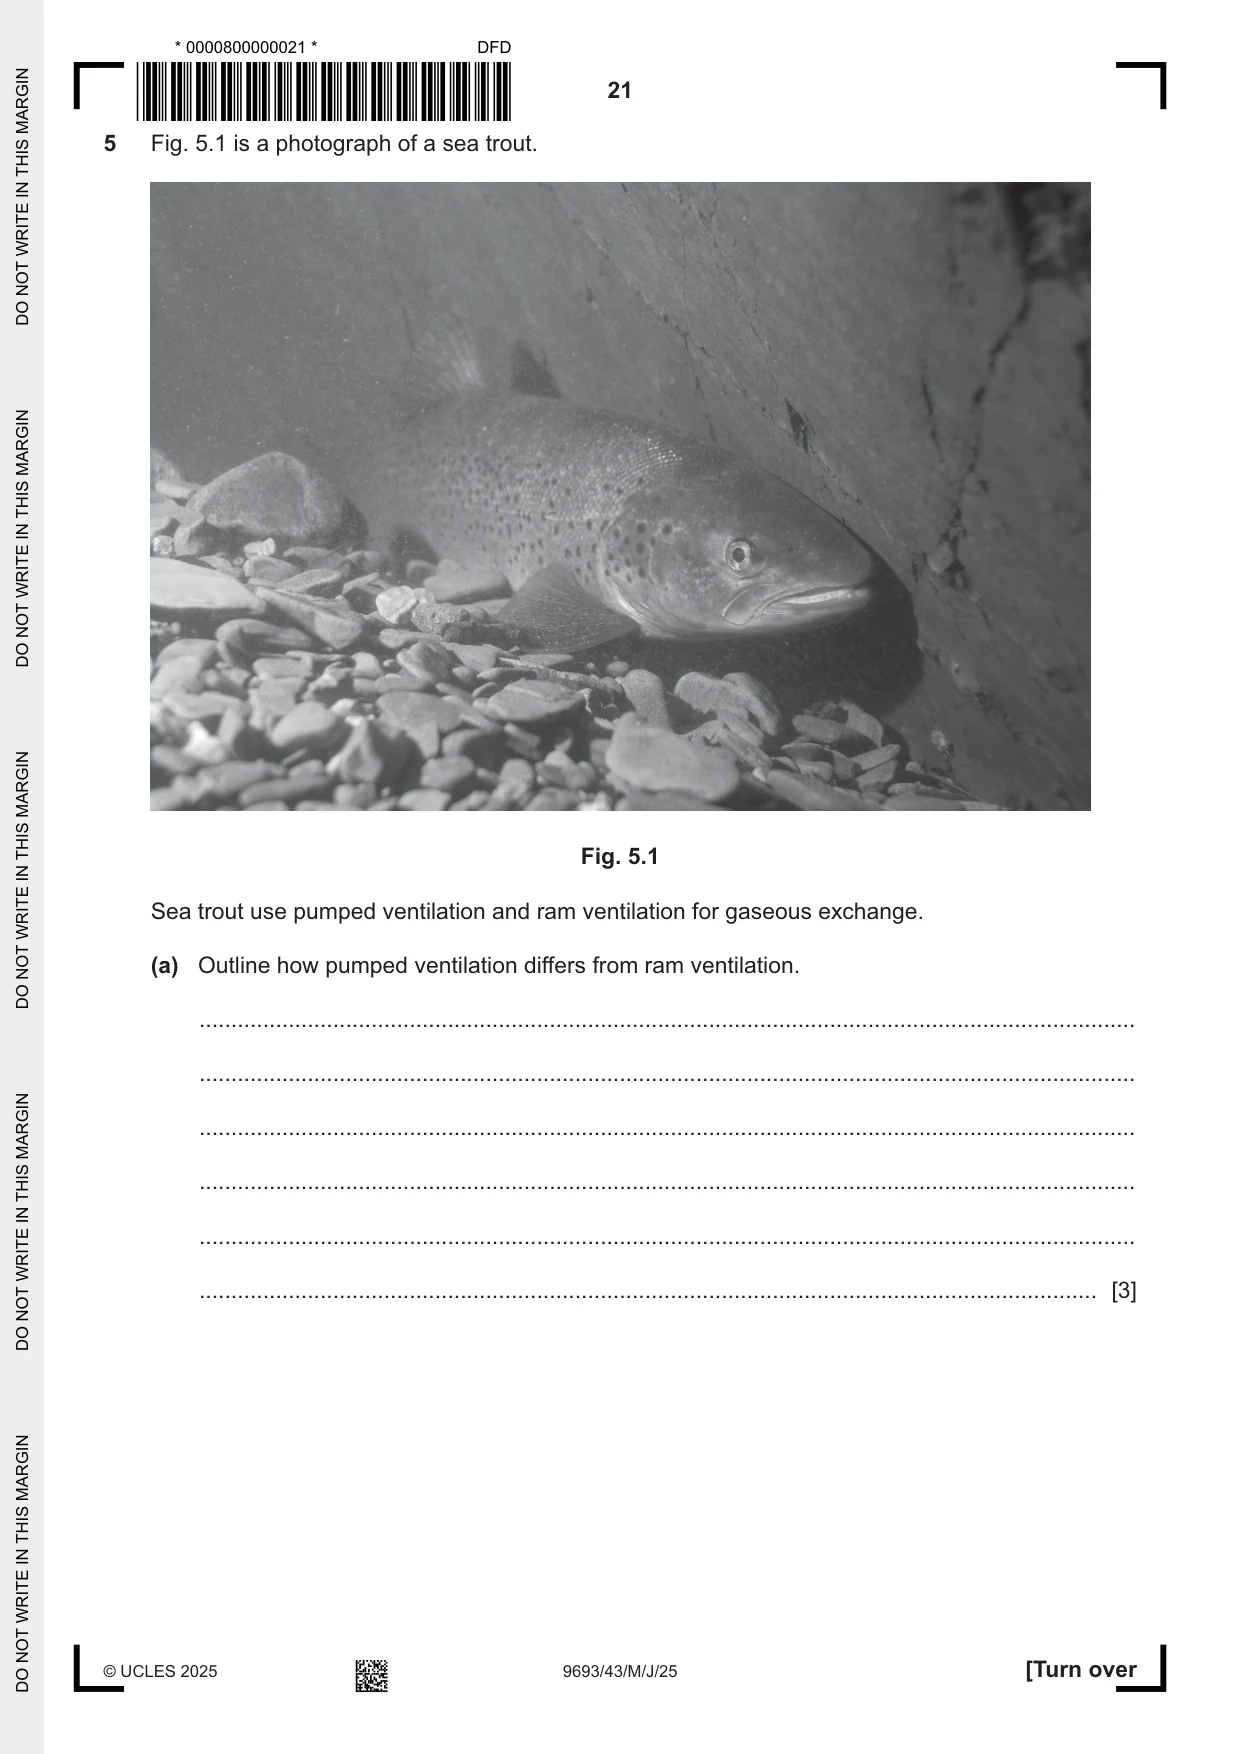
5 Fig. 5.1 is a photograph of a sea trout. Fig. 5.1 Sea trout use pumped ventilation and ram ventilation for gaseous exchange. (a) Outline how pumped ventilation differs from ram ventilation. ................................................................................................................................................... ................................................................................................................................................... ................................................................................................................................................... ................................................................................................................................................... ................................................................................................................................................... ............................................................................................................................................. [3] (b) The carbon dioxide concentration of surrounding water may affect the rate of pumped ventilation in sea trout. Plan a laboratory-based investigation to see if increasing the carbon dioxide concentration of water changes the rate of pumped ventilation in sea trout. Your plan should: • include a clear statement of the hypothesis • identify the independent, dependent and standardised variables • include full details of the method so that another person can follow it • describe how you would analyse your results • be safe and ethical. ................................................................................................................................................... ................................................................................................................................................... ................................................................................................................................................... ................................................................................................................................................... ................................................................................................................................................... ................................................................................................................................................... ................................................................................................................................................... ................................................................................................................................................... ................................................................................................................................................... ................................................................................................................................................... ................................................................................................................................................... ................................................................................................................................................... ................................................................................................................................................... ................................................................................................................................................... ................................................................................................................................................... ................................................................................................................................................... ................................................................................................................................................... ................................................................................................................................................... ................................................................................................................................................... ................................................................................................................................................... ................................................................................................................................................... ................................................................................................................................................... ................................................................................................................................................... ........................................................................................................................................... [12] [Total: 15]
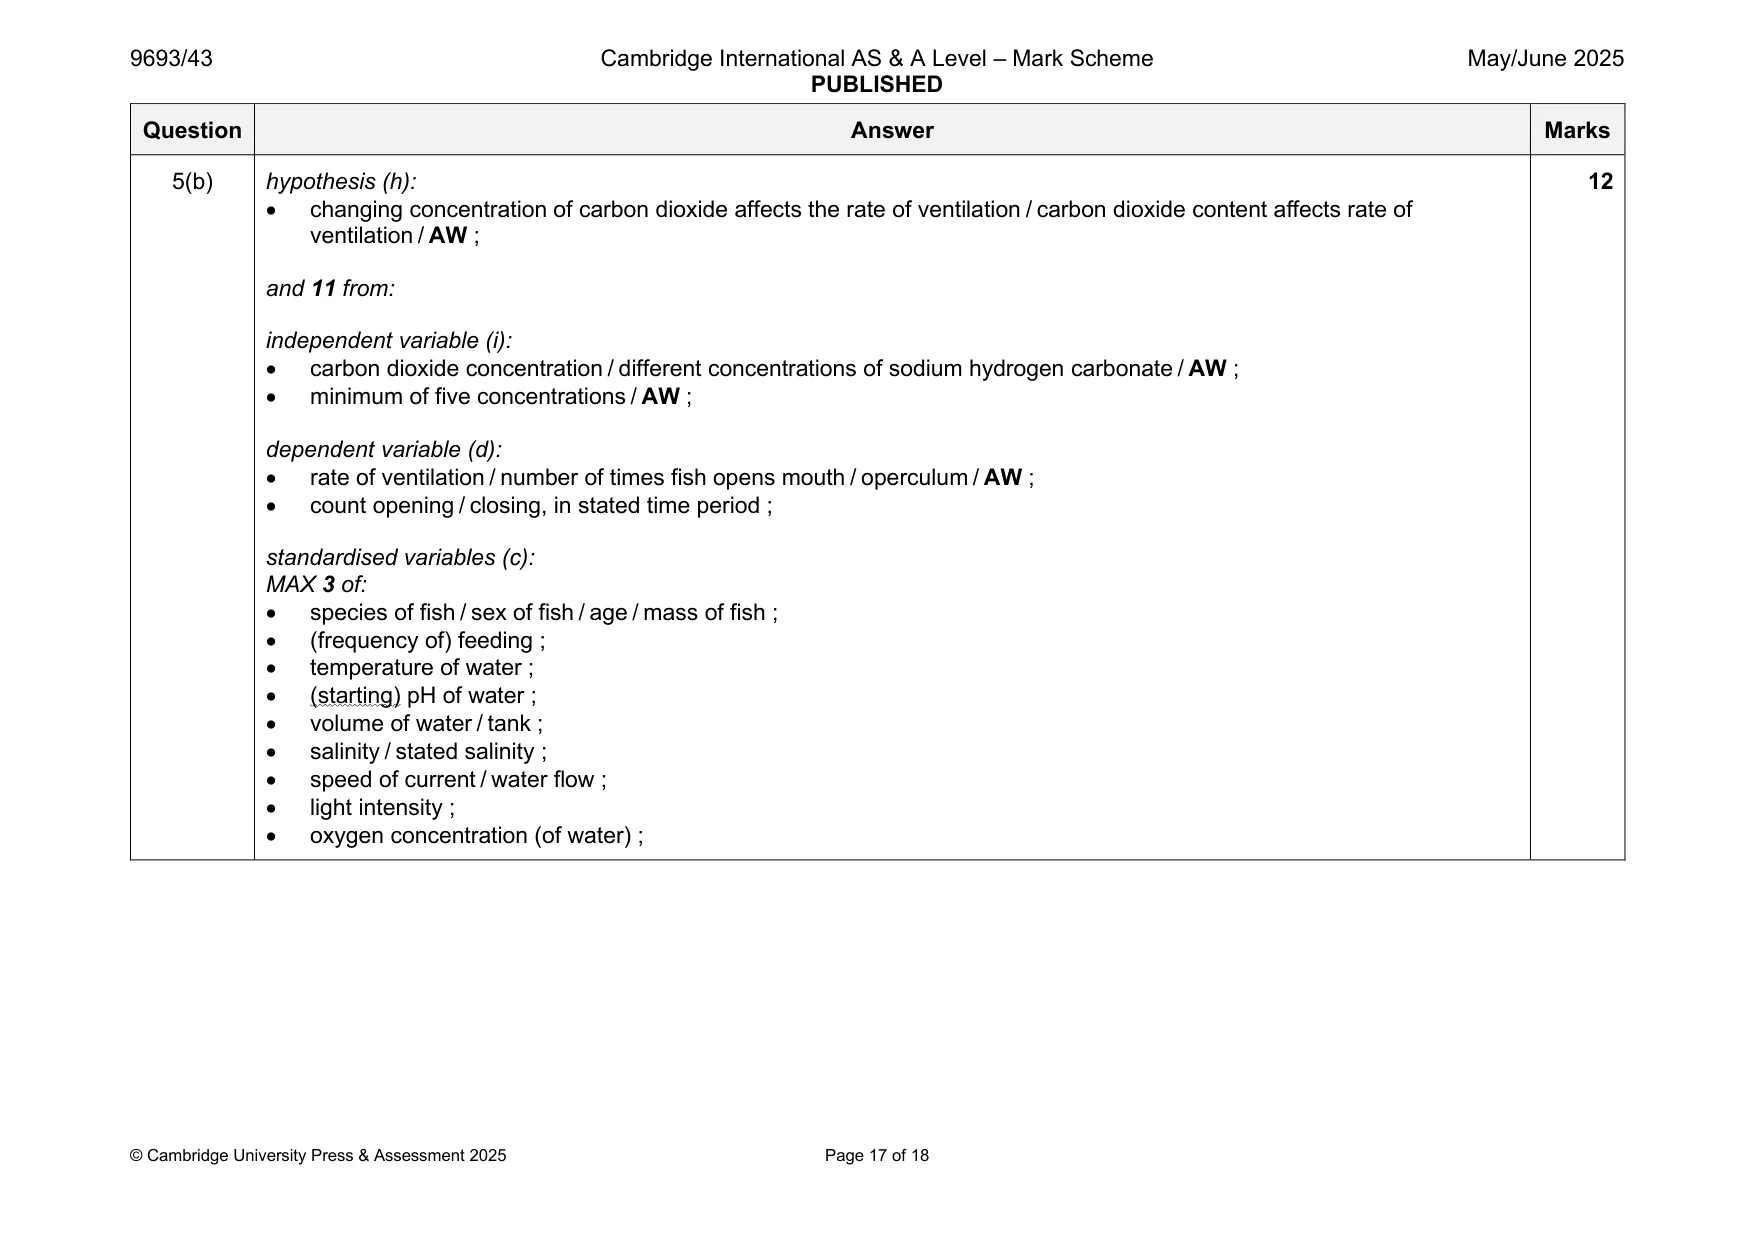
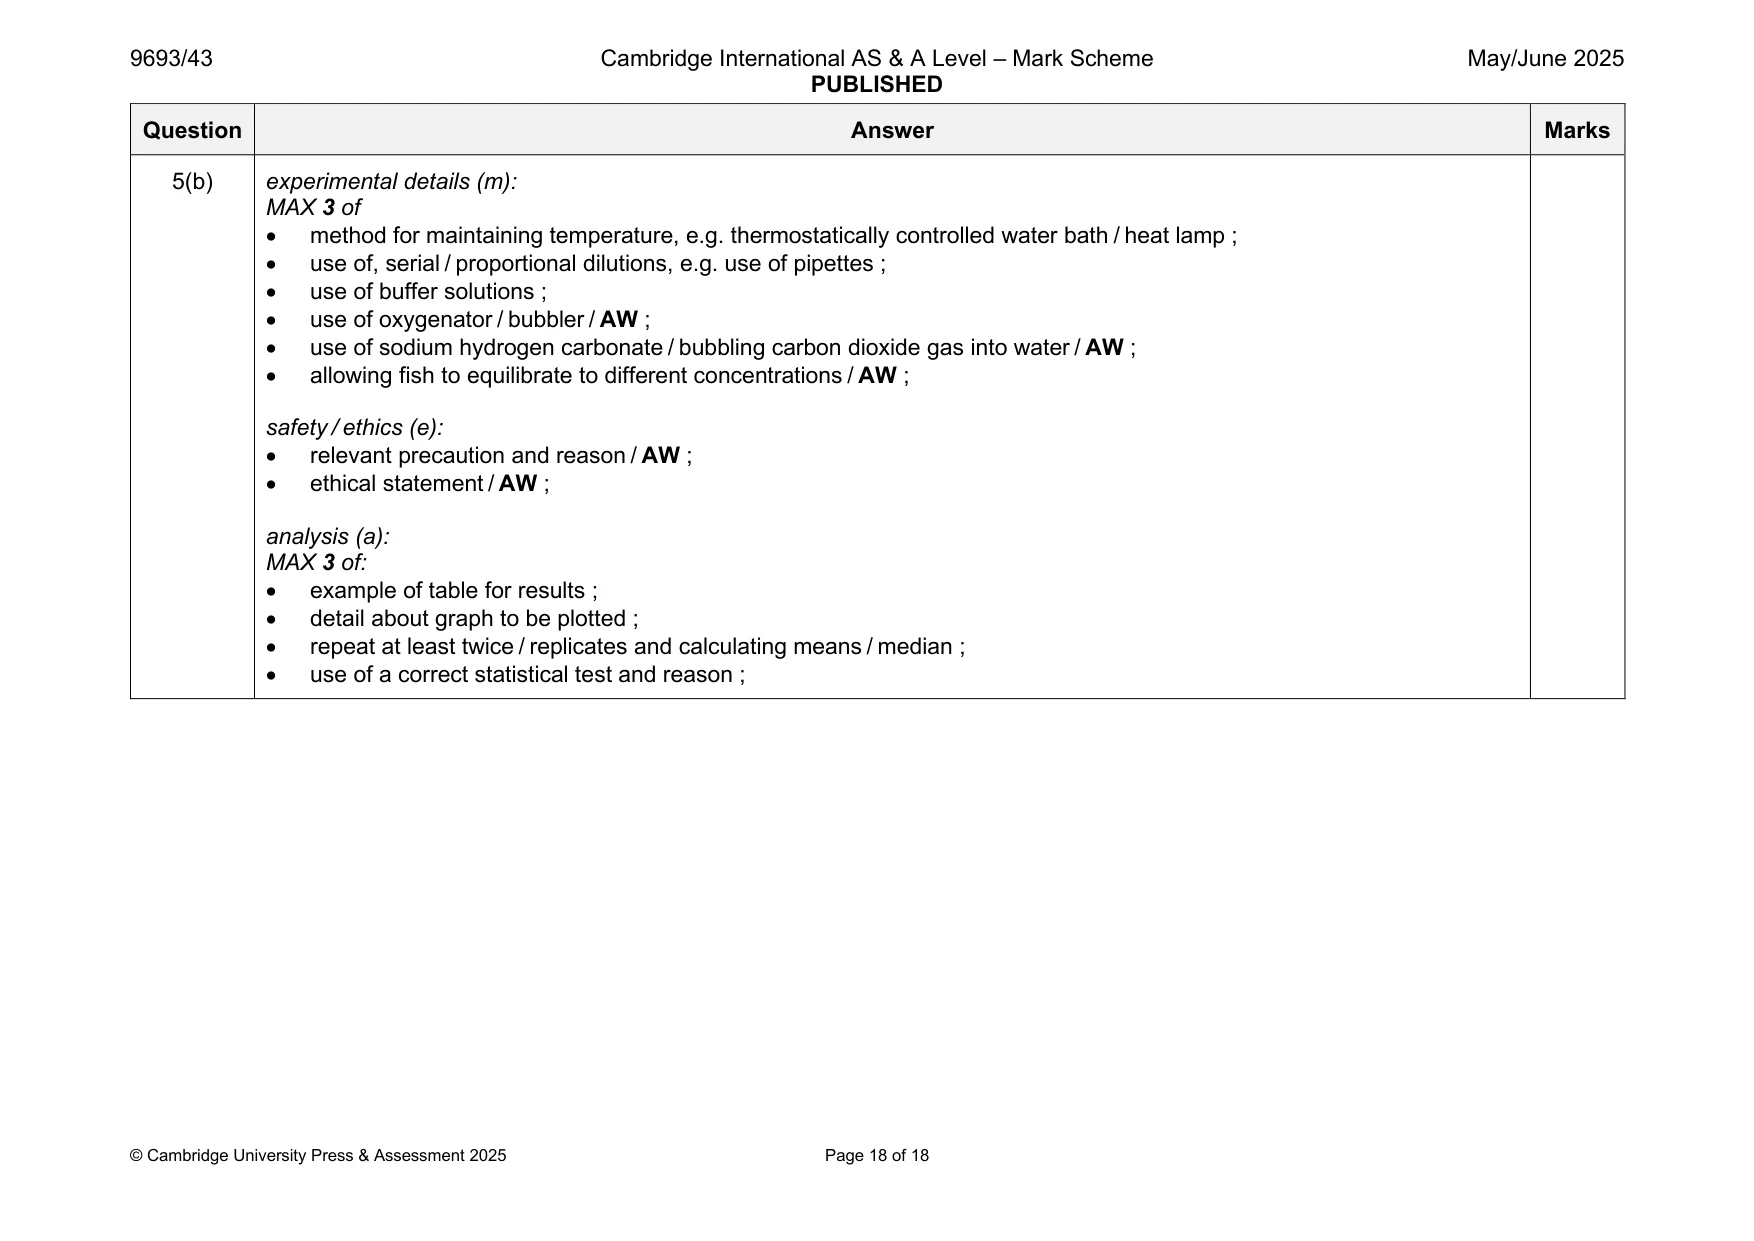
Mark scheme: 5(a) any 3 of: 3 1 in pumped ventilation mouth opens and closes / buccal cavity opens and closes / ORA ; 2 in pumped ventilation operculum opens and closes / ORA ; 3 pumped ventilation can be used when fish not moving / is not continuous / ORA ; 4 pumped ventilation, requires more energy / is an active process / ORA ; 5 pumped ventilation requires more muscle contractions / ORA ; 5(b) hypothesis (h): 12 • changing concentration of carbon dioxide affects the rate of ventilation / carbon dioxide content affects rate of ventilation / AW ; and 11 from: independent variable (i): • carbon dioxide concentration / different concentrations of sodium hydrogen carbonate / AW ; • minimum of five concentrations / AW ; dependent variable (d): • rate of ventilation / number of times fish opens mouth / operculum / AW ; • count opening / closing, in stated time period ; standardised variables (c): MAX 3 of: • species of fish / sex of fish / age / mass of fish ; • (frequency of) feeding ; • temperature of water ; • (starting) pH of water ; • volume of water / tank ; • salinity / stated salinity ; • speed of current / water flow ; • light intensity ; • oxygen concentration (of water) ; 5(b) experimental details (m): MAX 3 of • method for maintaining temperature, e.g. thermostatically controlled water bath / heat lamp ; • use of, serial / proportional dilutions, e.g. use of pipettes ; • use of buffer solutions ; • use of oxygenator / bubbler / AW ; • use of sodium hydrogen carbonate / bubbling carbon dioxide gas into water / AW ; • allowing fish to equilibrate to different concentrations / AW ; safety / ethics (e): • relevant precaution and reason / AW ; • ethical statement / AW ; analysis (a): MAX 3 of: • example of table for results ; • detail about graph to be plotted ; • repeat at least twice / replicates and calculating means / median ; • use of a correct statistical test and reason ;
What was in this paper
The subtopics covered by these 5 questions, and how many questions each got. Open one in a new tab to see every Cambridge question on it.
What you needed in this session
Cambridge’s own grade thresholds for 2025 May/June, Paper 4 · Variant 3. A higher threshold means an easier paper — the bar moves with how the cohort did.