Cambridge A Level Marine Science 9693 — 2020 May/June Paper 4 · Variant 0
9693/40/M/J/20 · 4 questions · 50 marks · ≈56 min
The question paper and its mark scheme, free to read here and free to download. This is Cambridge’s own paper, exactly as it was sat.
Question paper12 pages



Mark scheme
No mark scheme is in the library for this paper.
Questions as text
Q1 · Scientists genetically engineered zebrafish for rapid growth
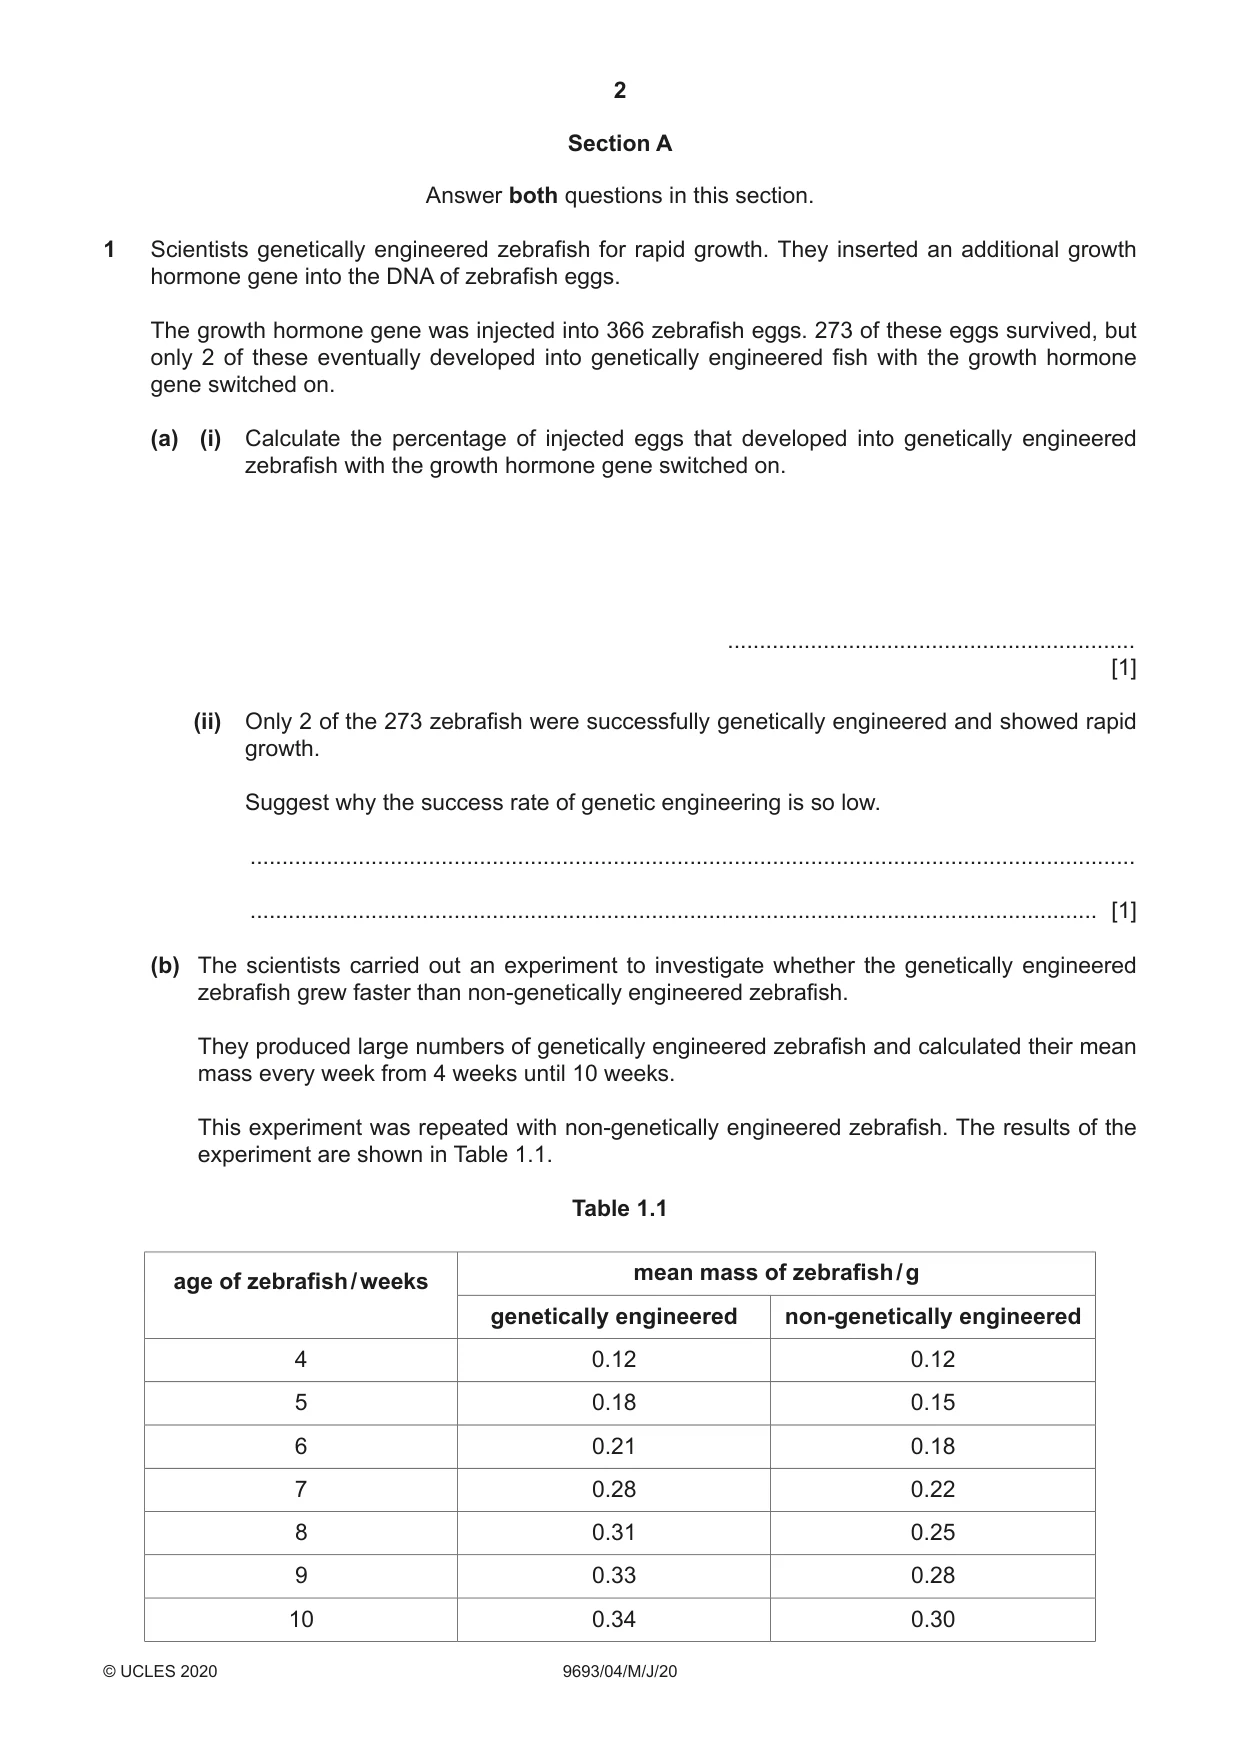
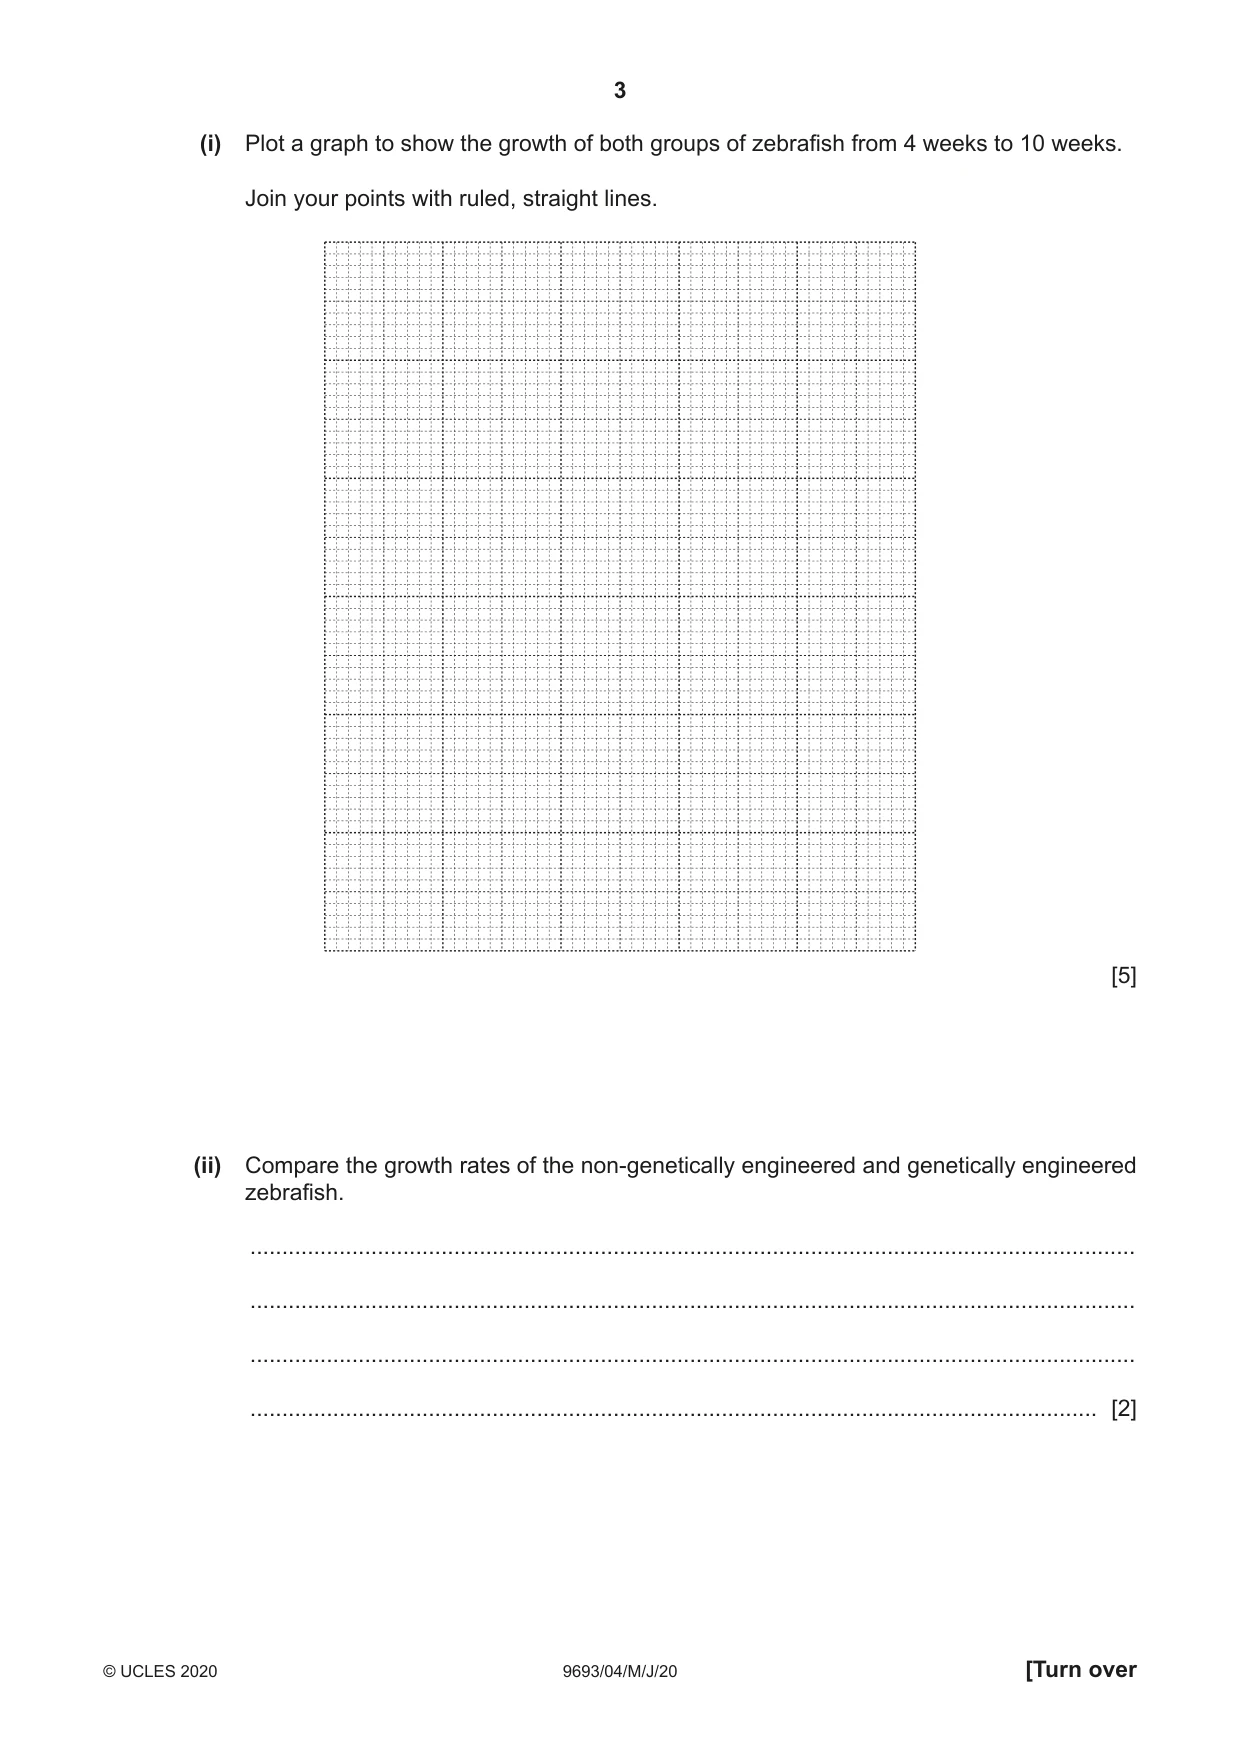
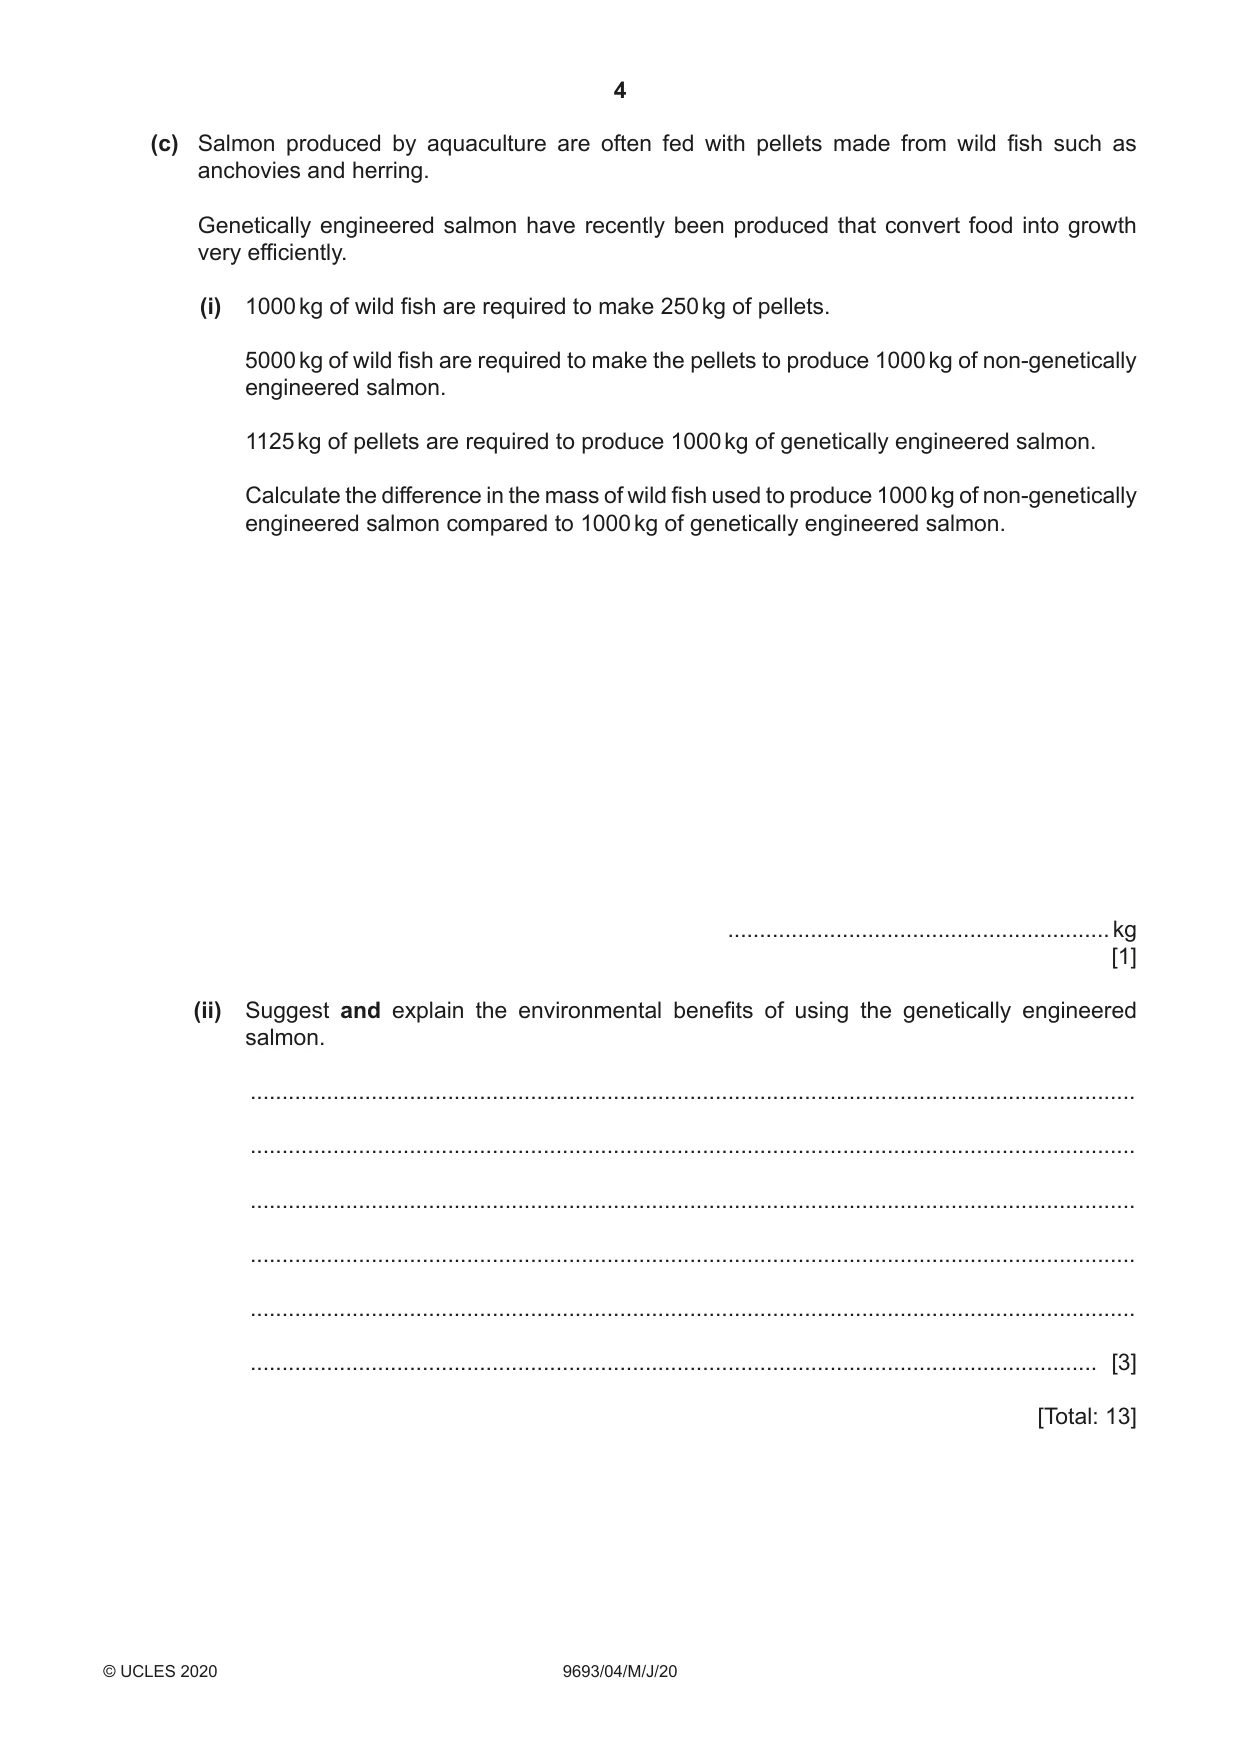
1 Scientists genetically engineered zebrafish for rapid growth. They inserted an additional growth hormone gene into the DNA of zebrafish eggs. The growth hormone gene was injected into 366 zebrafish eggs. 273 of these eggs survived, but only 2 of these eventually developed into genetically engineered fish with the growth hormone gene switched on. (a) (i) Calculate the percentage of injected eggs that developed into genetically engineered zebrafish with the growth hormone gene switched on. ................................................................ [1] (ii) Only 2 of the 273 zebrafish were successfully genetically engineered and showed rapid growth. Suggest why the success rate of genetic engineering is so low. ........................................................................................................................................... ..................................................................................................................................... [1] (b) The scientists carried out an experiment to investigate whether the genetically engineered zebrafish grew faster than non-genetically engineered zebrafish. They produced large numbers of genetically engineered zebrafish and calculated their mean mass every week from 4 weeks until 10 weeks. This experiment was repeated with non-genetically engineered zebrafish. The results of the experiment are shown in Table 1.1. Table 1.1 mean mass of zebrafish / g age of zebrafish / weeks genetically engineered non-genetically engineered 4 0.12 0.12 5 0.18 0.15 6 0.21 0.18 7 0.28 0.22 8 0.31 0.25 9 0.33 0.28 10 0.34 0.30 (i) Plot a graph to show the growth of both groups of zebrafish from 4 weeks to 10 weeks. Join your points with ruled, straight lines. [5] (ii) Compare the growth rates of the non-genetically engineered and genetically engineered zebrafish. ........................................................................................................................................... ........................................................................................................................................... ........................................................................................................................................... ..................................................................................................................................... [2] (c) Salmon produced by aquaculture are often fed with pellets made from wild fish such as anchovies and herring. Genetically engineered salmon have recently been produced that convert food into growth very efficiently. (i) 1000 kg of wild fish are required to make 250 kg of pellets. 5000 kg of wild fish are required to make the pellets to produce 1000 kg of non-genetically engineered salmon. 1125 kg of pellets are required to produce 1000 kg of genetically engineered salmon. Calculate the difference in the mass of wild fish used to produce 1000 kg of non-genetically engineered salmon compared to 1000 kg of genetically engineered salmon. ............................................................ kg [1] (ii) Suggest and explain the environmental benefits of using the genetically engineered salmon. ........................................................................................................................................... ........................................................................................................................................... ........................................................................................................................................... ........................................................................................................................................... ........................................................................................................................................... ..................................................................................................................................... [3] [Total: 13]
Q2 · The ratio of the gill surface area : body mass of fish is calculated using the following…
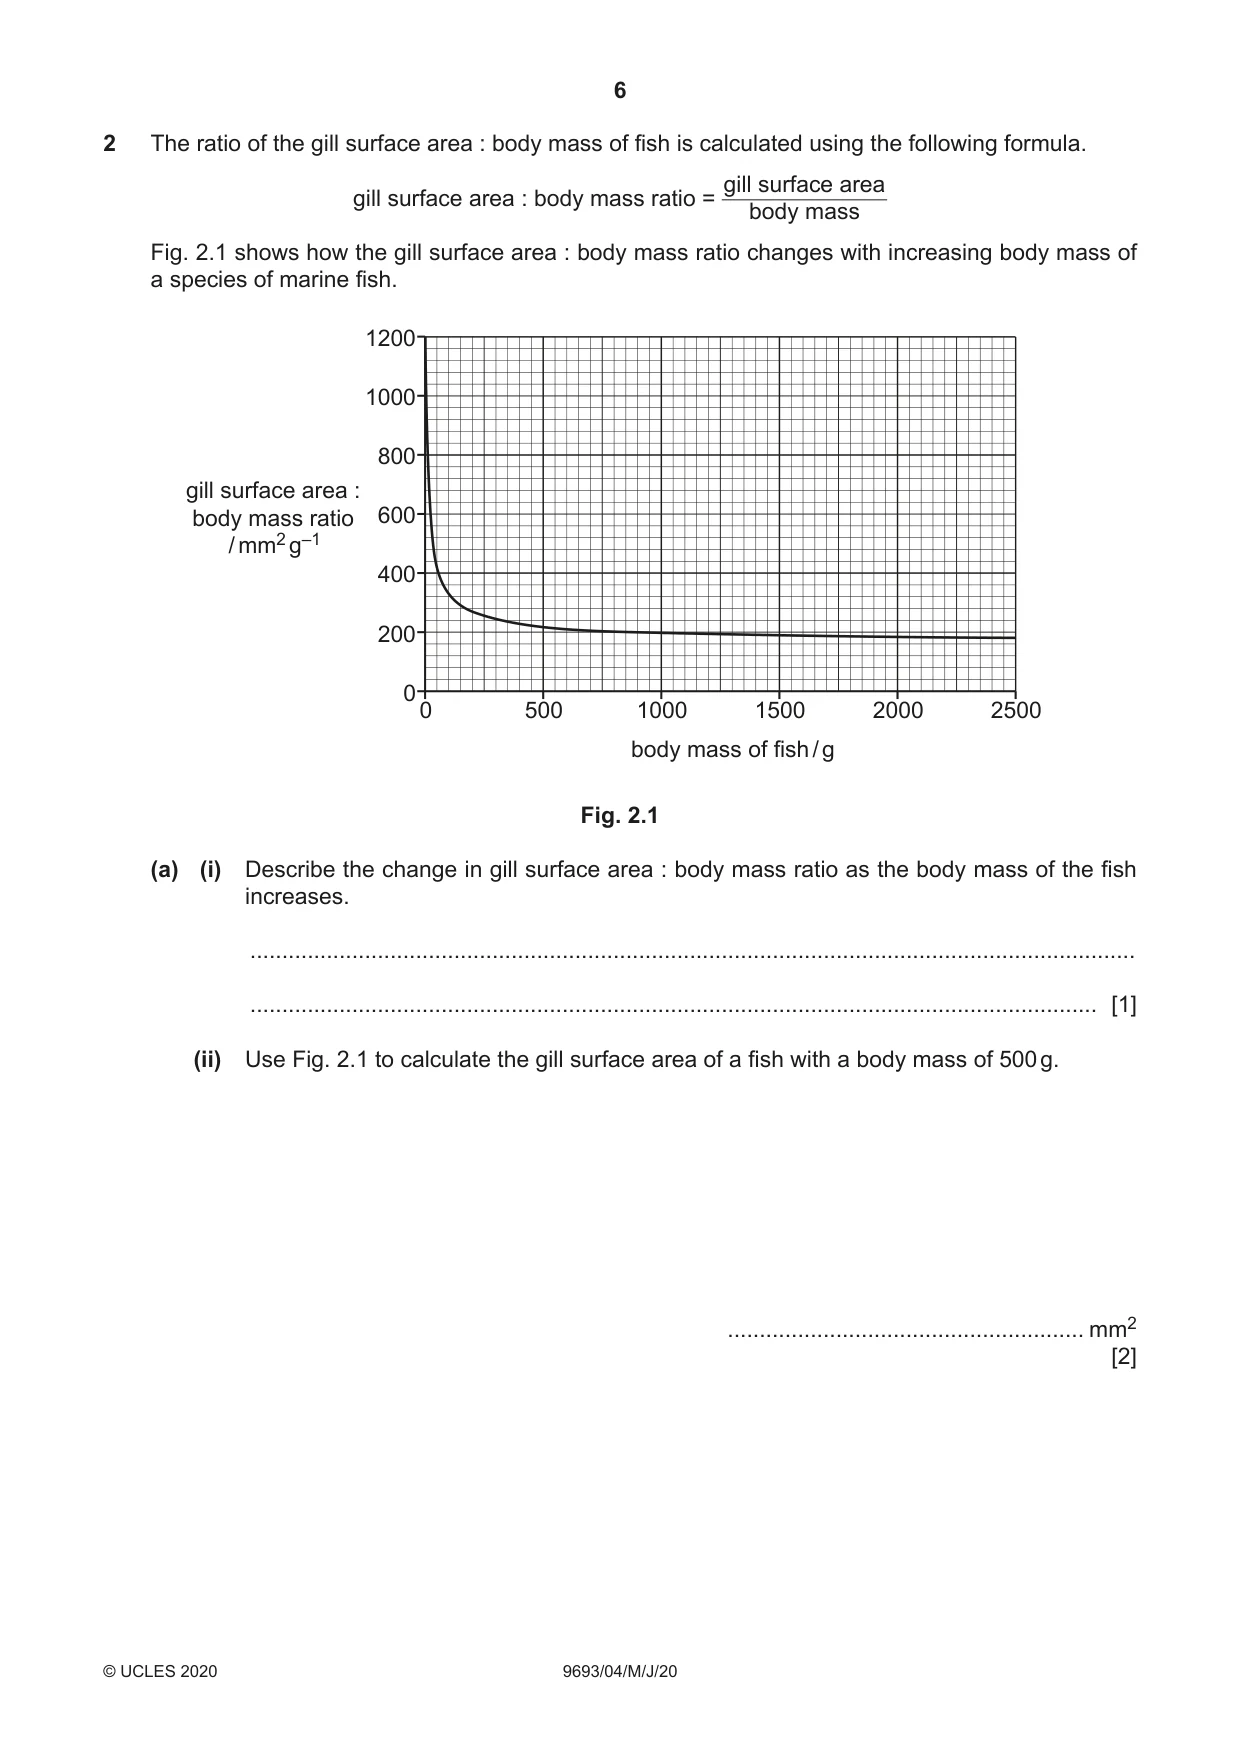
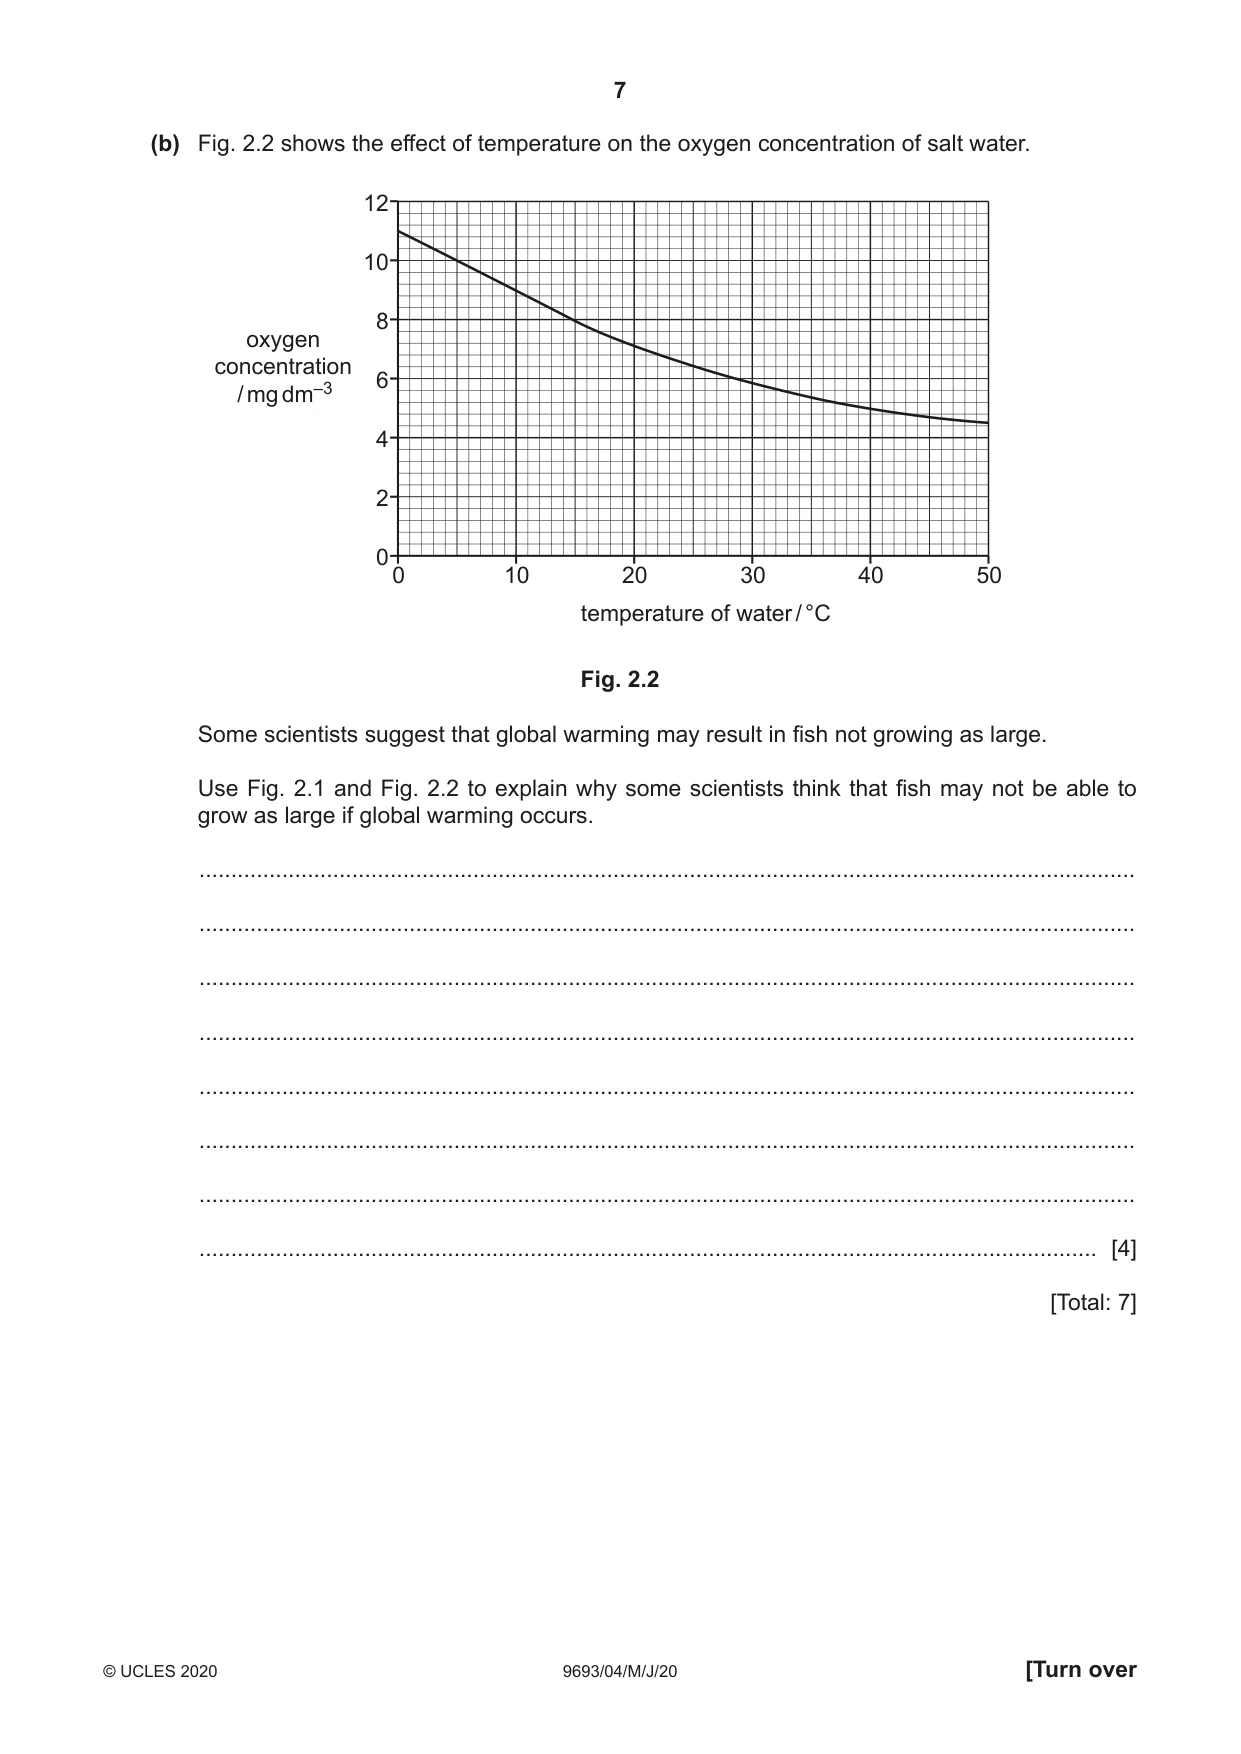
2 The ratio of the gill surface area : body mass of fish is calculated using the following formula. gill surface area gill surface area : body mass ratio = body mass Fig. 2.1 shows how the gill surface area : body mass ratio changes with increasing body mass of a species of marine fish. 1200 1000 800 gill surface area : body mass ratio 600 / mm2 g–1 400 200 0 0 500 1000 1500 2000 2500 body mass of fish / g Fig. 2.1 (a) (i) Describe the change in gill surface area : body mass ratio as the body mass of the fish increases. ........................................................................................................................................... ..................................................................................................................................... [1] (ii) Use Fig. 2.1 to calculate the gill surface area of a fish with a body mass of 500 g. ........................................................ mm2 [2] (b) Fig. 2.2 shows the effect of temperature on the oxygen concentration of salt water. 12 10 8 oxygen concentration 6 / mg dm–3 4 2 0 0 10 20 30 40 50 temperature of water / °C Fig. 2.2 Some scientists suggest that global warming may result in fish not growing as large. Use Fig. 2.1 and Fig. 2.2 to explain why some scientists think that fish may not be able to grow as large if global warming occurs. ................................................................................................................................................... ................................................................................................................................................... ................................................................................................................................................... ................................................................................................................................................... ................................................................................................................................................... ................................................................................................................................................... ................................................................................................................................................... ............................................................................................................................................. [4] [Total: 7]
Q3 · Outline how the techniques of intensive aquaculture differ from those of extensive…
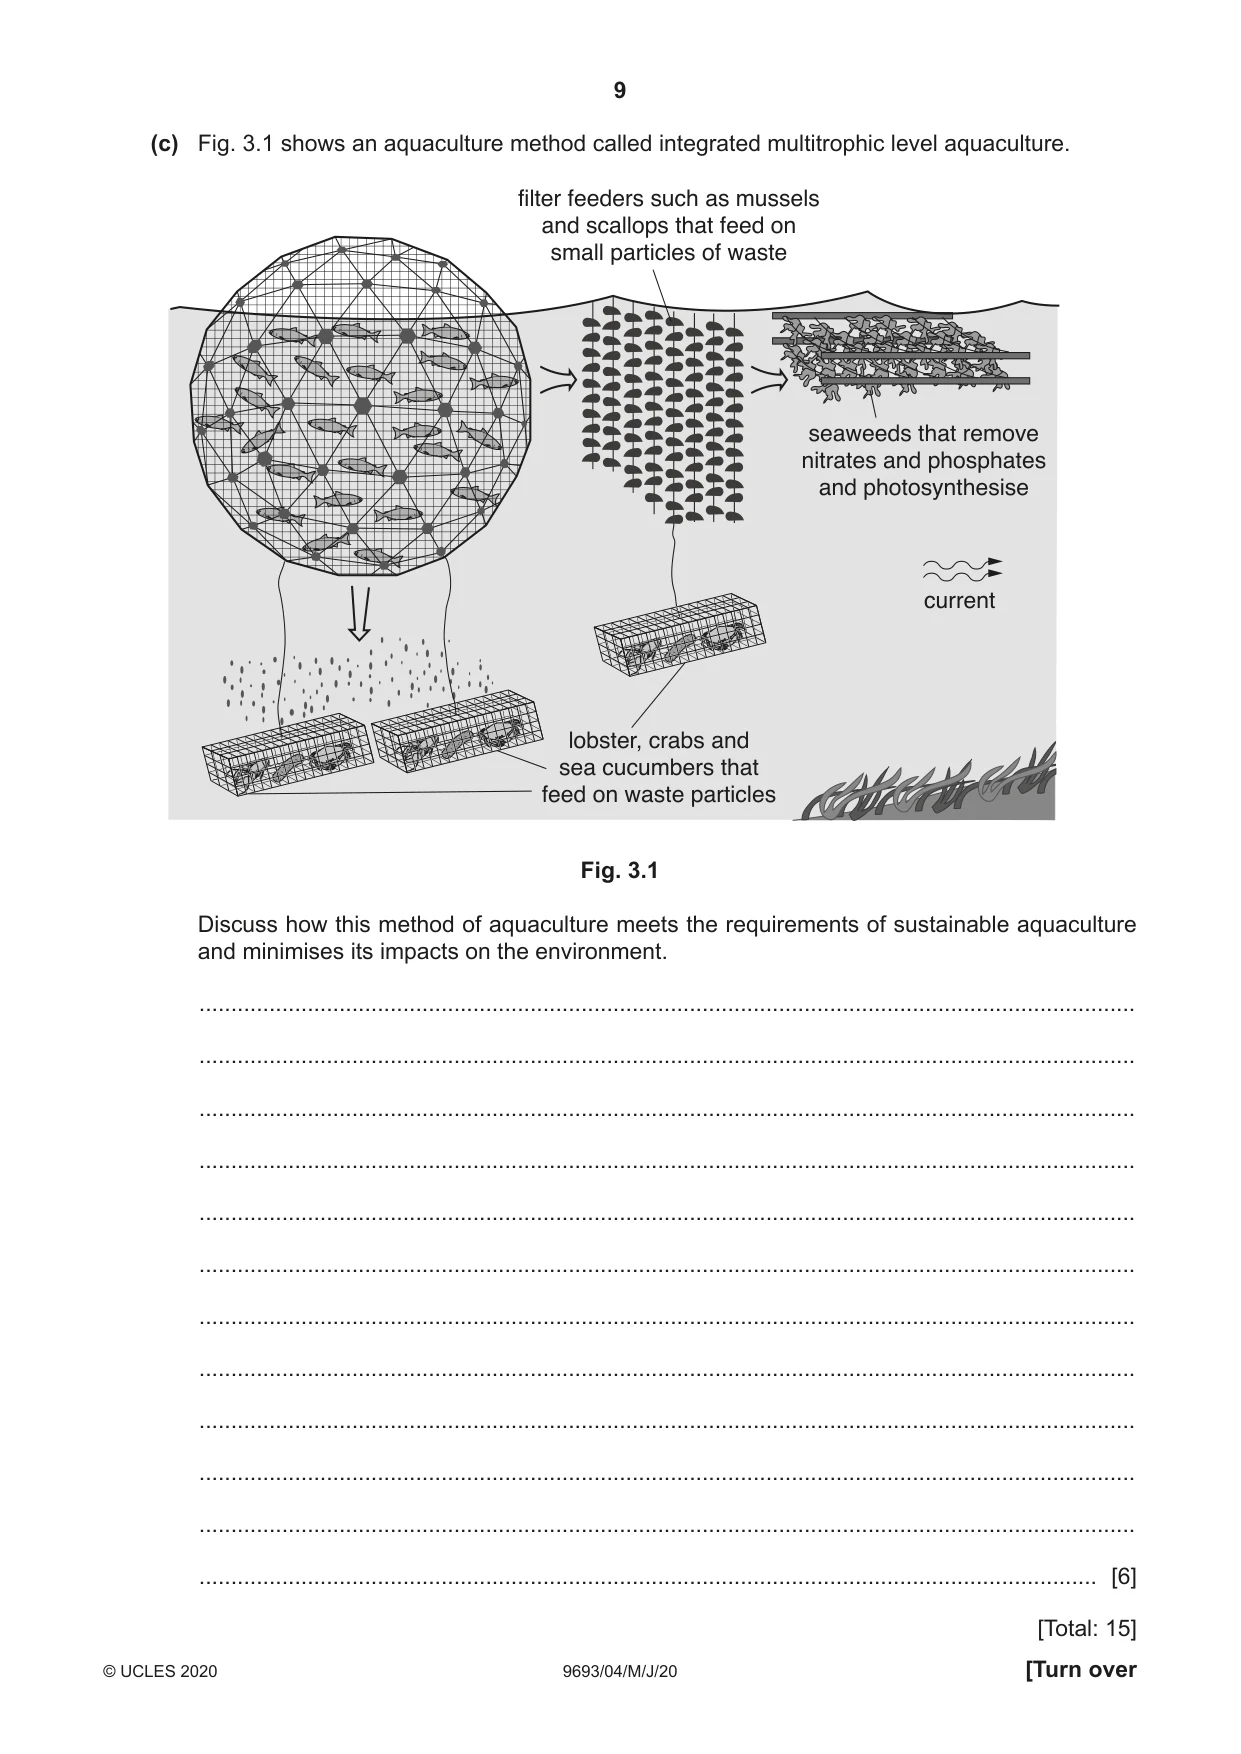
3 (a) Outline how the techniques of intensive aquaculture differ from those of extensive aquaculture. ................................................................................................................................................... ................................................................................................................................................... ................................................................................................................................................... ................................................................................................................................................... ................................................................................................................................................... ................................................................................................................................................... ................................................................................................................................................... ............................................................................................................................................. [4] (b) Describe the process used for the aquaculture of shrimp. ................................................................................................................................................... ................................................................................................................................................... ................................................................................................................................................... ................................................................................................................................................... ................................................................................................................................................... ................................................................................................................................................... ................................................................................................................................................... ................................................................................................................................................... ................................................................................................................................................... ............................................................................................................................................. [5] (c) Fig. 3.1 shows an aquaculture method called integrated multitrophic level aquaculture. filter feeders such as mussels and scallops that feed on small particles of waste seaweeds that remove nitrates and phosphates and photosynthesise current lobster, crabs and sea cucumbers that feed on waste particles Fig. 3.1 Discuss how this method of aquaculture meets the requirements of sustainable aquaculture and minimises its impacts on the environment. ................................................................................................................................................... ................................................................................................................................................... ................................................................................................................................................... ................................................................................................................................................... ................................................................................................................................................... ................................................................................................................................................... ................................................................................................................................................... ................................................................................................................................................... ................................................................................................................................................... ................................................................................................................................................... ................................................................................................................................................... ............................................................................................................................................. [6] [Total: 15]
Q4 · The conservation of primary producers is essential for the health of the marine…
4 The conservation of primary producers is essential for the health of the marine environment and for ensuring sustainable fish stocks. (a) (i) Outline the ecological importance of primary producers. ........................................................................................................................................... ........................................................................................................................................... ........................................................................................................................................... ........................................................................................................................................... ........................................................................................................................................... ..................................................................................................................................... [3] (ii) Explain why different types of primary producers are found in the open ocean and intertidal zones. ........................................................................................................................................... ........................................................................................................................................... ........................................................................................................................................... ........................................................................................................................................... ........................................................................................................................................... ........................................................................................................................................... ........................................................................................................................................... ........................................................................................................................................... ........................................................................................................................................... ........................................................................................................................................... ........................................................................................................................................... ..................................................................................................................................... [6] (b) Discuss the advantages and disadvantages of the principal methods used to monitor fisheries to ensure sustainable fishing. ................................................................................................................................................... ................................................................................................................................................... ................................................................................................................................................... ................................................................................................................................................... ................................................................................................................................................... ................................................................................................................................................... ................................................................................................................................................... ................................................................................................................................................... ................................................................................................................................................... ................................................................................................................................................... ................................................................................................................................................... ............................................................................................................................................. [6] [Total: 15]
What was in this paper
The subtopics covered by these 4 questions, and how many questions each got. Open one in a new tab to see every Cambridge question on it.