Cambridge A Level Marine Science 9693 — 2017 Oct/Nov Paper 4 · Variant 1
9693/41/O/N/17 · 4 questions · 50 marks · ≈56 min
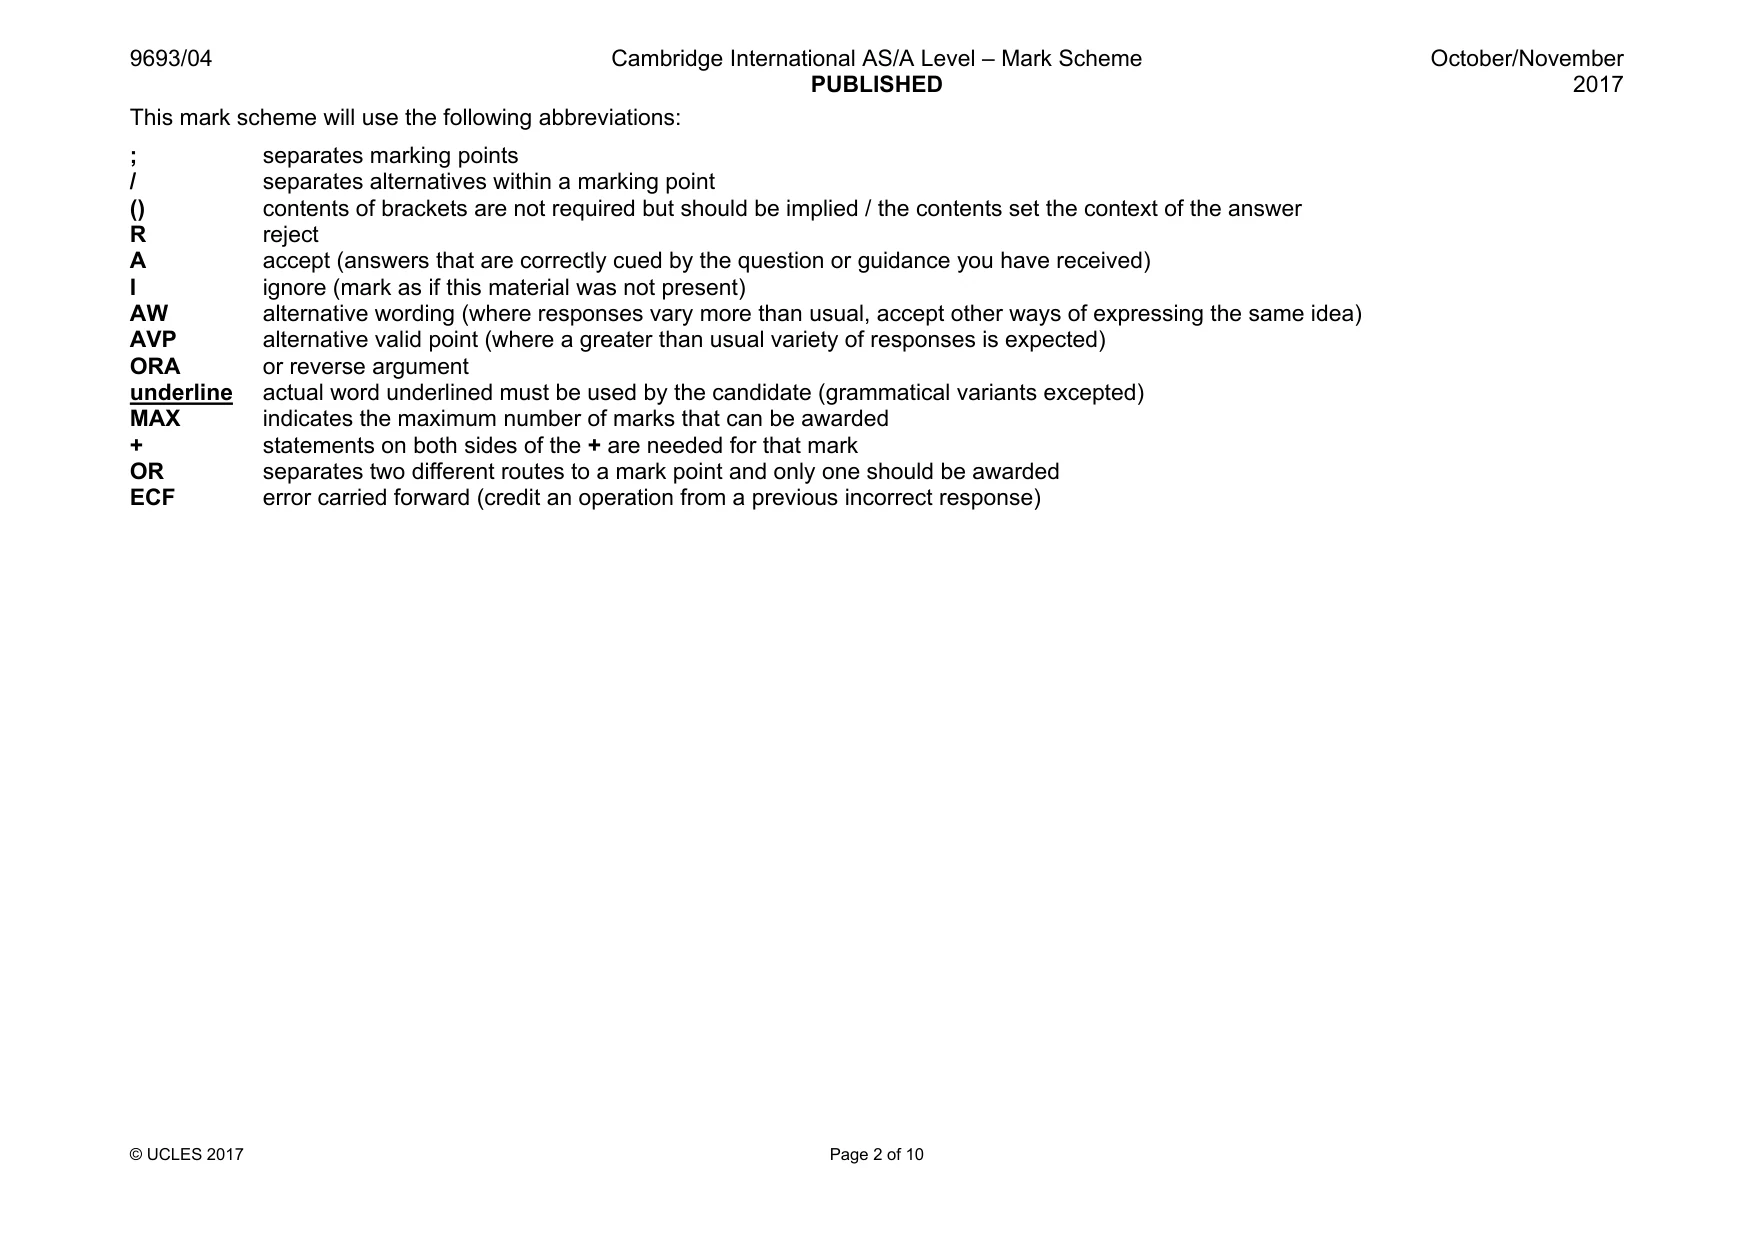
The question paper and its mark scheme, free to read here and free to download. This is Cambridge’s own paper, exactly as it was sat.
Question paper12 pages

Mark scheme10 pages
Answers below. Sit the paper first if you are practising.
Questions as text
Q1 · An experiment was carried out to investigate the effect of temperature and mass of food…
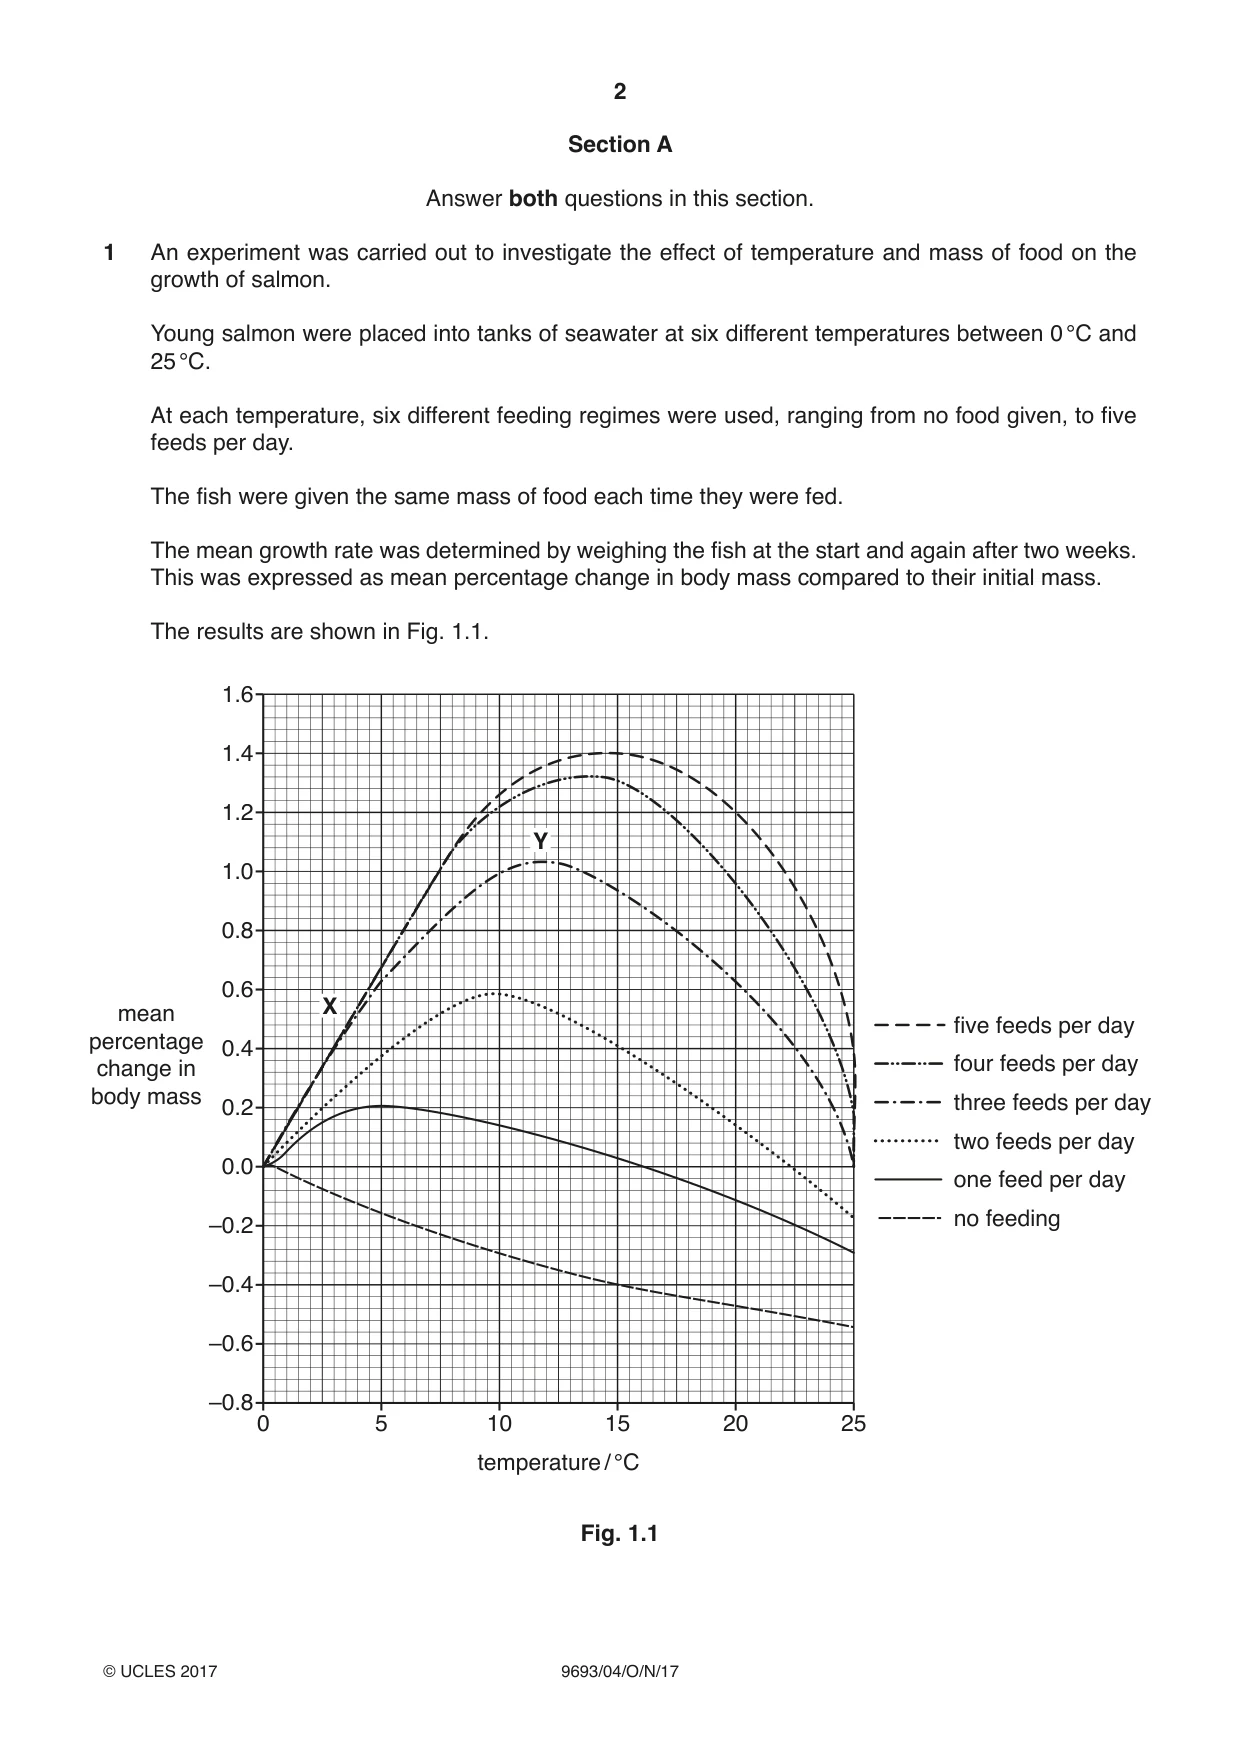
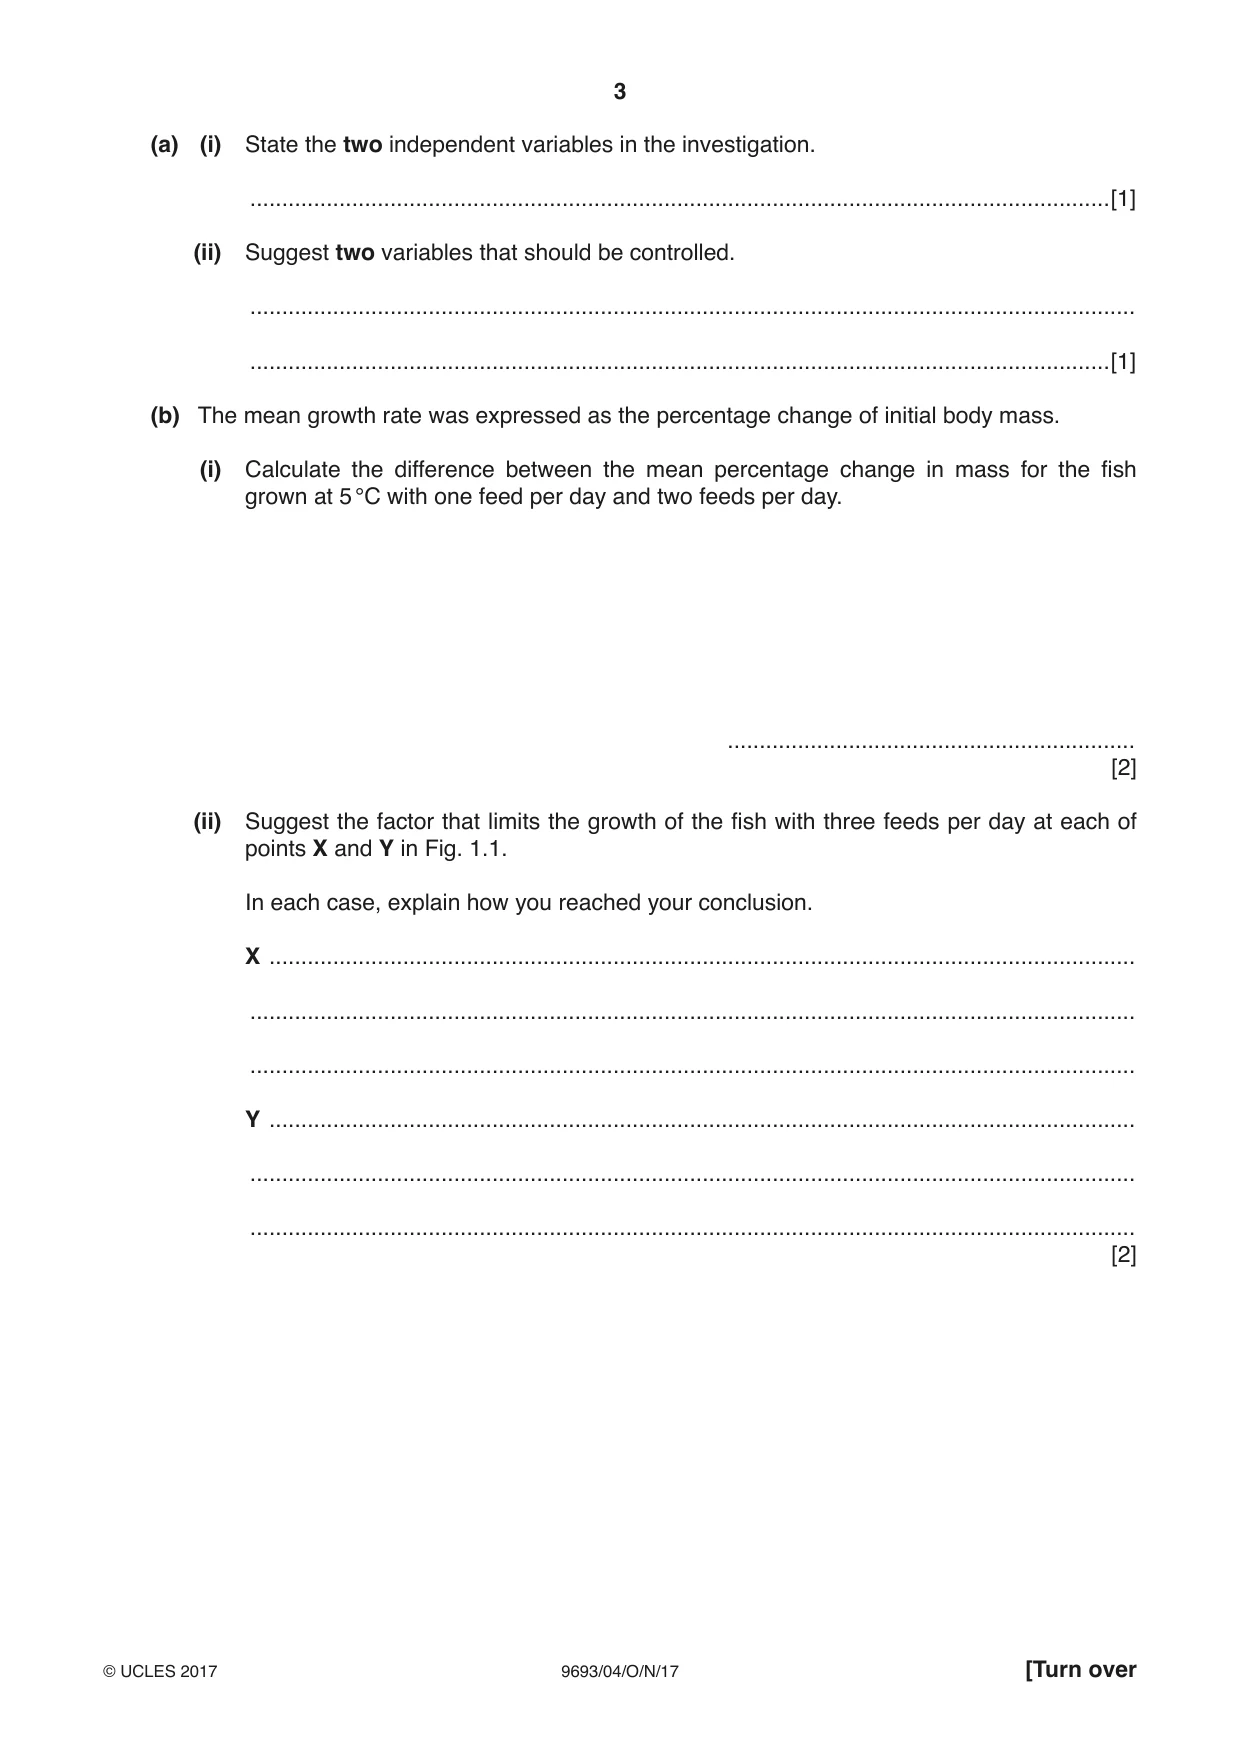
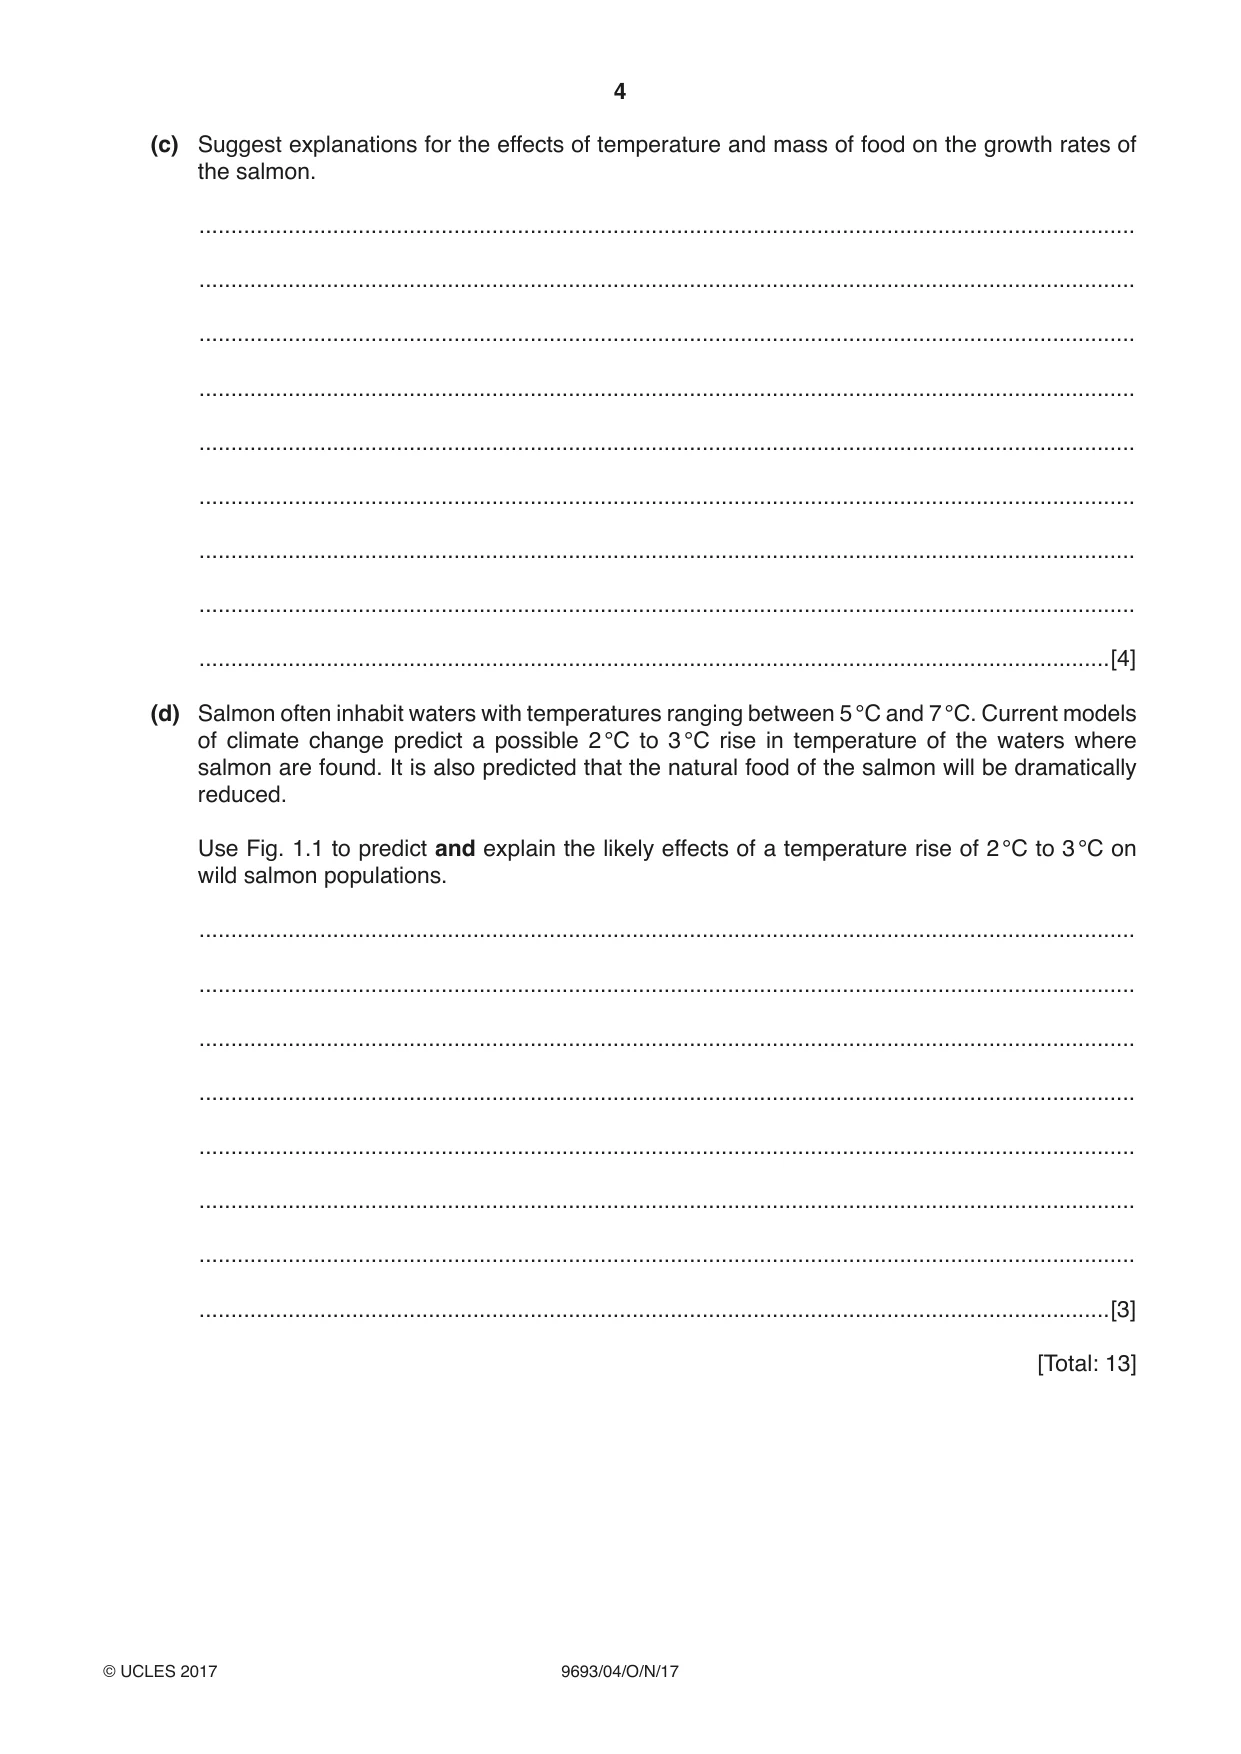
1 An experiment was carried out to investigate the effect of temperature and mass of food on the growth of salmon. Young salmon were placed into tanks of seawater at six different temperatures between 0 °C and 25 °C. At each temperature, six different feeding regimes were used, ranging from no food given, to five feeds per day. The fish were given the same mass of food each time they were fed. The mean growth rate was determined by weighing the fish at the start and again after two weeks. This was expressed as mean percentage change in body mass compared to their initial mass. The results are shown in Fig. 1.1. 1.6 1.4 1.2 Y 1.0 0.8 0.6 X mean five feeds per daypercentage 0.4 change in four feeds per day body mass 0.2 three feeds per day two feeds per day 0.0 one feed per day no feeding –0.2 –0.4 –0.6 –0.8 0 5 10 15 20 25 temperature / °C Fig. 1.1 (a) (i) State the two independent variables in the investigation. .......................................................................................................................................[1] (ii) Suggest two variables that should be controlled. ........................................................................................................................................... .......................................................................................................................................[1] (b) The mean growth rate was expressed as the percentage change of initial body mass. (i) Calculate the difference between the mean percentage change in mass for the fish grown at 5 °C with one feed per day and two feeds per day. ................................................................ [2] (ii) Suggest the factor that limits the growth of the fish with three feeds per day at each of points X and Y in Fig. 1.1. In each case, explain how you reached your conclusion. X ........................................................................................................................................ ........................................................................................................................................... ........................................................................................................................................... Y ........................................................................................................................................ ........................................................................................................................................... ........................................................................................................................................... [2] (c) Suggest explanations for the effects of temperature and mass of food on the growth rates of the salmon. ................................................................................................................................................... ................................................................................................................................................... ................................................................................................................................................... ................................................................................................................................................... ................................................................................................................................................... ................................................................................................................................................... ................................................................................................................................................... ................................................................................................................................................... ...............................................................................................................................................[4] (d) Salmon often inhabit waters with temperatures ranging between 5 °C and 7 °C. Current models of climate change predict a possible 2 °C to 3 °C rise in temperature of the waters where salmon are found. It is also predicted that the natural food of the salmon will be dramatically reduced. Use Fig. 1.1 to predict and explain the likely effects of a temperature rise of 2 °C to 3 °C on wild salmon populations. ................................................................................................................................................... ................................................................................................................................................... ................................................................................................................................................... ................................................................................................................................................... ................................................................................................................................................... ................................................................................................................................................... ................................................................................................................................................... ...............................................................................................................................................[3] [Total: 13]
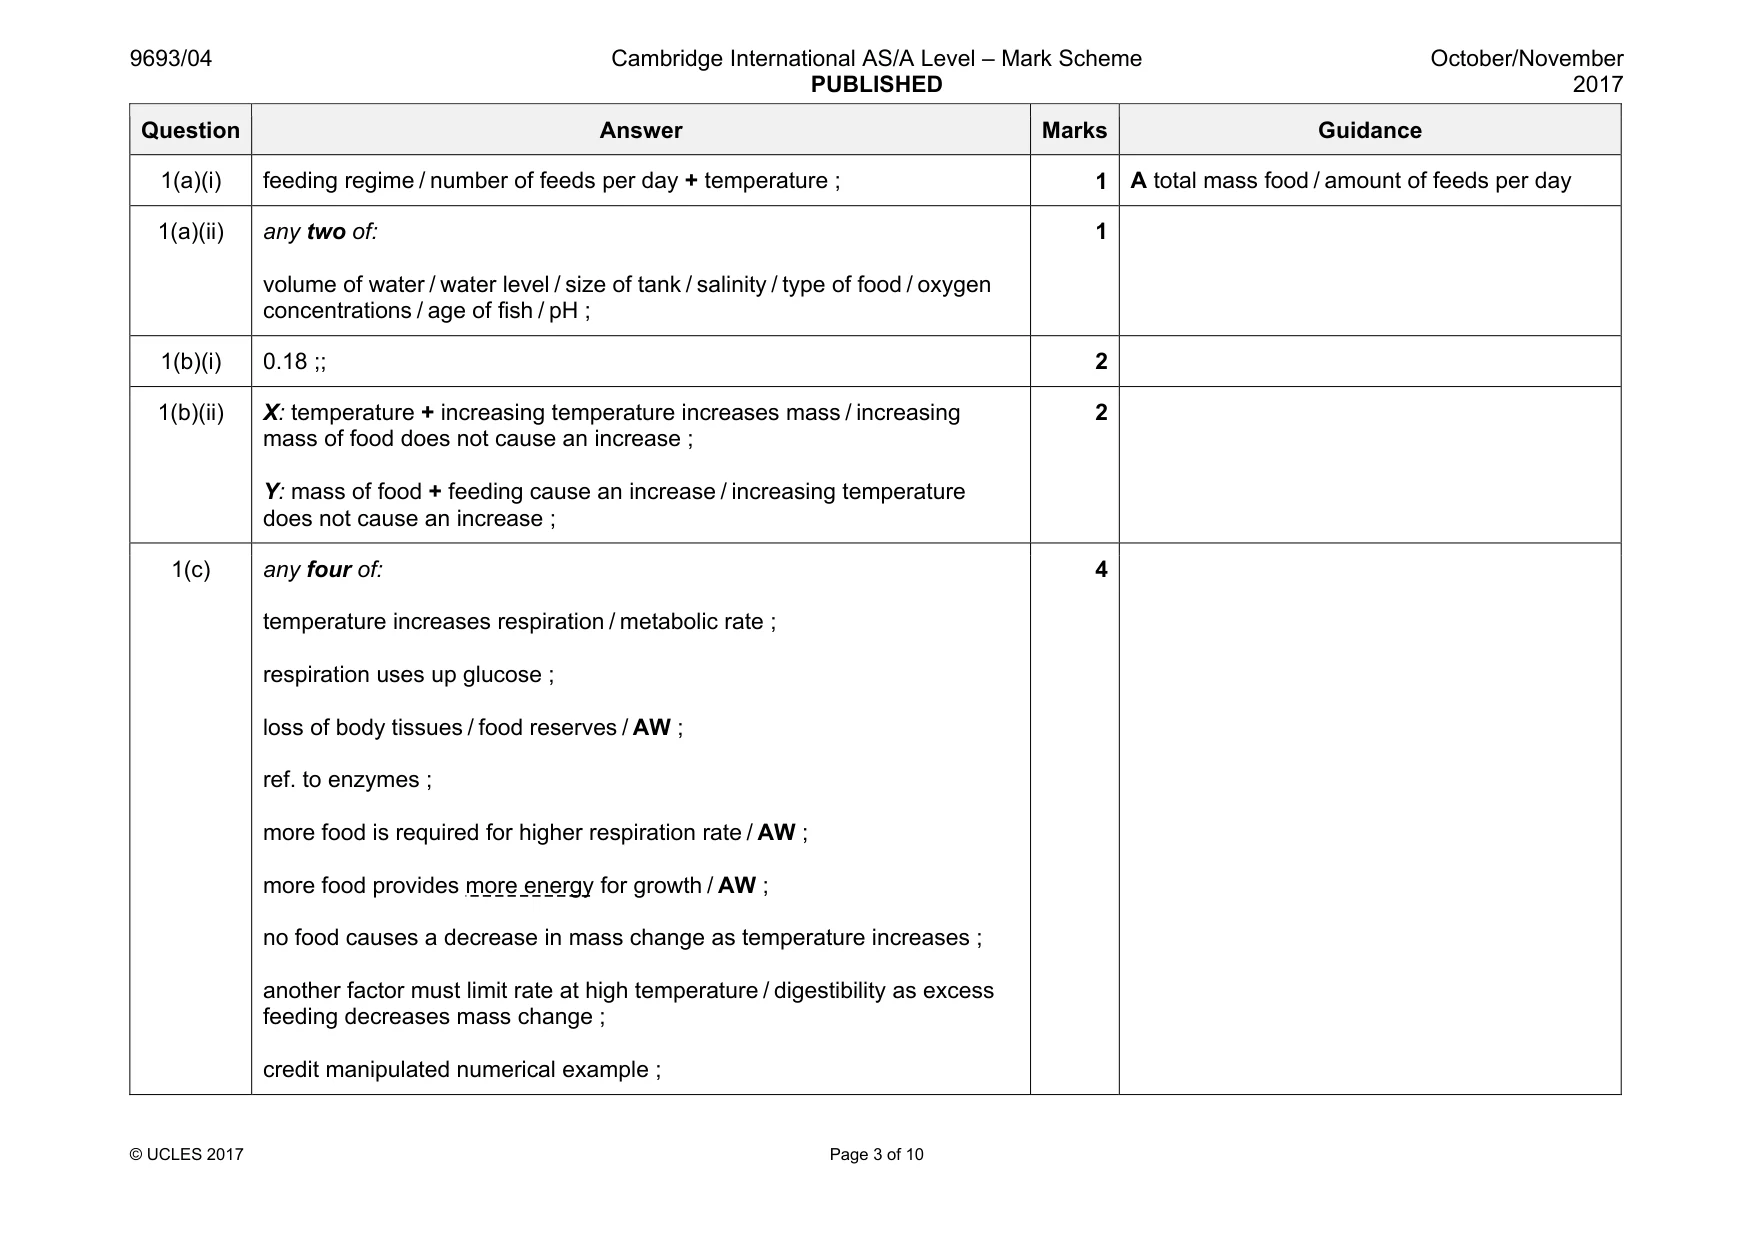
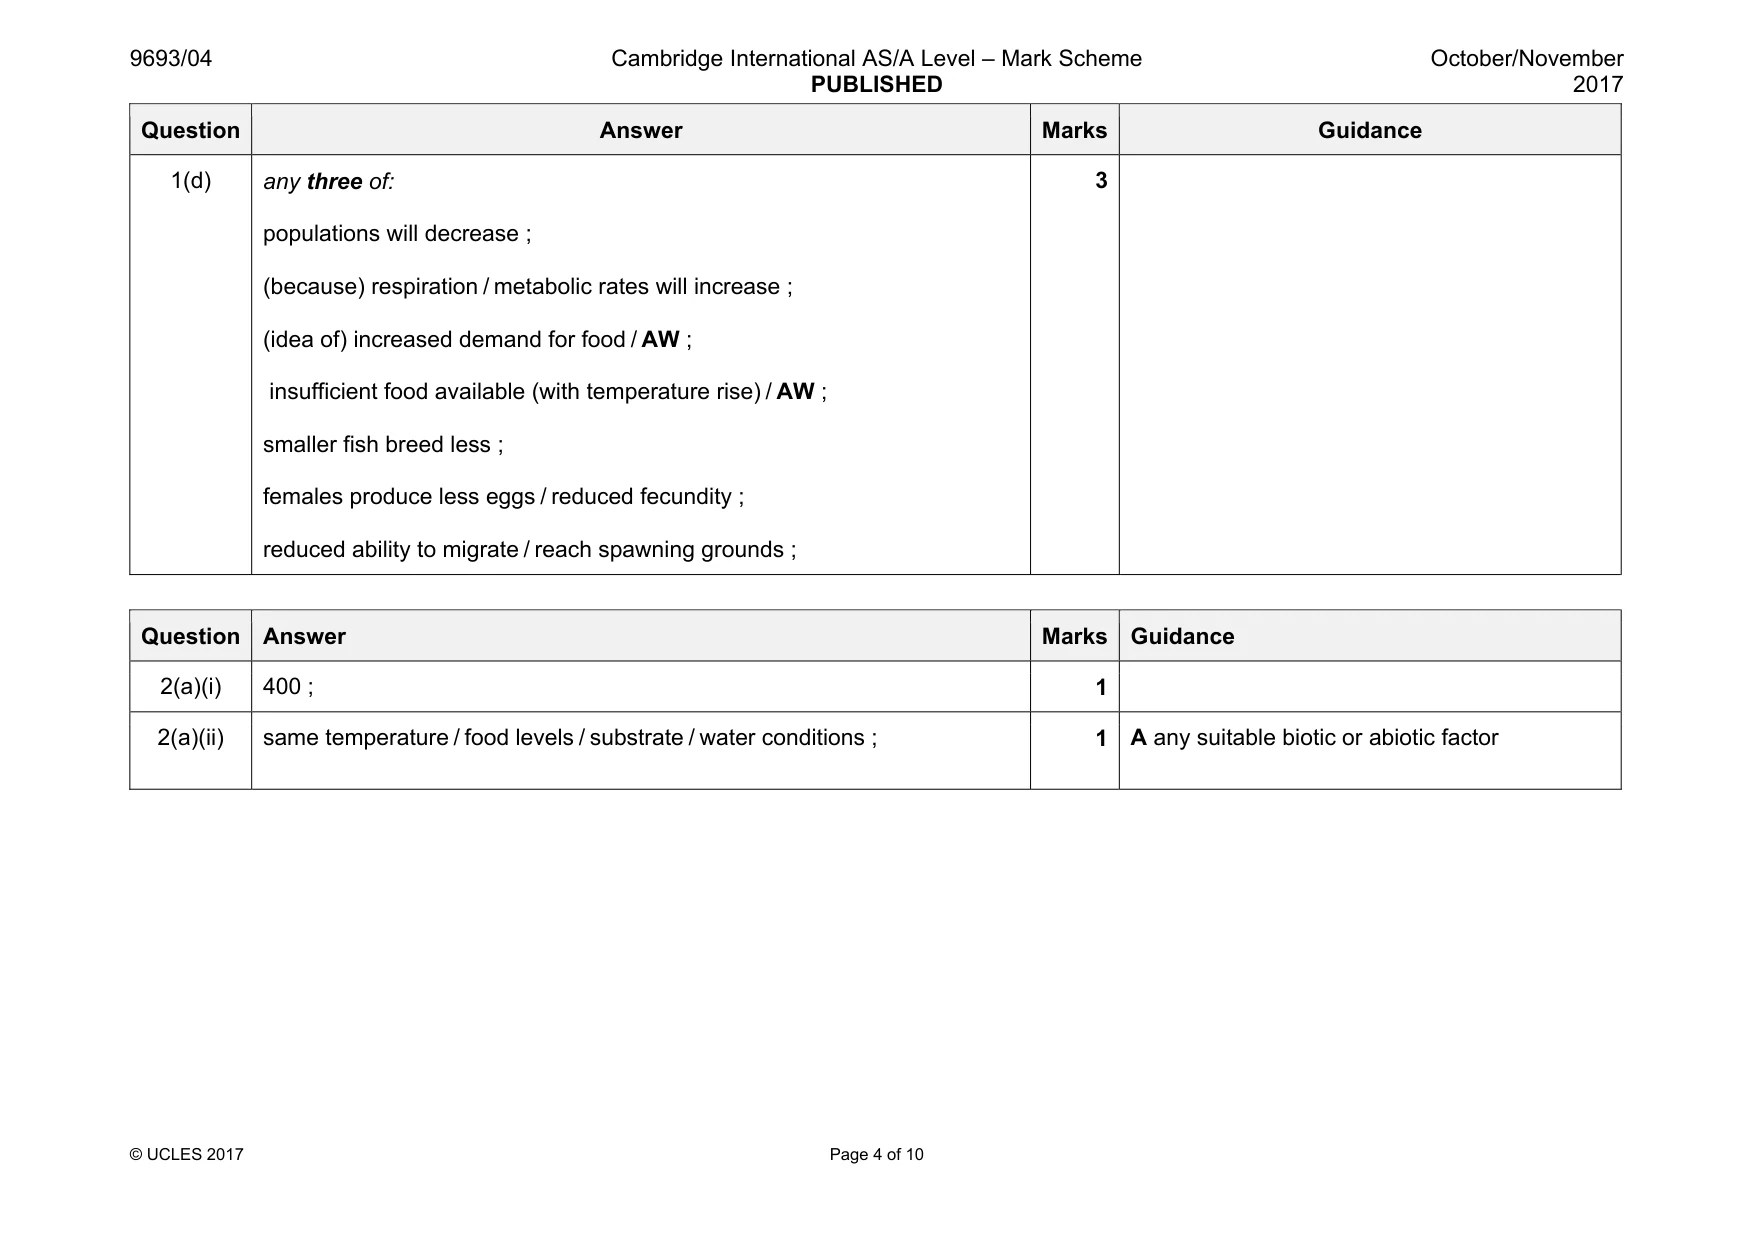
Mark scheme: 1(a)(i) feeding regime / number of feeds per day + temperature ; 1 A total mass food / amount of feeds per day 1(a)(ii) any two of: volume of water / water level / size of tank / salinity / type of food / oxygen concentrations / age of fish / pH ; 1 1(b)(i) 0.18 ;; 2 1(b)(ii) X: temperature + increasing temperature increases mass / increasing mass of food does not cause an increase ; Y: mass of food + feeding cause an increase / increasing temperature does not cause an increase ; 2 1(c) any four of: temperature increases respiration / metabolic rate ; respiration uses up glucose ; loss of body tissues / food reserves / AW ; ref. to enzymes ; more food is required for higher respiration rate / AW ; more food provides more energy for growth / AW ; no food causes a decrease in mass change as temperature increases ; another factor must limit rate at high temperature / digestibility as excess feeding decreases mass change ; credit manipulated numerical example ; 4 Question Answer Marks Guidance 1(d) any three of: populations will decrease ; (because) respiration / metabolic rates will increase ; (idea of) increased demand for food / AW ; insufficient food available (with temperature rise) / AW ; smaller fish breed less ; females produce less eggs / reduced fecundity ; reduced ability to migrate / reach spawning grounds ; 3 Question Answer Marks Guidance
Q2 · Marine protection areas (MPAs) are regions of sea or ocean where fishing is prohibited or…
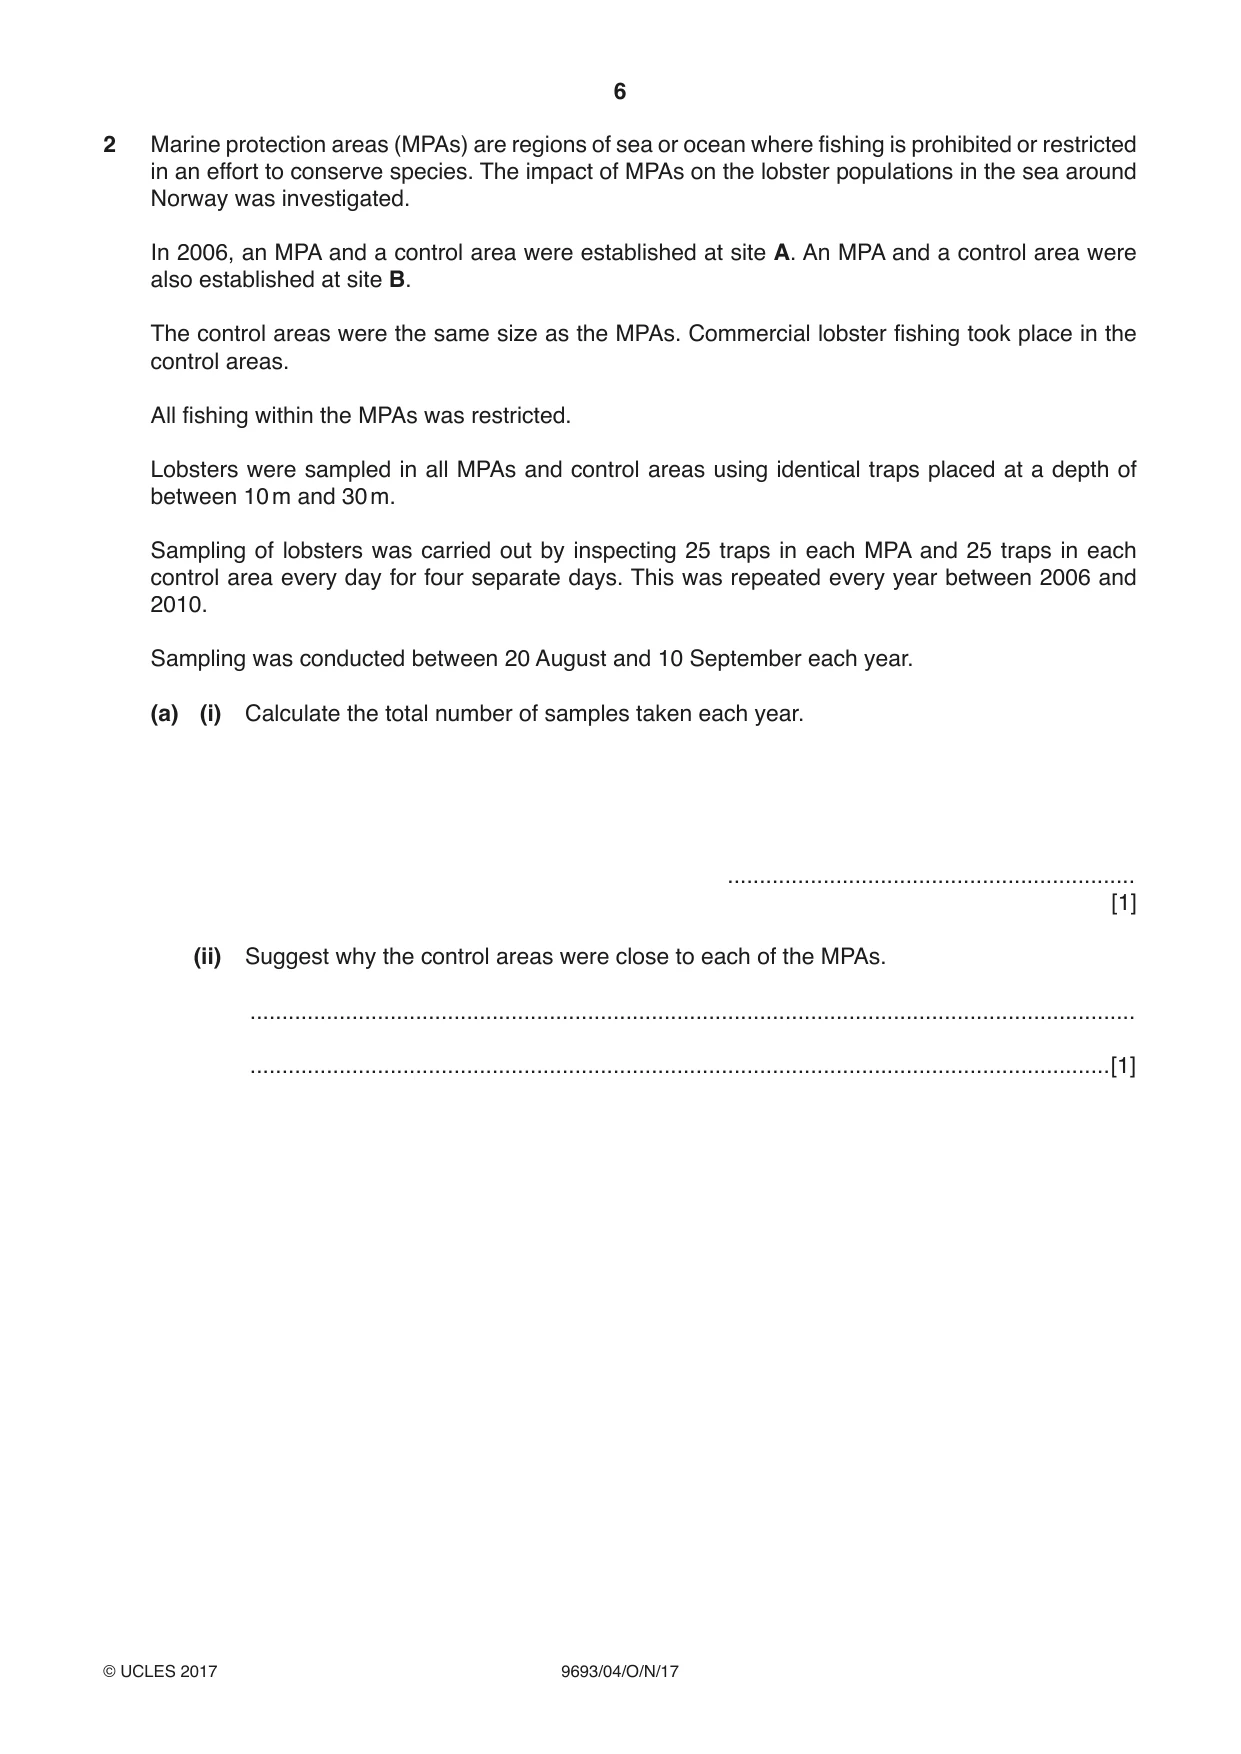
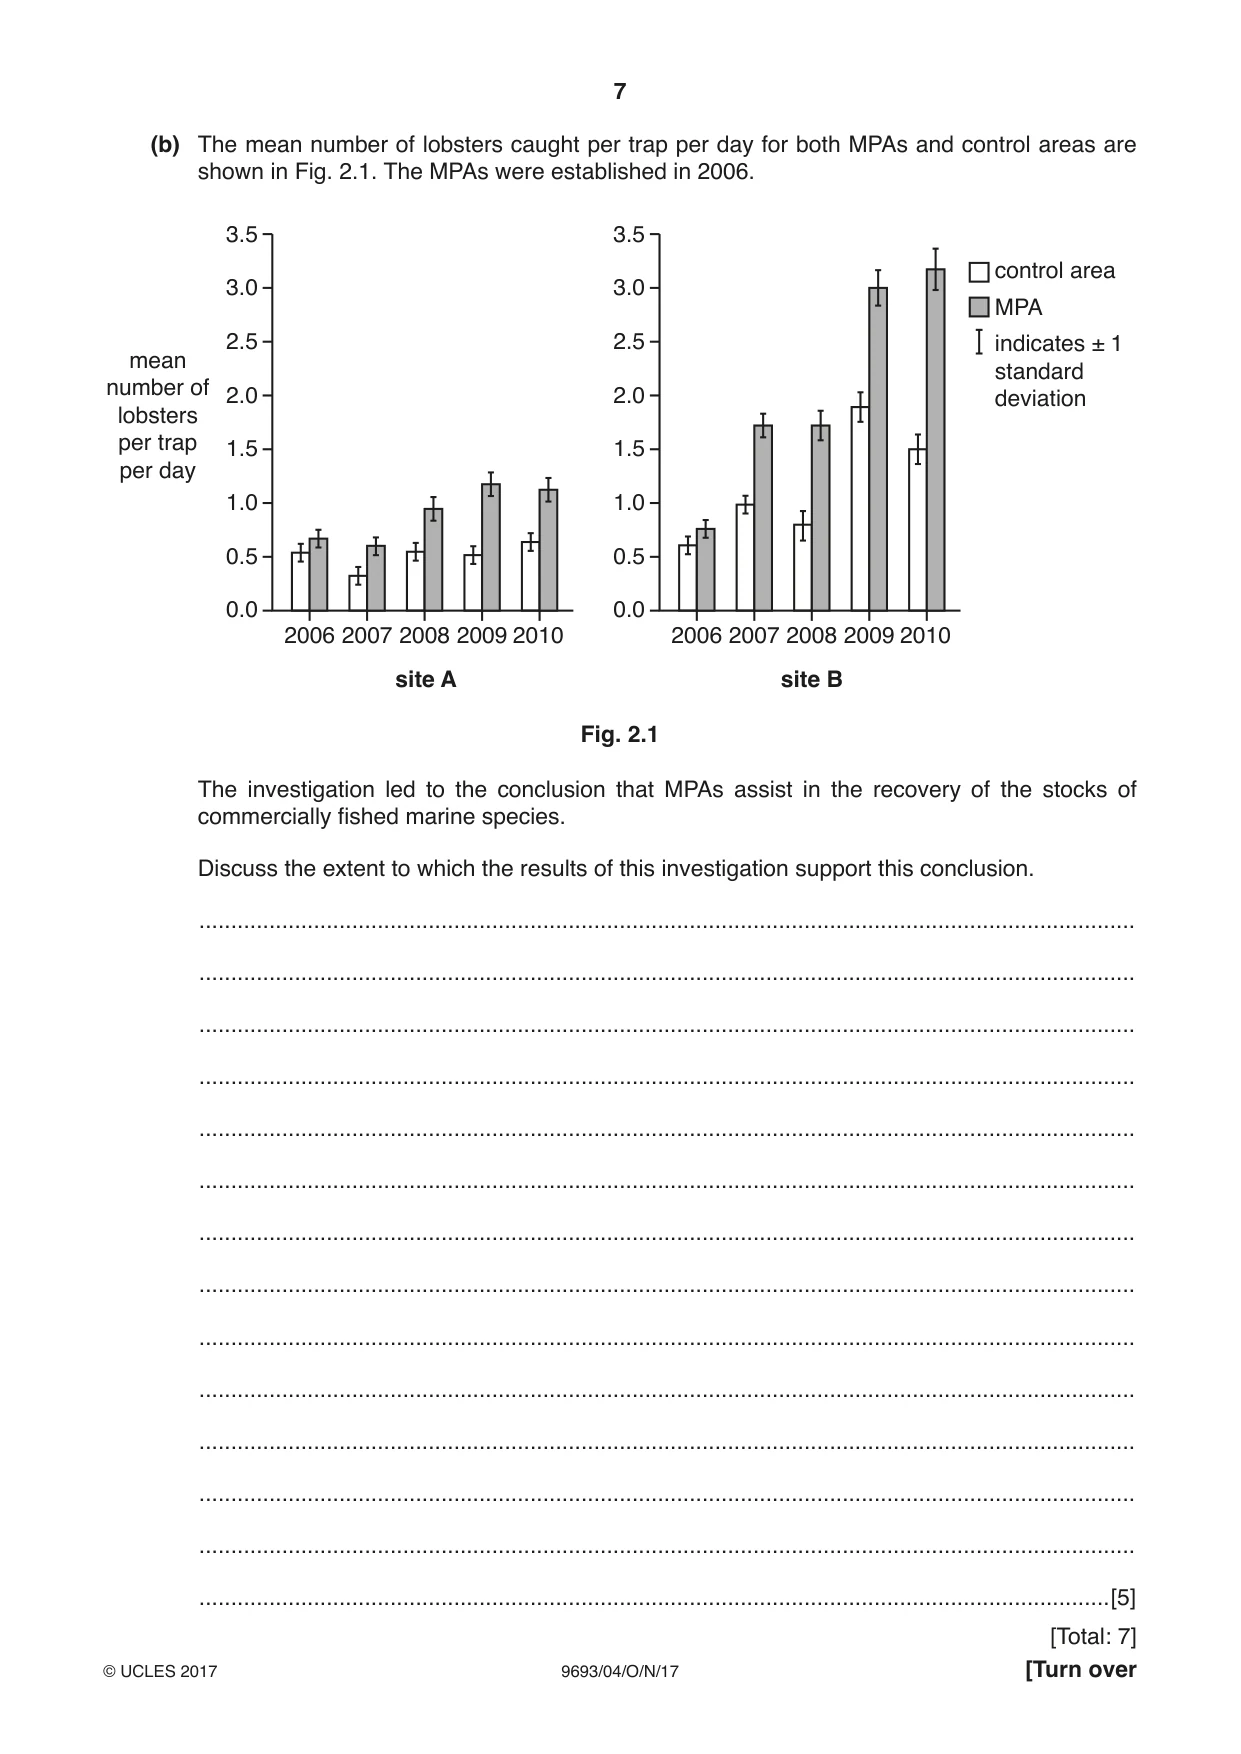
2 Marine protection areas (MPAs) are regions of sea or ocean where fishing is prohibited or restricted in an effort to conserve species. The impact of MPAs on the lobster populations in the sea around Norway was investigated. In 2006, an MPA and a control area were established at site A. An MPA and a control area were also established at site B. The control areas were the same size as the MPAs. Commercial lobster fishing took place in the control areas. All fishing within the MPAs was restricted. Lobsters were sampled in all MPAs and control areas using identical traps placed at a depth of between 10 m and 30 m. Sampling of lobsters was carried out by inspecting 25 traps in each MPA and 25 traps in each control area every day for four separate days. This was repeated every year between 2006 and 2010. Sampling was conducted between 20 August and 10 September each year. (a) (i) Calculate the total number of samples taken each year. ................................................................ [1] (ii) Suggest why the control areas were close to each of the MPAs. ........................................................................................................................................... .......................................................................................................................................[1] (b) The mean number of lobsters caught per trap per day for both MPAs and control areas are shown in Fig. 2.1. The MPAs were established in 2006. 3.5 3.5 control area 3.0 3.0 MPA 2.5 2.5 indicates ± 1 mean standardnumber of 2.0 2.0 deviation lobsters per trap 1.5 1.5 per day 1.0 1.0 0.5 0.5 0.0 0.0 2006 2007 2008 2009 2010 2006 2007 2008 2009 2010 site A site B Fig. 2.1 The investigation led to the conclusion that MPAs assist in the recovery of the stocks of commercially fished marine species. Discuss the extent to which the results of this investigation support this conclusion. ................................................................................................................................................... ................................................................................................................................................... ................................................................................................................................................... ................................................................................................................................................... ................................................................................................................................................... ................................................................................................................................................... ................................................................................................................................................... ................................................................................................................................................... ................................................................................................................................................... ................................................................................................................................................... ................................................................................................................................................... ................................................................................................................................................... ................................................................................................................................................... ...............................................................................................................................................[5]
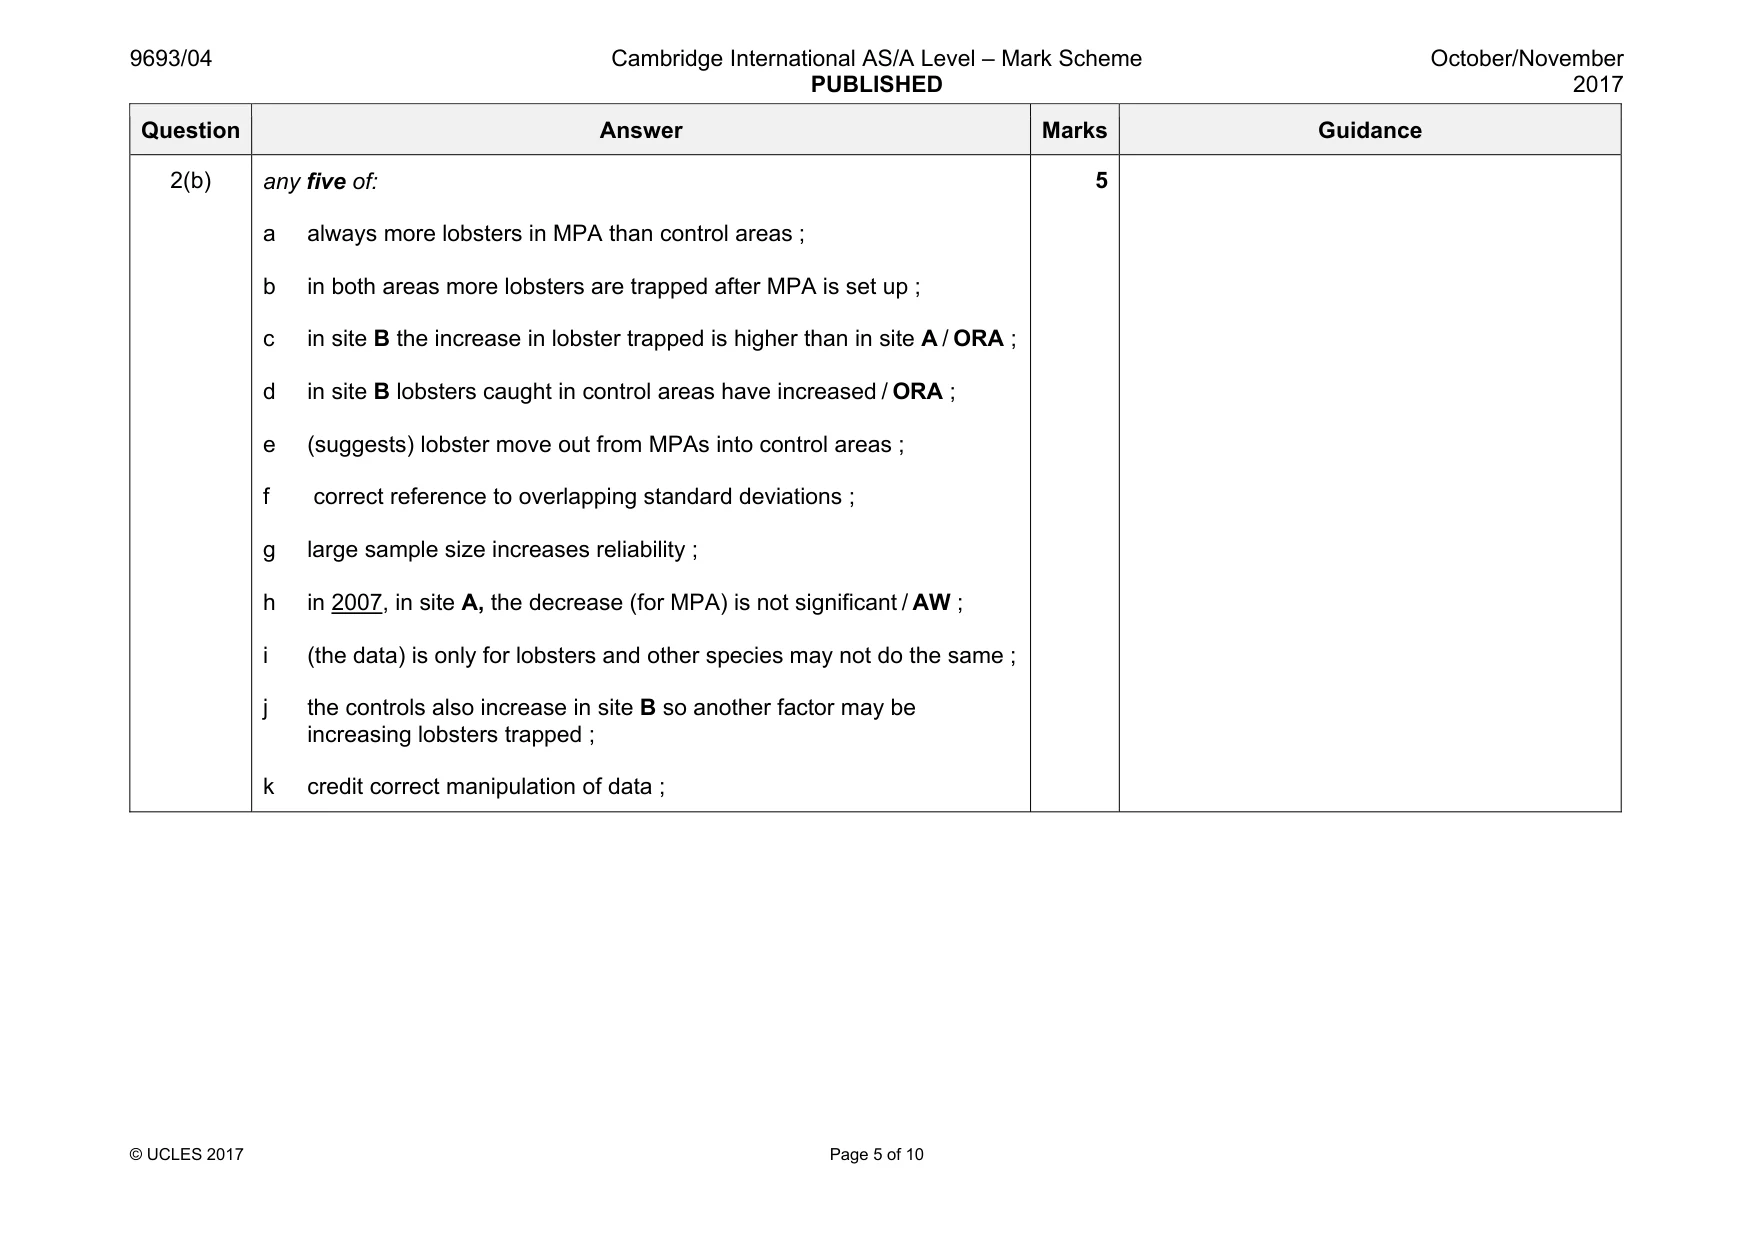
Mark scheme: 2(a)(i) 400 ; 1 2(a)(ii) same temperature / food levels / substrate / water conditions ; 1 A any suitable biotic or abiotic factor Question Answer Marks Guidance 2(b) any five of: a always more lobsters in MPA than control areas ; b in both areas more lobsters are trapped after MPA is set up ; c in site B the increase in lobster trapped is higher than in site A / ORA ; d in site B lobsters caught in control areas have increased / ORA ; e (suggests) lobster move out from MPAs into control areas ; f correct reference to overlapping standard deviations ; g large sample size increases reliability ; h in 2007, in site A, the decrease (for MPA) is not significant / AW ; i (the data) is only for lobsters and other species may not do the same ; j the controls also increase in site B so another factor may be increasing lobsters trapped ; k credit correct manipulation of data ; 5
Q3 · Marine organisms are adapted for life in their particular habitat
3 Marine organisms are adapted for life in their particular habitat. (a) (i) Explain why large, active animals require specialised gas exchange surfaces and transport systems. ........................................................................................................................................... ........................................................................................................................................... ........................................................................................................................................... ........................................................................................................................................... ........................................................................................................................................... ........................................................................................................................................... ........................................................................................................................................... ........................................................................................................................................... .......................................................................................................................................[4] (ii) Describe how tuna maximise their rate of gas exchange. ........................................................................................................................................... ........................................................................................................................................... ........................................................................................................................................... ........................................................................................................................................... ........................................................................................................................................... ........................................................................................................................................... ........................................................................................................................................... ........................................................................................................................................... ........................................................................................................................................... ........................................................................................................................................... ........................................................................................................................................... ........................................................................................................................................... .......................................................................................................................................[6] (b) Explain why algal species adapted to live in deeper waters often contain accessory pigments. ................................................................................................................................................... ................................................................................................................................................... ................................................................................................................................................... ................................................................................................................................................... ................................................................................................................................................... ................................................................................................................................................... ................................................................................................................................................... ................................................................................................................................................... ................................................................................................................................................... ................................................................................................................................................... ................................................................................................................................................... ................................................................................................................................................... ...............................................................................................................................................[5] [Total: 15]
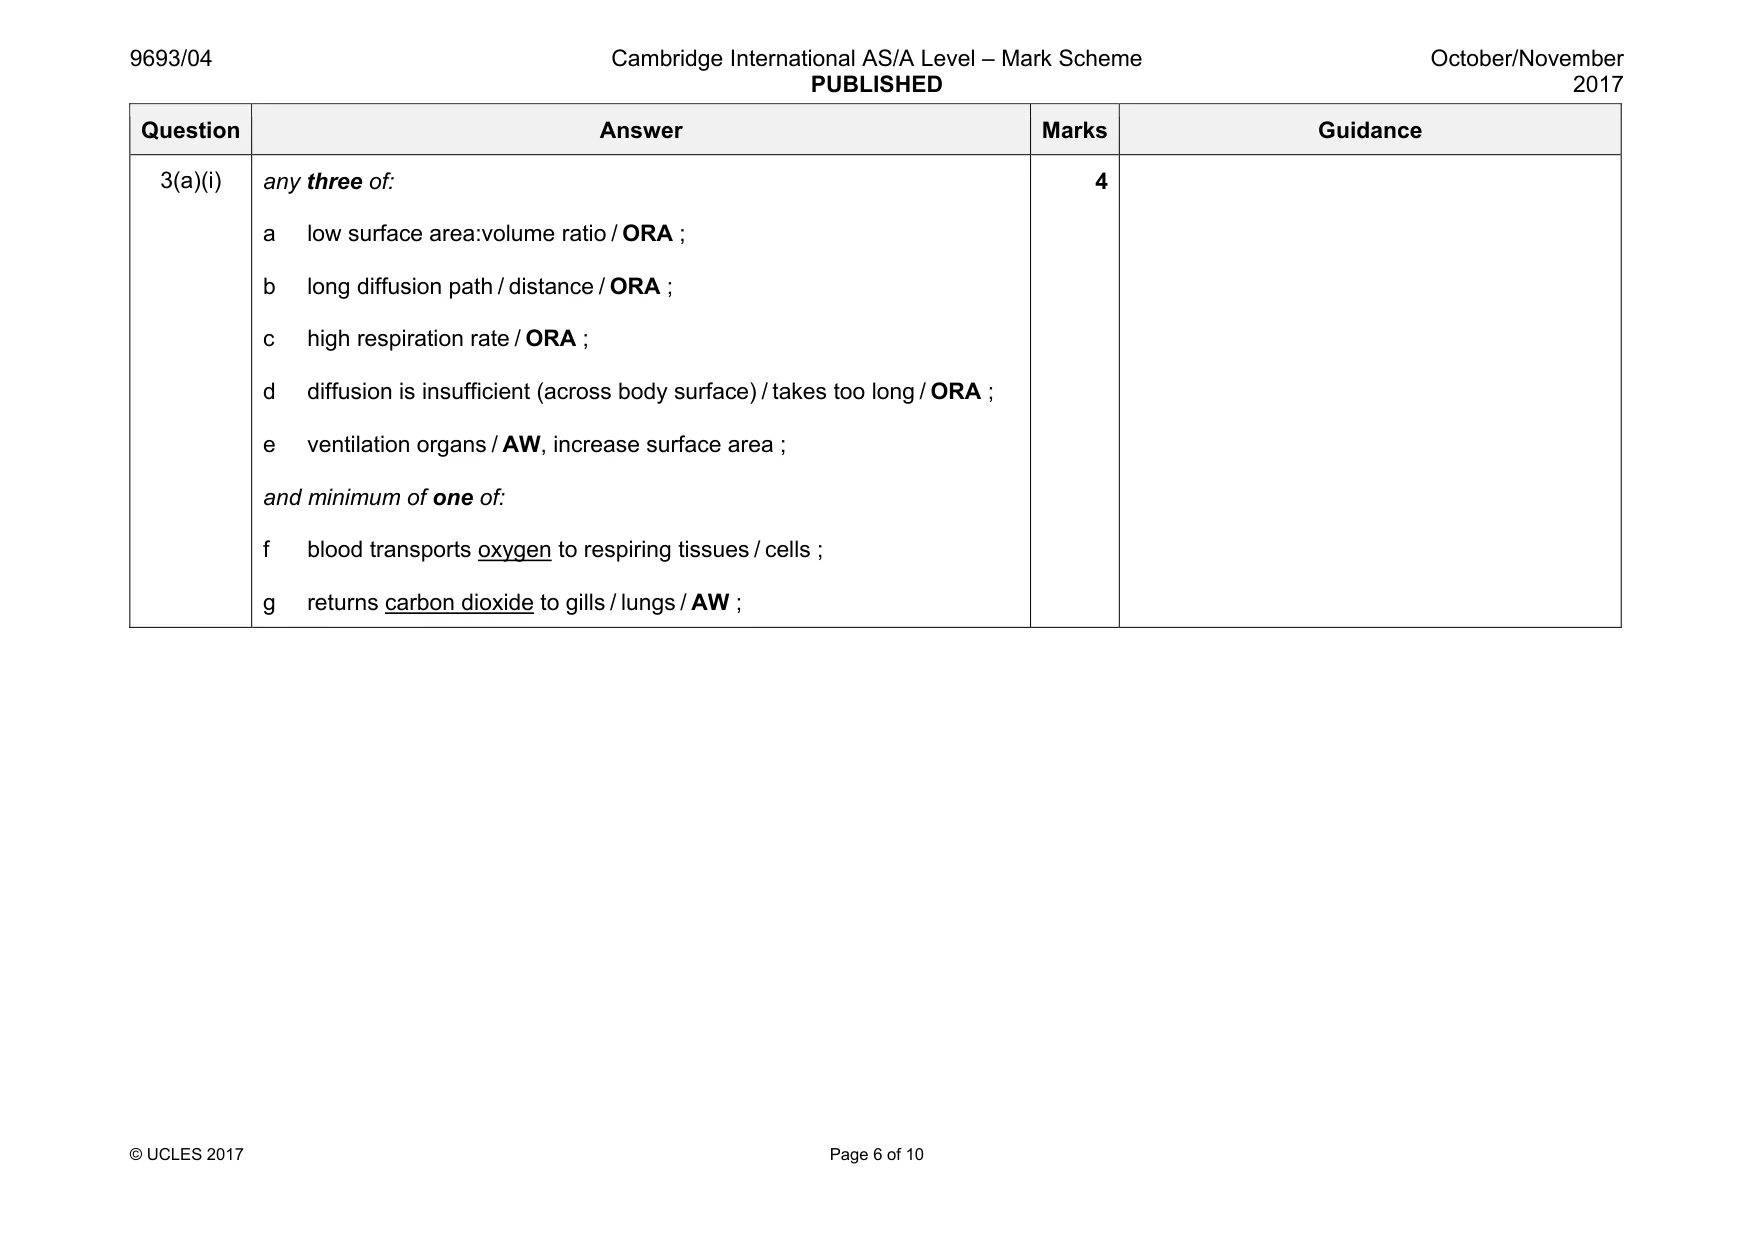
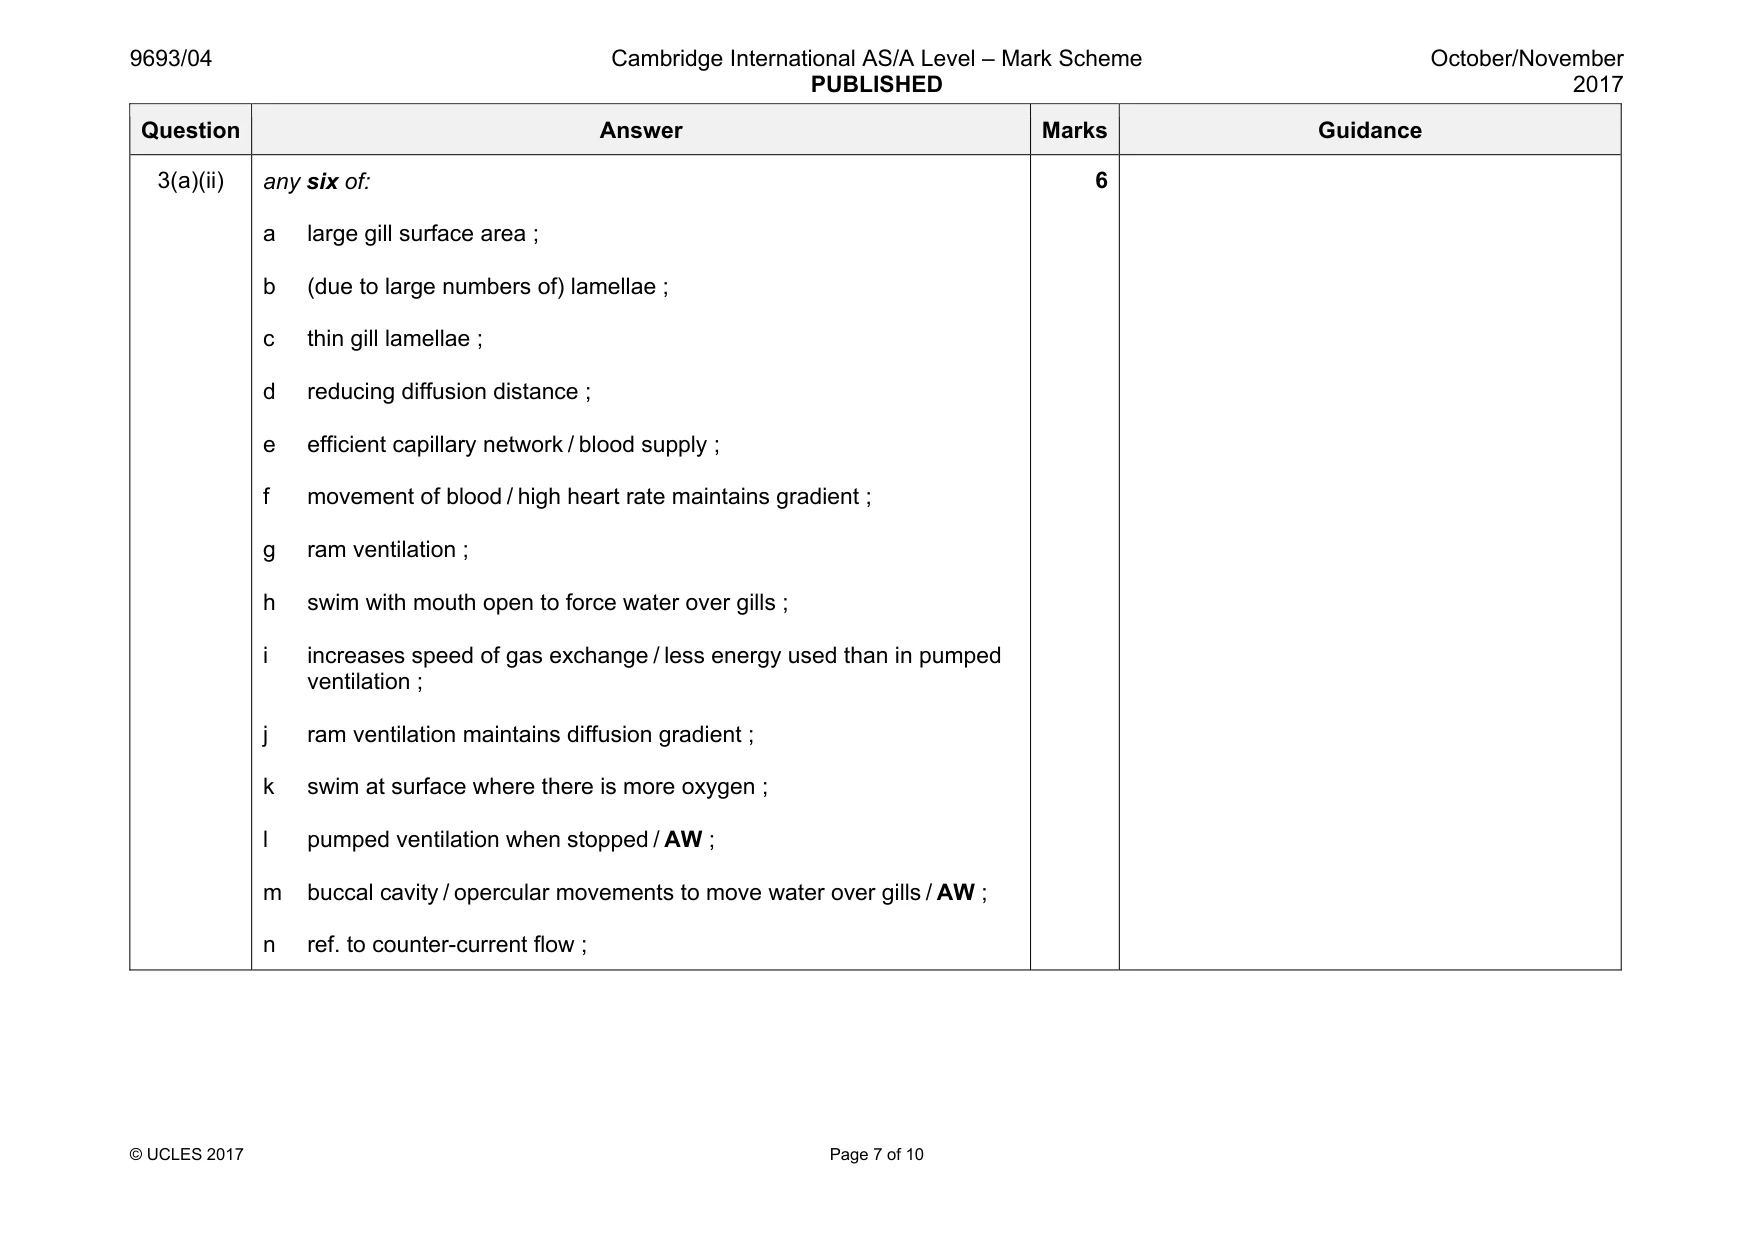
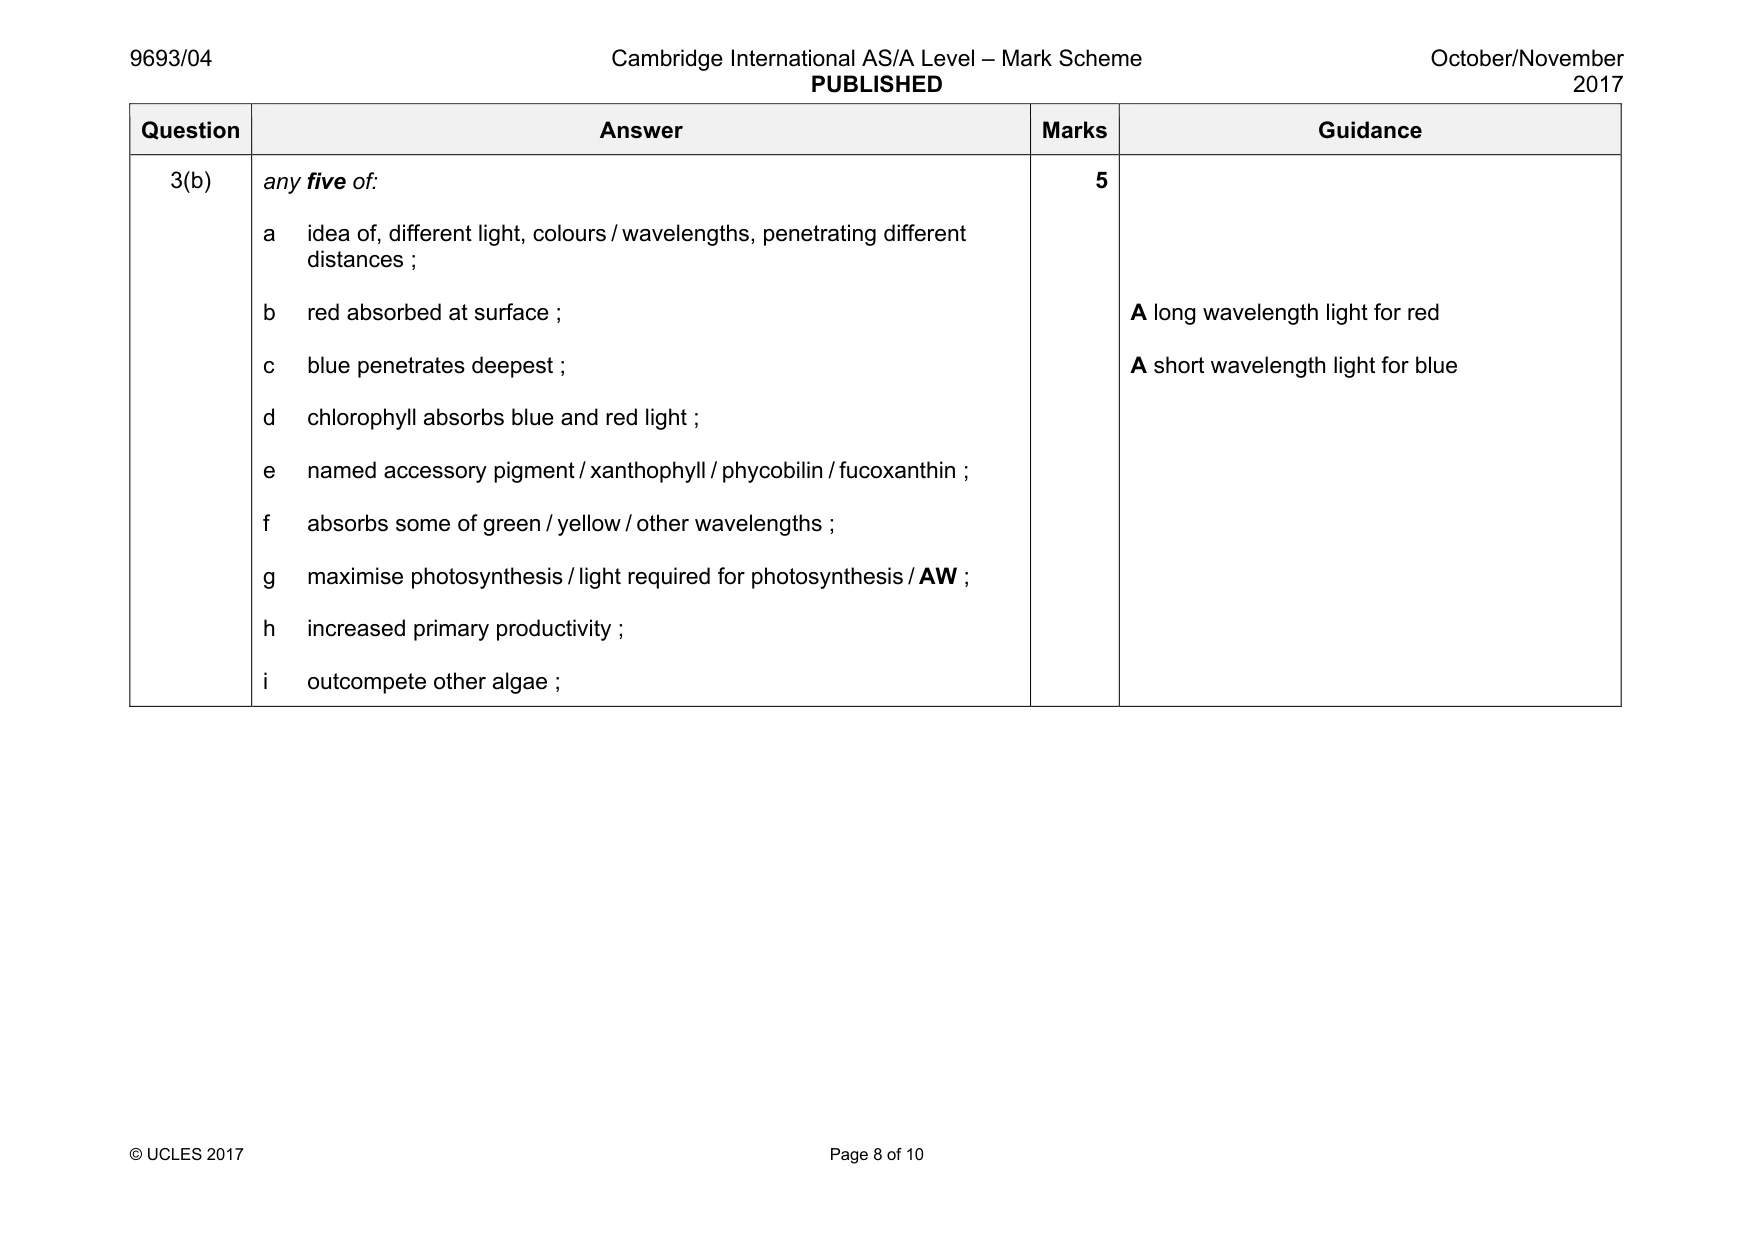
Mark scheme: 3(a)(i) any three of: a low surface area:volume ratio / ORA ; b long diffusion path / distance / ORA ; c high respiration rate / ORA ; d diffusion is insufficient (across body surface) / takes too long / ORA ; e ventilation organs / AW, increase surface area ; and minimum of one of: f blood transports oxygen to respiring tissues / cells ; g returns carbon dioxide to gills / lungs / AW ; 4 Question Answer Marks Guidance 3(a)(ii) any six of: a large gill surface area ; b (due to large numbers of) lamellae ; c thin gill lamellae ; d reducing diffusion distance ; e efficient capillary network / blood supply ; f movement of blood / high heart rate maintains gradient ; g ram ventilation ; h swim with mouth open to force water over gills ; i increases speed of gas exchange / less energy used than in pumped ventilation ; j ram ventilation maintains diffusion gradient ; k swim at surface where there is more oxygen ; l pumped ventilation when stopped / AW ; m buccal cavity / opercular movements to move water over gills / AW ; n ref. to counter-current flow ; 6 Question Answer Marks Guidance 3(b) any five of: a idea of, different light, colours / wavelengths, penetrating different distances ; b red absorbed at surface ; c blue penetrates deepest ; d chlorophyll absorbs blue and red light ; e named accessory pigment / xanthophyll / phycobilin / fucoxanthin ; f absorbs some of green / yellow / other wavelengths ; g maximise photosynthesis / light required for photosynthesis / AW ; h increased primary productivity ; i outcompete other algae ; 5 A long wavelength light for red A short wavelength light for blue
Q4 · Planting of mangroves and building artificial reefs can assist in the rehabilitation of…
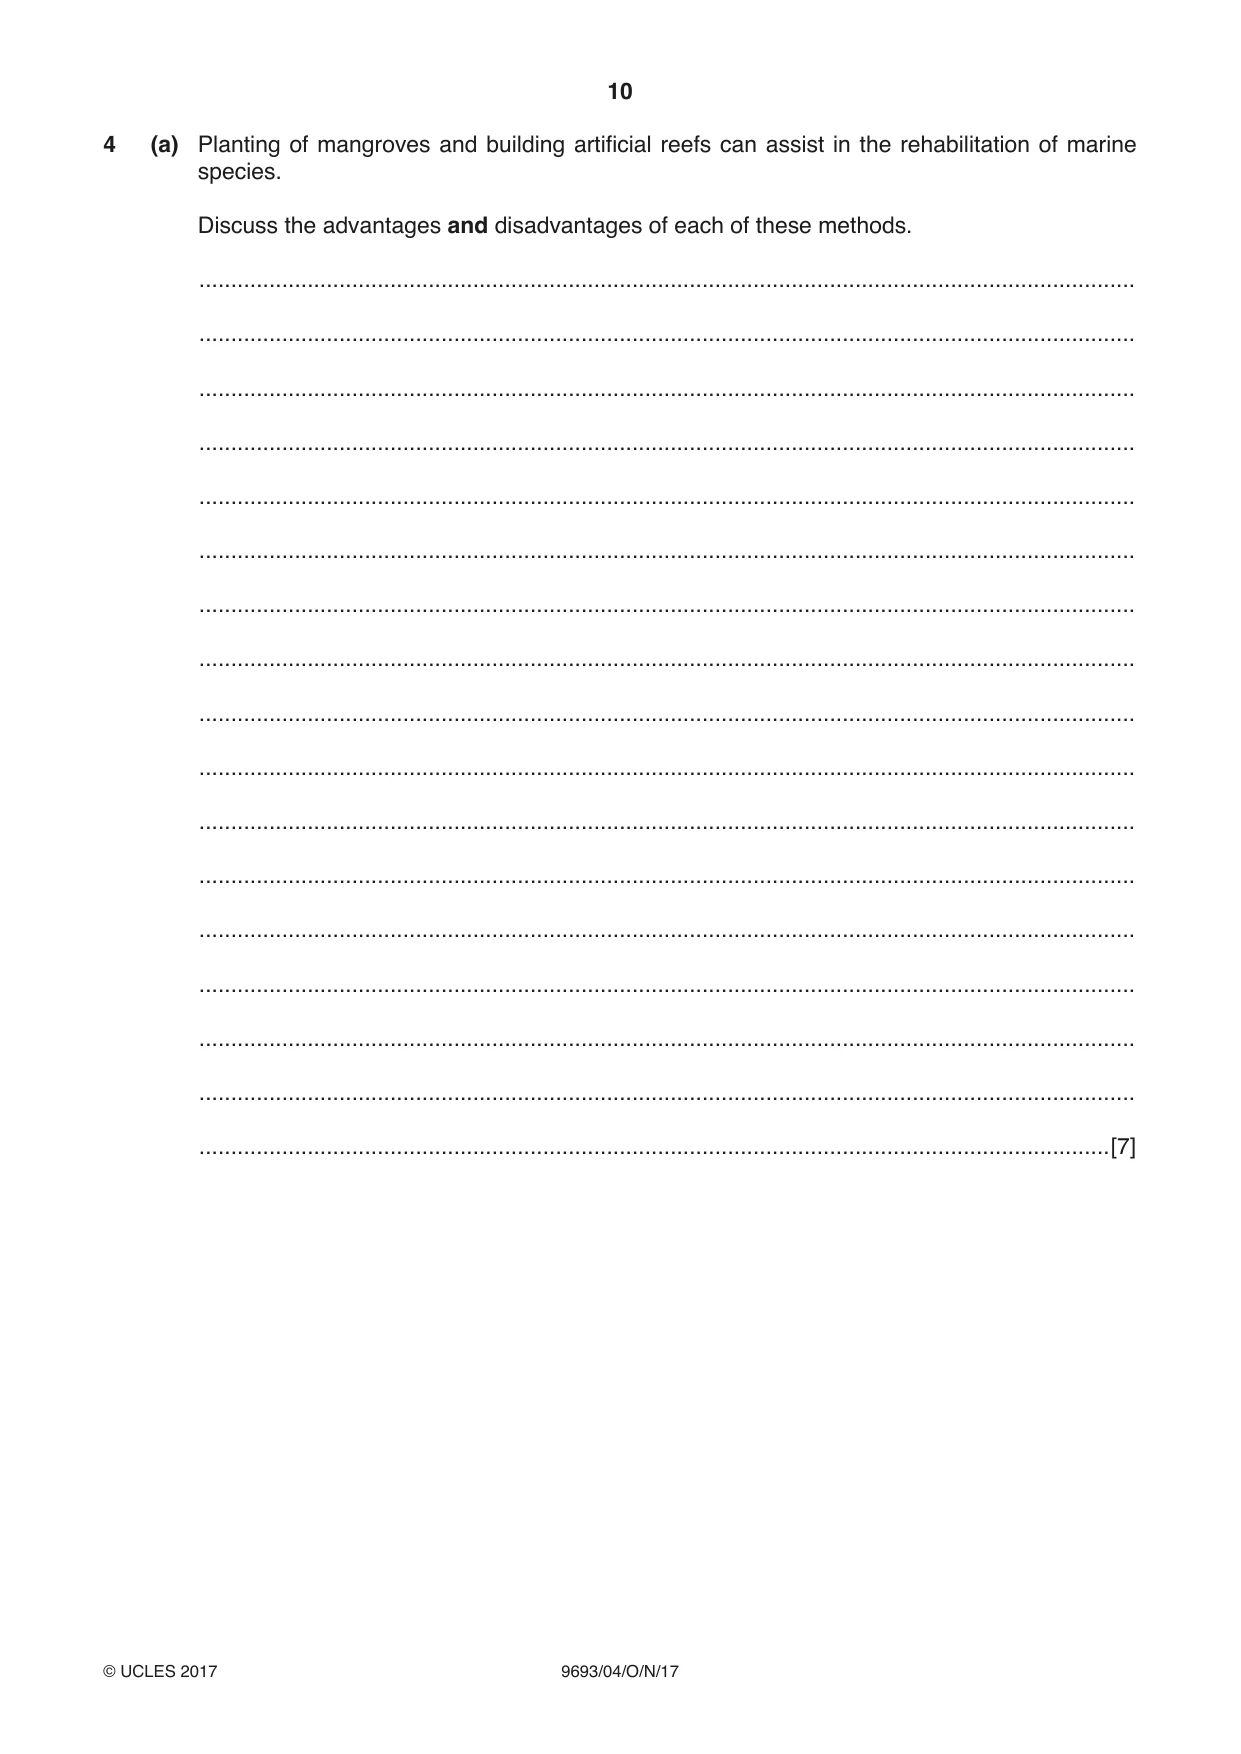
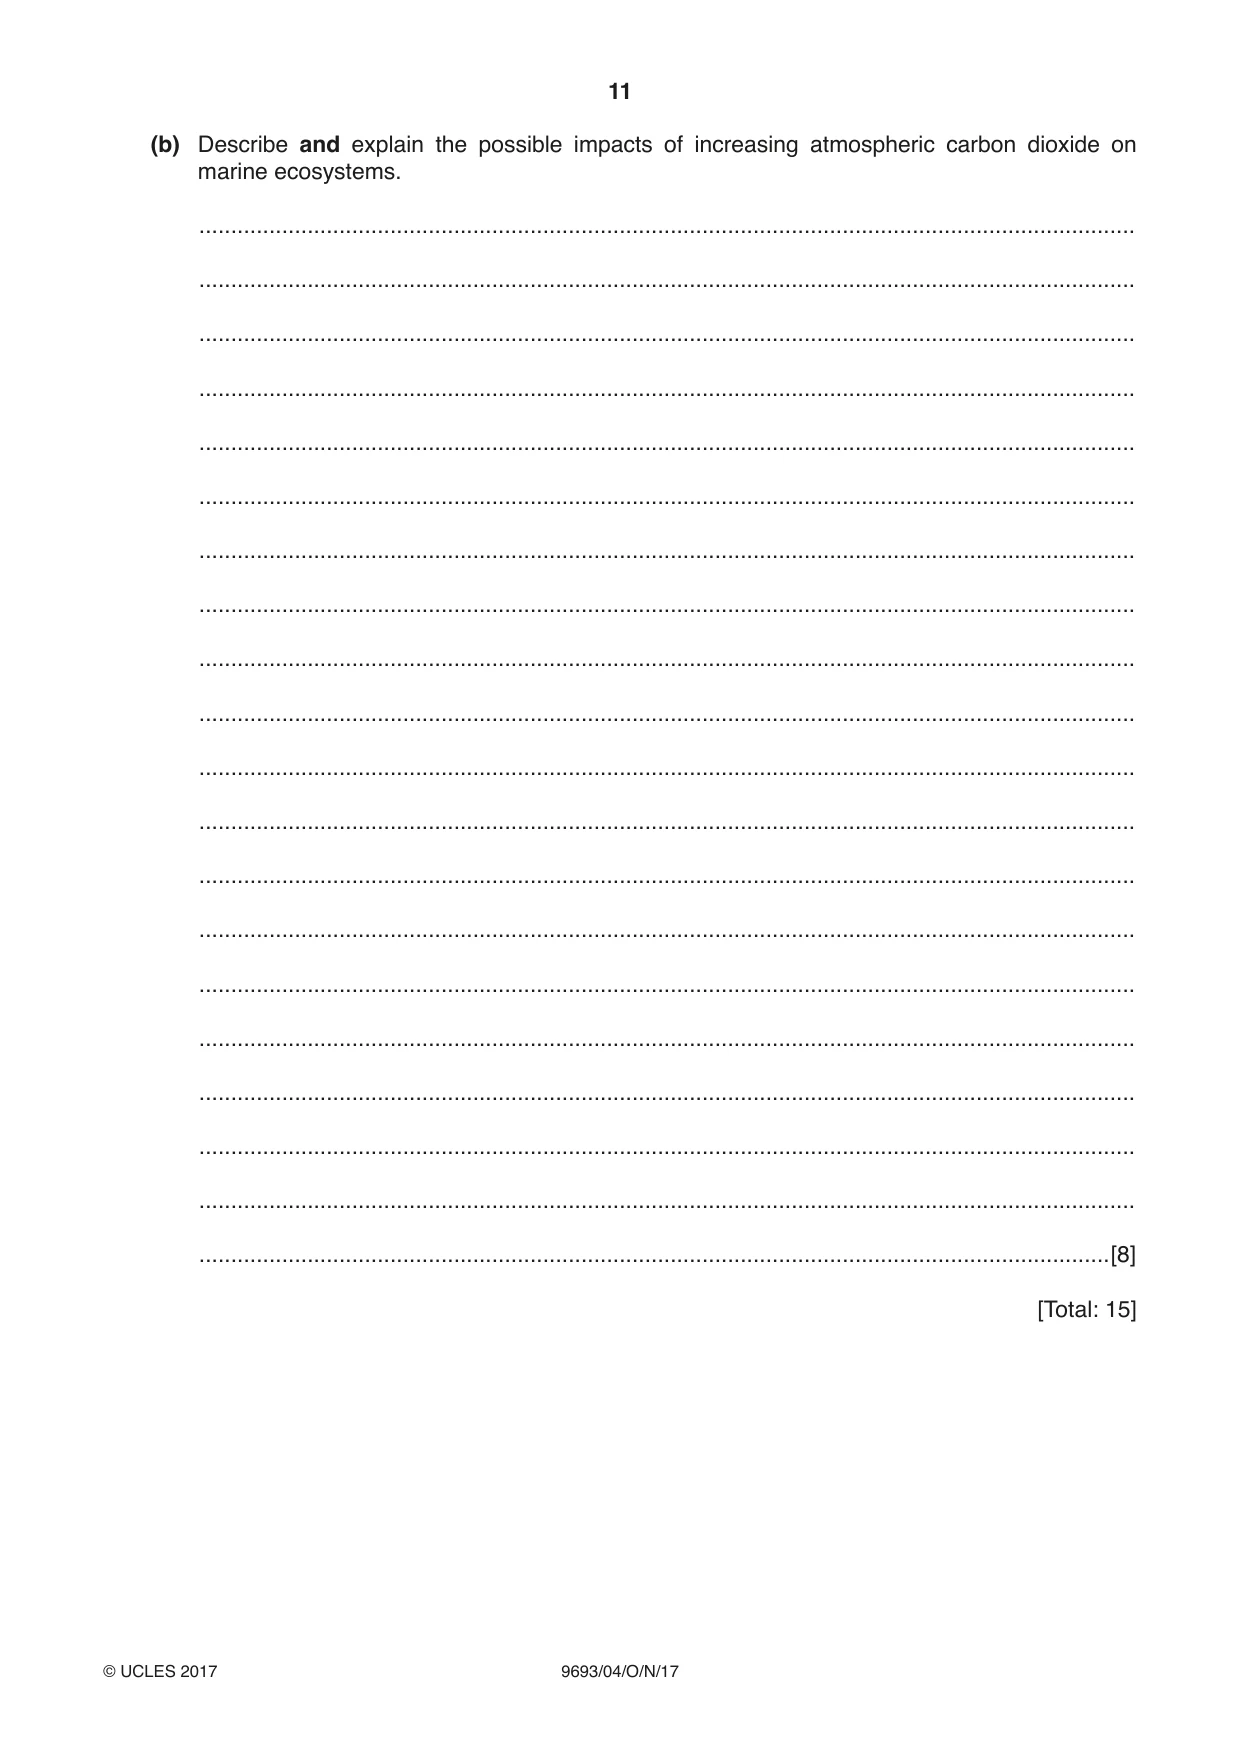
4 (a) Planting of mangroves and building artificial reefs can assist in the rehabilitation of marine species. Discuss the advantages and disadvantages of each of these methods. ................................................................................................................................................... ................................................................................................................................................... ................................................................................................................................................... ................................................................................................................................................... ................................................................................................................................................... ................................................................................................................................................... ................................................................................................................................................... ................................................................................................................................................... ................................................................................................................................................... ................................................................................................................................................... ................................................................................................................................................... ................................................................................................................................................... ................................................................................................................................................... ................................................................................................................................................... ................................................................................................................................................... ................................................................................................................................................... ...............................................................................................................................................[7] (b) Describe and explain the possible impacts of increasing atmospheric carbon dioxide on marine ecosystems. ................................................................................................................................................... ................................................................................................................................................... ................................................................................................................................................... ................................................................................................................................................... ................................................................................................................................................... ................................................................................................................................................... ................................................................................................................................................... ................................................................................................................................................... ................................................................................................................................................... ................................................................................................................................................... ................................................................................................................................................... ................................................................................................................................................... ................................................................................................................................................... ................................................................................................................................................... ................................................................................................................................................... ................................................................................................................................................... ................................................................................................................................................... ................................................................................................................................................... ................................................................................................................................................... ...............................................................................................................................................[8] [Total: 15]
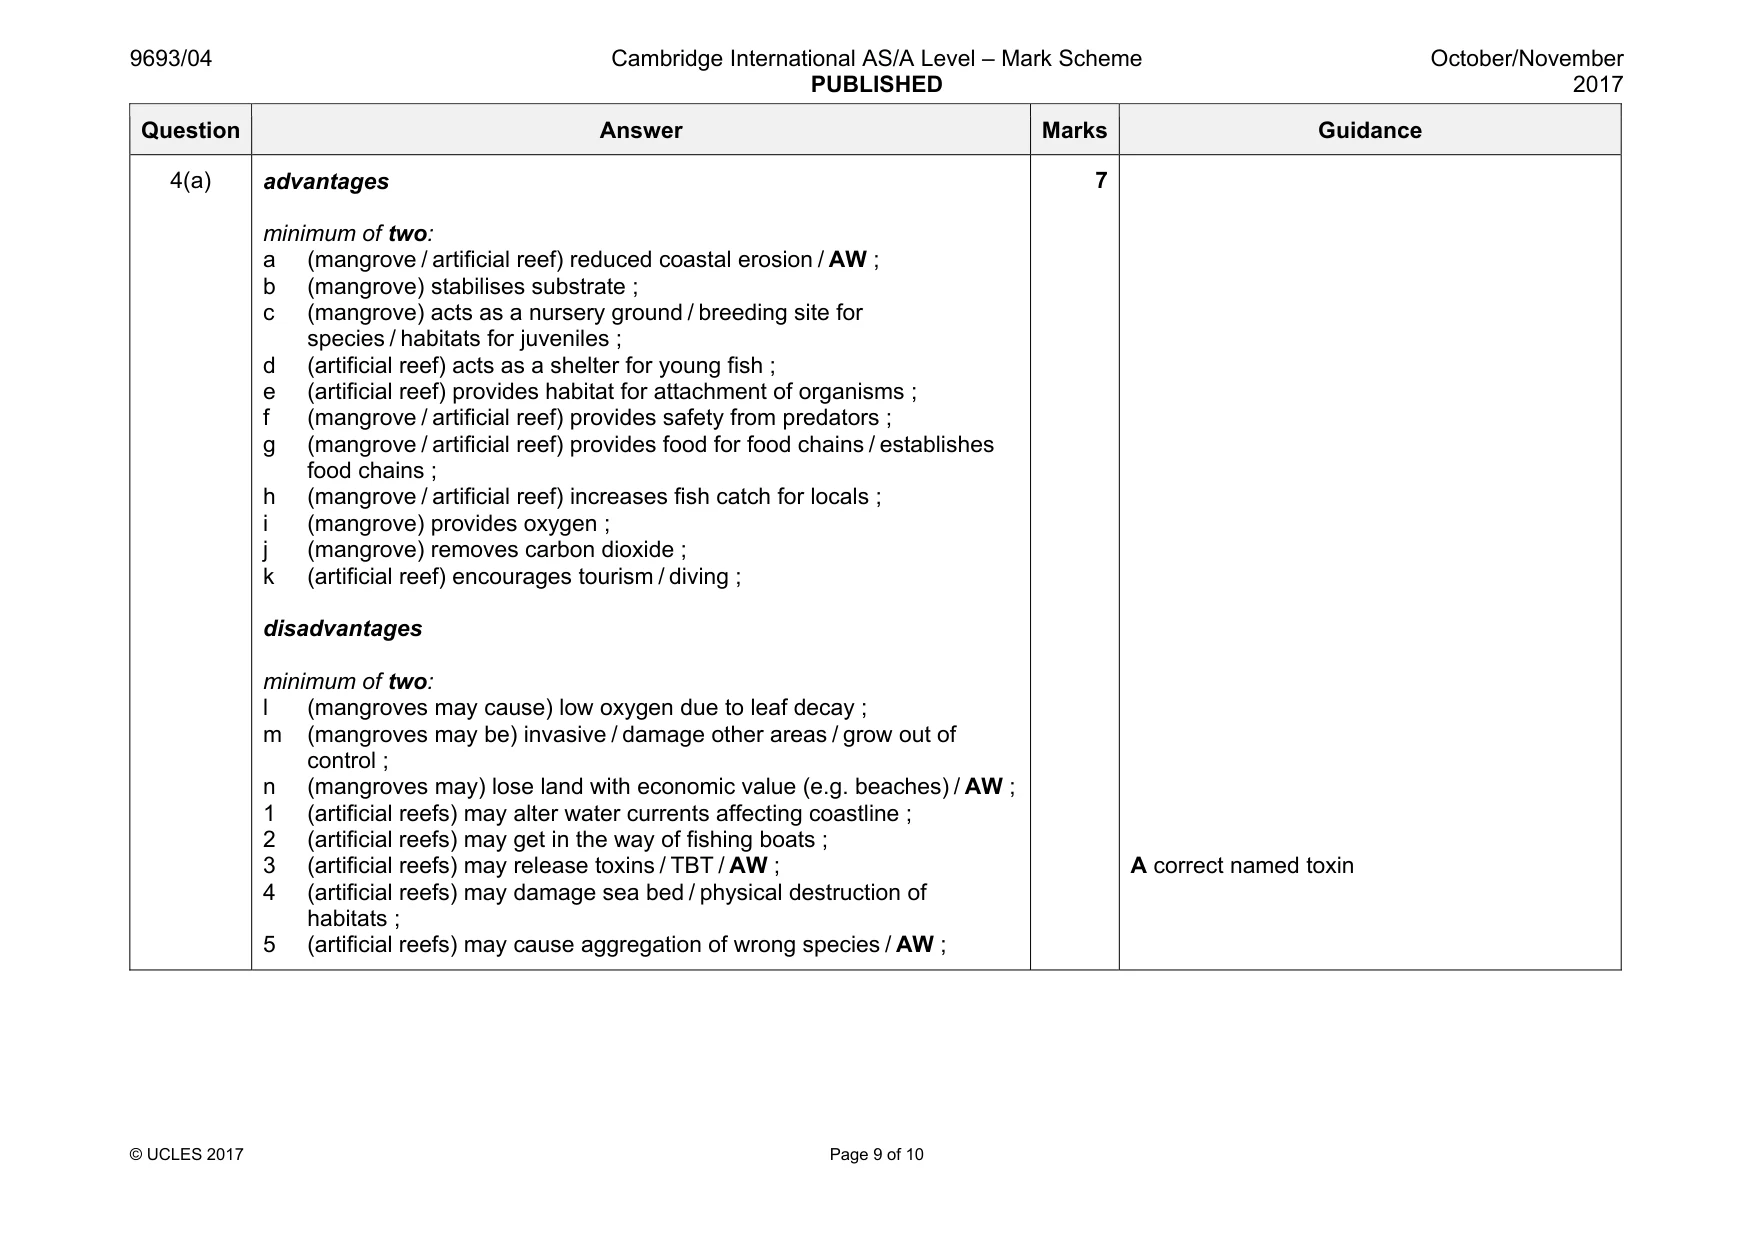
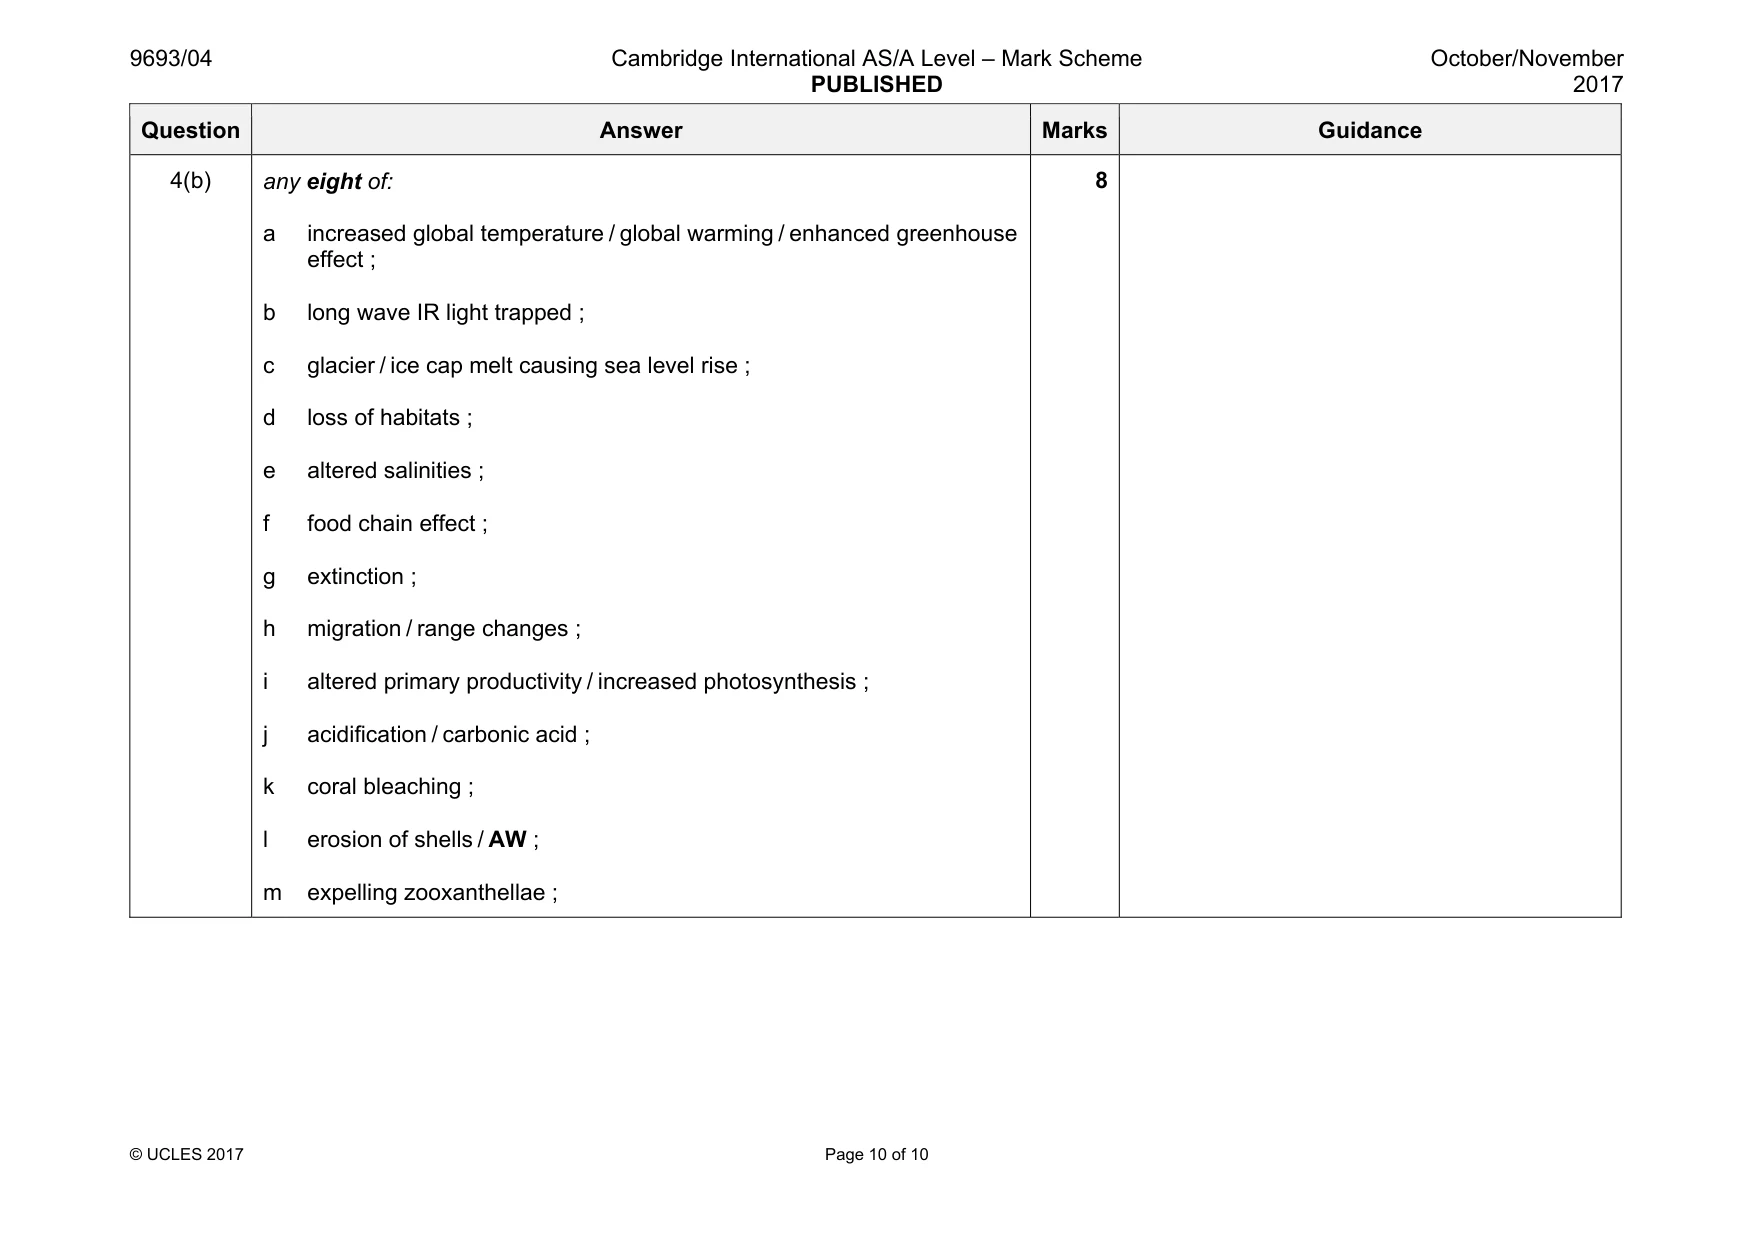
Mark scheme: 4(a) advantages minimum of two: a (mangrove / artificial reef) reduced coastal erosion / AW ; b (mangrove) stabilises substrate ; c (mangrove) acts as a nursery ground / breeding site for species / habitats for juveniles ; d (artificial reef) acts as a shelter for young fish ; e (artificial reef) provides habitat for attachment of organisms ; f (mangrove / artificial reef) provides safety from predators ; g (mangrove / artificial reef) provides food for food chains / establishes food chains ; h (mangrove / artificial reef) increases fish catch for locals ; i (mangrove) provides oxygen ; j (mangrove) removes carbon dioxide ; k (artificial reef) encourages tourism / diving ; disadvantages minimum of two: l (mangroves may cause) low oxygen due to leaf decay ; m (mangroves may be) invasive / damage other areas / grow out of control ; n (mangroves may) lose land with economic value (e.g. beaches) / AW ; 1 (artificial reefs) may alter water currents affecting coastline ; 2 (artificial reefs) may get in the way of fishing boats ; 3 (artificial reefs) may release toxins / TBT / AW ; 4 (artificial reefs) may damage sea bed / physical destruction of habitats ; 5 (artificial reefs) may cause aggregation of wrong species / AW ; 7 A correct named toxin Question Answer Marks Guidance 4(b) any eight of: a increased global temperature / global warming / enhanced greenhouse effect ; b long wave IR light trapped ; c glacier / ice cap melt causing sea level rise ; d loss of habitats ; e altered salinities ; f food chain effect ; g extinction ; h migration / range changes ; i altered primary productivity / increased photosynthesis ; j acidification / carbonic acid ; k coral bleaching ; l erosion of shells / AW ; m expelling zooxanthellae ; 8
What was in this paper
The subtopics covered by these 4 questions, and how many questions each got. Open one in a new tab to see every Cambridge question on it.
What you needed in this session
Cambridge’s own grade thresholds for 2017 Oct/Nov, Paper 4 · Variant 1. A higher threshold means an easier paper — the bar moves with how the cohort did.