Cambridge A Level Marine Science 9693 — 2025 May/June Paper 4 · Variant 1
9693/41/M/J/25 · 6 questions · 75 marks · 105 min
The question paper and its mark scheme, free to read here and free to download. This is Cambridge’s own paper, exactly as it was sat.
Question paper24 pages




Mark scheme21 pages
Answers below. Sit the paper first if you are practising.
Questions as text
Q1 · An electron micrograph of part of a cell from a salmon
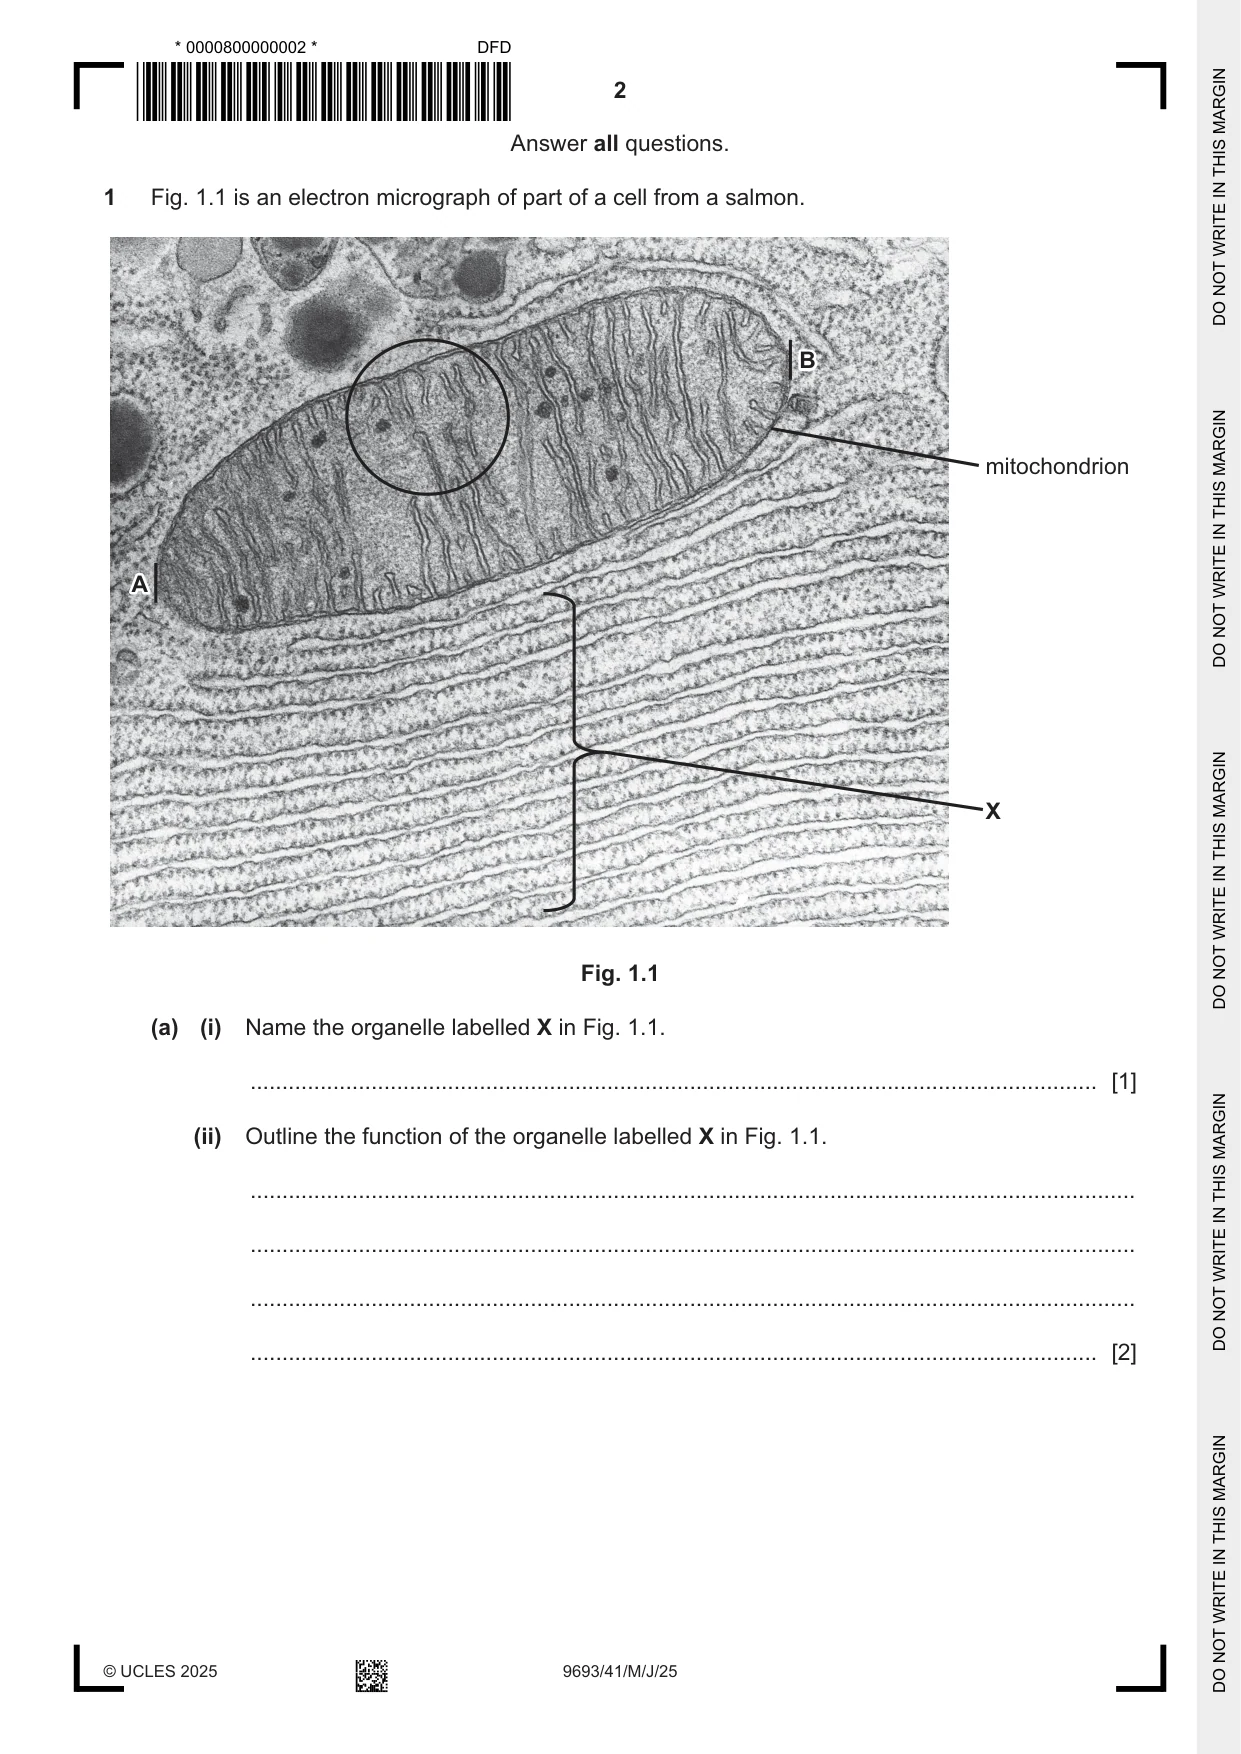
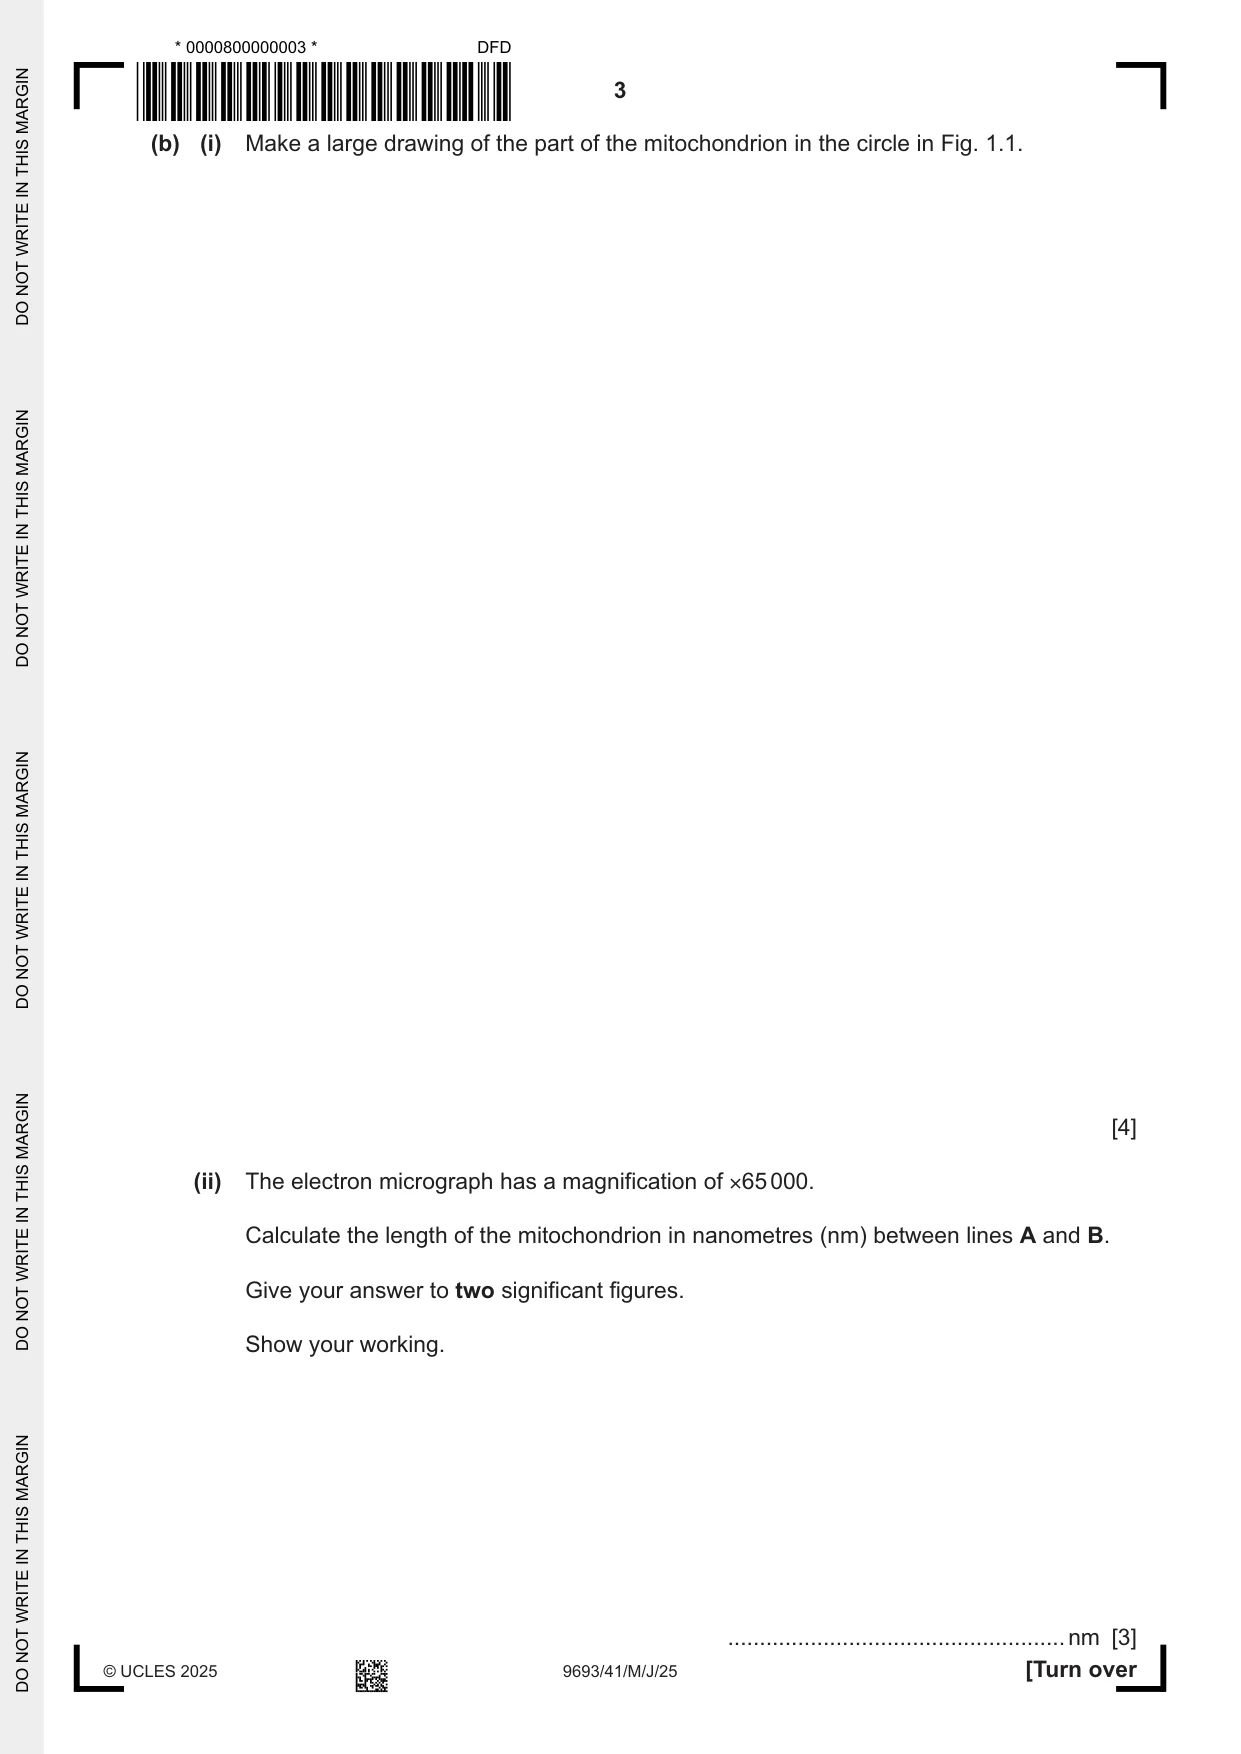
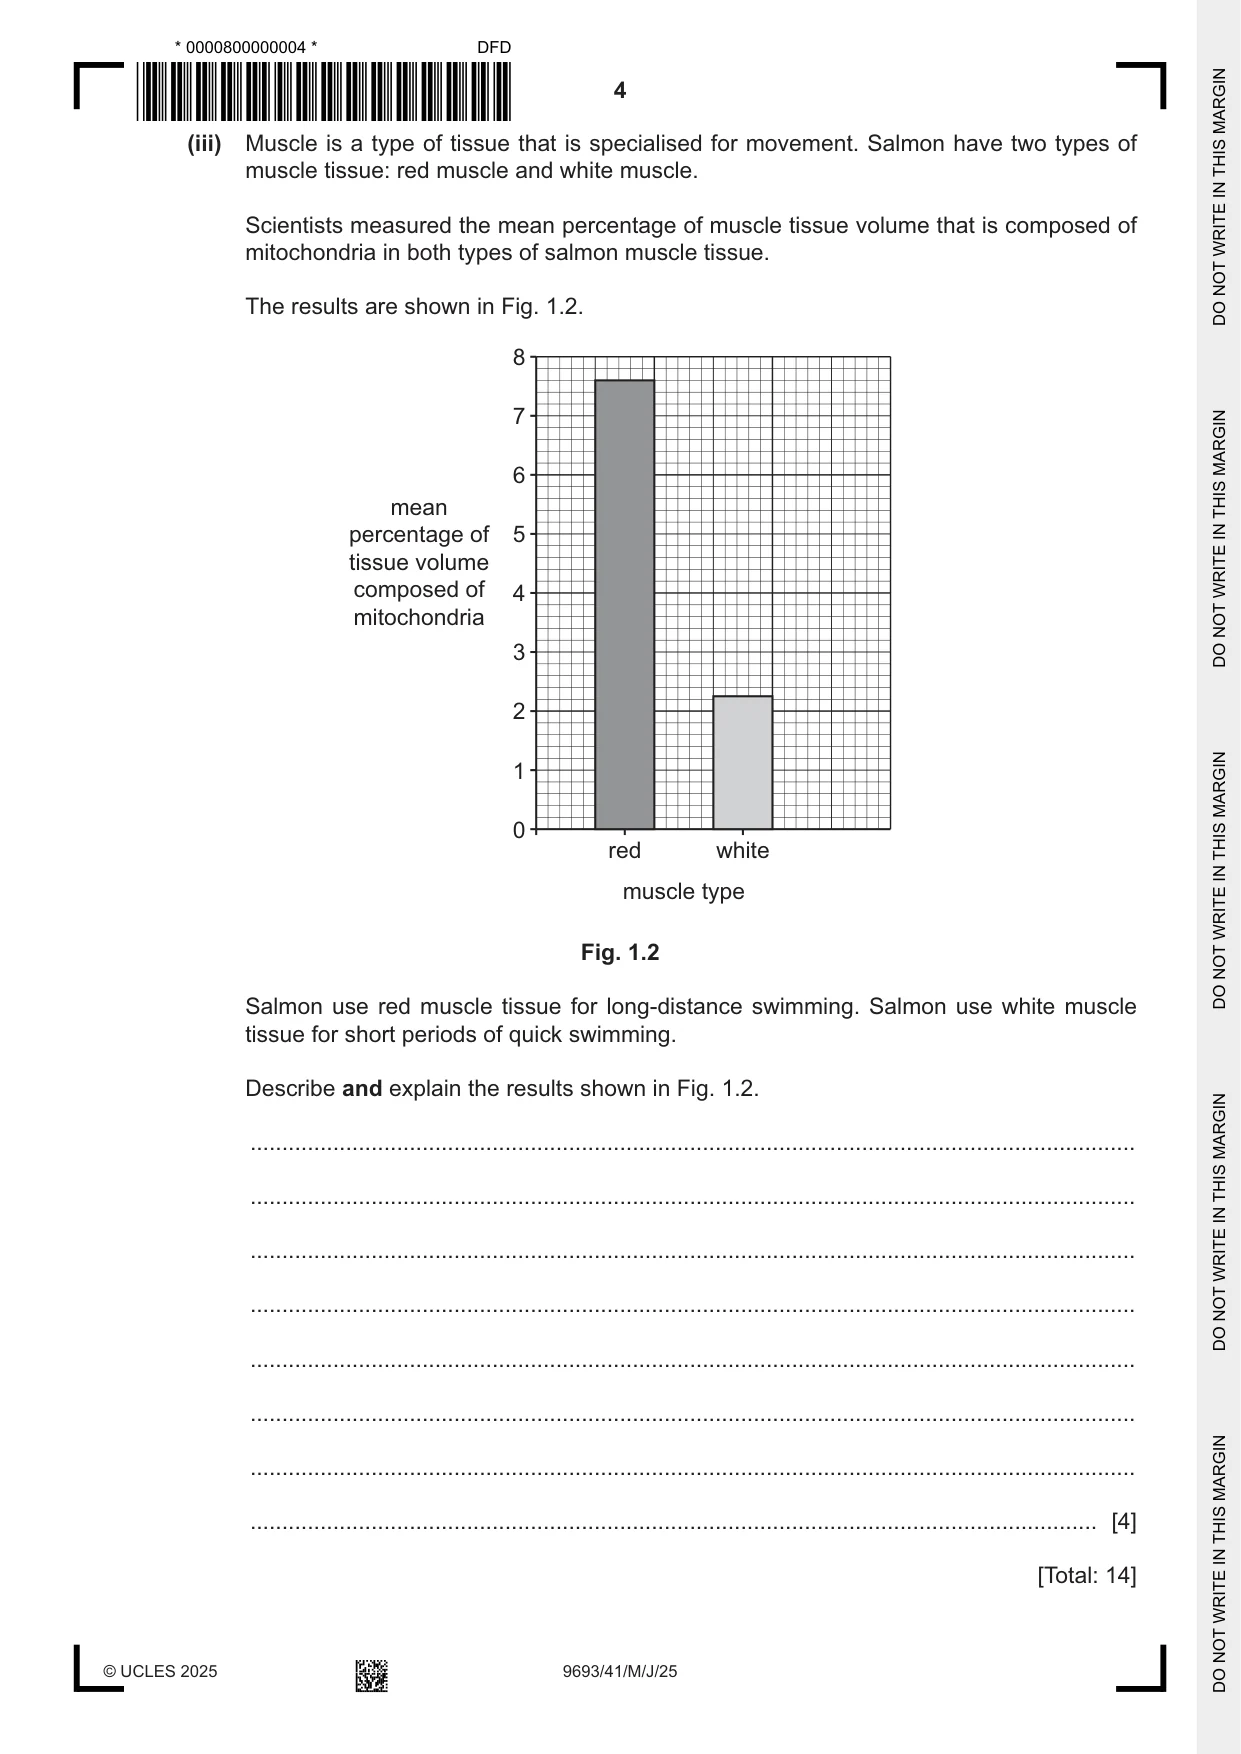
1 Fig. 1.1 is an electron micrograph of part of a cell from a salmon. B mitochondrion A X Fig. 1.1 (a) (i) Name the organelle labelled X in Fig. 1.1. ..................................................................................................................................... [1] (ii) Outline the function of the organelle labelled X in Fig. 1.1. ........................................................................................................................................... ........................................................................................................................................... ........................................................................................................................................... ..................................................................................................................................... [2] (b) (i) Make a large drawing of the part of the mitochondrion in the circle in Fig. 1.1. [4] (ii) The electron micrograph has a magnification of ×65 000. Calculate the length of the mitochondrion in nanometres (nm) between lines A and B. Give your answer to two significant figures. Show your working. .....................................................nm [3] (iii) Muscle is a type of tissue that is specialised for movement. Salmon have two types of muscle tissue: red muscle and white muscle. Scientists measured the mean percentage of muscle tissue volume that is composed of mitochondria in both types of salmon muscle tissue. The results are shown in Fig. 1.2. 8 7 6 mean percentage of 5 tissue volume composed of 4 mitochondria 3 2 1 0 red white muscle type Fig. 1.2 Salmon use red muscle tissue for long-distance swimming. Salmon use white muscle tissue for short periods of quick swimming. Describe and explain the results shown in Fig. 1.2. ........................................................................................................................................... ........................................................................................................................................... ........................................................................................................................................... ........................................................................................................................................... ........................................................................................................................................... ........................................................................................................................................... ........................................................................................................................................... ..................................................................................................................................... [4] [Total: 14]
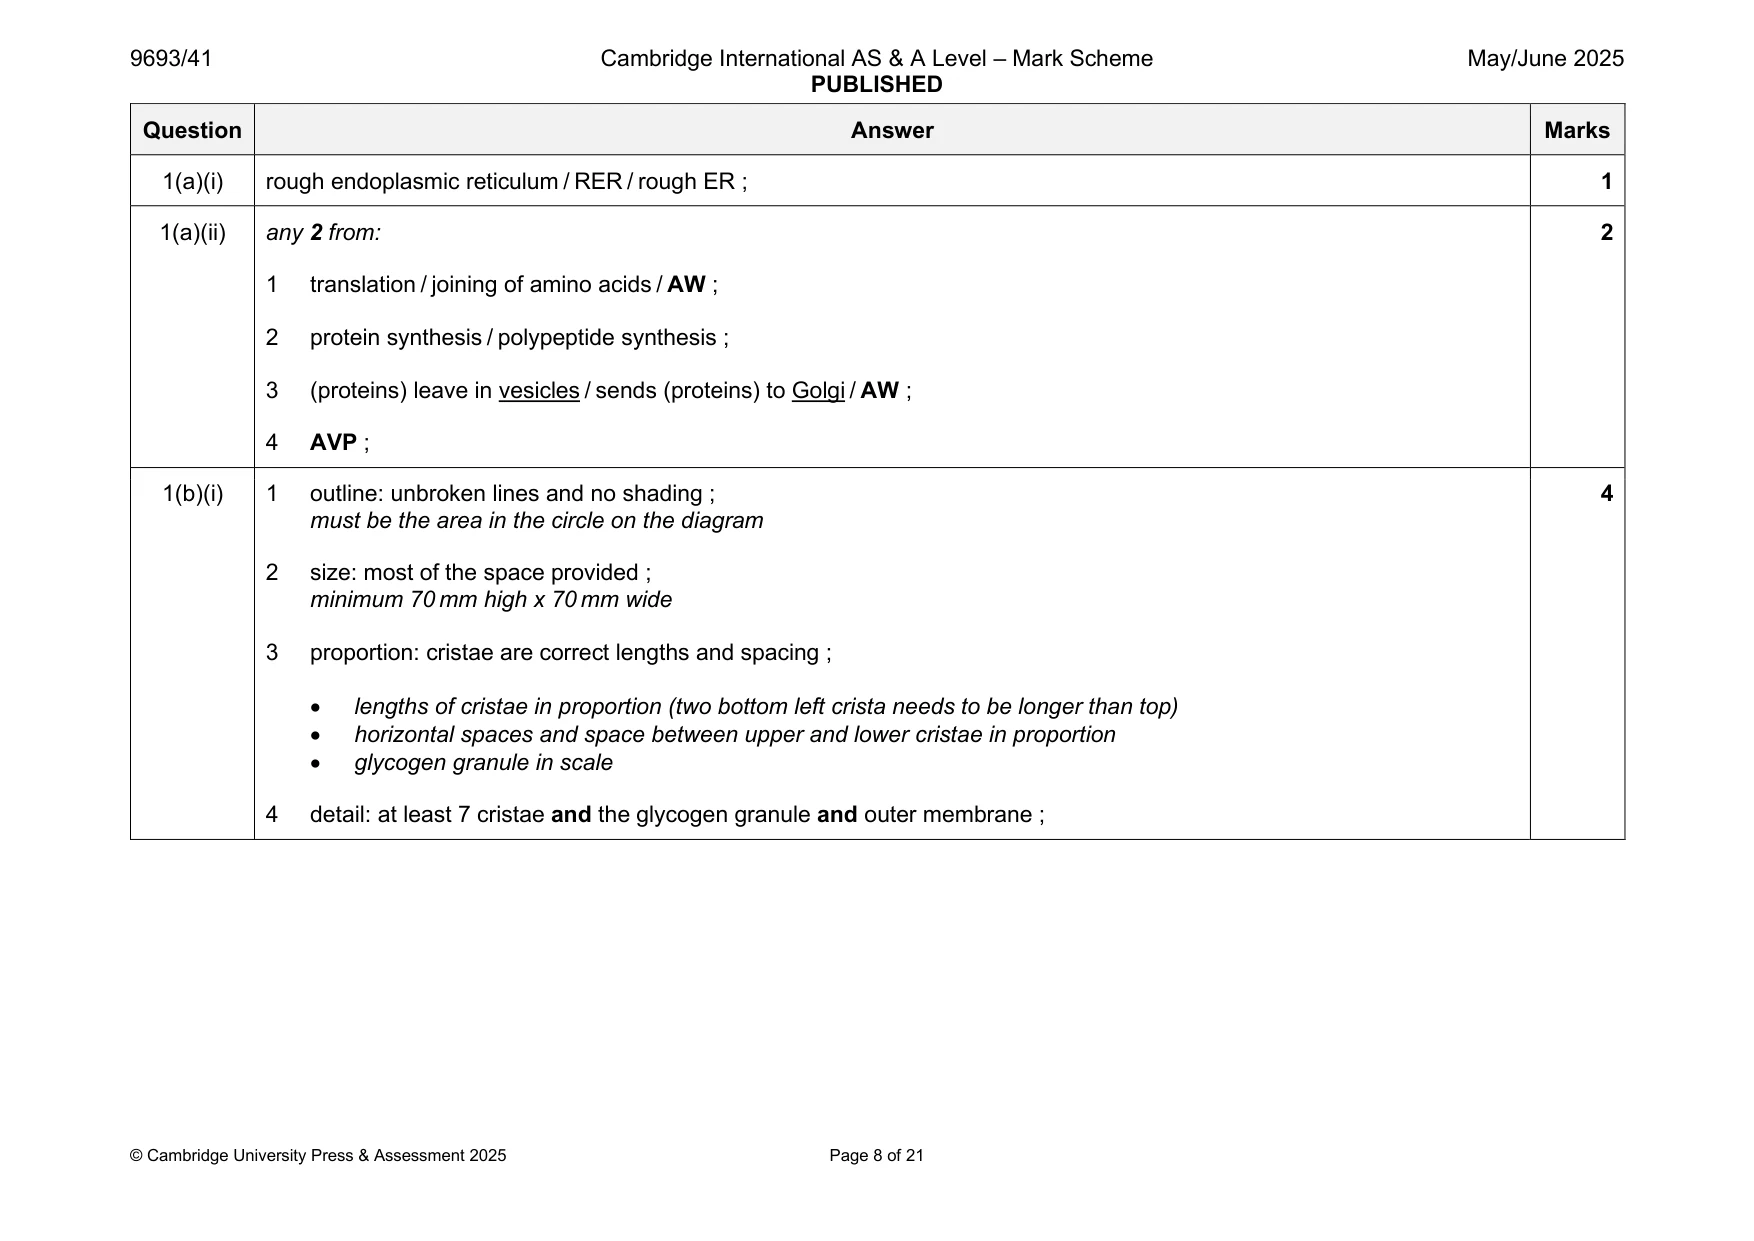
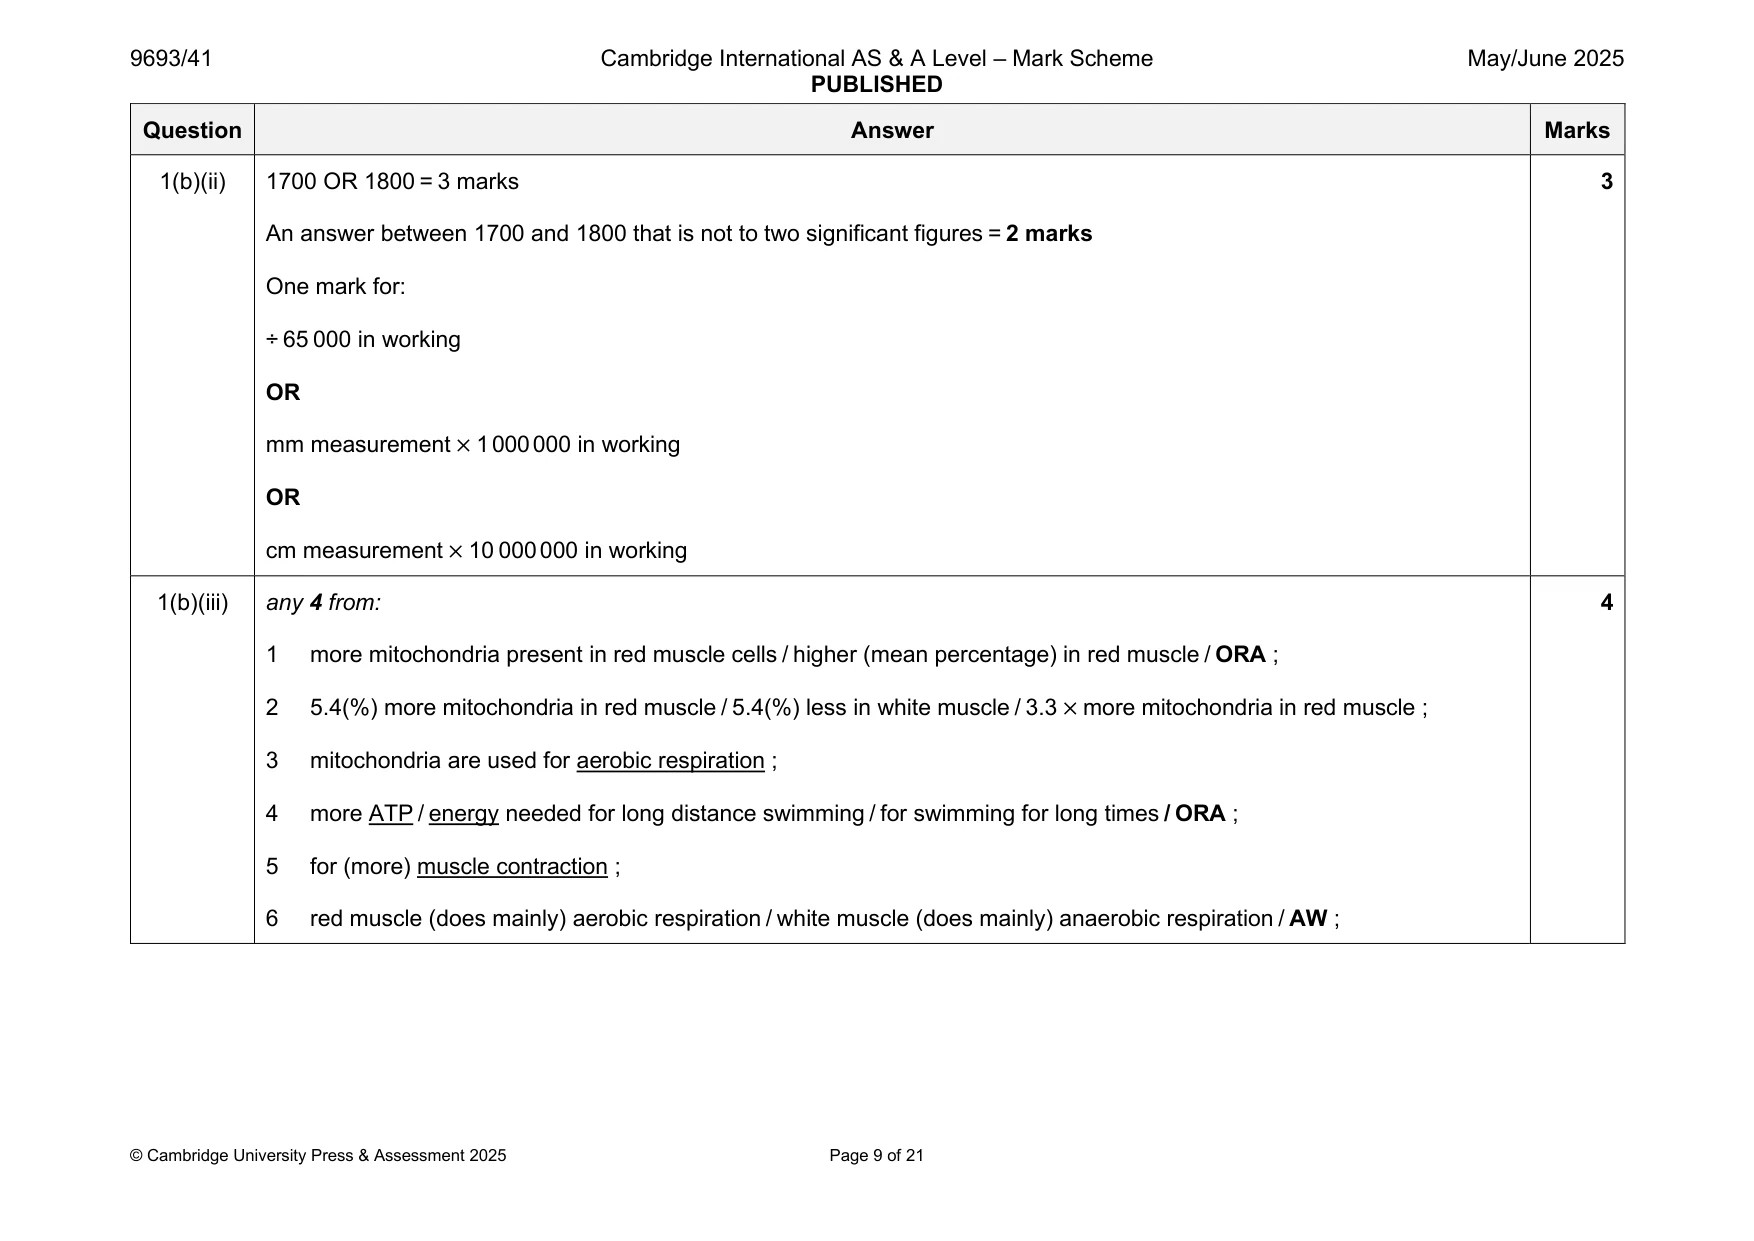
Mark scheme: Question Answer Marks 1(a)(i) rough endoplasmic reticulum / RER / rough ER ; 1 1(a)(ii) any 2 from: 2 1 translation / joining of amino acids / AW ; 2 protein synthesis / polypeptide synthesis ; 3 (proteins) leave in vesicles / sends (proteins) to Golgi / AW ; 4 AVP ; 1(b)(i) 1 outline: unbroken lines and no shading ; 4 must be the area in the circle on the diagram 2 size: most of the space provided ; minimum 70 mm high x 70 mm wide 3 proportion: cristae are correct lengths and spacing ; • lengths of cristae in proportion (two bottom left crista needs to be longer than top) • horizontal spaces and space between upper and lower cristae in proportion • glycogen granule in scale 4 detail: at least 7 cristae and the glycogen granule and outer membrane ; 1(b)(ii) 1700 OR 1800 = 3 marks 3 An answer between 1700 and 1800 that is not to two significant figures = 2 marks One mark for: ÷ 65 000 in working OR mm measurement × 1 000 000 in working OR cm measurement × 10 000 000 in working 1(b)(iii) any 4 from: 4 1 more mitochondria present in red muscle cells / higher (mean percentage) in red muscle / ORA ; 2 5.4(%) more mitochondria in red muscle / 5.4(%) less in white muscle / 3.3 × more mitochondria in red muscle ; 3 mitochondria are used for aerobic respiration ; 4 more ATP / energy needed for long distance swimming / for swimming for long times / ORA ; 5 for (more) muscle contraction ; 6 red muscle (does mainly) aerobic respiration / white muscle (does mainly) anaerobic respiration / AW ;
Q2 · Endoriftia bacteria fix carbon by chemosynthesis
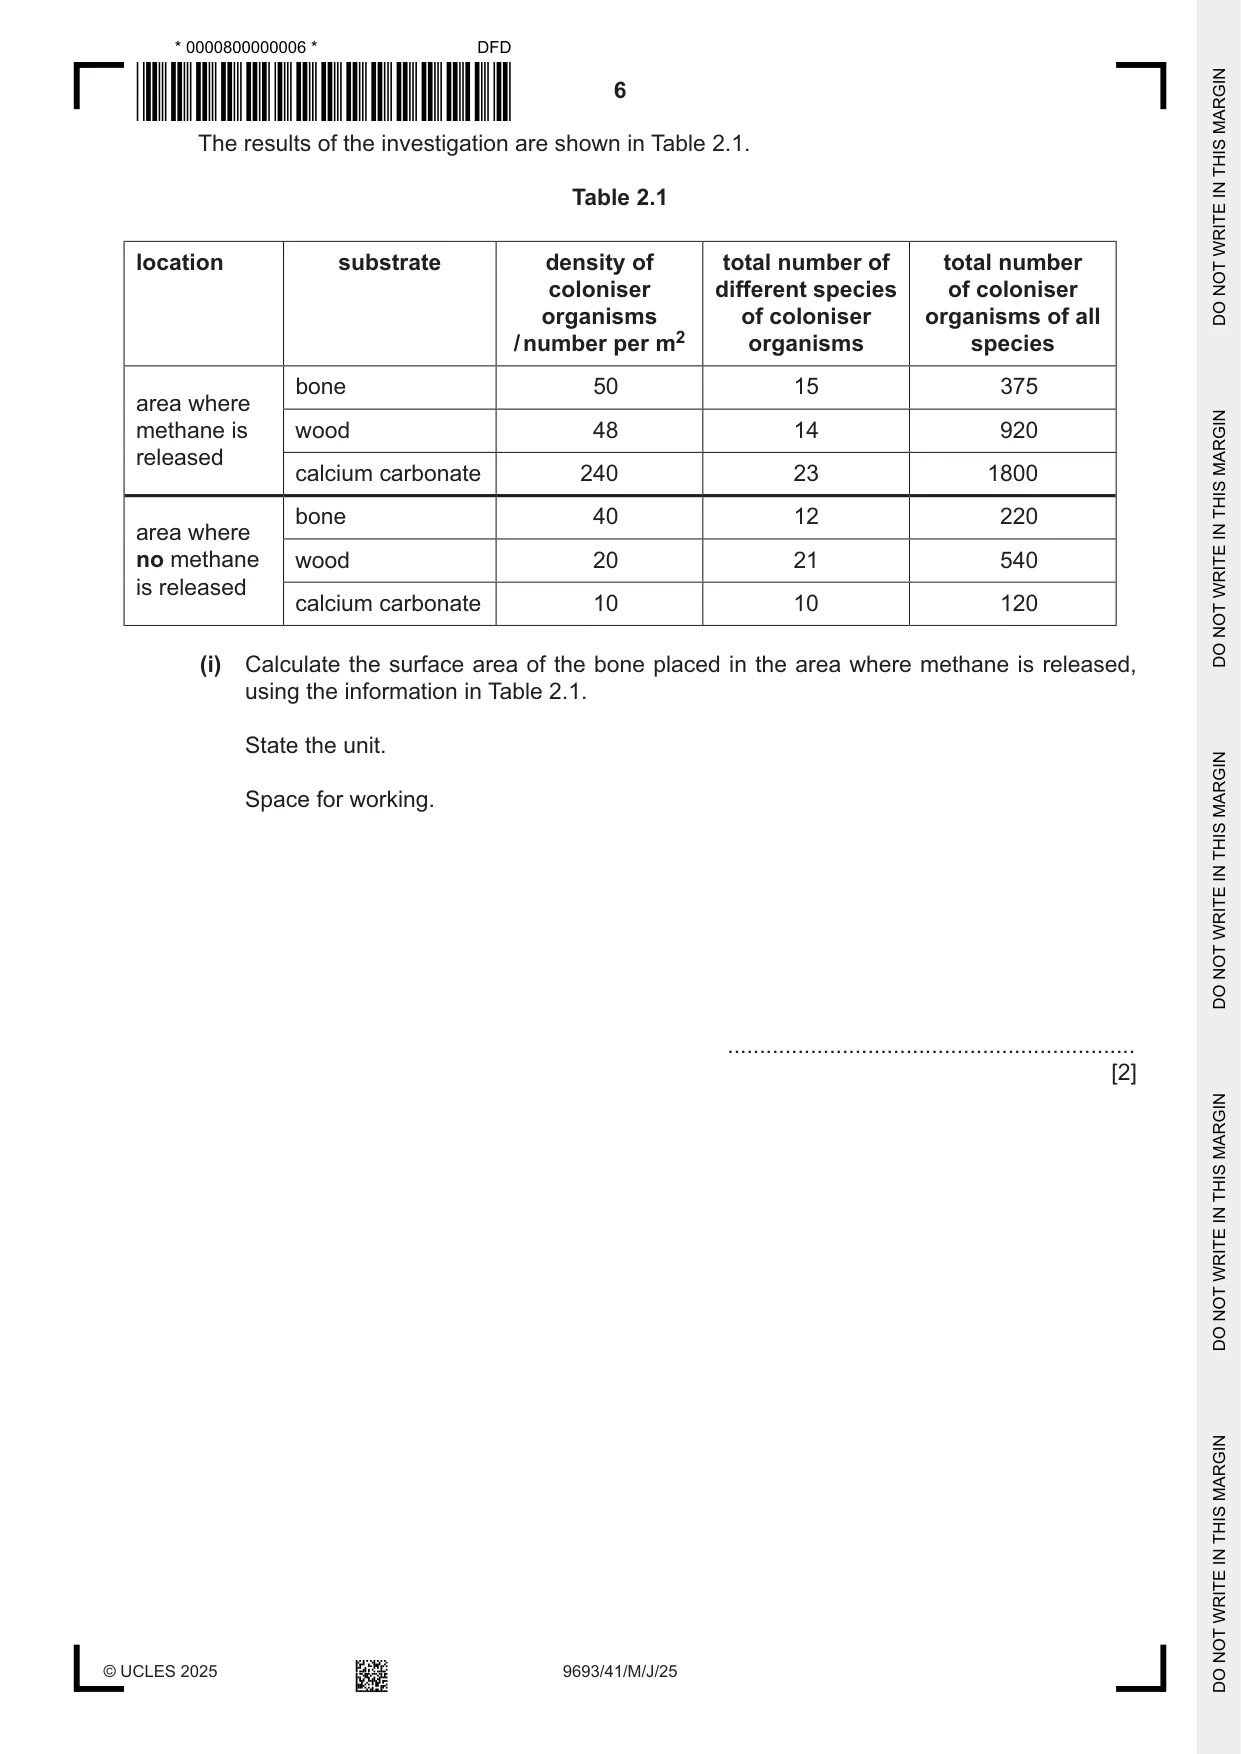
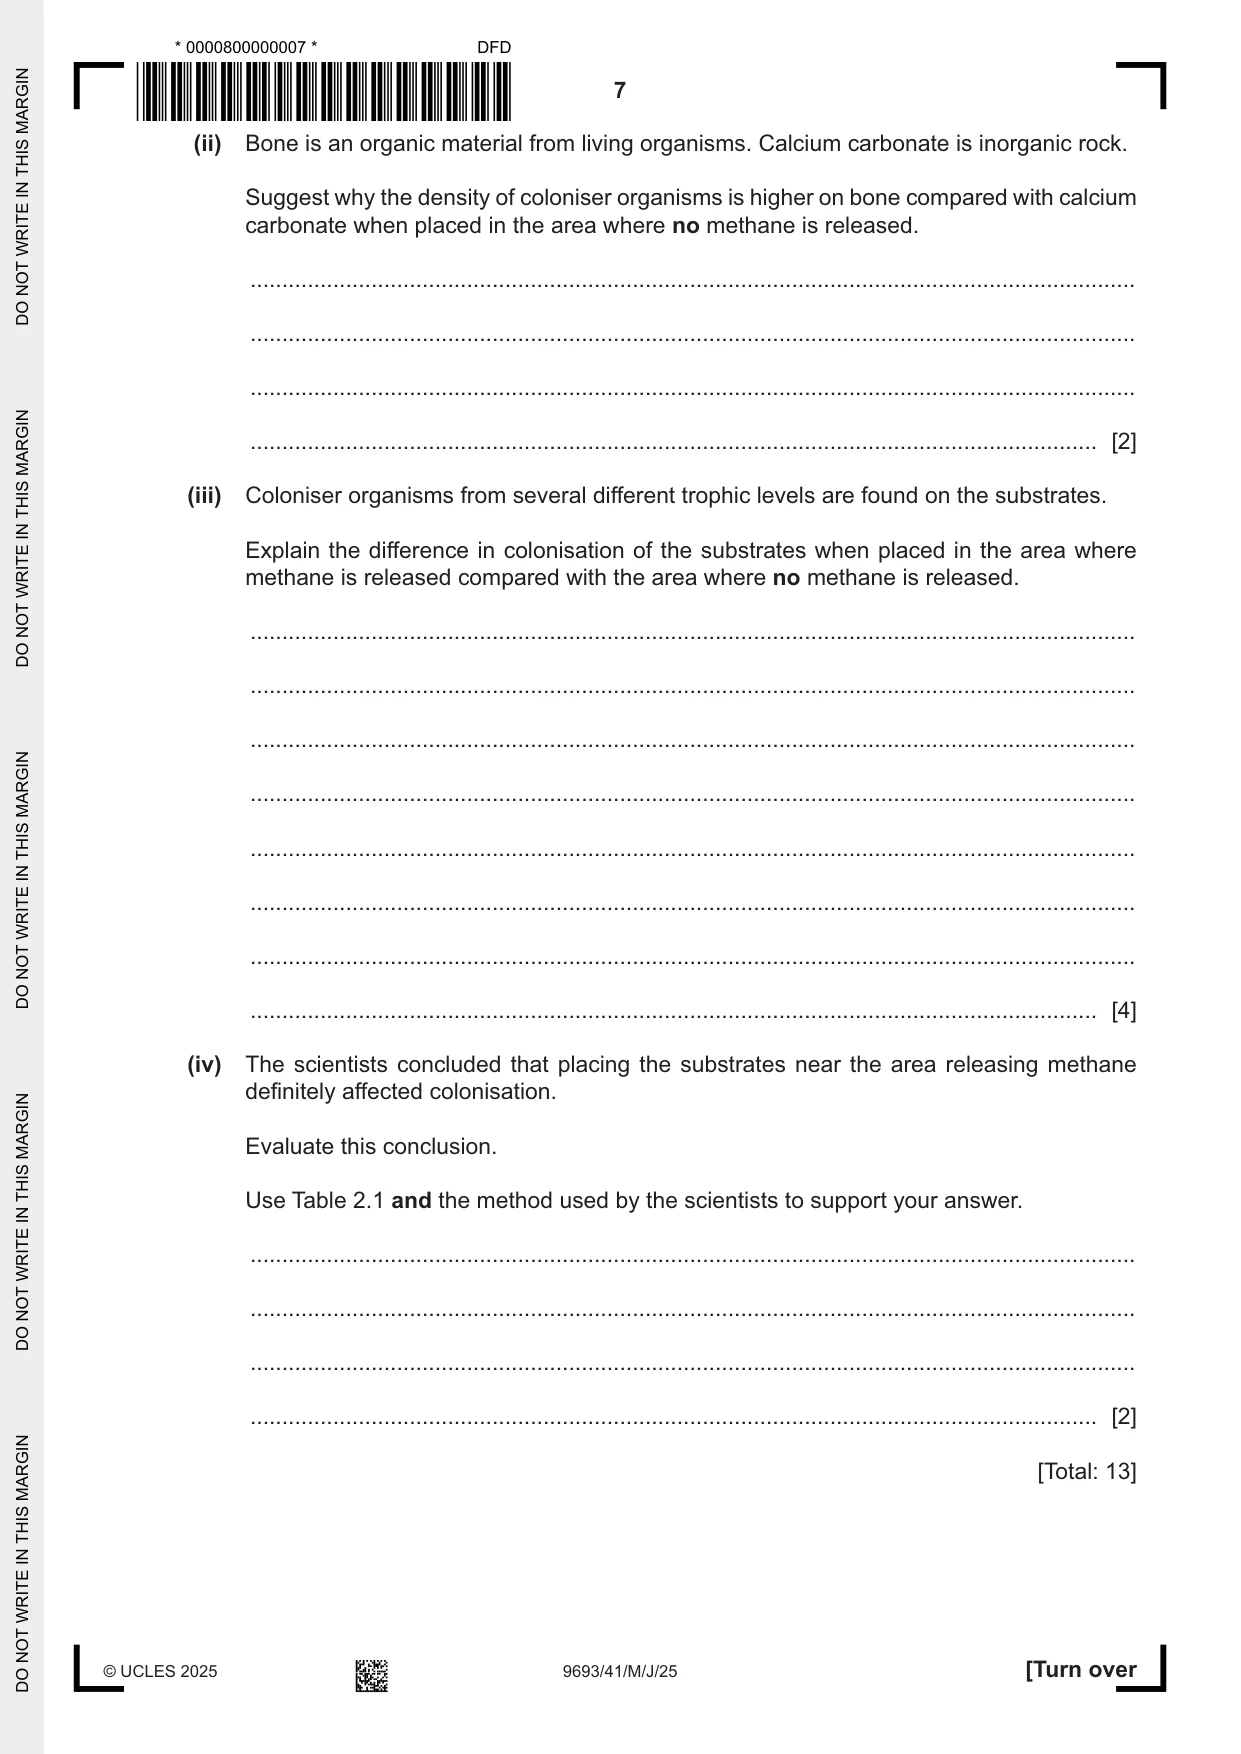
2 Endoriftia bacteria fix carbon by chemosynthesis. Endoriftia bacteria live inside giant tubeworms, Riftia. (a) Describe the relationship between Riftia and Endoriftia. ................................................................................................................................................... ................................................................................................................................................... ................................................................................................................................................... ................................................................................................................................................... ................................................................................................................................................... ............................................................................................................................................. [3] (b) Other species of bacteria can also fix carbon by chemosynthesis. Some of these species of bacteria live in areas of the seabed where methane gas is released into the water. These bacteria are often the start of food chains. Scientists investigated the colonisation of different types of substrates by organisms, using the following method. • They placed a piece of bone, wood and calcium carbonate rock at depths of 1000 m in an area where methane is released from the seabed. • They placed another piece of bone, wood and calcium carbonate rock at depths of 1000 m in an area where no methane is released. • After seven years, they determined the density of coloniser organisms, the total number of different species of coloniser organisms, and the total number of coloniser organisms of all species present on each substrate. The results of the investigation are shown in Table 2.1. Table 2.1 location substrate density of total number of total number coloniser different species of coloniser organisms of coloniser organisms of all / number per m2 organisms species bone 50 15 375 area where methane is wood 48 14 920 released calcium carbonate 240 23 1800 bone 40 12 220 area where no methane wood 20 21 540 is released calcium carbonate 10 10 120 (i) Calculate the surface area of the bone placed in the area where methane is released, using the information in Table 2.1. State the unit. Space for working. ................................................................ [2] (ii) Bone is an organic material from living organisms. Calcium carbonate is inorganic rock. Suggest why the density of coloniser organisms is higher on bone compared with calcium carbonate when placed in the area where no methane is released. ........................................................................................................................................... ........................................................................................................................................... ........................................................................................................................................... ..................................................................................................................................... [2] (iii) Coloniser organisms from several different trophic levels are found on the substrates. Explain the difference in colonisation of the substrates when placed in the area where methane is released compared with the area where no methane is released. ........................................................................................................................................... ........................................................................................................................................... ........................................................................................................................................... ........................................................................................................................................... ........................................................................................................................................... ........................................................................................................................................... ........................................................................................................................................... ..................................................................................................................................... [4] (iv) The scientists concluded that placing the substrates near the area releasing methane definitely affected colonisation. Evaluate this conclusion. Use Table 2.1 and the method used by the scientists to support your answer. ........................................................................................................................................... ........................................................................................................................................... ........................................................................................................................................... ..................................................................................................................................... [2] [Total: 13]
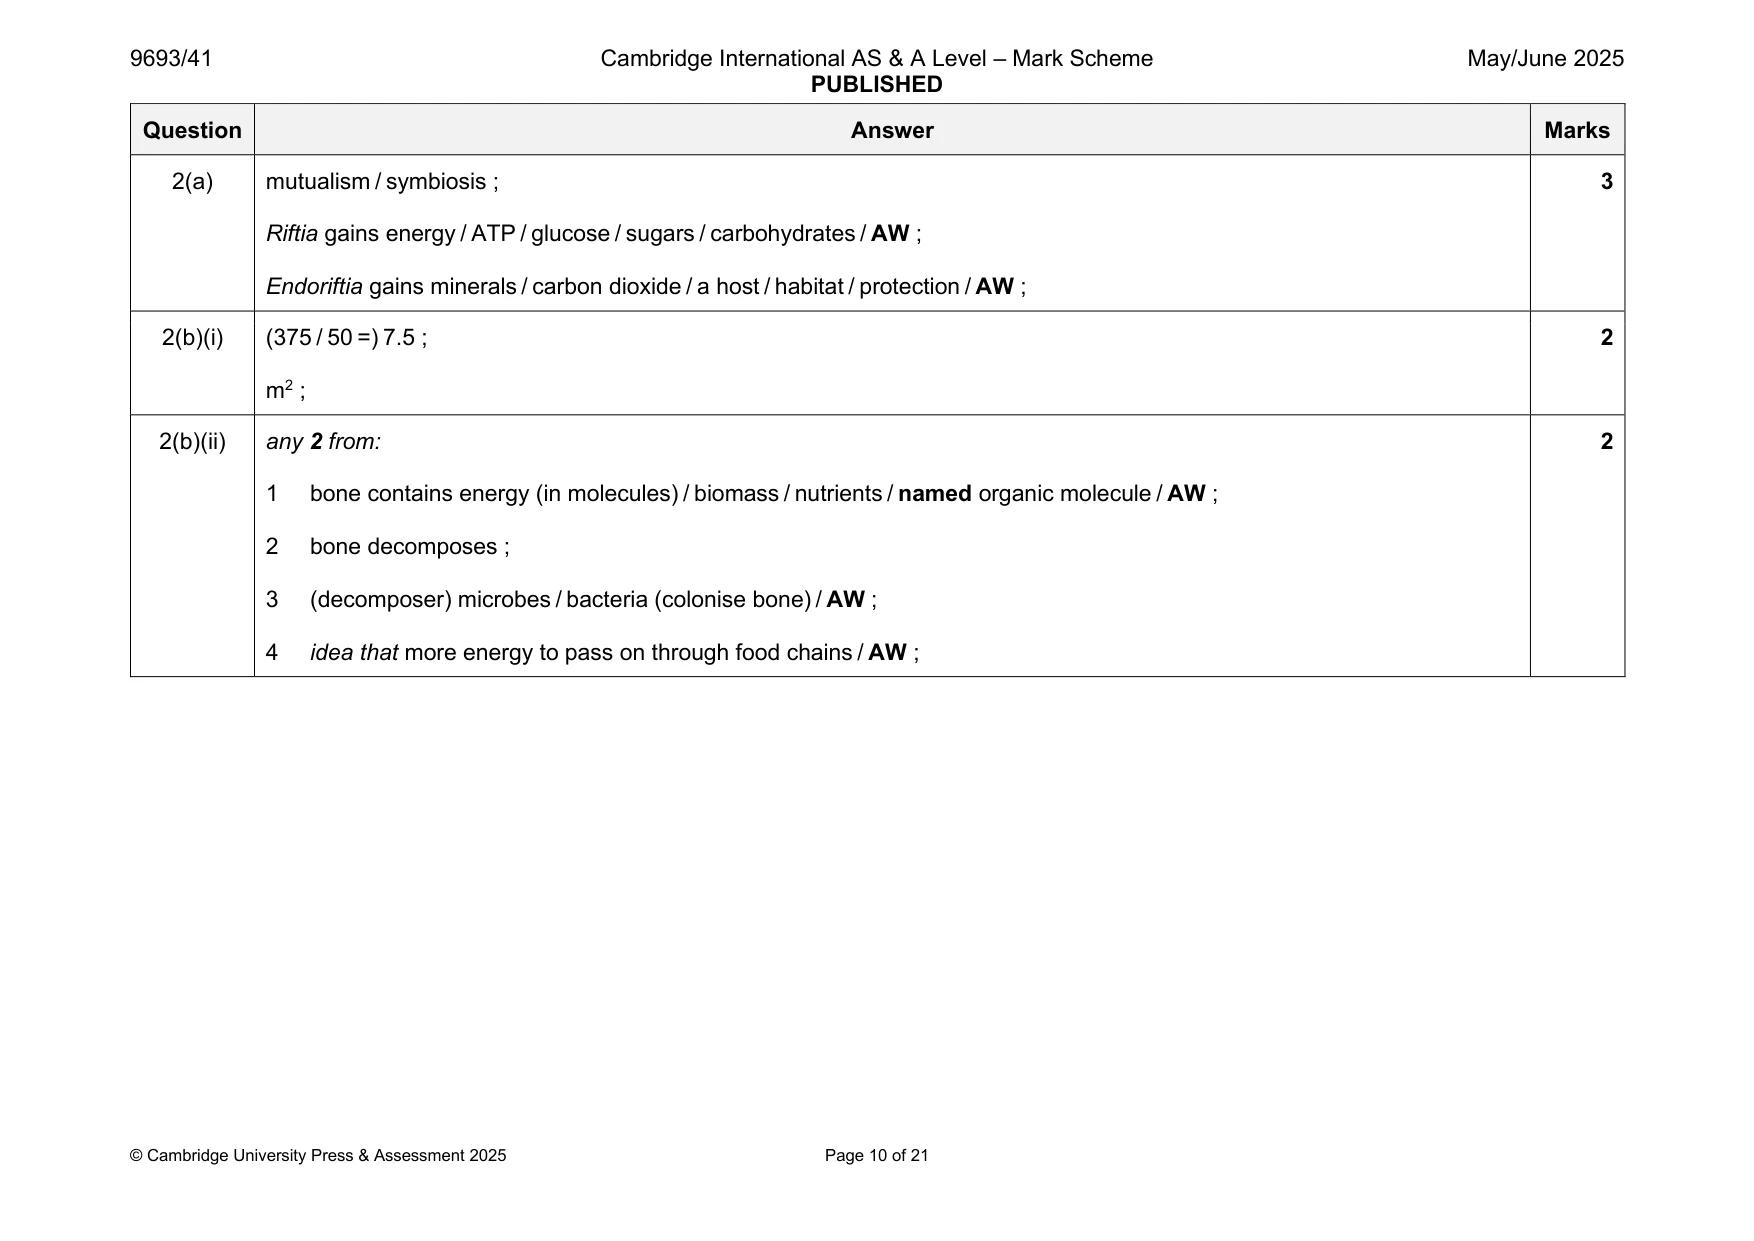
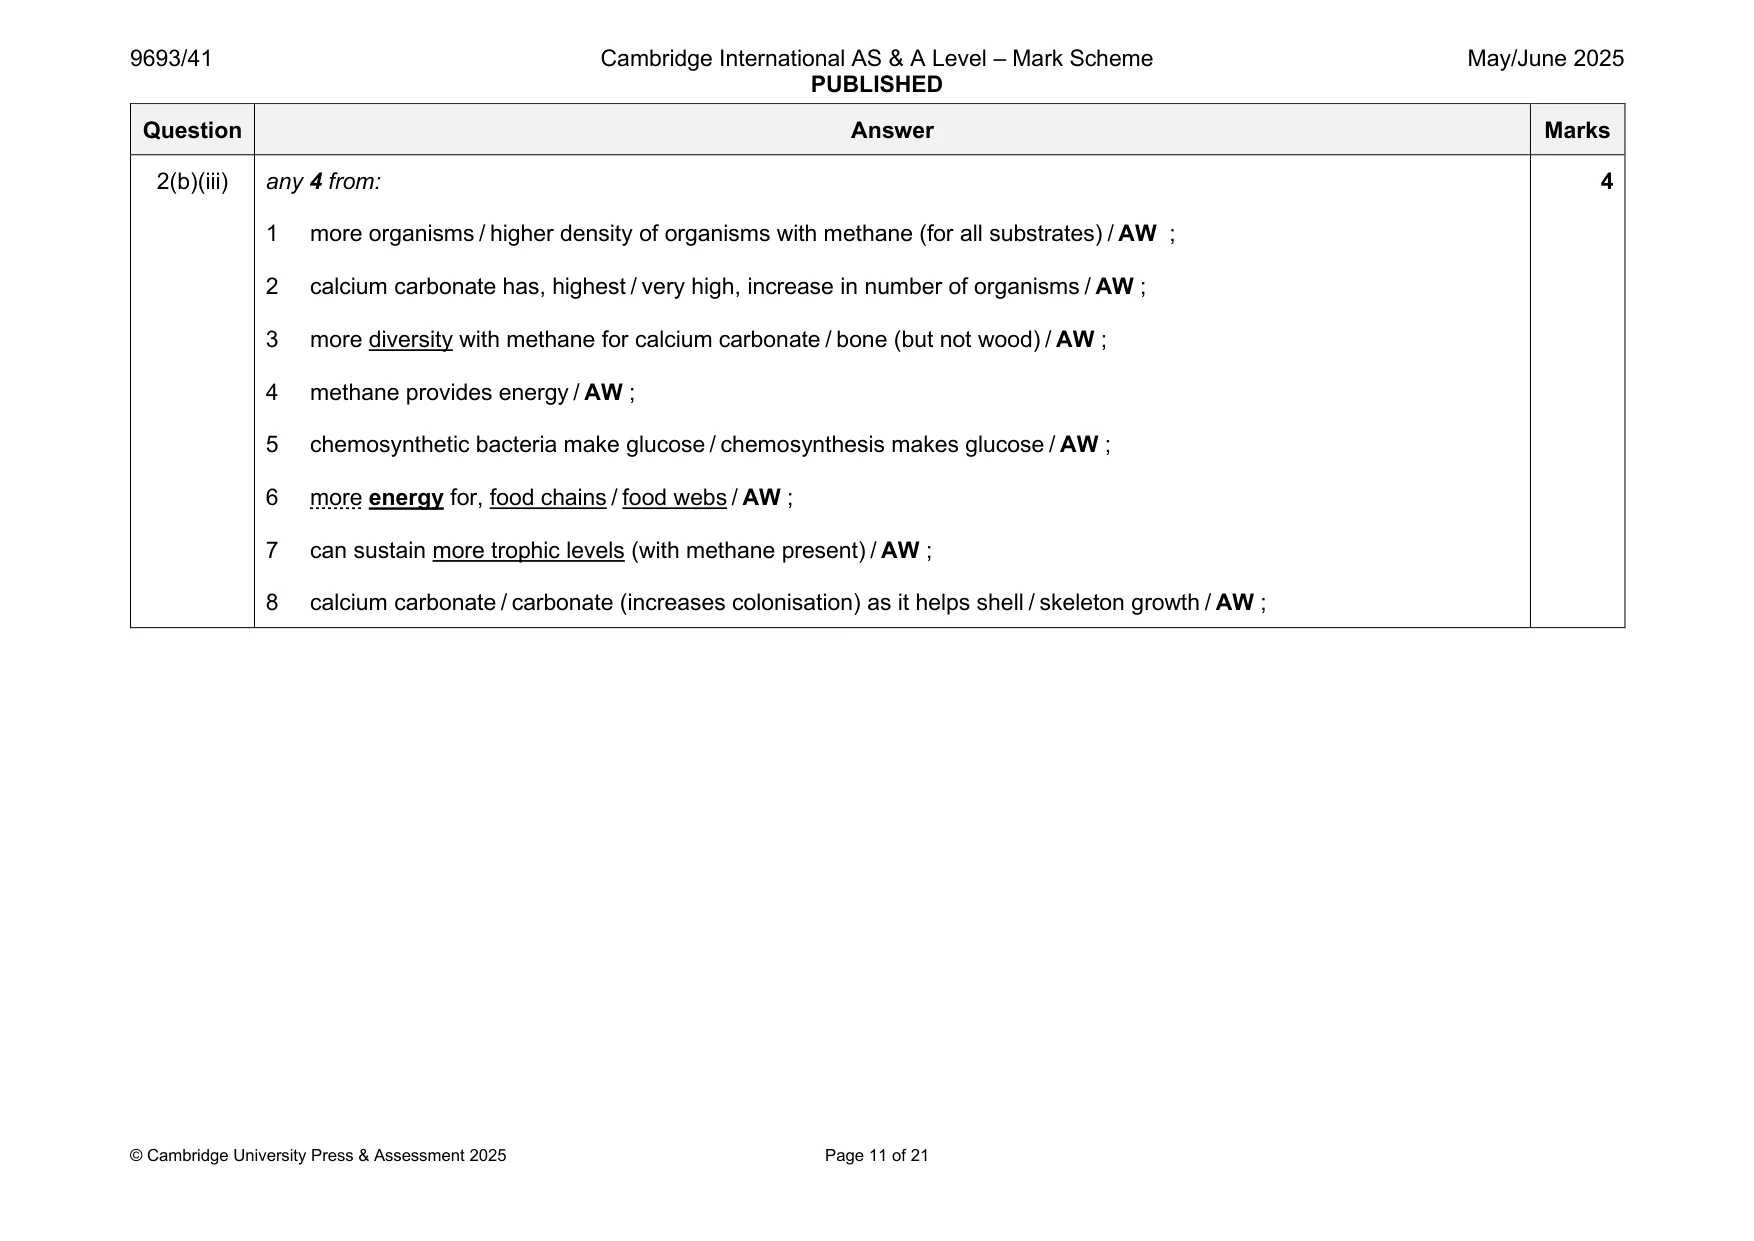
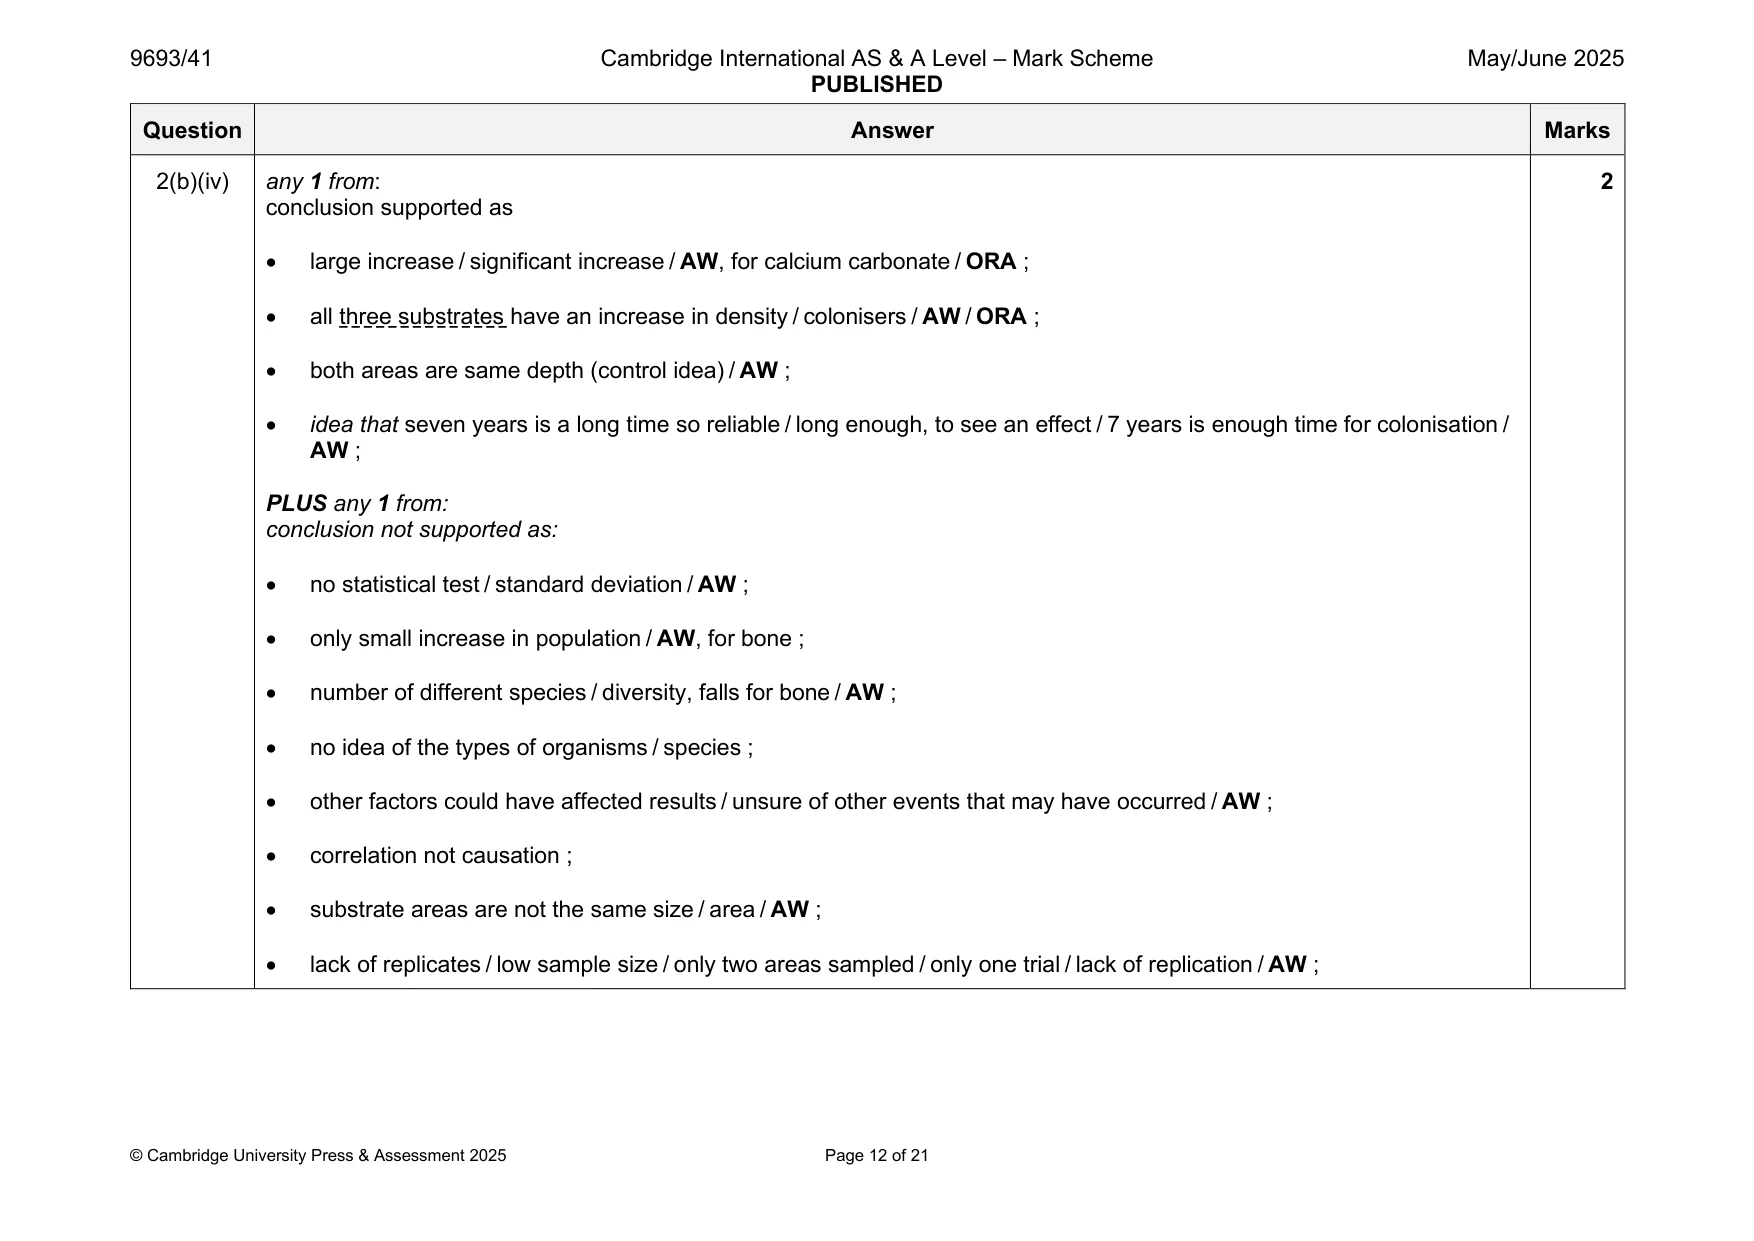
Mark scheme: 2(a) mutualism / symbiosis ; 3 Riftia gains energy / ATP / glucose / sugars / carbohydrates / AW ; Endoriftia gains minerals / carbon dioxide / a host / habitat / protection / AW ; 2(b)(i) (375 / 50 =) 7.5 ; 2 m2 ; 2(b)(ii) any 2 from: 2 1 bone contains energy (in molecules) / biomass / nutrients / named organic molecule / AW ; 2 bone decomposes ; 3 (decomposer) microbes / bacteria (colonise bone) / AW ; 4 idea that more energy to pass on through food chains / AW ; 2(b)(iii) any 4 from: 4 1 more organisms / higher density of organisms with methane (for all substrates) / AW ; 2 calcium carbonate has, highest / very high, increase in number of organisms / AW ; 3 more diversity with methane for calcium carbonate / bone (but not wood) / AW ; 4 methane provides energy / AW ; 5 chemosynthetic bacteria make glucose / chemosynthesis makes glucose / AW ; 6 more energy for, food chains / food webs / AW ; 7 can sustain more trophic levels (with methane present) / AW ; 8 calcium carbonate / carbonate (increases colonisation) as it helps shell / skeleton growth / AW ; 2(b)(iv) any 1 from: 2 conclusion supported as • large increase / significant increase / AW, for calcium carbonate / ORA ; • all three substrates have an increase in density / colonisers / AW / ORA ; • both areas are same depth (control idea) / AW ; • idea that seven years is a long time so reliable / long enough, to see an effect / 7 years is enough time for colonisation / AW ; PLUS any 1 from: conclusion not supported as: • no statistical test / standard deviation / AW ; • only small increase in population / AW, for bone ; • number of different species / diversity, falls for bone / AW ; • no idea of the types of organisms / species ; • other factors could have affected results / unsure of other events that may have occurred / AW ; • correlation not causation ; • substrate areas are not the same size / area / AW ; • lack of replicates / low sample size / only two areas sampled / only one trial / lack of replication / AW ;
Q3 · Oysters are shelled molluscs that have a complex life cycle
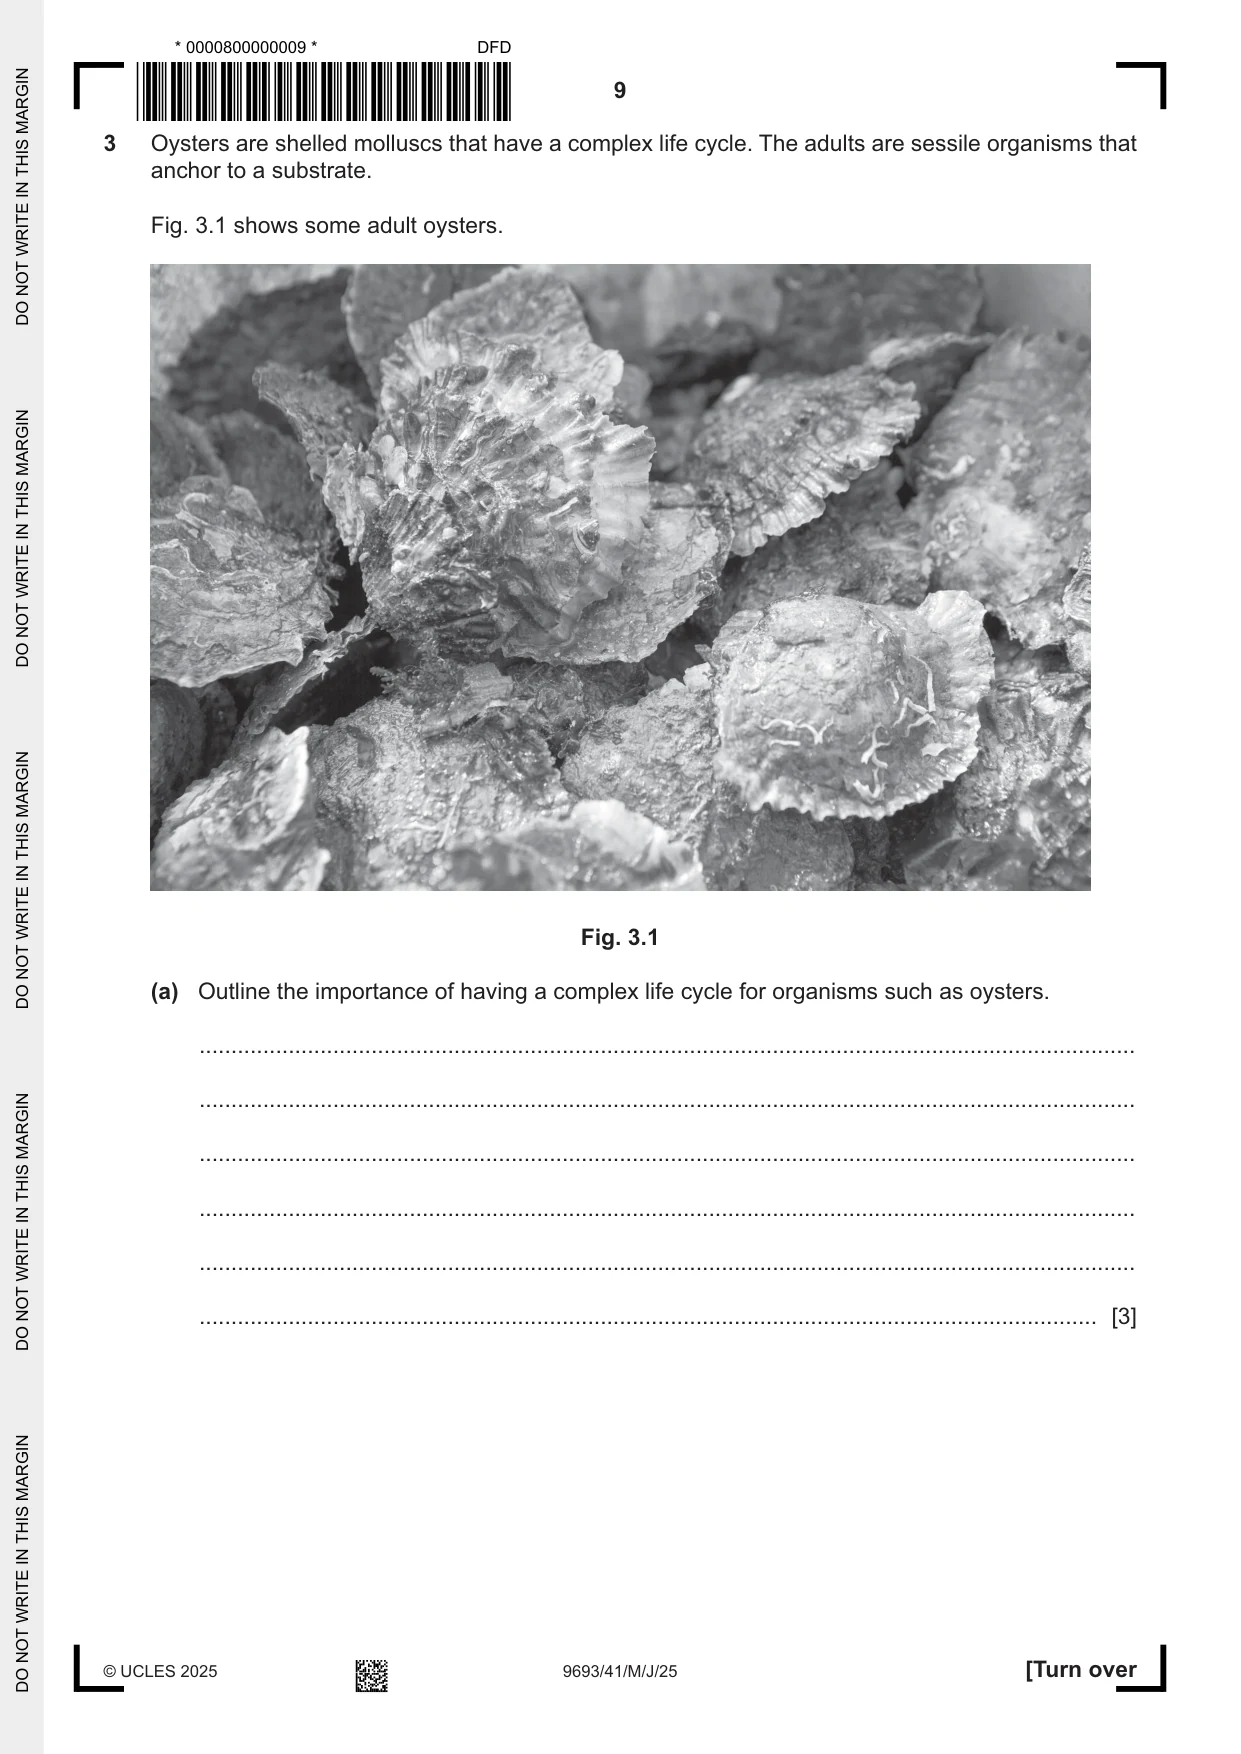
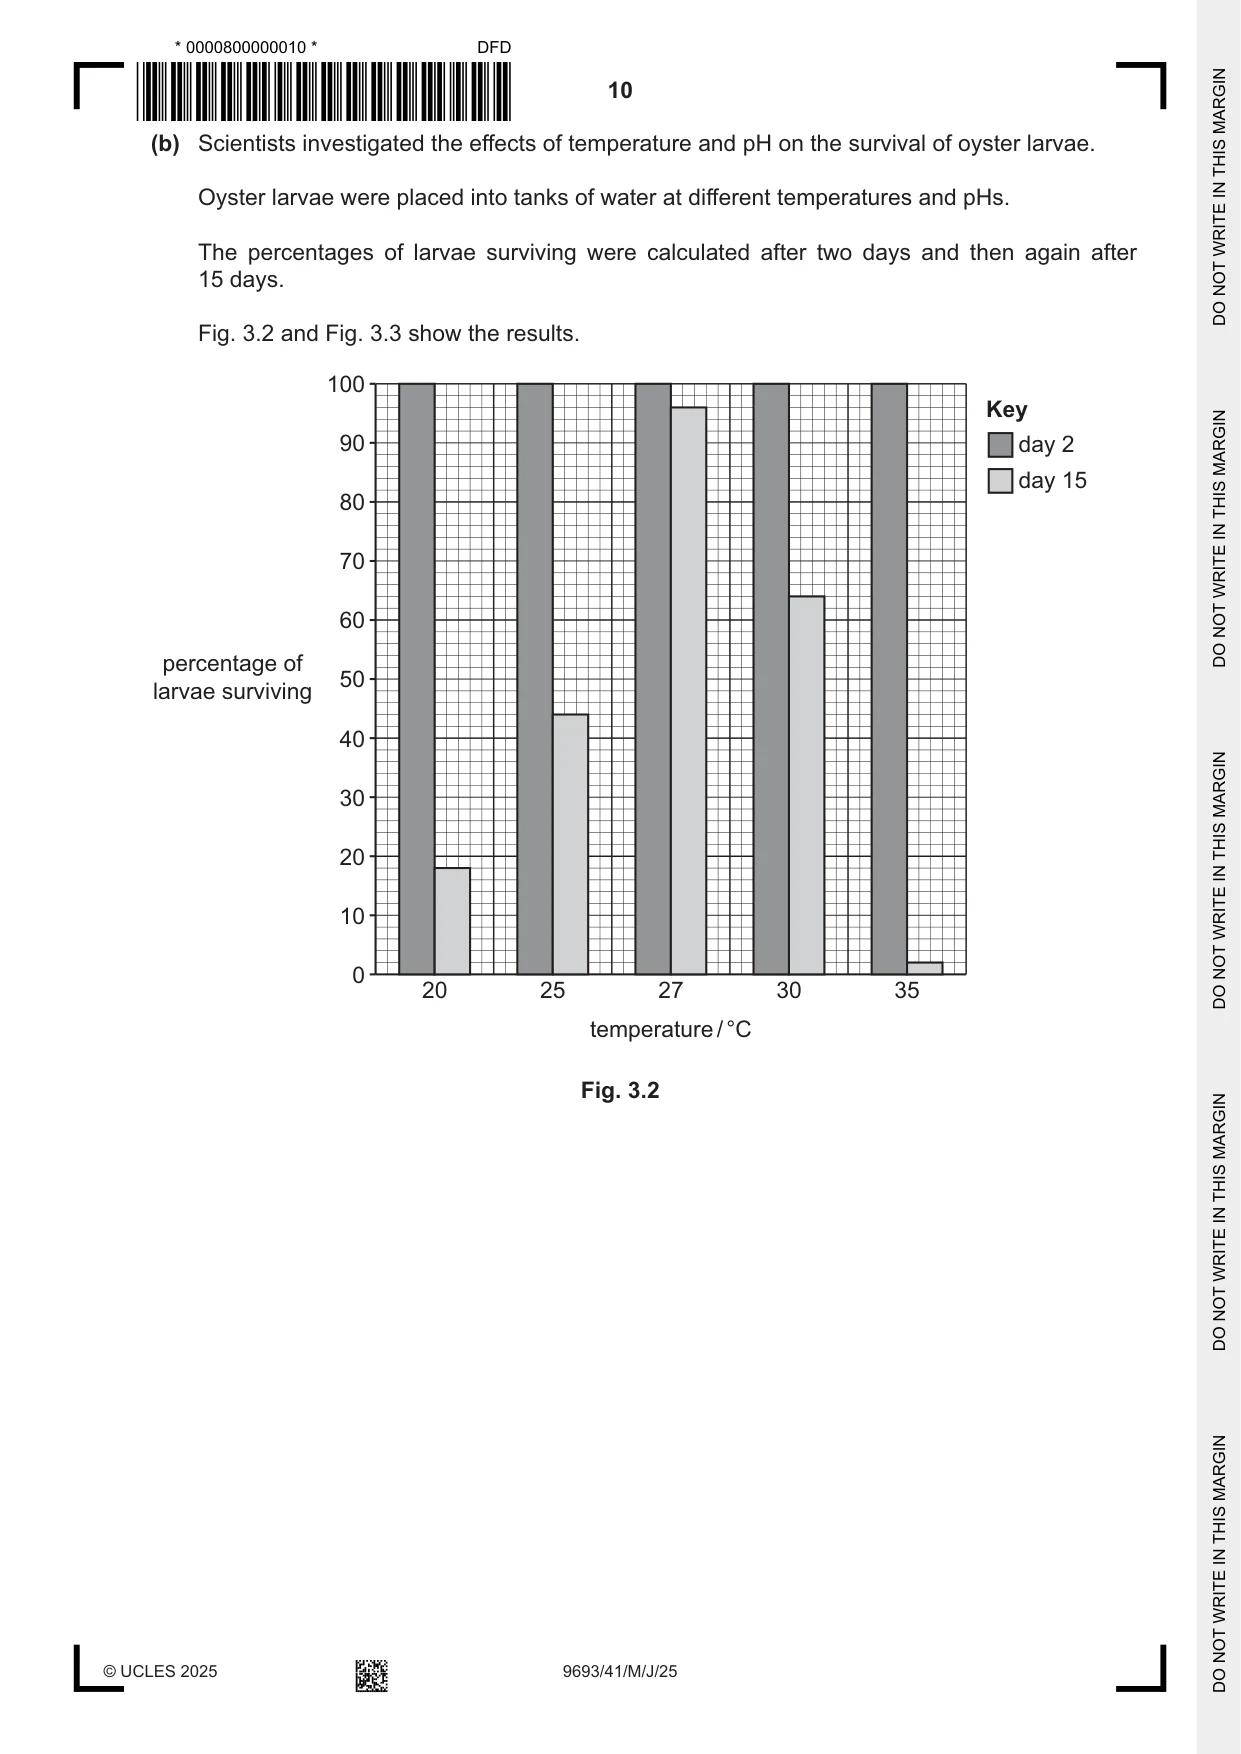
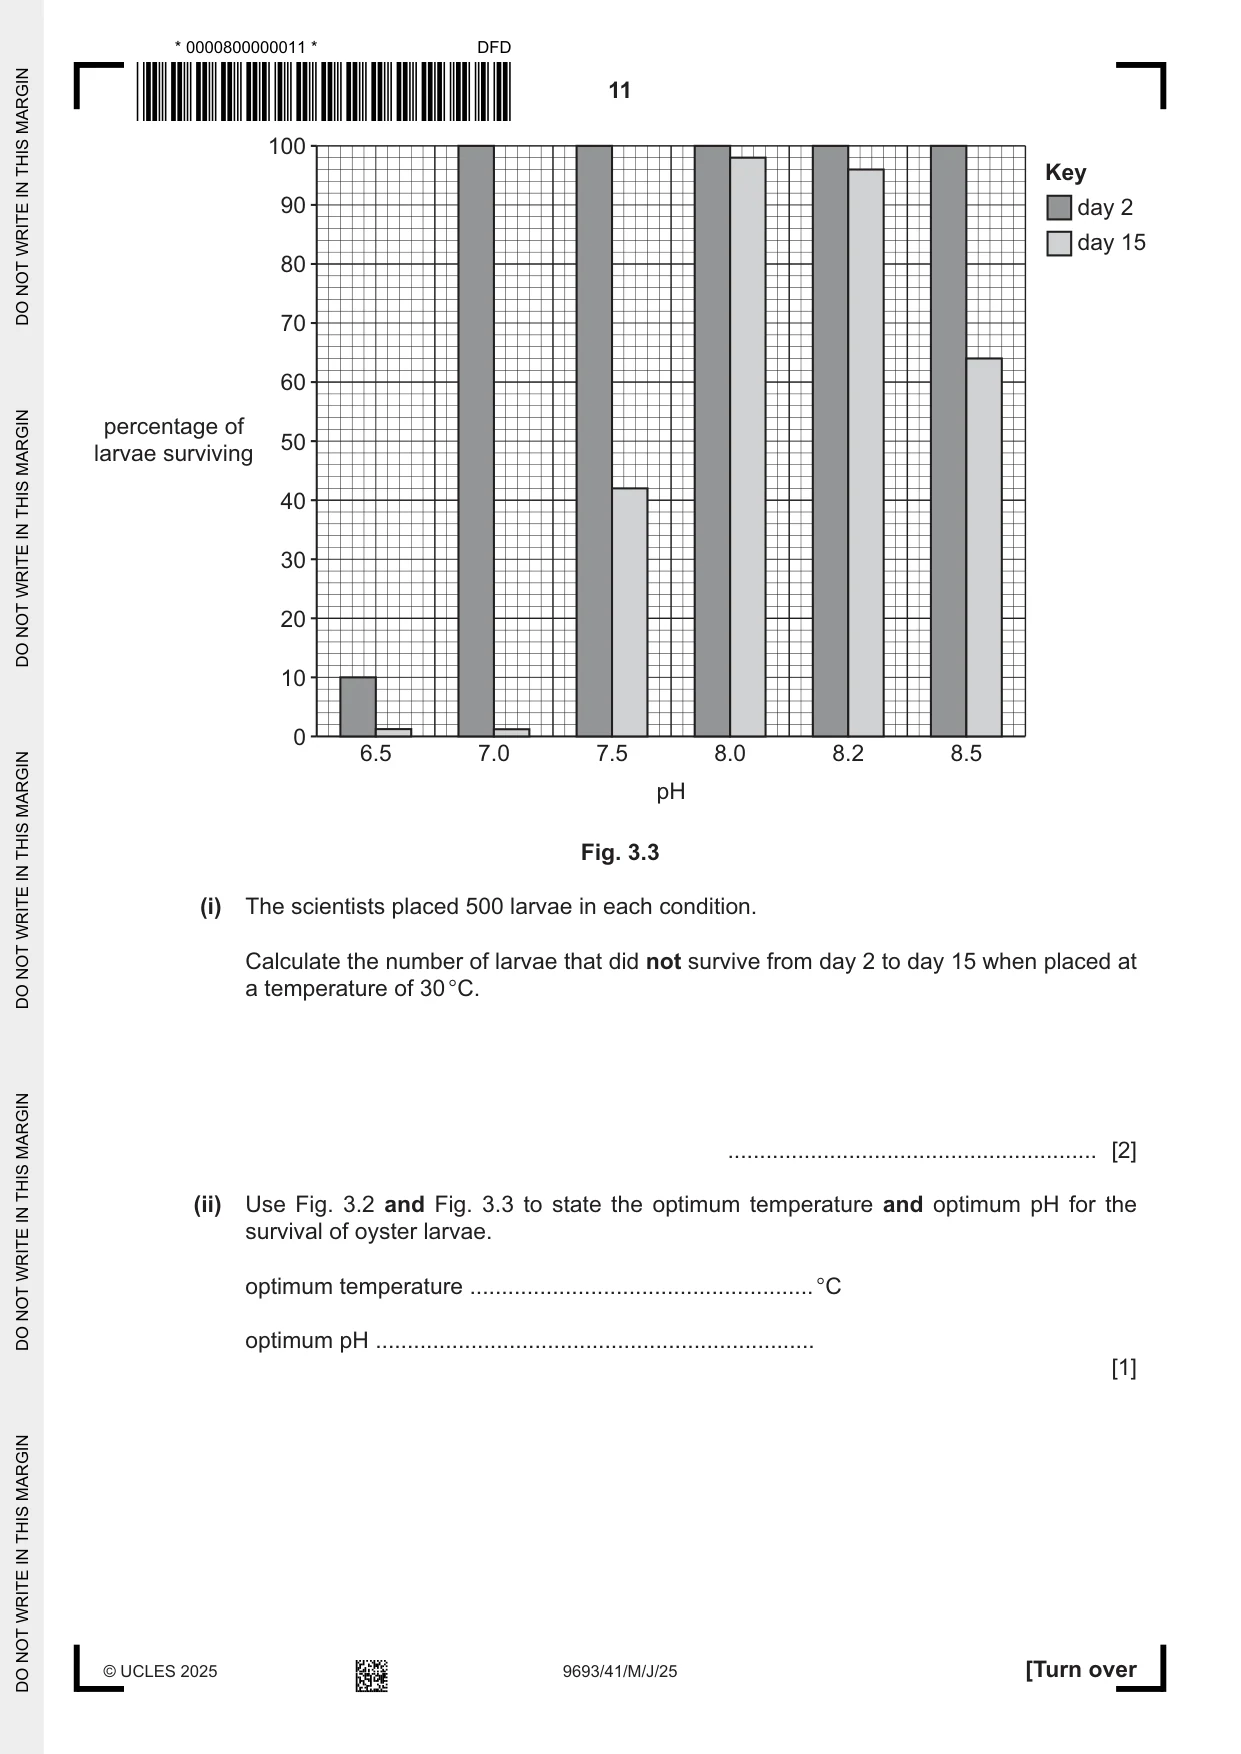
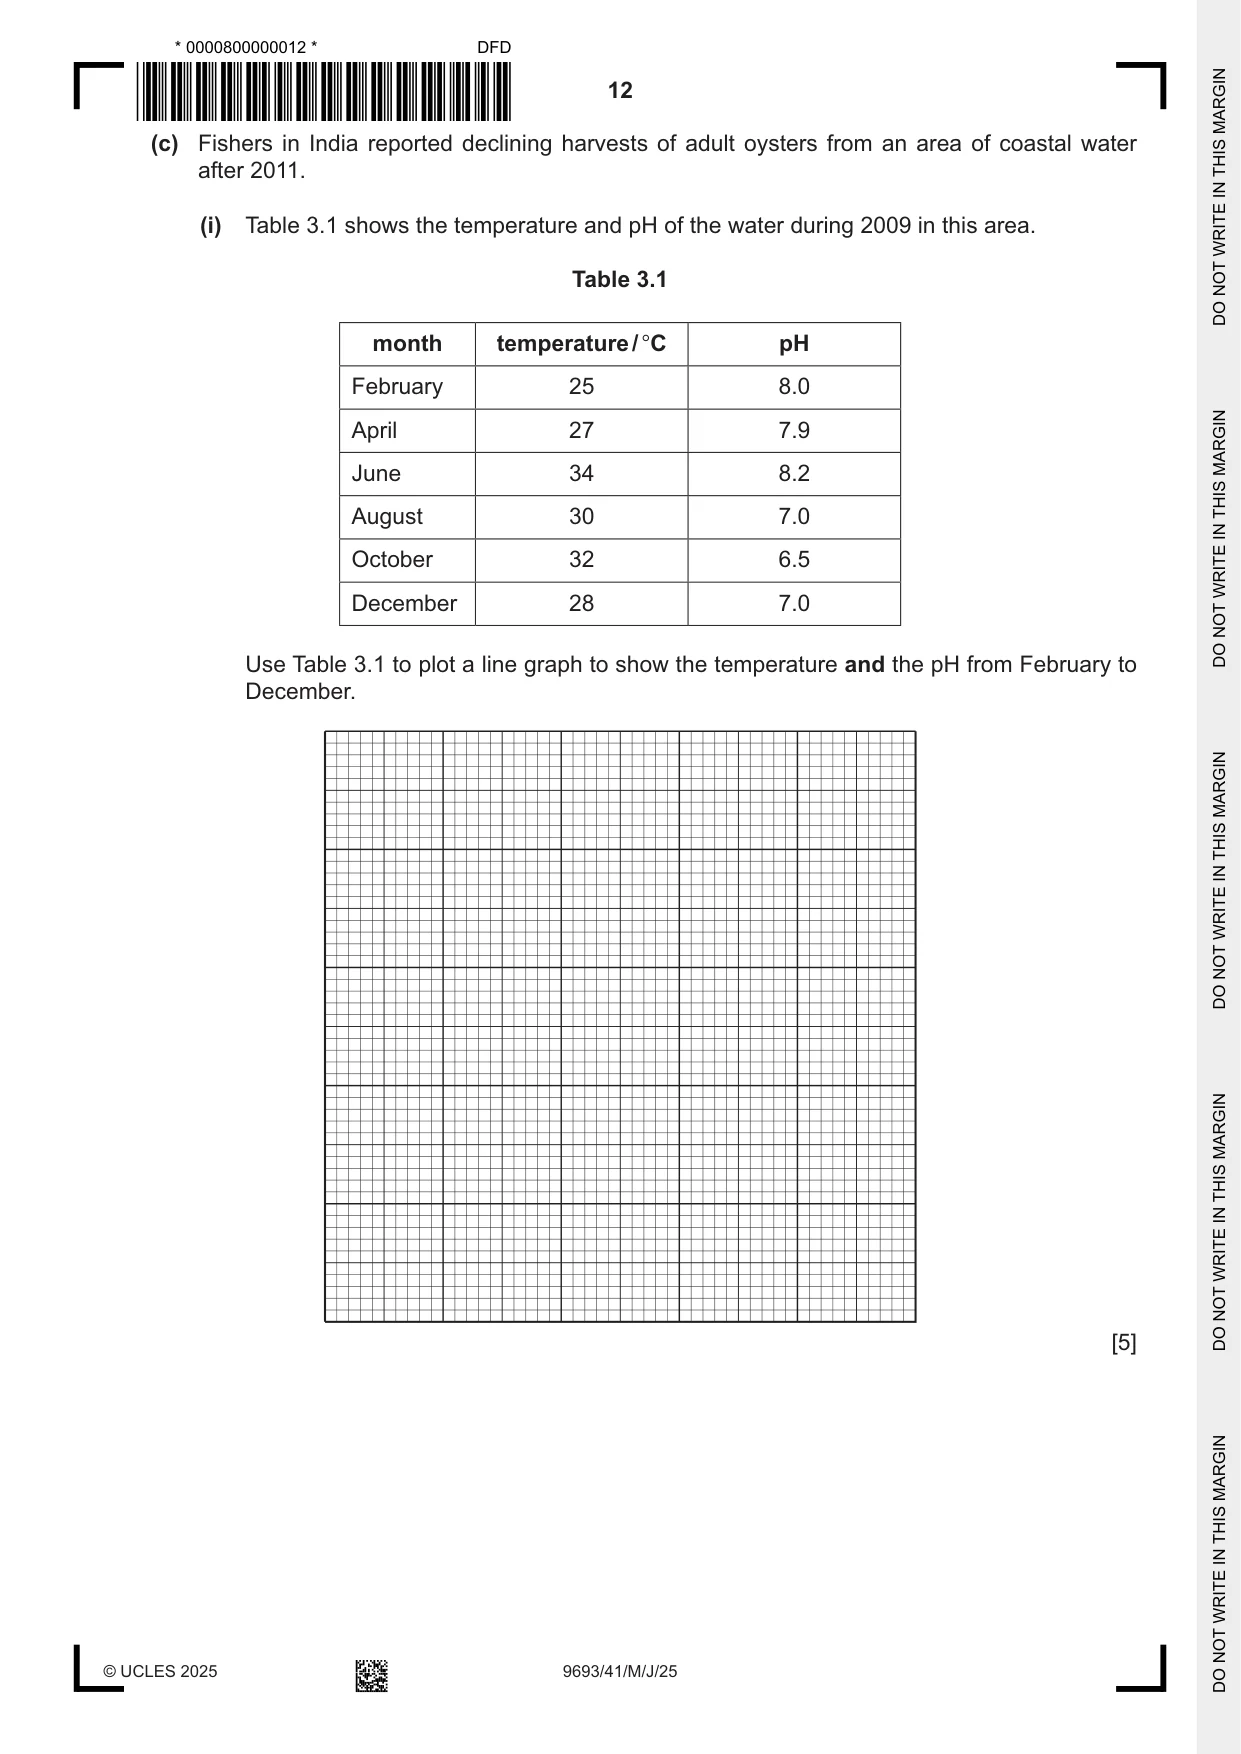
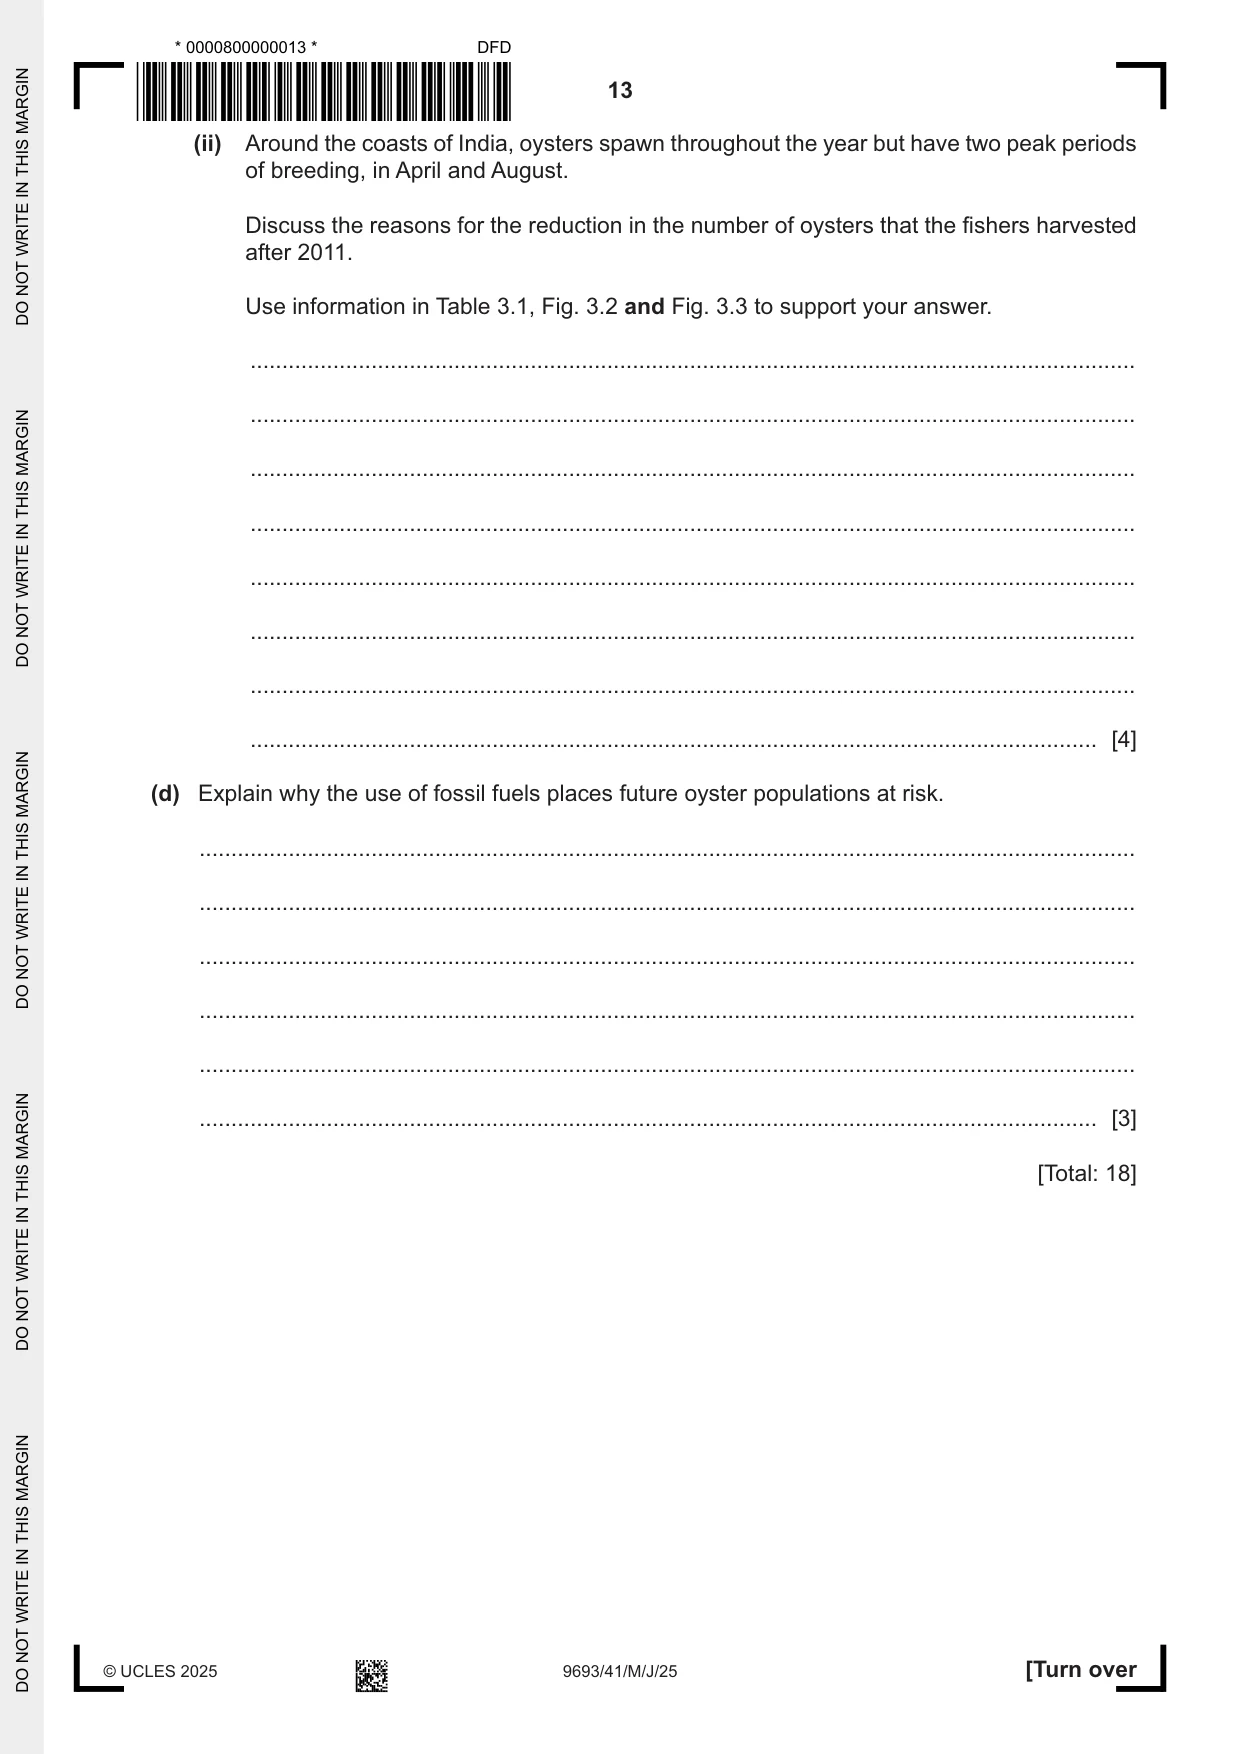
3 Oysters are shelled molluscs that have a complex life cycle. The adults are sessile organisms that anchor to a substrate. Fig. 3.1 shows some adult oysters. Fig. 3.1 (a) Outline the importance of having a complex life cycle for organisms such as oysters. ................................................................................................................................................... ................................................................................................................................................... ................................................................................................................................................... ................................................................................................................................................... ................................................................................................................................................... ............................................................................................................................................. [3] (b) Scientists investigated the effects of temperature and pH on the survival of oyster larvae. Oyster larvae were placed into tanks of water at different temperatures and pHs. The percentages of larvae surviving were calculated after two days and then again after 15 days. Fig. 3.2 and Fig. 3.3 show the results. 100 Key 90 day 2 day 15 80 70 60 percentage of 50 larvae surviving 40 30 20 10 0 20 25 27 30 35 temperature / °C Fig. 3.2 100 Key 90 day 2 day 15 80 70 60 percentage of 50 larvae surviving 40 30 20 10 0 6.5 7.0 7.5 8.0 8.2 8.5 pH Fig. 3.3 (i) The scientists placed 500 larvae in each condition. Calculate the number of larvae that did not survive from day 2 to day 15 when placed at a temperature of 30 °C. .......................................................... [2] (ii) Use Fig. 3.2 and Fig. 3.3 to state the optimum temperature and optimum pH for the survival of oyster larvae. optimum temperature ...................................................... °C optimum pH ..................................................................... [1] (c) Fishers in India reported declining harvests of adult oysters from an area of coastal water after 2011. (i) Table 3.1 shows the temperature and pH of the water during 2009 in this area. Table 3.1 month temperature / °C pH February 25 8.0 April 27 7.9 June 34 8.2 August 30 7.0 October 32 6.5 December 28 7.0 Use Table 3.1 to plot a line graph to show the temperature and the pH from February to December. [5] (ii) Around the coasts of India, oysters spawn throughout the year but have two peak periods of breeding, in April and August. Discuss the reasons for the reduction in the number of oysters that the fishers harvested after 2011. Use information in Table 3.1, Fig. 3.2 and Fig. 3.3 to support your answer. ........................................................................................................................................... ........................................................................................................................................... ........................................................................................................................................... ........................................................................................................................................... ........................................................................................................................................... ........................................................................................................................................... ........................................................................................................................................... ..................................................................................................................................... [4] (d) Explain why the use of fossil fuels places future oyster populations at risk. ................................................................................................................................................... ................................................................................................................................................... ................................................................................................................................................... ................................................................................................................................................... ................................................................................................................................................... ............................................................................................................................................. [3] [Total: 18]
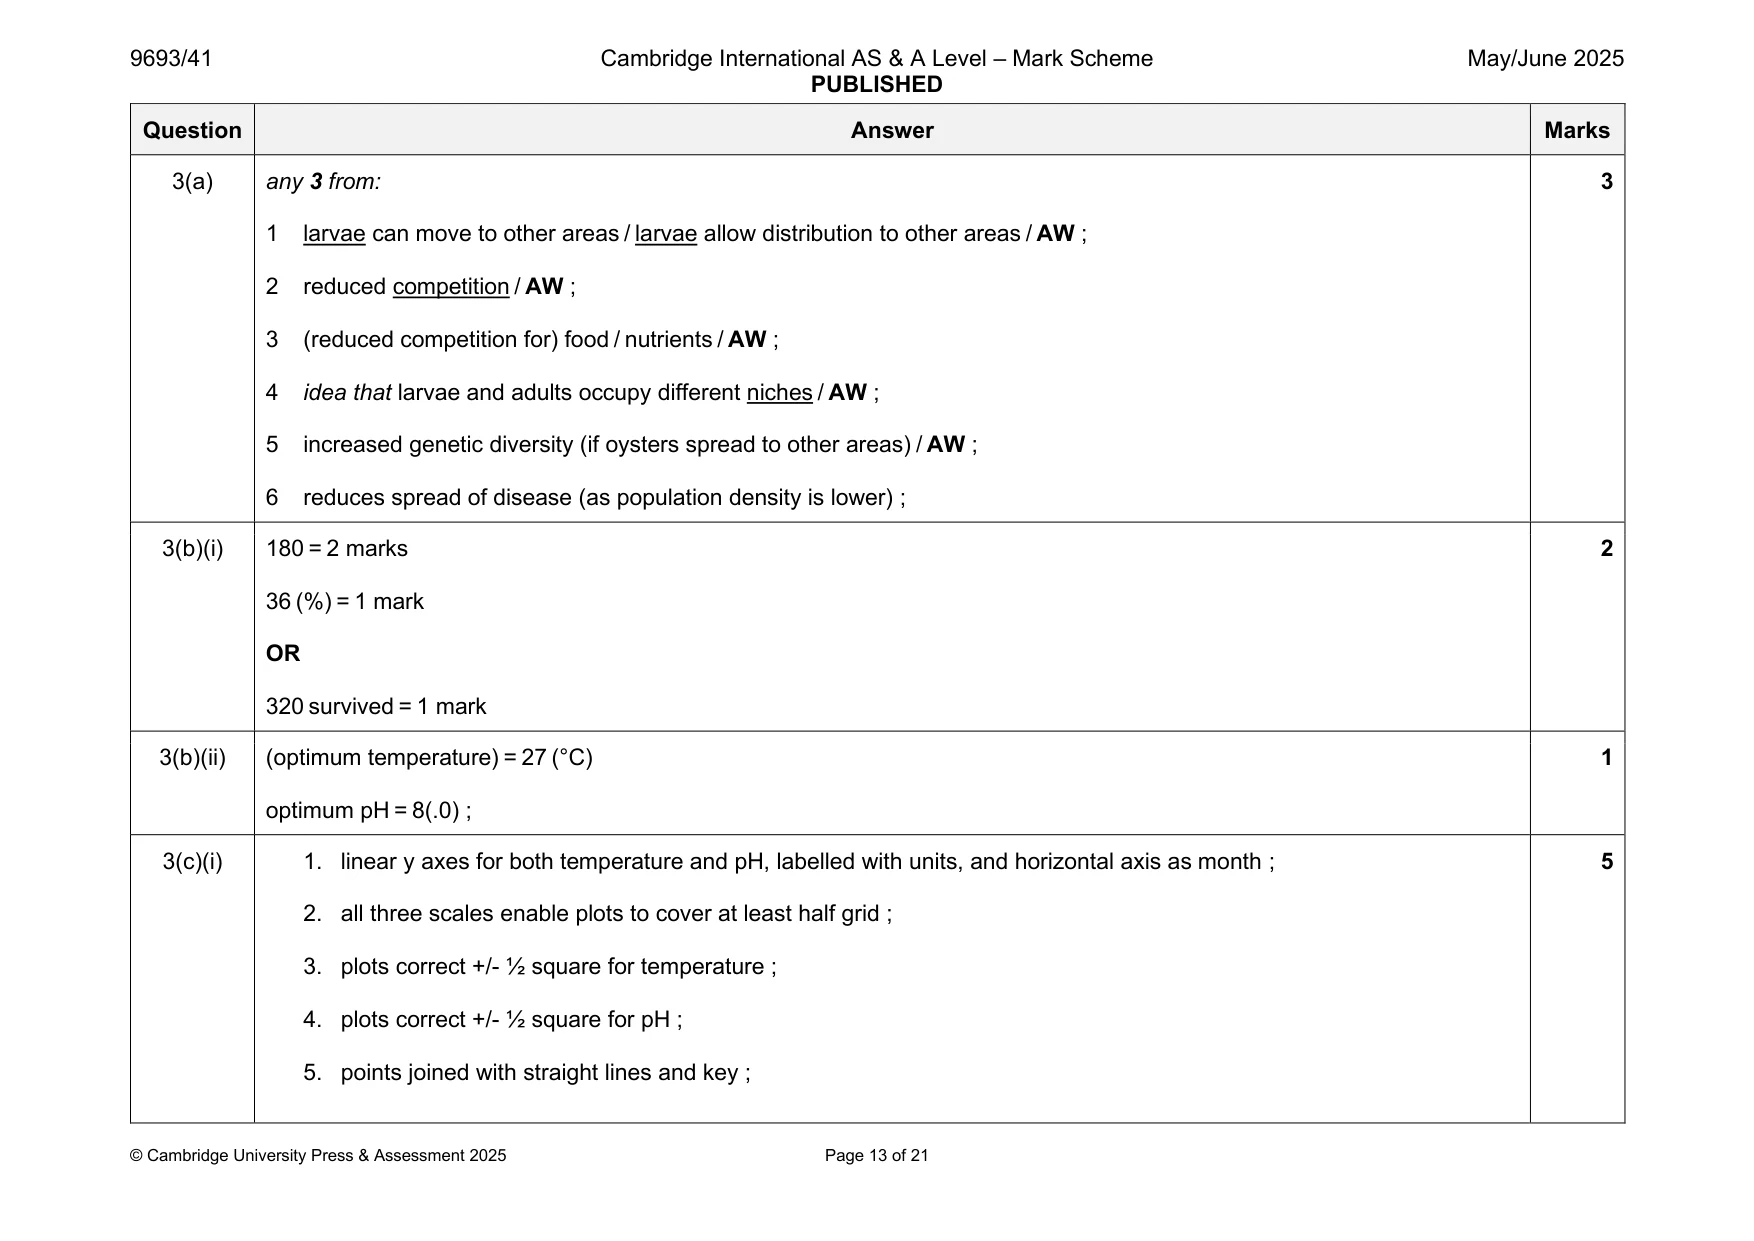
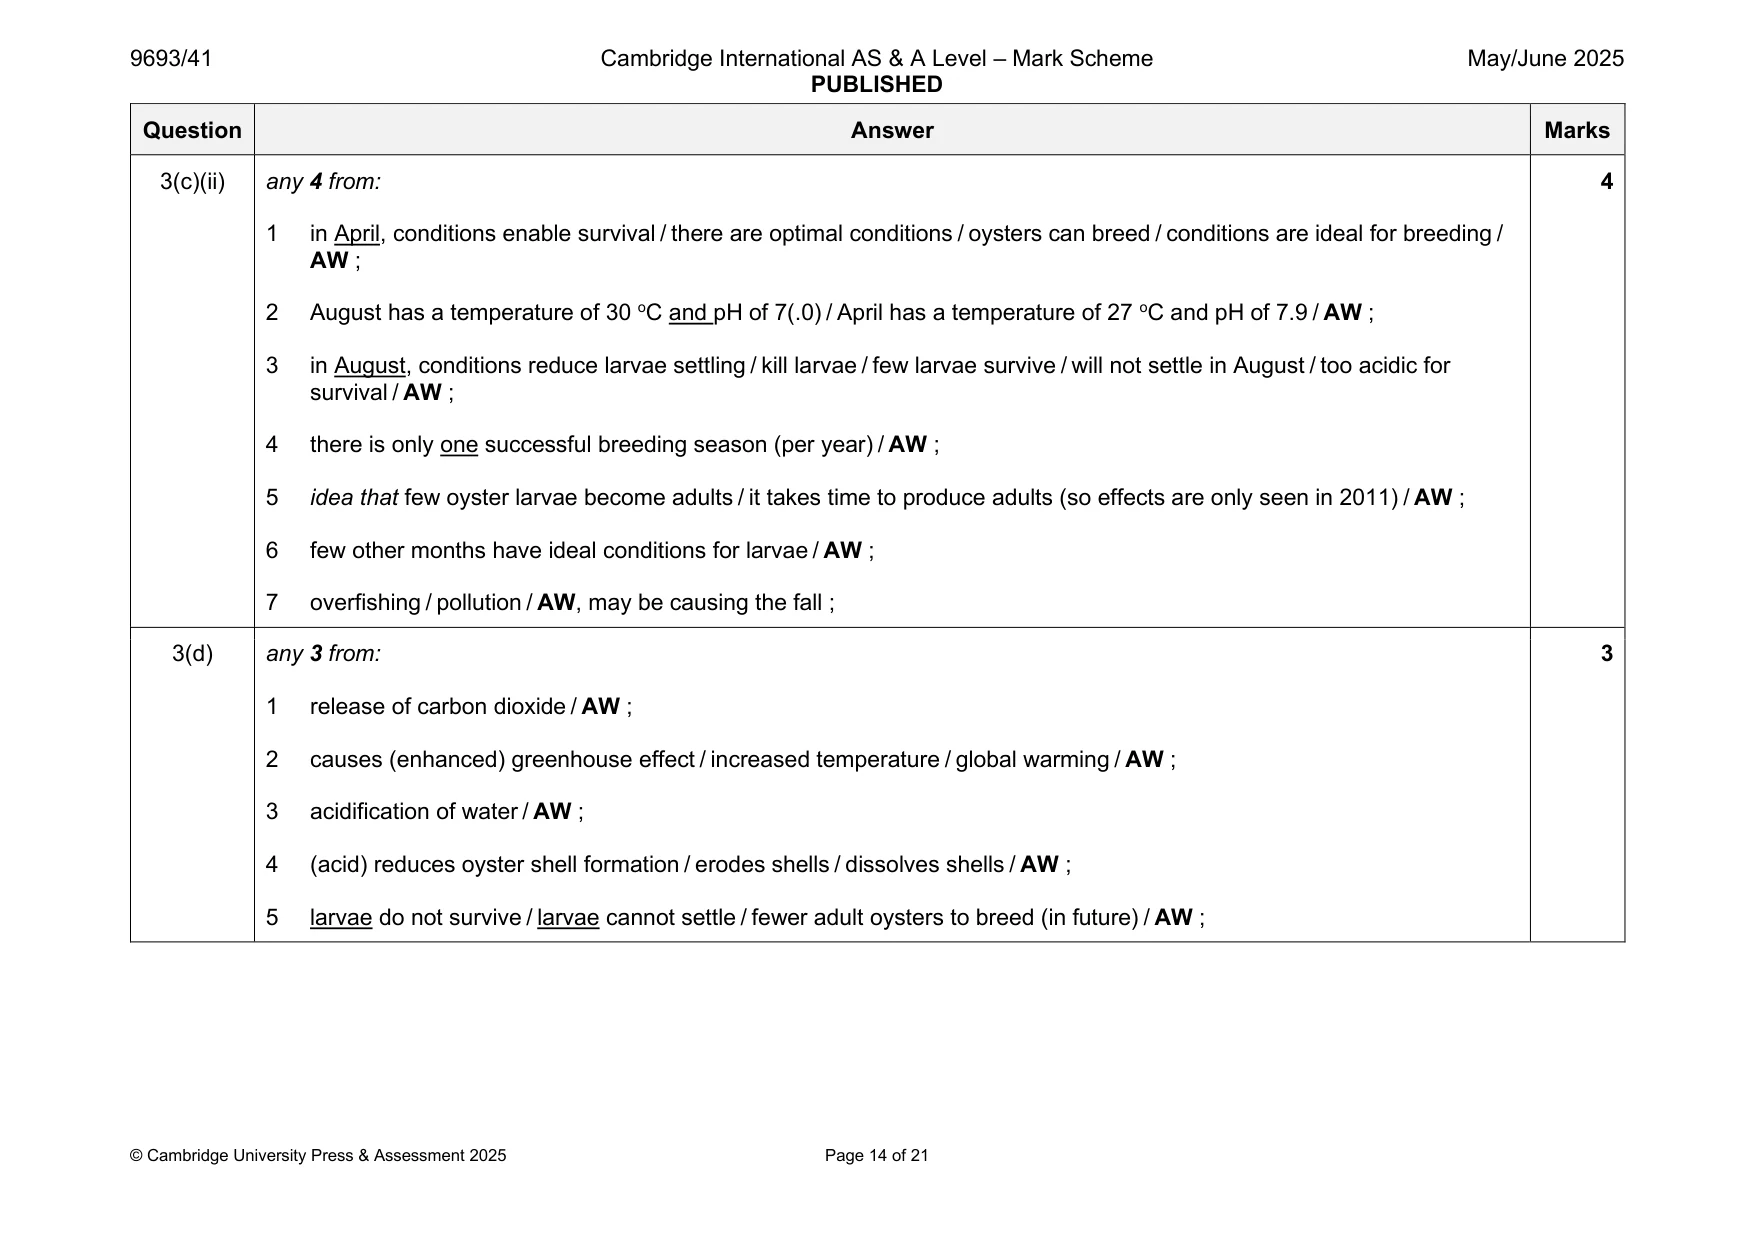
Mark scheme: 3(a) any 3 from: 3 1 larvae can move to other areas / larvae allow distribution to other areas / AW ; 2 reduced competition / AW ; 3 (reduced competition for) food / nutrients / AW ; 4 idea that larvae and adults occupy different niches / AW ; 5 increased genetic diversity (if oysters spread to other areas) / AW ; 6 reduces spread of disease (as population density is lower) ; 3(b)(i) 180 = 2 marks 2 36 (%) = 1 mark OR 320 survived = 1 mark 3(b)(ii) (optimum temperature) = 27 (°C) 1 optimum pH = 8(.0) ; 3(c)(i) 1. linear y axes for both temperature and pH, labelled with units, and horizontal axis as month ; 5 2. all three scales enable plots to cover at least half grid ; 3. plots correct +/- ½ square for temperature ; 4. plots correct +/- ½ square for pH ; 5. points joined with straight lines and key ; 3(c)(ii) any 4 from: 4 1 in April, conditions enable survival / there are optimal conditions / oysters can breed / conditions are ideal for breeding / AW ; 2 August has a temperature of 30 oC and pH of 7(.0) / April has a temperature of 27 oC and pH of 7.9 / AW ; 3 in August, conditions reduce larvae settling / kill larvae / few larvae survive / will not settle in August / too acidic for survival / AW ; 4 there is only one successful breeding season (per year) / AW ; 5 idea that few oyster larvae become adults / it takes time to produce adults (so effects are only seen in 2011) / AW ; 6 few other months have ideal conditions for larvae / AW ; 7 overfishing / pollution / AW, may be causing the fall ; 3(d) any 3 from: 3 1 release of carbon dioxide / AW ; 2 causes (enhanced) greenhouse effect / increased temperature / global warming / AW ; 3 acidification of water / AW ; 4 (acid) reduces oyster shell formation / erodes shells / dissolves shells / AW ; 5 larvae do not survive / larvae cannot settle / fewer adult oysters to breed (in future) / AW ;
Q4 · A student investigated if the surface area of fish gills has a correlation with the…
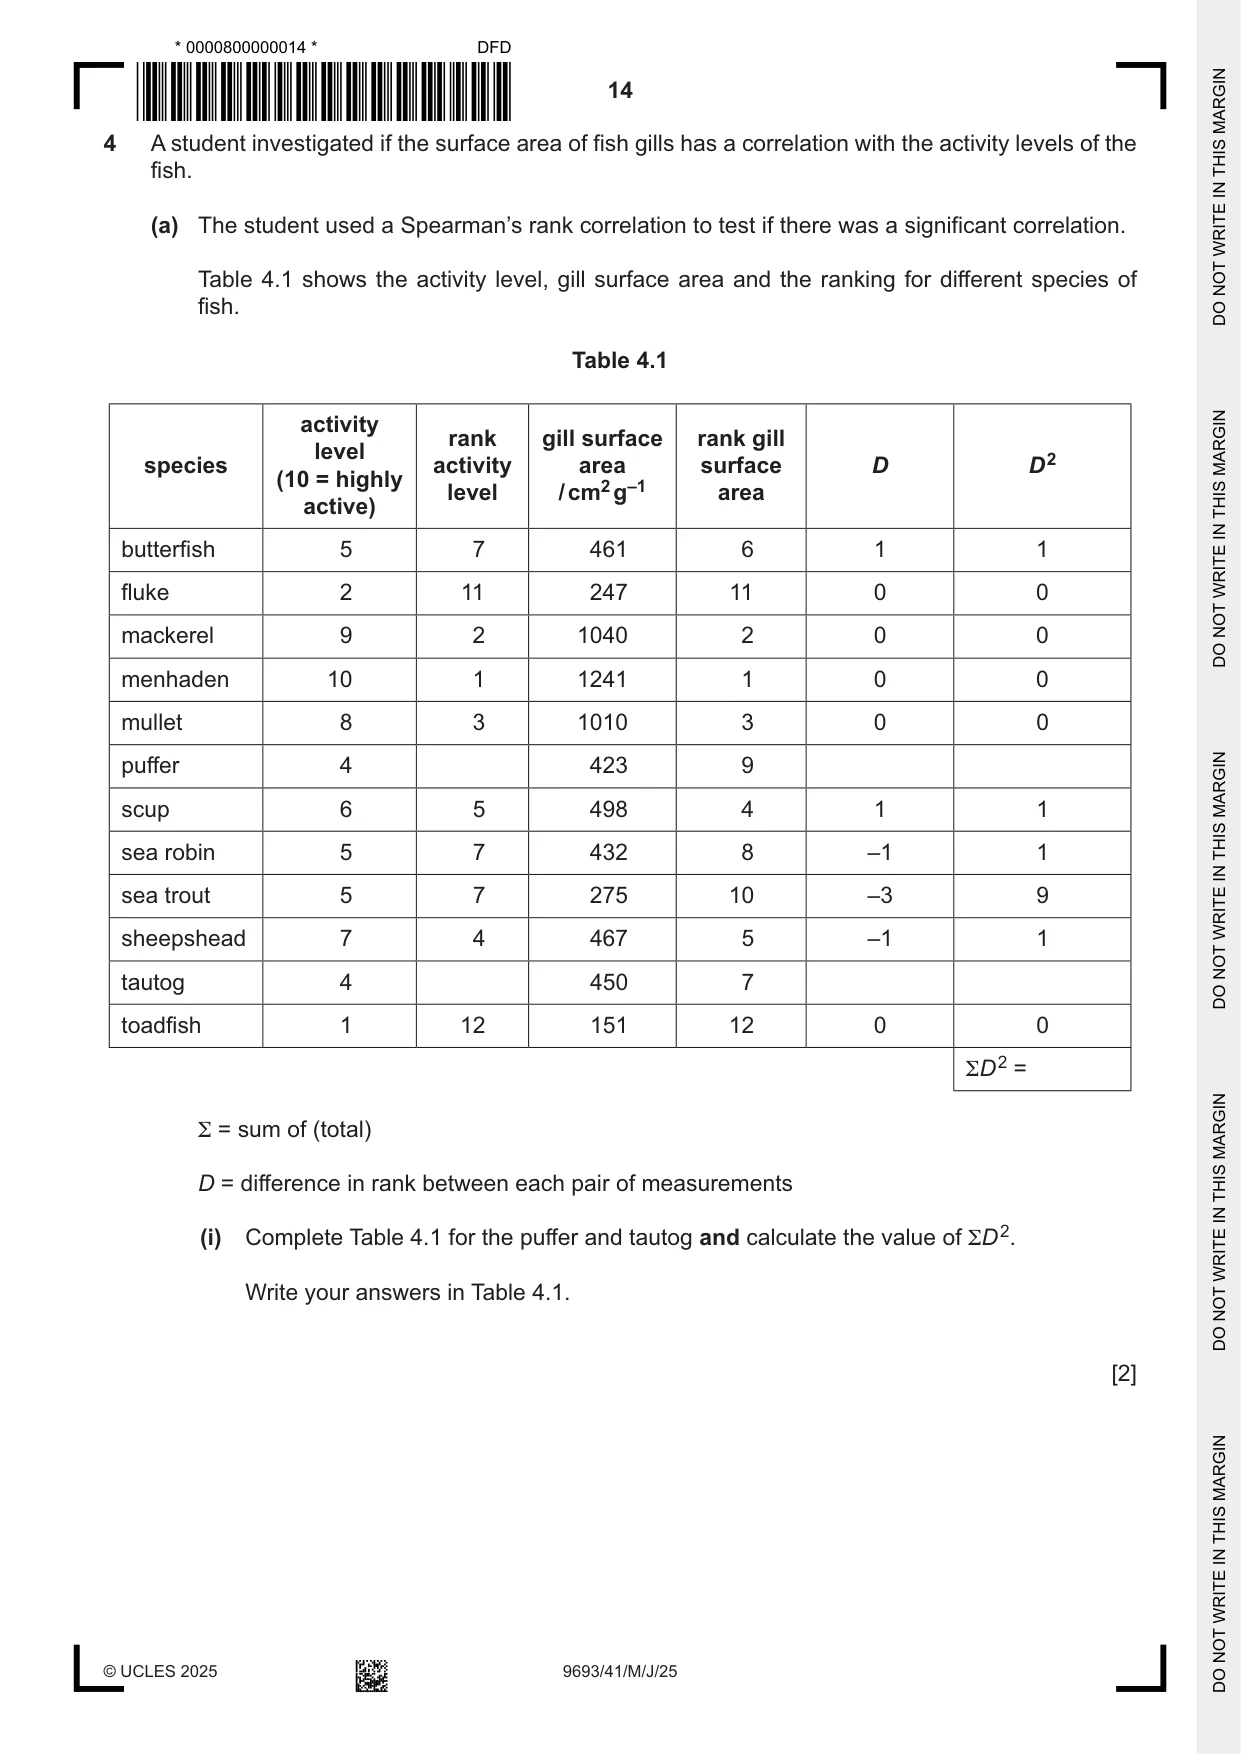
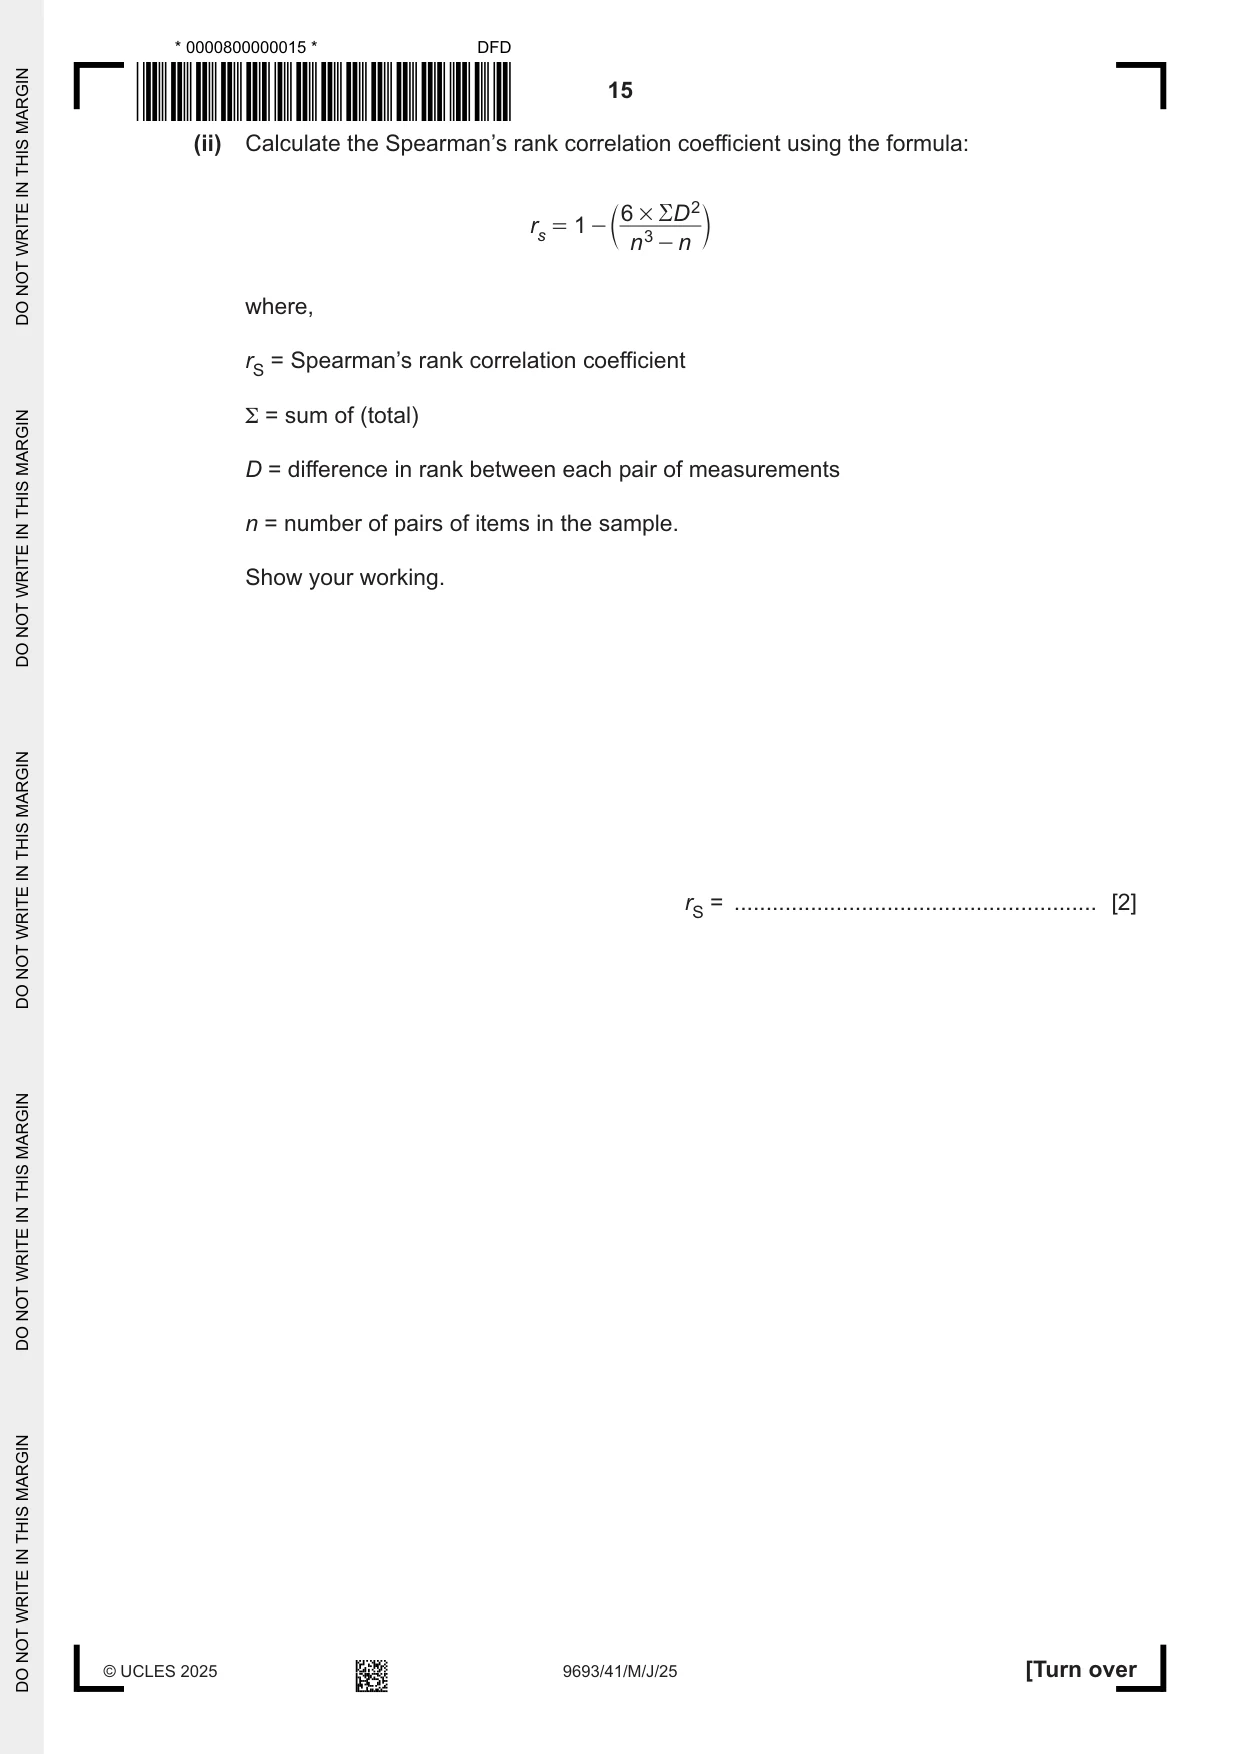
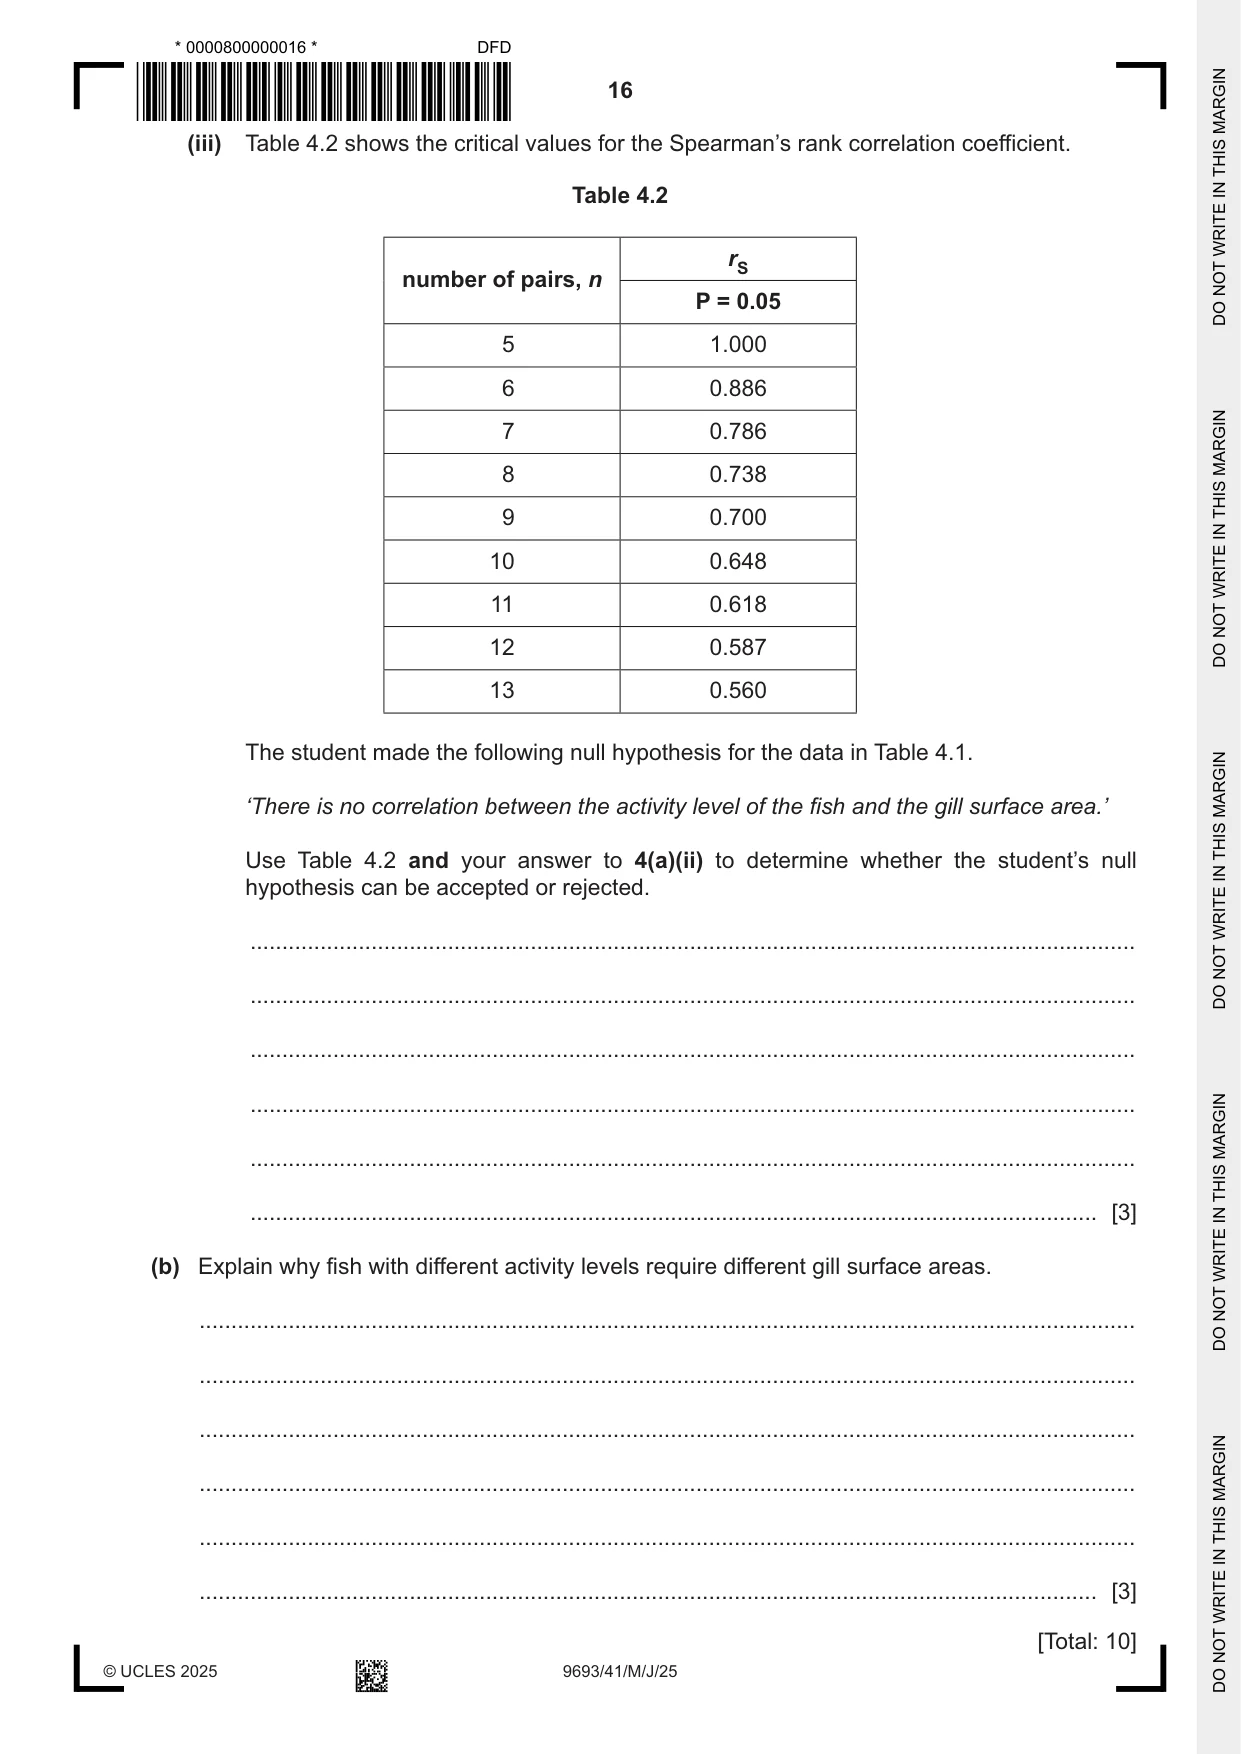
4 A student investigated if the surface area of fish gills has a correlation with the activity levels of the fish. (a) The student used a Spearman’s rank correlation to test if there was a significant correlation. Table 4.1 shows the activity level, gill surface area and the ranking for different species of fish. Table 4.1 activity rank gill surface rank gill level species activity area surface D D 2 (10 = highly level / cm2 g–1 area active) butterfish 5 7 461 6 1 1 fluke 2 11 247 11 0 0 mackerel 9 2 1040 2 0 0 menhaden 10 1 1241 1 0 0 mullet 8 3 1010 3 0 0 puffer 4 423 9 scup 6 5 498 4 1 1 sea robin 5 7 432 8 –1 1 sea trout 5 7 275 10 –3 9 sheepshead 7 4 467 5 –1 1 tautog 4 450 7 toadfish 1 12 151 12 0 0 ΣD 2 = Σ = sum of (total) D = difference in rank between each pair of measurements (i) Complete Table 4.1 for the puffer and tautog and calculate the value of ΣD 2. Write your answers in Table 4.1. [2] (ii) Calculate the Spearman’s rank correlation coefficient using the formula: 6 # R D 2 r = 1 - c m s n 3 - n where, rS = Spearman’s rank correlation coefficient Σ = sum of (total) D = difference in rank between each pair of measurements n = number of pairs of items in the sample. Show your working. rS = ......................................................... [2] (iii) Table 4.2 shows the critical values for the Spearman’s rank correlation coefficient. Table 4.2 rS number of pairs, n P = 0.05 5 1.000 6 0.886 7 0.786 8 0.738 9 0.700 10 0.648 11 0.618 12 0.587 13 0.560 The student made the following null hypothesis for the data in Table 4.1. ‘There is no correlation between the activity level of the fish and the gill surface area.’ Use Table 4.2 and your answer to 4(a)(ii) to determine whether the student’s null hypothesis can be accepted or rejected. ........................................................................................................................................... ........................................................................................................................................... ........................................................................................................................................... ........................................................................................................................................... ........................................................................................................................................... ..................................................................................................................................... [3] (b) Explain why fish with different activity levels require different gill surface areas. ................................................................................................................................................... ................................................................................................................................................... ................................................................................................................................................... ................................................................................................................................................... ................................................................................................................................................... ............................................................................................................................................. [3] [Total: 10]
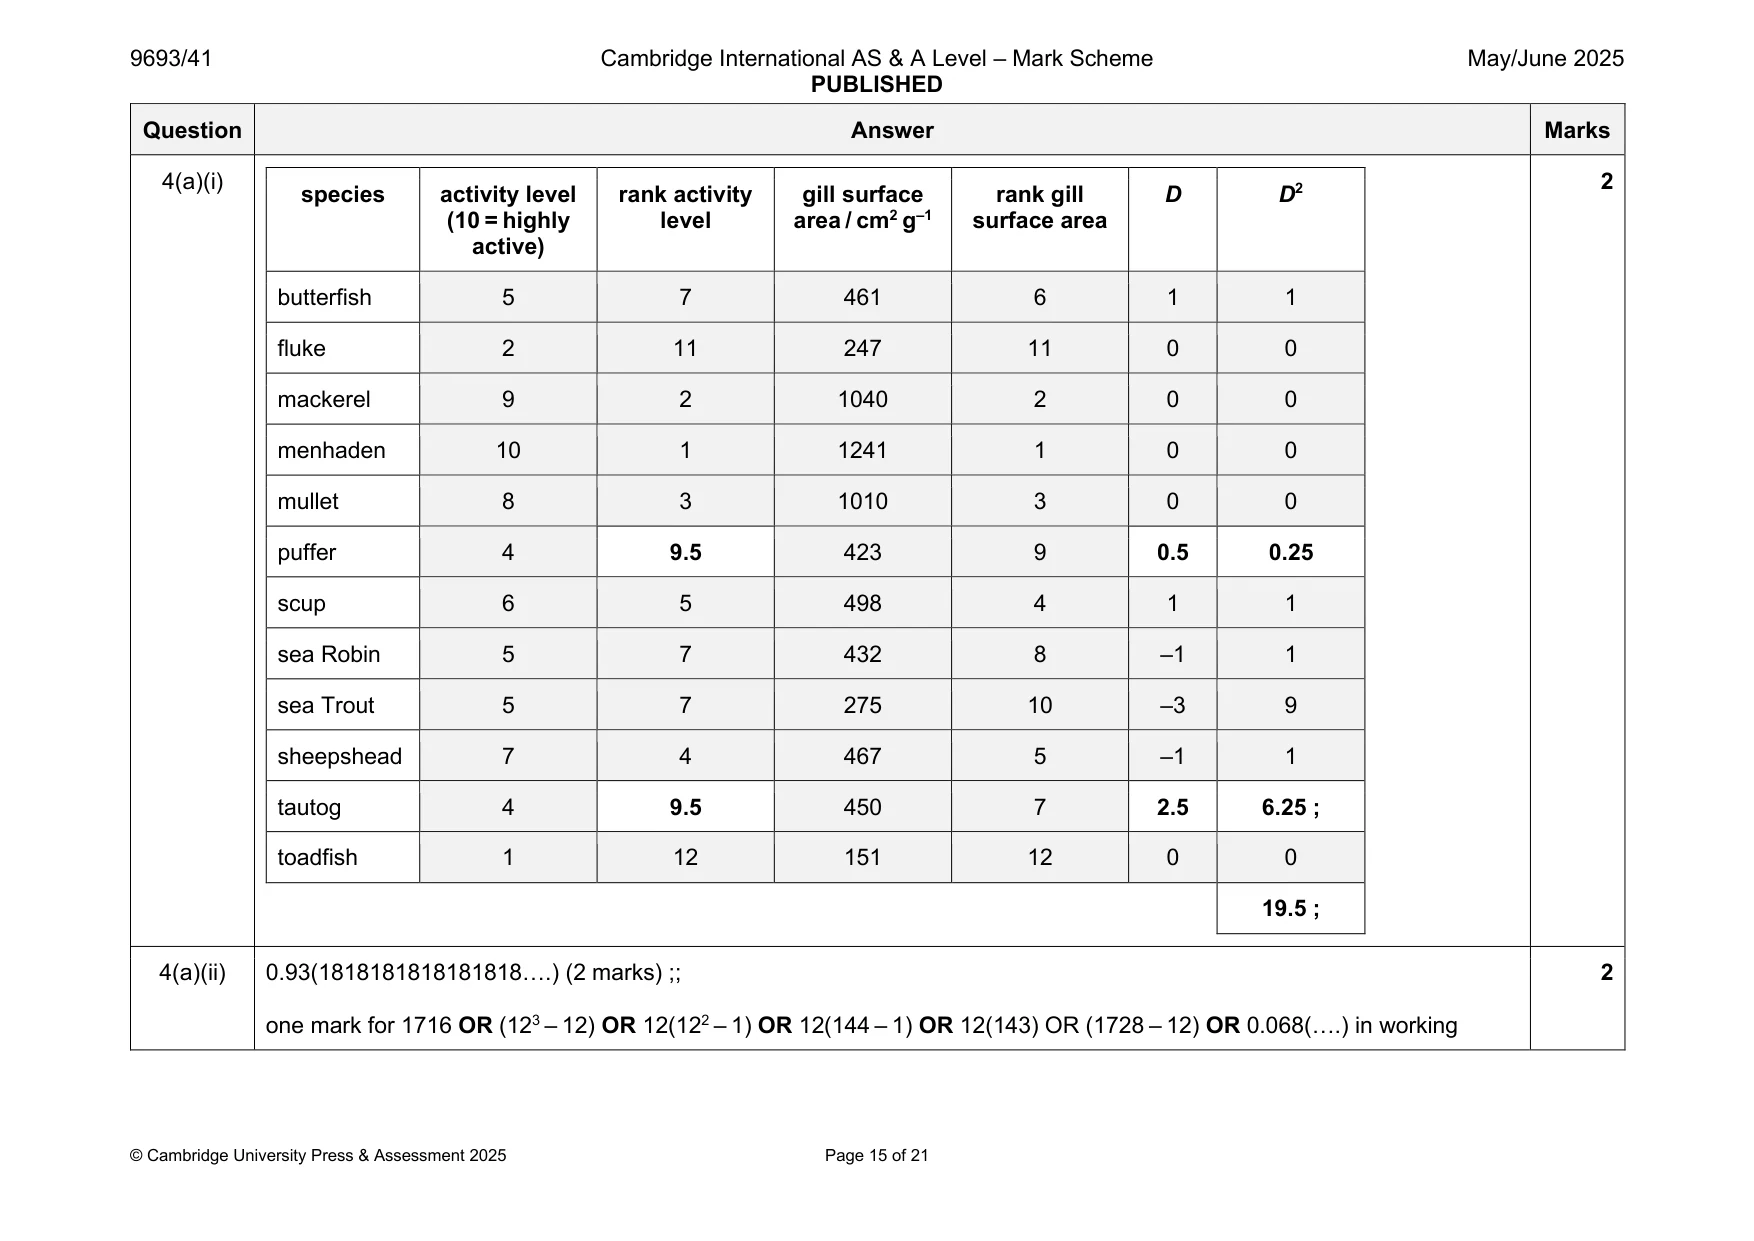
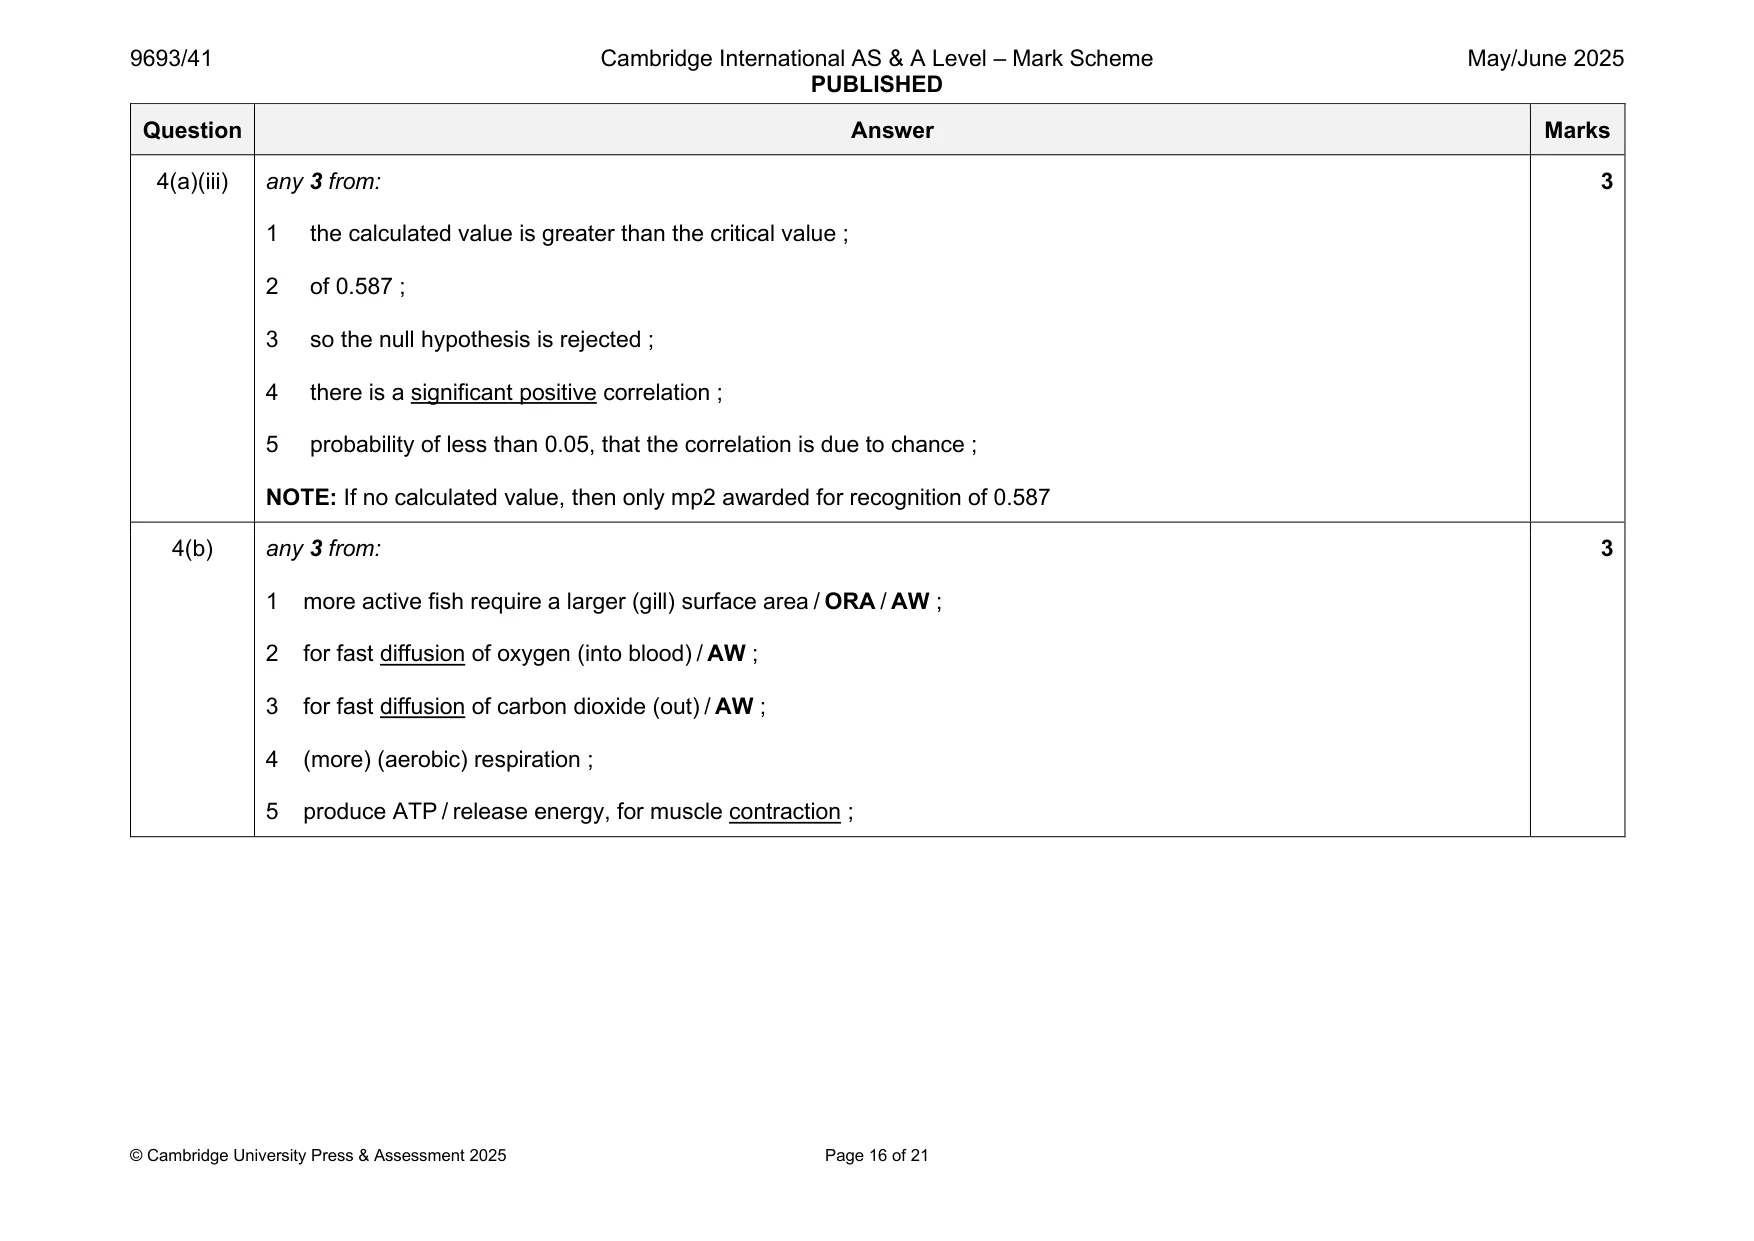
Mark scheme: 4(a)(i) 2 species activity level rank activity gill surface rank gill D D2 (10 = highly level area / cm2 g–1 surface area active) butterfish 5 7 461 6 1 1 fluke 2 11 247 11 0 0 mackerel 9 2 1040 2 0 0 menhaden 10 1 1241 1 0 0 mullet 8 3 1010 3 0 0 puffer 4 9.5 423 9 0.5 0.25 scup 6 5 498 4 1 1 sea Robin 5 7 432 8 –1 1 sea Trout 5 7 275 10 –3 9 sheepshead 7 4 467 5 –1 1 tautog 4 9.5 450 7 2.5 6.25 ; toadfish 1 12 151 12 0 0 19.5 ; 4(a)(ii) 0.93(1818181818181818….) (2 marks) ;; 2 one mark for 1716 OR (123 – 12) OR 12(122 – 1) OR 12(144 – 1) OR 12(143) OR (1728 – 12) OR 0.068(….) in working 4(a)(iii) any 3 from: 3 1 the calculated value is greater than the critical value ; 2 of 0.587 ; 3 so the null hypothesis is rejected ; 4 there is a significant positive correlation ; 5 probability of less than 0.05, that the correlation is due to chance ; NOTE: If no calculated value, then only mp2 awarded for recognition of 0.587 4(b) any 3 from: 3 1 more active fish require a larger (gill) surface area / ORA / AW ; 2 for fast diffusion of oxygen (into blood) / AW ; 3 for fast diffusion of carbon dioxide (out) / AW ; 4 (more) (aerobic) respiration ; 5 produce ATP / release energy, for muscle contraction ;
Q5 · A photograph of Palau which is a nation located in the Pacific Ocean
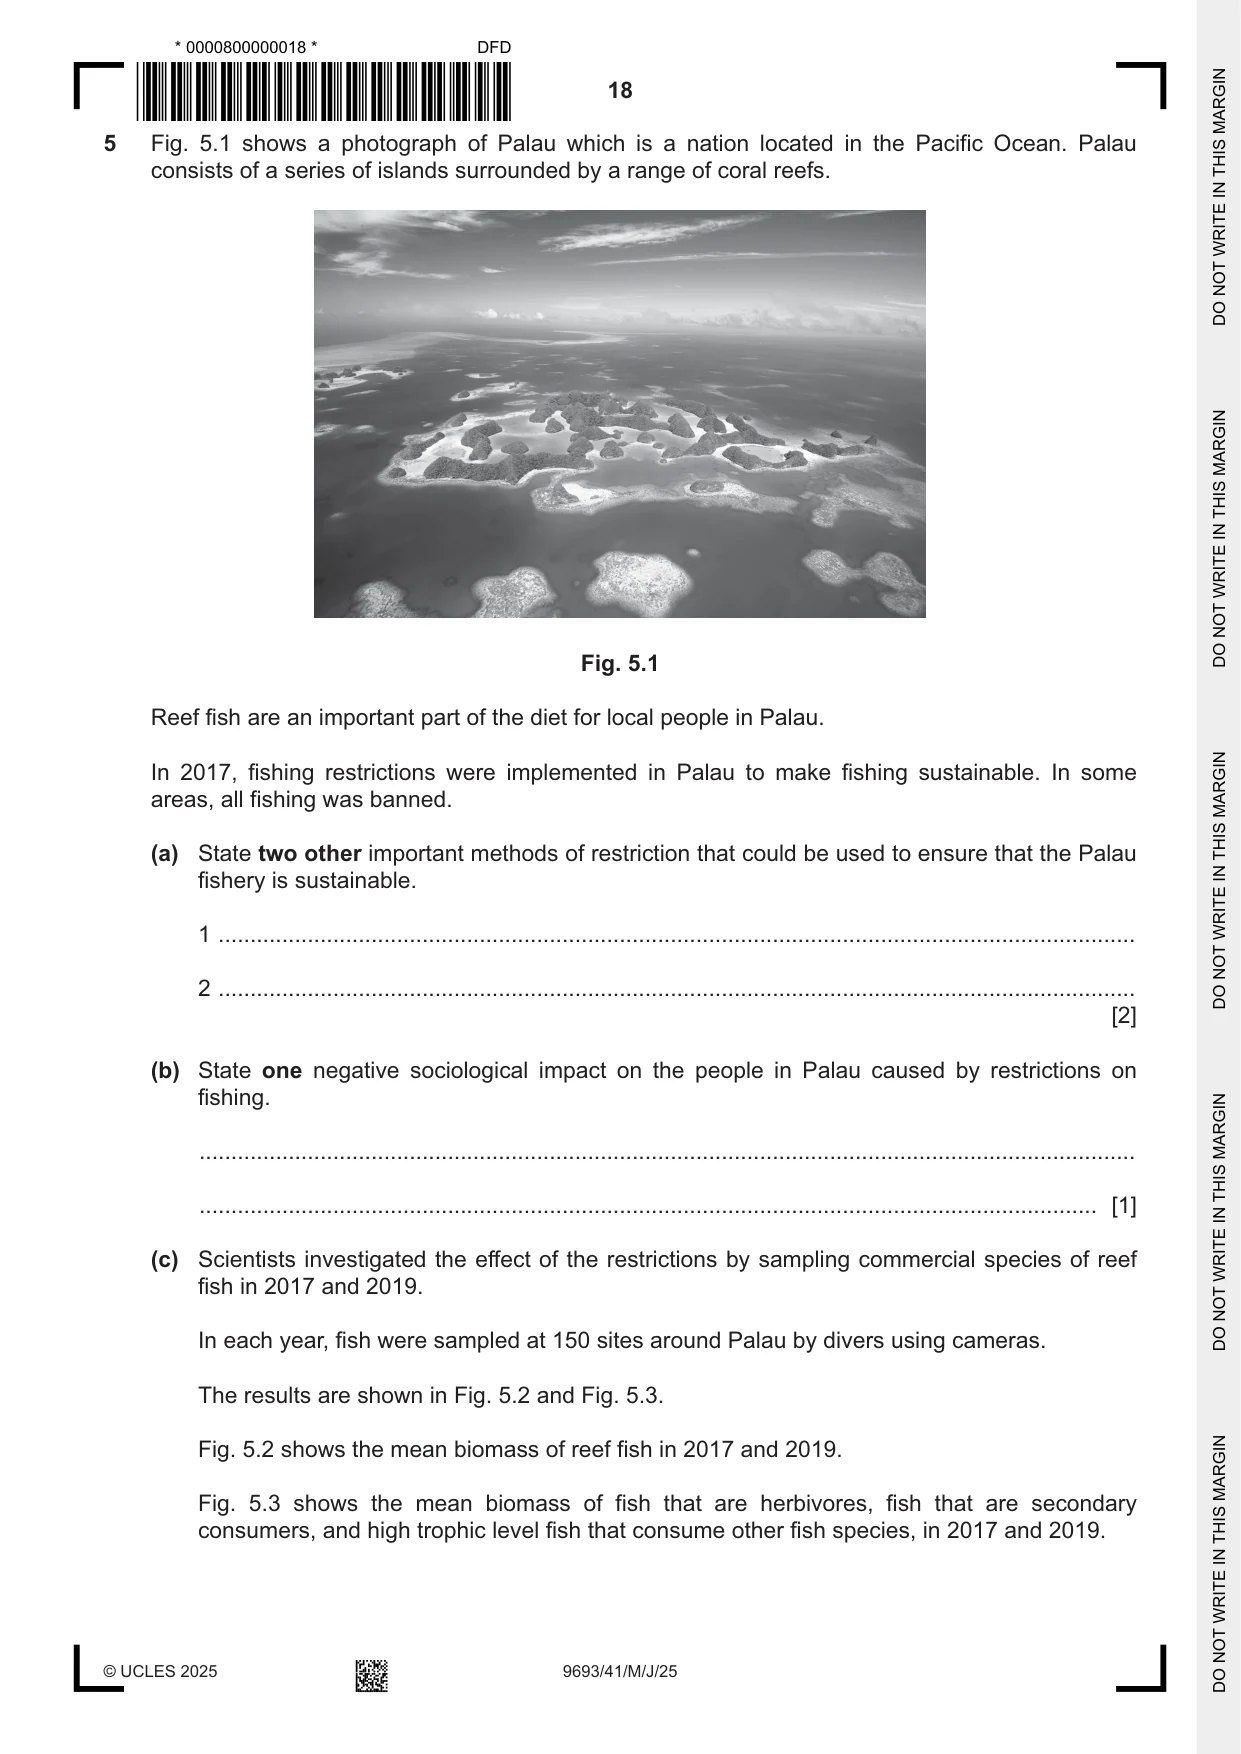
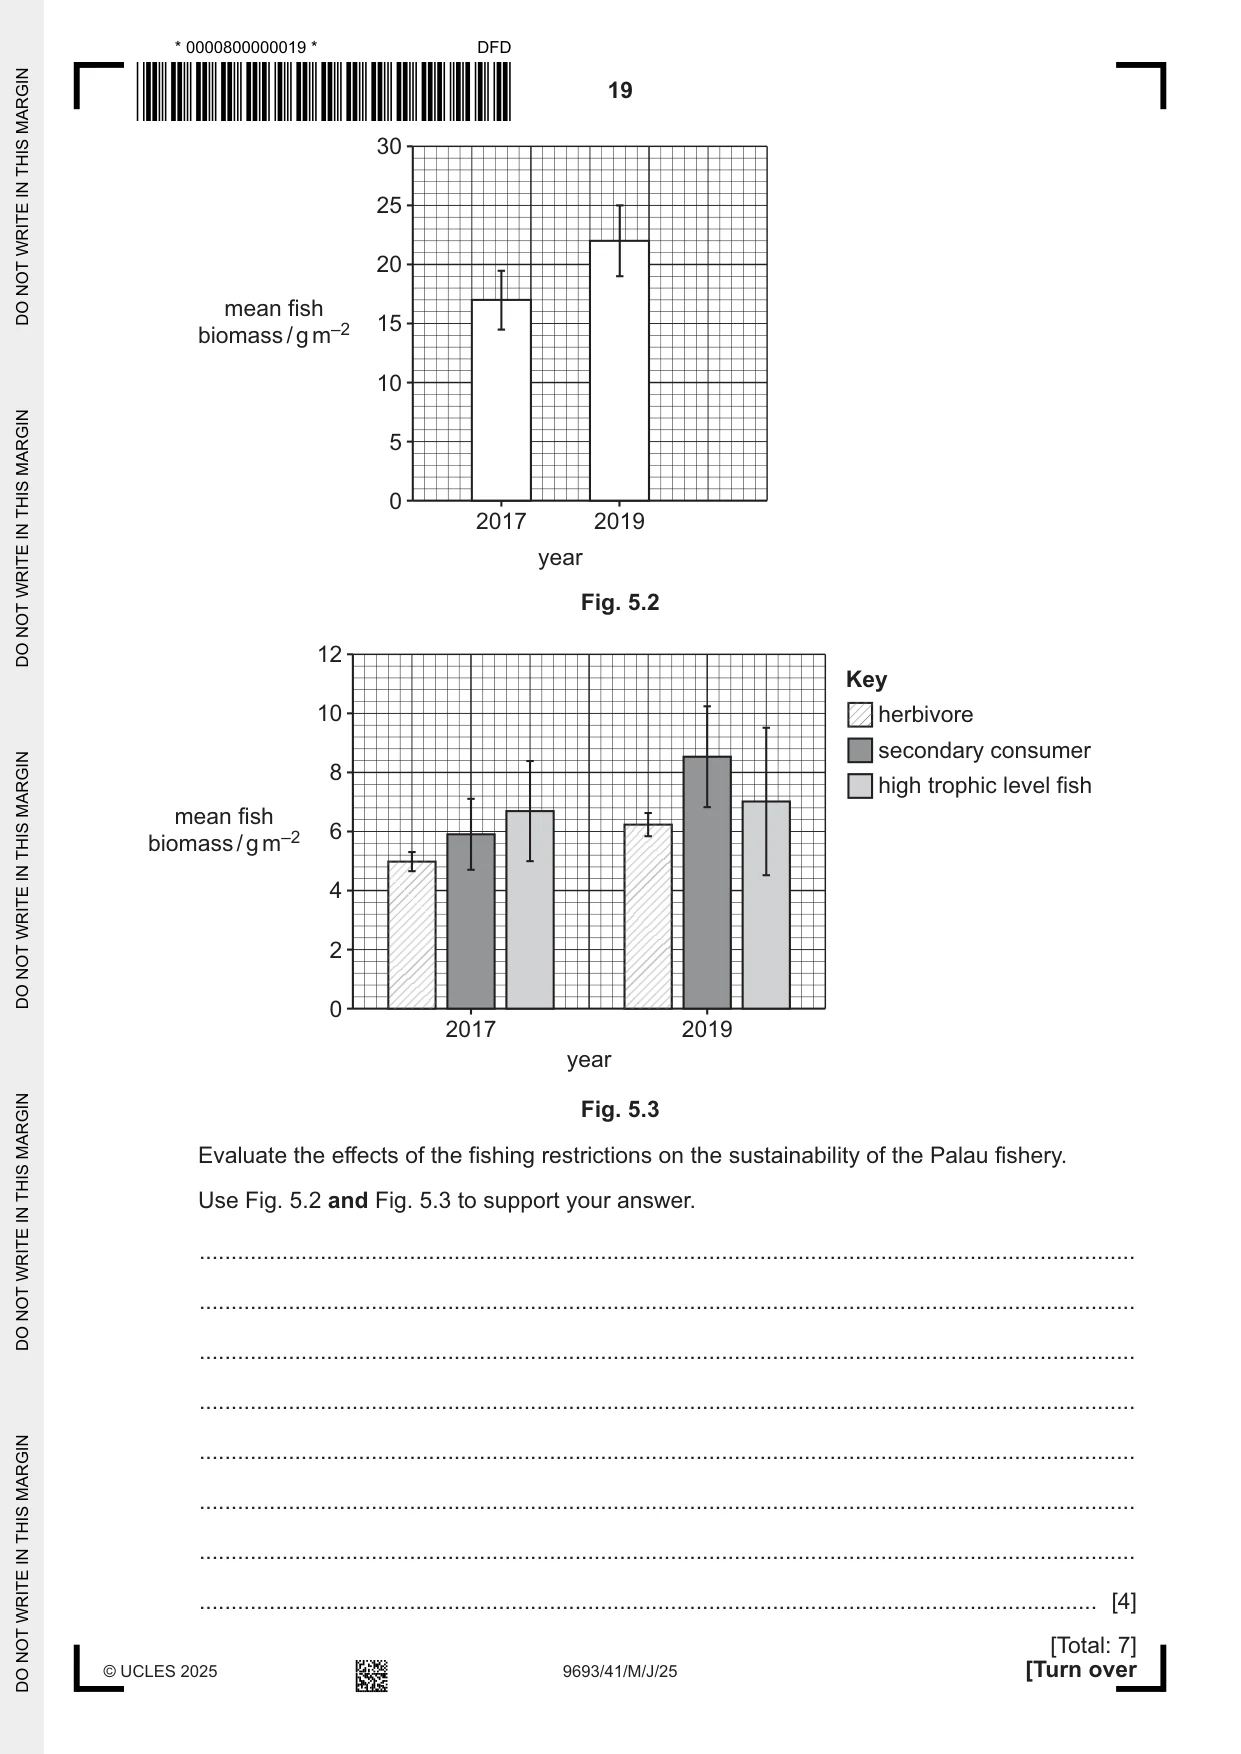
5 Fig. 5.1 shows a photograph of Palau which is a nation located in the Pacific Ocean. Palau consists of a series of islands surrounded by a range of coral reefs. Fig. 5.1 Reef fish are an important part of the diet for local people in Palau. In 2017, fishing restrictions were implemented in Palau to make fishing sustainable. In some areas, all fishing was banned. (a) State two other important methods of restriction that could be used to ensure that the Palau fishery is sustainable. 1 ................................................................................................................................................ 2 ................................................................................................................................................ [2] (b) State one negative sociological impact on the people in Palau caused by restrictions on fishing. ................................................................................................................................................... ............................................................................................................................................. [1] (c) Scientists investigated the effect of the restrictions by sampling commercial species of reef fish in 2017 and 2019. In each year, fish were sampled at 150 sites around Palau by divers using cameras. The results are shown in Fig. 5.2 and Fig. 5.3. Fig. 5.2 shows the mean biomass of reef fish in 2017 and 2019. Fig. 5.3 shows the mean biomass of fish that are herbivores, fish that are secondary consumers, and high trophic level fish that consume other fish species, in 2017 and 2019. 30 25 20 mean fish 15 biomass / g m–2 10 5 0 2017 2019 year Fig. 5.2 12 Key 10 herbivore secondary consumer 8 high trophic level fish mean fish 6biomass / g m–2 4 2 0 2017 2019 year Fig. 5.3 Evaluate the effects of the fishing restrictions on the sustainability of the Palau fishery. Use Fig. 5.2 and Fig. 5.3 to support your answer. ................................................................................................................................................... ................................................................................................................................................... ................................................................................................................................................... ................................................................................................................................................... ................................................................................................................................................... ................................................................................................................................................... ................................................................................................................................................... ............................................................................................................................................. [4] [Total: 7]
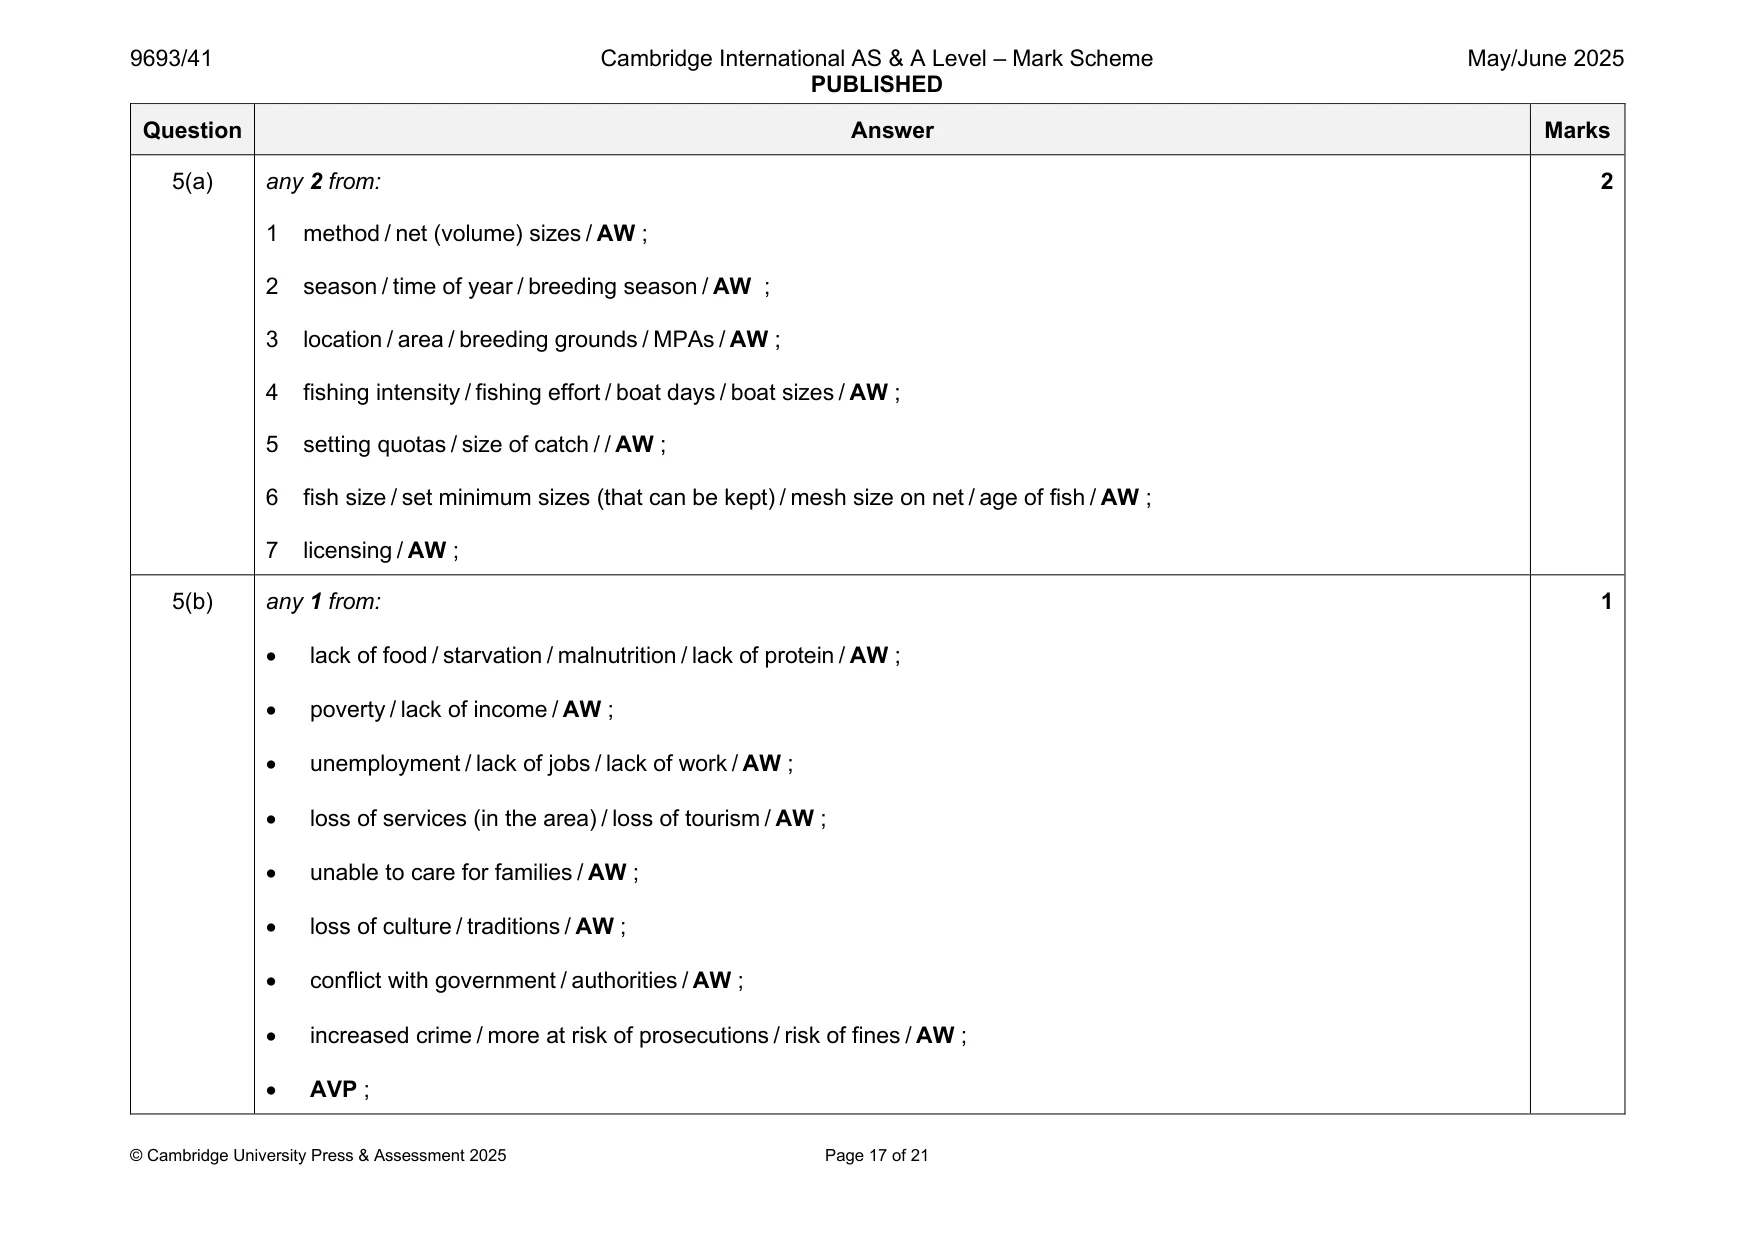
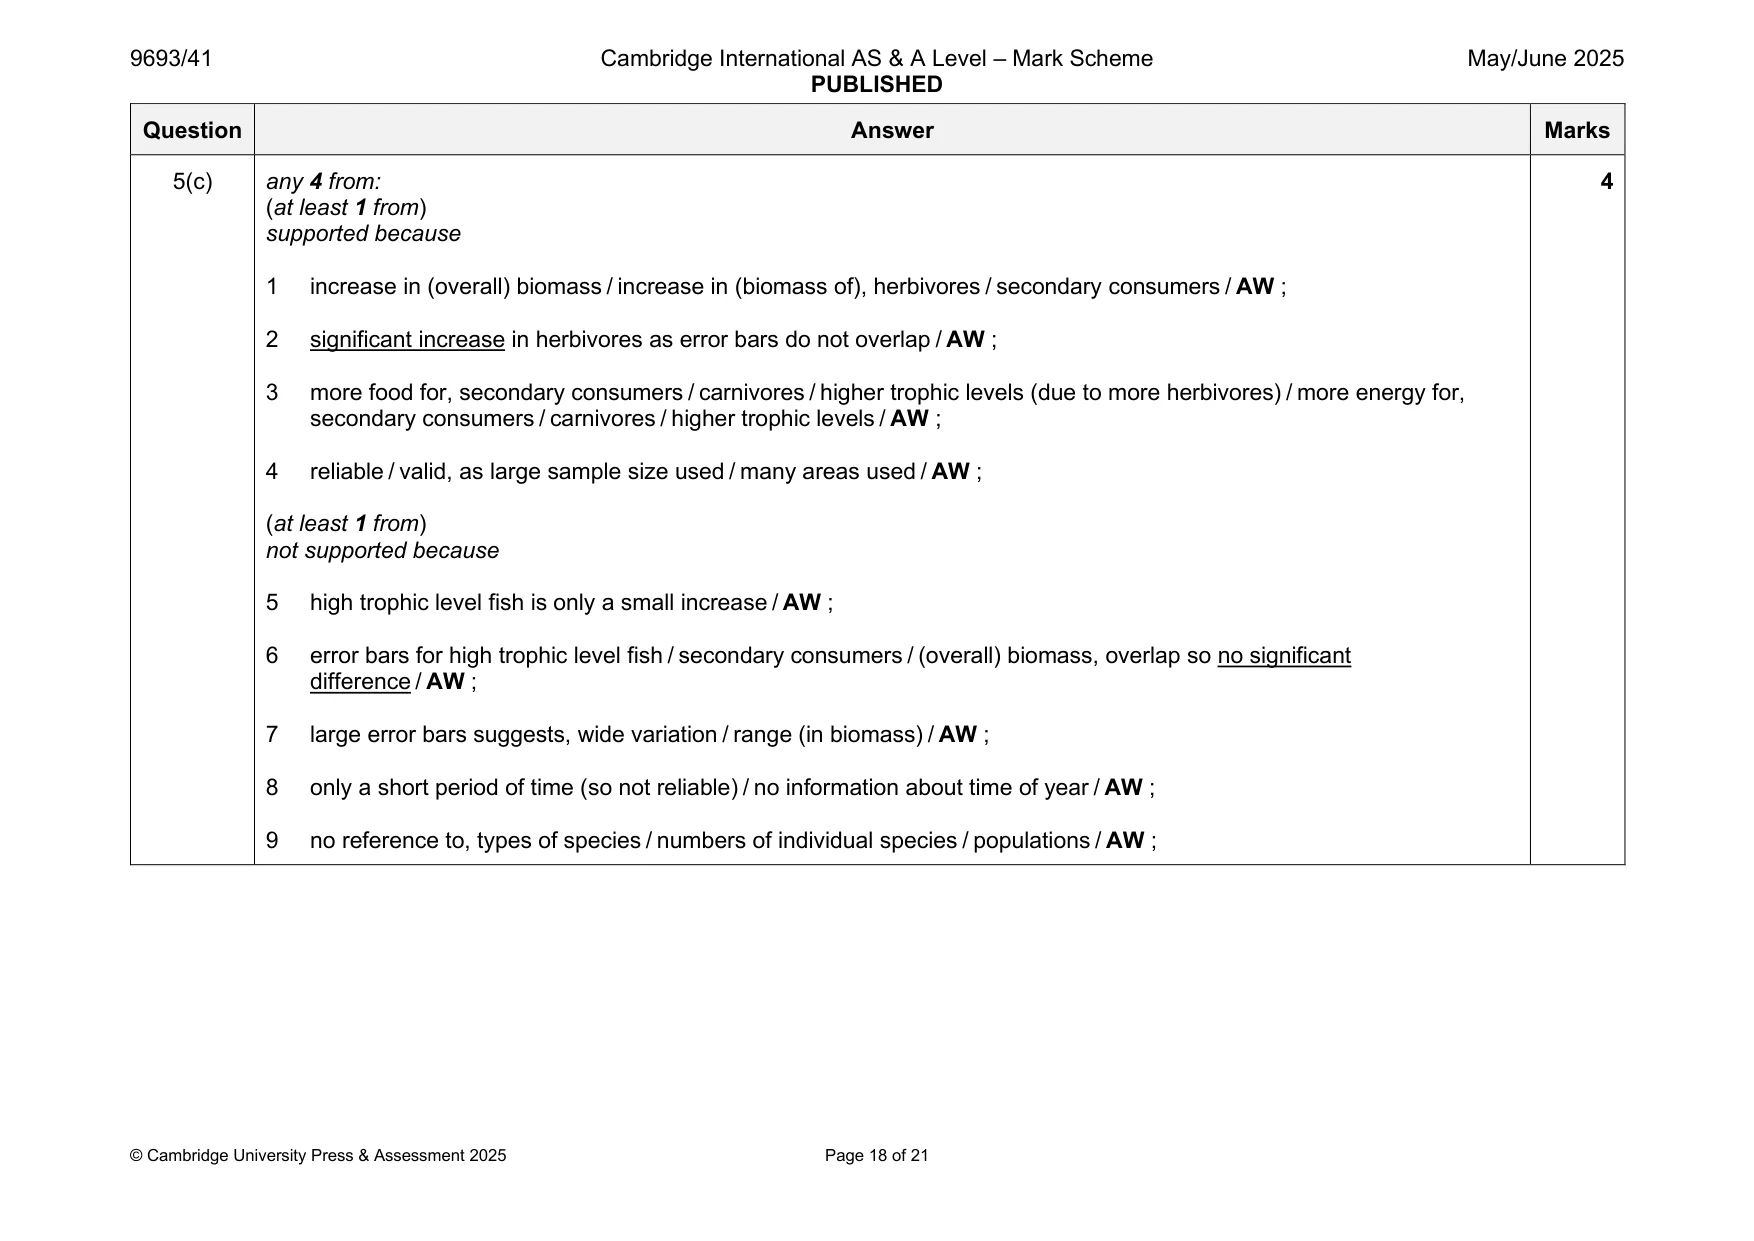
Mark scheme: 5(a) any 2 from: 2 1 method / net (volume) sizes / AW ; 2 season / time of year / breeding season / AW ; 3 location / area / breeding grounds / MPAs / AW ; 4 fishing intensity / fishing effort / boat days / boat sizes / AW ; 5 setting quotas / size of catch / / AW ; 6 fish size / set minimum sizes (that can be kept) / mesh size on net / age of fish / AW ; 7 licensing / AW ; 5(b) any 1 from: 1 • lack of food / starvation / malnutrition / lack of protein / AW ; • poverty / lack of income / AW ; • unemployment / lack of jobs / lack of work / AW ; • loss of services (in the area) / loss of tourism / AW ; • unable to care for families / AW ; • loss of culture / traditions / AW ; • conflict with government / authorities / AW ; • increased crime / more at risk of prosecutions / risk of fines / AW ; • AVP ; 5(c) any 4 from: 4 (at least 1 from) supported because 1 increase in (overall) biomass / increase in (biomass of), herbivores / secondary consumers / AW ; 2 significant increase in herbivores as error bars do not overlap / AW ; 3 more food for, secondary consumers / carnivores / higher trophic levels (due to more herbivores) / more energy for, secondary consumers / carnivores / higher trophic levels / AW ; 4 reliable / valid, as large sample size used / many areas used / AW ; (at least 1 from) not supported because 5 high trophic level fish is only a small increase / AW ; 6 error bars for high trophic level fish / secondary consumers / (overall) biomass, overlap so no significant difference / AW ; 7 large error bars suggests, wide variation / range (in biomass) / AW ; 8 only a short period of time (so not reliable) / no information about time of year / AW ; 9 no reference to, types of species / numbers of individual species / populations / AW ;
Q6 · A photograph of a ship’s rudder and propeller covered in barnacles
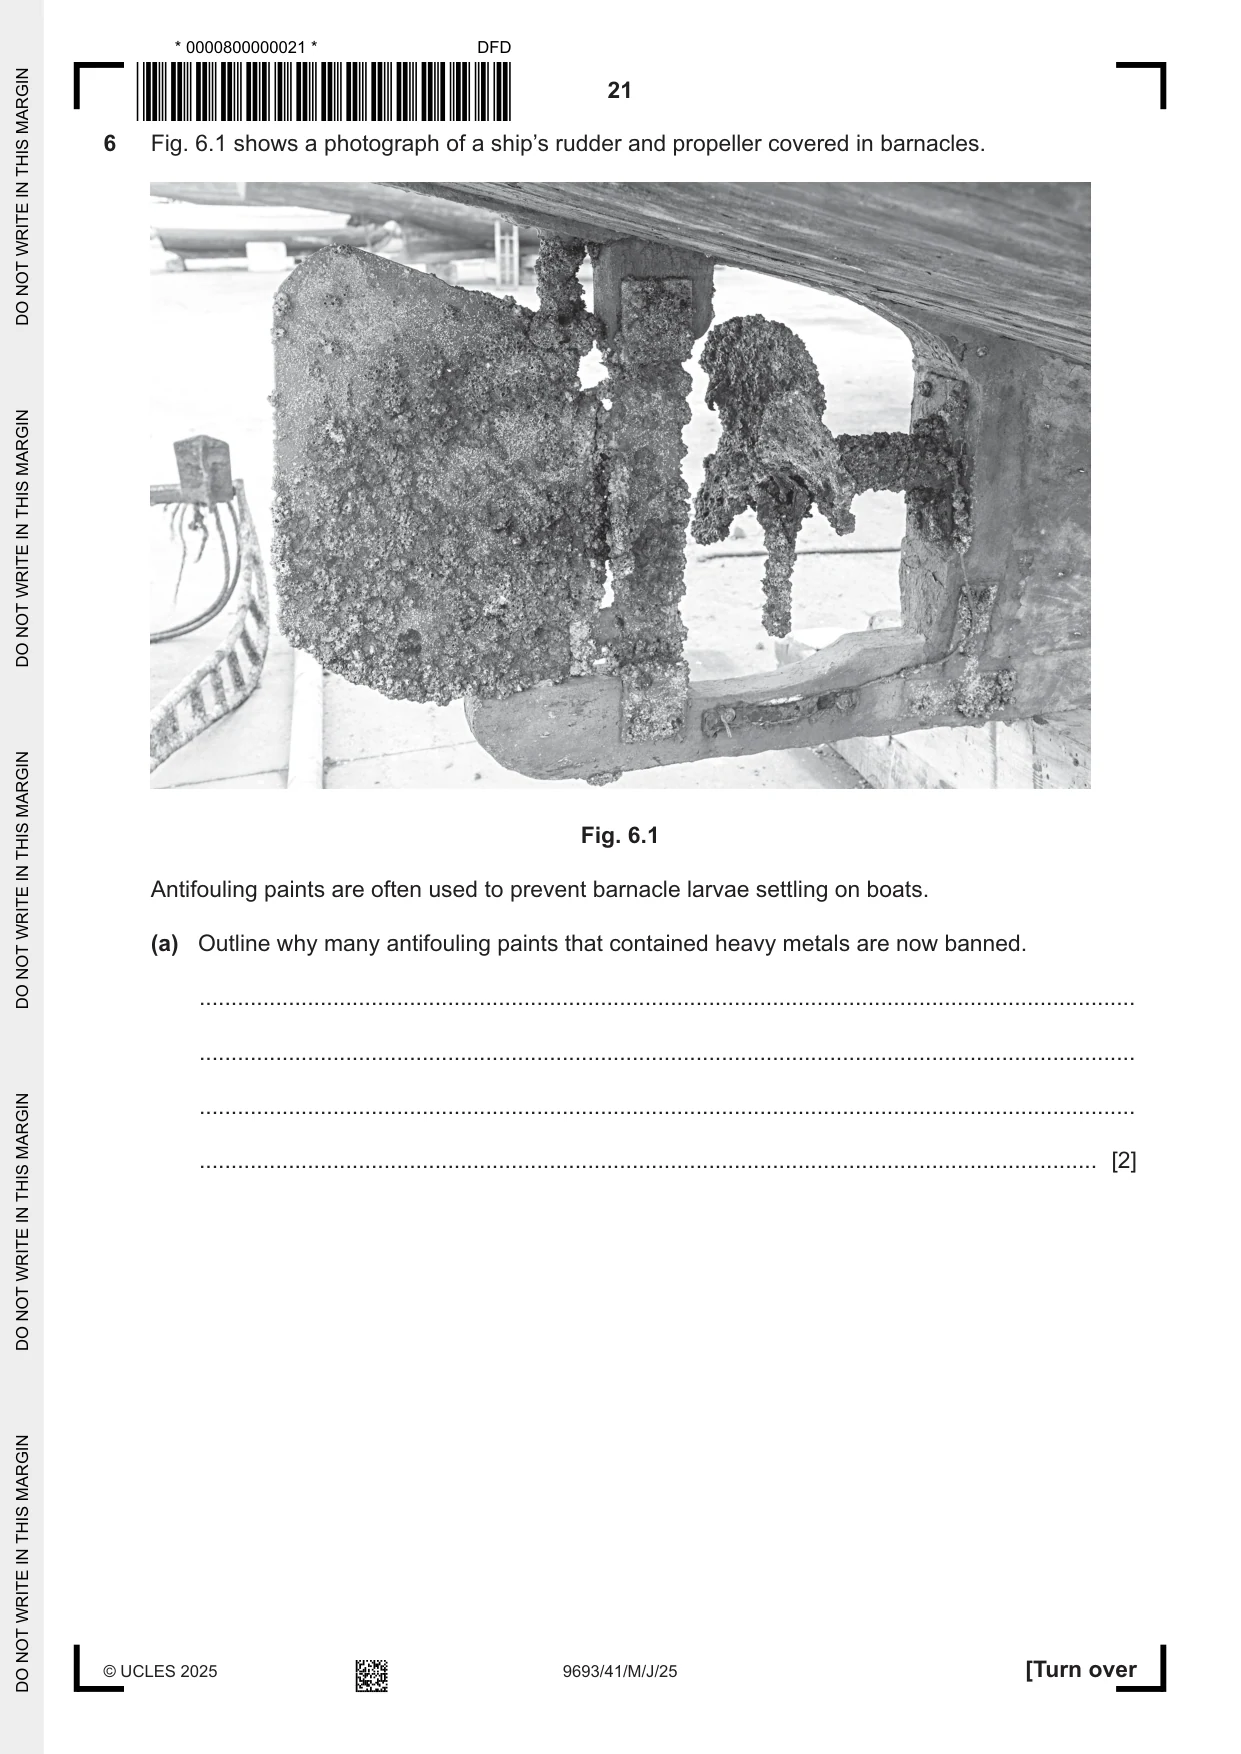
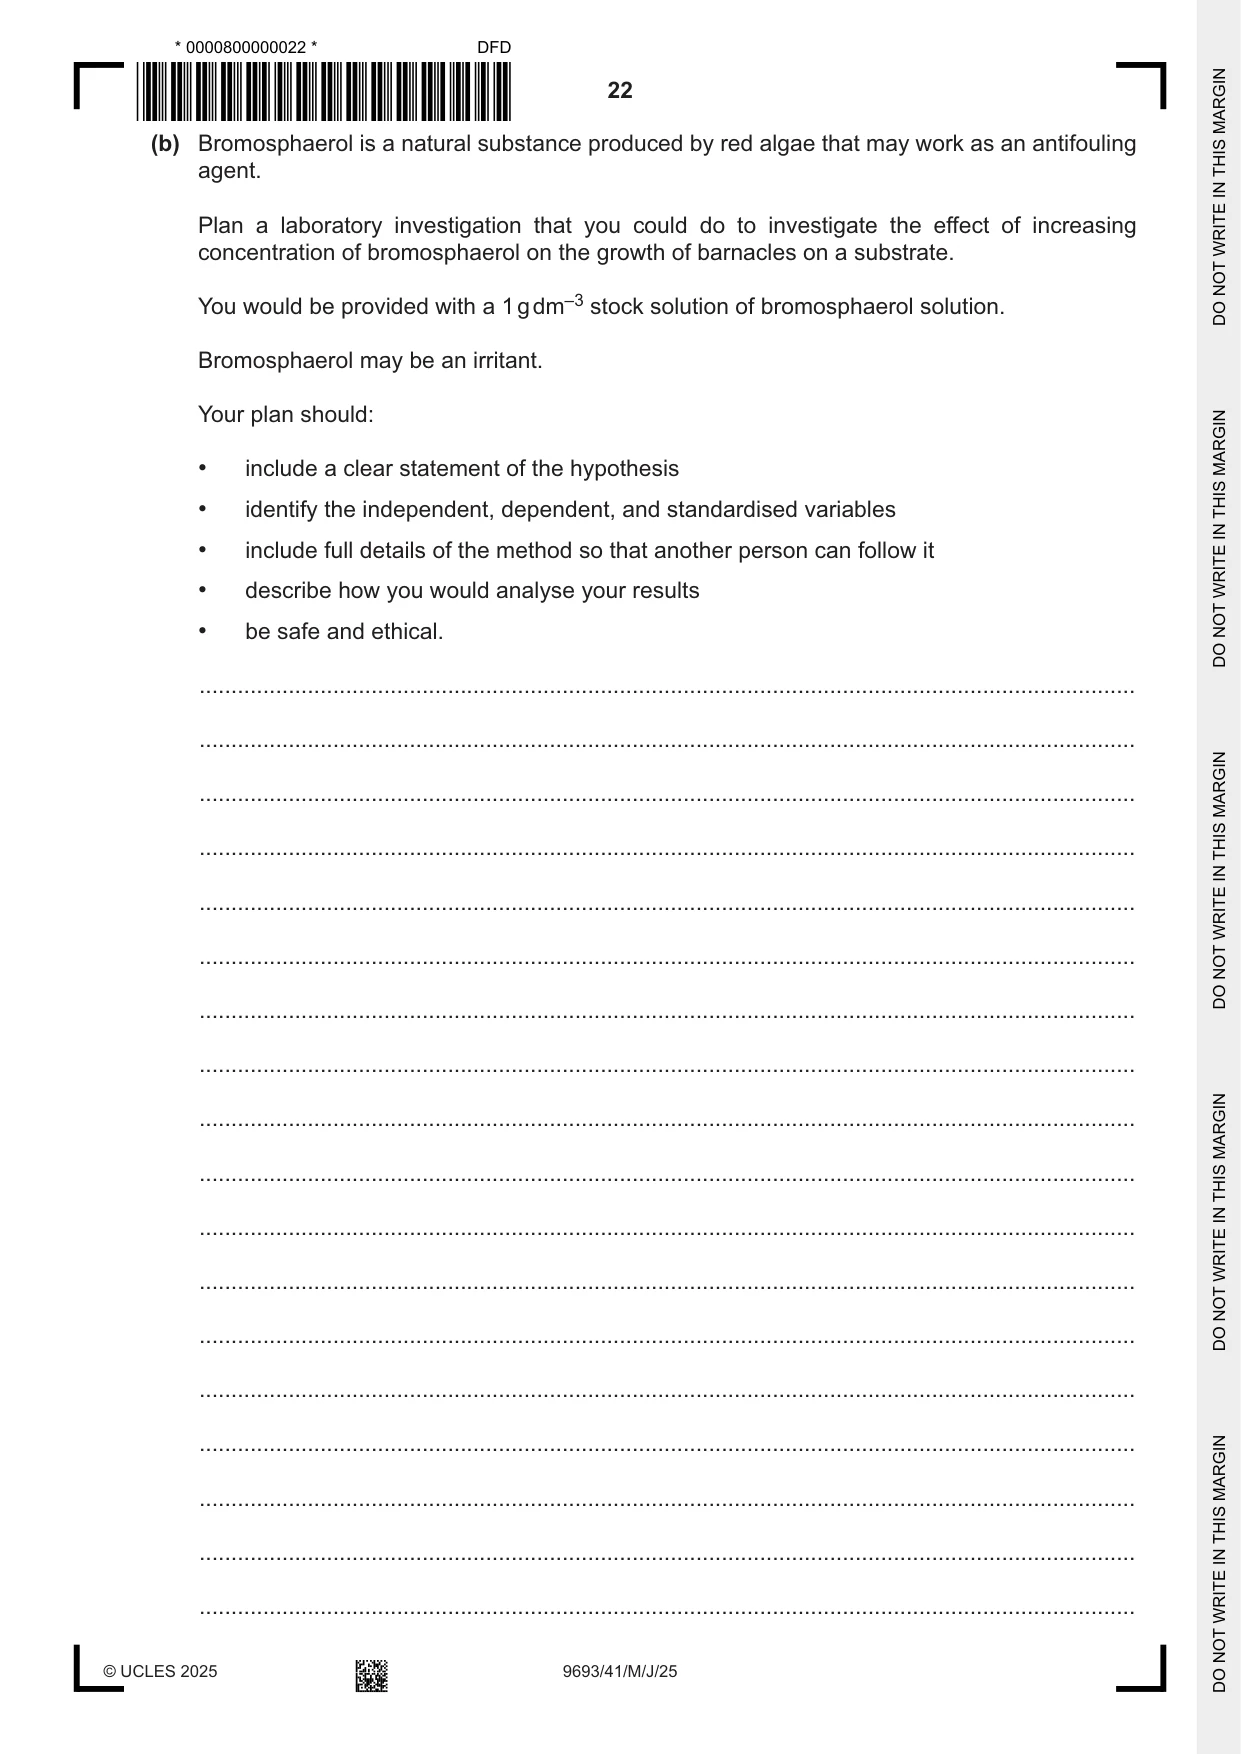
6 Fig. 6.1 shows a photograph of a ship’s rudder and propeller covered in barnacles. Fig. 6.1 Antifouling paints are often used to prevent barnacle larvae settling on boats. (a) Outline why many antifouling paints that contained heavy metals are now banned. ................................................................................................................................................... ................................................................................................................................................... ................................................................................................................................................... ............................................................................................................................................. [2] (b) Bromosphaerol is a natural substance produced by red algae that may work as an antifouling agent. Plan a laboratory investigation that you could do to investigate the effect of increasing concentration of bromosphaerol on the growth of barnacles on a substrate. You would be provided with a 1 g dm–3 stock solution of bromosphaerol solution. Bromosphaerol may be an irritant. Your plan should: • include a clear statement of the hypothesis • identify the independent, dependent, and standardised variables • include full details of the method so that another person can follow it • describe how you would analyse your results • be safe and ethical. ................................................................................................................................................... ................................................................................................................................................... ................................................................................................................................................... ................................................................................................................................................... ................................................................................................................................................... ................................................................................................................................................... ................................................................................................................................................... ................................................................................................................................................... ................................................................................................................................................... ................................................................................................................................................... ................................................................................................................................................... ................................................................................................................................................... ................................................................................................................................................... ................................................................................................................................................... ................................................................................................................................................... ................................................................................................................................................... ................................................................................................................................................... ................................................................................................................................................... ................................................................................................................................................... ................................................................................................................................................... ................................................................................................................................................... ................................................................................................................................................... ................................................................................................................................................... ........................................................................................................................................... [11] [Total: 13]
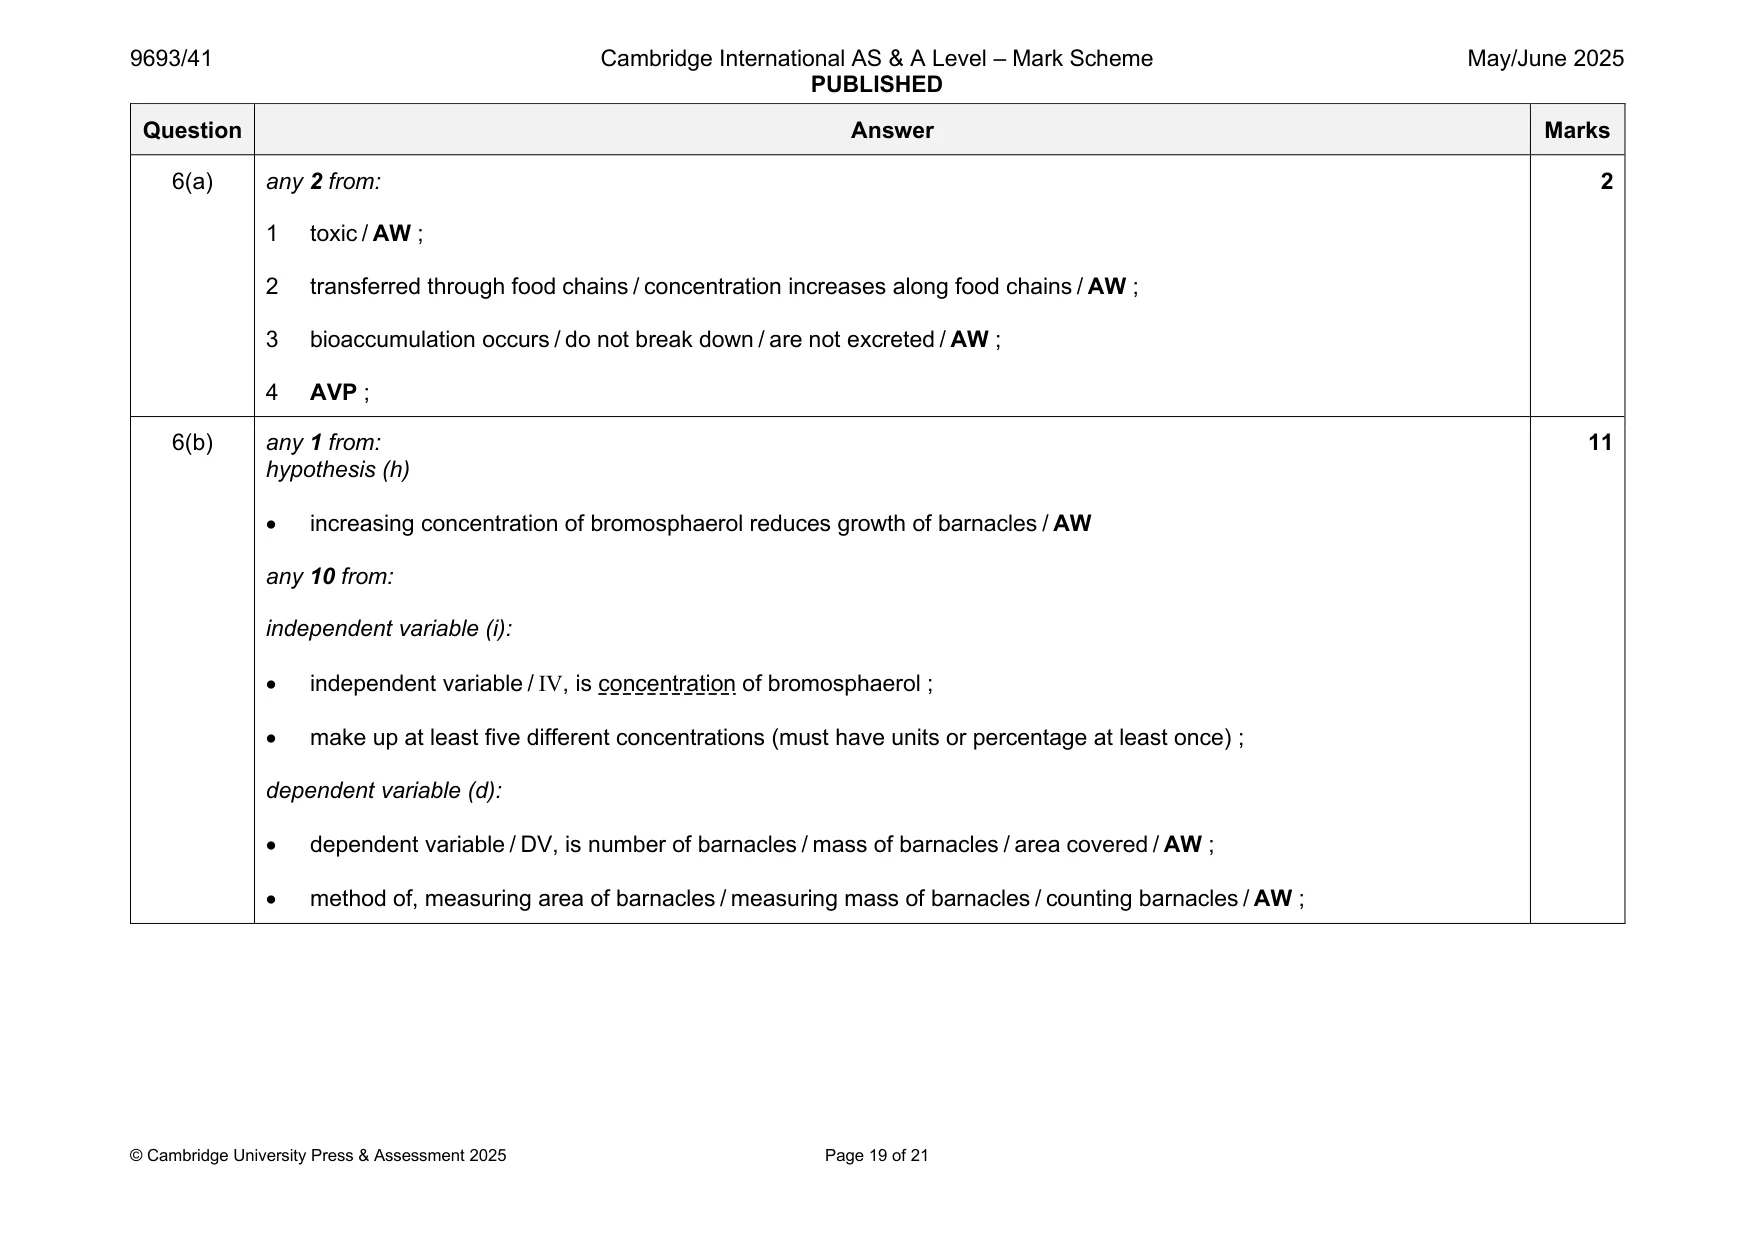
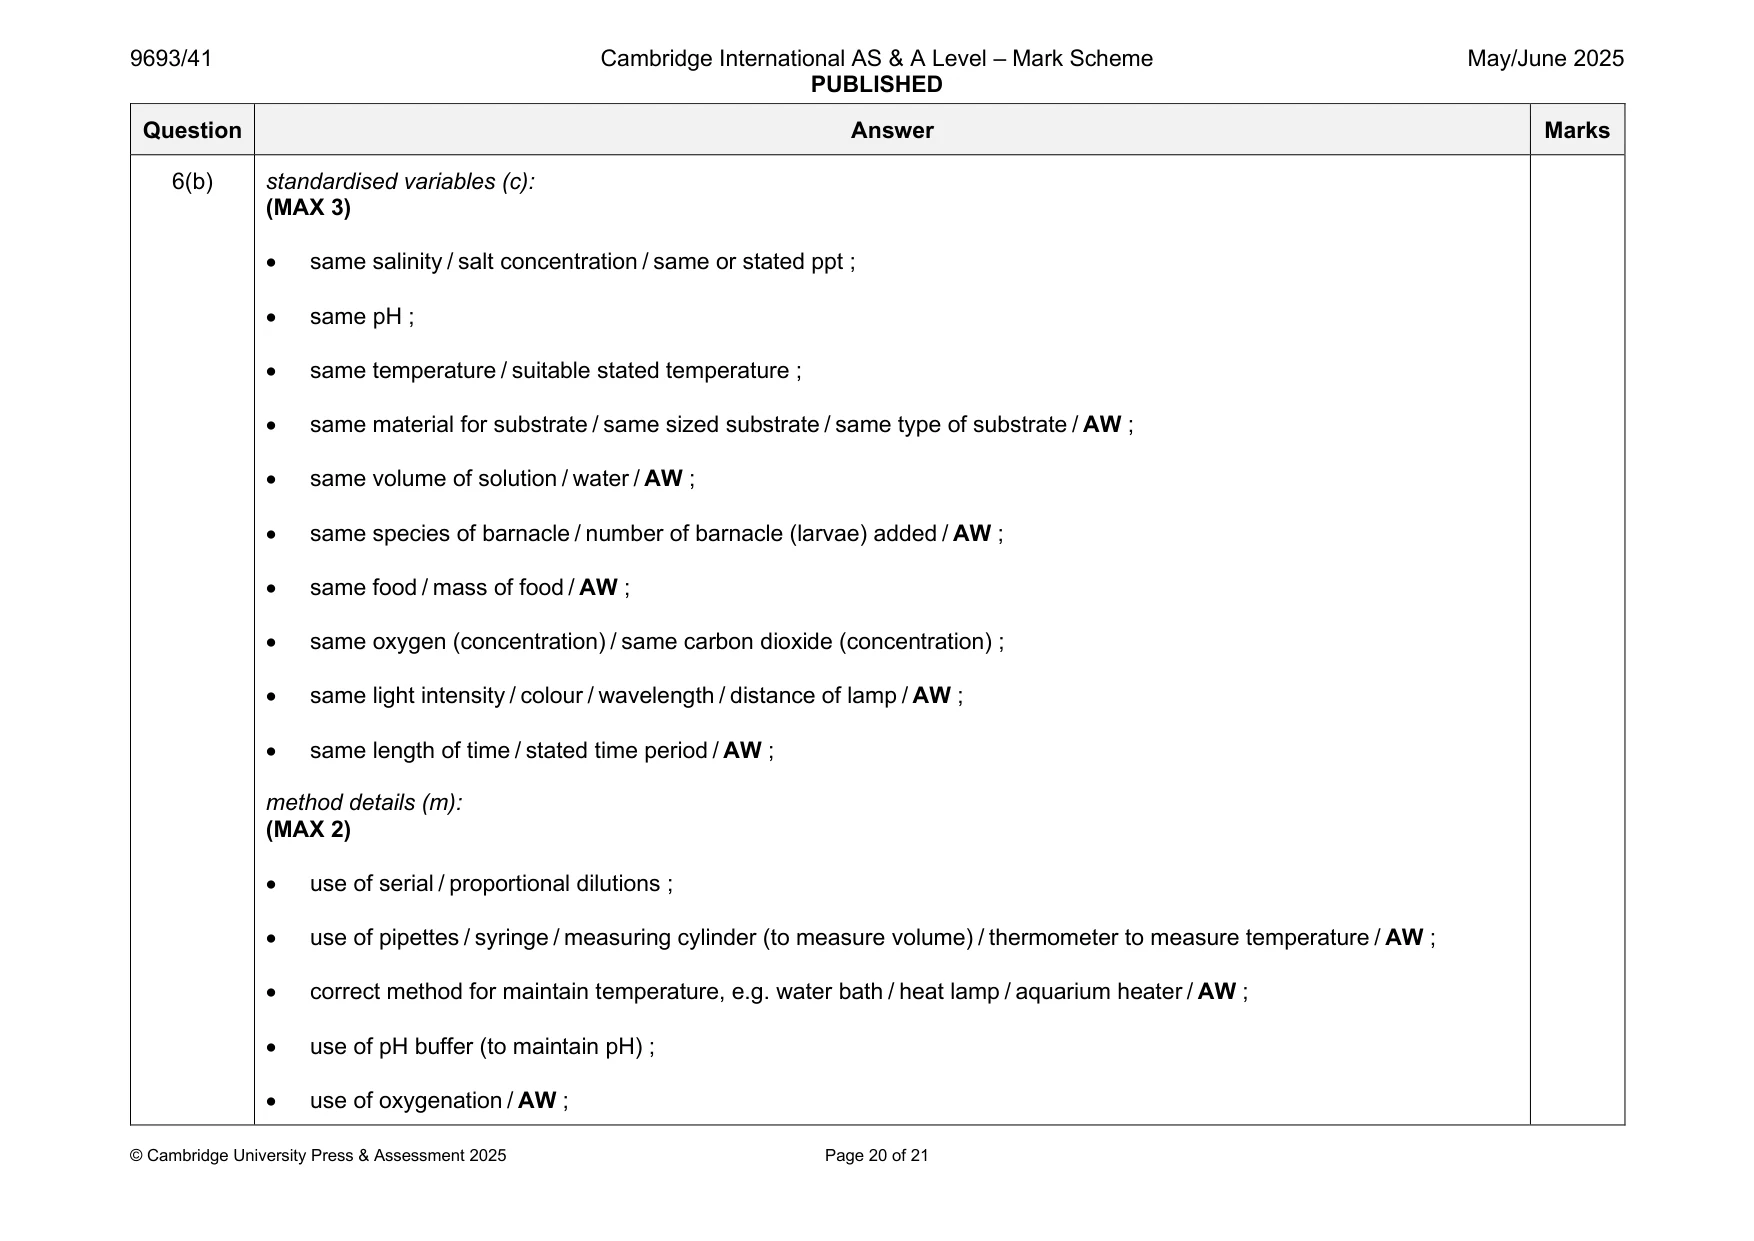
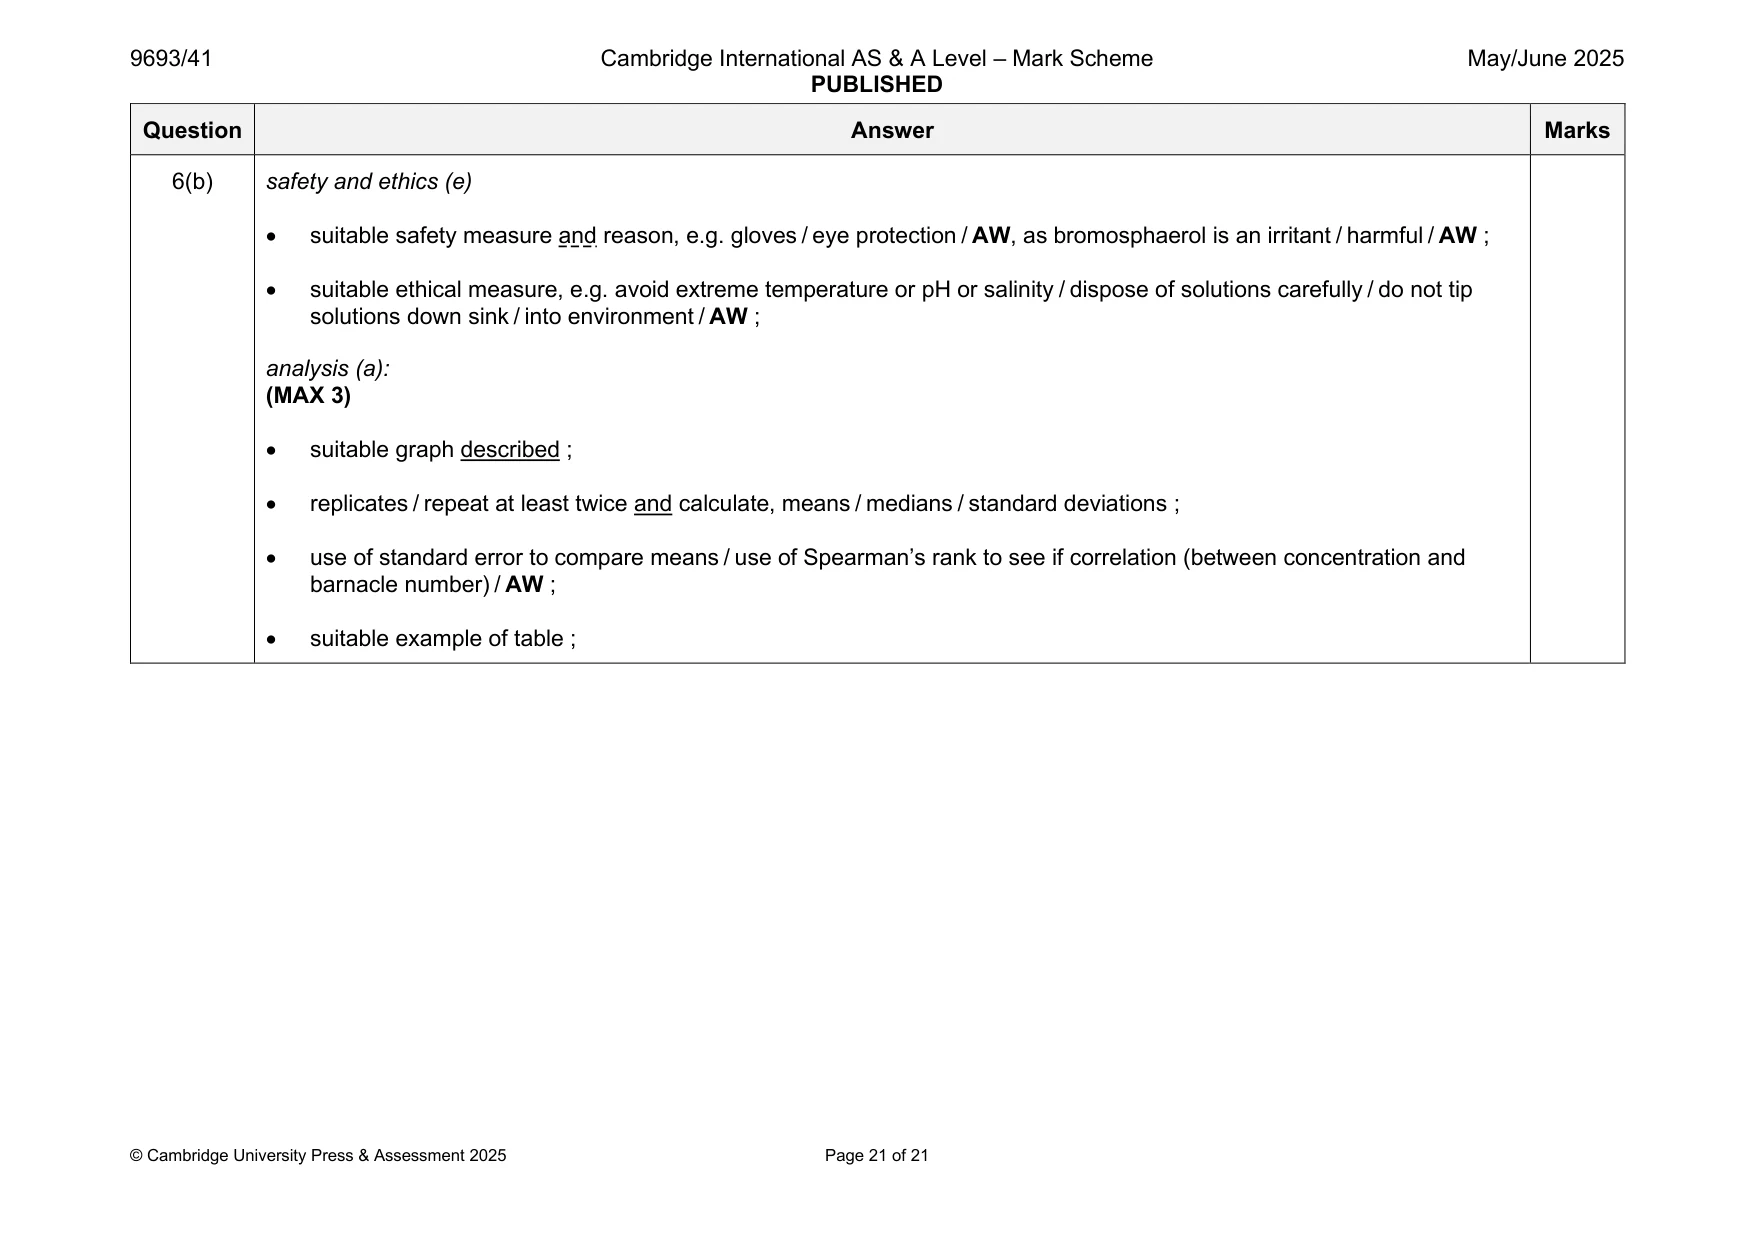
Mark scheme: 6(a) any 2 from: 2 1 toxic / AW ; 2 transferred through food chains / concentration increases along food chains / AW ; 3 bioaccumulation occurs / do not break down / are not excreted / AW ; 4 AVP ; 6(b) any 1 from: 11 hypothesis (h) • increasing concentration of bromosphaerol reduces growth of barnacles / AW any 10 from: independent variable (i): • independent variable / IV, is concentration of bromosphaerol ; • make up at least five different concentrations (must have units or percentage at least once) ; dependent variable (d): • dependent variable / DV, is number of barnacles / mass of barnacles / area covered / AW ; • method of, measuring area of barnacles / measuring mass of barnacles / counting barnacles / AW ; 6(b) standardised variables (c): (MAX 3) • same salinity / salt concentration / same or stated ppt ; • same pH ; • same temperature / suitable stated temperature ; • same material for substrate / same sized substrate / same type of substrate / AW ; • same volume of solution / water / AW ; • same species of barnacle / number of barnacle (larvae) added / AW ; • same food / mass of food / AW ; • same oxygen (concentration) / same carbon dioxide (concentration) ; • same light intensity / colour / wavelength / distance of lamp / AW ; • same length of time / stated time period / AW ; method details (m): (MAX 2) • use of serial / proportional dilutions ; • use of pipettes / syringe / measuring cylinder (to measure volume) / thermometer to measure temperature / AW ; • correct method for maintain temperature, e.g. water bath / heat lamp / aquarium heater / AW ; • use of pH buffer (to maintain pH) ; • use of oxygenation / AW ; 6(b) safety and ethics (e) • suitable safety measure and reason, e.g. gloves / eye protection / AW, as bromosphaerol is an irritant / harmful / AW ; • suitable ethical measure, e.g. avoid extreme temperature or pH or salinity / dispose of solutions carefully / do not tip solutions down sink / into environment / AW ; analysis (a): (MAX 3) • suitable graph described ; • replicates / repeat at least twice and calculate, means / medians / standard deviations ; • use of standard error to compare means / use of Spearman’s rank to see if correlation (between concentration and barnacle number) / AW ; • suitable example of table ;
What was in this paper
The subtopics covered by these 6 questions, and how many questions each got. Open one in a new tab to see every Cambridge question on it.
What you needed in this session
Cambridge’s own grade thresholds for 2025 May/June, Paper 4 · Variant 1. A higher threshold means an easier paper — the bar moves with how the cohort did.