Questions as text
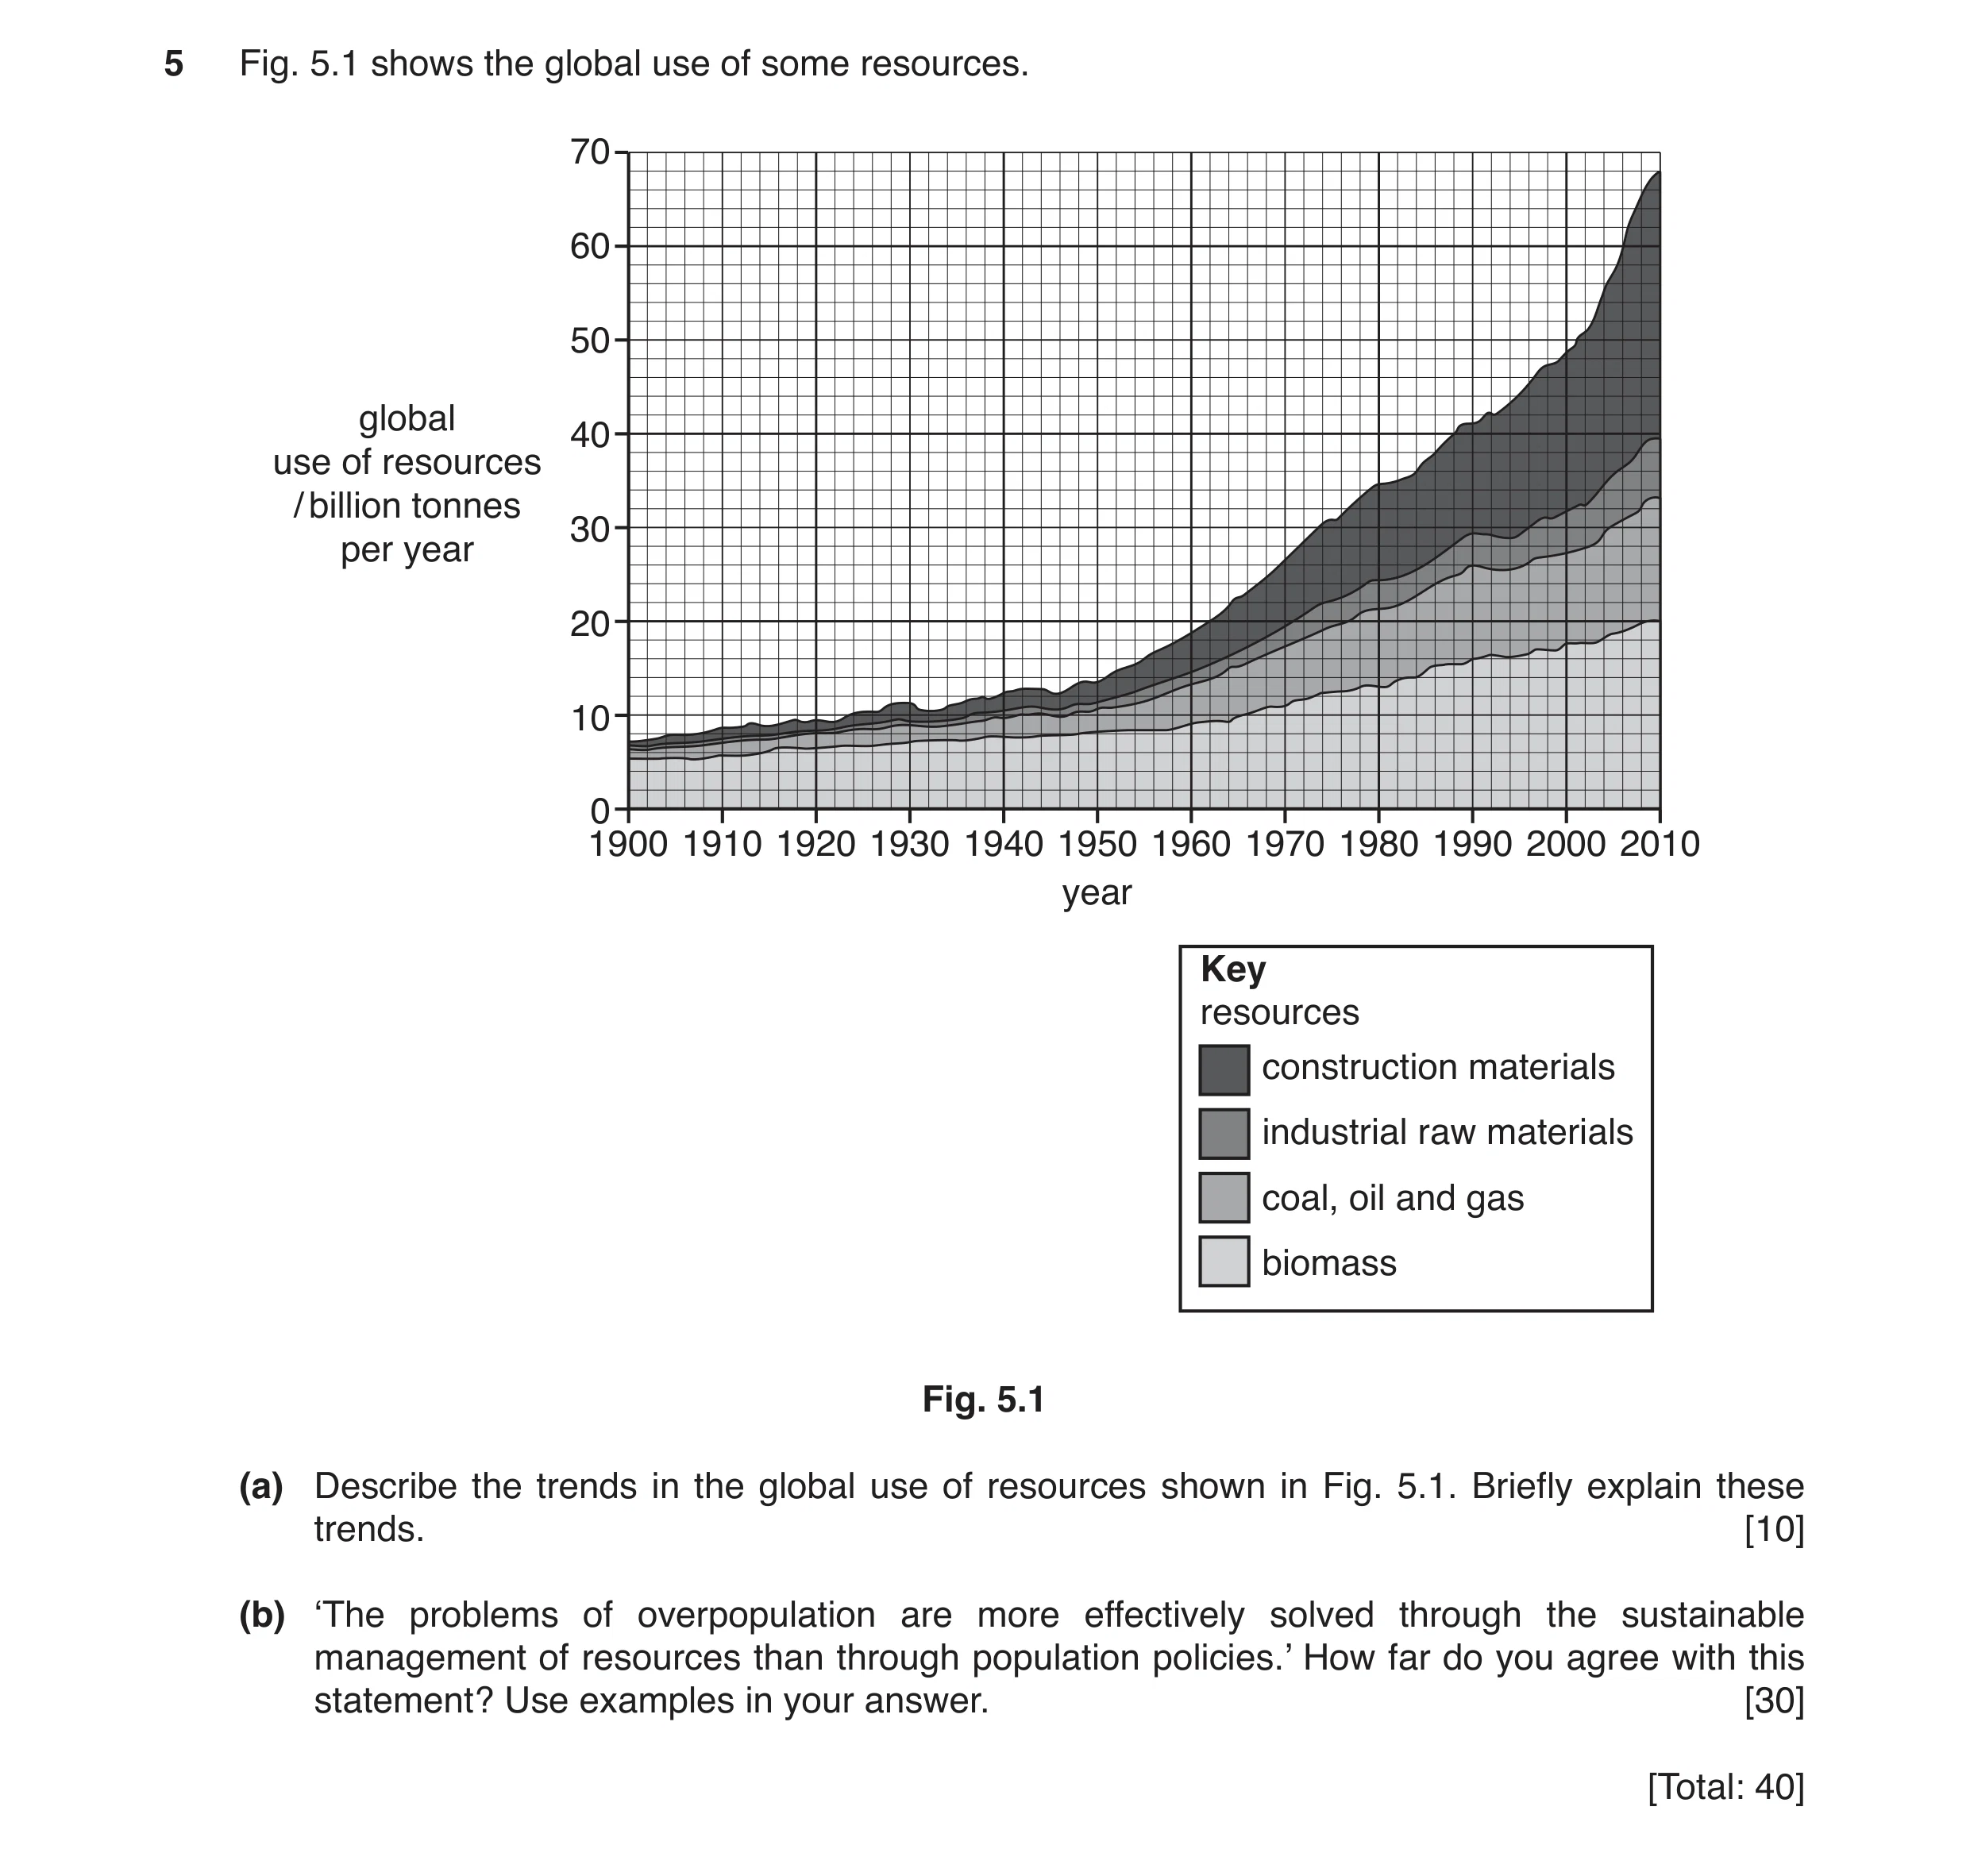
Q1 · The global use of some resources 8291/22 Oct/Nov 2017
5 Fig. 5.1 shows the global use of some resources. 70 60 50 global 40 use of resources / billion tonnes 30 per year 20 10 0 1900 1910 1920 1930 1940 1950 1960 1970 1980 1990 2000 2010 year Key resources construction materials industrial raw materials coal, oil and gas biomass Fig. 5.1 (a) Describe the trends in the global use of resources shown in Fig. 5.1. Briefly explain these trends. [10] (b) ‘The problems of overpopulation are more effectively solved through the sustainable management of resources than through population policies.’ How far do you agree with this statement? Use examples in your answer. [30] [Total: 40]
40 marks
Mark scheme: 5(a) Trends show overall increases in the use of all resources with the largest increase in the use of construction materials from 1 billion tonnes in 1900 to 28 billion tonnes in 2010 while biomass has increased from 6 billion to 20 billion. There is a lower rate of increase between 1900 and 1950 followed by a higher rate of increase in the use of all resources between 1960 and 2010, particularly in the use of construction resources since 2000. There are fluctuations in the changes and some anomalies to the overall increasing trend with decreases in the use of resources in some years, for example in construction materials 1944–45 or the use of industrial raw materials 1990–94. Increases in the use of resources are linked to population growth and economic development. Increased urbanisation, large urban construction projects and infrastructure development have increased the demand for construction resources. Industrial development and population growth and particularly the increase in large newly industrialised countries have increased demand for both industrial raw materials and energy resources. The use of alternative, renewable energy resources may explain the slowing in the rate of increase in the use of coal, gas and oil resources since 2000. An increase in biomass is due to increased demand for food resources by an increasing global population, and in the demand for biomass as a renewable energy resource. Please use level descriptors 1 10 Answer requires a description of the trends for resources and the use of use of data from Fig. 3.1.together with reasons linked to specific resources. Award 4 marks for description 2 marks for use of data and 4 for explanation. Question Answer Marks Guidance 5(b) The question requirements are: to consider policies affecting the size of the population to prevent overpopulation to consider the sustainable use of resources by a population to consider the extent to which the sustainable use of resources will be effective in to use examples Indicative content: Policies aimed at controlling population size include for example fertility control, family planning incentives, migration, education and employment opportunities. The sustainable management of resources may include for example, reference to the use of renewable energy resources; a policy of reduce, reuse and recycle; the efficient use of all raw materials; the efficient production of food and sustainable agriculture and pollution control preventing the contamination of water resources. It may be suggested that the carrying capacity of a country can be increased through the sustainable use of resources thereby supporting a larger population and reducing problems of overpopulation. Alternatively It may be argued that some countries have already reached or are close to the carrying capacity, thus using resources sustainably and sustainable management cannot solve overpopulation issues. Please use level descriptors 2 30 Section A and Section B descriptor levels: Descriptor Award Mark Consistently meets the level criteria Mark at top of level Meets the criteria, but with some inconsistency Middle, mark to just below top mark Meets most of level criteria, but not all convincingly Just below middle, mark to just above bottom mark On the borderline of this level and the one below Mark at bottom of level Section A and Section B descriptor levels: Section B (part a), Level descriptors 1 8–10 marks The response: • contains few errors • shows a very good understanding of the question • shows a good use of data or the information provided, where appropriate • provides a balanced answer 5–7 marks The response: • may contain some errors • shows an adequate understanding of the question • shows some use of data or the information provided, where appropriate • may lack balance 1–4 marks The response: • may contains errors • shows limited understanding of the question • shows little or no use of data or the information, where appropriate • lacks balance Section A and Section B descriptor levels: Section B (part b): Level descriptors 2 Responses: Level one, 25–30 marks • fulfil all the requirements of the question • contain a very good understanding of the content required • contain a very good balance of content • contain substantial critical and supportive evaluations • make accurate use of relevant vocabulary Level two, 19–24 marks • fulfil most of the requirements of the question • contain a good understanding of the content required • contain a good balance of content • contain some critical and supportive evaluations • make good use of relevant vocabulary Level three, 13–18 marks • fulfil some requirements of the question • contain some understanding of the content required • may contain some limited balance of content • may contain brief evaluations • make some use of relevant vocabulary Level four, 6–12 marks • fulfil limited requirements of the question • contain limited understanding of the content required • may contain poorly balanced content • may not contain evaluations • make limited use of relevant vocabulary Section A and Section B descriptor levels: Level five, 1–5 marks • fulfil a few of the requirements of the question • contain a very limited understanding of the content required • are likely to be unbalanced and undeveloped • evaluative statements are likely to be missing • make no use of relevant vocabulary
This question in 8291/22 Oct/Nov 2017
Question 2 8291/21 May/June 2018
2 Fig. 2.1 contains information about the Mekong river basin in Southeast Asia and the sites of some dam-building projects. CHINA Snow and glacier melt is the main source of VIETNAM freshwater in the upper course of the river.MYANMAR Hanoi Gulf of Tonkin LAOS The river flow is influenced by the monsoon rains (May to October). Vientiane THAILAND Bangkok CAMBODIA Phnom Penh The Mekong delta: Gulf of Thailand VIETNAM • is an area of low land where the Mekong river splits into smaller rivers • is inundated by saltwater Mekong delta when river flow is low during the dry season (November to April) South China Sea • is a major rice-growing N region of the world • has a population of 0 200 km approximately 17 million. Key capital city agriculture Mekong river basin boundary forested area Mekong river land outside Mekong river basin dam-building projects sea national boundary lake Fig. 2.1 (a) (i) With reference to the information in Fig. 2.1, explain why the Mekong delta is prone to flooding. … … … … … … … … [4] (ii) Explain how global warming could impact on the environment and on the population in areas such as the Mekong delta. … … … … … … … … … … … … [6] (b) (i) Outline two benefits of dam-building projects, such as those shown in Fig. 2.1. … … … … … … … … [4] (ii) Suggest the negative impacts of constructing dams on the Mekong river. Refer to Fig. 2.1 in your answer. … … … … … … … … … … … … [6] [Total: 20]
20 marks
Mark scheme: 2(a)(i) a low-lying area / close to sea level; glacier melt (coincides with); monsoon rainfall / increased precipitation in wet season; increased input of water / river flow / volume / discharge; increase surface run-off; from higher land; reduce infiltration of soil; soil saturation; high water table; less interception in agricultural land due to reduced forest cover; 4 Question Answer Marks 2(a)(ii) environment: increase in temperature; increased melting of glaciers; increased river flow into delta; thermal expansion of sea water; rise in sea level; increased inundation of delta/increased tidal surge; long-term flooding of delta region; salt water intrusion; reduced freshwater stores in river, lake, wetland; salinization of soil; change in hydrological cycle; e.g. increase in storm / frequency / intensity; increased length of dry season; population: effect drinking water supply; effect on rain-fed irrigation; effect on the suitability of land for growing crops; effect on agricultural output of delta; loss of livelihood; migration of population inland; ecological effects; 6 Question Answer Marks 2(b)(i) reservoir stores water during heavy rain / water from glacier melt; for drinking water / domestic use; use in industry; provides a water supply during the dry season; irrigation water for agriculture; extends the growing season ; hydroelectric power generation; electricity supply for cities, e.g. Vientiane; flood protection; control of river flow to lower course of river reducing frequency of downstream flooding; economic value of dams; tourism opportunities; employment opportunities provided by dam building projects; recreation activities; e.g. sailing, fishing; 4 Question Answer Marks 2(b)(ii) effect on the natural flow of water, rate of flow; reduced flow of water to lower course of river; transport of sediments downstream is effected by the build-up of sediment in the dam; reduced supply of nutrients downstream/ reduces soil fertility of farmland in the lower course of the river; effect on agricultural activity; reduced supply of water for rain-fed irrigation; e.g. rice–growing in Mekong Delta; lowering of water table; destruction of wetlands; ecological disruption / effect on freshwater species; effect on freshwater lakes; e.g. reduced supply of water to (Tonle Sap) lake; effect on freshwater fisheries; loss of livelihood for people dependent on the fisheries; increased salinization of delta region; effect on ecosystems destroyed by dam-building; deforestation; dust and noise during dam building; forced displacement of people evicted from their lands and homes; 6
This question in 8291/21 May/June 2018
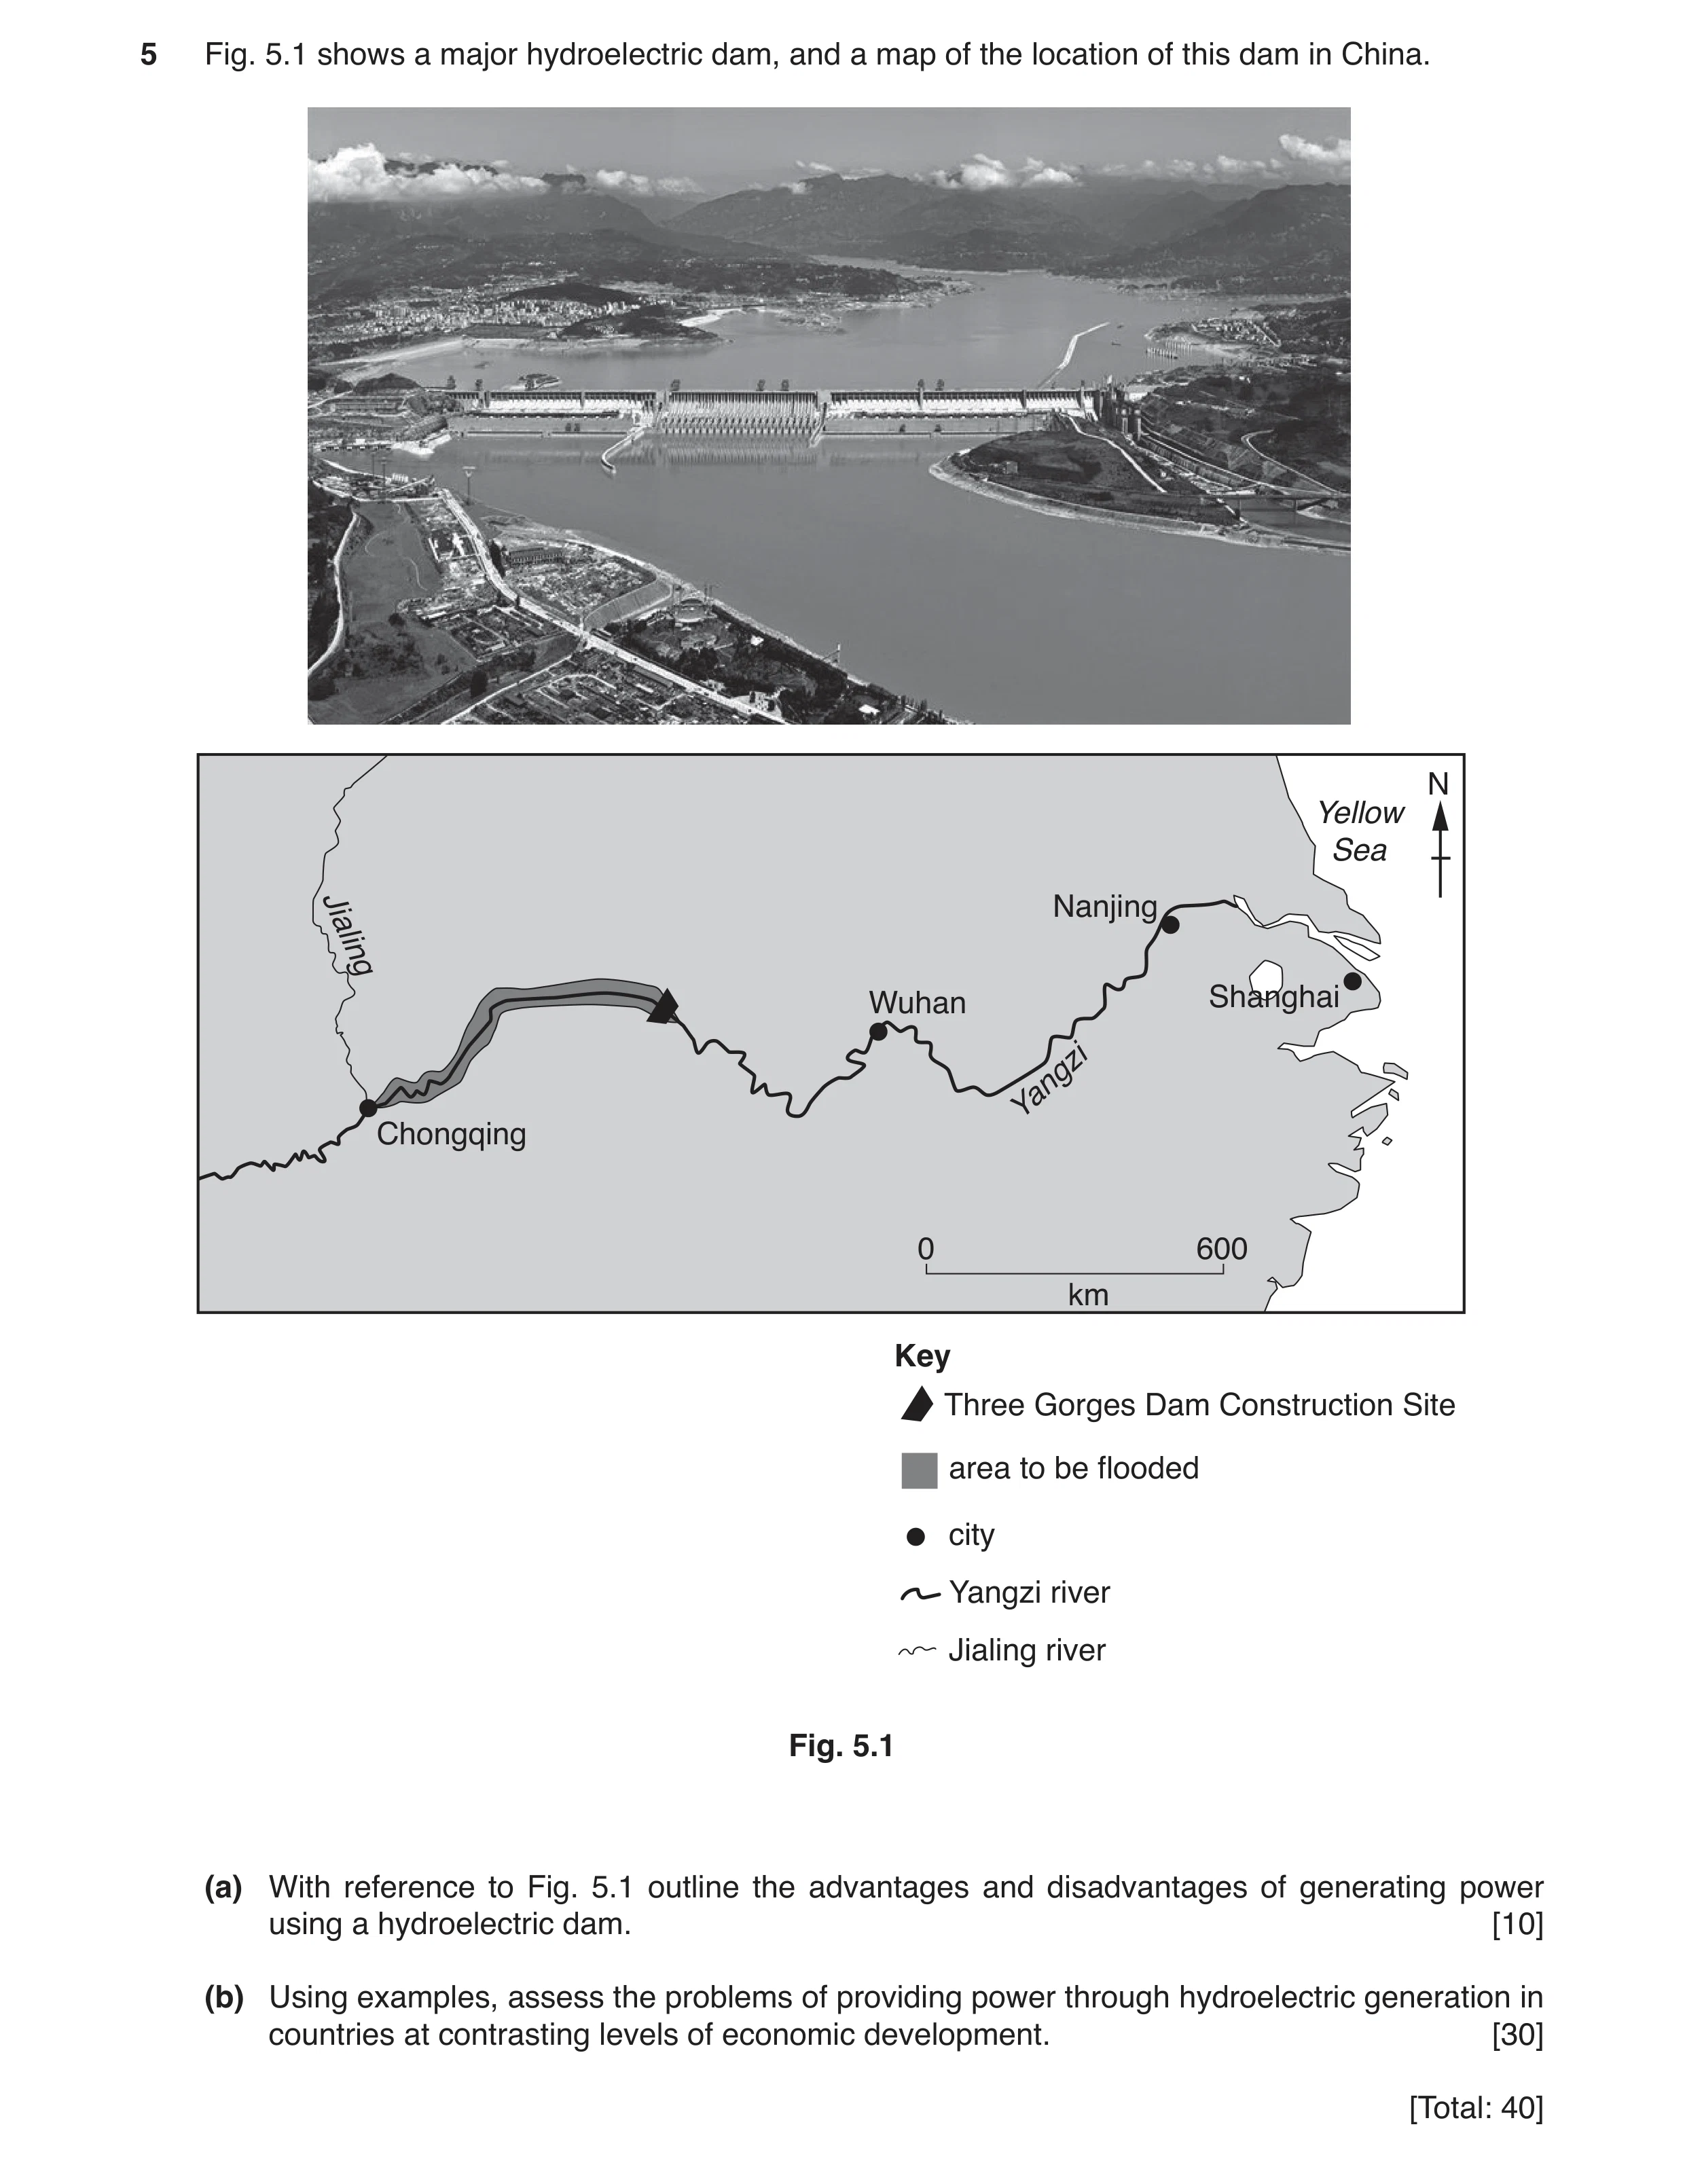
Q3 · A major hydroelectric dam, and a map of the location of this dam in China 8291/22 May/June 2019
5 Fig. 5.1 shows a major hydroelectric dam, and a map of the location of this dam in China. N Yellow Sea Jialing Nanjing Wuhan Shanghai Yangzi Chongqing 0 600 km Key Three Gorges Dam Construction Site area to be flooded city Yangzi river Jialing river Fig. 5.1 (a) With reference to Fig. 5.1 outline the advantages and disadvantages of generating power using a hydroelectric dam. [10] (b) Using examples, assess the problems of providing power through hydroelectric generation in countries at contrasting levels of economic development. [30] [Total: 40]
40 marks
Mark scheme: 5(a) Advantages include ‘renewable’ tag as water isn’t consumed during the process, can generate power continually, can retain water for controlled release to allow generation during peak demand, and once constructed doesn’t generate waste or polluting by-products, they also provide recreational possibilities. Disadvantages include risk of earthquake damage, loss of habitats because of flooding, loss of biodiversity, disruption of fish migration patterns, disruption of human habitation or activities such as farming, pollution including noise pollution during construction, the loss of water flow downstream leading to increased silting, and they are very expensive to construct. Please use level descriptors 1 10 5(b) The question requirements are: • To understand the problems involved in constructing HEP dams • To distinguish between the problems faced by countries with different levels of economic development • To assess the relative impact of HEP schemes in countries with different levels of economic development. HEP dams are very expensive to set-up and countries with low economic development haven’t the resources to build and often rely on other countries for the construction costs e.g. China are building a lot of dams in Africa in return for access to mineral resources. The power generated doesn’t always benefit the local population, and often these are the people displaced by the construction. Jobs aren’t always generated locally as overseas workers are used. Costs escalate and projects overrun leading to long term financial losses and further weakening the local economy often for decades e.g. Brazil’s Itaipu Dam. More highly developed economies can afford the HEP costs but don’t always have the natural resources to warrant the use of HEP dams. They usually finish construction on time and within budget reducing the financial overburden. These countries also can afford mixed supply sources including solar and wind power. Please use level descriptors 2 30 Section B descriptor levels: Descriptor Award Mark Consistently meets the level criteria Mark at top of level Meets the criteria, but with some inconsistency Middle, mark to just below top mark Meets most of level criteria, but not all convincingly Just below middle, mark to just above bottom mark On the borderline of this level and the one below Mark at bottom of level level descriptors 1 Level one, 8–10 marks The response: • contains few errors • shows a very good understanding of the question • shows a good use of data or the information provided, where appropriate • provides a balanced answer Level two, 5–7 marks The response: • may contain some errors • shows an adequate understanding of the question • shows some use of data or the information provided, where appropriate • may lack balance Level three, 1–4 marks The response: • may contain errors • shows limited understanding of the question • shows little or no use of data or the information, where appropriate • lacks balance Section B descriptor levels: level descriptors 2 Responses: Level one, 25–30 marks • fulfil all the requirements of the question • contain a very good understanding of the content required • contain a very good balance of content • contain substantial critical and supportive evaluations • make accurate use of relevant vocabulary Level two, 19–24 marks • fulfil most of the requirements of the question • contain a good understanding of the content required • contain a good balance of content • contain some critical and supportive evaluations • make good use of relevant vocabulary Level three, 13–18 marks • fulfil some requirements of the question • contain some understanding of the content required • may contain some limited balance of content • may contain brief evaluations • make some use of relevant vocabulary Level four, 6–12 marks • fulfil limited requirements of the question • contain limited understanding of the content required • may contain a poor balance of content • may not contain evaluations • make limited use of relevant vocabulary Section B descriptor levels: Level five, 1–5 marks • fulfil a few requirements of the question • contain a very limited understanding of the content required • are likely to be unbalanced and undeveloped • evaluative statements are likely to be missing • make no use of relevant vocabulary
This question in 8291/22 May/June 2019
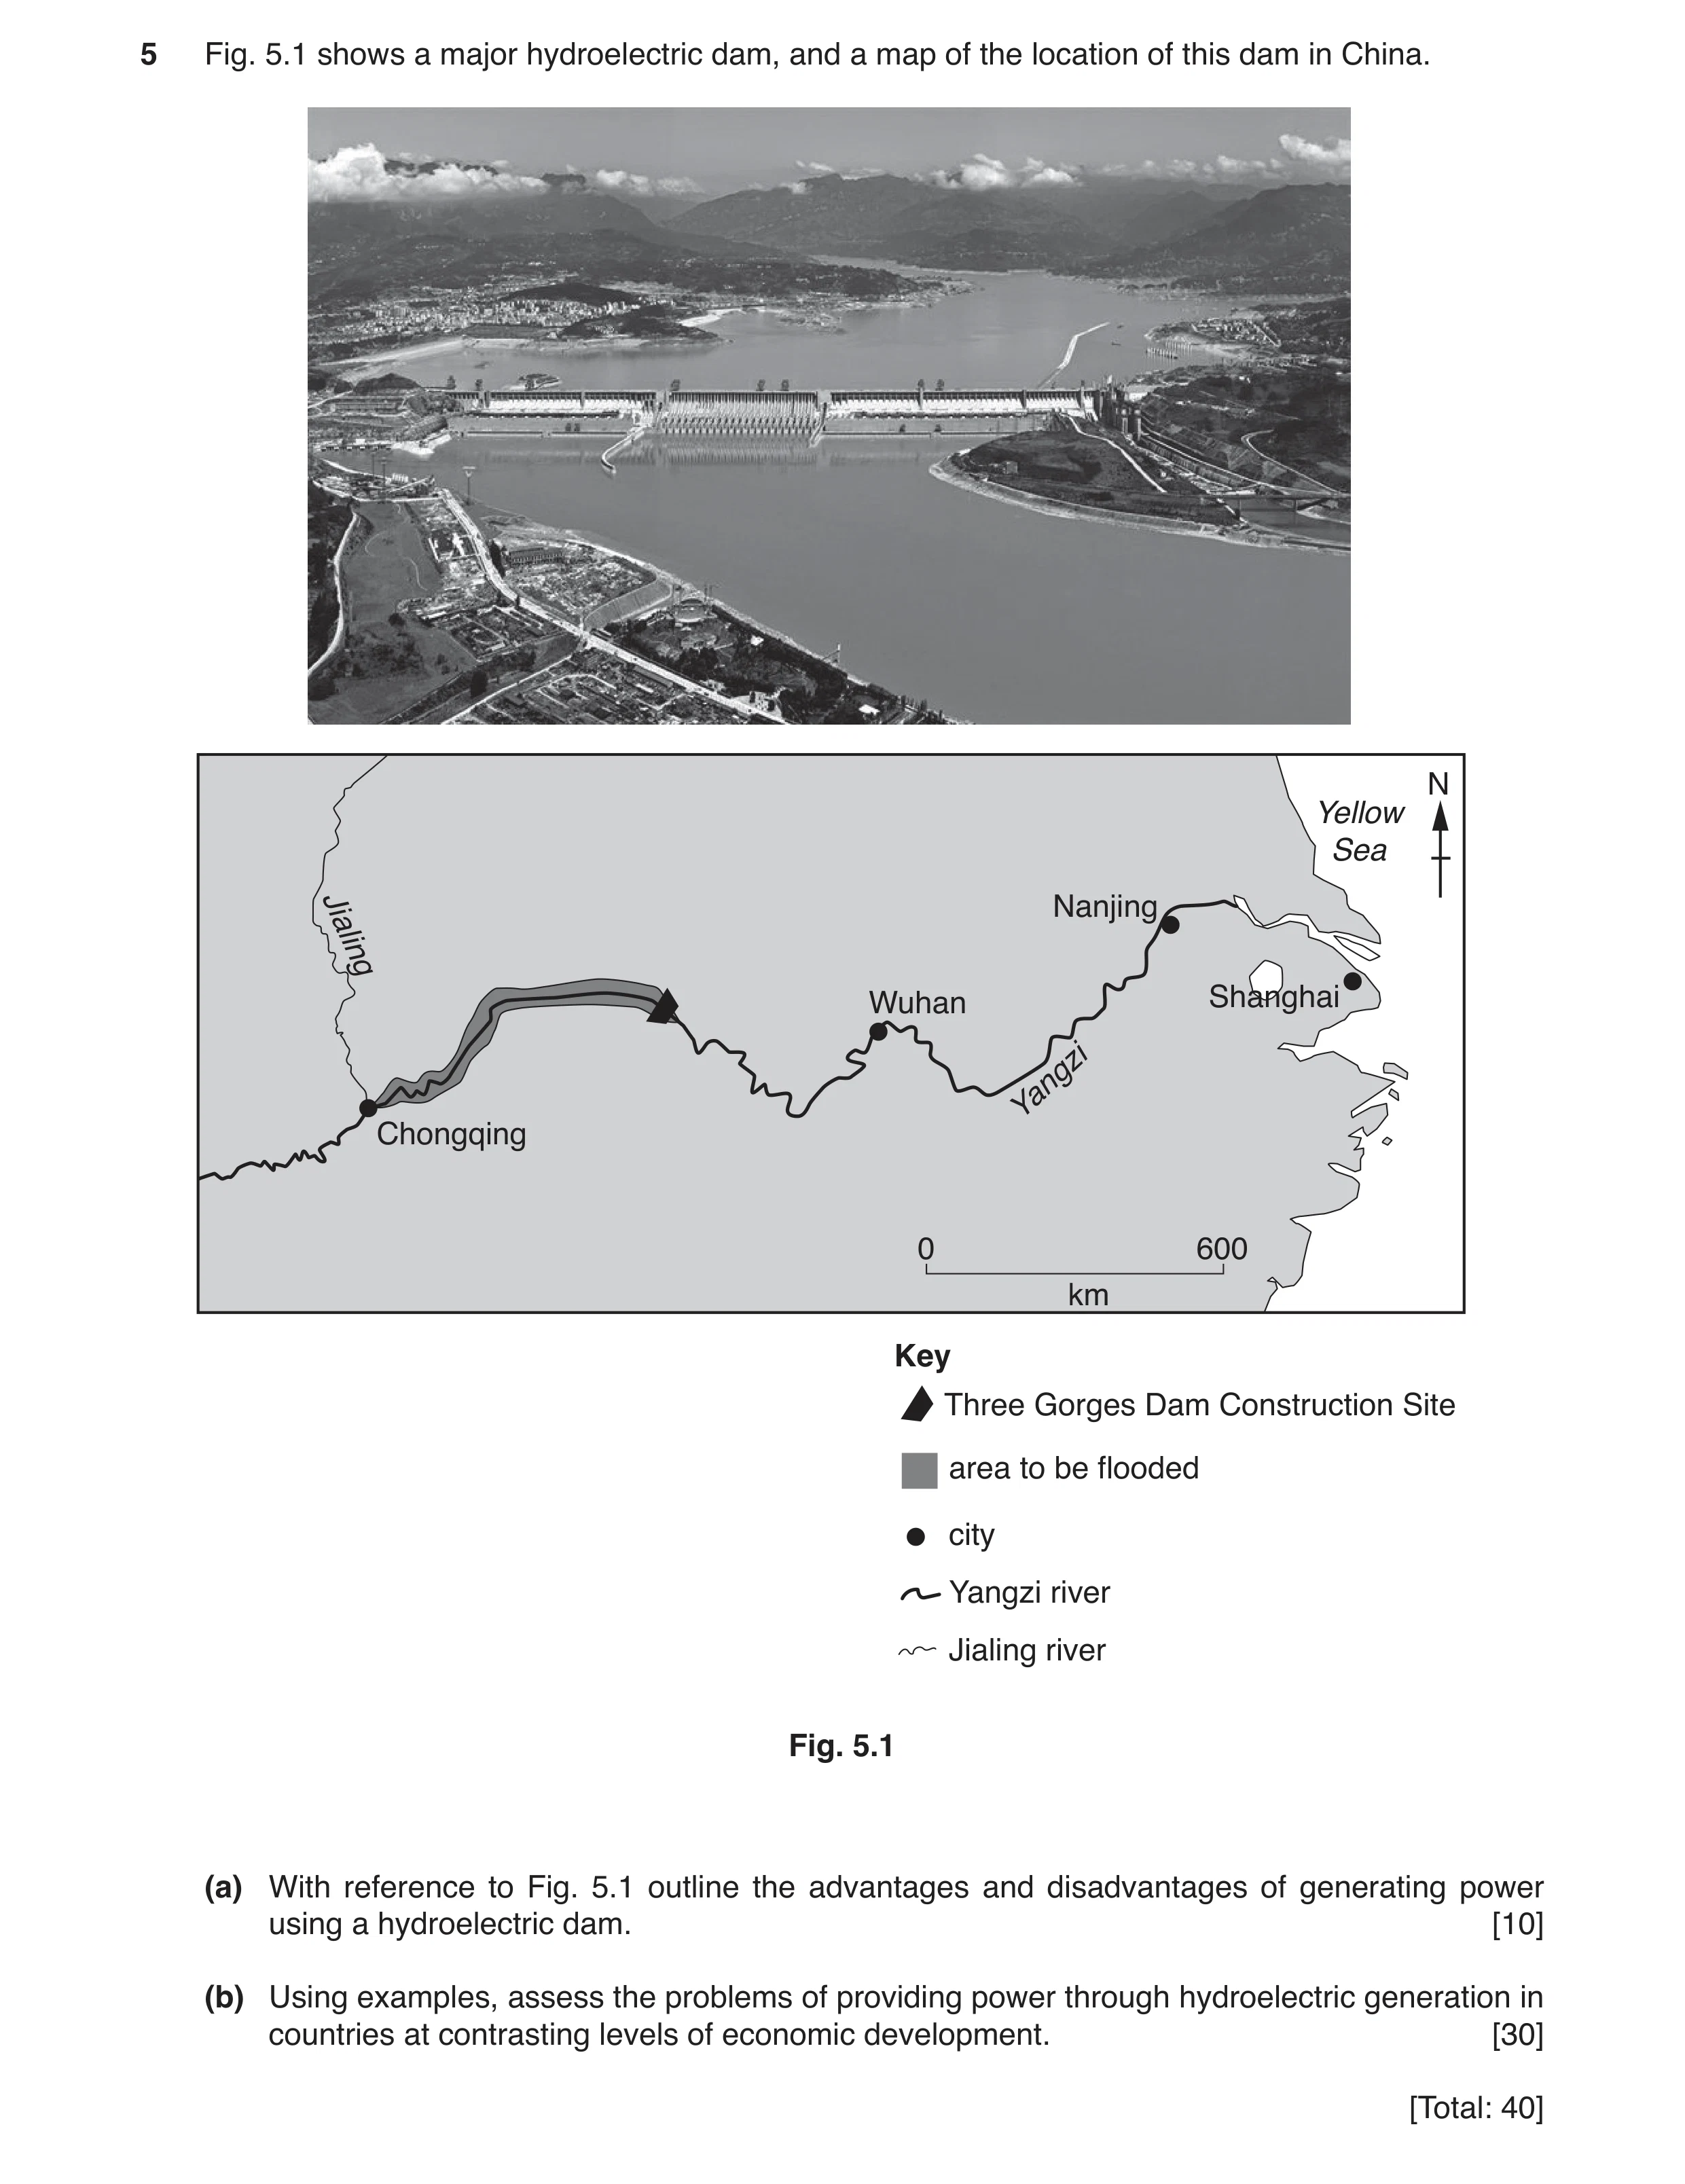
Q4 · A major hydroelectric dam, and a map of the location of this dam in China 8291/23 May/June 2019
5 Fig. 5.1 shows a major hydroelectric dam, and a map of the location of this dam in China. N Yellow Sea Jialing Nanjing Wuhan Shanghai Yangzi Chongqing 0 600 km Key Three Gorges Dam Construction Site area to be flooded city Yangzi river Jialing river Fig. 5.1 (a) With reference to Fig. 5.1 outline the advantages and disadvantages of generating power using a hydroelectric dam. [10] (b) Using examples, assess the problems of providing power through hydroelectric generation in countries at contrasting levels of economic development. [30] [Total: 40]
40 marks
Mark scheme: 5(a) Advantages include ‘renewable’ tag as water isn’t consumed during the process, can generate power continually, can retain water for controlled release to allow generation during peak demand, and once constructed doesn’t generate waste or polluting by-products, they also provide recreational possibilities. Disadvantages include risk of earthquake damage, loss of habitats because of flooding, loss of biodiversity, disruption of fish migration patterns, disruption of human habitation or activities such as farming, pollution including noise pollution during construction, the loss of water flow downstream leading to increased silting, and they are very expensive to construct. Please use level descriptors 1 10 5(b) The question requirements are: • To understand the problems involved in constructing HEP dams • To distinguish between the problems faced by countries with different levels of economic development • To assess the relative impact of HEP schemes in countries with different levels of economic development. HEP dams are very expensive to set-up and countries with low economic development haven’t the resources to build and often rely on other countries for the construction costs e.g. China are building a lot of dams in Africa in return for access to mineral resources. The power generated doesn’t always benefit the local population, and often these are the people displaced by the construction. Jobs aren’t always generated locally as overseas workers are used. Costs escalate and projects overrun leading to long term financial losses and further weakening the local economy often for decades e.g. Brazil’s Itaipu Dam. More highly developed economies can afford the HEP costs but don’t always have the natural resources to warrant the use of HEP dams. They usually finish construction on time and within budget reducing the financial overburden. These countries also can afford mixed supply sources including solar and wind power. Please use level descriptors 2 30 Section B descriptor levels: Descriptor Award Mark Consistently meets the level criteria Mark at top of level Meets the criteria, but with some inconsistency Middle, mark to just below top mark Meets most of level criteria, but not all convincingly Just below middle, mark to just above bottom mark On the borderline of this level and the one below Mark at bottom of level level descriptors 1 Level one, 8–10 marks The response: • contains few errors • shows a very good understanding of the question • shows a good use of data or the information provided, where appropriate • provides a balanced answer Level two, 5–7 marks The response: • may contain some errors • shows an adequate understanding of the question • shows some use of data or the information provided, where appropriate • may lack balance Level three, 1–4 marks The response: • may contain errors • shows limited understanding of the question • shows little or no use of data or the information, where appropriate • lacks balance Section B descriptor levels: level descriptors 2 Responses: Level one, 25–30 marks • fulfil all the requirements of the question • contain a very good understanding of the content required • contain a very good balance of content • contain substantial critical and supportive evaluations • make accurate use of relevant vocabulary Level two, 19–24 marks • fulfil most of the requirements of the question • contain a good understanding of the content required • contain a good balance of content • contain some critical and supportive evaluations • make good use of relevant vocabulary Level three, 13–18 marks • fulfil some requirements of the question • contain some understanding of the content required • may contain some limited balance of content • may contain brief evaluations • make some use of relevant vocabulary Level four, 6–12 marks • fulfil limited requirements of the question • contain limited understanding of the content required • may contain a poor balance of content • may not contain evaluations • make limited use of relevant vocabulary Section B descriptor levels: Level five, 1–5 marks • fulfil a few requirements of the question • contain a very limited understanding of the content required • are likely to be unbalanced and undeveloped • evaluative statements are likely to be missing • make no use of relevant vocabulary
This question in 8291/23 May/June 2019
Q5 · A map showing the location of the Belo Monte dam, a hydroelectric power (HEP) project in… 8291/21 Oct/Nov 2020
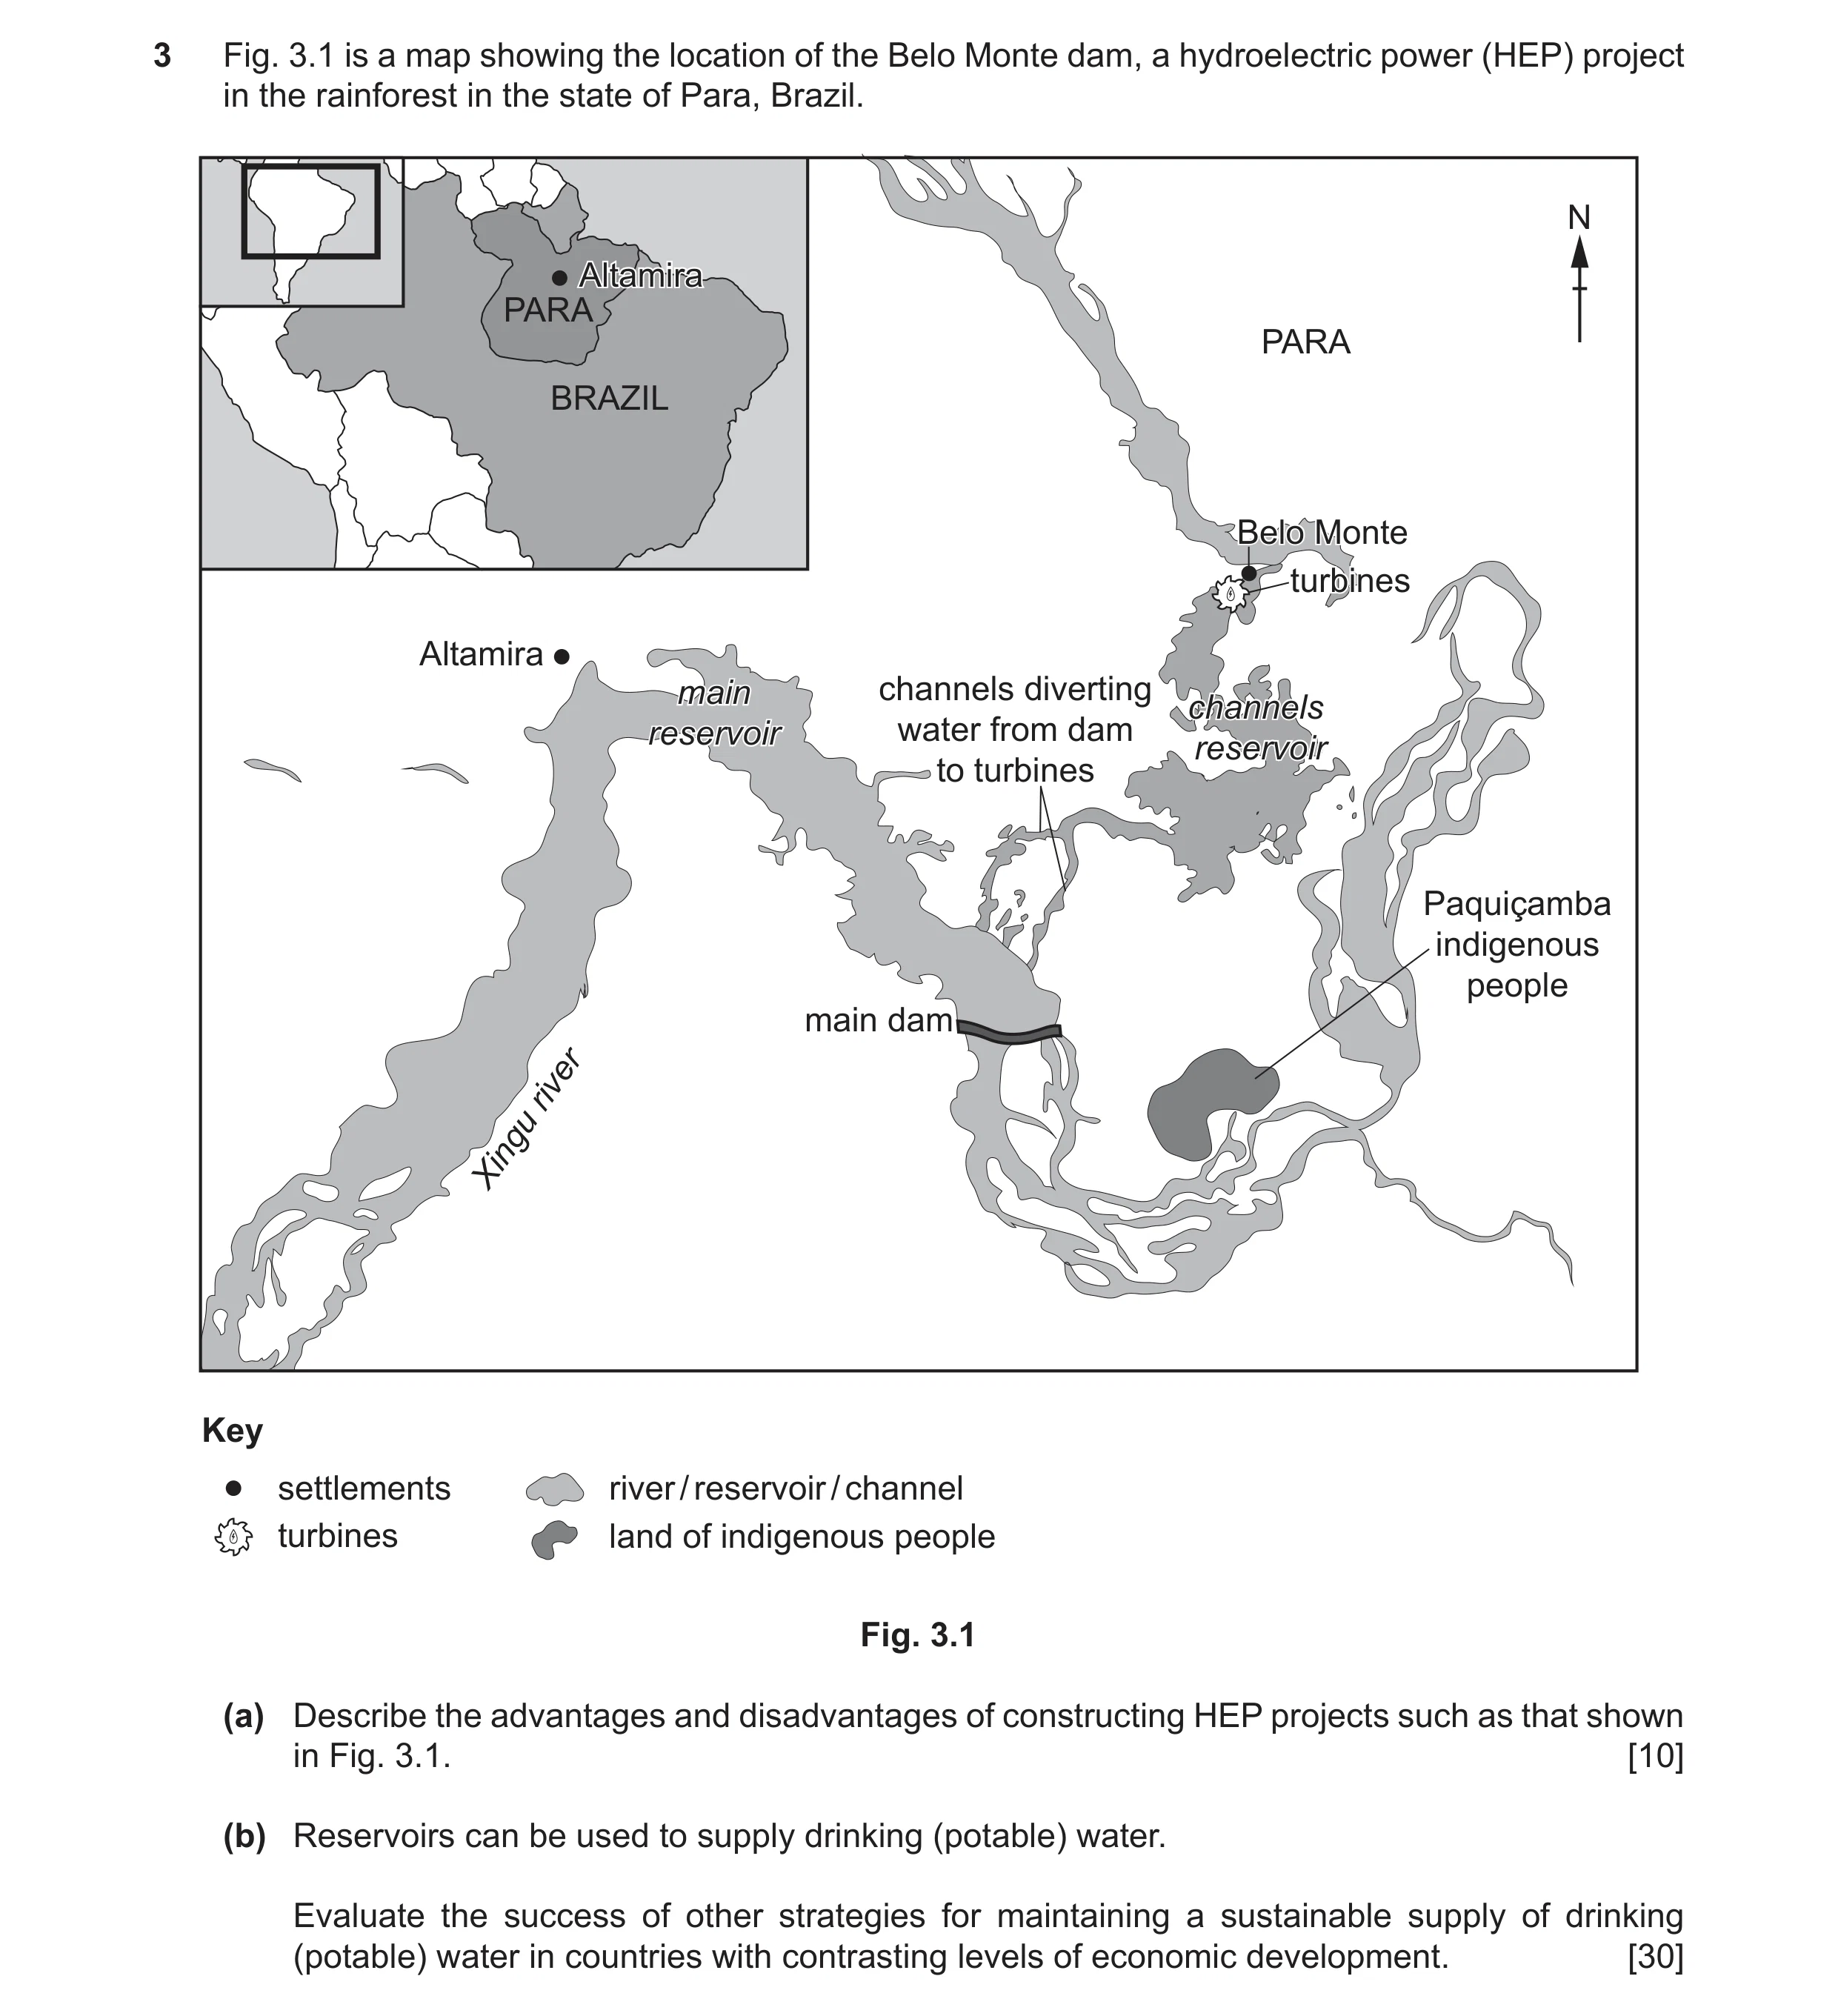
3 Fig. 3.1 is a map showing the location of the Belo Monte dam, a hydroelectric power (HEP) project in the rainforest in the state of Para, Brazil. N AltamiraAltamira PARA PARA BRAZIL BeloBelo MonteMonte turbinesturbines Altamira mainmain channels diverting channelschannels reservoirreservoir water from dam reservoirreservoir to turbines Paquiçamba indigenous people main dam river Xingu Key settlements river / reservoir / channel turbines land of indigenous people Fig. 3.1 (a) Describe the advantages and disadvantages of constructing HEP projects such as that shown in Fig. 3.1. [10] (b) Reservoirs can be used to supply drinking (potable) water. Evaluate the success of other strategies for maintaining a sustainable supply of drinking (potable) water in countries with contrasting levels of economic development. [30]
40 marks
Mark scheme: 3(a) Advantages HEP once built is clean, provides a lot of power, provides areas for recreation, and a habitat for wildlife. Disadvantages During construction habitats destroyed, people displaced, loss of crop growing land, loss of biodiversity, noise and dust pollution. Expensive. 3(b) The question requirements are: • to demonstrate understanding of the range of problems arising from different levels of economic development • to describe different methods of water supply • to assess the relative success of the different strategies used to supply potable water. Indicative content: Appropriate technology used, e.g. wells, boreholes, gravity fed schemes using natural slopes, harvesting rainwater, waste management (use of grey water), reduction of evaporation techniques, improved irrigation and use of drought tolerant crops. Relative merits and success assessed. Where infrastructure is available water supply still must be both sufficient and safe (disease free) so sanitation is also an issue. Ground water stores need preserving, e.g. aquifers. Dams to provide water reservoirs. Desalination is an option if affordable and the country is not landlocked. 30 please use level descriptors 2 please use level descriptors 1
This question in 8291/21 Oct/Nov 2020
Q6 · In 2020, 83% of homes in the United Kingdom combusted natural gas (methane) for heating 8291/21 May/June 2022
1 (a) In 2020, 83% of homes in the United Kingdom combusted natural gas (methane) for heating. In January 2020, a blend of 20% hydrogen gas and 80% natural gas was trialled in 100 homes. The trial cost more than $9 million. When hydrogen is combusted, it generates heat and water. It is estimated that switching to 100% hydrogen gas will save 6 million tonnes of carbon dioxide per year from being emitted into the atmosphere. (i) Explain why alternative fuels to methane are needed. … … … … … … [3] (ii) Suggest two reasons why the trial to replace methane might not be extended to the whole of the United Kingdom. 1 … … 2 … … [2] (iii) Hydrogen can be obtained from methane. This process emits carbon dioxide. State two strategies for removing carbon dioxide once it is in the atmosphere. 1 … … 2 … … [2] (b) Fig. 1.1 shows fossil fuel consumption as a percentage of total energy consumption for high-income economy countries (HICs) and low-income economy countries (LICs) between 1970 and 2015. 100 90 80 70 60 percentage of total energy 50 consumption 40 30 20 10 0 1970 1975 1980 1985 1990 1995 2000 2005 2010 2015 year Key HICs LICs Fig. 1.1 (i) Compare the trends shown in fossil fuel consumption for HICs and LICs shown in Fig. 1.1. … … … … … … … … [4] (ii) Some countries do not have a supply of fossil fuels. They have to import fossil fuels into their country. Explain how this can lead to energy insecurity. … … … … [2] [Total: 13]
13 marks
Mark scheme: 1(a)(i) any three from: (methane is a) greenhouse gas; (methane) contributes to climate change / global warming or described / enhanced greenhouse effect; methane has greater impact (on global warming) than CO2 / methane has higher global warming potential or higher GWP than CO2; (methane is) non-renewable / finite; (alternative source of fuel) increases energy security; non-CO2 emitting gases needed to meet carbon targets / investment in carbon neutral fuels / need to reduce carbon emissions for target / comply with international agreements; 1(a)(ii) any two from: economic reason; lack of infrastructure / may need new equipment; trial might be unsuccessful; alternative energy resources available; trial still uses, methane / greenhouse gas; people against the idea / lack of agreement / large population to convince; 2 1(a)(iii) any two from: carbon capture; named strategy; carbon, storage / sink; M2 named strategy e.g. underground, oceans, aquifers, fossil fuel seams; plant more trees / afforestation / reforestation; 2 Question Answer Marks 1(b)(i) any four comparative trends: higher or more overall consumption in HICs / HICs double; HICs starting % higher; HICs AND LICs overall decrease (from 1970–2015); HICs (steadier) decrease AND LICs fluctuates; comparative year trend or data quote from a HIC AND a LIC to support trend e.g. 1970–1985 LICs increase as HICs decrease / HIC 95(%) LIC at 33(%) in 1970 / HICs use 60–65% more / 1970–2015 or overall HICs slight fluctuation AND LICs more fluctuation; 4 1(b)(ii) any two from: economic issue; reliance on import / reliant on another country; conflict (between countries); delays or disruption in supply e.g. could be cut-of / embargo / restrictions on trade / instability in export country / natural disasters / new laws / climate change quotas; 2
This question in 8291/21 May/June 2022
Q7 · A report stated that 3 billion people cook their food using stoves that require open fires 8291/21 May/June 2022
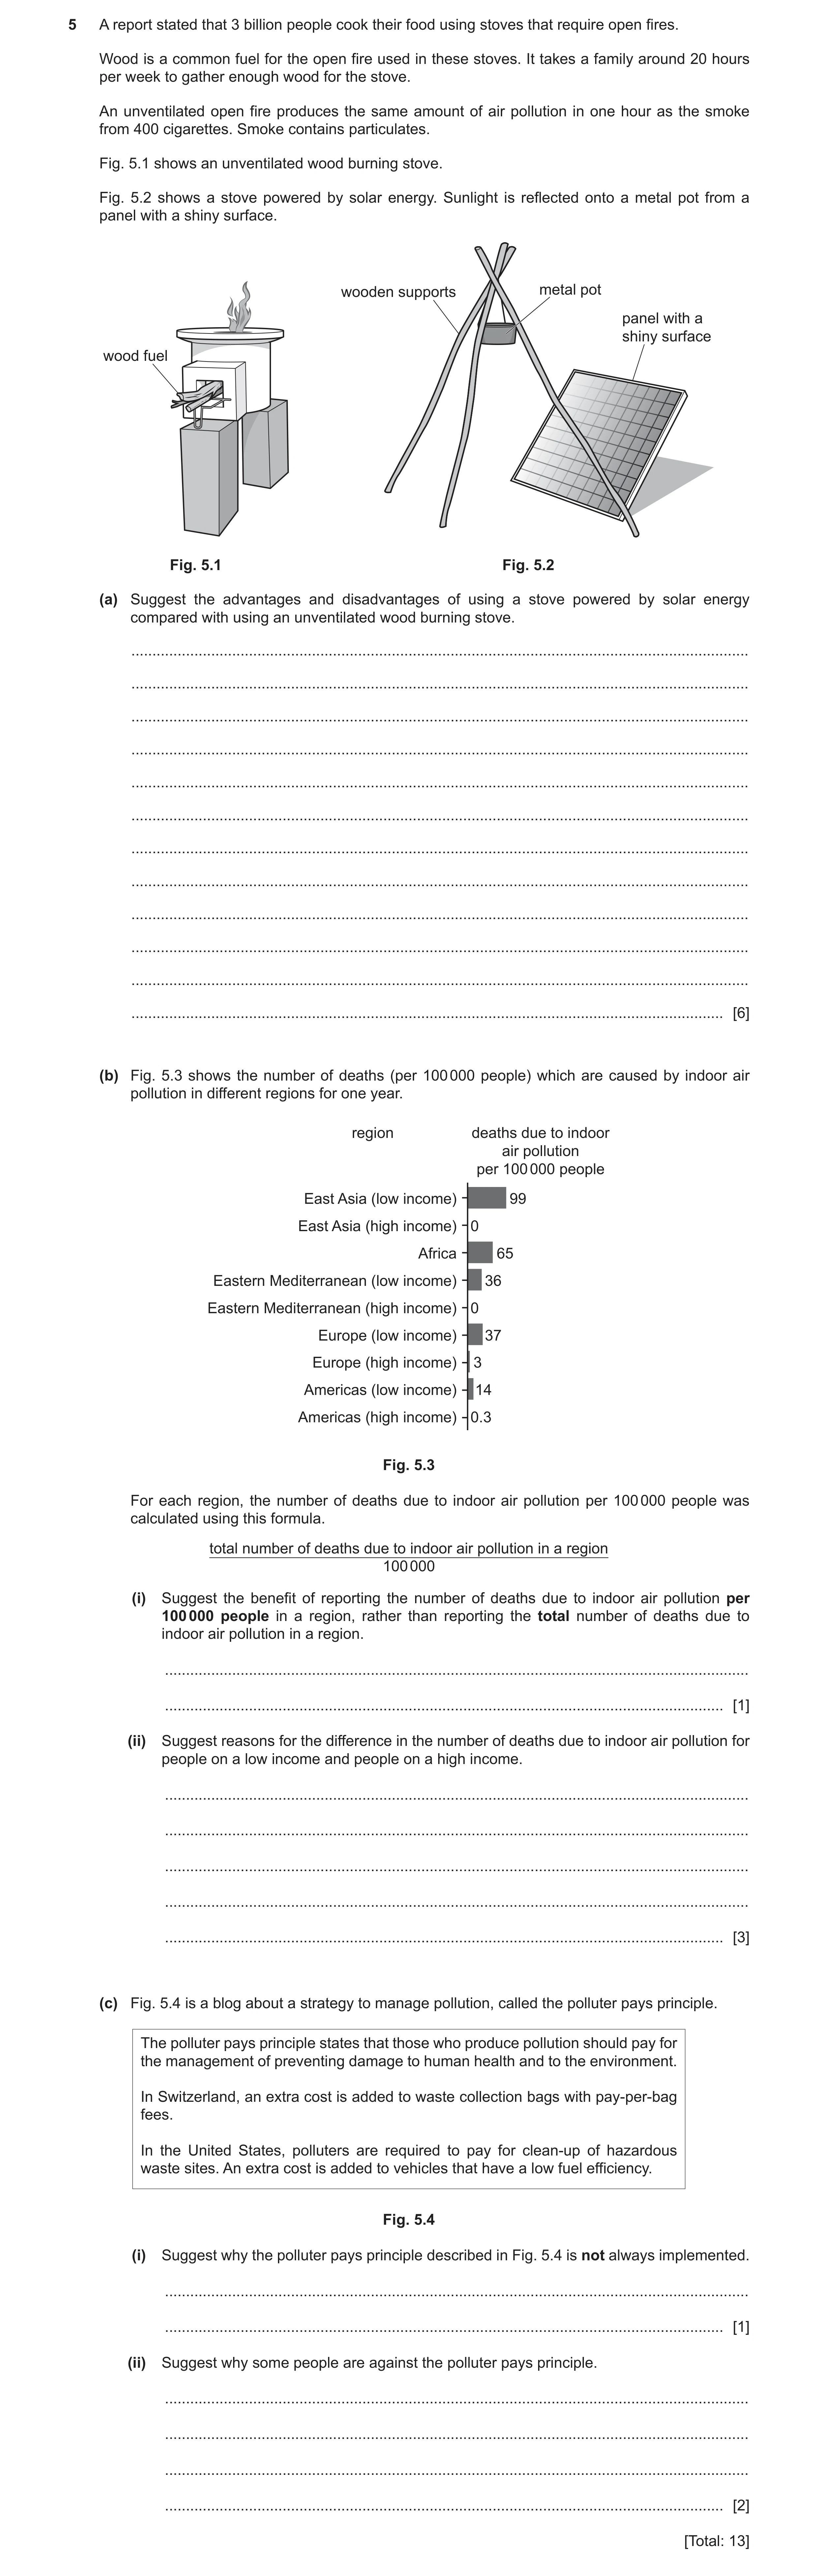
5 A report stated that 3 billion people cook their food using stoves that require open fires. Wood is a common fuel for the open fire used in these stoves. It takes a family around 20 hours per week to gather enough wood for the stove. An unventilated open fire produces the same amount of air pollution in one hour as the smoke from 400 cigarettes. Smoke contains particulates. Fig. 5.1 shows an unventilated wood burning stove. Fig. 5.2 shows a stove powered by solar energy. Sunlight is reflected onto a metal pot from a panel with a shiny surface. wooden supports metal pot panel with a shiny surface wood fuel Fig. 5.1 Fig. 5.2 (a) Suggest the advantages and disadvantages of using a stove powered by solar energy compared with using an unventilated wood burning stove. … … … … … … … … … … … … [6] (b) Fig. 5.3 shows the number of deaths (per 100 000 people) which are caused by indoor air pollution in different regions for one year. region deaths due to indoor air pollution per 100 000 people East Asia (low income) 99 East Asia (high income) 0 Africa 65 Eastern Mediterranean (low income) 36 Eastern Mediterranean (high income) 0 Europe (low income) 37 Europe (high income) 3 Americas (low income) 14 Americas (high income) 0.3 Fig. 5.3 For each region, the number of deaths due to indoor air pollution per 100 000 people was calculated using this formula. total number of deaths due to indoor air pollution in a region 100 000 (i) Suggest the benefit of reporting the number of deaths due to indoor air pollution per 100 000 people in a region, rather than reporting the total number of deaths due to indoor air pollution in a region. … … [1] (ii) Suggest reasons for the difference in the number of deaths due to indoor air pollution for people on a low income and people on a high income. … … … … … [3] (c) Fig. 5.4 is a blog about a strategy to manage pollution, called the polluter pays principle. The polluter pays principle states that those who produce pollution should pay for the management of preventing damage to human health and to the environment. In Switzerland, an extra cost is added to waste collection bags with pay-per-bag fees. In the United States, polluters are required to pay for clean-up of hazardous waste sites. An extra cost is added to vehicles that have a low fuel efficiency. Fig. 5.4 (i) Suggest why the polluter pays principle described in Fig. 5.4 is not always implemented. … … [1] (ii) Suggest why some people are against the polluter pays principle. … … … … [2] [Total: 13]
13 marks
Mark scheme: 5(a) for solar stove: max [5] advantages of solar stove: renewable energy; solar energy or sun is free to use; uses existing / local / same, materials for stove; saves time collecting fuel; does not produce smoke / smog / particulates / carbon dioxide emissions / produce carbon monoxide / less air pollution; does not cause respiratory disease / breathing difficulties / lung cancer / eye irritation / stated condition related to CO / named condition; not cutting down trees / less deforestation ; less risk of (uncontrolled) fires max [5] disadvantages of solar stove: expense of shiny surface; less reliable / can only be used, when or where sunny / at certain times of day / mealtimes must fit in with weather / less flexible use; used outside; not sturdy construction; food takes longer to cook; does not provide ash for use on soils; harder to build shiny surface / don’t have skills to self-build a shiny surface; 6 5(b)(i) any one from: regions can be (directly) compared; different regions have different numbers of people; 1 5(b)(ii) any three from low income people: greater number of homes with indoor wood / dung / open fire / unventilated stoves; have less access to electricity / less supply of (natural) gas / no alternatives to current fuel; homes not ventilated / limited technology or advancements; have more people per home / homes overcrowded; less access to medical facilities / poorer overall health; limited education; 3 Question Answer Marks 5(c)(i) any one from: origin of pollution not known / difficult to prove who caused the pollution / pollution comes from different countries; too many people cause the pollution / everyone contributes to pollution; lack of funds / lack of money / negative impact on economy; difficult to define pollution; some countries / people, have different priorities; pressure from (large) companies / lobbying; 1 5(c)(ii) any two from: economic reason; leads to loss of jobs; lack of alternatives e.g. no widespread electric vehicle use / lack of control over personal carbon footprint 2
This question in 8291/21 May/June 2022
Q8 · In 2017, the United Kingdom generated electricity for 24 hours without using coal 8291/22 May/June 2022
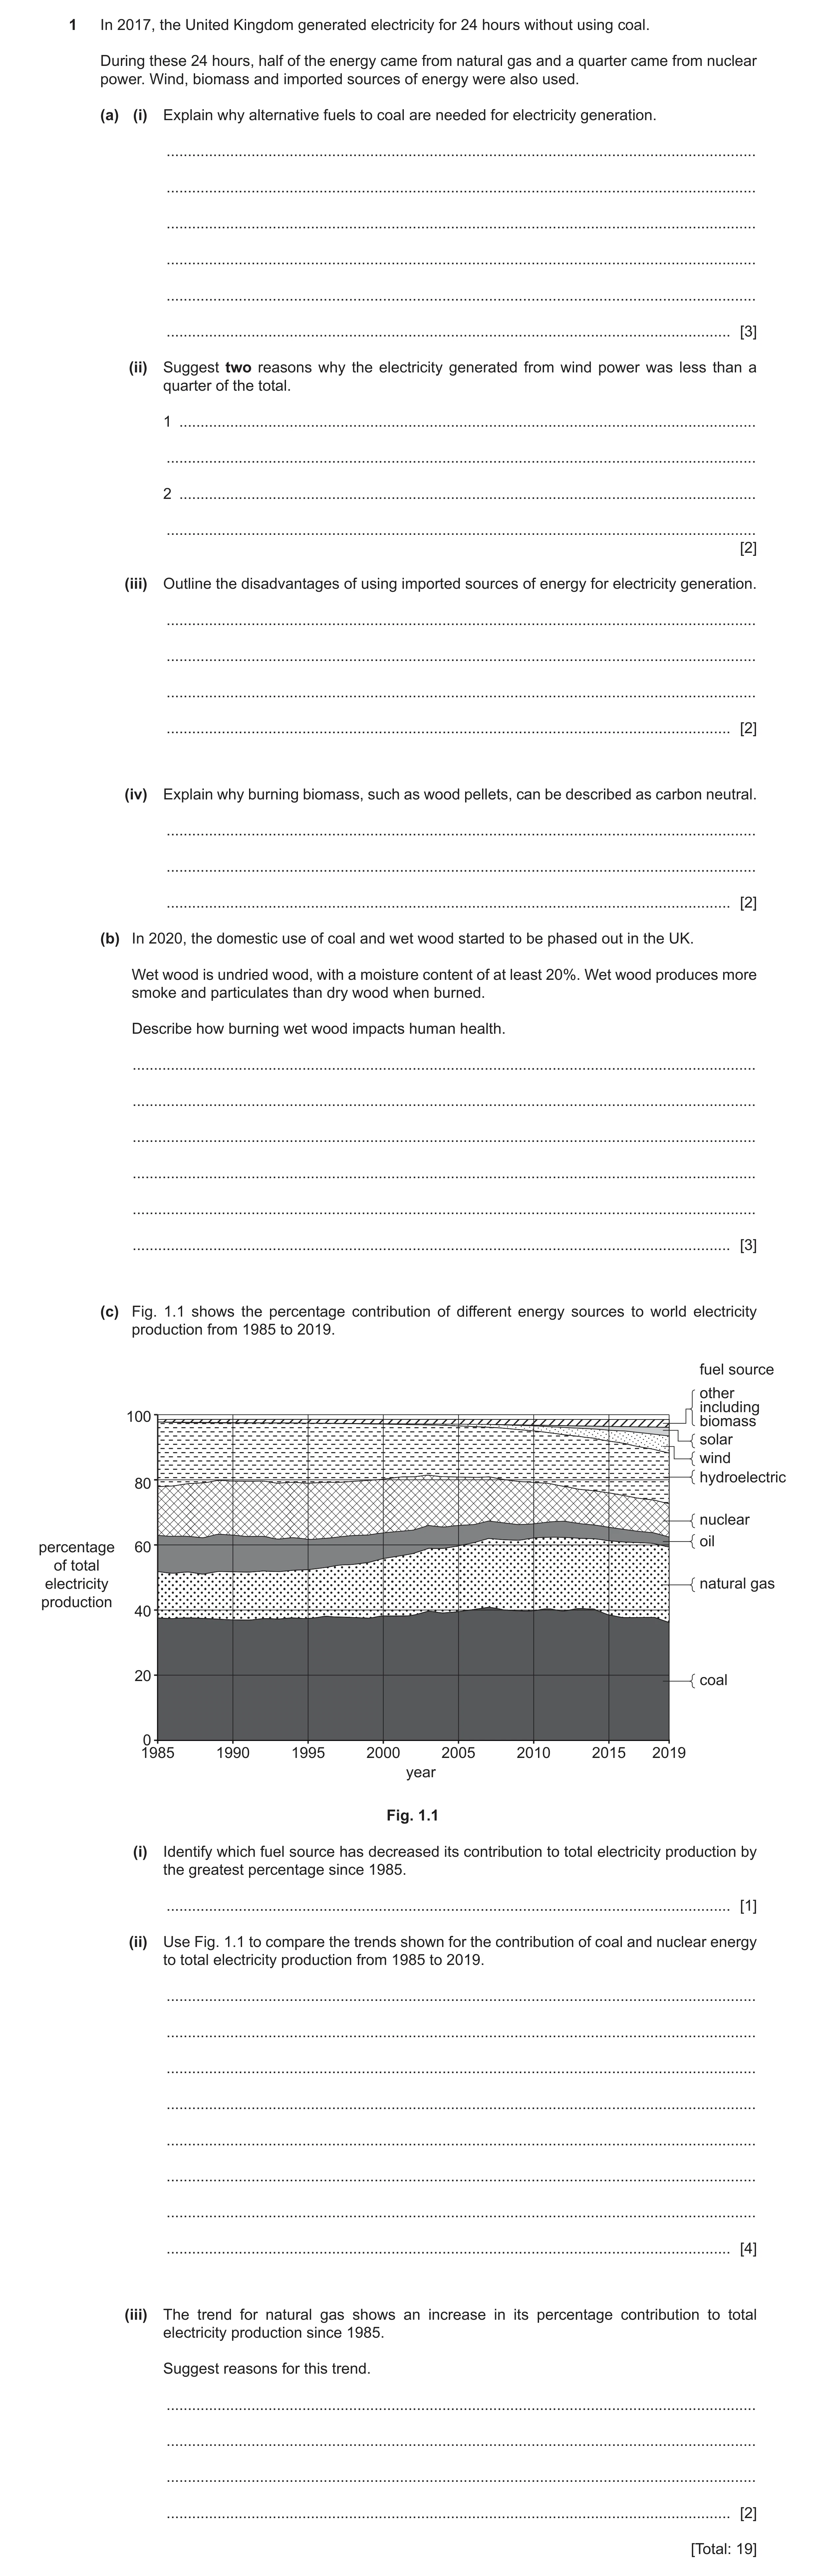
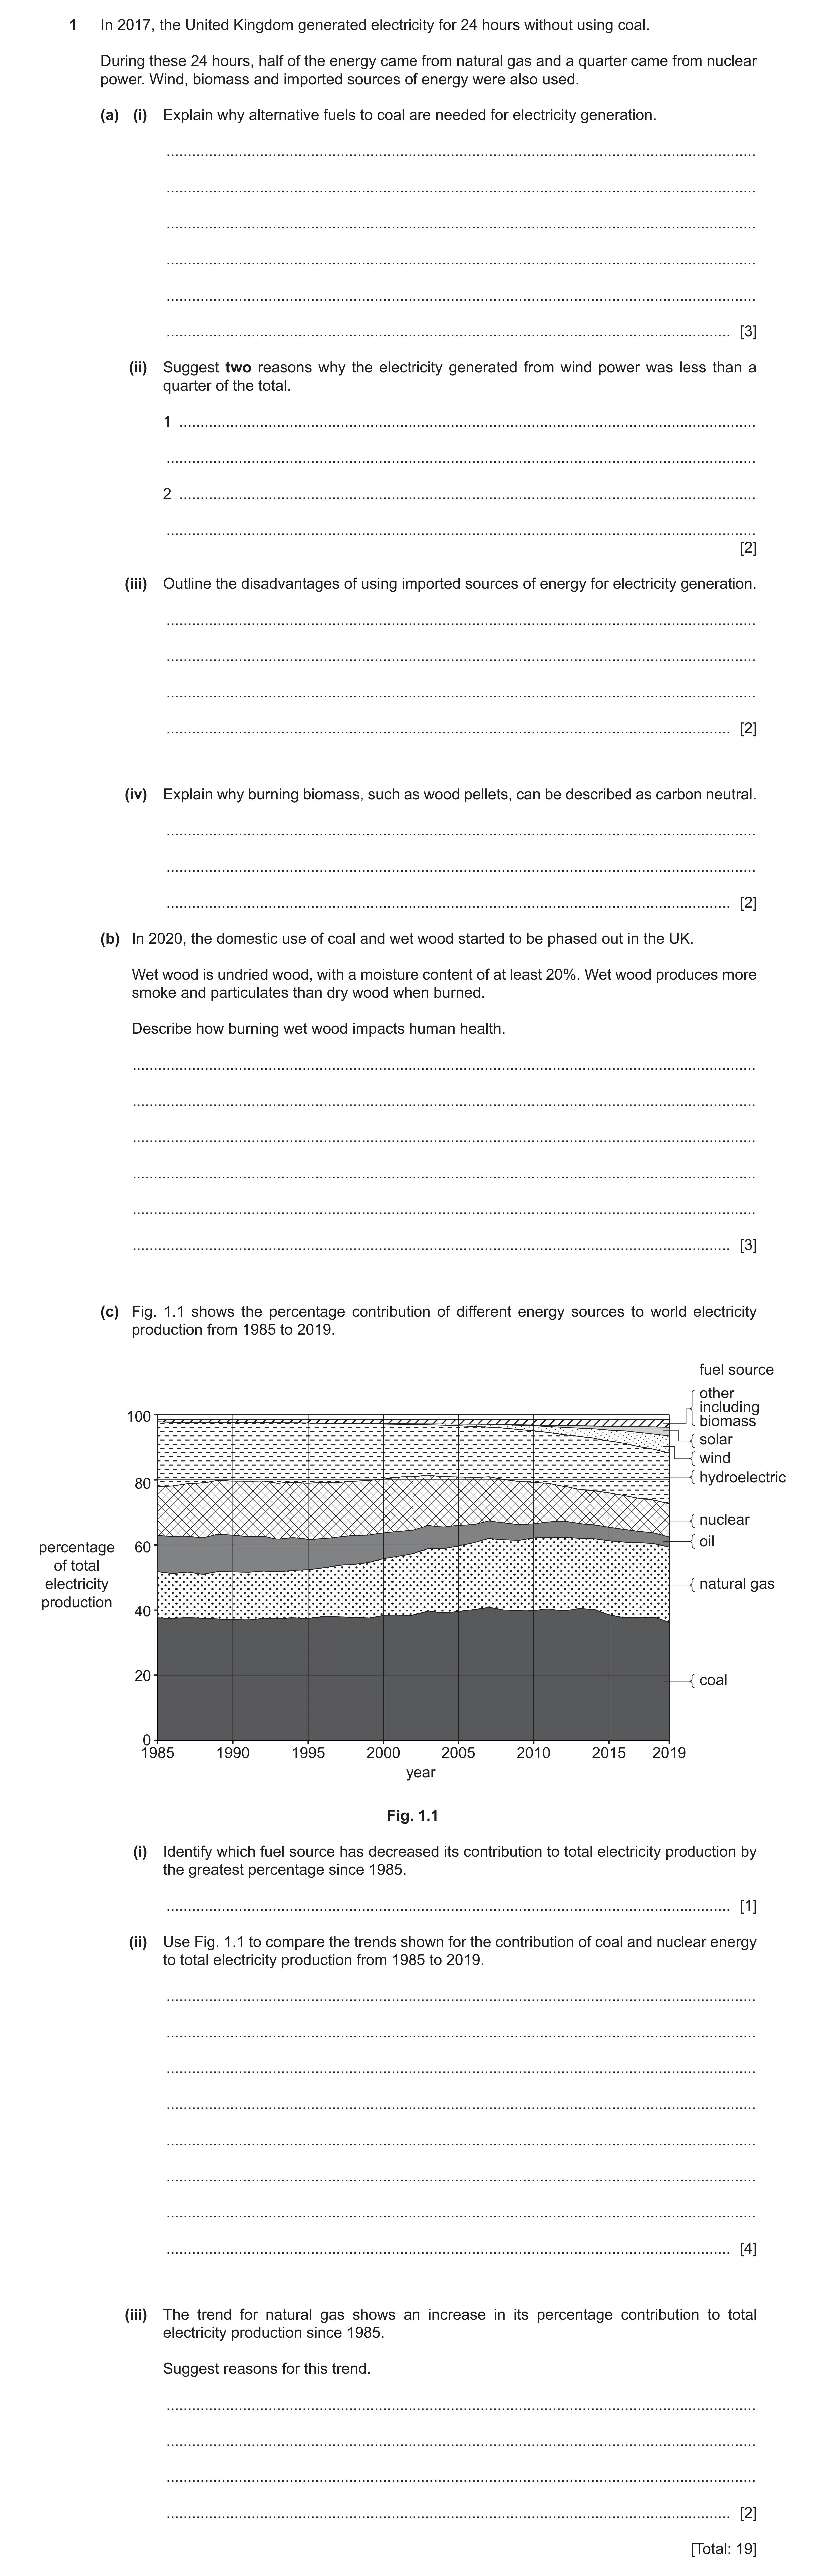
1 In 2017, the United Kingdom generated electricity for 24 hours without using coal. During these 24 hours, half of the energy came from natural gas and a quarter came from nuclear power. Wind, biomass and imported sources of energy were also used. (a) (i) Explain why alternative fuels to coal are needed for electricity generation. … … … … … … [3] (ii) Suggest two reasons why the electricity generated from wind power was less than a quarter of the total. 1 … … 2 … … [2] (iii) Outline the disadvantages of using imported sources of energy for electricity generation. … … … … [2] (iv) Explain why burning biomass, such as wood pellets, can be described as carbon neutral. … … … [2] (b) In 2020, the domestic use of coal and wet wood started to be phased out in the UK. Wet wood is undried wood, with a moisture content of at least 20%. Wet wood produces more smoke and particulates than dry wood when burned. Describe how burning wet wood impacts human health. … … … … … … [3] (c) Fig. 1.1 shows the percentage contribution of different energy sources to world electricity production from 1985 to 2019. fuel source other including 100 biomass solar wind hydroelectric 80 nuclear oilpercentage 60 of total electricity natural gas production 40 20 coal 0 1985 1990 1995 2000 2005 2010 2015 2019 year Fig. 1.1 (i) Identify which fuel source has decreased its contribution to total electricity production by the greatest percentage since 1985. … [1] (ii) Use Fig. 1.1 to compare the trends shown for the contribution of coal and nuclear energy to total electricity production from 1985 to 2019. … … … … … … … … [4] (iii) The trend for natural gas shows an increase in its percentage contribution to total electricity production since 1985. Suggest reasons for this trend. … … … … [2] [Total: 19]
19 marks
Mark scheme: 1(a)(i) any three from: coal is a fossil fuel; coal is, finite / non-renewable; burning coal produces carbon dioxide / sulfur dioxide / nitrous oxides / carbon monoxide; burning coal contributes to particulates / smoke / soot; burning coal contributes to climate change / global warming / enhanced greenhouse effect; non-carbon dioxide emitting gases needed to meet carbon targets / investment in carbon neutral fuels; burning coal contributes to acid rain; (using alternative energy sources) increases energy security; Question Answer Marks 1(a)(ii) any two from: not enough wind turbines; new technology needed / new equipment needed / lack of suitable infrastructure; weather conditions not favourable / not enough wind; expensive; (excess) energy available from other sources; 2 1(a)(iii) any two or developed from: energy insecurity; disrupted electricity supply; job losses; increased poverty; civil disruption / conflict; (import country) not self-reliant; economic reason; transport implication e.g. spillage / using fossil fuels 2 1(a)(iv) plants capture carbon dioxide; (by the process of) photosynthesis; 2 1(b) any three from: (particulates) cause (photochemical) smog; eye irritation; respiratory irritation / named condition / breathing problem / lung problem; heart ailment; cancer; decreased crop yields; leads to food shortages; 3 1(c)(i) oil; 1 Question Answer Marks 1(c)(ii) any four from: coal share greater than nuclear; both overall (slight) decrease; nuclear decrease greater than coal / coal more stable; comparative year trend or data quote; 4 1(c)(iii) any two from: new reserves found; improved technology; extraction from previously banned areas permitted e.g. Alaska increased demand; 2
This question in 8291/22 May/June 2022
Q9 · Data about traffic congestion in four of India’s cities 8291/22 May/June 2022
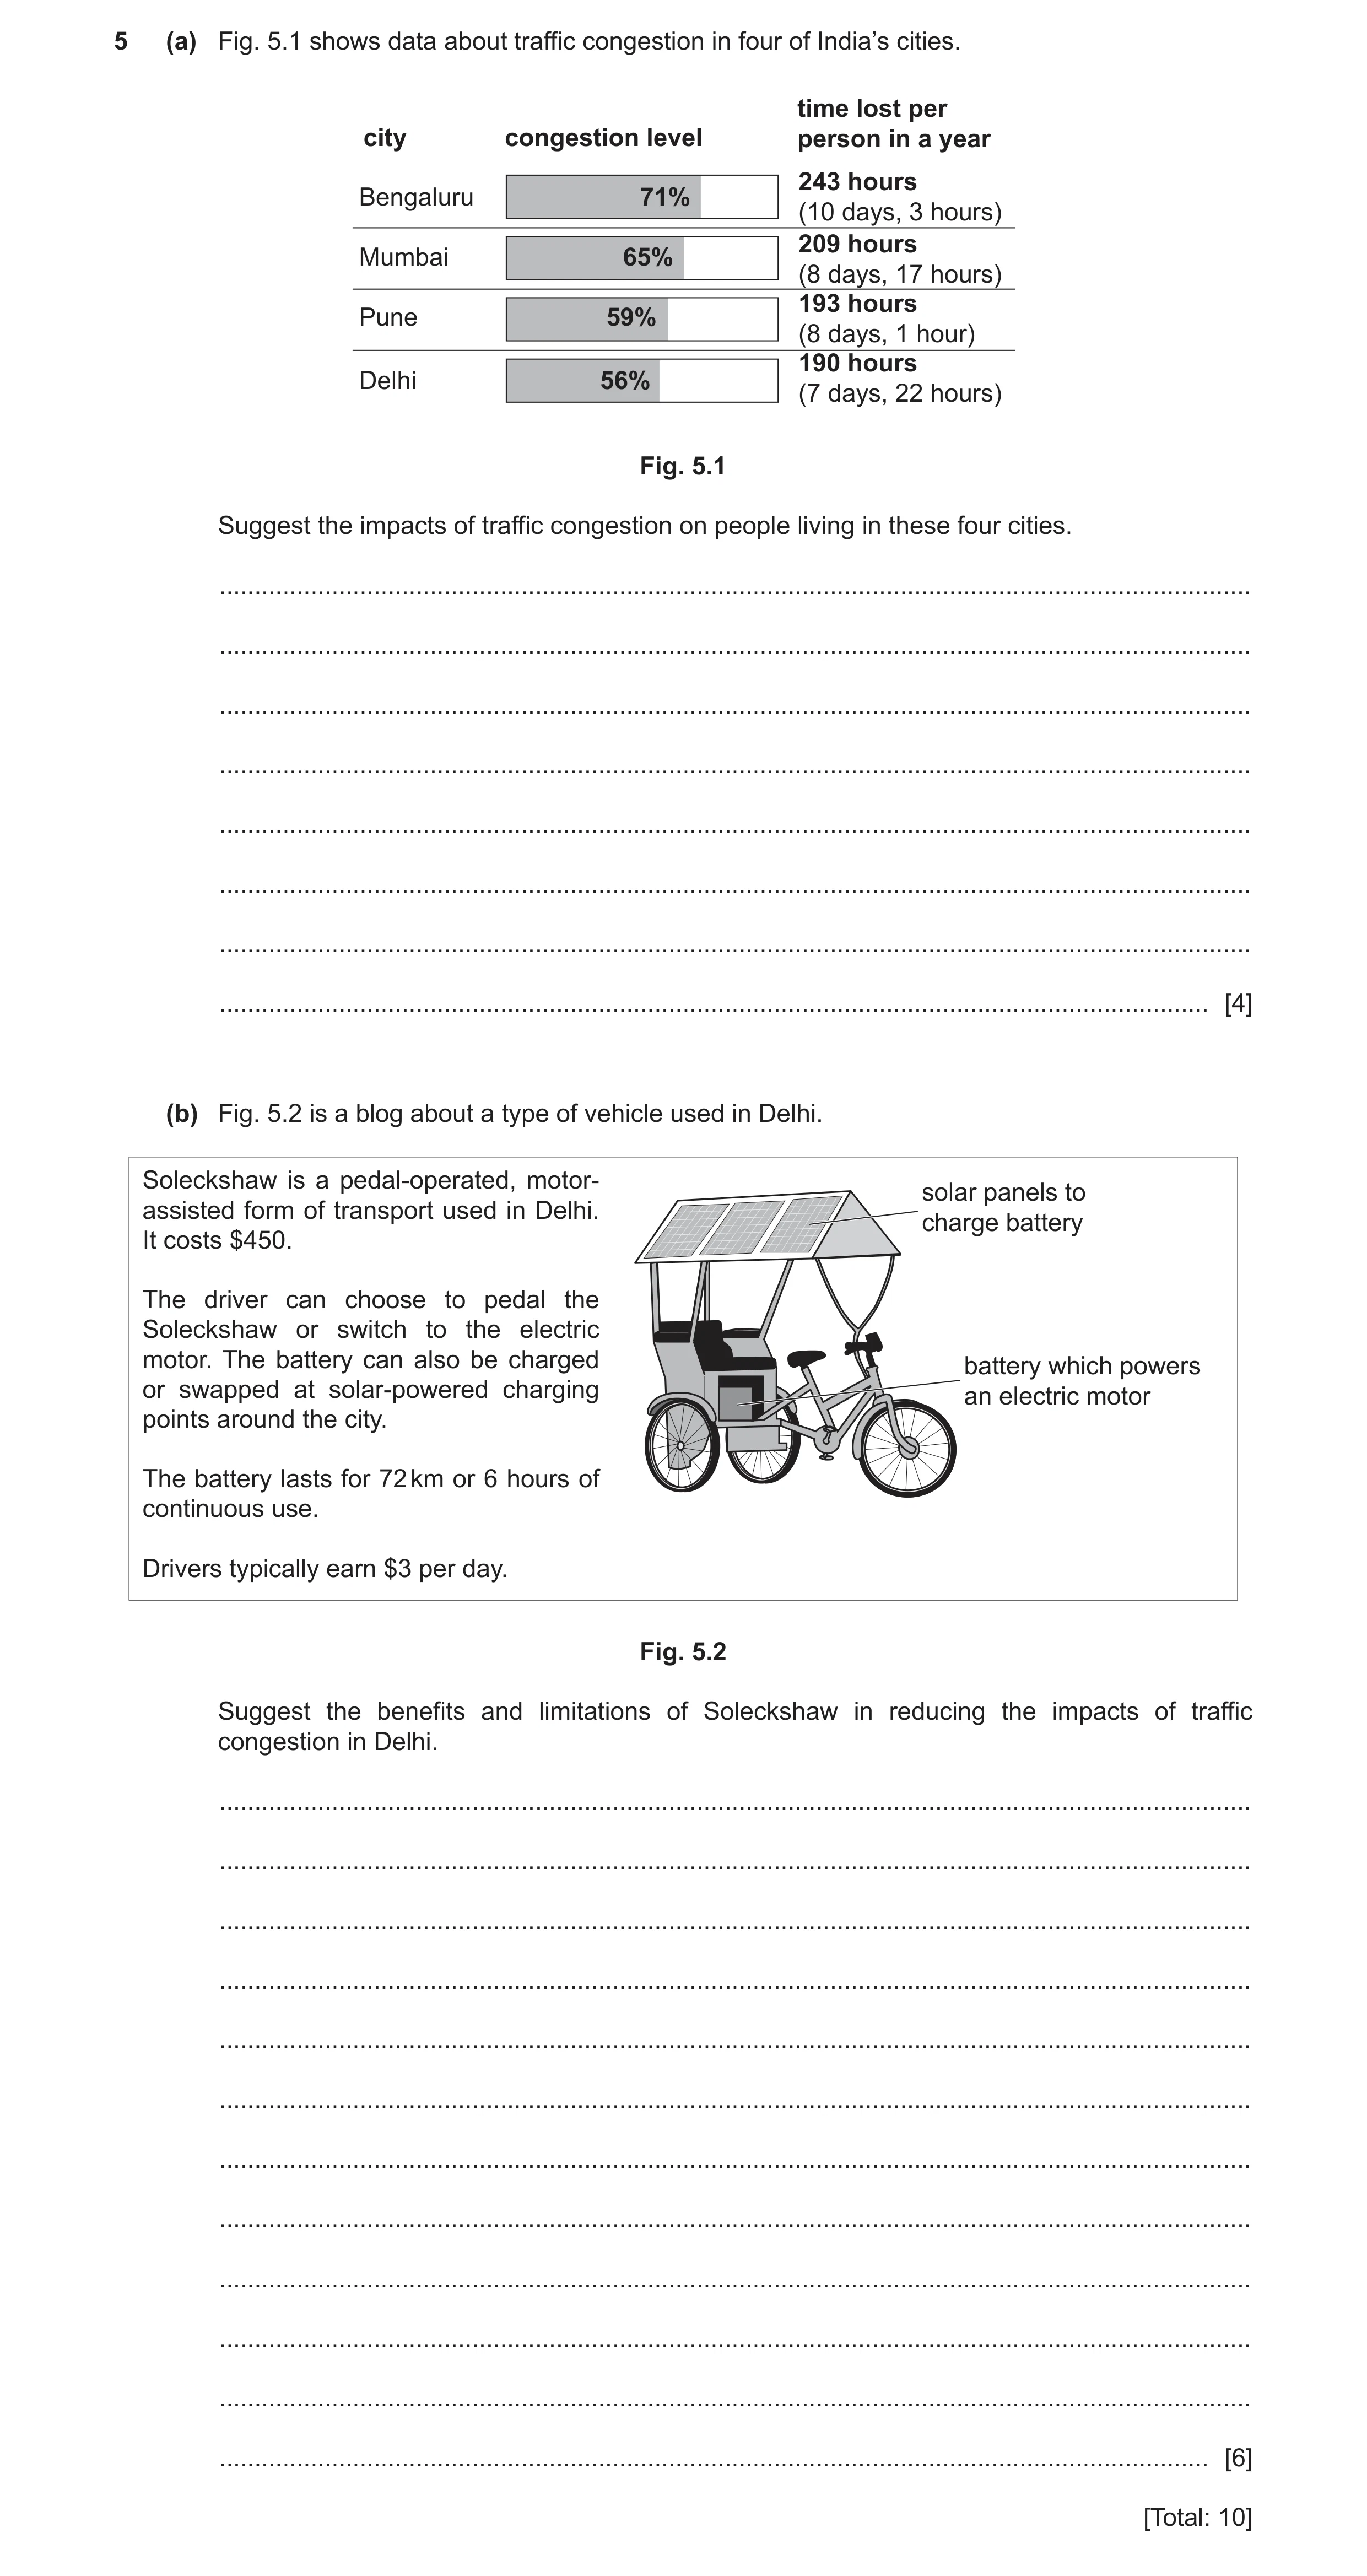
5 (a) Fig. 5.1 shows data about traffic congestion in four of India’s cities. time lost per city congestion level person in a year 243 hours Bengaluru 71% (10 days, 3 hours) 209 hours Mumbai 65% (8 days, 17 hours) 193 hours Pune 59% (8 days, 1 hour) 190 hours Delhi 56% (7 days, 22 hours) Fig. 5.1 Suggest the impacts of traffic congestion on people living in these four cities. … … … … … … … … [4] (b) Fig. 5.2 is a blog about a type of vehicle used in Delhi. Soleckshaw is a pedal-operated, motor- solar panels to assisted form of transport used in Delhi. charge battery It costs $450. The driver can choose to pedal the Soleckshaw or switch to the electric motor. The battery can also be charged battery which powers or swapped at solar-powered charging an electric motor points around the city. The battery lasts for 72 km or 6 hours of continuous use. Drivers typically earn $3 per day. Fig. 5.2 Suggest the benefits and limitations of Soleckshaw in reducing the impacts of traffic congestion in Delhi. … … … … … … … … … … … … [6] [Total: 10]
10 marks
Mark scheme: 5(a) any four from: loss of income; time lost (in travelling to work); respiratory illness; eye irritation; from vehicle emissions or named emission e.g. SO2, NOx, VOCs, particulates / unburnt hydrocarbons; formation of emission described; impact of emission described e.g. acid rain / photochemical smog; carbon dioxide emissions; impact of CO2 emissions global warming; 5(b) any six from but at least one benefit and one limitation: benefit: does not use, fossil fuels / petrol; (solar) is renewable / non-finite; does not emit, CO2 / air pollution (at point of use); will improve quality of life for drivers; do not need to wait for battery to charge / can swop battery rather than charging it / battery charges as you go; limitation: expensive / drivers unlikely to be able to afford them / drivers low wage; extra equipment likely to be heavy; range is short / only lasts for 6 hours; solar panel needs Sun / won’t operate at night or when cloudy; 6
This question in 8291/22 May/June 2022
Q10 · In 2017, the United Kingdom generated electricity for 24 hours without using coal 8291/23 May/June 2022
1 In 2017, the United Kingdom generated electricity for 24 hours without using coal. During these 24 hours, half of the energy came from natural gas and a quarter came from nuclear power. Wind, biomass and imported sources of energy were also used. (a) (i) Explain why alternative fuels to coal are needed for electricity generation. … … … … … … [3] (ii) Suggest two reasons why the electricity generated from wind power was less than a quarter of the total. 1 … … 2 … … [2] (iii) Outline the disadvantages of using imported sources of energy for electricity generation. … … … … [2] (iv) Explain why burning biomass, such as wood pellets, can be described as carbon neutral. … … … [2] (b) In 2020, the domestic use of coal and wet wood started to be phased out in the UK. Wet wood is undried wood, with a moisture content of at least 20%. Wet wood produces more smoke and particulates than dry wood when burned. Describe how burning wet wood impacts human health. … … … … … … [3] (c) Fig. 1.1 shows the percentage contribution of different energy sources to world electricity production from 1985 to 2019. fuel source other including 100 biomass solar wind hydroelectric 80 nuclear oilpercentage 60 of total electricity natural gas production 40 20 coal 0 1985 1990 1995 2000 2005 2010 2015 2019 year Fig. 1.1 (i) Identify which fuel source has decreased its contribution to total electricity production by the greatest percentage since 1985. … [1] (ii) Use Fig. 1.1 to compare the trends shown for the contribution of coal and nuclear energy to total electricity production from 1985 to 2019. … … … … … … … … [4] (iii) The trend for natural gas shows an increase in its percentage contribution to total electricity production since 1985. Suggest reasons for this trend. … … … … [2] [Total: 19]
19 marks
Mark scheme: 1(a)(i) any three from: coal is a fossil fuel; coal is, finite / non-renewable; burning coal produces carbon dioxide / sulfur dioxide / nitrous oxides / carbon monoxide; burning coal contributes to particulates / smoke / soot; burning coal contributes to climate change / global warming / enhanced greenhouse effect; non-carbon dioxide emitting gases needed to meet carbon targets / investment in carbon neutral fuels; burning coal contributes to acid rain; (using alternative energy sources) increases energy security; Question Answer Marks 1(a)(ii) any two from: not enough wind turbines; new technology needed / new equipment needed / lack of suitable infrastructure; weather conditions not favourable / not enough wind; expensive; (excess) energy available from other sources; 2 1(a)(iii) any two or developed from: energy insecurity; disrupted electricity supply; job losses; increased poverty; civil disruption / conflict; (import country) not self-reliant; economic reason; transport implication e.g. spillage / using fossil fuels 2 1(a)(iv) plants capture carbon dioxide; (by the process of) photosynthesis; 2 1(b) any three from: (particulates) cause (photochemical) smog; eye irritation; respiratory irritation / named condition / breathing problem / lung problem; heart ailment; cancer; decreased crop yields; leads to food shortages; 3 1(c)(i) oil; 1 Question Answer Marks 1(c)(ii) any four from: coal share greater than nuclear; both overall (slight) decrease; nuclear decrease greater than coal / coal more stable; comparative year trend or data quote; 4 1(c)(iii) any two from: new reserves found; improved technology; extraction from previously banned areas permitted e.g. Alaska increased demand; 2
This question in 8291/23 May/June 2022
Q11 · Data about traffic congestion in four of India’s cities 8291/23 May/June 2022
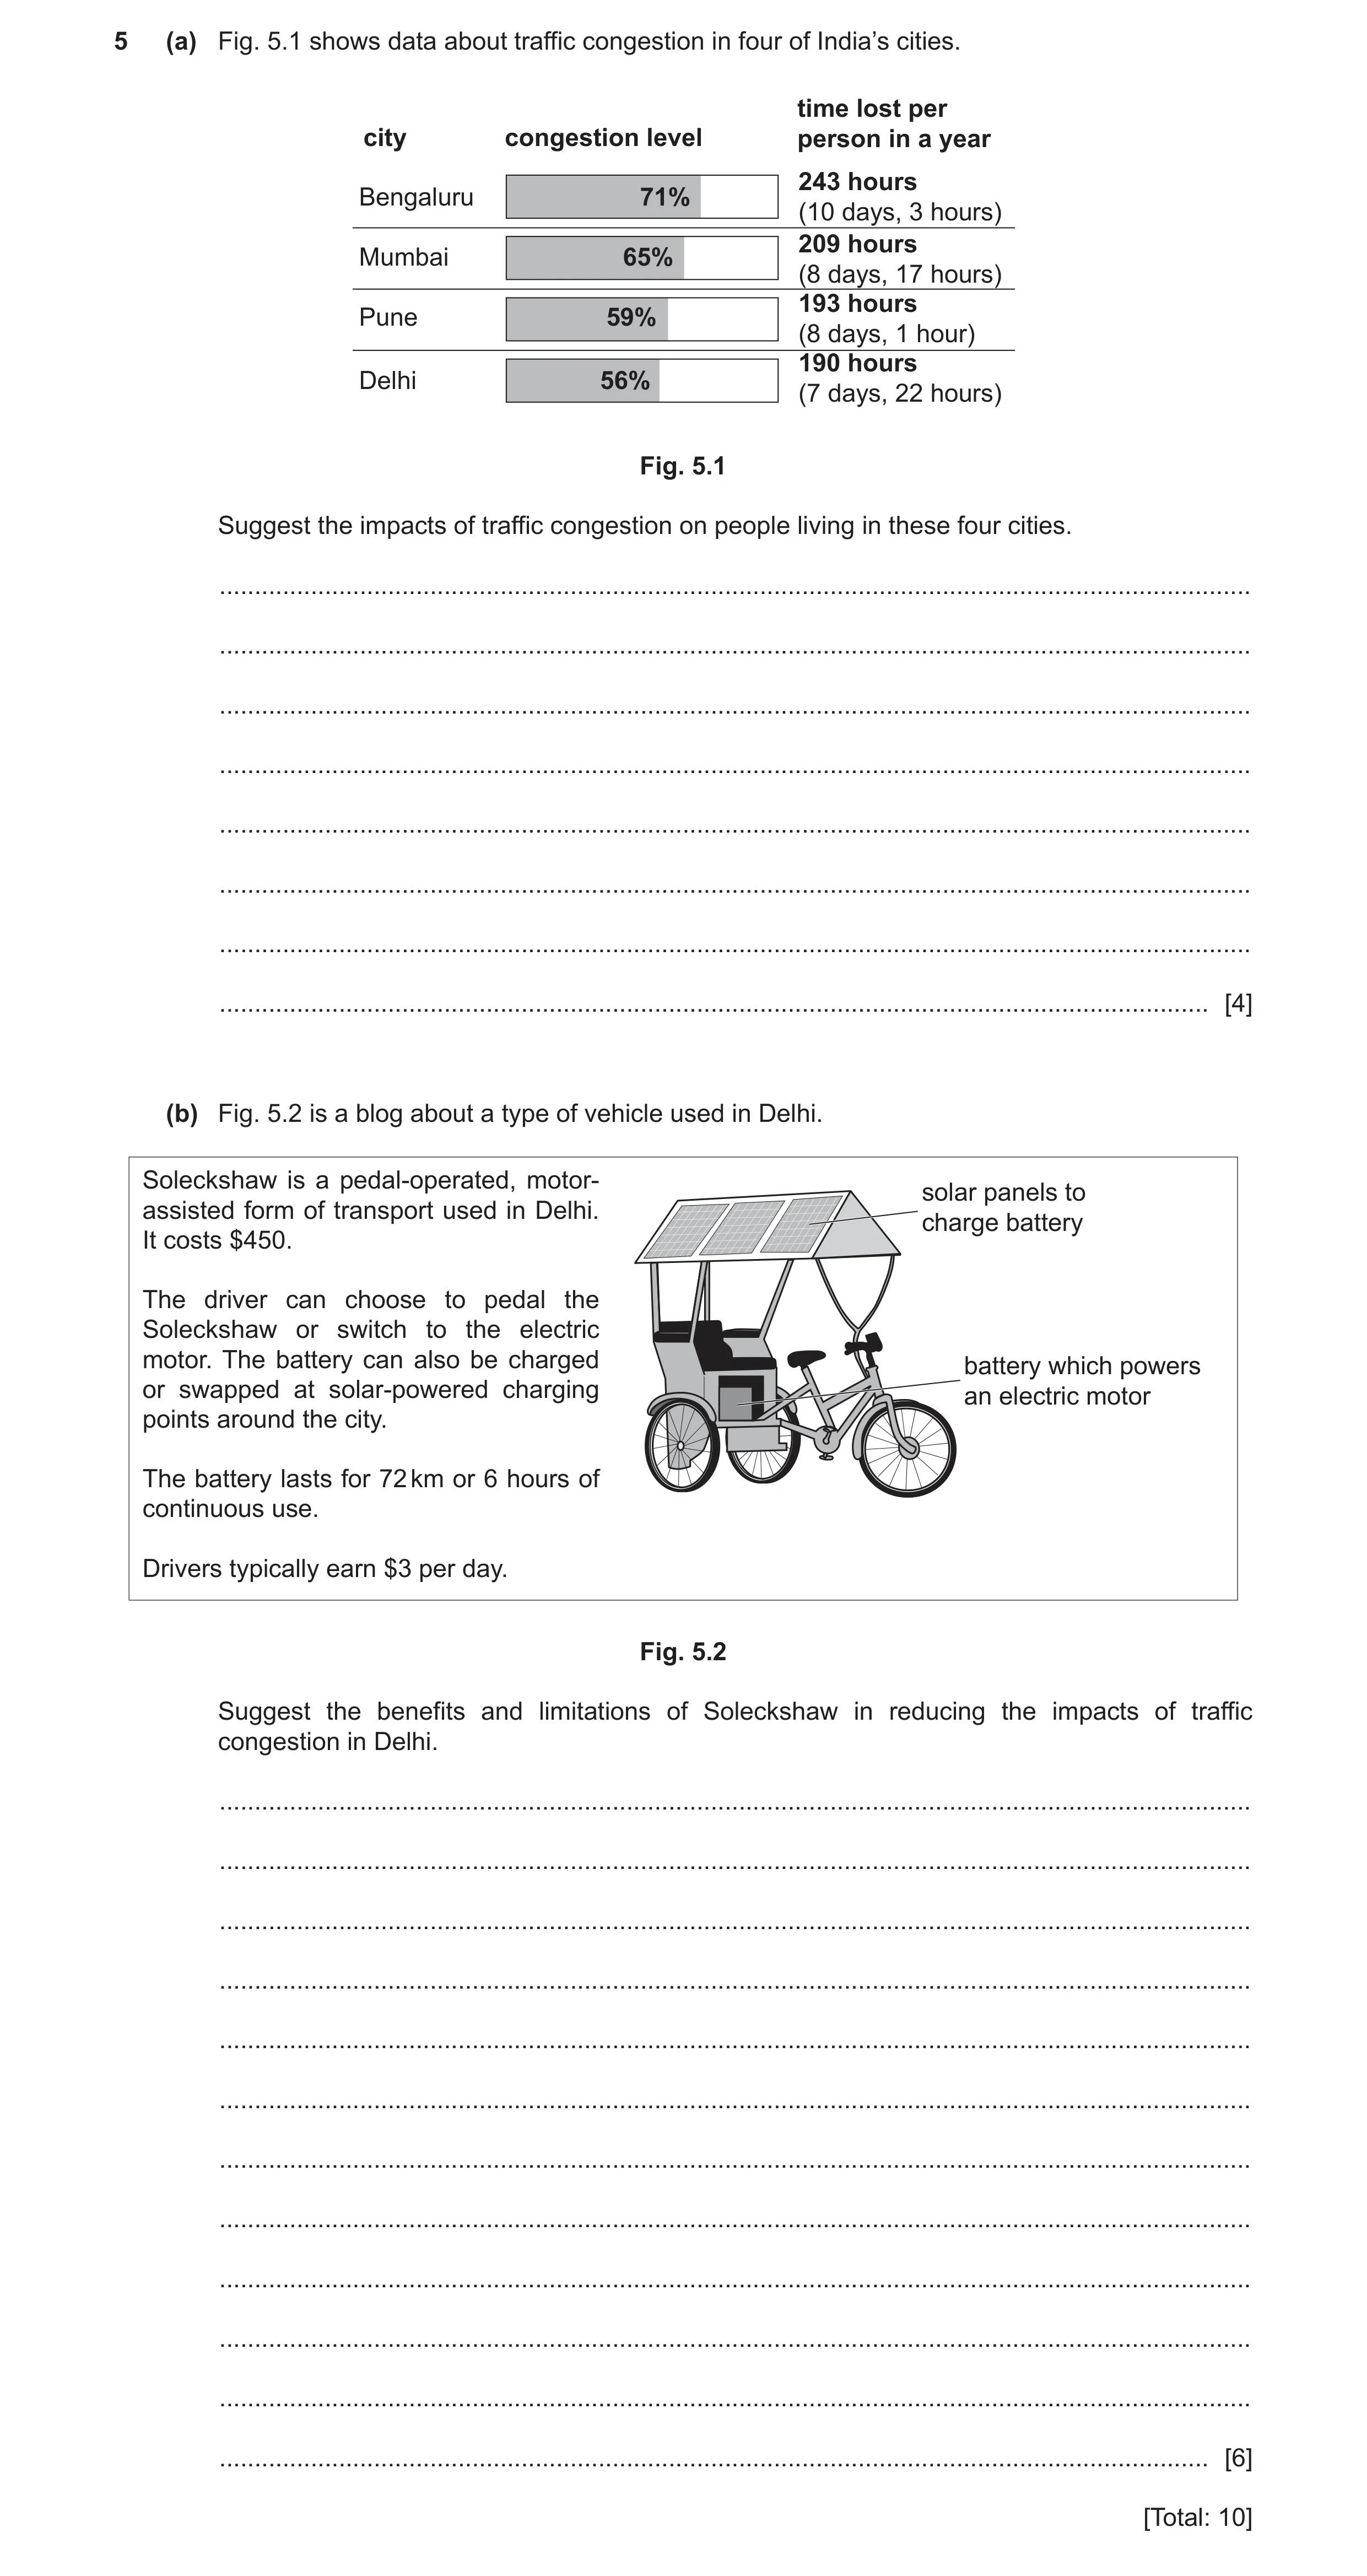
5 (a) Fig. 5.1 shows data about traffic congestion in four of India’s cities. time lost per city congestion level person in a year 243 hours Bengaluru 71% (10 days, 3 hours) 209 hours Mumbai 65% (8 days, 17 hours) 193 hours Pune 59% (8 days, 1 hour) 190 hours Delhi 56% (7 days, 22 hours) Fig. 5.1 Suggest the impacts of traffic congestion on people living in these four cities. … … … … … … … … [4] (b) Fig. 5.2 is a blog about a type of vehicle used in Delhi. Soleckshaw is a pedal-operated, motor- solar panels to assisted form of transport used in Delhi. charge battery It costs $450. The driver can choose to pedal the Soleckshaw or switch to the electric motor. The battery can also be charged battery which powers or swapped at solar-powered charging an electric motor points around the city. The battery lasts for 72 km or 6 hours of continuous use. Drivers typically earn $3 per day. Fig. 5.2 Suggest the benefits and limitations of Soleckshaw in reducing the impacts of traffic congestion in Delhi. … … … … … … … … … … … … [6] [Total: 10]
10 marks
Mark scheme: 5(a) any four from: loss of income; time lost (in travelling to work); respiratory illness; eye irritation; from vehicle emissions or named emission e.g. SO2, NOx, VOCs, particulates / unburnt hydrocarbons; formation of emission described; impact of emission described e.g. acid rain / photochemical smog; carbon dioxide emissions; impact of CO2 emissions global warming; 5(b) any six from but at least one benefit and one limitation: benefit: does not use, fossil fuels / petrol; (solar) is renewable / non-finite; does not emit, CO2 / air pollution (at point of use); will improve quality of life for drivers; do not need to wait for battery to charge / can swop battery rather than charging it / battery charges as you go; limitation: expensive / drivers unlikely to be able to afford them / drivers low wage; extra equipment likely to be heavy; range is short / only lasts for 6 hours; solar panel needs Sun / won’t operate at night or when cloudy; 6
This question in 8291/23 May/June 2022
Q12 · A photograph of Stockton mine, a large coal mine in New Zealand 8291/21 Oct/Nov 2022
3 Fig. 3.1 shows a photograph of Stockton mine, a large coal mine in New Zealand. Fig. 3.1 (a) Coal is a fossil fuel. It is a non-renewable energy resource. (i) State one non-renewable energy resource, other than coal. … [1] (ii) Explain why fossil fuel depletion can lead to energy insecurity. … … … … [2] (iii) Rationing fossil fuels is a strategy to manage energy insecurity. Outline one advantage and one disadvantage of this strategy. advantage … … disadvantage … … [2] (b) The location of the coal mine was the only known habitat of a species of snail, the Mount Augustus snail. Fig. 3.2 is a drawing of a Mount Augustus snail. 90 mm Fig. 3.2 Before mining started, the mining company was required to move Mount Augustus snails from the area of the planned coal mine. This took two years. 4000 snails were moved to locations nearby. The population of the snails was monitored using a capture-mark-recapture method. Pitfall traps were used to collect the snails. (i) Describe a capture-mark-recapture method to estimate the population of the Mount Augustus snails using a pitfall trap. … … … … … … … … … … … … [5] (ii) Assumptions are made when using capture-mark-recapture methods of estimating populations. One assumption is that during the survey period there are no deaths or births within the population surveyed. State two other assumptions. … … … … [2] (c) The results of a snail capture-mark-recapture survey are shown in Table 3.1. Table 3.1 number of snails numbers of marked number of marked estimate ofrecapture in first sample, and unmarked snails snails in second population size, date n1 in second sample, n2 sample, m2 N July 2010 148 160 6 3947 July 2011 151 135 5 … July 2012 130 145 5 3770 July 2013 142 152 6 3597 July 2014 133 147 8 2444 July 2015 75 60 2 2250 The Lincoln index is used to estimate population size using the formula shown. n1 × n2 N = m2 (i) Complete Table 3.1 by calculating the estimated population size, N, for July 2011. [1] (ii) Use Table 3.1 to write a suitable conclusion about the population of snails. … … [1] (iii) 50 snails were tagged with a radio tracking device to record their location after they were released back into the wild. After 18 months, 30% of the snails had died. Calculate the number of snails that were alive after 18 months. … [2] (iv) 2000 Mount Augustus snails were not released back into the wild. These snails were kept in captivity. Suggest reasons why. … … … … [2] (d) A food chain for the Mount Augustus snail is shown. grass earthworm Mount Augustus snail rat (i) Identify the primary consumer in this food chain. … [1] (ii) Rats can spread diseases. Poison is used to control rats. Suggest the disadvantage of using poison to control rats. … … [1] (e) A scientist wanted to investigate the best diet to feed the Mount Augustus snails kept in captivity. The scientist used this method: • select 10 snails • label the snails 1 to 10 • record the mass of each snail at the start • feed five snails diet A for 10 weeks • diet A – earthworms • feed five different snails diet B for 10 weeks • diet B – earthworms and calcium • record the mass of each snail after 10 weeks. Table 3.2 shows the results. Table 3.2 diet A diet B mass of snail change in mass of snail change in snail mass snail mass after 10 after 10 / g / g at start at start weeks weeks / g / g / g / g 1 80 80 0 6 75 79 +4 2 81 82 +1 7 72 80 +8 3 93 91 8 87 95 +8 … 4 73 75 +2 9 93 97 +6 5 79 55 -24 10 85 92 +7 (i) Complete Table 3.2 for snail 3, diet A. [2] (ii) Calculate the average change in mass for diet B. … g [1] (iii) Suggest a reason for the result for snail 5, diet A. … … [1] (iv) Use Table 3.2 to write a conclusion for the investigation. Give a reason for your conclusion. … … [1] [Total: 25]
25 marks
Mark scheme: 3(a)(i) any one from: 1 oil; natural gas; uranium / nuclear; 3(a)(ii) any two from: 2 idea of inequality in global energy resources / more reserves in some countries than others; requires import of energy resource or electricity; limited alternatives of fossil fuels / reduction in a natural energy resource / some countries rely heavily on fossil fuels / main energy source; cost of energy will go up; 3(a)(iii) advantage: 2 existing resources last longer; disadvantage: does not solve the problem of finding an alternative; difficult to police / manage rationing strategy; 3(b)(i) any five from: 5 reference to where sampling will take place / mapping sampling points / random or systematic sampling stated or described; (small) hole for snail to fall into; count all (Mount Augustus) snail in trap; mark shells; with, e.g. correction fluid, nail varnish, marker pen; release back to same location; repeat (after at least 24 hours); repeat for different locations; 3(b)(ii) any two from: 2 all members of the population mix randomly; marks are not lost between samples; the mark does not harm the animal, e.g. making it more obvious to predators; the marks do not affect the chances of recapture; the animals are active; 3(c)(i) 4077; 1 3(c)(ii) any one from: 1 initially population increased; general decrease in population; since 2012; 3(c)(iii) (30% mortality) 15 (dead); 2 (50 – 15 =) 35; 3(c)(iv) any two from: 2 to protect from predators; to have a genetic record / for research or study; to ensure species does not become extinct; breeding programme; 3(d)(i) earthworm; 1 3(d)(ii) any one from: 1 rats become resistant to the poison; may affect non-target species / may poison other animals that eat the rat; builds-up in food chain / biomagnification; 3(e)(i) negative value / – symbol; 2 2; 3(e)(ii) 6.6 / 7; 1 3(e)(iii) any one from: 1 anomalous result; snail has disease / illness; 3(e)(iv) diet B is better because the snails increase more in mass (than A); 1
This question in 8291/21 Oct/Nov 2022
Q13 · A photograph of Stockton mine, a large coal mine in New Zealand 8291/23 Oct/Nov 2022
3 Fig. 3.1 shows a photograph of Stockton mine, a large coal mine in New Zealand. Fig. 3.1 (a) Coal is a fossil fuel. It is a non-renewable energy resource. (i) State one non-renewable energy resource, other than coal. … [1] (ii) Explain why fossil fuel depletion can lead to energy insecurity. … … … … [2] (iii) Rationing fossil fuels is a strategy to manage energy insecurity. Outline one advantage and one disadvantage of this strategy. advantage … … disadvantage … … [2] (b) The location of the coal mine was the only known habitat of a species of snail, the Mount Augustus snail. Fig. 3.2 is a drawing of a Mount Augustus snail. 90 mm Fig. 3.2 Before mining started, the mining company was required to move Mount Augustus snails from the area of the planned coal mine. This took two years. 4000 snails were moved to locations nearby. The population of the snails was monitored using a capture-mark-recapture method. Pitfall traps were used to collect the snails. (i) Describe a capture-mark-recapture method to estimate the population of the Mount Augustus snails using a pitfall trap. … … … … … … … … … … … … [5] (ii) Assumptions are made when using capture-mark-recapture methods of estimating populations. One assumption is that during the survey period there are no deaths or births within the population surveyed. State two other assumptions. … … … … [2] (c) The results of a snail capture-mark-recapture survey are shown in Table 3.1. Table 3.1 number of snails numbers of marked number of marked estimate ofrecapture in first sample, and unmarked snails snails in second population size, date n1 in second sample, n2 sample, m2 N July 2010 148 160 6 3947 July 2011 151 135 5 … July 2012 130 145 5 3770 July 2013 142 152 6 3597 July 2014 133 147 8 2444 July 2015 75 60 2 2250 The Lincoln index is used to estimate population size using the formula shown. n1 × n2 N = m2 (i) Complete Table 3.1 by calculating the estimated population size, N, for July 2011. [1] (ii) Use Table 3.1 to write a suitable conclusion about the population of snails. … … [1] (iii) 50 snails were tagged with a radio tracking device to record their location after they were released back into the wild. After 18 months, 30% of the snails had died. Calculate the number of snails that were alive after 18 months. … [2] (iv) 2000 Mount Augustus snails were not released back into the wild. These snails were kept in captivity. Suggest reasons why. … … … … [2] (d) A food chain for the Mount Augustus snail is shown. grass earthworm Mount Augustus snail rat (i) Identify the primary consumer in this food chain. … [1] (ii) Rats can spread diseases. Poison is used to control rats. Suggest the disadvantage of using poison to control rats. … … [1] (e) A scientist wanted to investigate the best diet to feed the Mount Augustus snails kept in captivity. The scientist used this method: • select 10 snails • label the snails 1 to 10 • record the mass of each snail at the start • feed five snails diet A for 10 weeks • diet A – earthworms • feed five different snails diet B for 10 weeks • diet B – earthworms and calcium • record the mass of each snail after 10 weeks. Table 3.2 shows the results. Table 3.2 diet A diet B mass of snail change in mass of snail change in snail mass snail mass after 10 after 10 / g / g at start at start weeks weeks / g / g / g / g 1 80 80 0 6 75 79 +4 2 81 82 +1 7 72 80 +8 3 93 91 8 87 95 +8 … 4 73 75 +2 9 93 97 +6 5 79 55 -24 10 85 92 +7 (i) Complete Table 3.2 for snail 3, diet A. [2] (ii) Calculate the average change in mass for diet B. … g [1] (iii) Suggest a reason for the result for snail 5, diet A. … … [1] (iv) Use Table 3.2 to write a conclusion for the investigation. Give a reason for your conclusion. … … [1] [Total: 25]
25 marks
Mark scheme: 3(a)(i) any one from: 1 oil; natural gas; uranium / nuclear; 3(a)(ii) any two from: 2 idea of inequality in global energy resources / more reserves in some countries than others; requires import of energy resource or electricity; limited alternatives of fossil fuels / reduction in a natural energy resource / some countries rely heavily on fossil fuels / main energy source; cost of energy will go up; 3(a)(iii) advantage: 2 existing resources last longer; disadvantage: does not solve the problem of finding an alternative; difficult to police / manage rationing strategy; 3(b)(i) any five from: 5 reference to where sampling will take place / mapping sampling points / random or systematic sampling stated or described; (small) hole for snail to fall into; count all (Mount Augustus) snail in trap; mark shells; with, e.g. correction fluid, nail varnish, marker pen; release back to same location; repeat (after at least 24 hours); repeat for different locations; 3(b)(ii) any two from: 2 all members of the population mix randomly; marks are not lost between samples; the mark does not harm the animal, e.g. making it more obvious to predators; the marks do not affect the chances of recapture; the animals are active; 3(c)(i) 4077; 1 3(c)(ii) any one from: 1 initially population increased; general decrease in population; since 2012; 3(c)(iii) (30% mortality) 15 (dead); 2 (50 – 15 =) 35; 3(c)(iv) any two from: 2 to protect from predators; to have a genetic record / for research or study; to ensure species does not become extinct; breeding programme; 3(d)(i) earthworm; 1 3(d)(ii) any one from: 1 rats become resistant to the poison; may affect non-target species / may poison other animals that eat the rat; builds-up in food chain / biomagnification; 3(e)(i) negative value / – symbol; 2 2; 3(e)(ii) 6.6 / 7; 1 3(e)(iii) any one from: 1 anomalous result; snail has disease / illness; 3(e)(iv) diet B is better because the snails increase more in mass (than A); 1
This question in 8291/23 Oct/Nov 2022
Q14 · Oil sands contain deposits of oil 8291/21 May/June 2023
1 Oil sands contain deposits of oil. Fig. 1.1 is an enlarged sketch of an oil sands sample. Each grain of sand is surrounded by a layer of water and a type of oil called bitumen. Key bitumen water sand 1 mm Fig. 1.1 (a) Oil is a fossil fuel. State two other fossil fuels. 1 … 2 … [2] (b) Extracting oil from oil sands uses large volumes of water. The waste water is stored in tailing ponds. 75% of the water in the tailing ponds is recycled back into the extraction process. (i) Suggest why the water is recycled back into the extraction process. … … … … … … [3] (ii) Suggest why some people are concerned about the storage of waste water in tailing ponds. … … … … … … [3] (c) Fig. 1.2 shows the location of oil sands deposits in Canada. These are some of the largest deposits of oil on Earth. Key N oil sands deposit river ALBERTA Edmonton Calgary Fig. 1.2 Use Fig. 1.2 to suggest the challenges of exporting oil from these oil sands locations. Give reasons for your answer. … … … … … … [3] (d) (i) Fig. 1.3 shows the oil production from oil sands and conventional oil sources in Canada from 2006 to 2019. Key oil production oil sands conventional oil sources 3.0 2.5 2.0 oil production / million barrels 1.5 per day 1.0 0.5 0.0 2006 2007 2008 2009 2010 2011 2012 2013 2014 2015 2016 2017 2018 2019 year Fig. 1.3 Use Fig. 1.3 to compare the trends in oil production from oil sands and oil production from conventional oil sources. … … … … … … [3] (ii) These oil sands deposits cover 142 200 km2. 4800 km2 of the oil sands deposits can be mined. The remaining area currently cannot be mined. Calculate the percentage of the oil sands deposits that can be mined. Give your answer to one decimal place. … % [2] (iii) Explain how a reliance on fossil fuels, such as oil, can lead to energy insecurity. … … … … [2] (e) A report stated that from 2000 to 2018 the emission rate of greenhouse gases in Canada from oil sands extraction decreased by 36%. These emissions account for 12% of Canada’s total greenhouse gas emissions. (i) Explain why greenhouse gas emissions are a concern. … … … … … … [3] (ii) Canada was one of the countries that signed the Paris Agreement in 2016. Explain why international agreements help to control greenhouse gas emissions. … … … … [2] (iii) International agreements have helped to reduce the emission rate of greenhouse gases. Suggest two other reasons why the emission rate of greenhouse gases from oil sands extraction has decreased. 1 … … 2 … … [2] (f) A pipeline for transporting oil was planned to run from Canada to the USA. Many people objected to the building of this pipeline. Suggest reasons why some people were in favour of building this pipeline. … … … … … … [3] [Total: 28]
28 marks
Mark scheme: 1(a) M1 natural gas; M2 coal; 2 1(b)(i) any three from: M1 reduce, use / wastage of water; M2 reduce risk of water insecurity; M3 reduce energy used; M4 reduce risk of energy insecurity; M5 reduce costs; 3 1(b)(ii) any three suggestions: M1 contamination of soil; M2 water pollution / pollution of named water source e.g. rivers / reservoir / drinking water supplies / groundwater; M3 (water pollution) toxic contents (to wildlife) / reduce biodiversity / disrupt food chains; M4 bioaccumulation; M5 description e.g. build up of toxins in an organism; M6 biomagnification; M7 description e.g. build up of toxins up a food chain; M8 (tail ponds) risk of collapse / flooding / stated flooding impact; 3 1(c) any three from: M1 land locked / not near a port / can’t export by sea; M2 (road transport) leads to congestion; M3 (road transport) leads to noise/visual/air, pollution or increased carbon emissions; M4 currently no pipeline; M5 (pipeline or oil spill) causes habitat / biodiversity, loss; M6 cost of oil to consumer becomes expensive / transport expensive (as remote location/transport); M7 risk of oil spills / risk of water pollution; M8 stated other negative reference to the rivers: idea of lots of rivers / surrounded by rivers / need to cross rivers / difficult to cross in winter / disruption to flow of rivers; M9 public / political, opposition; M10 idea of long distance to export country / crossing international borders; 3 Question Answer Marks 1(d)(i) any three comparisons from: M1 oil sands, starts lower / ends higher (than conventional) / ora; M2 similar trend / both have an (overall) increase; M3 oil sands increased AND conventional remains constant; M4 from 2011 oil sands increase more / ora; M5 both peak in 2019; M6 both fluctuate; M7 equal production in (end of) 2010 or 2011; M8 comparative paired quoted data; e.g. comparative, number of barrels / specific year trends 3 1(d)(ii) M1 4 800 142 200 (100) / 3.375527 / 3.376 / 3.38; M2 3.4; 2 1(d)(iii) M1 oil, is non-renewable / finite / will run out; M2 prices will increase as availability decreases / demand will be greater than supply; M3 idea of having to rely on imported fossil fuels or imported electricity / dependence on another country; 2 1(e)(i) any three from: M1 greenhouse gases absorb (infrared) radiation; M2 lead to enhanced greenhouse effect / increased global, temperatures / (global) warming; M3 causes climate change; M4 stated effect of climate change e.g. sea level rise, animal extinction / increased migration, reduction of ice sheets / wildfires / disrupt weather patterns; 3 1(e)(ii) any two from: M1 idea of, working together / global cooperation; M2 idea of, no borders in atmosphere / (greenhouse) emissions or pollutants are global; M3 finance / support, needed for LIC; M4 raises awareness; M5 incentive to follow agreement due to: financial penalties for countries who break the agreement / (international) enforcement / international standards / targets or limits or rules everyone must follow / international accountability / political or international pressure to follow the agreement; 2 Question Answer Marks 1(e)(iii) any two from: M1 improved or newer technology; M2 idea of more efficient extraction; M3 pressure from environmental groups (for emission reduction); M4 reduced extraction / limits on extraction; M5 AVP;; 2 1(f) any three from: M1 increased jobs; M2 greater availability of oil / increased energy security / more consistent supply of oil; M3 leading to lower oil prices / reduces import cost; M4 improved, local facilities / infrastructure; M5 reduces impacts of overland transport / less vehicles needed / less risk of stated pollution related to transport e.g. oil spill, air pollution, noise pollution; M6 reduces cost of transport; M7 idea of benefitting economy of country or company; 3
This question in 8291/21 May/June 2023
Q15 · Define the term energy security 8291/21 Oct/Nov 2023
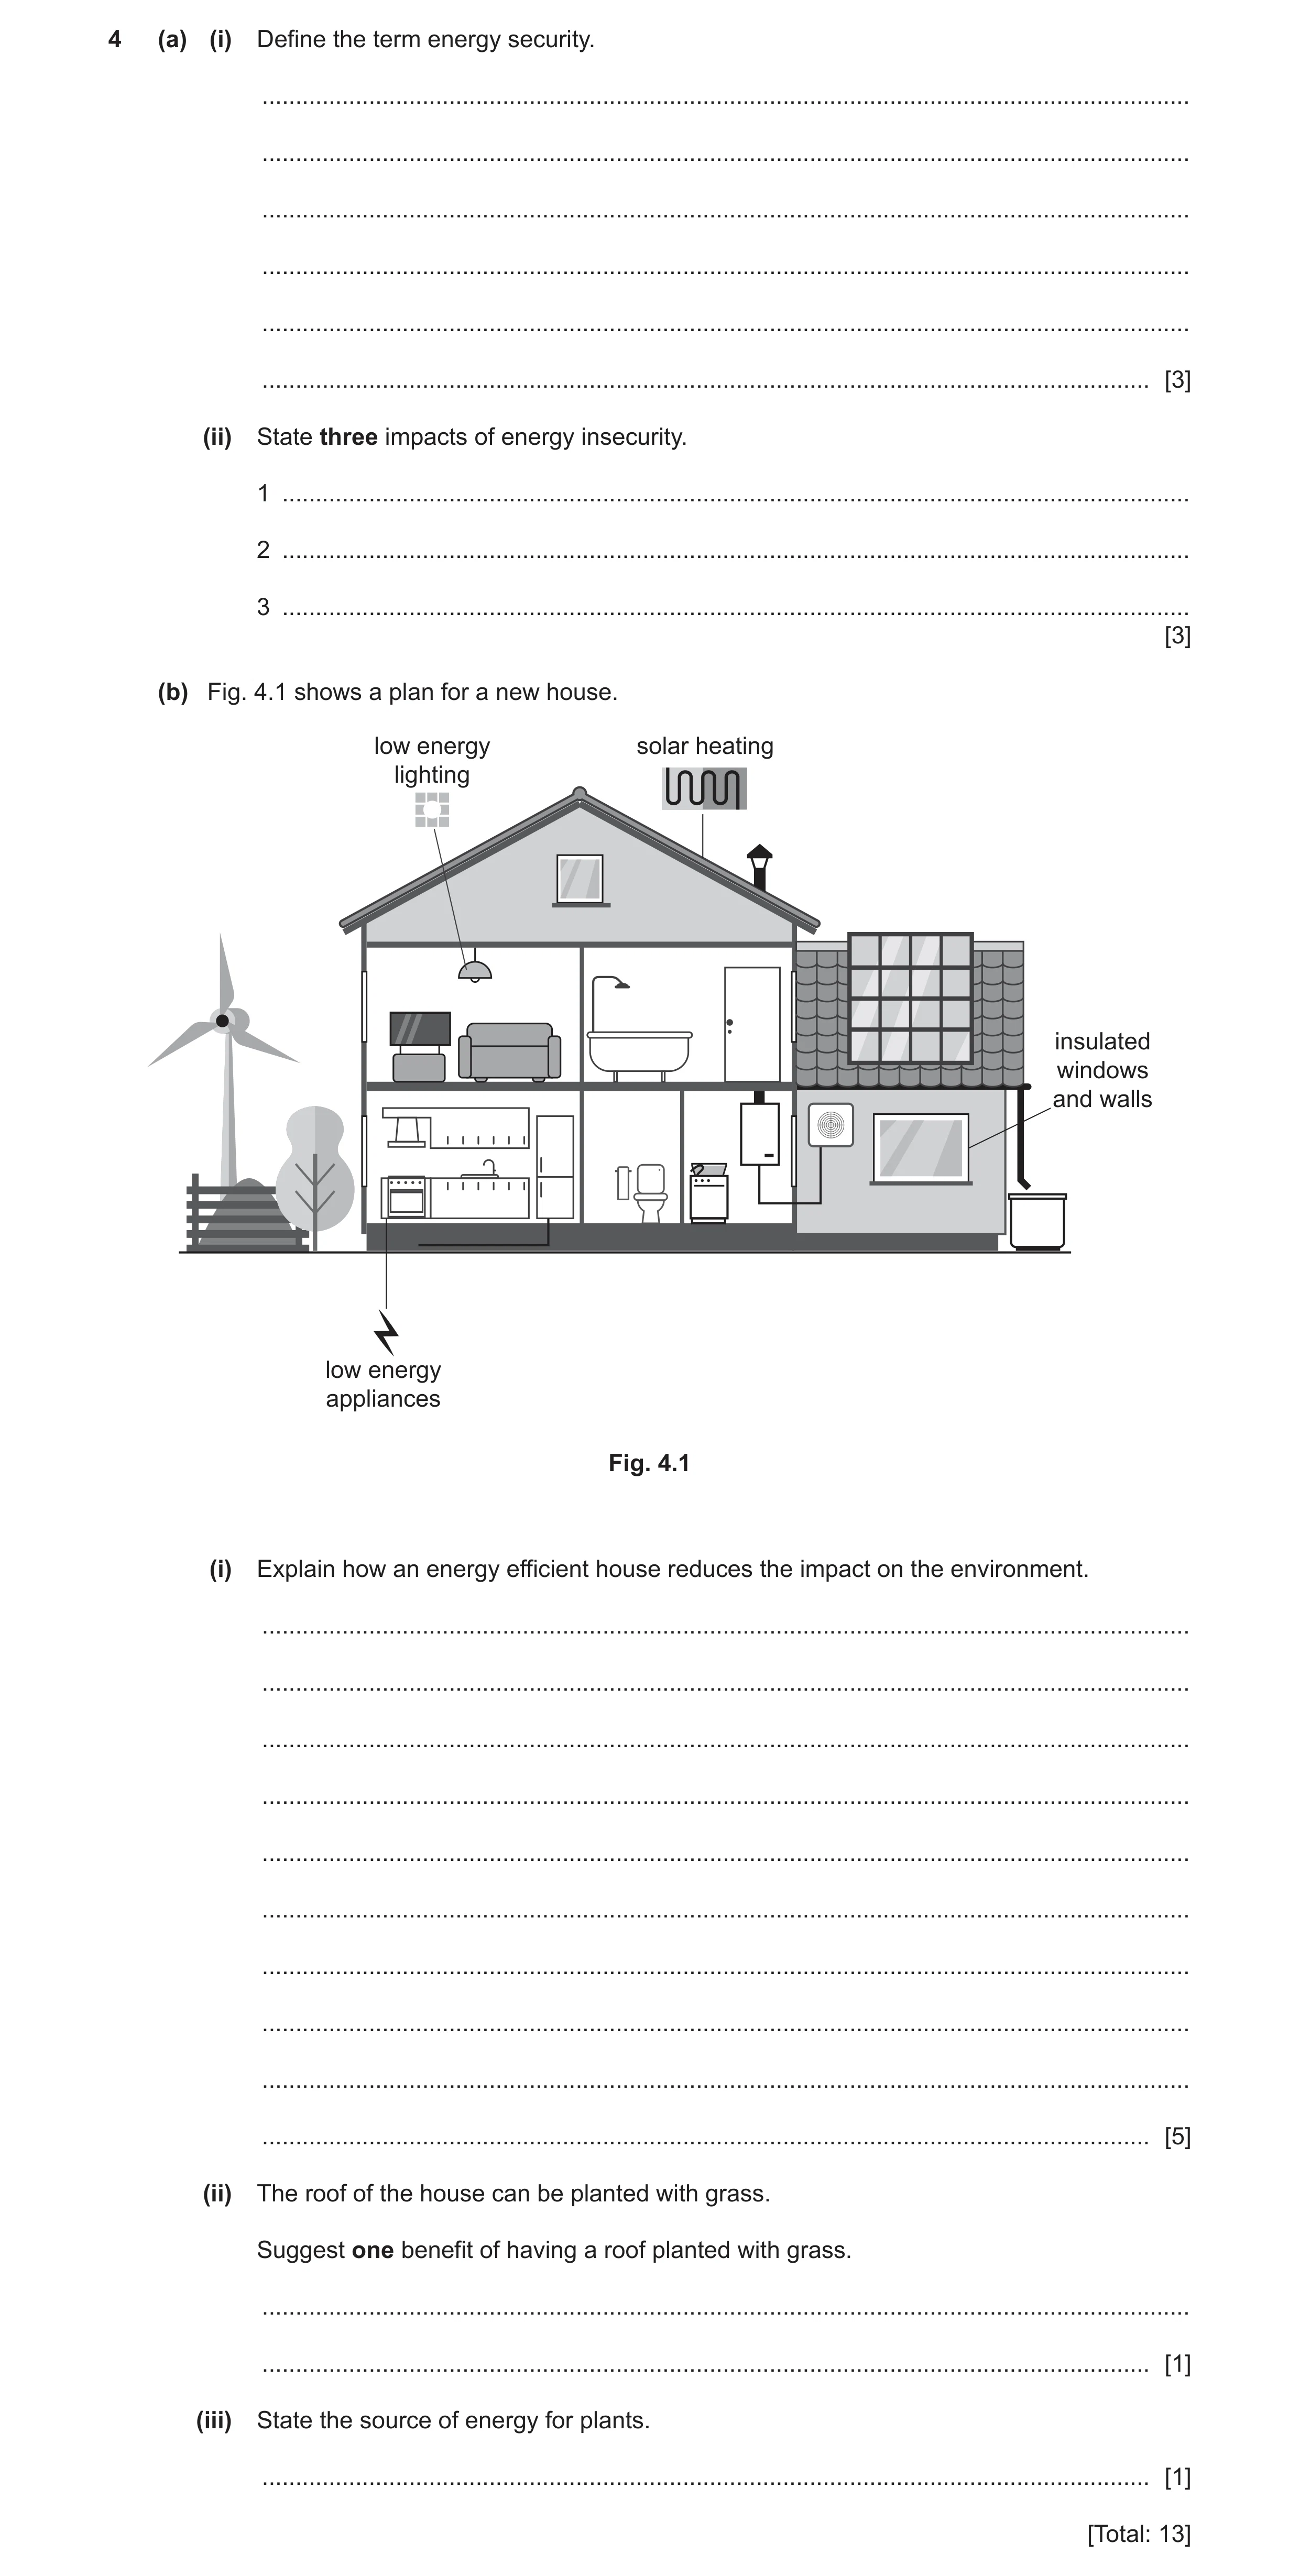
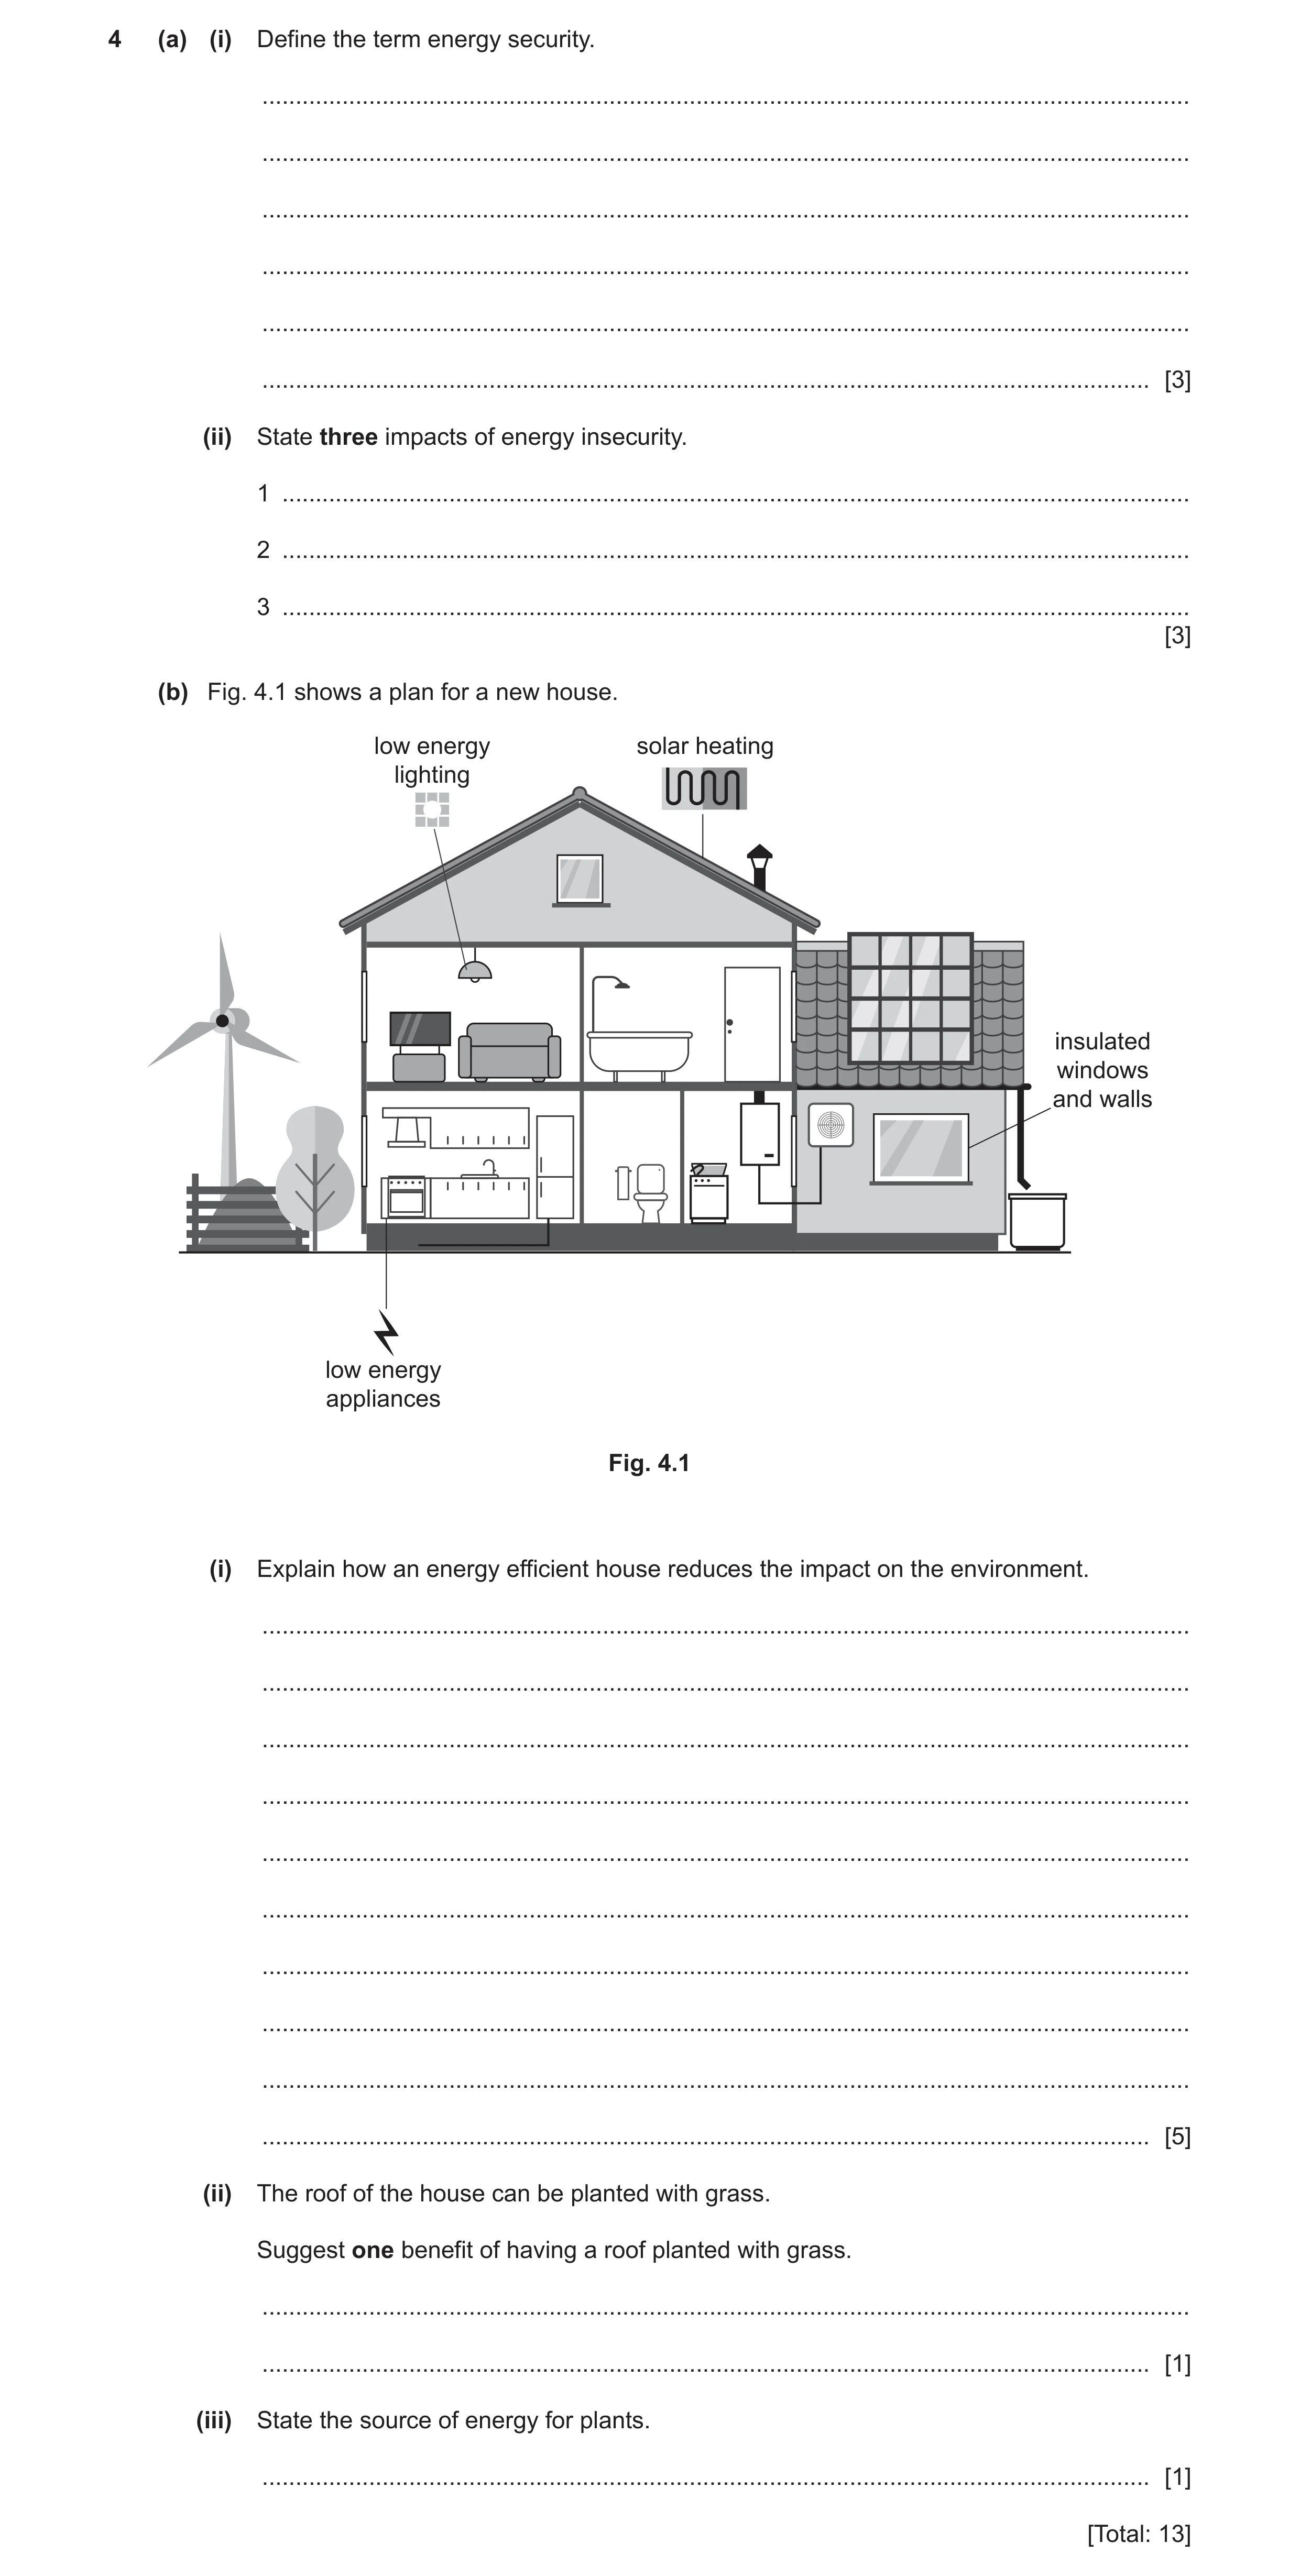
4 (a) (i) Define the term energy security. … … … … … … [3] (ii) State three impacts of energy insecurity. 1 … 2 … 3 … [3] (b) Fig. 4.1 shows a plan for a new house. low energy solar heating lighting insulated windows and walls low energy appliances Fig. 4.1 (i) Explain how an energy efficient house reduces the impact on the environment. … … … … … … … … … … [5] (ii) The roof of the house can be planted with grass. Suggest one benefit of having a roof planted with grass. … … [1] (iii) State the source of energy for plants. … [1] [Total: 13]
13 marks
Mark scheme: 4(a)(i) reliable availability of energy (sources) / enough energy; 3 at an affordable price; with consideration of the environmental impacts; 4(a)(ii) any three from: 3 disrupted supply / power cuts / less workable hours; increasing prices for energy resources; increasing costs for industry; job losses or unemployment / recession or economy decreases / lower income; poverty / low standard of living; reliance on imported energy; civil disruption /conflict; 4(b)(i) any five from: 5 wind/solar panels provide renewable energy supply; so reduces use of /fossil fuels; which are finite / non-renewable; reduction in mining e.g. coal; rain water collection eases water insecurity / provides source of water for irrigation / recycles water; water recycling reduces water wastage; composting reduces waste; provides source of nutrients for soil; less artificial fertilisers needed / reduces fertiliser production; low energy appliances/lights reduce use of resources/fossil fuels; reduce emissions of carbon dioxide; reduces, climate change / global warming; insulated walls/windows reduces heat transfer / loss / gain; 4(b)(ii) any one from: 1 more insulation; increase photosynthesis / absorbs carbon dioxide; traps particulates; improves biodiversity; reduces, storm water / run-off; increases infiltration; 4(b)(iii) Sun; 1
This question in 8291/21 Oct/Nov 2023
Q16 · Define the term energy security 8291/23 Oct/Nov 2023
4 (a) (i) Define the term energy security. … … … … … … [3] (ii) State three impacts of energy insecurity. 1 … 2 … 3 … [3] (b) Fig. 4.1 shows a plan for a new house. low energy solar heating lighting insulated windows and walls low energy appliances Fig. 4.1 (i) Explain how an energy efficient house reduces the impact on the environment. … … … … … … … … … … [5] (ii) The roof of the house can be planted with grass. Suggest one benefit of having a roof planted with grass. … … [1] (iii) State the source of energy for plants. … [1] [Total: 13]
13 marks
Mark scheme: 4(a)(i) reliable availability of energy (sources) / enough energy; 3 at an affordable price; with consideration of the environmental impacts; 4(a)(ii) any three from: 3 disrupted supply / power cuts / less workable hours; increasing prices for energy resources; increasing costs for industry; job losses or unemployment / recession or economy decreases / lower income; poverty / low standard of living; reliance on imported energy; civil disruption /conflict; 4(b)(i) any five from: 5 wind/solar panels provide renewable energy supply; so reduces use of /fossil fuels; which are finite / non-renewable; reduction in mining e.g. coal; rain water collection eases water insecurity / provides source of water for irrigation / recycles water; water recycling reduces water wastage; composting reduces waste; provides source of nutrients for soil; less artificial fertilisers needed / reduces fertiliser production; low energy appliances/lights reduce use of resources/fossil fuels; reduce emissions of carbon dioxide; reduces, climate change / global warming; insulated walls/windows reduces heat transfer / loss / gain; 4(b)(ii) any one from: 1 more insulation; increase photosynthesis / absorbs carbon dioxide; traps particulates; improves biodiversity; reduces, storm water / run-off; increases infiltration; 4(b)(iii) Sun; 1
This question in 8291/23 Oct/Nov 2023
Q17 · ‘Climate TRACE’ is a global organisation that collects and shares data on greenhouse gas… 8291/21 Oct/Nov 2024
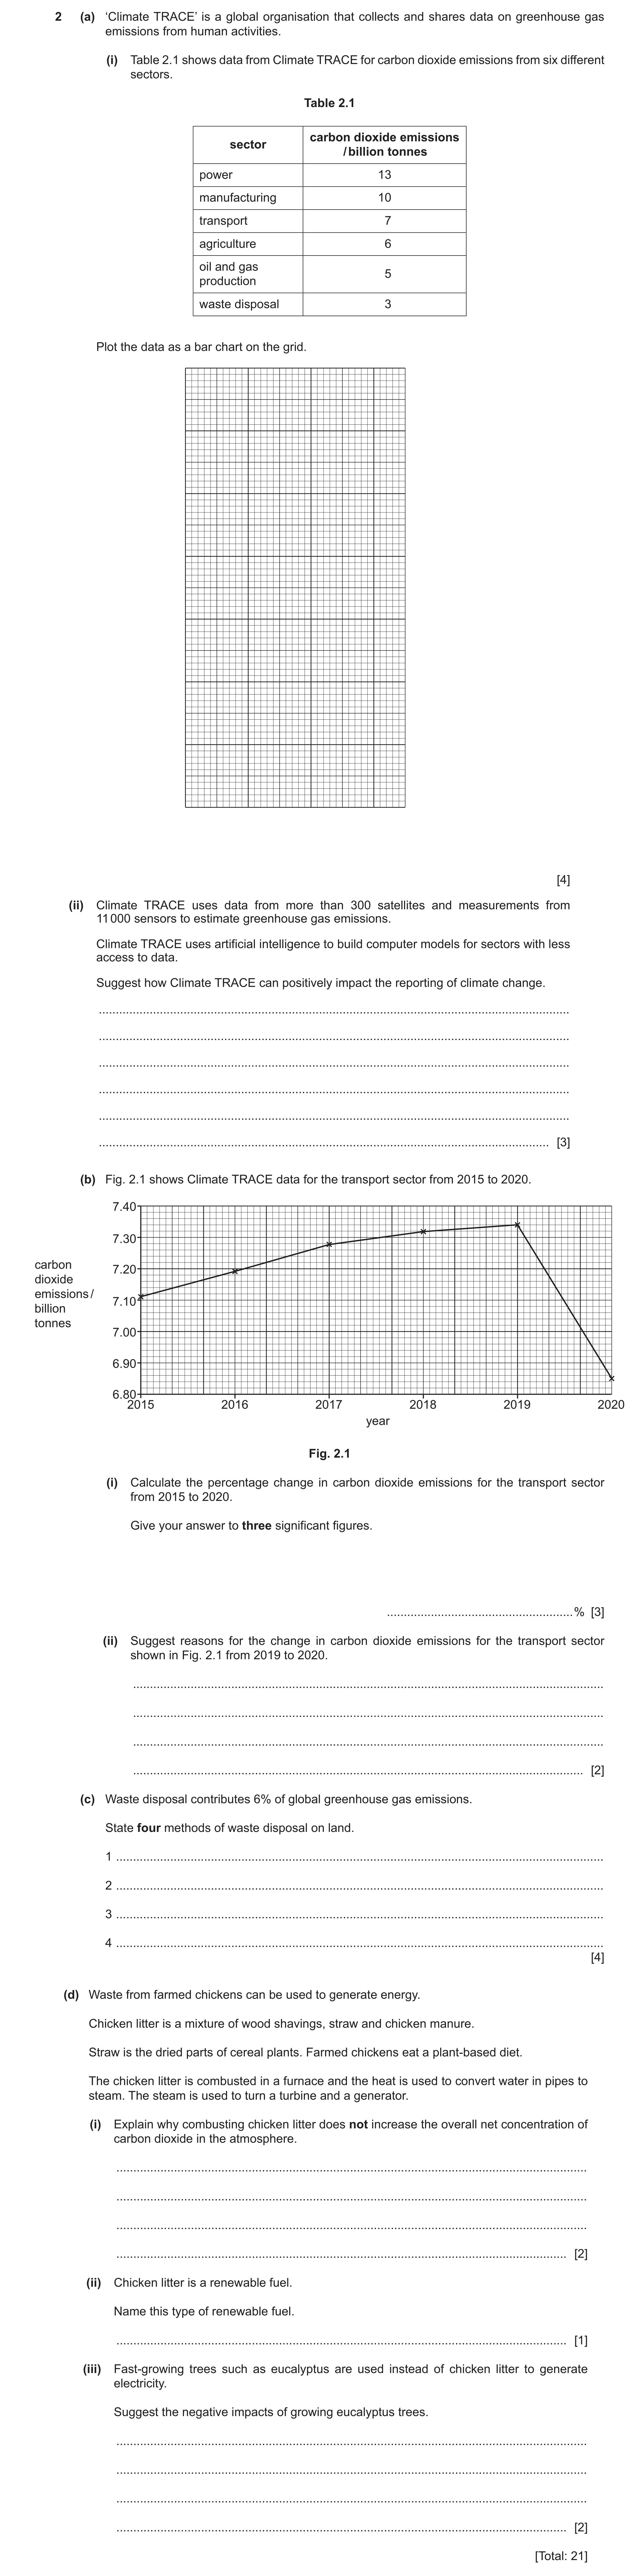
2 (a) ‘Climate TRACE’ is a global organisation that collects and shares data on greenhouse gas emissions from human activities. (i) Table 2.1 shows data from Climate TRACE for carbon dioxide emissions from six different sectors. Table 2.1 carbon dioxide emissions sector / billion tonnes power 13 manufacturing 10 transport 7 agriculture 6 oil and gas 5 production waste disposal 3 Plot the data as a bar chart on the grid. [4] (ii) Climate TRACE uses data from more than 300 satellites and measurements from 11 000 sensors to estimate greenhouse gas emissions. Climate TRACE uses artificial intelligence to build computer models for sectors with less access to data. Suggest how Climate TRACE can positively impact the reporting of climate change. … … … … … … [3] (b) Fig. 2.1 shows Climate TRACE data for the transport sector from 2015 to 2020. 7.40 7.30 carbon 7.20 dioxide emissions / 7.10 billion tonnes 7.00 6.90 6.80 2015 2016 2017 2018 2019 2020 year Fig. 2.1 (i) Calculate the percentage change in carbon dioxide emissions for the transport sector from 2015 to 2020. Give your answer to three significant figures. … % [3] (ii) Suggest reasons for the change in carbon dioxide emissions for the transport sector shown in Fig. 2.1 from 2019 to 2020. … … … … [2] (c) Waste disposal contributes 6% of global greenhouse gas emissions. State four methods of waste disposal on land. 1 … 2 … 3 … 4 … [4] (d) Waste from farmed chickens can be used to generate energy. Chicken litter is a mixture of wood shavings, straw and chicken manure. Straw is the dried parts of cereal plants. Farmed chickens eat a plant-based diet. The chicken litter is combusted in a furnace and the heat is used to convert water in pipes to steam. The steam is used to turn a turbine and a generator. (i) Explain why combusting chicken litter does not increase the overall net concentration of carbon dioxide in the atmosphere. … … … … [2] (ii) Chicken litter is a renewable fuel. Name this type of renewable fuel. … [1] (iii) Fast-growing trees such as eucalyptus are used instead of chicken litter to generate electricity. Suggest the negative impacts of growing eucalyptus trees. … … … … [2] [Total: 21]
21 marks
Mark scheme: 2(a)(i) axis labels: y-axis and unit carbon dioxide emissions / billion tonnes and x-axis sector; 4 sensible linear scale with data that occupies at least half the grid; bars equal width and not touching; correct plots; 2(a)(ii) any three from: 3 provides reliable data; provides a large quantity of data / big data; increases confidence in data; predicts emissions where data is not available; data can be used in climate models; shows which sectors are most polluting; targeted strategies for each sector; increase (public) awareness; idea that it is a global organisation so includes all countries / produces global averages for emissions; 2(b)(i) correct readings from graph: 3 2015: 7.11 and 2020: 6.85; correct manipulation of 2015 and 2020 data; [(7.11 − 6.85) 7.11] 100 3.6568; answer to three significant figures (−)3.66; 2(b)(ii) any two from: 2 decreased use of vehicles; increase use of: public transport; electric cars; biofuel; low-carbon fuels; 2(c) any four from: 4 landfill sites; incineration / burning (of waste); storage; exporting to other countries; recycling; 2(d)(i) any two from: 2 chicken litter content are plant based; plants took in carbon dioxide (during photosynthesis); this carbon dioxide is returned to the atmosphere; 2(d)(ii) biomass / biofuel; 1 2(d)(iii) any two from: 2 could become invasive / could outcompete native plants; replace food crops / use land that could be used for agriculture or crops; could lead to food insecurity; (grown for biofuel so) short lived habitat; reduces biodiversity; require a lot of water;
This question in 8291/21 Oct/Nov 2024
Q18 · ‘Climate TRACE’ is a global organisation that collects and shares data on greenhouse gas… 8291/23 Oct/Nov 2024
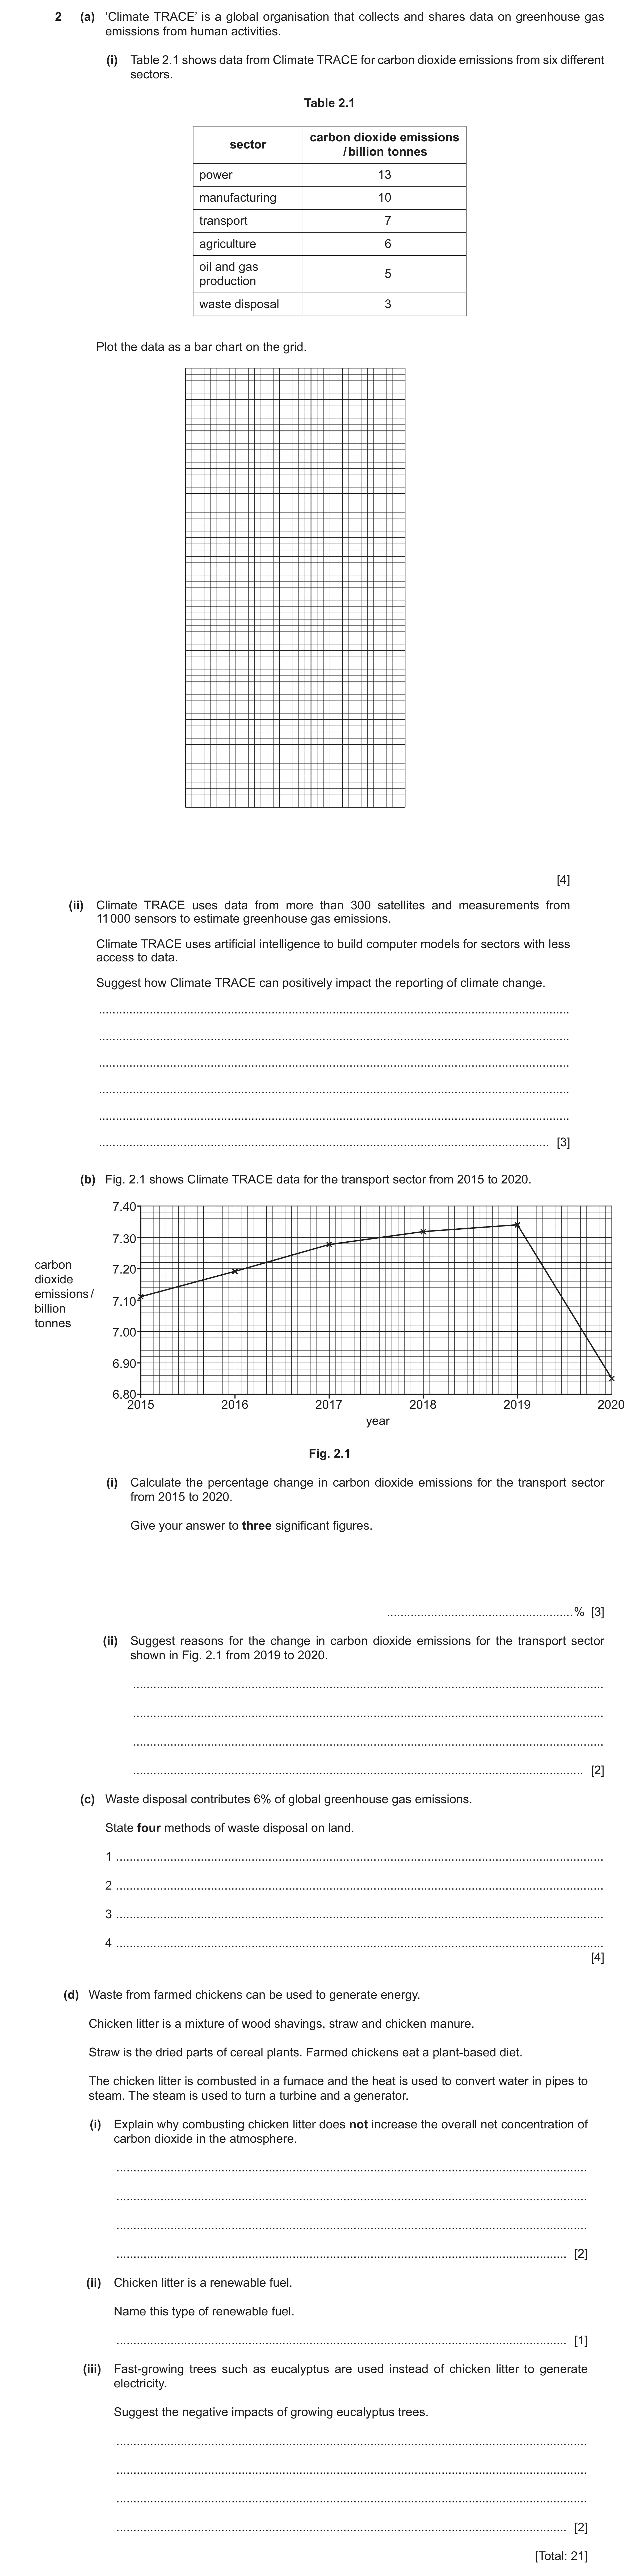
2 (a) ‘Climate TRACE’ is a global organisation that collects and shares data on greenhouse gas emissions from human activities. (i) Table 2.1 shows data from Climate TRACE for carbon dioxide emissions from six different sectors. Table 2.1 carbon dioxide emissions sector / billion tonnes power 13 manufacturing 10 transport 7 agriculture 6 oil and gas 5 production waste disposal 3 Plot the data as a bar chart on the grid. [4] (ii) Climate TRACE uses data from more than 300 satellites and measurements from 11 000 sensors to estimate greenhouse gas emissions. Climate TRACE uses artificial intelligence to build computer models for sectors with less access to data. Suggest how Climate TRACE can positively impact the reporting of climate change. … … … … … … [3] (b) Fig. 2.1 shows Climate TRACE data for the transport sector from 2015 to 2020. 7.40 7.30 carbon 7.20 dioxide emissions / 7.10 billion tonnes 7.00 6.90 6.80 2015 2016 2017 2018 2019 2020 year Fig. 2.1 (i) Calculate the percentage change in carbon dioxide emissions for the transport sector from 2015 to 2020. Give your answer to three significant figures. … % [3] (ii) Suggest reasons for the change in carbon dioxide emissions for the transport sector shown in Fig. 2.1 from 2019 to 2020. … … … … [2] (c) Waste disposal contributes 6% of global greenhouse gas emissions. State four methods of waste disposal on land. 1 … 2 … 3 … 4 … [4] (d) Waste from farmed chickens can be used to generate energy. Chicken litter is a mixture of wood shavings, straw and chicken manure. Straw is the dried parts of cereal plants. Farmed chickens eat a plant-based diet. The chicken litter is combusted in a furnace and the heat is used to convert water in pipes to steam. The steam is used to turn a turbine and a generator. (i) Explain why combusting chicken litter does not increase the overall net concentration of carbon dioxide in the atmosphere. … … … … [2] (ii) Chicken litter is a renewable fuel. Name this type of renewable fuel. … [1] (iii) Fast-growing trees such as eucalyptus are used instead of chicken litter to generate electricity. Suggest the negative impacts of growing eucalyptus trees. … … … … [2] [Total: 21]
21 marks
Mark scheme: 2(a)(i) axis labels: y-axis and unit carbon dioxide emissions / billion tonnes and x-axis sector; 4 sensible linear scale with data that occupies at least half the grid; bars equal width and not touching; correct plots; 2(a)(ii) any three from: 3 provides reliable data; provides a large quantity of data / big data; increases confidence in data; predicts emissions where data is not available; data can be used in climate models; shows which sectors are most polluting; targeted strategies for each sector; increase (public) awareness; idea that it is a global organisation so includes all countries / produces global averages for emissions; 2(b)(i) correct readings from graph: 3 2015: 7.11 and 2020: 6.85; correct manipulation of 2015 and 2020 data; [(7.11 − 6.85) 7.11] 100 3.6568; answer to three significant figures (−)3.66; 2(b)(ii) any two from: 2 decreased use of vehicles; increase use of: public transport; electric cars; biofuel; low-carbon fuels; 2(c) any four from: 4 landfill sites; incineration / burning (of waste); storage; exporting to other countries; recycling; 2(d)(i) any two from: 2 chicken litter content are plant based; plants took in carbon dioxide (during photosynthesis); this carbon dioxide is returned to the atmosphere; 2(d)(ii) biomass / biofuel; 1 2(d)(iii) any two from: 2 could become invasive / could outcompete native plants; replace food crops / use land that could be used for agriculture or crops; could lead to food insecurity; (grown for biofuel so) short lived habitat; reduces biodiversity; require a lot of water;
This question in 8291/23 Oct/Nov 2024
Q19 · Biochar is added to soil to improve soil structure 8291/21 May/June 2025
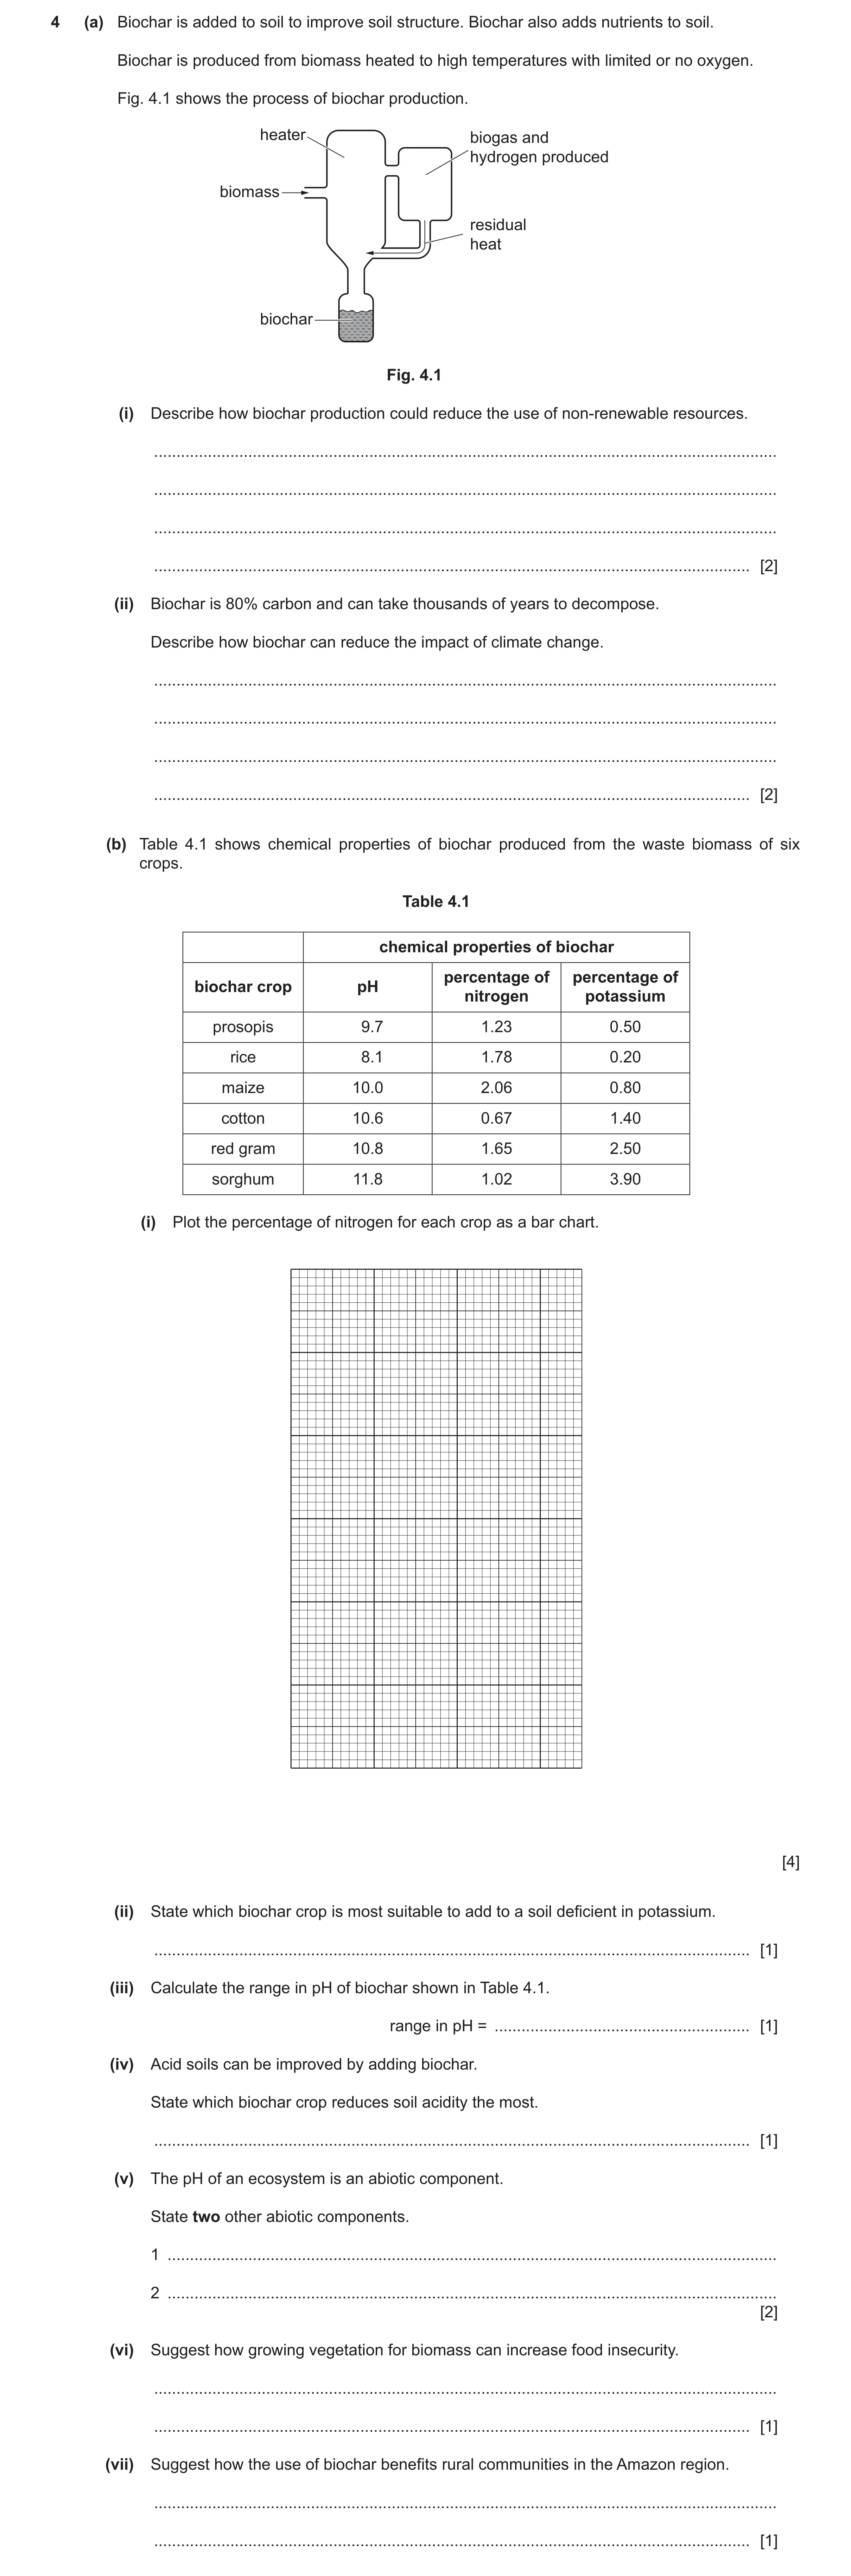
4 (a) Biochar is added to soil to improve soil structure. Biochar also adds nutrients to soil. Biochar is produced from biomass heated to high temperatures with limited or no oxygen. Fig. 4.1 shows the process of biochar production. heater biogas and hydrogen produced biomass residual heat biochar Fig. 4.1 (i) Describe how biochar production could reduce the use of non-renewable resources. … … … … [2] (ii) Biochar is 80% carbon and can take thousands of years to decompose. Describe how biochar can reduce the impact of climate change. … … … … [2] (b) Table 4.1 shows chemical properties of biochar produced from the waste biomass of six crops. Table 4.1 chemical properties of biochar percentage of percentage of biochar crop pH nitrogen potassium prosopis 9.7 1.23 0.50 rice 8.1 1.78 0.20 maize 10.0 2.06 0.80 cotton 10.6 0.67 1.40 red gram 10.8 1.65 2.50 sorghum 11.8 1.02 3.90 (i) Plot the percentage of nitrogen for each crop as a bar chart. [4] (ii) State which biochar crop is most suitable to add to a soil deficient in potassium. … [1] (iii) Calculate the range in pH of biochar shown in Table 4.1. range in pH = … [1] (iv) Acid soils can be improved by adding biochar. State which biochar crop reduces soil acidity the most. … [1] (v) The pH of an ecosystem is an abiotic component. State two other abiotic components. 1 … 2 … [2] (vi) Suggest how growing vegetation for biomass can increase food insecurity. … … [1] (vii) Suggest how the use of biochar benefits rural communities in the Amazon region. … … [1]
15 marks
Mark scheme: 4(a)(i) any two from: 2 M1 biogas / biofuels, are renewable fuels; M2 the (residual) heat from the process is fed back to the heater / no additional energy needed; M3 stated example of how use of biochar reduces the use of non-renewable resources e.g. biochar does not need to be extracted from a quarry using equipment that runs on non-renewable resources; 4(a)(ii) any two from: 2 M1 carbon, capture / sink / store; M2 carbon stored for a long time; M3 replaces, non-renewable resources / fossil fuels; 4(b)(i) M1 axis labels: y-axis percentage of nitrogen AND x-axis biochar crop AND crop names; 4 M2 sensible linear scale such that plotted points occupy at least half of grid; M3 5–6 correct plots; M4 bars drawn with ruler AND of equal width AND not touching; 4(b)(ii) sorghum; 1 4(b)(iii) 3.7; 1 4(b)(iv) sorghum; 1 4(b)(v) any two from: 2 M1 temperature; M2 humidity; M3 water; M4 oxygen; M5 salinity; M6 light; 4(b)(vi) any one from: 1 M1 (land or vegetation) not used for crops or food / reduced crop yield; M2 less food for livestock; M3 vegetation cannot be eaten; 4(b)(vii) any one from: 1 M1 maintains fertile land / allows for good plant or crop growth; M2 improves food security; M3 more land can be used to grow crops; M4 stated economic benefit e.g. of selling biomass to make biochar; M5 sustainable practice; M6 can be used, as a fuel / to provide energy; M7 readily available; 4(c) M1 uneven / scattered, distribution; 3 M2 large area, in south / S / south east / SE / east / E; M3 large areas, either side / along, rivers; 4(d)(i) key matches pie chart with shading AND labels; 1 4(d)(ii) any two from: 2 M1 homes / towns / roads / infrastructure / construction / urbanisation / industry / building; M2 mineral extraction / mining; M3 renewable energy e.g. hydroelectric / HEP / wind farms / solar power; M4 reservoirs / dams; M5 natural disasters e.g. storms / (wild) fires / floods / droughts / volcanoes; 4(e)(i) any two from: 2 M1 first (species) to colonise; M2 small plants; M3 fast growing / quickly fills an area / spread fast; M4 short lived; M5 improves soil or stated example e.g. binds shallow or thin soil / improves soil structure / improves soil fertility / adds organic matter / improves water holding capacity; M6 tolerance to hostile conditions / stated example e.g. low pH or acid soils or can grow in soils with limited nutrients; 4(e)(ii) climax (community); 1
This question in 8291/21 May/June 2025
 1 / 50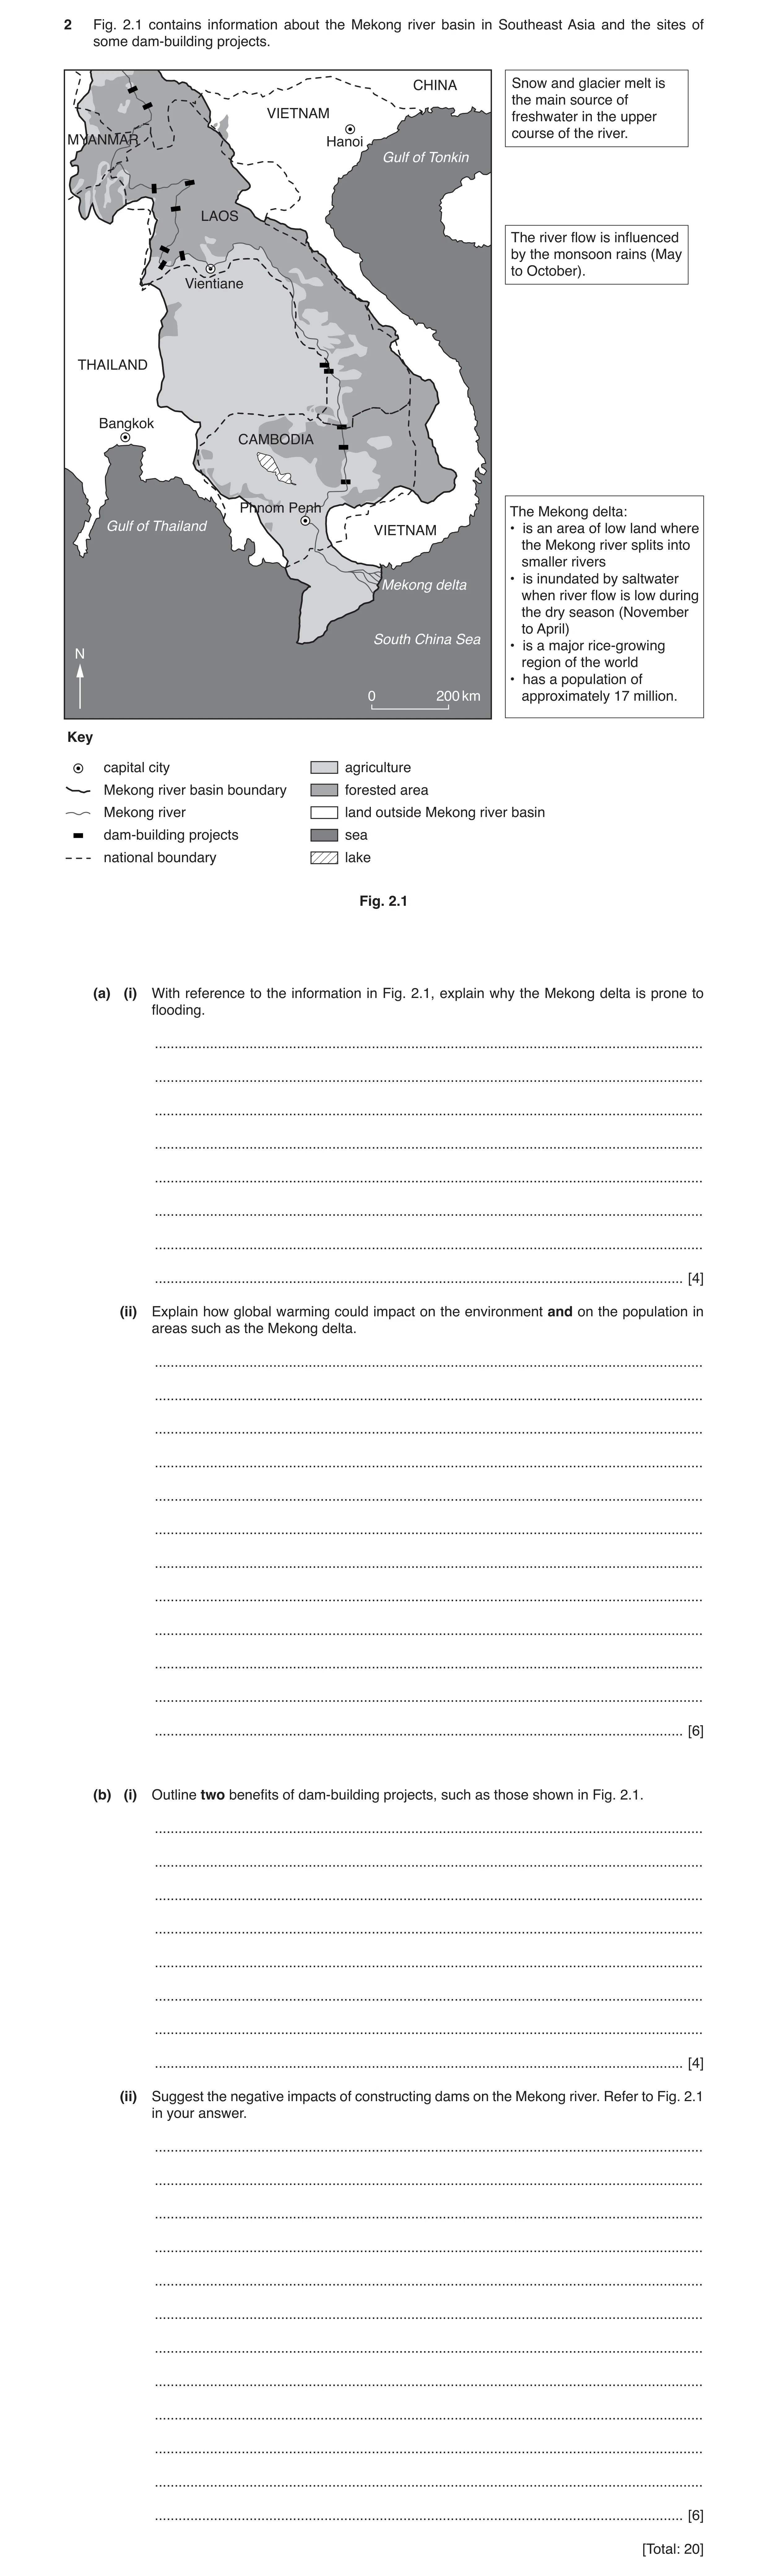
 5 / 50
 6 / 50
 7 / 50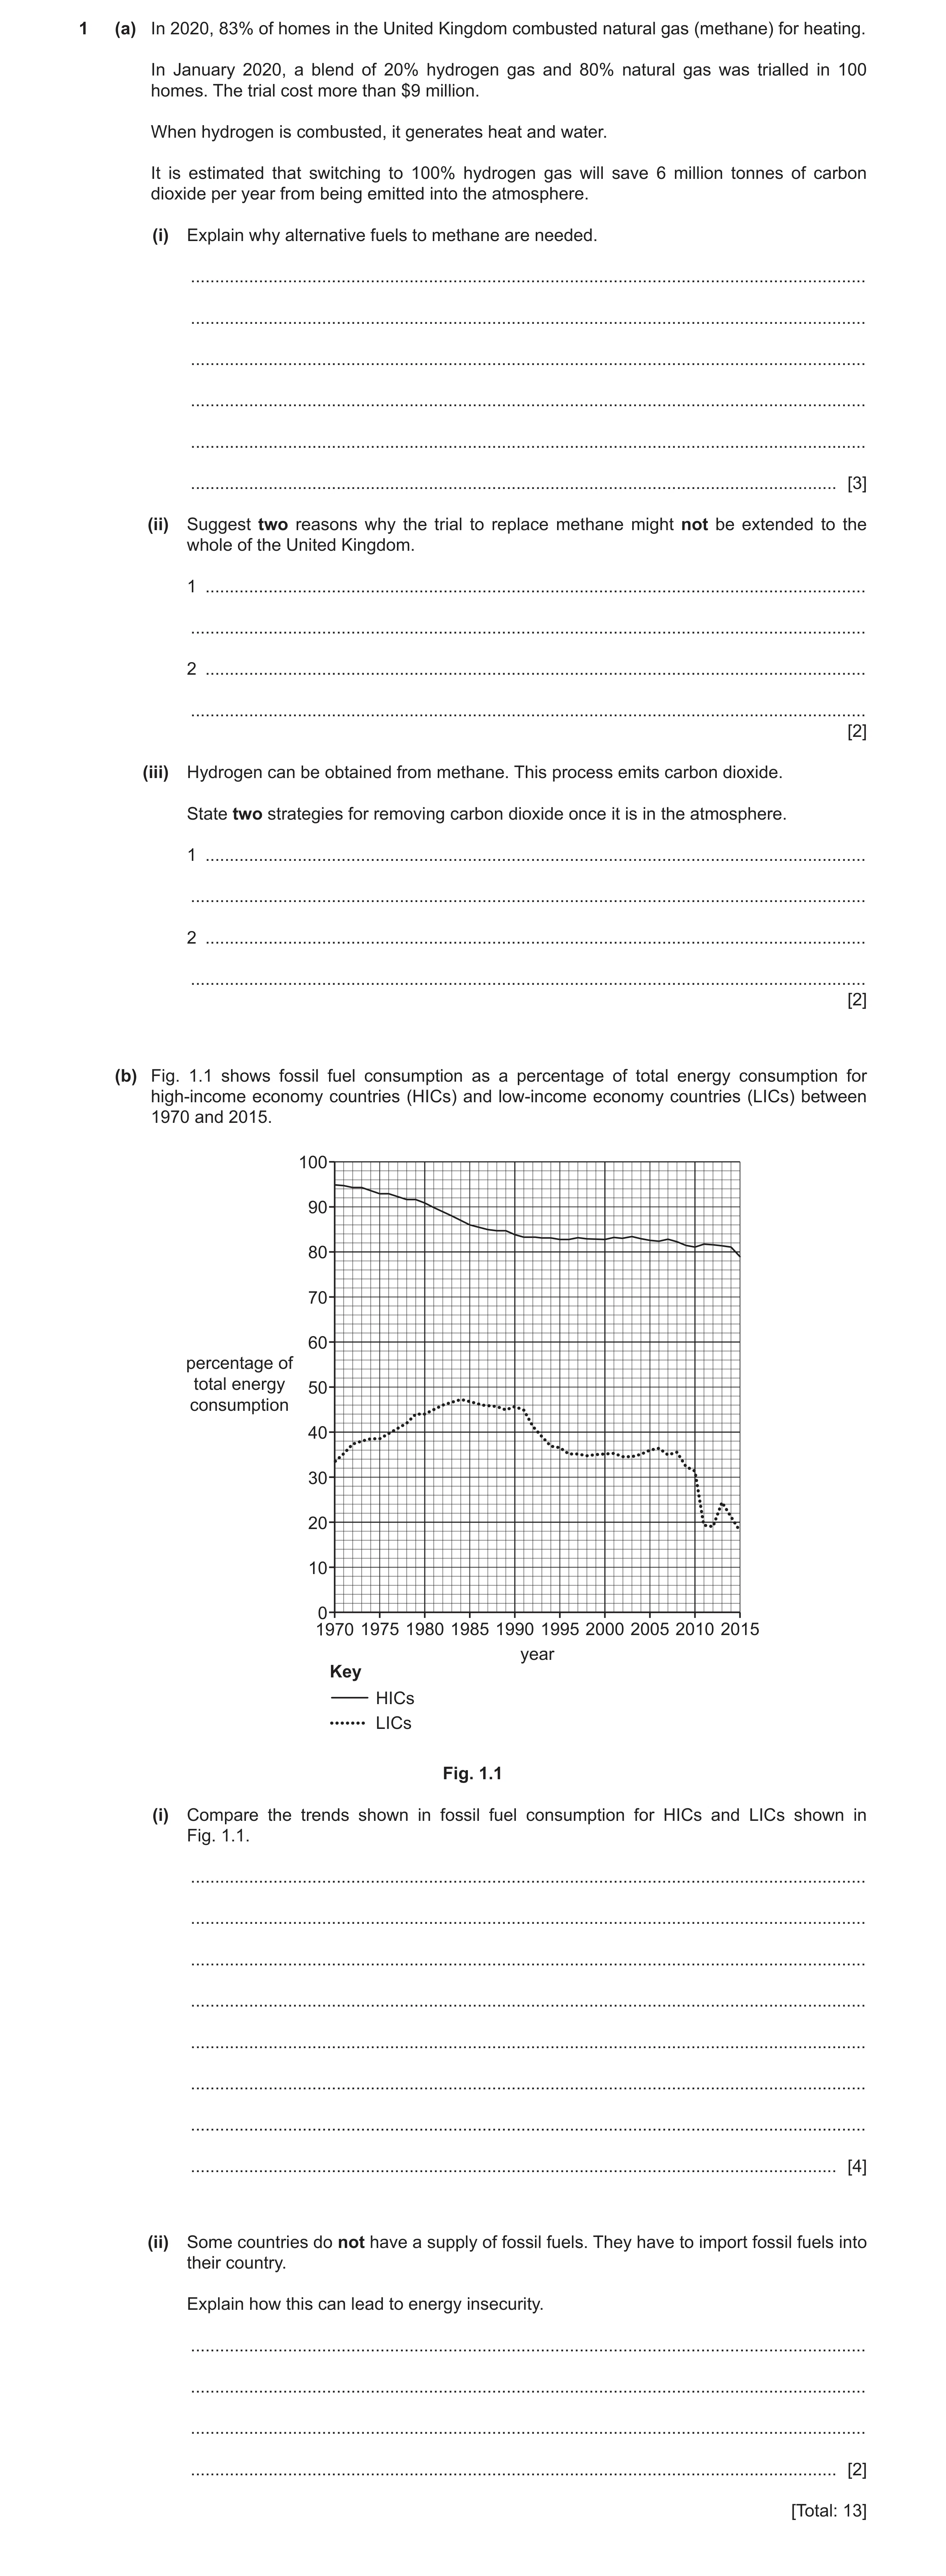



 40
40 20
20 40
40 40
40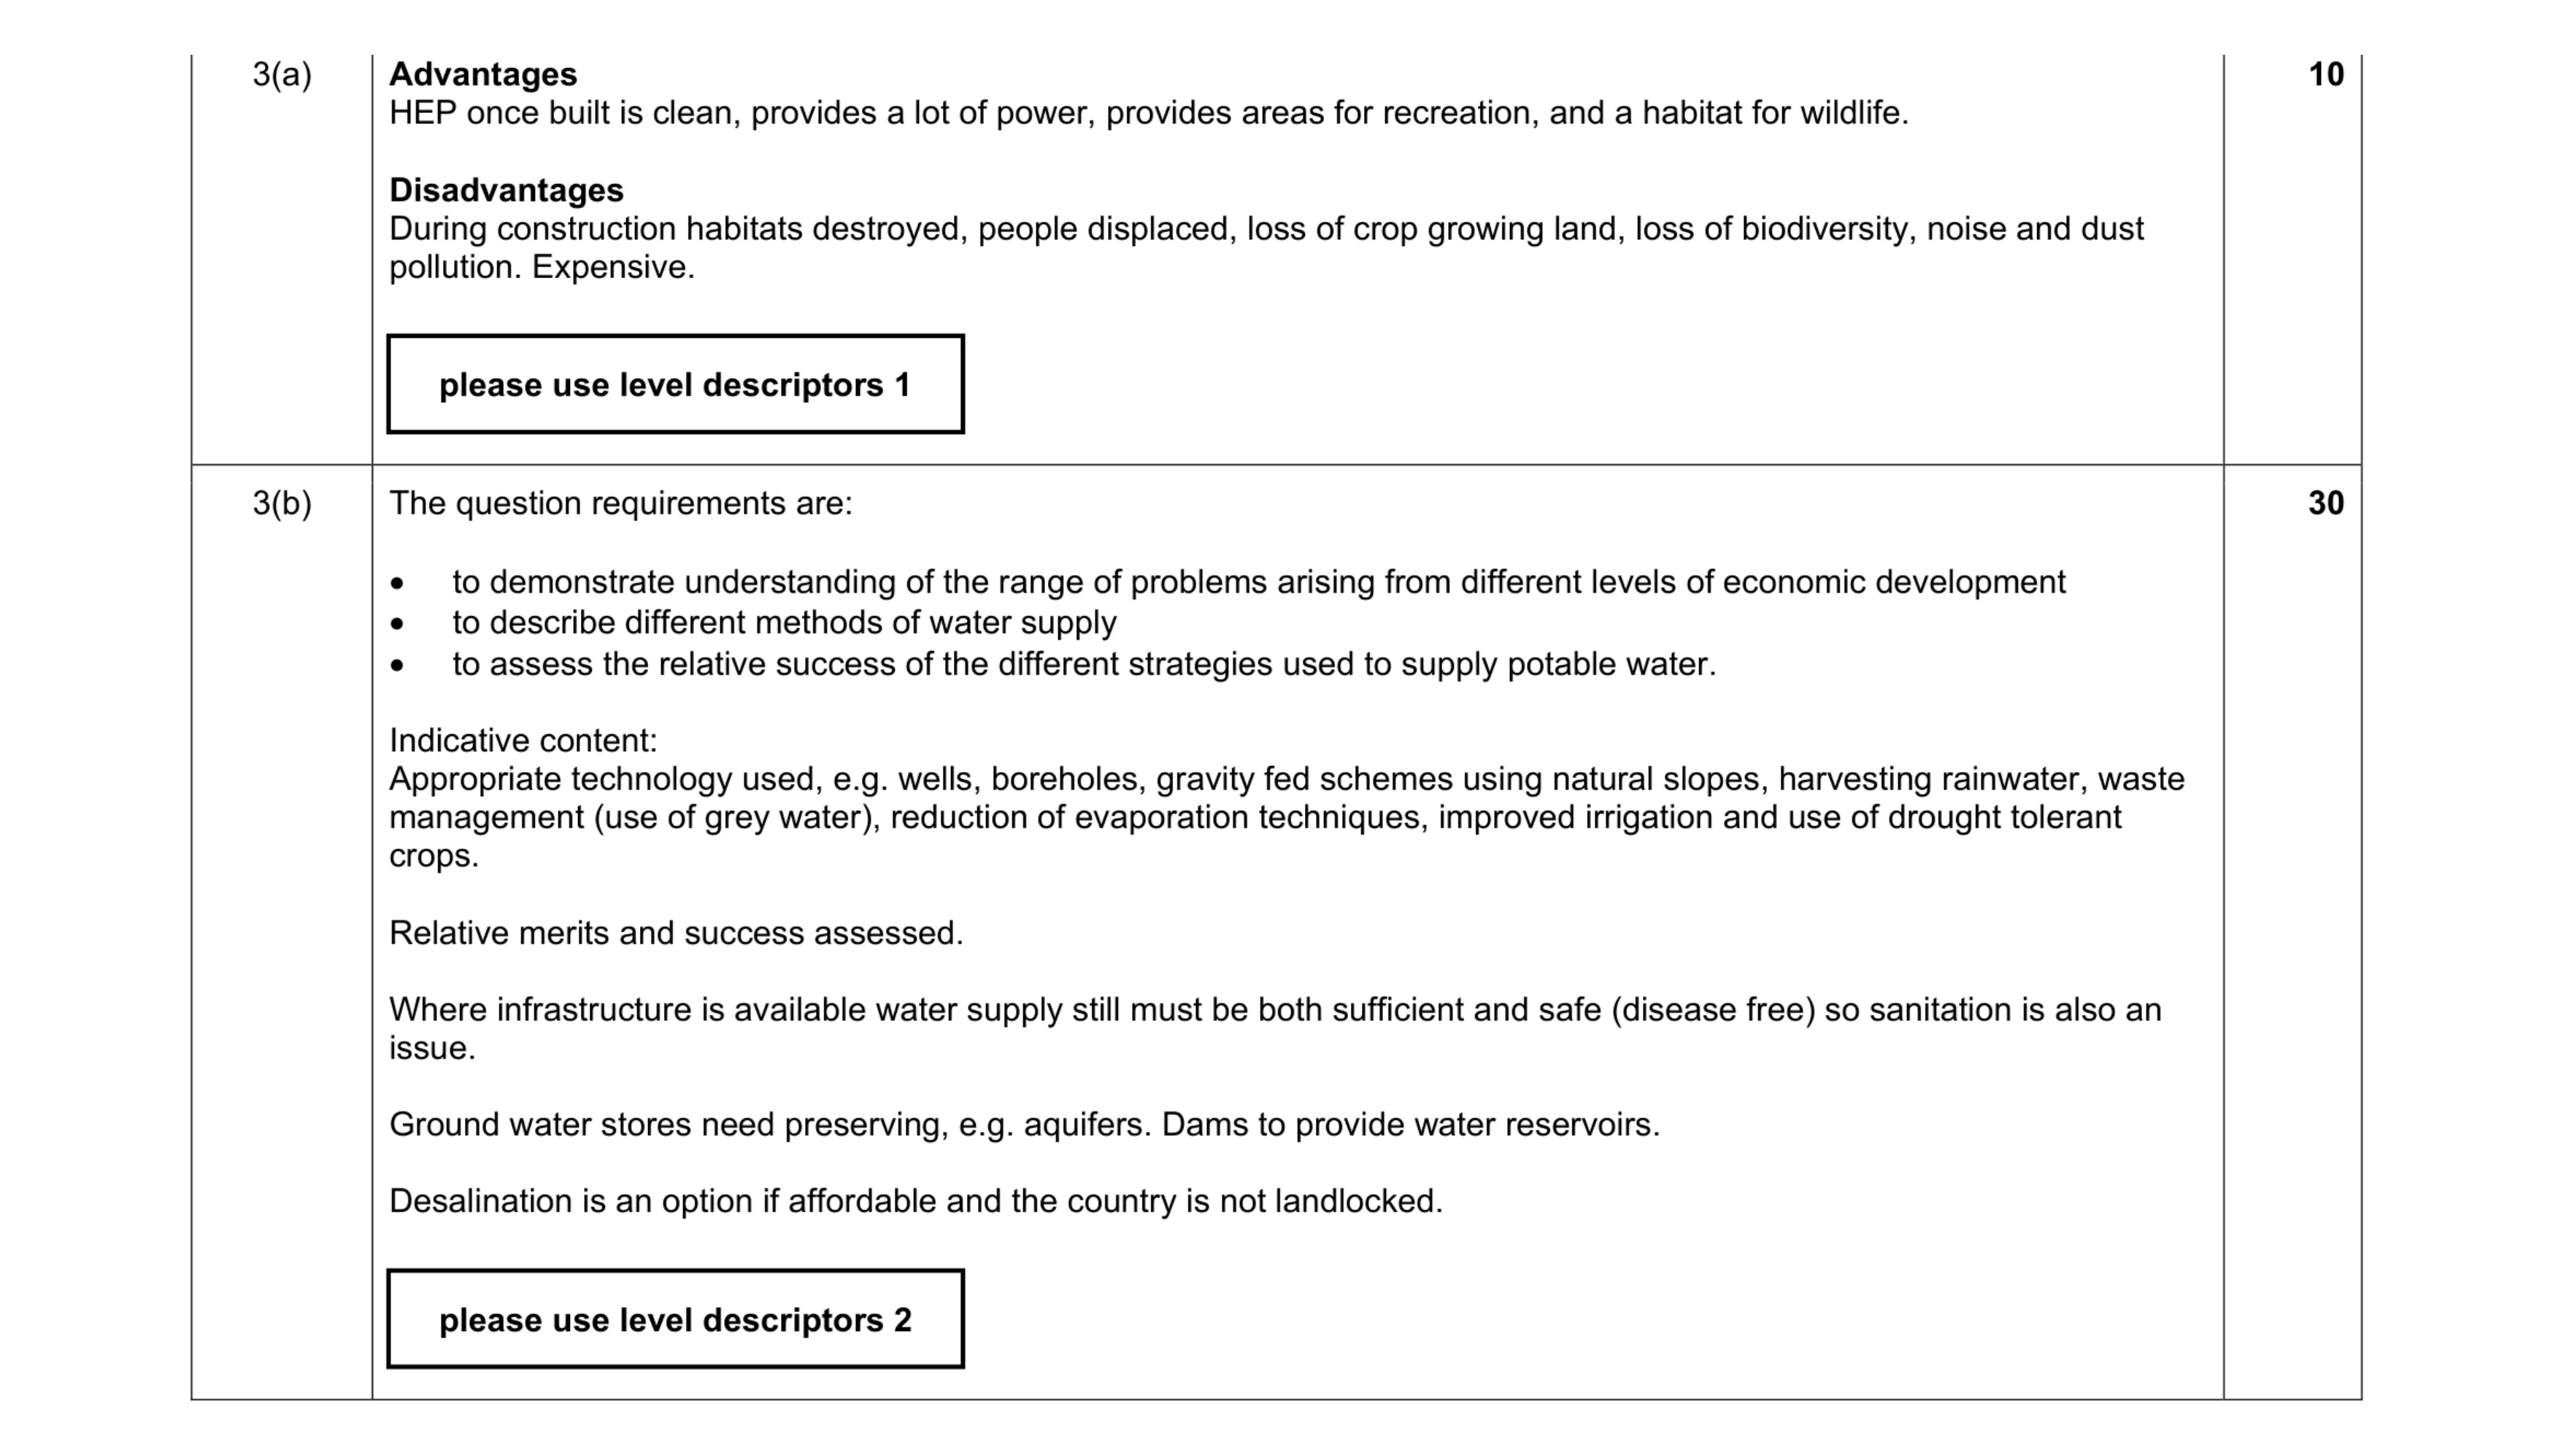 40
40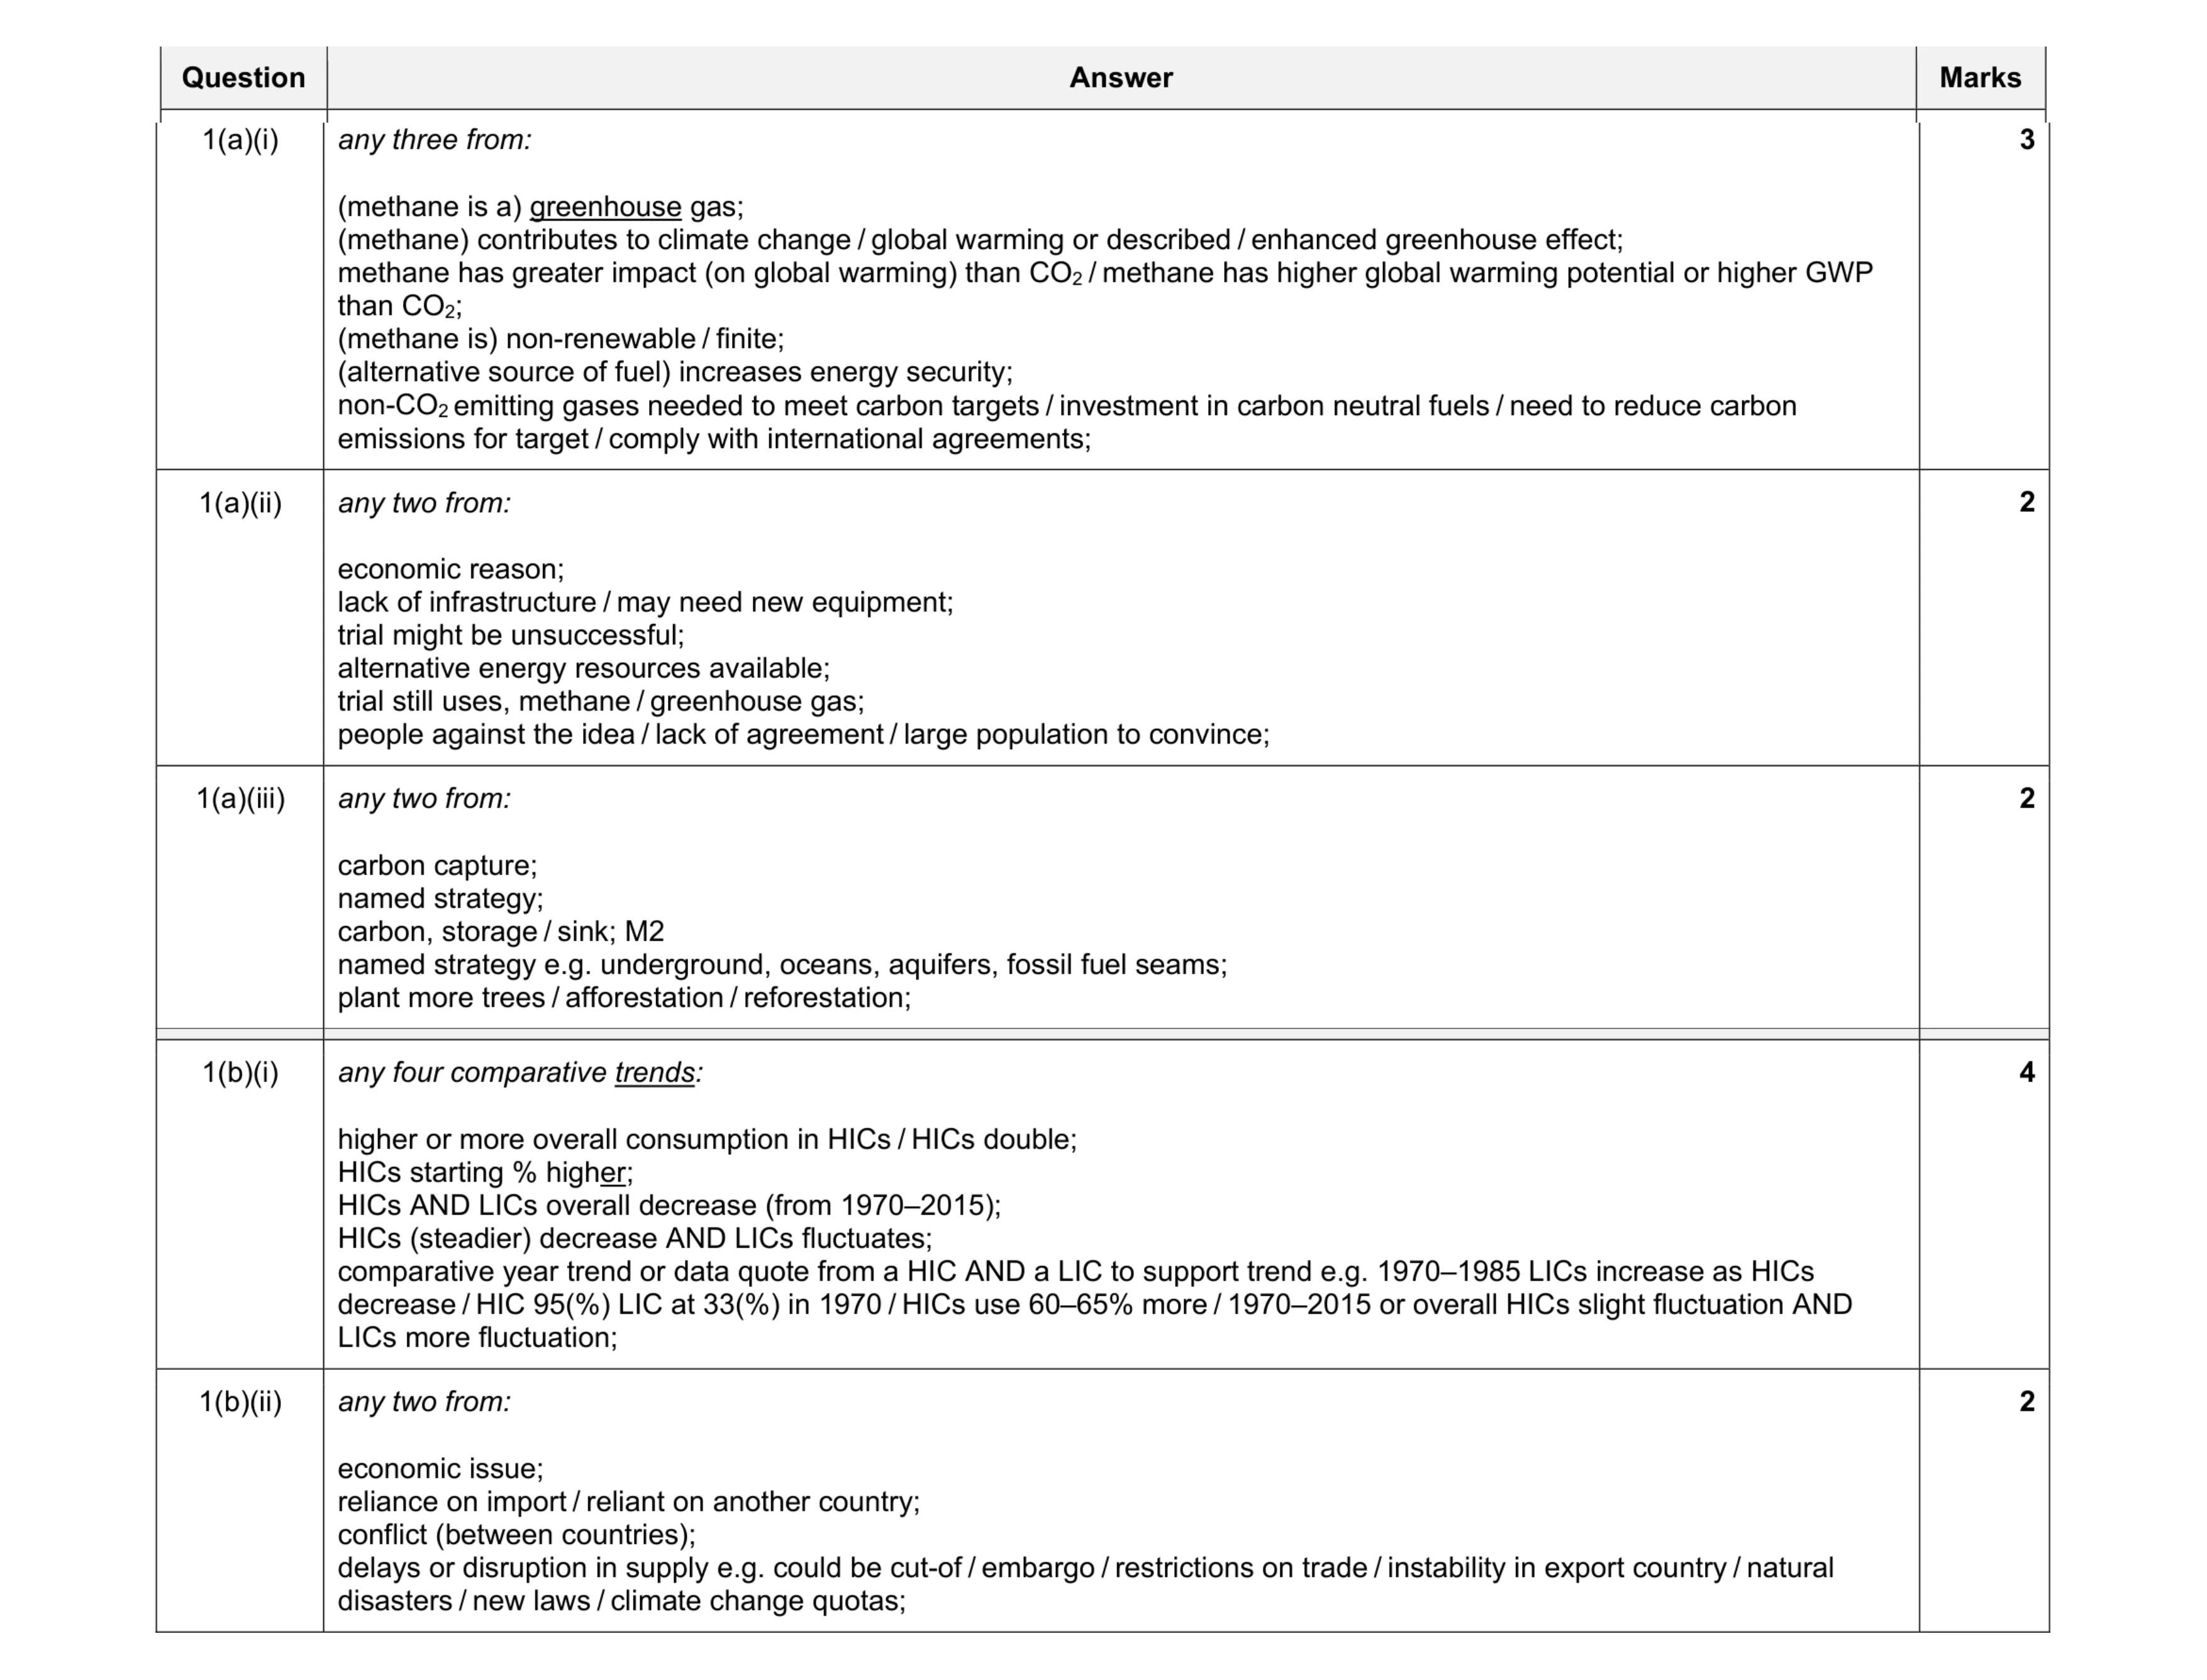 13
13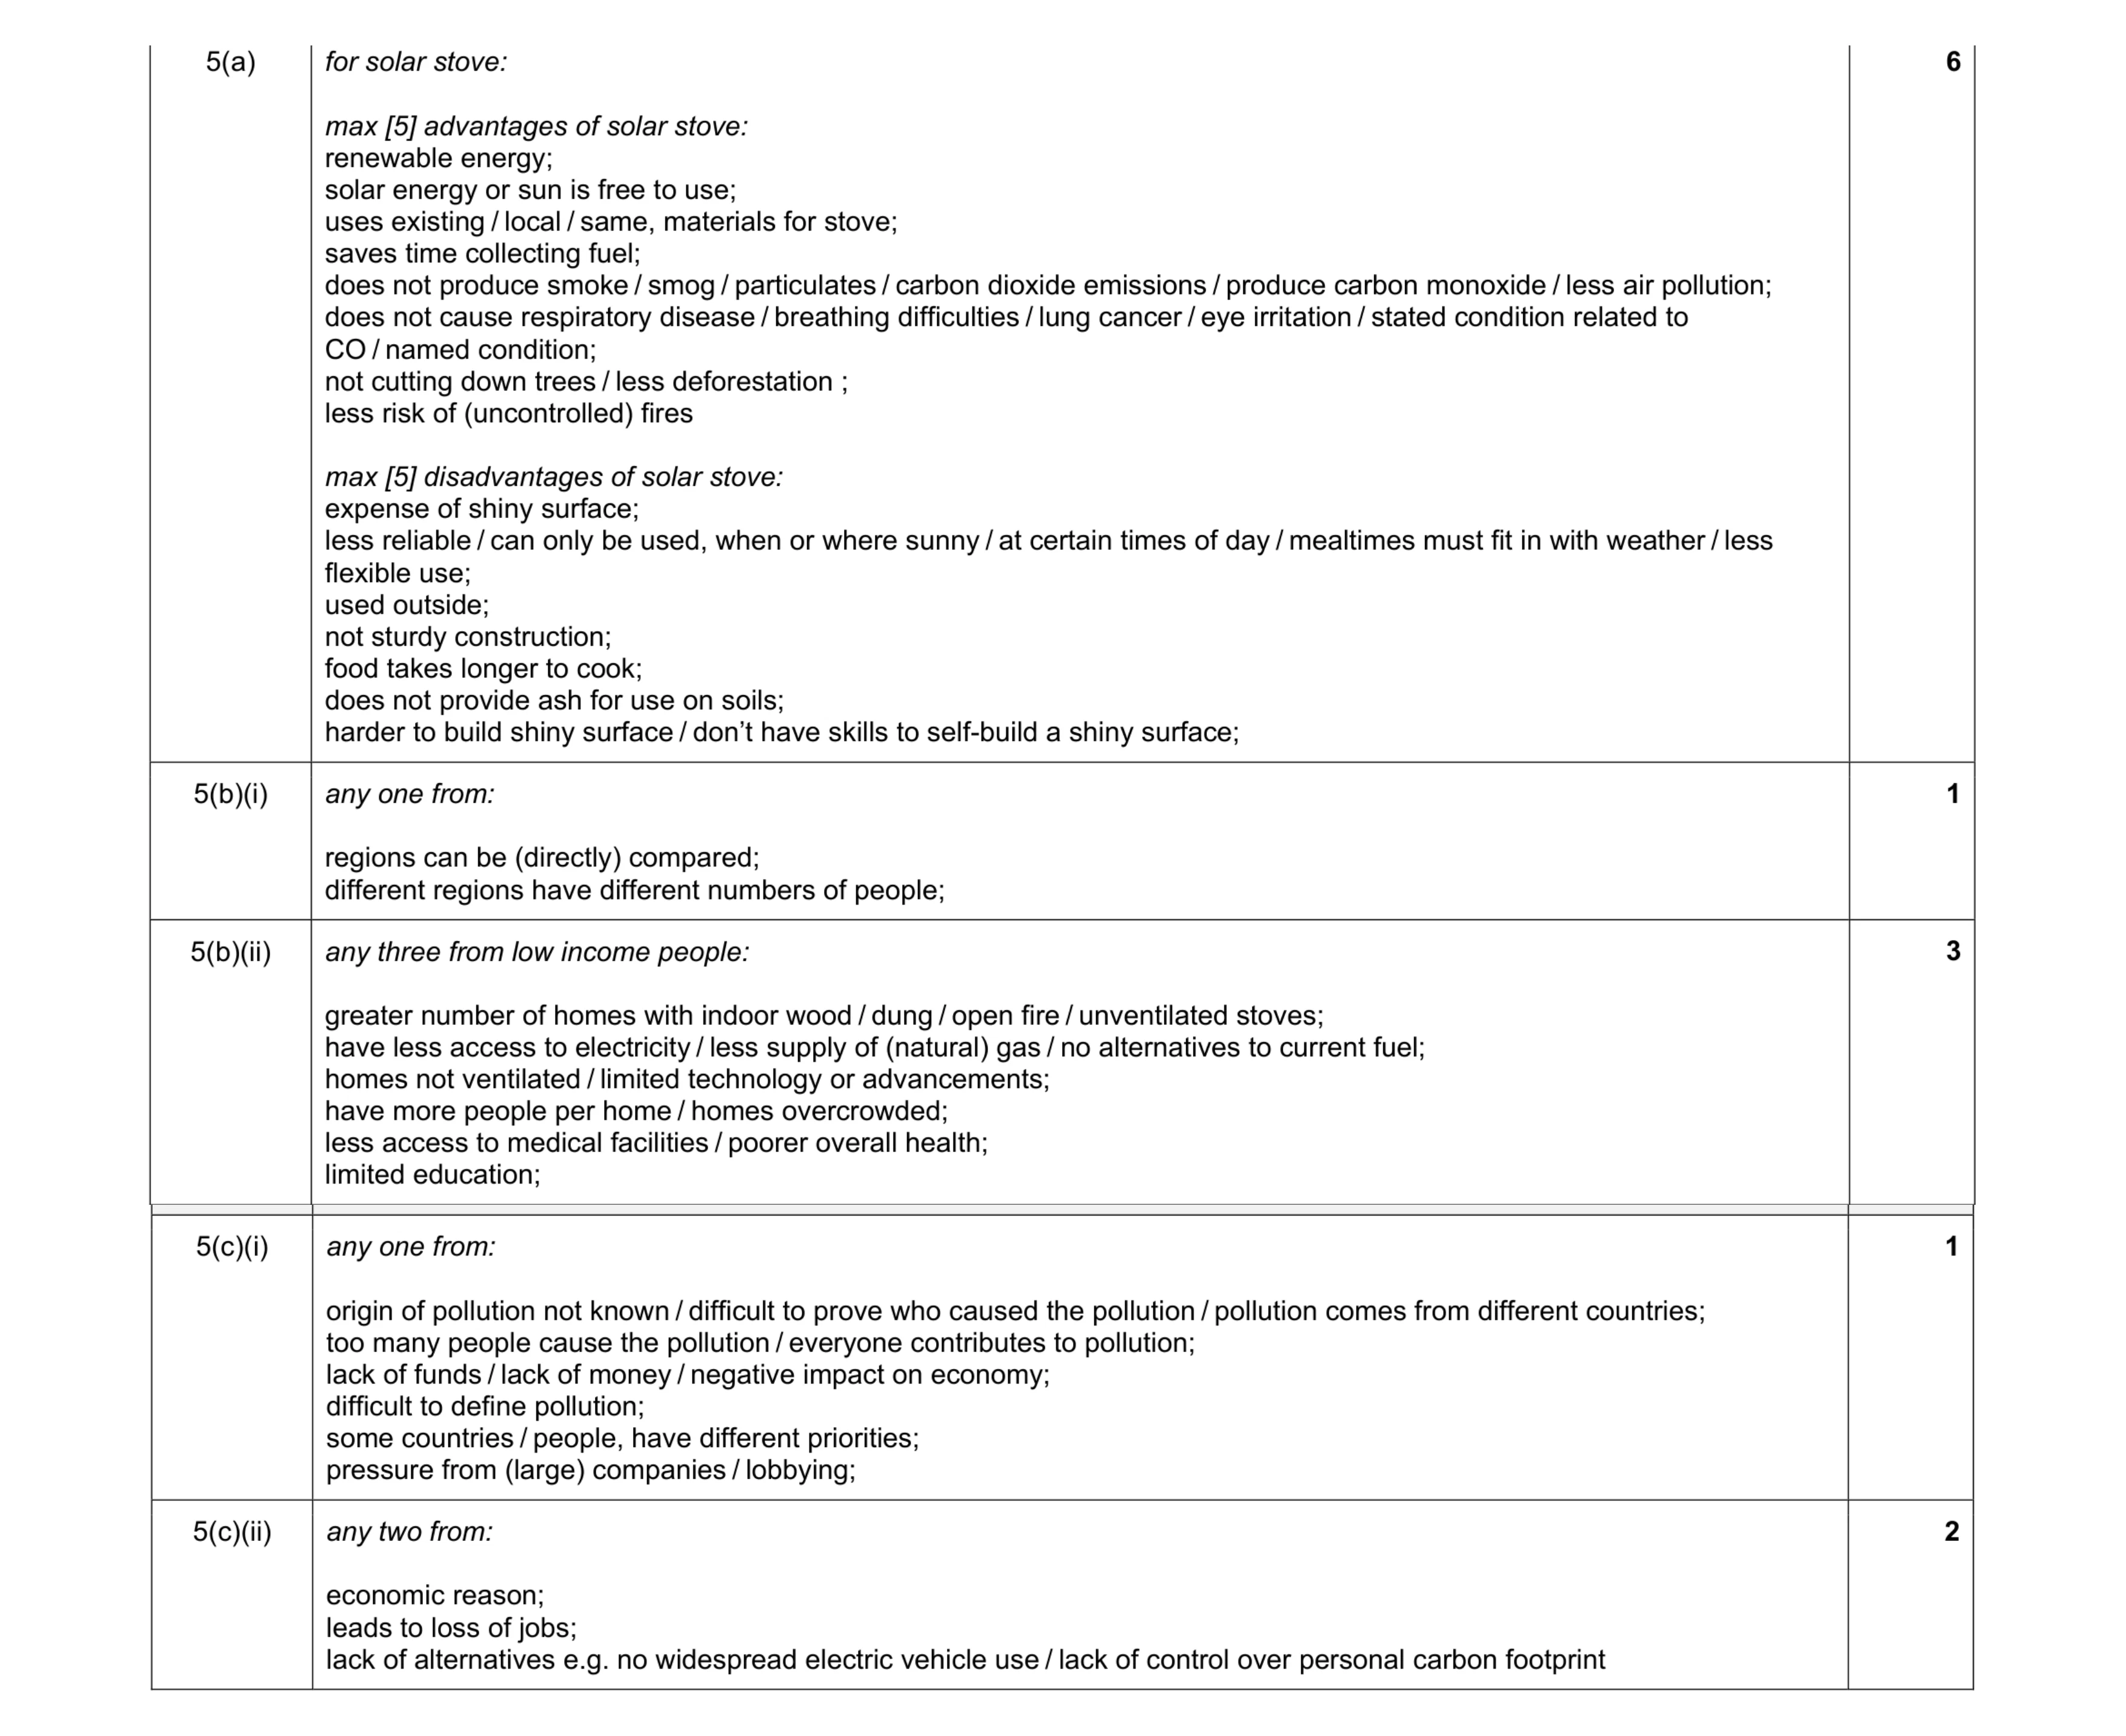 13
13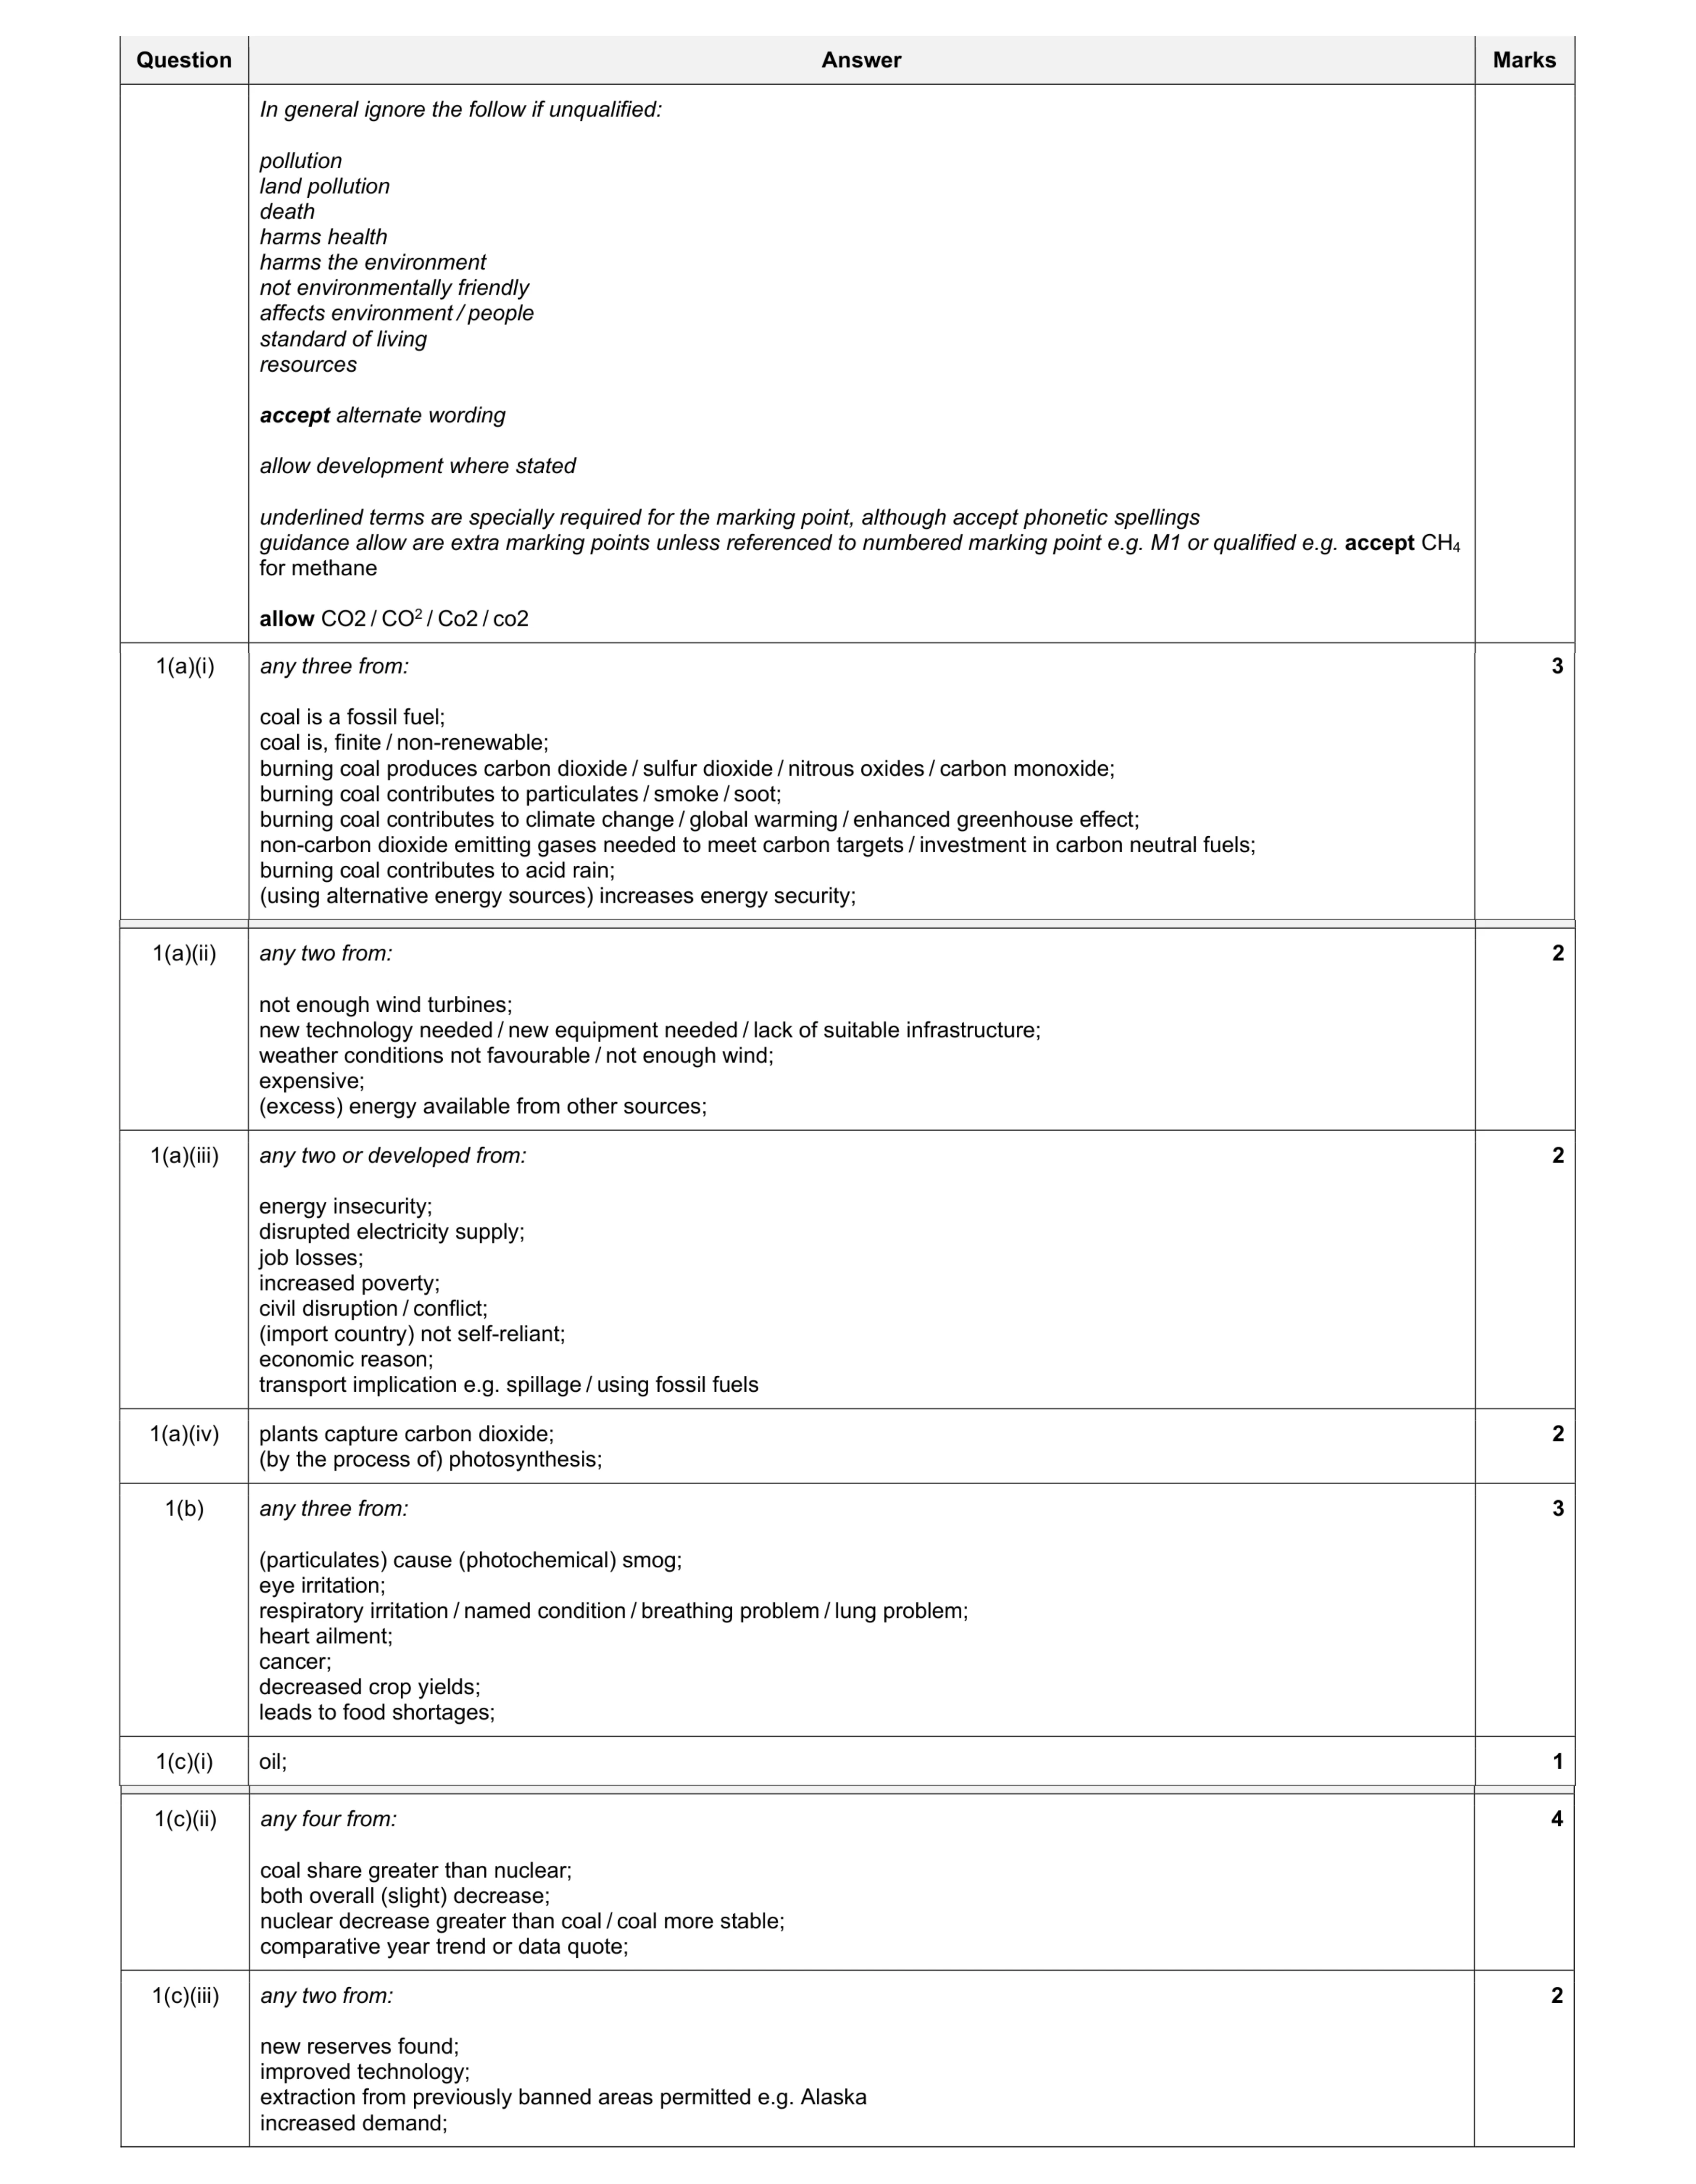 19
19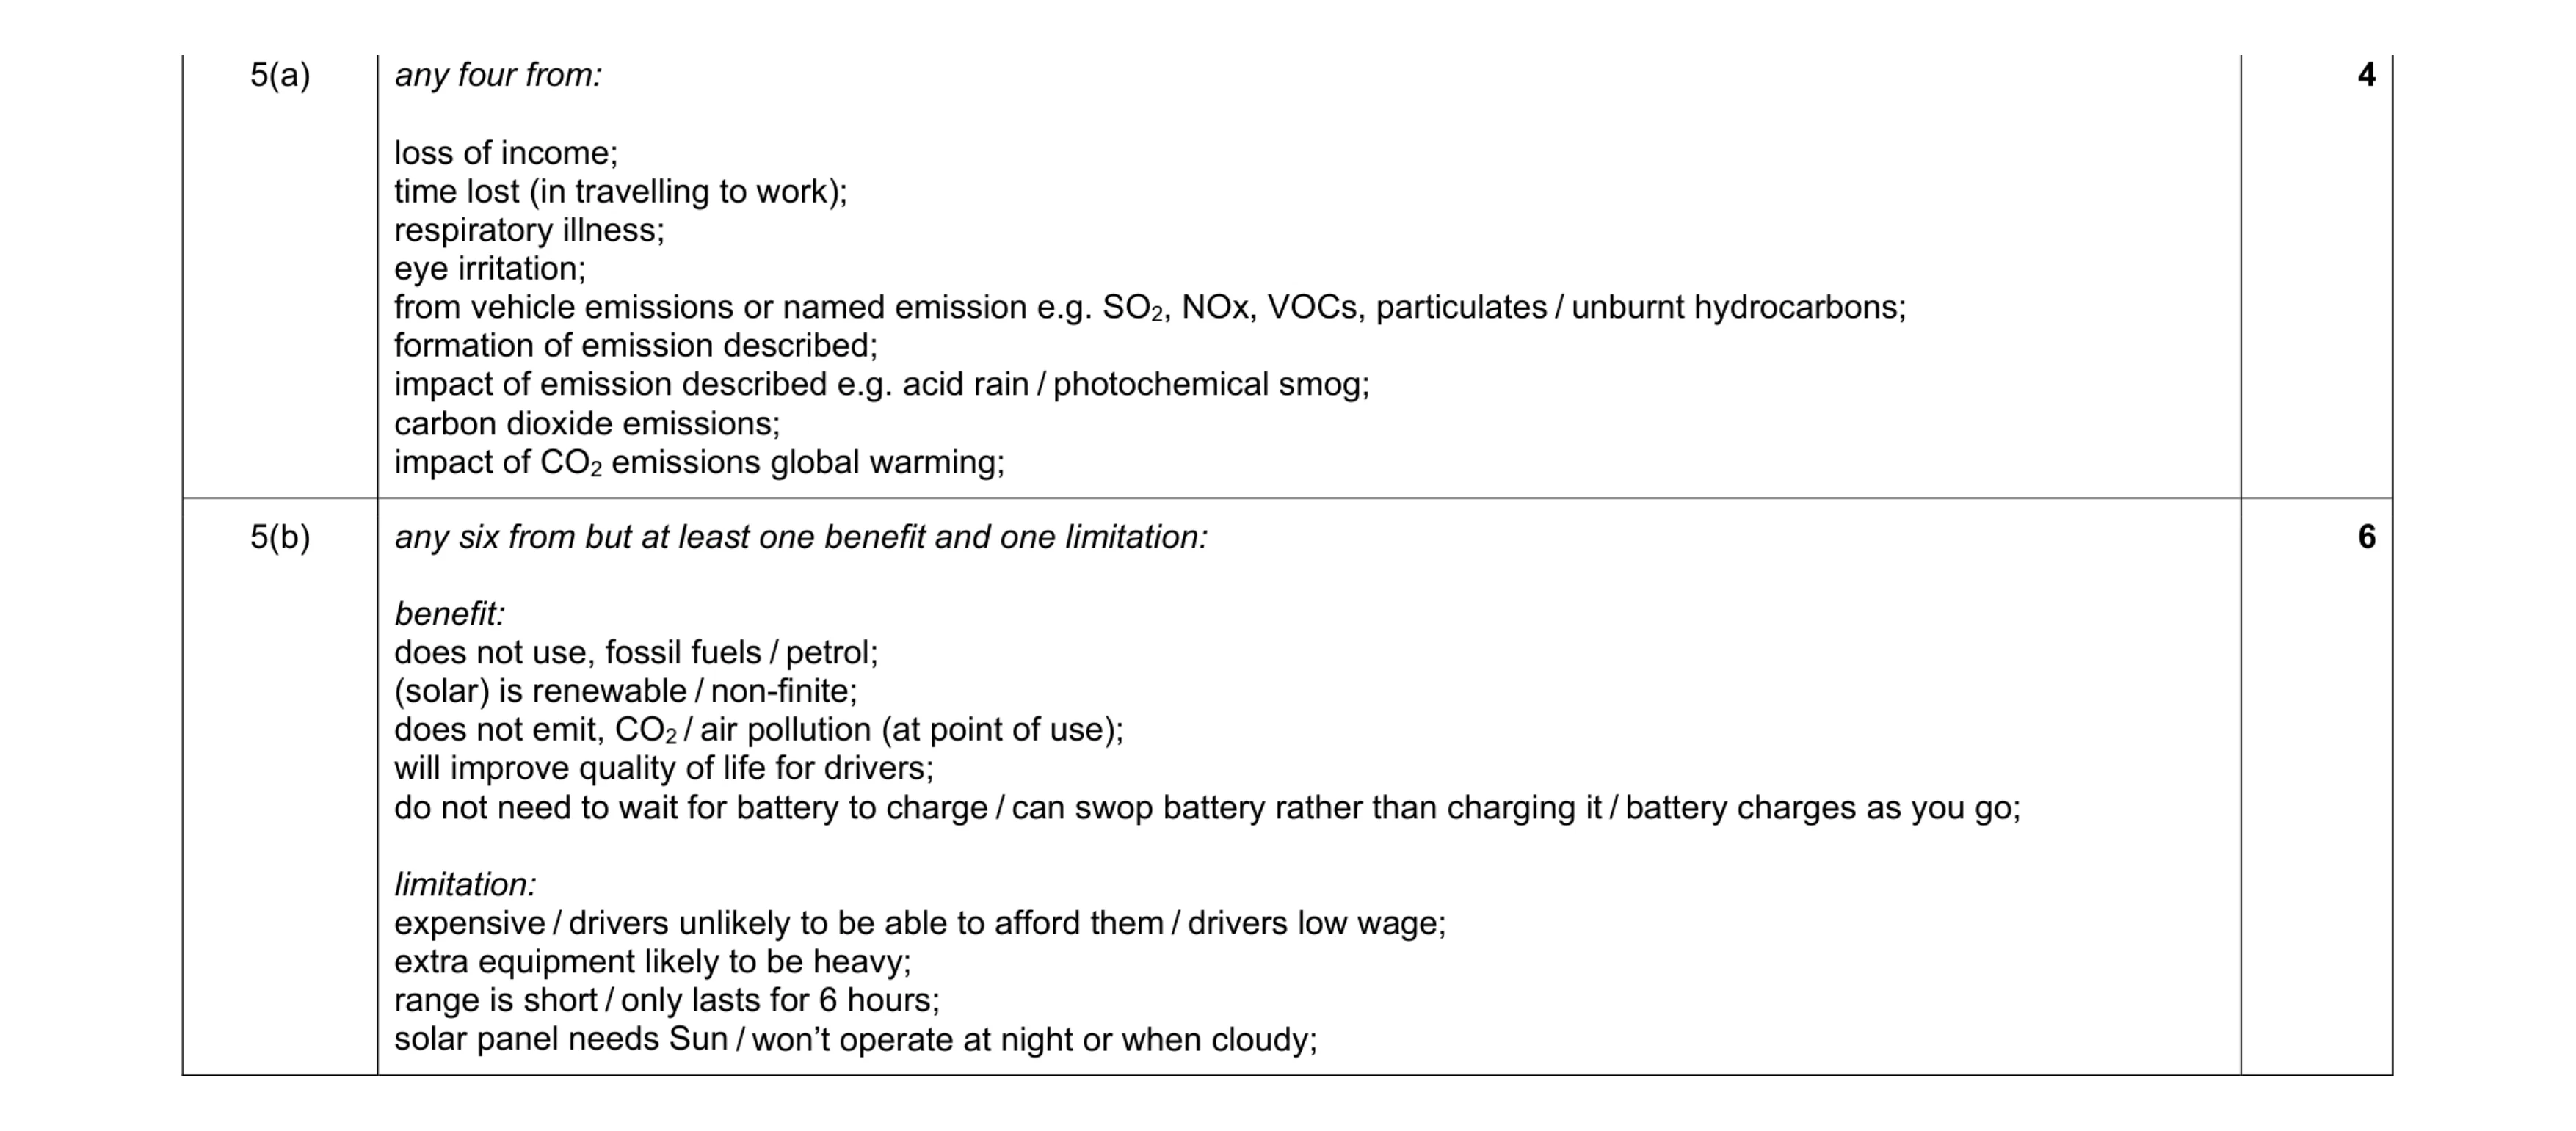 10
10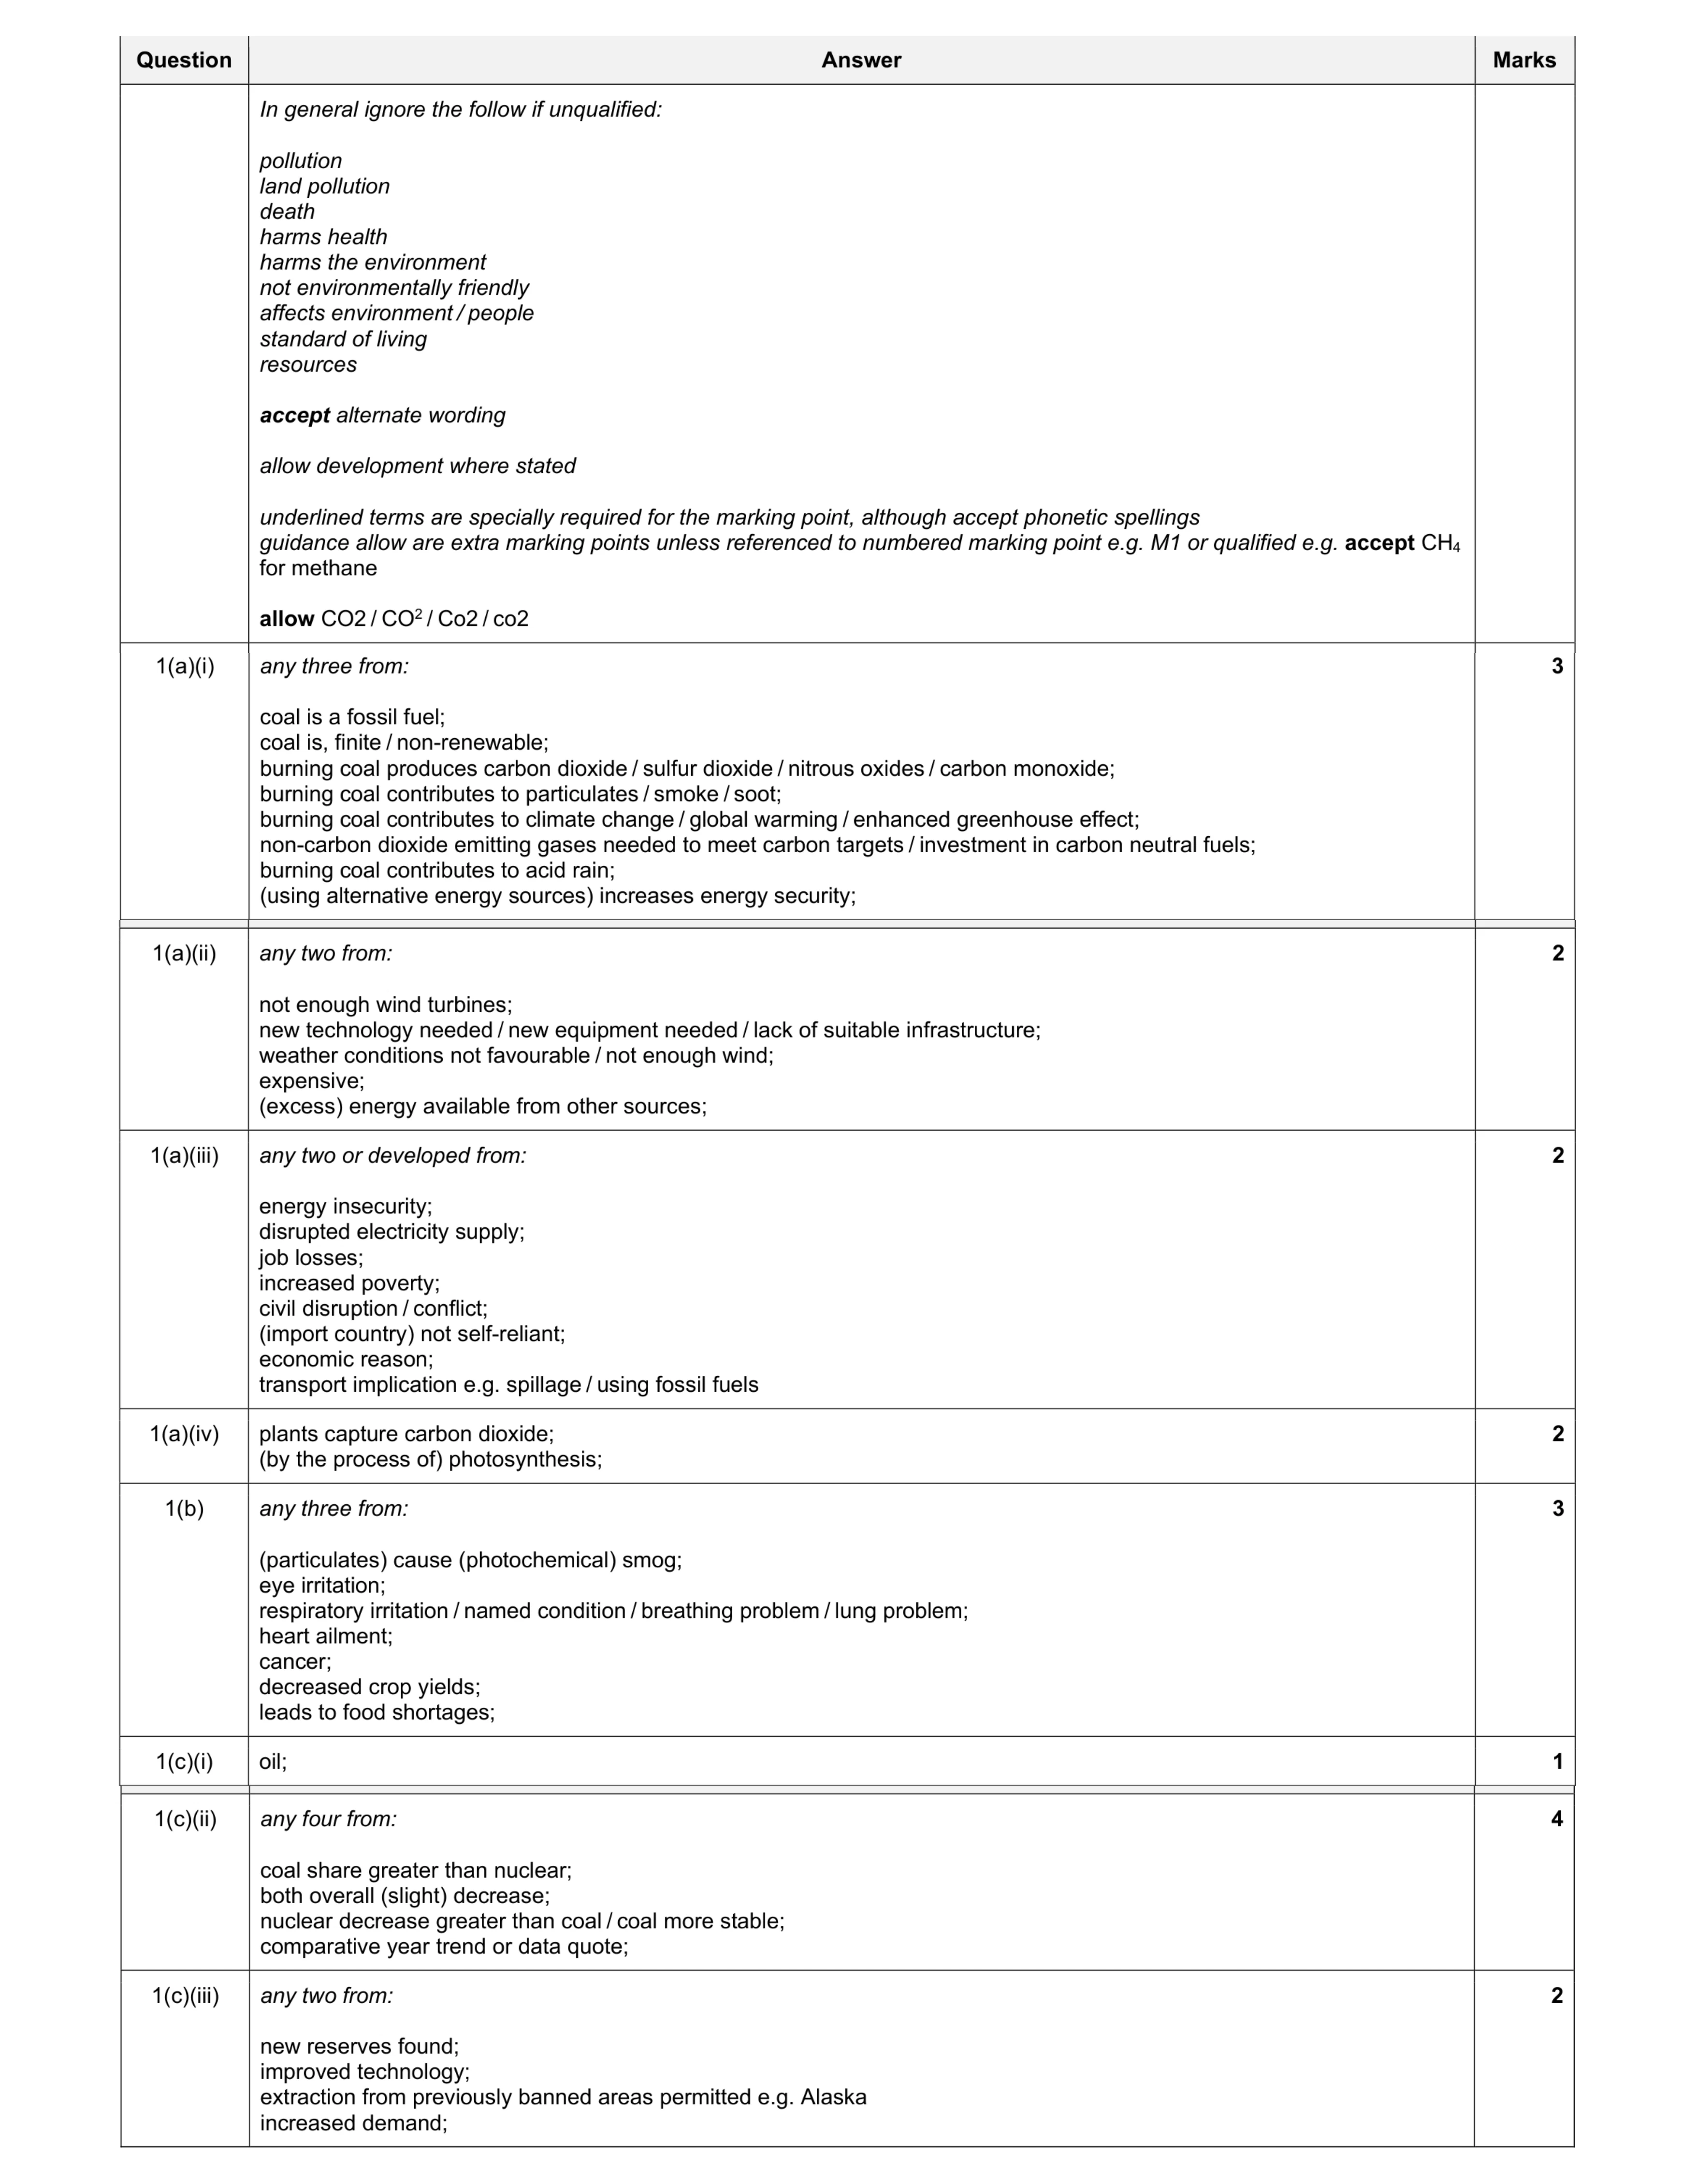 19
19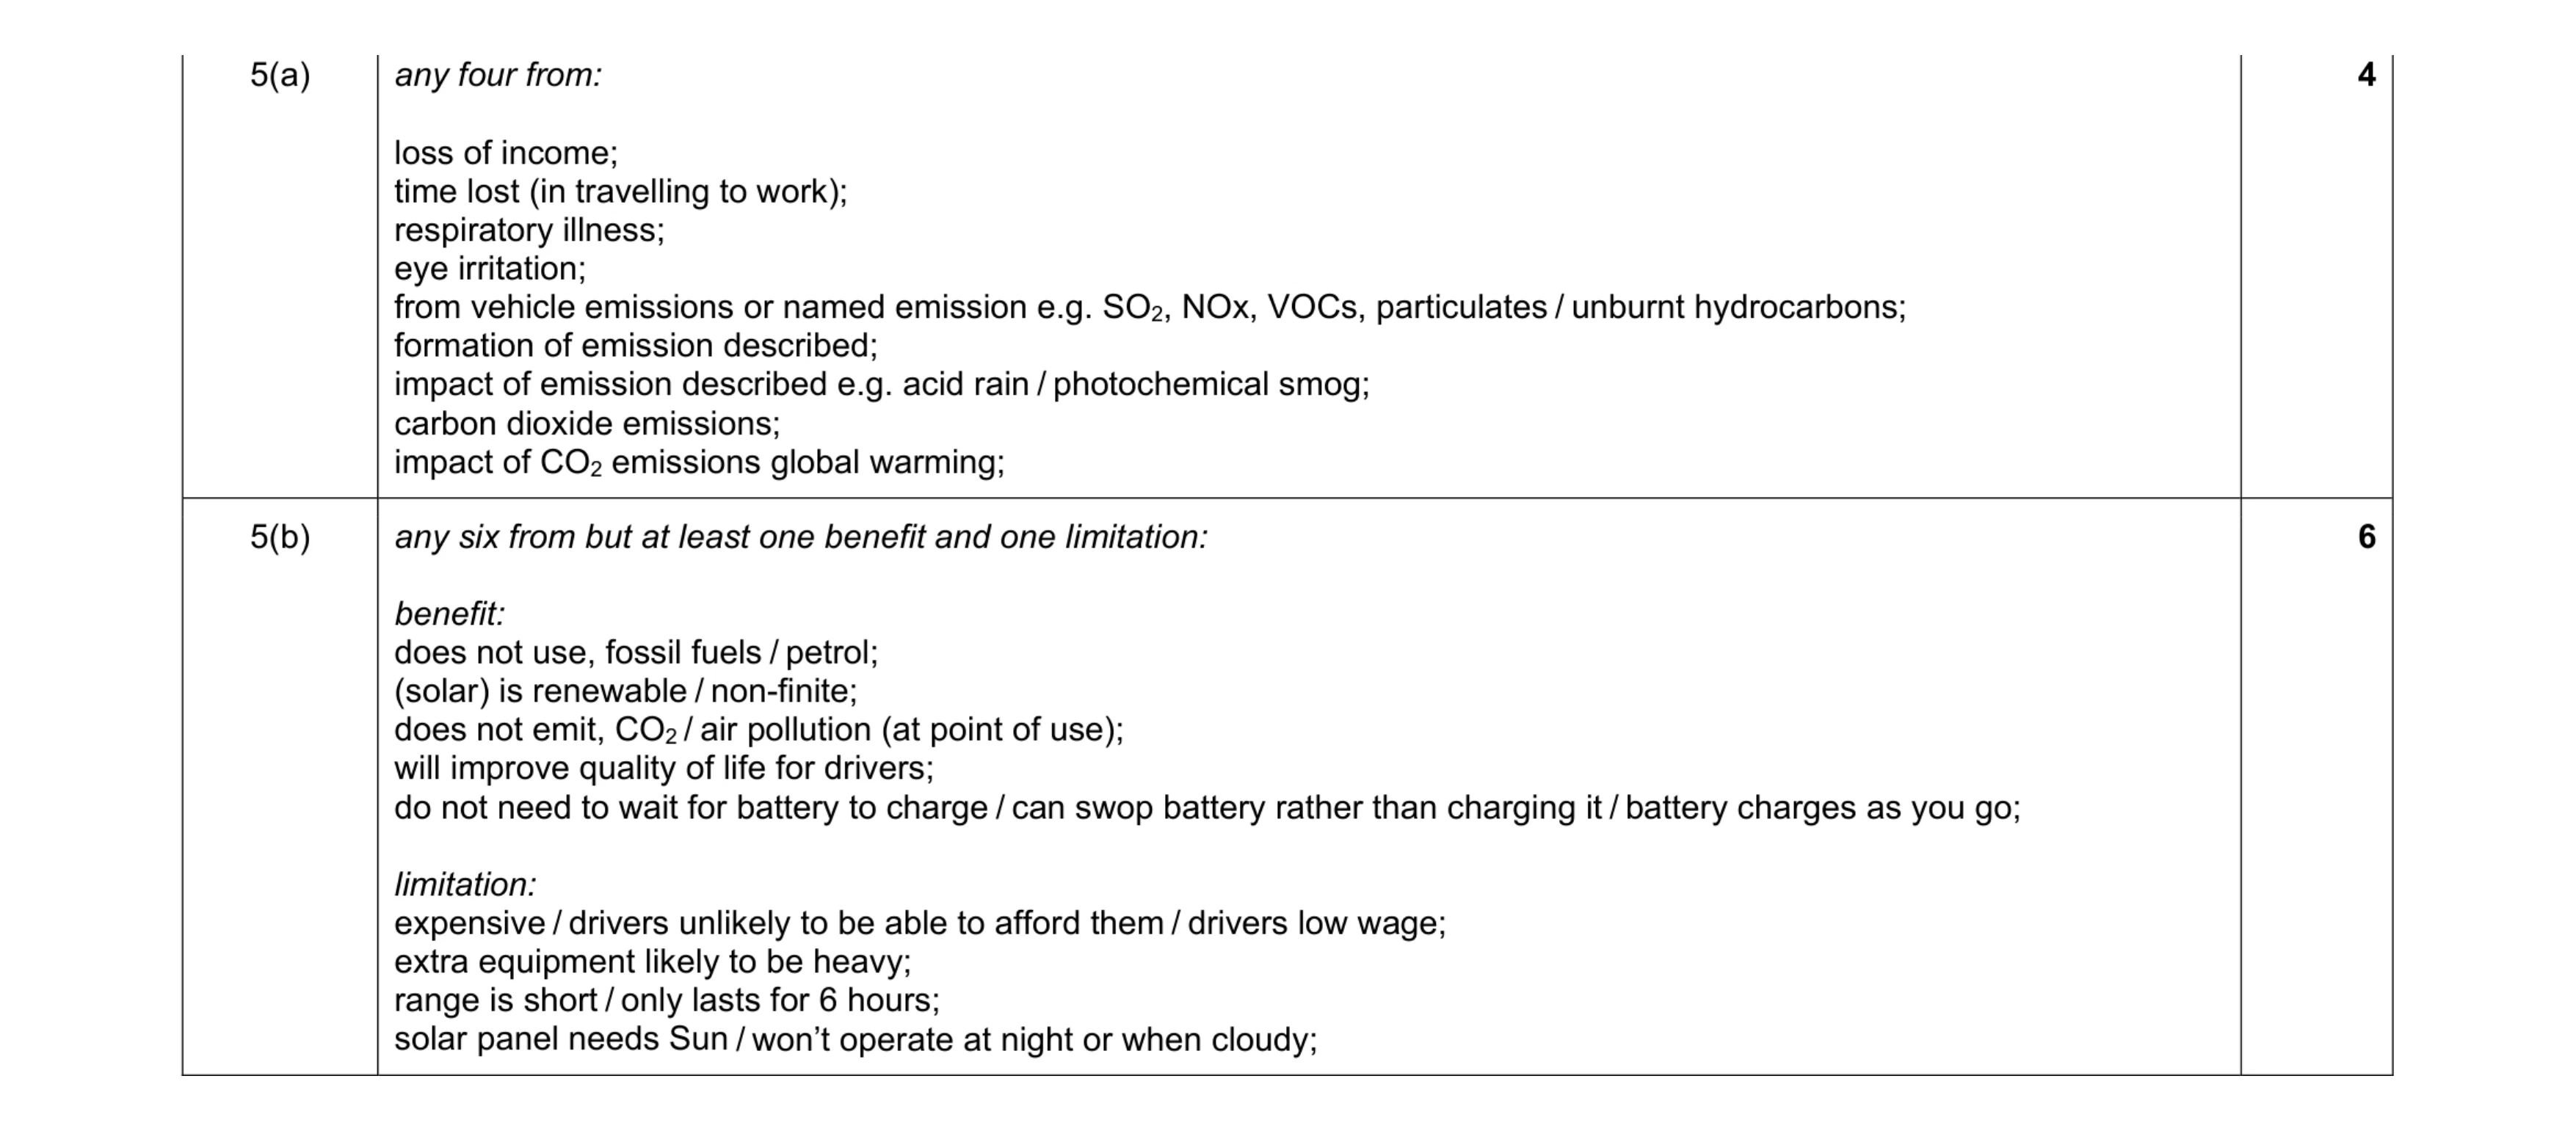 10
10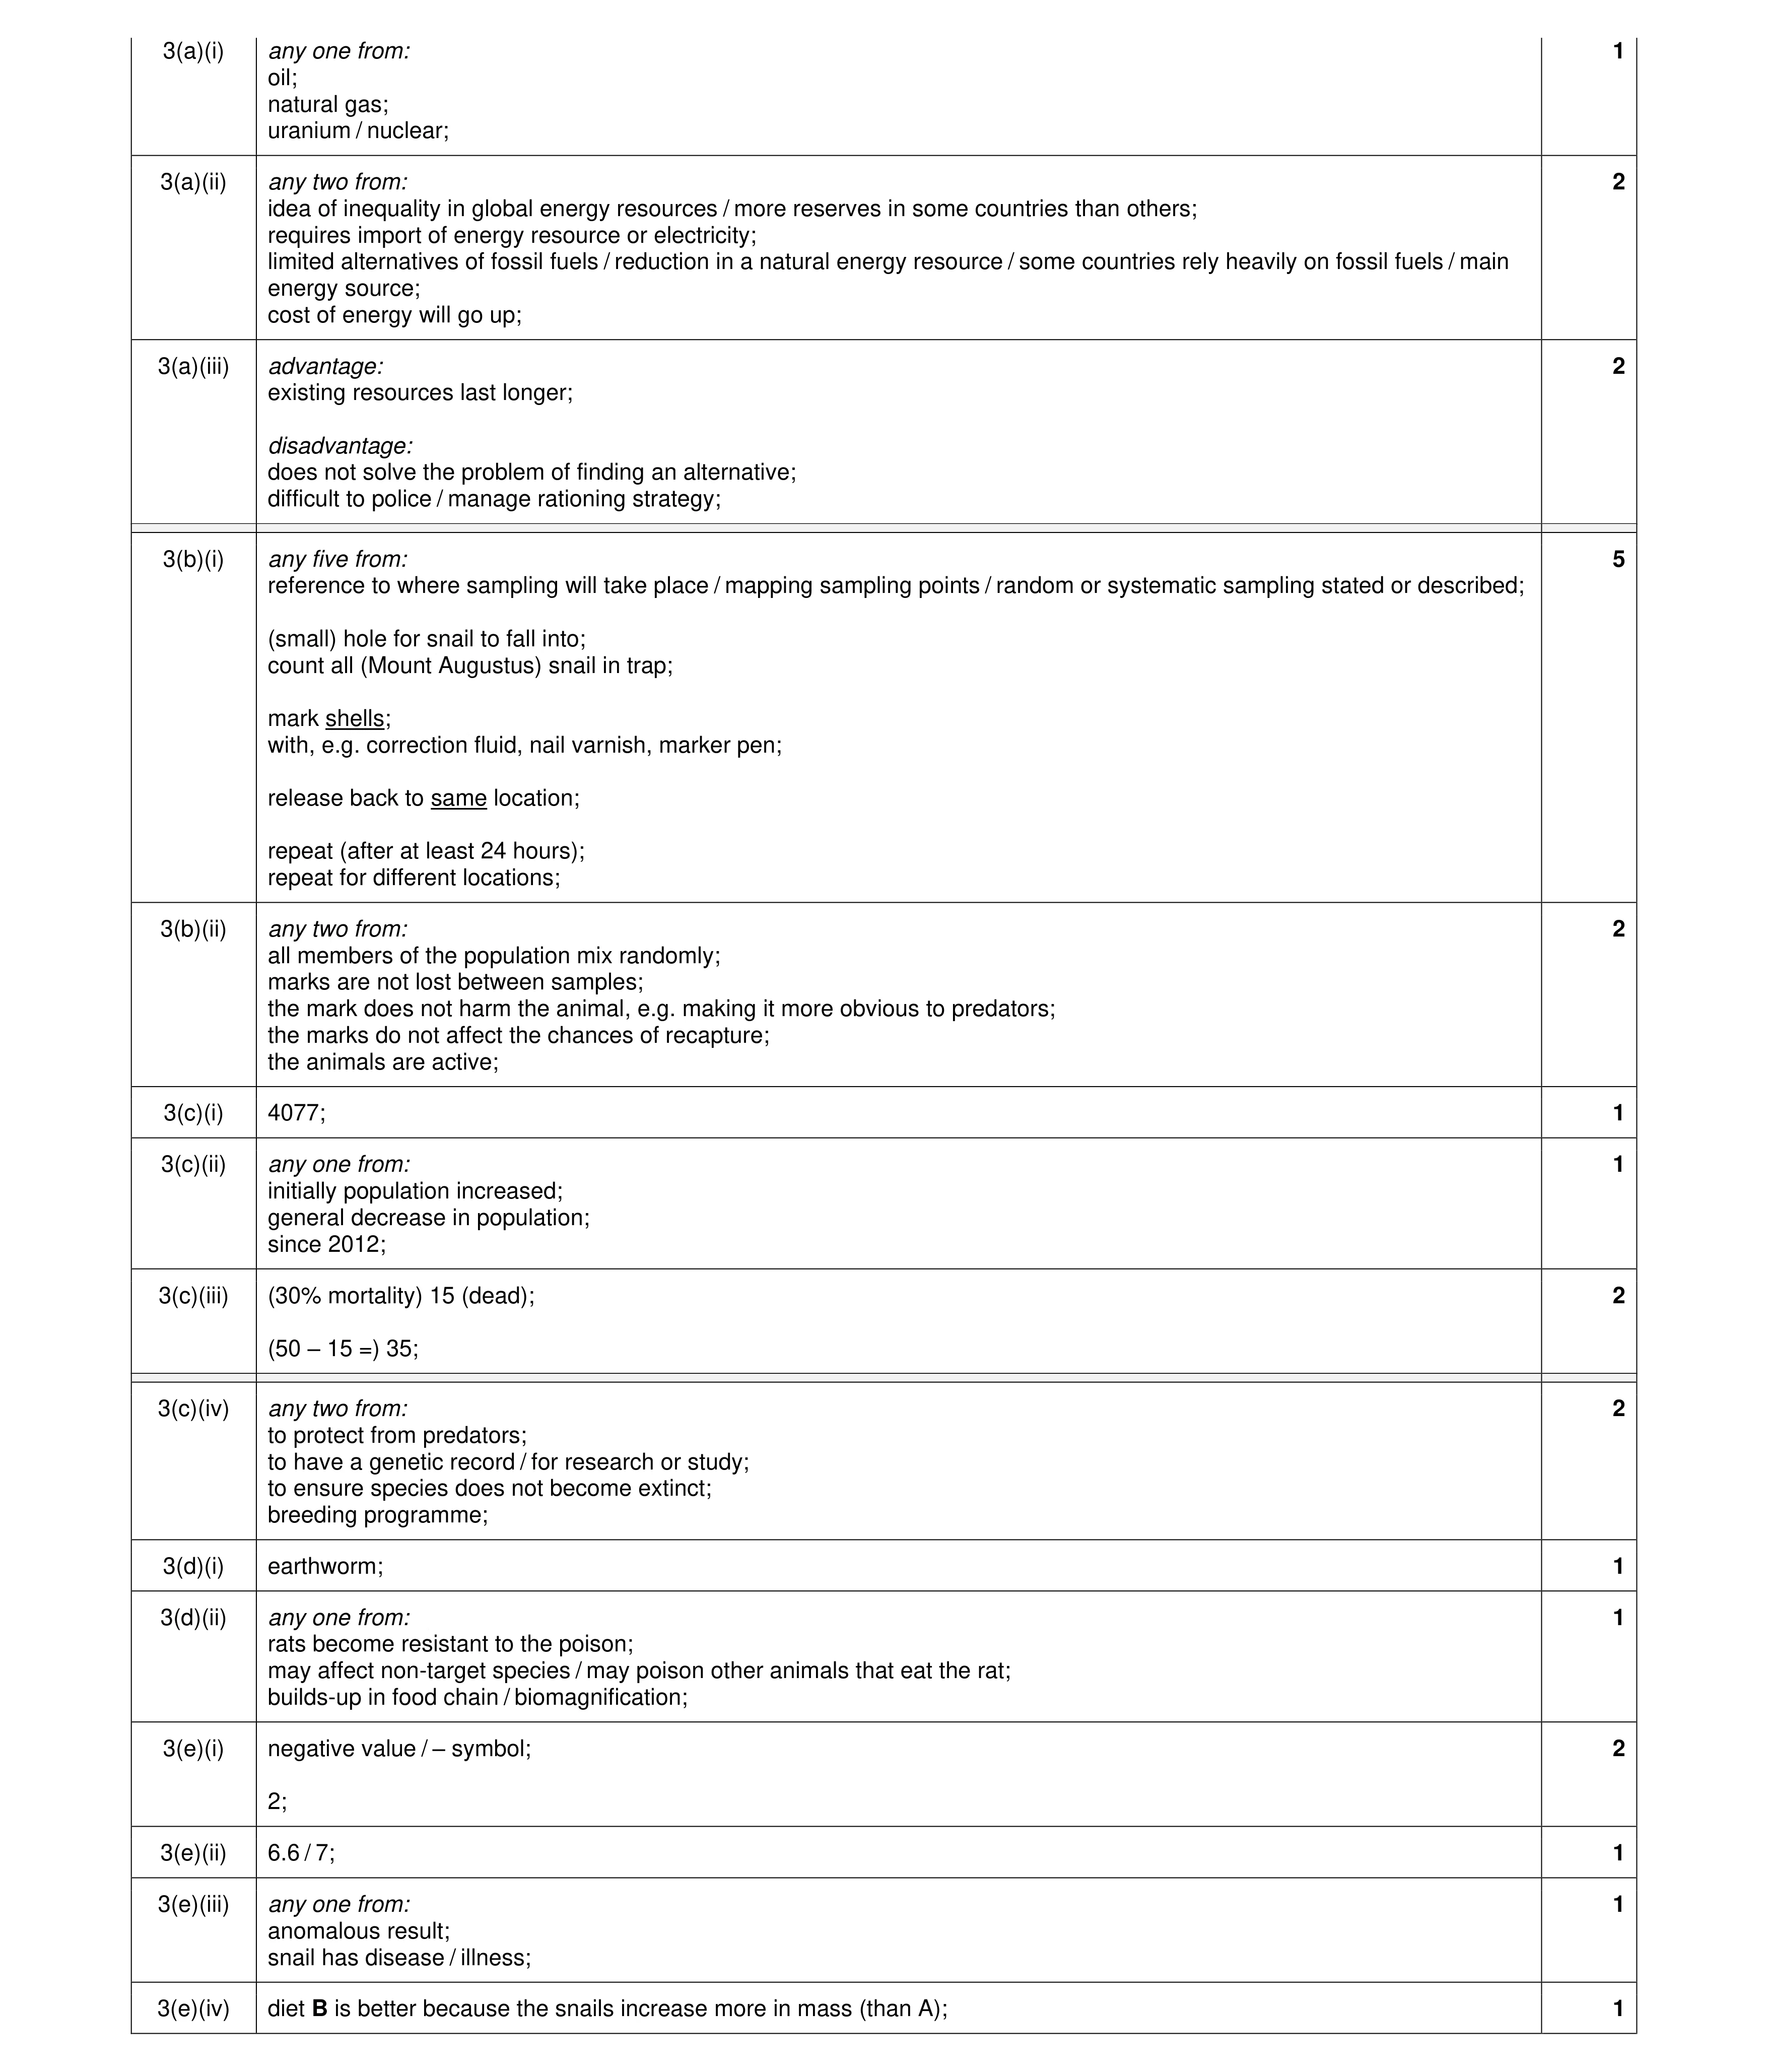 25
25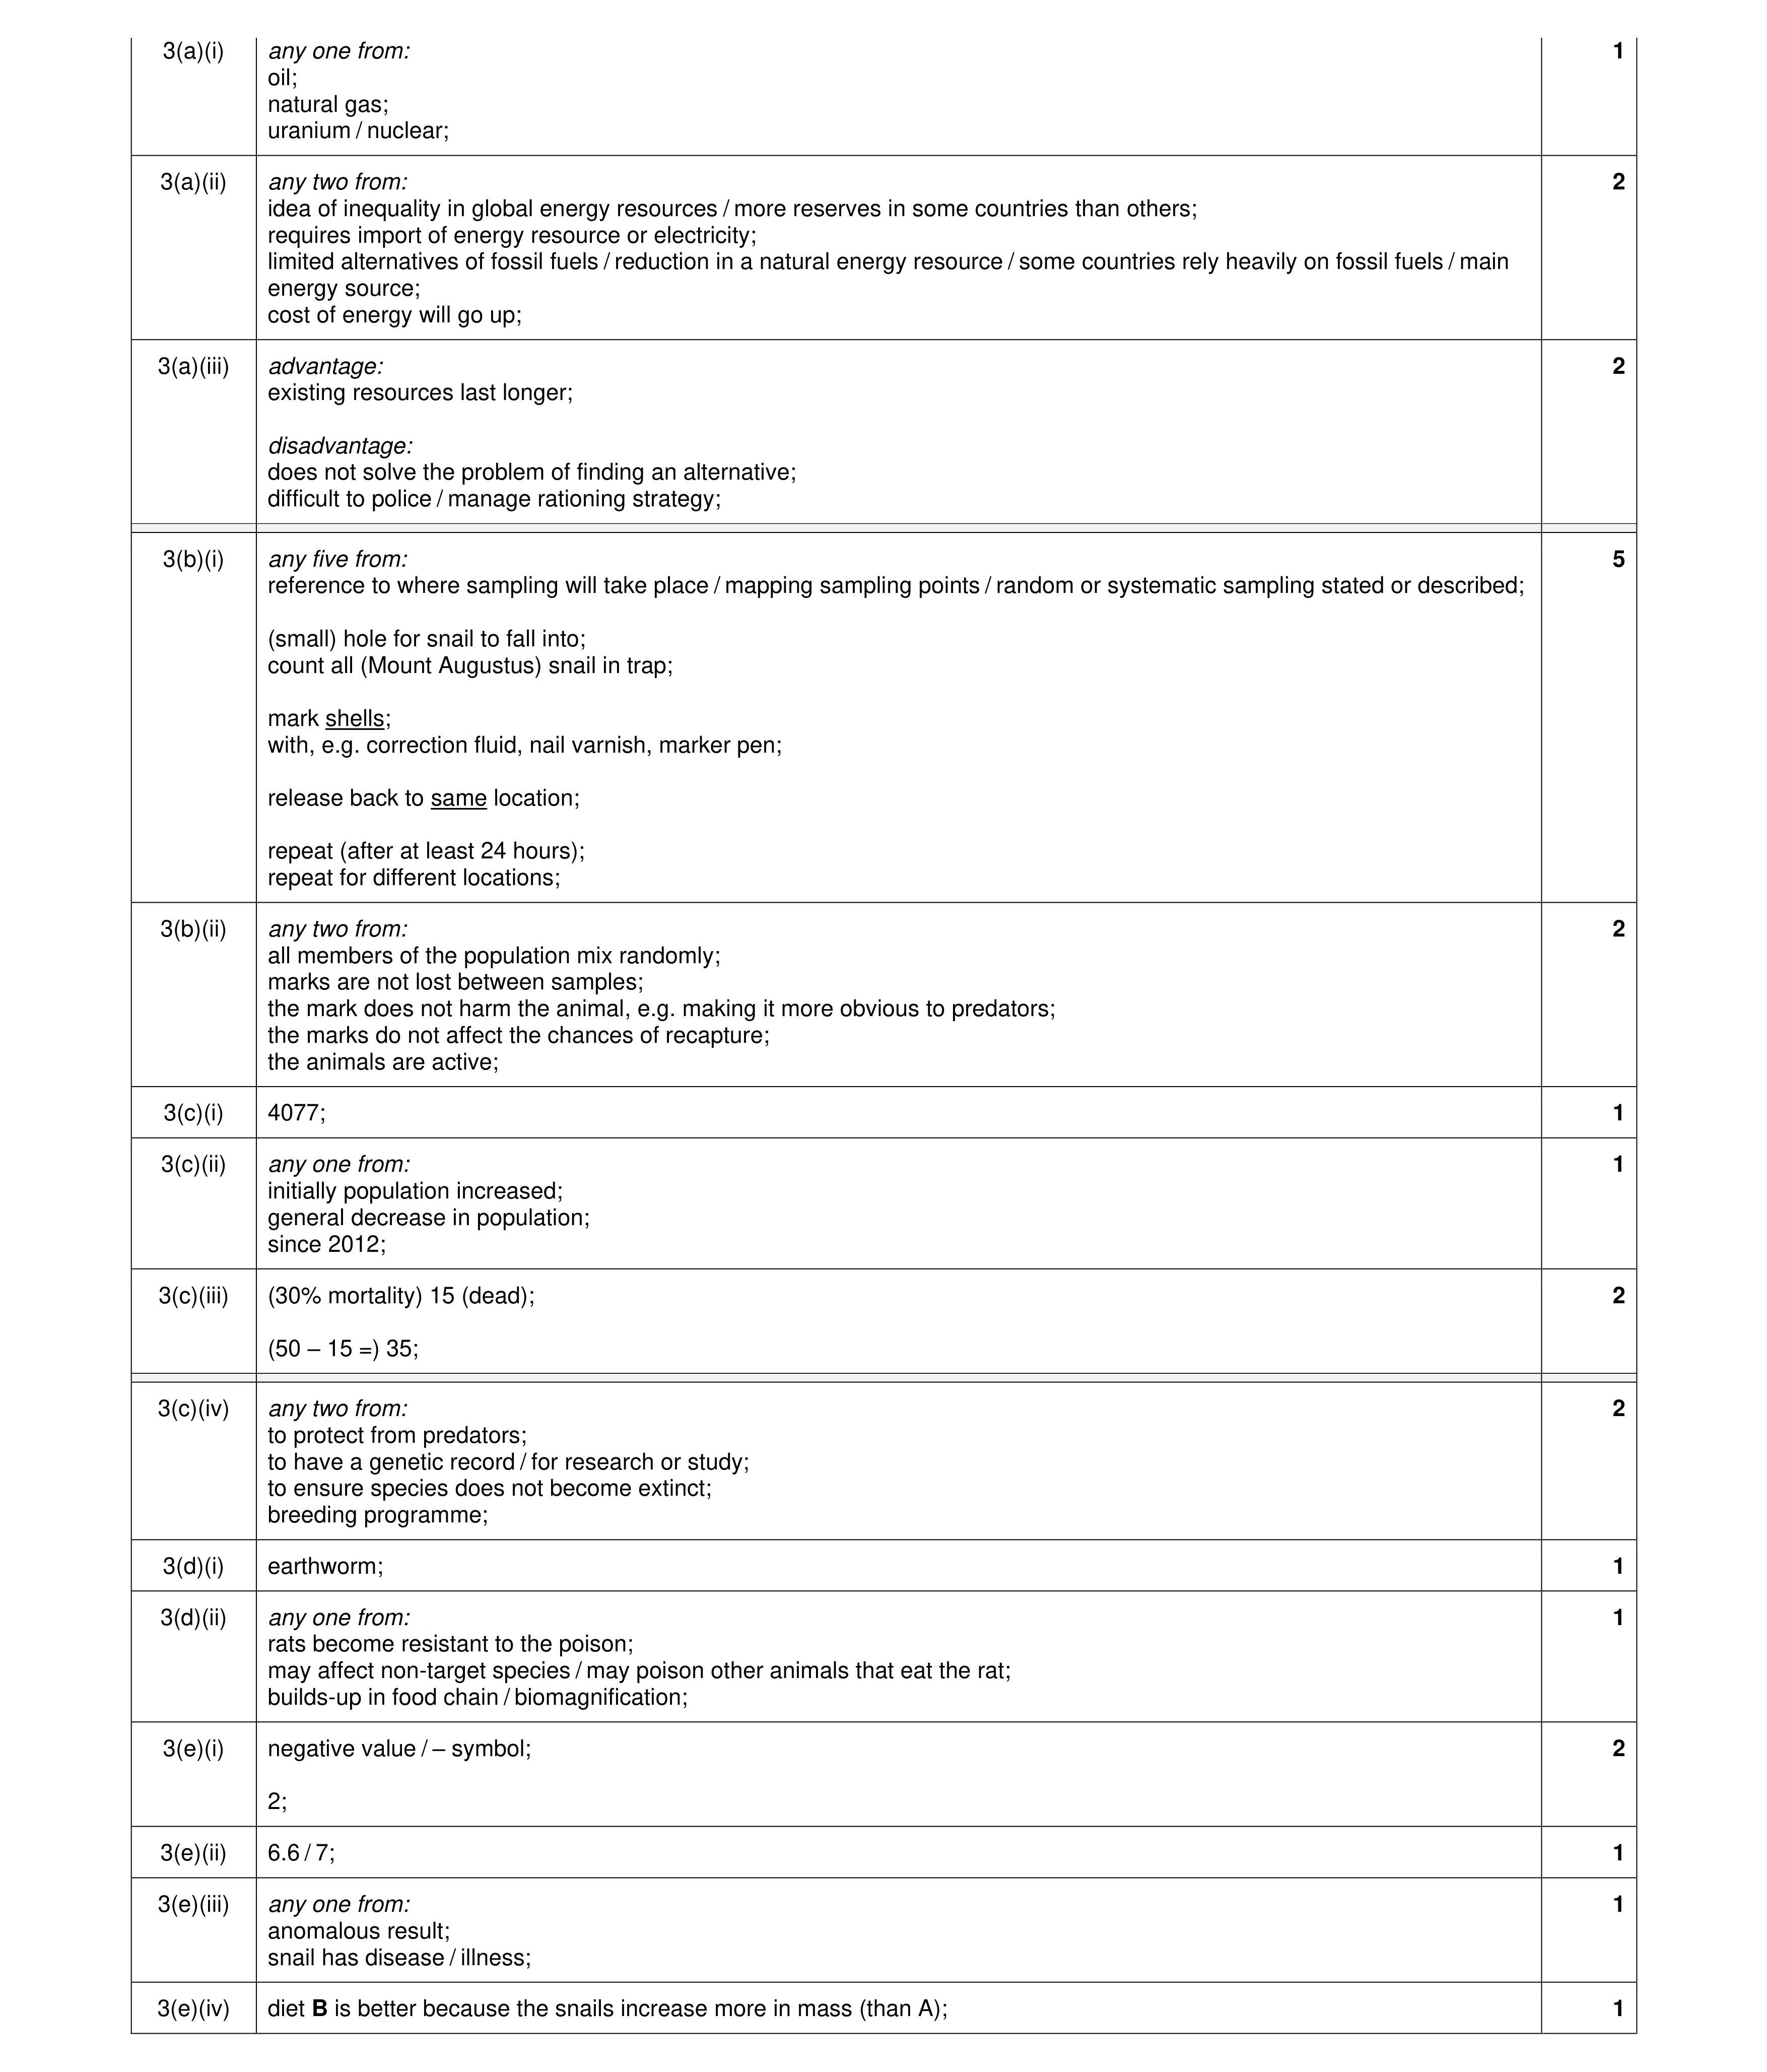 25
25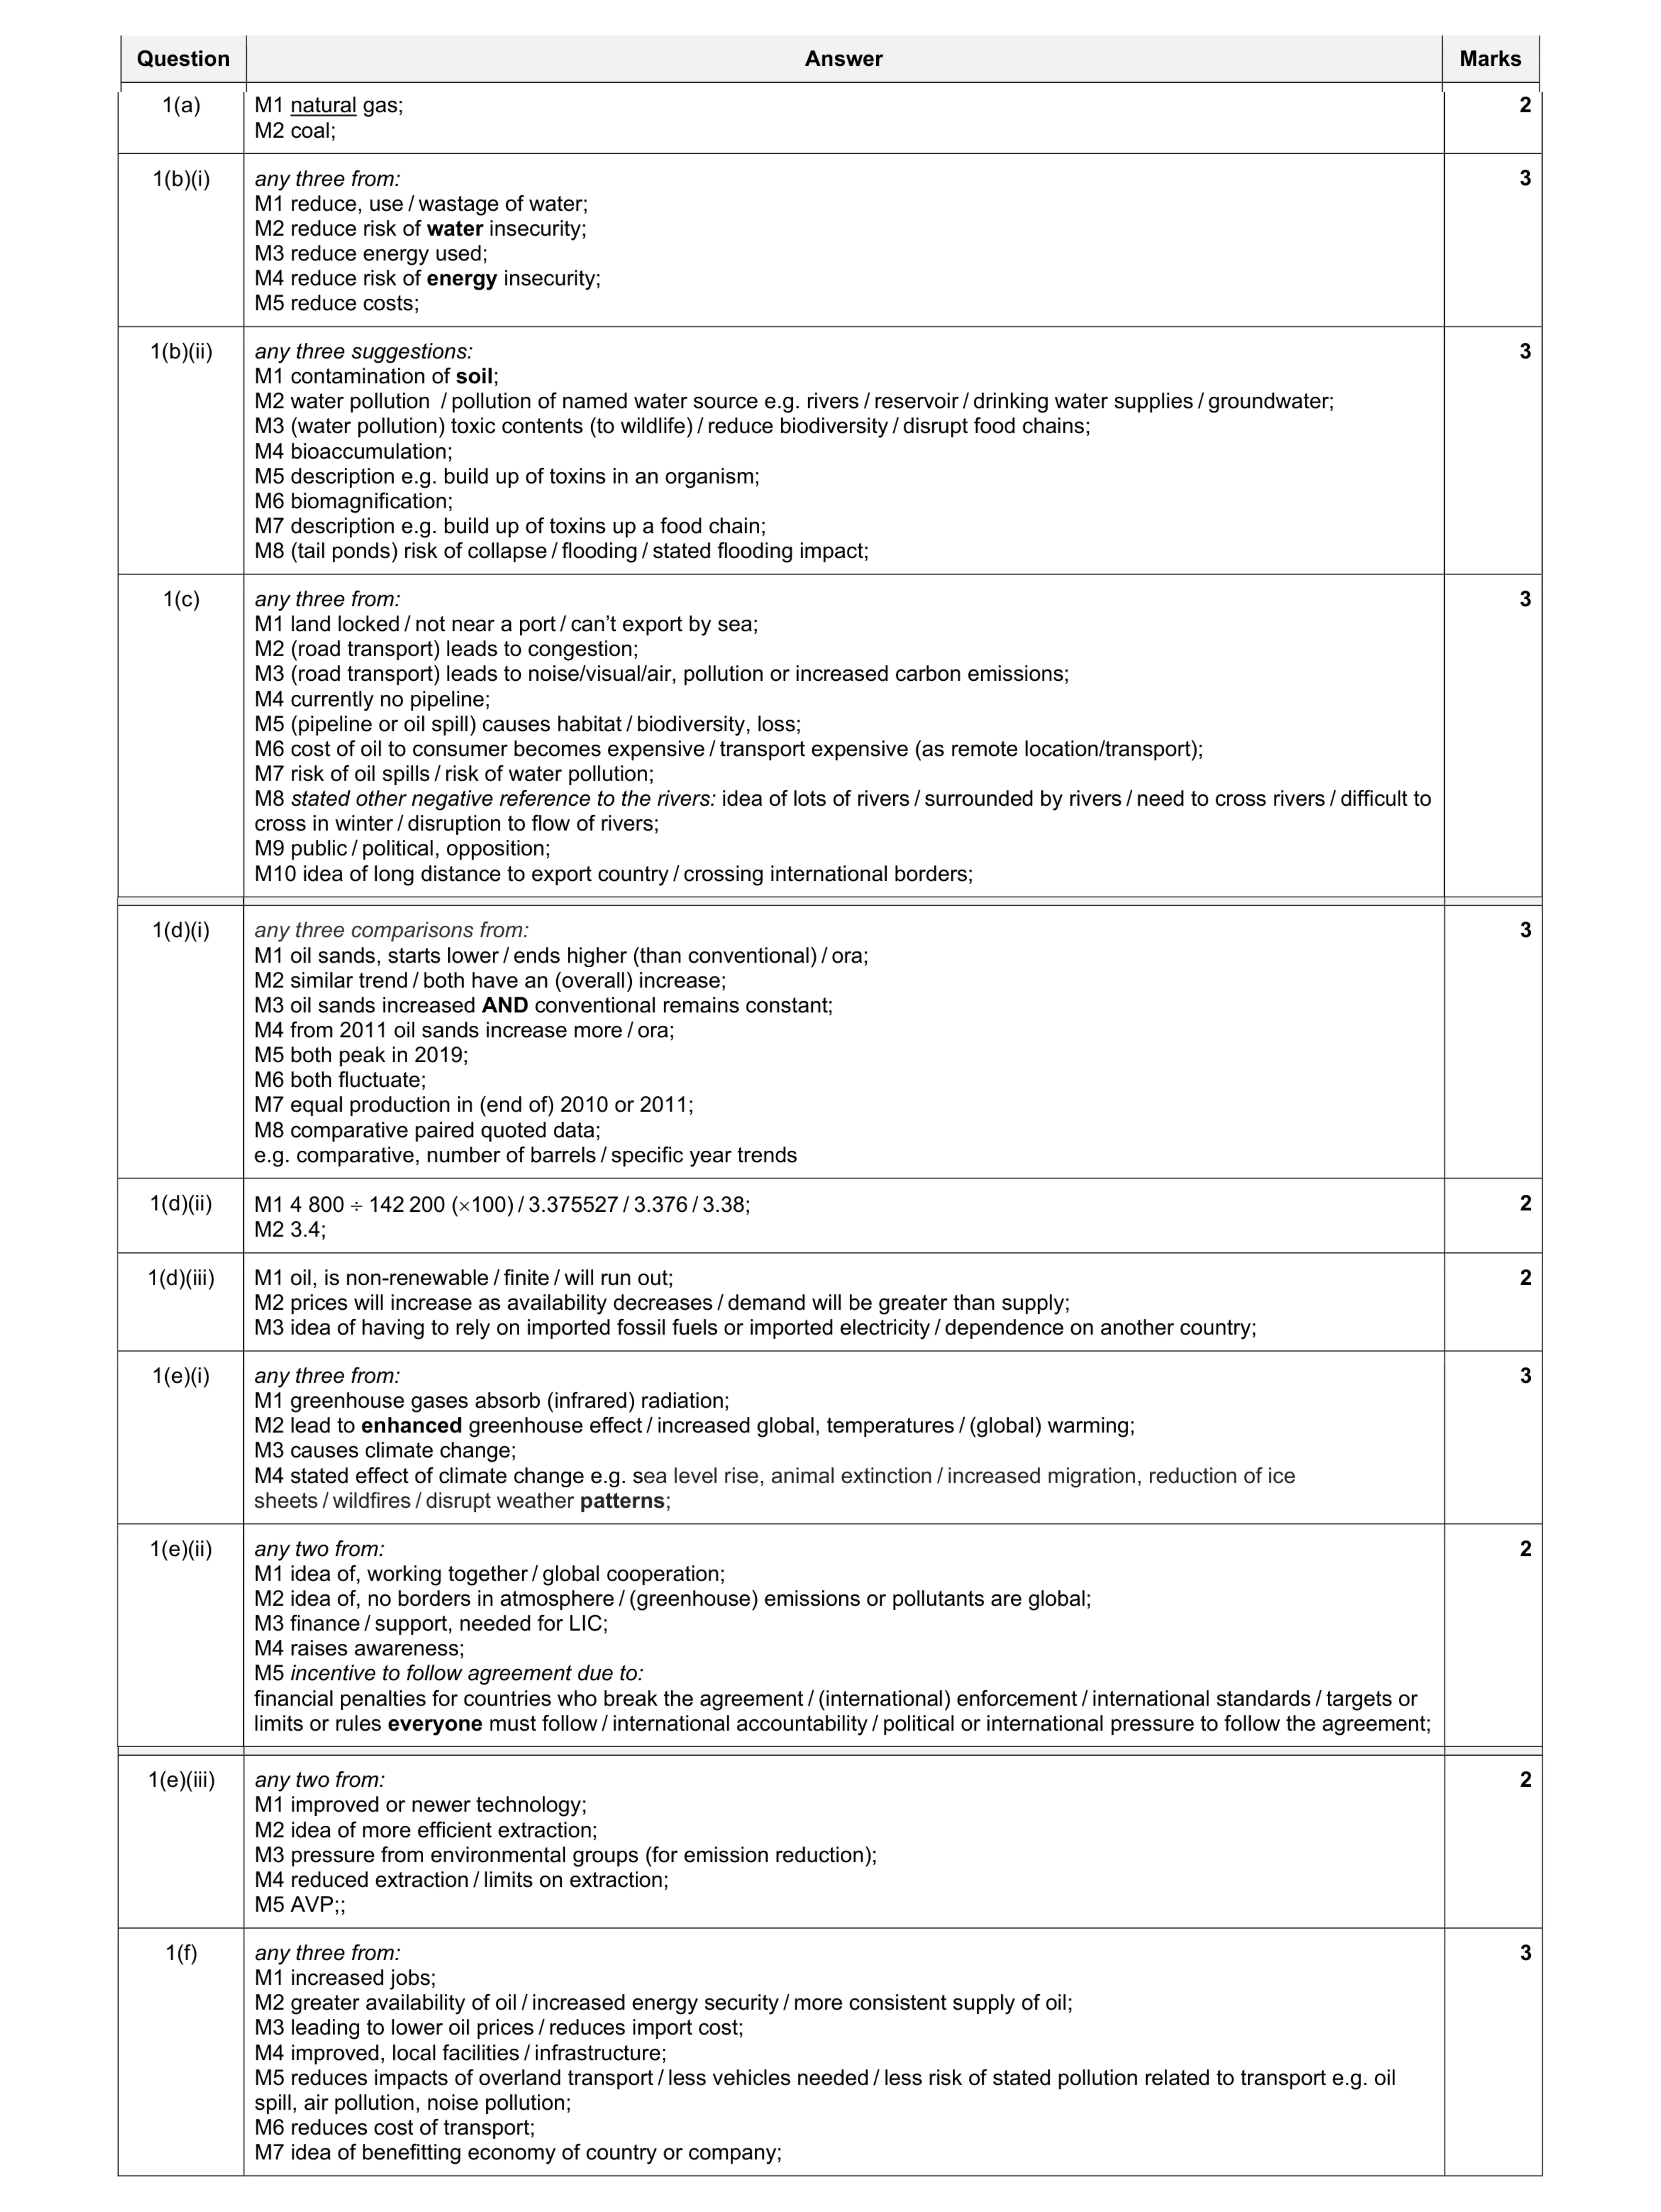 28
28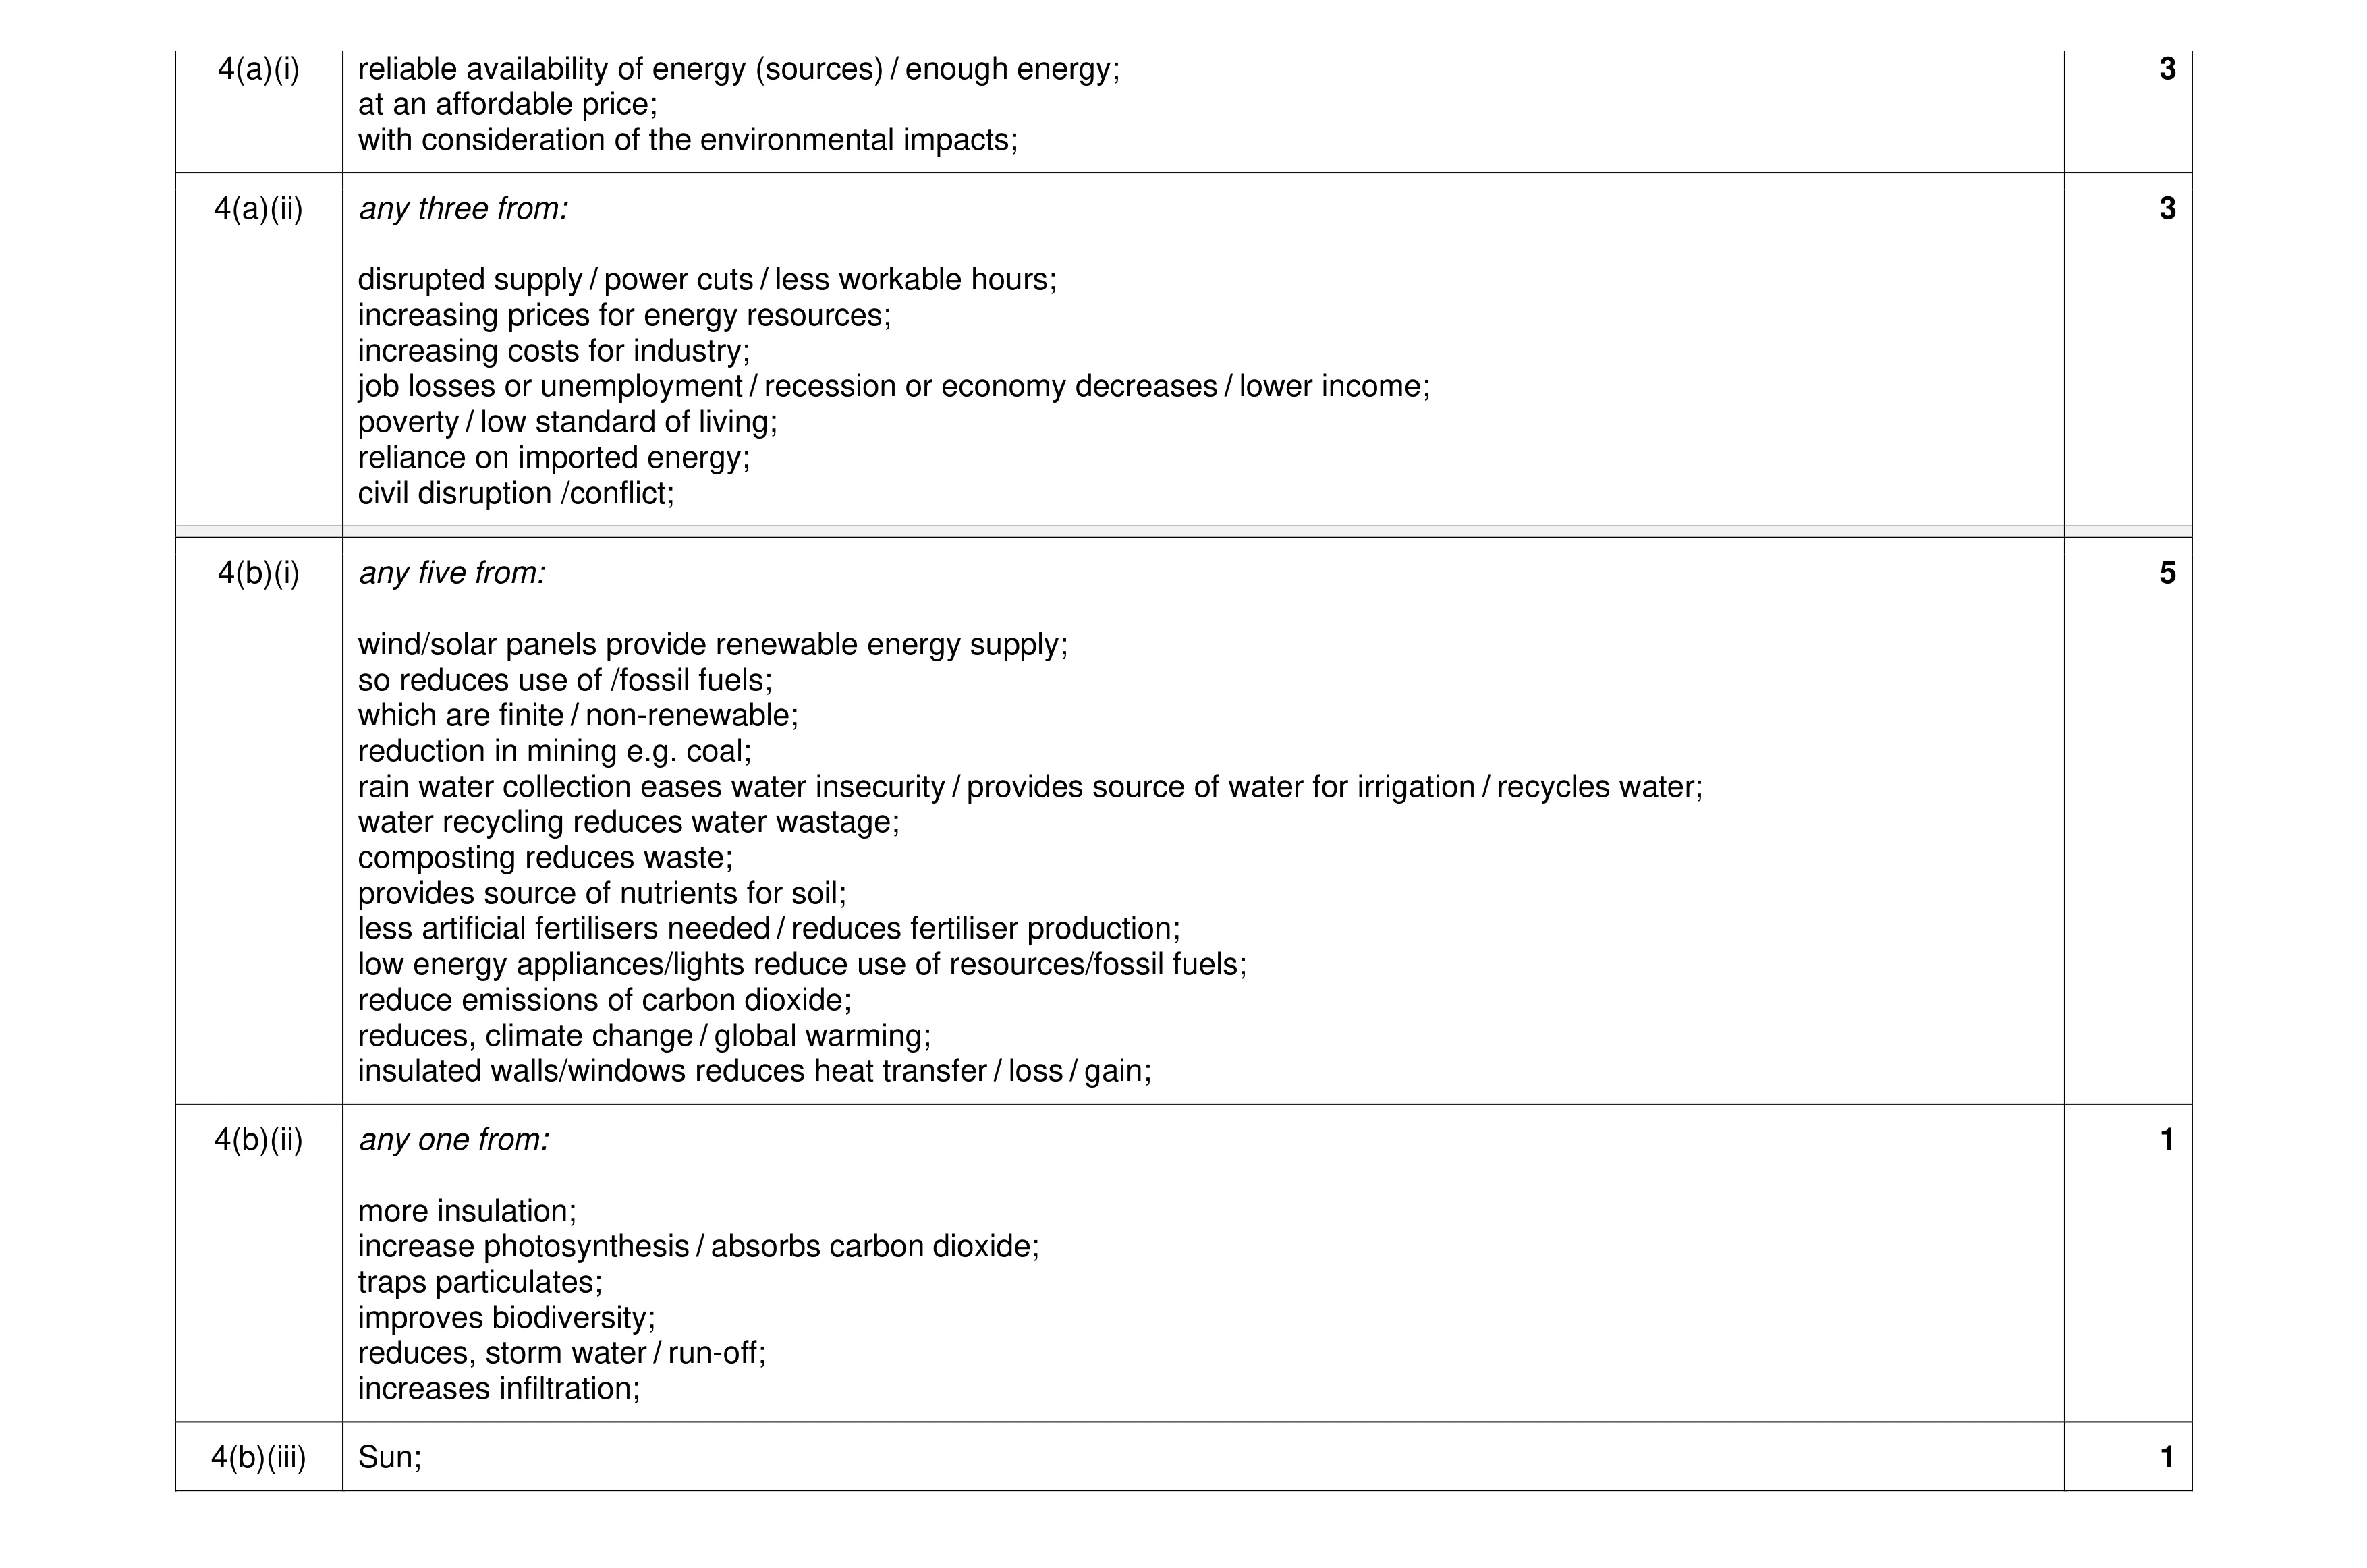 13
13 13
13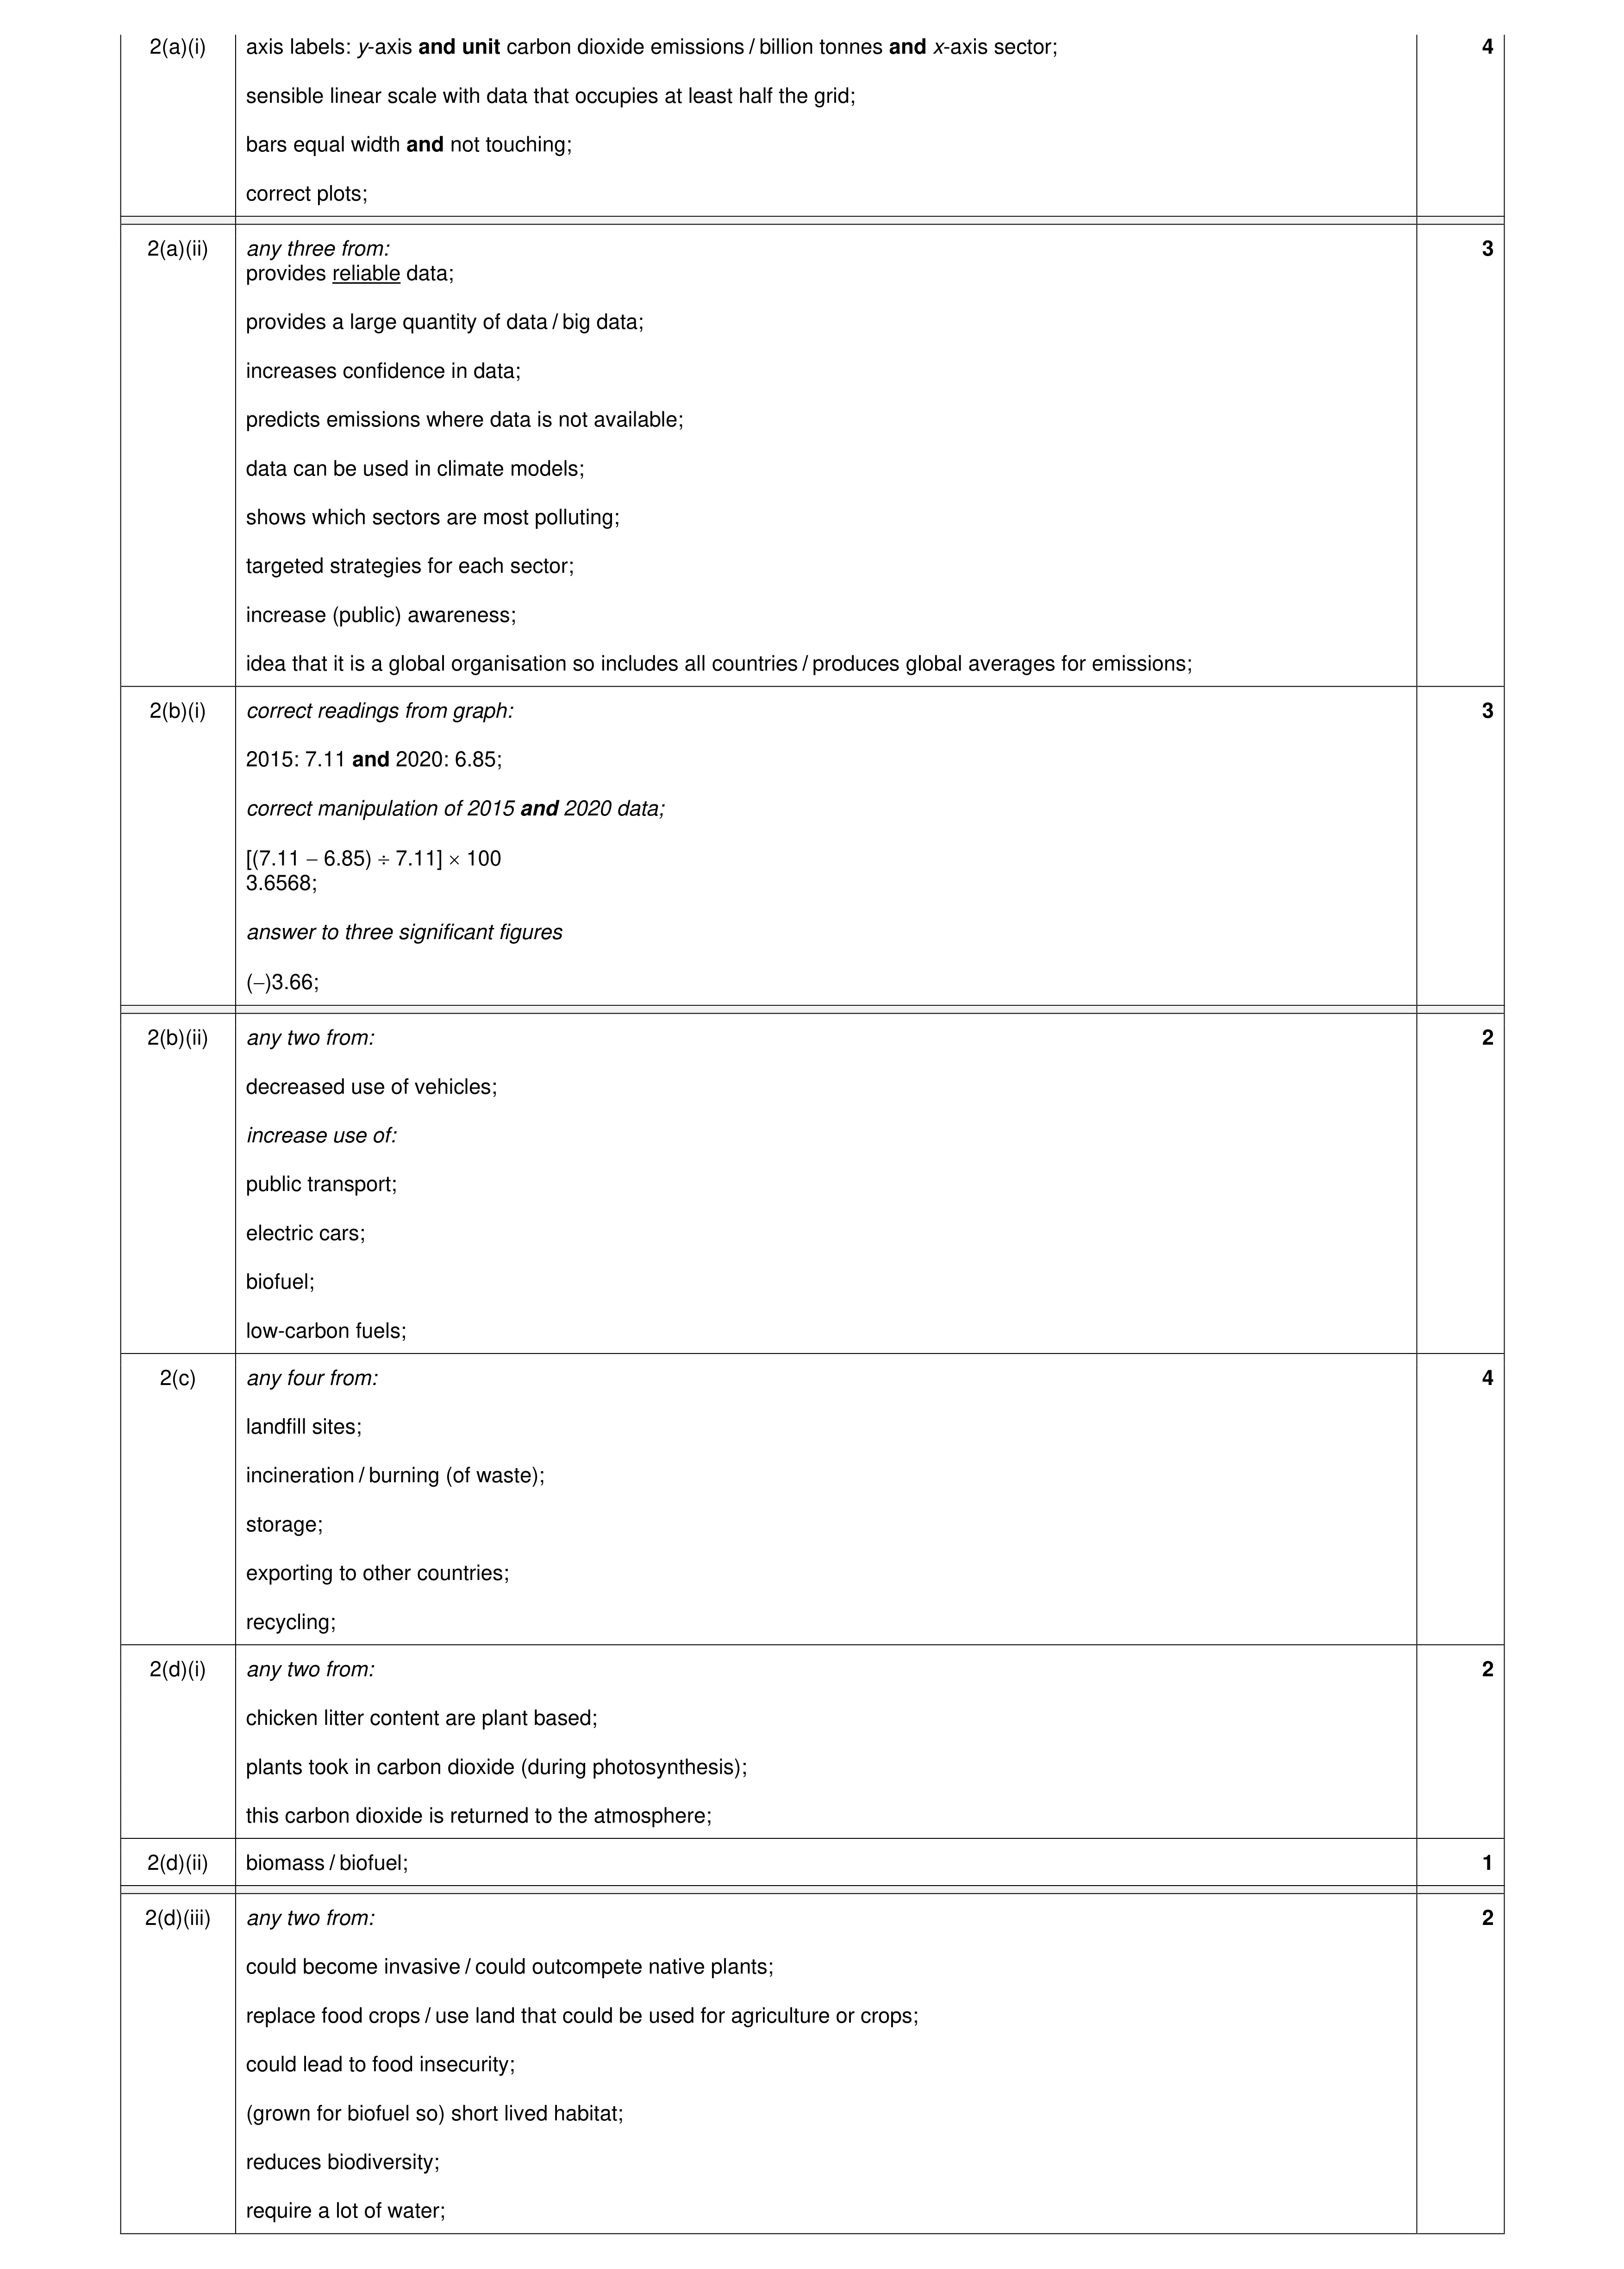 21
21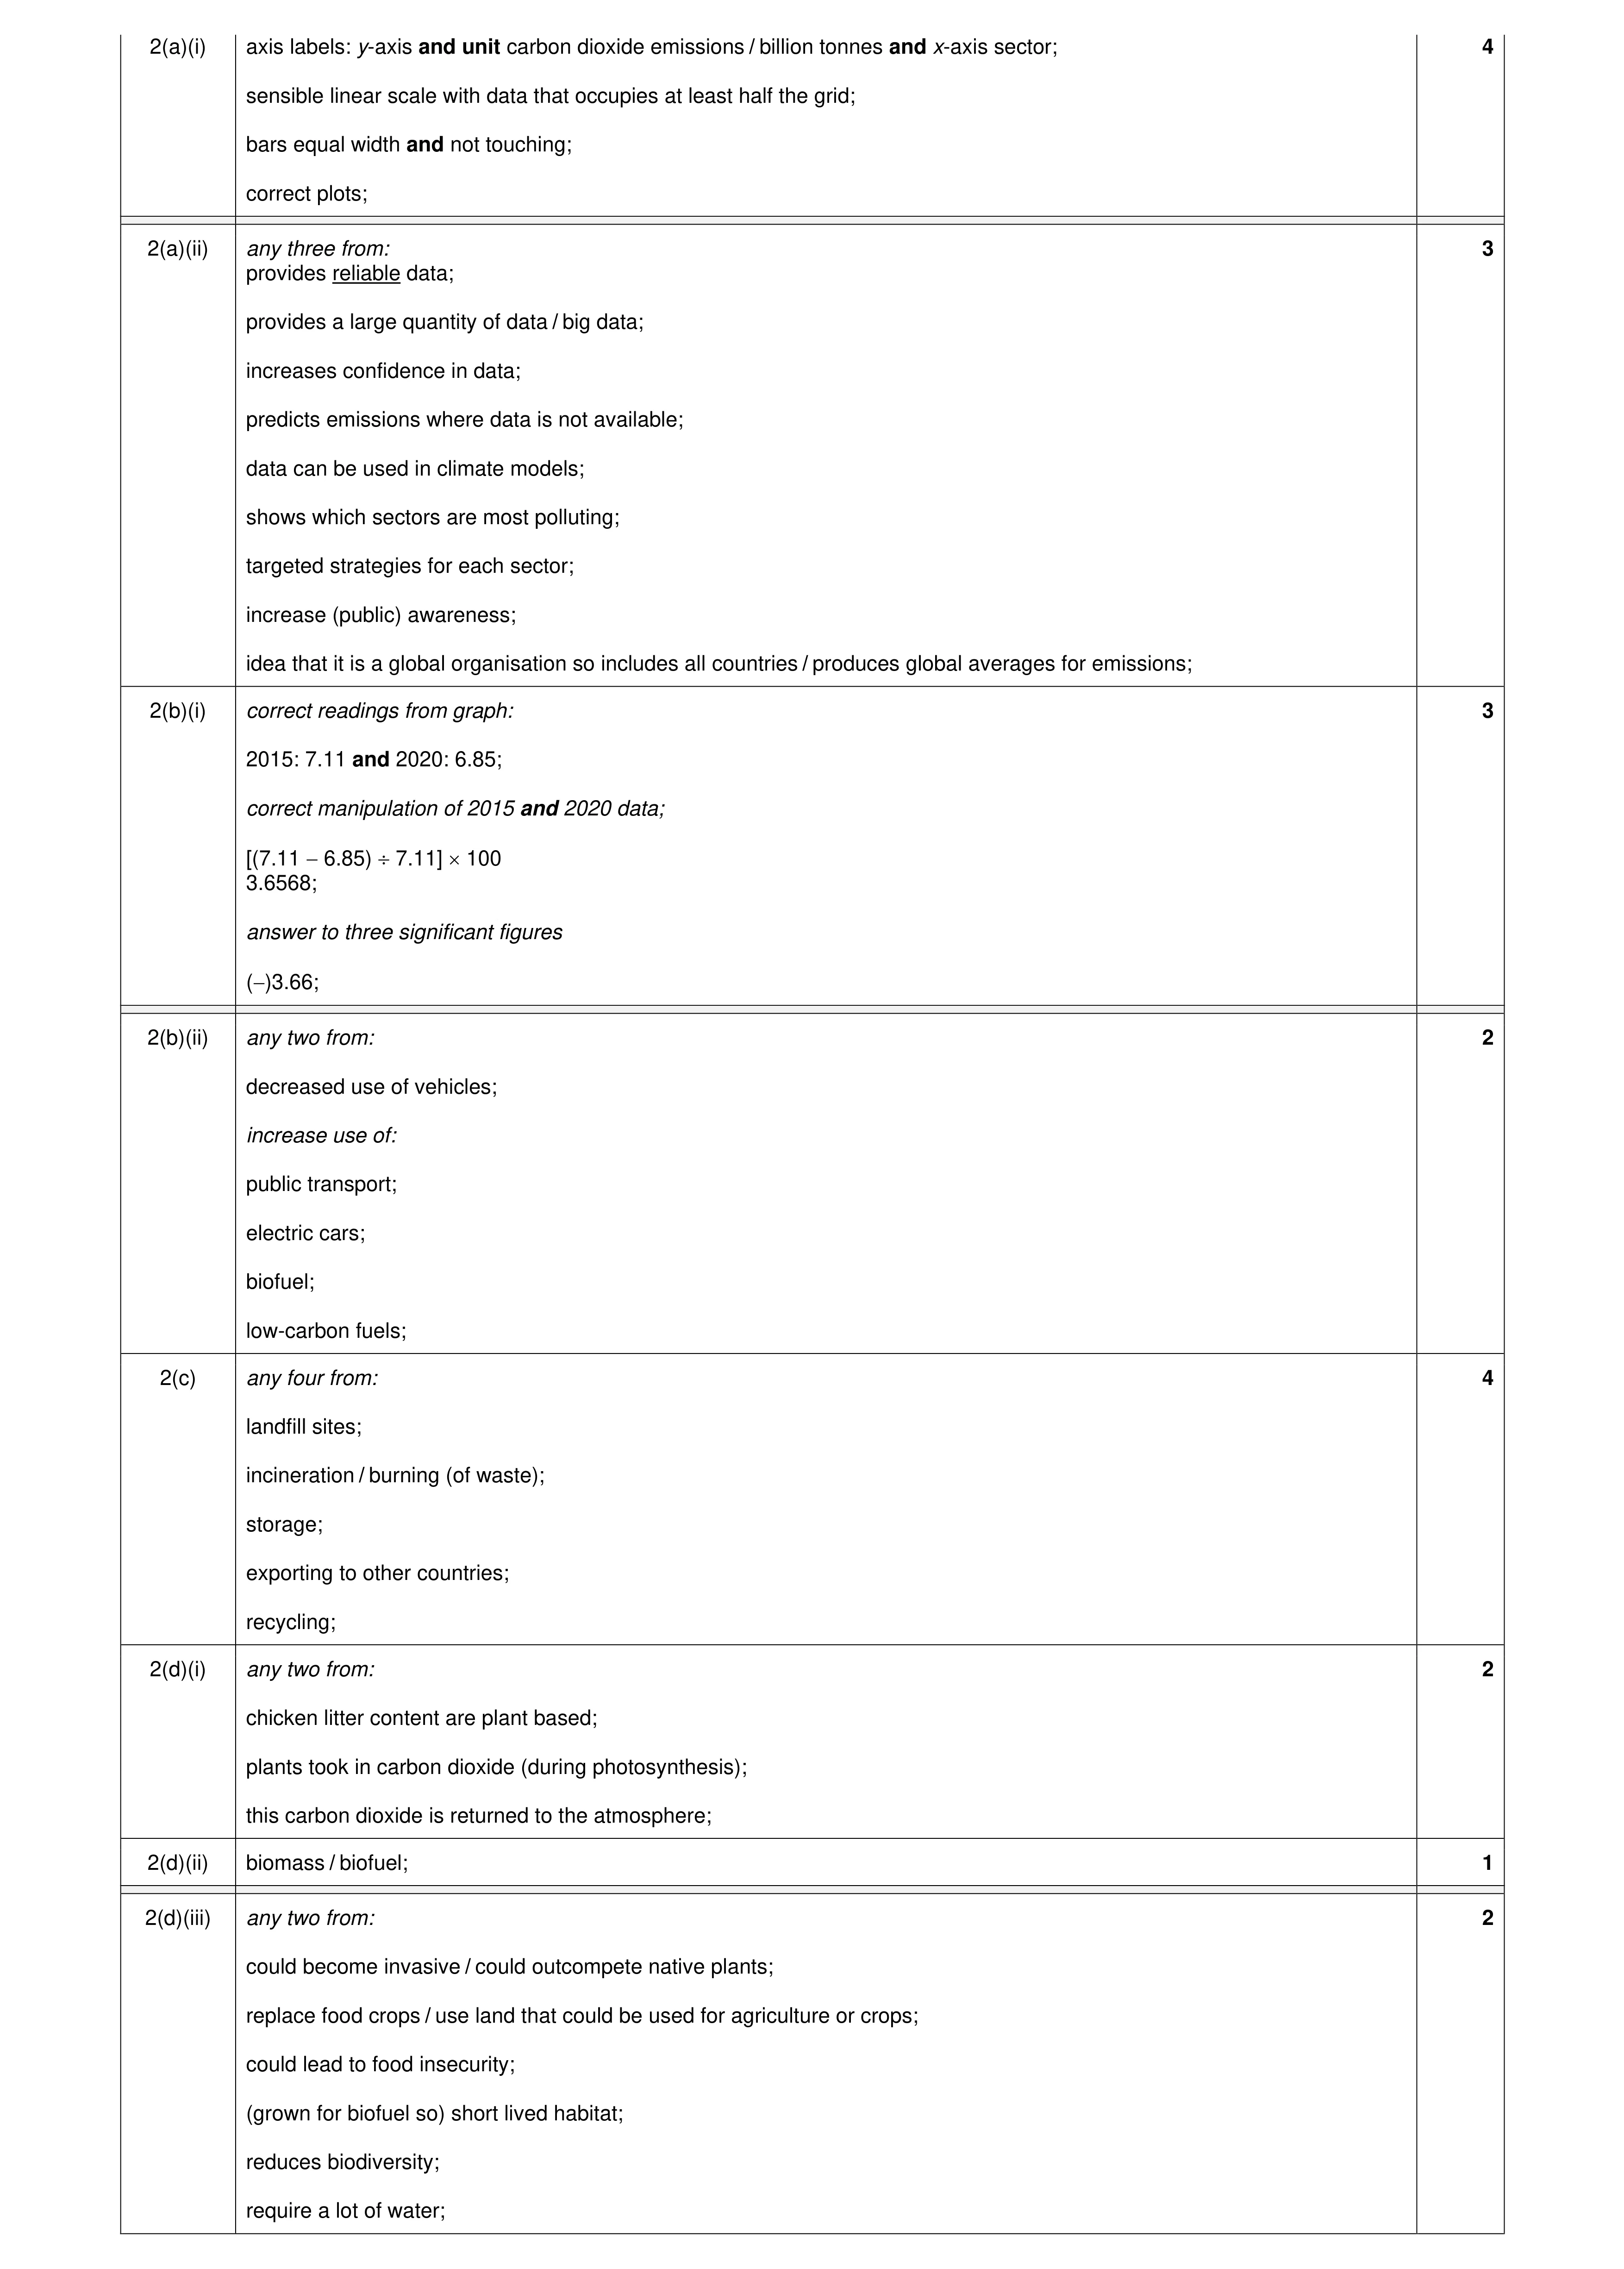 21
21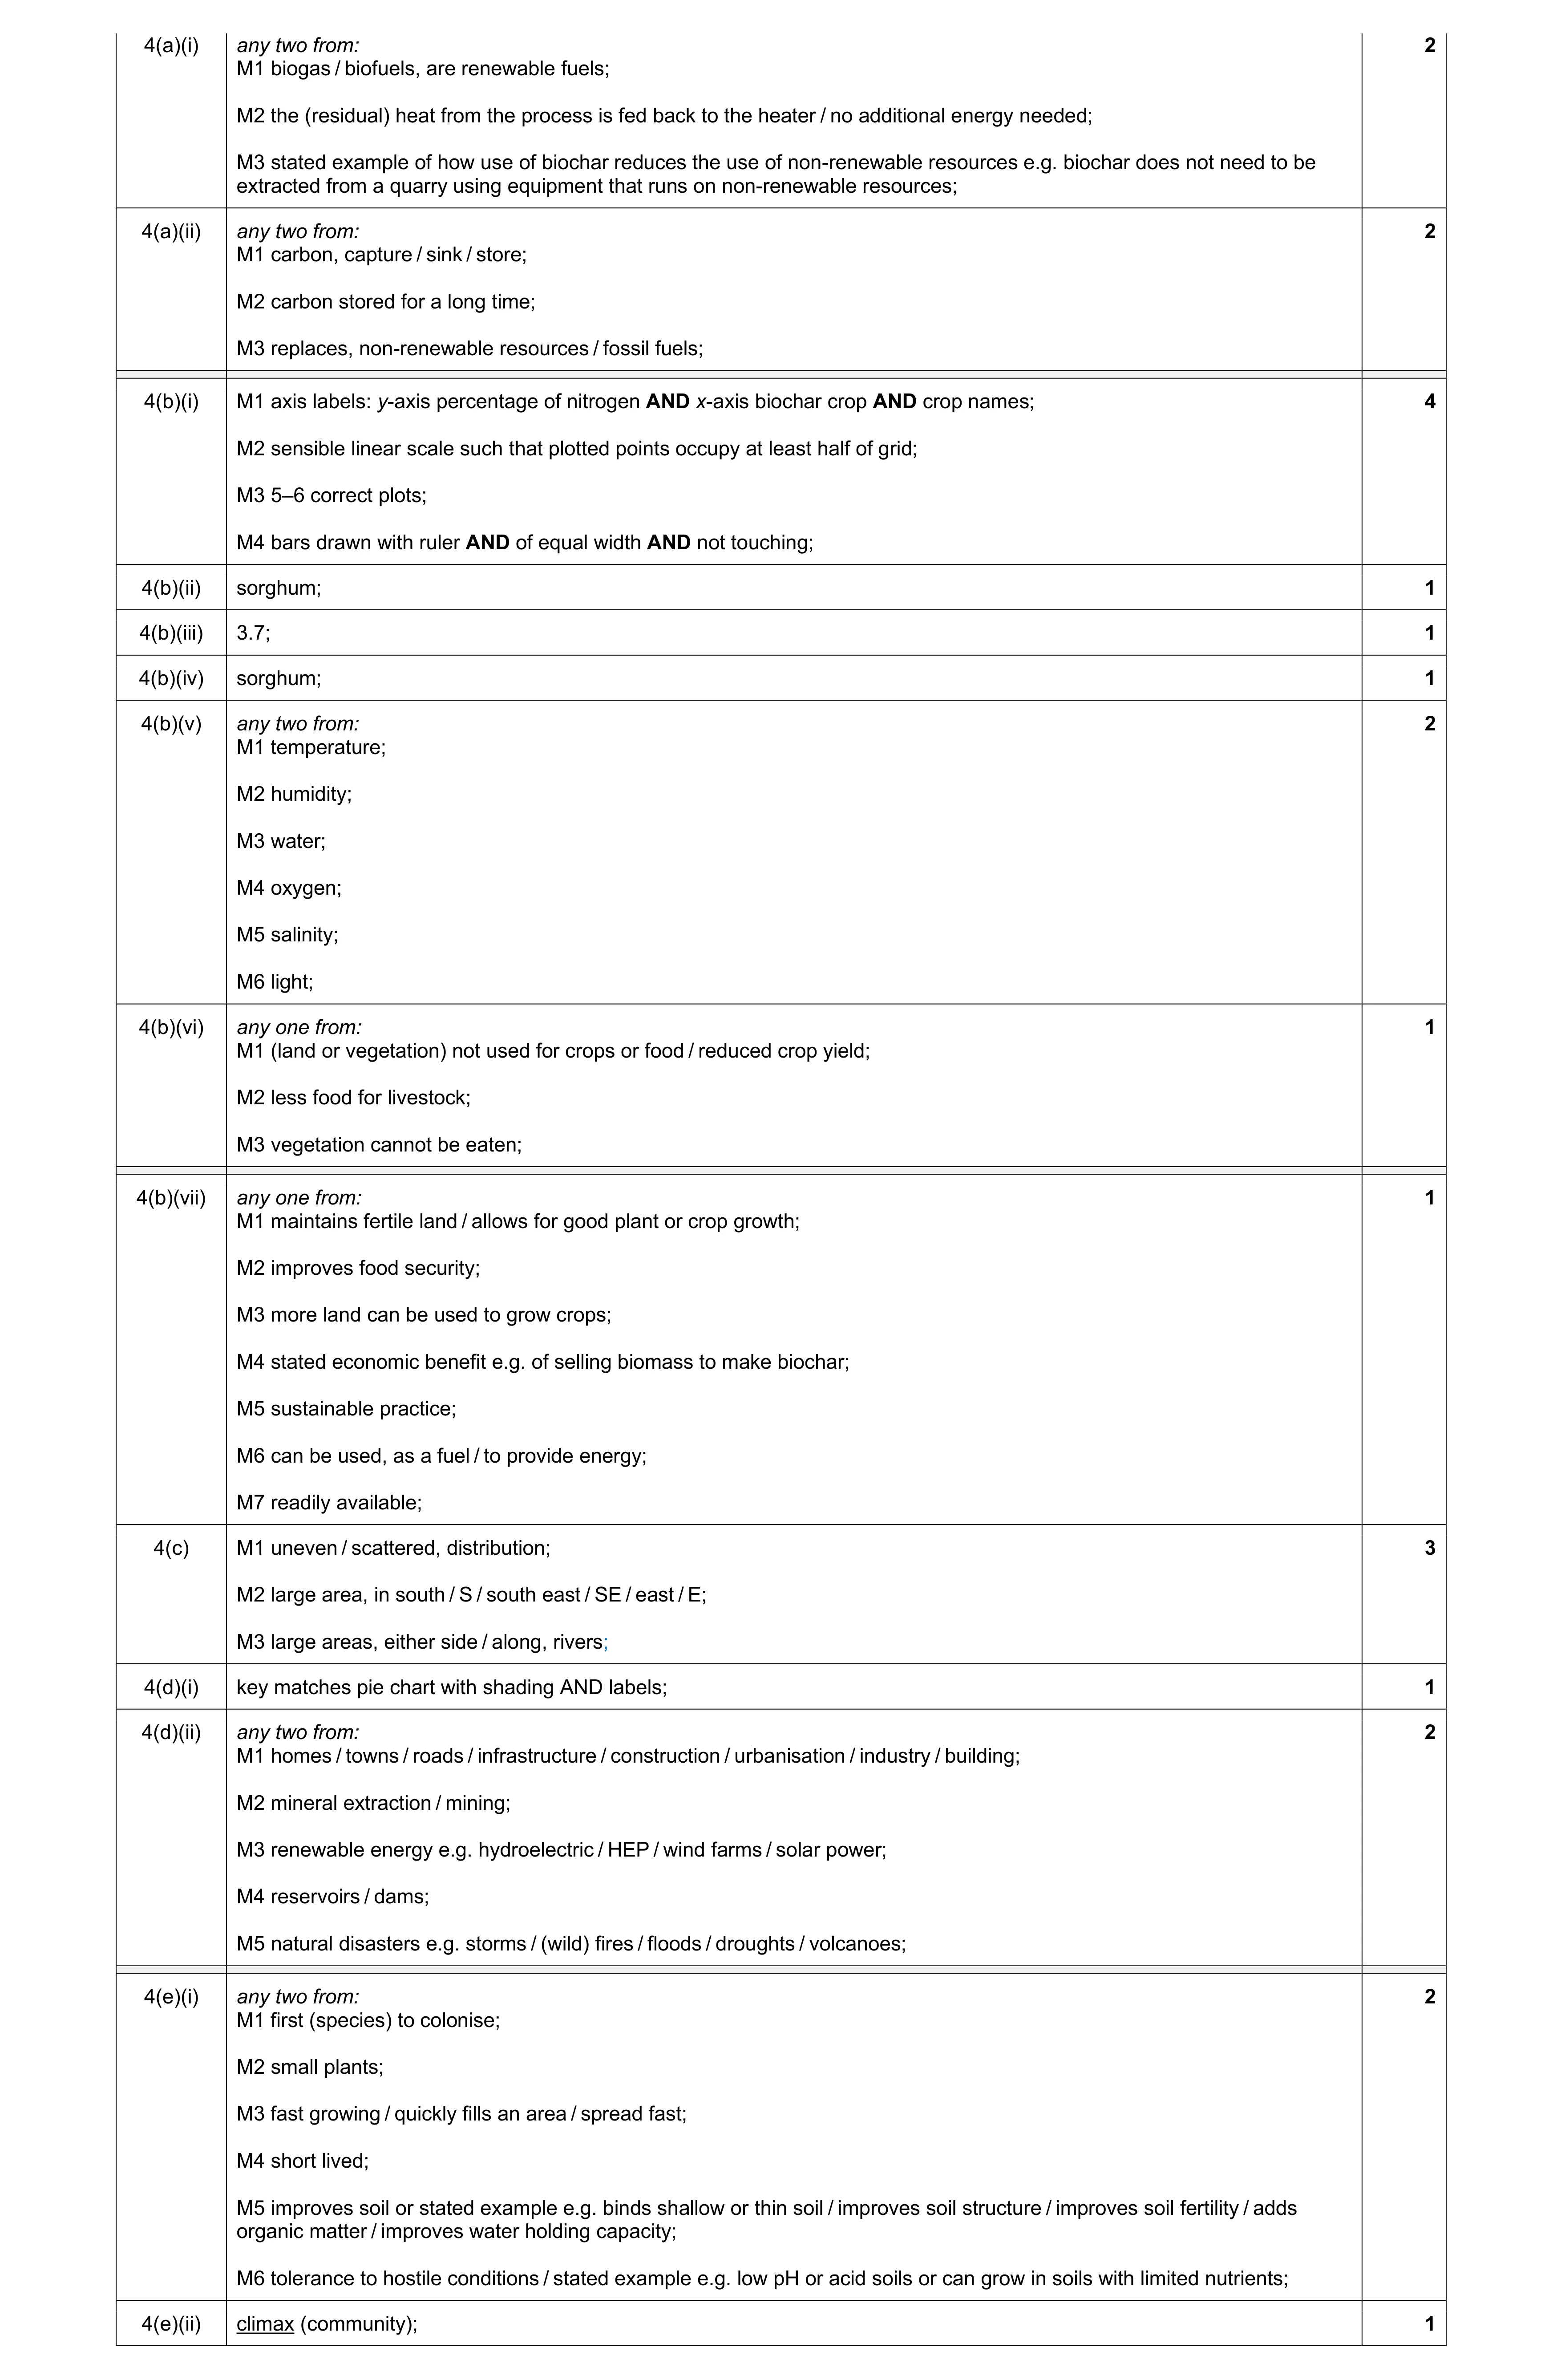 15
15