Cambridge A Level Environmental Management (AS only) 8291 — 2025 May/June Paper 2 · Variant 1
8291/21/M/J/25 · 4 questions · 80 marks · 105 min
The question paper and its mark scheme, free to read here and free to download. This is Cambridge’s own paper, exactly as it was sat.
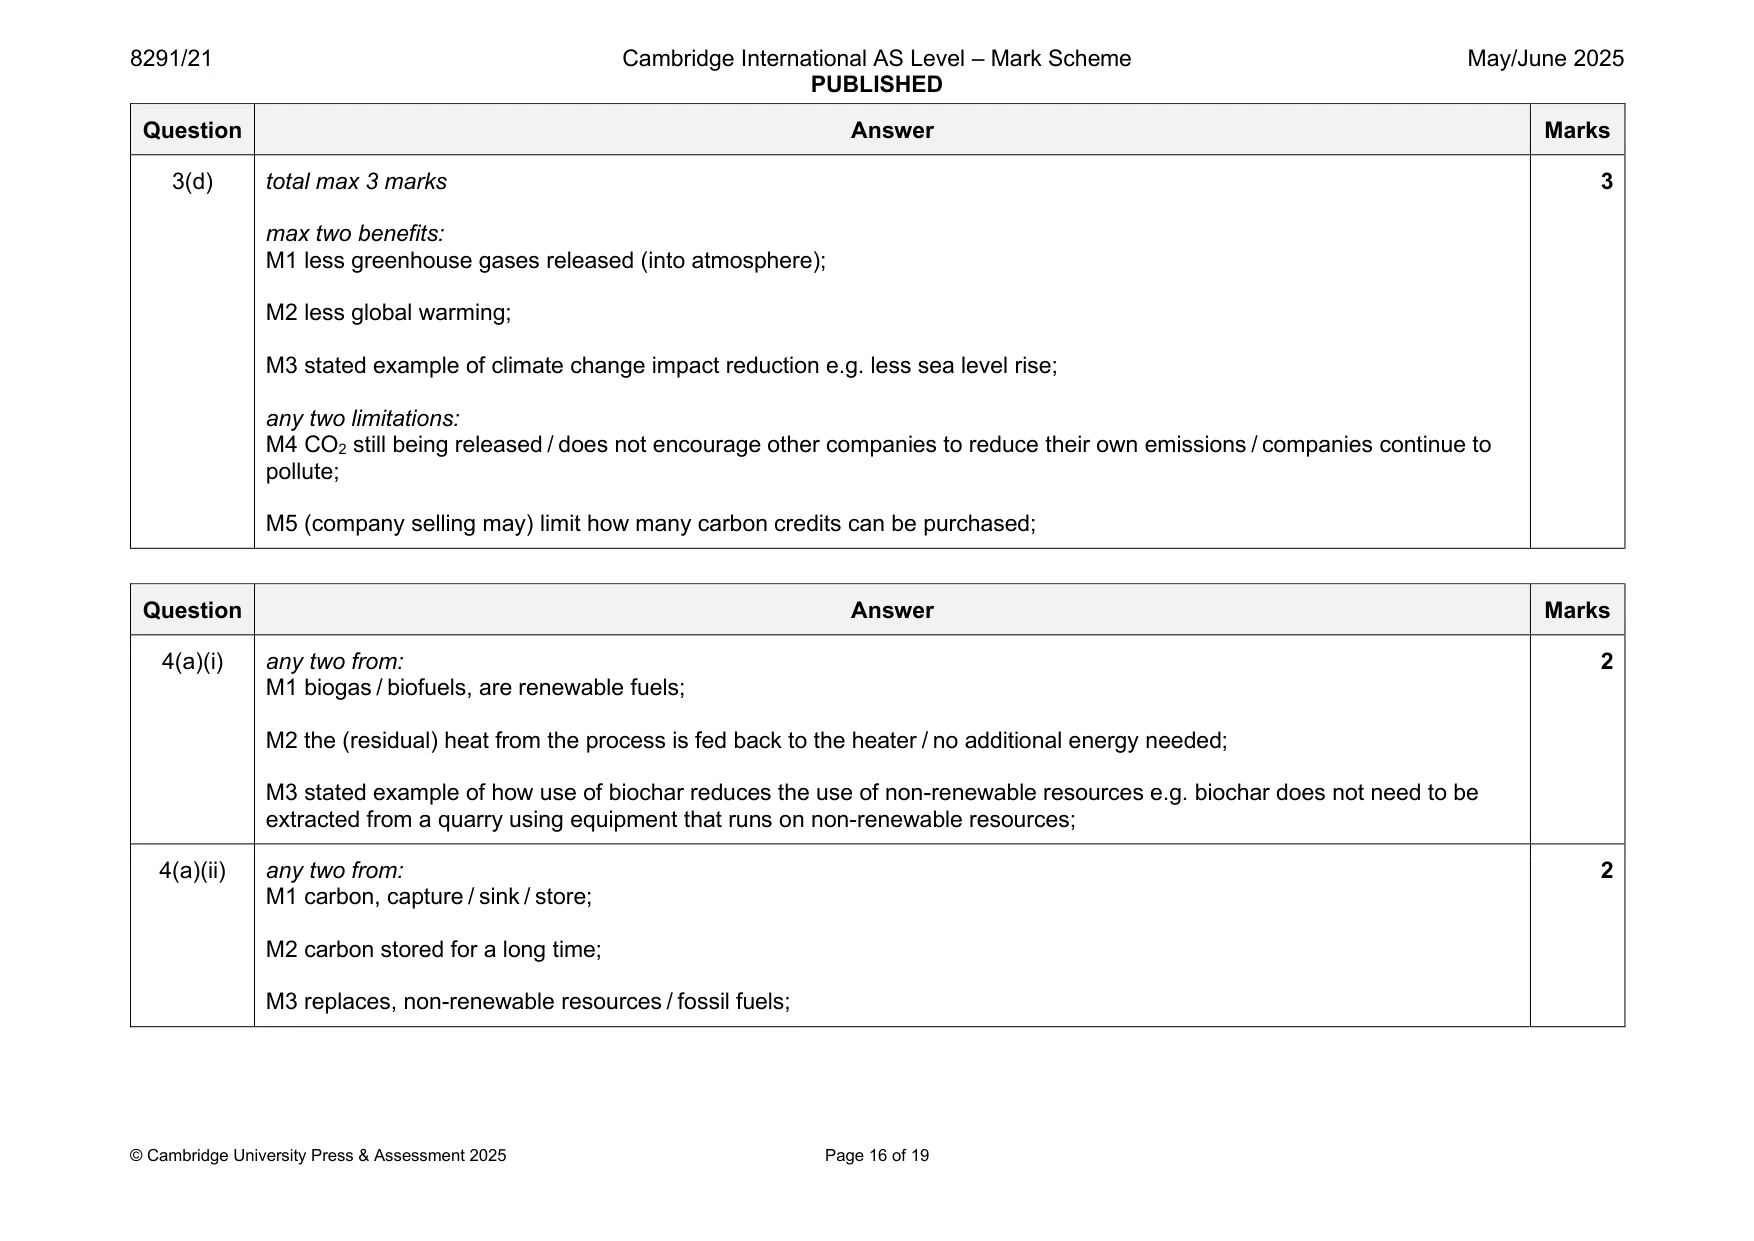
Question paper24 pages







Mark scheme19 pages
Answers below. Sit the paper first if you are practising.
Questions as text
Q1 · A report stated that people who live near waste incineration plants are less likely to…
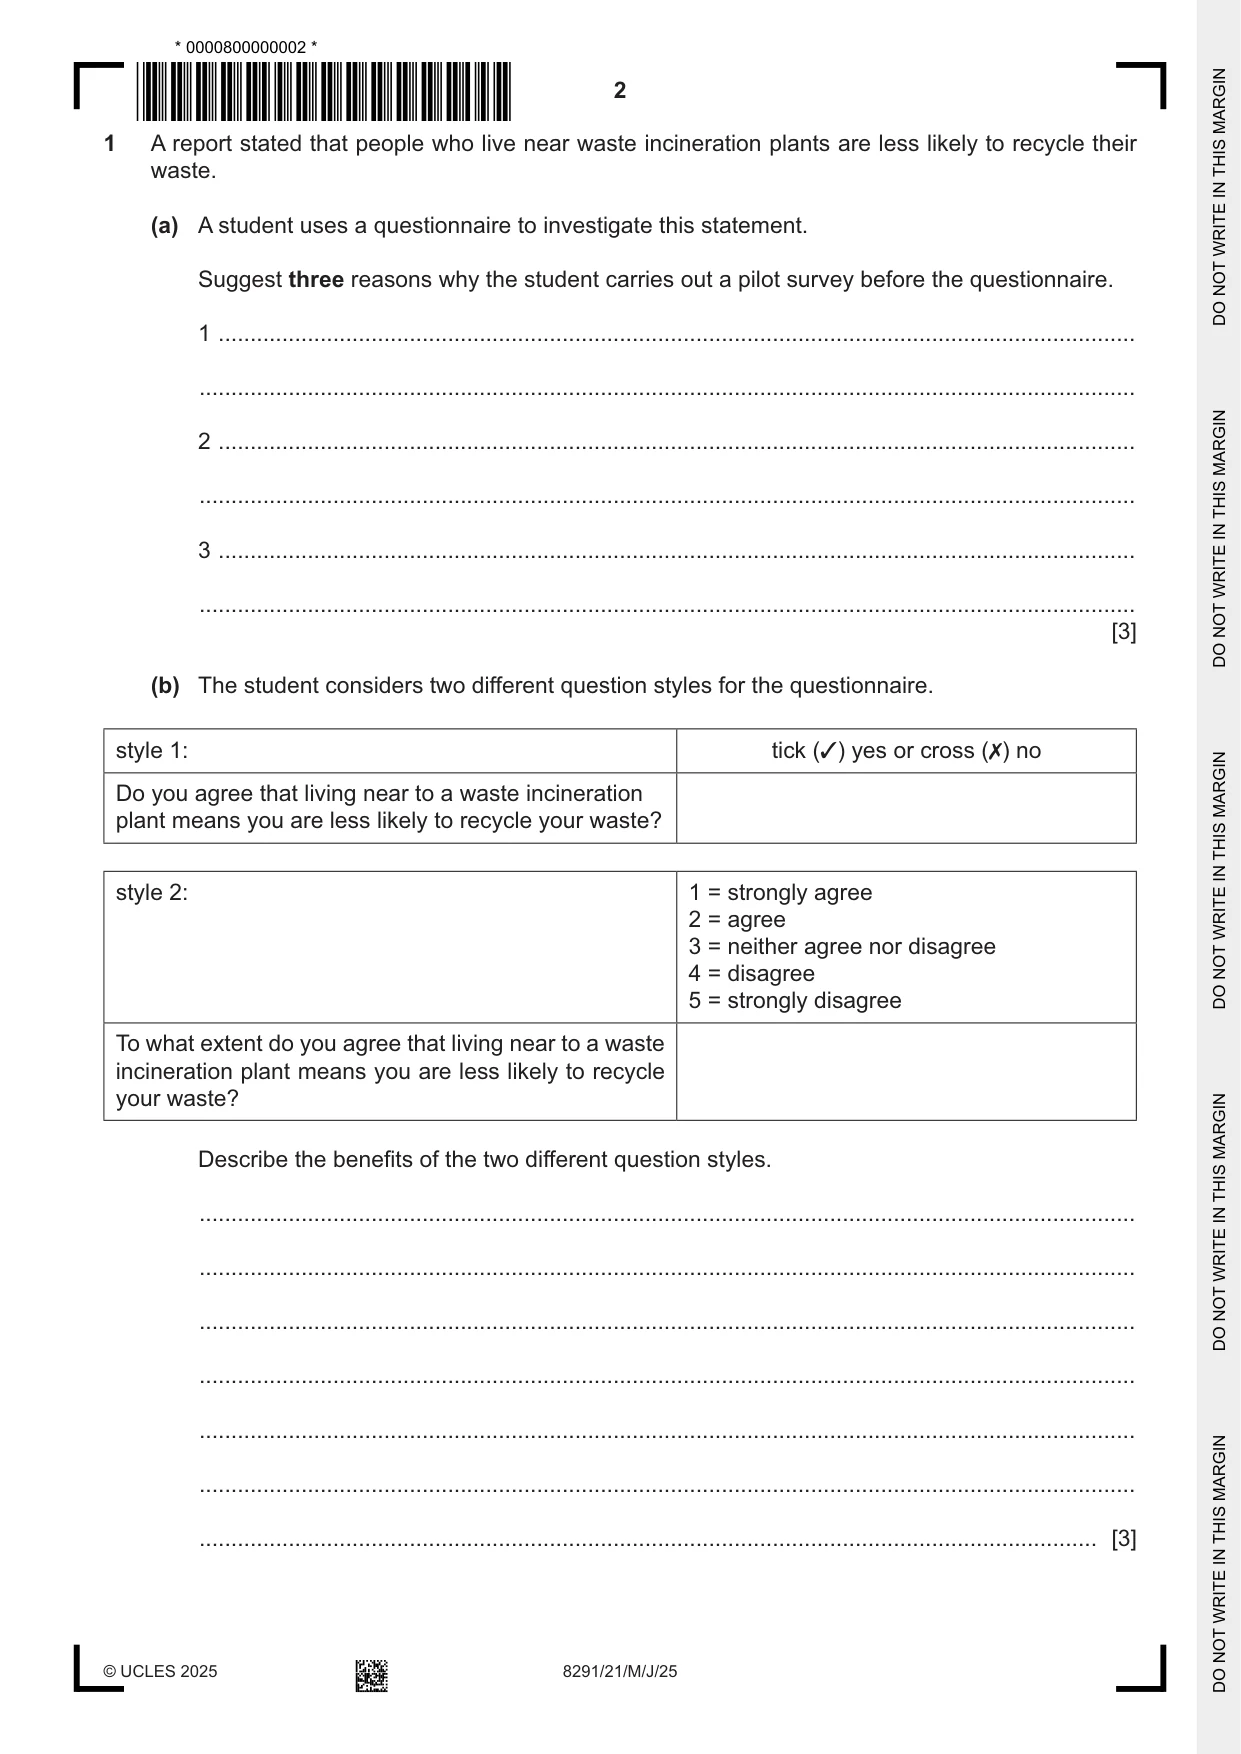
1 A report stated that people who live near waste incineration plants are less likely to recycle their waste. (a) A student uses a questionnaire to investigate this statement. Suggest three reasons why the student carries out a pilot survey before the questionnaire. 1 ................................................................................................................................................ ................................................................................................................................................... 2 ................................................................................................................................................ ................................................................................................................................................... 3 ................................................................................................................................................ ................................................................................................................................................... [3] (b) The student considers two different question styles for the questionnaire. style 1: tick (✓) yes or cross (✗) no Do you agree that living near to a waste incineration plant means you are less likely to recycle your waste? style 2: 1 = strongly agree 2 = agree 3 = neither agree nor disagree 4 = disagree 5 = strongly disagree To what extent do you agree that living near to a waste incineration plant means you are less likely to recycle your waste? Describe the benefits of the two different question styles. ................................................................................................................................................... ................................................................................................................................................... ................................................................................................................................................... ................................................................................................................................................... ................................................................................................................................................... ................................................................................................................................................... ............................................................................................................................................. [3] (c) The student then decides to carry out recorded interviews with some of the people in the survey. (i) Suggest the benefits of using recorded interviews. ........................................................................................................................................... ........................................................................................................................................... ........................................................................................................................................... ........................................................................................................................................... ..................................................................................................................................... [2] (ii) The student selects only women aged 40–50 years for the recorded interviews. State a limitation of this sampling method. ........................................................................................................................................... ........................................................................................................................................... ..................................................................................................................................... [1] (d) The student concludes that a lack of recycling facilities is the main reason people do not recycle their waste. (i) Suggest two reasons for a lack of recycling facilities. 1 ........................................................................................................................................ ........................................................................................................................................... 2 ........................................................................................................................................ ........................................................................................................................................... [2] (ii) Explain how financial incentives and legislation encourage more people to recycle their waste. ........................................................................................................................................... ........................................................................................................................................... ........................................................................................................................................... ........................................................................................................................................... ..................................................................................................................................... [2] (e) Explain the impacts of landfill as a method of waste disposal. ................................................................................................................................................... ................................................................................................................................................... ................................................................................................................................................... ................................................................................................................................................... ................................................................................................................................................... ................................................................................................................................................... ................................................................................................................................................... ................................................................................................................................................... ................................................................................................................................................... ............................................................................................................................................. [5] [Total: 18]
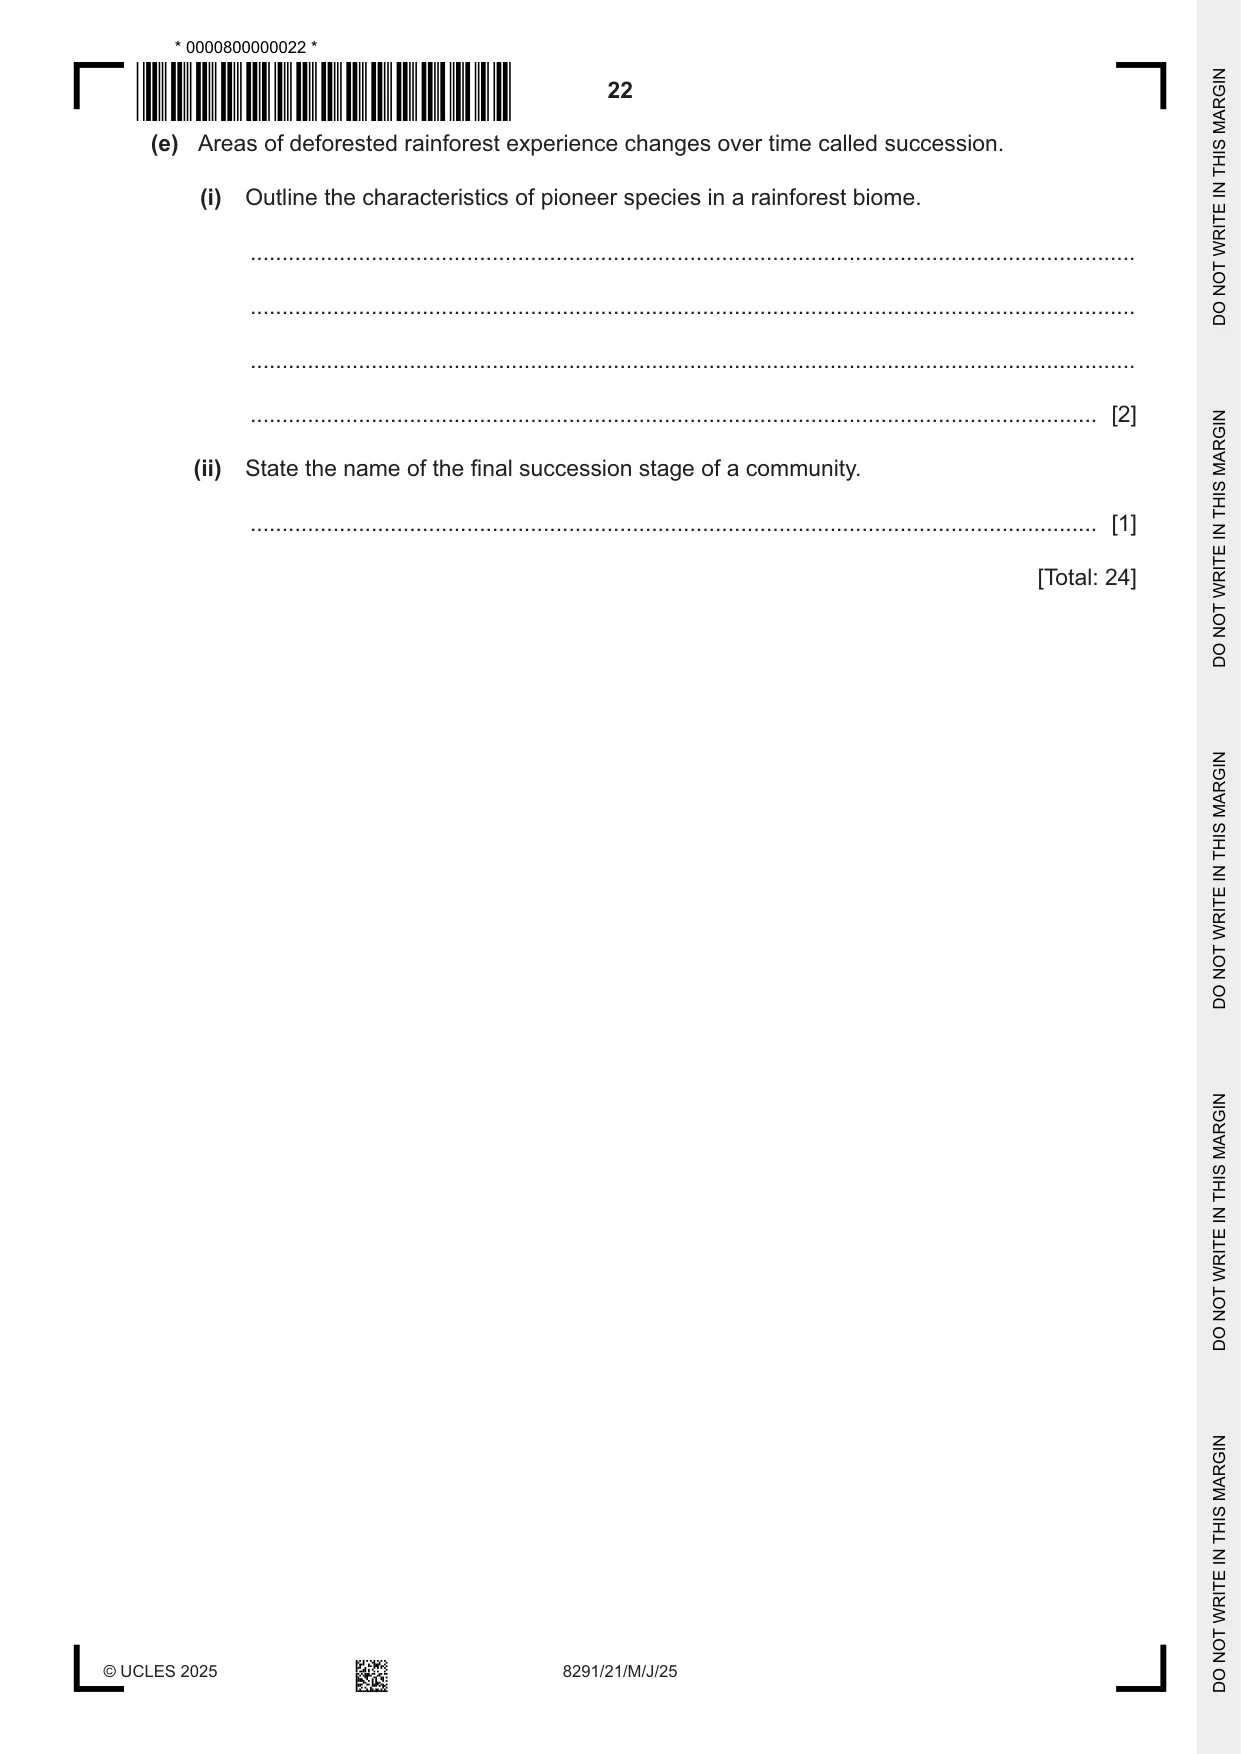
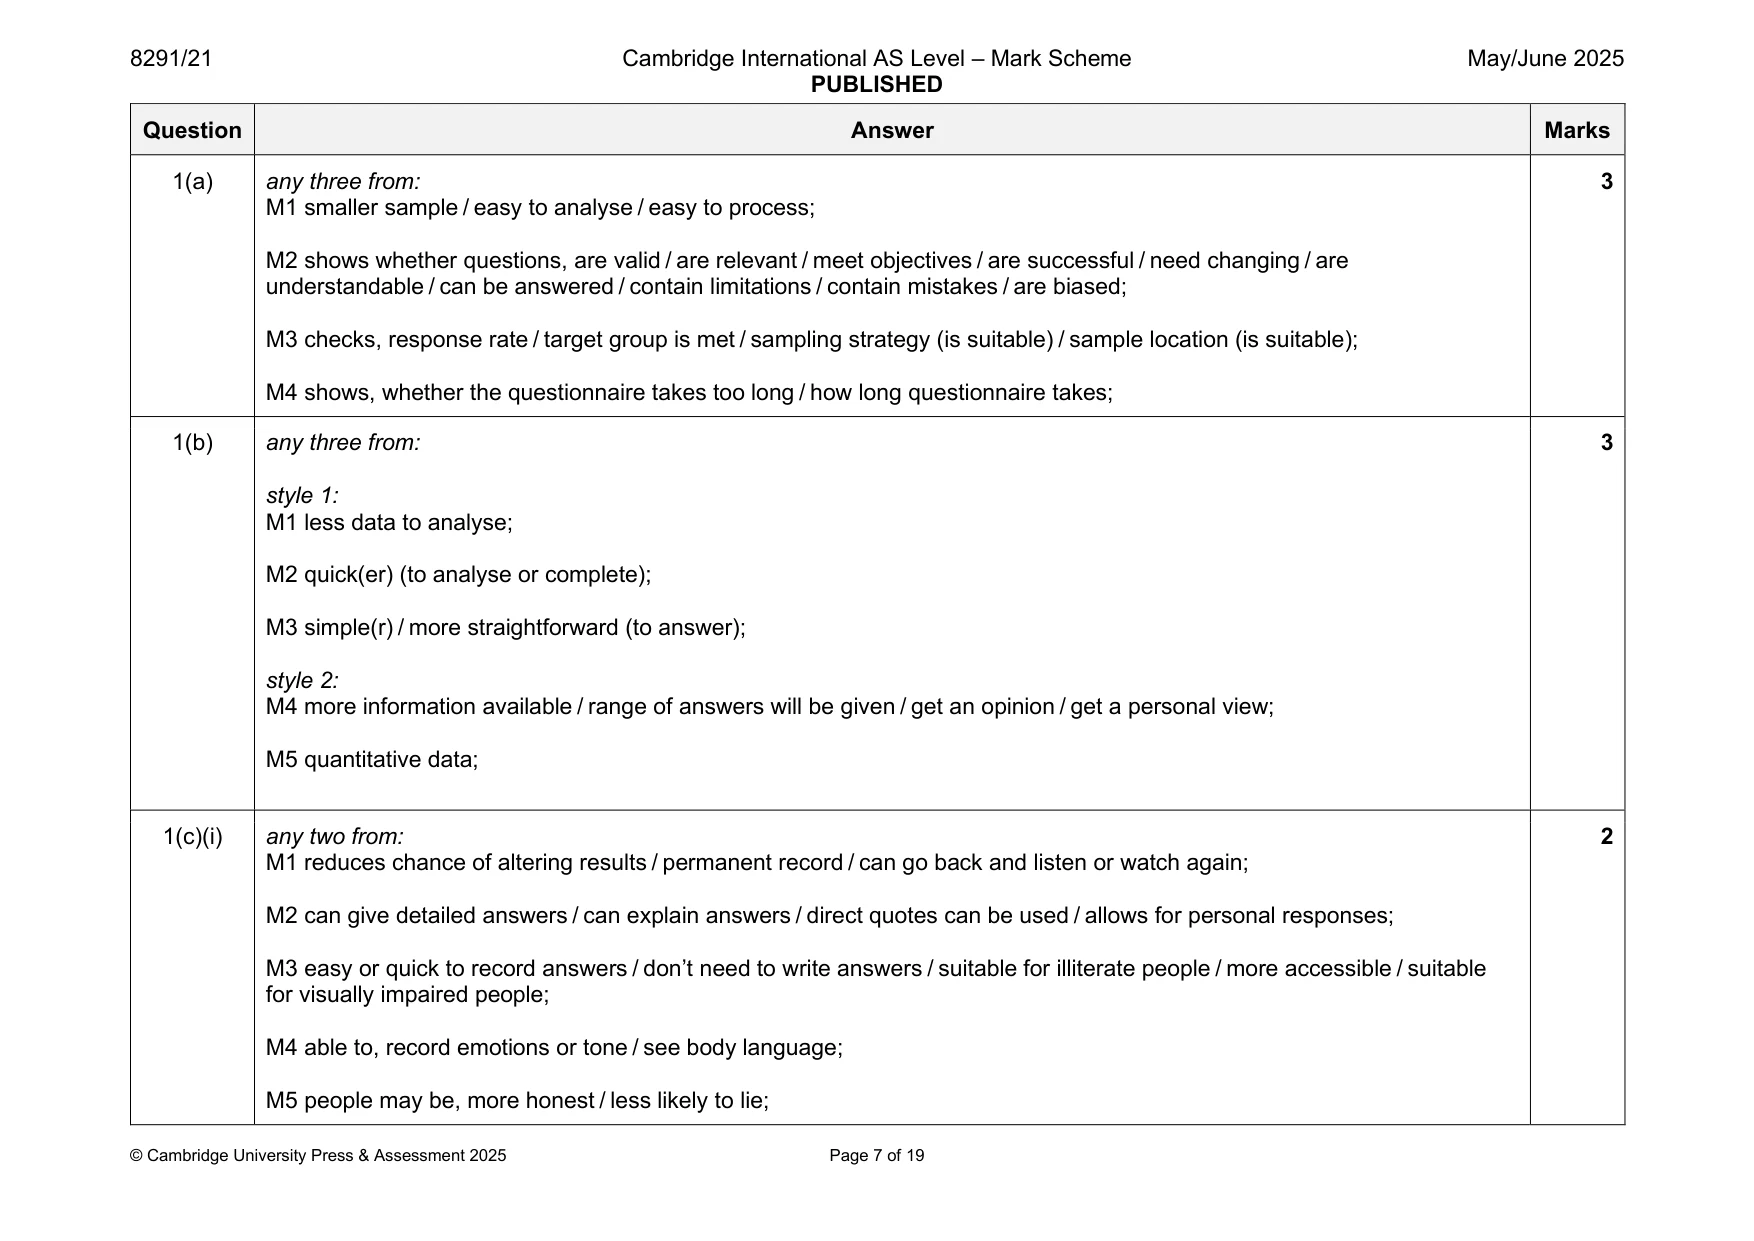
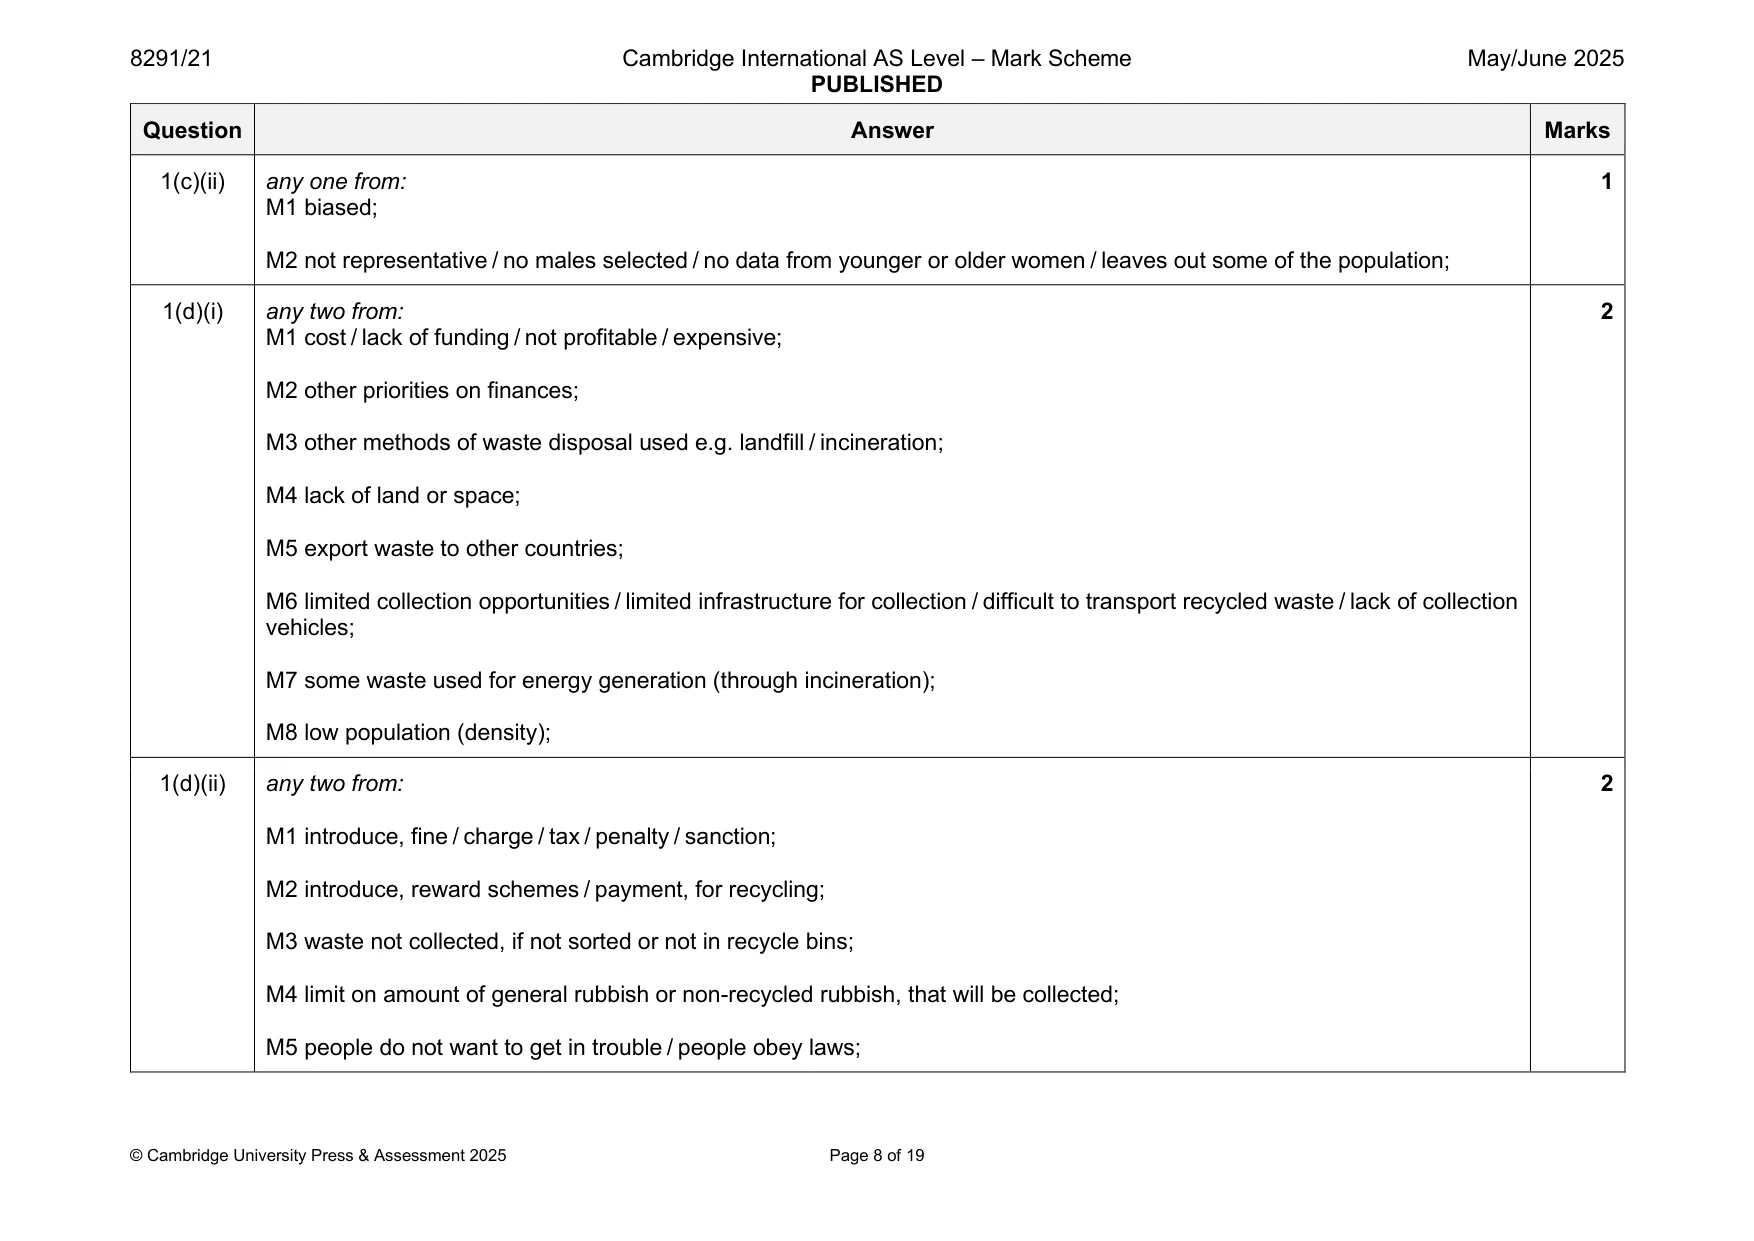
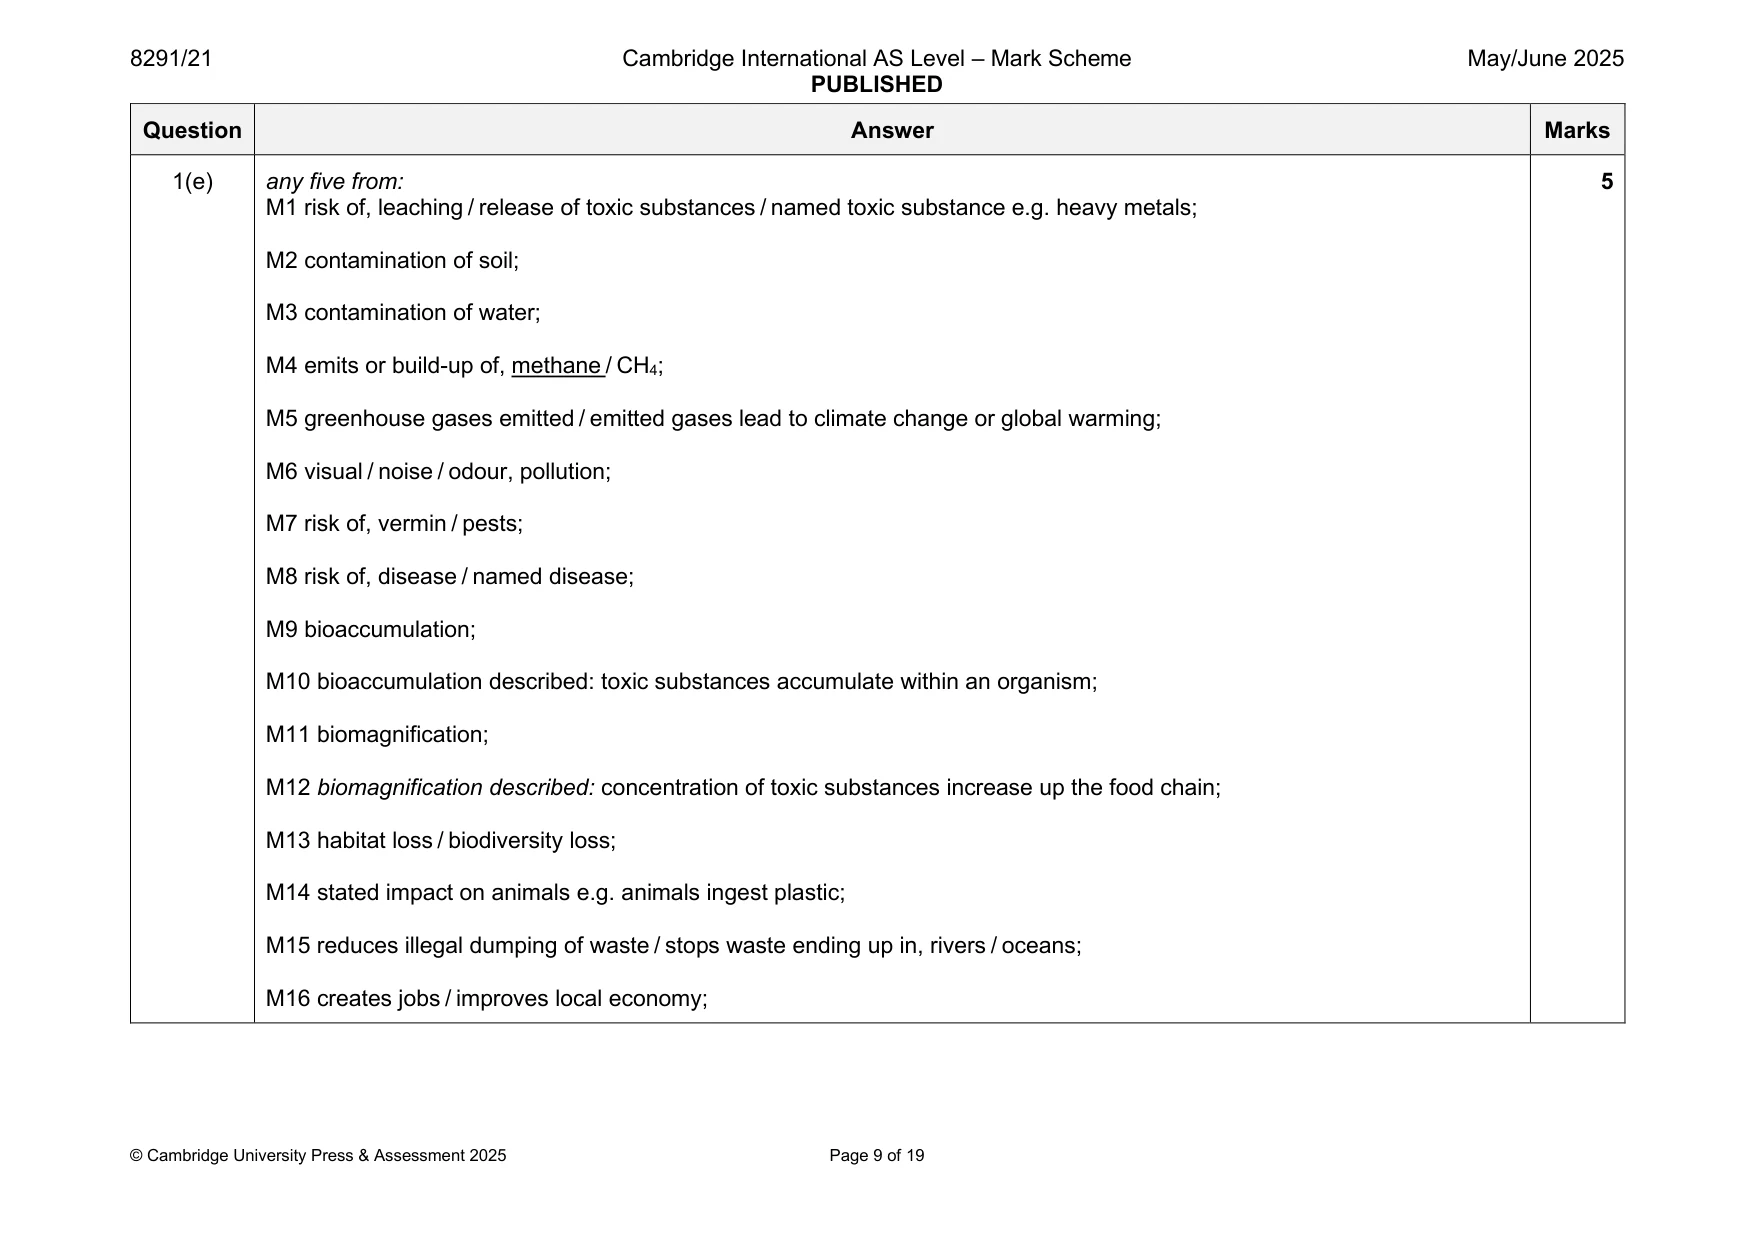
Mark scheme: Question Answer Marks 1(a) any three from: 3 M1 smaller sample / easy to analyse / easy to process; M2 shows whether questions, are valid / are relevant / meet objectives / are successful / need changing / are understandable / can be answered / contain limitations / contain mistakes / are biased; M3 checks, response rate / target group is met / sampling strategy (is suitable) / sample location (is suitable); M4 shows, whether the questionnaire takes too long / how long questionnaire takes; 1(b) any three from: 3 style 1: M1 less data to analyse; M2 quick(er) (to analyse or complete); M3 simple(r) / more straightforward (to answer); style 2: M4 more information available / range of answers will be given / get an opinion / get a personal view; M5 quantitative data; 1(c)(i) any two from: 2 M1 reduces chance of altering results / permanent record / can go back and listen or watch again; M2 can give detailed answers / can explain answers / direct quotes can be used / allows for personal responses; M3 easy or quick to record answers / don’t need to write answers / suitable for illiterate people / more accessible / suitable for visually impaired people; M4 able to, record emotions or tone / see body language; M5 people may be, more honest / less likely to lie; 1(c)(ii) any one from: 1 M1 biased; M2 not representative / no males selected / no data from younger or older women / leaves out some of the population; 1(d)(i) any two from: 2 M1 cost / lack of funding / not profitable / expensive; M2 other priorities on finances; M3 other methods of waste disposal used e.g. landfill / incineration; M4 lack of land or space; M5 export waste to other countries; M6 limited collection opportunities / limited infrastructure for collection / difficult to transport recycled waste / lack of collection vehicles; M7 some waste used for energy generation (through incineration); M8 low population (density); 1(d)(ii) any two from: 2 M1 introduce, fine / charge / tax / penalty / sanction; M2 introduce, reward schemes / payment, for recycling; M3 waste not collected, if not sorted or not in recycle bins; M4 limit on amount of general rubbish or non-recycled rubbish, that will be collected; M5 people do not want to get in trouble / people obey laws; 1(e) any five from: 5 M1 risk of, leaching / release of toxic substances / named toxic substance e.g. heavy metals; M2 contamination of soil; M3 contamination of water; M4 emits or build-up of, methane / CH4; M5 greenhouse gases emitted / emitted gases lead to climate change or global warming; M6 visual / noise / odour, pollution; M7 risk of, vermin / pests; M8 risk of, disease / named disease; M9 bioaccumulation; M10 bioaccumulation described: toxic substances accumulate within an organism; M11 biomagnification; M12 biomagnification described: concentration of toxic substances increase up the food chain; M13 habitat loss / biodiversity loss; M14 stated impact on animals e.g. animals ingest plastic; M15 reduces illegal dumping of waste / stops waste ending up in, rivers / oceans; M16 creates jobs / improves local economy;
Q2 · Water turbidity measures the cloudiness of water
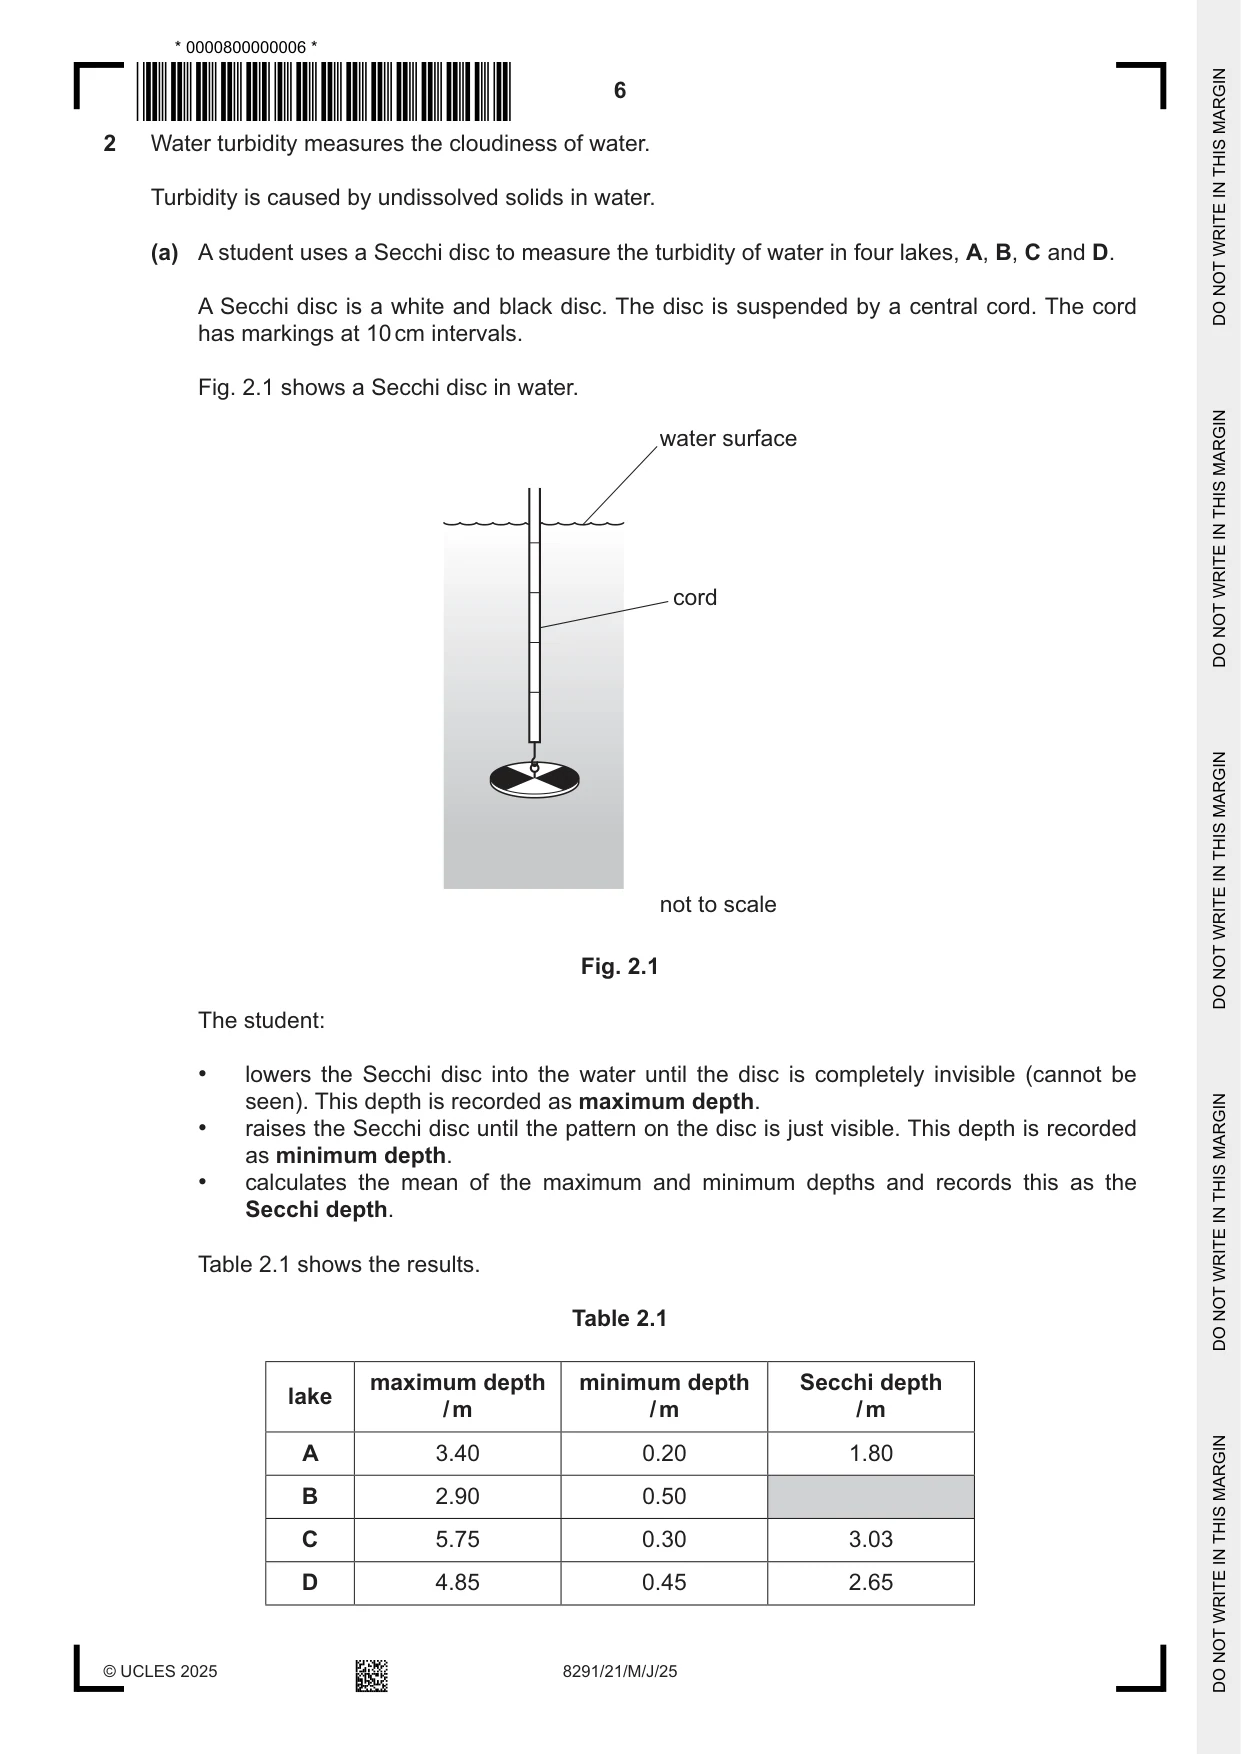
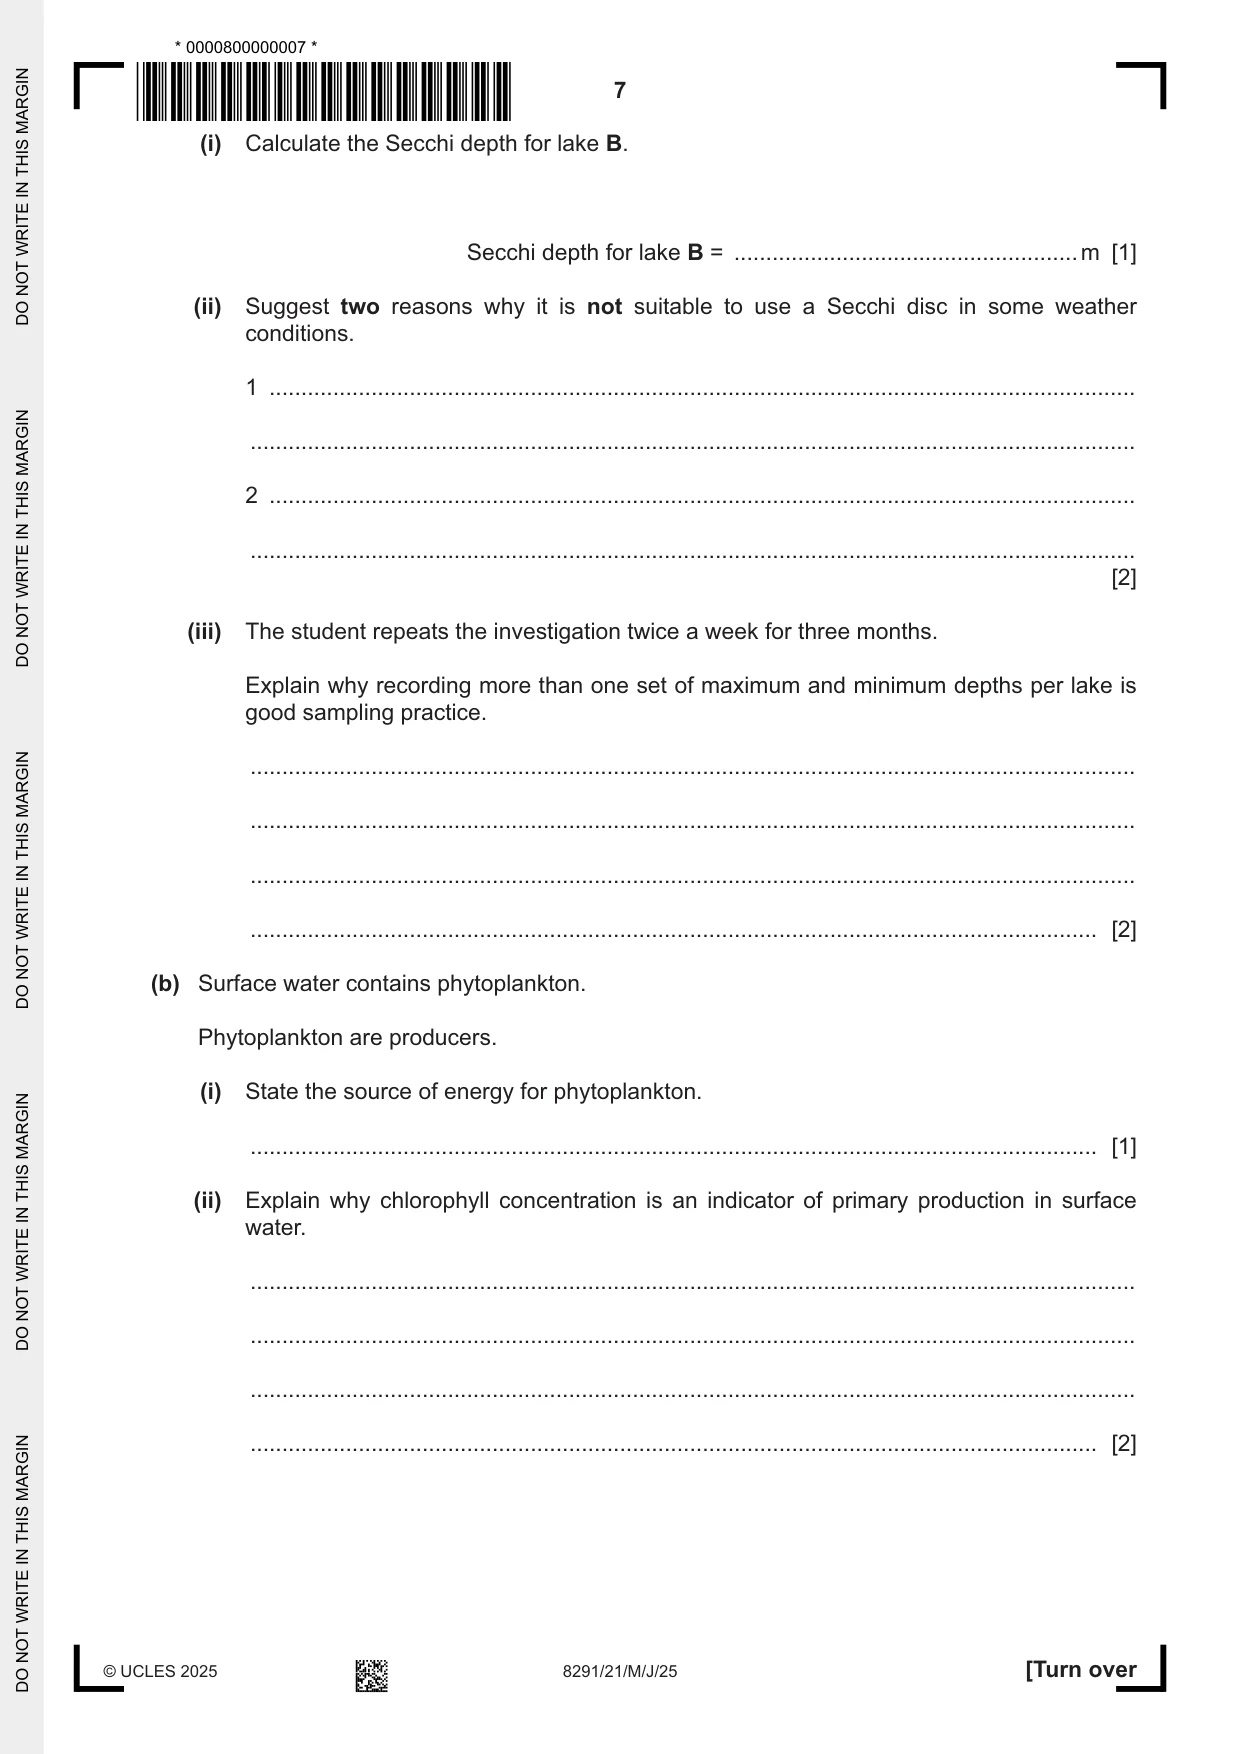
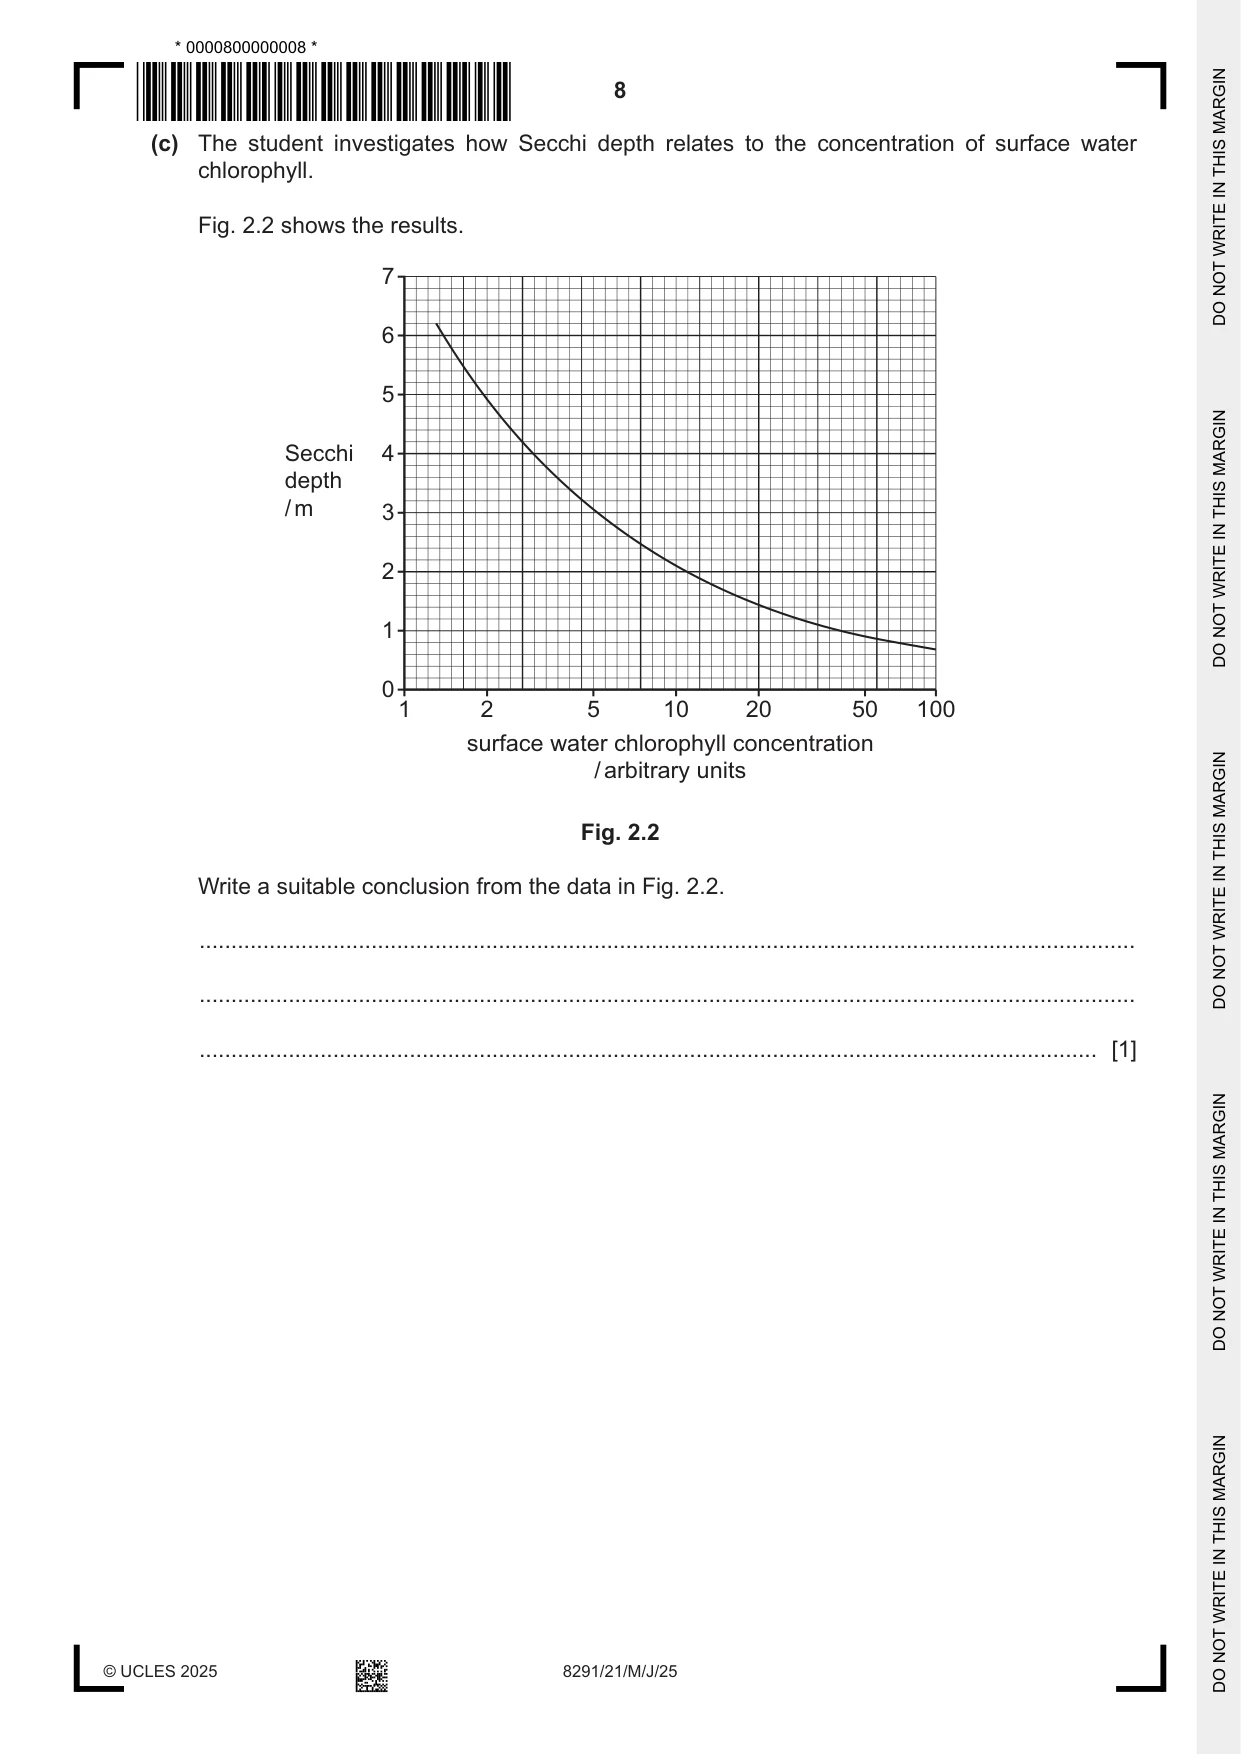
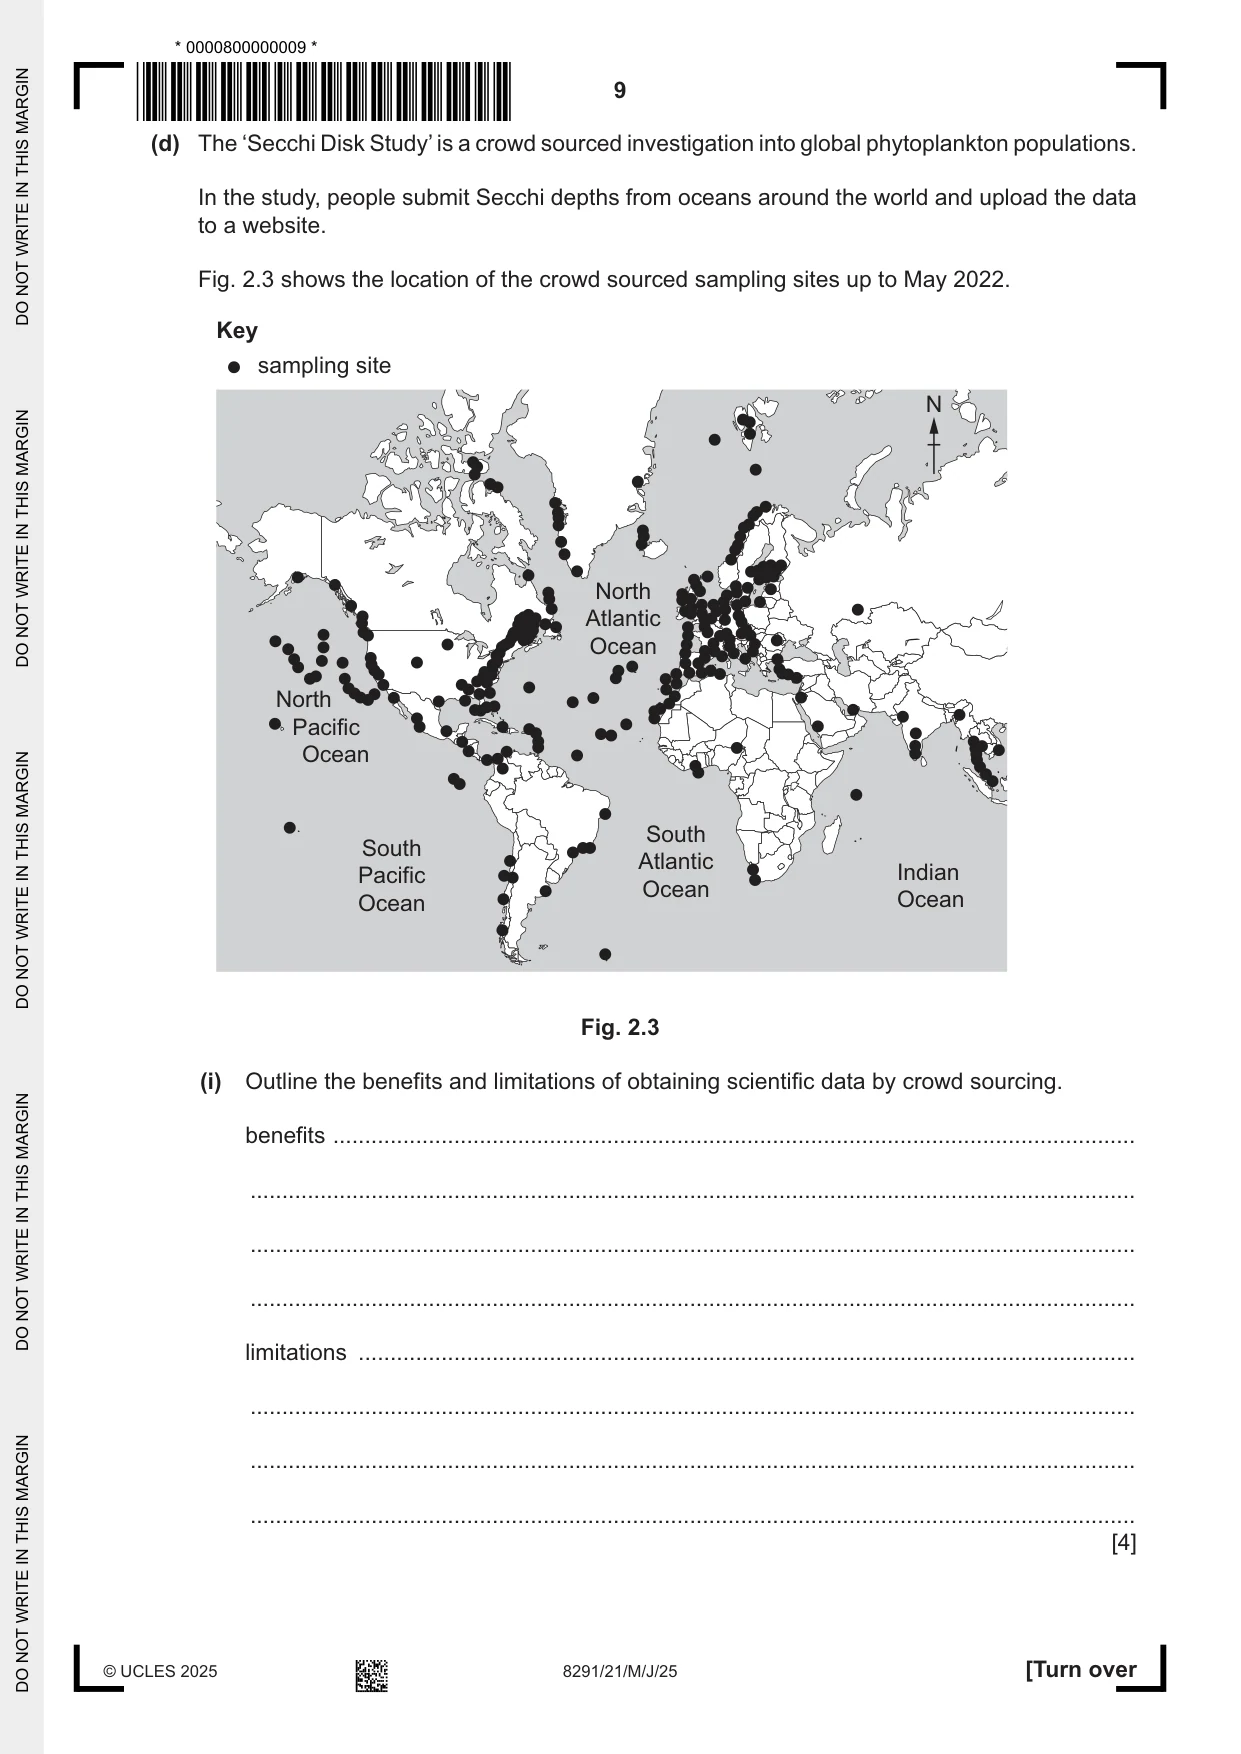
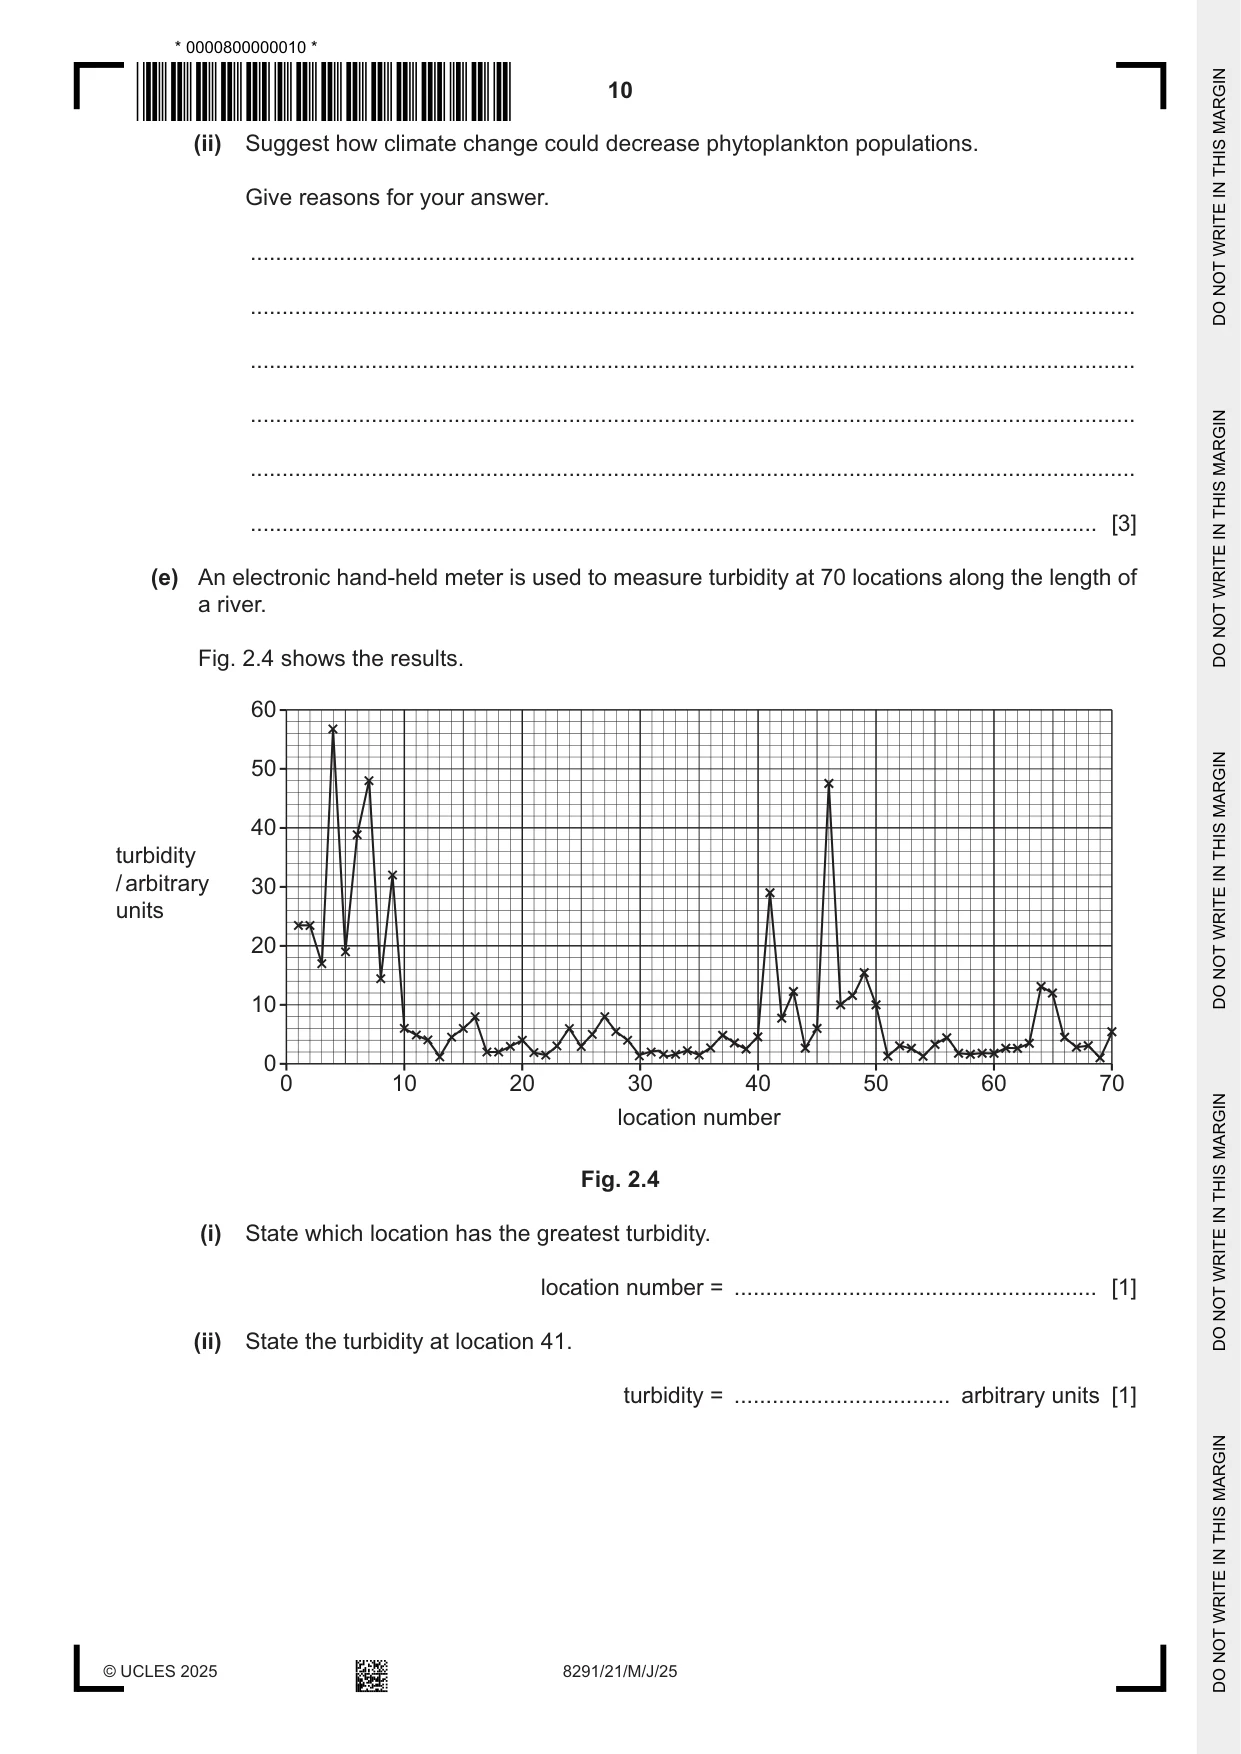
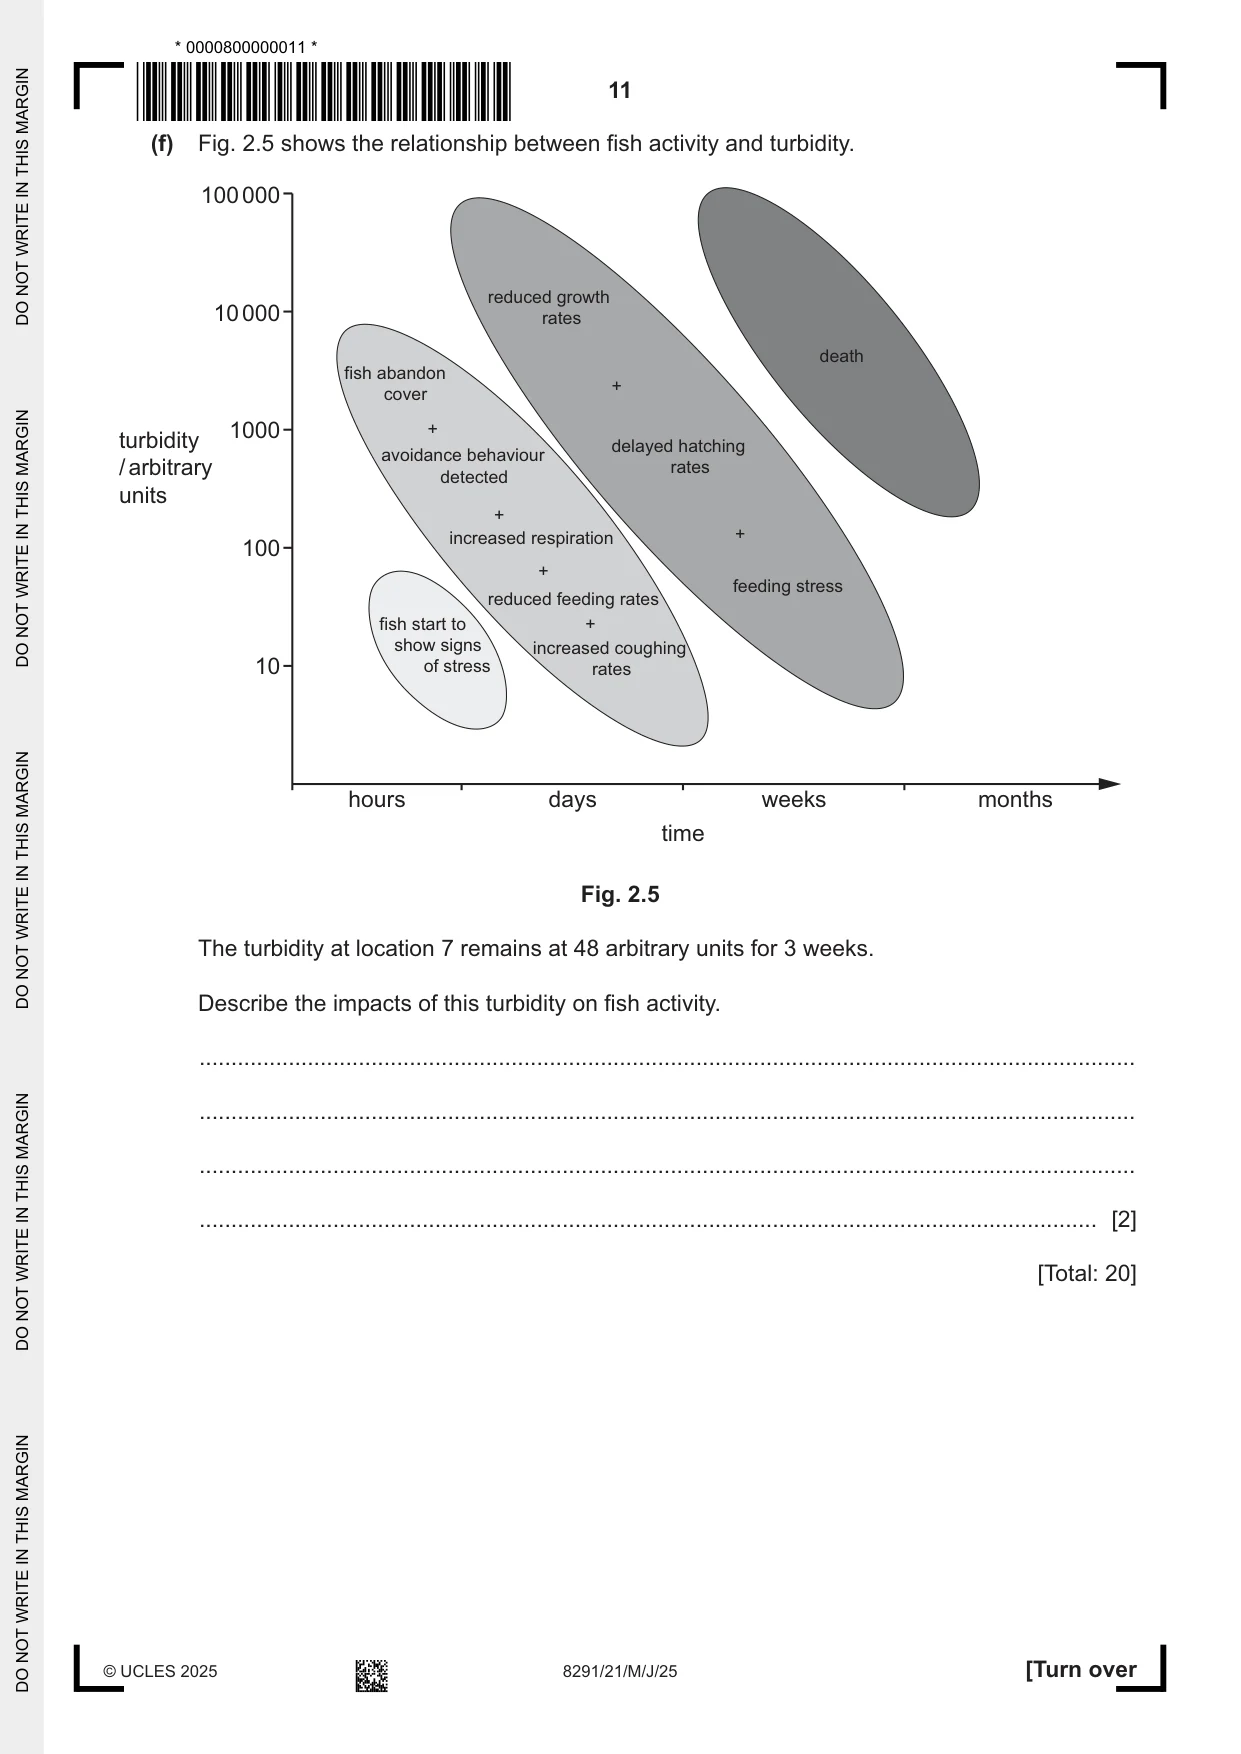
2 Water turbidity measures the cloudiness of water. Turbidity is caused by undissolved solids in water. (a) A student uses a Secchi disc to measure the turbidity of water in four lakes, A, B, C and D. A Secchi disc is a white and black disc. The disc is suspended by a central cord. The cord has markings at 10 cm intervals. Fig. 2.1 shows a Secchi disc in water. water surface cord not to scale Fig. 2.1 The student: • lowers the Secchi disc into the water until the disc is completely invisible (cannot be seen). This depth is recorded as maximum depth. • raises the Secchi disc until the pattern on the disc is just visible. This depth is recorded as minimum depth. • calculates the mean of the maximum and minimum depths and records this as the Secchi depth. Table 2.1 shows the results. Table 2.1 maximum depth minimum depth Secchi depth lake / m / m / m A 3.40 0.20 1.80 B 2.90 0.50 C 5.75 0.30 3.03 D 4.85 0.45 2.65 (i) Calculate the Secchi depth for lake B. Secchi depth for lake B = ......................................................m [1] (ii) Suggest two reasons why it is not suitable to use a Secchi disc in some weather conditions. 1 ........................................................................................................................................ ........................................................................................................................................... 2 ........................................................................................................................................ ........................................................................................................................................... [2] (iii) The student repeats the investigation twice a week for three months. Explain why recording more than one set of maximum and minimum depths per lake is good sampling practice. ........................................................................................................................................... ........................................................................................................................................... ........................................................................................................................................... ..................................................................................................................................... [2] (b) Surface water contains phytoplankton. Phytoplankton are producers. (i) State the source of energy for phytoplankton. ..................................................................................................................................... [1] (ii) Explain why chlorophyll concentration is an indicator of primary production in surface water. ........................................................................................................................................... ........................................................................................................................................... ........................................................................................................................................... ..................................................................................................................................... [2] (c) The student investigates how Secchi depth relates to the concentration of surface water chlorophyll. Fig. 2.2 shows the results. 7 6 5 Secchi 4 depth / m 3 2 1 0 1 2 5 10 20 50 100 surface water chlorophyll concentration / arbitrary units Fig. 2.2 Write a suitable conclusion from the data in Fig. 2.2. ................................................................................................................................................... ................................................................................................................................................... ............................................................................................................................................. [1] (d) The ‘Secchi Disk Study’ is a crowd sourced investigation into global phytoplankton populations. In the study, people submit Secchi depths from oceans around the world and upload the data to a website. Fig. 2.3 shows the location of the crowd sourced sampling sites up to May 2022. Key sampling site N North Atlantic Ocean North Pacific Ocean South South Atlantic Pacific Indian Ocean Ocean Ocean Fig. 2.3 (i) Outline the benefits and limitations of obtaining scientific data by crowd sourcing. benefits .............................................................................................................................. ........................................................................................................................................... ........................................................................................................................................... ........................................................................................................................................... limitations .......................................................................................................................... ........................................................................................................................................... ........................................................................................................................................... ........................................................................................................................................... [4] (ii) Suggest how climate change could decrease phytoplankton populations. Give reasons for your answer. ........................................................................................................................................... ........................................................................................................................................... ........................................................................................................................................... ........................................................................................................................................... ........................................................................................................................................... ..................................................................................................................................... [3] (e) An electronic hand-held meter is used to measure turbidity at 70 locations along the length of a river. Fig. 2.4 shows the results. 60 50 40 turbidity / arbitrary 30 units 20 10 0 0 10 20 30 40 50 60 70 location number Fig. 2.4 (i) State which location has the greatest turbidity. location number = ......................................................... [1] (ii) State the turbidity at location 41. turbidity = .................................. arbitrary units [1] (f) Fig. 2.5 shows the relationship between fish activity and turbidity. 100 000 reduced growth 10 000 rates death fish abandon + cover 1000 + turbidity delayed hatching avoidance behaviour / arbitrary rates detected units + increased respiration + 100 + feeding stress reduced feeding rates fish start to + show signs increased coughing 10 of stress rates hours days weeks months time Fig. 2.5 The turbidity at location 7 remains at 48 arbitrary units for 3 weeks. Describe the impacts of this turbidity on fish activity. ................................................................................................................................................... ................................................................................................................................................... ................................................................................................................................................... ............................................................................................................................................. [2] [Total: 20]
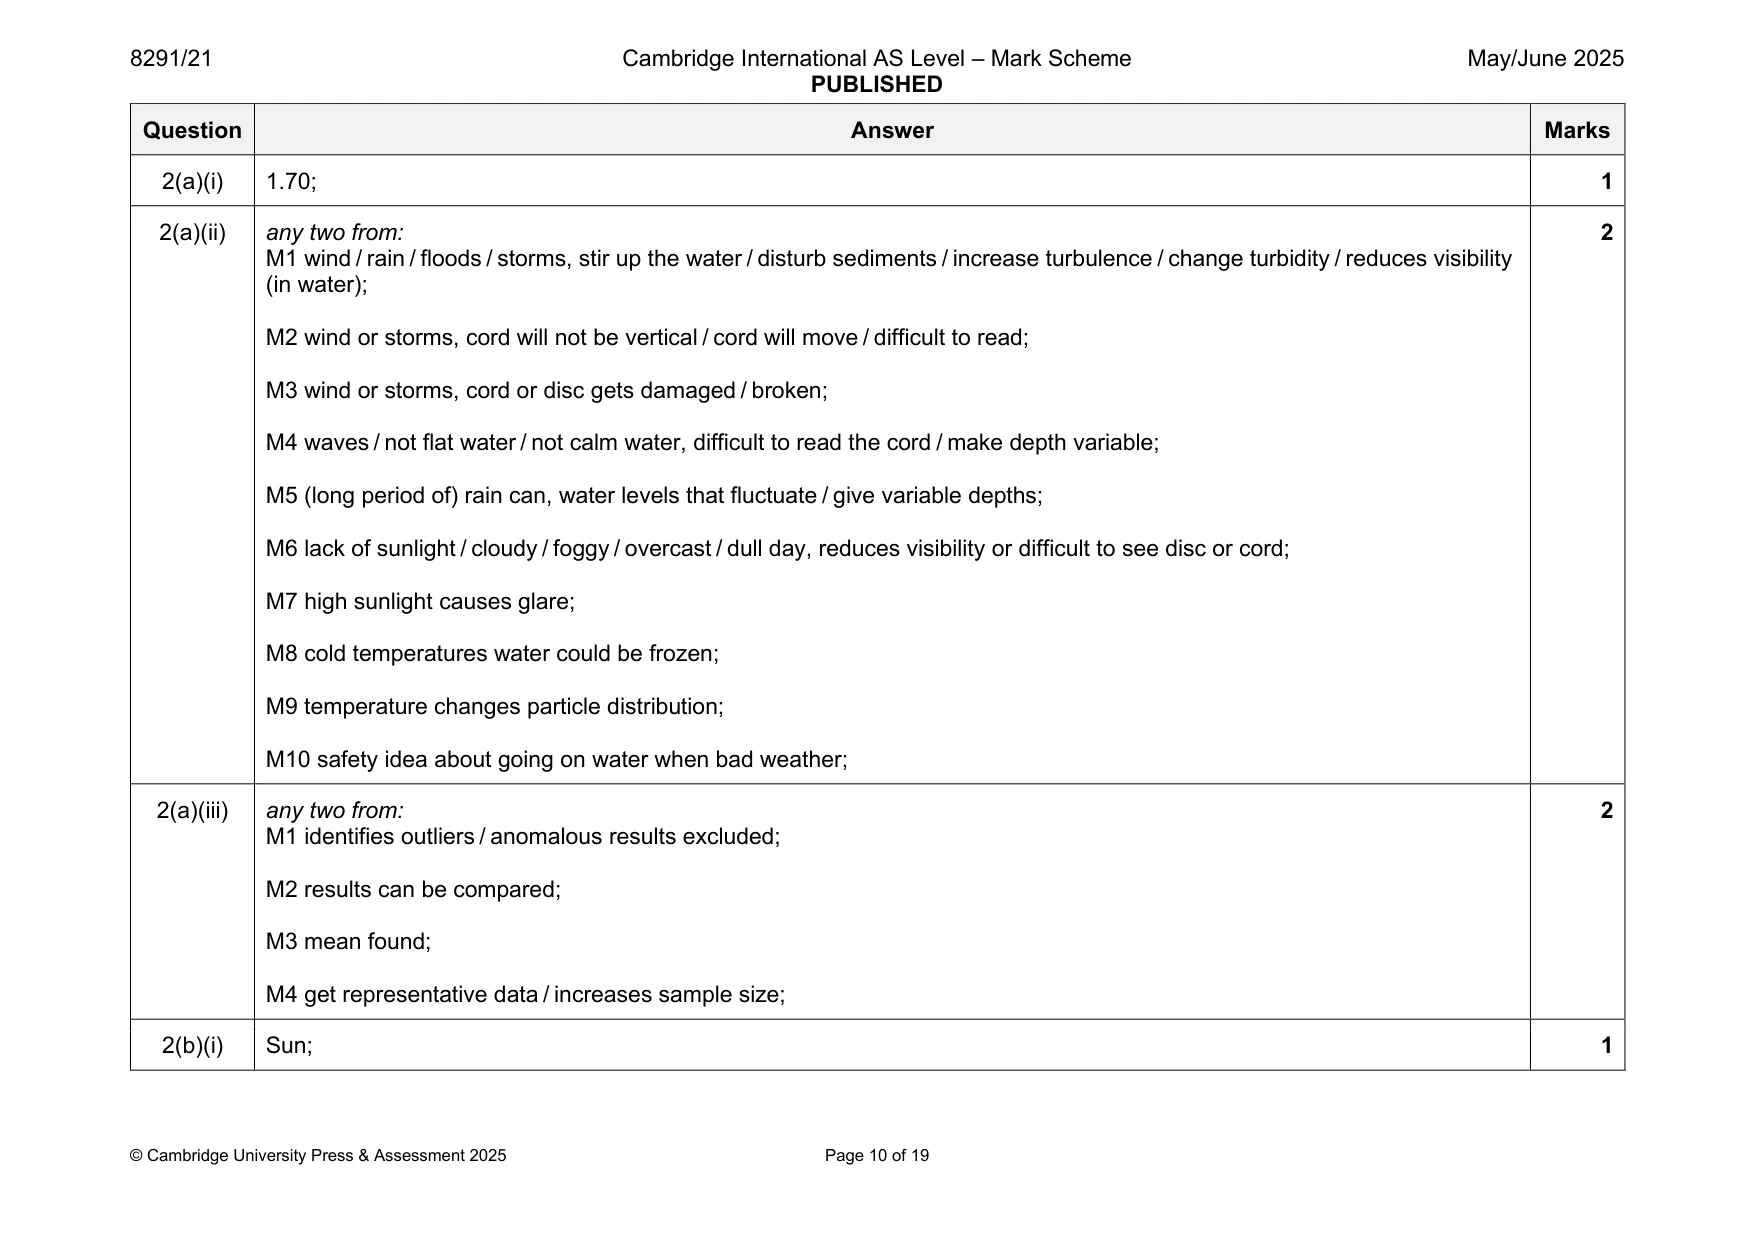
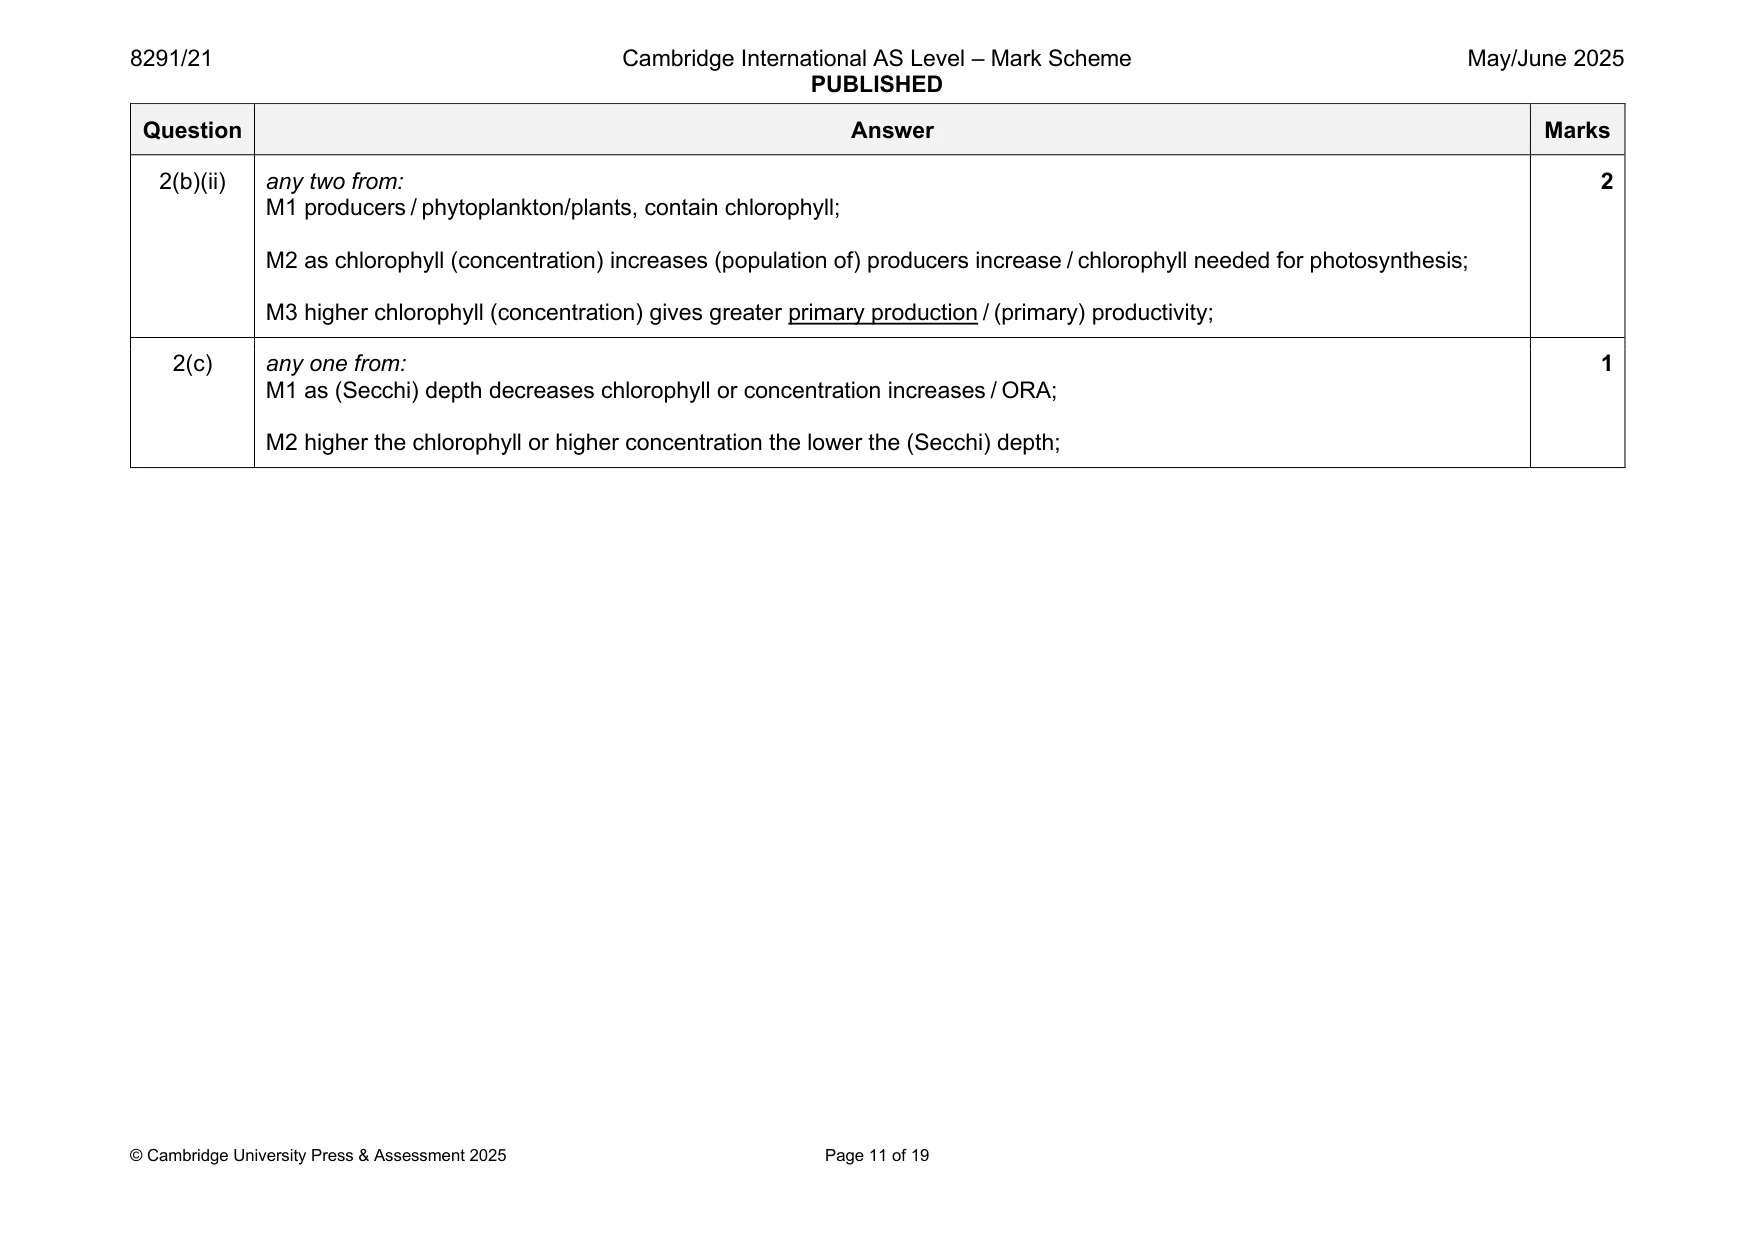
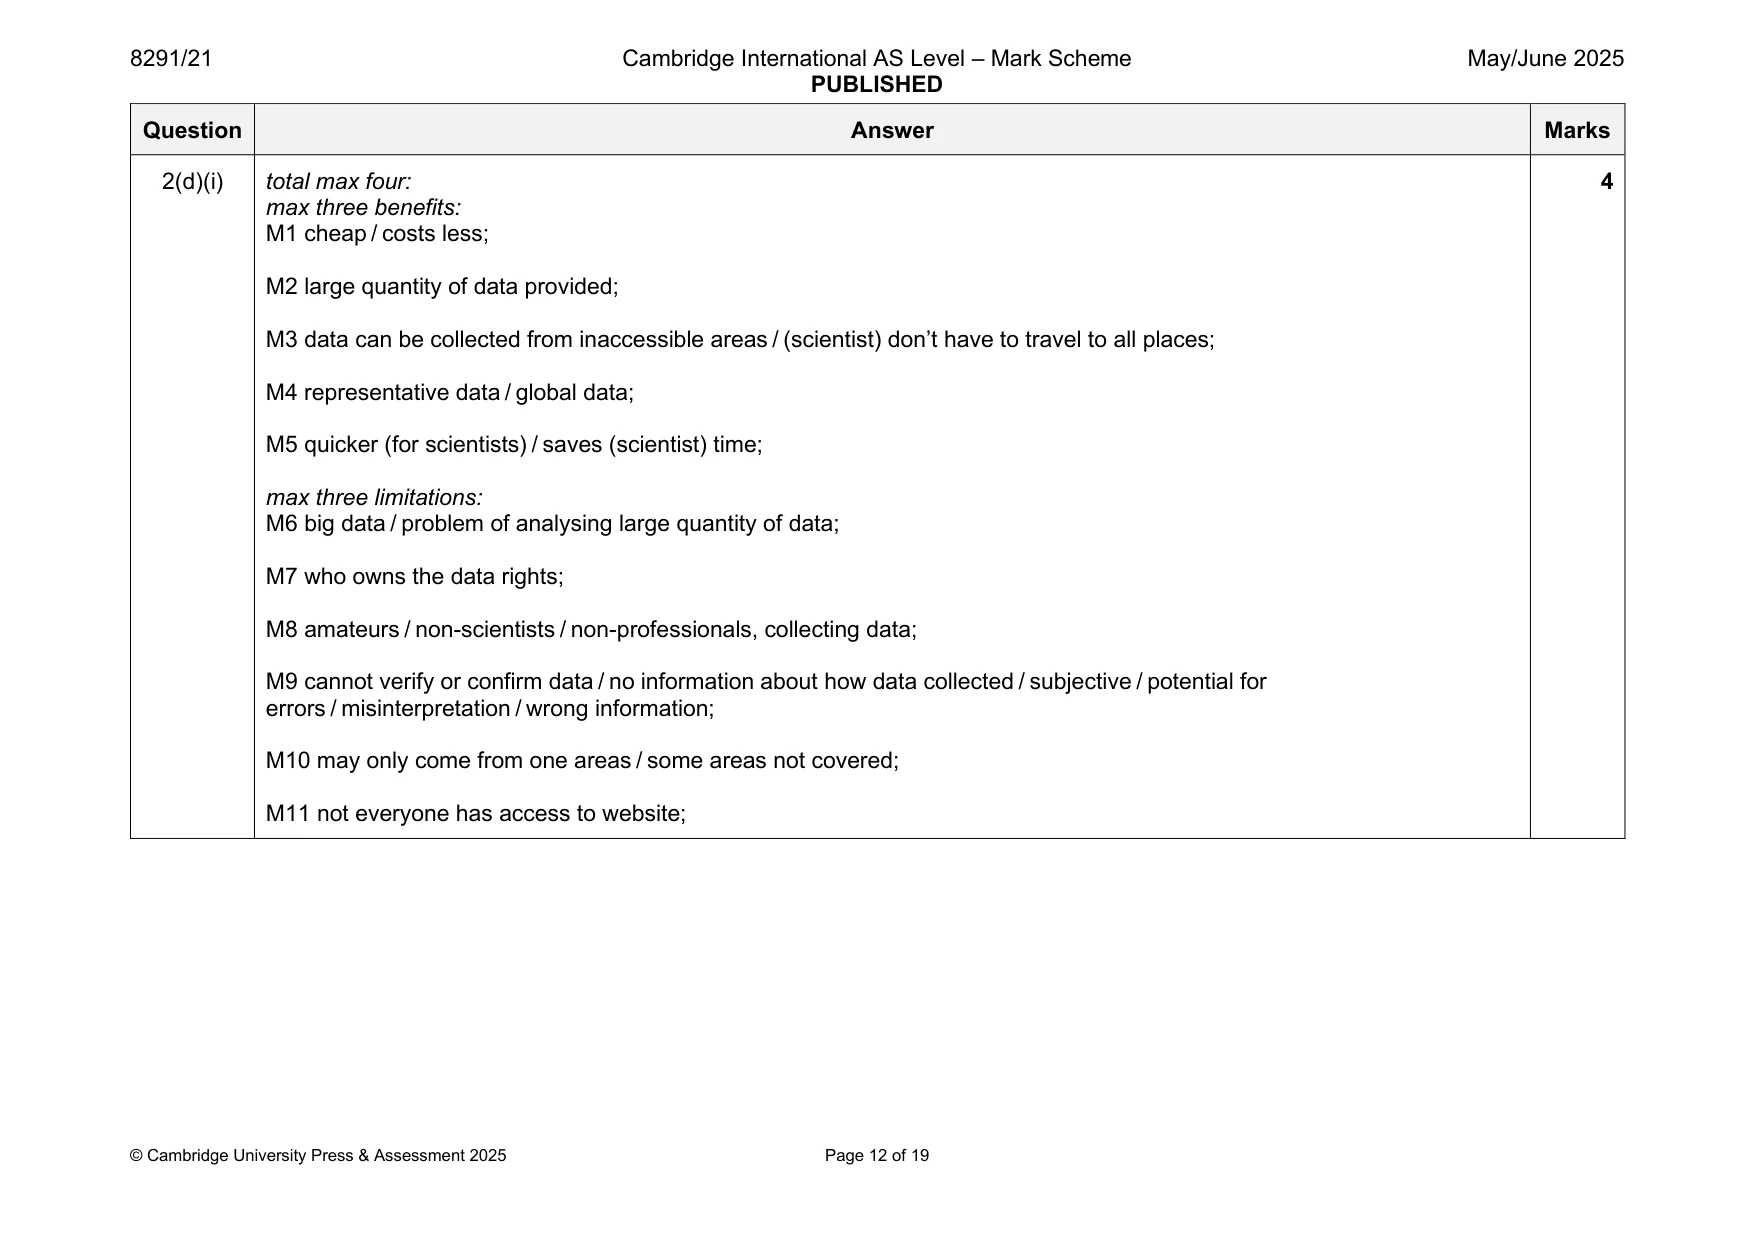
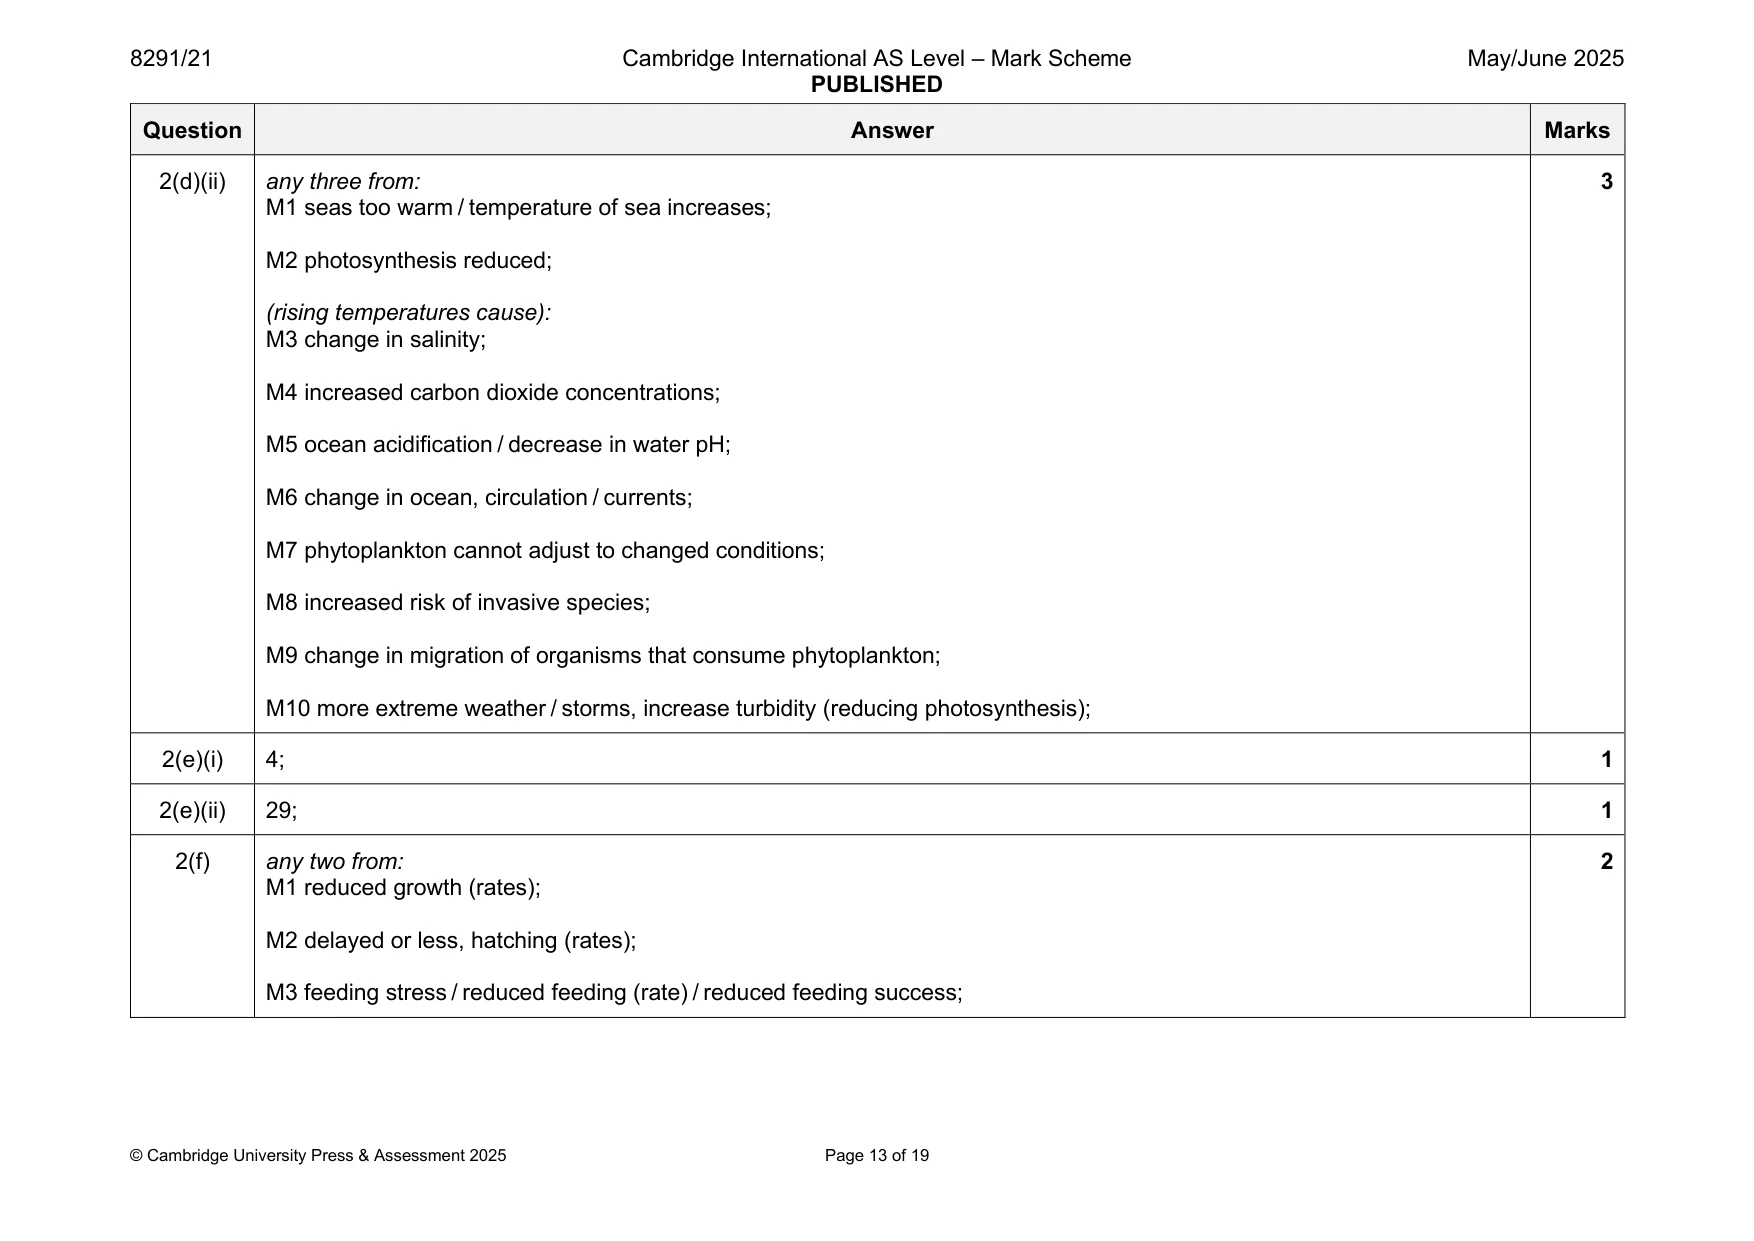
Mark scheme: 2(a)(i) 1.70; 1 2(a)(ii) any two from: 2 M1 wind / rain / floods / storms, stir up the water / disturb sediments / increase turbulence / change turbidity / reduces visibility (in water); M2 wind or storms, cord will not be vertical / cord will move / difficult to read; M3 wind or storms, cord or disc gets damaged / broken; M4 waves / not flat water / not calm water, difficult to read the cord / make depth variable; M5 (long period of) rain can, water levels that fluctuate / give variable depths; M6 lack of sunlight / cloudy / foggy / overcast / dull day, reduces visibility or difficult to see disc or cord; M7 high sunlight causes glare; M8 cold temperatures water could be frozen; M9 temperature changes particle distribution; M10 safety idea about going on water when bad weather; 2(a)(iii) any two from: 2 M1 identifies outliers / anomalous results excluded; M2 results can be compared; M3 mean found; M4 get representative data / increases sample size; 2(b)(i) Sun; 1 2(b)(ii) any two from: 2 M1 producers / phytoplankton/plants, contain chlorophyll; M2 as chlorophyll (concentration) increases (population of) producers increase / chlorophyll needed for photosynthesis; M3 higher chlorophyll (concentration) gives greater primary production / (primary) productivity; 2(c) any one from: 1 M1 as (Secchi) depth decreases chlorophyll or concentration increases / ORA; M2 higher the chlorophyll or higher concentration the lower the (Secchi) depth; 2(d)(i) total max four: 4 max three benefits: M1 cheap / costs less; M2 large quantity of data provided; M3 data can be collected from inaccessible areas / (scientist) don’t have to travel to all places; M4 representative data / global data; M5 quicker (for scientists) / saves (scientist) time; max three limitations: M6 big data / problem of analysing large quantity of data; M7 who owns the data rights; M8 amateurs / non-scientists / non-professionals, collecting data; M9 cannot verify or confirm data / no information about how data collected / subjective / potential for errors / misinterpretation / wrong information; M10 may only come from one areas / some areas not covered; M11 not everyone has access to website; 2(d)(ii) any three from: 3 M1 seas too warm / temperature of sea increases; M2 photosynthesis reduced; (rising temperatures cause): M3 change in salinity; M4 increased carbon dioxide concentrations; M5 ocean acidification / decrease in water pH; M6 change in ocean, circulation / currents; M7 phytoplankton cannot adjust to changed conditions; M8 increased risk of invasive species; M9 change in migration of organisms that consume phytoplankton; M10 more extreme weather / storms, increase turbidity (reducing photosynthesis); 2(e)(i) 4; 1 2(e)(ii) 29; 1 2(f) any two from: 2 M1 reduced growth (rates); M2 delayed or less, hatching (rates); M3 feeding stress / reduced feeding (rate) / reduced feeding success;
Q3 · Chlorofluorocarbons (CFCs) from aerosols and refrigerants cause ozone depletion
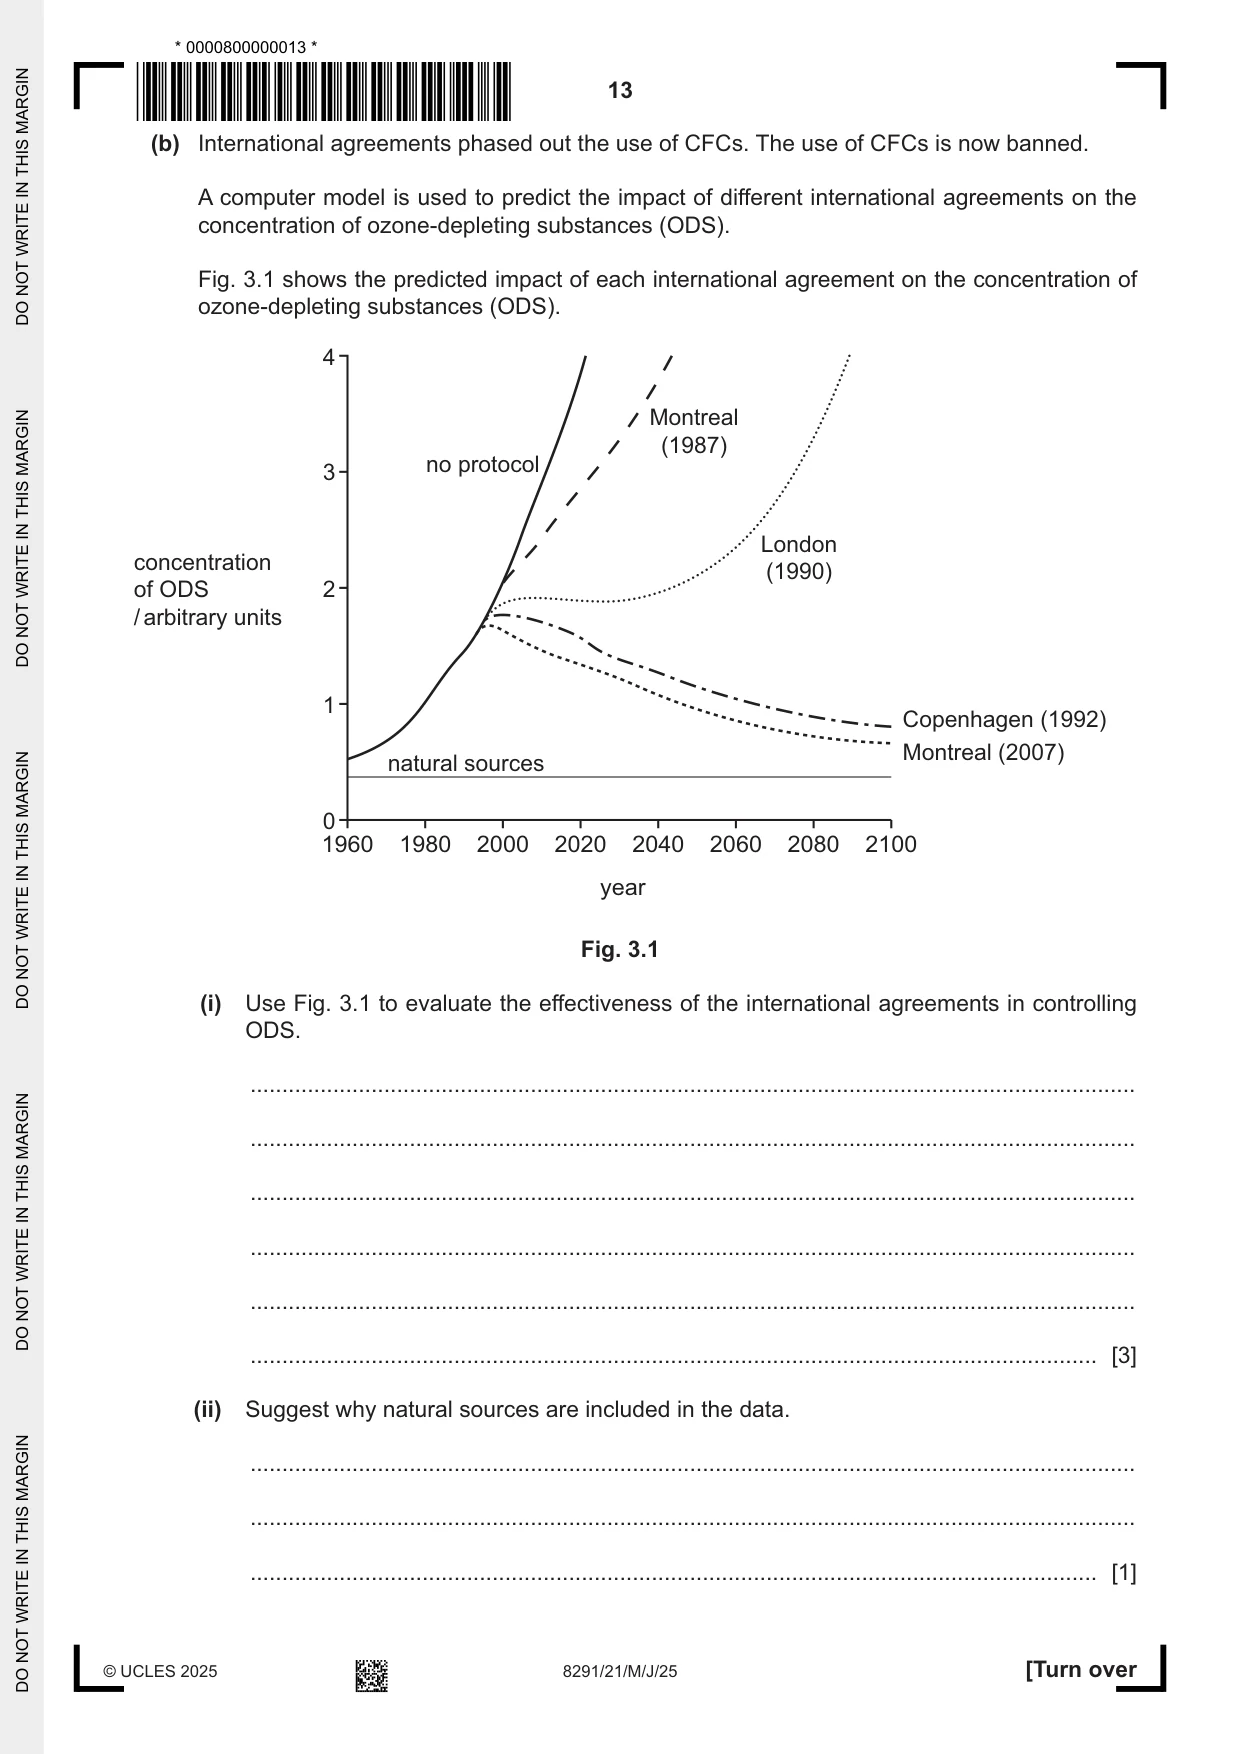
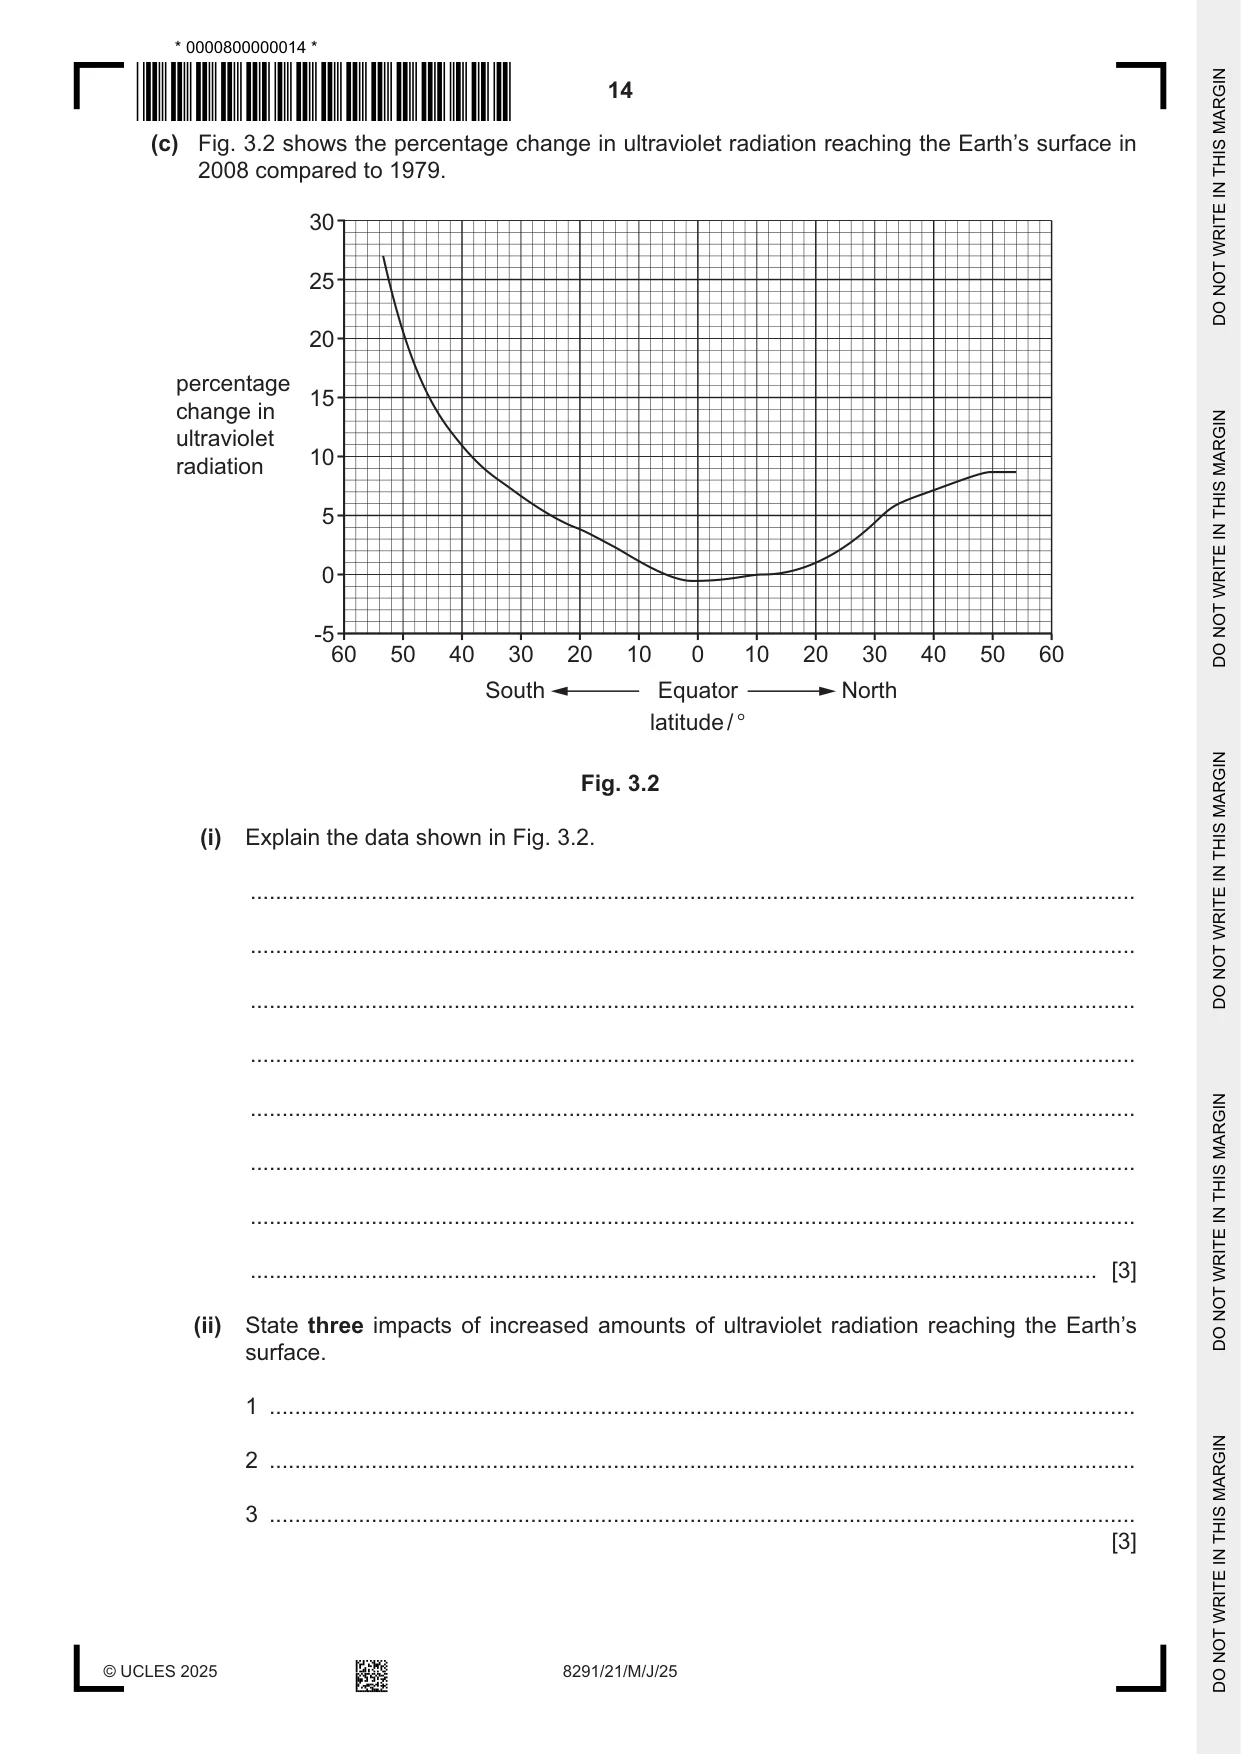
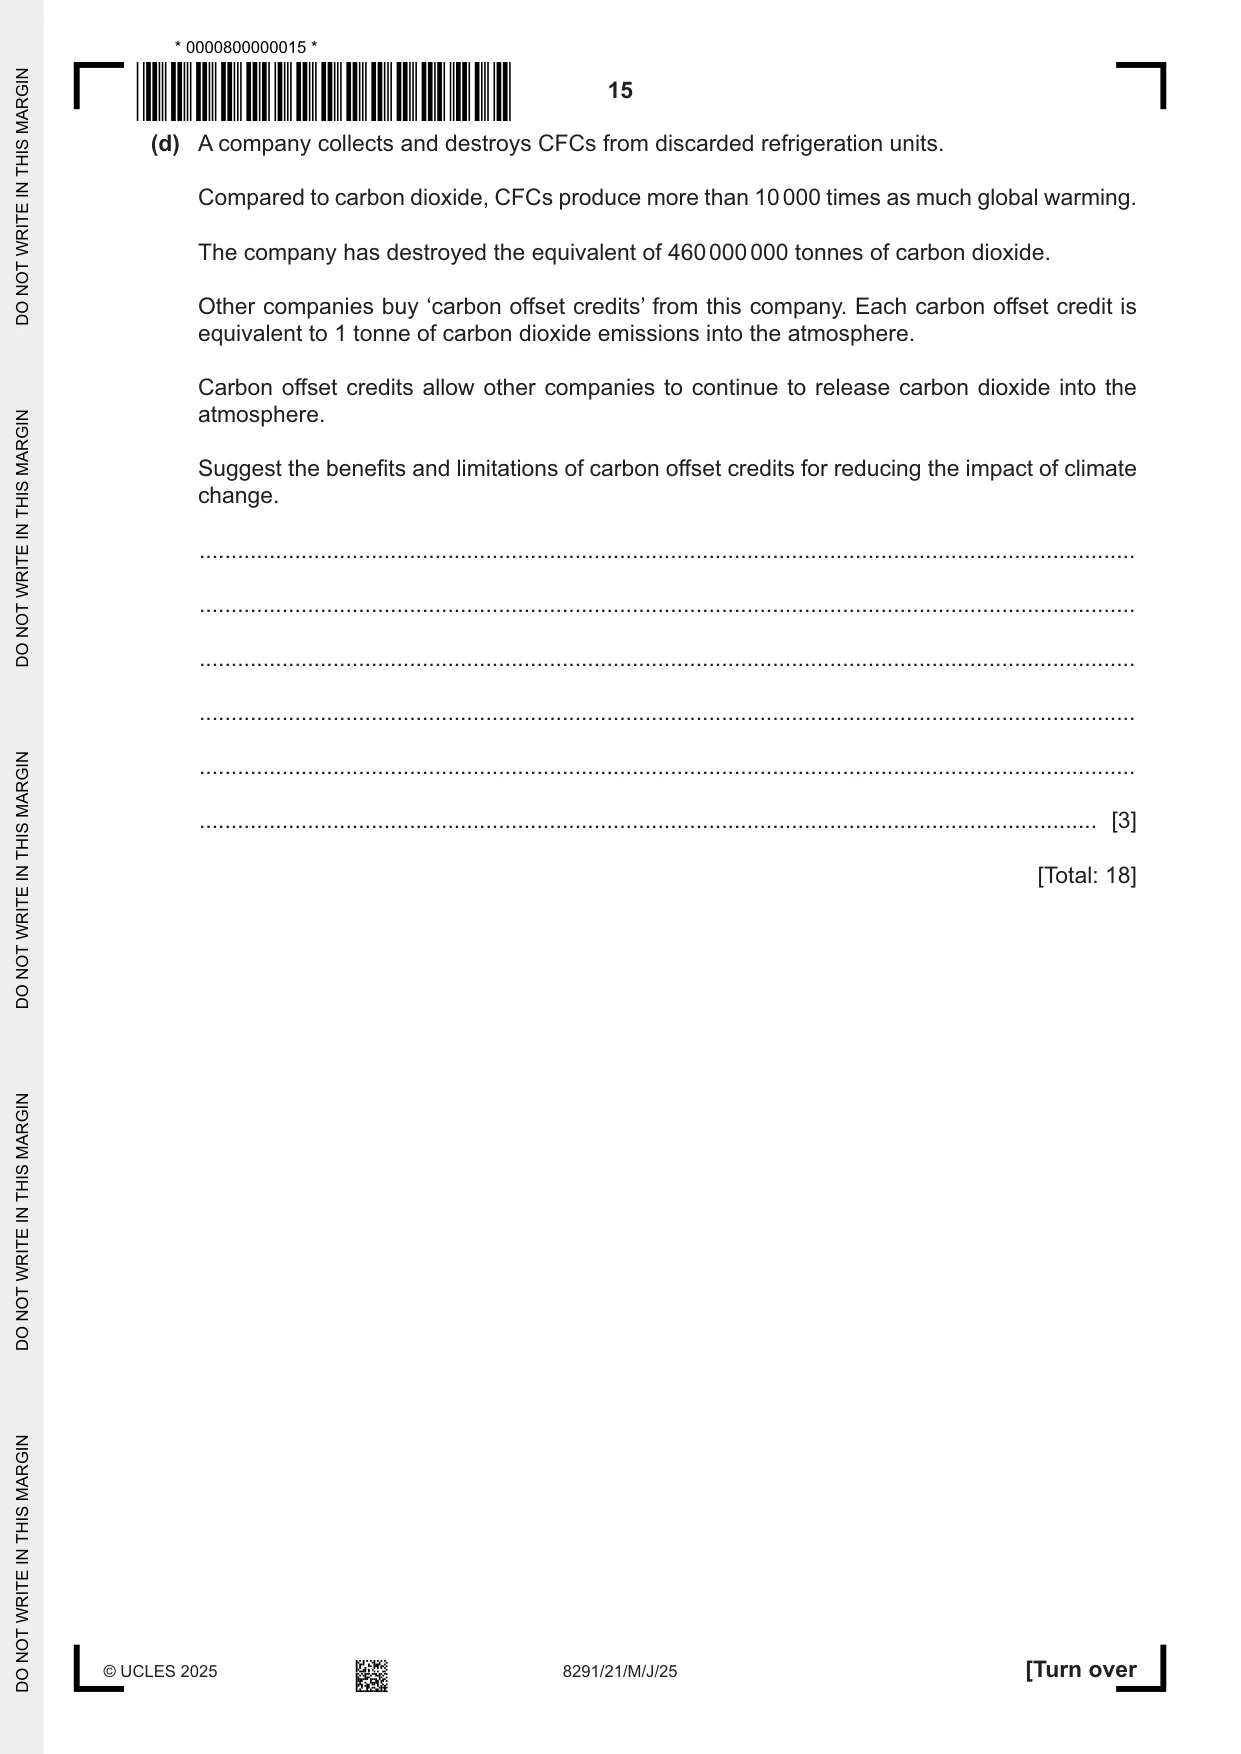
3 (a) Chlorofluorocarbons (CFCs) from aerosols and refrigerants cause ozone depletion. (i) State the layer of the atmosphere which contains the ozone layer. ..................................................................................................................................... [1] (ii) Outline how ozone depletion occurs. ........................................................................................................................................... ........................................................................................................................................... ........................................................................................................................................... ........................................................................................................................................... ........................................................................................................................................... ........................................................................................................................................... ........................................................................................................................................... ..................................................................................................................................... [4] (b) International agreements phased out the use of CFCs. The use of CFCs is now banned. A computer model is used to predict the impact of different international agreements on the concentration of ozone-depleting substances (ODS). Fig. 3.1 shows the predicted impact of each international agreement on the concentration of ozone-depleting substances (ODS). 4 Montreal (1987) no protocol 3 London concentration (1990) of ODS 2 / arbitrary units 1 Copenhagen (1992) Montreal (2007) natural sources 0 1960 1980 2000 2020 2040 2060 2080 2100 year Fig. 3.1 (i) Use Fig. 3.1 to evaluate the effectiveness of the international agreements in controlling ODS. ........................................................................................................................................... ........................................................................................................................................... ........................................................................................................................................... ........................................................................................................................................... ........................................................................................................................................... ..................................................................................................................................... [3] (ii) Suggest why natural sources are included in the data. ........................................................................................................................................... ........................................................................................................................................... ..................................................................................................................................... [1] (c) Fig. 3.2 shows the percentage change in ultraviolet radiation reaching the Earth’s surface in 2008 compared to 1979. 30 25 20 percentage 15 change in ultraviolet 10 radiation 5 0 -5 60 50 40 30 20 10 0 10 20 30 40 50 60 South Equator North latitude / ° Fig. 3.2 (i) Explain the data shown in Fig. 3.2. ........................................................................................................................................... ........................................................................................................................................... ........................................................................................................................................... ........................................................................................................................................... ........................................................................................................................................... ........................................................................................................................................... ........................................................................................................................................... ..................................................................................................................................... [3] (ii) State three impacts of increased amounts of ultraviolet radiation reaching the Earth’s surface. 1 ........................................................................................................................................ 2 ........................................................................................................................................ 3 ........................................................................................................................................ [3] (d) A company collects and destroys CFCs from discarded refrigeration units. Compared to carbon dioxide, CFCs produce more than 10 000 times as much global warming. The company has destroyed the equivalent of 460 000 000 tonnes of carbon dioxide. Other companies buy ‘carbon offset credits’ from this company. Each carbon offset credit is equivalent to 1 tonne of carbon dioxide emissions into the atmosphere. Carbon offset credits allow other companies to continue to release carbon dioxide into the atmosphere. Suggest the benefits and limitations of carbon offset credits for reducing the impact of climate change. ................................................................................................................................................... ................................................................................................................................................... ................................................................................................................................................... ................................................................................................................................................... ................................................................................................................................................... ............................................................................................................................................. [3] [Total: 18]
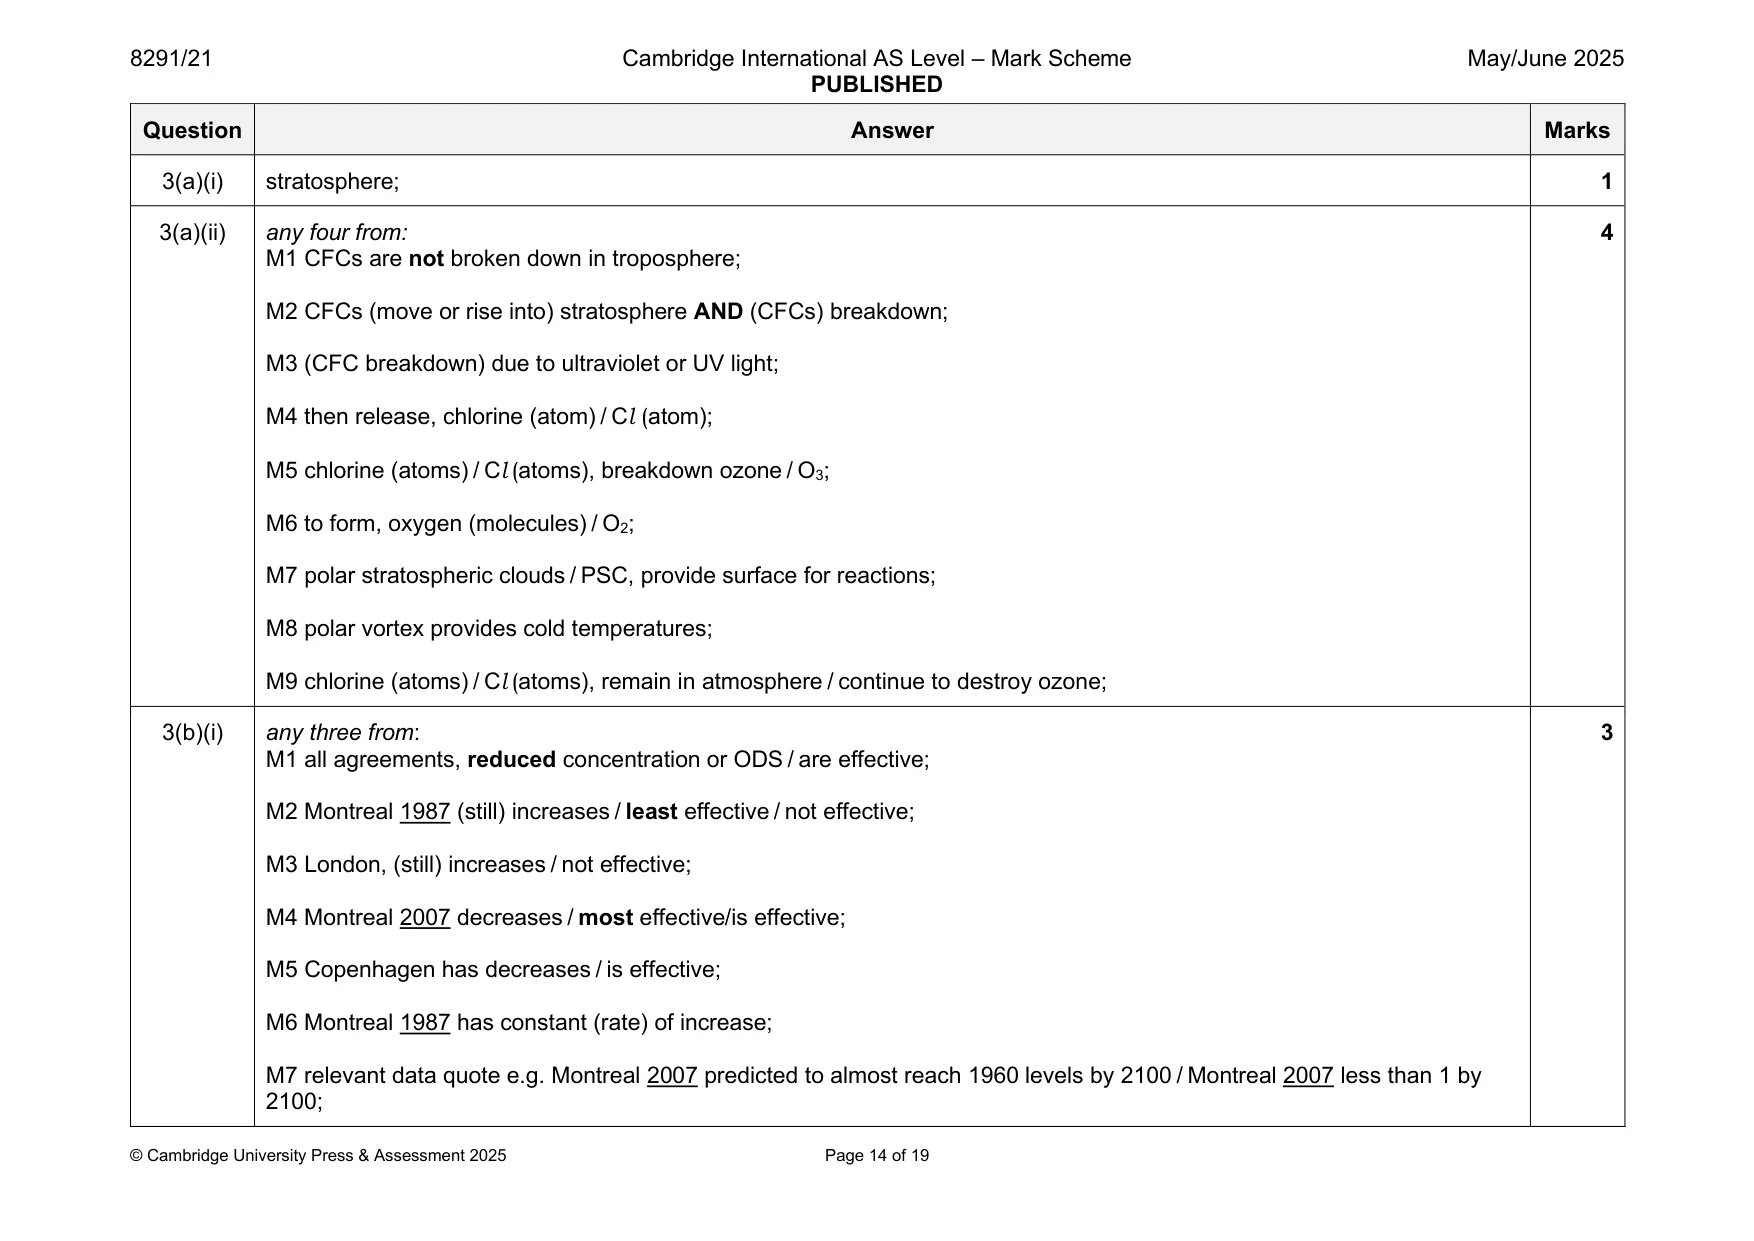
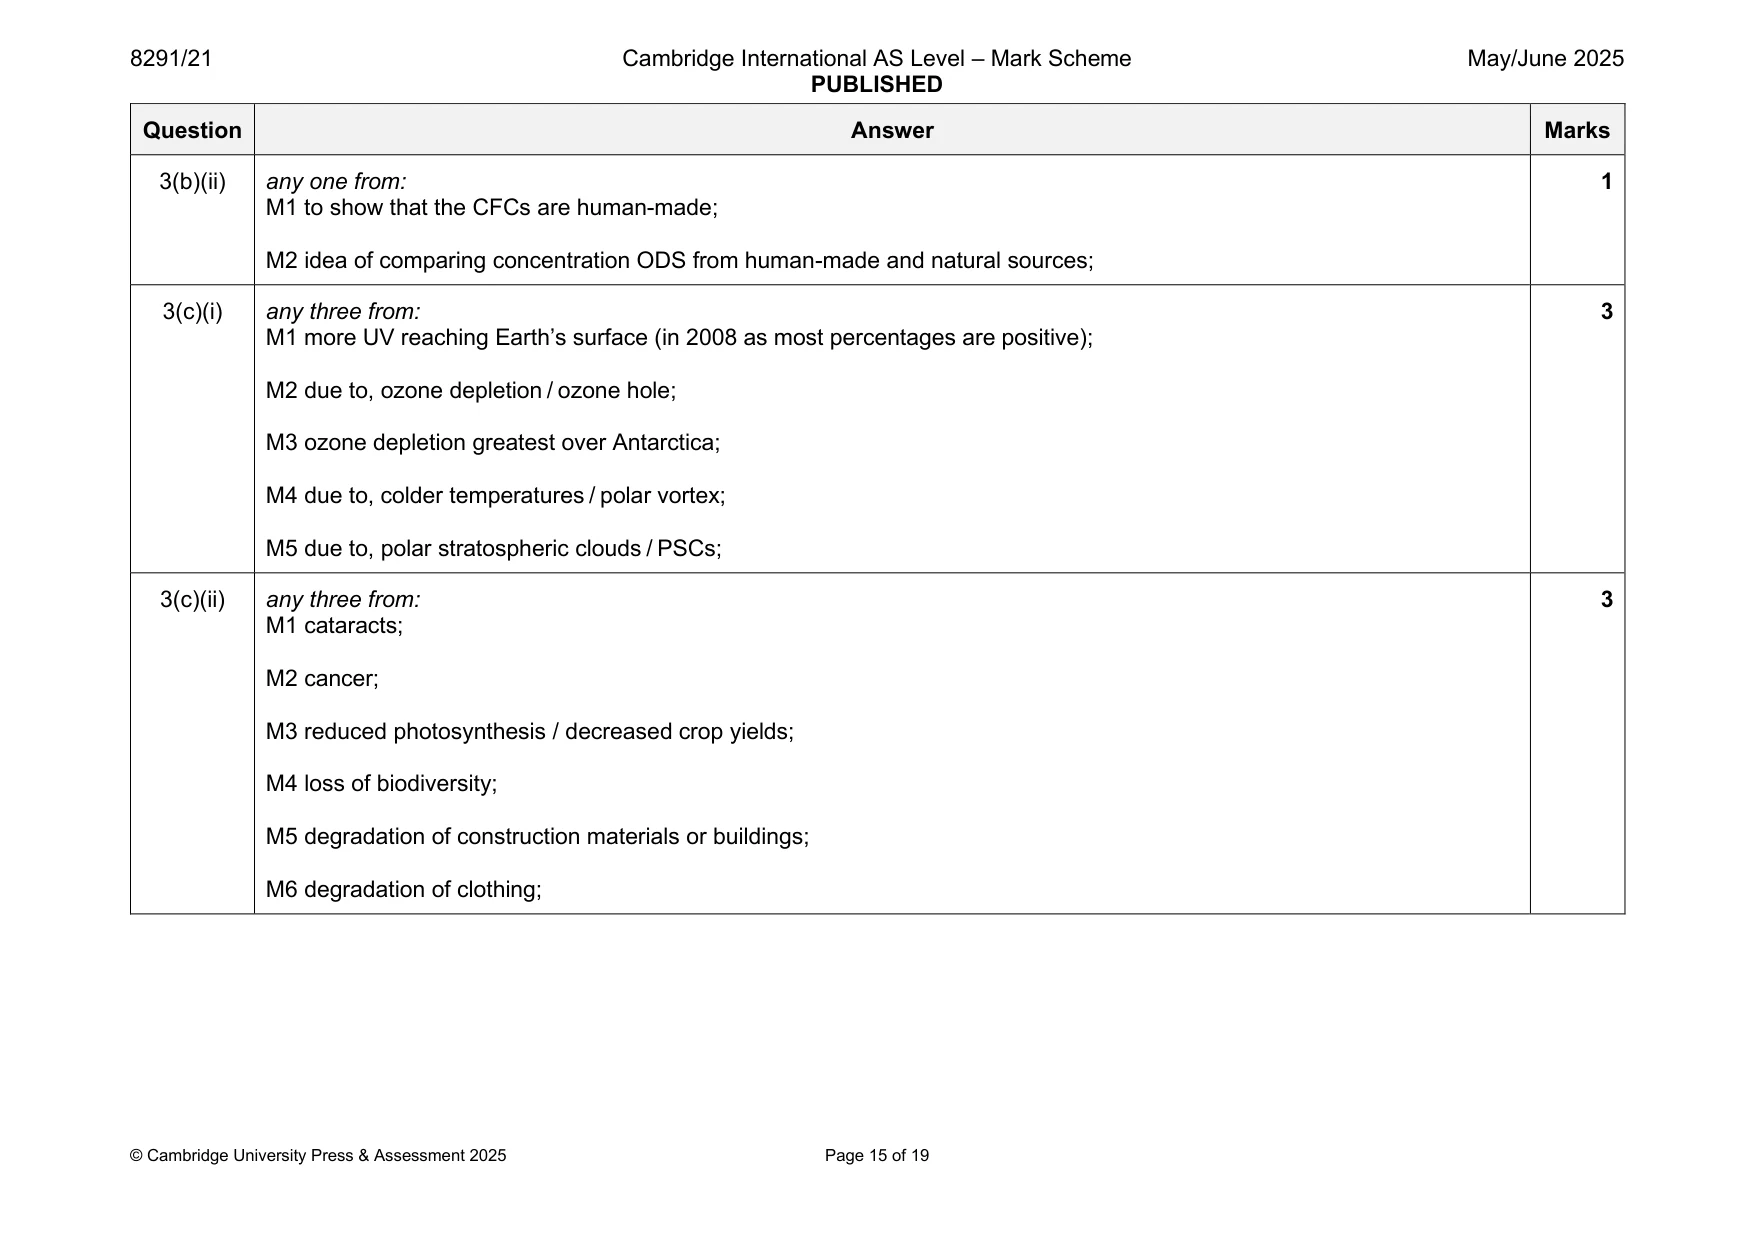
Mark scheme: 3(a)(i) stratosphere; 1 3(a)(ii) any four from: 4 M1 CFCs are not broken down in troposphere; M2 CFCs (move or rise into) stratosphere AND (CFCs) breakdown; M3 (CFC breakdown) due to ultraviolet or UV light; M4 then release, chlorine (atom) / Cl (atom); M5 chlorine (atoms) / Cl (atoms), breakdown ozone / O3; M6 to form, oxygen (molecules) / O2; M7 polar stratospheric clouds / PSC, provide surface for reactions; M8 polar vortex provides cold temperatures; M9 chlorine (atoms) / Cl (atoms), remain in atmosphere / continue to destroy ozone; 3(b)(i) any three from: 3 M1 all agreements, reduced concentration or ODS / are effective; M2 Montreal 1987 (still) increases / least effective / not effective; M3 London, (still) increases / not effective; M4 Montreal 2007 decreases / most effective/is effective; M5 Copenhagen has decreases / is effective; M6 Montreal 1987 has constant (rate) of increase; M7 relevant data quote e.g. Montreal 2007 predicted to almost reach 1960 levels by 2100 / Montreal 2007 less than 1 by 2100; 3(b)(ii) any one from: 1 M1 to show that the CFCs are human-made; M2 idea of comparing concentration ODS from human-made and natural sources; 3(c)(i) any three from: 3 M1 more UV reaching Earth’s surface (in 2008 as most percentages are positive); M2 due to, ozone depletion / ozone hole; M3 ozone depletion greatest over Antarctica; M4 due to, colder temperatures / polar vortex; M5 due to, polar stratospheric clouds / PSCs; 3(c)(ii) any three from: 3 M1 cataracts; M2 cancer; M3 reduced photosynthesis / decreased crop yields; M4 loss of biodiversity; M5 degradation of construction materials or buildings; M6 degradation of clothing; 3(d) total max 3 marks 3 max two benefits: M1 less greenhouse gases released (into atmosphere); M2 less global warming; M3 stated example of climate change impact reduction e.g. less sea level rise; any two limitations: M4 CO2 still being released / does not encourage other companies to reduce their own emissions / companies continue to pollute; M5 (company selling may) limit how many carbon credits can be purchased;
Q4 · Biochar is added to soil to improve soil structure
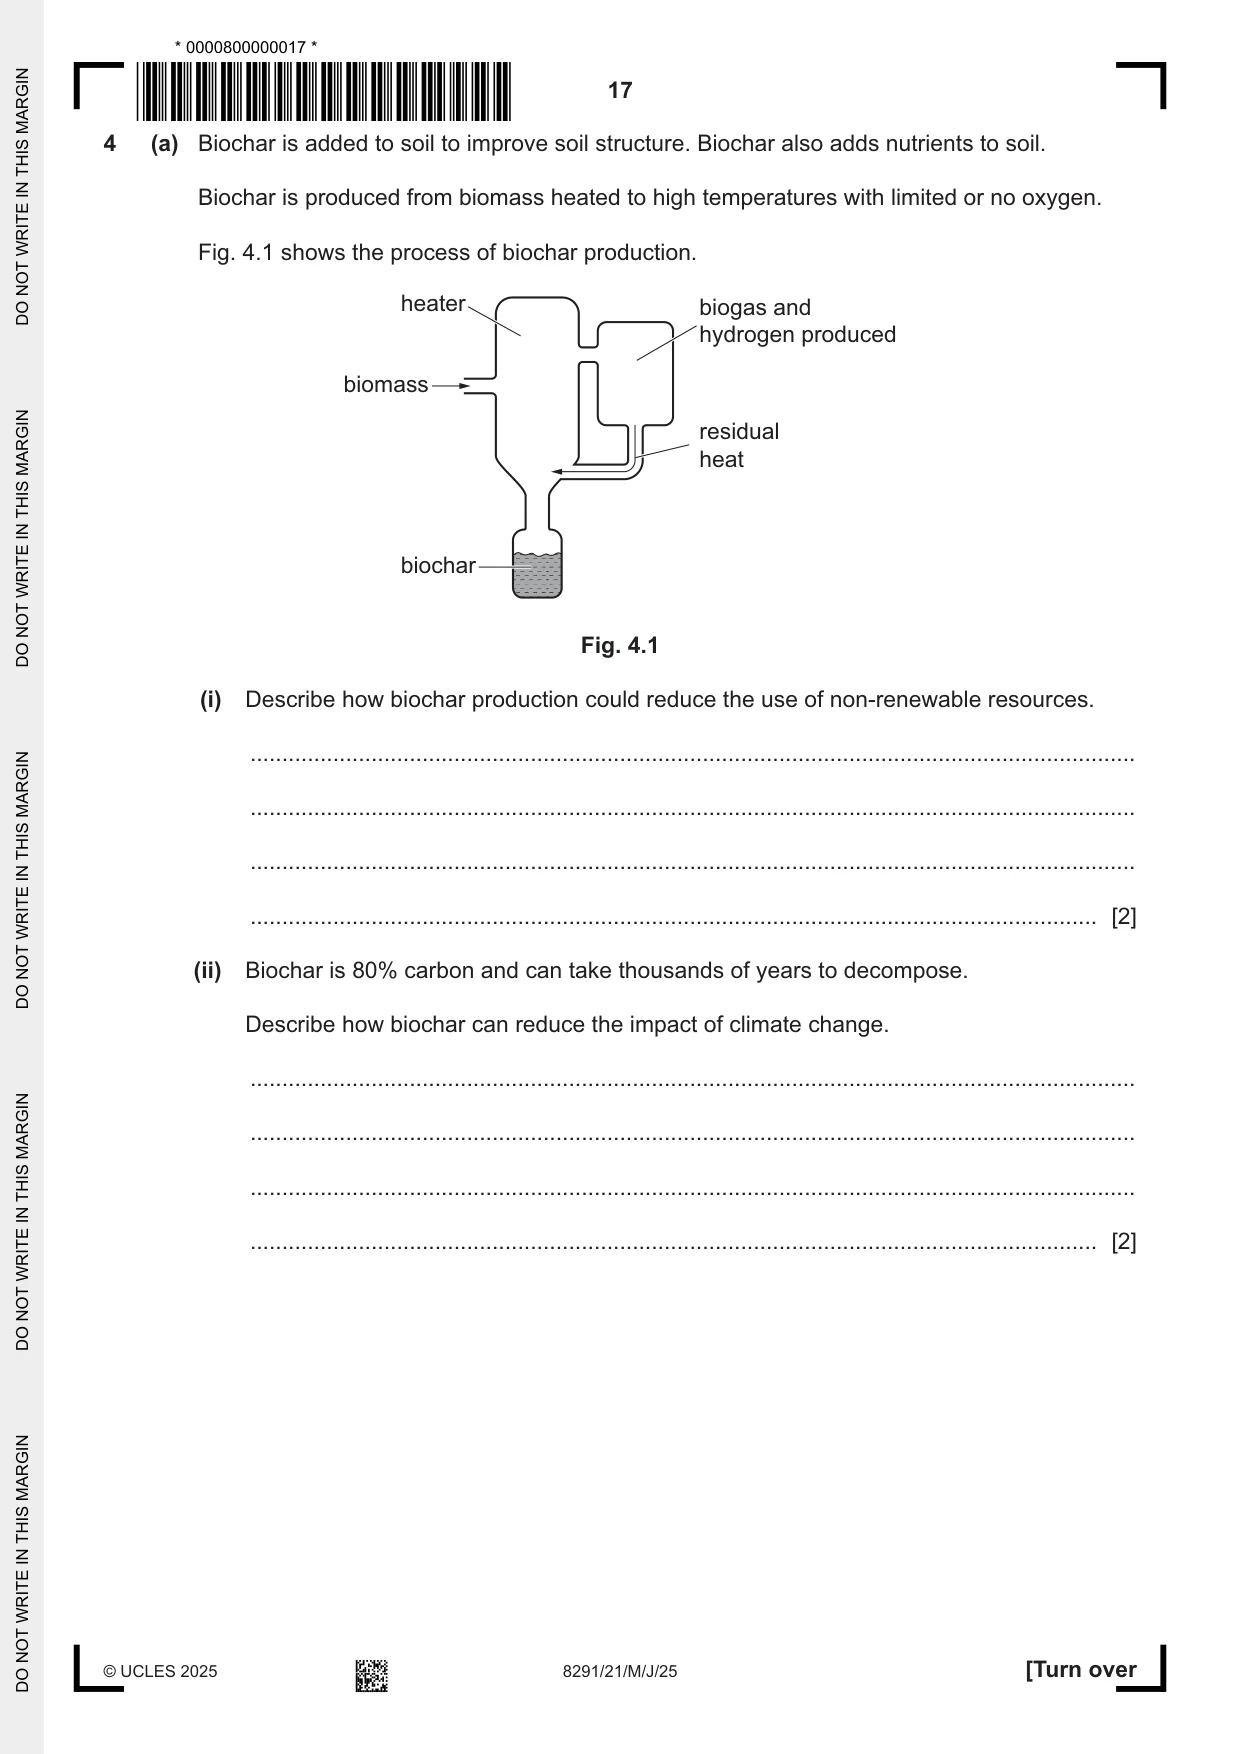
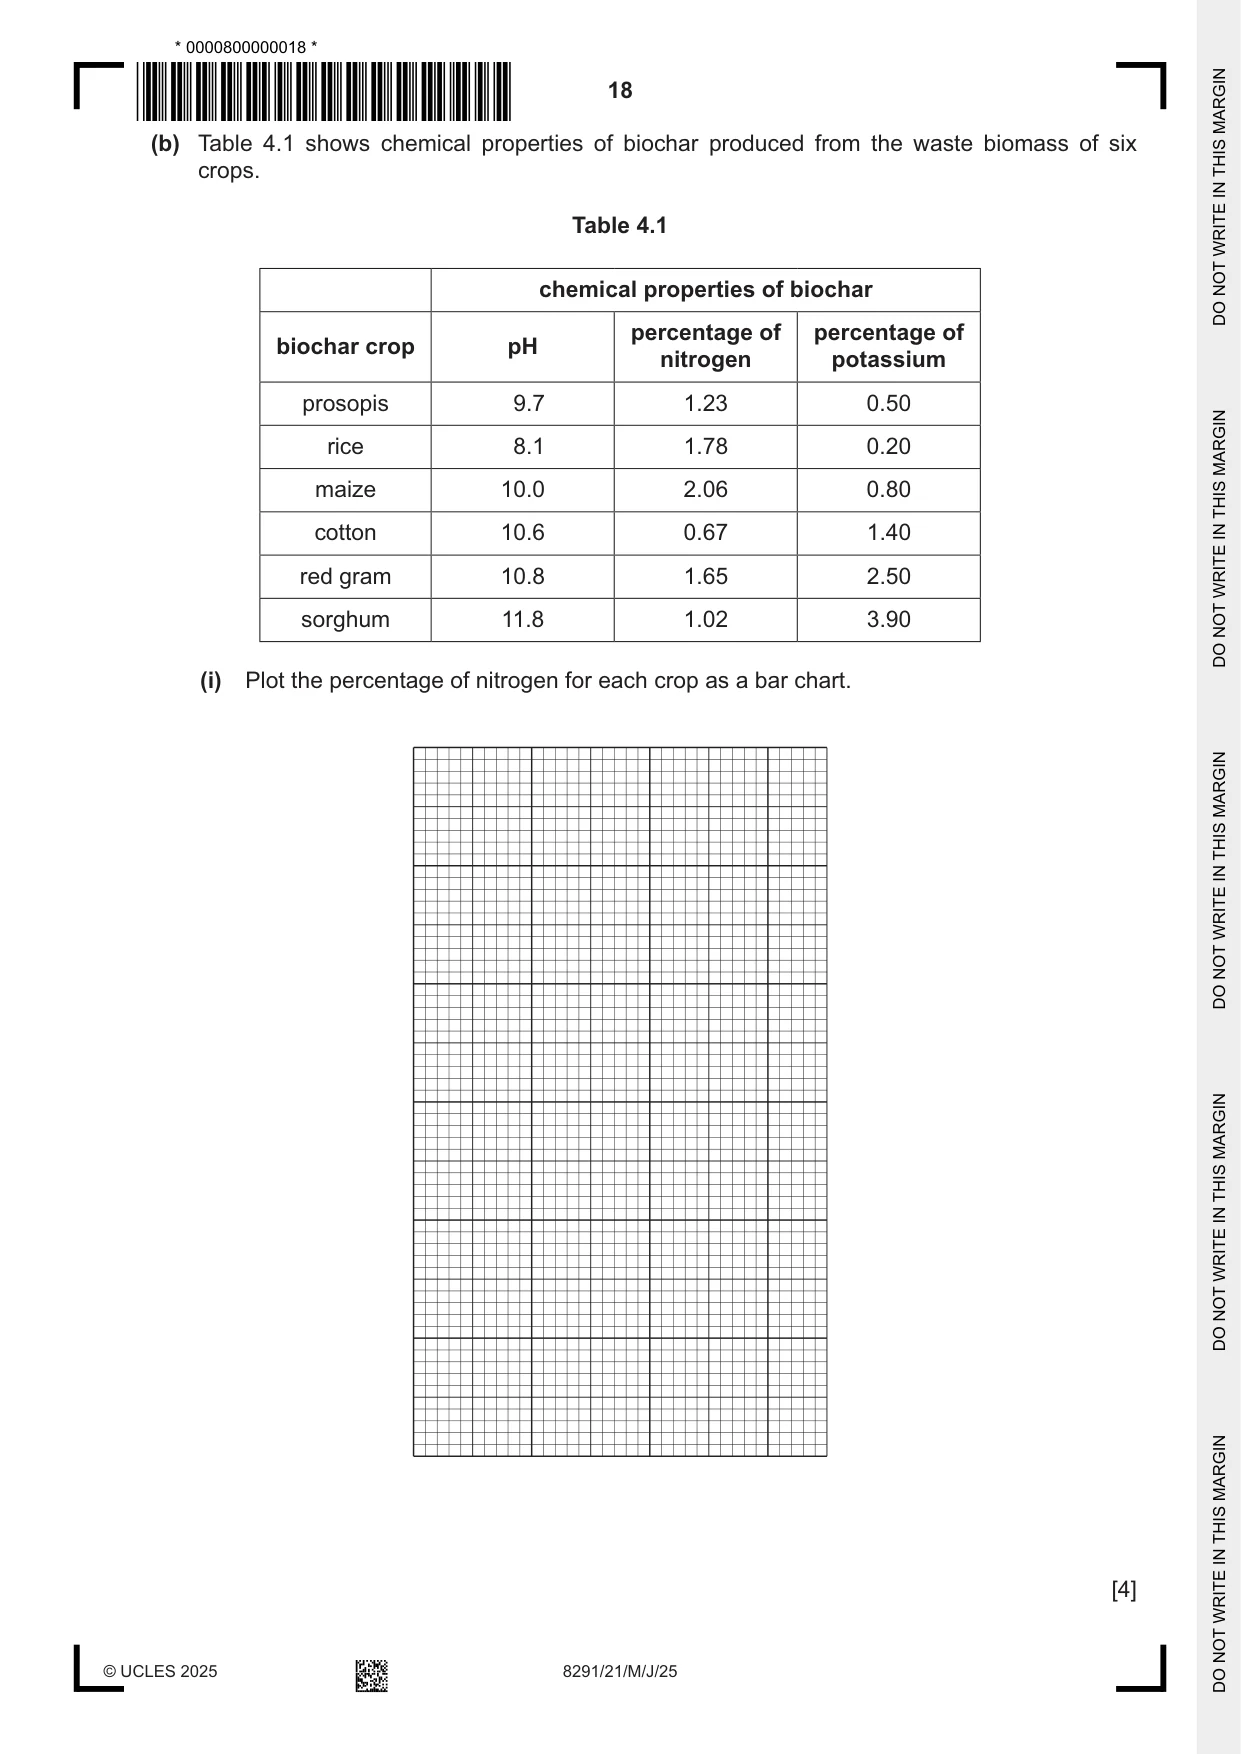
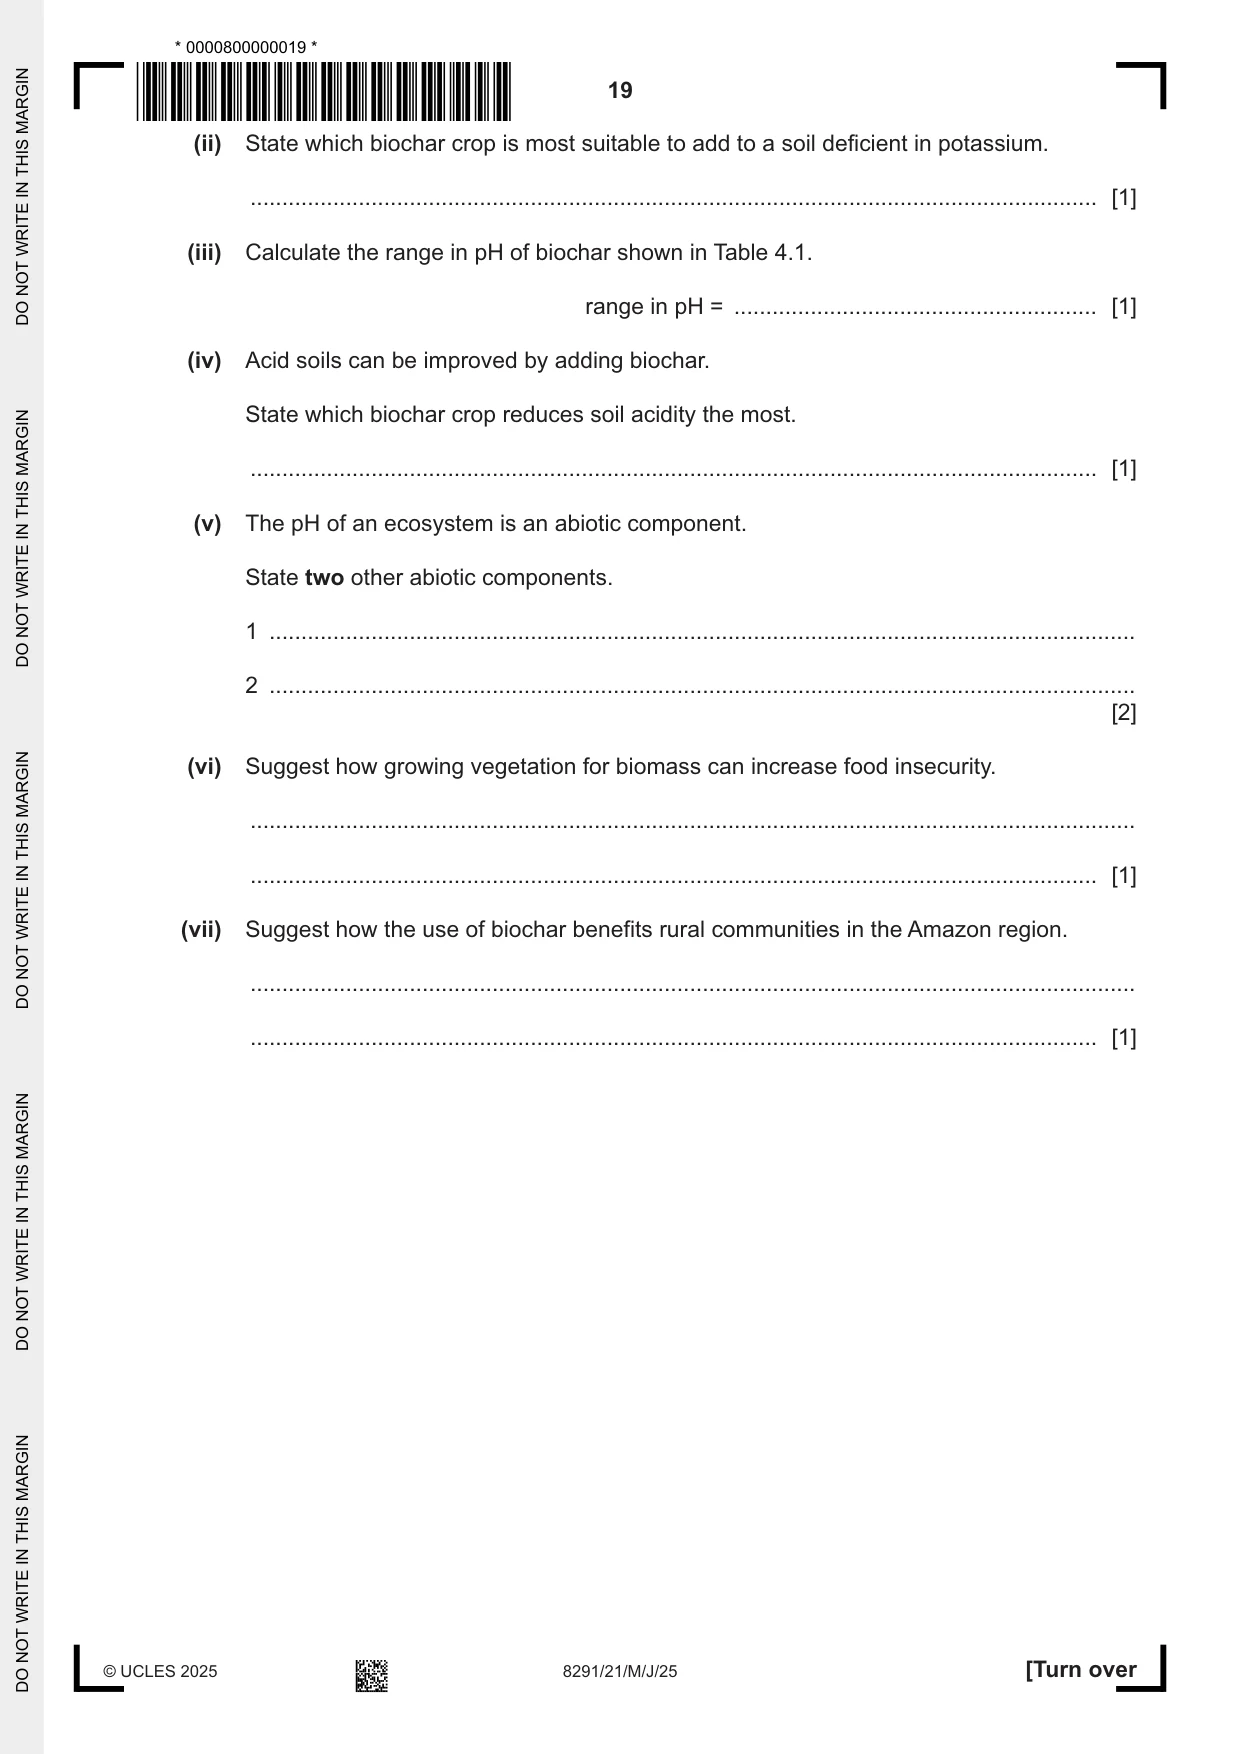
4 (a) Biochar is added to soil to improve soil structure. Biochar also adds nutrients to soil. Biochar is produced from biomass heated to high temperatures with limited or no oxygen. Fig. 4.1 shows the process of biochar production. heater biogas and hydrogen produced biomass residual heat biochar Fig. 4.1 (i) Describe how biochar production could reduce the use of non-renewable resources. ........................................................................................................................................... ........................................................................................................................................... ........................................................................................................................................... ..................................................................................................................................... [2] (ii) Biochar is 80% carbon and can take thousands of years to decompose. Describe how biochar can reduce the impact of climate change. ........................................................................................................................................... ........................................................................................................................................... ........................................................................................................................................... ..................................................................................................................................... [2] (b) Table 4.1 shows chemical properties of biochar produced from the waste biomass of six crops. Table 4.1 chemical properties of biochar percentage of percentage of biochar crop pH nitrogen potassium prosopis 9.7 1.23 0.50 rice 8.1 1.78 0.20 maize 10.0 2.06 0.80 cotton 10.6 0.67 1.40 red gram 10.8 1.65 2.50 sorghum 11.8 1.02 3.90 (i) Plot the percentage of nitrogen for each crop as a bar chart. [4] (ii) State which biochar crop is most suitable to add to a soil deficient in potassium. ..................................................................................................................................... [1] (iii) Calculate the range in pH of biochar shown in Table 4.1. range in pH = ......................................................... [1] (iv) Acid soils can be improved by adding biochar. State which biochar crop reduces soil acidity the most. ..................................................................................................................................... [1] (v) The pH of an ecosystem is an abiotic component. State two other abiotic components. 1 ........................................................................................................................................ 2 ........................................................................................................................................ [2] (vi) Suggest how growing vegetation for biomass can increase food insecurity. ........................................................................................................................................... ..................................................................................................................................... [1] (vii) Suggest how the use of biochar benefits rural communities in the Amazon region. ........................................................................................................................................... ..................................................................................................................................... [1]
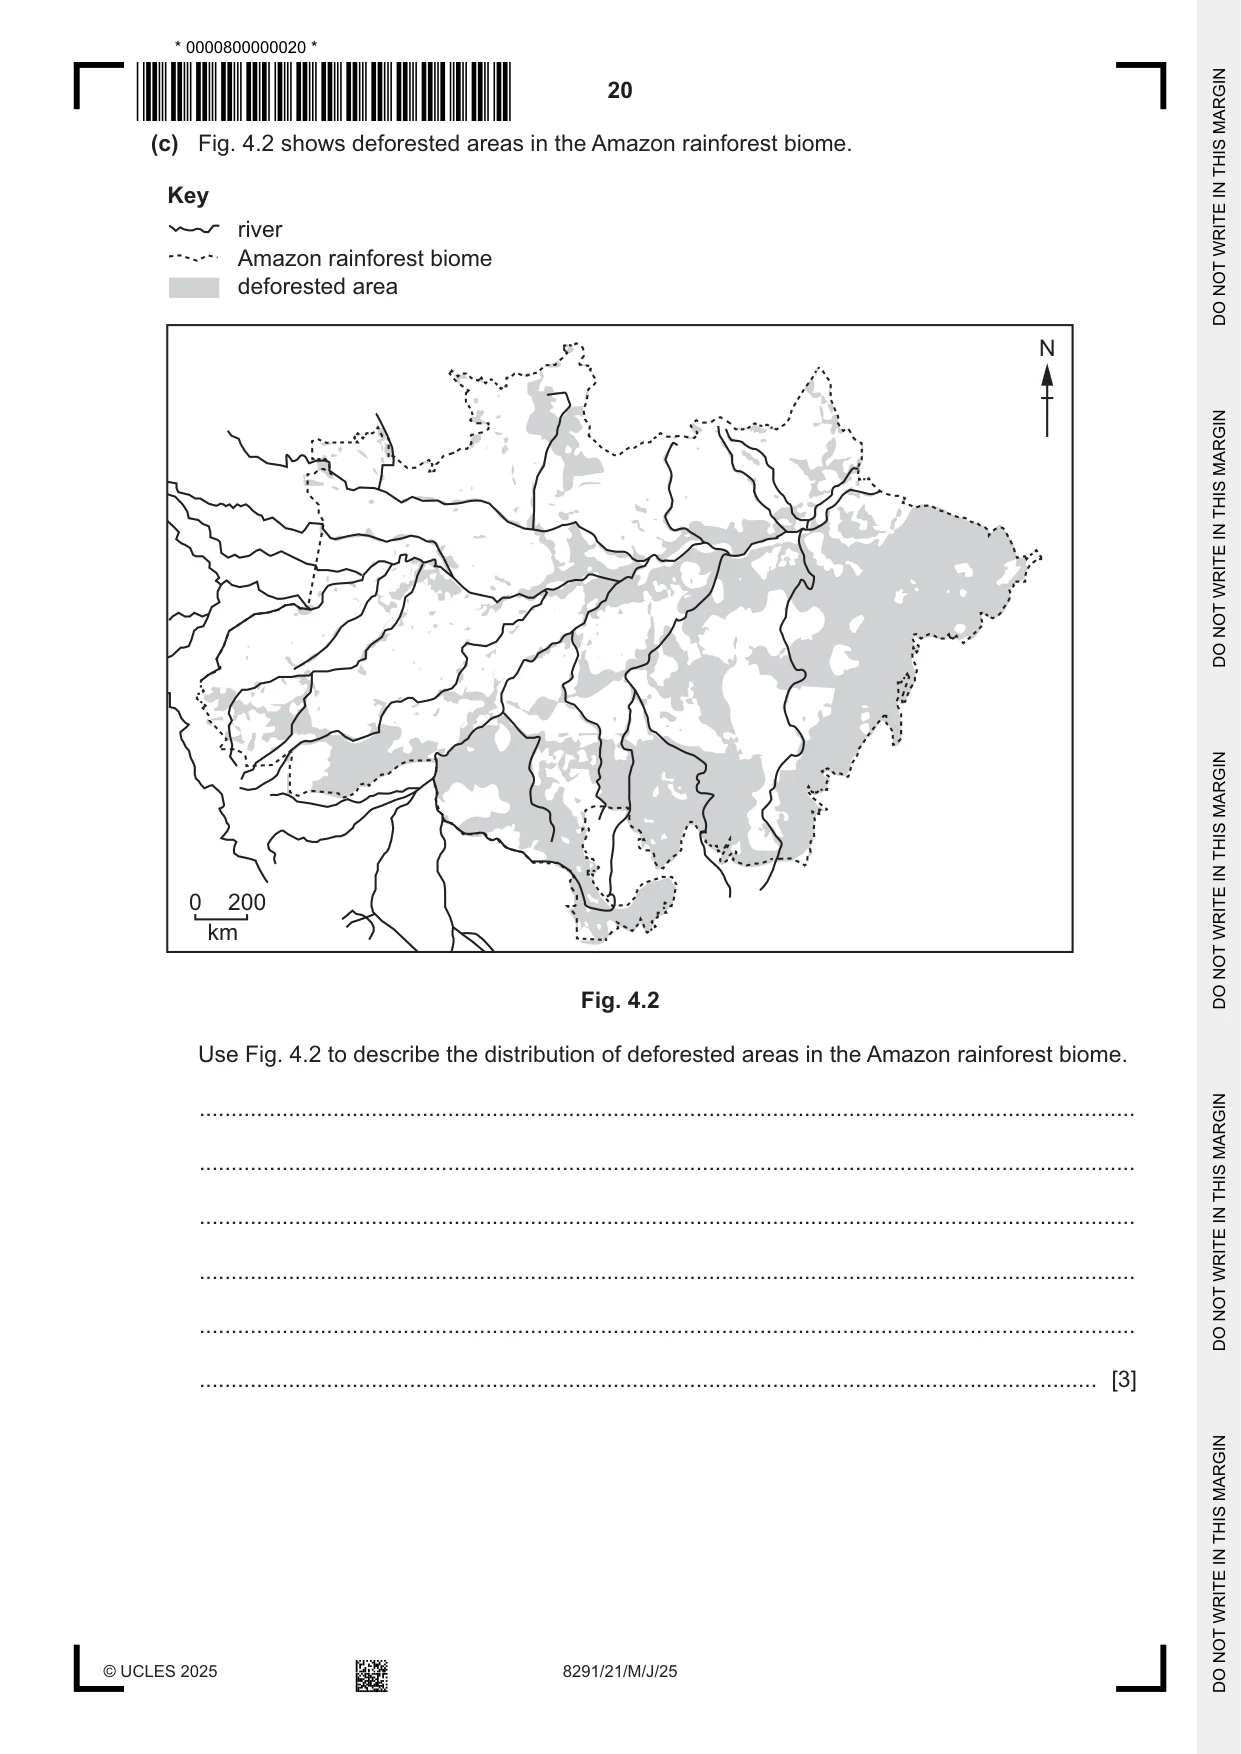
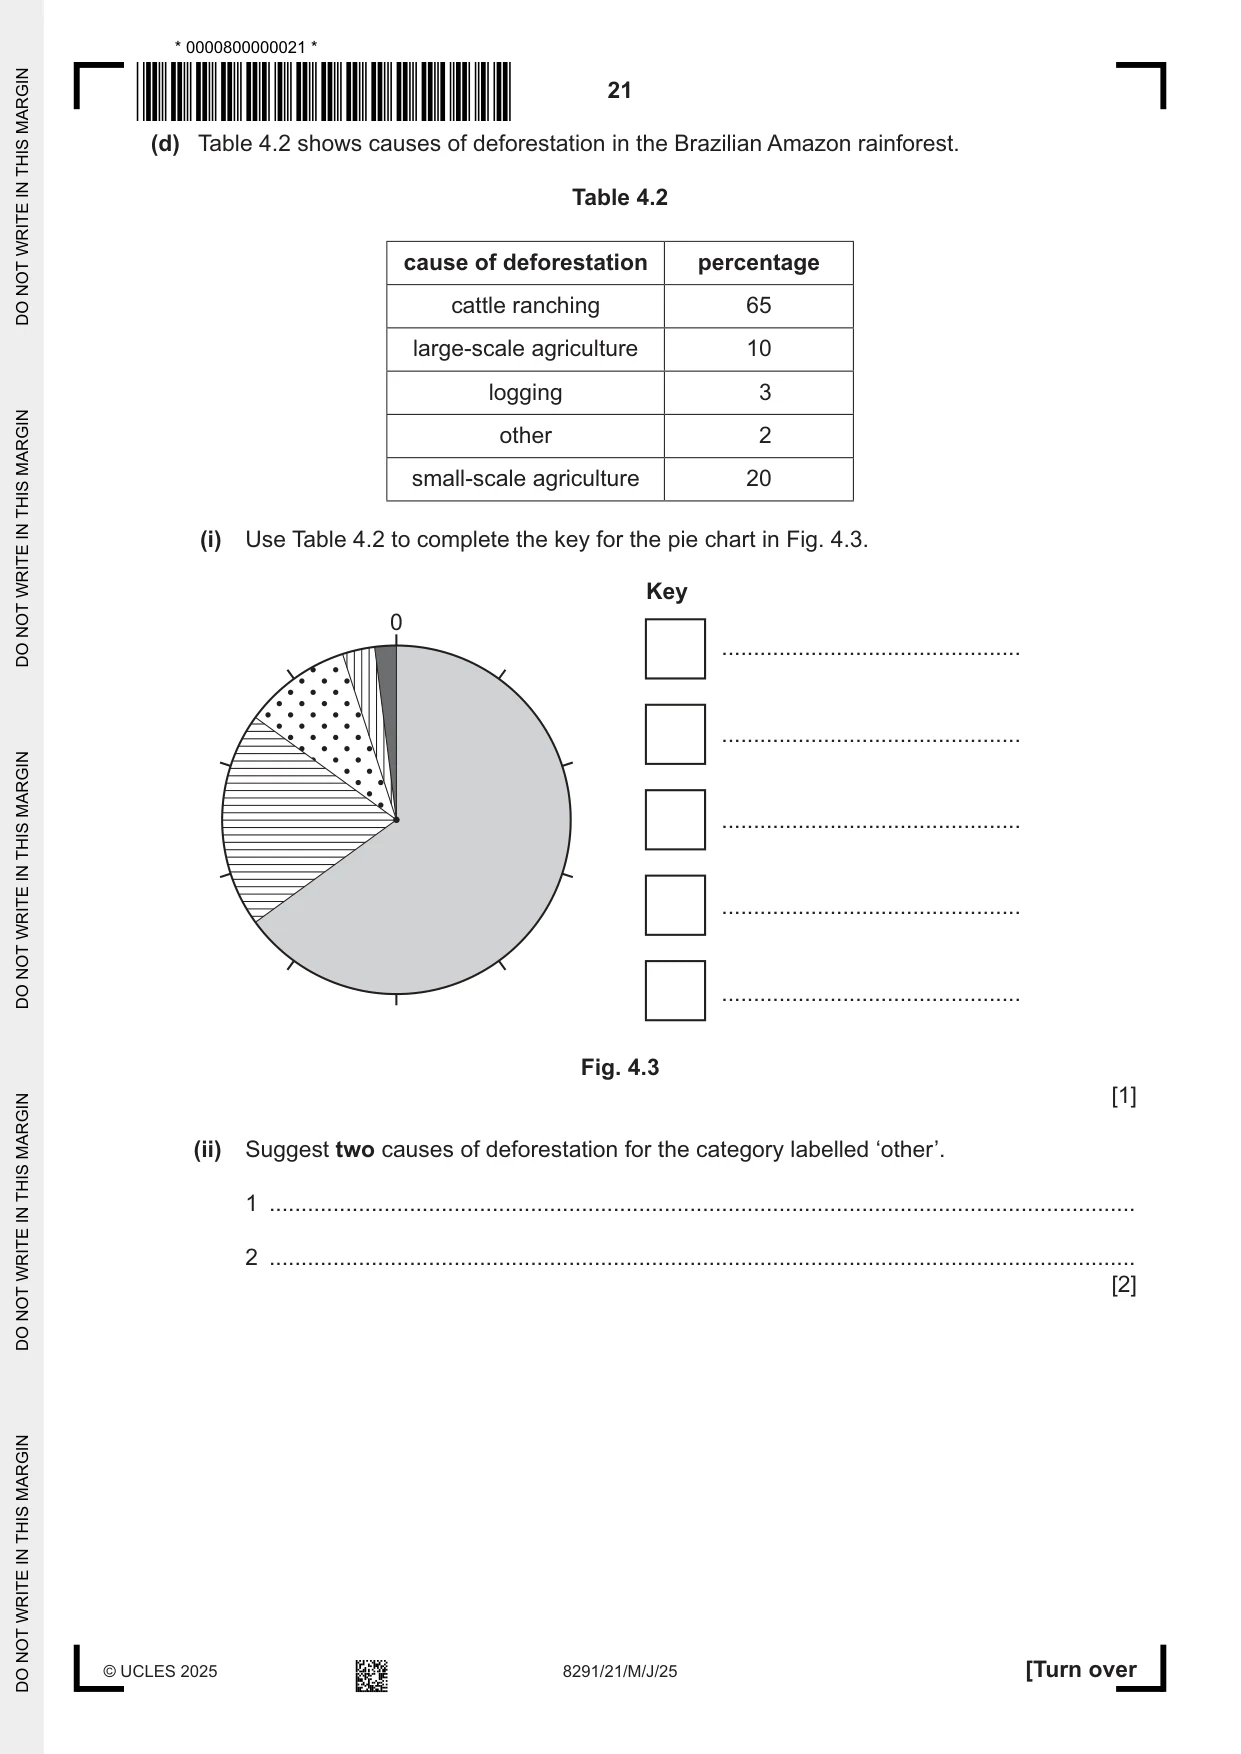
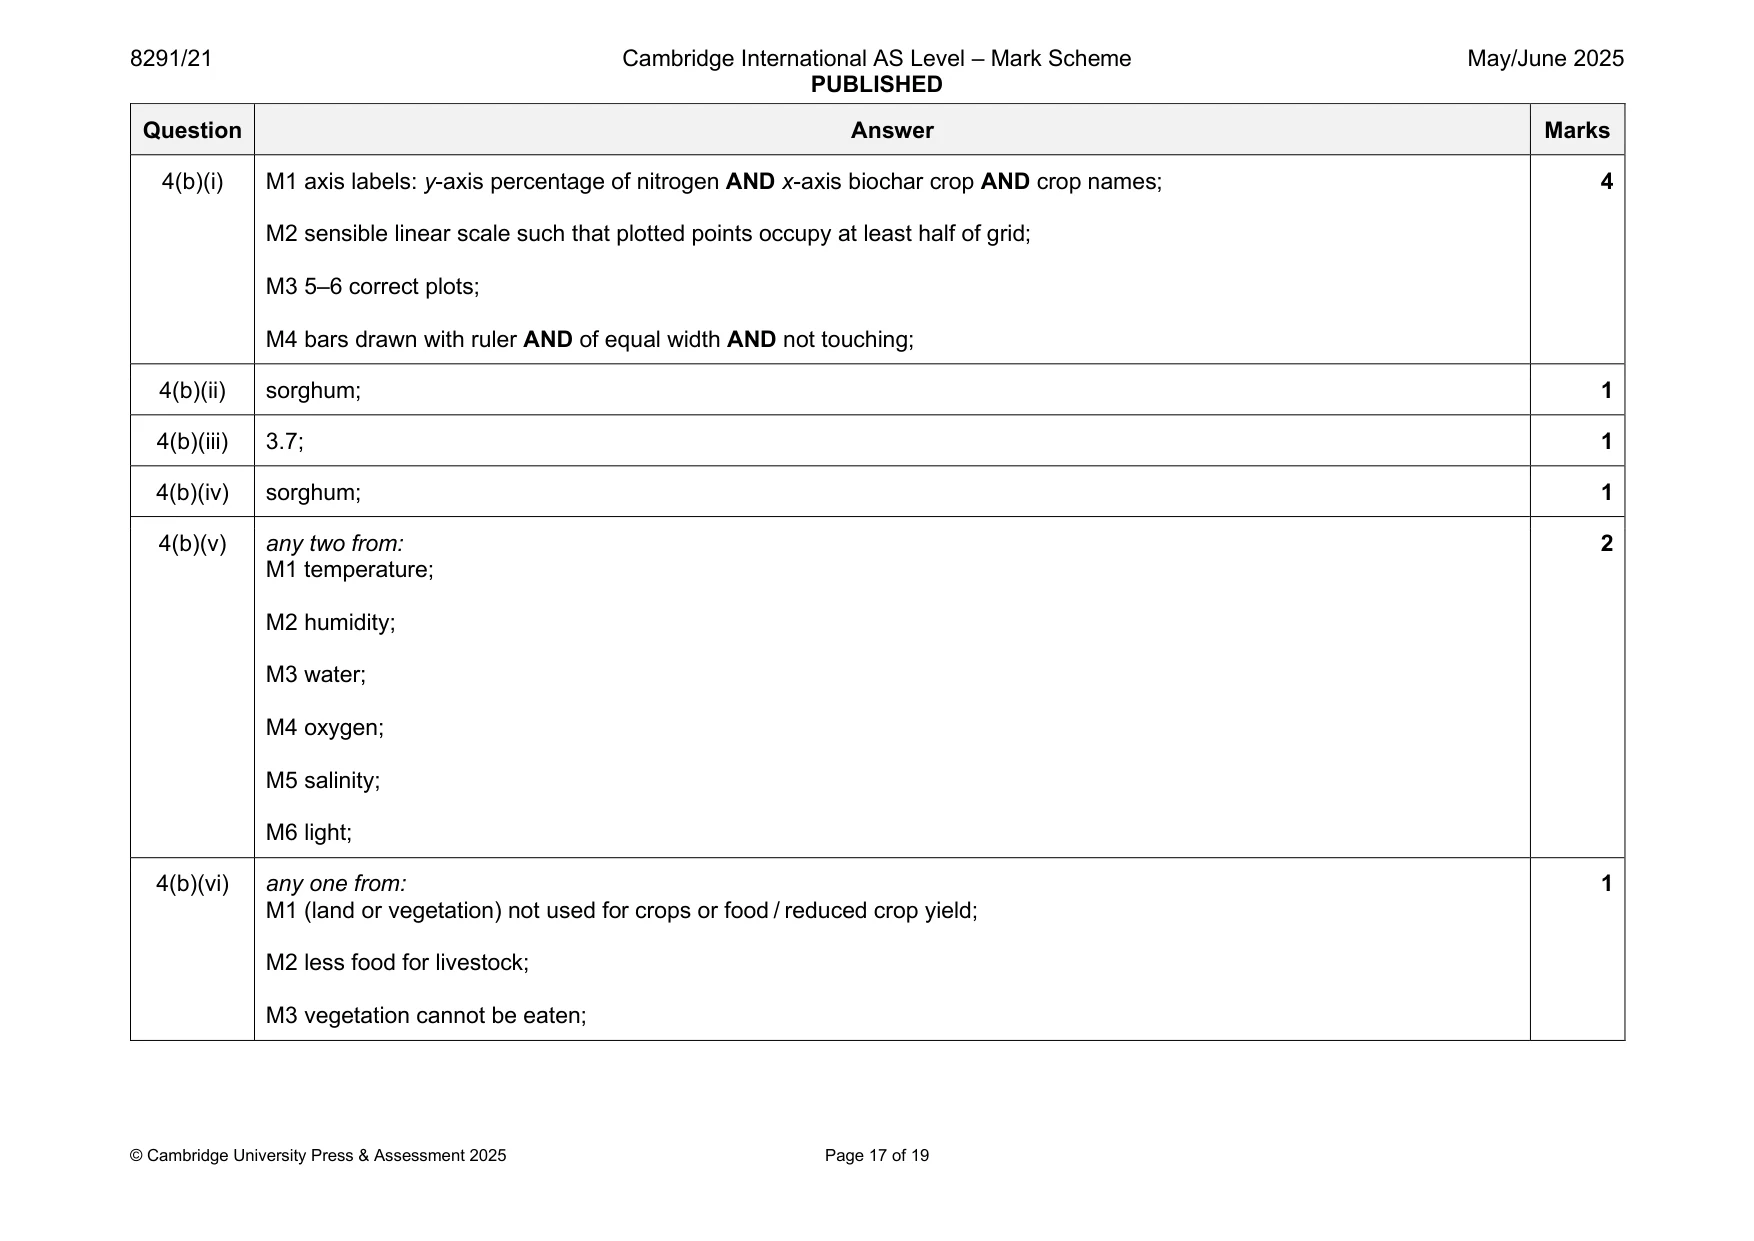
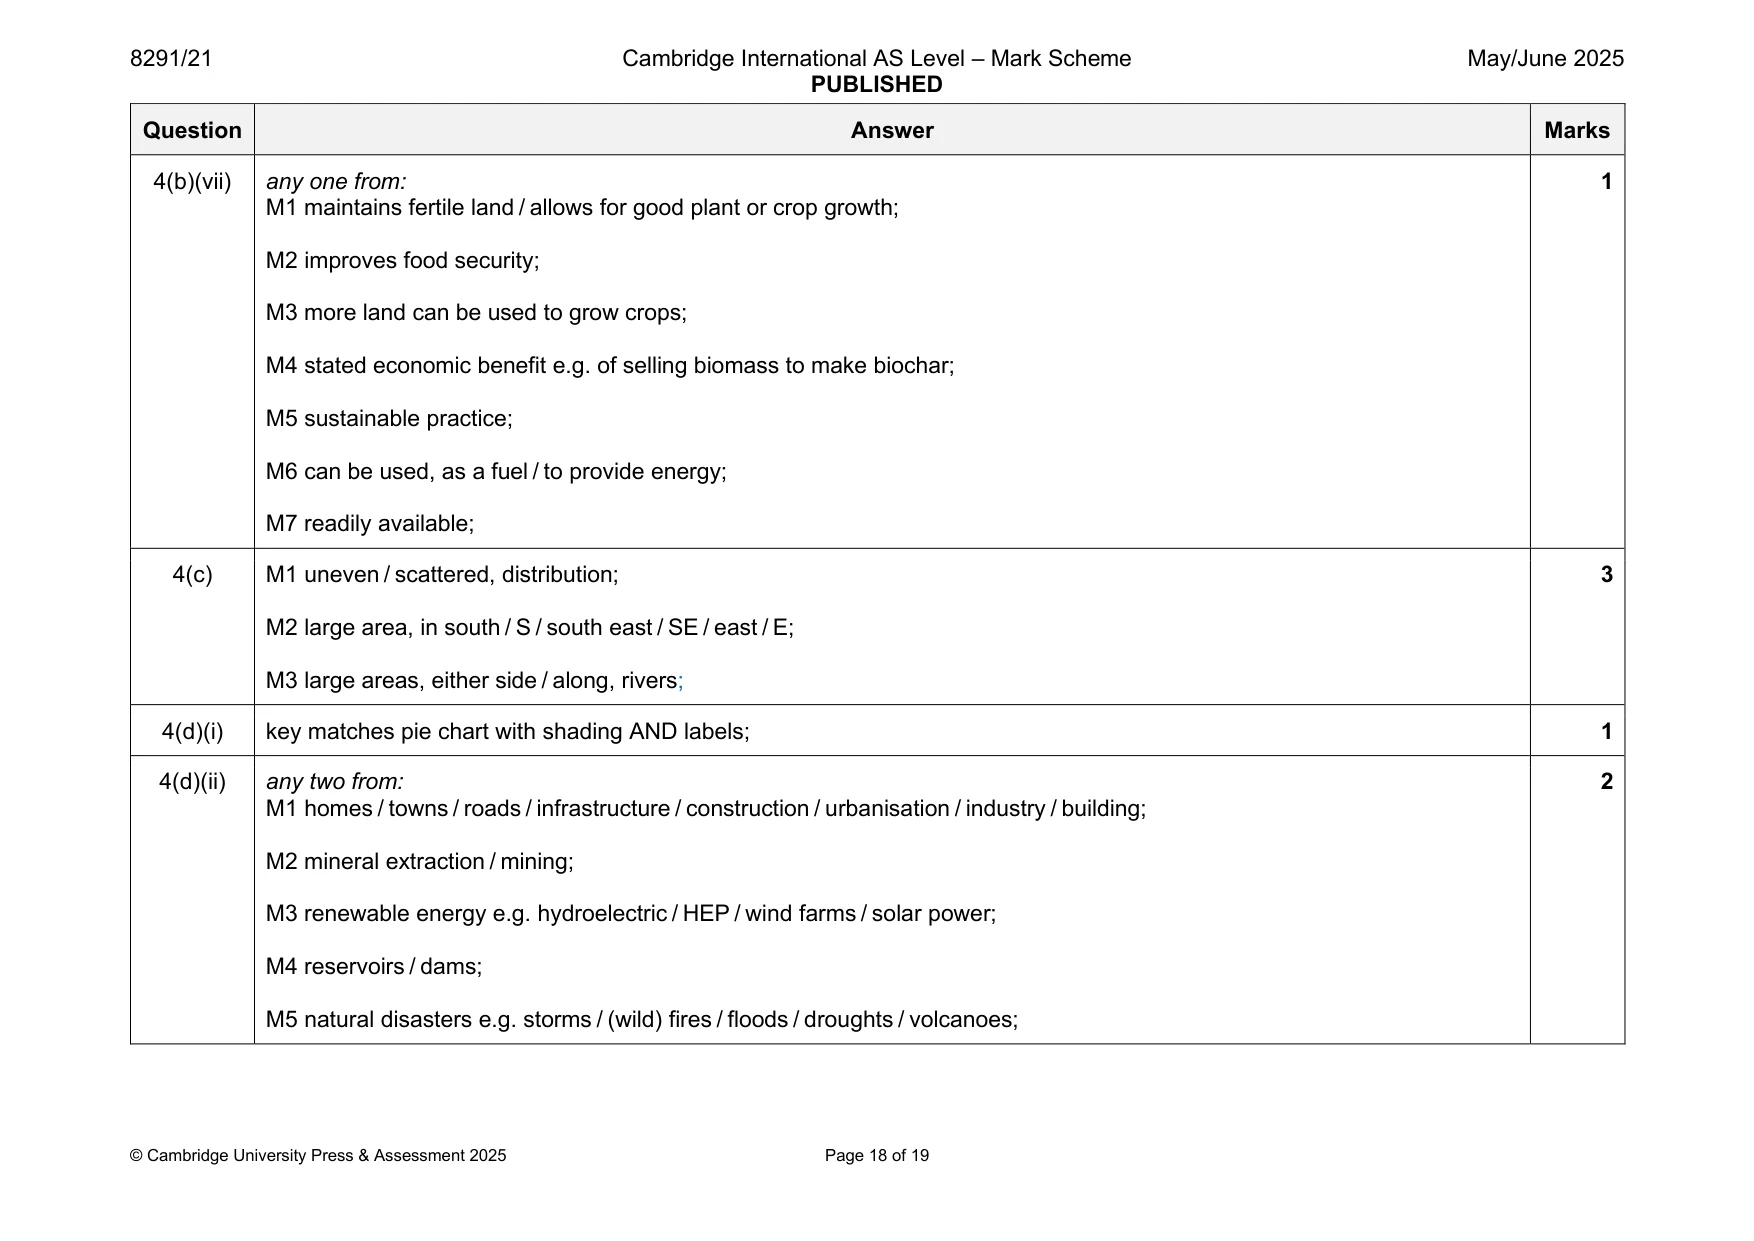
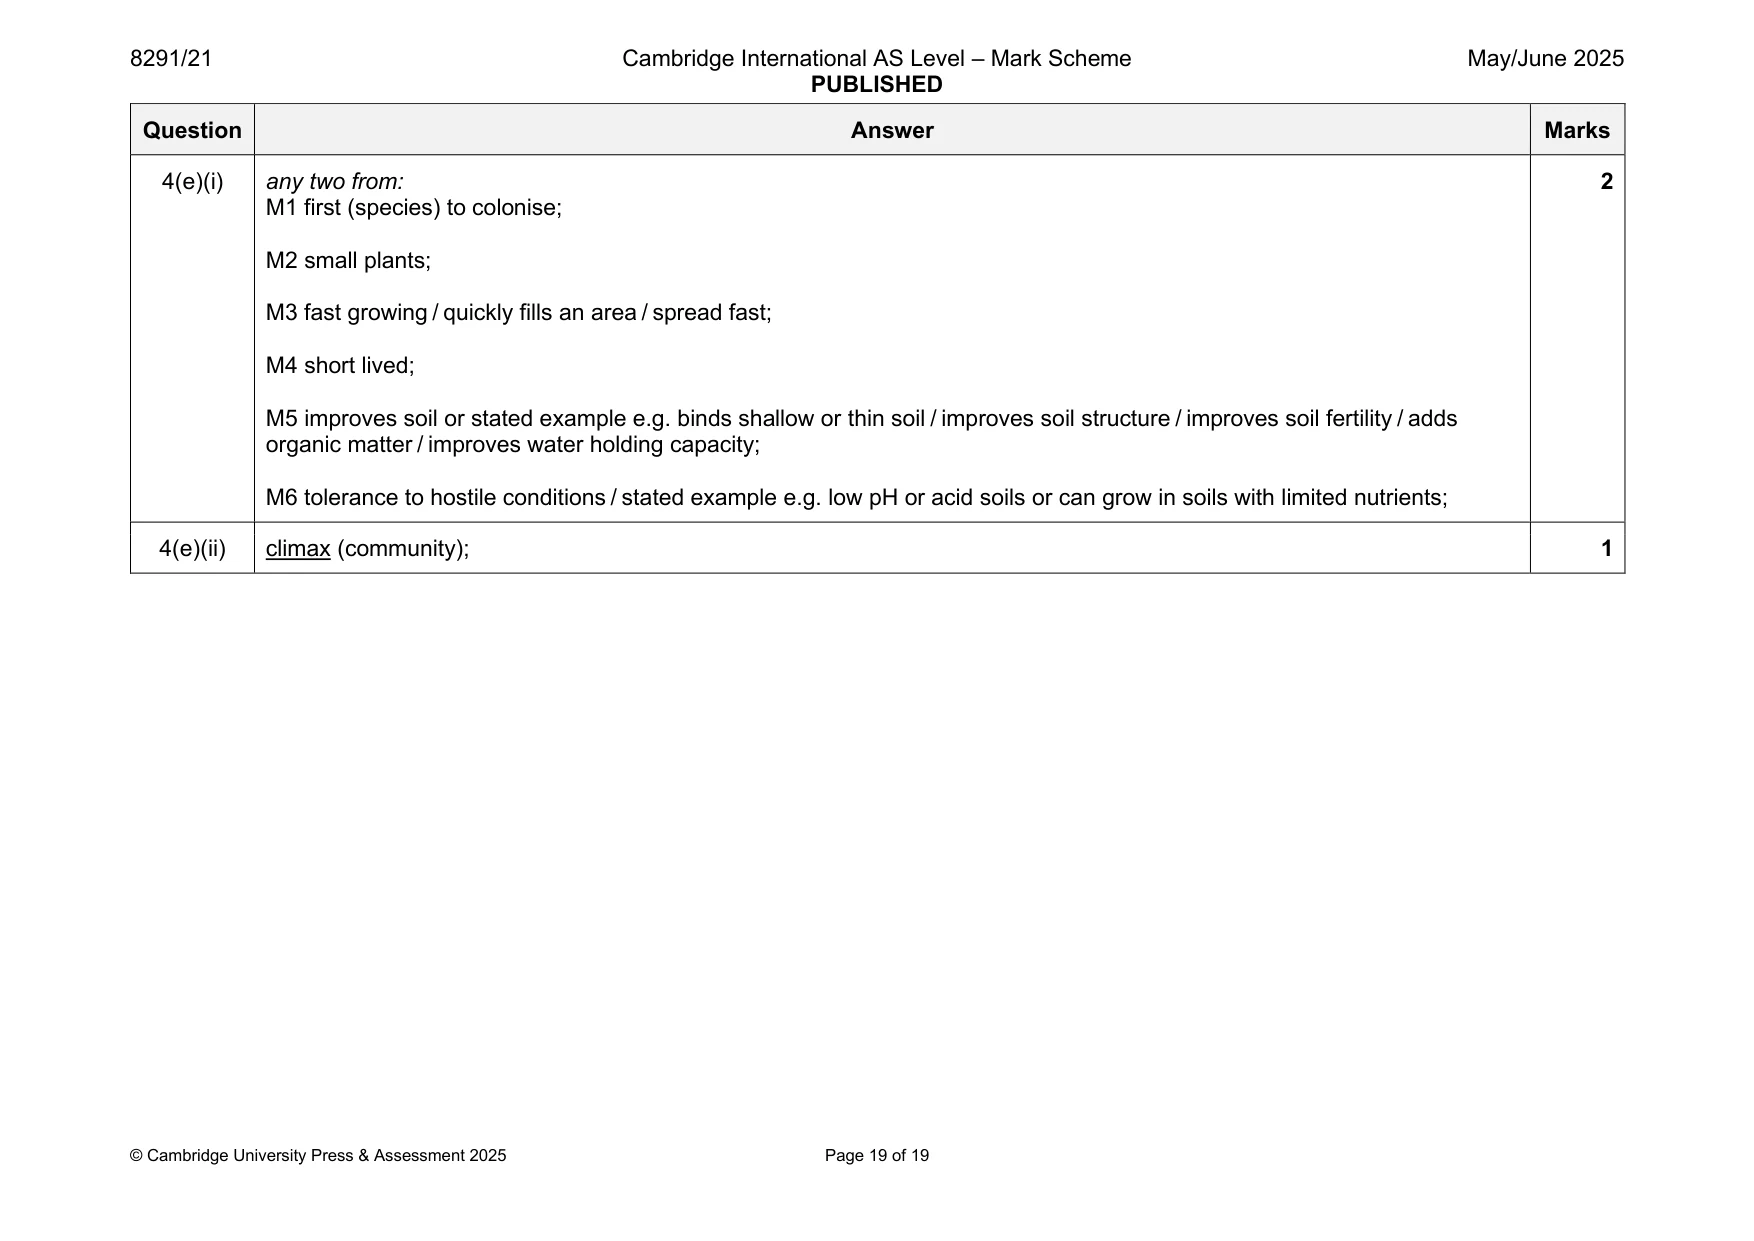
Mark scheme: 4(a)(i) any two from: 2 M1 biogas / biofuels, are renewable fuels; M2 the (residual) heat from the process is fed back to the heater / no additional energy needed; M3 stated example of how use of biochar reduces the use of non-renewable resources e.g. biochar does not need to be extracted from a quarry using equipment that runs on non-renewable resources; 4(a)(ii) any two from: 2 M1 carbon, capture / sink / store; M2 carbon stored for a long time; M3 replaces, non-renewable resources / fossil fuels; 4(b)(i) M1 axis labels: y-axis percentage of nitrogen AND x-axis biochar crop AND crop names; 4 M2 sensible linear scale such that plotted points occupy at least half of grid; M3 5–6 correct plots; M4 bars drawn with ruler AND of equal width AND not touching; 4(b)(ii) sorghum; 1 4(b)(iii) 3.7; 1 4(b)(iv) sorghum; 1 4(b)(v) any two from: 2 M1 temperature; M2 humidity; M3 water; M4 oxygen; M5 salinity; M6 light; 4(b)(vi) any one from: 1 M1 (land or vegetation) not used for crops or food / reduced crop yield; M2 less food for livestock; M3 vegetation cannot be eaten; 4(b)(vii) any one from: 1 M1 maintains fertile land / allows for good plant or crop growth; M2 improves food security; M3 more land can be used to grow crops; M4 stated economic benefit e.g. of selling biomass to make biochar; M5 sustainable practice; M6 can be used, as a fuel / to provide energy; M7 readily available; 4(c) M1 uneven / scattered, distribution; 3 M2 large area, in south / S / south east / SE / east / E; M3 large areas, either side / along, rivers; 4(d)(i) key matches pie chart with shading AND labels; 1 4(d)(ii) any two from: 2 M1 homes / towns / roads / infrastructure / construction / urbanisation / industry / building; M2 mineral extraction / mining; M3 renewable energy e.g. hydroelectric / HEP / wind farms / solar power; M4 reservoirs / dams; M5 natural disasters e.g. storms / (wild) fires / floods / droughts / volcanoes; 4(e)(i) any two from: 2 M1 first (species) to colonise; M2 small plants; M3 fast growing / quickly fills an area / spread fast; M4 short lived; M5 improves soil or stated example e.g. binds shallow or thin soil / improves soil structure / improves soil fertility / adds organic matter / improves water holding capacity; M6 tolerance to hostile conditions / stated example e.g. low pH or acid soils or can grow in soils with limited nutrients; 4(e)(ii) climax (community); 1
What was in this paper
The subtopics covered by these 4 questions, and how many questions each got. Open one in a new tab to see every Cambridge question on it.
What you needed in this session
Cambridge’s own grade thresholds for 2025 May/June, Paper 2 · Variant 1. A higher threshold means an easier paper — the bar moves with how the cohort did.