Cambridge A Level Environmental Management (AS only) 8291 — 2022 May/June Paper 2 · Variant 3
8291/23/M/J/22 · 5 questions · 80 marks · ≈90 min
The question paper and its mark scheme, free to read here and free to download. This is Cambridge’s own paper, exactly as it was sat.
Question paper24 pages







Mark scheme13 pages
Answers below. Sit the paper first if you are practising.
Questions as text
Q1 · In 2017, the United Kingdom generated electricity for 24 hours without using coal
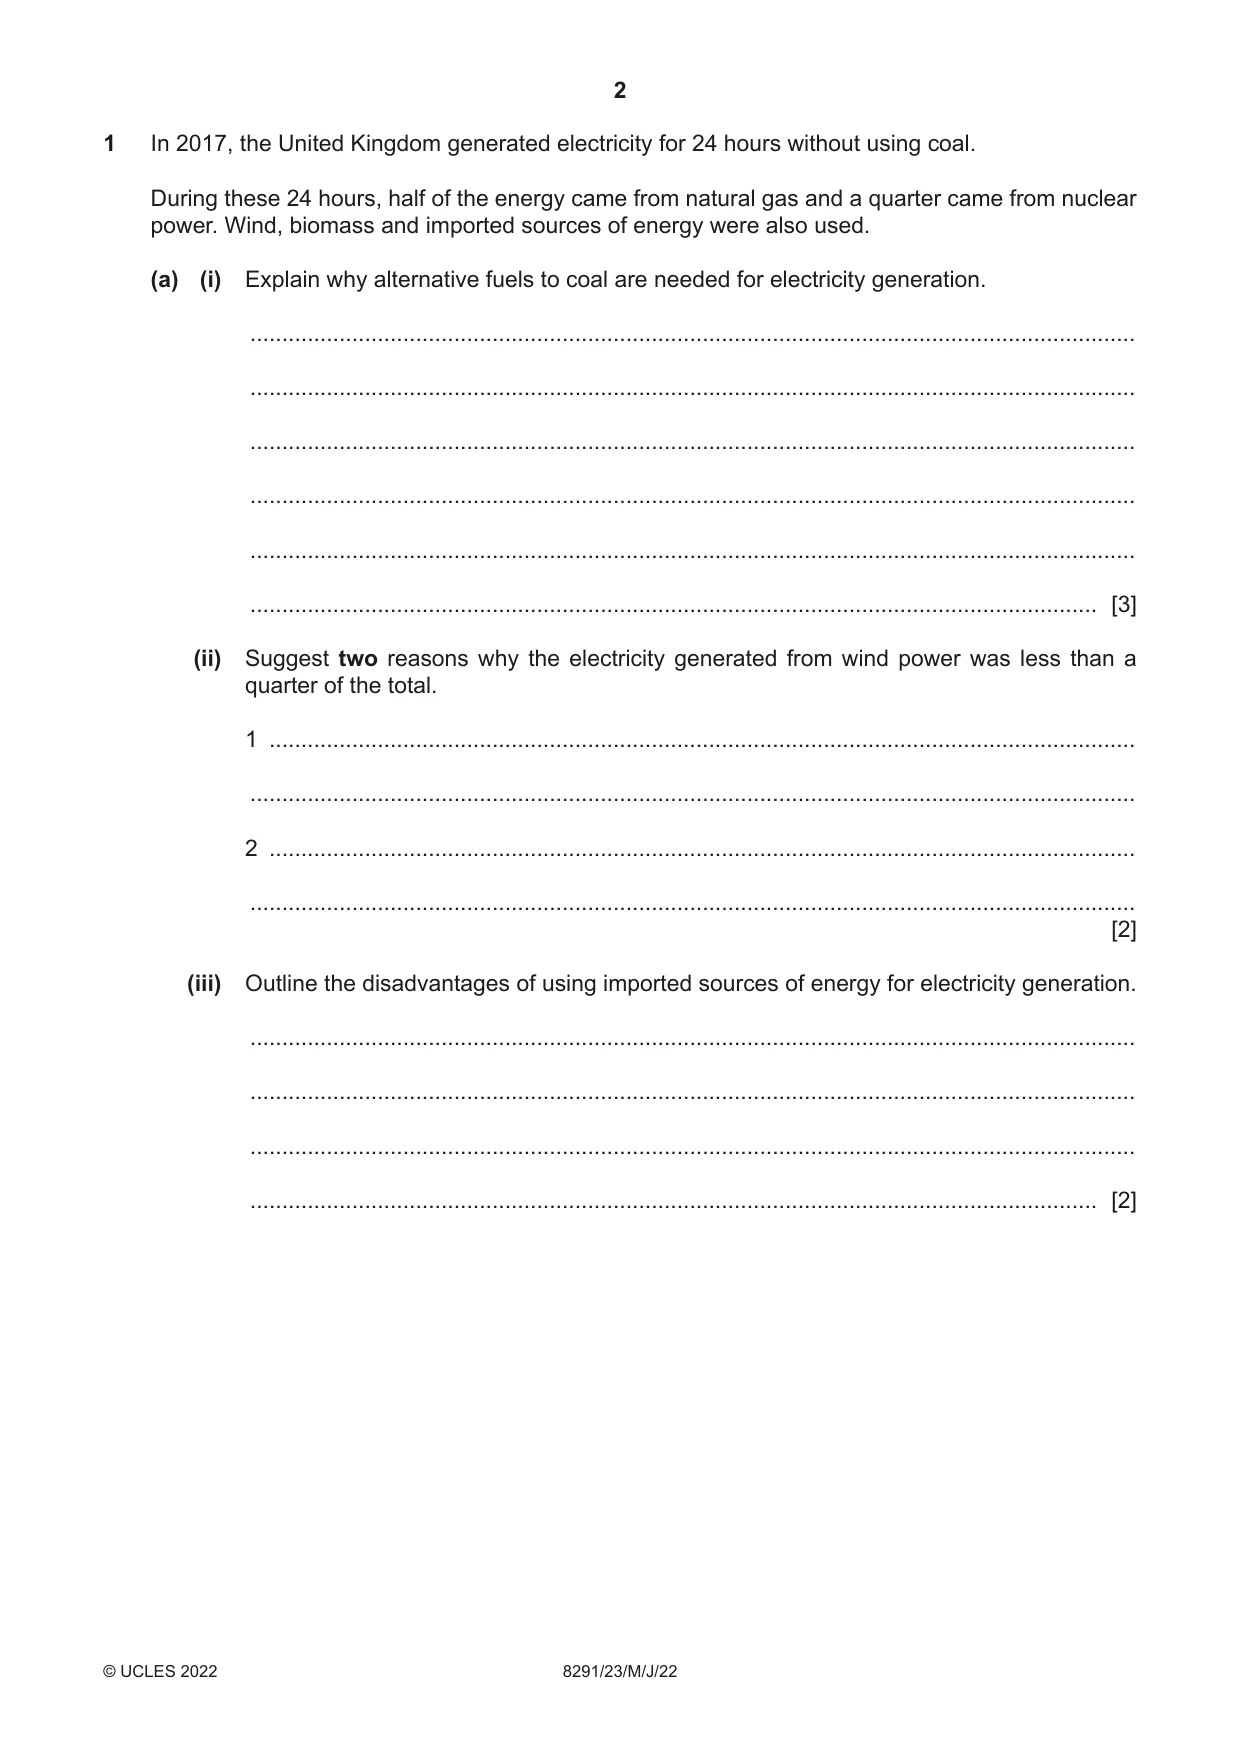
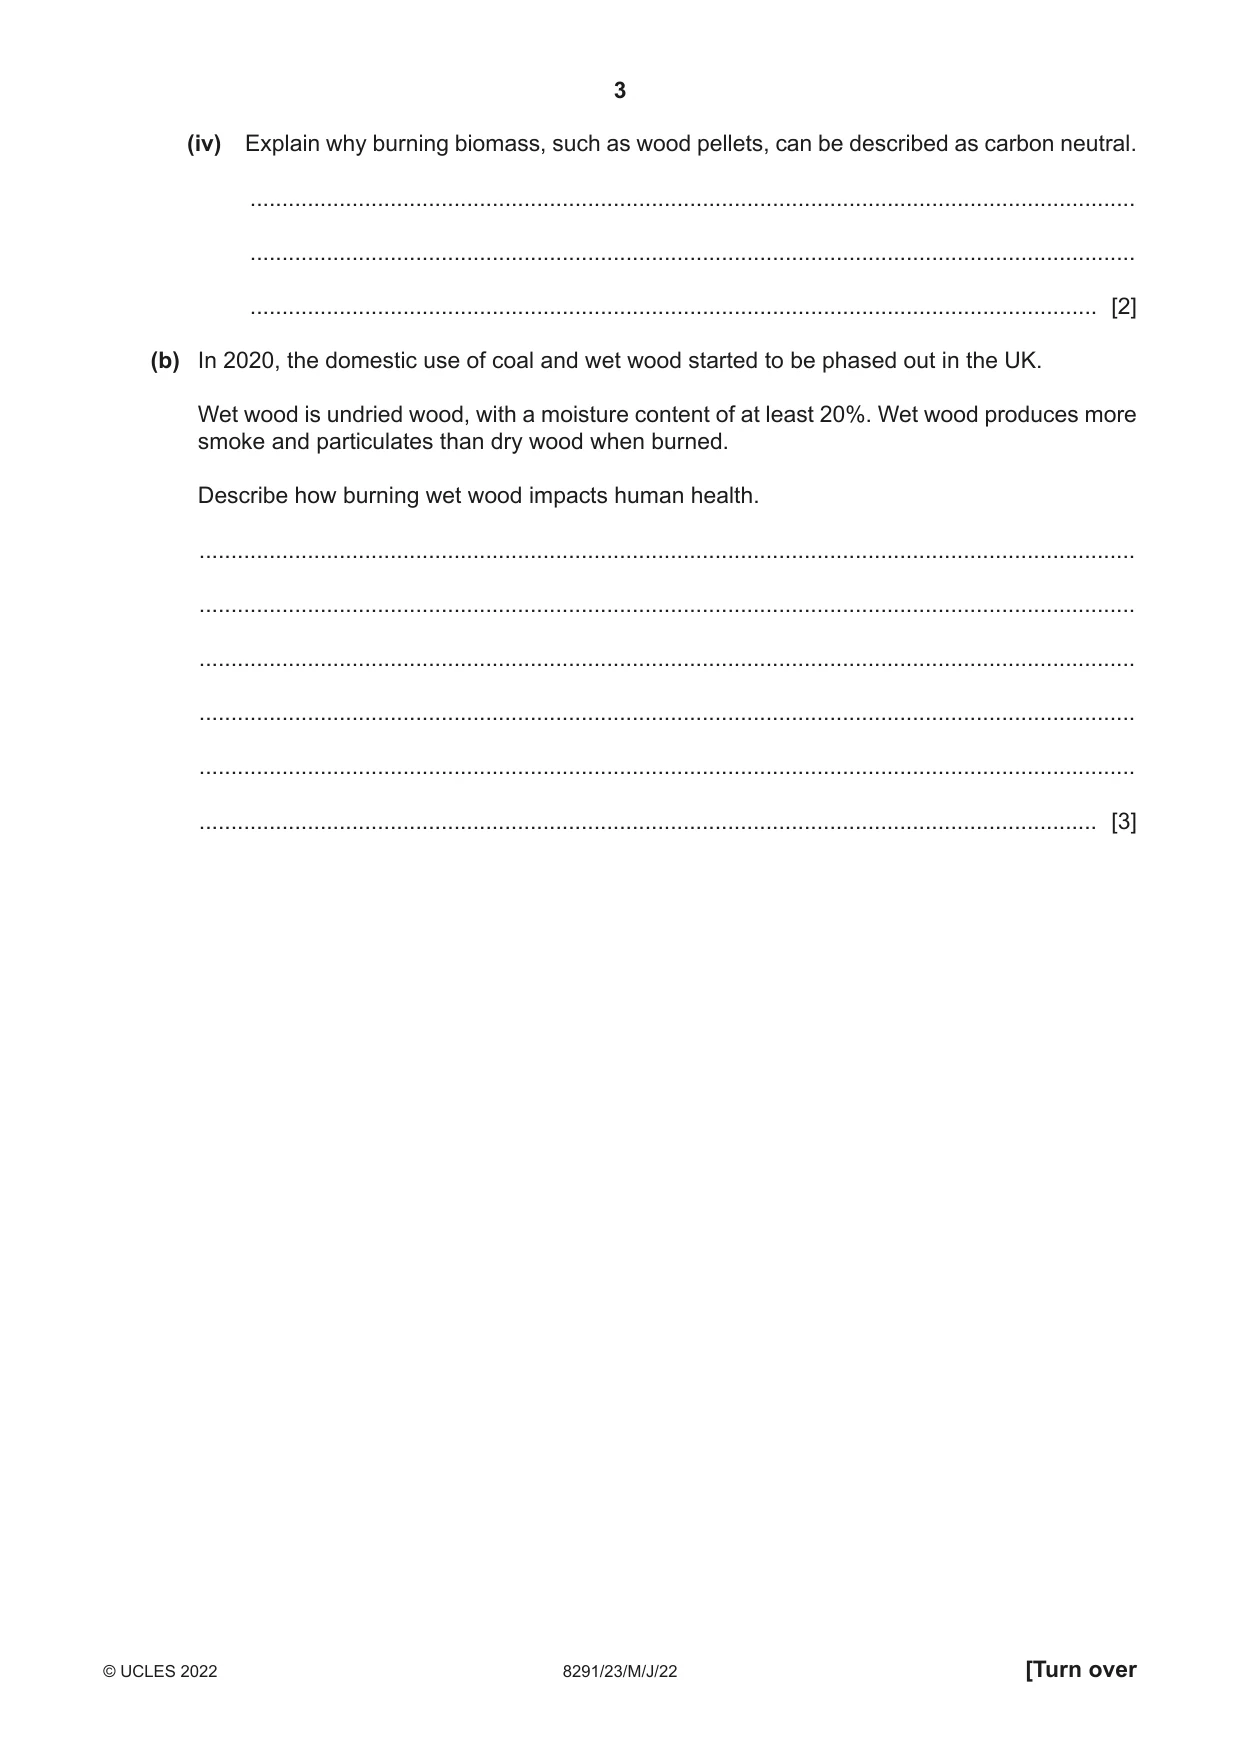
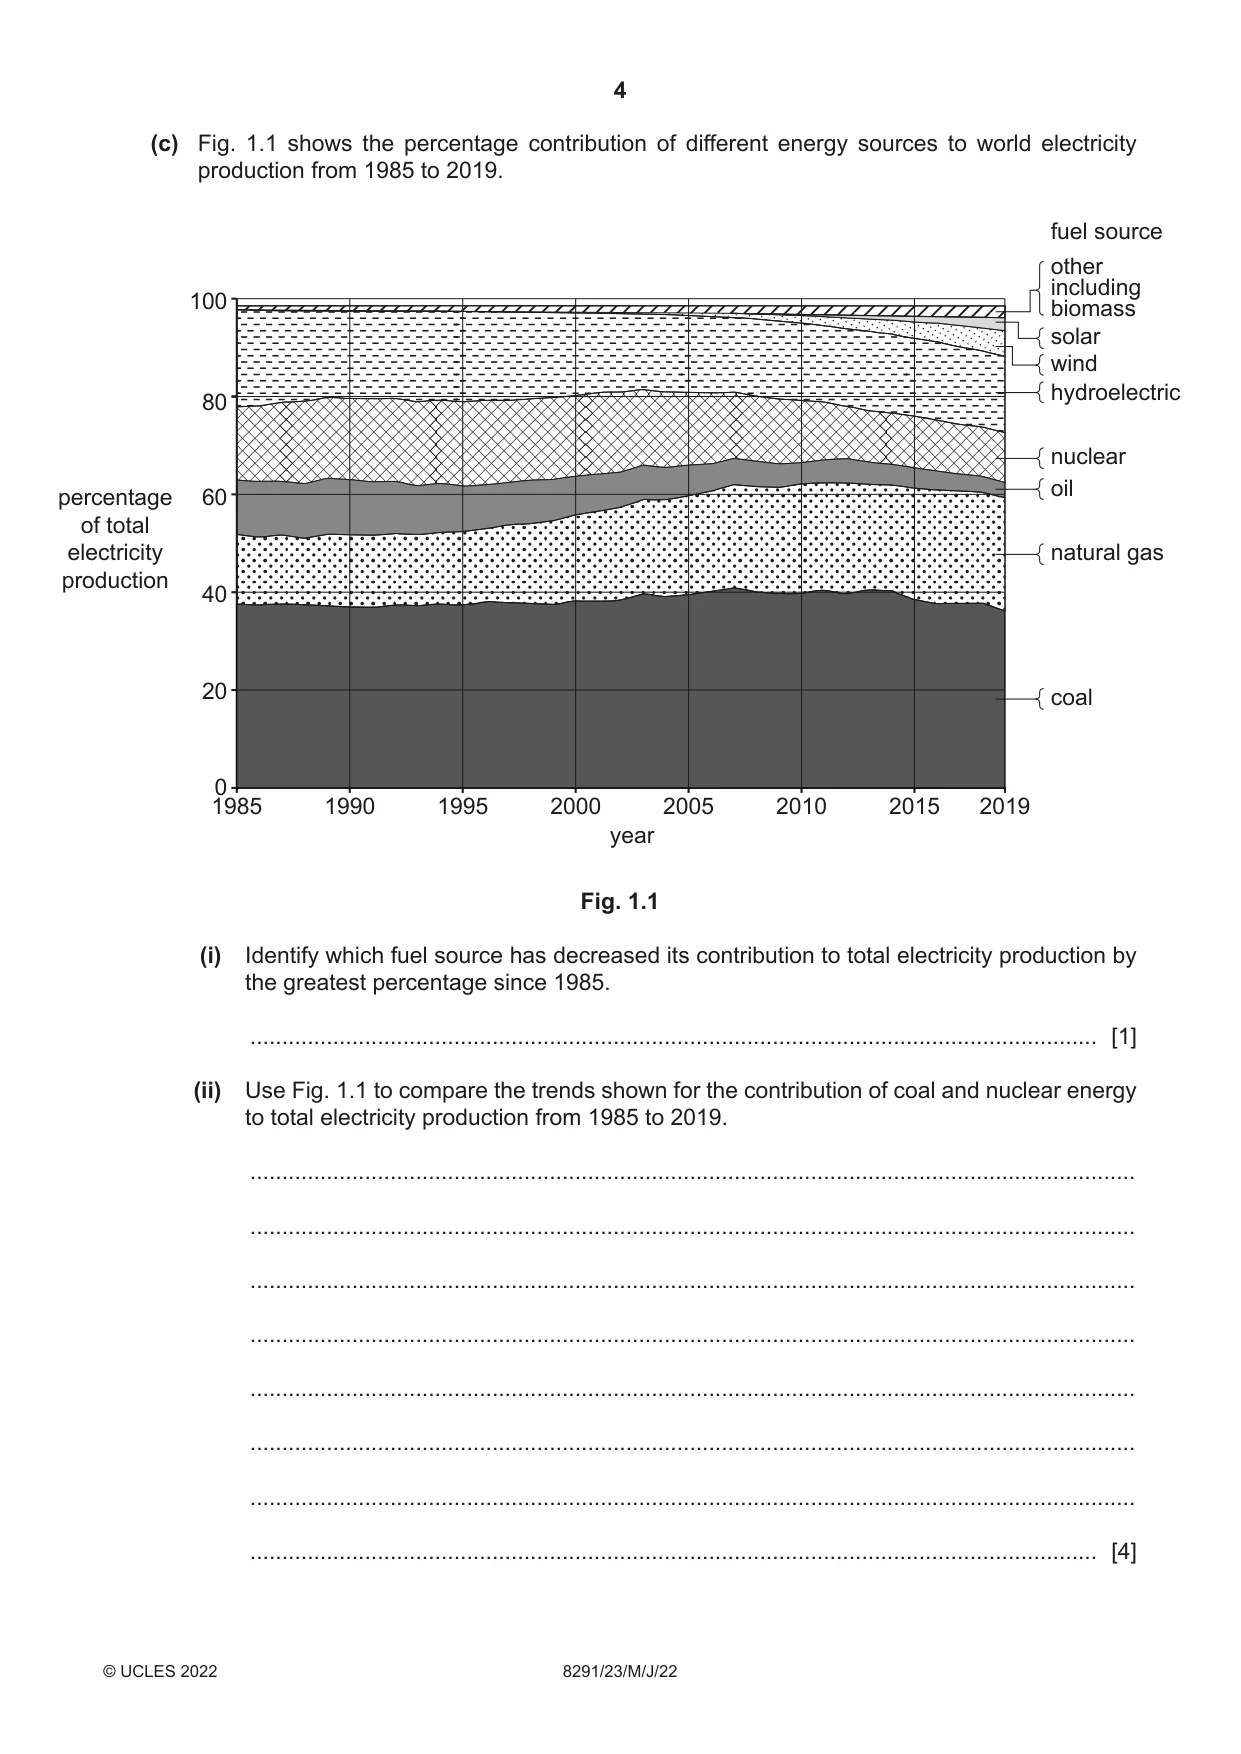
1 In 2017, the United Kingdom generated electricity for 24 hours without using coal. During these 24 hours, half of the energy came from natural gas and a quarter came from nuclear power. Wind, biomass and imported sources of energy were also used. (a) (i) Explain why alternative fuels to coal are needed for electricity generation. ........................................................................................................................................... ........................................................................................................................................... ........................................................................................................................................... ........................................................................................................................................... ........................................................................................................................................... ..................................................................................................................................... [3] (ii) Suggest two reasons why the electricity generated from wind power was less than a quarter of the total. 1 ........................................................................................................................................ ........................................................................................................................................... 2 ........................................................................................................................................ ........................................................................................................................................... [2] (iii) Outline the disadvantages of using imported sources of energy for electricity generation. ........................................................................................................................................... ........................................................................................................................................... ........................................................................................................................................... ..................................................................................................................................... [2] (iv) Explain why burning biomass, such as wood pellets, can be described as carbon neutral. ........................................................................................................................................... ........................................................................................................................................... ..................................................................................................................................... [2] (b) In 2020, the domestic use of coal and wet wood started to be phased out in the UK. Wet wood is undried wood, with a moisture content of at least 20%. Wet wood produces more smoke and particulates than dry wood when burned. Describe how burning wet wood impacts human health. ................................................................................................................................................... ................................................................................................................................................... ................................................................................................................................................... ................................................................................................................................................... ................................................................................................................................................... ............................................................................................................................................. [3] (c) Fig. 1.1 shows the percentage contribution of different energy sources to world electricity production from 1985 to 2019. fuel source other including 100 biomass solar wind hydroelectric 80 nuclear oilpercentage 60 of total electricity natural gas production 40 20 coal 0 1985 1990 1995 2000 2005 2010 2015 2019 year Fig. 1.1 (i) Identify which fuel source has decreased its contribution to total electricity production by the greatest percentage since 1985. ..................................................................................................................................... [1] (ii) Use Fig. 1.1 to compare the trends shown for the contribution of coal and nuclear energy to total electricity production from 1985 to 2019. ........................................................................................................................................... ........................................................................................................................................... ........................................................................................................................................... ........................................................................................................................................... ........................................................................................................................................... ........................................................................................................................................... ........................................................................................................................................... ..................................................................................................................................... [4] (iii) The trend for natural gas shows an increase in its percentage contribution to total electricity production since 1985. Suggest reasons for this trend. ........................................................................................................................................... ........................................................................................................................................... ........................................................................................................................................... ..................................................................................................................................... [2] [Total: 19]
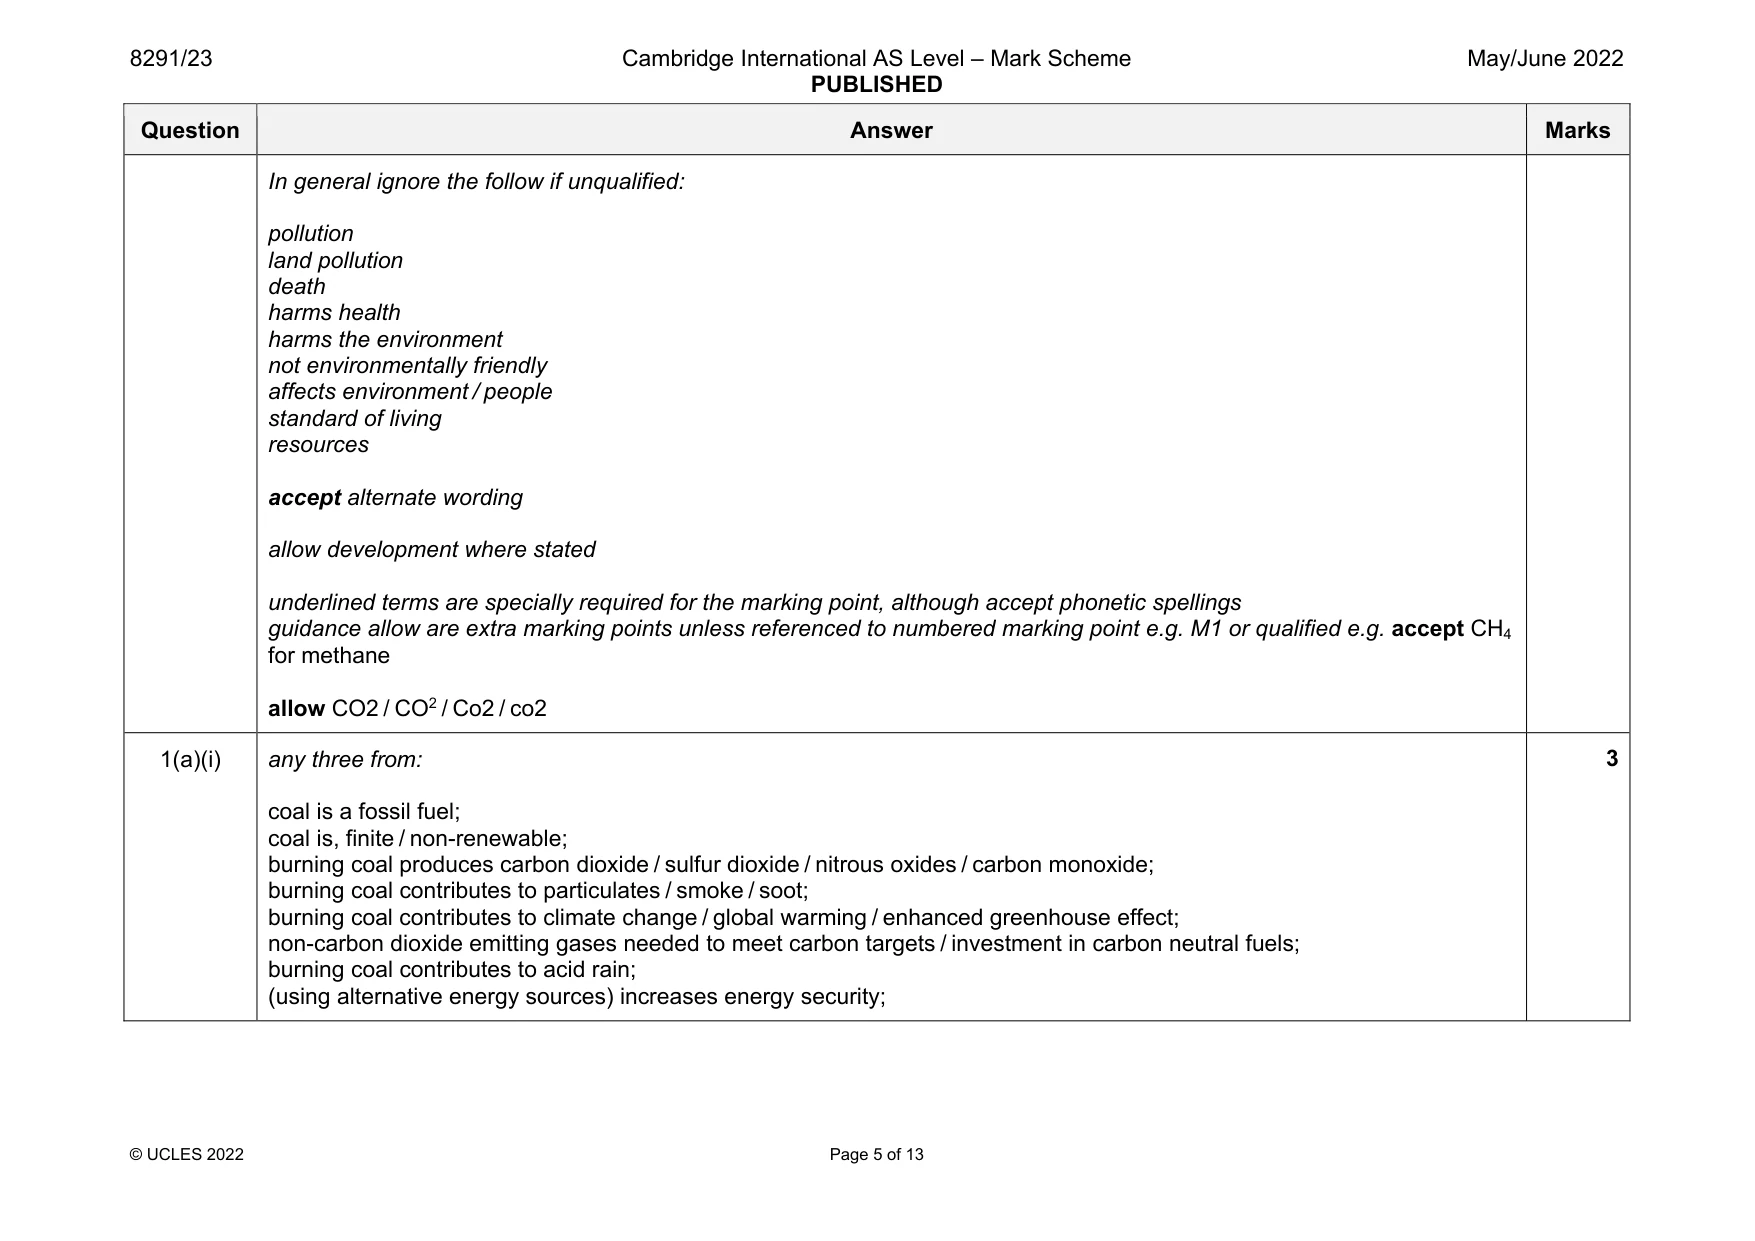
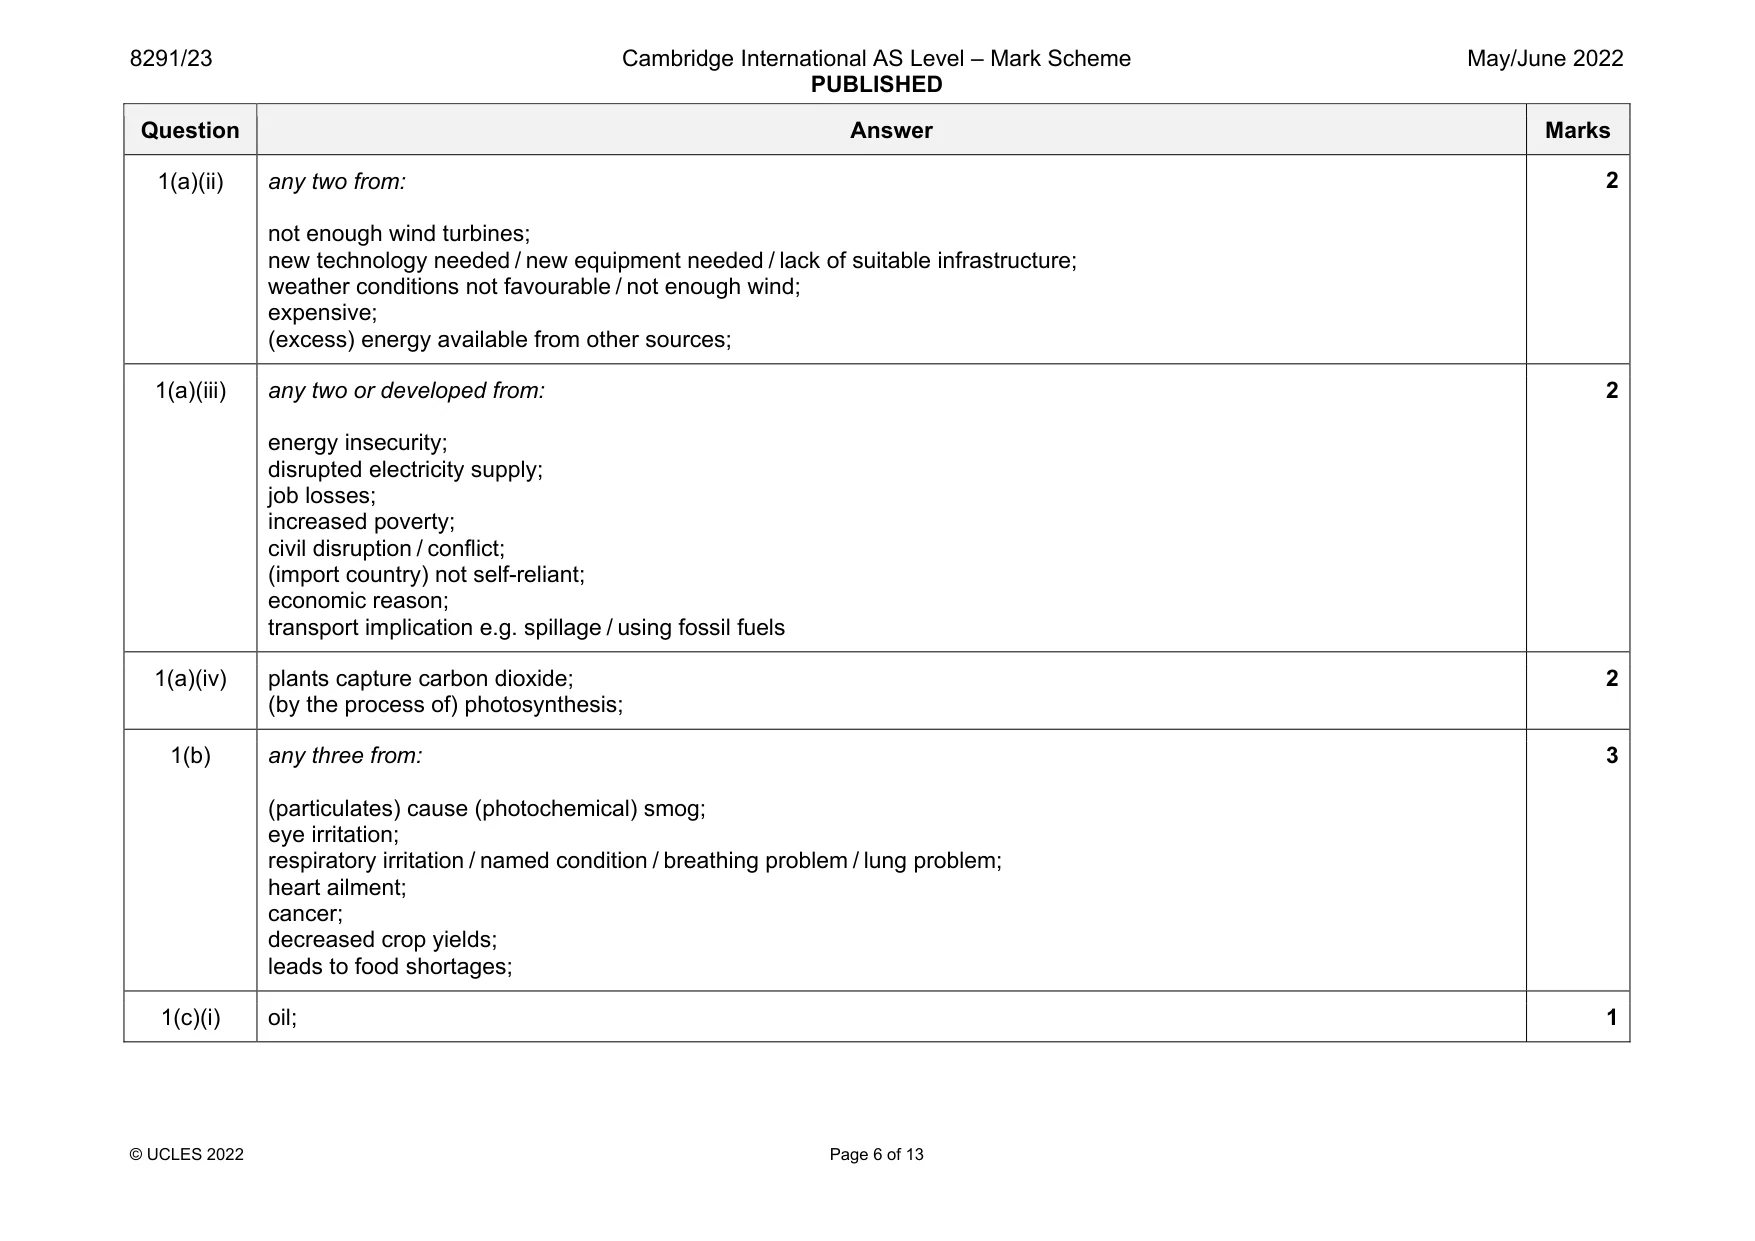
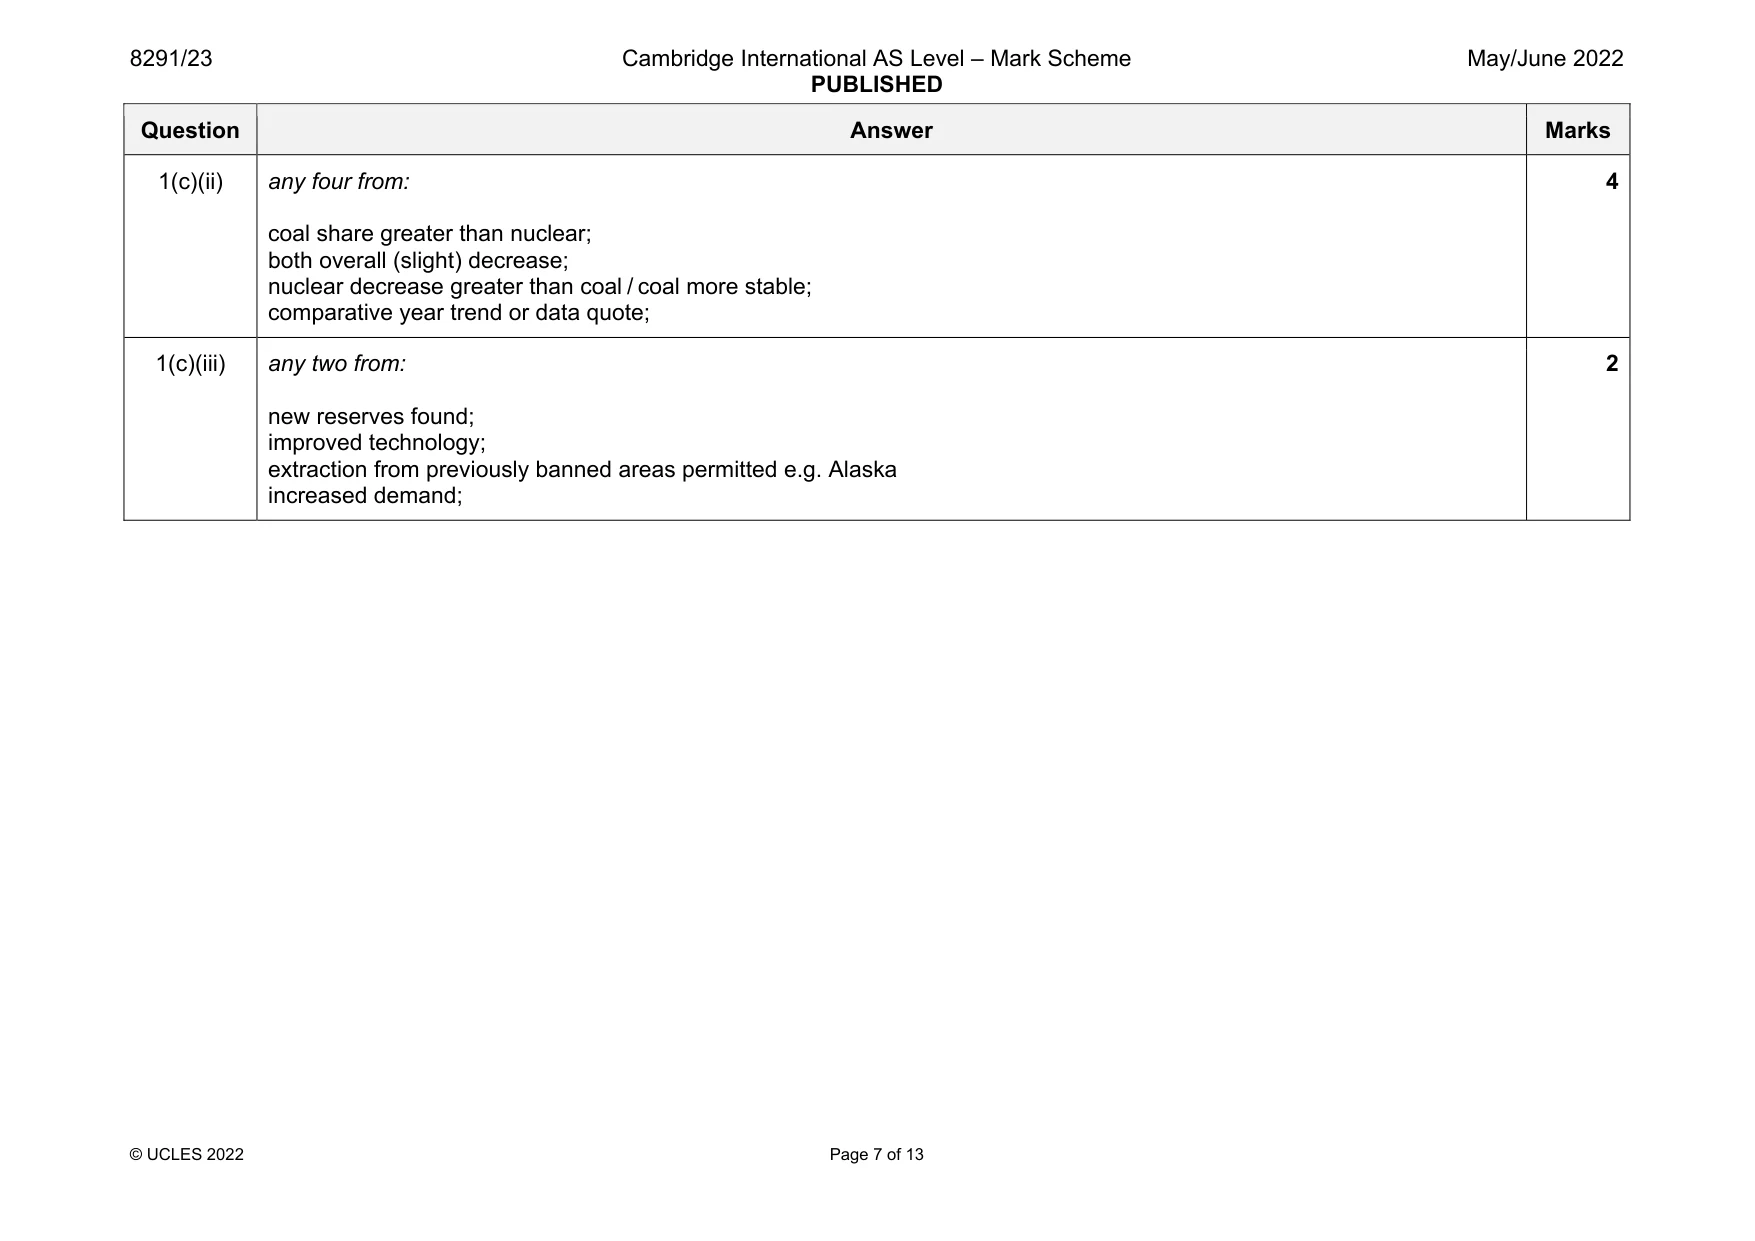
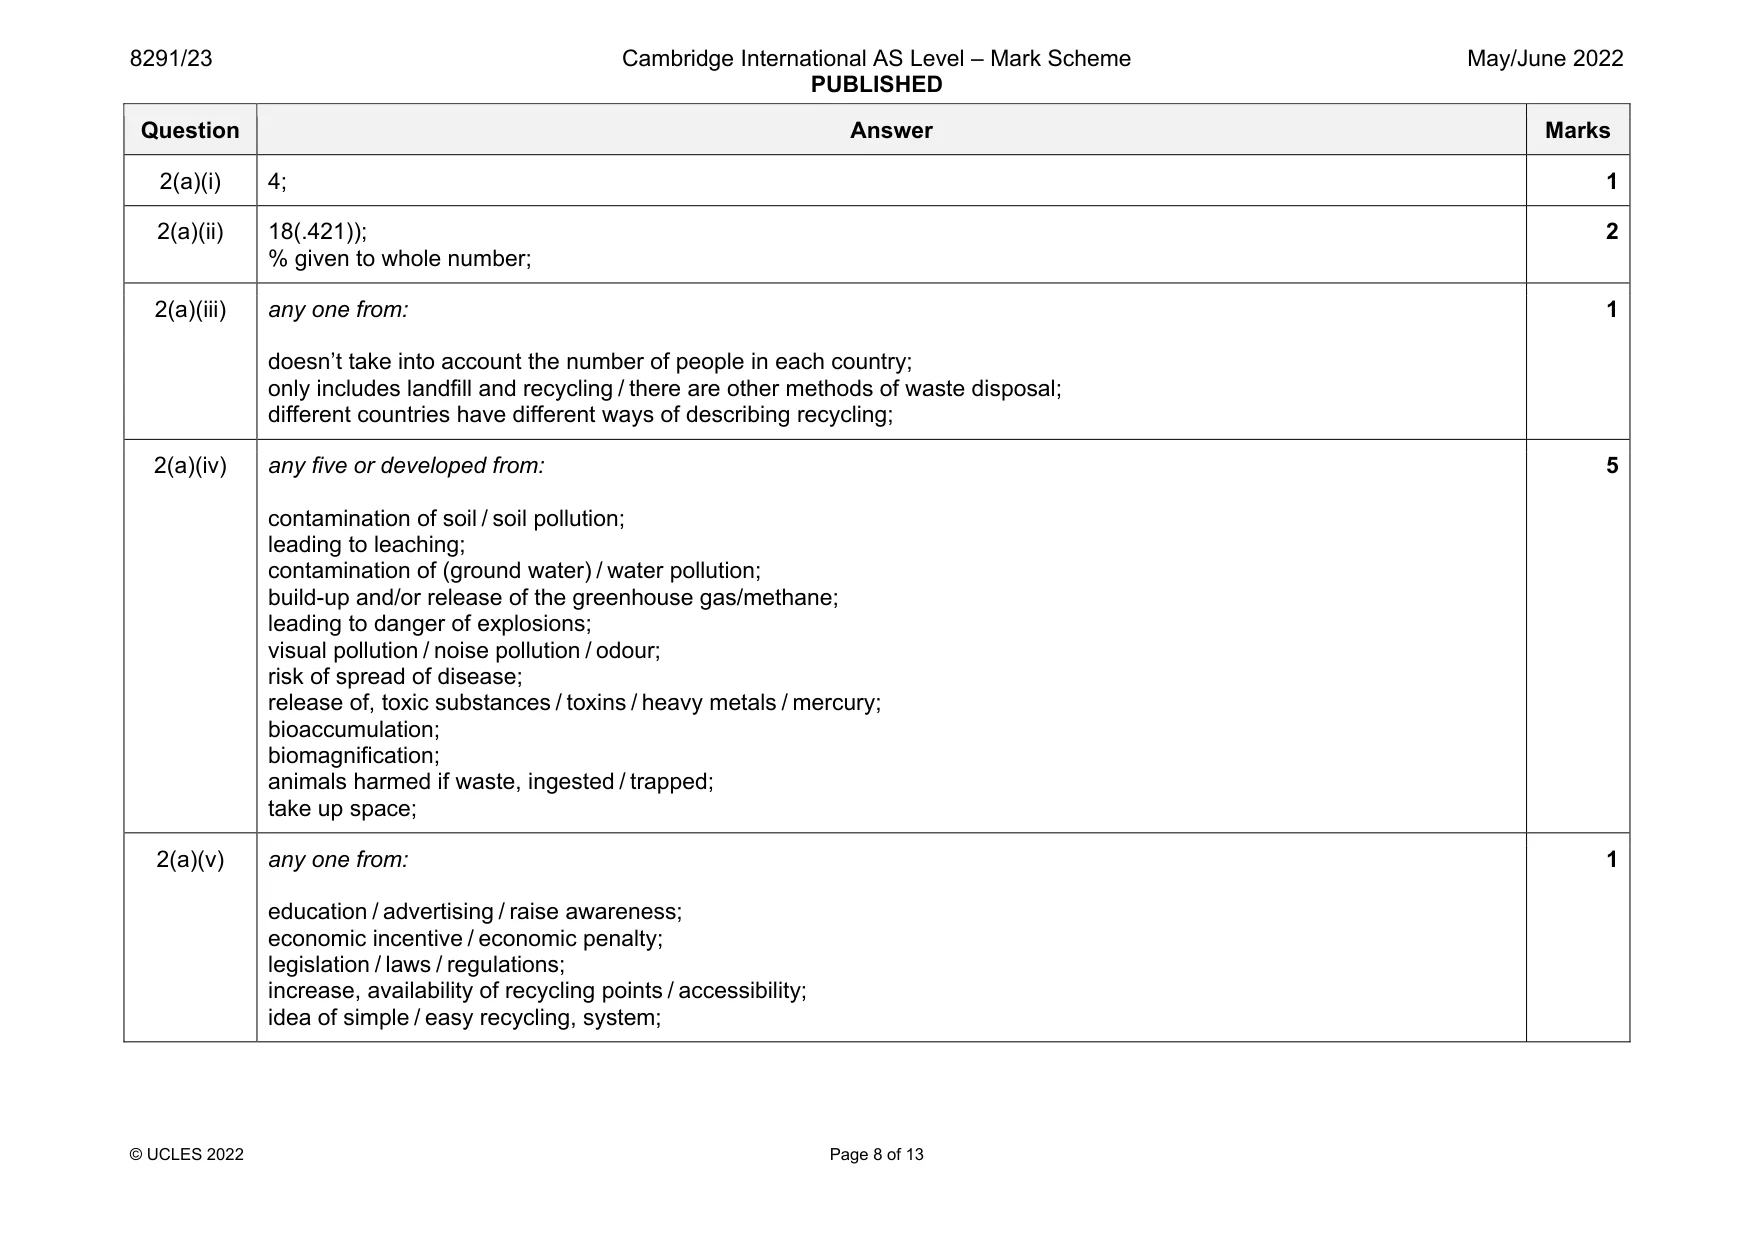
Mark scheme: 1(a)(i) any three from: coal is a fossil fuel; coal is, finite / non-renewable; burning coal produces carbon dioxide / sulfur dioxide / nitrous oxides / carbon monoxide; burning coal contributes to particulates / smoke / soot; burning coal contributes to climate change / global warming / enhanced greenhouse effect; non-carbon dioxide emitting gases needed to meet carbon targets / investment in carbon neutral fuels; burning coal contributes to acid rain; (using alternative energy sources) increases energy security; Question Answer Marks 1(a)(ii) any two from: not enough wind turbines; new technology needed / new equipment needed / lack of suitable infrastructure; weather conditions not favourable / not enough wind; expensive; (excess) energy available from other sources; 2 1(a)(iii) any two or developed from: energy insecurity; disrupted electricity supply; job losses; increased poverty; civil disruption / conflict; (import country) not self-reliant; economic reason; transport implication e.g. spillage / using fossil fuels 2 1(a)(iv) plants capture carbon dioxide; (by the process of) photosynthesis; 2 1(b) any three from: (particulates) cause (photochemical) smog; eye irritation; respiratory irritation / named condition / breathing problem / lung problem; heart ailment; cancer; decreased crop yields; leads to food shortages; 3 1(c)(i) oil; 1 Question Answer Marks 1(c)(ii) any four from: coal share greater than nuclear; both overall (slight) decrease; nuclear decrease greater than coal / coal more stable; comparative year trend or data quote; 4 1(c)(iii) any two from: new reserves found; improved technology; extraction from previously banned areas permitted e.g. Alaska increased demand; 2
Q2 · The bar chart in Fig
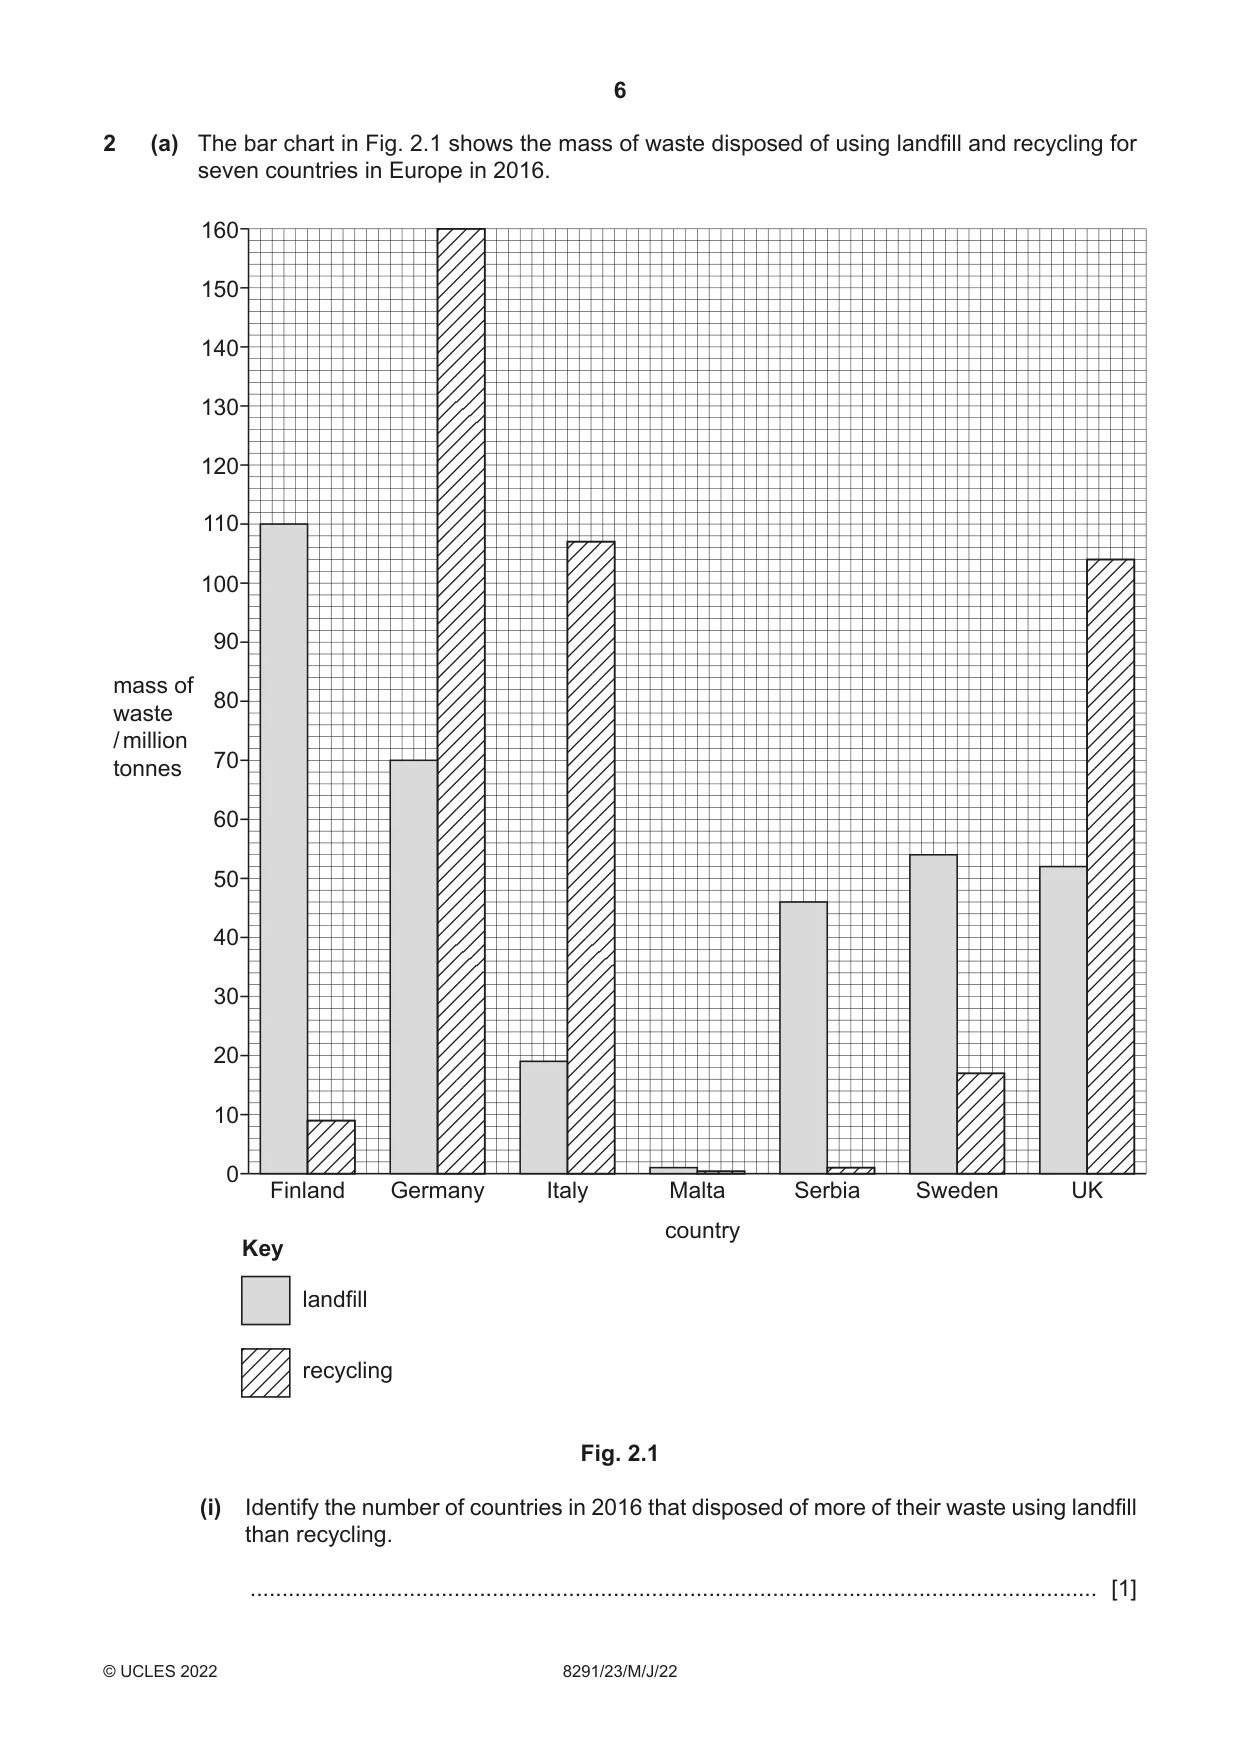
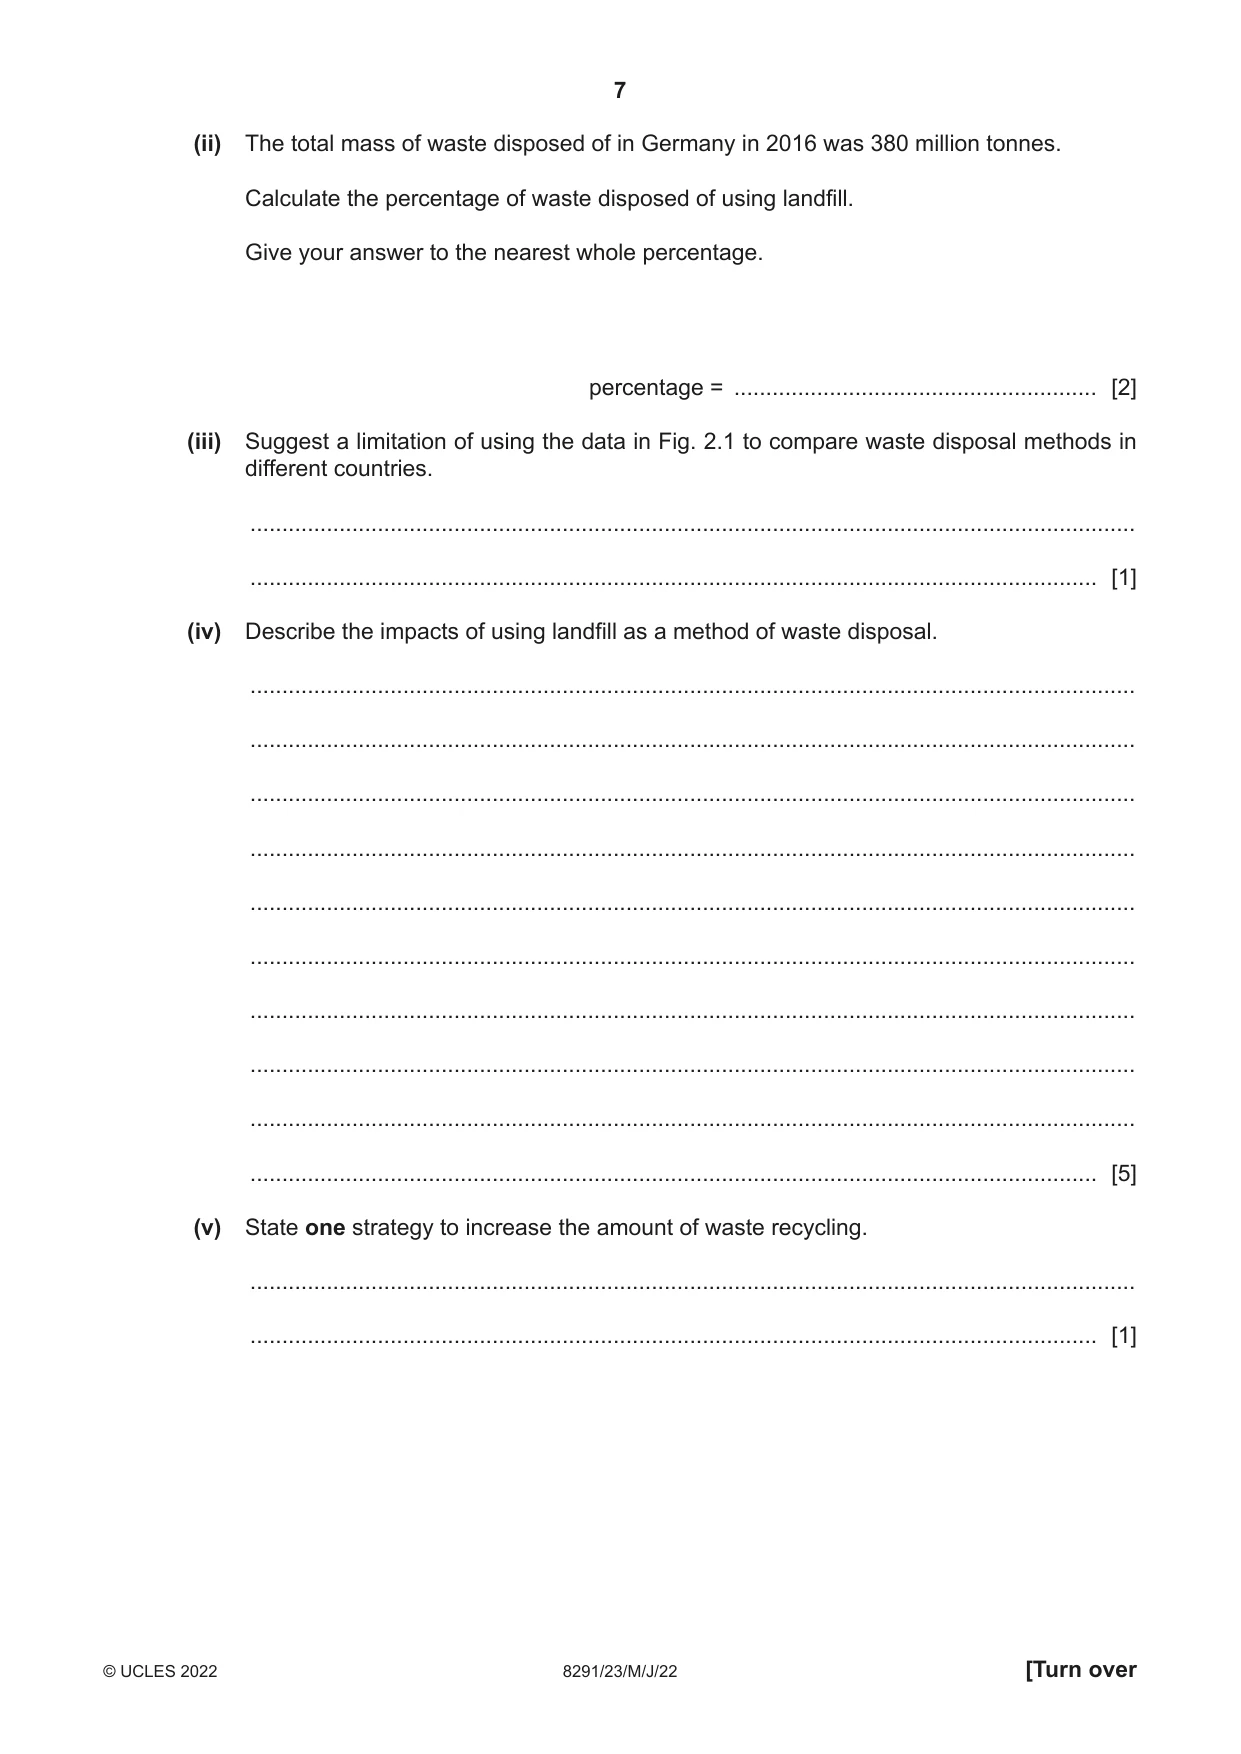
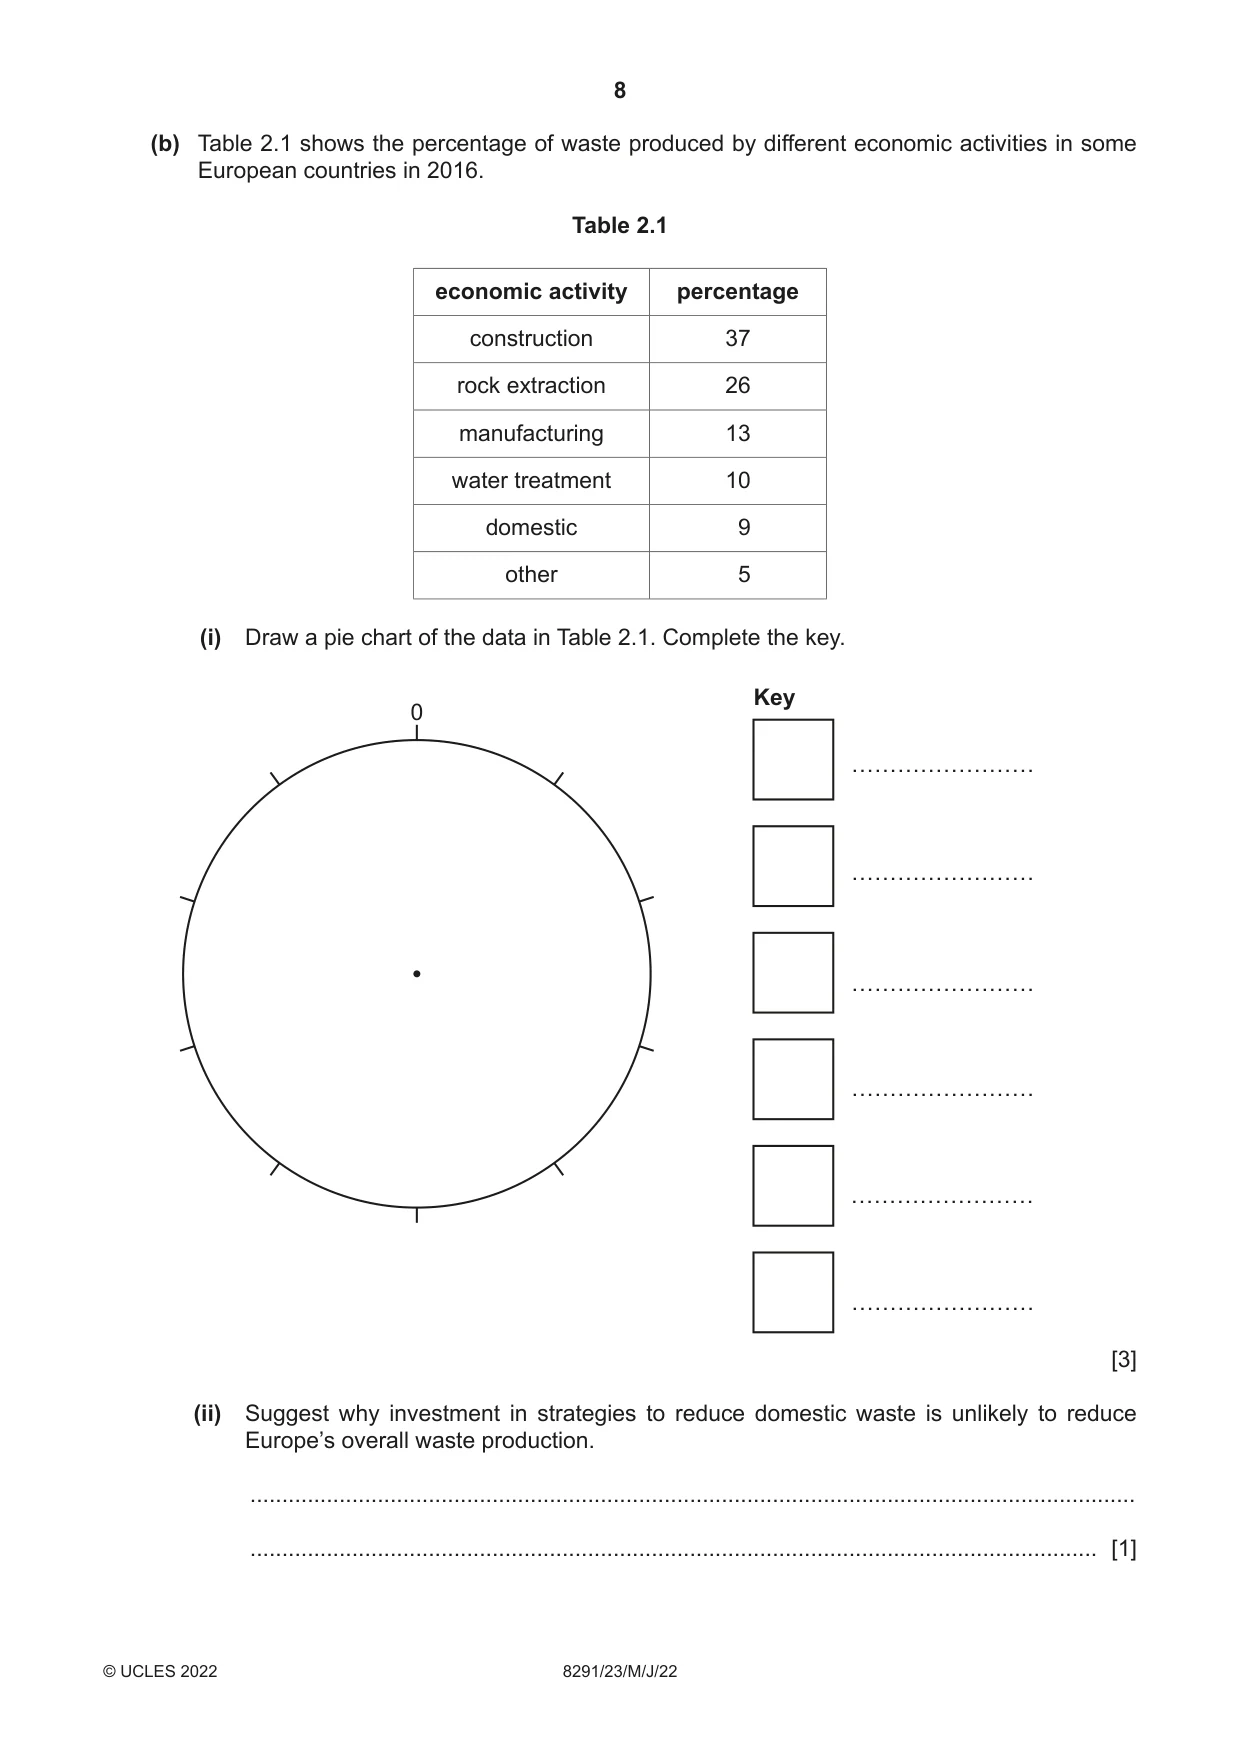
2 (a) The bar chart in Fig. 2.1 shows the mass of waste disposed of using landfill and recycling for seven countries in Europe in 2016. 160 150 140 130 120 110 100 90 mass of 80 waste / million 70 tonnes 60 50 40 30 20 10 0 Finland Germany Italy Malta Serbia Sweden UK country Key landfill recycling Fig. 2.1 (i) Identify the number of countries in 2016 that disposed of more of their waste using landfill than recycling. ..................................................................................................................................... [1] (ii) The total mass of waste disposed of in Germany in 2016 was 380 million tonnes. Calculate the percentage of waste disposed of using landfill. Give your answer to the nearest whole percentage. percentage = ......................................................... [2] (iii) Suggest a limitation of using the data in Fig. 2.1 to compare waste disposal methods in different countries. ........................................................................................................................................... ..................................................................................................................................... [1] (iv) Describe the impacts of using landfill as a method of waste disposal. ........................................................................................................................................... ........................................................................................................................................... ........................................................................................................................................... ........................................................................................................................................... ........................................................................................................................................... ........................................................................................................................................... ........................................................................................................................................... ........................................................................................................................................... ........................................................................................................................................... ..................................................................................................................................... [5] (v) State one strategy to increase the amount of waste recycling. ........................................................................................................................................... ..................................................................................................................................... [1] (b) Table 2.1 shows the percentage of waste produced by different economic activities in some European countries in 2016. Table 2.1 economic activity percentage construction 37 rock extraction 26 manufacturing 13 water treatment 10 domestic 9 other 5 (i) Draw a pie chart of the data in Table 2.1. Complete the key. Key 0 [3] (ii) Suggest why investment in strategies to reduce domestic waste is unlikely to reduce Europe’s overall waste production. ........................................................................................................................................... ..................................................................................................................................... [1] (c) Explain how waste incineration can benefit a country. ................................................................................................................................................... ................................................................................................................................................... ................................................................................................................................................... ............................................................................................................................................. [2] [Total: 16]
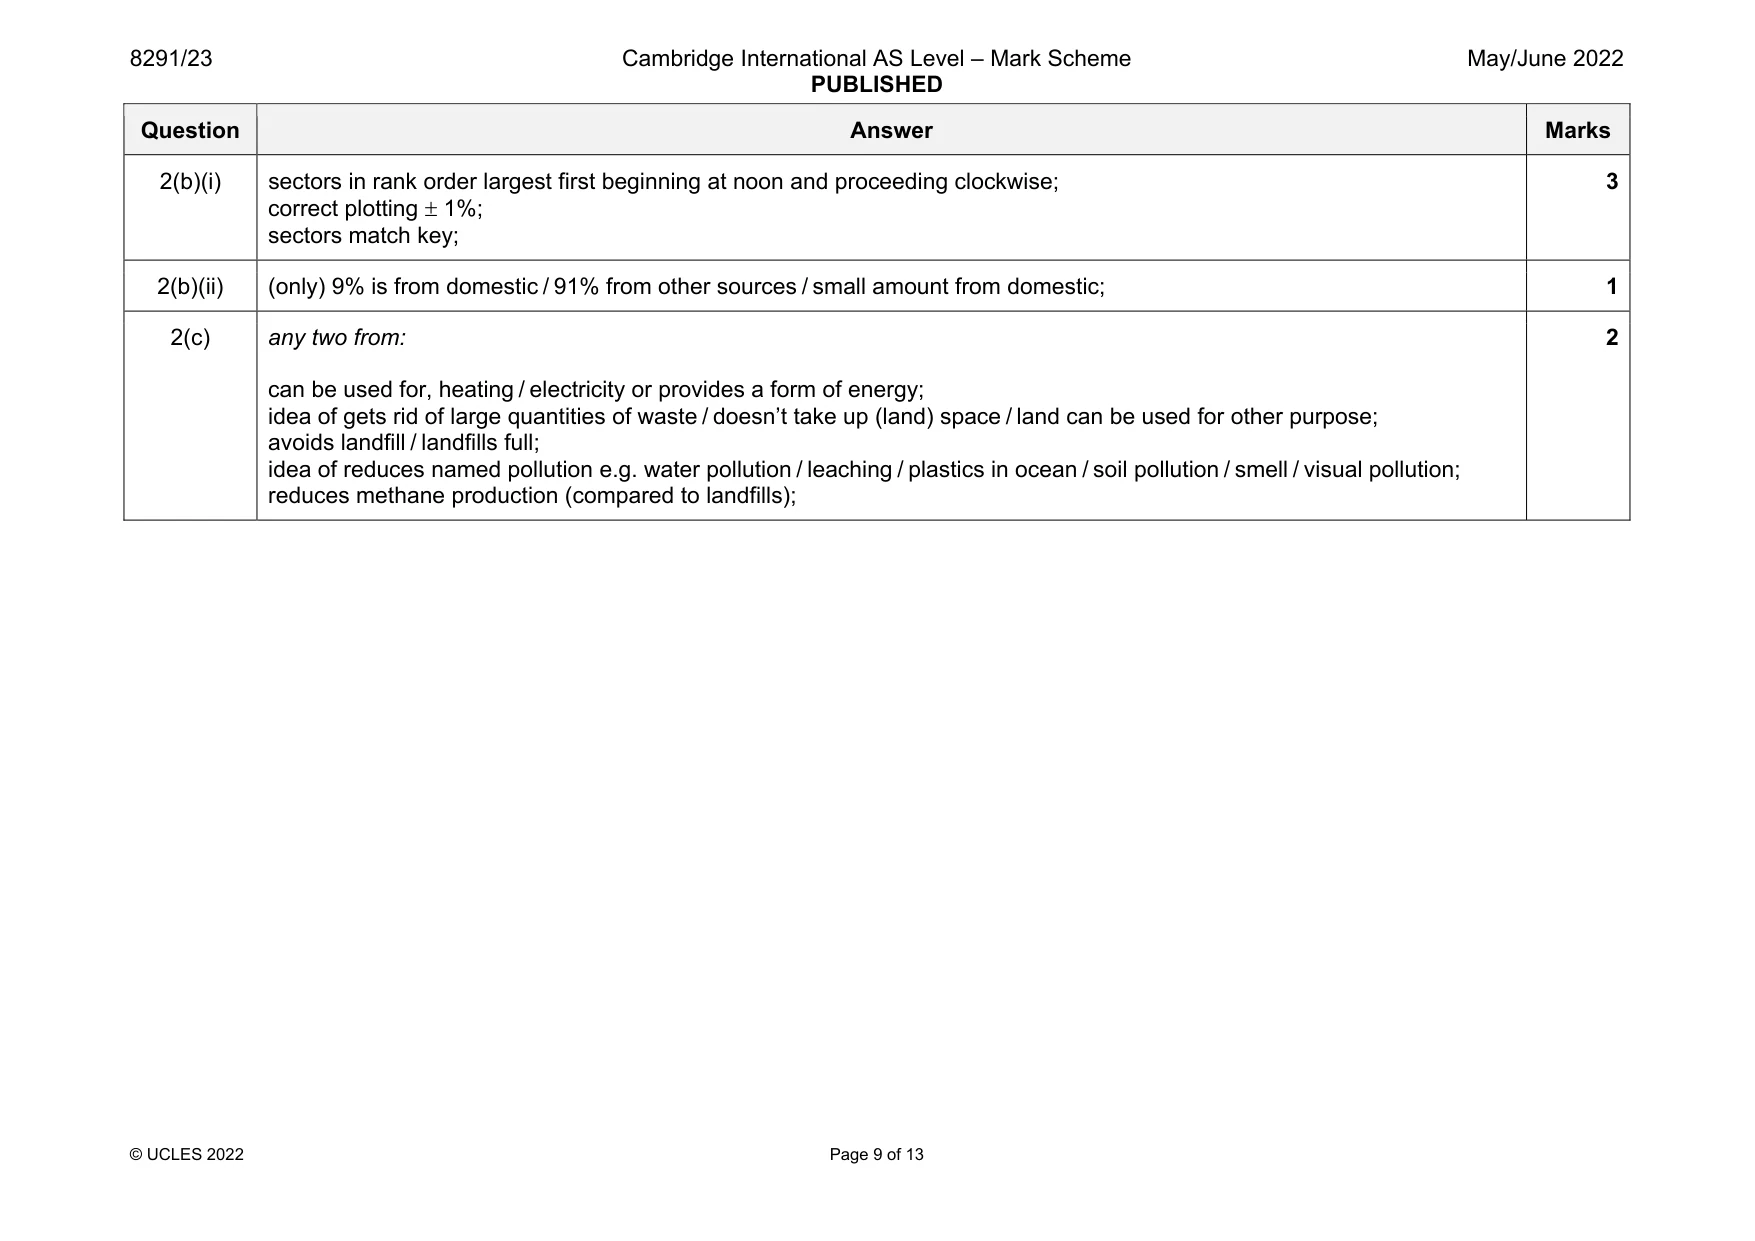
Mark scheme: 2(a)(i) 4; 1 2(a)(ii) 18(.421)); % given to whole number; 2 2(a)(iii) any one from: doesn’t take into account the number of people in each country; only includes landfill and recycling / there are other methods of waste disposal; different countries have different ways of describing recycling; 1 2(a)(iv) any five or developed from: contamination of soil / soil pollution; leading to leaching; contamination of (ground water) / water pollution; build-up and/or release of the greenhouse gas/methane; leading to danger of explosions; visual pollution / noise pollution / odour; risk of spread of disease; release of, toxic substances / toxins / heavy metals / mercury; bioaccumulation; biomagnification; animals harmed if waste, ingested / trapped; take up space; 5 2(a)(v) any one from: education / advertising / raise awareness; economic incentive / economic penalty; legislation / laws / regulations; increase, availability of recycling points / accessibility; idea of simple / easy recycling, system; 1 Question Answer Marks 2(b)(i) sectors in rank order largest first beginning at noon and proceeding clockwise; correct plotting 1%; sectors match key; 3 2(b)(ii) (only) 9% is from domestic / 91% from other sources / small amount from domestic; 1 2(c) any two from: can be used for, heating / electricity or provides a form of energy; idea of gets rid of large quantities of waste / doesn’t take up (land) space / land can be used for other purpose; avoids landfill / landfills full; idea of reduces named pollution e.g. water pollution / leaching / plastics in ocean / soil pollution / smell / visual pollution; reduces methane production (compared to landfills); 2
Q3 · A conservationist uses aerial photographs to estimate the population of a species of bird
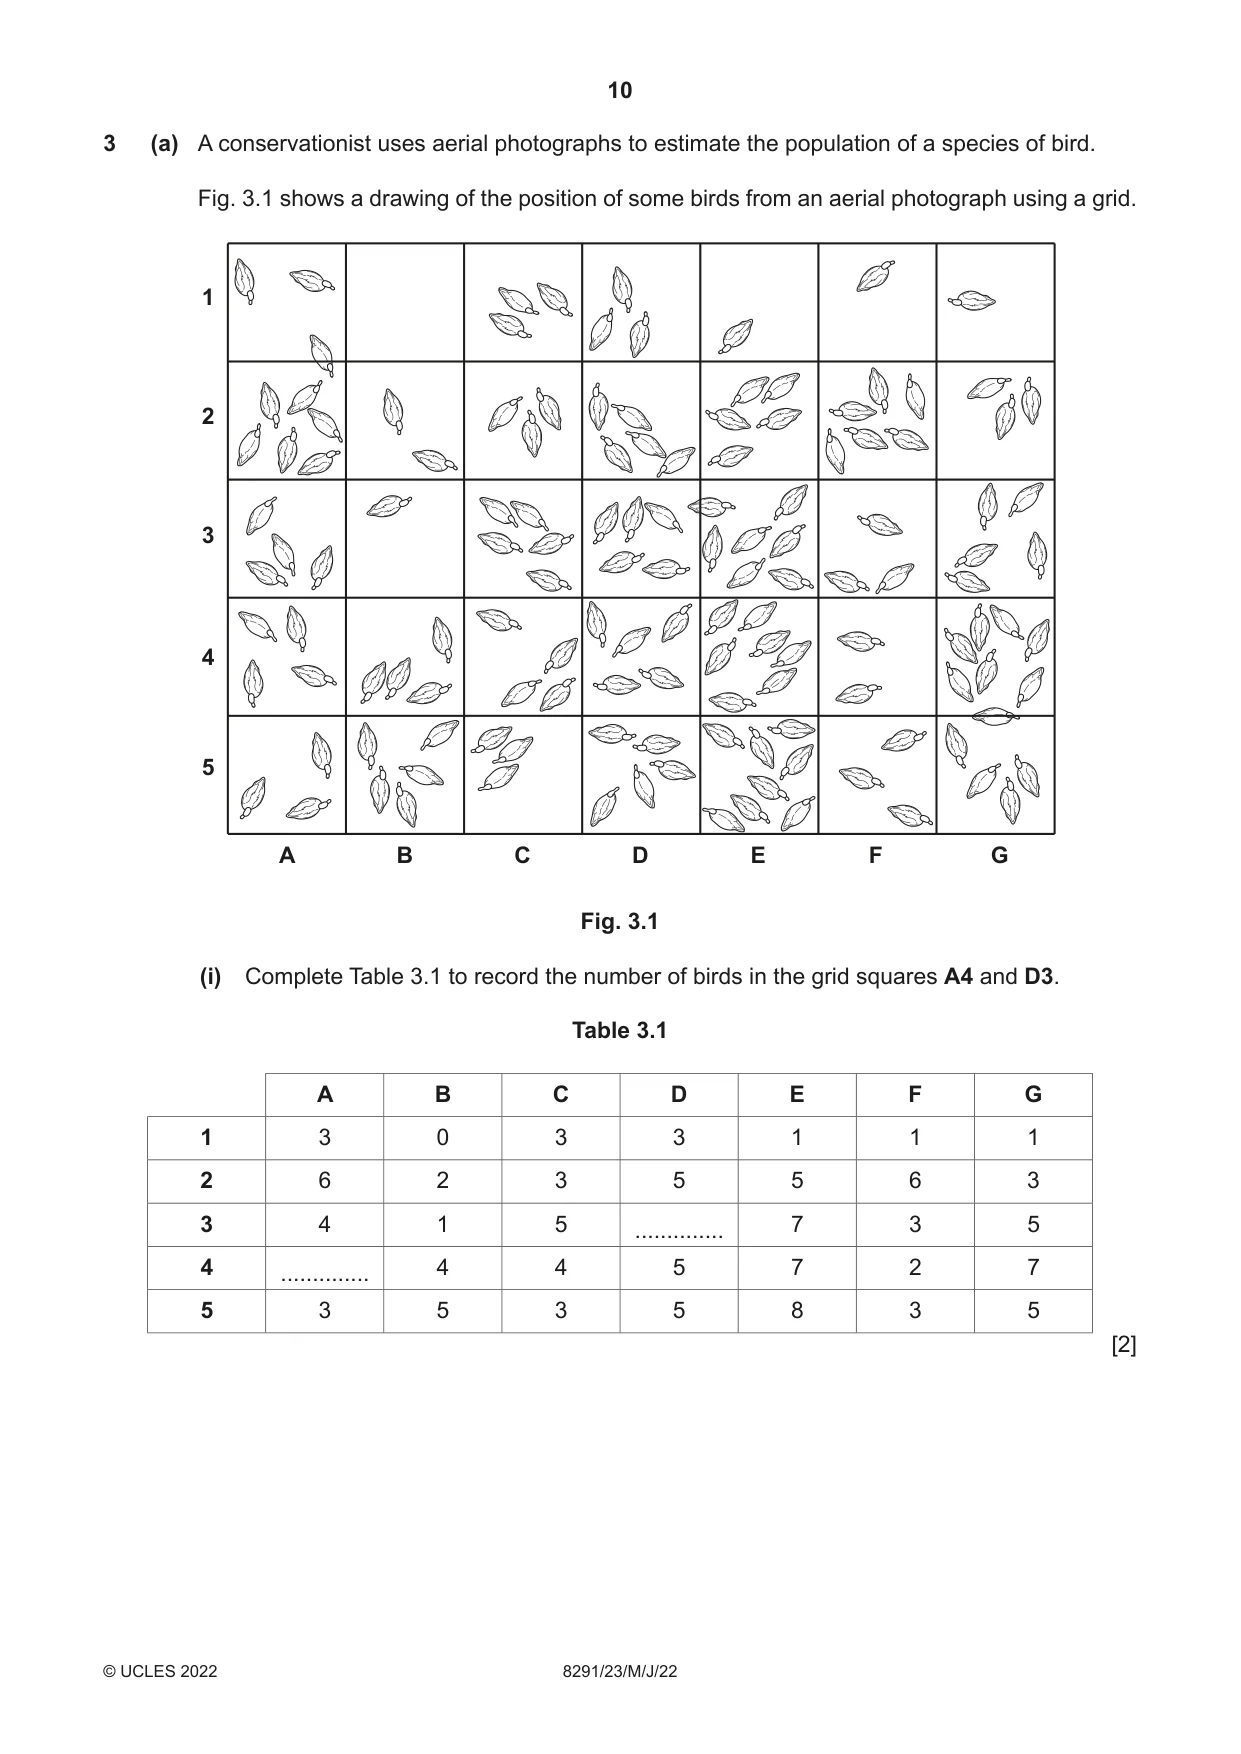
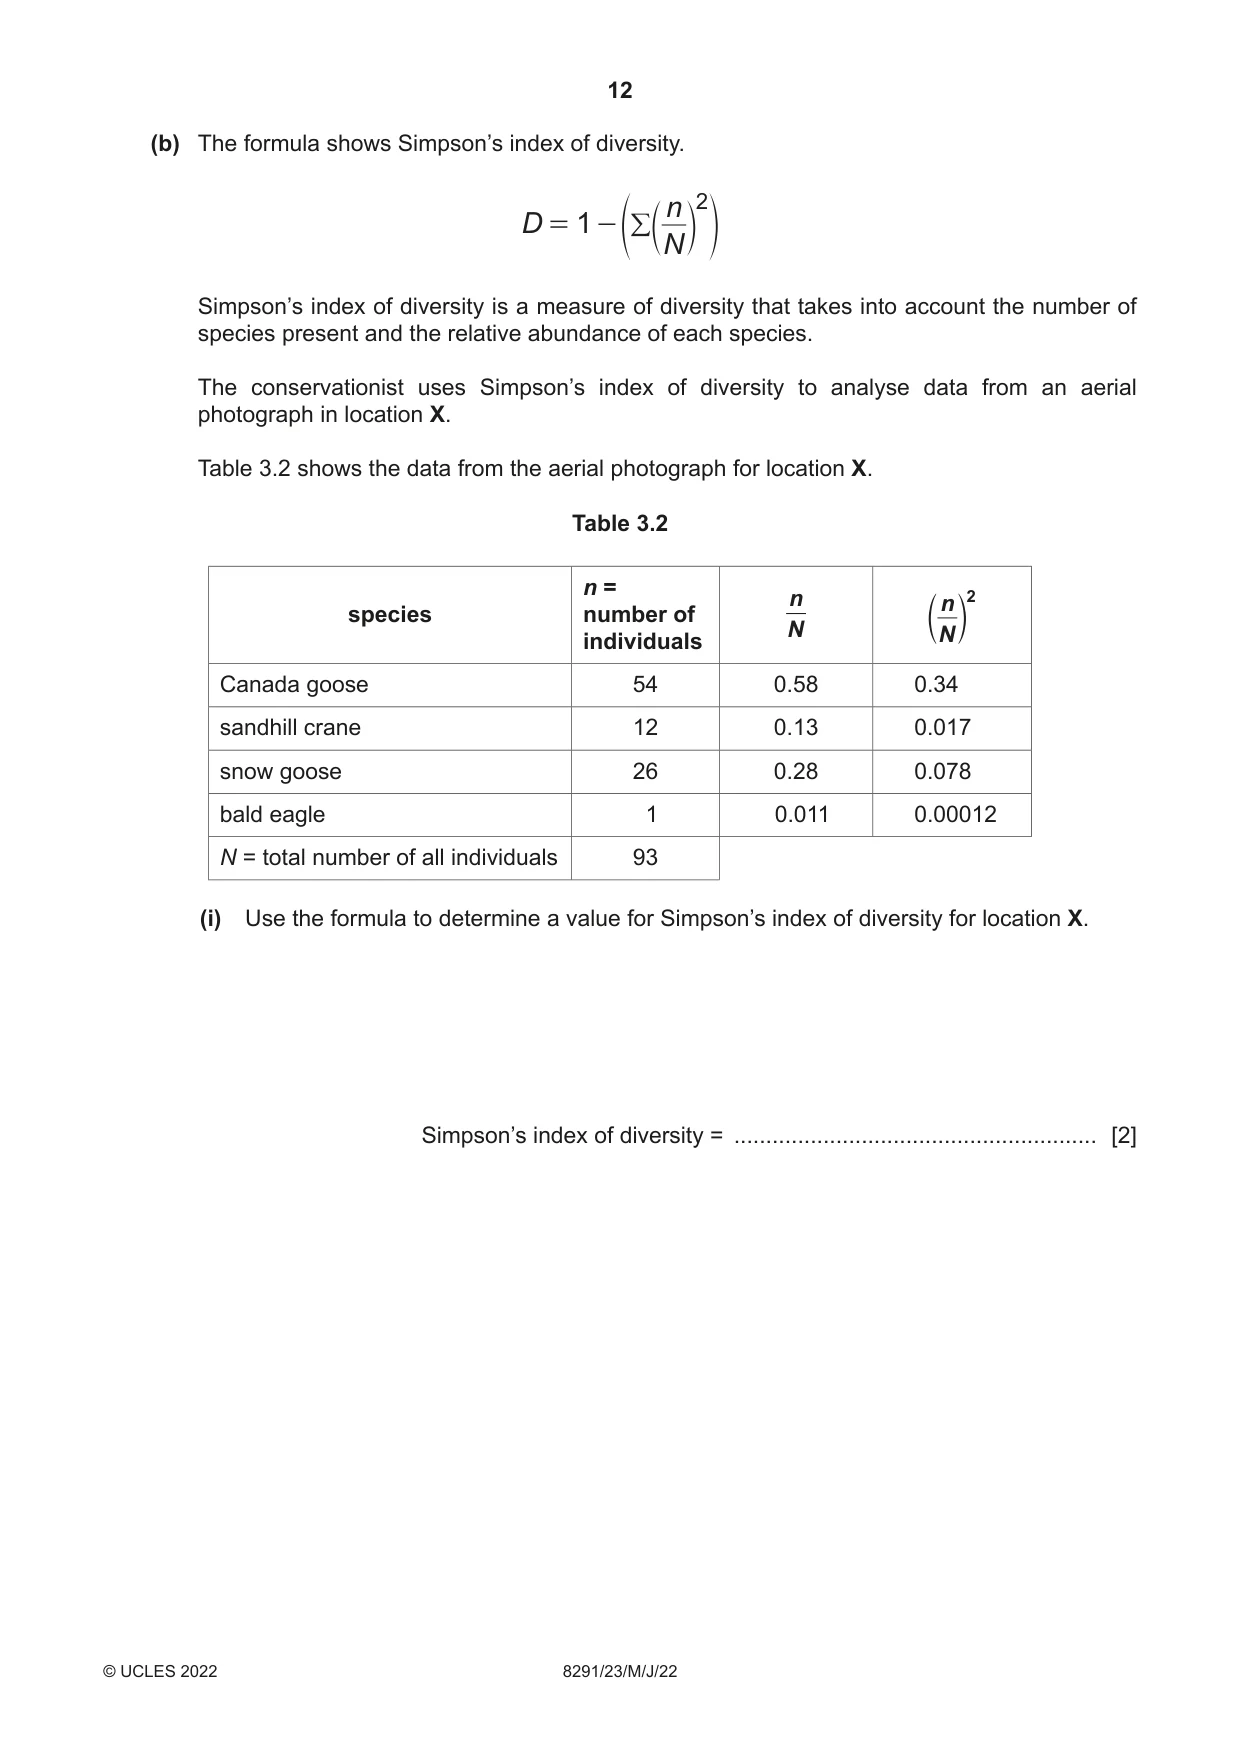
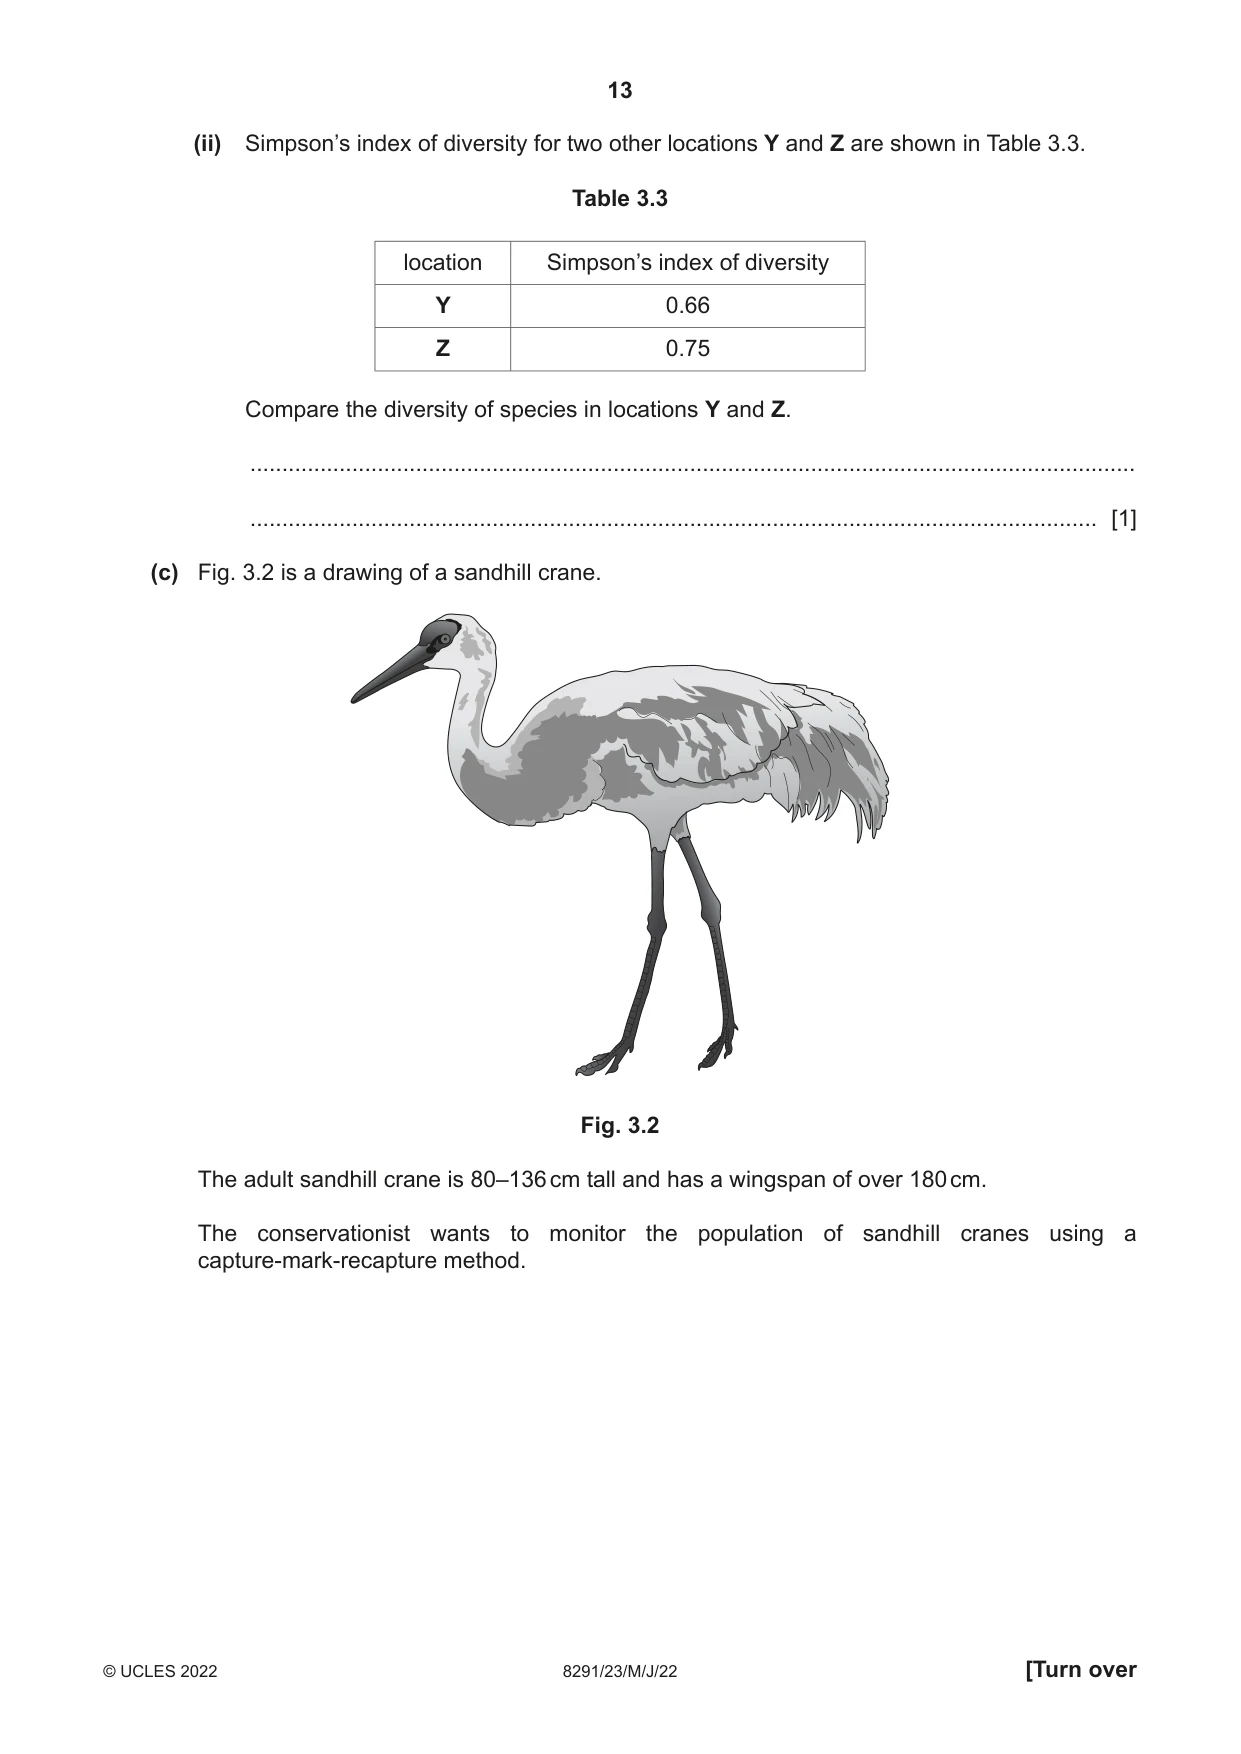
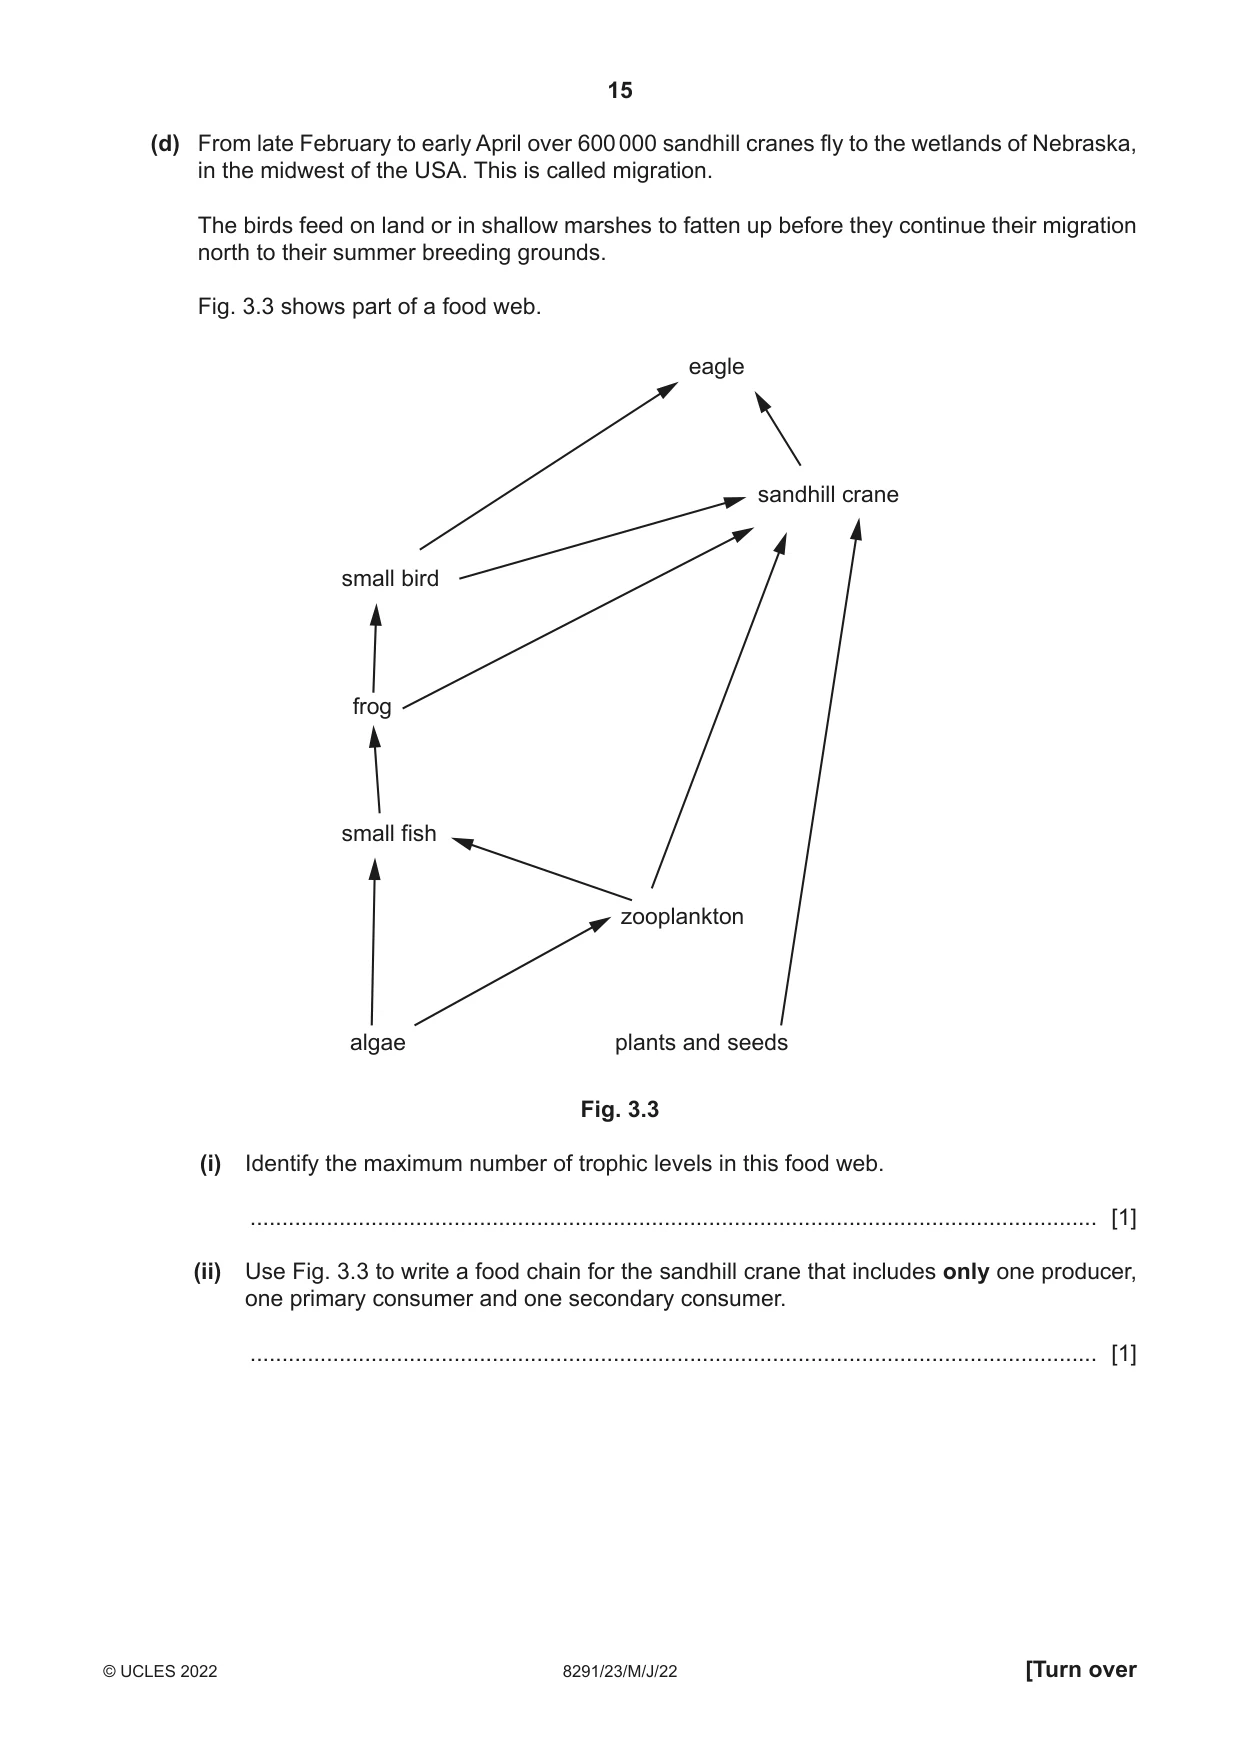
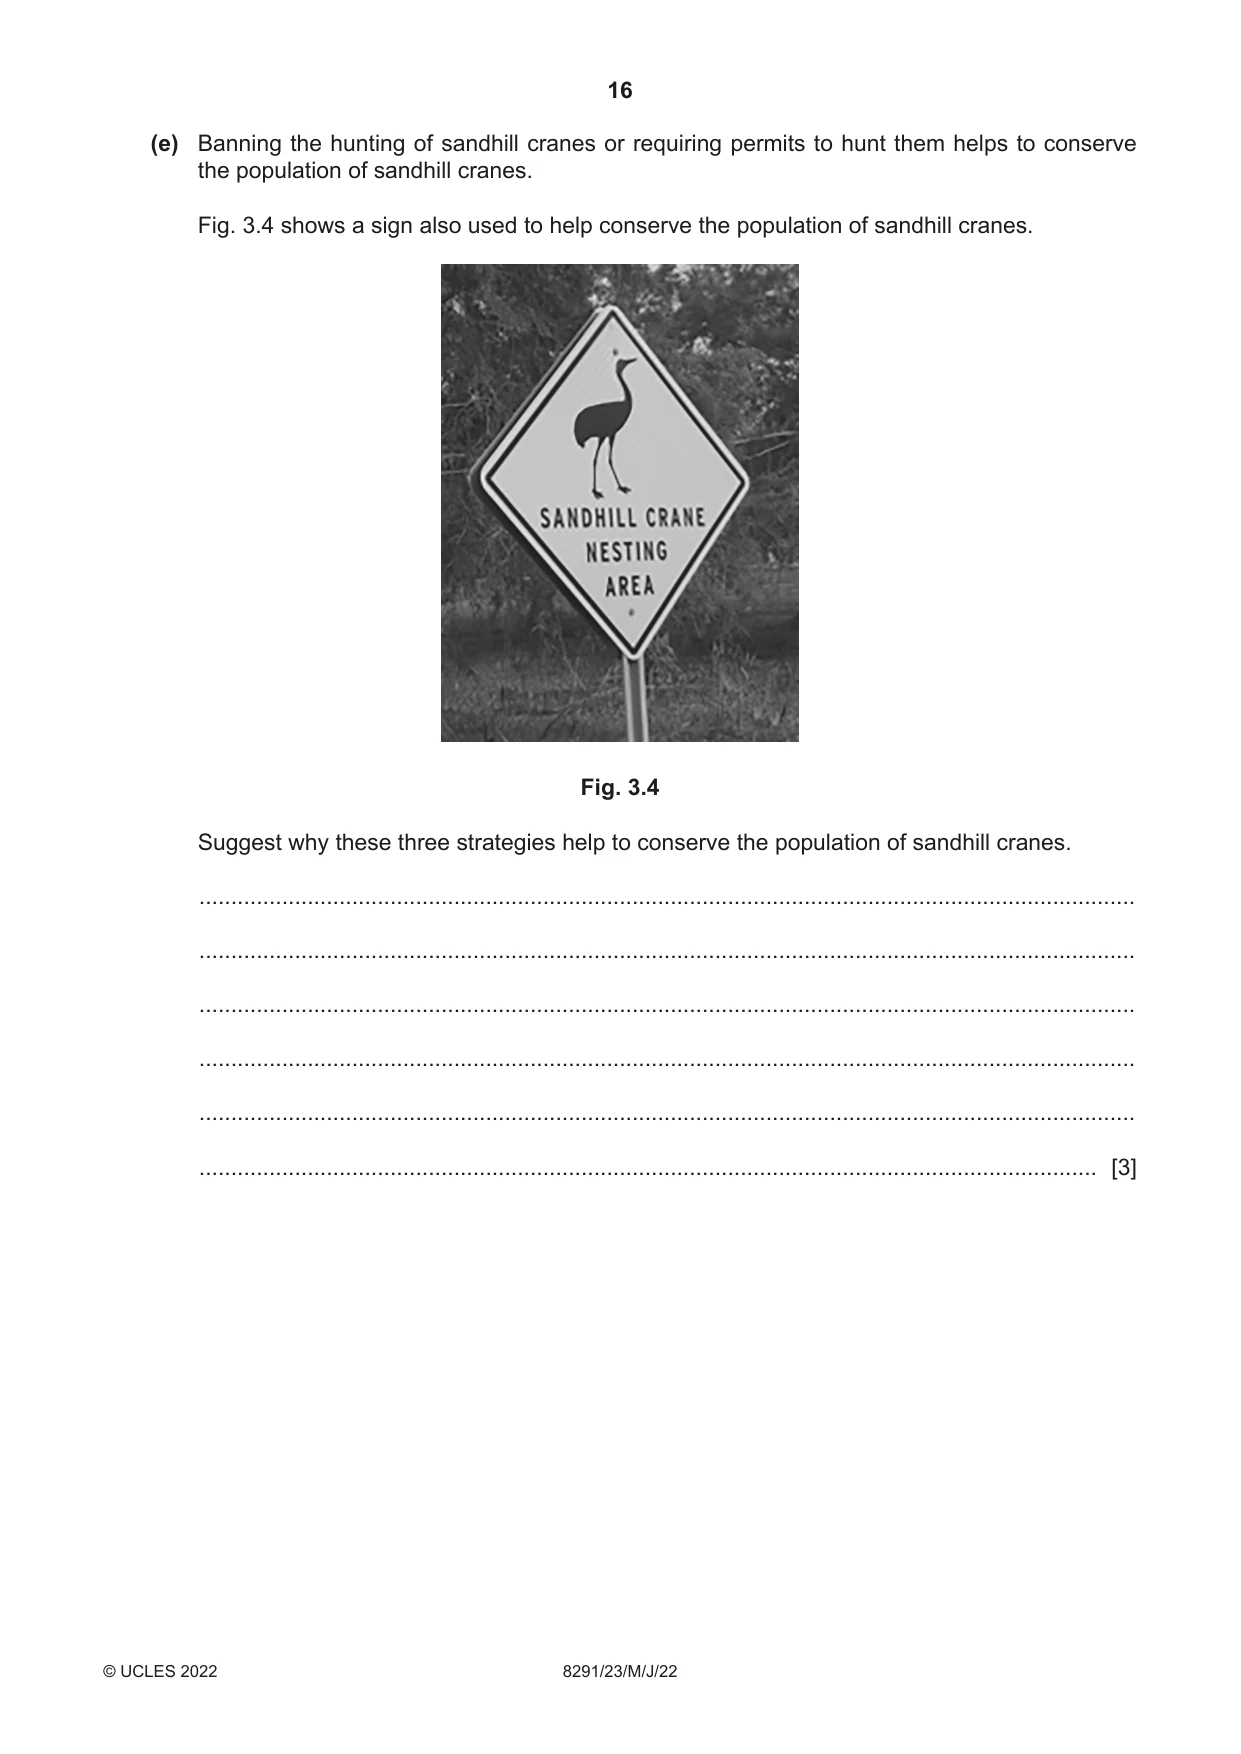
3 (a) A conservationist uses aerial photographs to estimate the population of a species of bird. Fig. 3.1 shows a drawing of the position of some birds from an aerial photograph using a grid. 1 2 3 4 5 A B C D E F G Fig. 3.1 (i) Complete Table 3.1 to record the number of birds in the grid squares A4 and D3. Table 3.1 A B C D E F G 1 3 0 3 3 1 1 1 2 6 2 3 5 5 6 3 3 4 1 5 .............. 7 3 5 4 .............. 4 4 5 7 2 7 5 3 5 3 5 8 3 5 [2] (ii) Describe the benefits and limitations of using aerial photographs to survey the population of birds. benefits .............................................................................................................................. ........................................................................................................................................... ........................................................................................................................................... ........................................................................................................................................... limitations .......................................................................................................................... ........................................................................................................................................... ........................................................................................................................................... ........................................................................................................................................... [4] (b) The formula shows Simpson’s index of diversity. n 2 D = 1 / -f d N n p Simpson’s index of diversity is a measure of diversity that takes into account the number of species present and the relative abundance of each species. The conservationist uses Simpson’s index of diversity to analyse data from an aerial photograph in location X. Table 3.2 shows the data from the aerial photograph for location X. Table 3.2 n = 2 n n species number of N d N n individuals Canada goose 54 0.58 0.34 sandhill crane 12 0.13 0.017 snow goose 26 0.28 0.078 bald eagle 1 0.011 0.00012 N = total number of all individuals 93 (i) Use the formula to determine a value for Simpson’s index of diversity for location X. Simpson’s index of diversity = ......................................................... [2] (ii) Simpson’s index of diversity for two other locations Y and Z are shown in Table 3.3. Table 3.3 location Simpson’s index of diversity Y 0.66 Z 0.75 Compare the diversity of species in locations Y and Z. ........................................................................................................................................... ..................................................................................................................................... [1] (c) Fig. 3.2 is a drawing of a sandhill crane. Fig. 3.2 The adult sandhill crane is 80–136 cm tall and has a wingspan of over 180 cm. The conservationist wants to monitor the population of sandhill cranes using a capture-mark-recapture method. (i) Outline the capture-mark-recapture method the conservationist can use. ........................................................................................................................................... ........................................................................................................................................... ........................................................................................................................................... ........................................................................................................................................... ........................................................................................................................................... ..................................................................................................................................... [3] (ii) State two assumptions that must be made when using capture-mark-recapture data. 1 ........................................................................................................................................ ........................................................................................................................................... 2 ........................................................................................................................................ ........................................................................................................................................... [2] (d) From late February to early April over 600 000 sandhill cranes fly to the wetlands of Nebraska, in the midwest of the USA. This is called migration. The birds feed on land or in shallow marshes to fatten up before they continue their migration north to their summer breeding grounds. Fig. 3.3 shows part of a food web. eagle sandhill crane small bird frog small fish zooplankton algae plants and seeds Fig. 3.3 (i) Identify the maximum number of trophic levels in this food web. ..................................................................................................................................... [1] (ii) Use Fig. 3.3 to write a food chain for the sandhill crane that includes only one producer, one primary consumer and one secondary consumer. ..................................................................................................................................... [1] (e) Banning the hunting of sandhill cranes or requiring permits to hunt them helps to conserve the population of sandhill cranes. Fig. 3.4 shows a sign also used to help conserve the population of sandhill cranes. Fig. 3.4 Suggest why these three strategies help to conserve the population of sandhill cranes. ................................................................................................................................................... ................................................................................................................................................... ................................................................................................................................................... ................................................................................................................................................... ................................................................................................................................................... ............................................................................................................................................. [3] (f) Climate change is a threat to the sandhill crane. Suggest why climate change could decrease the population of sandhill cranes. Give reasons for your answer. ................................................................................................................................................... ................................................................................................................................................... ................................................................................................................................................... ................................................................................................................................................... ................................................................................................................................................... ................................................................................................................................................... ................................................................................................................................................... ............................................................................................................................................. [4] [Total: 23]
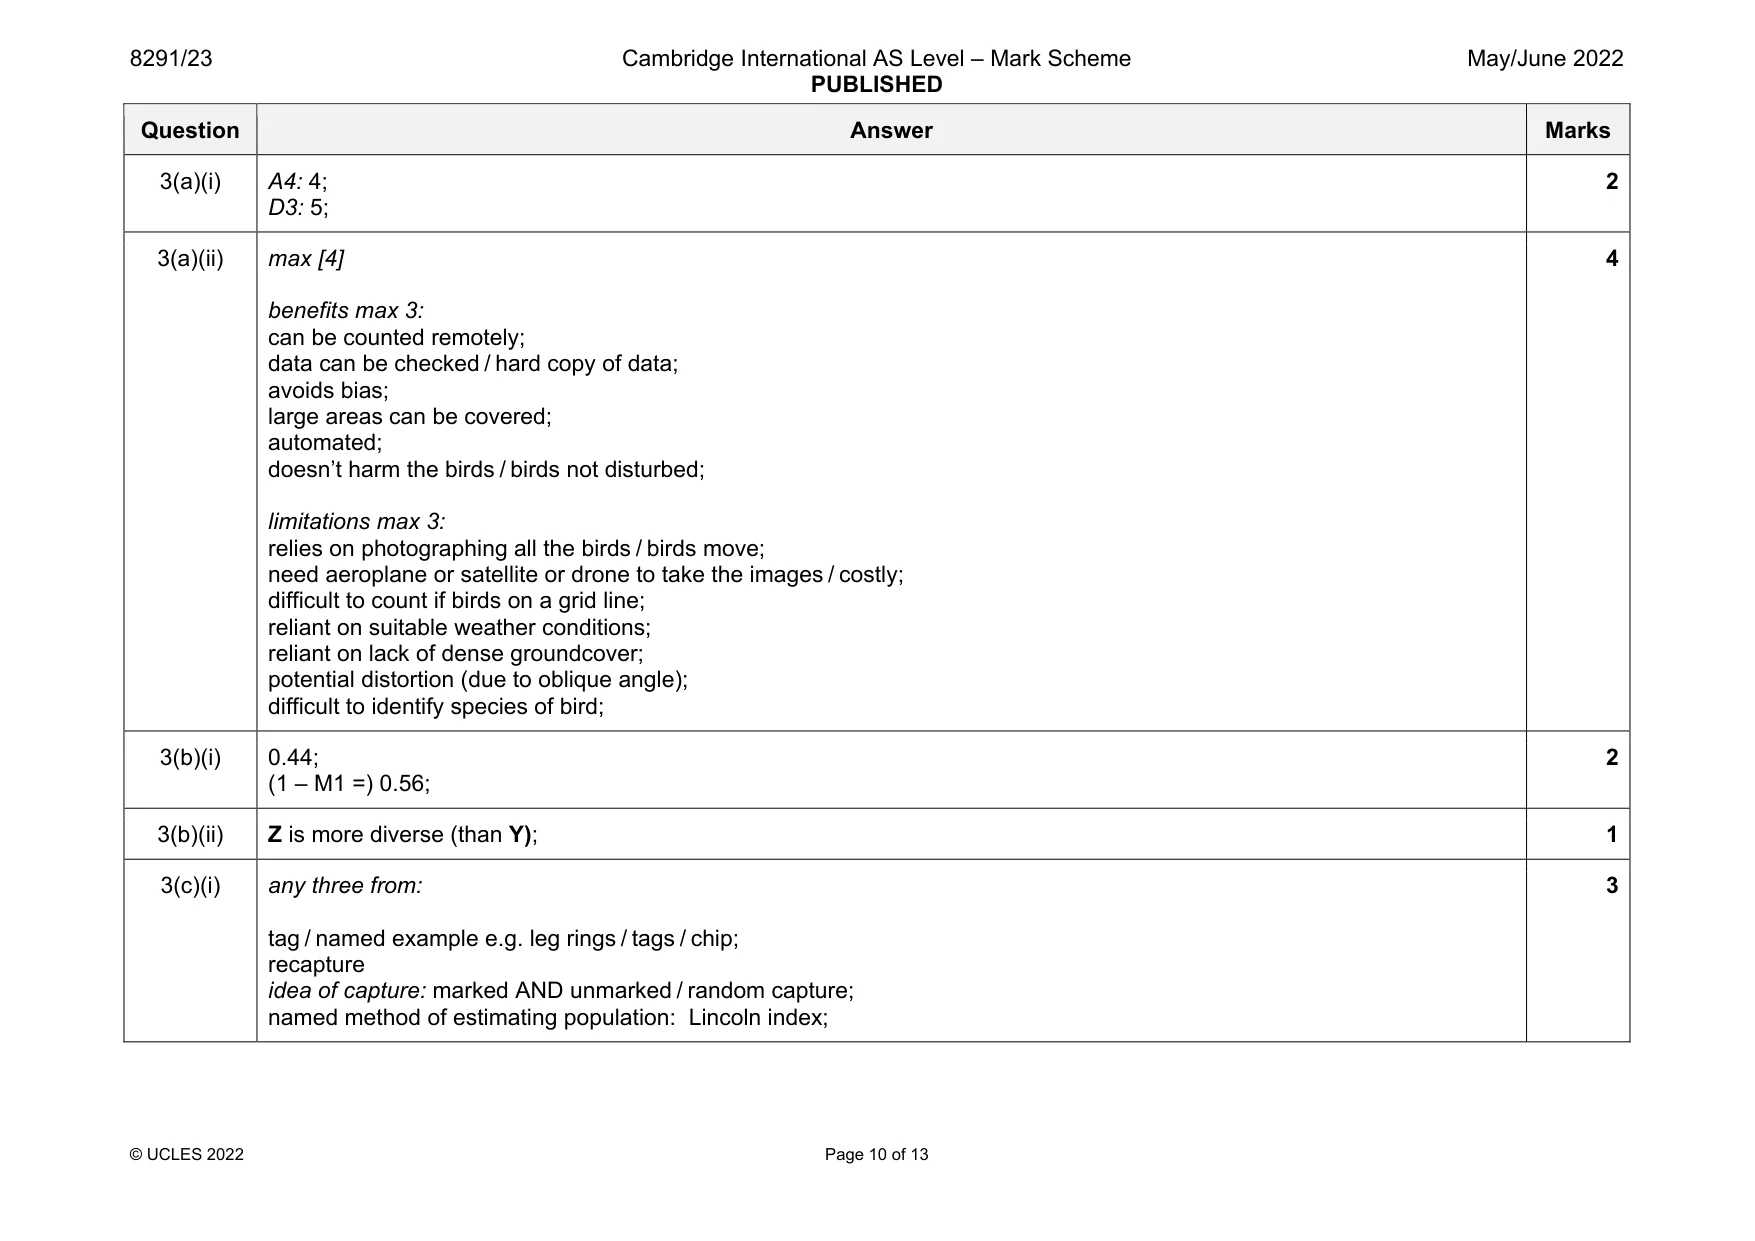
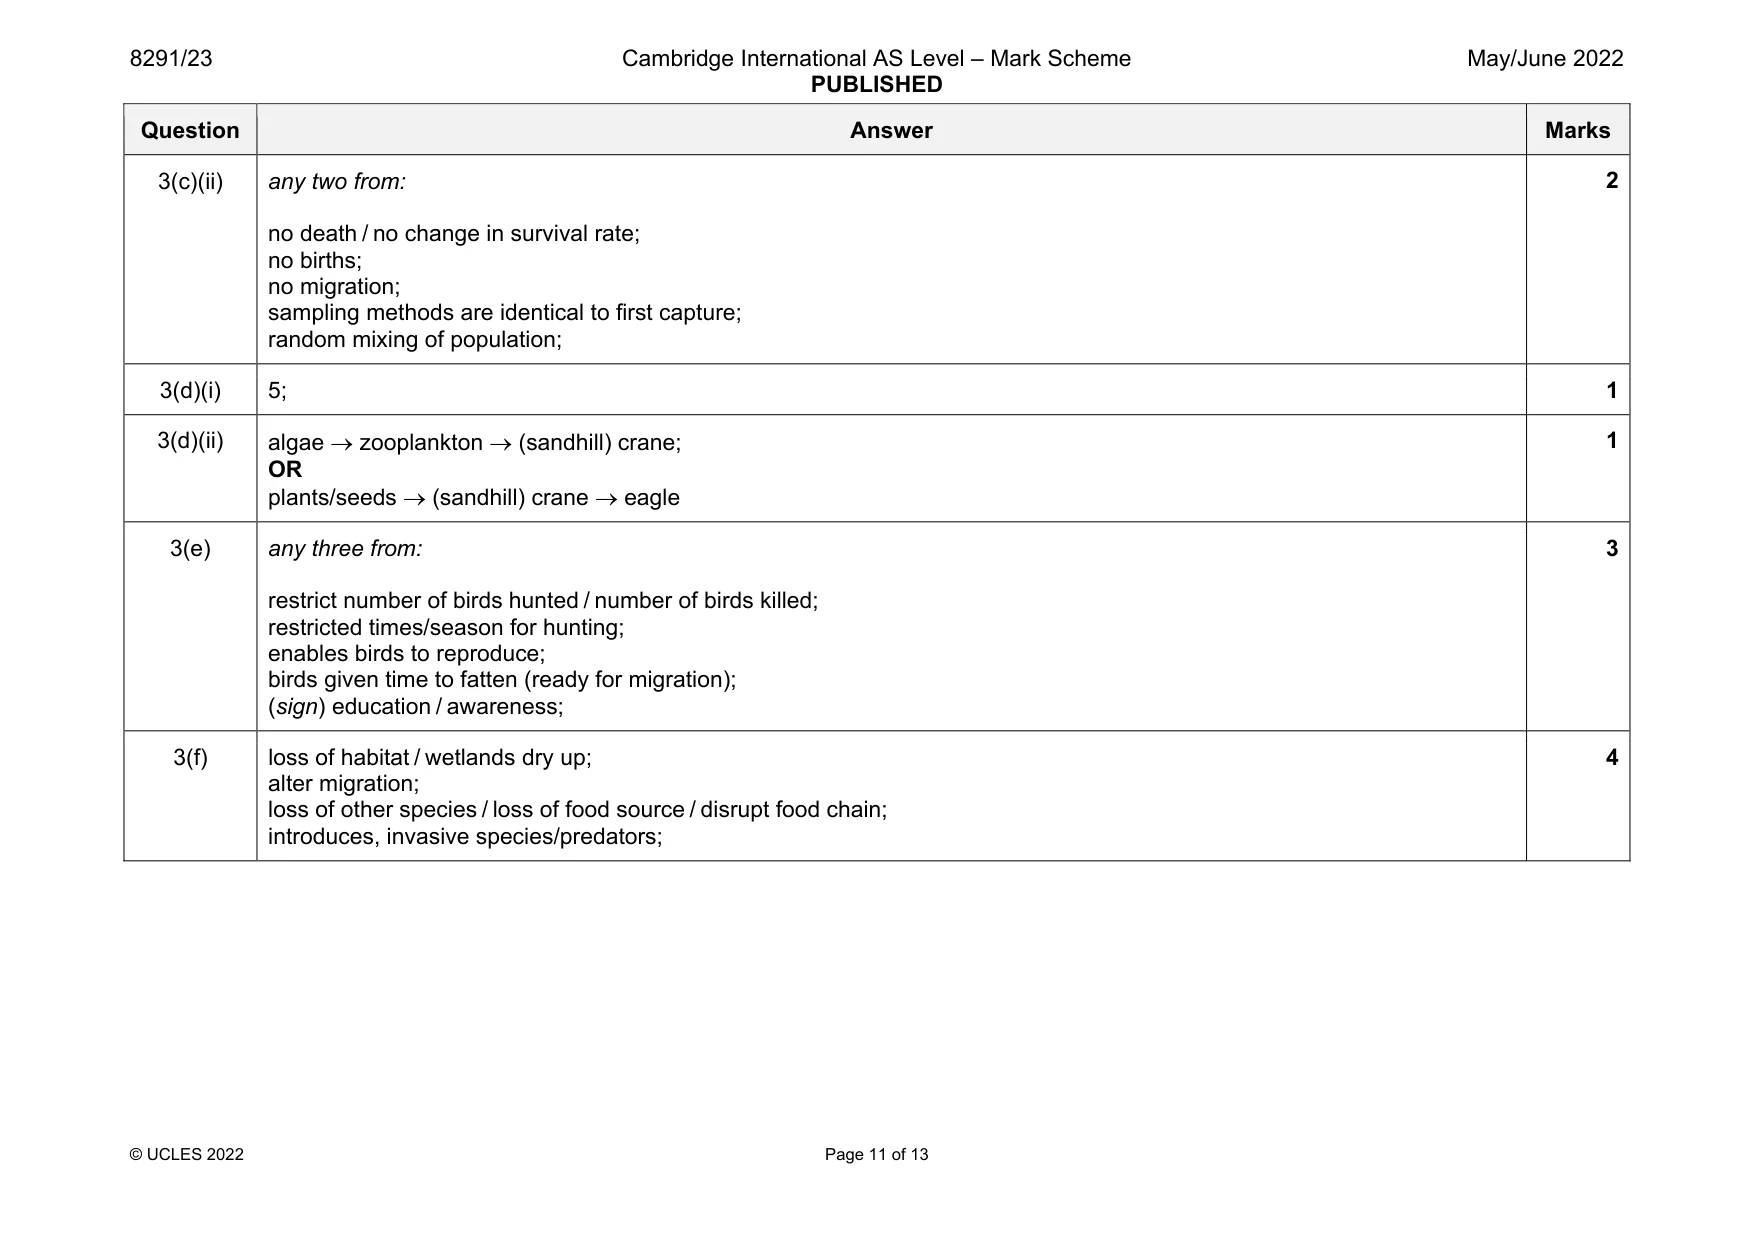
Mark scheme: 3(a)(i) A4: 4; D3: 5; 2 3(a)(ii) max [4] benefits max 3: can be counted remotely; data can be checked / hard copy of data; avoids bias; large areas can be covered; automated; doesn’t harm the birds / birds not disturbed; limitations max 3: relies on photographing all the birds / birds move; need aeroplane or satellite or drone to take the images / costly; difficult to count if birds on a grid line; reliant on suitable weather conditions; reliant on lack of dense groundcover; potential distortion (due to oblique angle); difficult to identify species of bird; 4 3(b)(i) 0.44; (1 – M1 =) 0.56; 2 3(b)(ii) Z is more diverse (than Y); 1 3(c)(i) any three from: tag / named example e.g. leg rings / tags / chip; recapture idea of capture: marked AND unmarked / random capture; named method of estimating population: Lincoln index; 3 Question Answer Marks 3(c)(ii) any two from: no death / no change in survival rate; no births; no migration; sampling methods are identical to first capture; random mixing of population; 2 3(d)(i) 5; 1 3(d)(ii) algae zooplankton (sandhill) crane; OR plants/seeds (sandhill) crane eagle 1 3(e) any three from: restrict number of birds hunted / number of birds killed; restricted times/season for hunting; enables birds to reproduce; birds given time to fatten (ready for migration); (sign) education / awareness; 3 3(f) loss of habitat / wetlands dry up; alter migration; loss of other species / loss of food source / disrupt food chain; introduces, invasive species/predators; 4
Q4 · Data for total forest cover in Ethiopia from 1990 to 2010
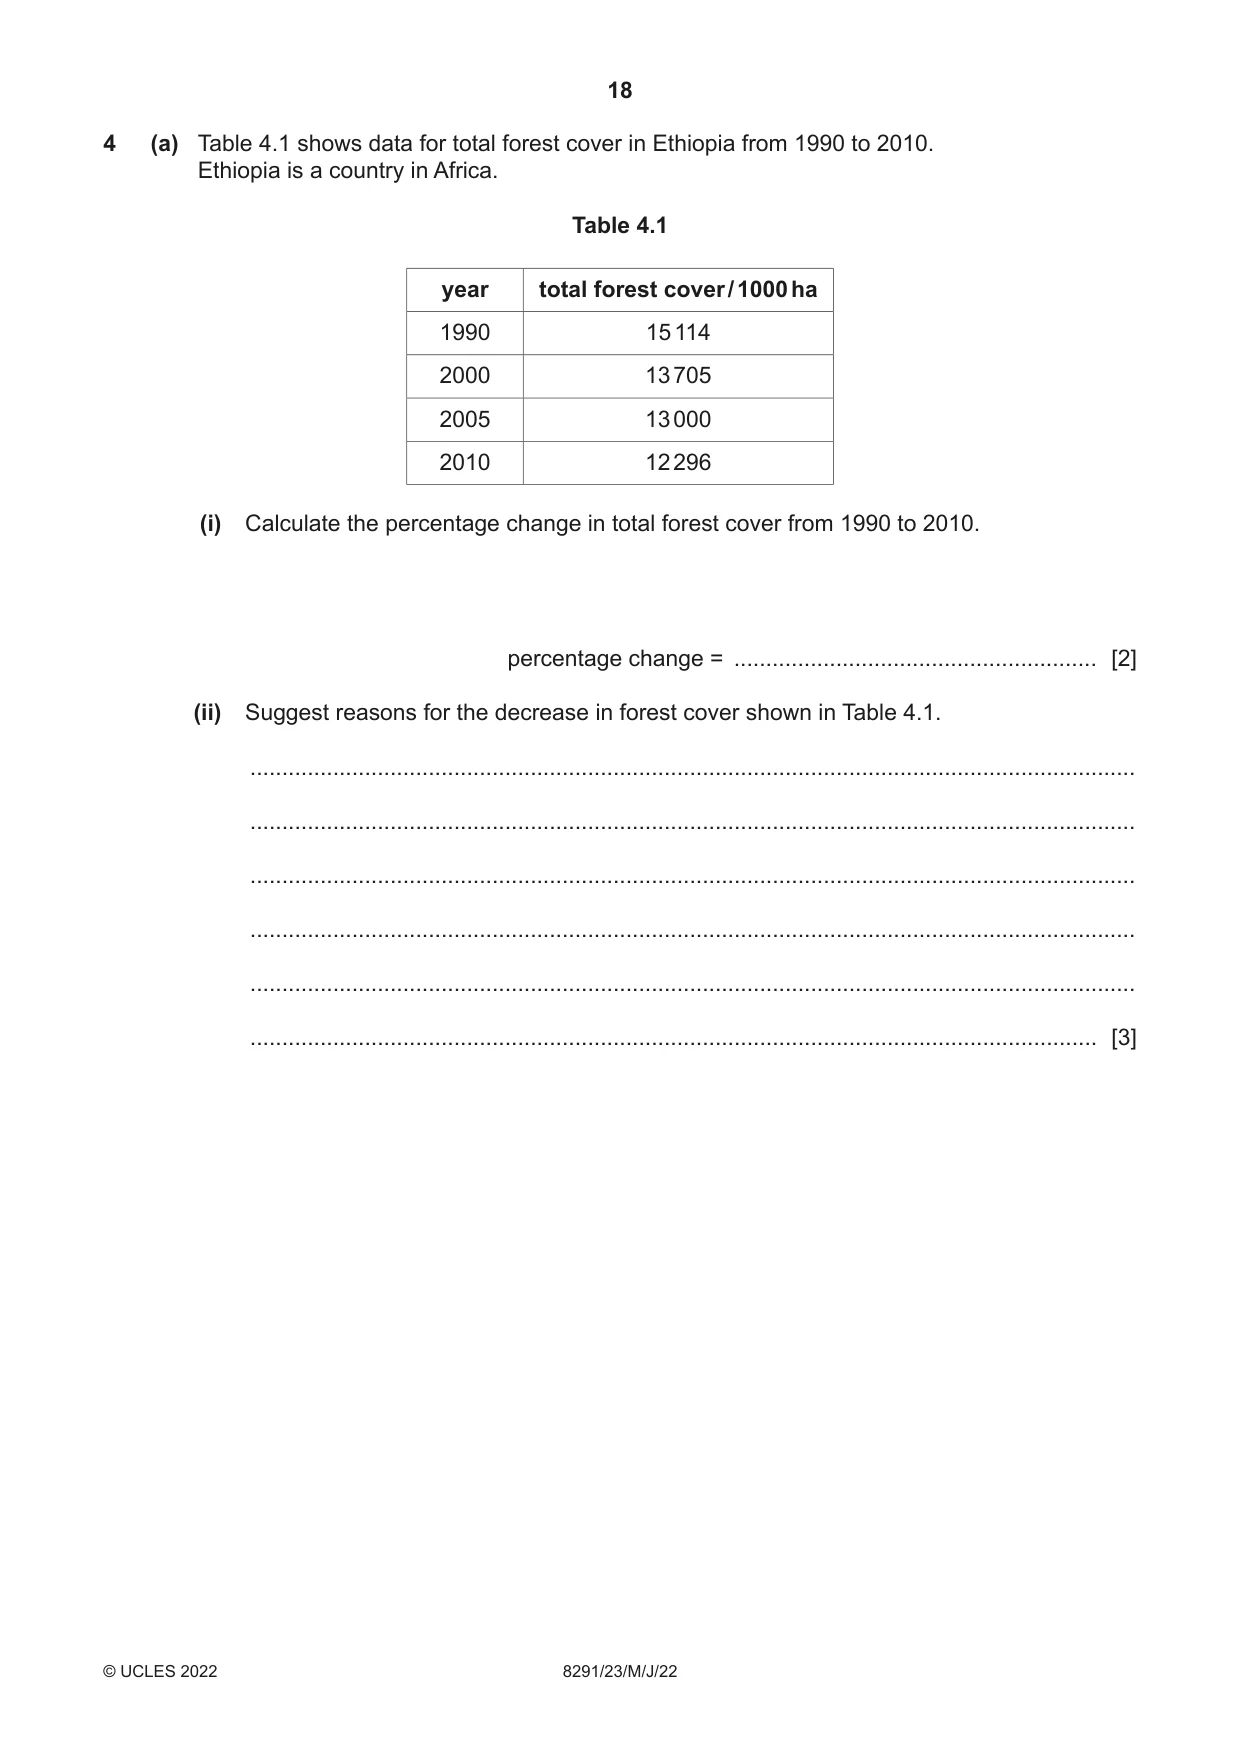
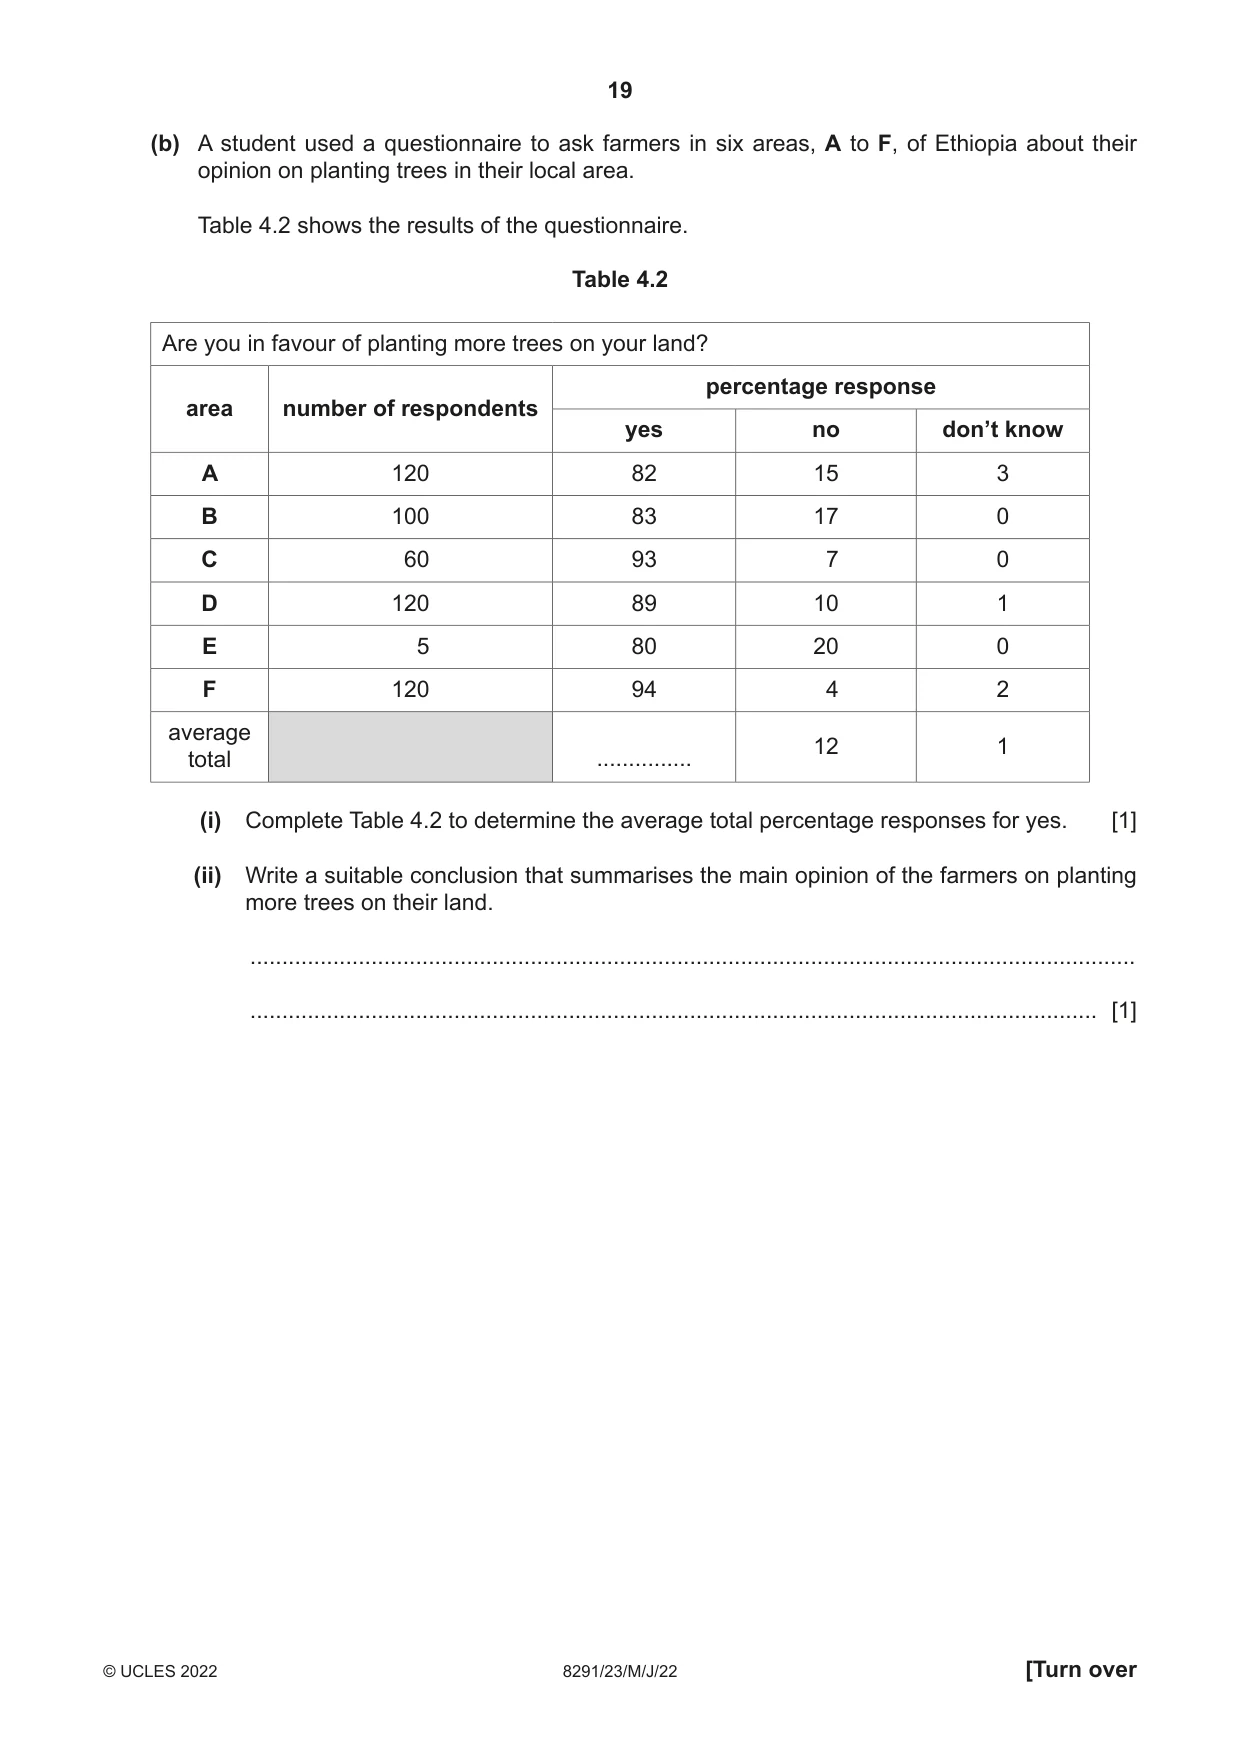
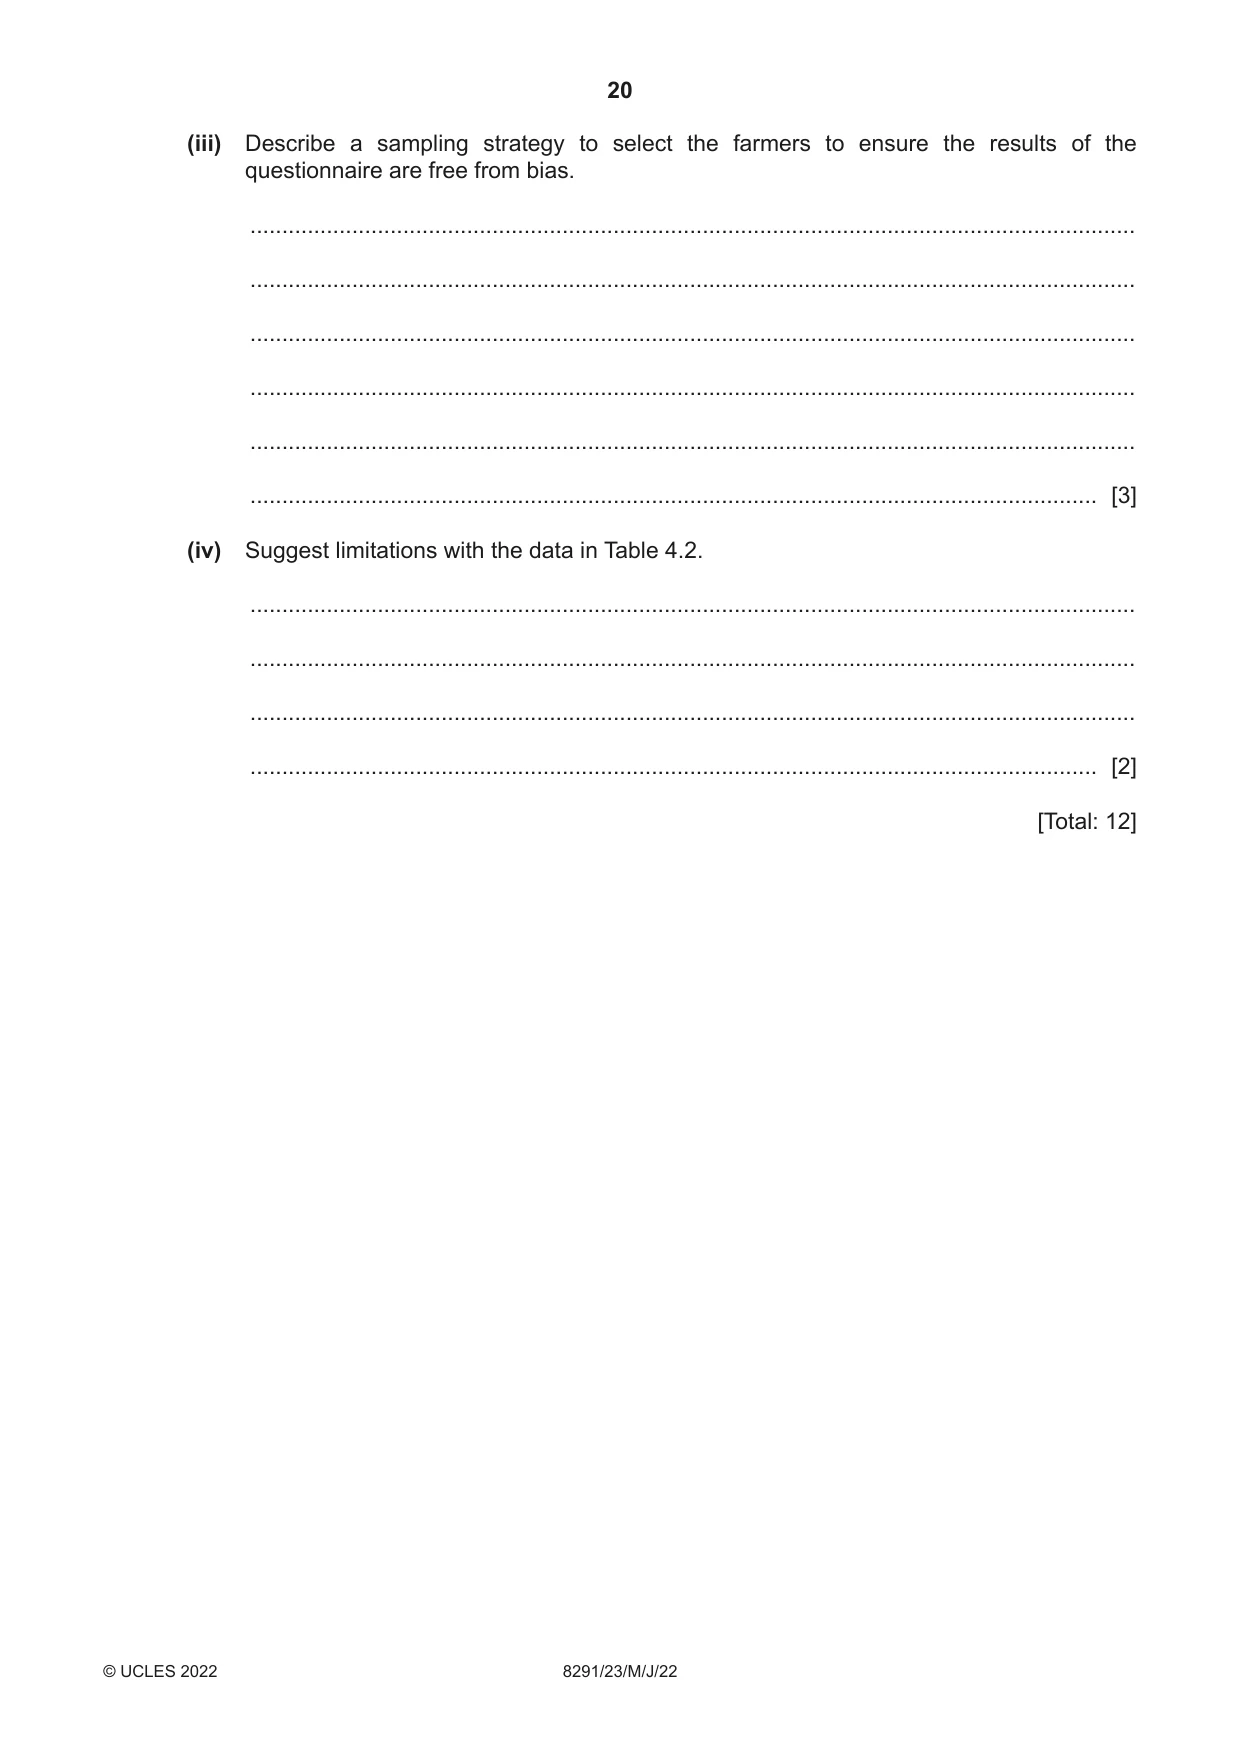
4 (a) Table 4.1 shows data for total forest cover in Ethiopia from 1990 to 2010. Ethiopia is a country in Africa. Table 4.1 year total forest cover / 1000 ha 1990 15 114 2000 13 705 2005 13 000 2010 12 296 (i) Calculate the percentage change in total forest cover from 1990 to 2010. percentage change = ......................................................... [2] (ii) Suggest reasons for the decrease in forest cover shown in Table 4.1. ........................................................................................................................................... ........................................................................................................................................... ........................................................................................................................................... ........................................................................................................................................... ........................................................................................................................................... ..................................................................................................................................... [3] (b) A student used a questionnaire to ask farmers in six areas, A to F, of Ethiopia about their opinion on planting trees in their local area. Table 4.2 shows the results of the questionnaire. Table 4.2 Are you in favour of planting more trees on your land? percentage response area number of respondents yes no don’t know A 120 82 15 3 B 100 83 17 0 C 60 93 7 0 D 120 89 10 1 E 5 80 20 0 F 120 94 4 2 average 12 1 total ............... (i) Complete Table 4.2 to determine the average total percentage responses for yes. [1] (ii) Write a suitable conclusion that summarises the main opinion of the farmers on planting more trees on their land. ........................................................................................................................................... ..................................................................................................................................... [1] (iii) Describe a sampling strategy to select the farmers to ensure the results of the questionnaire are free from bias. ........................................................................................................................................... ........................................................................................................................................... ........................................................................................................................................... ........................................................................................................................................... ........................................................................................................................................... ..................................................................................................................................... [3] (iv) Suggest limitations with the data in Table 4.2. ........................................................................................................................................... ........................................................................................................................................... ........................................................................................................................................... ..................................................................................................................................... [2] [Total: 12]
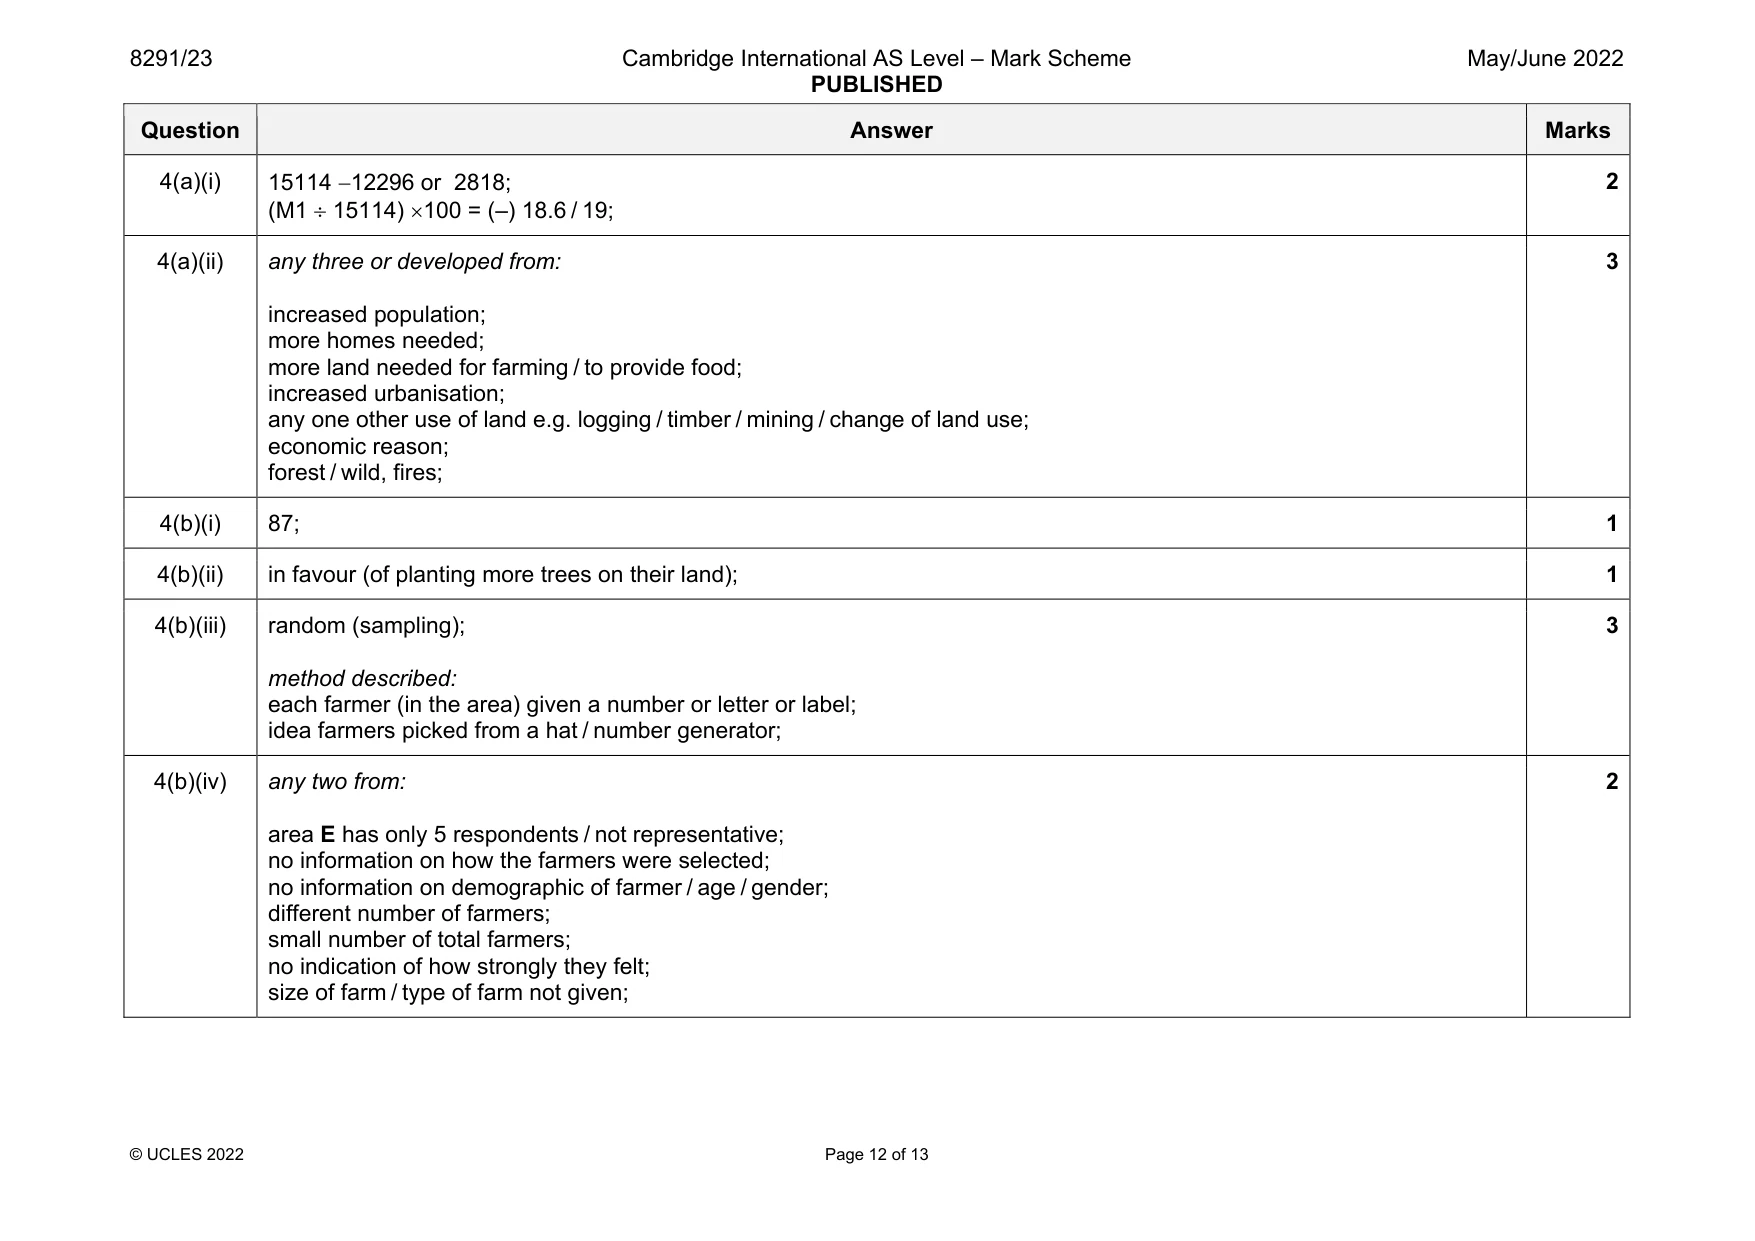
Mark scheme: 4(a)(i) (M1 15114) 100 = (–) 18.6 / 19; 2 4(a)(ii) any three or developed from: increased population; more homes needed; more land needed for farming / to provide food; increased urbanisation; any one other use of land e.g. logging / timber / mining / change of land use; economic reason; forest / wild, fires; 3 4(b)(i) 87; 1 4(b)(ii) in favour (of planting more trees on their land); 1 4(b)(iii) random (sampling); method described: each farmer (in the area) given a number or letter or label; idea farmers picked from a hat / number generator; 3 4(b)(iv) any two from: area E has only 5 respondents / not representative; no information on how the farmers were selected; no information on demographic of farmer / age / gender; different number of farmers; small number of total farmers; no indication of how strongly they felt; size of farm / type of farm not given; 2
Q5 · Data about traffic congestion in four of India’s cities
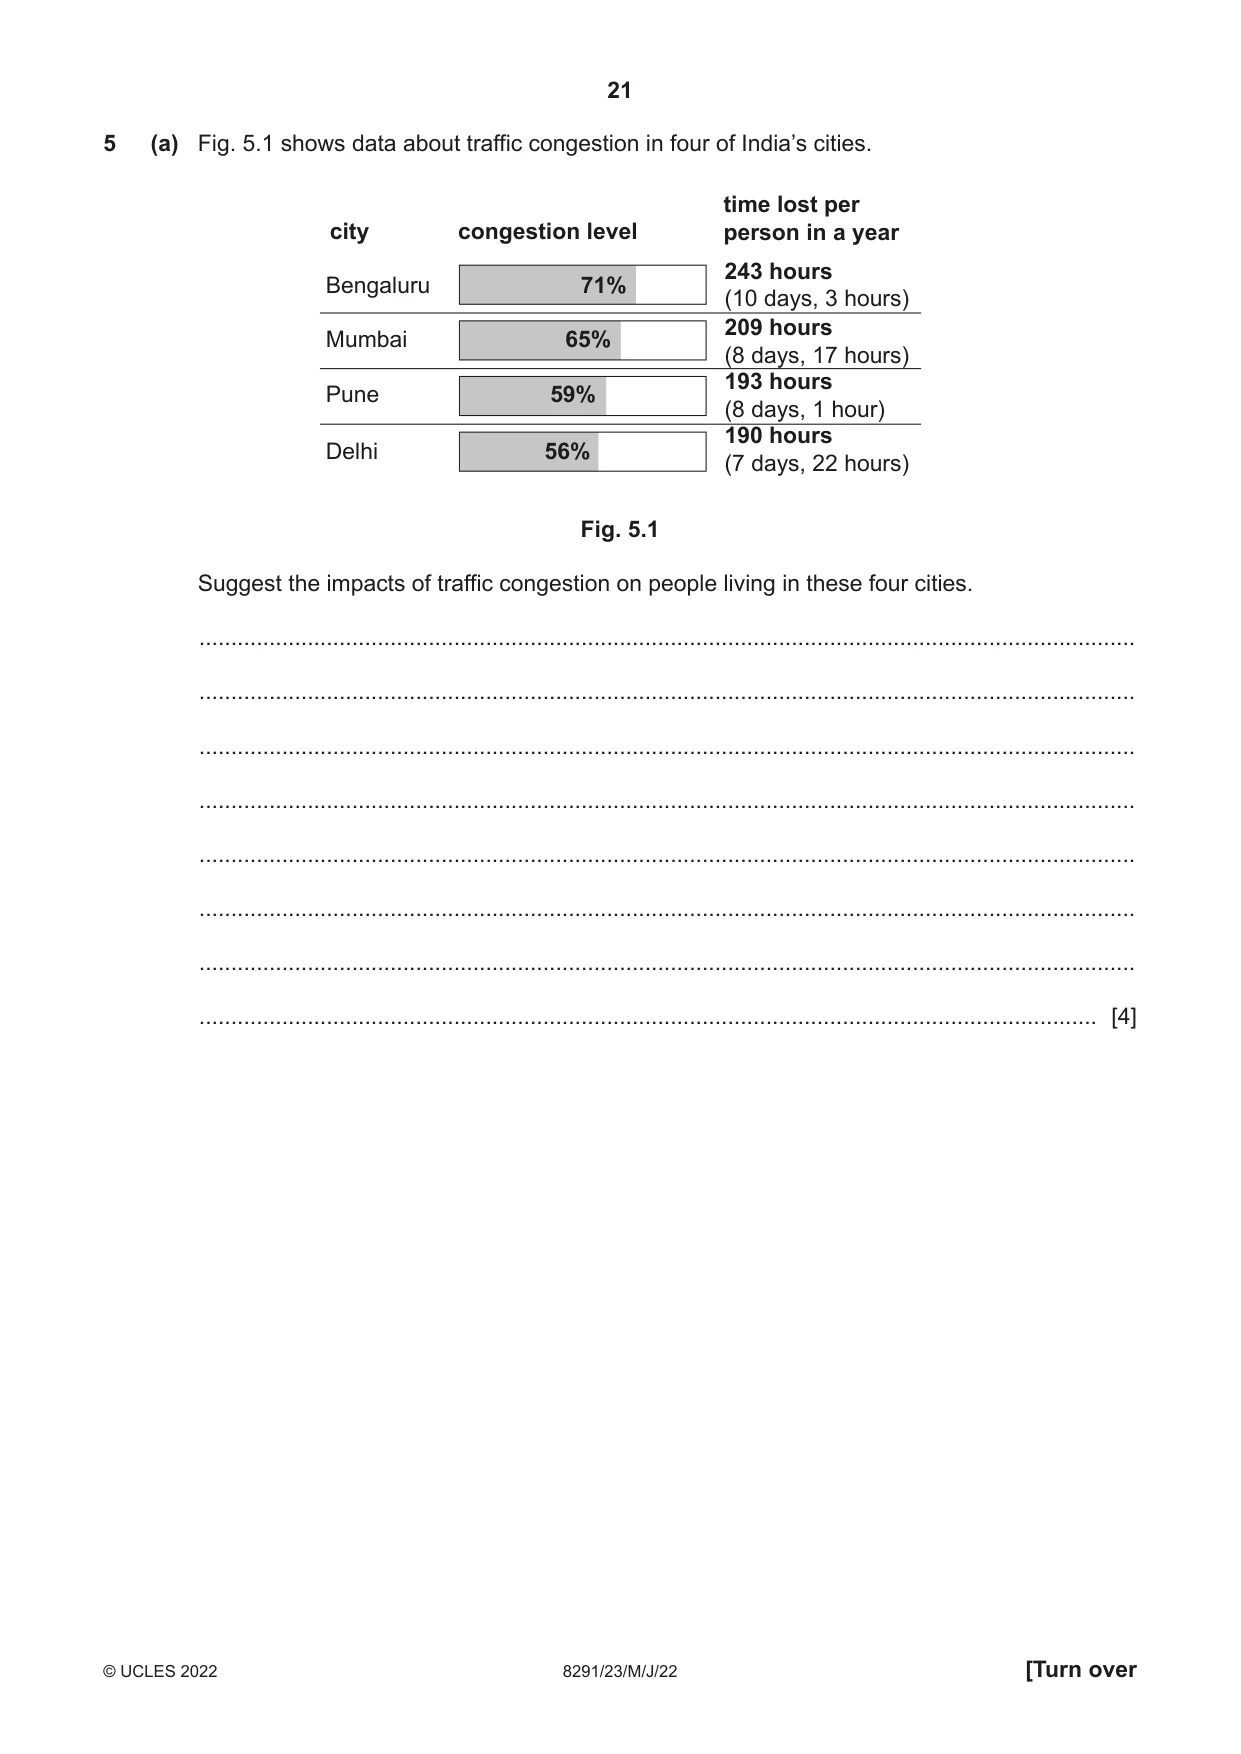
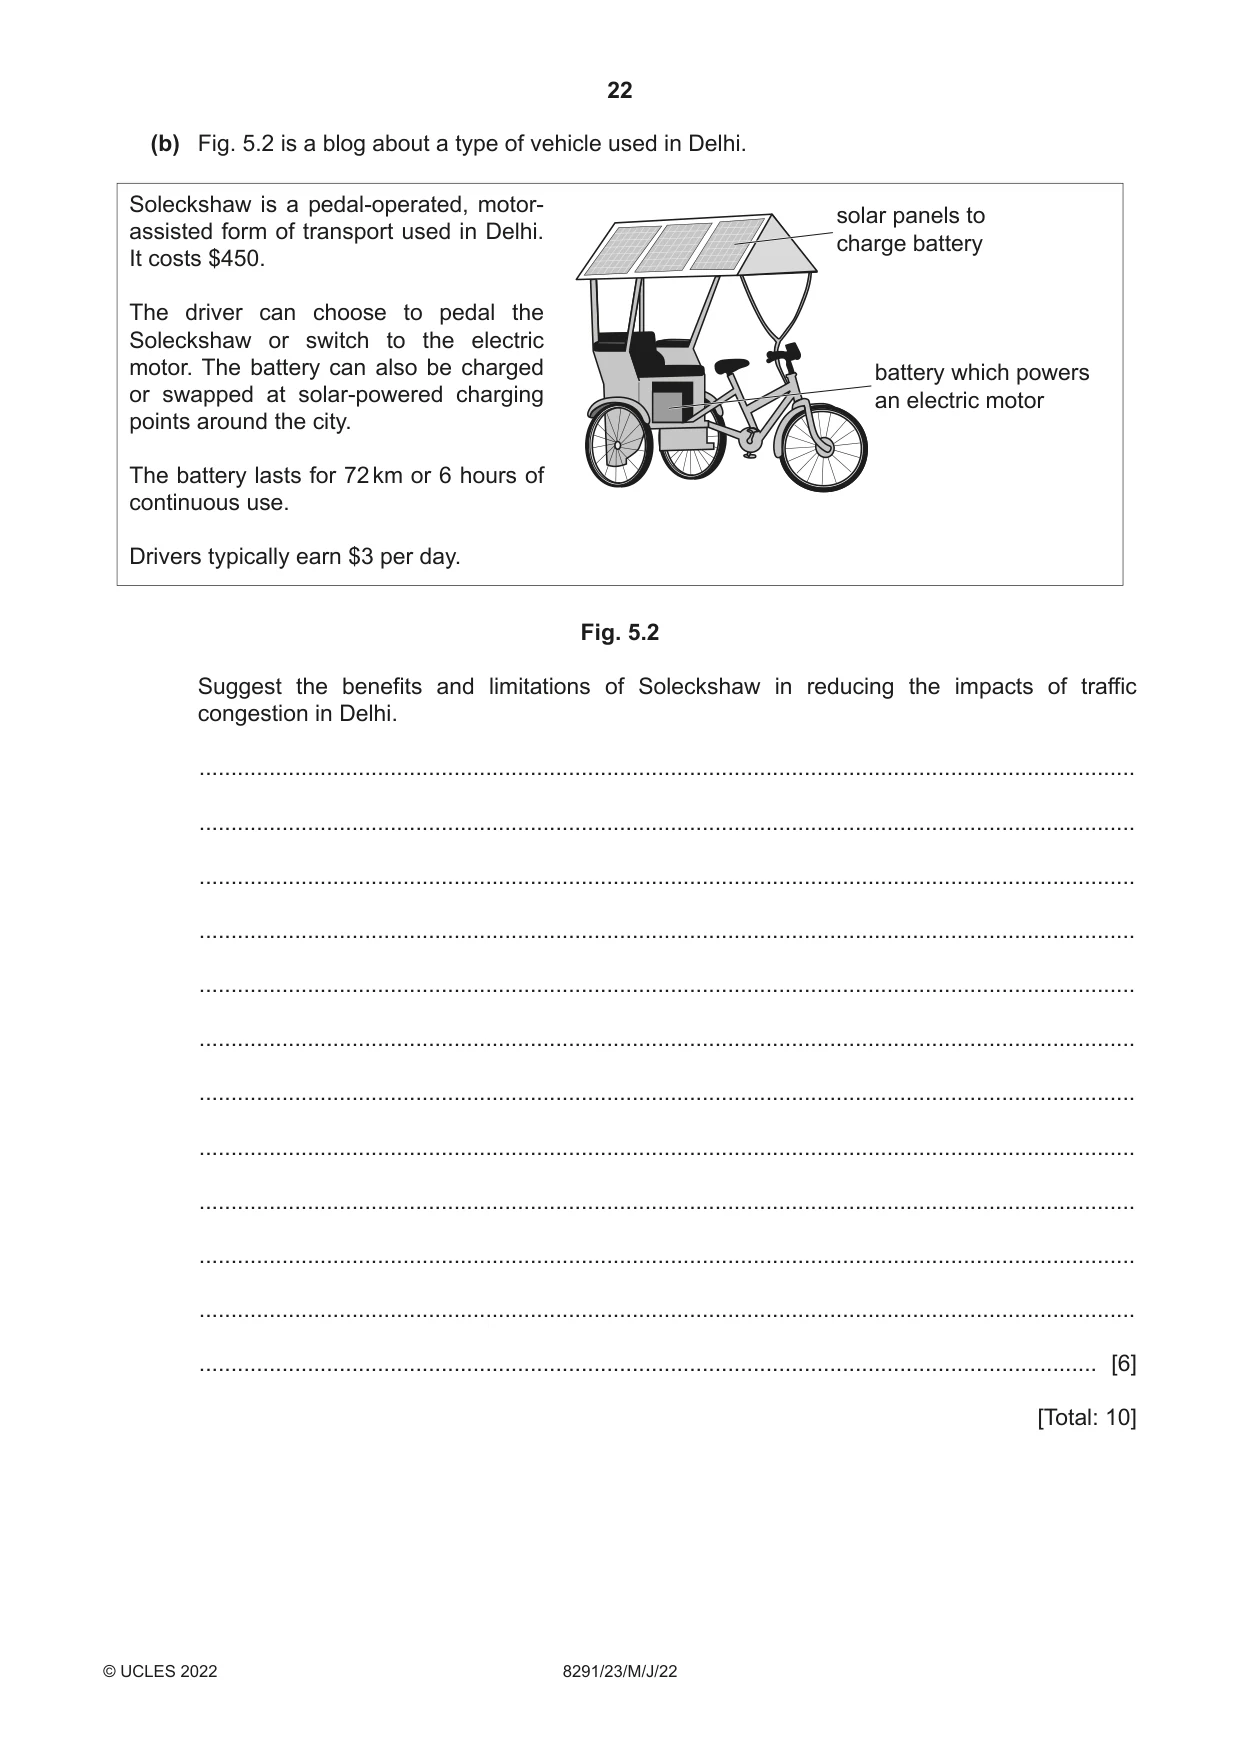
5 (a) Fig. 5.1 shows data about traffic congestion in four of India’s cities. time lost per city congestion level person in a year 243 hours Bengaluru 71% (10 days, 3 hours) 209 hours Mumbai 65% (8 days, 17 hours) 193 hours Pune 59% (8 days, 1 hour) 190 hours Delhi 56% (7 days, 22 hours) Fig. 5.1 Suggest the impacts of traffic congestion on people living in these four cities. ................................................................................................................................................... ................................................................................................................................................... ................................................................................................................................................... ................................................................................................................................................... ................................................................................................................................................... ................................................................................................................................................... ................................................................................................................................................... ............................................................................................................................................. [4] (b) Fig. 5.2 is a blog about a type of vehicle used in Delhi. Soleckshaw is a pedal-operated, motor- solar panels to assisted form of transport used in Delhi. charge battery It costs $450. The driver can choose to pedal the Soleckshaw or switch to the electric motor. The battery can also be charged battery which powers or swapped at solar-powered charging an electric motor points around the city. The battery lasts for 72 km or 6 hours of continuous use. Drivers typically earn $3 per day. Fig. 5.2 Suggest the benefits and limitations of Soleckshaw in reducing the impacts of traffic congestion in Delhi. ................................................................................................................................................... ................................................................................................................................................... ................................................................................................................................................... ................................................................................................................................................... ................................................................................................................................................... ................................................................................................................................................... ................................................................................................................................................... ................................................................................................................................................... ................................................................................................................................................... ................................................................................................................................................... ................................................................................................................................................... ............................................................................................................................................. [6] [Total: 10]
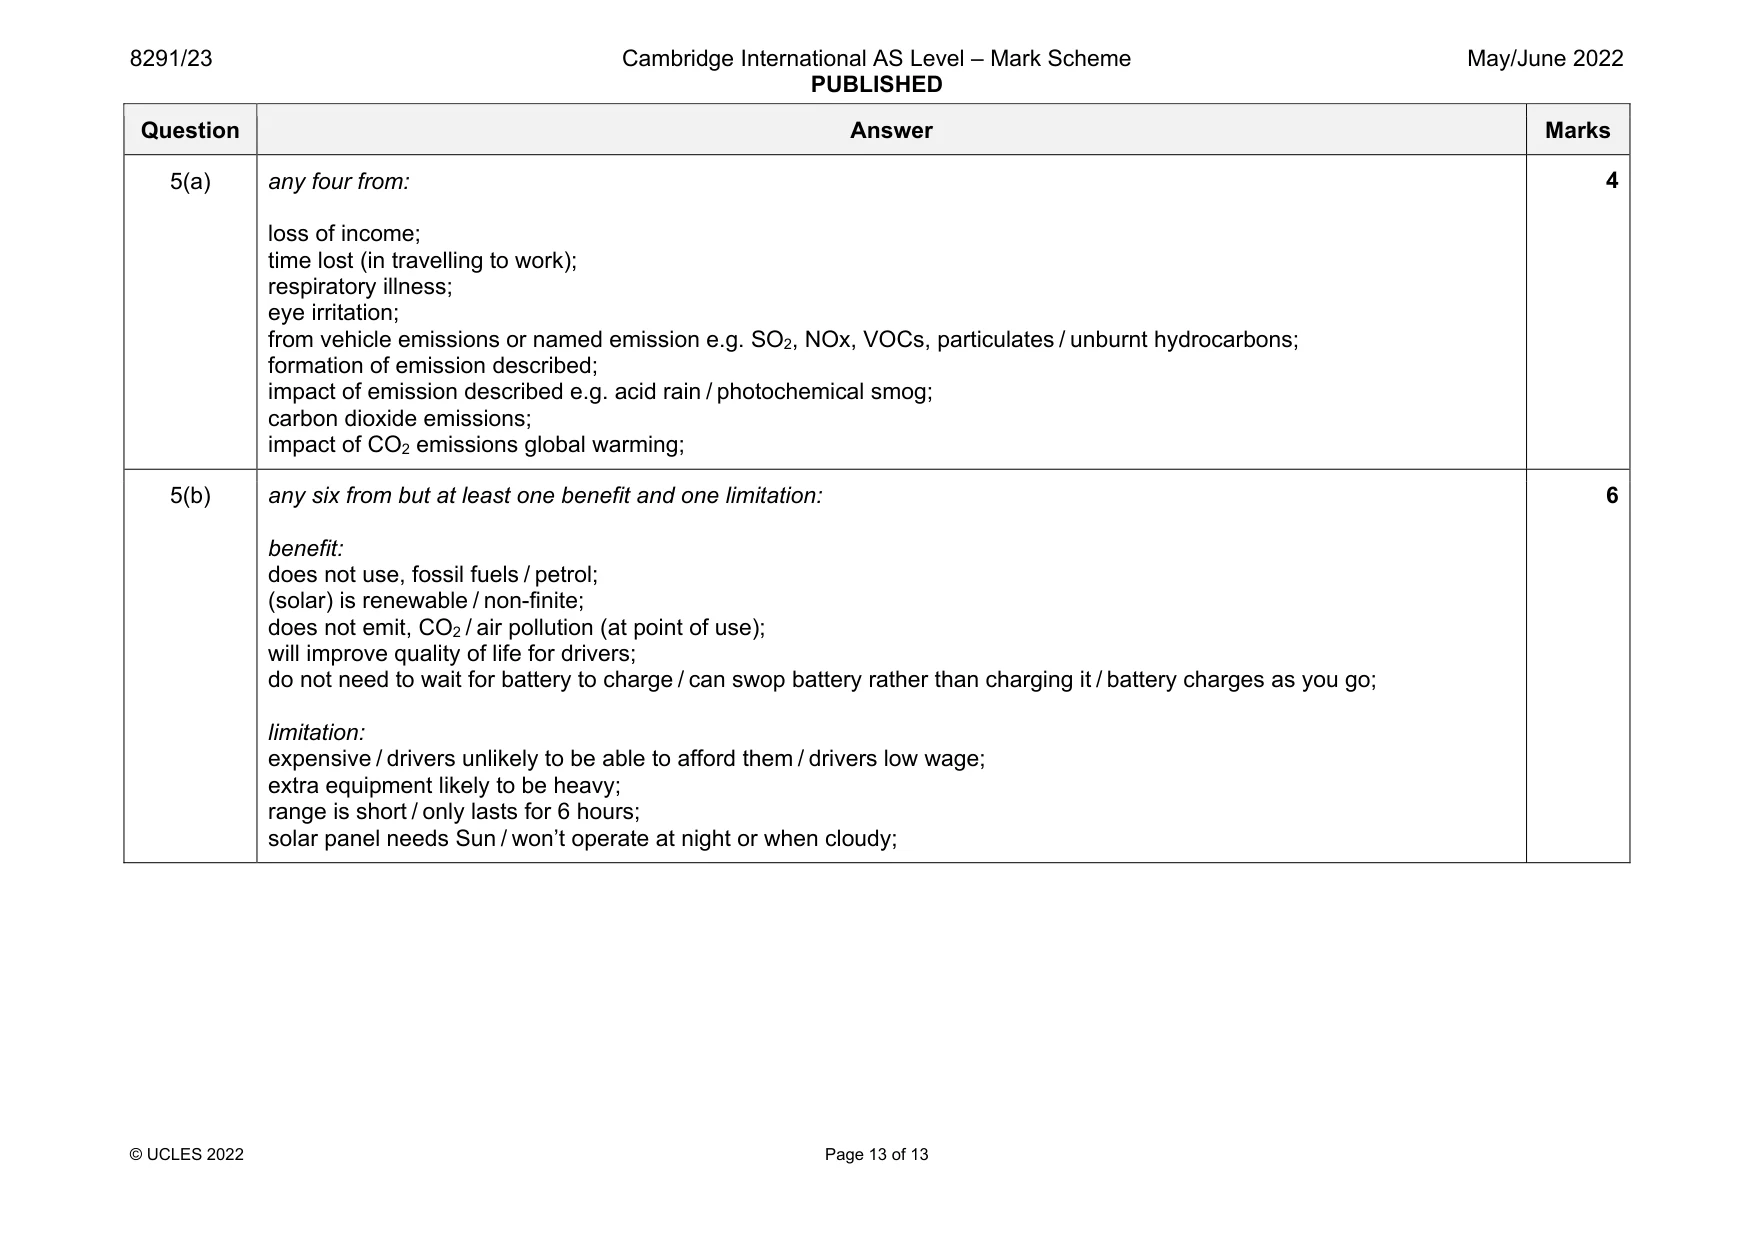
Mark scheme: 5(a) any four from: loss of income; time lost (in travelling to work); respiratory illness; eye irritation; from vehicle emissions or named emission e.g. SO2, NOx, VOCs, particulates / unburnt hydrocarbons; formation of emission described; impact of emission described e.g. acid rain / photochemical smog; carbon dioxide emissions; impact of CO2 emissions global warming; 5(b) any six from but at least one benefit and one limitation: benefit: does not use, fossil fuels / petrol; (solar) is renewable / non-finite; does not emit, CO2 / air pollution (at point of use); will improve quality of life for drivers; do not need to wait for battery to charge / can swop battery rather than charging it / battery charges as you go; limitation: expensive / drivers unlikely to be able to afford them / drivers low wage; extra equipment likely to be heavy; range is short / only lasts for 6 hours; solar panel needs Sun / won’t operate at night or when cloudy; 6
What was in this paper
The subtopics covered by these 5 questions, and how many questions each got. Open one in a new tab to see every Cambridge question on it.
What you needed in this session
Cambridge’s own grade thresholds for 2022 May/June, Paper 2 · Variant 3. A higher threshold means an easier paper — the bar moves with how the cohort did.