Cambridge A Level Environmental Management (AS only) 8291 — 2022 Oct/Nov Paper 2 · Variant 3
8291/23/O/N/22 · 5 questions · 80 marks · ≈90 min
The question paper and its mark scheme, free to read here and free to download. This is Cambridge’s own paper, exactly as it was sat.
Question paper24 pages

Mark scheme12 pages
Answers below. Sit the paper first if you are practising.
Questions as text
Q1 · A map of Singapore, Southeast Asia
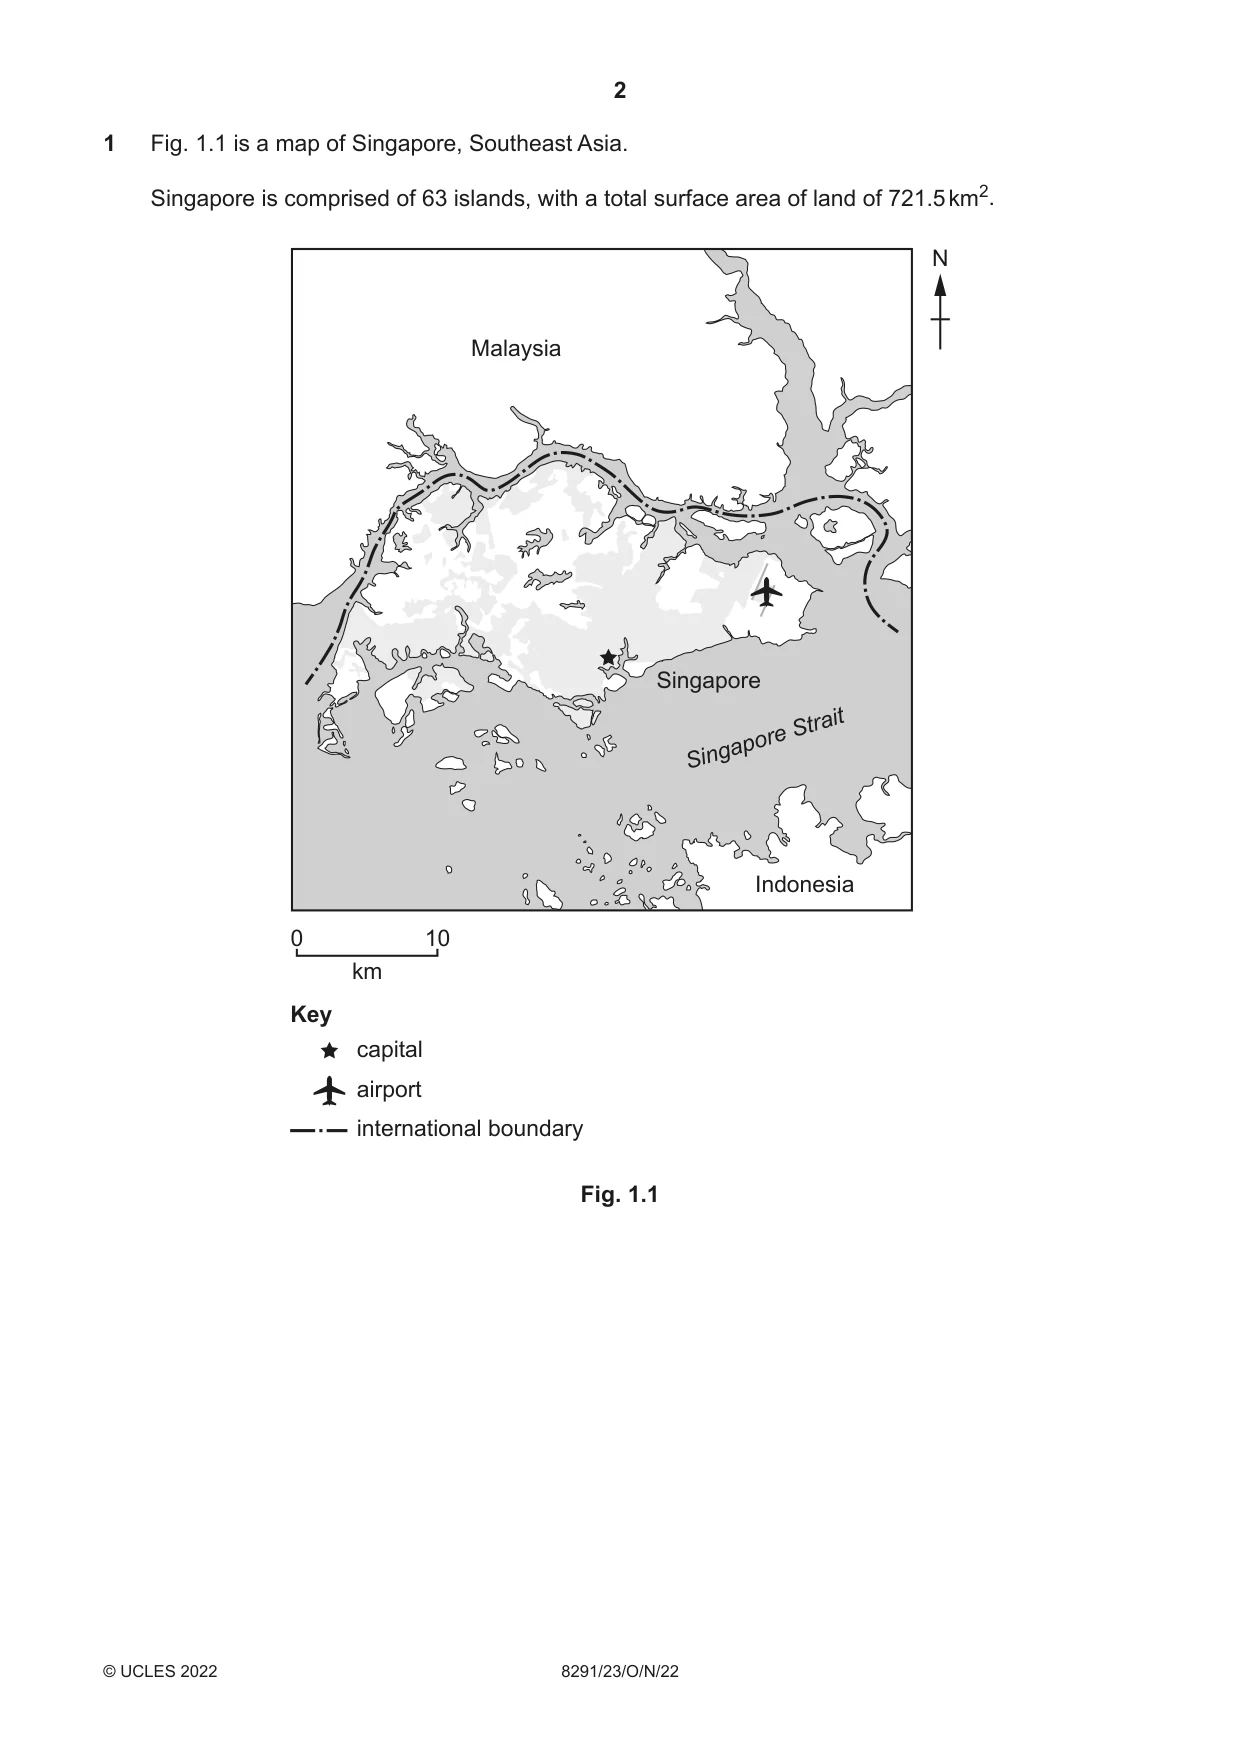
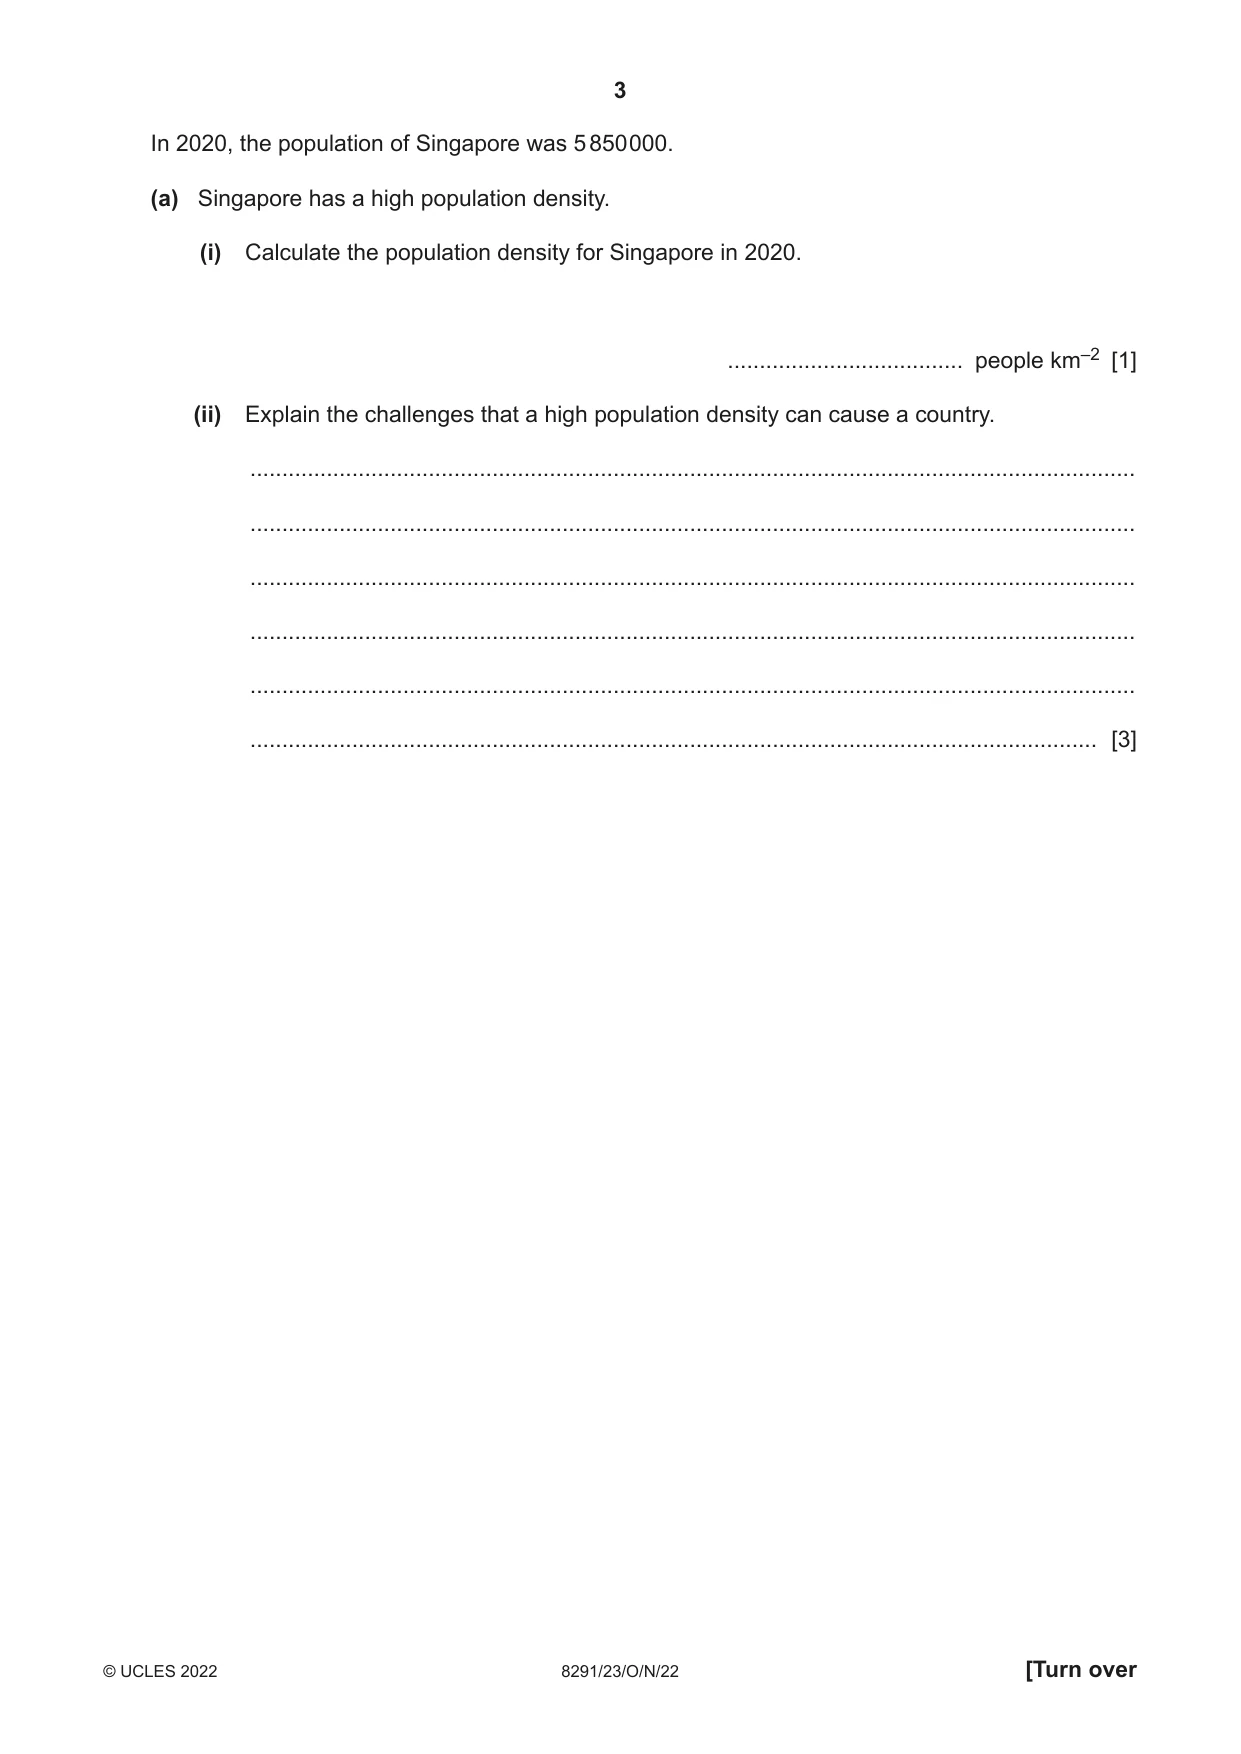
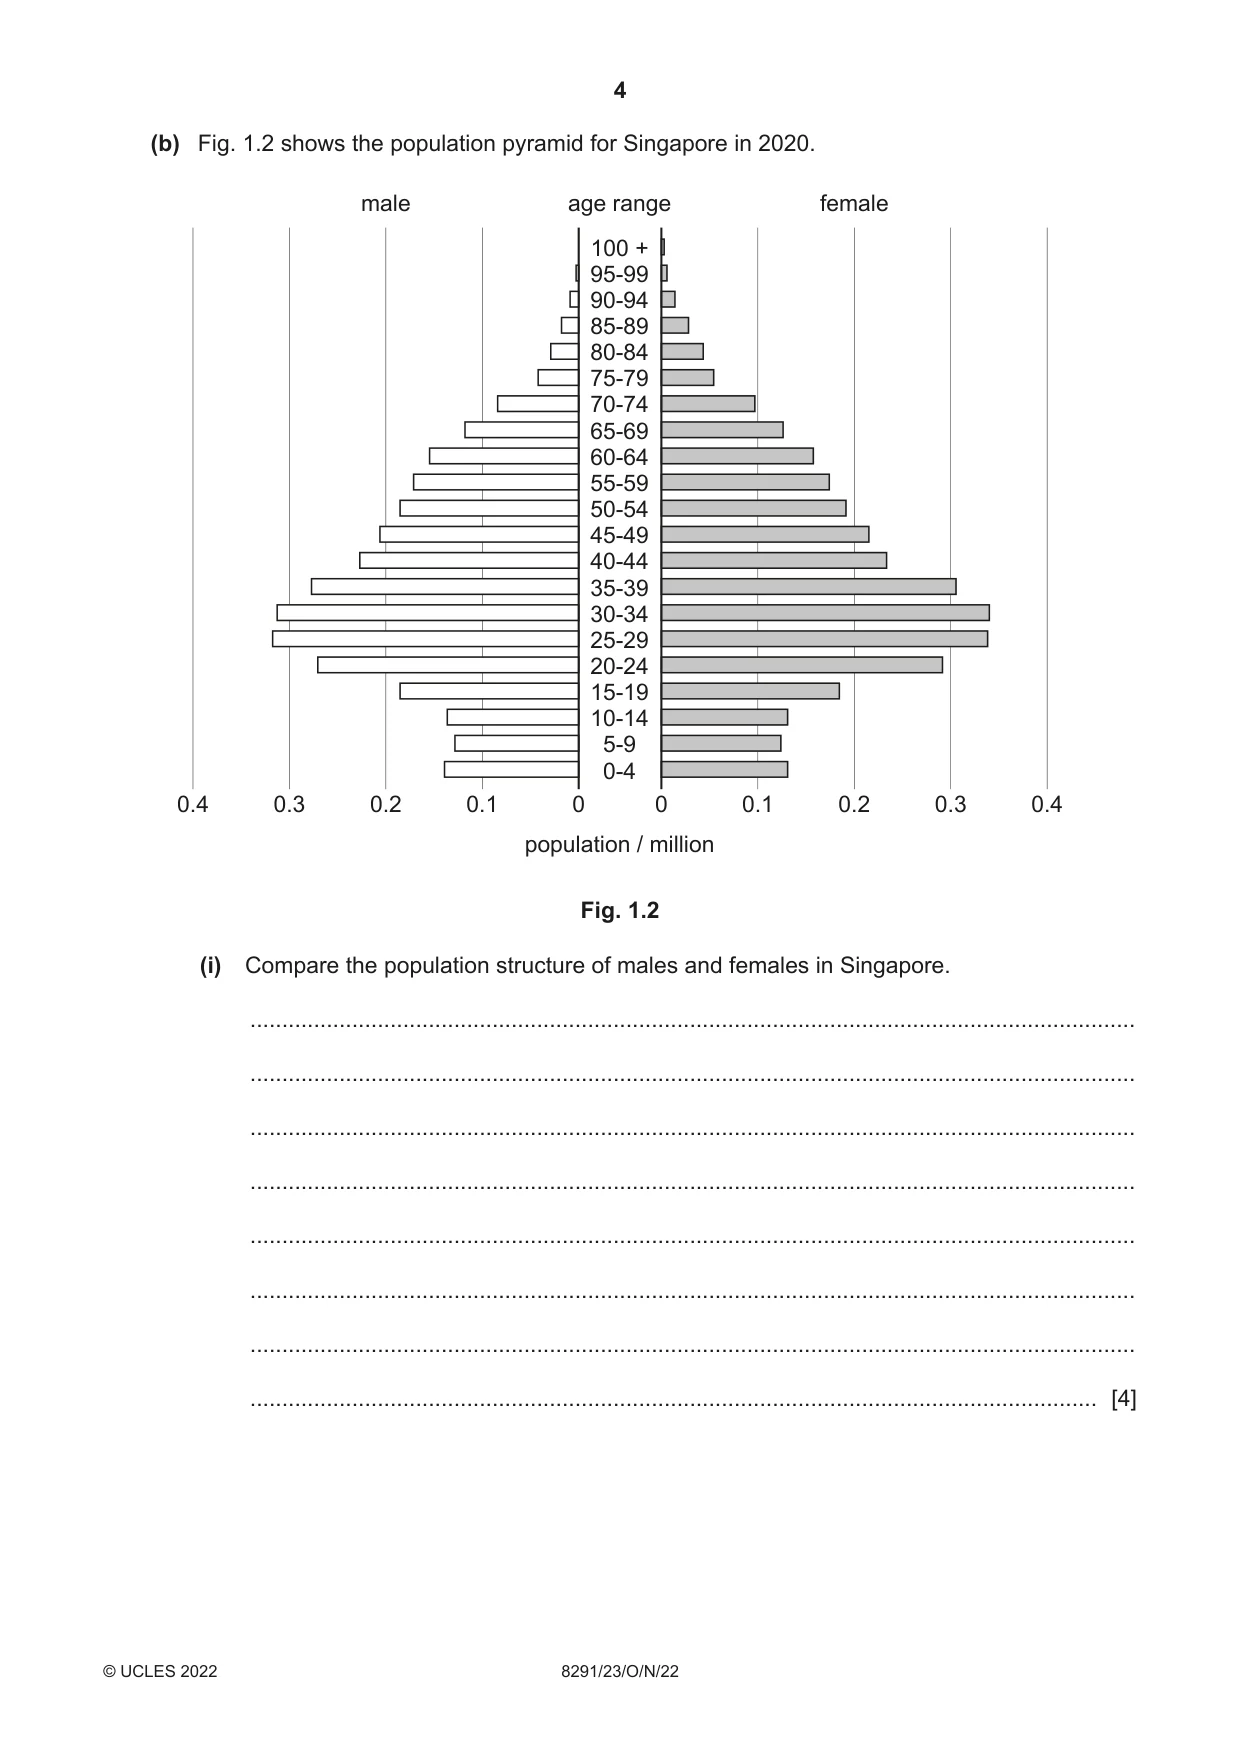
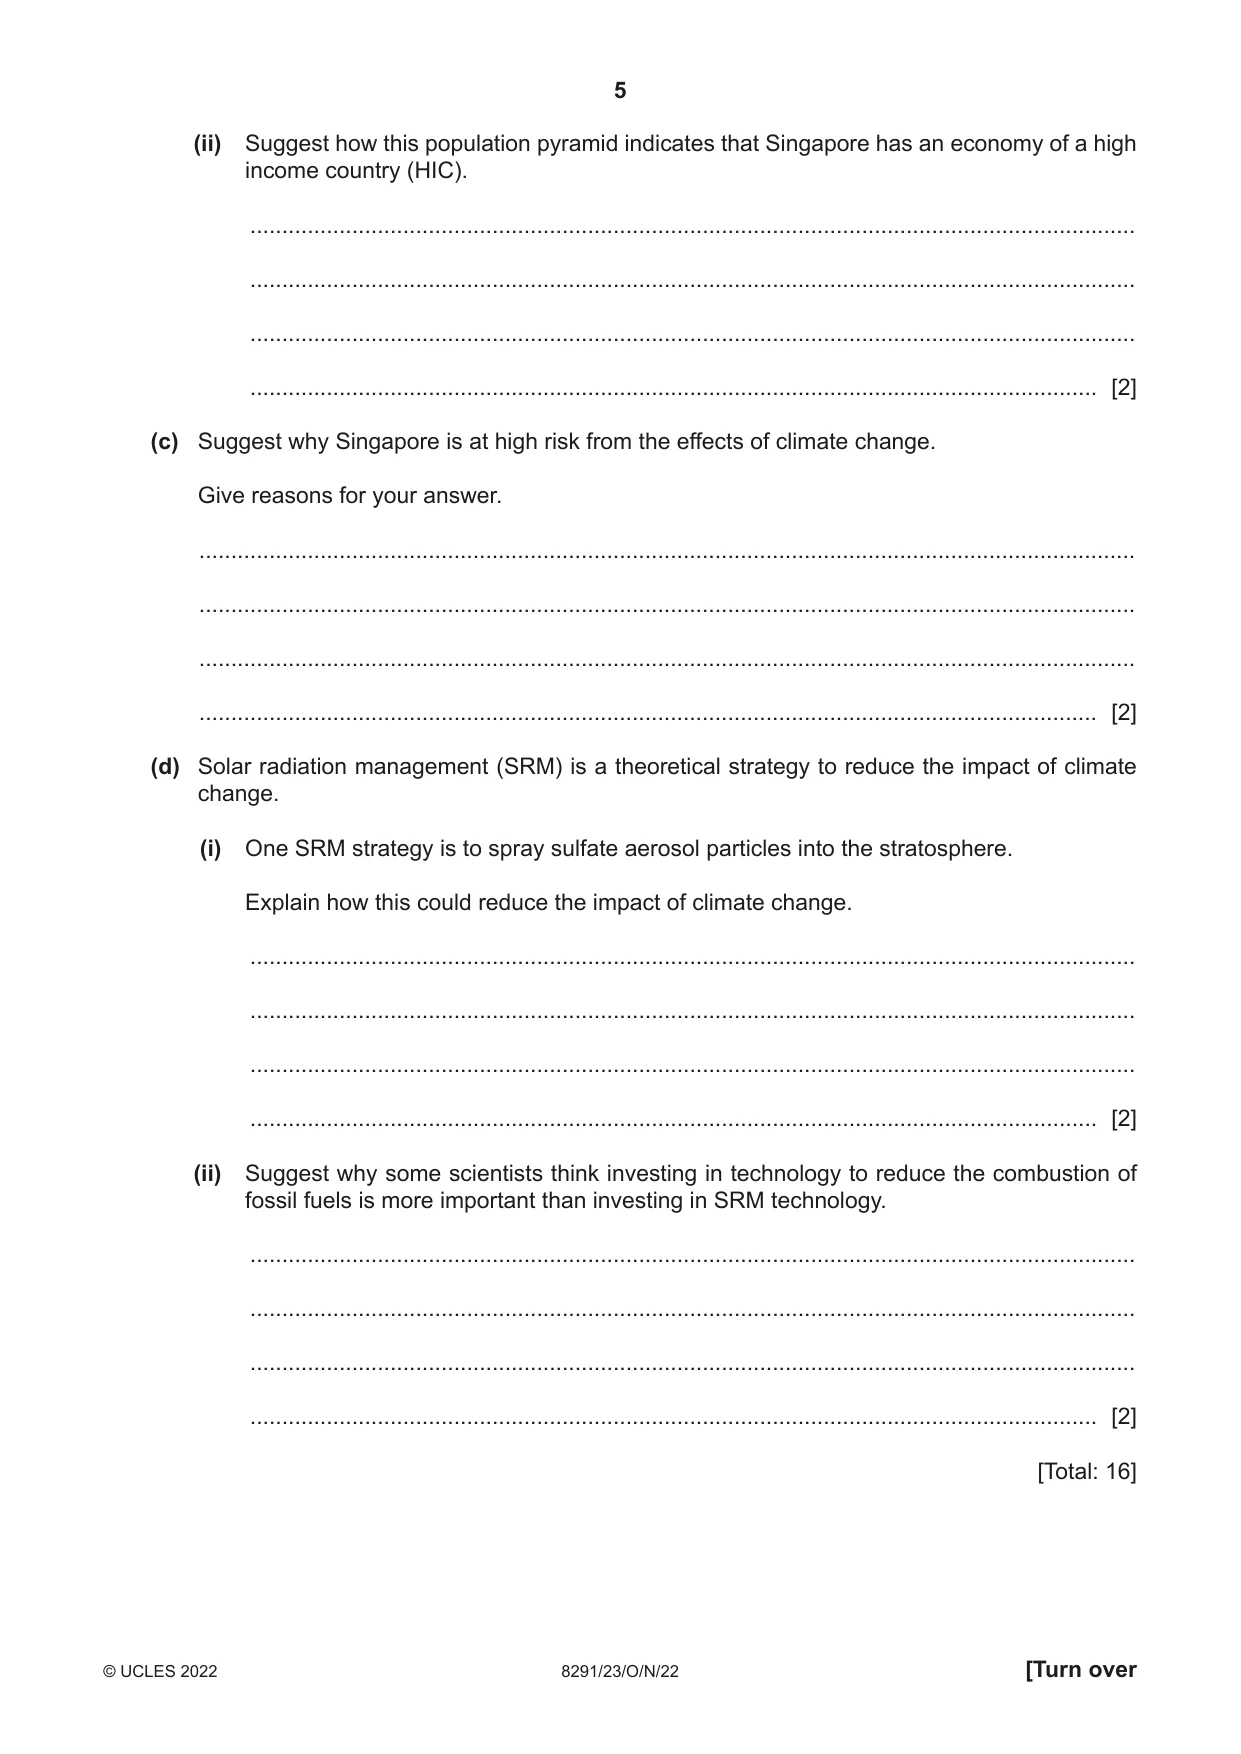
1 Fig. 1.1 is a map of Singapore, Southeast Asia. Singapore is comprised of 63 islands, with a total surface area of land of 721.5 km2. N Malaysia Singapore Strait Singapore Indonesia 0 10 km Key capital airport international boundary Fig. 1.1 In 2020, the population of Singapore was 5 850 000. (a) Singapore has a high population density. (i) Calculate the population density for Singapore in 2020. ..................................... people km–2 [1] (ii) Explain the challenges that a high population density can cause a country. ........................................................................................................................................... ........................................................................................................................................... ........................................................................................................................................... ........................................................................................................................................... ........................................................................................................................................... ..................................................................................................................................... [3] (b) Fig. 1.2 shows the population pyramid for Singapore in 2020. male age range female 100 + 95-99 90-94 85-89 80-84 75-79 70-74 65-69 60-64 55-59 50-54 45-49 40-44 35-39 30-34 25-29 20-24 15-19 10-14 5-9 0-4 0.4 0.3 0.2 0.1 0 0 0.1 0.2 0.3 0.4 population / million Fig. 1.2 (i) Compare the population structure of males and females in Singapore. ........................................................................................................................................... ........................................................................................................................................... ........................................................................................................................................... ........................................................................................................................................... ........................................................................................................................................... ........................................................................................................................................... ........................................................................................................................................... ..................................................................................................................................... [4] (ii) Suggest how this population pyramid indicates that Singapore has an economy of a high income country (HIC). ........................................................................................................................................... ........................................................................................................................................... ........................................................................................................................................... ..................................................................................................................................... [2] (c) Suggest why Singapore is at high risk from the effects of climate change. Give reasons for your answer. ................................................................................................................................................... ................................................................................................................................................... ................................................................................................................................................... ............................................................................................................................................. [2] (d) Solar radiation management (SRM) is a theoretical strategy to reduce the impact of climate change. (i) One SRM strategy is to spray sulfate aerosol particles into the stratosphere. Explain how this could reduce the impact of climate change. ........................................................................................................................................... ........................................................................................................................................... ........................................................................................................................................... ..................................................................................................................................... [2] (ii) Suggest why some scientists think investing in technology to reduce the combustion of fossil fuels is more important than investing in SRM technology. ........................................................................................................................................... ........................................................................................................................................... ........................................................................................................................................... ..................................................................................................................................... [2] [Total: 16]
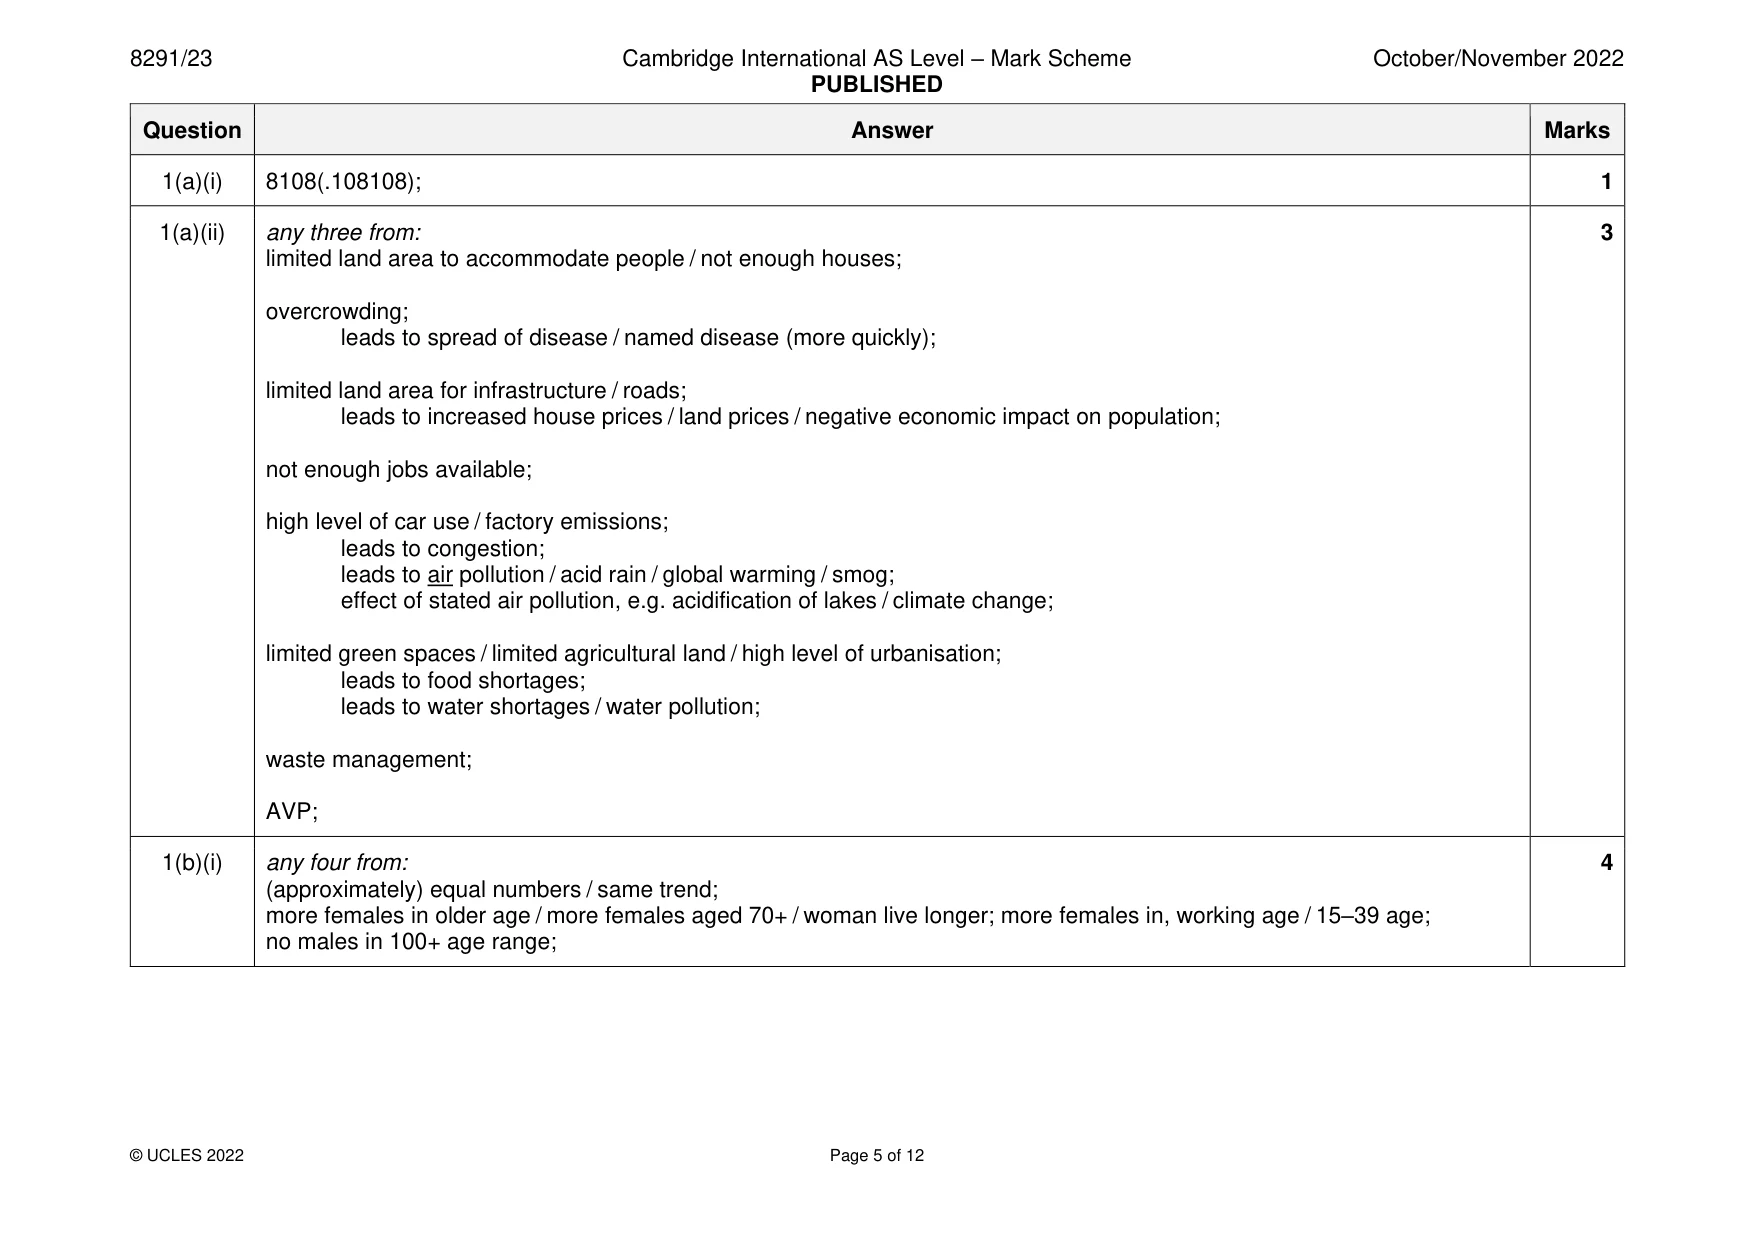
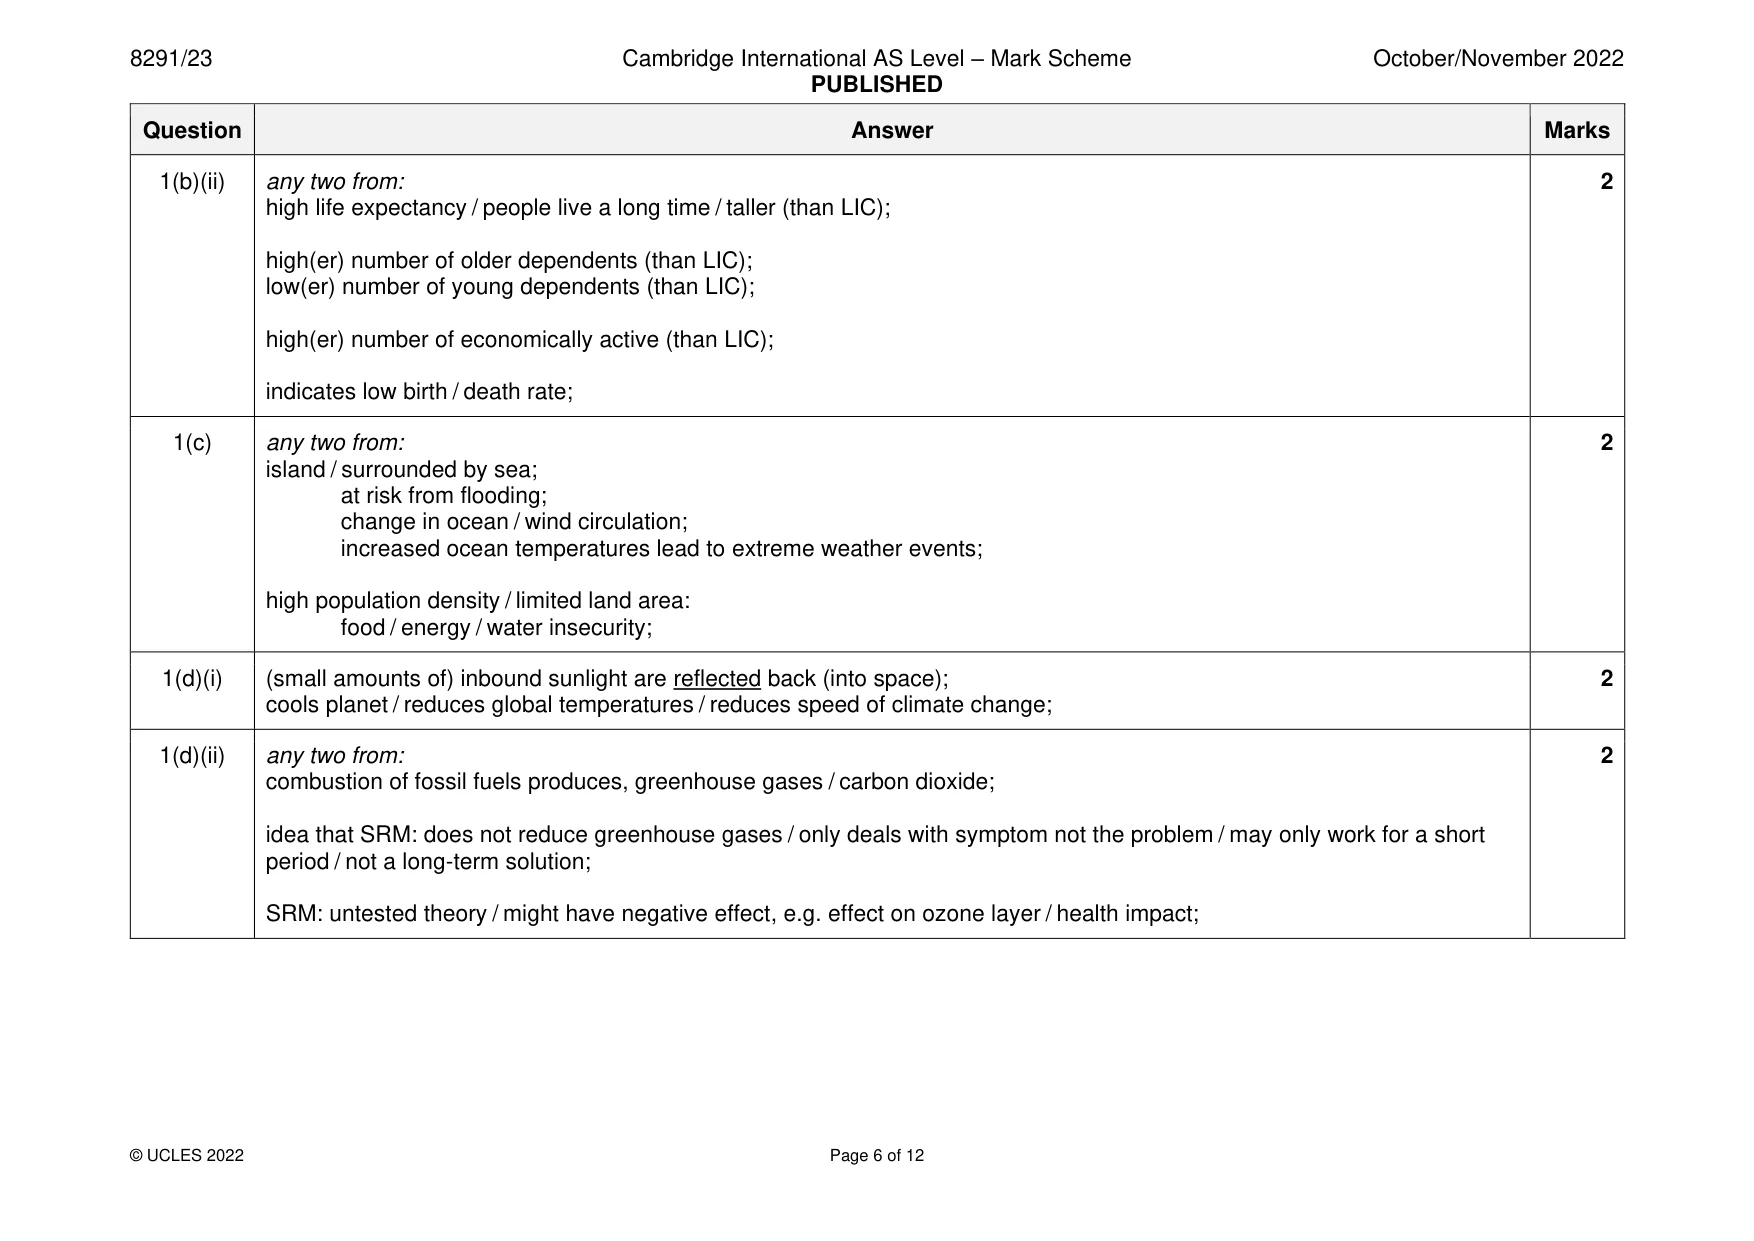
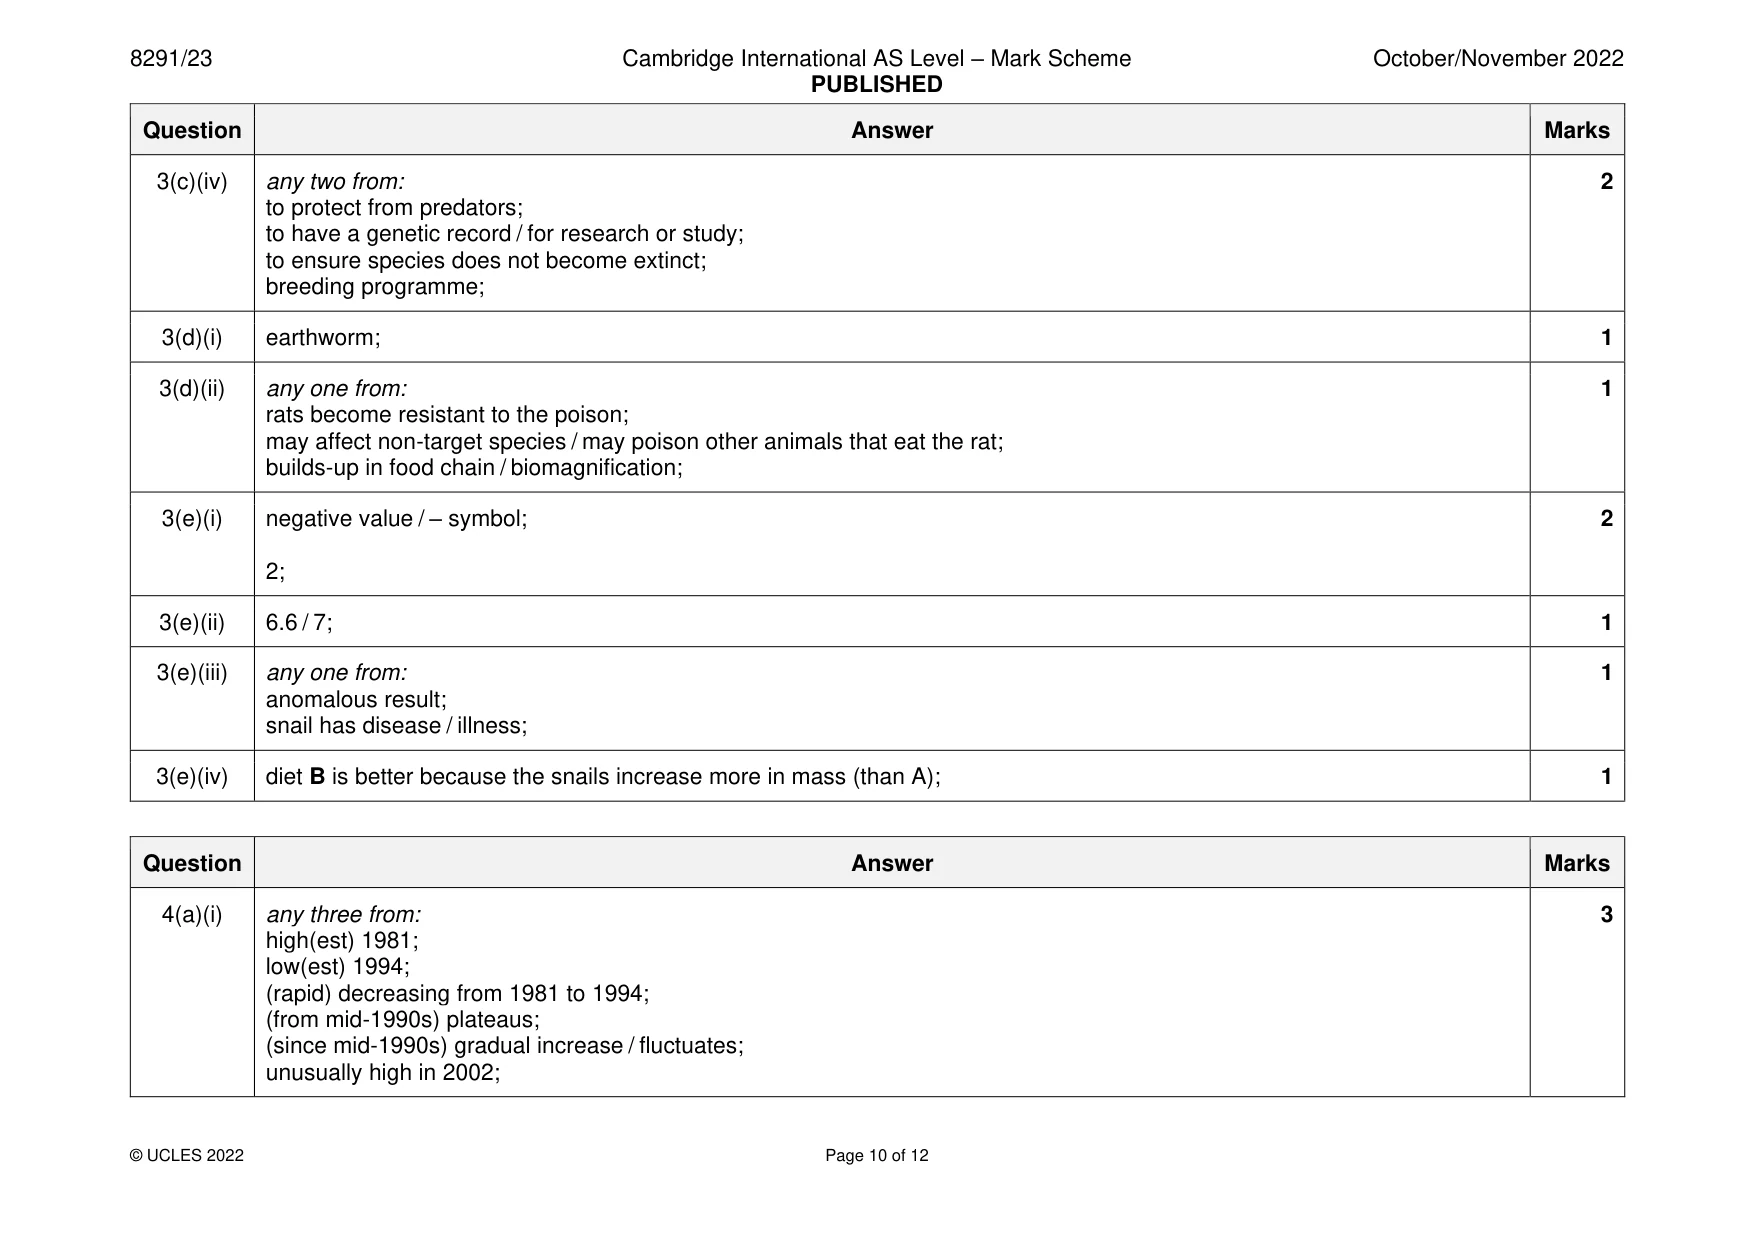
Mark scheme: Question Answer Marks 1(a)(i) 8108(.108108); 1 1(a)(ii) any three from: 3 limited land area to accommodate people / not enough houses; overcrowding; leads to spread of disease / named disease (more quickly); limited land area for infrastructure / roads; leads to increased house prices / land prices / negative economic impact on population; not enough jobs available; high level of car use / factory emissions; leads to congestion; leads to air pollution / acid rain / global warming / smog; effect of stated air pollution, e.g. acidification of lakes / climate change; limited green spaces / limited agricultural land / high level of urbanisation; leads to food shortages; leads to water shortages / water pollution; waste management; AVP; 1(b)(i) any four from: 4 (approximately) equal numbers / same trend; more females in older age / more females aged 70+ / woman live longer; more females in, working age / 15–39 age; no males in 100+ age range; 1(b)(ii) any two from: 2 high life expectancy / people live a long time / taller (than LIC); high(er) number of older dependents (than LIC); low(er) number of young dependents (than LIC); high(er) number of economically active (than LIC); indicates low birth / death rate; 1(c) any two from: 2 island / surrounded by sea; at risk from flooding; change in ocean / wind circulation; increased ocean temperatures lead to extreme weather events; high population density / limited land area: food / energy / water insecurity; 1(d)(i) (small amounts of) inbound sunlight are reflected back (into space); 2 cools planet / reduces global temperatures / reduces speed of climate change; 1(d)(ii) any two from: 2 combustion of fossil fuels produces, greenhouse gases / carbon dioxide; idea that SRM: does not reduce greenhouse gases / only deals with symptom not the problem / may only work for a short period / not a long-term solution; SRM: untested theory / might have negative effect, e.g. effect on ozone layer / health impact;
Q2 · A photograph of an area of densely forested land affected by human activity
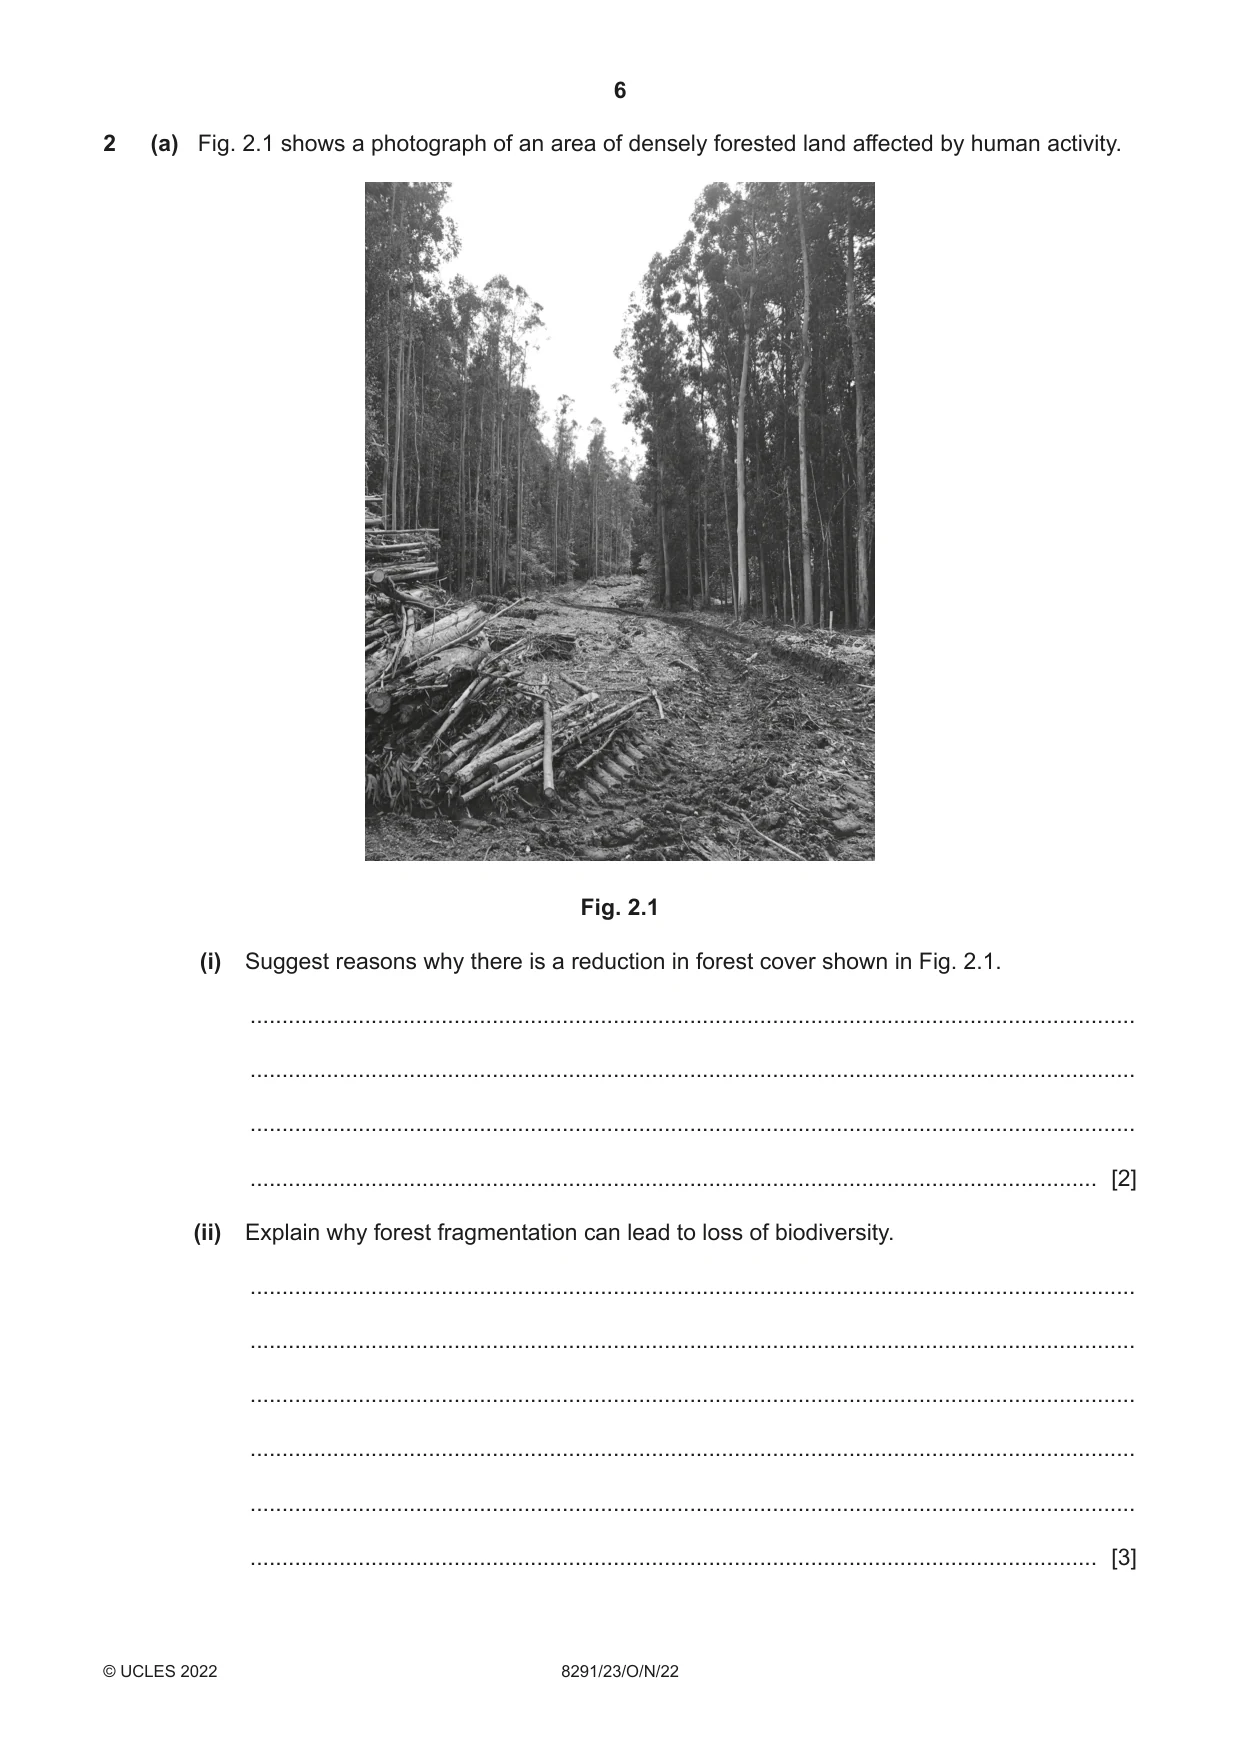
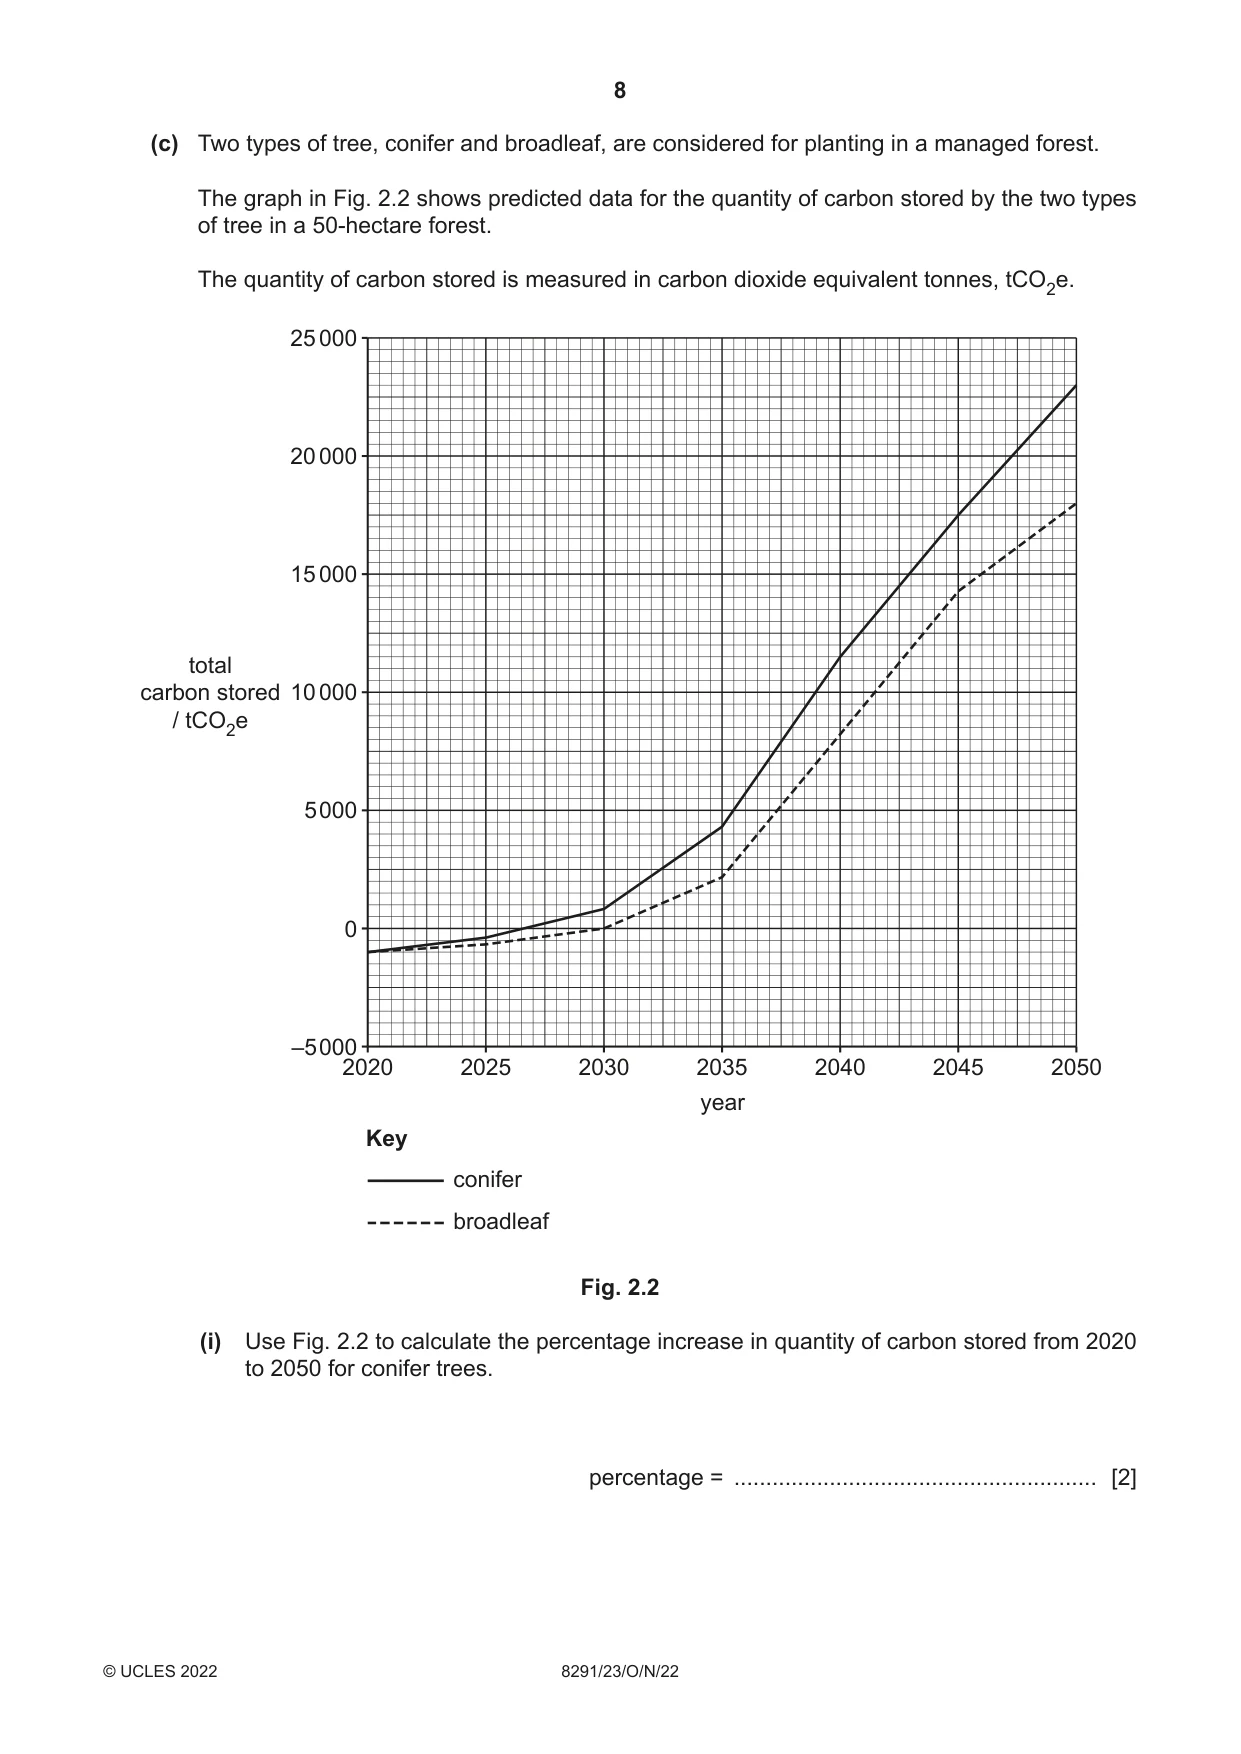
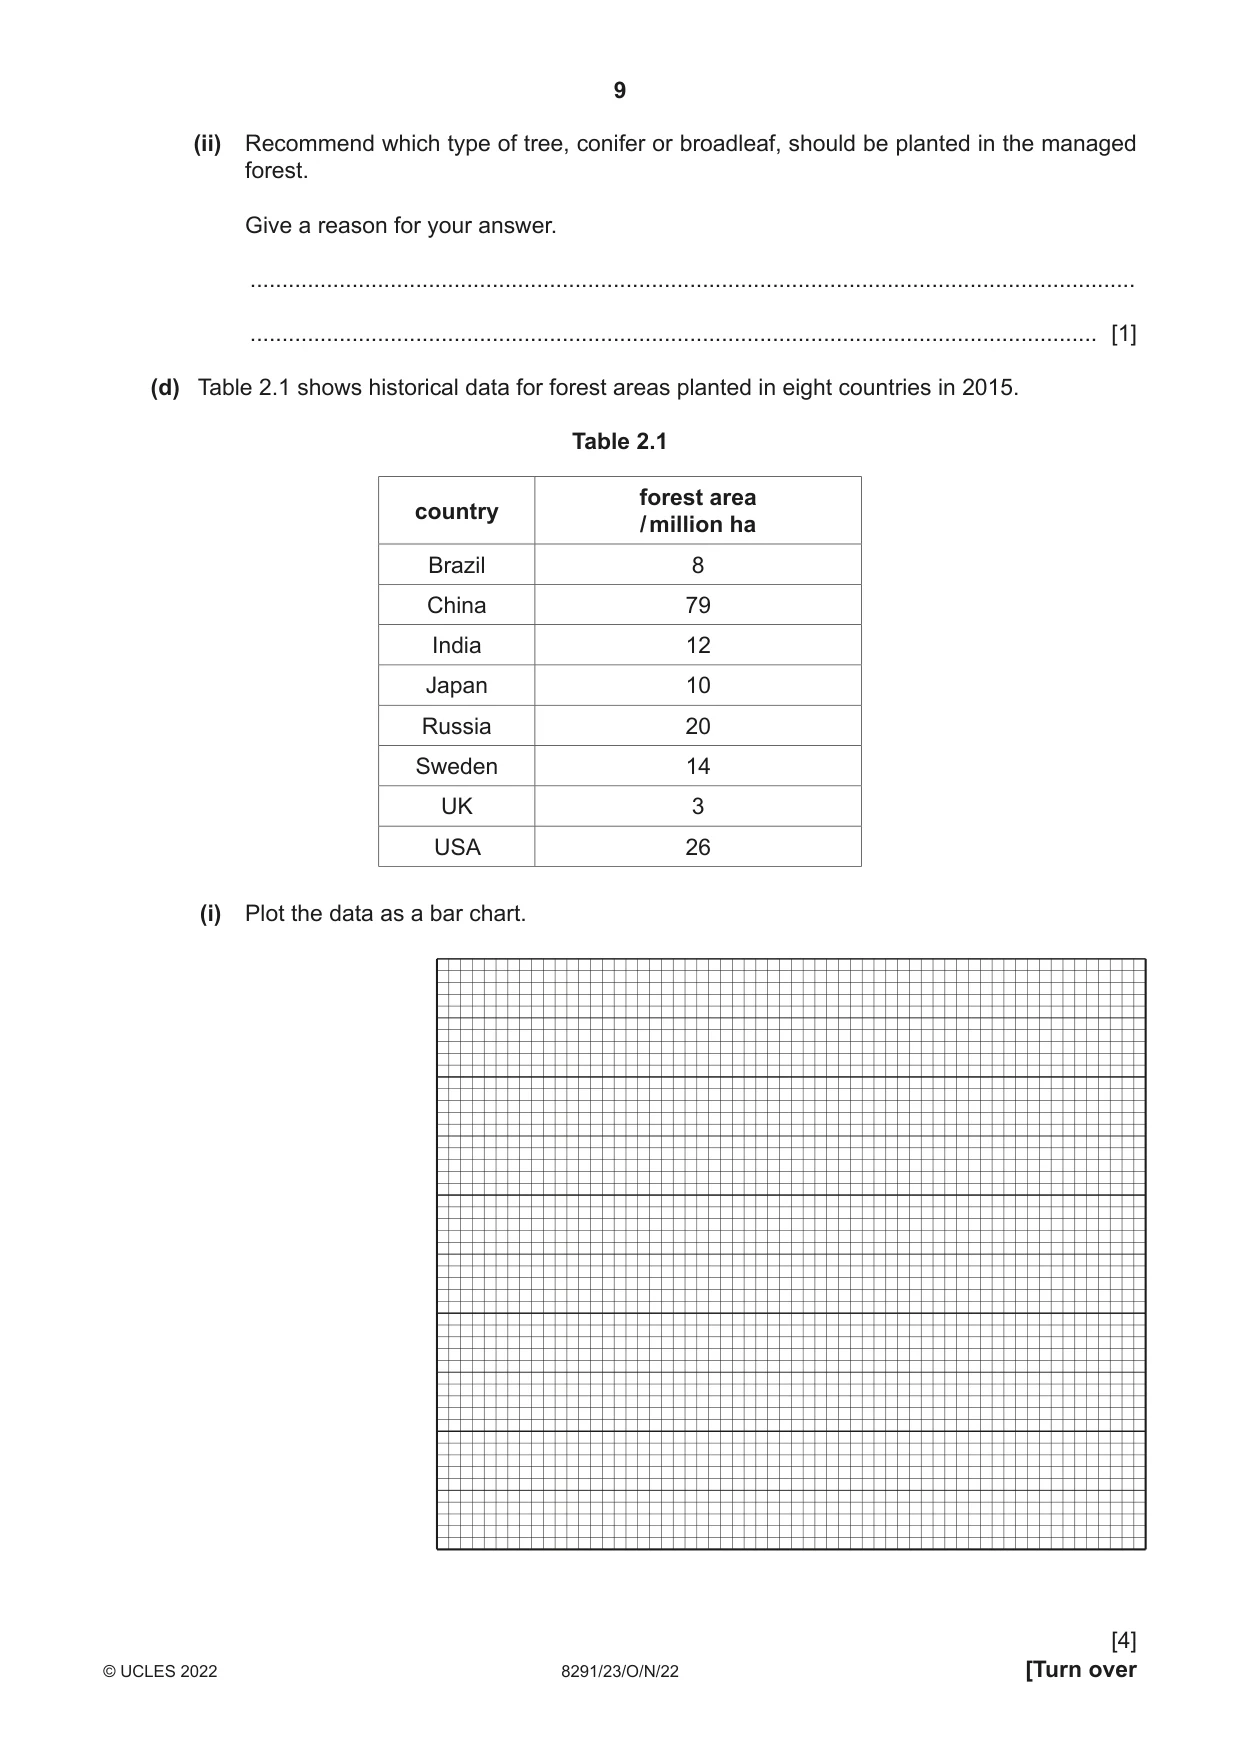
2 (a) Fig. 2.1 shows a photograph of an area of densely forested land affected by human activity. Fig. 2.1 (i) Suggest reasons why there is a reduction in forest cover shown in Fig. 2.1. ........................................................................................................................................... ........................................................................................................................................... ........................................................................................................................................... ..................................................................................................................................... [2] (ii) Explain why forest fragmentation can lead to loss of biodiversity. ........................................................................................................................................... ........................................................................................................................................... ........................................................................................................................................... ........................................................................................................................................... ........................................................................................................................................... ..................................................................................................................................... [3] (b) Explain how trees absorb carbon dioxide from the atmosphere. ................................................................................................................................................... ................................................................................................................................................... ................................................................................................................................................... ................................................................................................................................................... ................................................................................................................................................... ............................................................................................................................................. [3] (c) Two types of tree, conifer and broadleaf, are considered for planting in a managed forest. The graph in Fig. 2.2 shows predicted data for the quantity of carbon stored by the two types of tree in a 50-hectare forest. The quantity of carbon stored is measured in carbon dioxide equivalent tonnes, tCO2e. 25 000 20 000 15 000 total carbon stored 10 000 / tCO2e 5 000 0 –5 000 2020 2025 2030 2035 2040 2045 2050 year Key conifer broadleaf Fig. 2.2 (i) Use Fig. 2.2 to calculate the percentage increase in quantity of carbon stored from 2020 to 2050 for conifer trees. percentage = ......................................................... [2] (ii) Recommend which type of tree, conifer or broadleaf, should be planted in the managed forest. Give a reason for your answer. ........................................................................................................................................... ..................................................................................................................................... [1] (d) Table 2.1 shows historical data for forest areas planted in eight countries in 2015. Table 2.1 forest area country / million ha Brazil 8 China 79 India 12 Japan 10 Russia 20 Sweden 14 UK 3 USA 26 (i) Plot the data as a bar chart. [4] (ii) Suggest why some countries plant more trees than other countries. ........................................................................................................................................... ..................................................................................................................................... [1] [Total: 16]
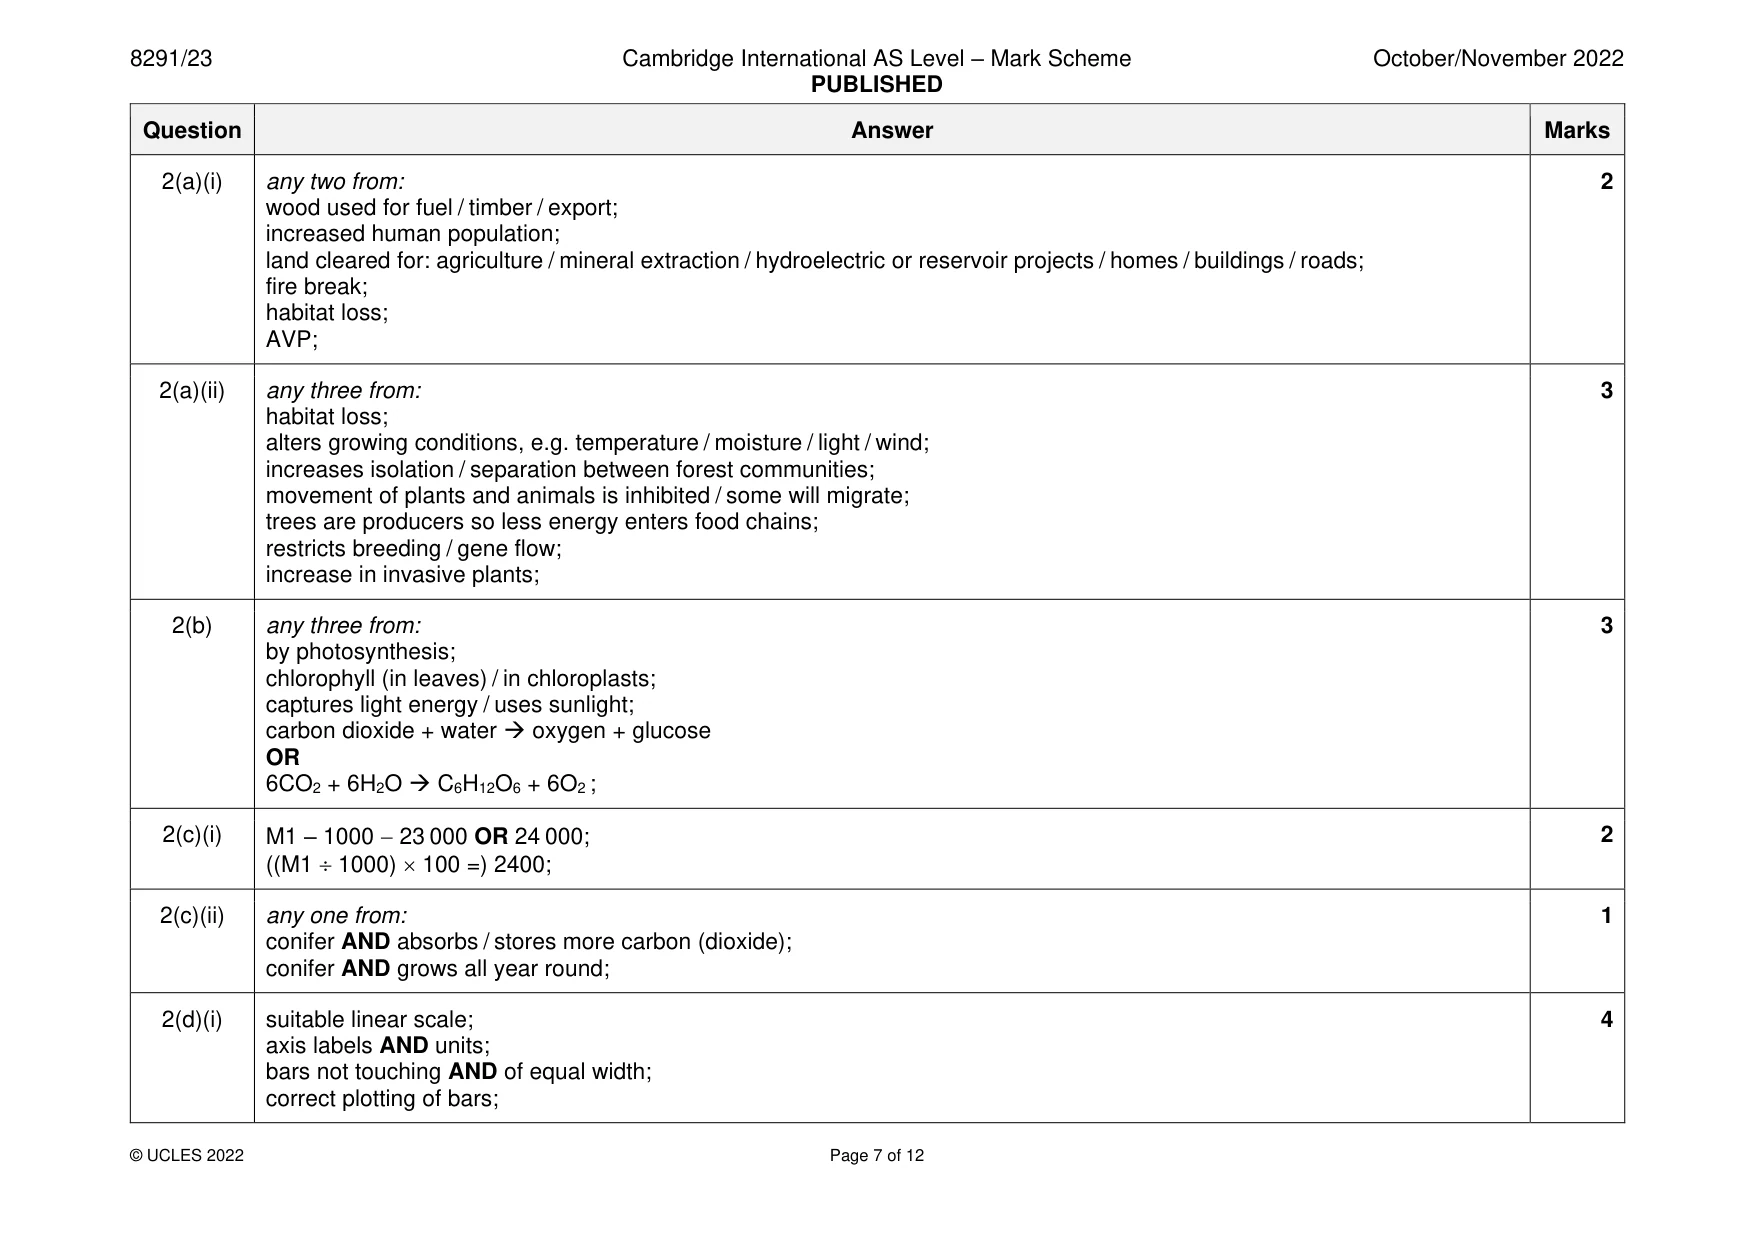
Mark scheme: 2(a)(i) any two from: 2 wood used for fuel / timber / export; increased human population; land cleared for: agriculture / mineral extraction / hydroelectric or reservoir projects / homes / buildings / roads; fire break; habitat loss; AVP; 2(a)(ii) any three from: 3 habitat loss; alters growing conditions, e.g. temperature / moisture / light / wind; increases isolation / separation between forest communities; movement of plants and animals is inhibited / some will migrate; trees are producers so less energy enters food chains; restricts breeding / gene flow; increase in invasive plants; 2(b) any three from: 3 by photosynthesis; chlorophyll (in leaves) / in chloroplasts; captures light energy / uses sunlight; carbon dioxide + water → oxygen + glucose OR 6CO2 + 6H2O → C6H12O6 + 6O2 ; 2(c)(i) M1 – 1000 − 23 000 OR 24 000; 2 ((M1 1000) 100 =) 2400; 2(c)(ii) any one from: 1 conifer AND absorbs / stores more carbon (dioxide); conifer AND grows all year round; 2(d)(i) suitable linear scale; 4 axis labels AND units; bars not touching AND of equal width; correct plotting of bars; 2(d)(ii) more land space / lower population density / more concerned about climate change / wealth / more suitable conditions / AVP; 1 grow trees for food;
Q3 · A photograph of Stockton mine, a large coal mine in New Zealand
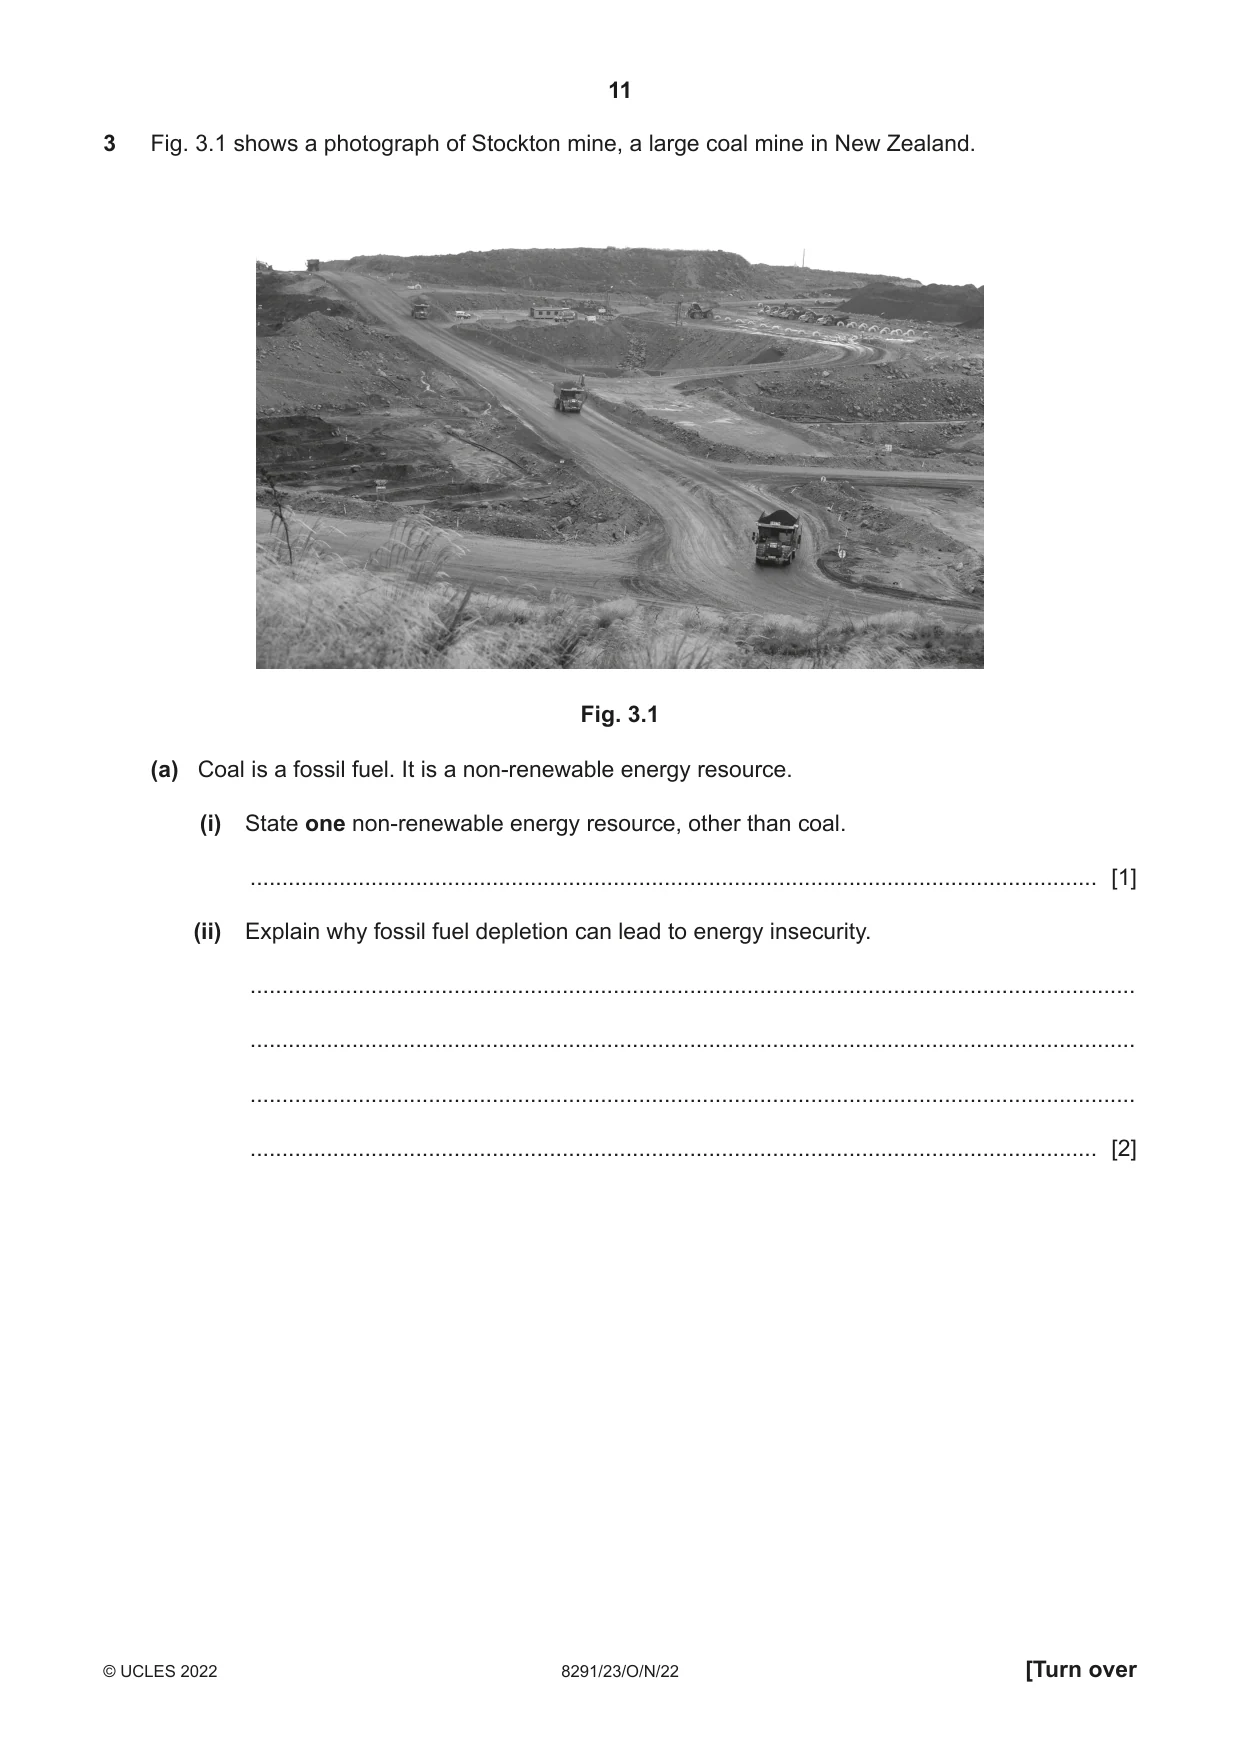
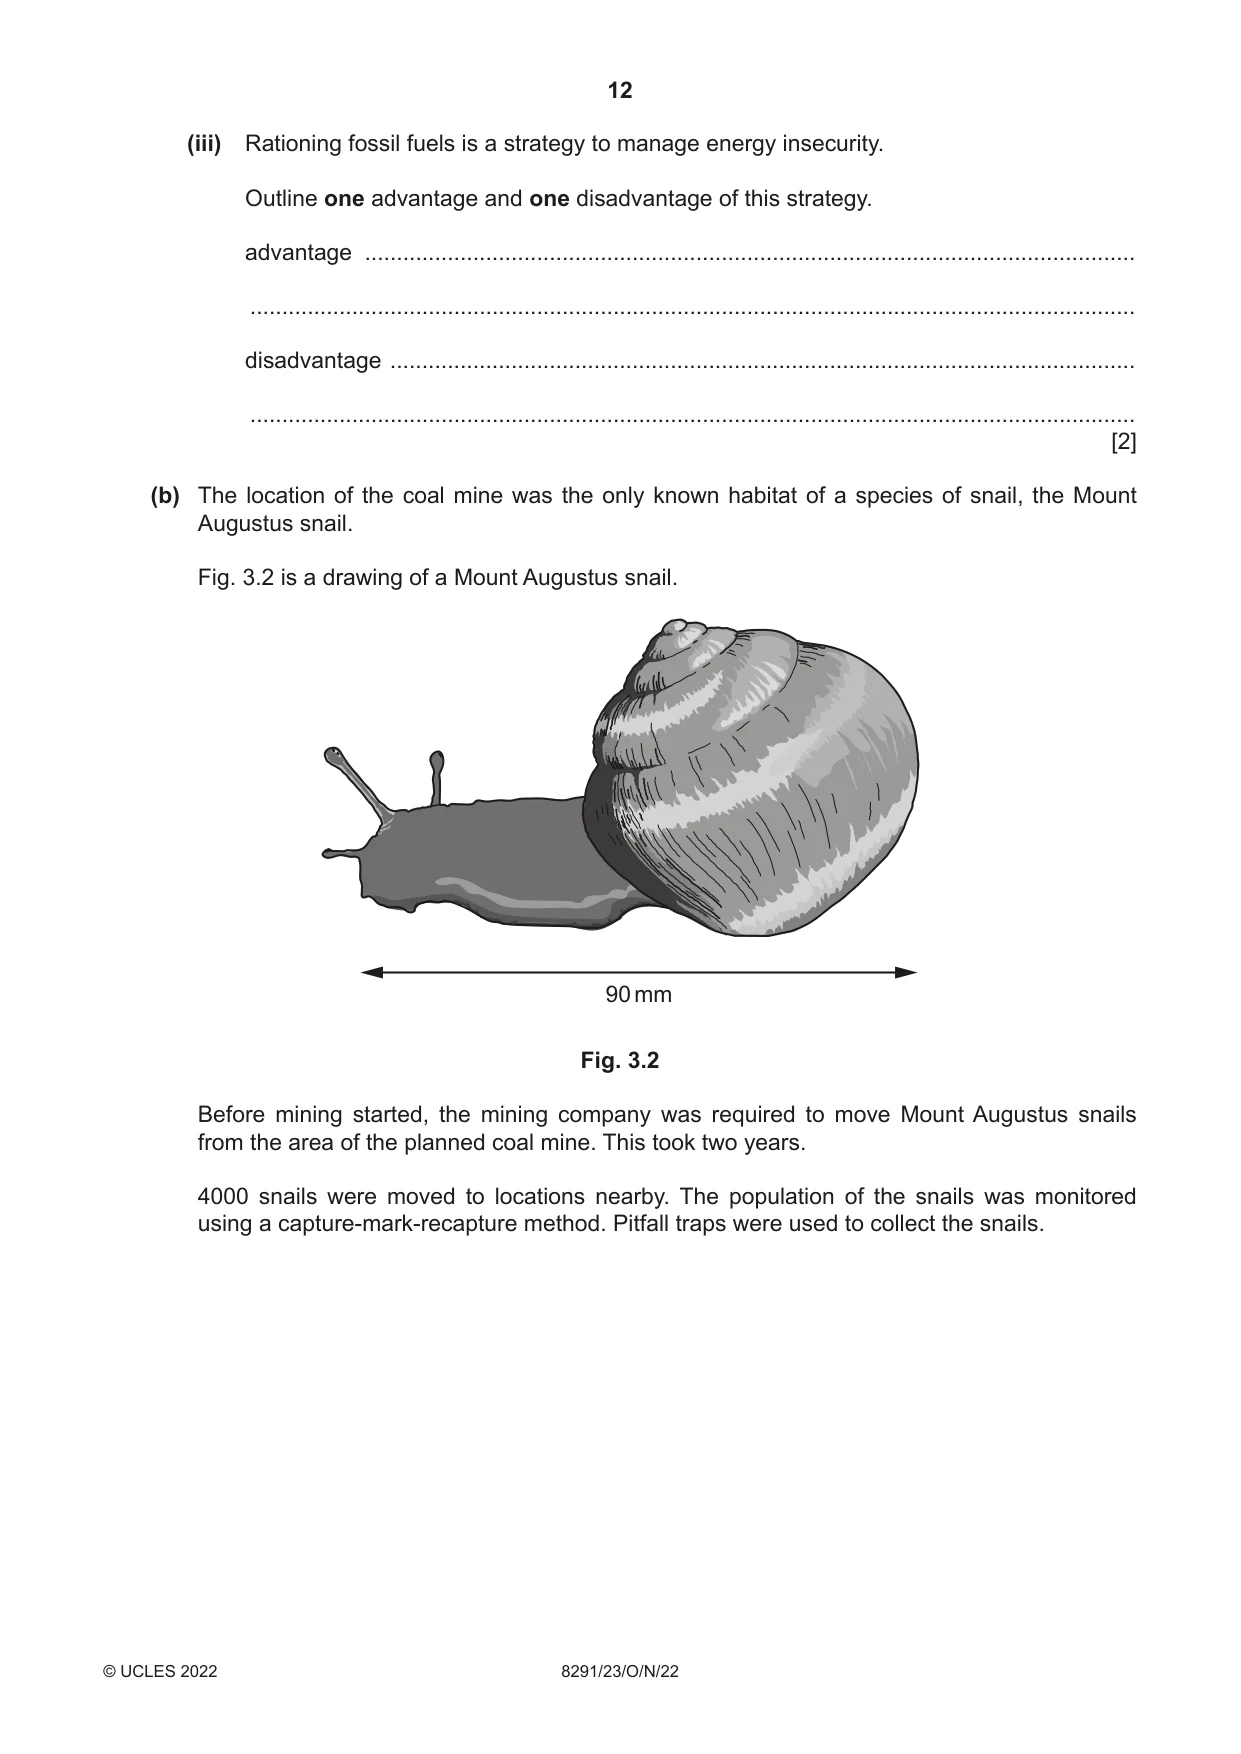
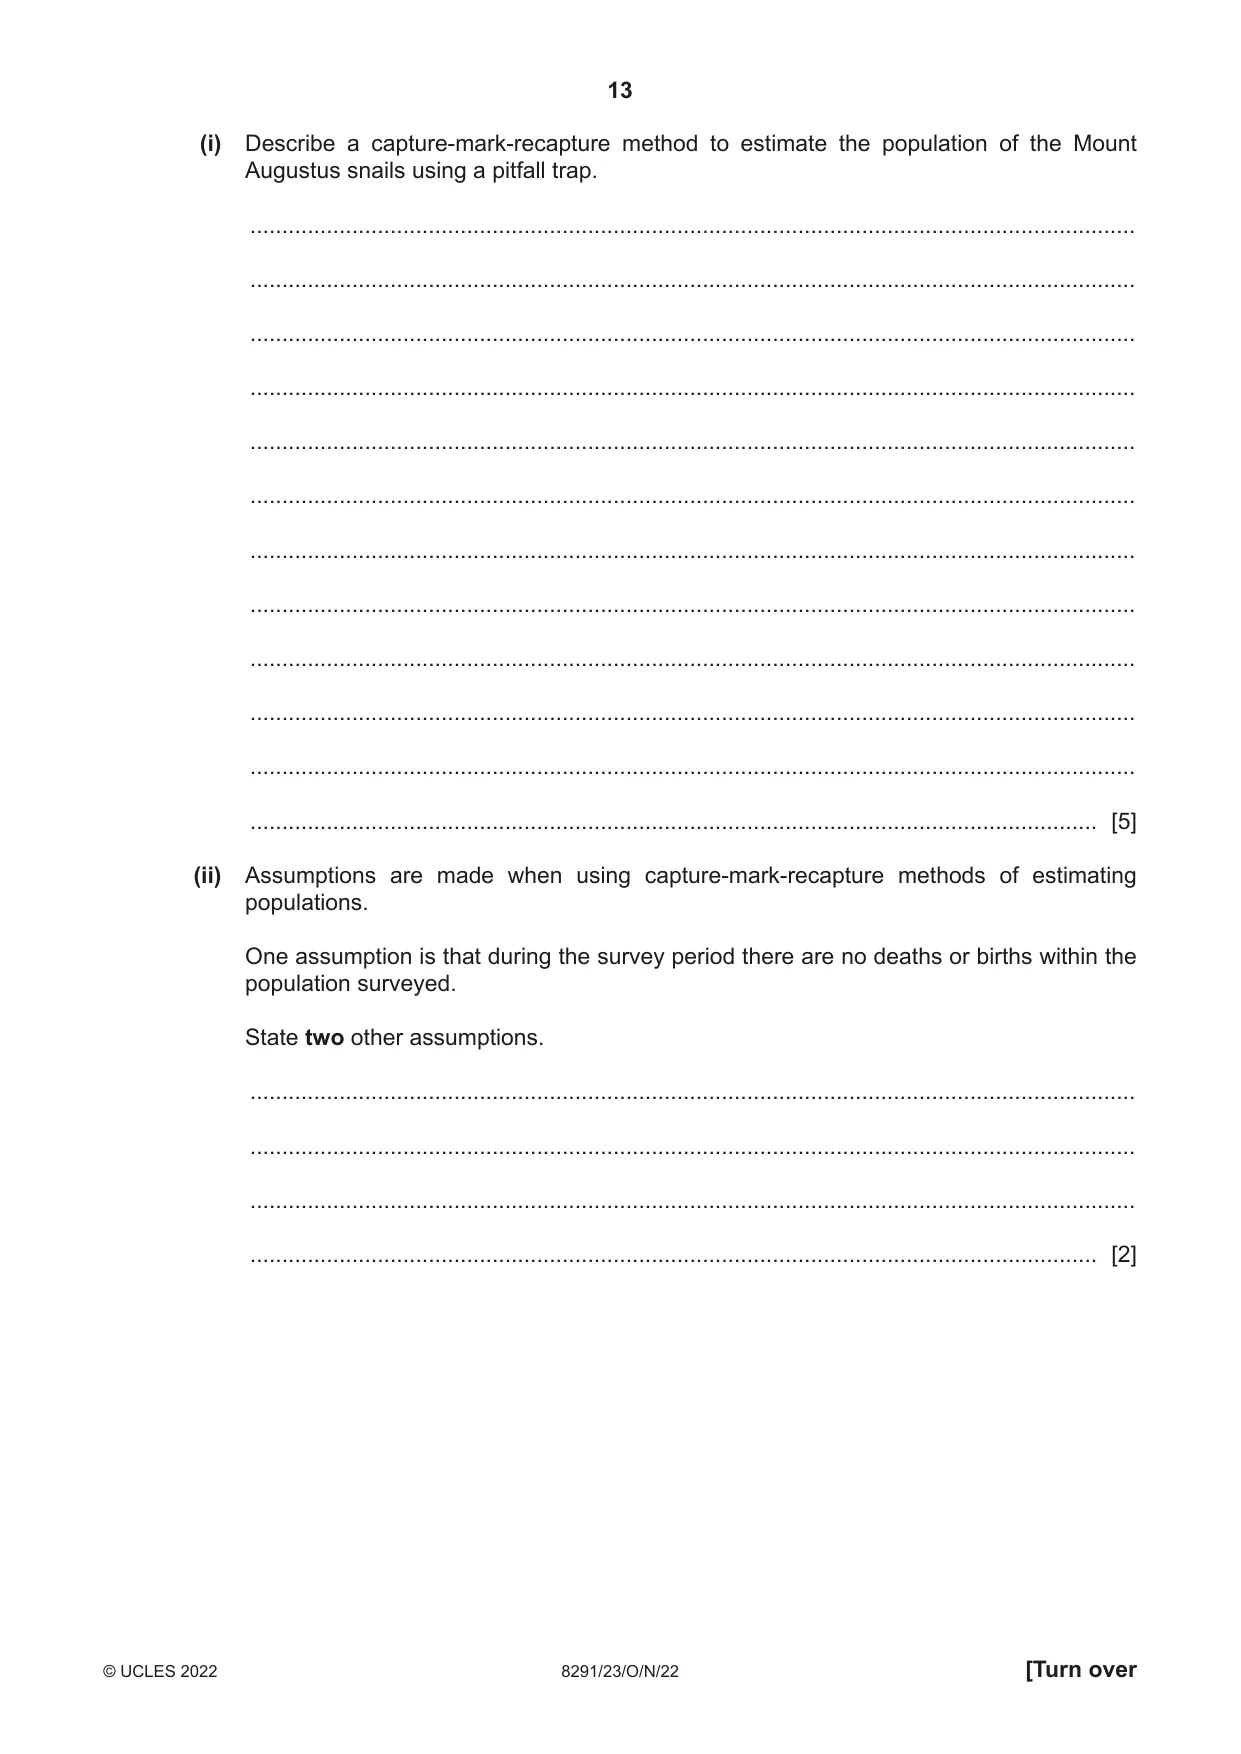
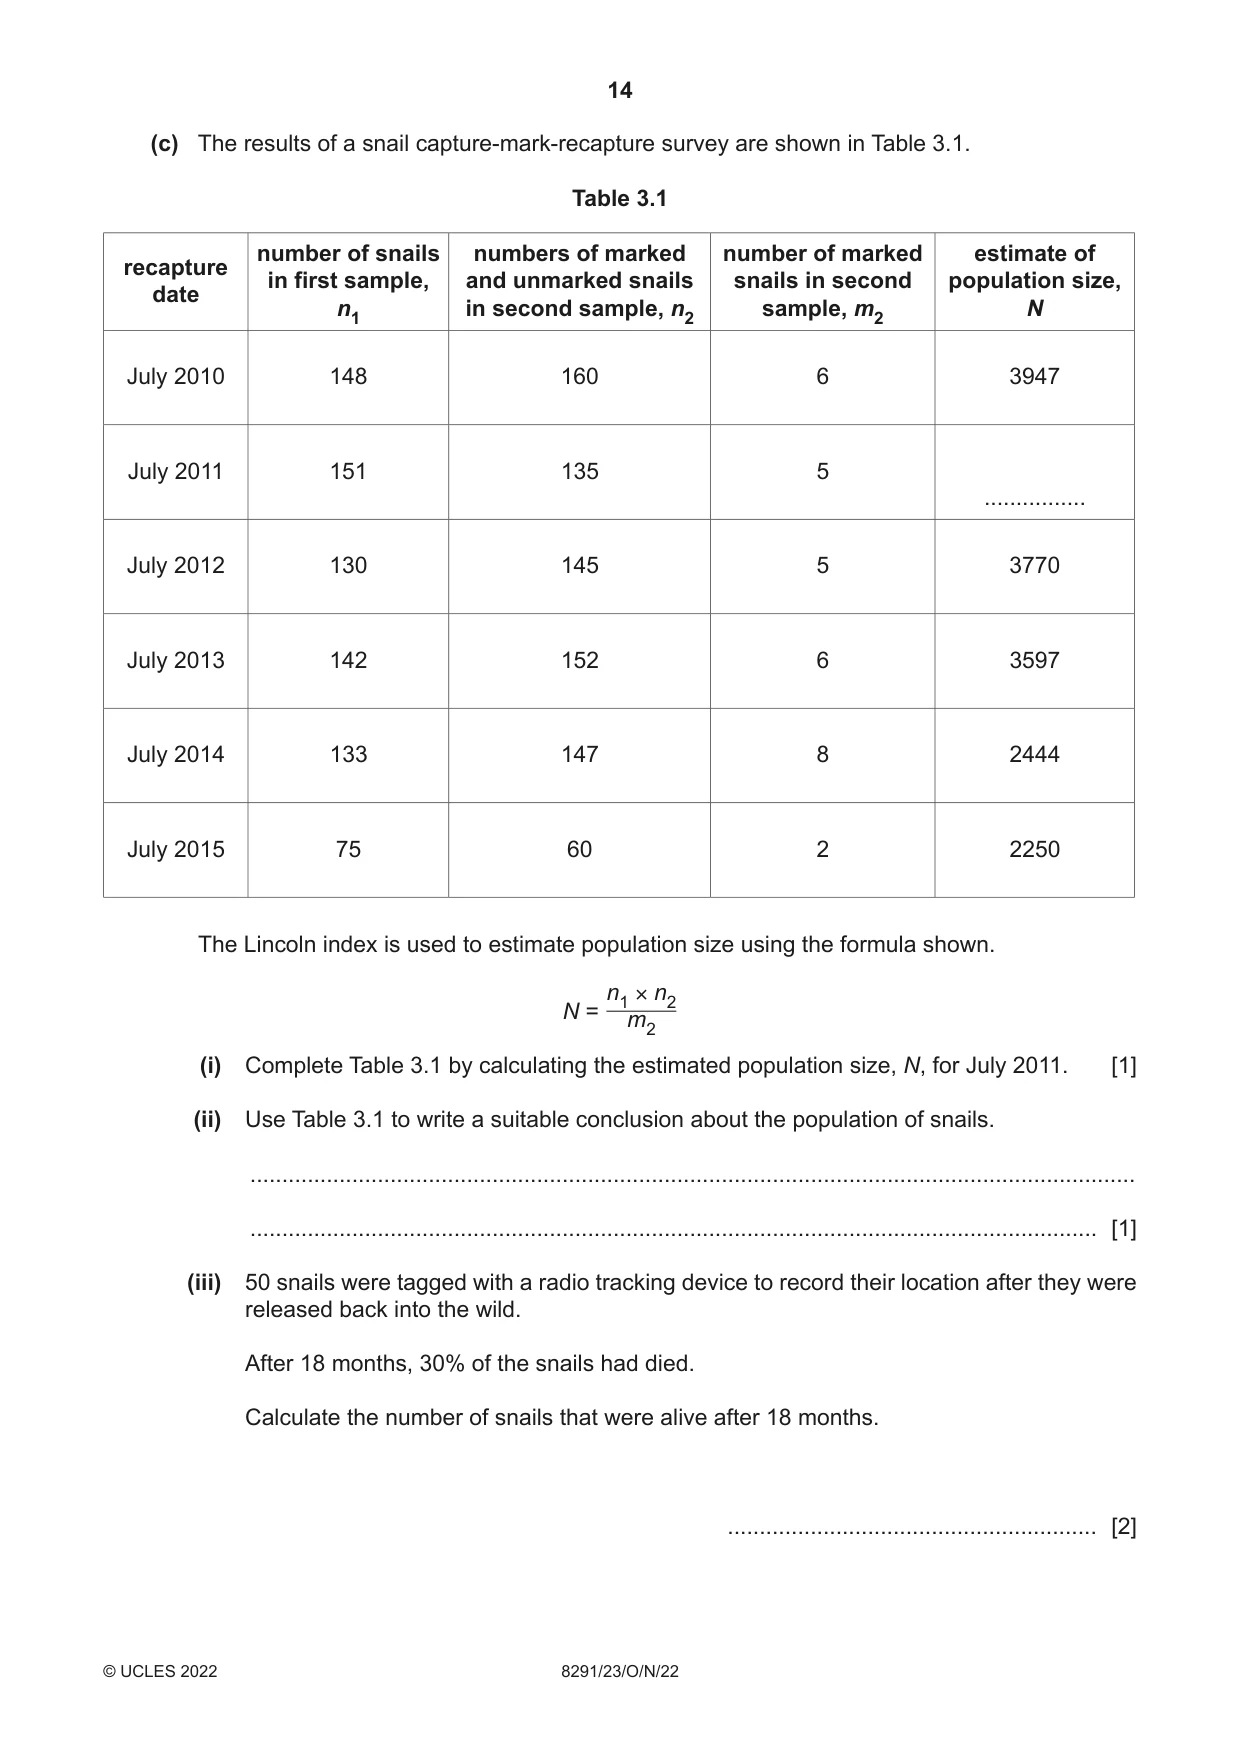
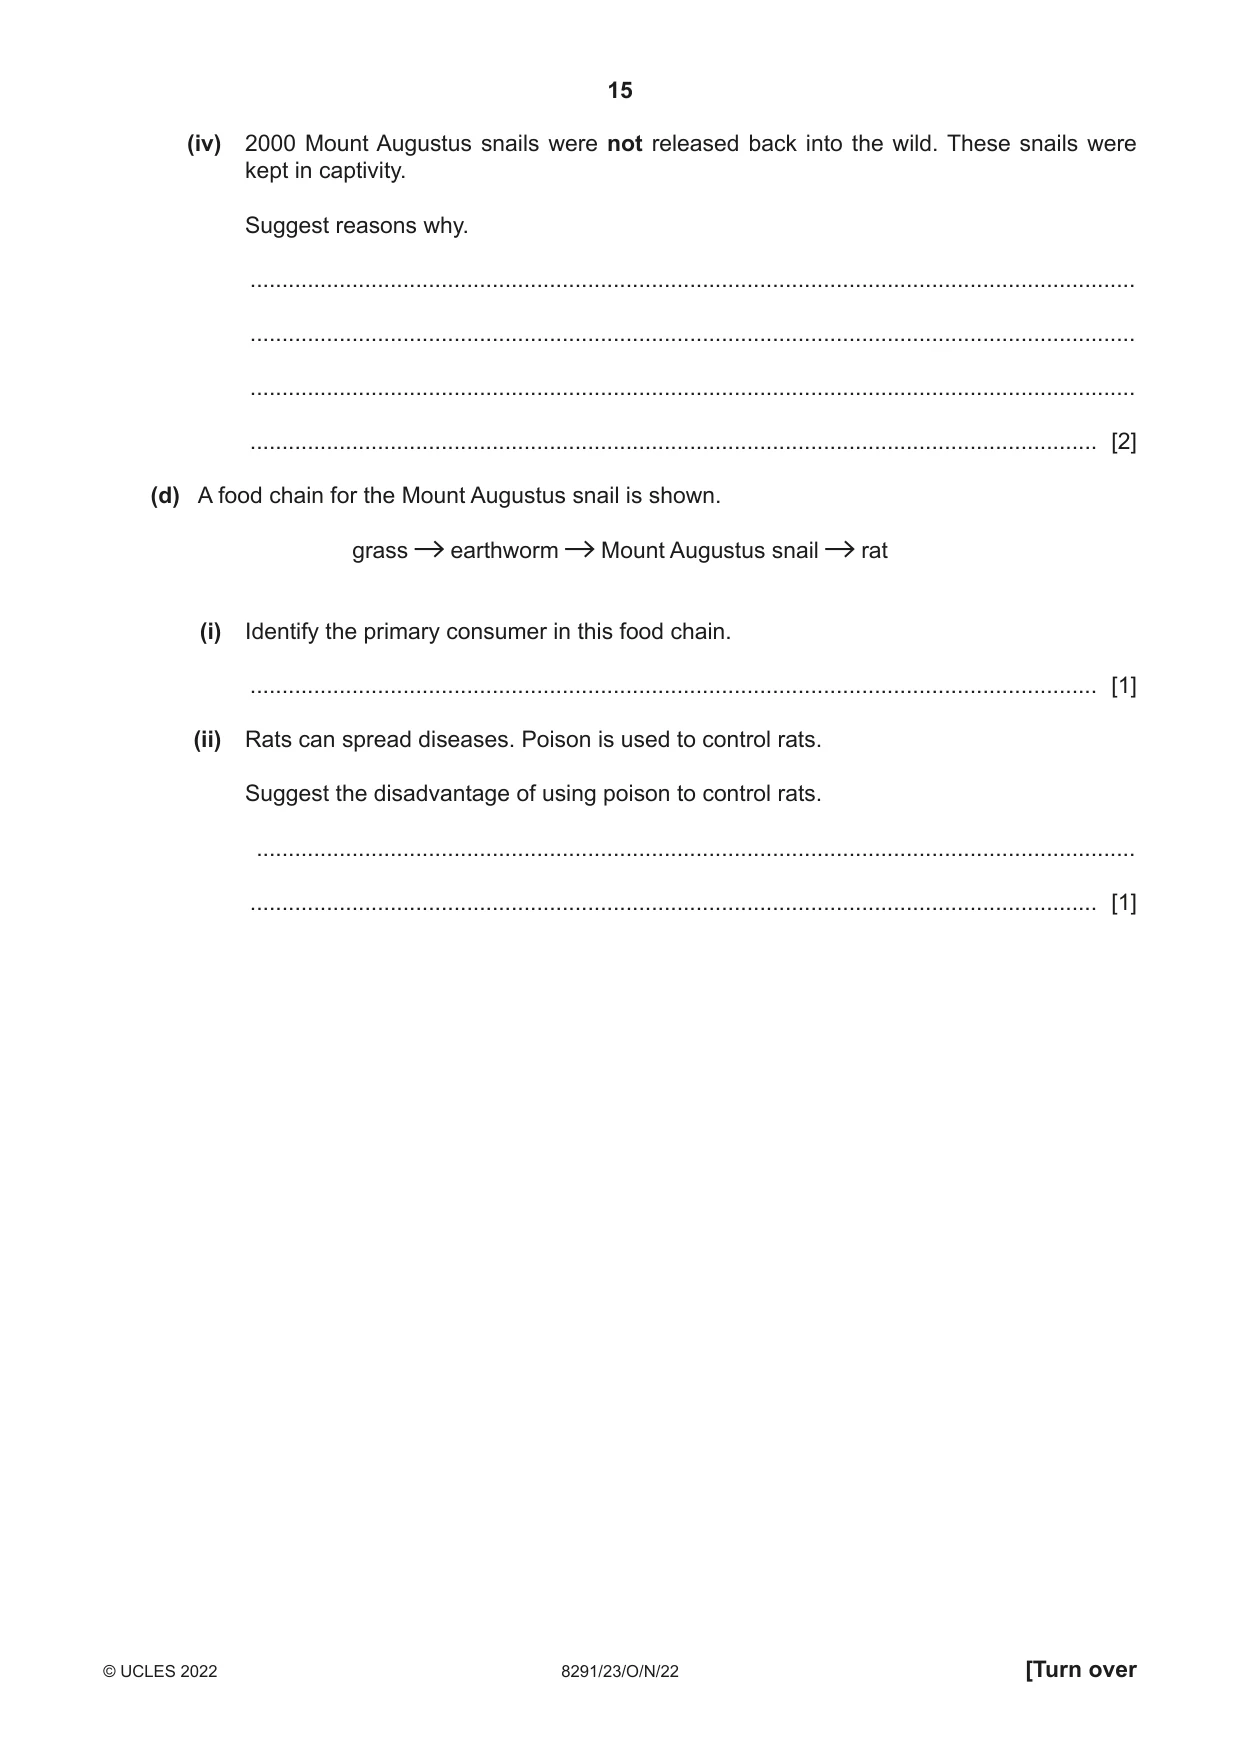
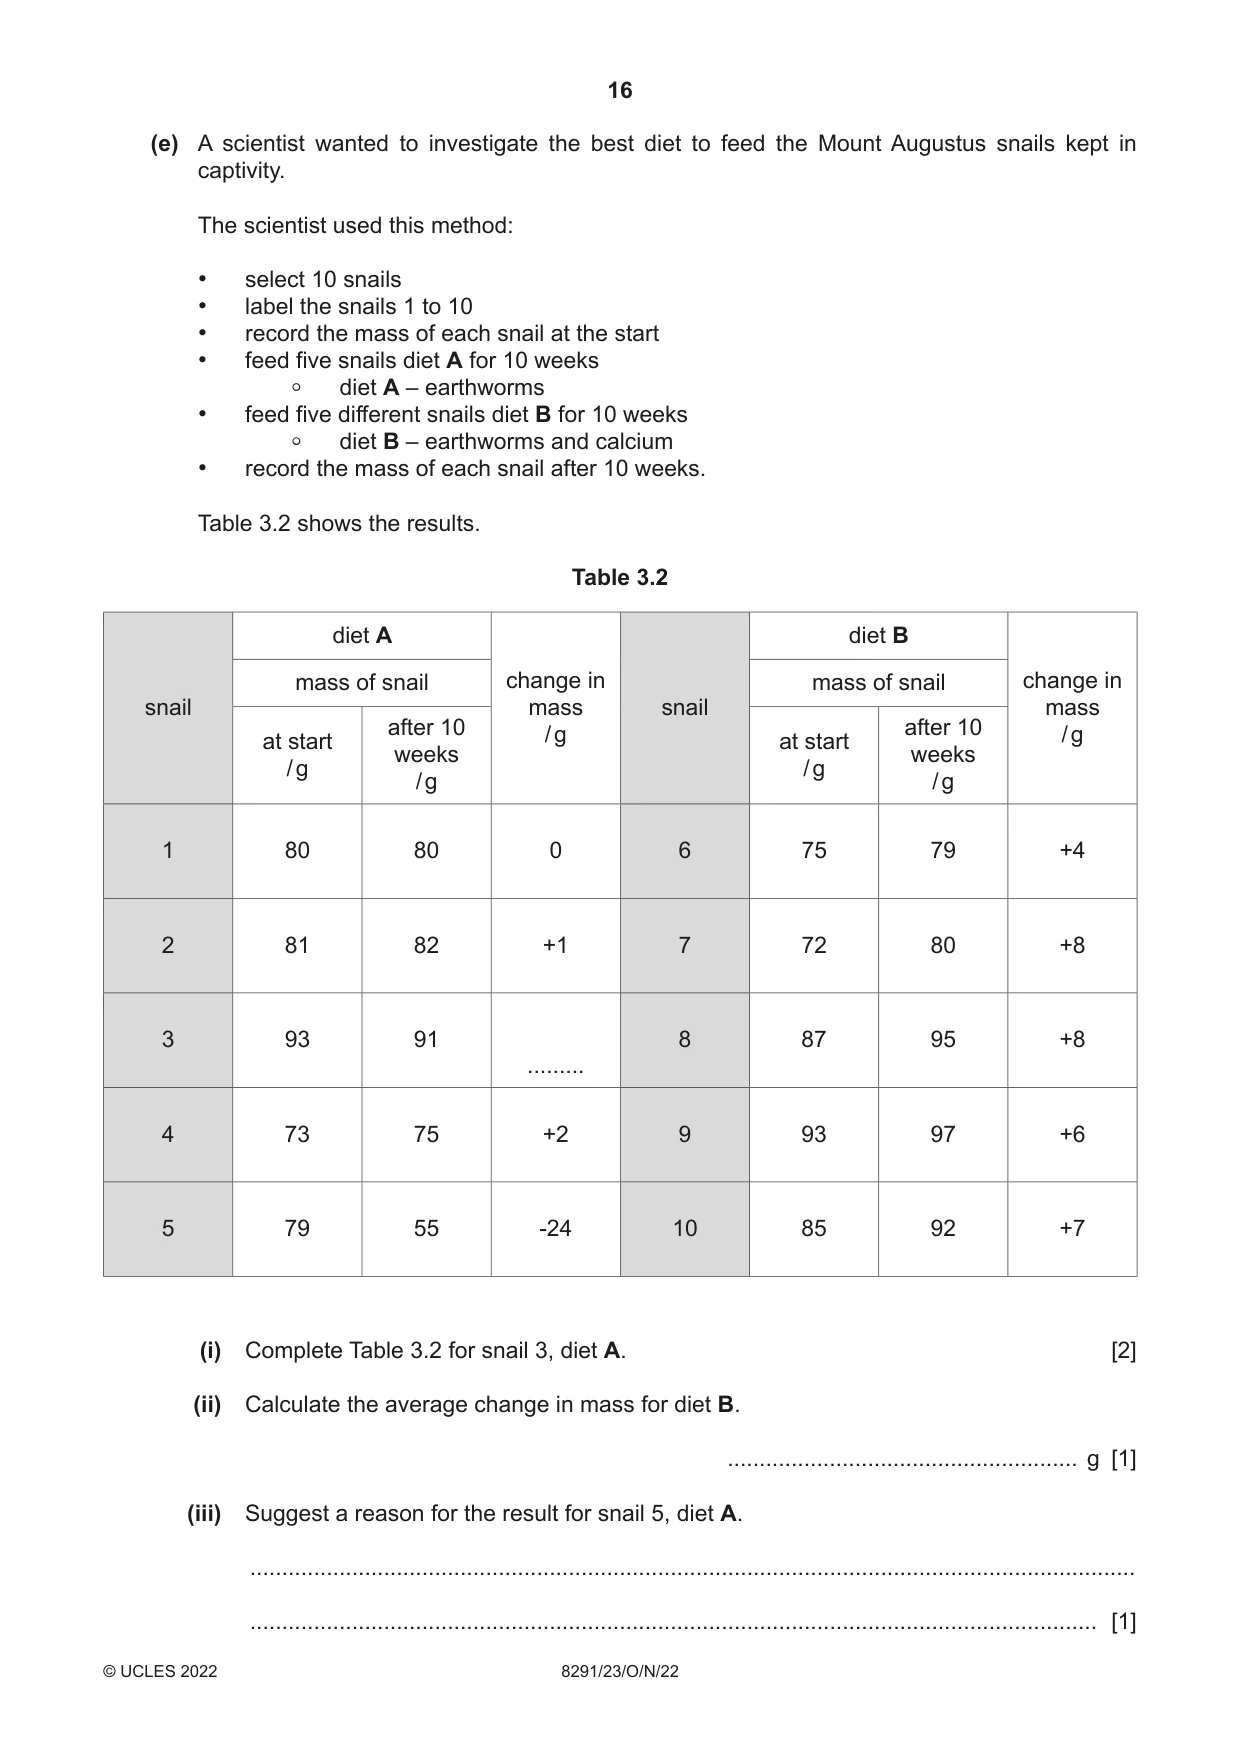
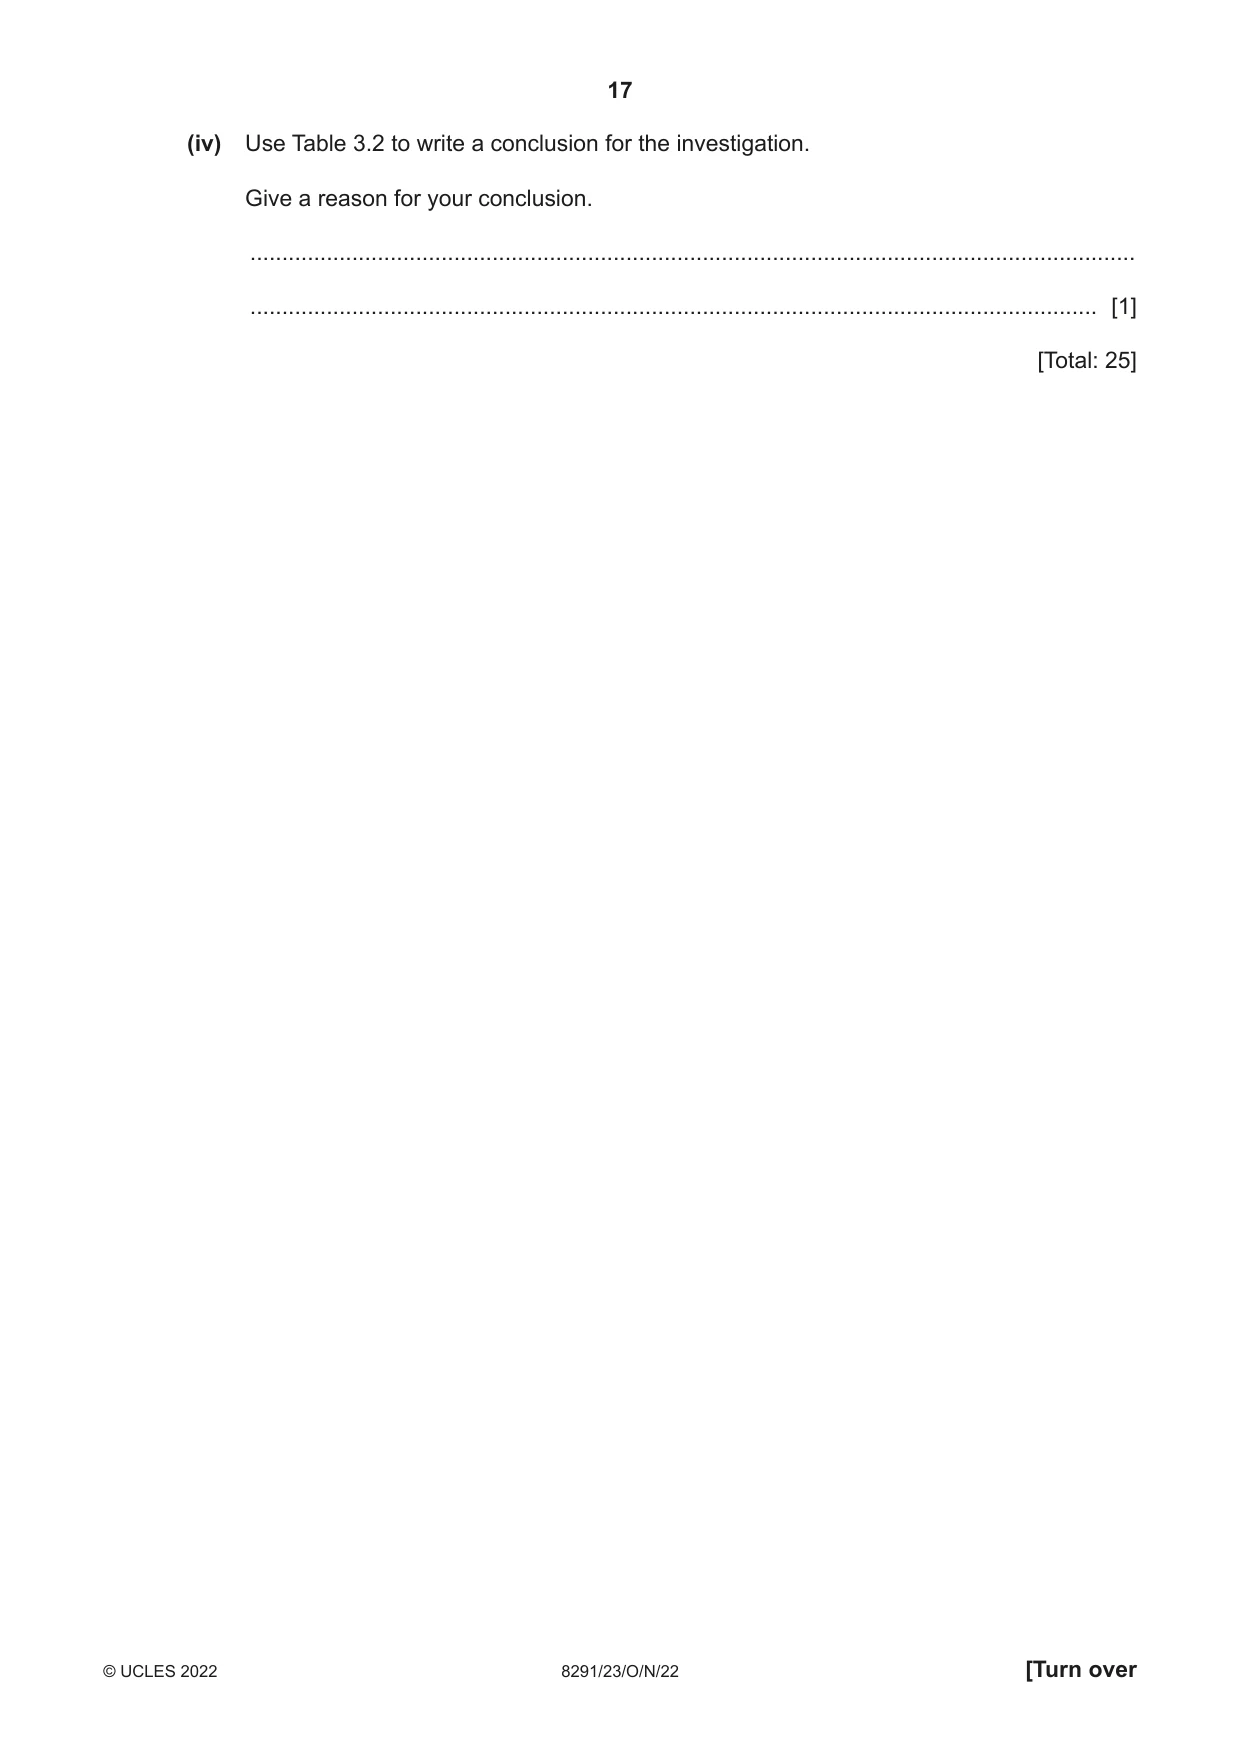
3 Fig. 3.1 shows a photograph of Stockton mine, a large coal mine in New Zealand. Fig. 3.1 (a) Coal is a fossil fuel. It is a non-renewable energy resource. (i) State one non-renewable energy resource, other than coal. ..................................................................................................................................... [1] (ii) Explain why fossil fuel depletion can lead to energy insecurity. ........................................................................................................................................... ........................................................................................................................................... ........................................................................................................................................... ..................................................................................................................................... [2] (iii) Rationing fossil fuels is a strategy to manage energy insecurity. Outline one advantage and one disadvantage of this strategy. advantage ......................................................................................................................... ........................................................................................................................................... disadvantage ..................................................................................................................... ........................................................................................................................................... [2] (b) The location of the coal mine was the only known habitat of a species of snail, the Mount Augustus snail. Fig. 3.2 is a drawing of a Mount Augustus snail. 90 mm Fig. 3.2 Before mining started, the mining company was required to move Mount Augustus snails from the area of the planned coal mine. This took two years. 4000 snails were moved to locations nearby. The population of the snails was monitored using a capture-mark-recapture method. Pitfall traps were used to collect the snails. (i) Describe a capture-mark-recapture method to estimate the population of the Mount Augustus snails using a pitfall trap. ........................................................................................................................................... ........................................................................................................................................... ........................................................................................................................................... ........................................................................................................................................... ........................................................................................................................................... ........................................................................................................................................... ........................................................................................................................................... ........................................................................................................................................... ........................................................................................................................................... ........................................................................................................................................... ........................................................................................................................................... ..................................................................................................................................... [5] (ii) Assumptions are made when using capture-mark-recapture methods of estimating populations. One assumption is that during the survey period there are no deaths or births within the population surveyed. State two other assumptions. ........................................................................................................................................... ........................................................................................................................................... ........................................................................................................................................... ..................................................................................................................................... [2] (c) The results of a snail capture-mark-recapture survey are shown in Table 3.1. Table 3.1 number of snails numbers of marked number of marked estimate ofrecapture in first sample, and unmarked snails snails in second population size, date n1 in second sample, n2 sample, m2 N July 2010 148 160 6 3947 July 2011 151 135 5 ................ July 2012 130 145 5 3770 July 2013 142 152 6 3597 July 2014 133 147 8 2444 July 2015 75 60 2 2250 The Lincoln index is used to estimate population size using the formula shown. n1 × n2 N = m2 (i) Complete Table 3.1 by calculating the estimated population size, N, for July 2011. [1] (ii) Use Table 3.1 to write a suitable conclusion about the population of snails. ........................................................................................................................................... ..................................................................................................................................... [1] (iii) 50 snails were tagged with a radio tracking device to record their location after they were released back into the wild. After 18 months, 30% of the snails had died. Calculate the number of snails that were alive after 18 months. .......................................................... [2] (iv) 2000 Mount Augustus snails were not released back into the wild. These snails were kept in captivity. Suggest reasons why. ........................................................................................................................................... ........................................................................................................................................... ........................................................................................................................................... ..................................................................................................................................... [2] (d) A food chain for the Mount Augustus snail is shown. grass earthworm Mount Augustus snail rat (i) Identify the primary consumer in this food chain. ..................................................................................................................................... [1] (ii) Rats can spread diseases. Poison is used to control rats. Suggest the disadvantage of using poison to control rats. .......................................................................................................................................... ..................................................................................................................................... [1] (e) A scientist wanted to investigate the best diet to feed the Mount Augustus snails kept in captivity. The scientist used this method: • select 10 snails • label the snails 1 to 10 • record the mass of each snail at the start • feed five snails diet A for 10 weeks • diet A – earthworms • feed five different snails diet B for 10 weeks • diet B – earthworms and calcium • record the mass of each snail after 10 weeks. Table 3.2 shows the results. Table 3.2 diet A diet B mass of snail change in mass of snail change in snail mass snail mass after 10 after 10 / g / g at start at start weeks weeks / g / g / g / g 1 80 80 0 6 75 79 +4 2 81 82 +1 7 72 80 +8 3 93 91 8 87 95 +8 ......... 4 73 75 +2 9 93 97 +6 5 79 55 -24 10 85 92 +7 (i) Complete Table 3.2 for snail 3, diet A. [2] (ii) Calculate the average change in mass for diet B. ....................................................... g [1] (iii) Suggest a reason for the result for snail 5, diet A. ........................................................................................................................................... ..................................................................................................................................... [1] (iv) Use Table 3.2 to write a conclusion for the investigation. Give a reason for your conclusion. ........................................................................................................................................... ..................................................................................................................................... [1] [Total: 25]
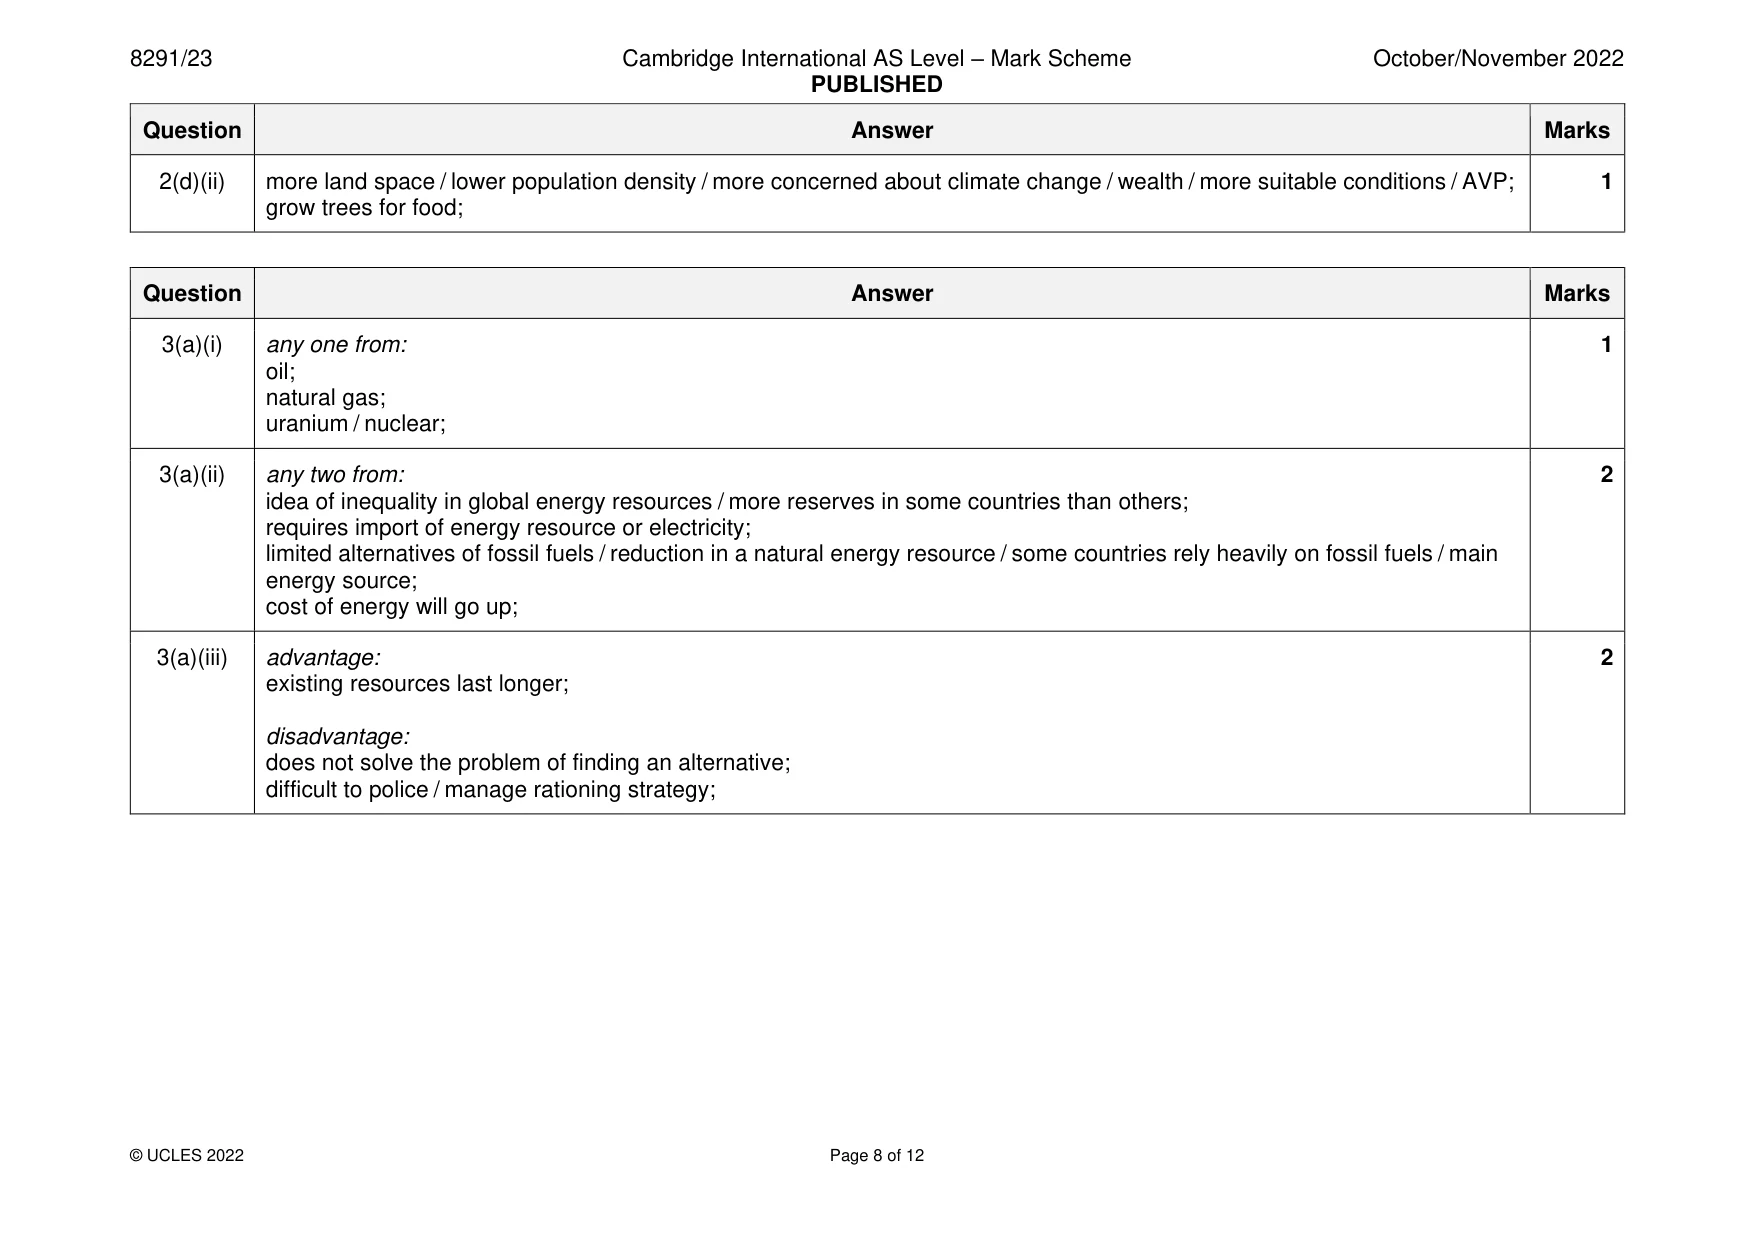
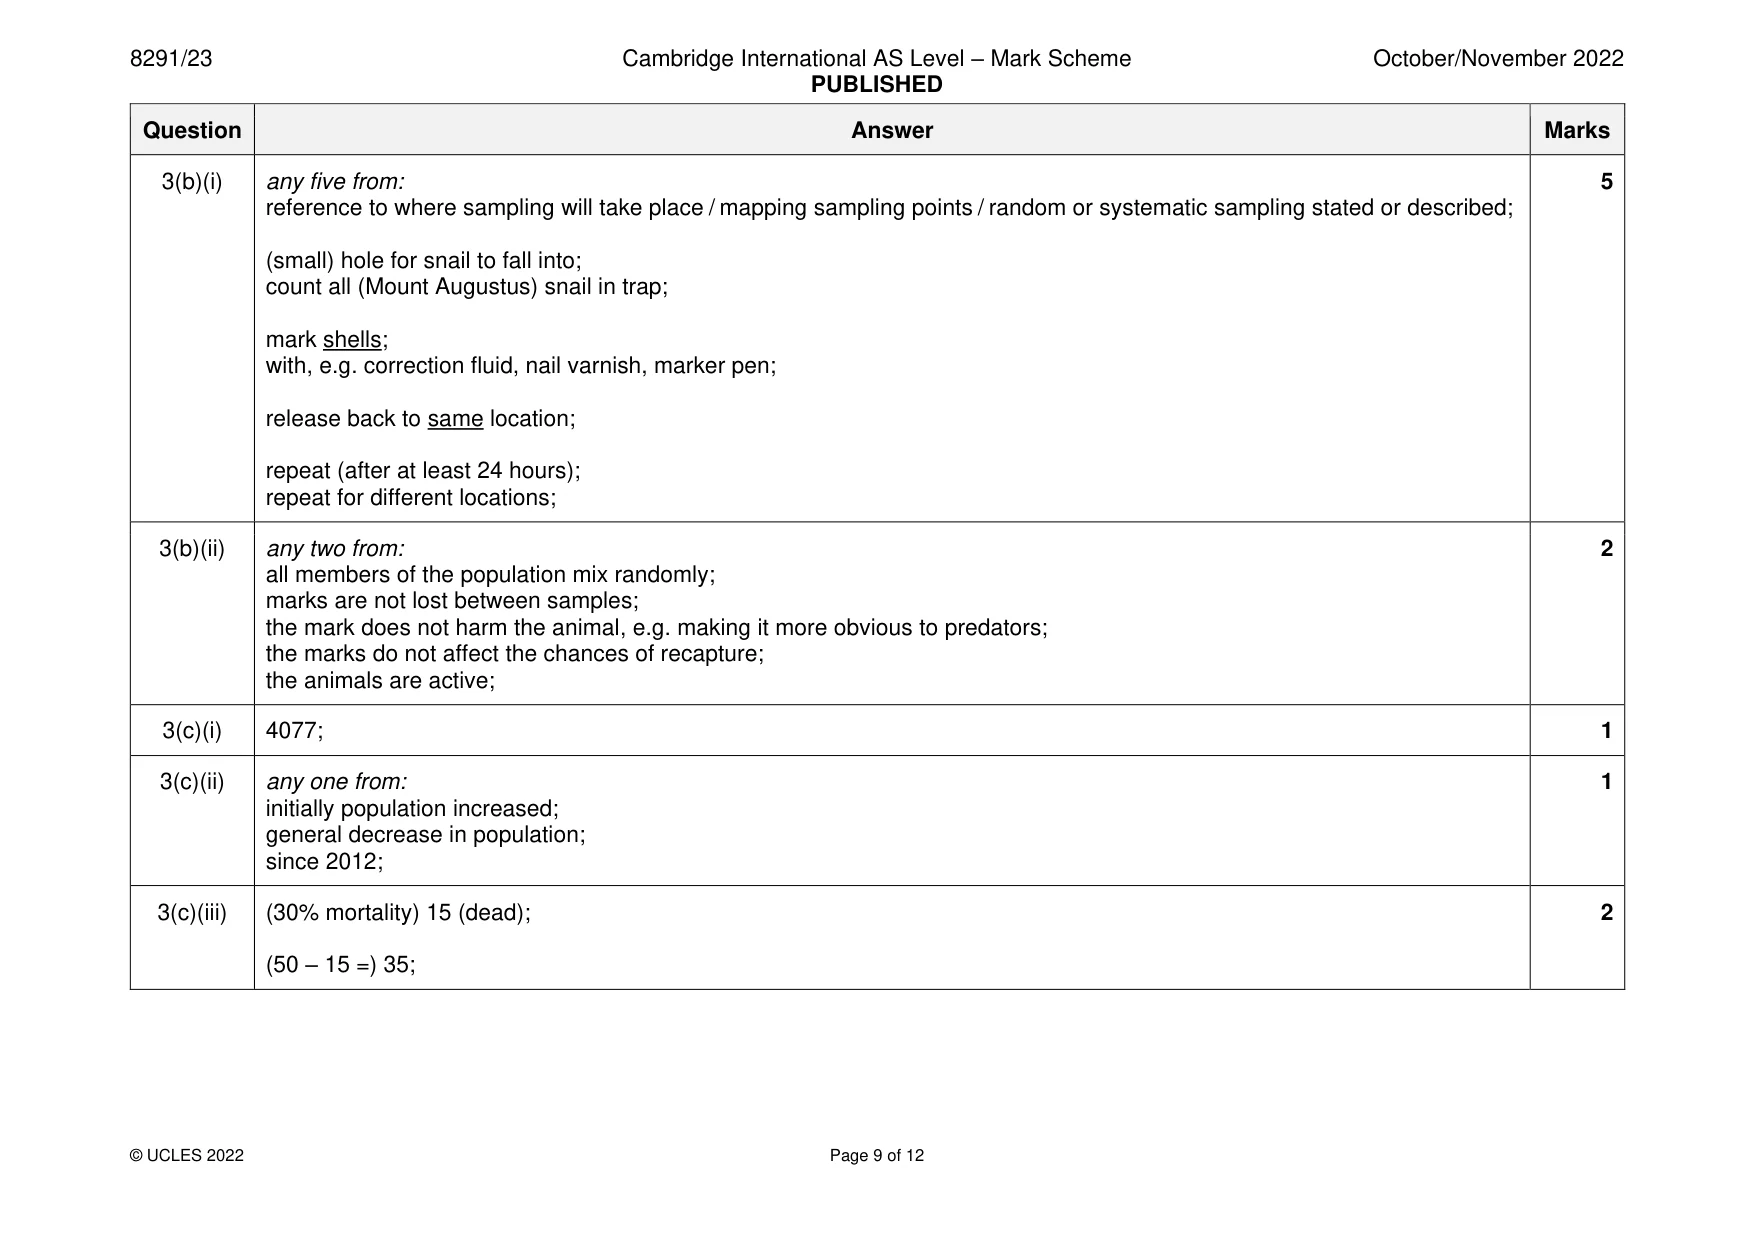
Mark scheme: 3(a)(i) any one from: 1 oil; natural gas; uranium / nuclear; 3(a)(ii) any two from: 2 idea of inequality in global energy resources / more reserves in some countries than others; requires import of energy resource or electricity; limited alternatives of fossil fuels / reduction in a natural energy resource / some countries rely heavily on fossil fuels / main energy source; cost of energy will go up; 3(a)(iii) advantage: 2 existing resources last longer; disadvantage: does not solve the problem of finding an alternative; difficult to police / manage rationing strategy; 3(b)(i) any five from: 5 reference to where sampling will take place / mapping sampling points / random or systematic sampling stated or described; (small) hole for snail to fall into; count all (Mount Augustus) snail in trap; mark shells; with, e.g. correction fluid, nail varnish, marker pen; release back to same location; repeat (after at least 24 hours); repeat for different locations; 3(b)(ii) any two from: 2 all members of the population mix randomly; marks are not lost between samples; the mark does not harm the animal, e.g. making it more obvious to predators; the marks do not affect the chances of recapture; the animals are active; 3(c)(i) 4077; 1 3(c)(ii) any one from: 1 initially population increased; general decrease in population; since 2012; 3(c)(iii) (30% mortality) 15 (dead); 2 (50 – 15 =) 35; 3(c)(iv) any two from: 2 to protect from predators; to have a genetic record / for research or study; to ensure species does not become extinct; breeding programme; 3(d)(i) earthworm; 1 3(d)(ii) any one from: 1 rats become resistant to the poison; may affect non-target species / may poison other animals that eat the rat; builds-up in food chain / biomagnification; 3(e)(i) negative value / – symbol; 2 2; 3(e)(ii) 6.6 / 7; 1 3(e)(iii) any one from: 1 anomalous result; snail has disease / illness; 3(e)(iv) diet B is better because the snails increase more in mass (than A); 1
Q4 · The variation in minimum daily ozone over Antarctica from 1980 to 2019
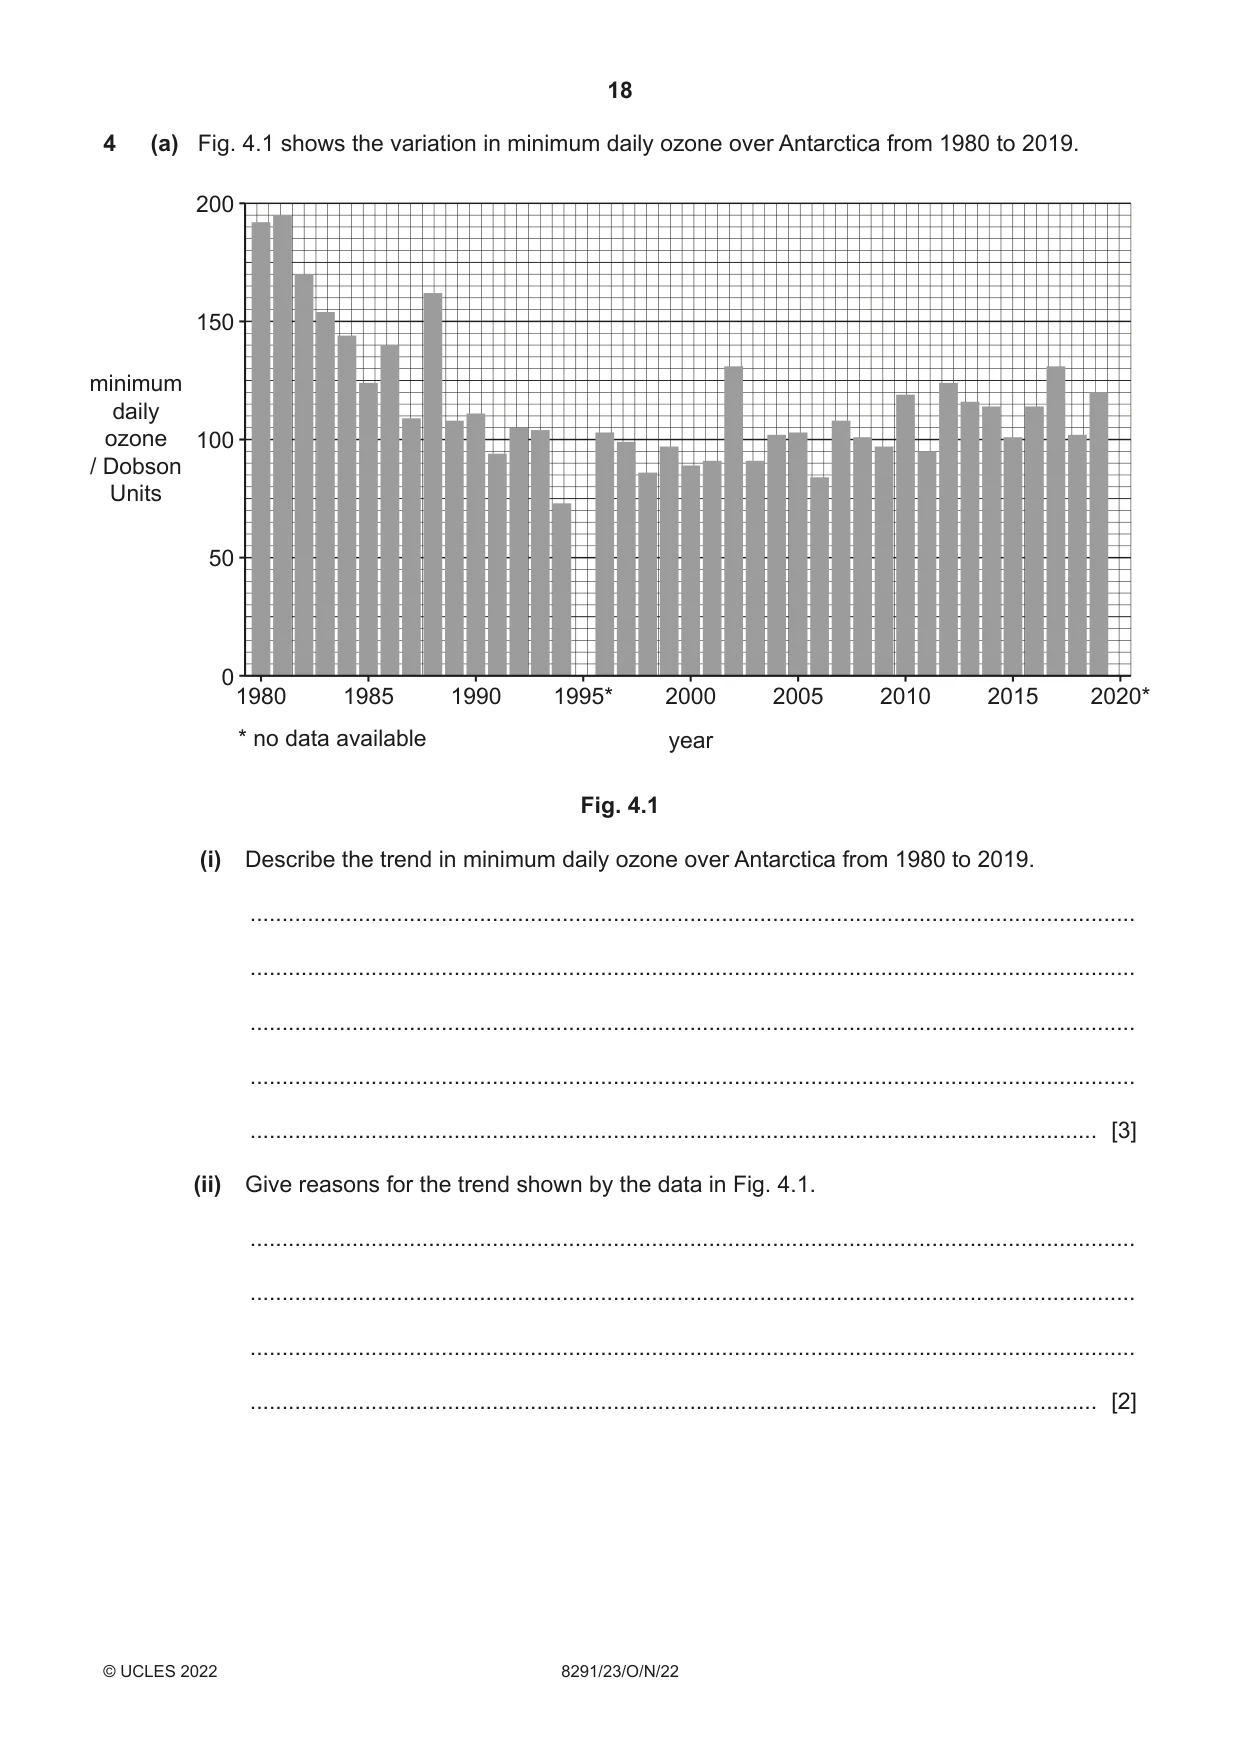
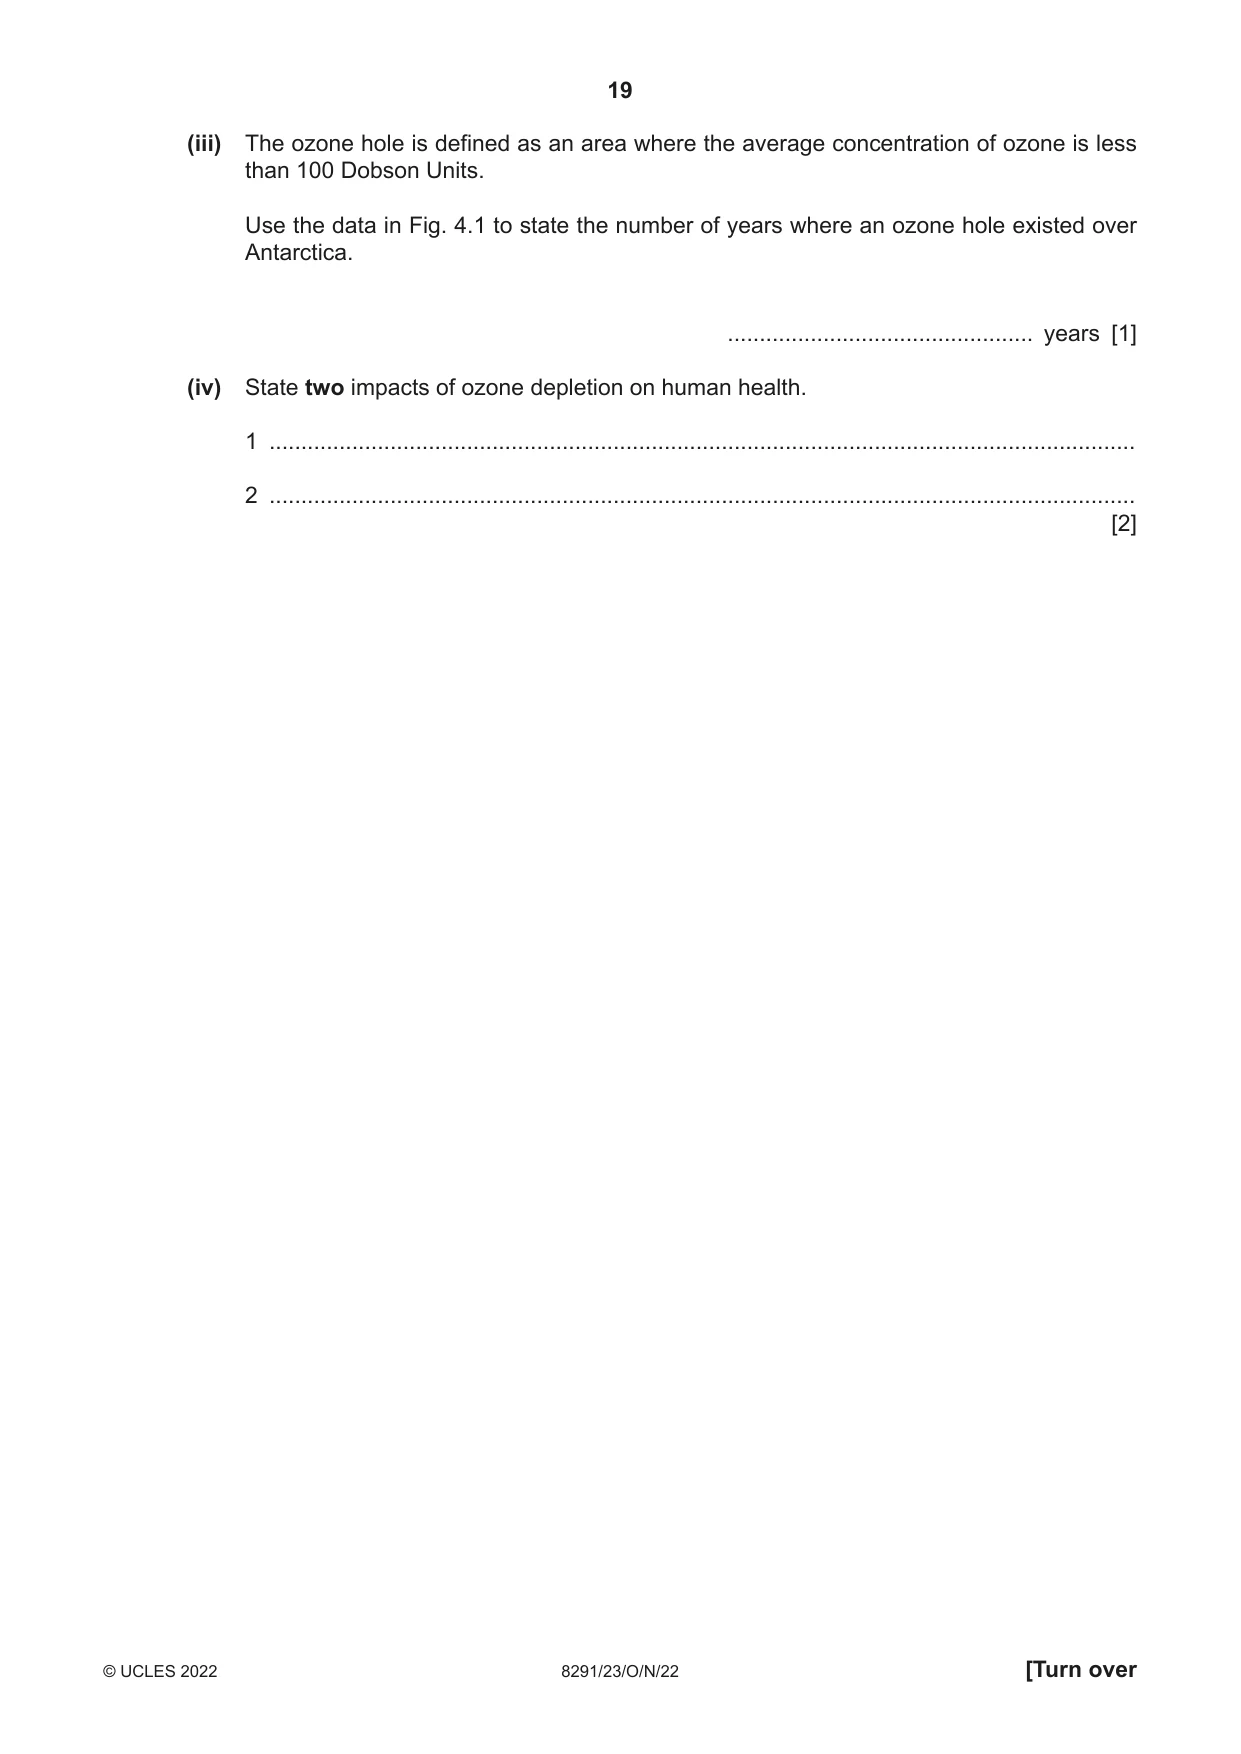
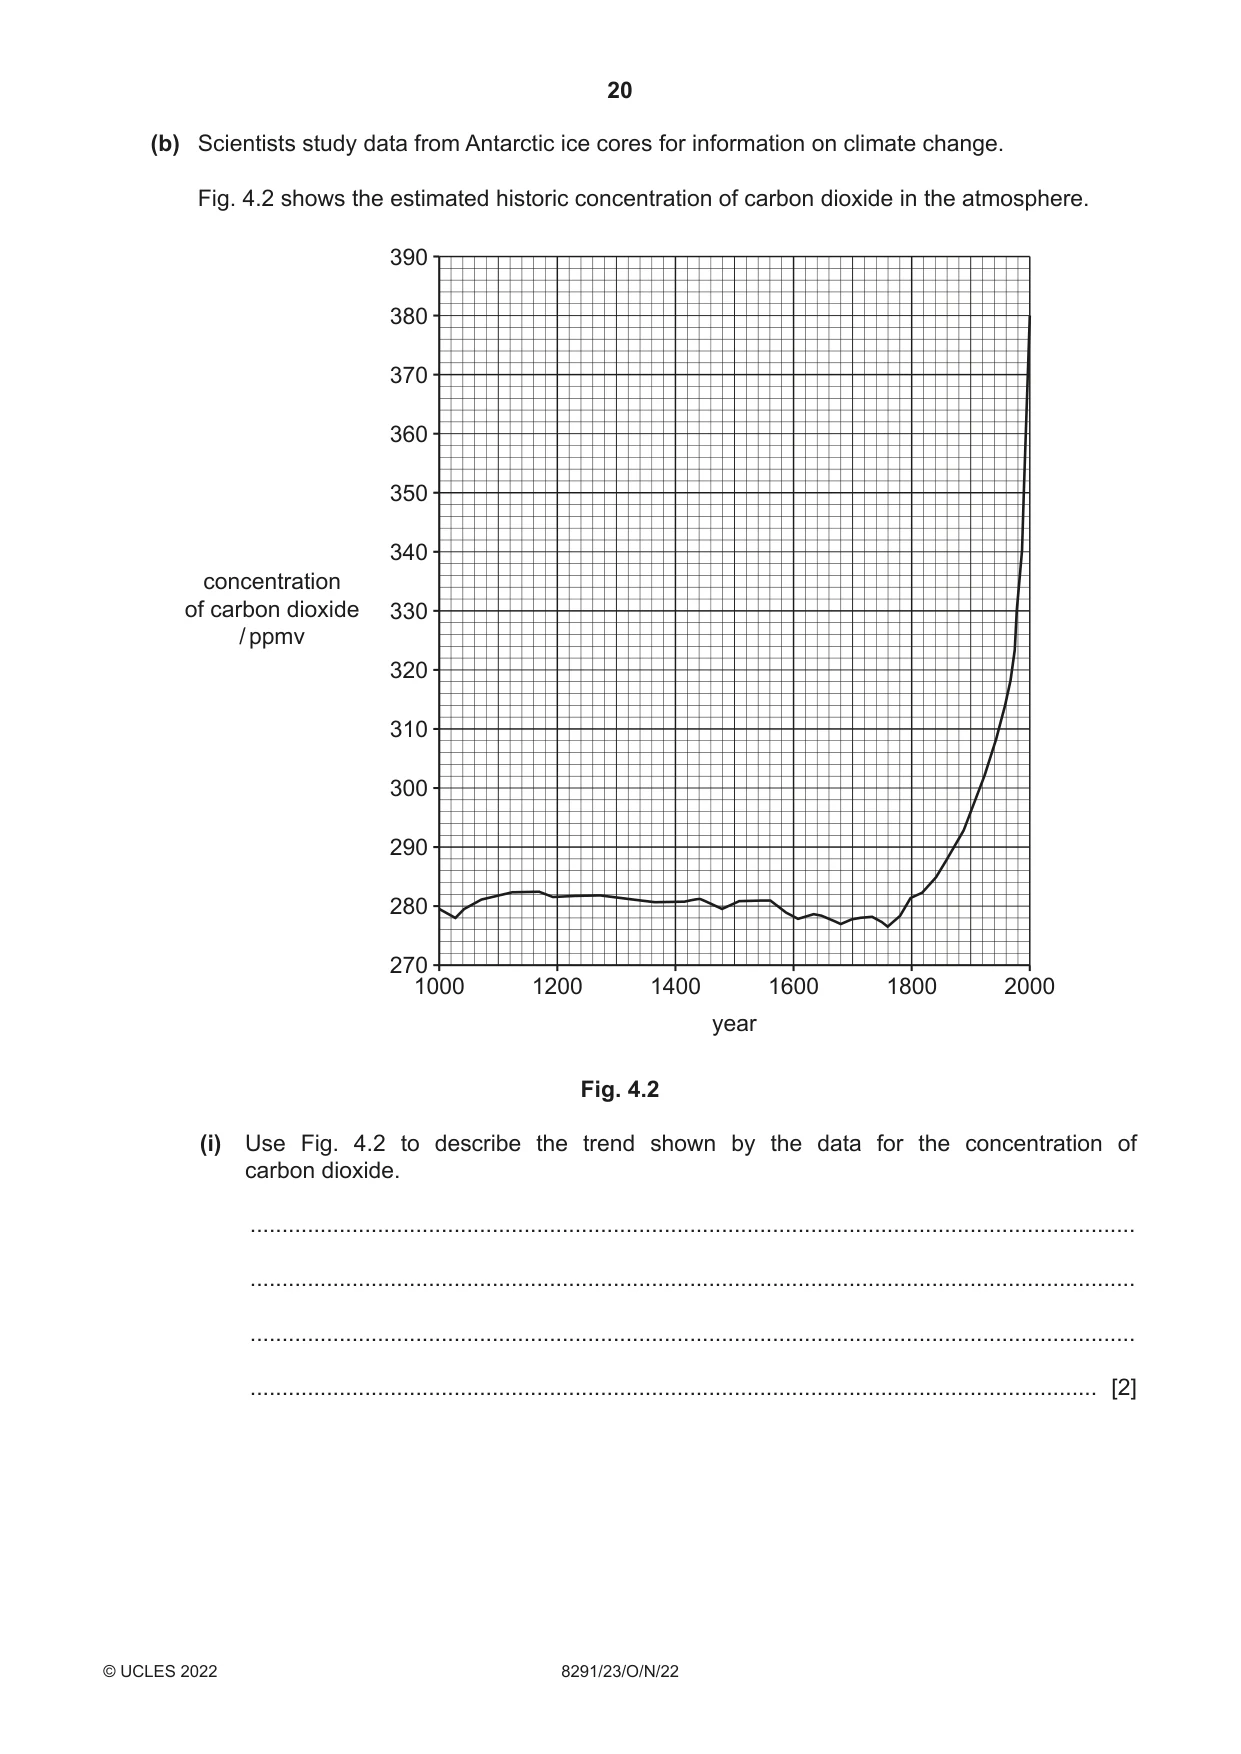
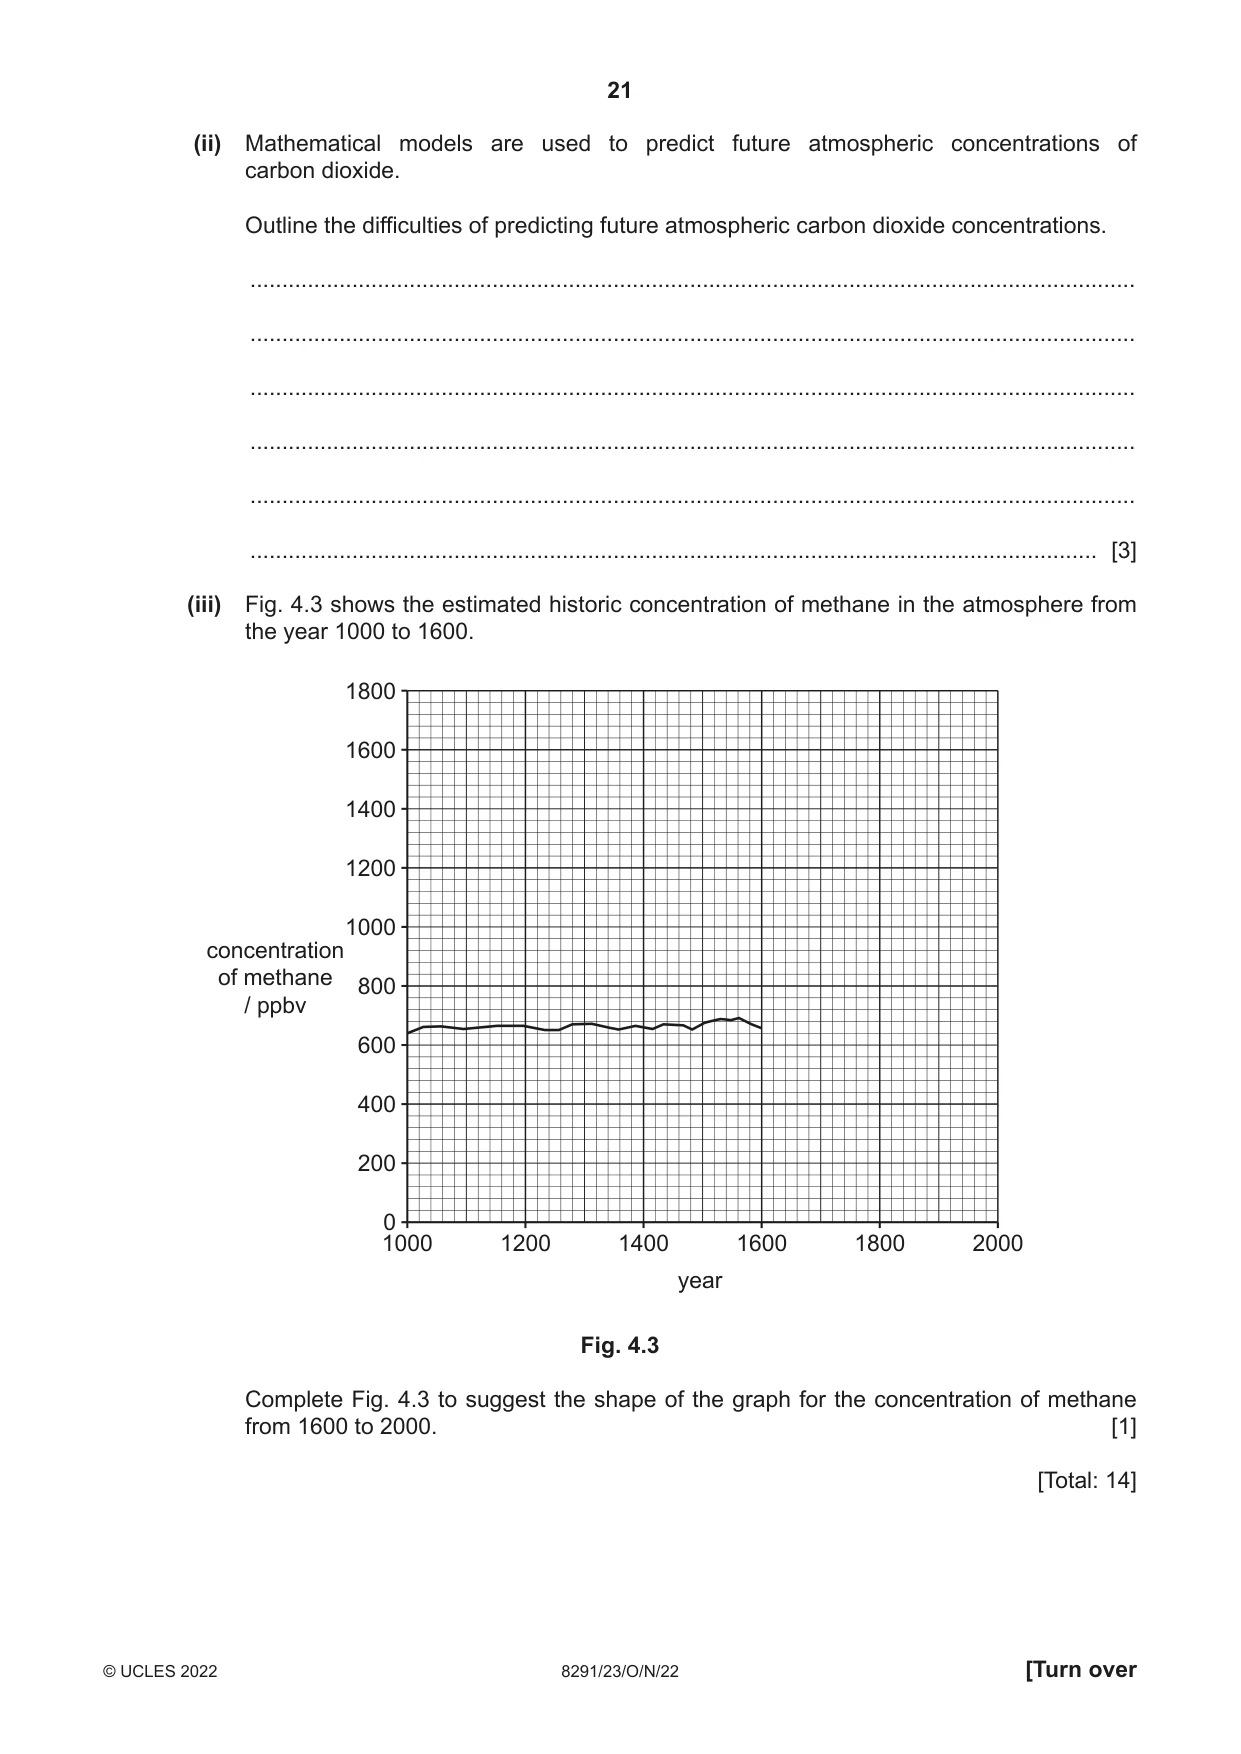
4 (a) Fig. 4.1 shows the variation in minimum daily ozone over Antarctica from 1980 to 2019. 200 150 minimum daily ozone 100 / Dobson Units 50 0 1980 1985 1990 1995* 2000 2005 2010 2015 2020* * no data available year Fig. 4.1 (i) Describe the trend in minimum daily ozone over Antarctica from 1980 to 2019. ........................................................................................................................................... ........................................................................................................................................... ........................................................................................................................................... ........................................................................................................................................... ..................................................................................................................................... [3] (ii) Give reasons for the trend shown by the data in Fig. 4.1. ........................................................................................................................................... ........................................................................................................................................... ........................................................................................................................................... ..................................................................................................................................... [2] (iii) The ozone hole is defined as an area where the average concentration of ozone is less than 100 Dobson Units. Use the data in Fig. 4.1 to state the number of years where an ozone hole existed over Antarctica. ................................................ years [1] (iv) State two impacts of ozone depletion on human health. 1 ........................................................................................................................................ 2 ........................................................................................................................................ [2] (b) Scientists study data from Antarctic ice cores for information on climate change. Fig. 4.2 shows the estimated historic concentration of carbon dioxide in the atmosphere. 390 380 370 360 350 340 concentration of carbon dioxide 330 / ppmv 320 310 300 290 280 270 1000 1200 1400 1600 1800 2000 year Fig. 4.2 (i) Use Fig. 4.2 to describe the trend shown by the data for the concentration of carbon dioxide. ........................................................................................................................................... ........................................................................................................................................... ........................................................................................................................................... ..................................................................................................................................... [2] (ii) Mathematical models are used to predict future atmospheric concentrations of carbon dioxide. Outline the difficulties of predicting future atmospheric carbon dioxide concentrations. ........................................................................................................................................... ........................................................................................................................................... ........................................................................................................................................... ........................................................................................................................................... ........................................................................................................................................... ..................................................................................................................................... [3] (iii) Fig. 4.3 shows the estimated historic concentration of methane in the atmosphere from the year 1000 to 1600. 1800 1600 1400 1200 1000 concentration of methane 800 / ppbv 600 400 200 0 1000 1200 1400 1600 1800 2000 year Fig. 4.3 Complete Fig. 4.3 to suggest the shape of the graph for the concentration of methane from 1600 to 2000. [1] [Total: 14]
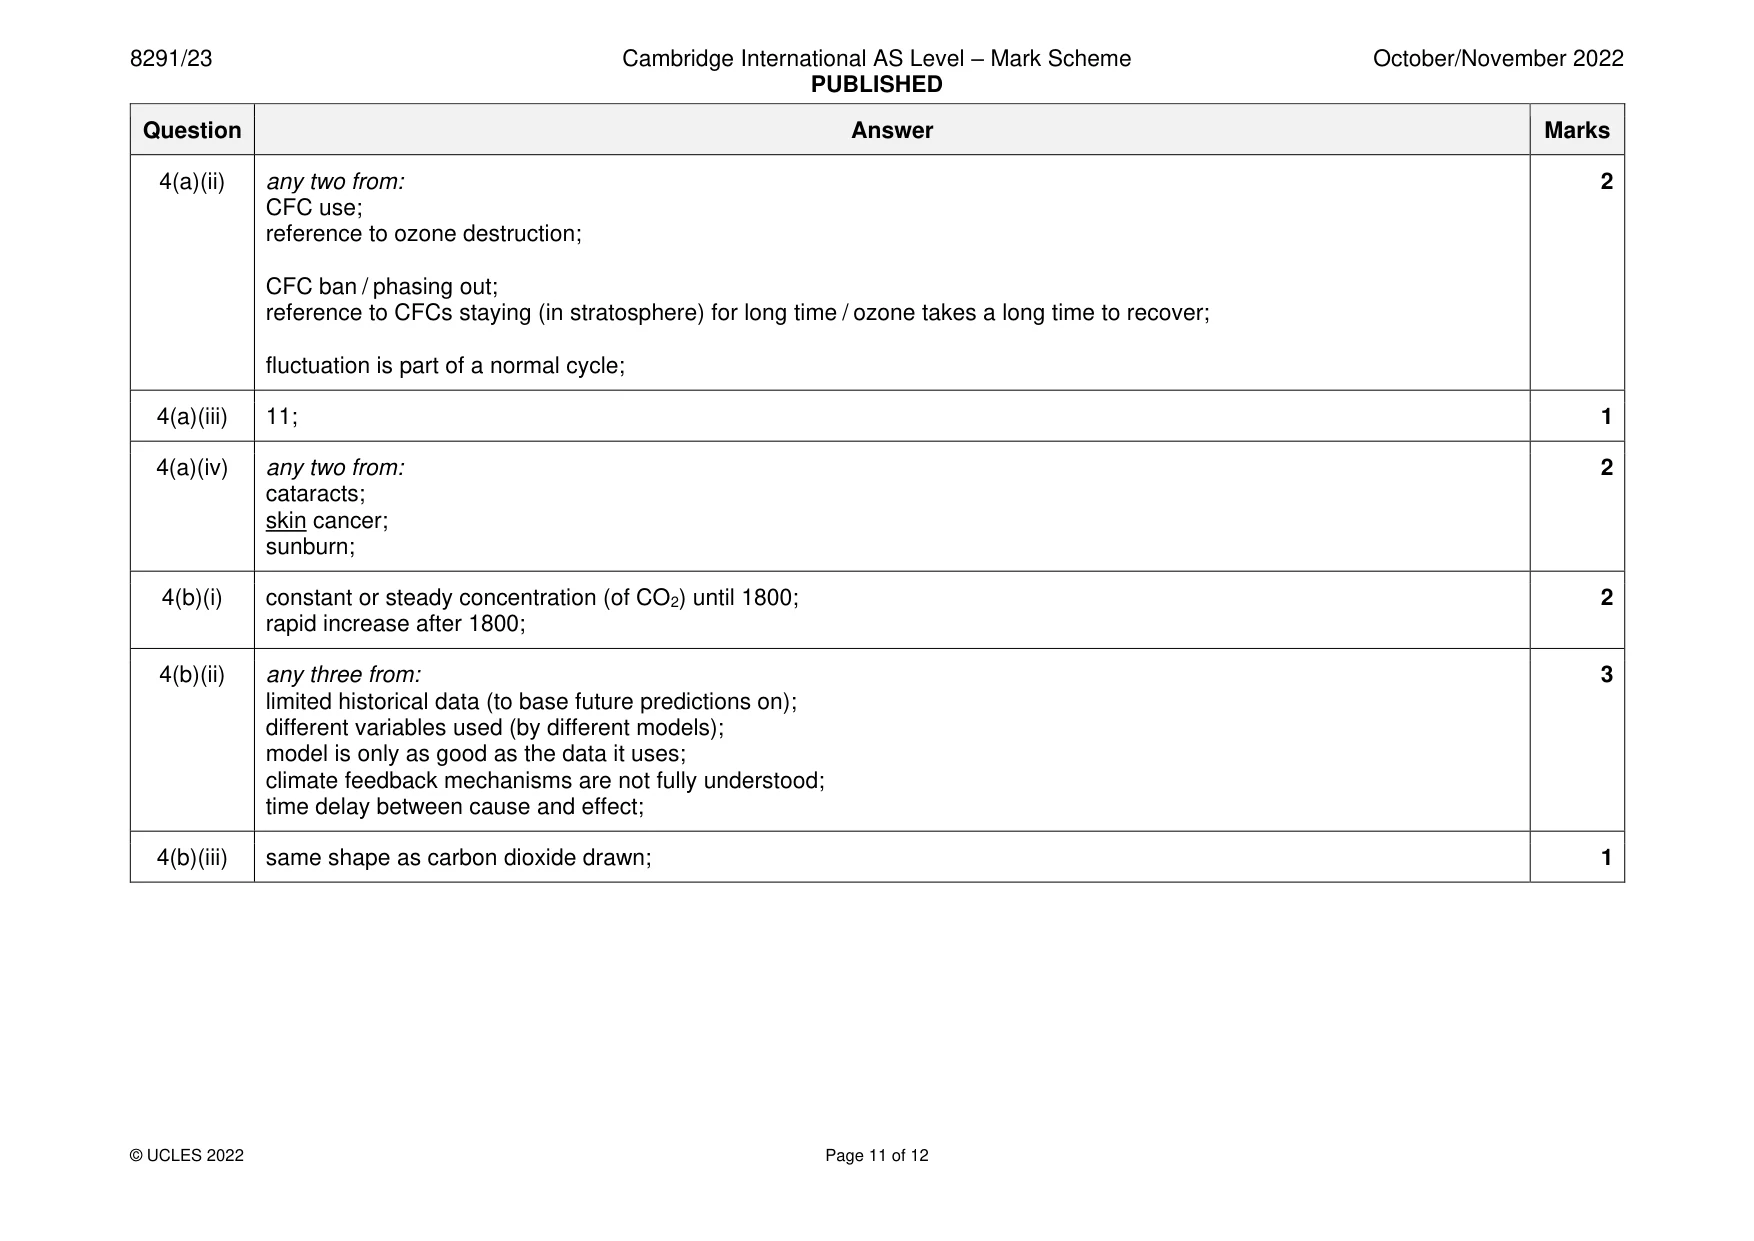
Mark scheme: 4(a)(i) any three from: 3 high(est) 1981; low(est) 1994; (rapid) decreasing from 1981 to 1994; (from mid-1990s) plateaus; (since mid-1990s) gradual increase / fluctuates; unusually high in 2002; 4(a)(ii) any two from: 2 CFC use; reference to ozone destruction; CFC ban / phasing out; reference to CFCs staying (in stratosphere) for long time / ozone takes a long time to recover; fluctuation is part of a normal cycle; 4(a)(iii) 11; 1 4(a)(iv) any two from: 2 cataracts; skin cancer; sunburn; 4(b)(i) constant or steady concentration (of CO2) until 1800; 2 rapid increase after 1800; 4(b)(ii) any three from: 3 limited historical data (to base future predictions on); different variables used (by different models); model is only as good as the data it uses; climate feedback mechanisms are not fully understood; time delay between cause and effect; 4(b)(iii) same shape as carbon dioxide drawn; 1
Q5 · Approximately 623 million people practise open defecation
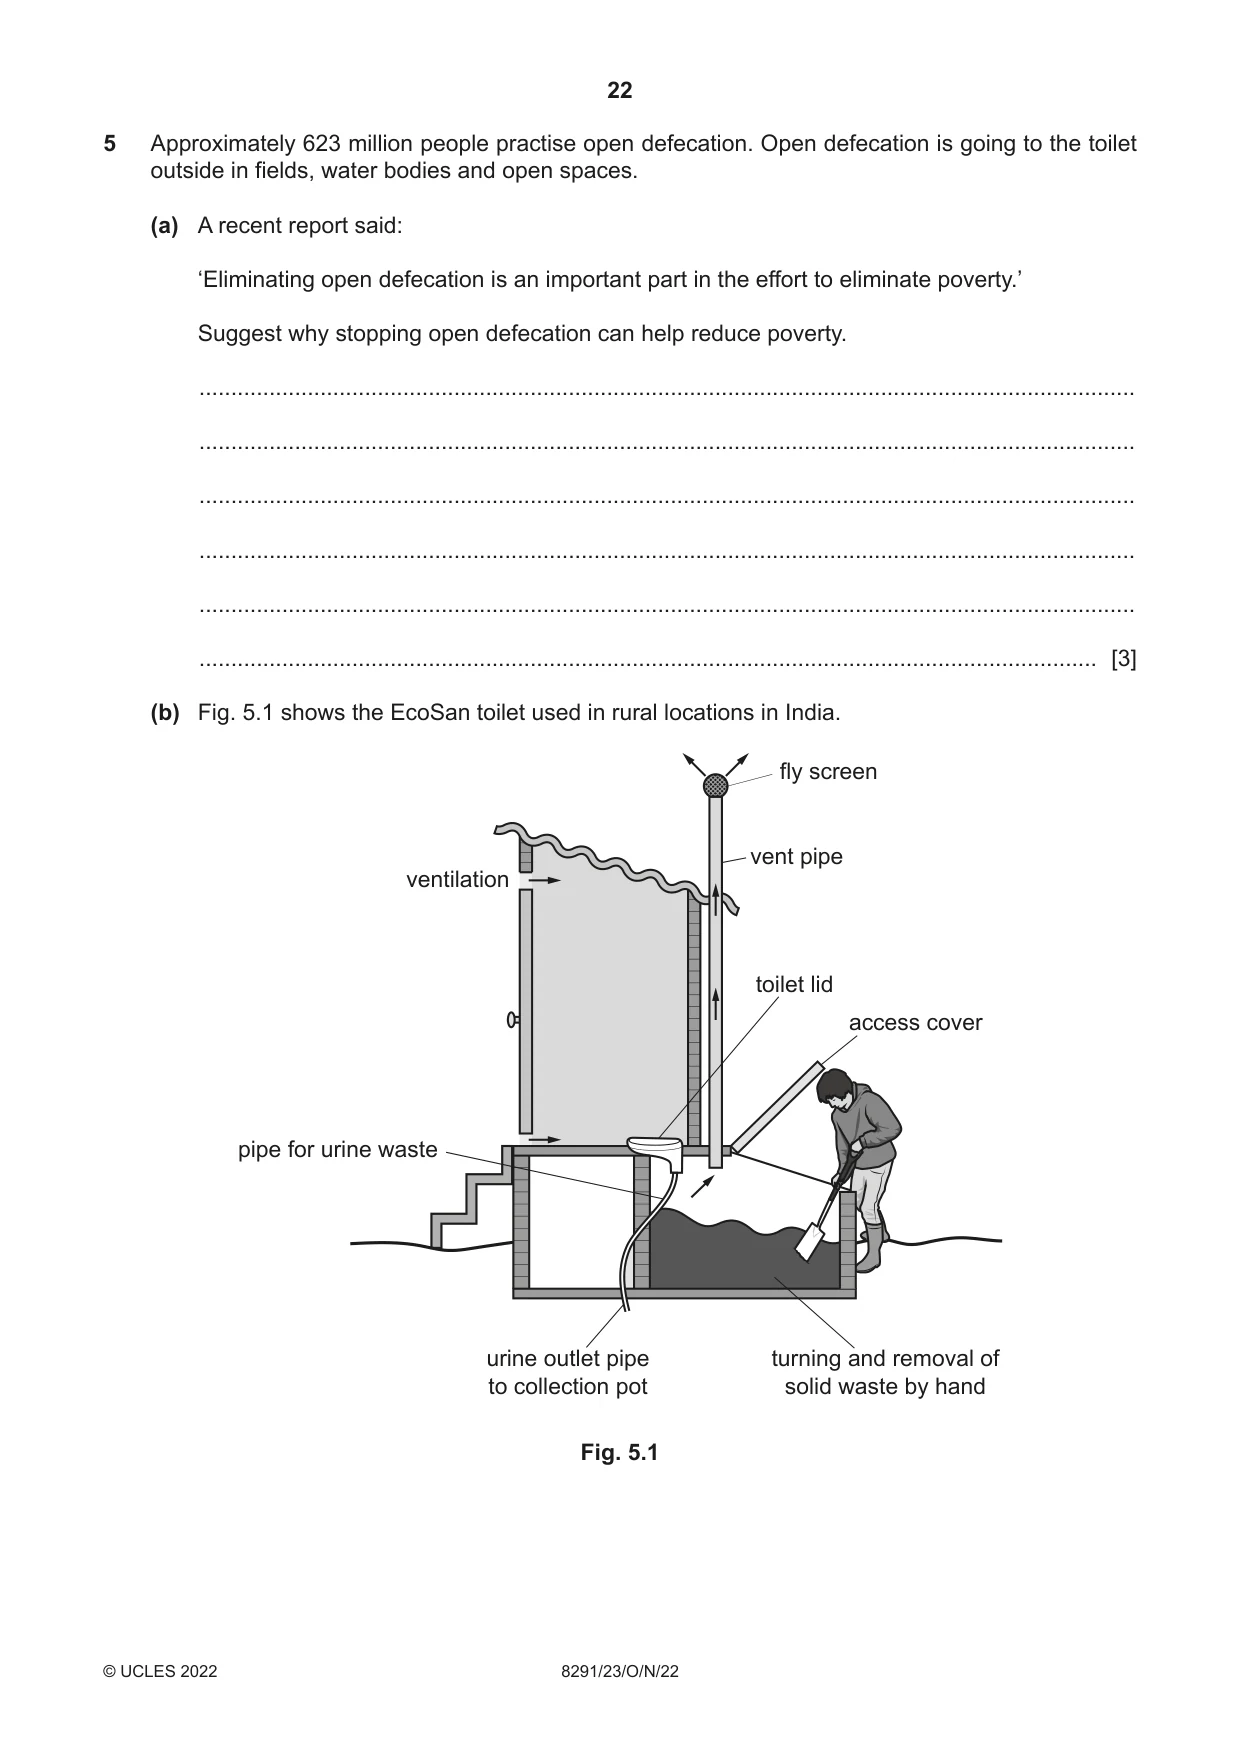
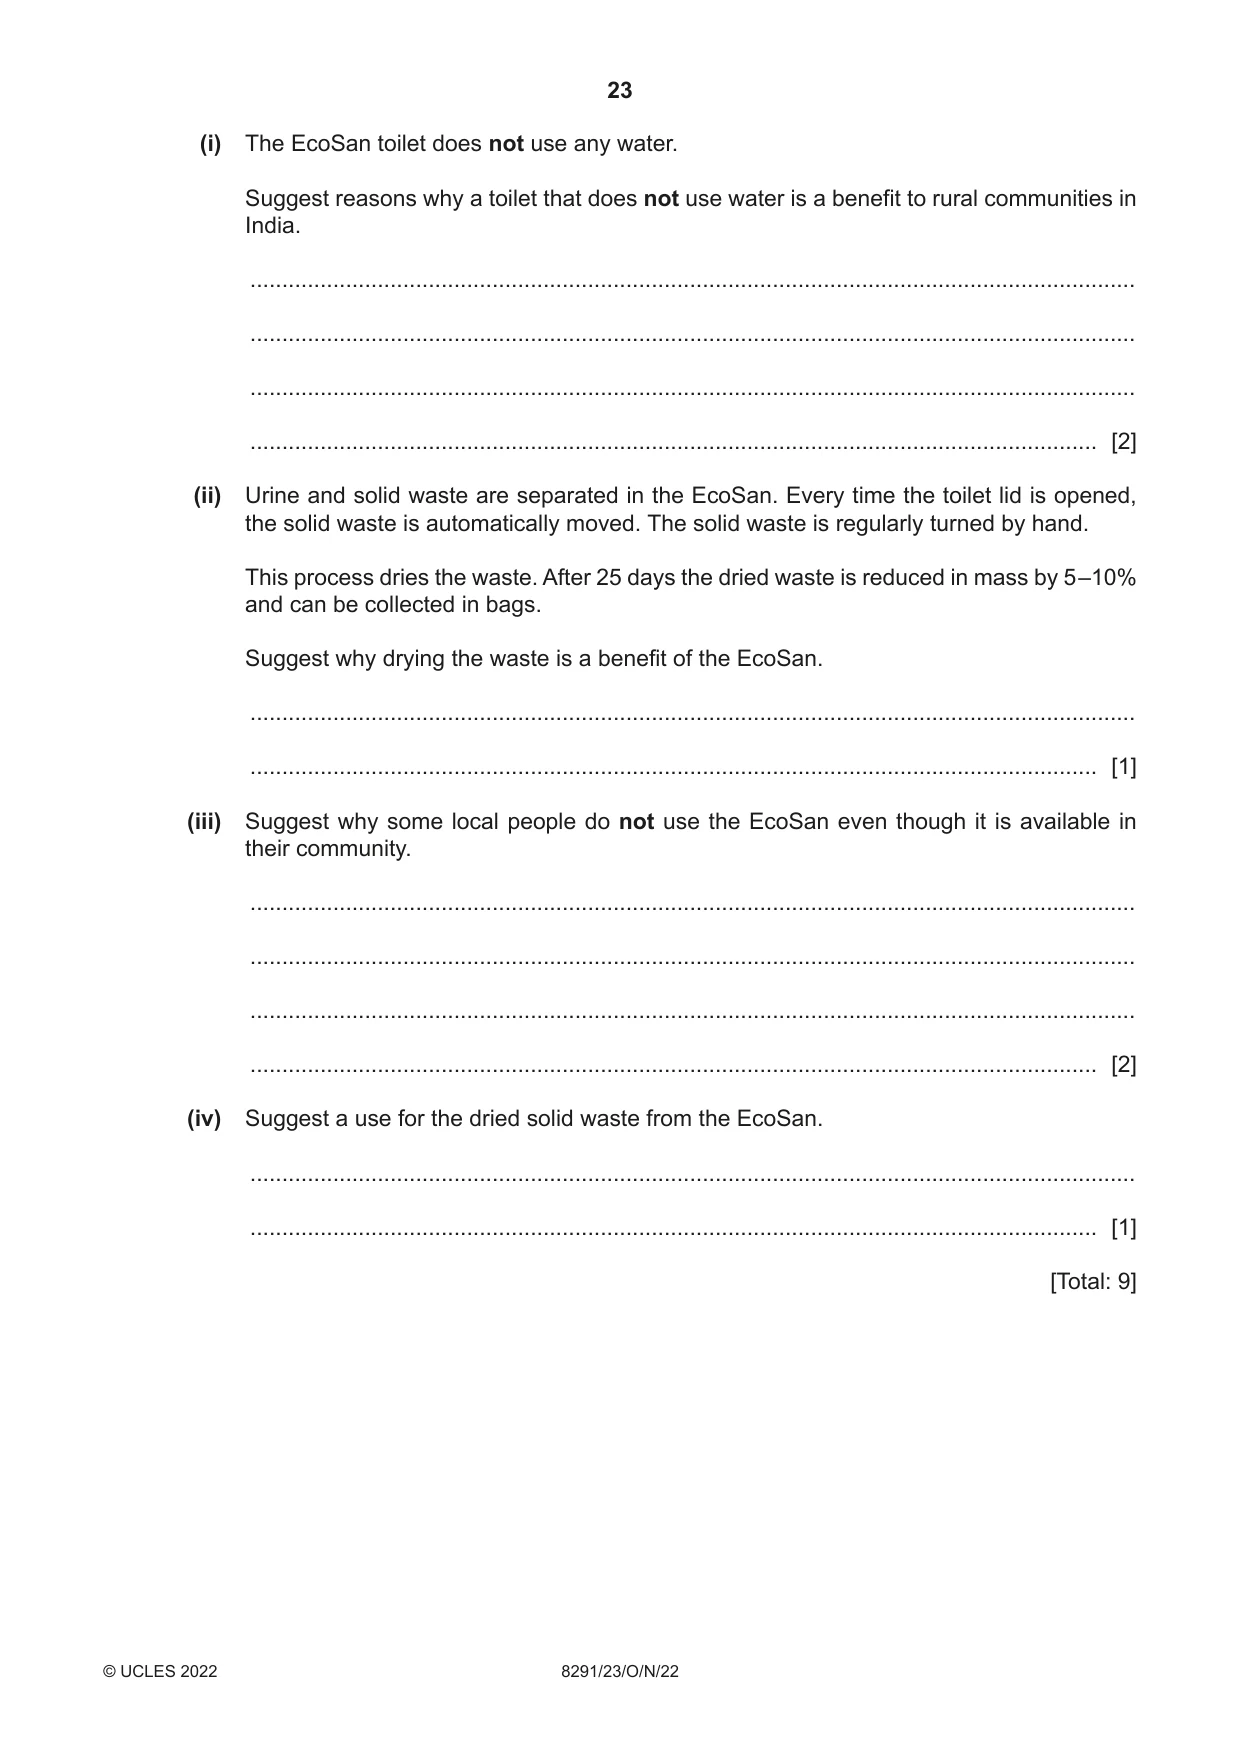
5 Approximately 623 million people practise open defecation. Open defecation is going to the toilet outside in fields, water bodies and open spaces. (a) A recent report said: ‘Eliminating open defecation is an important part in the effort to eliminate poverty.’ Suggest why stopping open defecation can help reduce poverty. ................................................................................................................................................... ................................................................................................................................................... ................................................................................................................................................... ................................................................................................................................................... ................................................................................................................................................... ............................................................................................................................................. [3] (b) Fig. 5.1 shows the EcoSan toilet used in rural locations in India. fly screen vent pipe ventilation toilet lid access cover pipe for urine waste urine outlet pipe turning and removal of to collection pot solid waste by hand Fig. 5.1 (i) The EcoSan toilet does not use any water. Suggest reasons why a toilet that does not use water is a benefit to rural communities in India. ........................................................................................................................................... ........................................................................................................................................... ........................................................................................................................................... ..................................................................................................................................... [2] (ii) Urine and solid waste are separated in the EcoSan. Every time the toilet lid is opened, the solid waste is automatically moved. The solid waste is regularly turned by hand. This process dries the waste. After 25 days the dried waste is reduced in mass by 5 –10% and can be collected in bags. Suggest why drying the waste is a benefit of the EcoSan. ........................................................................................................................................... ..................................................................................................................................... [1] (iii) Suggest why some local people do not use the EcoSan even though it is available in their community. ........................................................................................................................................... ........................................................................................................................................... ........................................................................................................................................... ..................................................................................................................................... [2] (iv) Suggest a use for the dried solid waste from the EcoSan. ........................................................................................................................................... ..................................................................................................................................... [1] [Total: 9]
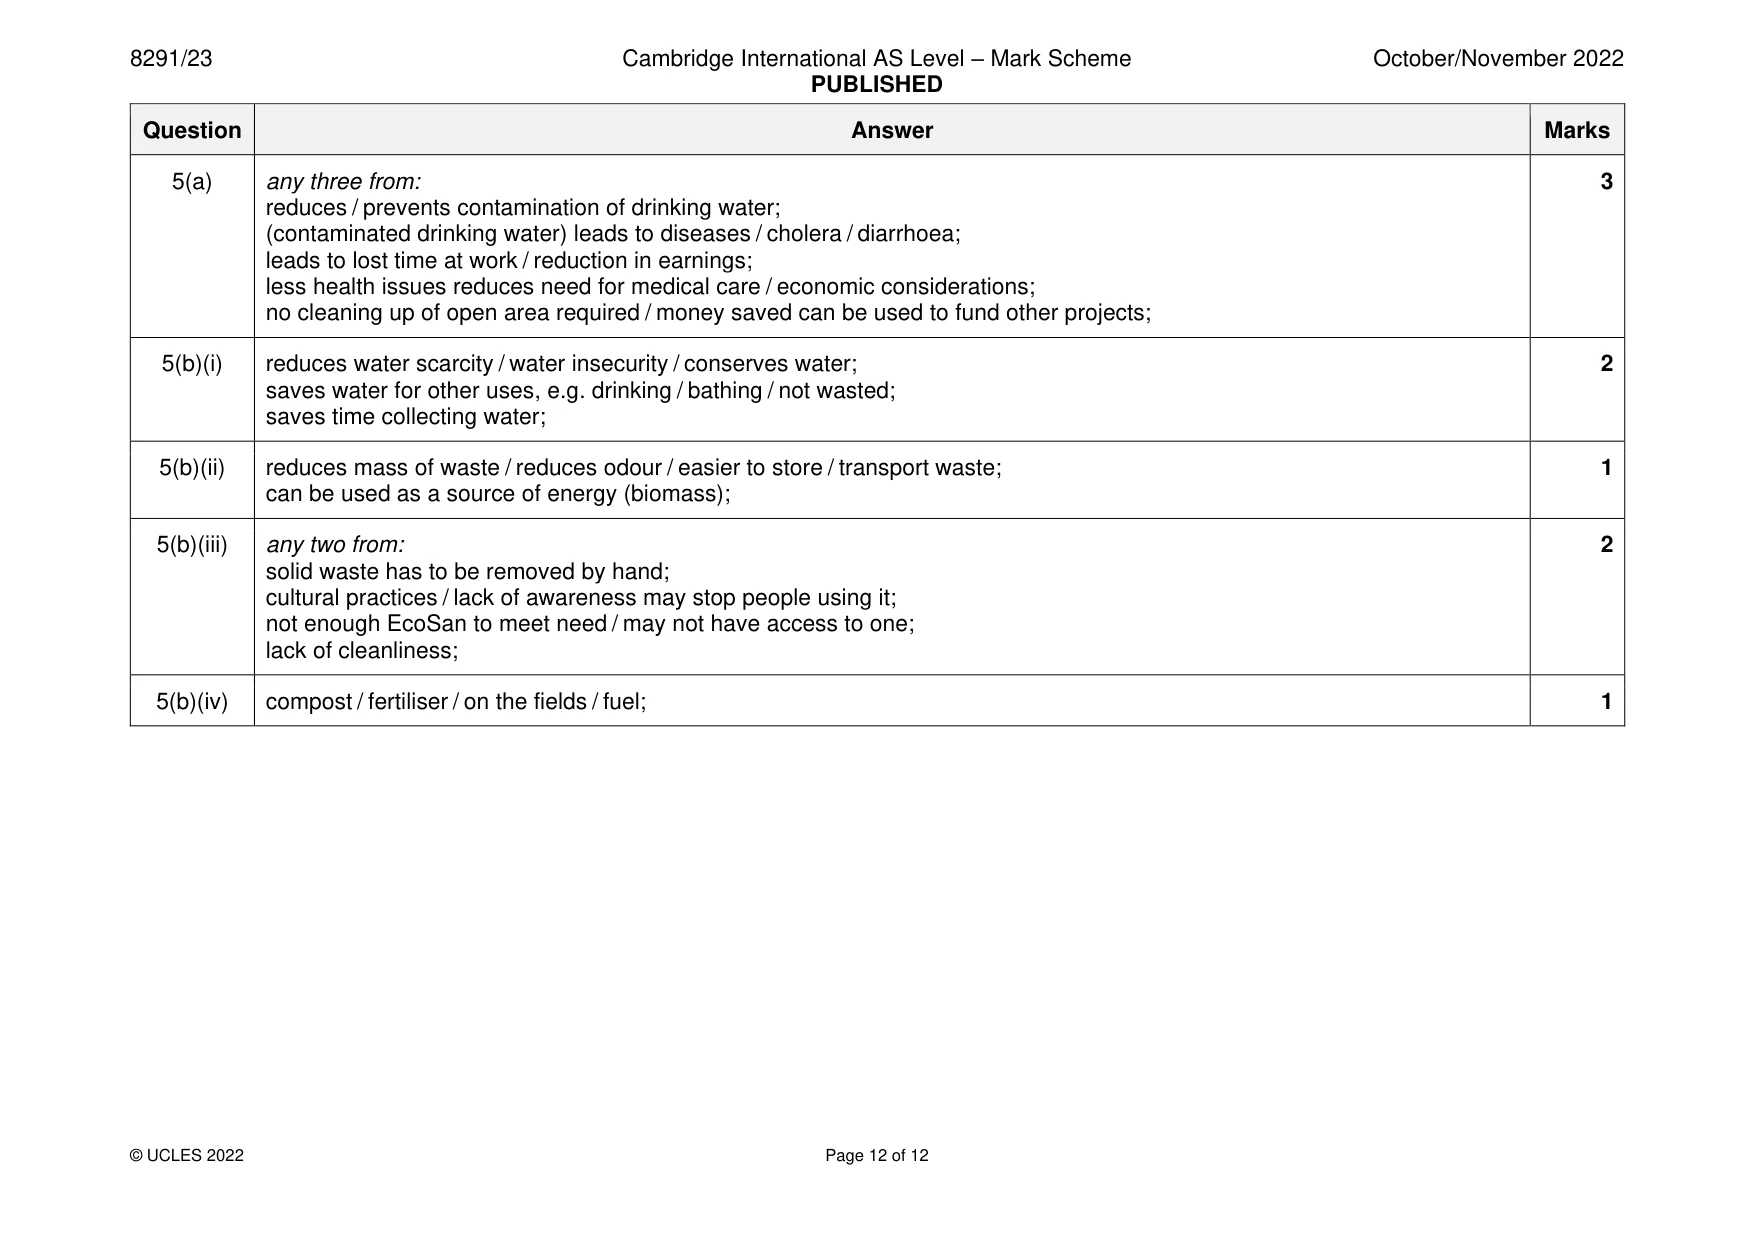
Mark scheme: 5(a) any three from: 3 reduces / prevents contamination of drinking water; (contaminated drinking water) leads to diseases / cholera / diarrhoea; leads to lost time at work / reduction in earnings; less health issues reduces need for medical care / economic considerations; no cleaning up of open area required / money saved can be used to fund other projects; 5(b)(i) reduces water scarcity / water insecurity / conserves water; 2 saves water for other uses, e.g. drinking / bathing / not wasted; saves time collecting water; 5(b)(ii) reduces mass of waste / reduces odour / easier to store / transport waste; 1 can be used as a source of energy (biomass); 5(b)(iii) any two from: 2 solid waste has to be removed by hand; cultural practices / lack of awareness may stop people using it; not enough EcoSan to meet need / may not have access to one; lack of cleanliness; 5(b)(iv) compost / fertiliser / on the fields / fuel; 1
What was in this paper
The subtopics covered by these 5 questions, and how many questions each got. Open one in a new tab to see every Cambridge question on it.
What you needed in this session
Cambridge’s own grade thresholds for 2022 Oct/Nov, Paper 2 · Variant 3. A higher threshold means an easier paper — the bar moves with how the cohort did.