Cambridge A Level Environmental Management (AS only) 8291 — 2023 Oct/Nov Paper 2 · Variant 3
8291/23/O/N/23 · 5 questions · 80 marks · ≈90 min
The question paper and its mark scheme, free to read here and free to download. This is Cambridge’s own paper, exactly as it was sat.
Question paper20 pages
Mark scheme12 pages
Answers below. Sit the paper first if you are practising.
Questions as text
Q1 · The World Bank classifies countries into income groups
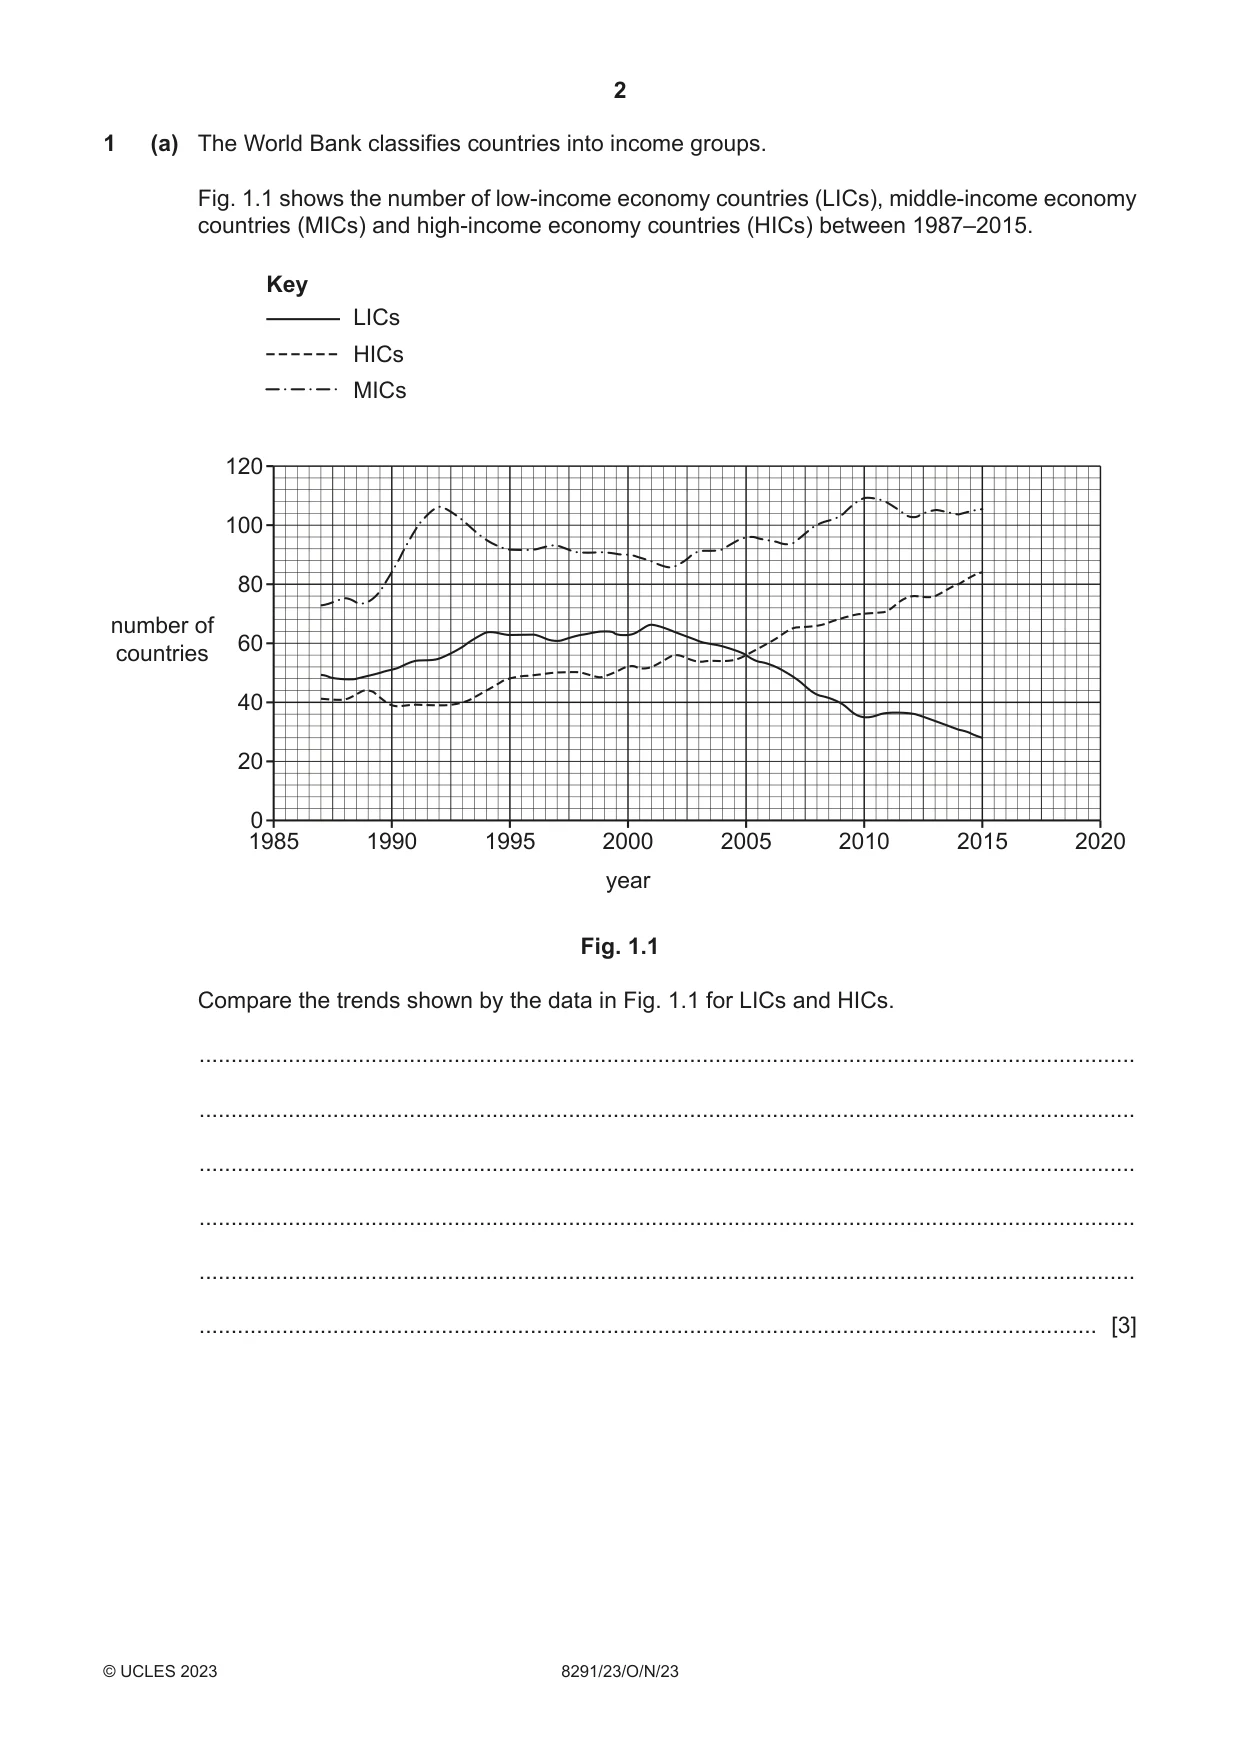
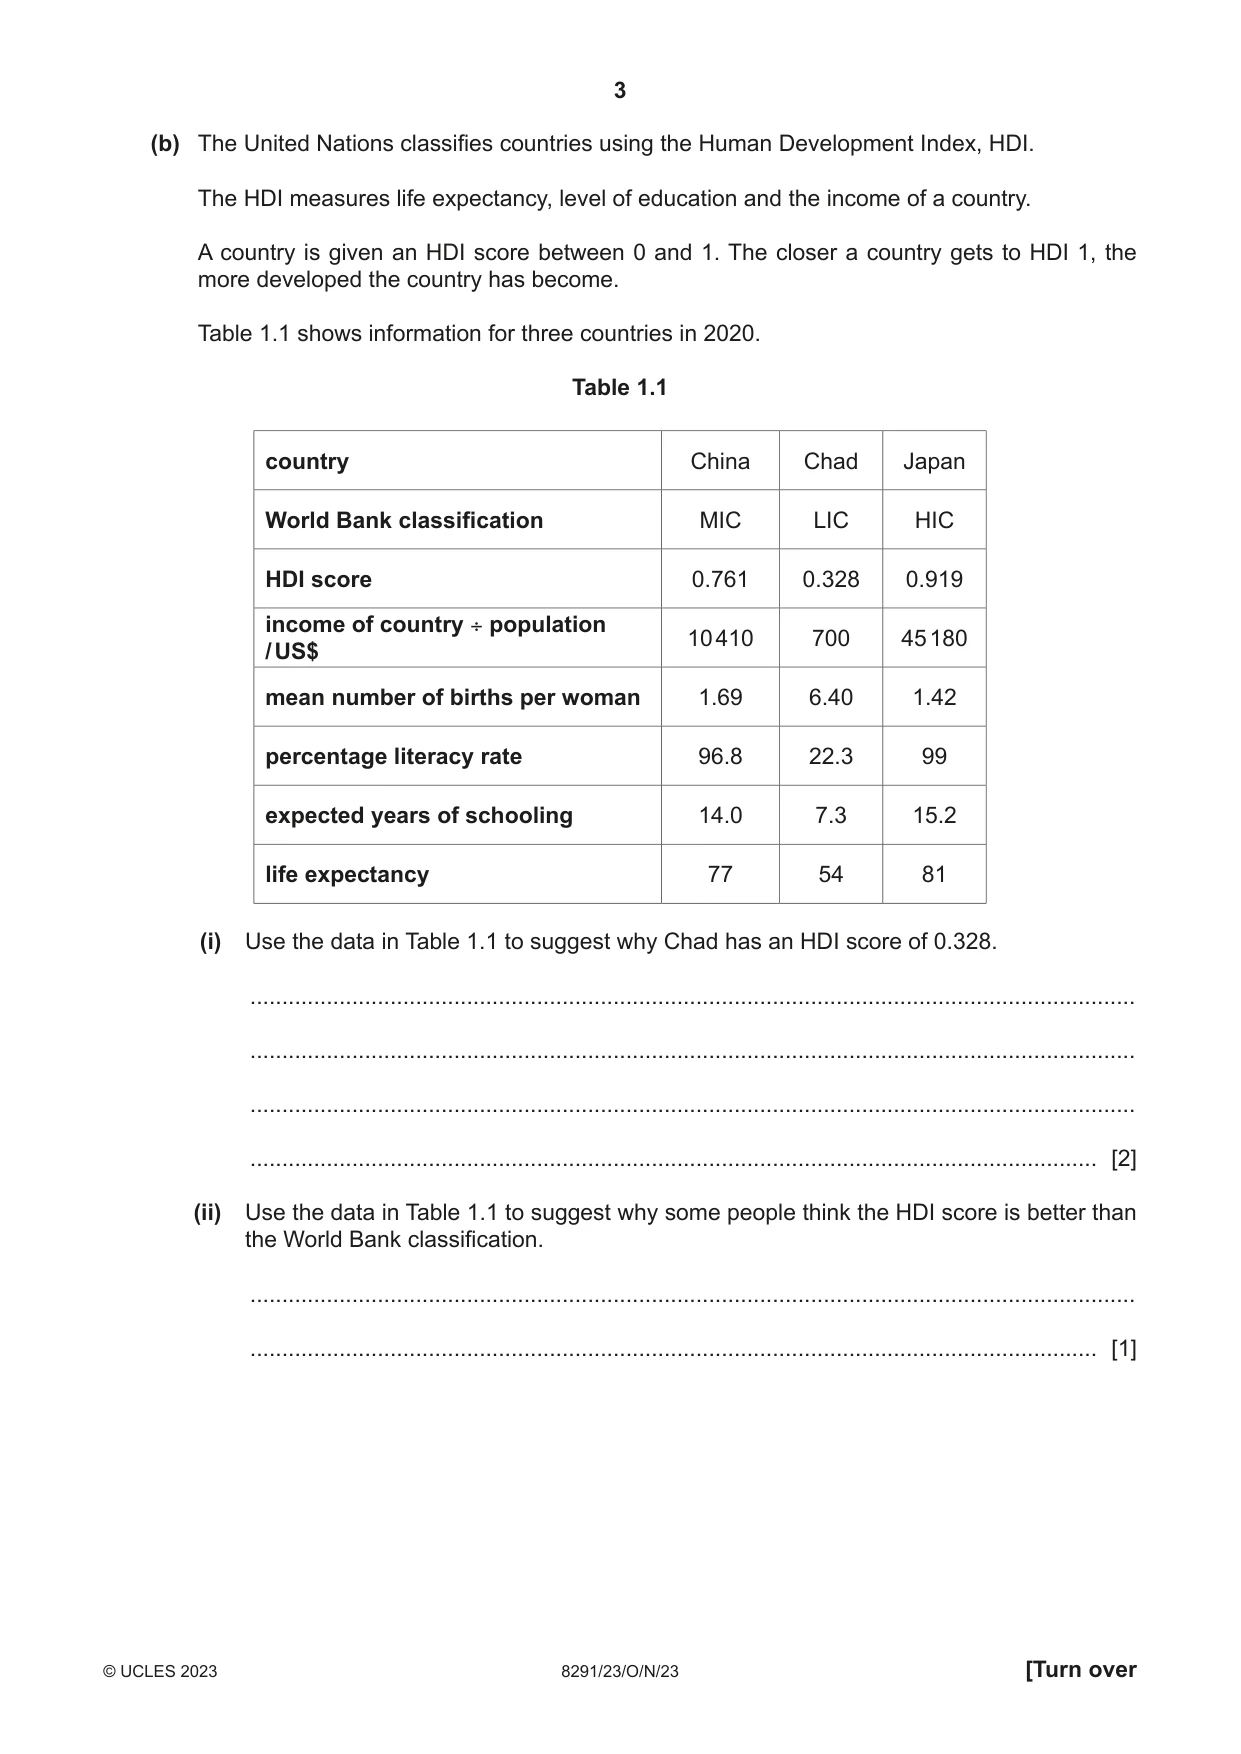
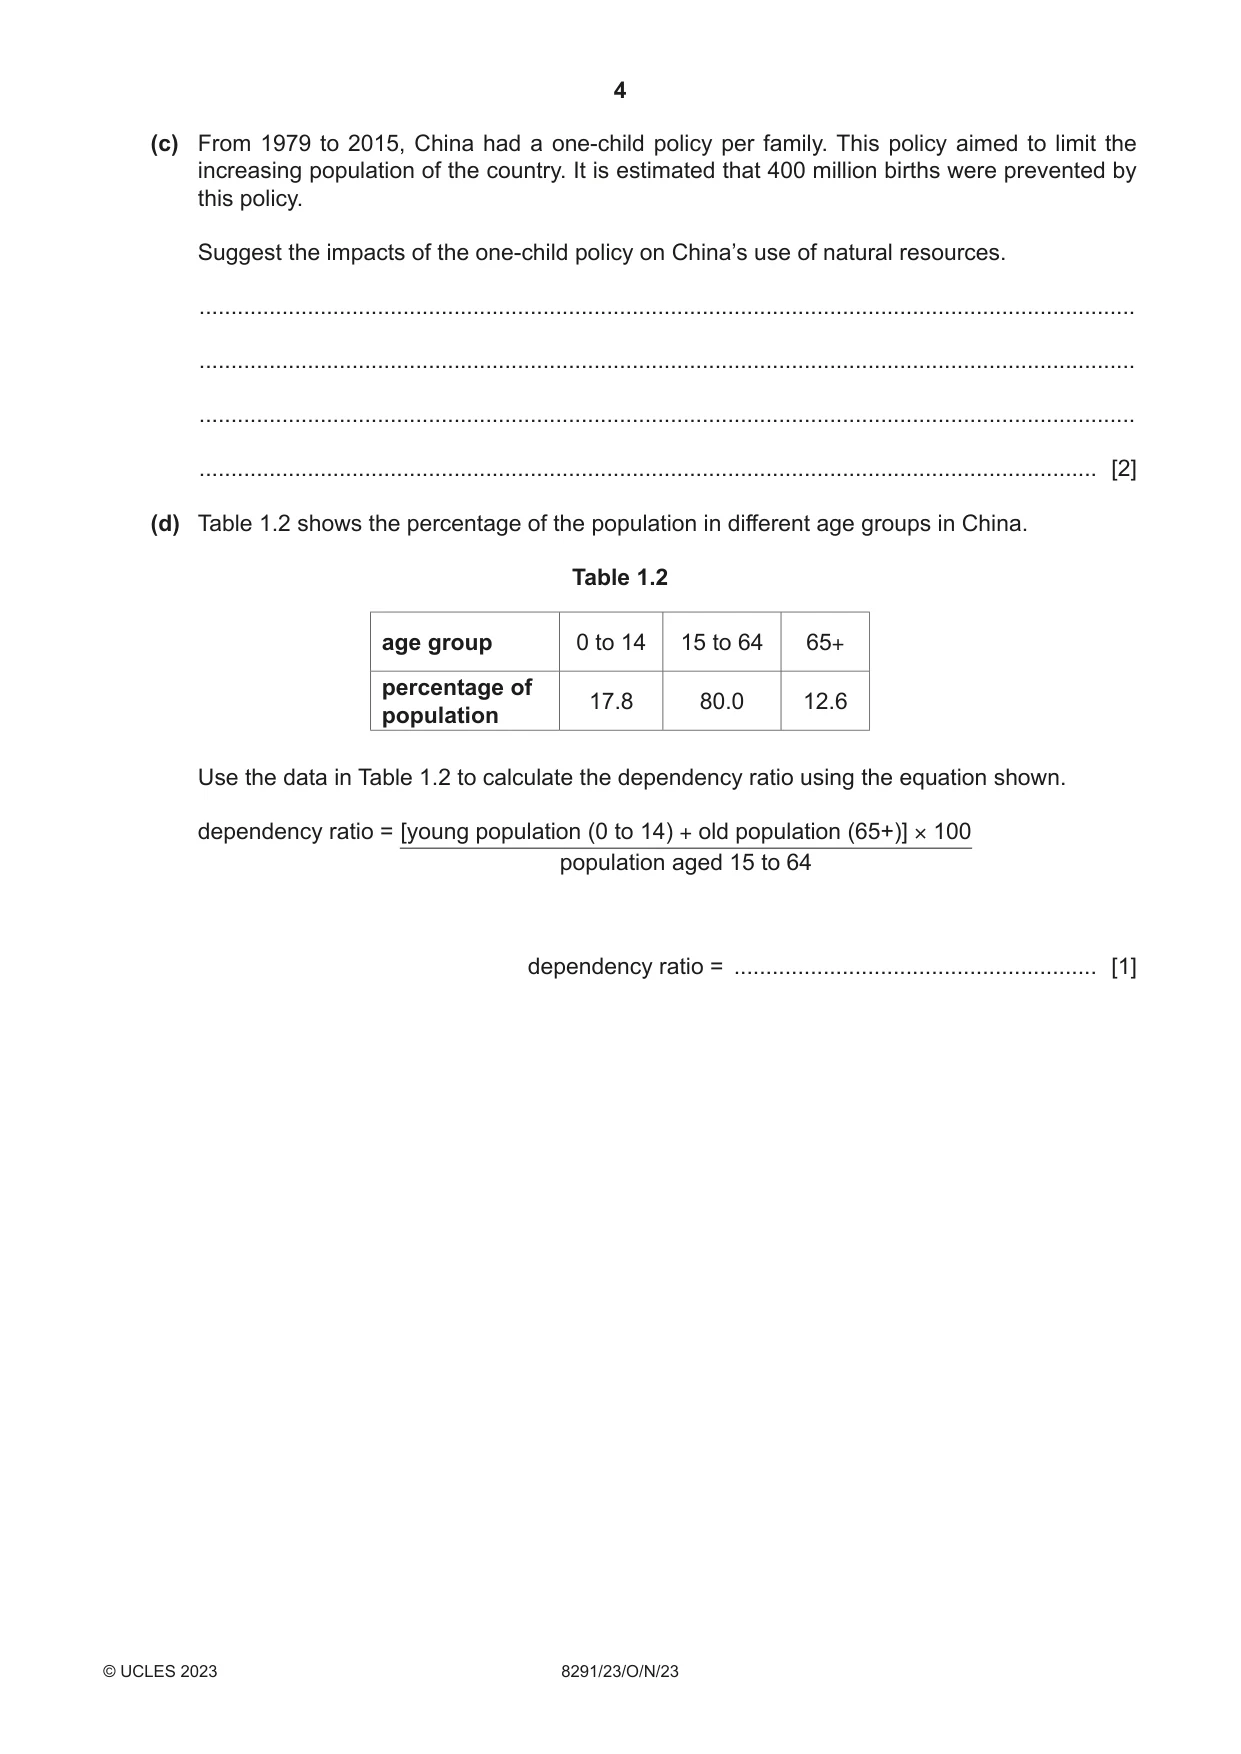
1 (a) The World Bank classifies countries into income groups. Fig. 1.1 shows the number of low-income economy countries (LICs), middle-income economy countries (MICs) and high-income economy countries (HICs) between 1987–2015. Key LICs HICs MICs 120 100 80 number of 60 countries 40 20 0 1985 1990 1995 2000 2005 2010 2015 2020 year Fig. 1.1 Compare the trends shown by the data in Fig. 1.1 for LICs and HICs. ................................................................................................................................................... ................................................................................................................................................... ................................................................................................................................................... ................................................................................................................................................... ................................................................................................................................................... ............................................................................................................................................. [3] (b) The United Nations classifies countries using the Human Development Index, HDI. The HDI measures life expectancy, level of education and the income of a country. A country is given an HDI score between 0 and 1. The closer a country gets to HDI 1, the more developed the country has become. Table 1.1 shows information for three countries in 2020. Table 1.1 country China Chad Japan World Bank classification MIC LIC HIC HDI score 0.761 0.328 0.919 income of country ÷ population 10 410 700 45 180 / US$ mean number of births per woman 1.69 6.40 1.42 percentage literacy rate 96.8 22.3 99 expected years of schooling 14.0 7.3 15.2 life expectancy 77 54 81 (i) Use the data in Table 1.1 to suggest why Chad has an HDI score of 0.328. ........................................................................................................................................... ........................................................................................................................................... ........................................................................................................................................... ..................................................................................................................................... [2] (ii) Use the data in Table 1.1 to suggest why some people think the HDI score is better than the World Bank classification. ........................................................................................................................................... ..................................................................................................................................... [1] (c) From 1979 to 2015, China had a one-child policy per family. This policy aimed to limit the increasing population of the country. It is estimated that 400 million births were prevented by this policy. Suggest the impacts of the one-child policy on China’s use of natural resources. ................................................................................................................................................... ................................................................................................................................................... ................................................................................................................................................... ............................................................................................................................................. [2] (d) Table 1.2 shows the percentage of the population in different age groups in China. Table 1.2 age group 0 to 14 15 to 64 65+ percentage of 17.8 80.0 12.6 population Use the data in Table 1.2 to calculate the dependency ratio using the equation shown. dependency ratio = [young population (0 to 14) + old population (65+)] × 100 population aged 15 to 64 dependency ratio = ......................................................... [1] (e) During the one-child policy, the mean number of births per woman in China decreased from 2.75 in 1979 to 1.62 in 2016. The working age population also decreased. The United Nations estimates that 37% of China’s population will be over 60 years of age by 2050. Suggest the impact the one-child policy will have on China’s economy by 2050. Give reasons for your answer. ................................................................................................................................................... ................................................................................................................................................... ................................................................................................................................................... ................................................................................................................................................... ................................................................................................................................................... ................................................................................................................................................... ................................................................................................................................................... ............................................................................................................................................. [4] [Total: 13]
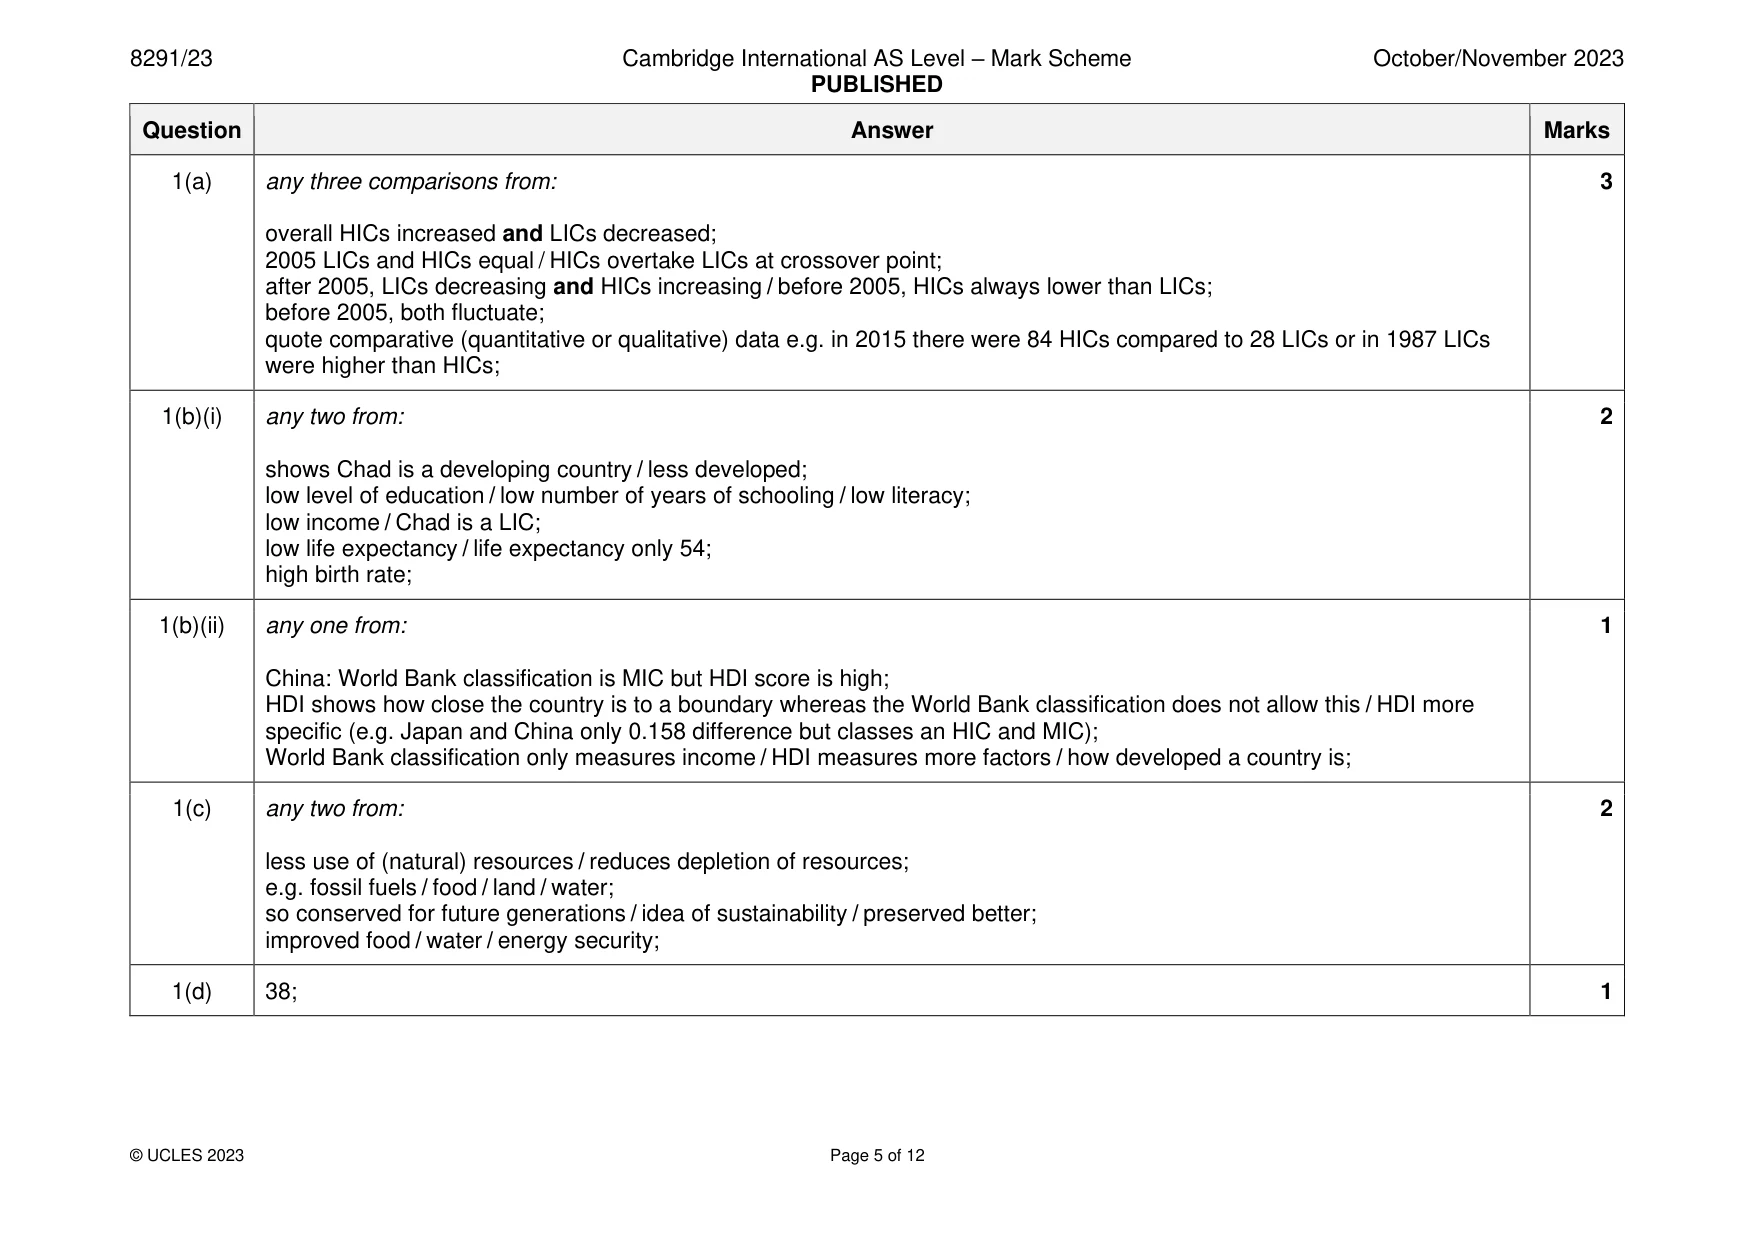
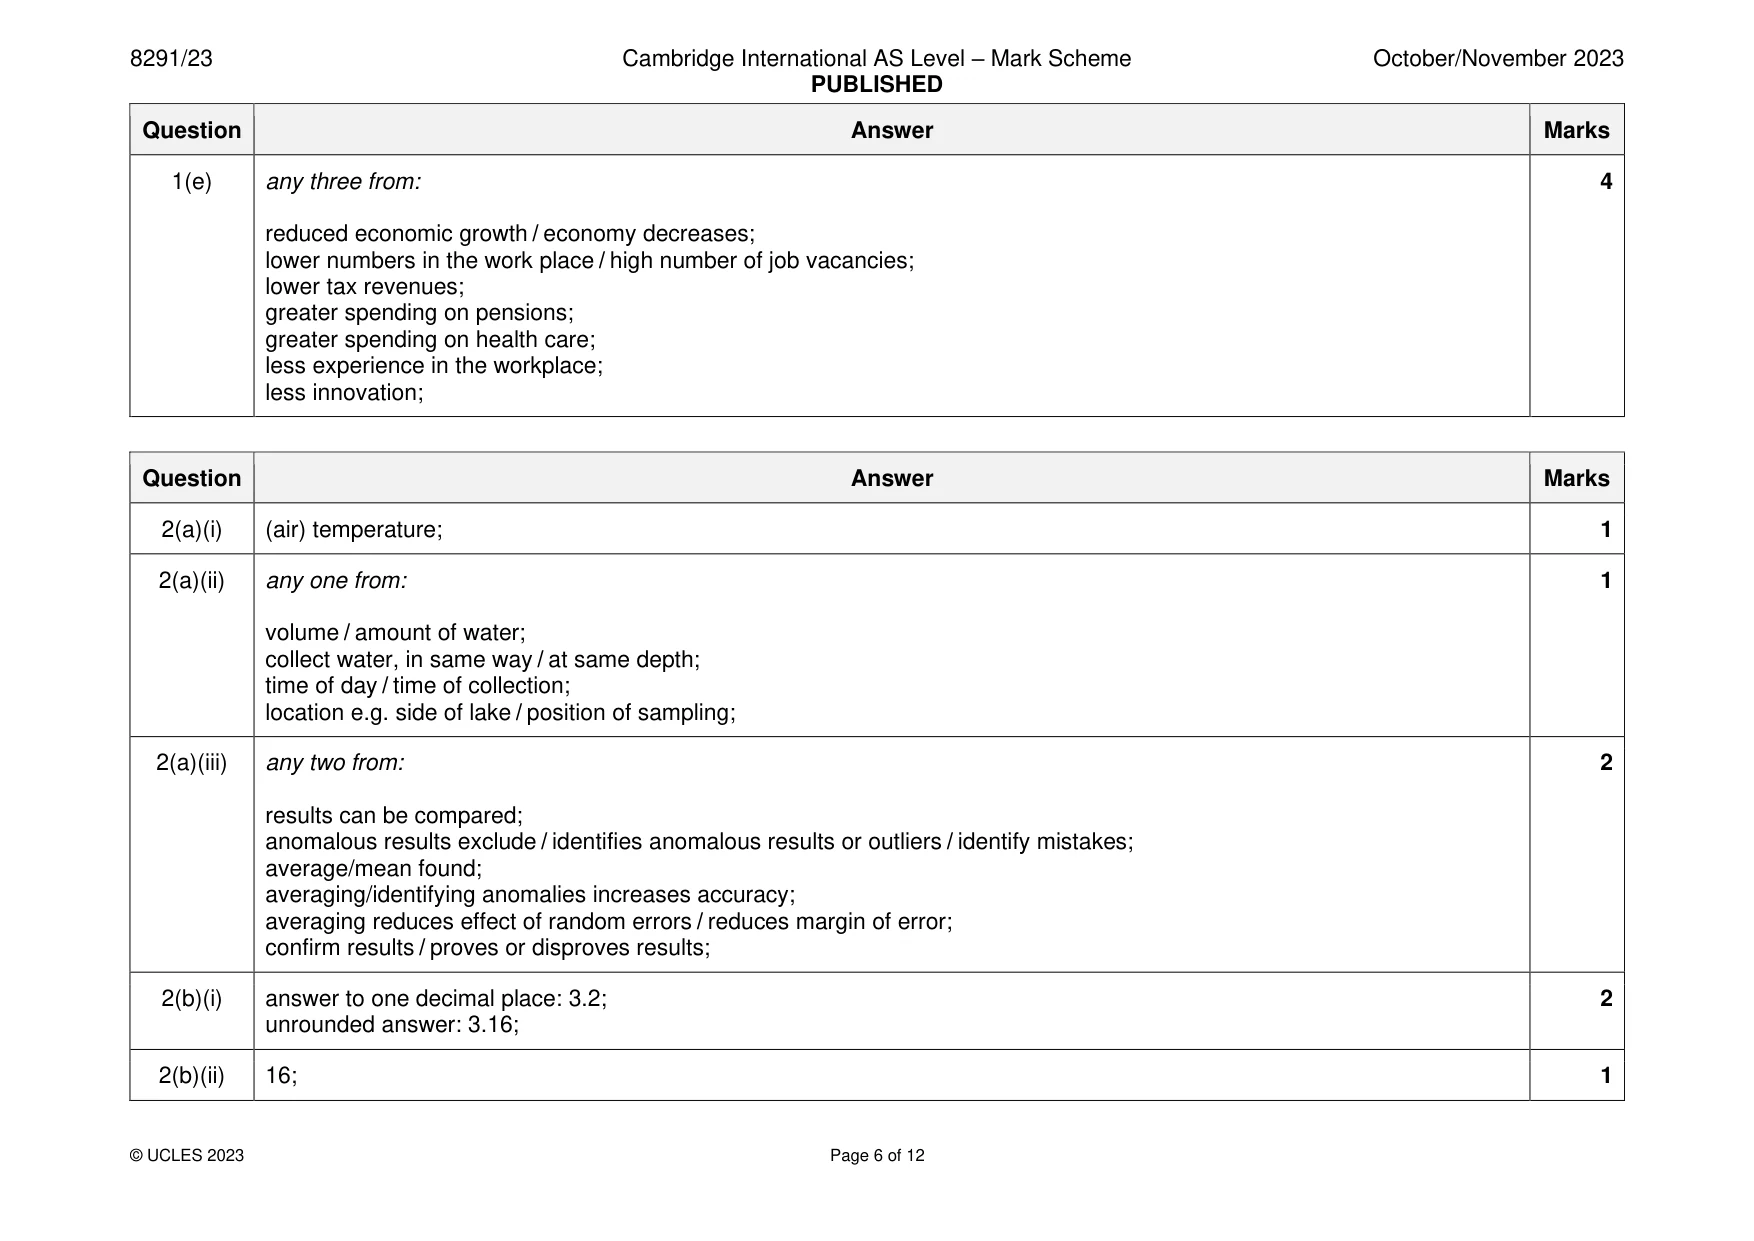
Mark scheme: Question Answer Marks 1(a) any three comparisons from: 3 overall HICs increased and LICs decreased; 2005 LICs and HICs equal / HICs overtake LICs at crossover point; after 2005, LICs decreasing and HICs increasing / before 2005, HICs always lower than LICs; before 2005, both fluctuate; quote comparative (quantitative or qualitative) data e.g. in 2015 there were 84 HICs compared to 28 LICs or in 1987 LICs were higher than HICs; 1(b)(i) any two from: 2 shows Chad is a developing country / less developed; low level of education / low number of years of schooling / low literacy; low income / Chad is a LIC; low life expectancy / life expectancy only 54; high birth rate; 1(b)(ii) any one from: 1 China: World Bank classification is MIC but HDI score is high; HDI shows how close the country is to a boundary whereas the World Bank classification does not allow this / HDI more specific (e.g. Japan and China only 0.158 difference but classes an HIC and MIC); World Bank classification only measures income / HDI measures more factors / how developed a country is; 1(c) any two from: 2 less use of (natural) resources / reduces depletion of resources; e.g. fossil fuels / food / land / water; so conserved for future generations / idea of sustainability / preserved better; improved food / water / energy security; 1(d) 38; 1 1(e) any three from: 4 reduced economic growth / economy decreases; lower numbers in the work place / high number of job vacancies; lower tax revenues; greater spending on pensions; greater spending on health care; less experience in the workplace; less innovation;
Q2 · A student investigates the concentration of nitrate ions in a lake
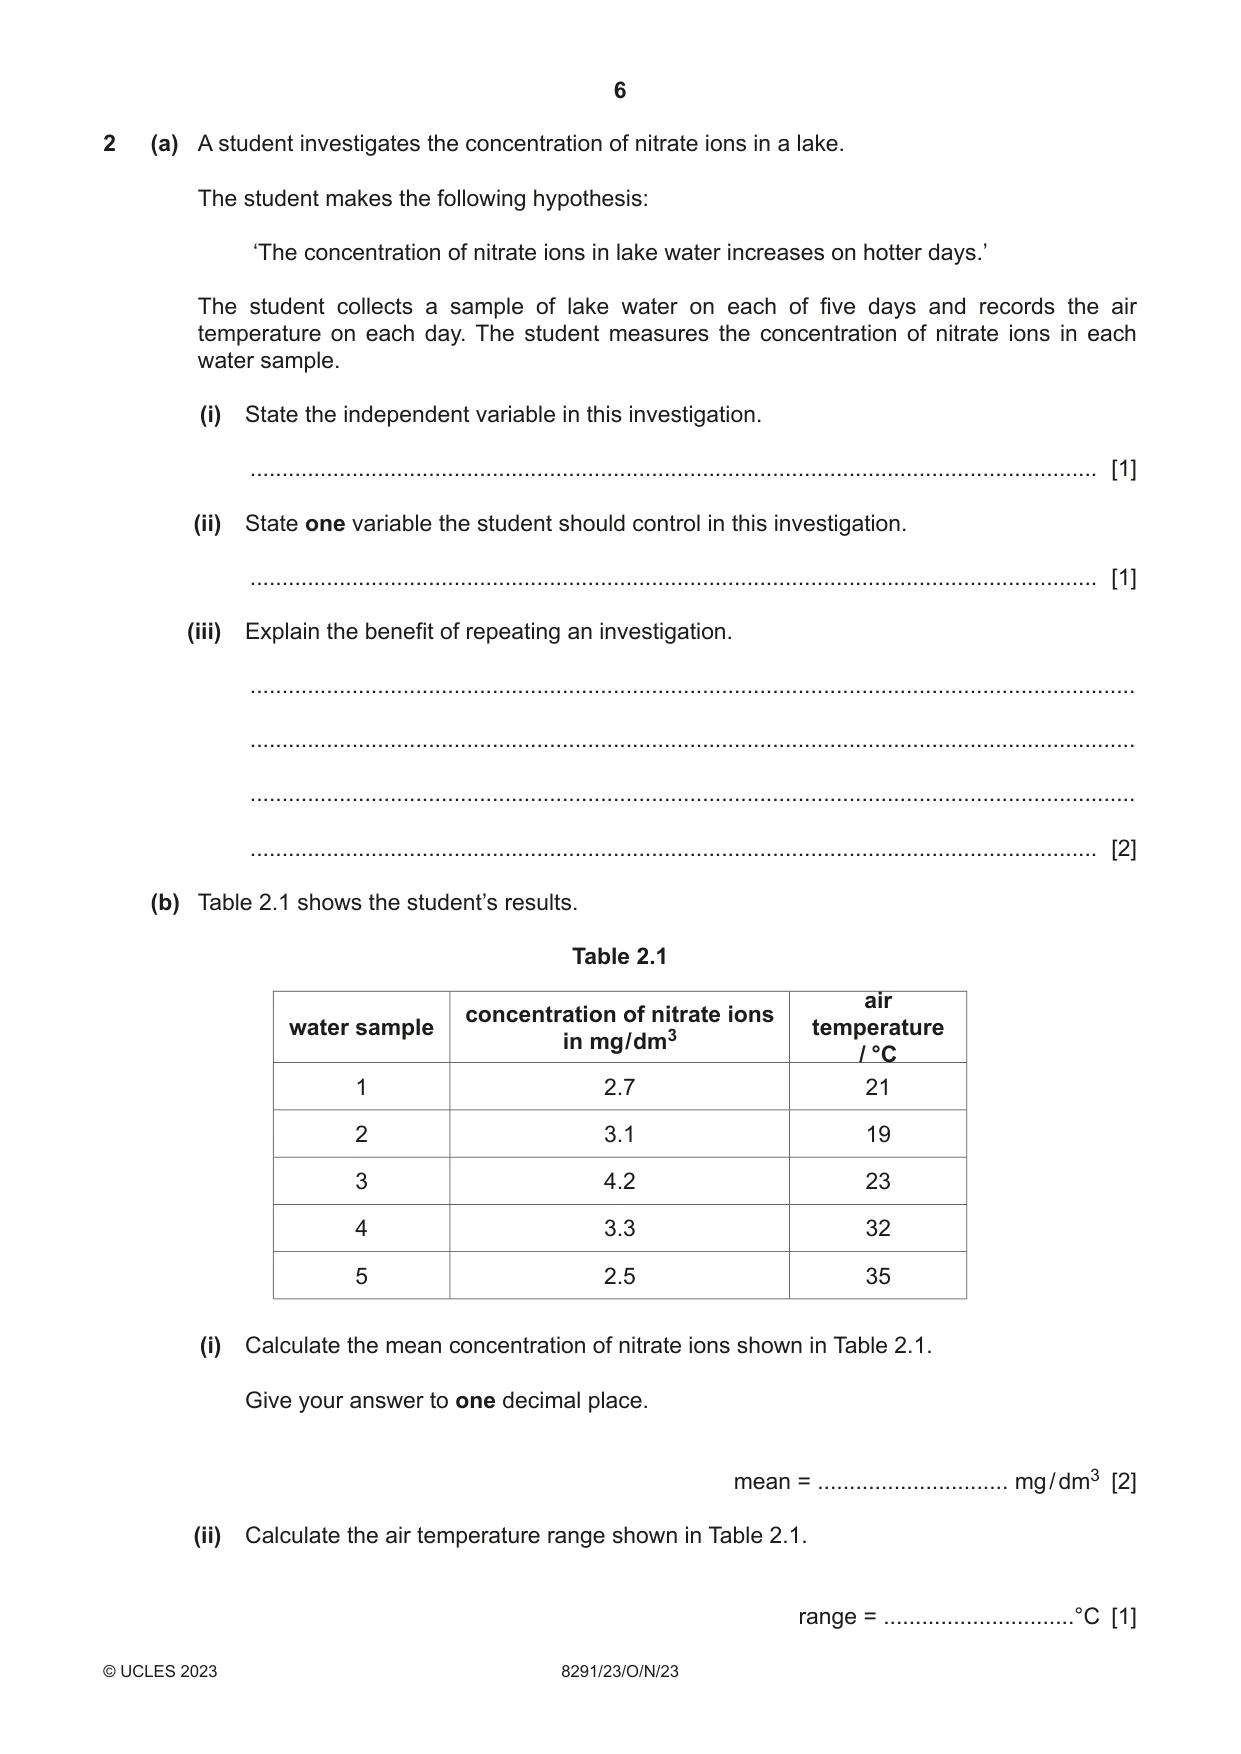
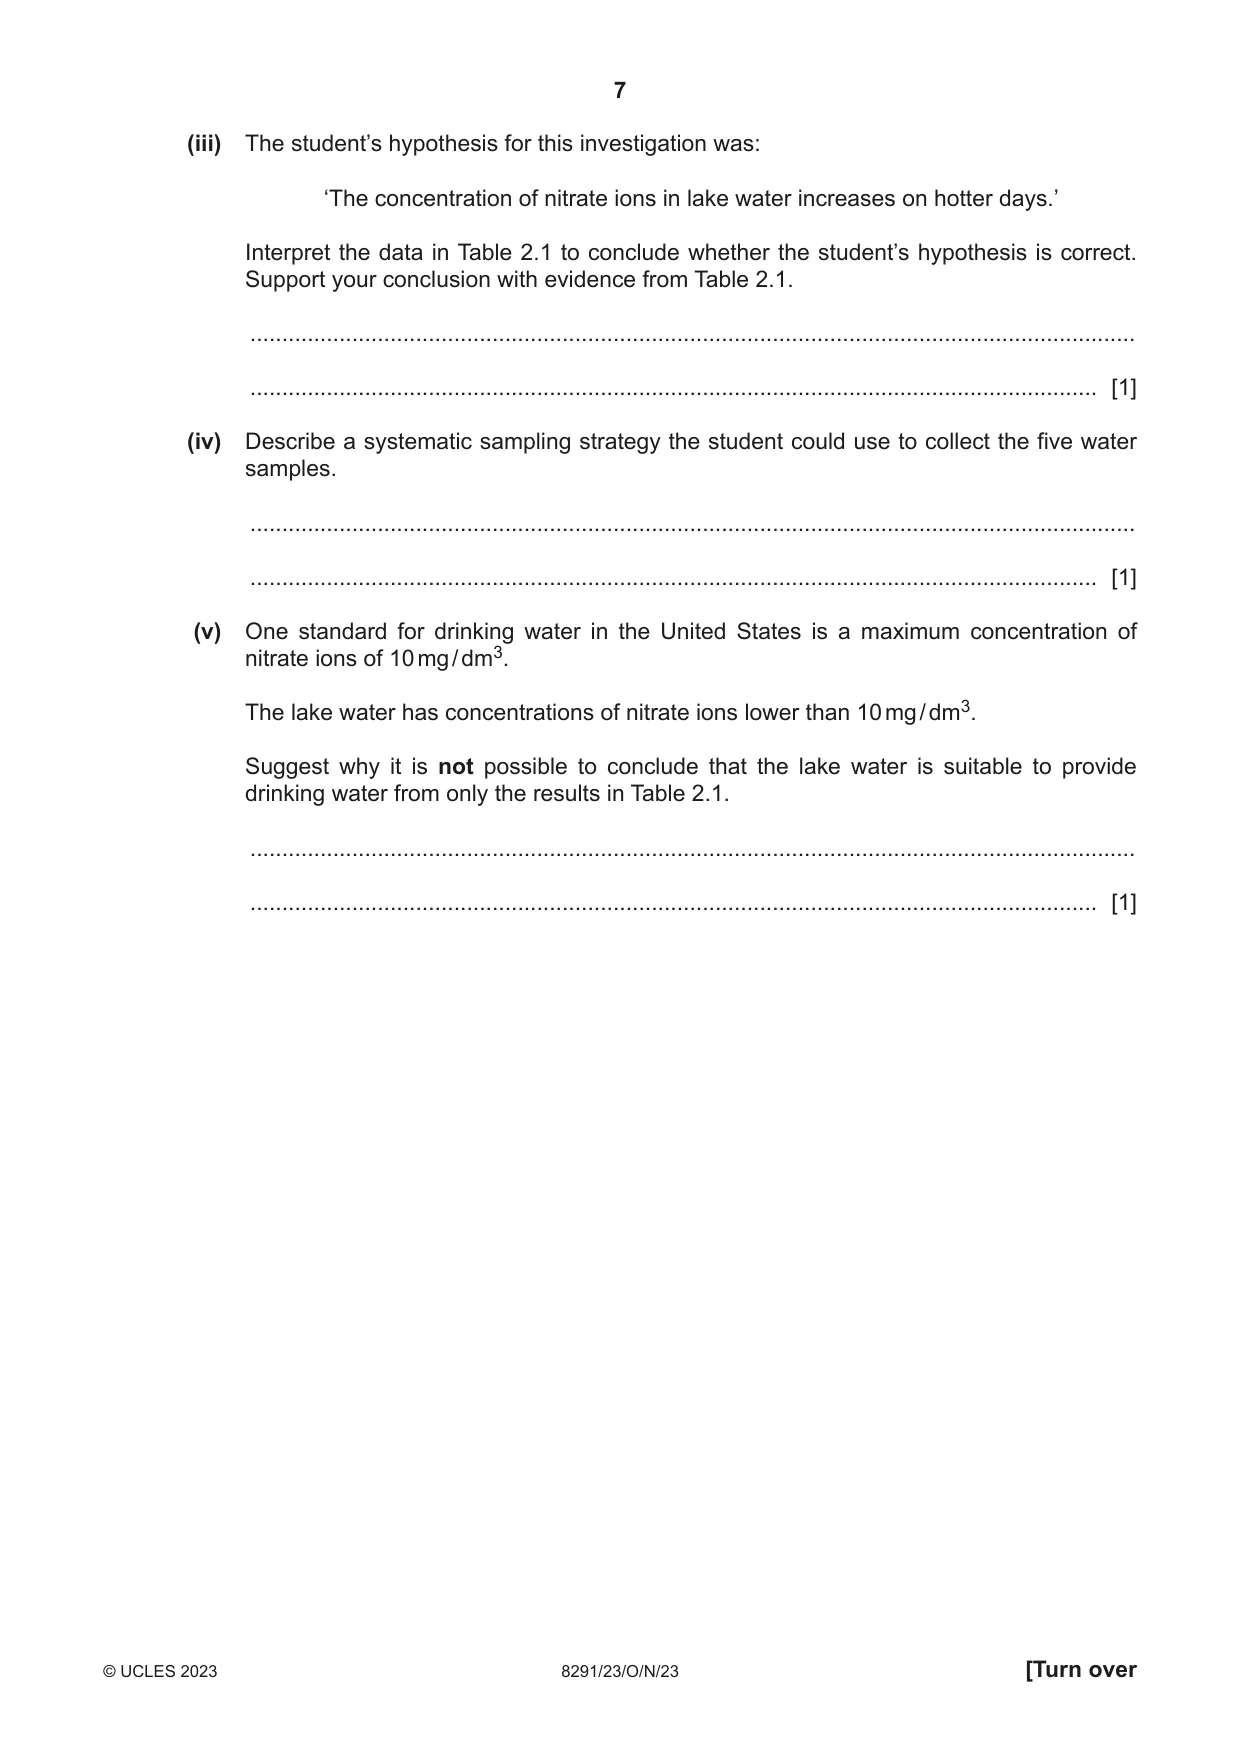
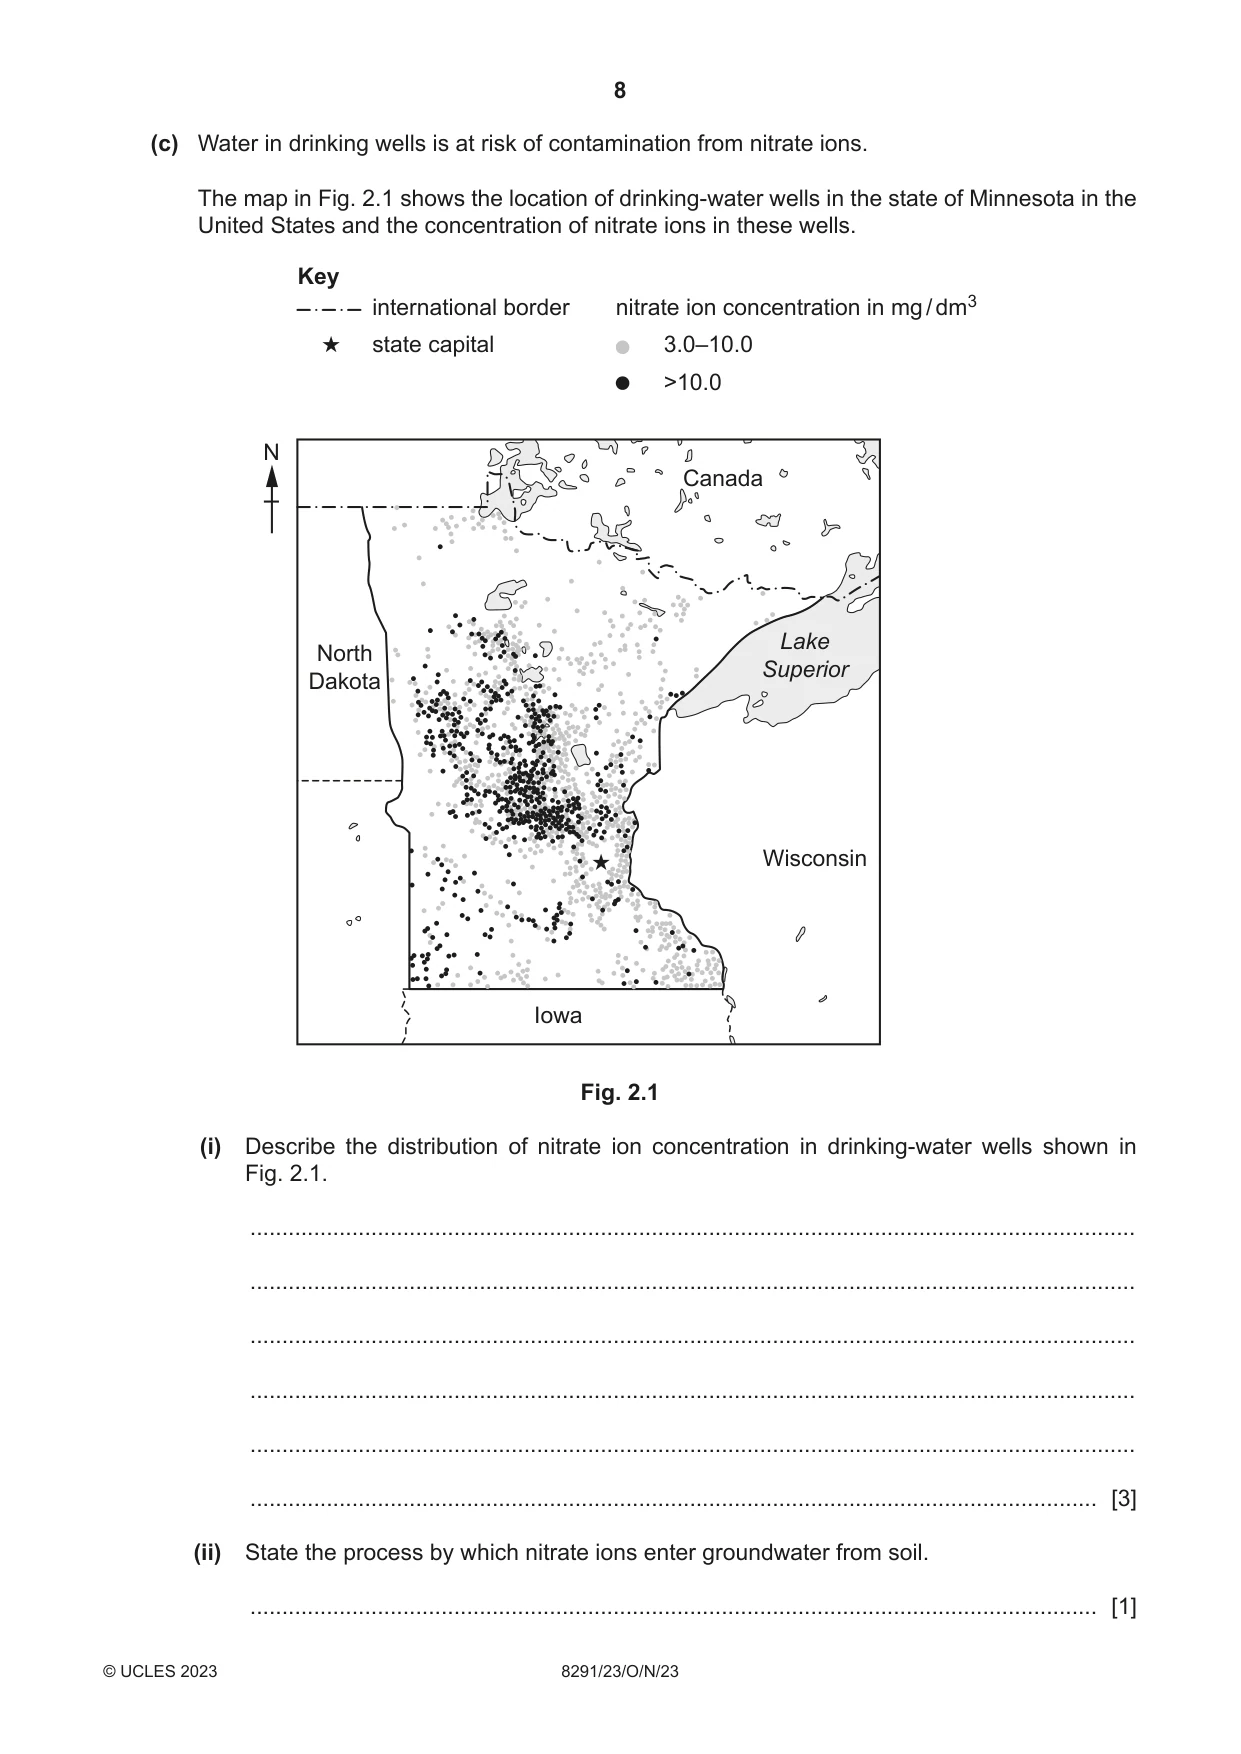
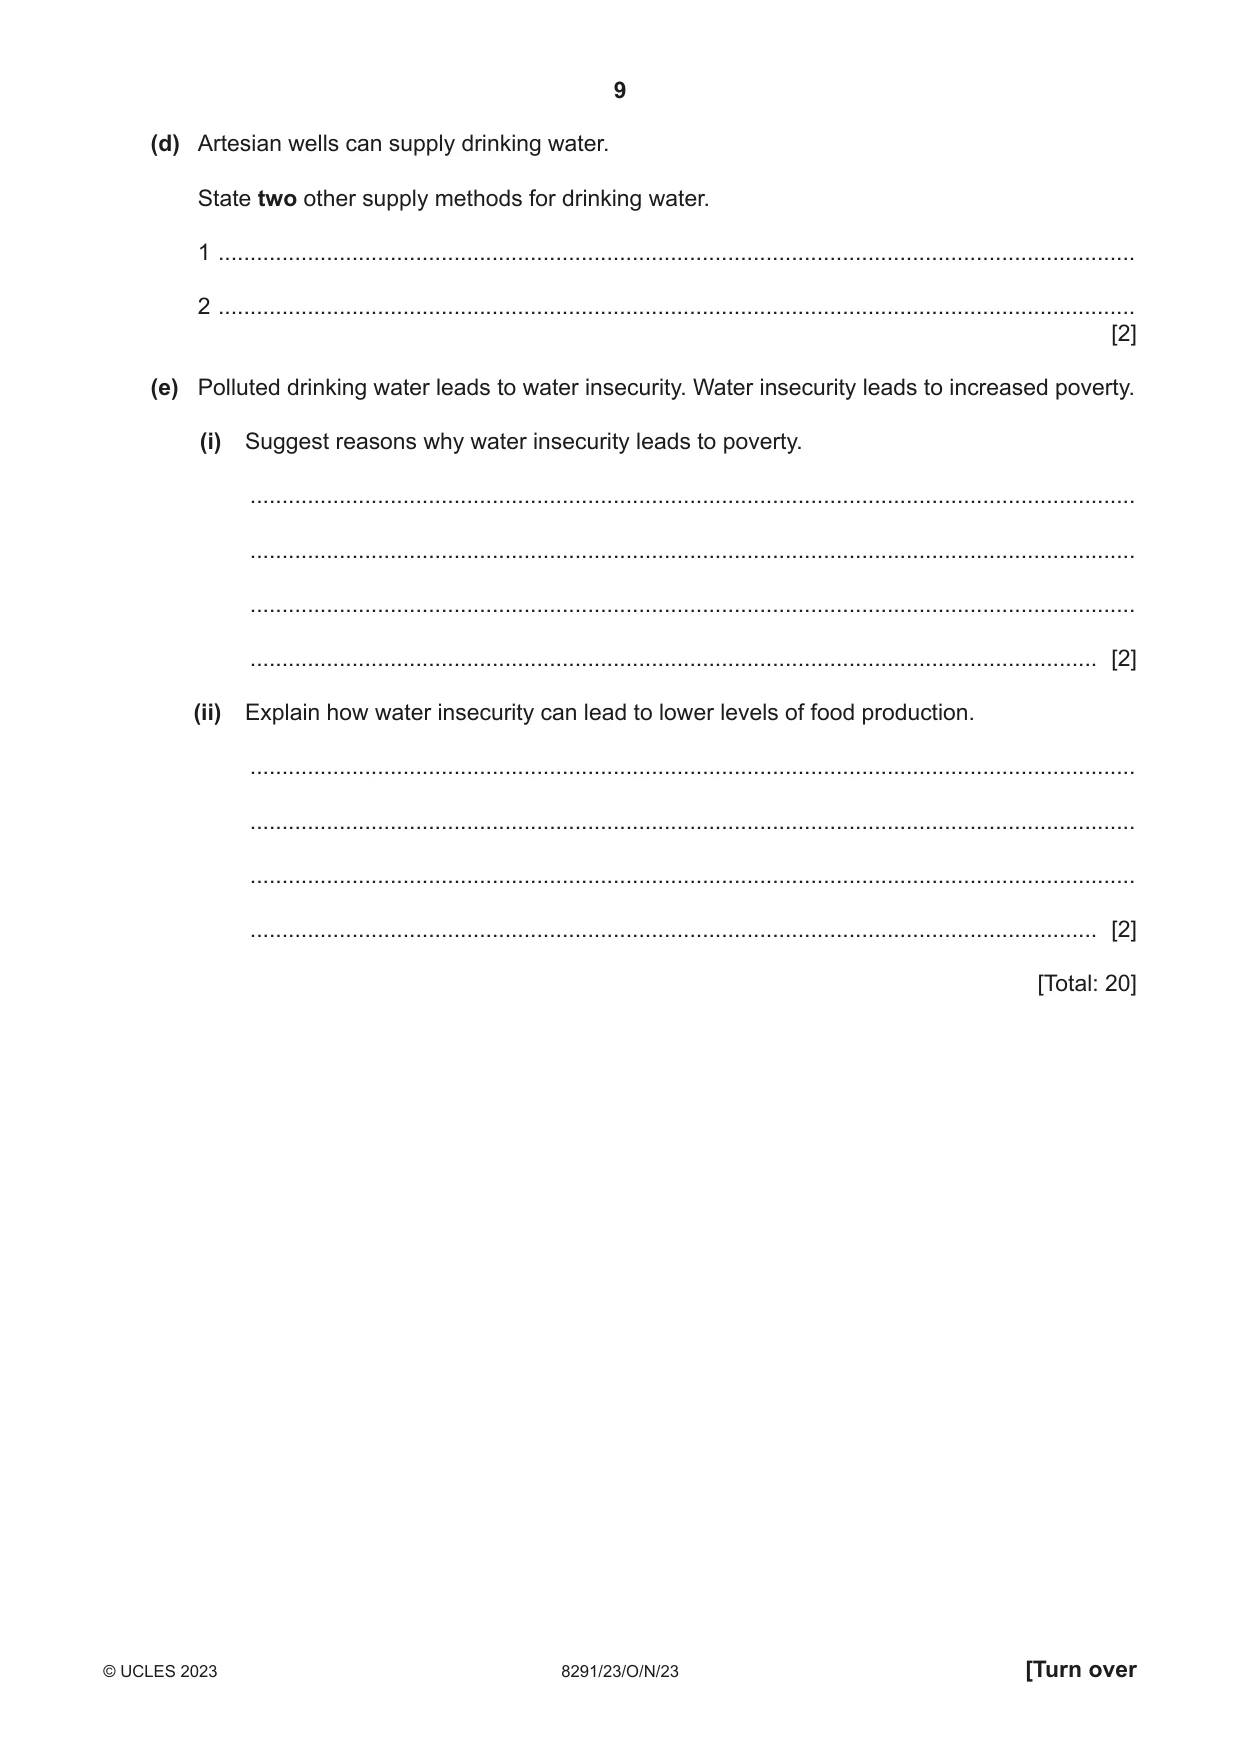
2 (a) A student investigates the concentration of nitrate ions in a lake. The student makes the following hypothesis: ‘The concentration of nitrate ions in lake water increases on hotter days.’ The student collects a sample of lake water on each of five days and records the air temperature on each day. The student measures the concentration of nitrate ions in each water sample. (i) State the independent variable in this investigation. ..................................................................................................................................... [1] (ii) State one variable the student should control in this investigation. ..................................................................................................................................... [1] (iii) Explain the benefit of repeating an investigation. ........................................................................................................................................... ........................................................................................................................................... ........................................................................................................................................... ..................................................................................................................................... [2] (b) Table 2.1 shows the student’s results. Table 2.1 air concentration of nitrate ions water sample temperature in mg / dm3 / °C 1 2.7 21 2 3.1 19 3 4.2 23 4 3.3 32 5 2.5 35 (i) Calculate the mean concentration of nitrate ions shown in Table 2.1. Give your answer to one decimal place. mean = .............................. mg / dm3 [2] (ii) Calculate the air temperature range shown in Table 2.1. range = ..............................°C [1] (iii) The student’s hypothesis for this investigation was: ‘The concentration of nitrate ions in lake water increases on hotter days.’ Interpret the data in Table 2.1 to conclude whether the student’s hypothesis is correct. Support your conclusion with evidence from Table 2.1. ........................................................................................................................................... ..................................................................................................................................... [1] (iv) Describe a systematic sampling strategy the student could use to collect the five water samples. ........................................................................................................................................... ..................................................................................................................................... [1] (v) One standard for drinking water in the United States is a maximum concentration of nitrate ions of 10 mg / dm3. The lake water has concentrations of nitrate ions lower than 10 mg / dm3. Suggest why it is not possible to conclude that the lake water is suitable to provide drinking water from only the results in Table 2.1. ........................................................................................................................................... ..................................................................................................................................... [1] (c) Water in drinking wells is at risk of contamination from nitrate ions. The map in Fig. 2.1 shows the location of drinking-water wells in the state of Minnesota in the United States and the concentration of nitrate ions in these wells. Key international border nitrate ion concentration in mg / dm3 state capital 3.0–10.0 >10.0 N Canada Lake North Superior Dakota Wisconsin Iowa Fig. 2.1 (i) Describe the distribution of nitrate ion concentration in drinking-water wells shown in Fig. 2.1. ........................................................................................................................................... ........................................................................................................................................... ........................................................................................................................................... ........................................................................................................................................... ........................................................................................................................................... ..................................................................................................................................... [3] (ii) State the process by which nitrate ions enter groundwater from soil. ..................................................................................................................................... [1] (d) Artesian wells can supply drinking water. State two other supply methods for drinking water. 1 ................................................................................................................................................ 2 ................................................................................................................................................ [2] (e) Polluted drinking water leads to water insecurity. Water insecurity leads to increased poverty. (i) Suggest reasons why water insecurity leads to poverty. ........................................................................................................................................... ........................................................................................................................................... ........................................................................................................................................... ..................................................................................................................................... [2] (ii) Explain how water insecurity can lead to lower levels of food production. ........................................................................................................................................... ........................................................................................................................................... ........................................................................................................................................... ..................................................................................................................................... [2] [Total: 20]
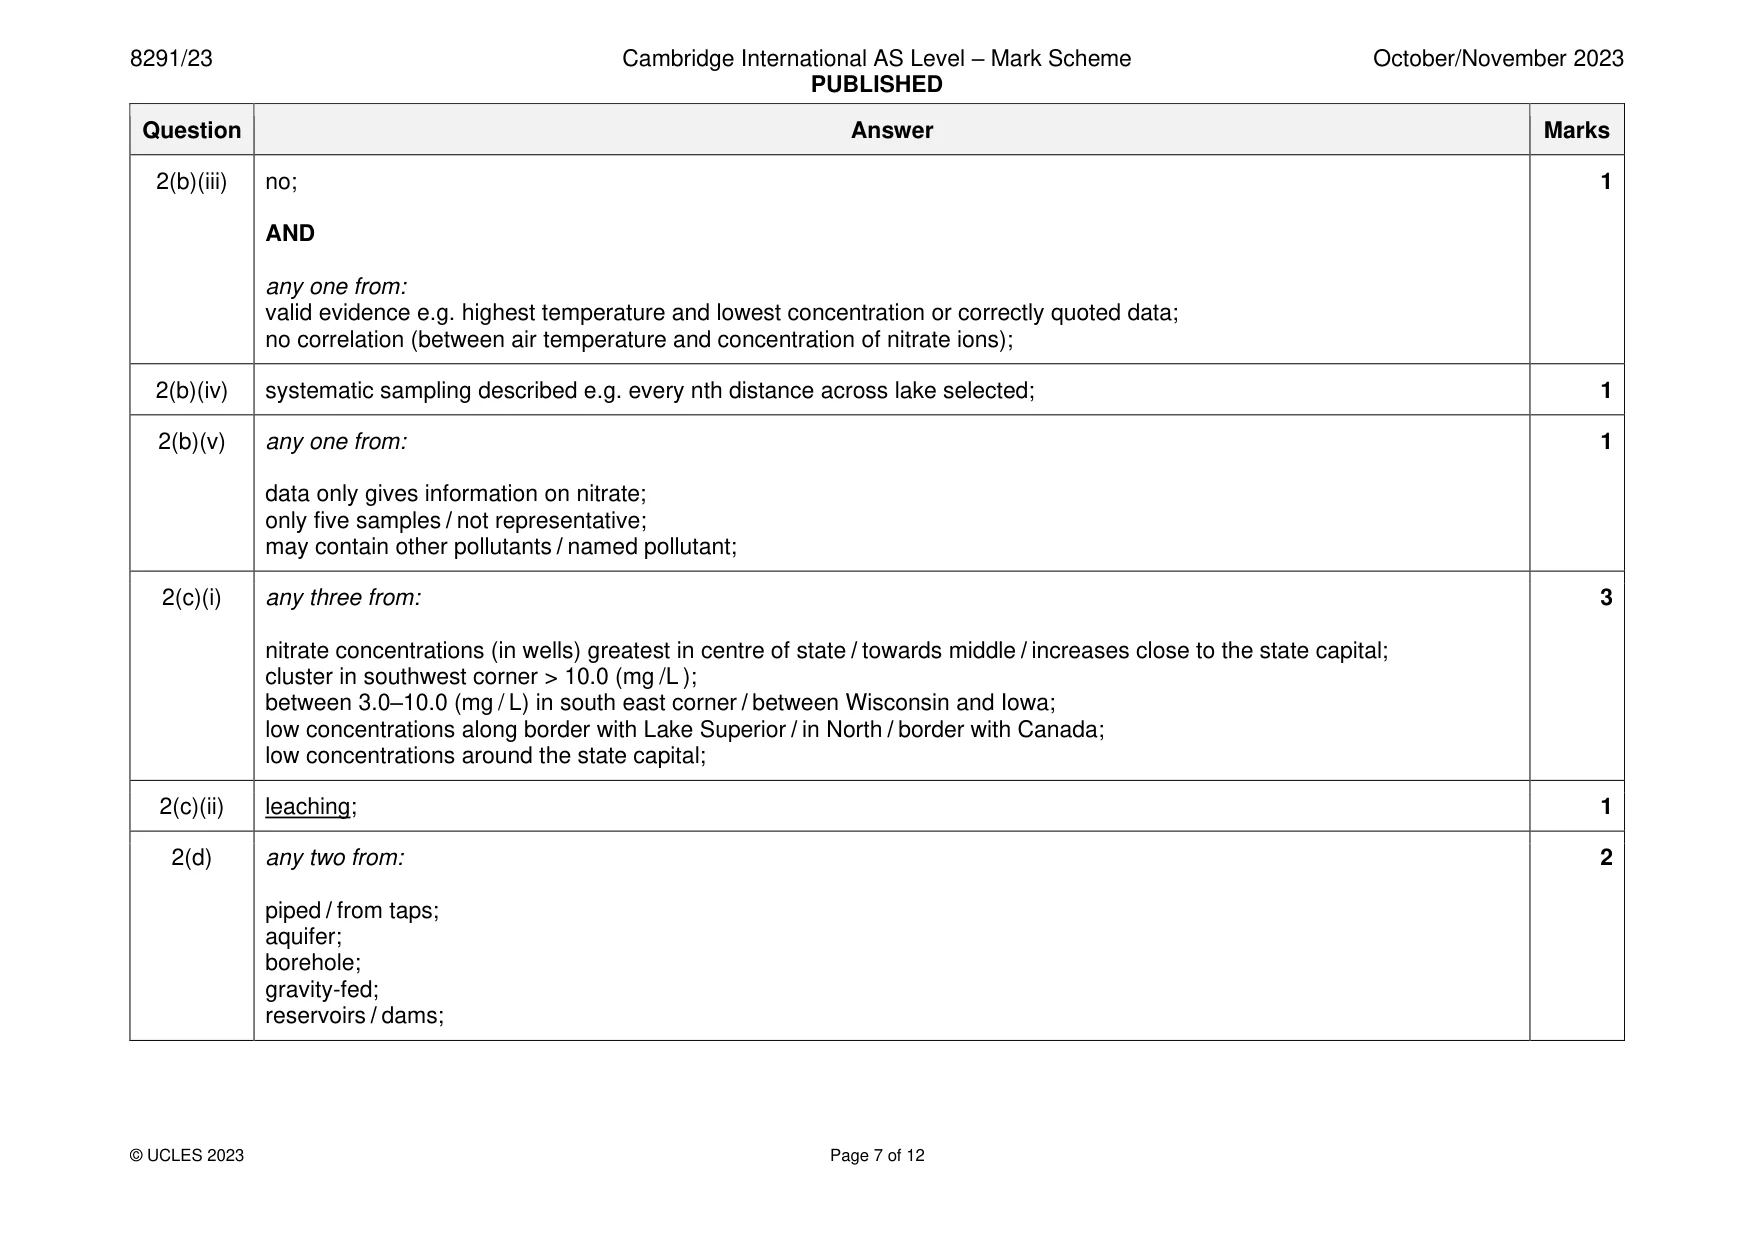
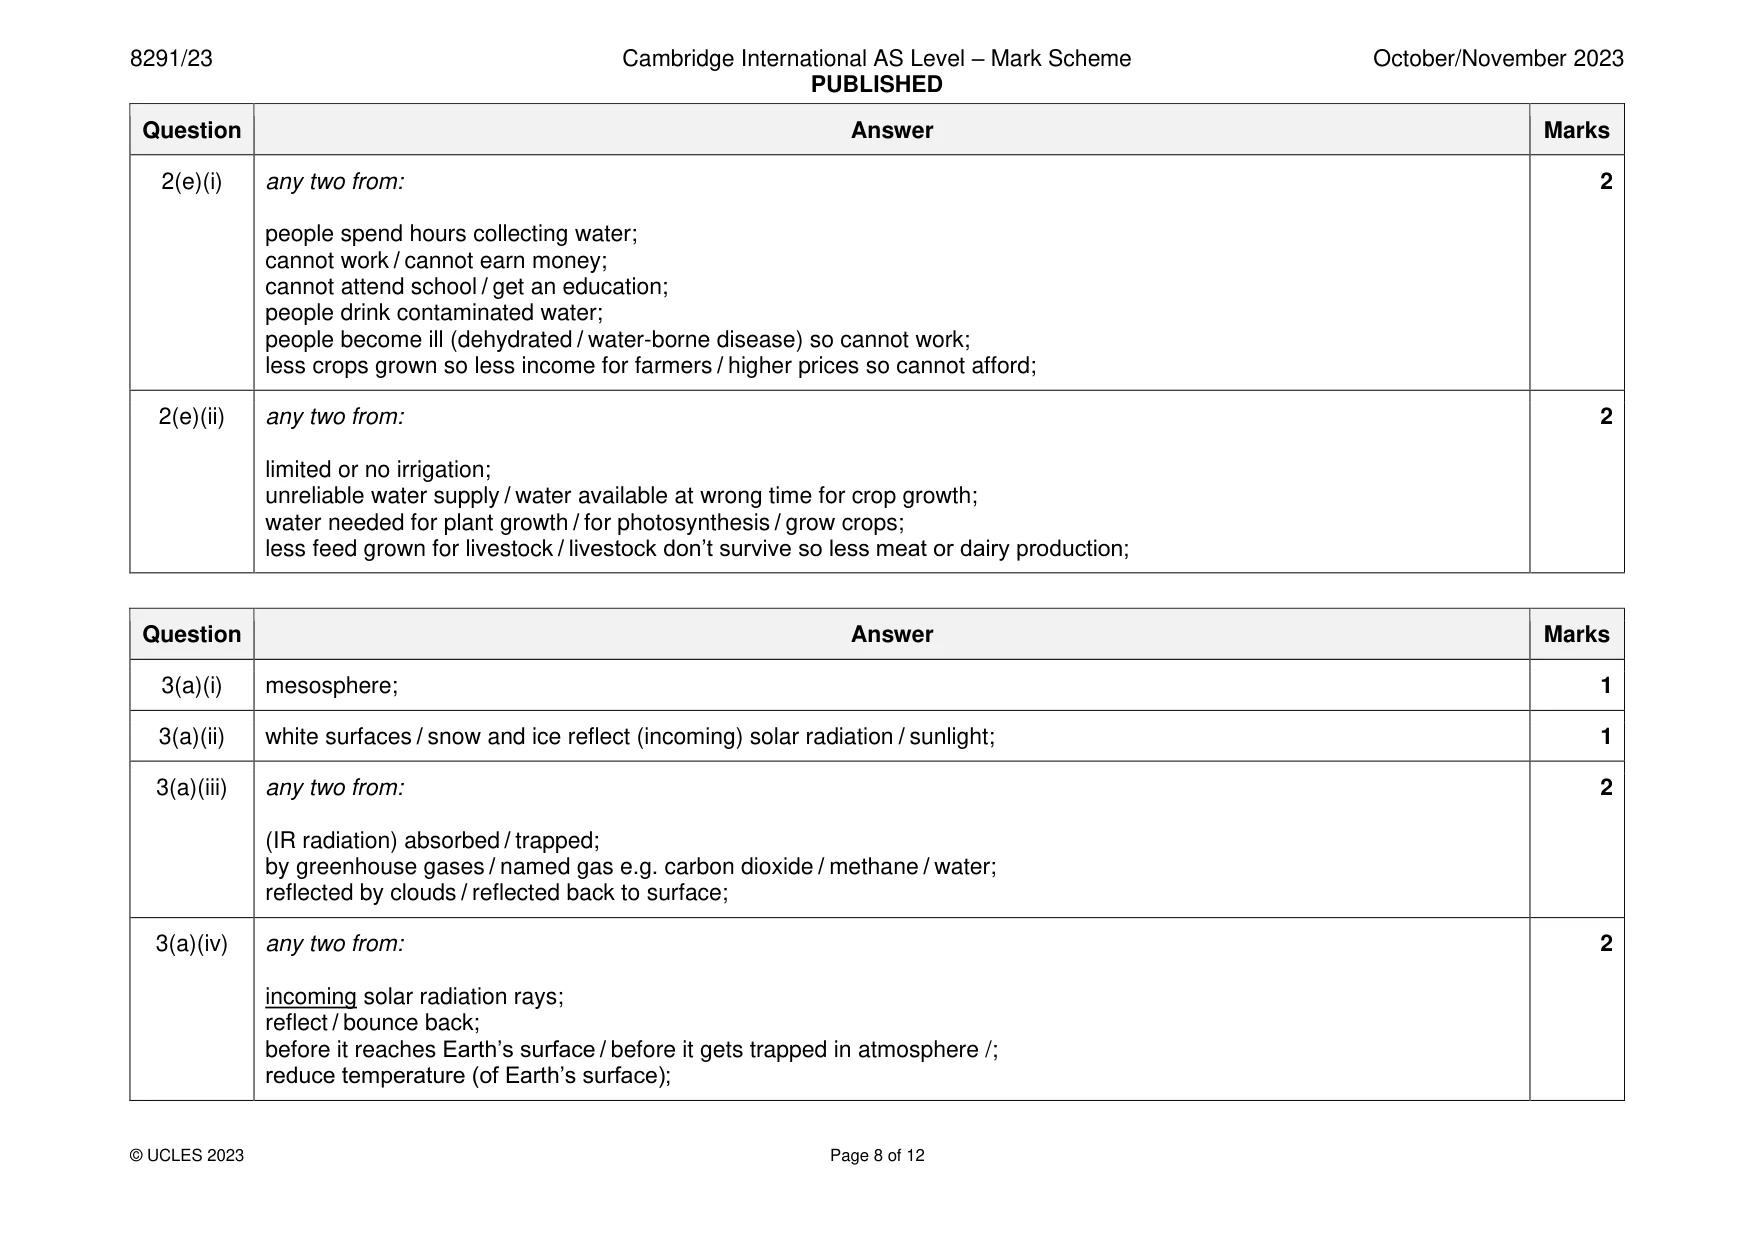
Mark scheme: 2(a)(i) (air) temperature; 1 2(a)(ii) any one from: 1 volume / amount of water; collect water, in same way / at same depth; time of day / time of collection; location e.g. side of lake / position of sampling; 2(a)(iii) any two from: 2 results can be compared; anomalous results exclude / identifies anomalous results or outliers / identify mistakes; average/mean found; averaging/identifying anomalies increases accuracy; averaging reduces effect of random errors / reduces margin of error; confirm results / proves or disproves results; 2(b)(i) answer to one decimal place: 3.2; 2 unrounded answer: 3.16; 2(b)(ii) 16; 1 2(b)(iii) no; 1 AND any one from: valid evidence e.g. highest temperature and lowest concentration or correctly quoted data; no correlation (between air temperature and concentration of nitrate ions); 2(b)(iv) systematic sampling described e.g. every nth distance across lake selected; 1 2(b)(v) any one from: 1 data only gives information on nitrate; only five samples / not representative; may contain other pollutants / named pollutant; 2(c)(i) any three from: 3 nitrate concentrations (in wells) greatest in centre of state / towards middle / increases close to the state capital; cluster in southwest corner > 10.0 (mg /L ); between 3.0–10.0 (mg / L) in south east corner / between Wisconsin and Iowa; low concentrations along border with Lake Superior / in North / border with Canada; low concentrations around the state capital; 2(c)(ii) leaching; 1 2(d) any two from: 2 piped / from taps; aquifer; borehole; gravity-fed; reservoirs / dams; 2(e)(i) any two from: 2 people spend hours collecting water; cannot work / cannot earn money; cannot attend school / get an education; people drink contaminated water; people become ill (dehydrated / water-borne disease) so cannot work; less crops grown so less income for farmers / higher prices so cannot afford; 2(e)(ii) any two from: 2 limited or no irrigation; unreliable water supply / water available at wrong time for crop growth; water needed for plant growth / for photosynthesis / grow crops; less feed grown for livestock / livestock don’t survive so less meat or dairy production;
Q3 · Incoming and outgoing solar radiation
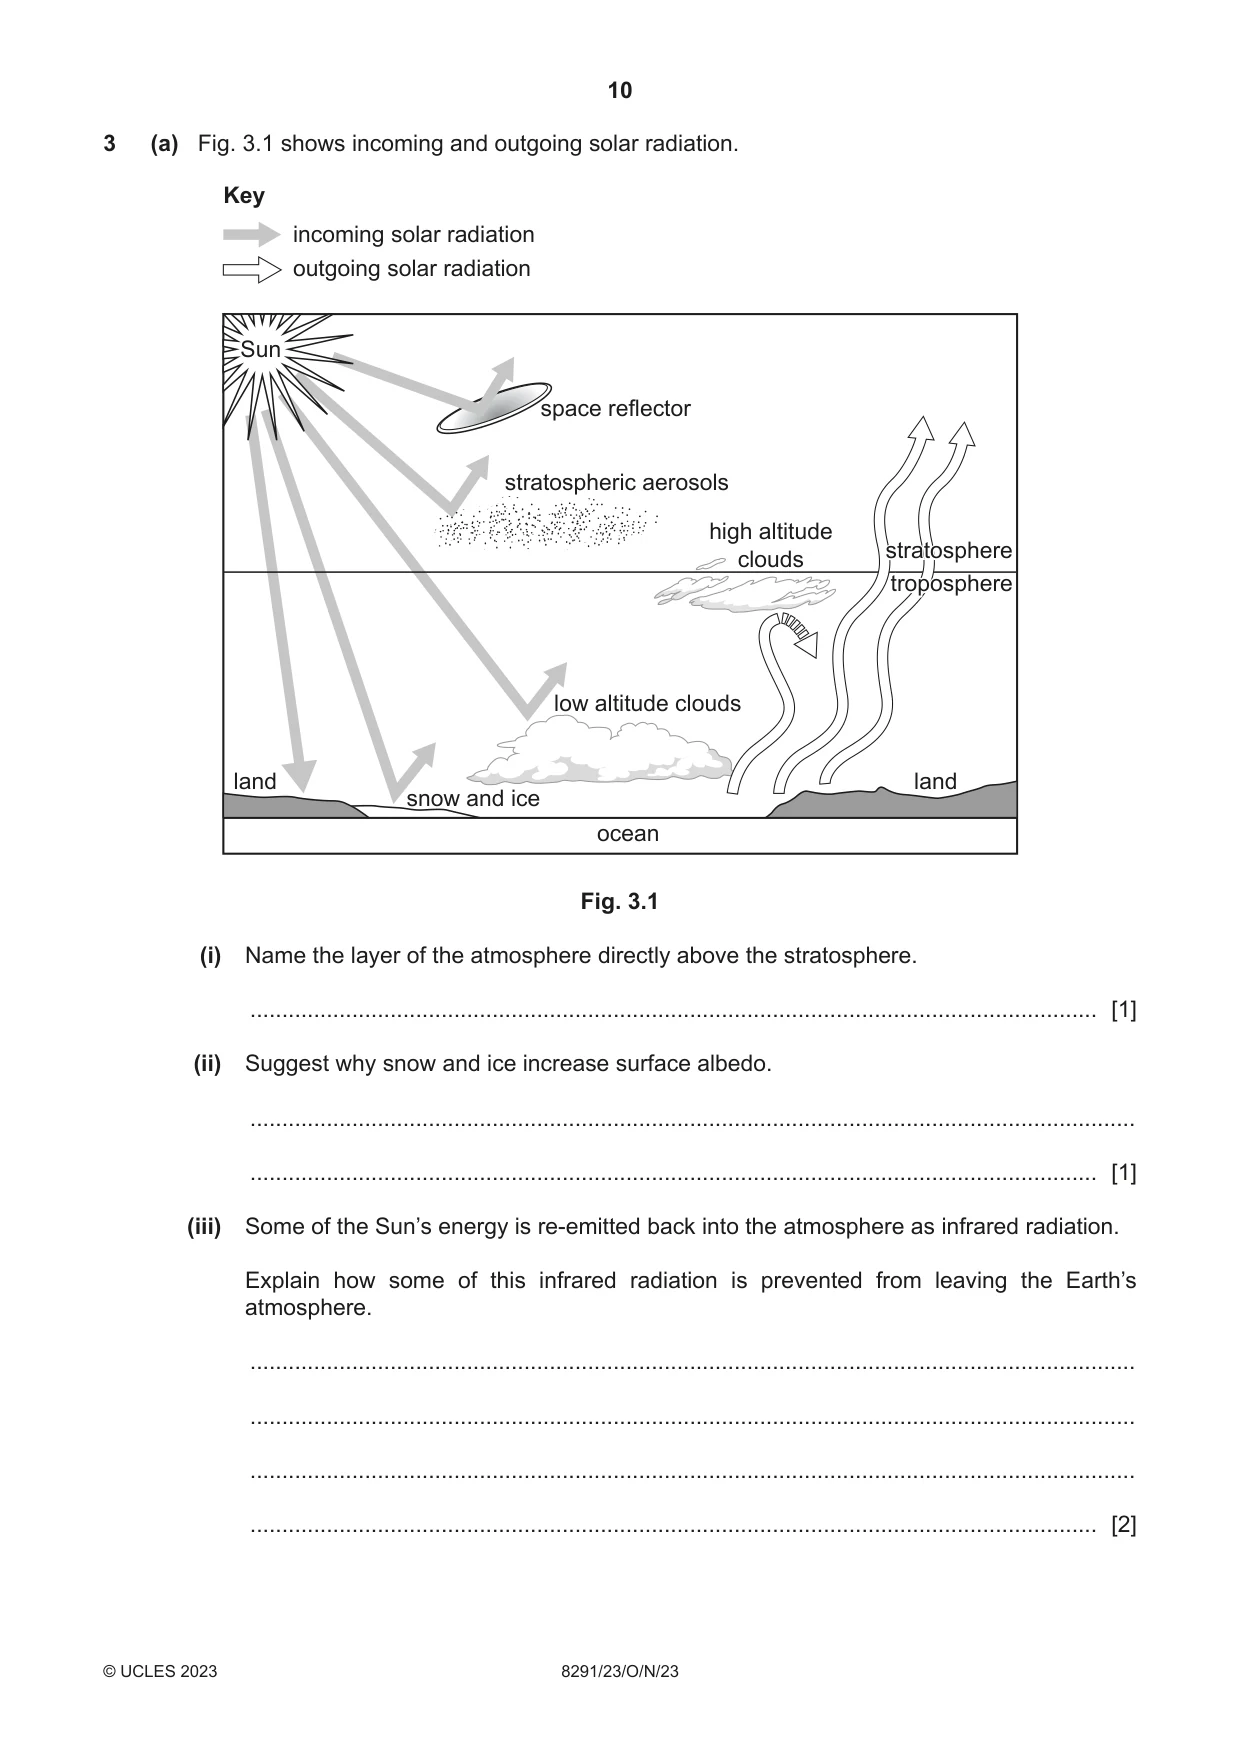
3 (a) Fig. 3.1 shows incoming and outgoing solar radiation. Key incoming solar radiation outgoing solar radiation Sun space reflector stratospheric aerosols high altitude stratospherestratosphere clouds tropospheretroposphere low altitude clouds land land snow and ice ocean Fig. 3.1 (i) Name the layer of the atmosphere directly above the stratosphere. ..................................................................................................................................... [1] (ii) Suggest why snow and ice increase surface albedo. ........................................................................................................................................... ..................................................................................................................................... [1] (iii) Some of the Sun’s energy is re-emitted back into the atmosphere as infrared radiation. Explain how some of this infrared radiation is prevented from leaving the Earth’s atmosphere. ........................................................................................................................................... ........................................................................................................................................... ........................................................................................................................................... ..................................................................................................................................... [2] (iv) Suggest how a space reflector could counteract climate change. ........................................................................................................................................... ........................................................................................................................................... ........................................................................................................................................... ..................................................................................................................................... [2] (b) Explain why eating a plant-based diet can reduce the impact of climate change. ................................................................................................................................................... ................................................................................................................................................... ................................................................................................................................................... ............................................................................................................................................. [2] (c) State the three major gases in Earth’s unpolluted atmosphere. 1 ................................................................................................................................................ 2 ................................................................................................................................................ 3 ................................................................................................................................................ [3] (d) Explain why international agreements are needed to control air pollution. ................................................................................................................................................... ................................................................................................................................................... ................................................................................................................................................... ............................................................................................................................................. [2] [Total: 13]
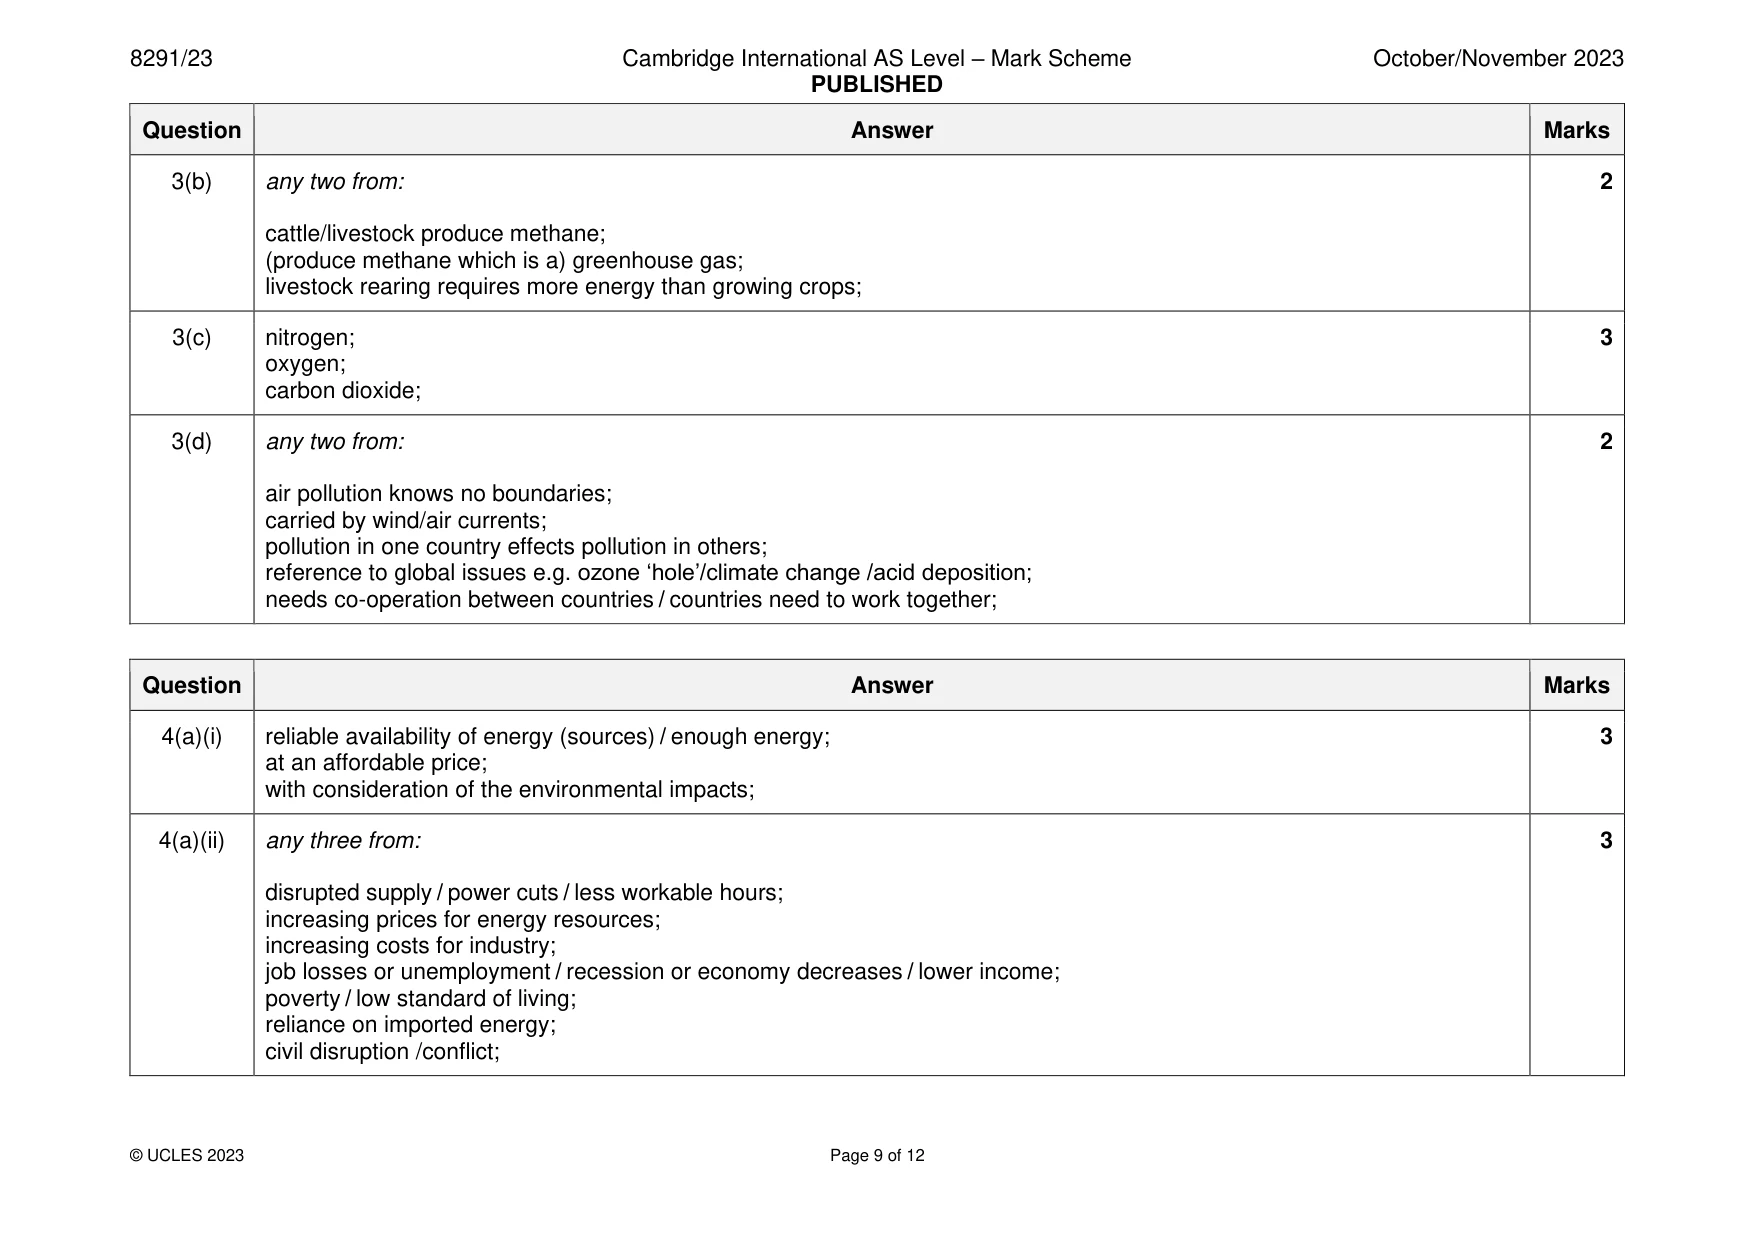
Mark scheme: 3(a)(i) mesosphere; 1 3(a)(ii) white surfaces / snow and ice reflect (incoming) solar radiation / sunlight; 1 3(a)(iii) any two from: 2 (IR radiation) absorbed / trapped; by greenhouse gases / named gas e.g. carbon dioxide / methane / water; reflected by clouds / reflected back to surface; 3(a)(iv) any two from: 2 incoming solar radiation rays; reflect / bounce back; before it reaches Earth’s surface / before it gets trapped in atmosphere /; reduce temperature (of Earth’s surface); 3(b) any two from: 2 cattle/livestock produce methane; (produce methane which is a) greenhouse gas; livestock rearing requires more energy than growing crops; 3(c) nitrogen; 3 oxygen; carbon dioxide; 3(d) any two from: 2 air pollution knows no boundaries; carried by wind/air currents; pollution in one country effects pollution in others; reference to global issues e.g. ozone ‘hole’/climate change /acid deposition; needs co-operation between countries / countries need to work together;
More questions on The structure and composition of the atmosphere
Q4 · Define the term energy security
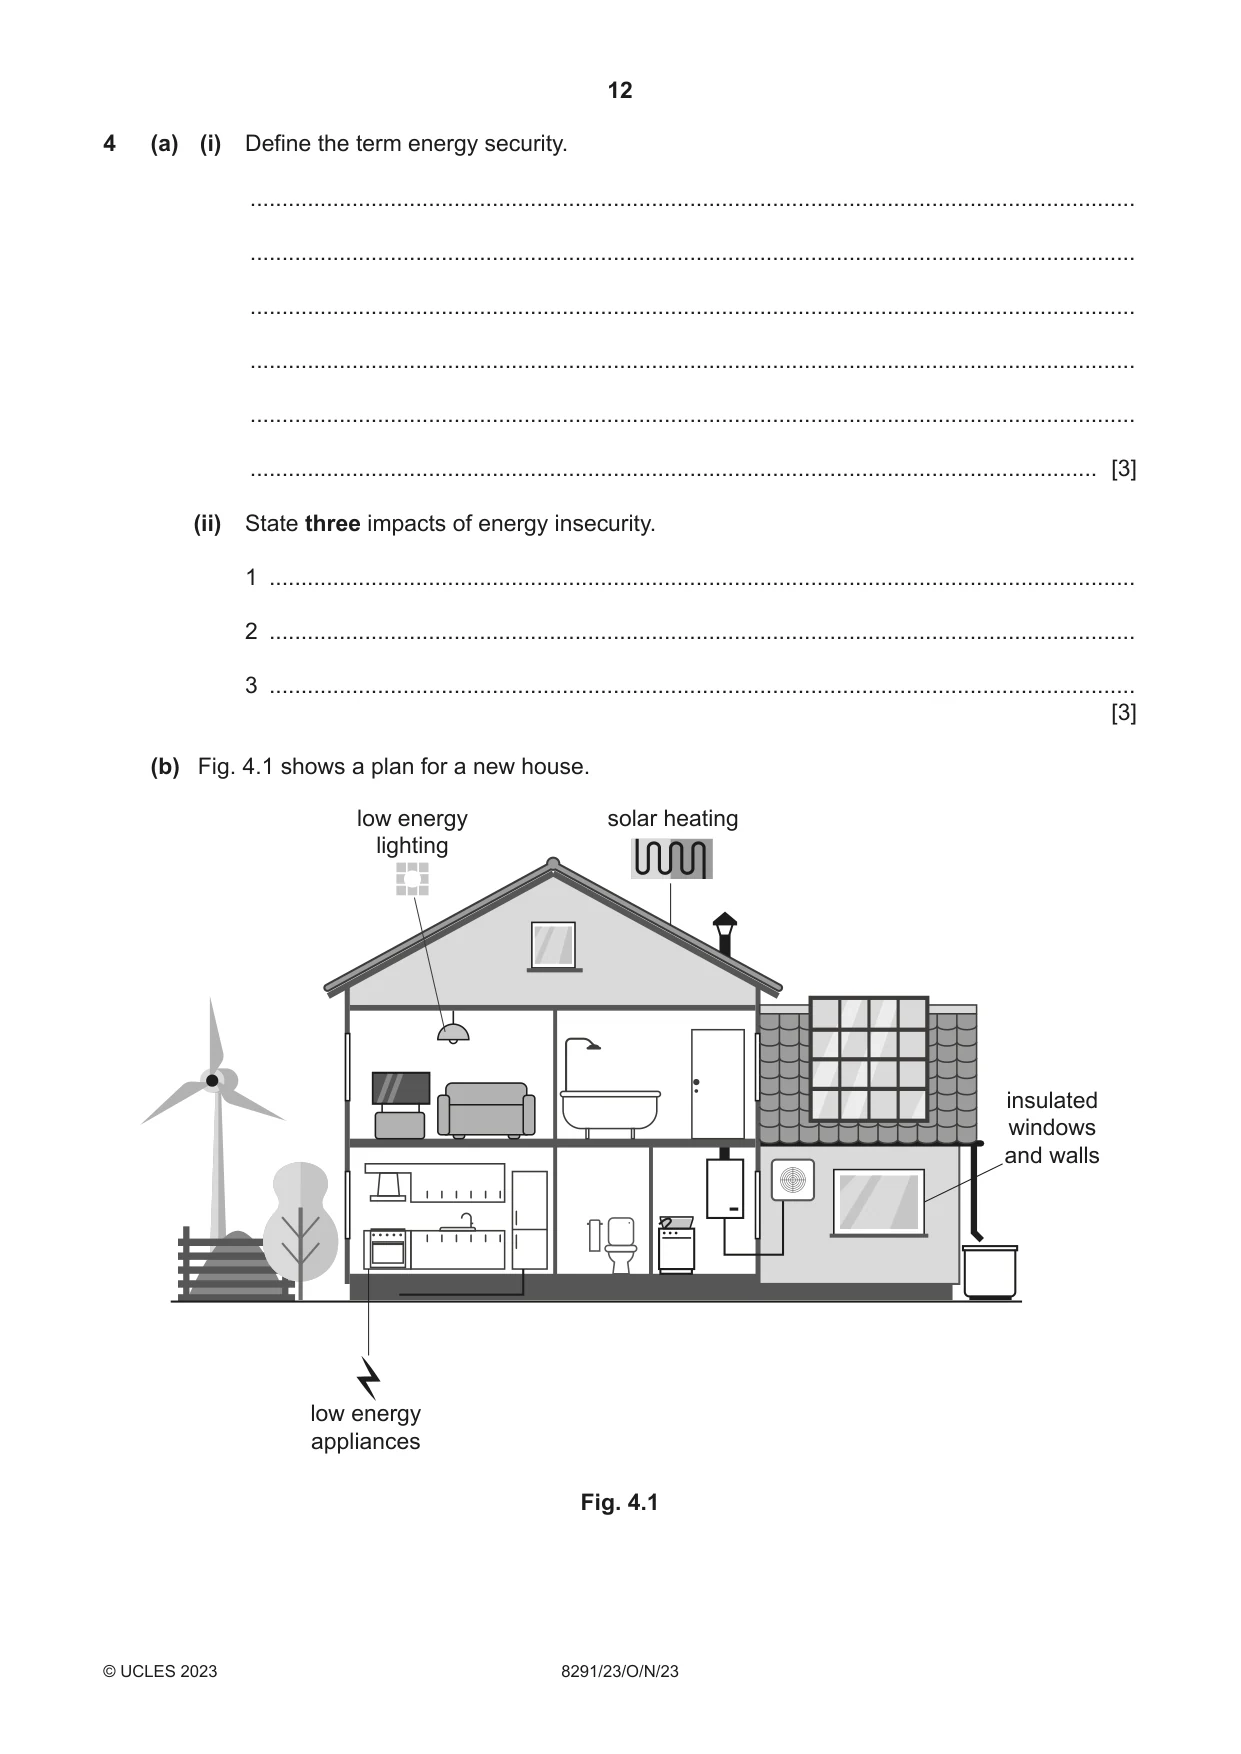
4 (a) (i) Define the term energy security. ........................................................................................................................................... ........................................................................................................................................... ........................................................................................................................................... ........................................................................................................................................... ........................................................................................................................................... ..................................................................................................................................... [3] (ii) State three impacts of energy insecurity. 1 ........................................................................................................................................ 2 ........................................................................................................................................ 3 ........................................................................................................................................ [3] (b) Fig. 4.1 shows a plan for a new house. low energy solar heating lighting insulated windows and walls low energy appliances Fig. 4.1 (i) Explain how an energy efficient house reduces the impact on the environment. ........................................................................................................................................... ........................................................................................................................................... ........................................................................................................................................... ........................................................................................................................................... ........................................................................................................................................... ........................................................................................................................................... ........................................................................................................................................... ........................................................................................................................................... ........................................................................................................................................... ..................................................................................................................................... [5] (ii) The roof of the house can be planted with grass. Suggest one benefit of having a roof planted with grass. ........................................................................................................................................... ..................................................................................................................................... [1] (iii) State the source of energy for plants. ..................................................................................................................................... [1] [Total: 13]
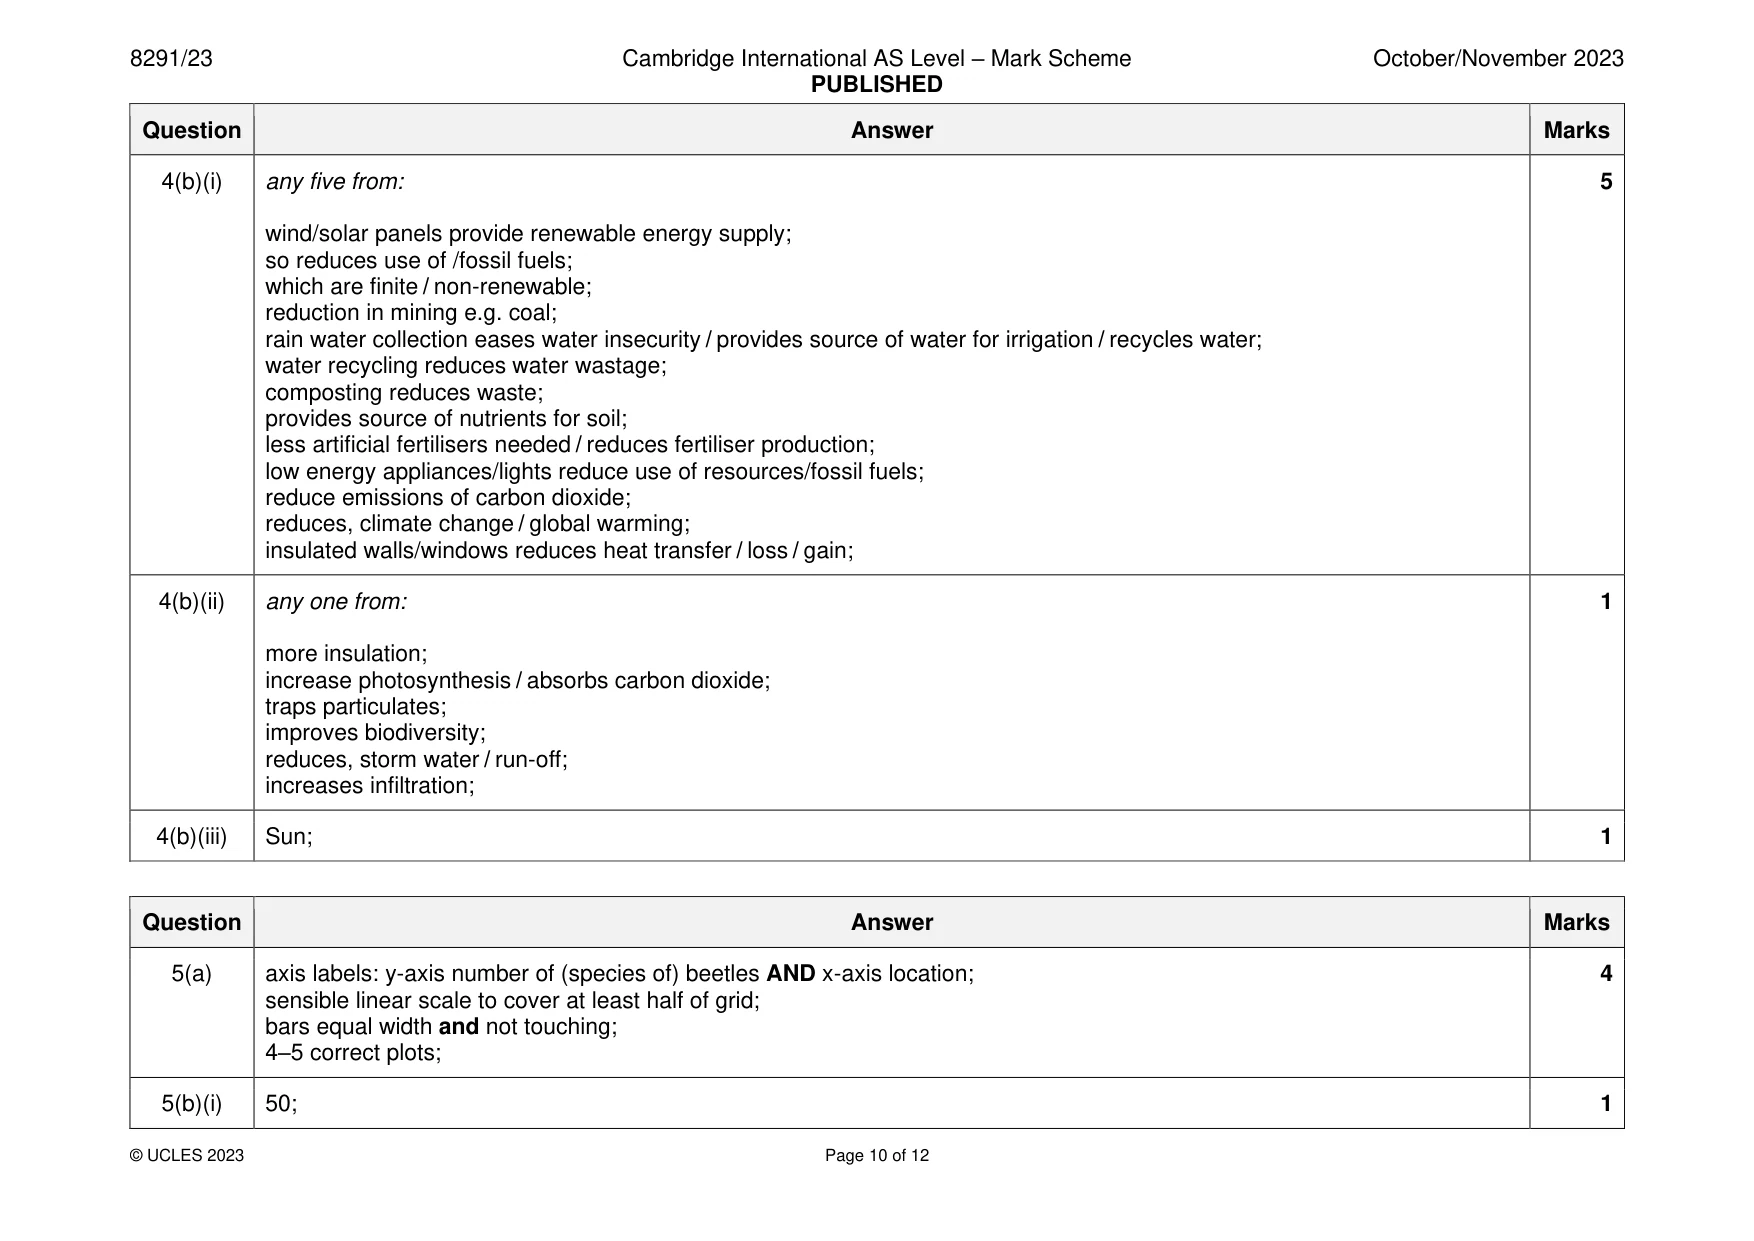
Mark scheme: 4(a)(i) reliable availability of energy (sources) / enough energy; 3 at an affordable price; with consideration of the environmental impacts; 4(a)(ii) any three from: 3 disrupted supply / power cuts / less workable hours; increasing prices for energy resources; increasing costs for industry; job losses or unemployment / recession or economy decreases / lower income; poverty / low standard of living; reliance on imported energy; civil disruption /conflict; 4(b)(i) any five from: 5 wind/solar panels provide renewable energy supply; so reduces use of /fossil fuels; which are finite / non-renewable; reduction in mining e.g. coal; rain water collection eases water insecurity / provides source of water for irrigation / recycles water; water recycling reduces water wastage; composting reduces waste; provides source of nutrients for soil; less artificial fertilisers needed / reduces fertiliser production; low energy appliances/lights reduce use of resources/fossil fuels; reduce emissions of carbon dioxide; reduces, climate change / global warming; insulated walls/windows reduces heat transfer / loss / gain; 4(b)(ii) any one from: 1 more insulation; increase photosynthesis / absorbs carbon dioxide; traps particulates; improves biodiversity; reduces, storm water / run-off; increases infiltration; 4(b)(iii) Sun; 1
Q5 · A conservationist investigates the population of beetles in five different locations in…
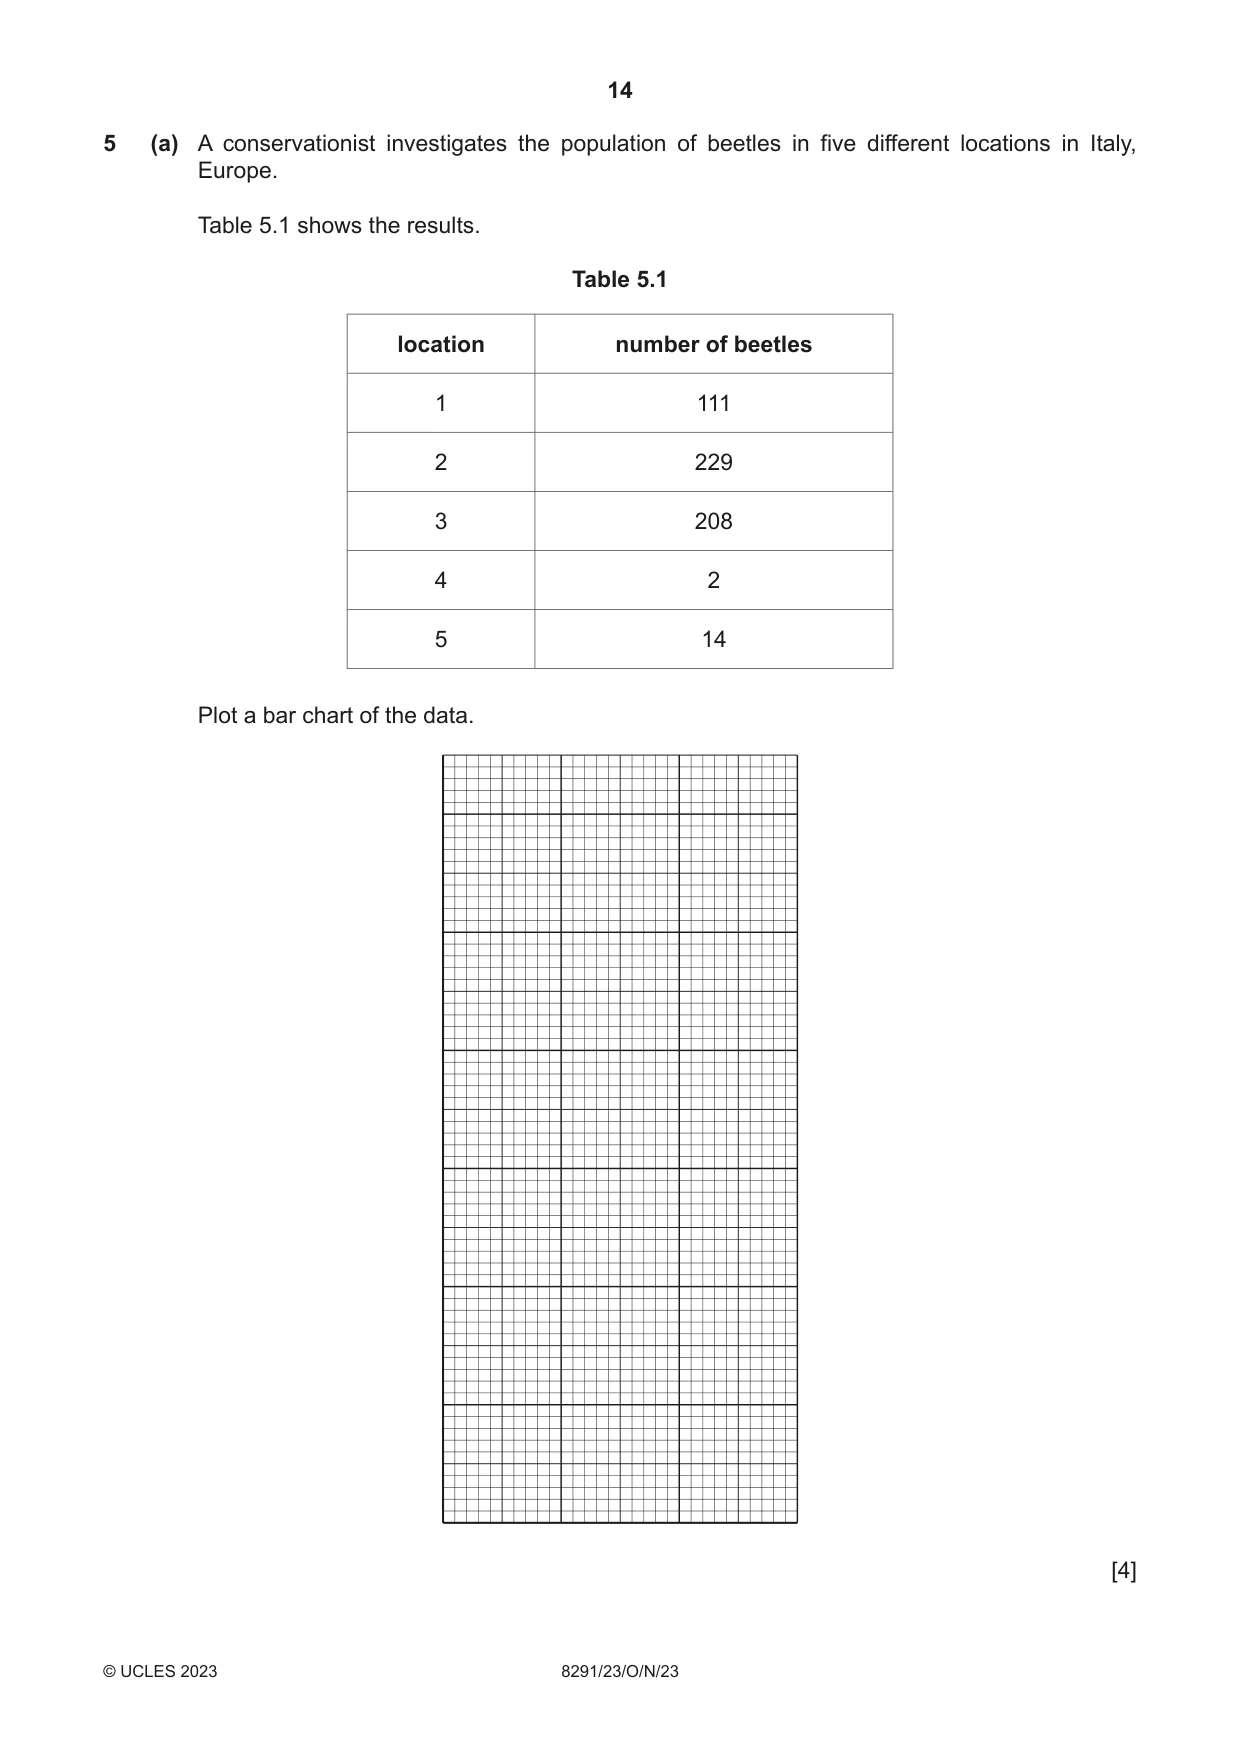
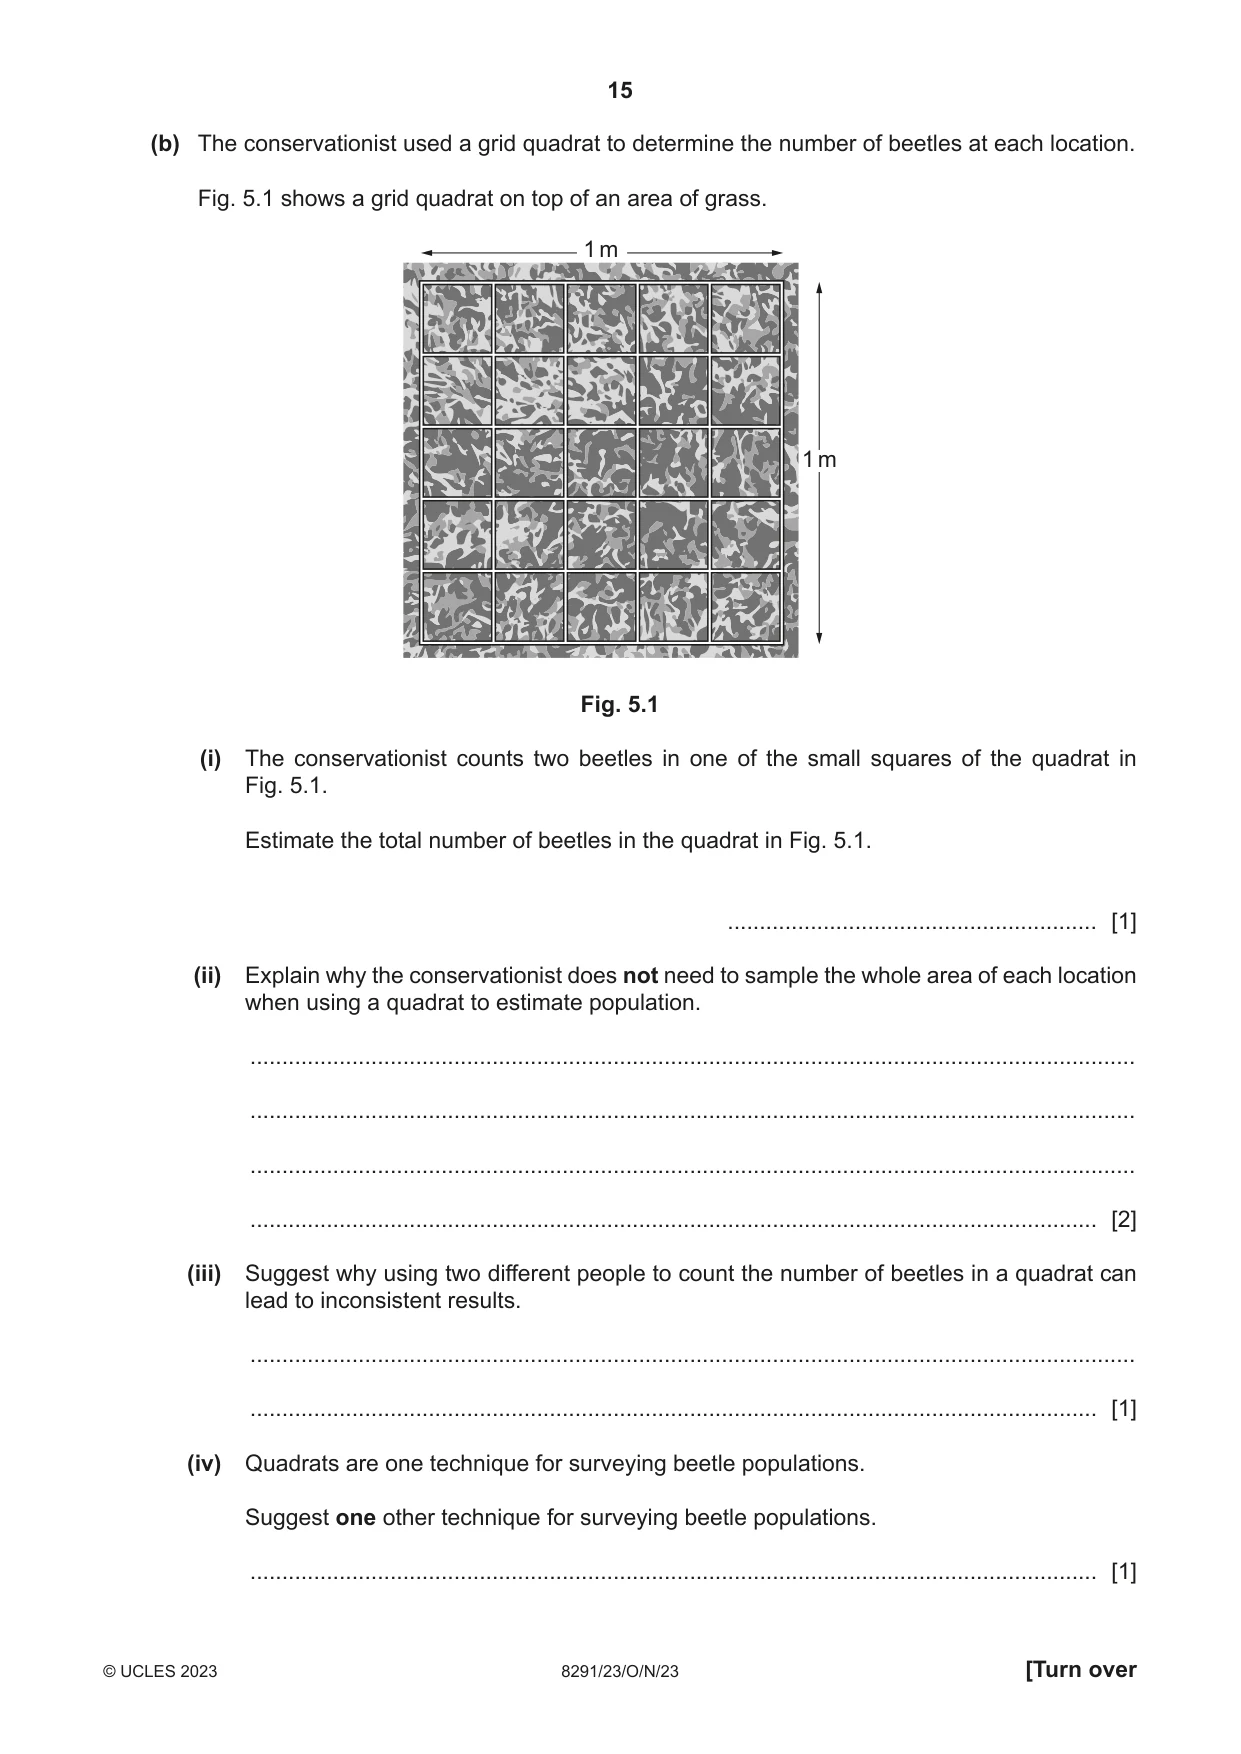
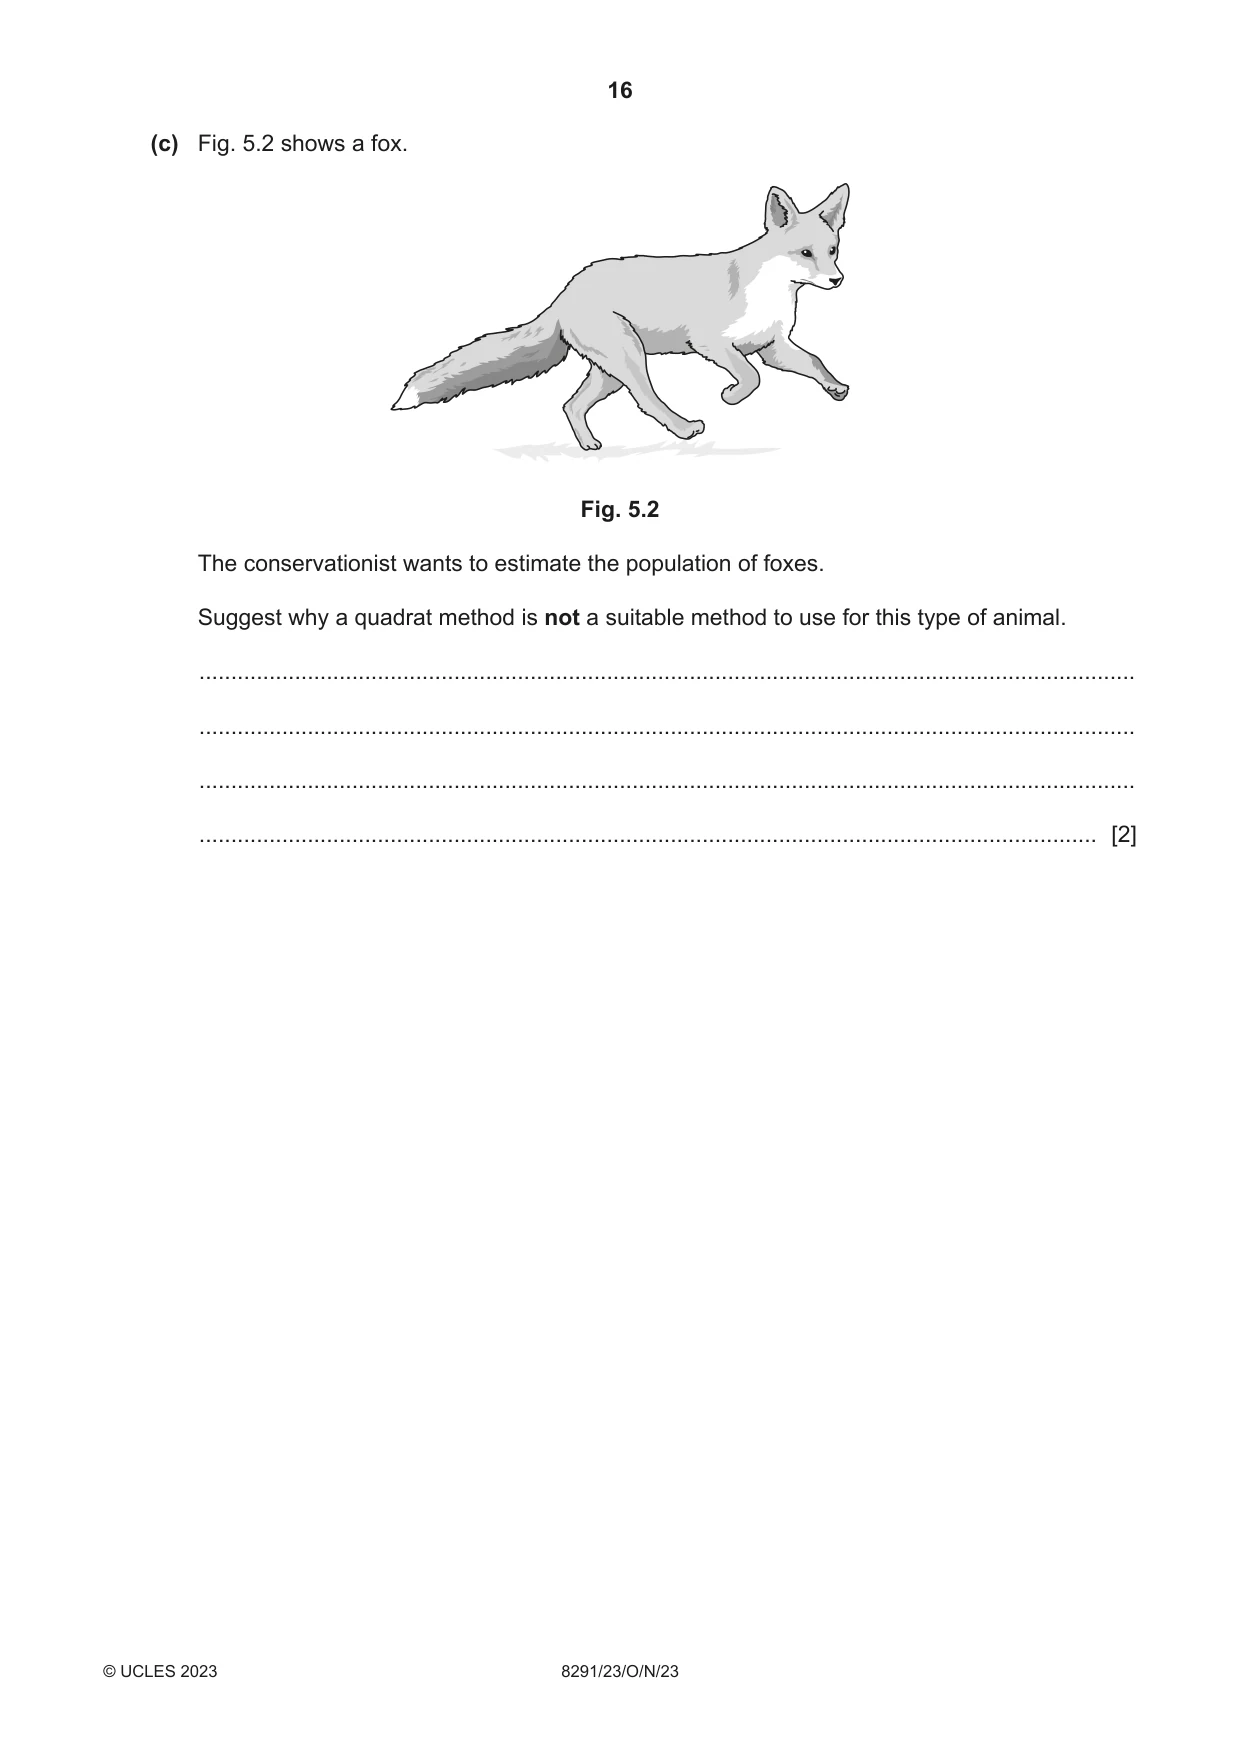
5 (a) A conservationist investigates the population of beetles in five different locations in Italy, Europe. Table 5.1 shows the results. Table 5.1 location number of beetles 1 111 2 229 3 208 4 2 5 14 Plot a bar chart of the data. [4] (b) The conservationist used a grid quadrat to determine the number of beetles at each location. Fig. 5.1 shows a grid quadrat on top of an area of grass. 1 m 1 m Fig. 5.1 (i) The conservationist counts two beetles in one of the small squares of the quadrat in Fig. 5.1. Estimate the total number of beetles in the quadrat in Fig. 5.1. .......................................................... [1] (ii) Explain why the conservationist does not need to sample the whole area of each location when using a quadrat to estimate population. ........................................................................................................................................... ........................................................................................................................................... ........................................................................................................................................... ..................................................................................................................................... [2] (iii) Suggest why using two different people to count the number of beetles in a quadrat can lead to inconsistent results. ........................................................................................................................................... ..................................................................................................................................... [1] (iv) Quadrats are one technique for surveying beetle populations. Suggest one other technique for surveying beetle populations. ..................................................................................................................................... [1] (c) Fig. 5.2 shows a fox. Fig. 5.2 The conservationist wants to estimate the population of foxes. Suggest why a quadrat method is not a suitable method to use for this type of animal. ................................................................................................................................................... ................................................................................................................................................... ................................................................................................................................................... ............................................................................................................................................. [2]
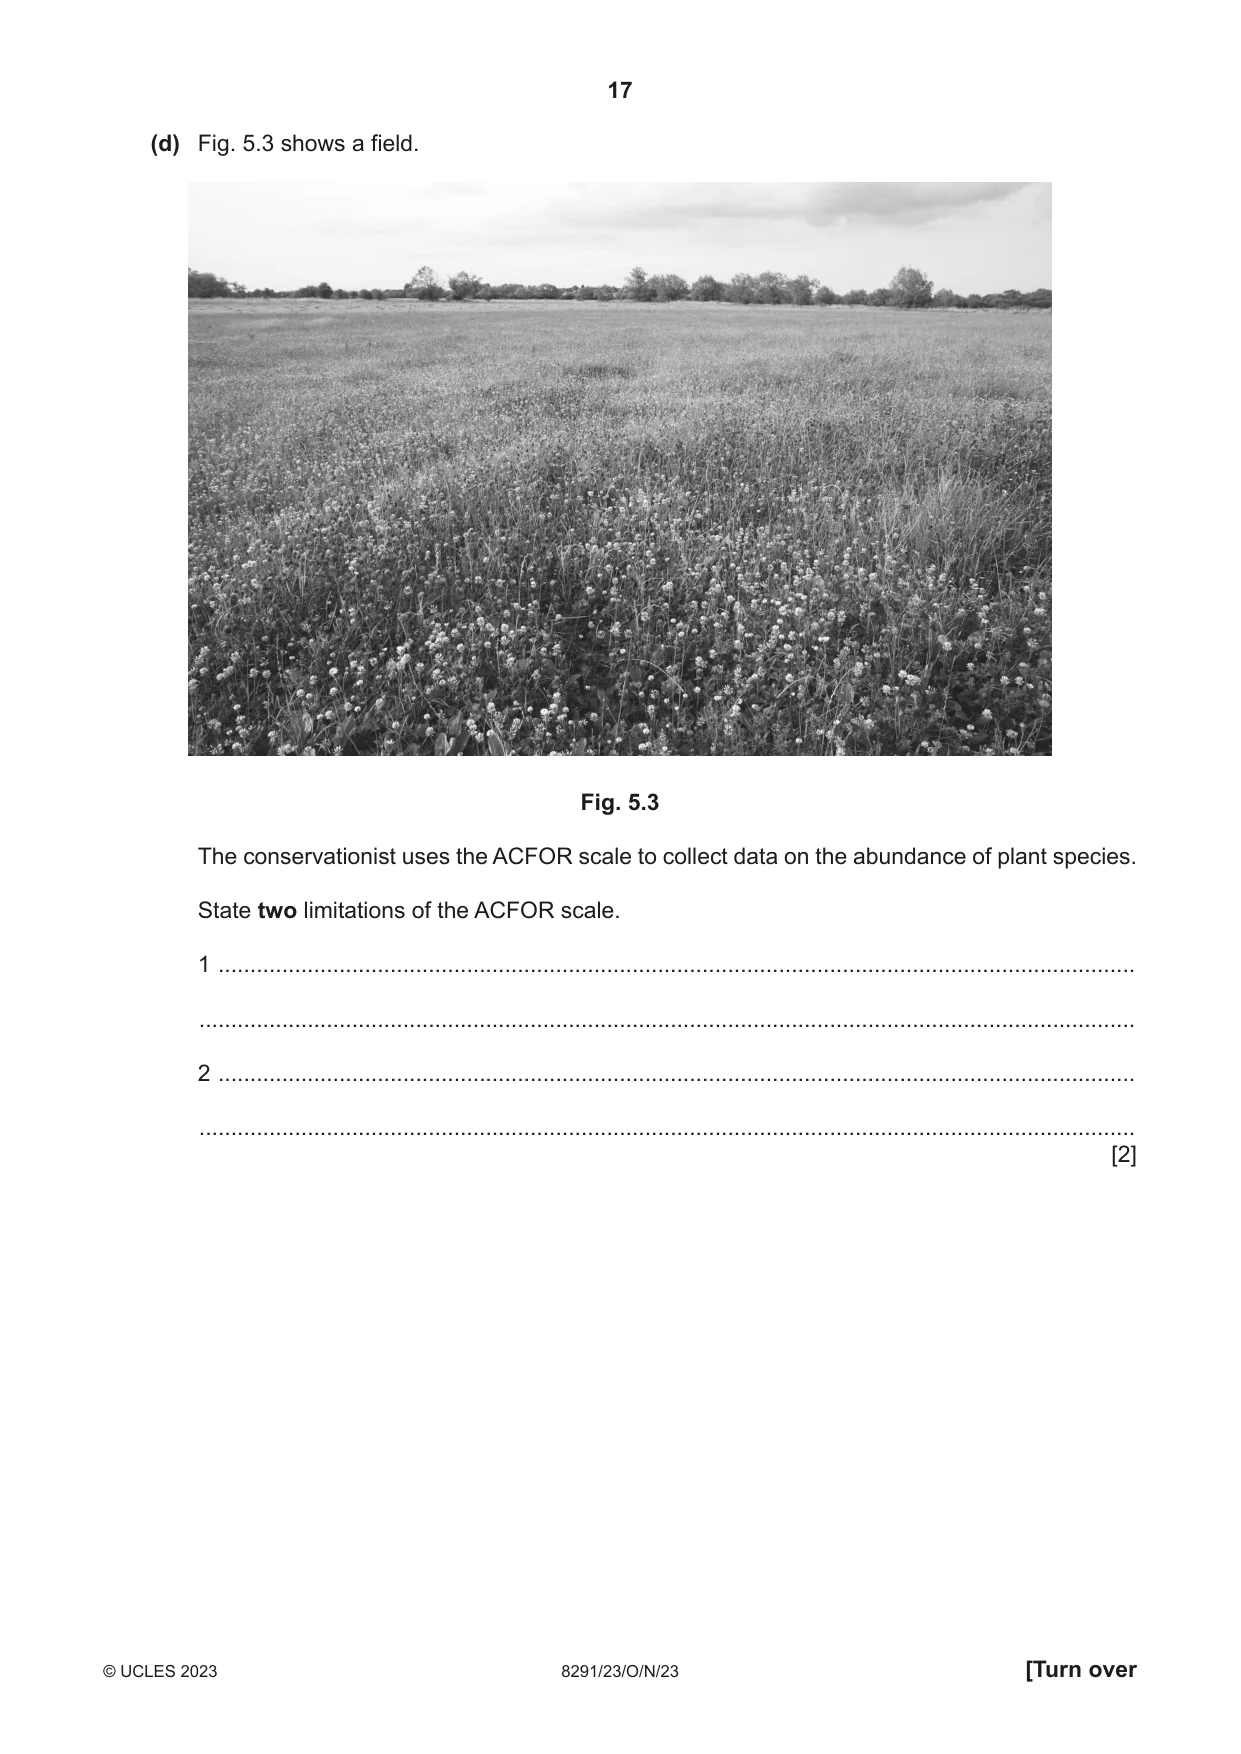
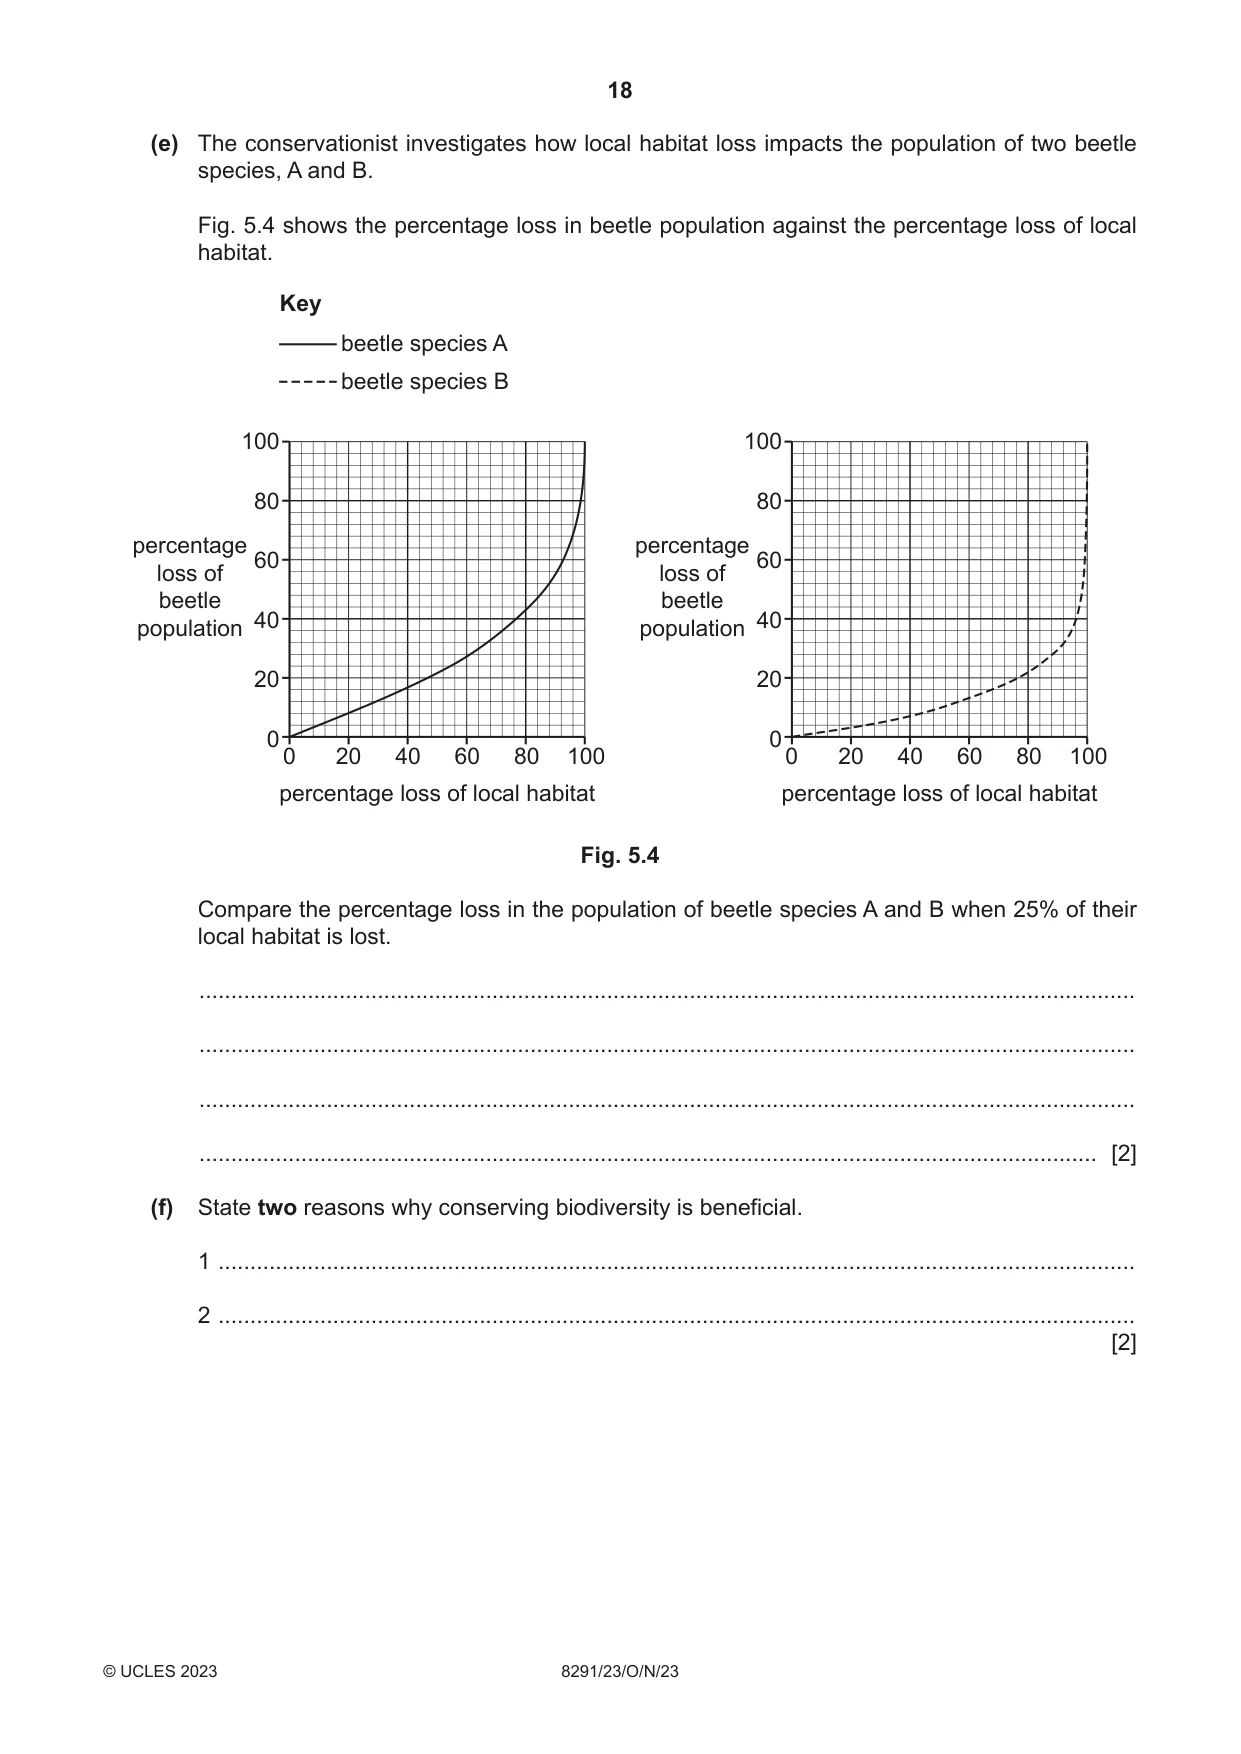
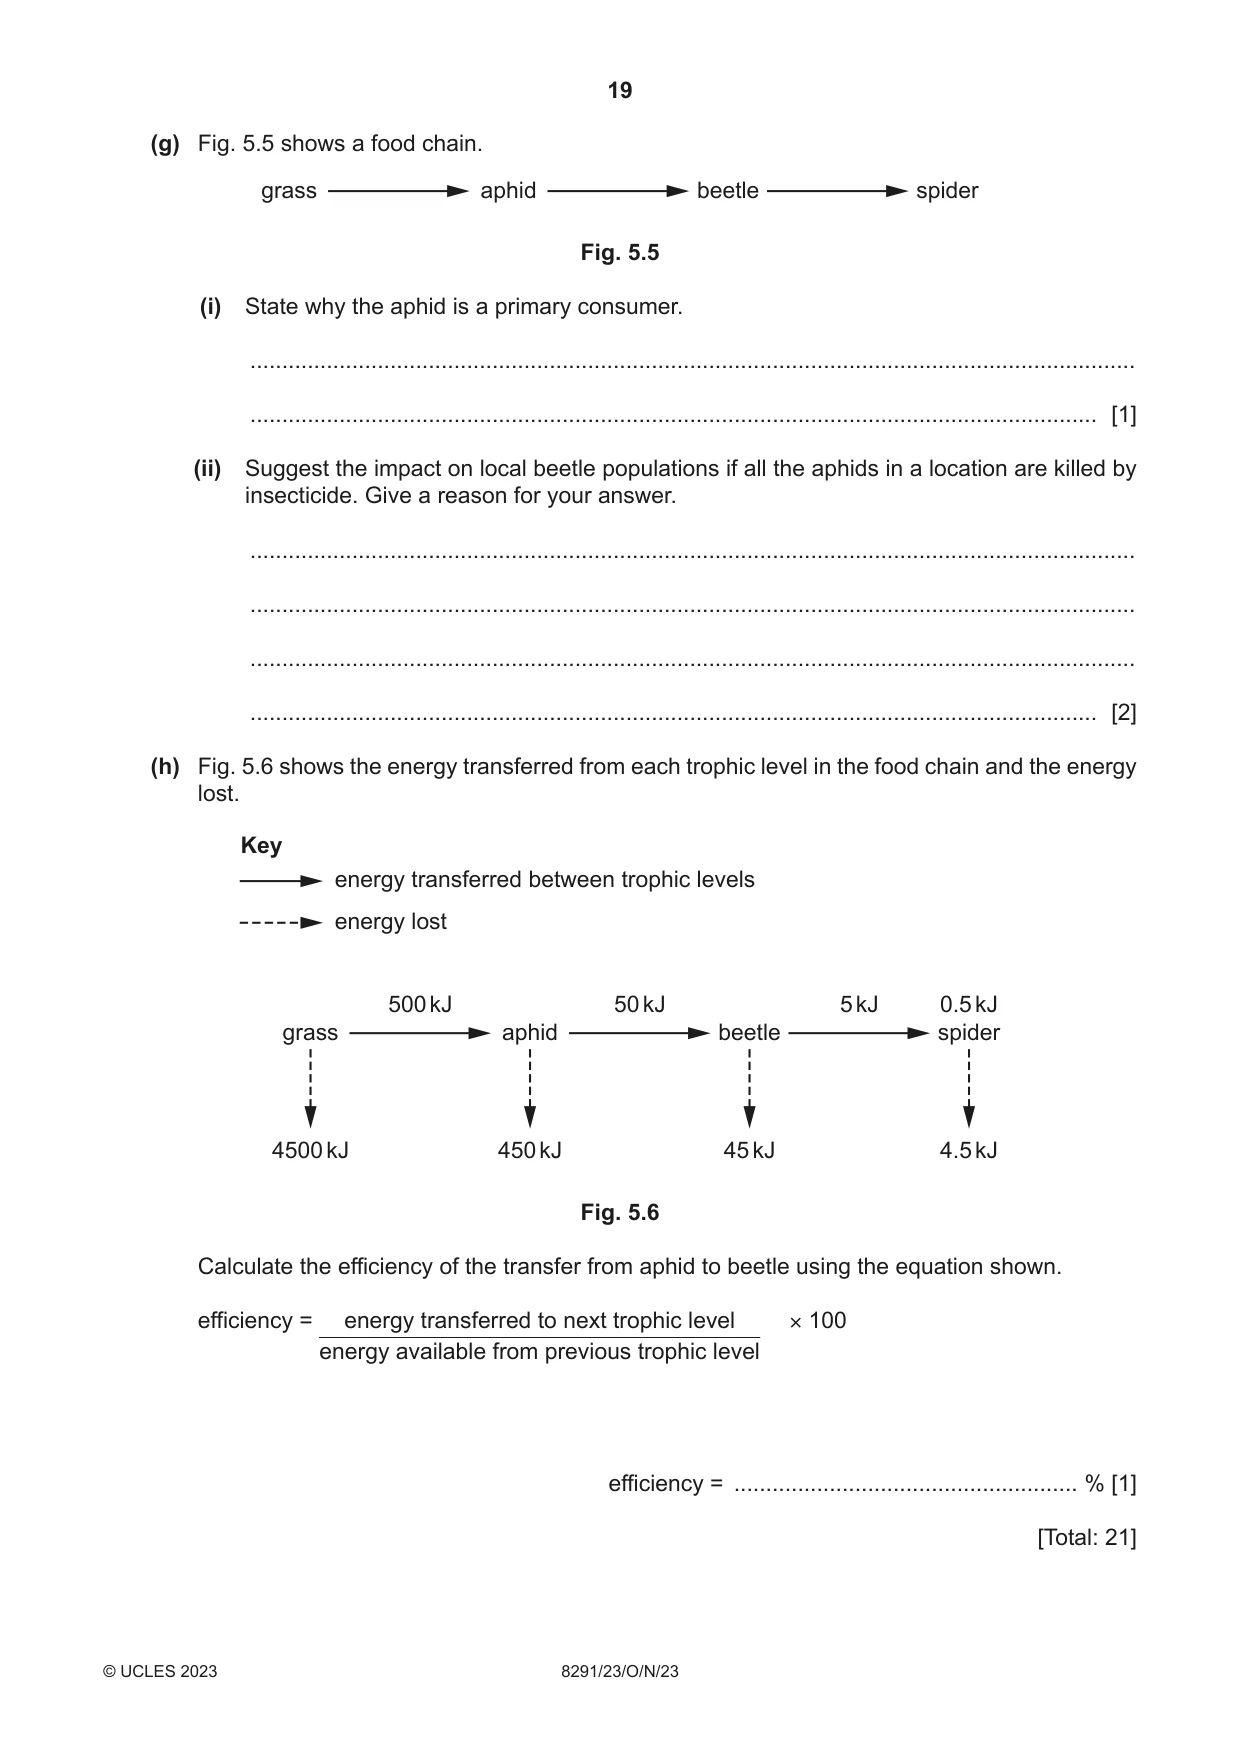
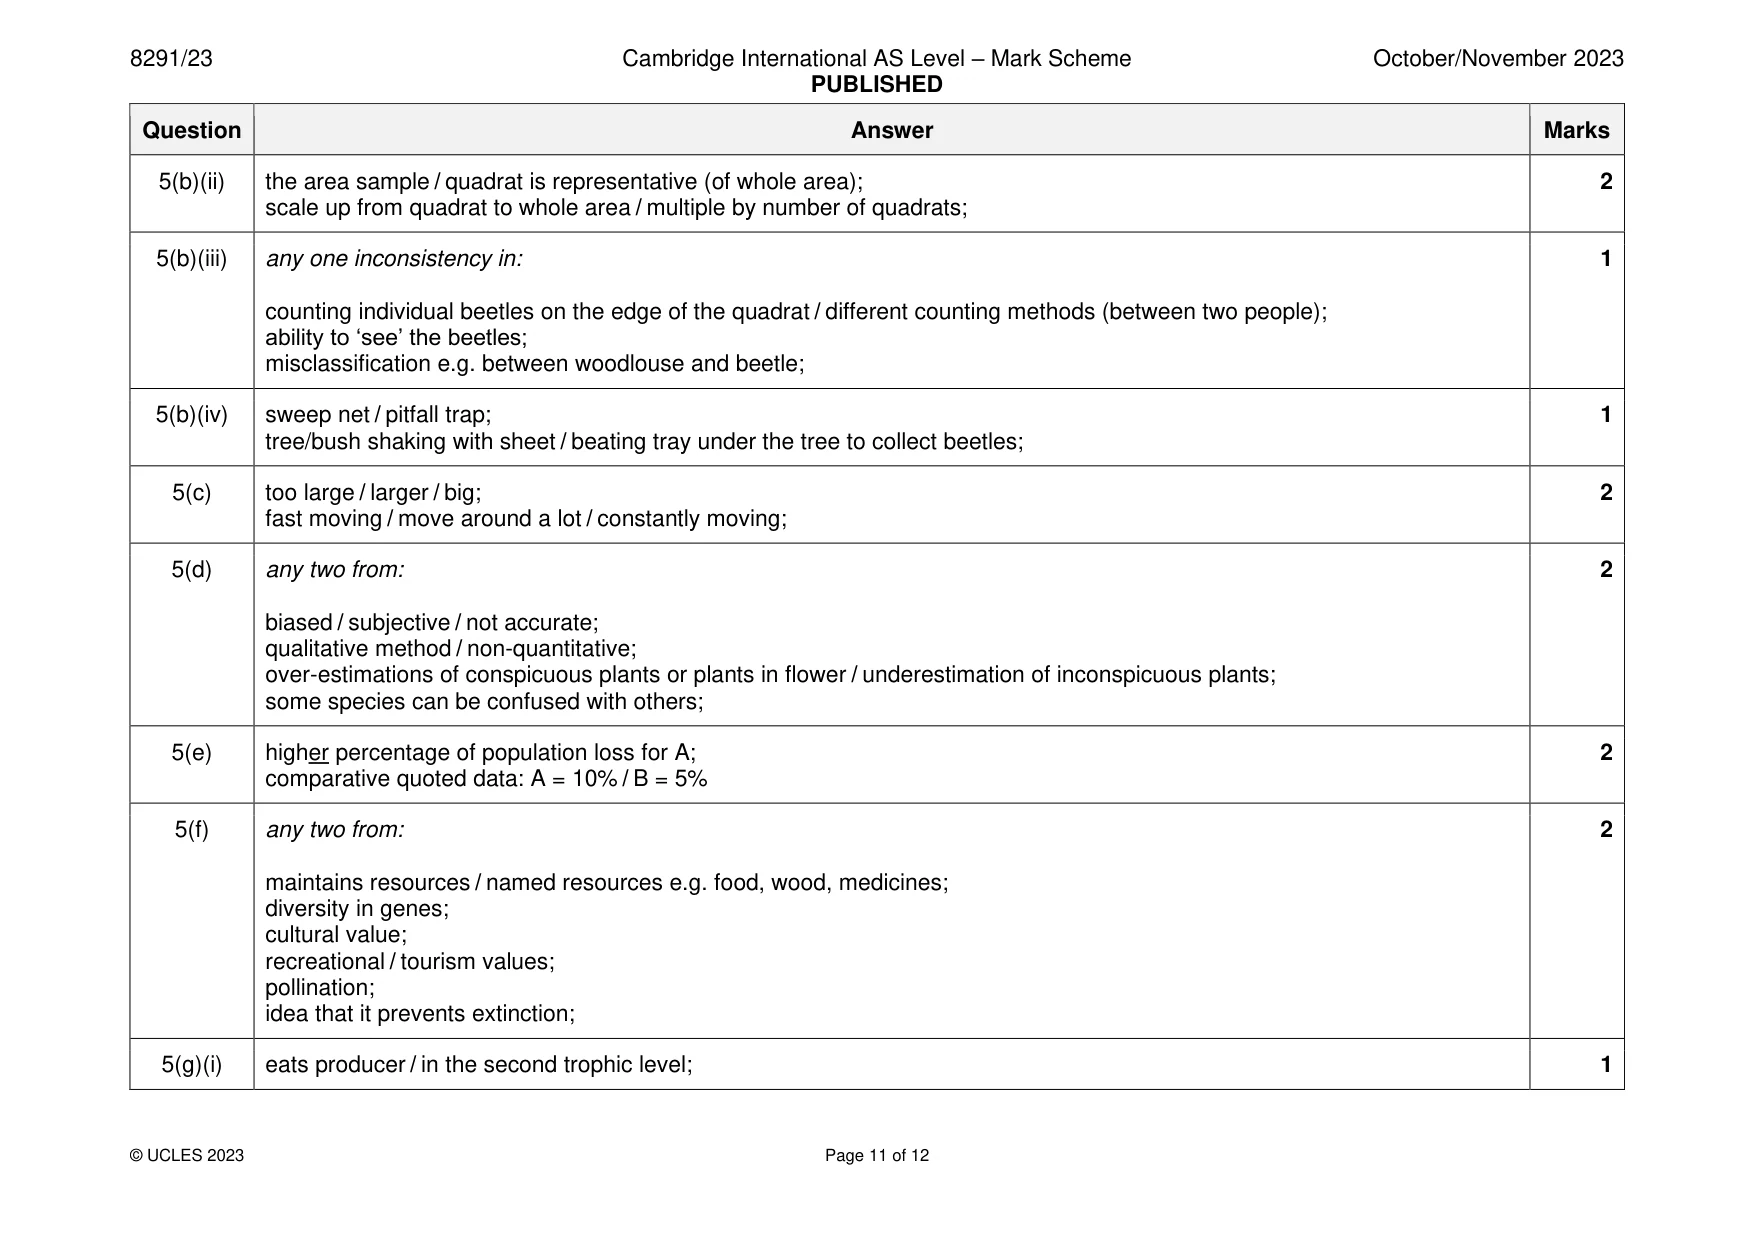
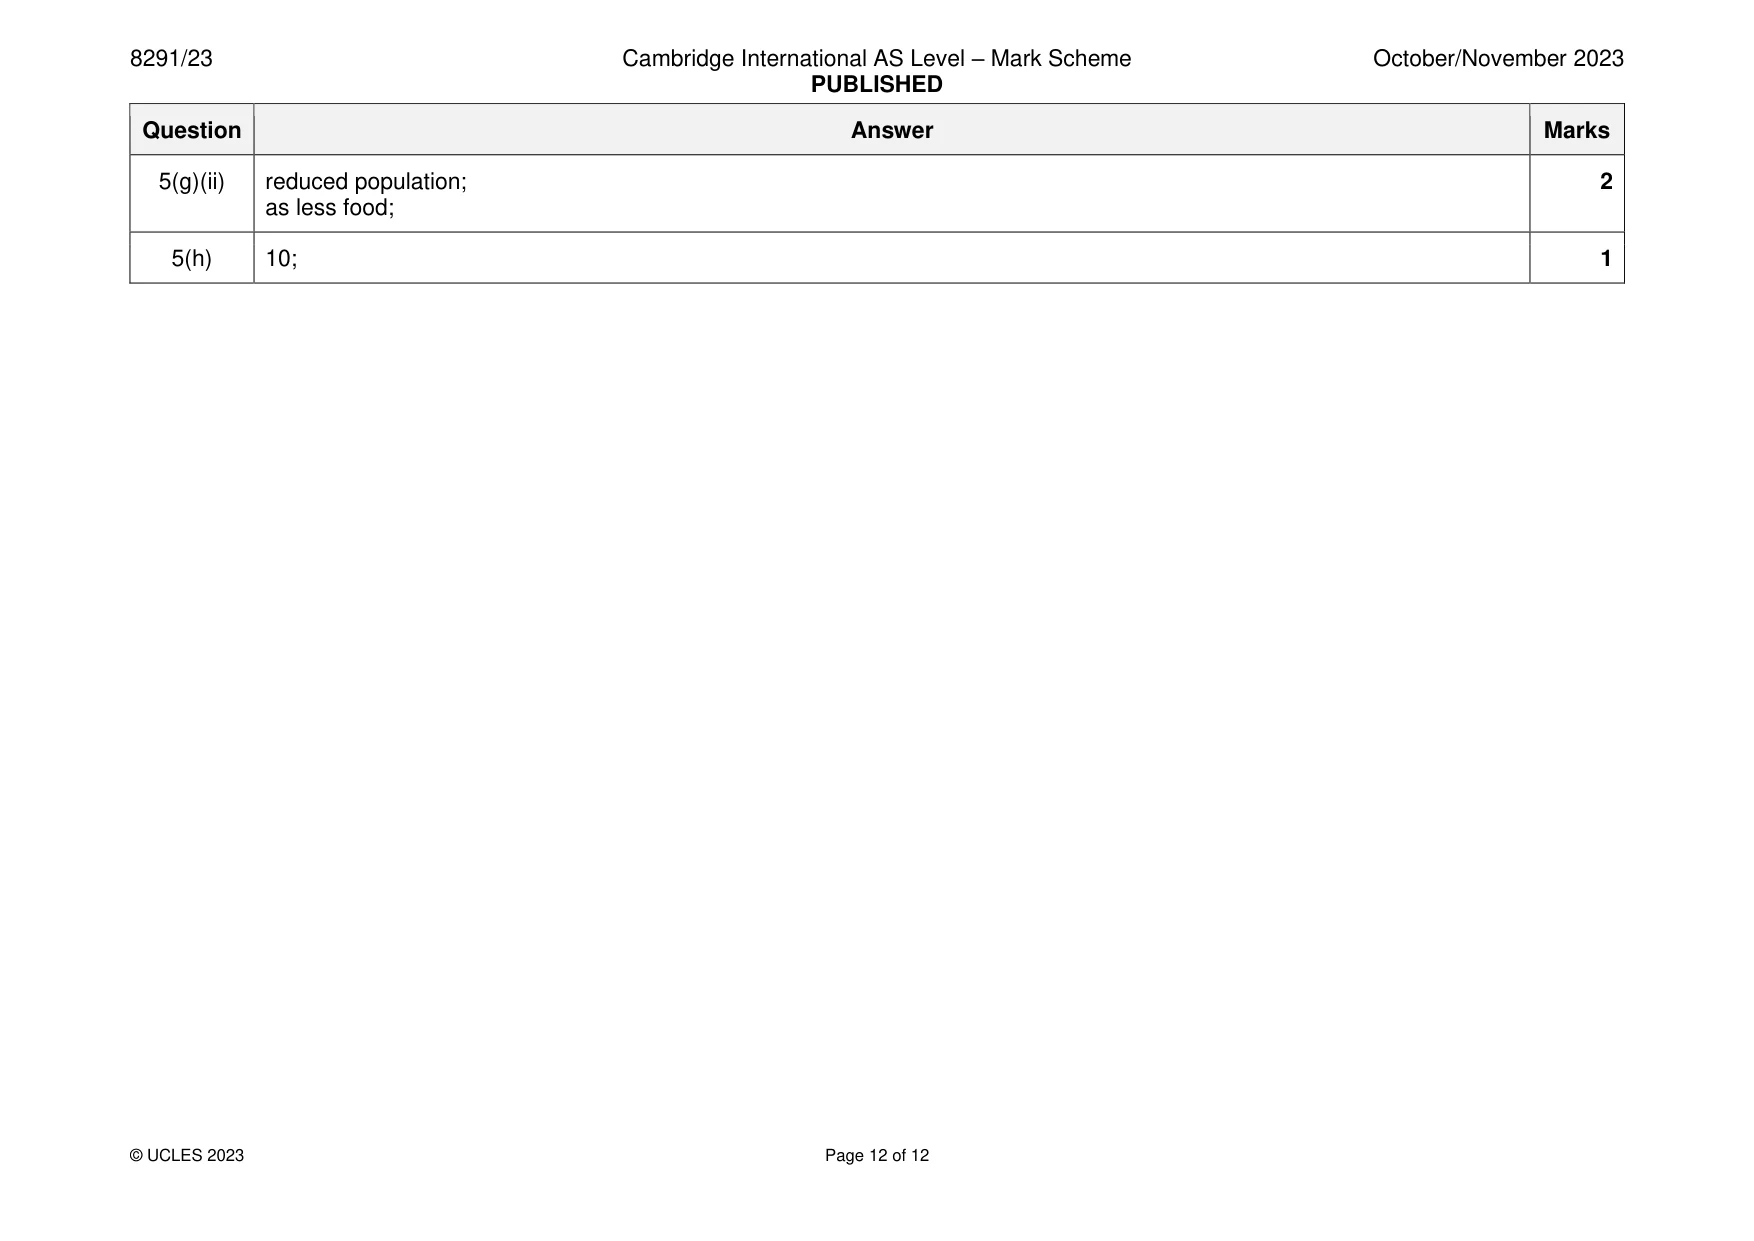
Mark scheme: 5(a) axis labels: y-axis number of (species of) beetles AND x-axis location; 4 sensible linear scale to cover at least half of grid; bars equal width and not touching; 4–5 correct plots; 5(b)(i) 50; 1 5(b)(ii) the area sample / quadrat is representative (of whole area); 2 scale up from quadrat to whole area / multiple by number of quadrats; 5(b)(iii) any one inconsistency in: 1 counting individual beetles on the edge of the quadrat / different counting methods (between two people); ability to ‘see’ the beetles; misclassification e.g. between woodlouse and beetle; 5(b)(iv) sweep net / pitfall trap; 1 tree/bush shaking with sheet / beating tray under the tree to collect beetles; 5(c) too large / larger / big; 2 fast moving / move around a lot / constantly moving; 5(d) any two from: 2 biased / subjective / not accurate; qualitative method / non-quantitative; over-estimations of conspicuous plants or plants in flower / underestimation of inconspicuous plants; some species can be confused with others; 5(e) higher percentage of population loss for A; 2 comparative quoted data: A = 10% / B = 5% 5(f) any two from: 2 maintains resources / named resources e.g. food, wood, medicines; diversity in genes; cultural value; recreational / tourism values; pollination; idea that it prevents extinction; 5(g)(i) eats producer / in the second trophic level; 1 5(g)(ii) reduced population; 2 as less food; 5(h) 10; 1
More questions on Data collection techniques and data analysis
What was in this paper
The subtopics covered by these 5 questions, and how many questions each got. Open one in a new tab to see every Cambridge question on it.
What you needed in this session
Cambridge’s own grade thresholds for 2023 Oct/Nov, Paper 2 · Variant 3. A higher threshold means an easier paper — the bar moves with how the cohort did.