Cambridge A Level Environmental Management (AS only) 8291 — 2023 May/June Paper 2 · Variant 1
8291/21/M/J/23 · 4 questions · 80 marks · ≈90 min
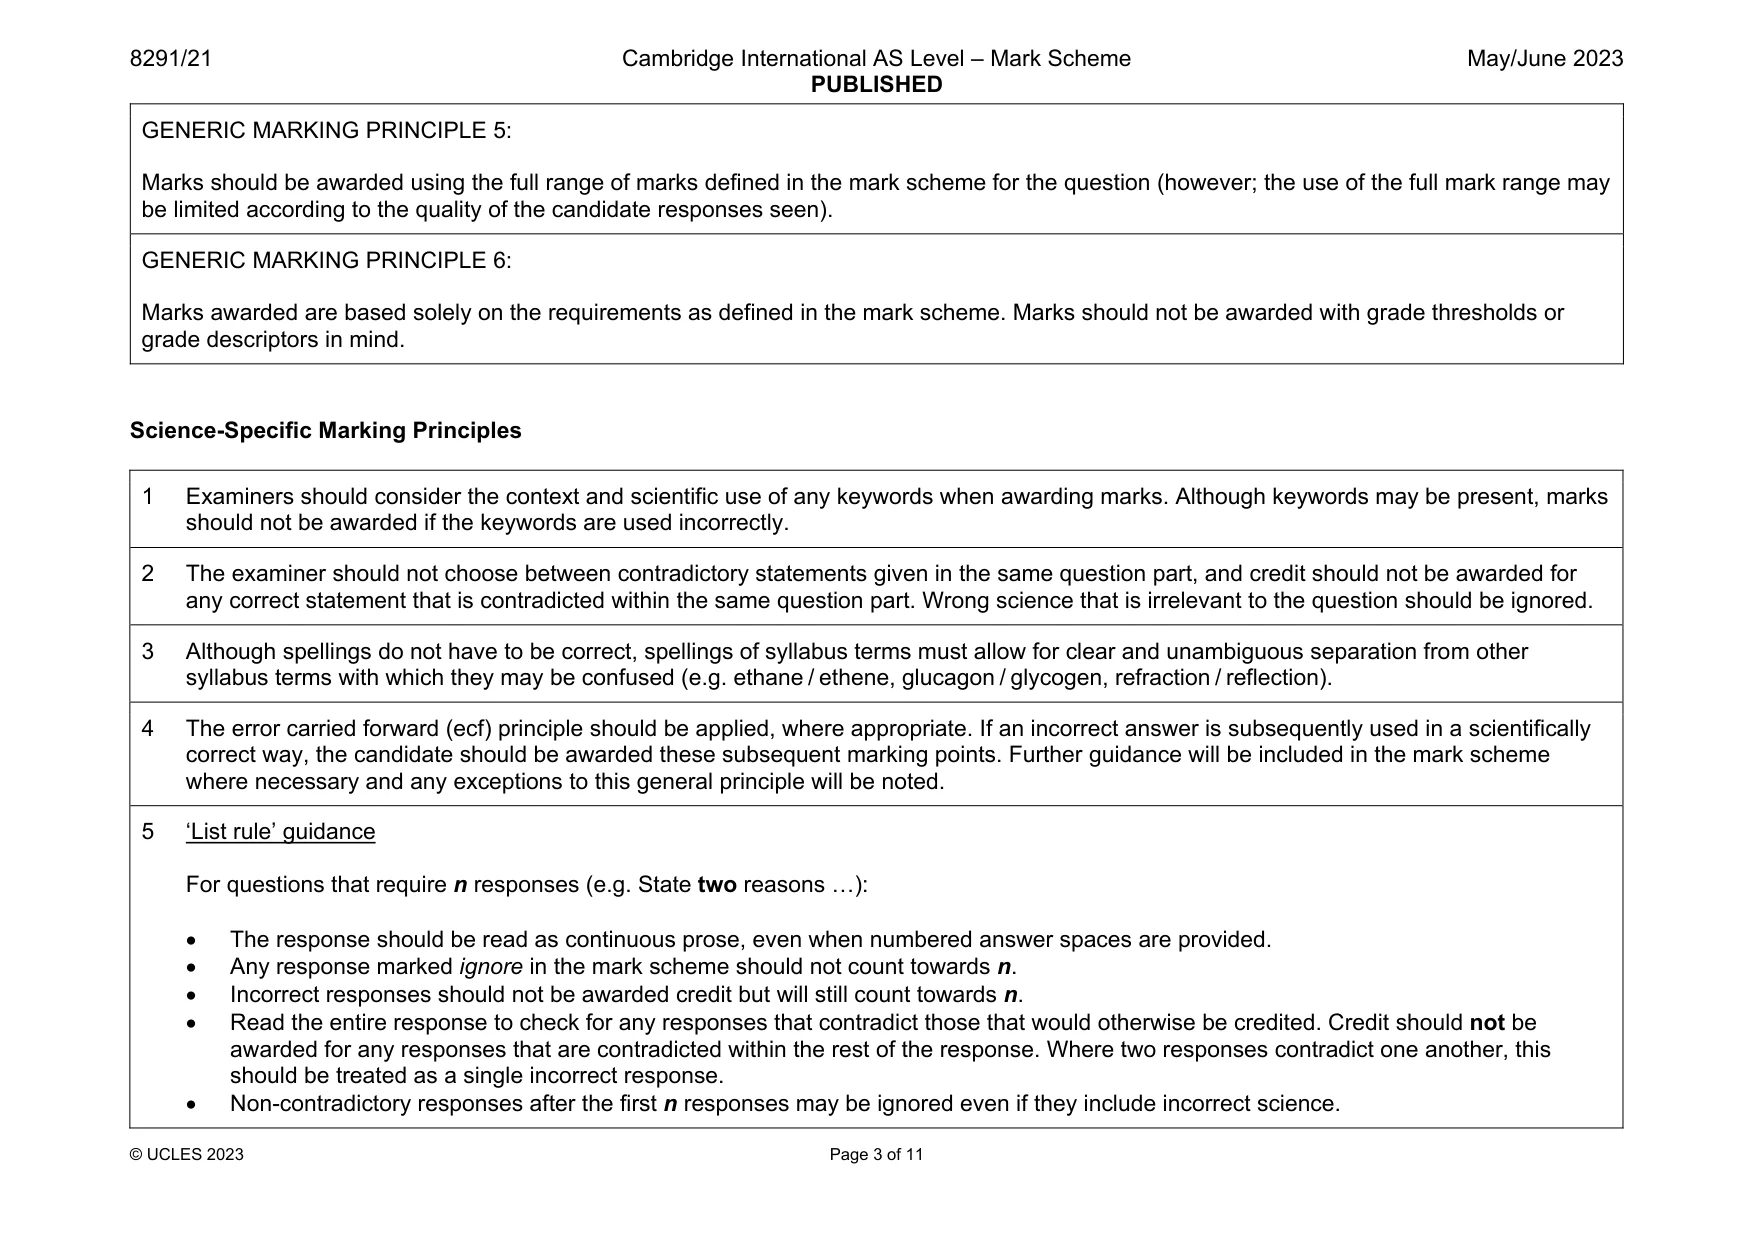
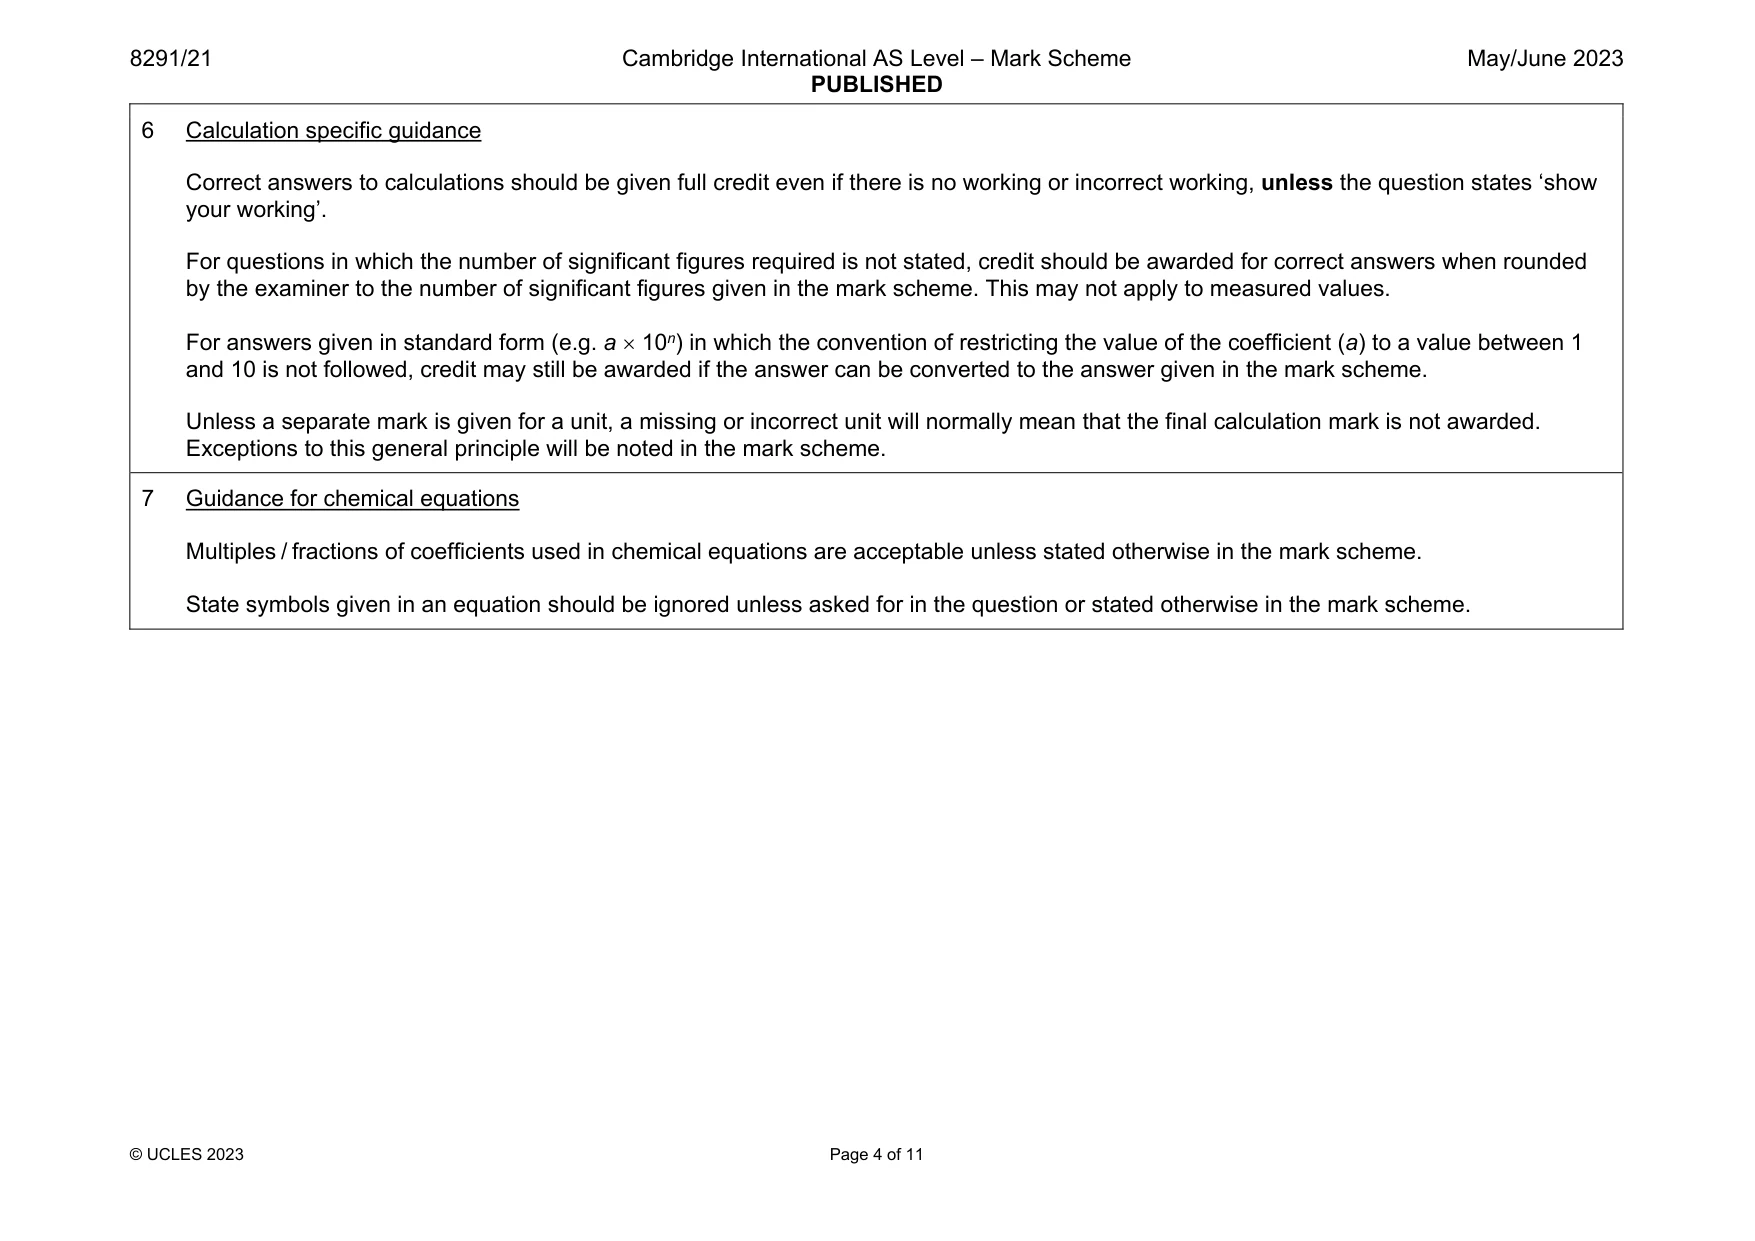
The question paper and its mark scheme, free to read here and free to download. This is Cambridge’s own paper, exactly as it was sat.
Question paper16 pages
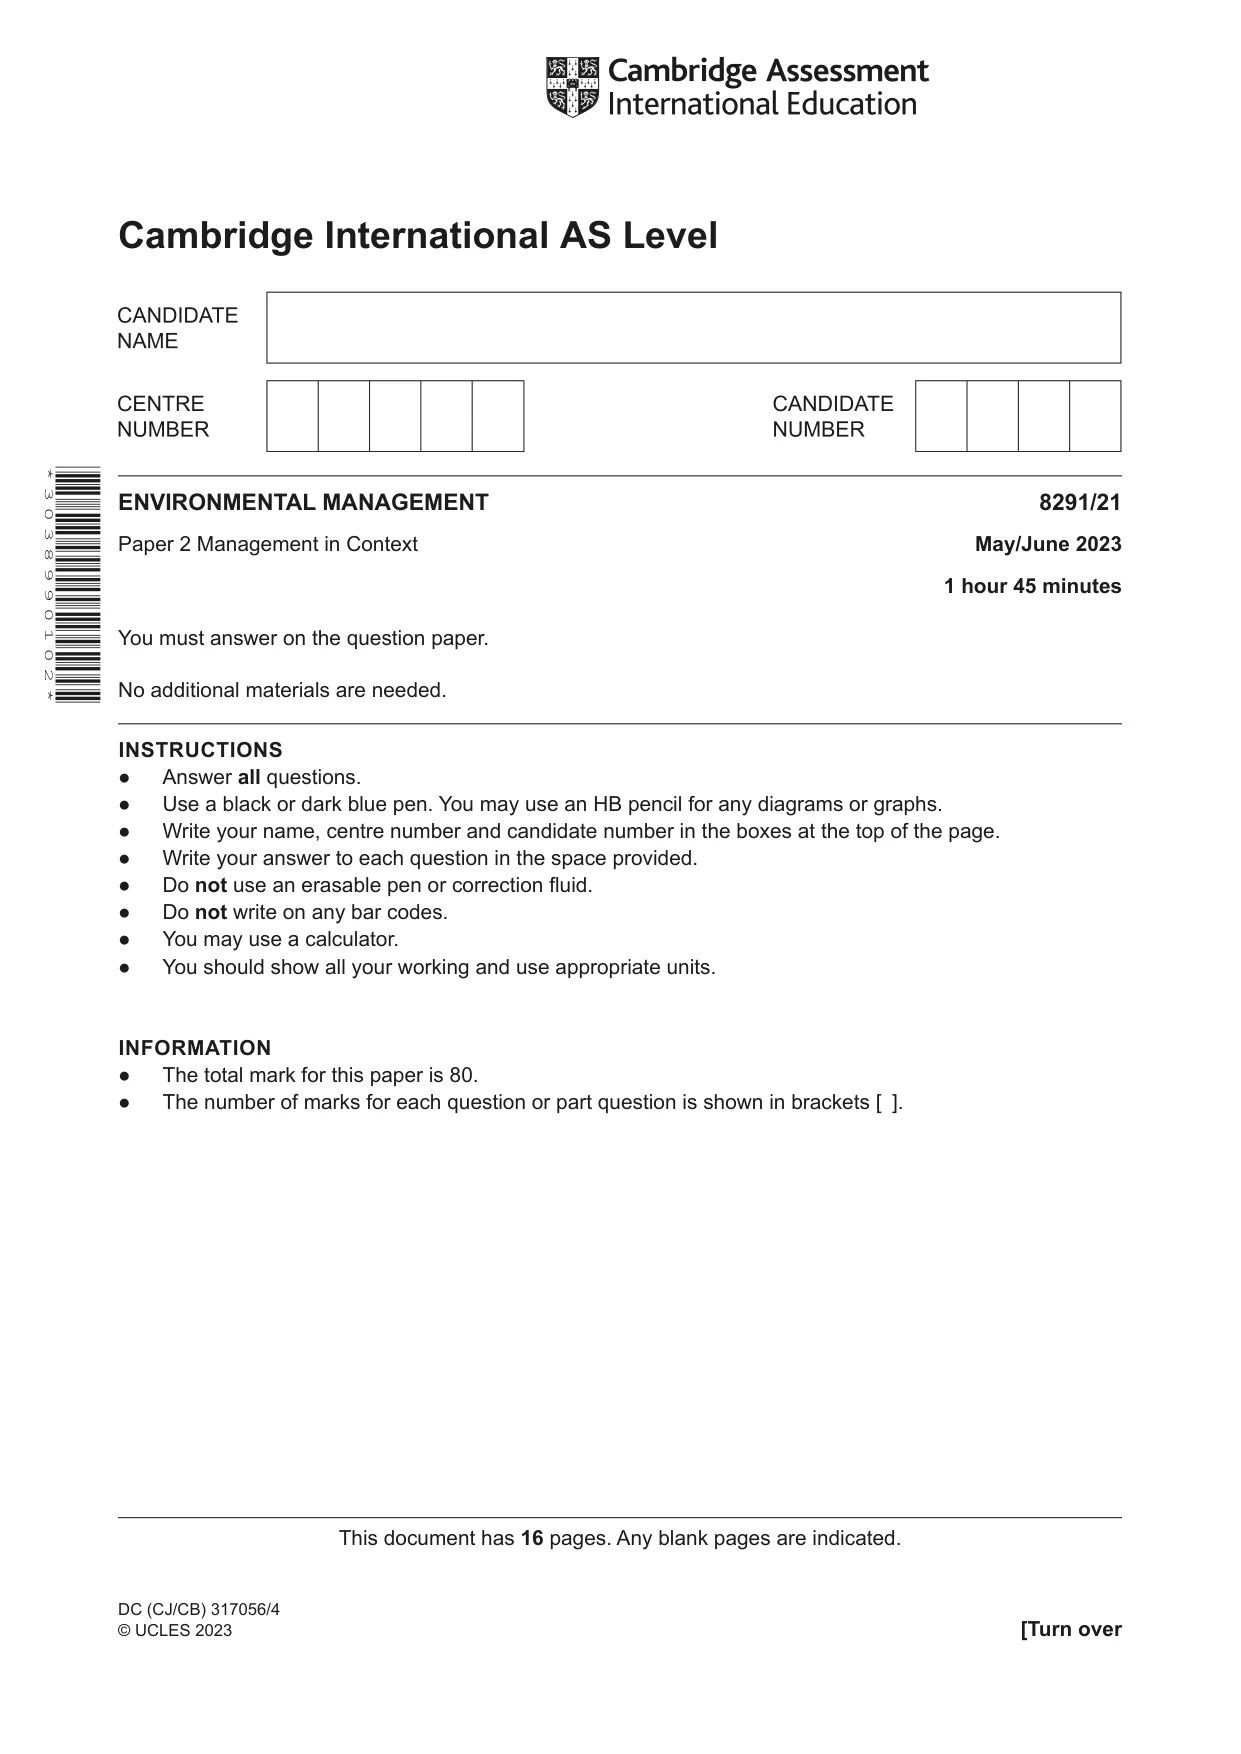
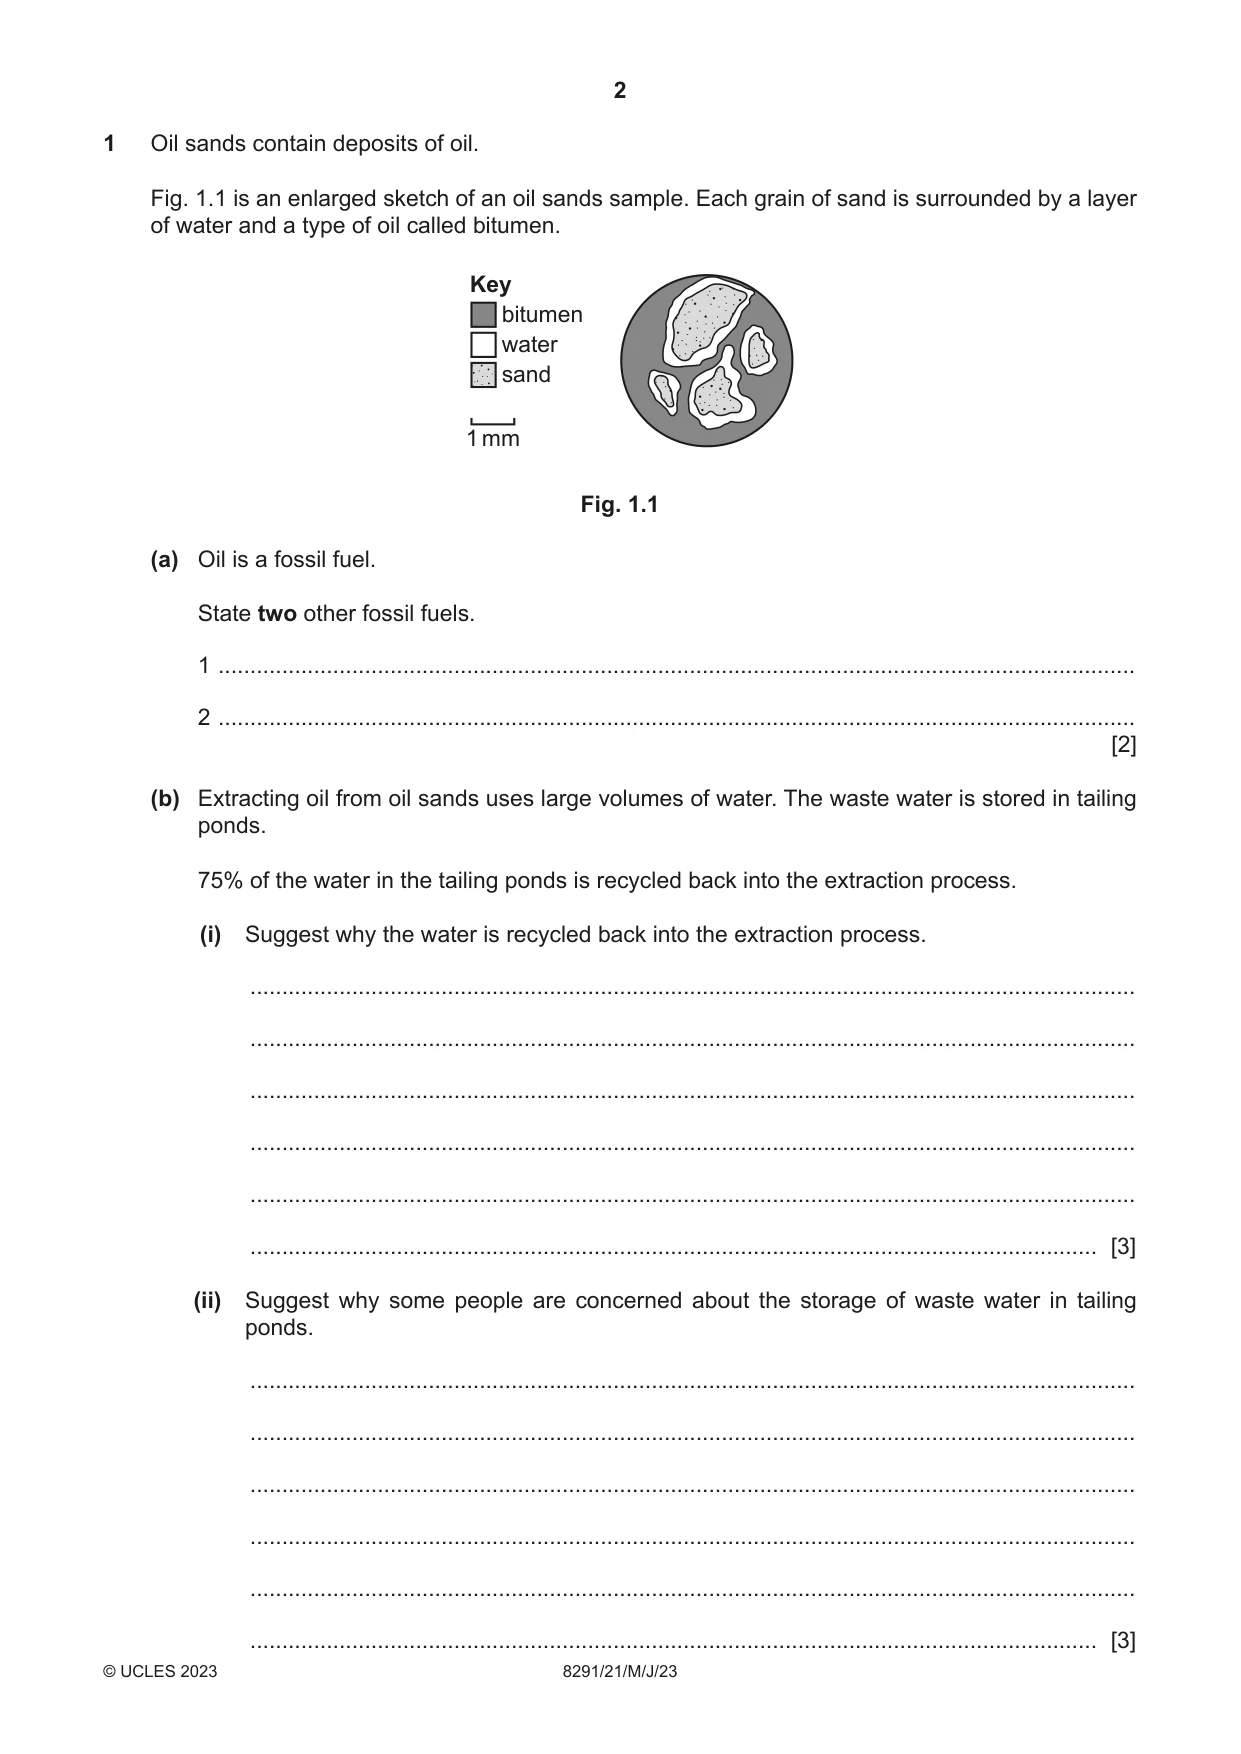
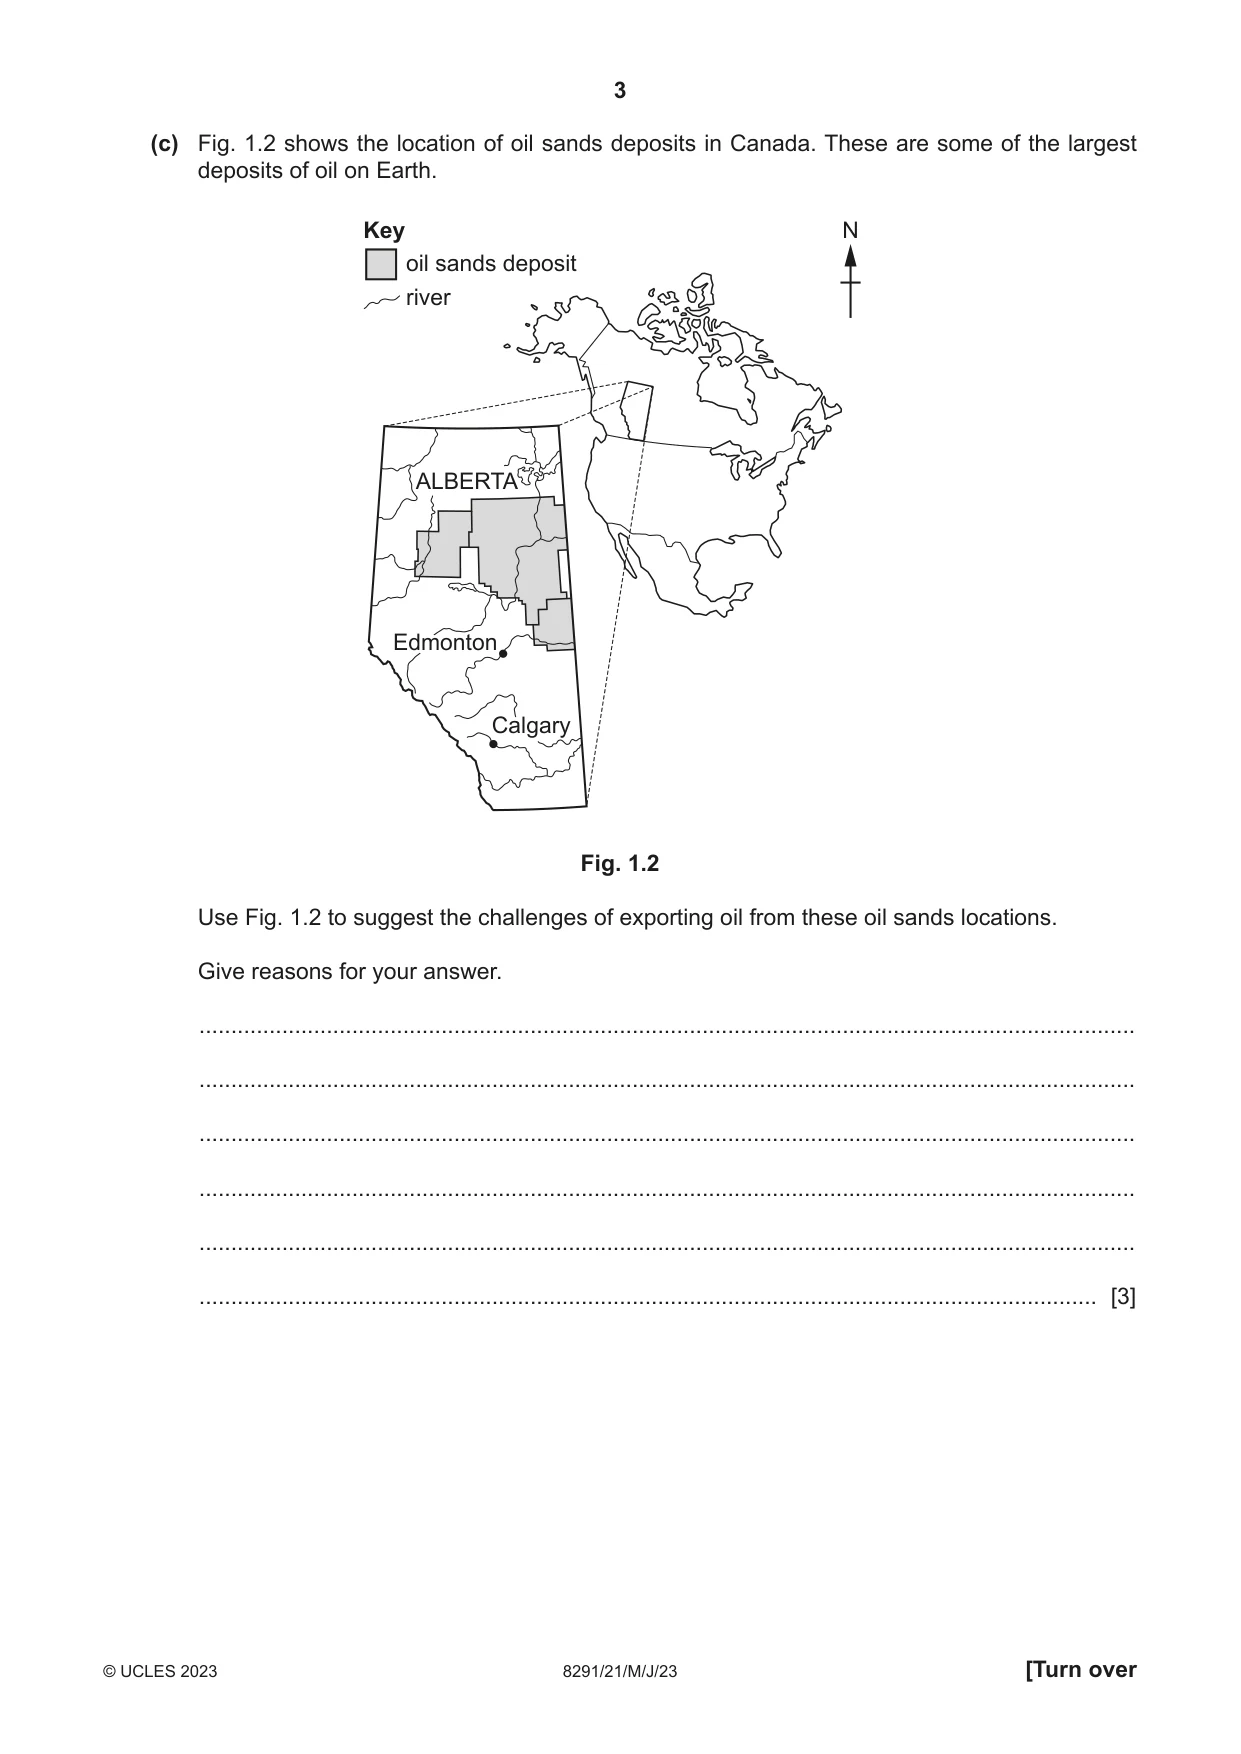
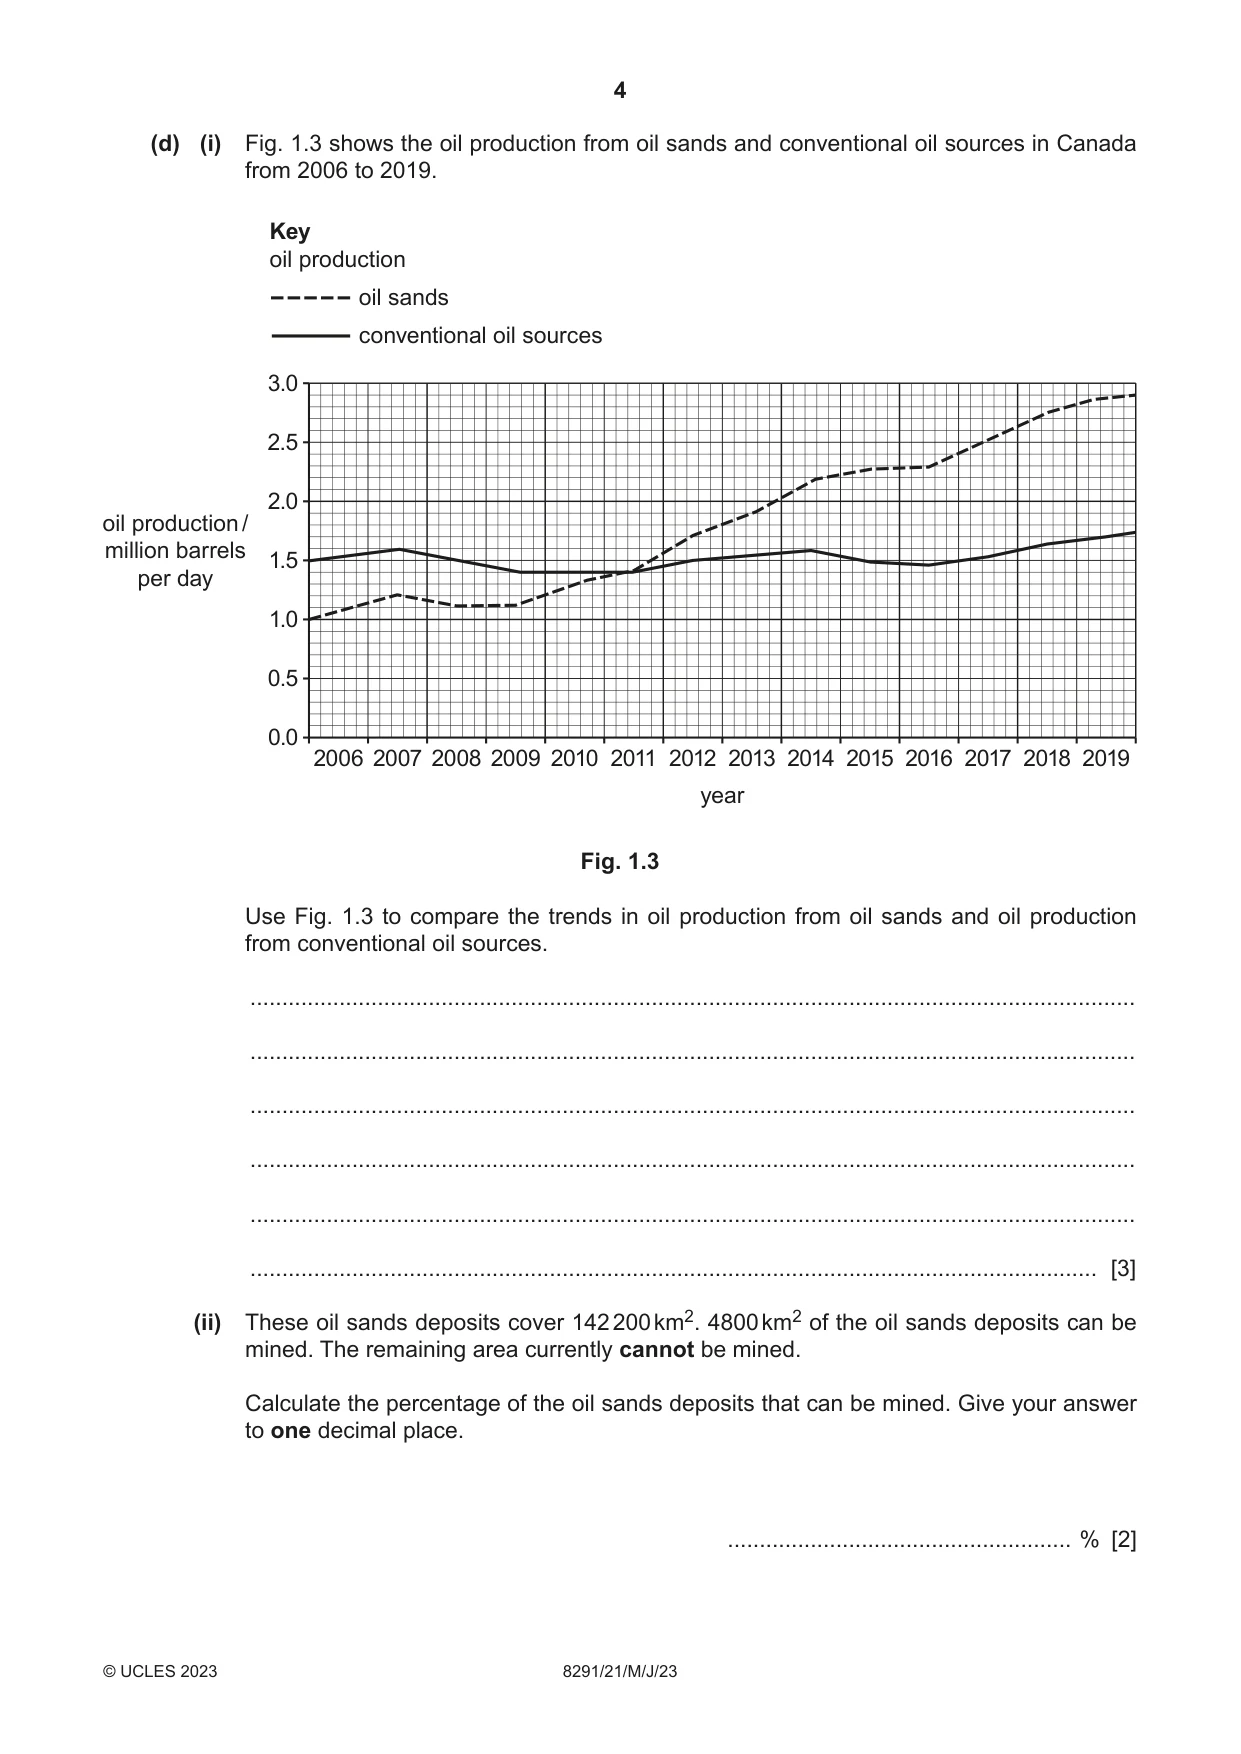


Mark scheme11 pages
Answers below. Sit the paper first if you are practising.
Questions as text
Q1 · Oil sands contain deposits of oil
1 Oil sands contain deposits of oil. Fig. 1.1 is an enlarged sketch of an oil sands sample. Each grain of sand is surrounded by a layer of water and a type of oil called bitumen. Key bitumen water sand 1 mm Fig. 1.1 (a) Oil is a fossil fuel. State two other fossil fuels. 1 ................................................................................................................................................ 2 ................................................................................................................................................ [2] (b) Extracting oil from oil sands uses large volumes of water. The waste water is stored in tailing ponds. 75% of the water in the tailing ponds is recycled back into the extraction process. (i) Suggest why the water is recycled back into the extraction process. ........................................................................................................................................... ........................................................................................................................................... ........................................................................................................................................... ........................................................................................................................................... ........................................................................................................................................... ..................................................................................................................................... [3] (ii) Suggest why some people are concerned about the storage of waste water in tailing ponds. ........................................................................................................................................... ........................................................................................................................................... ........................................................................................................................................... ........................................................................................................................................... ........................................................................................................................................... ..................................................................................................................................... [3] (c) Fig. 1.2 shows the location of oil sands deposits in Canada. These are some of the largest deposits of oil on Earth. Key N oil sands deposit river ALBERTA Edmonton Calgary Fig. 1.2 Use Fig. 1.2 to suggest the challenges of exporting oil from these oil sands locations. Give reasons for your answer. ................................................................................................................................................... ................................................................................................................................................... ................................................................................................................................................... ................................................................................................................................................... ................................................................................................................................................... ............................................................................................................................................. [3] (d) (i) Fig. 1.3 shows the oil production from oil sands and conventional oil sources in Canada from 2006 to 2019. Key oil production oil sands conventional oil sources 3.0 2.5 2.0 oil production / million barrels 1.5 per day 1.0 0.5 0.0 2006 2007 2008 2009 2010 2011 2012 2013 2014 2015 2016 2017 2018 2019 year Fig. 1.3 Use Fig. 1.3 to compare the trends in oil production from oil sands and oil production from conventional oil sources. ........................................................................................................................................... ........................................................................................................................................... ........................................................................................................................................... ........................................................................................................................................... ........................................................................................................................................... ..................................................................................................................................... [3] (ii) These oil sands deposits cover 142 200 km2. 4800 km2 of the oil sands deposits can be mined. The remaining area currently cannot be mined. Calculate the percentage of the oil sands deposits that can be mined. Give your answer to one decimal place. ...................................................... % [2] (iii) Explain how a reliance on fossil fuels, such as oil, can lead to energy insecurity. ........................................................................................................................................... ........................................................................................................................................... ........................................................................................................................................... ..................................................................................................................................... [2] (e) A report stated that from 2000 to 2018 the emission rate of greenhouse gases in Canada from oil sands extraction decreased by 36%. These emissions account for 12% of Canada’s total greenhouse gas emissions. (i) Explain why greenhouse gas emissions are a concern. ........................................................................................................................................... ........................................................................................................................................... ........................................................................................................................................... ........................................................................................................................................... ........................................................................................................................................... ..................................................................................................................................... [3] (ii) Canada was one of the countries that signed the Paris Agreement in 2016. Explain why international agreements help to control greenhouse gas emissions. ........................................................................................................................................... ........................................................................................................................................... ........................................................................................................................................... ..................................................................................................................................... [2] (iii) International agreements have helped to reduce the emission rate of greenhouse gases. Suggest two other reasons why the emission rate of greenhouse gases from oil sands extraction has decreased. 1 ........................................................................................................................................ ........................................................................................................................................... 2 ........................................................................................................................................ ........................................................................................................................................... [2] (f) A pipeline for transporting oil was planned to run from Canada to the USA. Many people objected to the building of this pipeline. Suggest reasons why some people were in favour of building this pipeline. ................................................................................................................................................... ................................................................................................................................................... ................................................................................................................................................... ................................................................................................................................................... ................................................................................................................................................... ............................................................................................................................................. [3] [Total: 28]
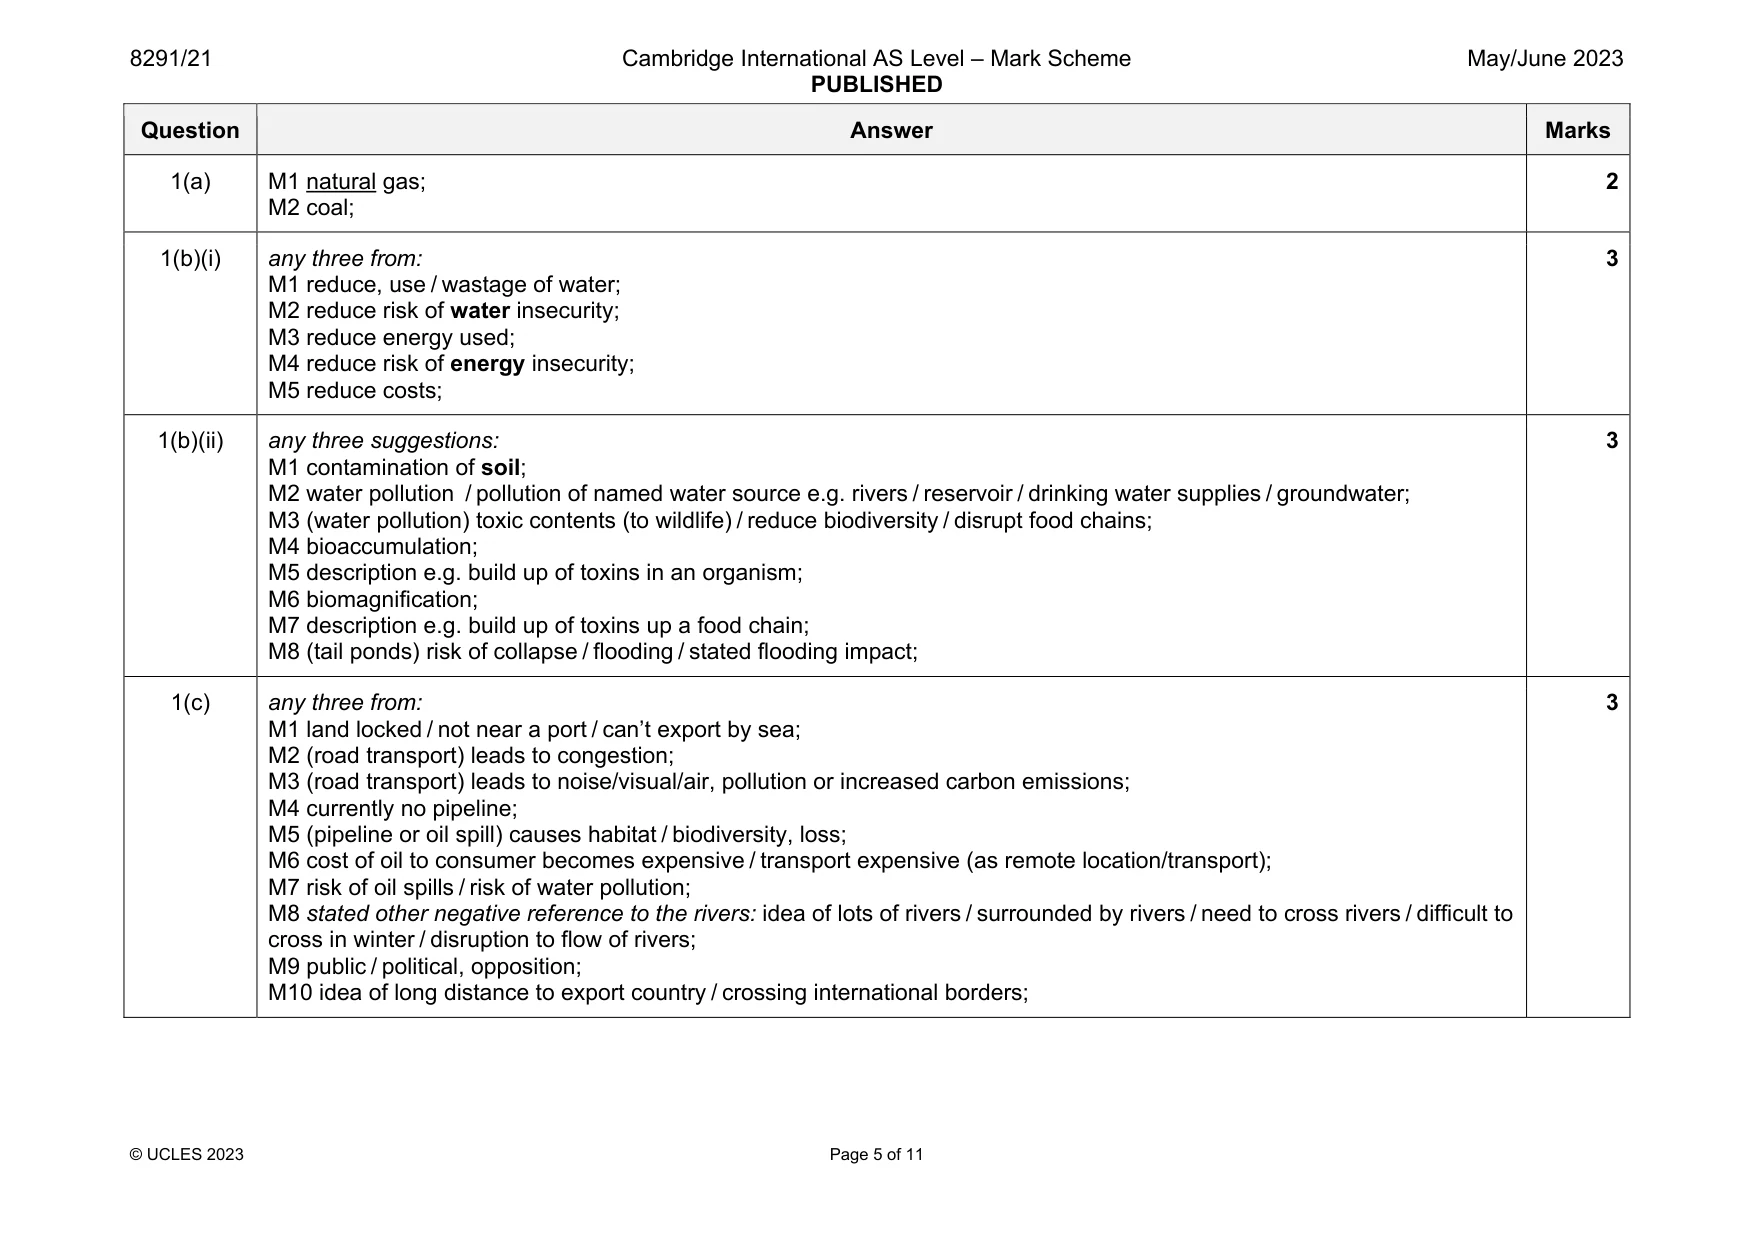
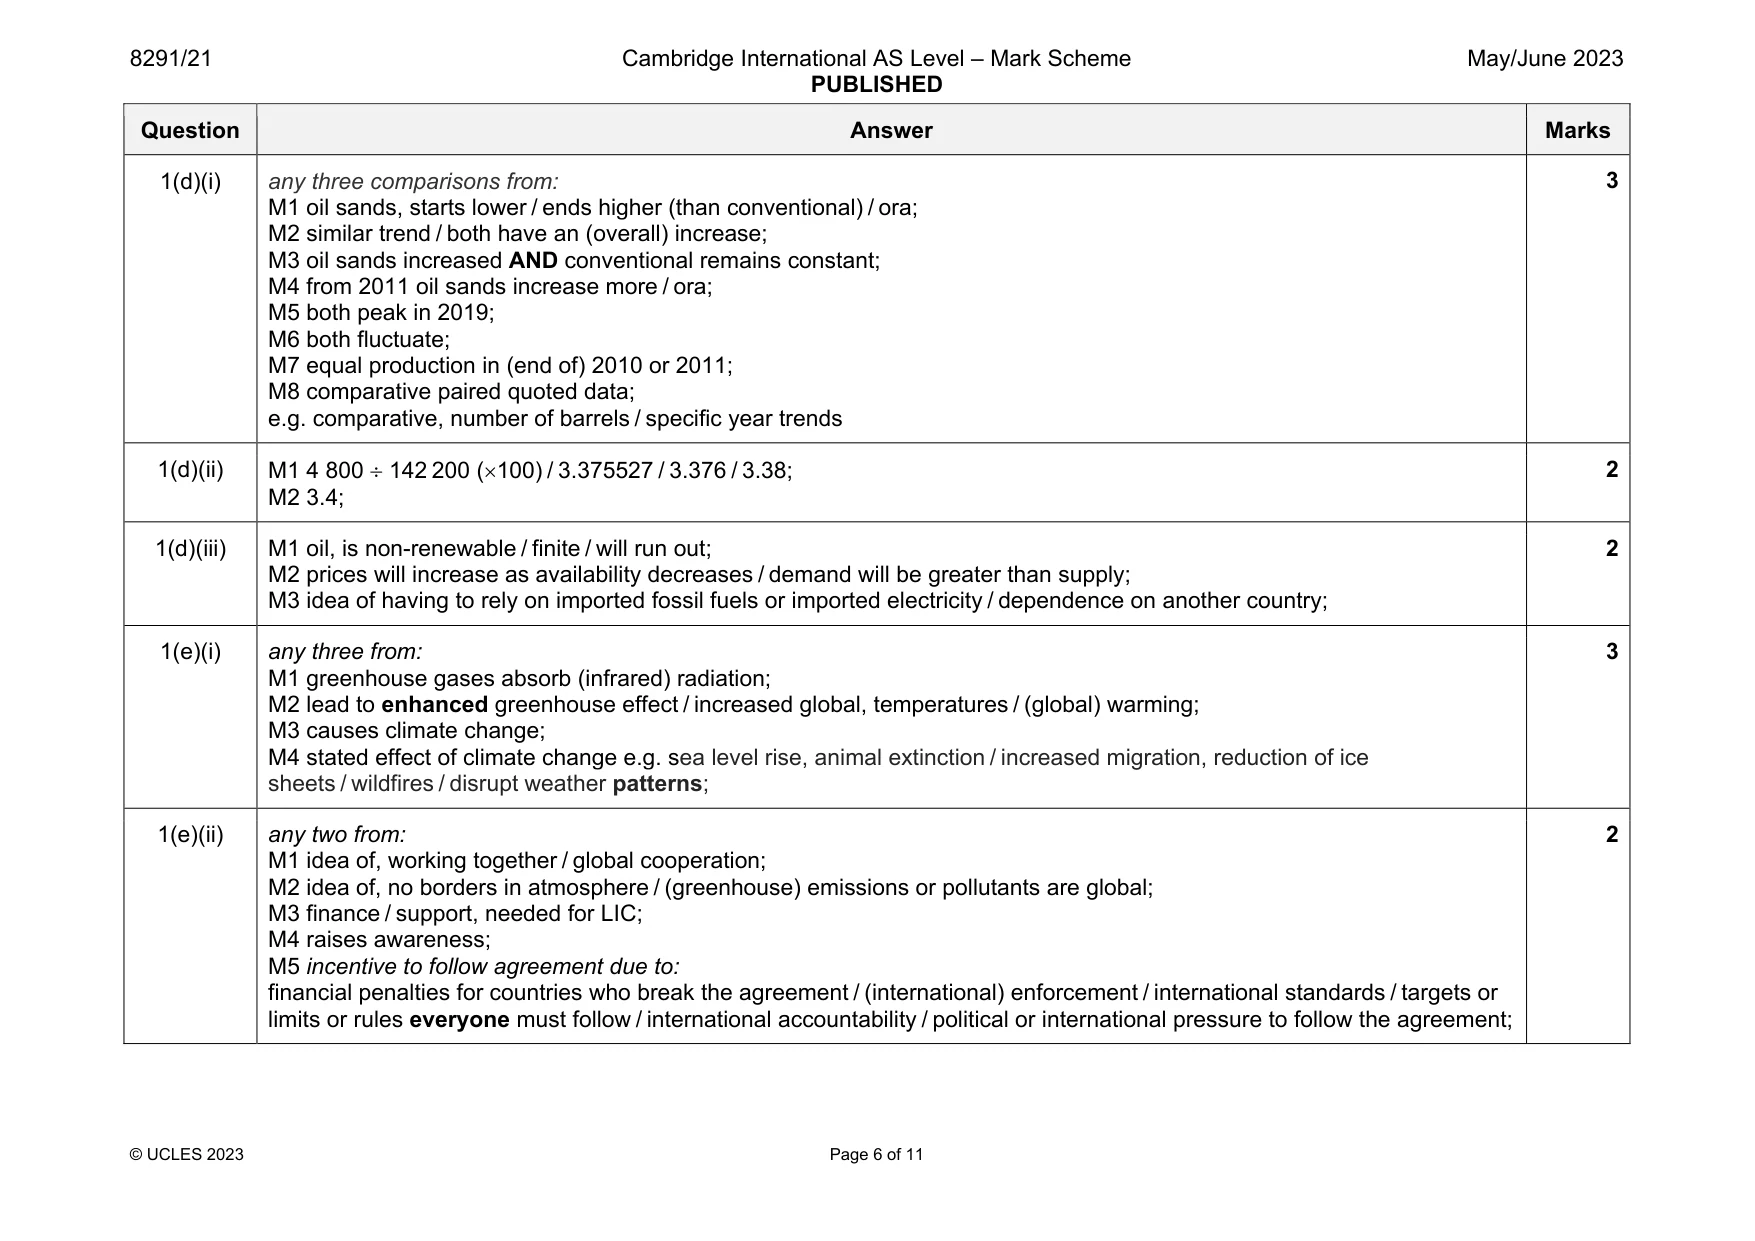
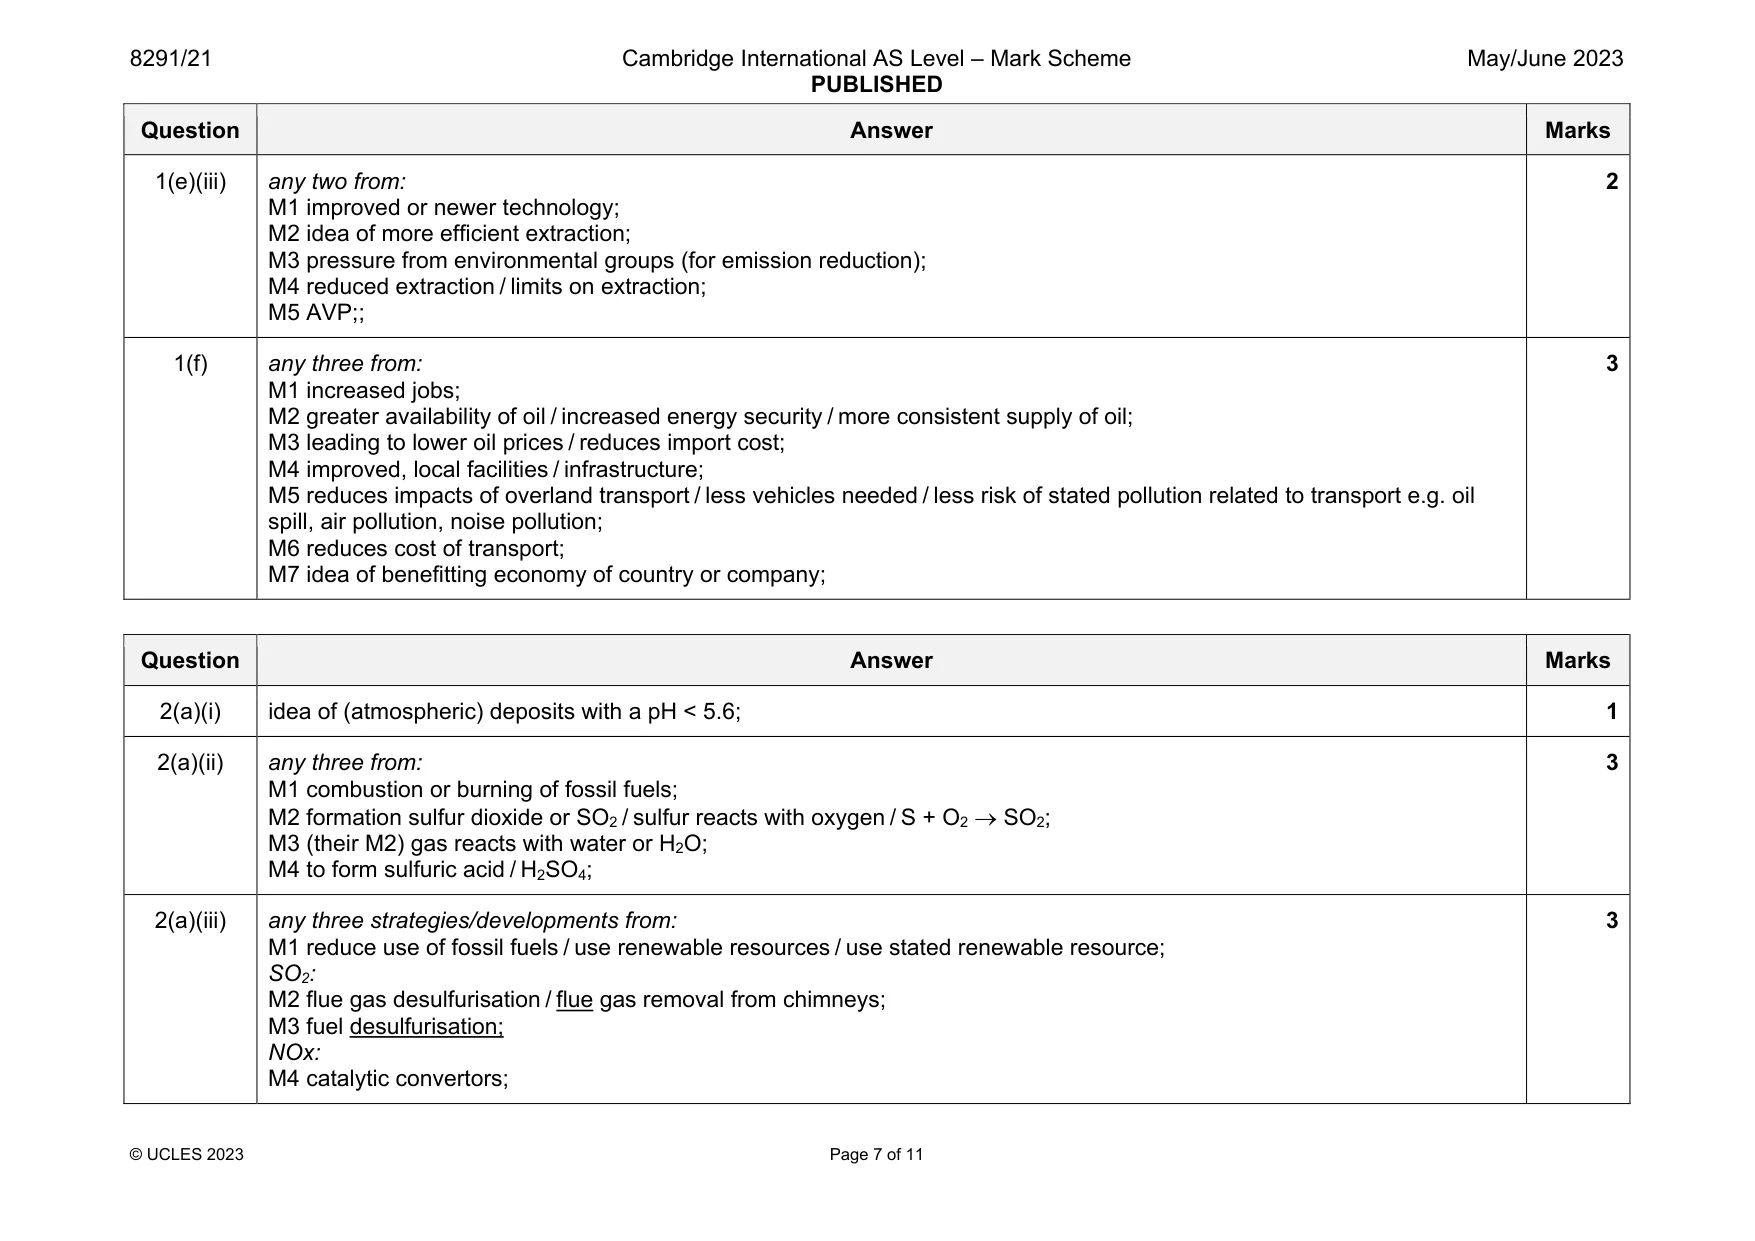
Mark scheme: 1(a) M1 natural gas; M2 coal; 2 1(b)(i) any three from: M1 reduce, use / wastage of water; M2 reduce risk of water insecurity; M3 reduce energy used; M4 reduce risk of energy insecurity; M5 reduce costs; 3 1(b)(ii) any three suggestions: M1 contamination of soil; M2 water pollution / pollution of named water source e.g. rivers / reservoir / drinking water supplies / groundwater; M3 (water pollution) toxic contents (to wildlife) / reduce biodiversity / disrupt food chains; M4 bioaccumulation; M5 description e.g. build up of toxins in an organism; M6 biomagnification; M7 description e.g. build up of toxins up a food chain; M8 (tail ponds) risk of collapse / flooding / stated flooding impact; 3 1(c) any three from: M1 land locked / not near a port / can’t export by sea; M2 (road transport) leads to congestion; M3 (road transport) leads to noise/visual/air, pollution or increased carbon emissions; M4 currently no pipeline; M5 (pipeline or oil spill) causes habitat / biodiversity, loss; M6 cost of oil to consumer becomes expensive / transport expensive (as remote location/transport); M7 risk of oil spills / risk of water pollution; M8 stated other negative reference to the rivers: idea of lots of rivers / surrounded by rivers / need to cross rivers / difficult to cross in winter / disruption to flow of rivers; M9 public / political, opposition; M10 idea of long distance to export country / crossing international borders; 3 Question Answer Marks 1(d)(i) any three comparisons from: M1 oil sands, starts lower / ends higher (than conventional) / ora; M2 similar trend / both have an (overall) increase; M3 oil sands increased AND conventional remains constant; M4 from 2011 oil sands increase more / ora; M5 both peak in 2019; M6 both fluctuate; M7 equal production in (end of) 2010 or 2011; M8 comparative paired quoted data; e.g. comparative, number of barrels / specific year trends 3 1(d)(ii) M1 4 800 142 200 (100) / 3.375527 / 3.376 / 3.38; M2 3.4; 2 1(d)(iii) M1 oil, is non-renewable / finite / will run out; M2 prices will increase as availability decreases / demand will be greater than supply; M3 idea of having to rely on imported fossil fuels or imported electricity / dependence on another country; 2 1(e)(i) any three from: M1 greenhouse gases absorb (infrared) radiation; M2 lead to enhanced greenhouse effect / increased global, temperatures / (global) warming; M3 causes climate change; M4 stated effect of climate change e.g. sea level rise, animal extinction / increased migration, reduction of ice sheets / wildfires / disrupt weather patterns; 3 1(e)(ii) any two from: M1 idea of, working together / global cooperation; M2 idea of, no borders in atmosphere / (greenhouse) emissions or pollutants are global; M3 finance / support, needed for LIC; M4 raises awareness; M5 incentive to follow agreement due to: financial penalties for countries who break the agreement / (international) enforcement / international standards / targets or limits or rules everyone must follow / international accountability / political or international pressure to follow the agreement; 2 Question Answer Marks 1(e)(iii) any two from: M1 improved or newer technology; M2 idea of more efficient extraction; M3 pressure from environmental groups (for emission reduction); M4 reduced extraction / limits on extraction; M5 AVP;; 2 1(f) any three from: M1 increased jobs; M2 greater availability of oil / increased energy security / more consistent supply of oil; M3 leading to lower oil prices / reduces import cost; M4 improved, local facilities / infrastructure; M5 reduces impacts of overland transport / less vehicles needed / less risk of stated pollution related to transport e.g. oil spill, air pollution, noise pollution; M6 reduces cost of transport; M7 idea of benefitting economy of country or company; 3
Q2 · The Sous reservoir in the Czech Republic is a source of drinking water for 100 000 people…
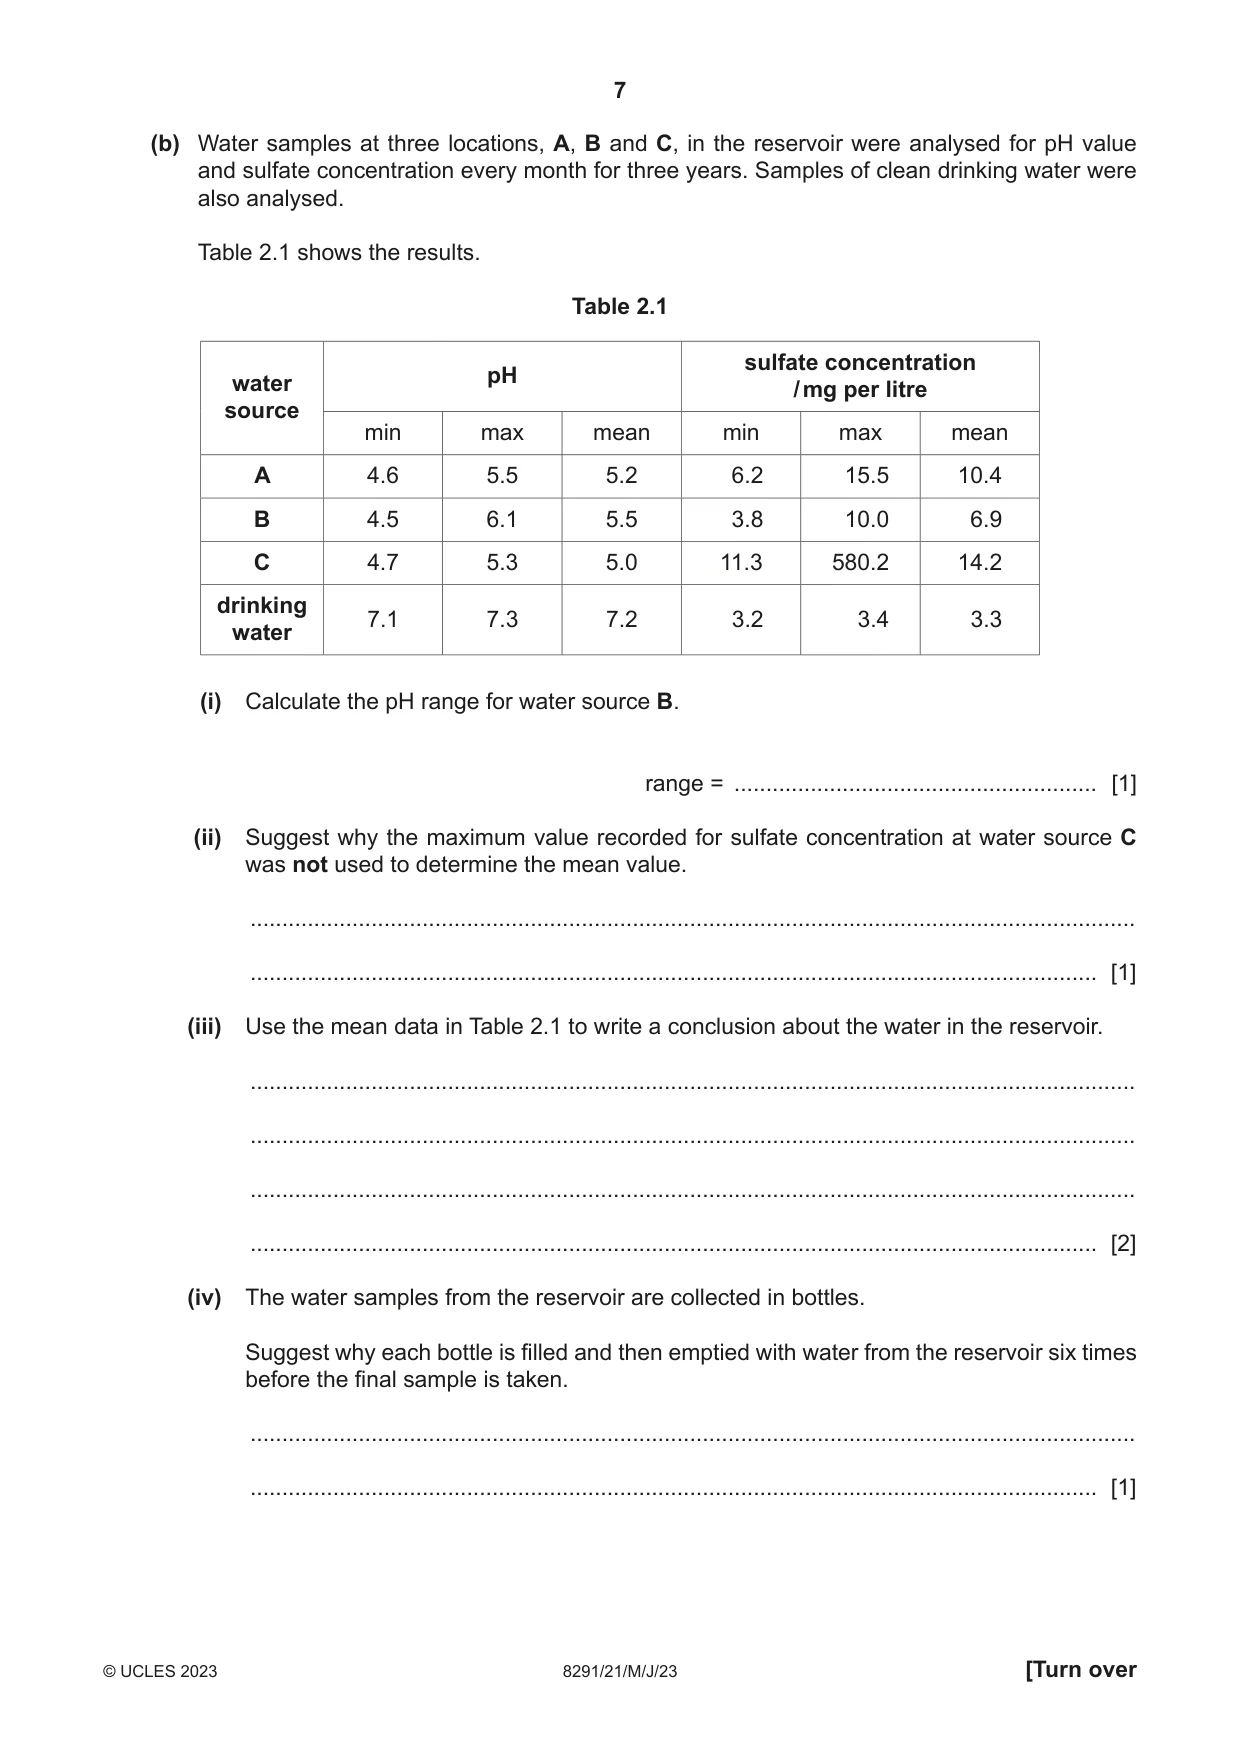
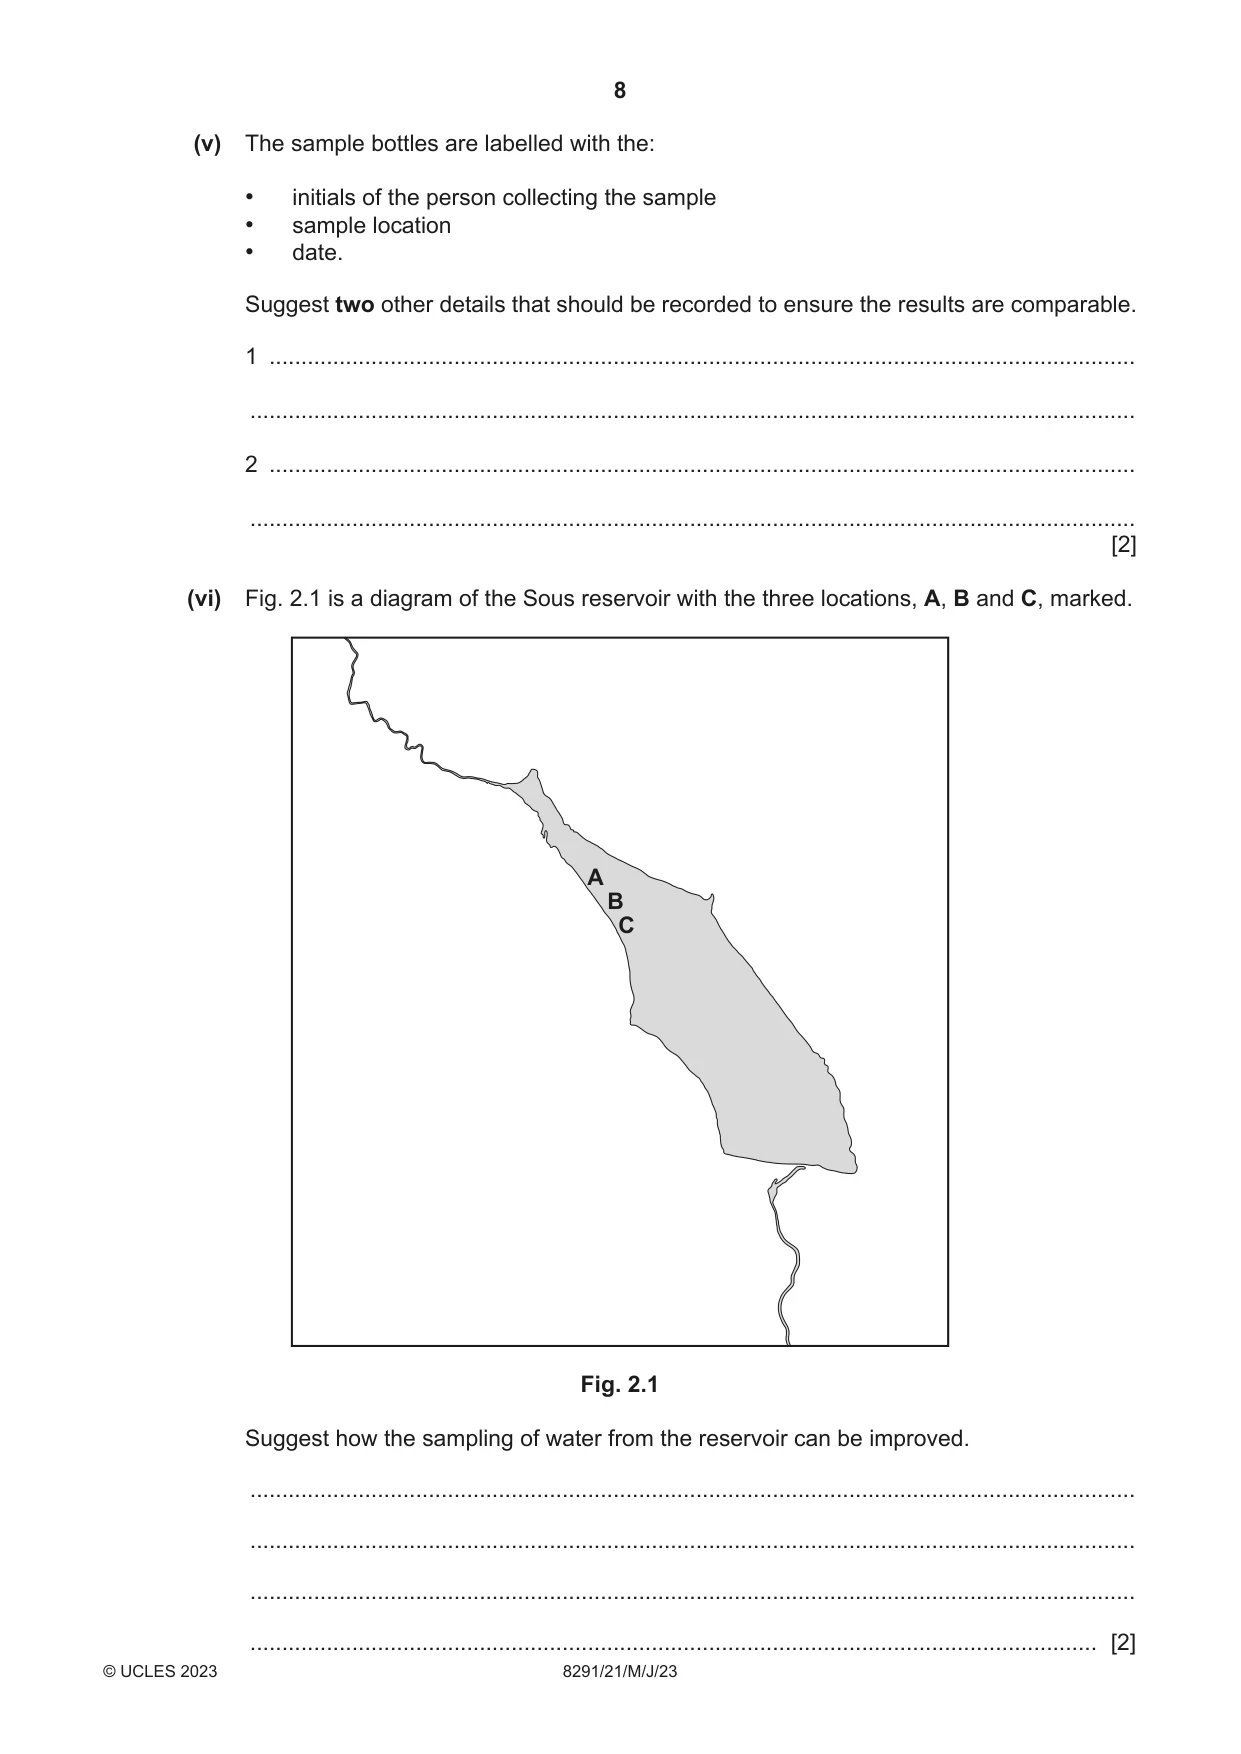
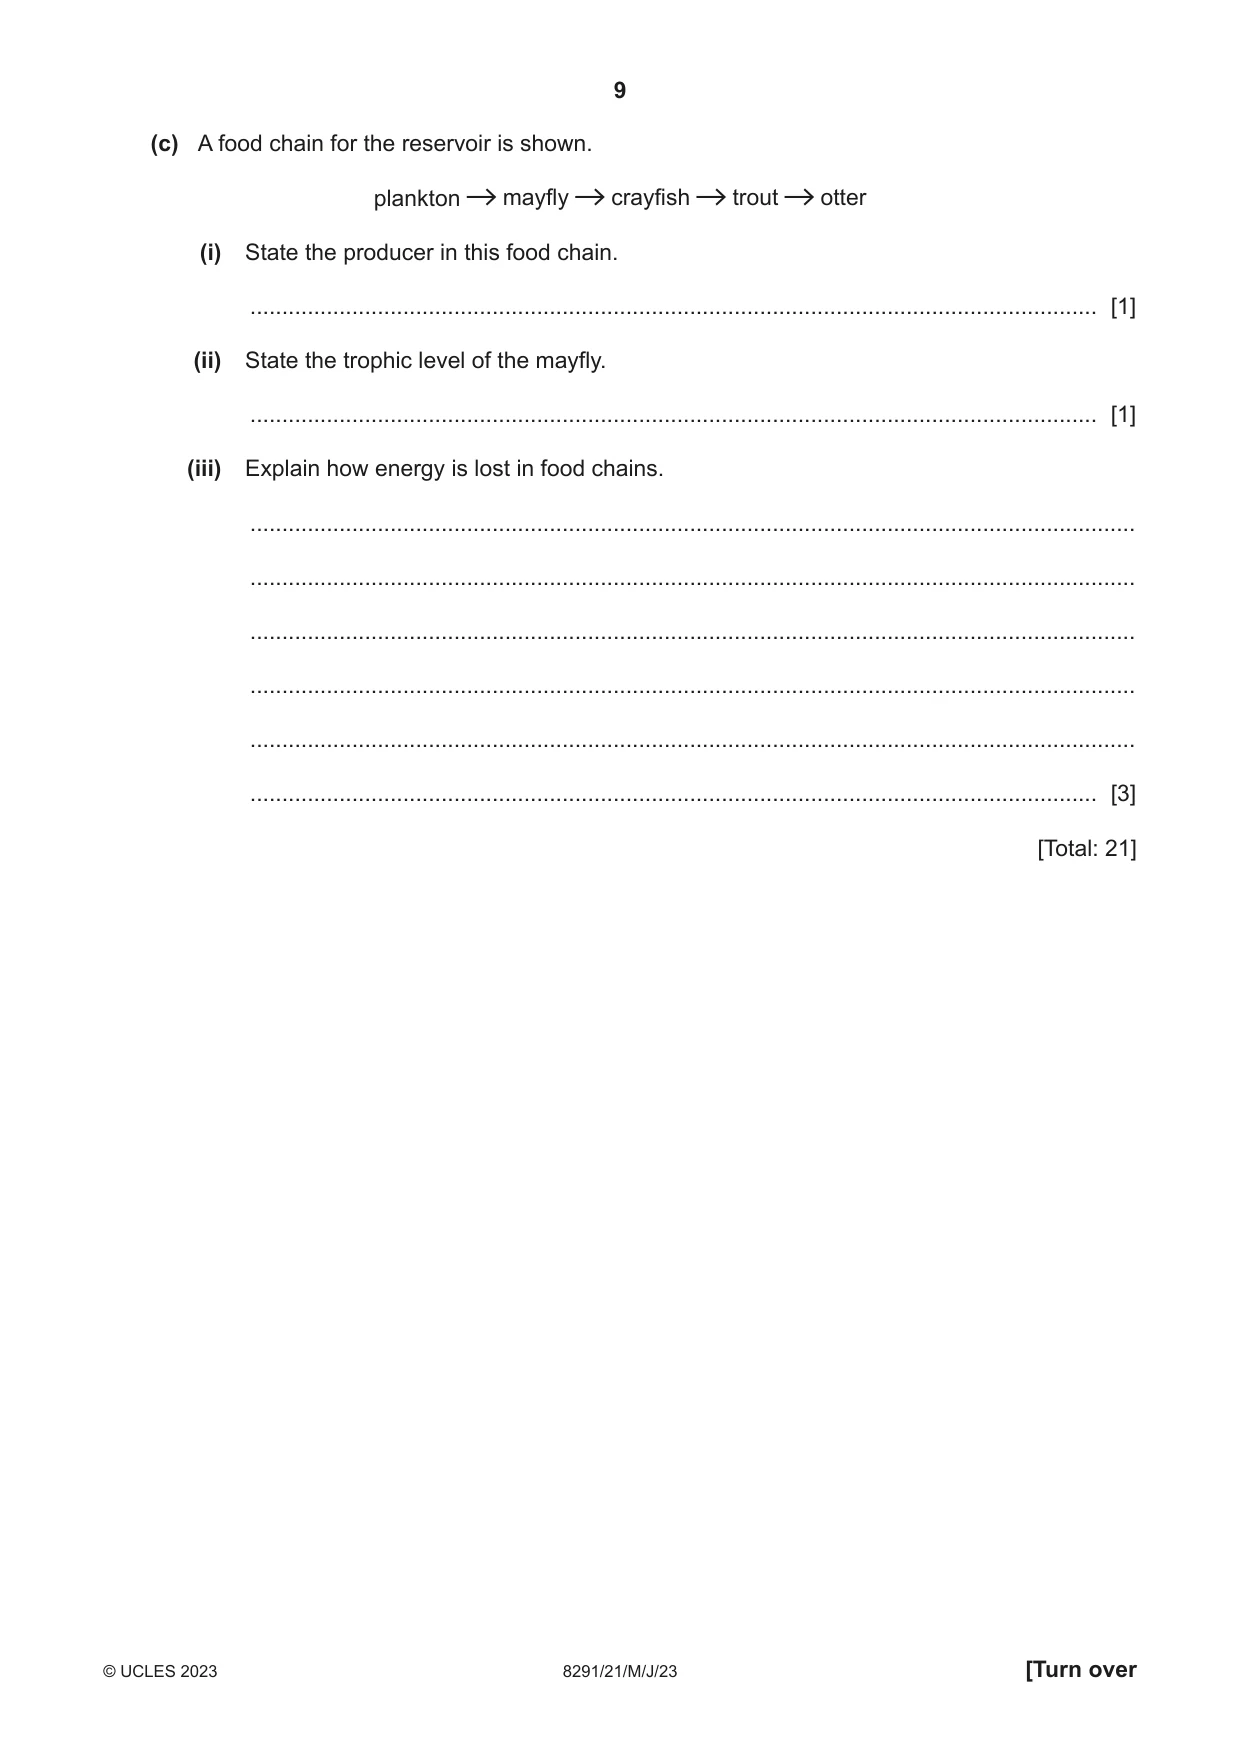
2 The Sous reservoir in the Czech Republic is a source of drinking water for 100 000 people in the region. The area has been affected by acid deposition. (a) (i) Define acid deposition. ........................................................................................................................................... ..................................................................................................................................... [1] (ii) Outline the formation of acid deposition from sulfur compounds. ........................................................................................................................................... ........................................................................................................................................... ........................................................................................................................................... ........................................................................................................................................... ........................................................................................................................................... ..................................................................................................................................... [3] (iii) Describe strategies for reducing the emissions of gases that cause acid deposition. ........................................................................................................................................... ........................................................................................................................................... ........................................................................................................................................... ........................................................................................................................................... ........................................................................................................................................... ..................................................................................................................................... [3] (b) Water samples at three locations, A, B and C, in the reservoir were analysed for pH value and sulfate concentration every month for three years. Samples of clean drinking water were also analysed. Table 2.1 shows the results. Table 2.1 sulfate concentration pH water / mg per litre source min max mean min max mean A 4.6 5.5 5.2 6.2 15.5 10.4 B 4.5 6.1 5.5 3.8 10.0 6.9 C 4.7 5.3 5.0 11.3 580.2 14.2 drinking 7.1 7.3 7.2 3.2 3.4 3.3 water (i) Calculate the pH range for water source B. range = ......................................................... [1] (ii) Suggest why the maximum value recorded for sulfate concentration at water source C was not used to determine the mean value. ........................................................................................................................................... ..................................................................................................................................... [1] (iii) Use the mean data in Table 2.1 to write a conclusion about the water in the reservoir. ........................................................................................................................................... ........................................................................................................................................... ........................................................................................................................................... ..................................................................................................................................... [2] (iv) The water samples from the reservoir are collected in bottles. Suggest why each bottle is filled and then emptied with water from the reservoir six times before the final sample is taken. ........................................................................................................................................... ..................................................................................................................................... [1] (v) The sample bottles are labelled with the: • initials of the person collecting the sample • sample location • date. Suggest two other details that should be recorded to ensure the results are comparable. 1 ........................................................................................................................................ ........................................................................................................................................... 2 ........................................................................................................................................ ........................................................................................................................................... [2] (vi) Fig. 2.1 is a diagram of the Sous reservoir with the three locations, A, B and C, marked. A B C Fig. 2.1 Suggest how the sampling of water from the reservoir can be improved. ........................................................................................................................................... ........................................................................................................................................... ........................................................................................................................................... ..................................................................................................................................... [2] (c) A food chain for the reservoir is shown. plankton mayfly crayfish trout otter (i) State the producer in this food chain. ..................................................................................................................................... [1] (ii) State the trophic level of the mayfly. ..................................................................................................................................... [1] (iii) Explain how energy is lost in food chains. ........................................................................................................................................... ........................................................................................................................................... ........................................................................................................................................... ........................................................................................................................................... ........................................................................................................................................... ..................................................................................................................................... [3] [Total: 21]
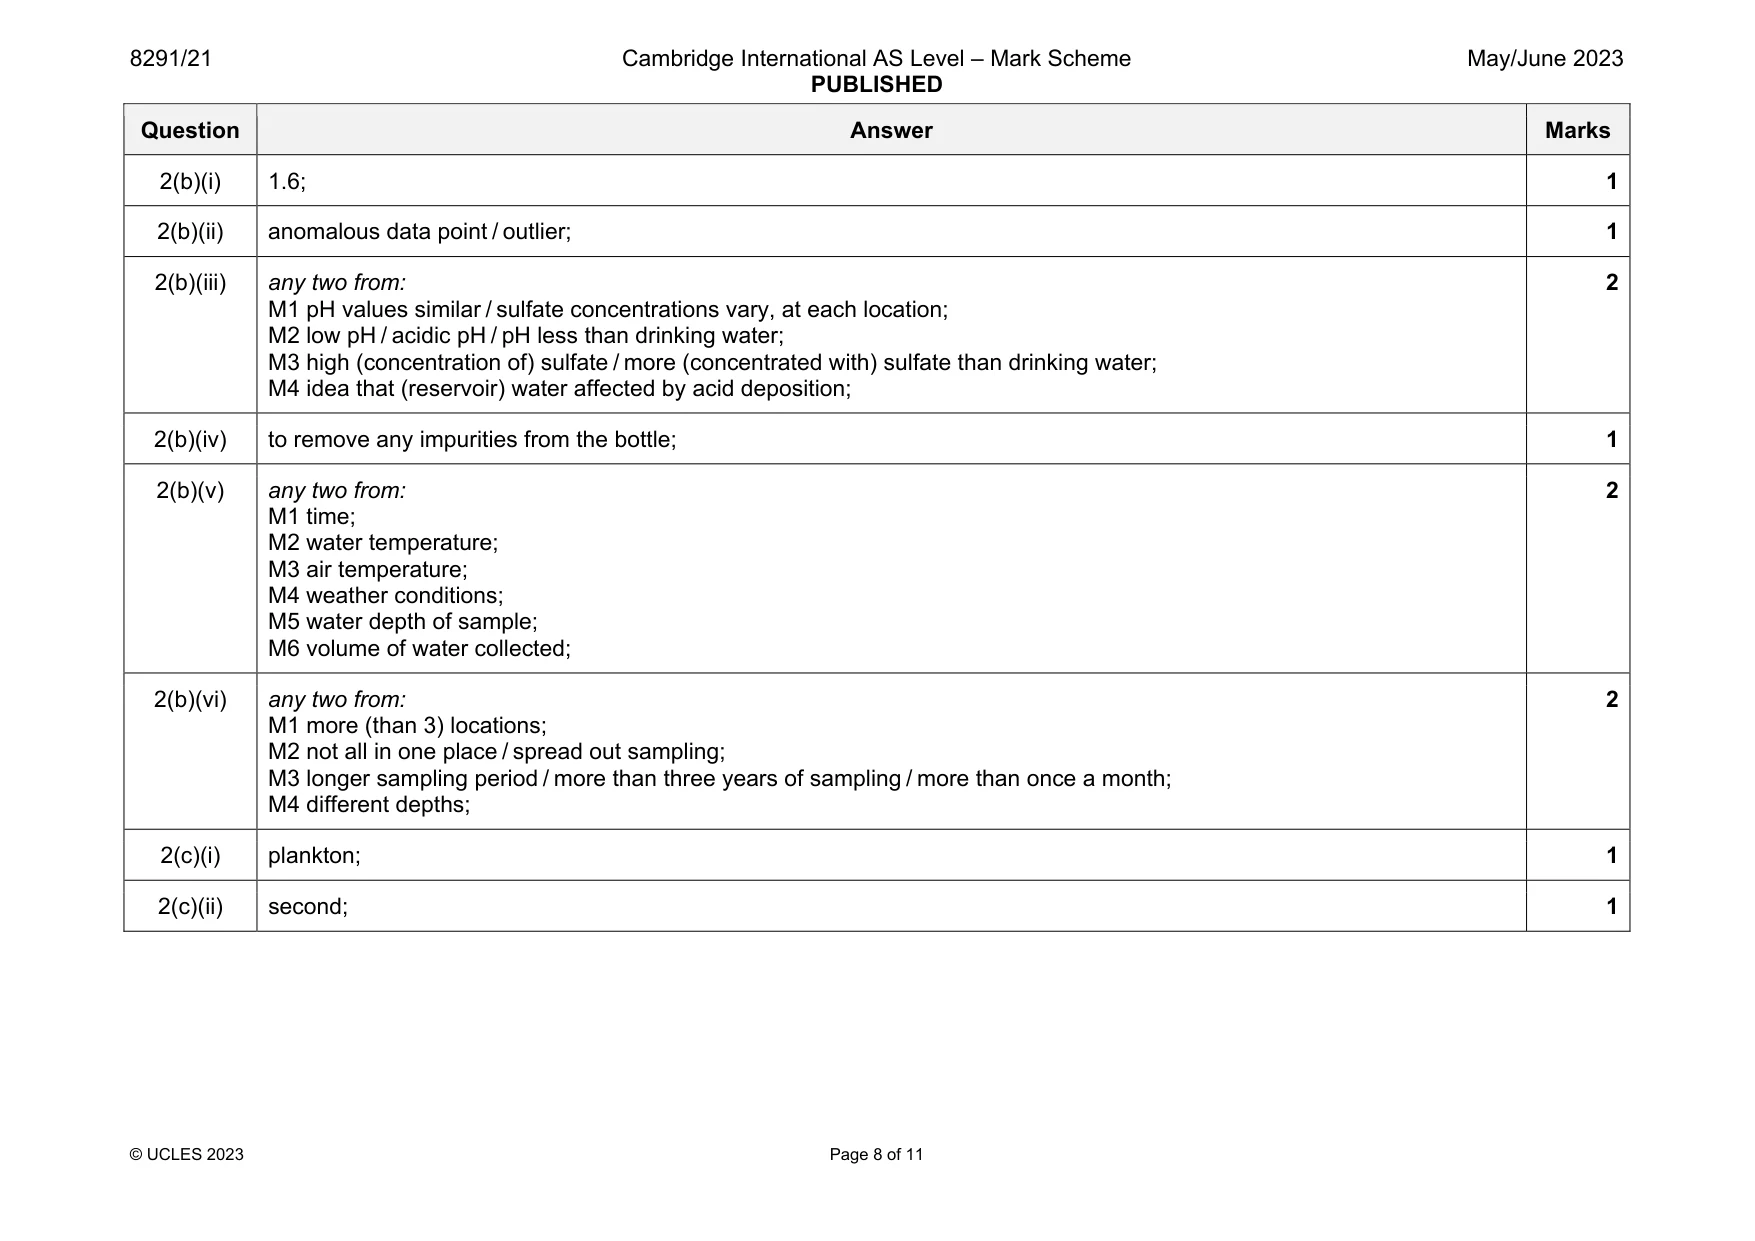
Mark scheme: 2(a)(i) idea of (atmospheric) deposits with a pH < 5.6; 1 2(a)(ii) any three from: M1 combustion or burning of fossil fuels; M2 formation sulfur dioxide or SO2 / sulfur reacts with oxygen / S + O2 SO2; M3 (their M2) gas reacts with water or H2O; M4 to form sulfuric acid / H2SO4; 3 2(a)(iii) any three strategies/developments from: M1 reduce use of fossil fuels / use renewable resources / use stated renewable resource; SO2: M2 flue gas desulfurisation / flue gas removal from chimneys; M3 fuel desulfurisation; NOx: M4 catalytic convertors; 3 Question Answer Marks 2(b)(i) 1.6; 1 2(b)(ii) anomalous data point / outlier; 1 2(b)(iii) any two from: M1 pH values similar / sulfate concentrations vary, at each location; M2 low pH / acidic pH / pH less than drinking water; M3 high (concentration of) sulfate / more (concentrated with) sulfate than drinking water; M4 idea that (reservoir) water affected by acid deposition; 2 2(b)(iv) to remove any impurities from the bottle; 1 2(b)(v) any two from: M1 time; M2 water temperature; M3 air temperature; M4 weather conditions; M5 water depth of sample; M6 volume of water collected; 2 2(b)(vi) any two from: M1 more (than 3) locations; M2 not all in one place / spread out sampling; M3 longer sampling period / more than three years of sampling / more than once a month; M4 different depths; 2 2(c)(i) plankton; 1 2(c)(ii) second; 1 Question Answer Marks 2(c)(iii) any three from: M1 lost as heat; M2 idea of only 10% of energy passed between levels / 90% is lost; lost through: M3 respiration; M4 digestion; M5 (excreted) waste (products); M6 movement; M7 death / decomposition; M8 maintaining body temperature / thermoregulation; M9 feeding / consumers do not consume the whole organism; 3
More questions on Data collection techniques and data analysis
Q3 · Brazil’s Atlantic forest contains approximately 6000 plant species, 263 amphibian species…
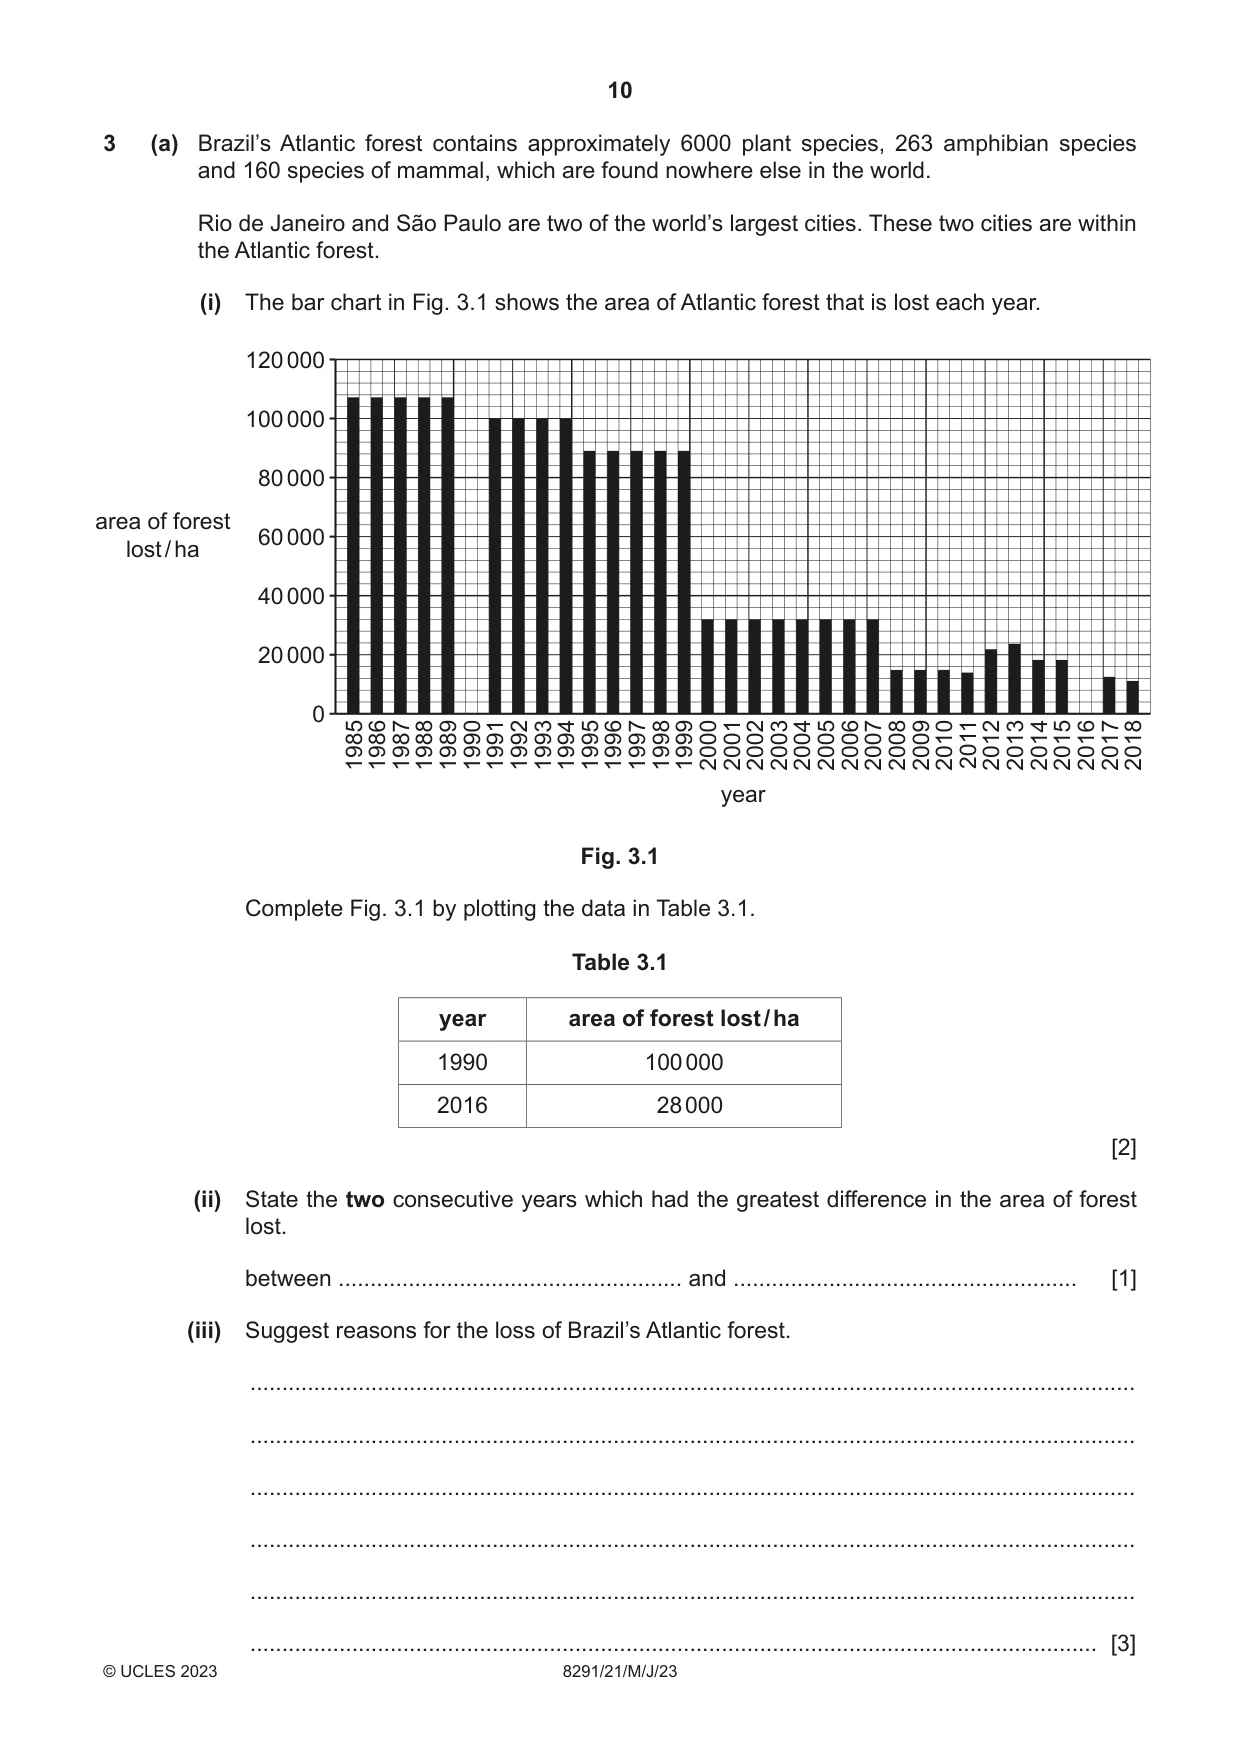
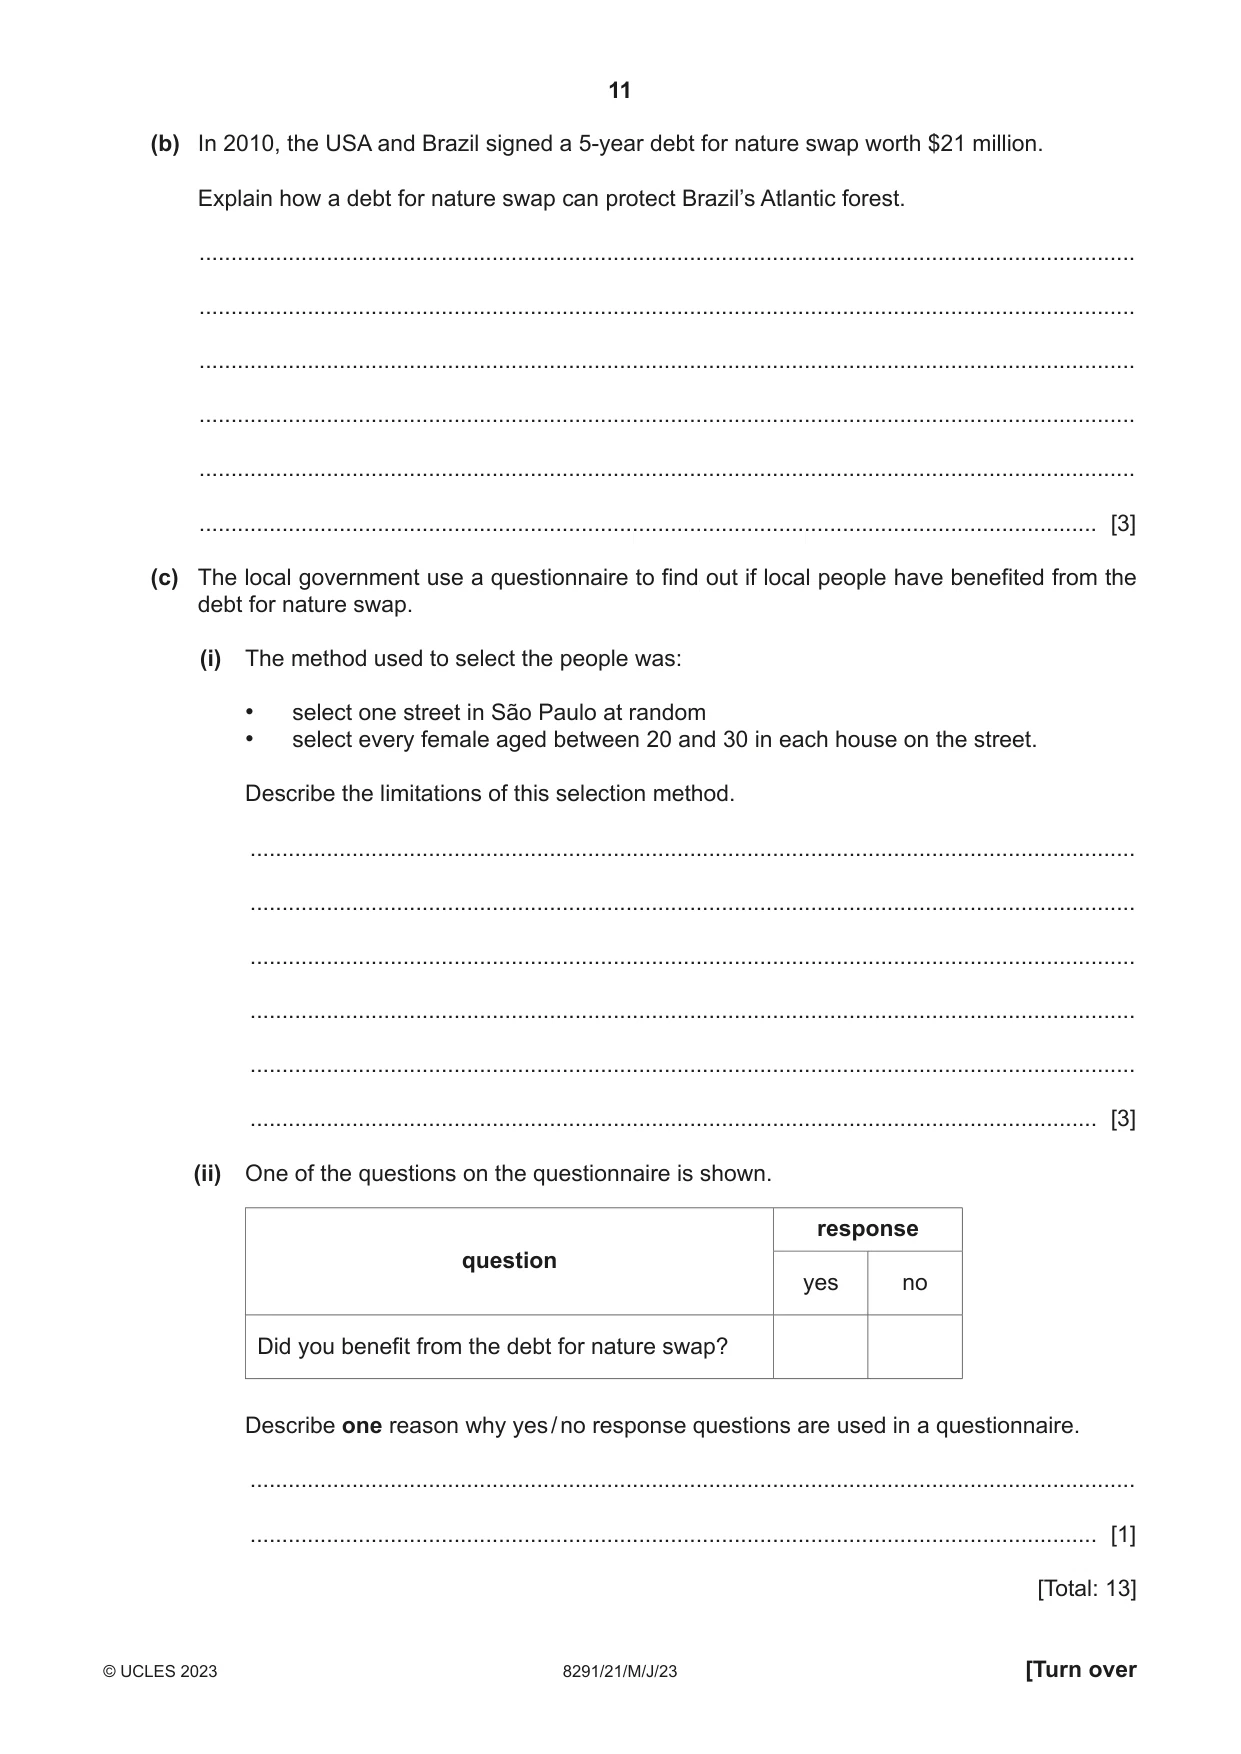
3 (a) Brazil’s Atlantic forest contains approximately 6000 plant species, 263 amphibian species and 160 species of mammal, which are found nowhere else in the world. Rio de Janeiro and São Paulo are two of the world’s largest cities. These two cities are within the Atlantic forest. (i) The bar chart in Fig. 3.1 shows the area of Atlantic forest that is lost each year. 120 000 100 000 80 000 area of forest 60 000 lost / ha 40 000 20 000 0 1985198619871988198919901991199219931994199519961997199819992000200120022003200420052006200720082009201020112012201320142015201620172018 year Fig. 3.1 Complete Fig. 3.1 by plotting the data in Table 3.1. Table 3.1 year area of forest lost / ha 1990 100 000 2016 28 000 [2] (ii) State the two consecutive years which had the greatest difference in the area of forest lost. between ...................................................... and ...................................................... [1] (iii) Suggest reasons for the loss of Brazil’s Atlantic forest. ........................................................................................................................................... ........................................................................................................................................... ........................................................................................................................................... ........................................................................................................................................... ........................................................................................................................................... ..................................................................................................................................... [3] (b) In 2010, the USA and Brazil signed a 5-year debt for nature swap worth $21 million. Explain how a debt for nature swap can protect Brazil’s Atlantic forest. ................................................................................................................................................... ................................................................................................................................................... ................................................................................................................................................... ................................................................................................................................................... ................................................................................................................................................... ............................................................................................................................................. [3] (c) The local government use a questionnaire to find out if local people have benefited from the debt for nature swap. (i) The method used to select the people was: • select one street in São Paulo at random • select every female aged between 20 and 30 in each house on the street. Describe the limitations of this selection method. ........................................................................................................................................... ........................................................................................................................................... ........................................................................................................................................... ........................................................................................................................................... ........................................................................................................................................... ..................................................................................................................................... [3] (ii) One of the questions on the questionnaire is shown. response question yes no Did you benefit from the debt for nature swap? Describe one reason why yes / no response questions are used in a questionnaire. ........................................................................................................................................... ..................................................................................................................................... [1] [Total: 13]
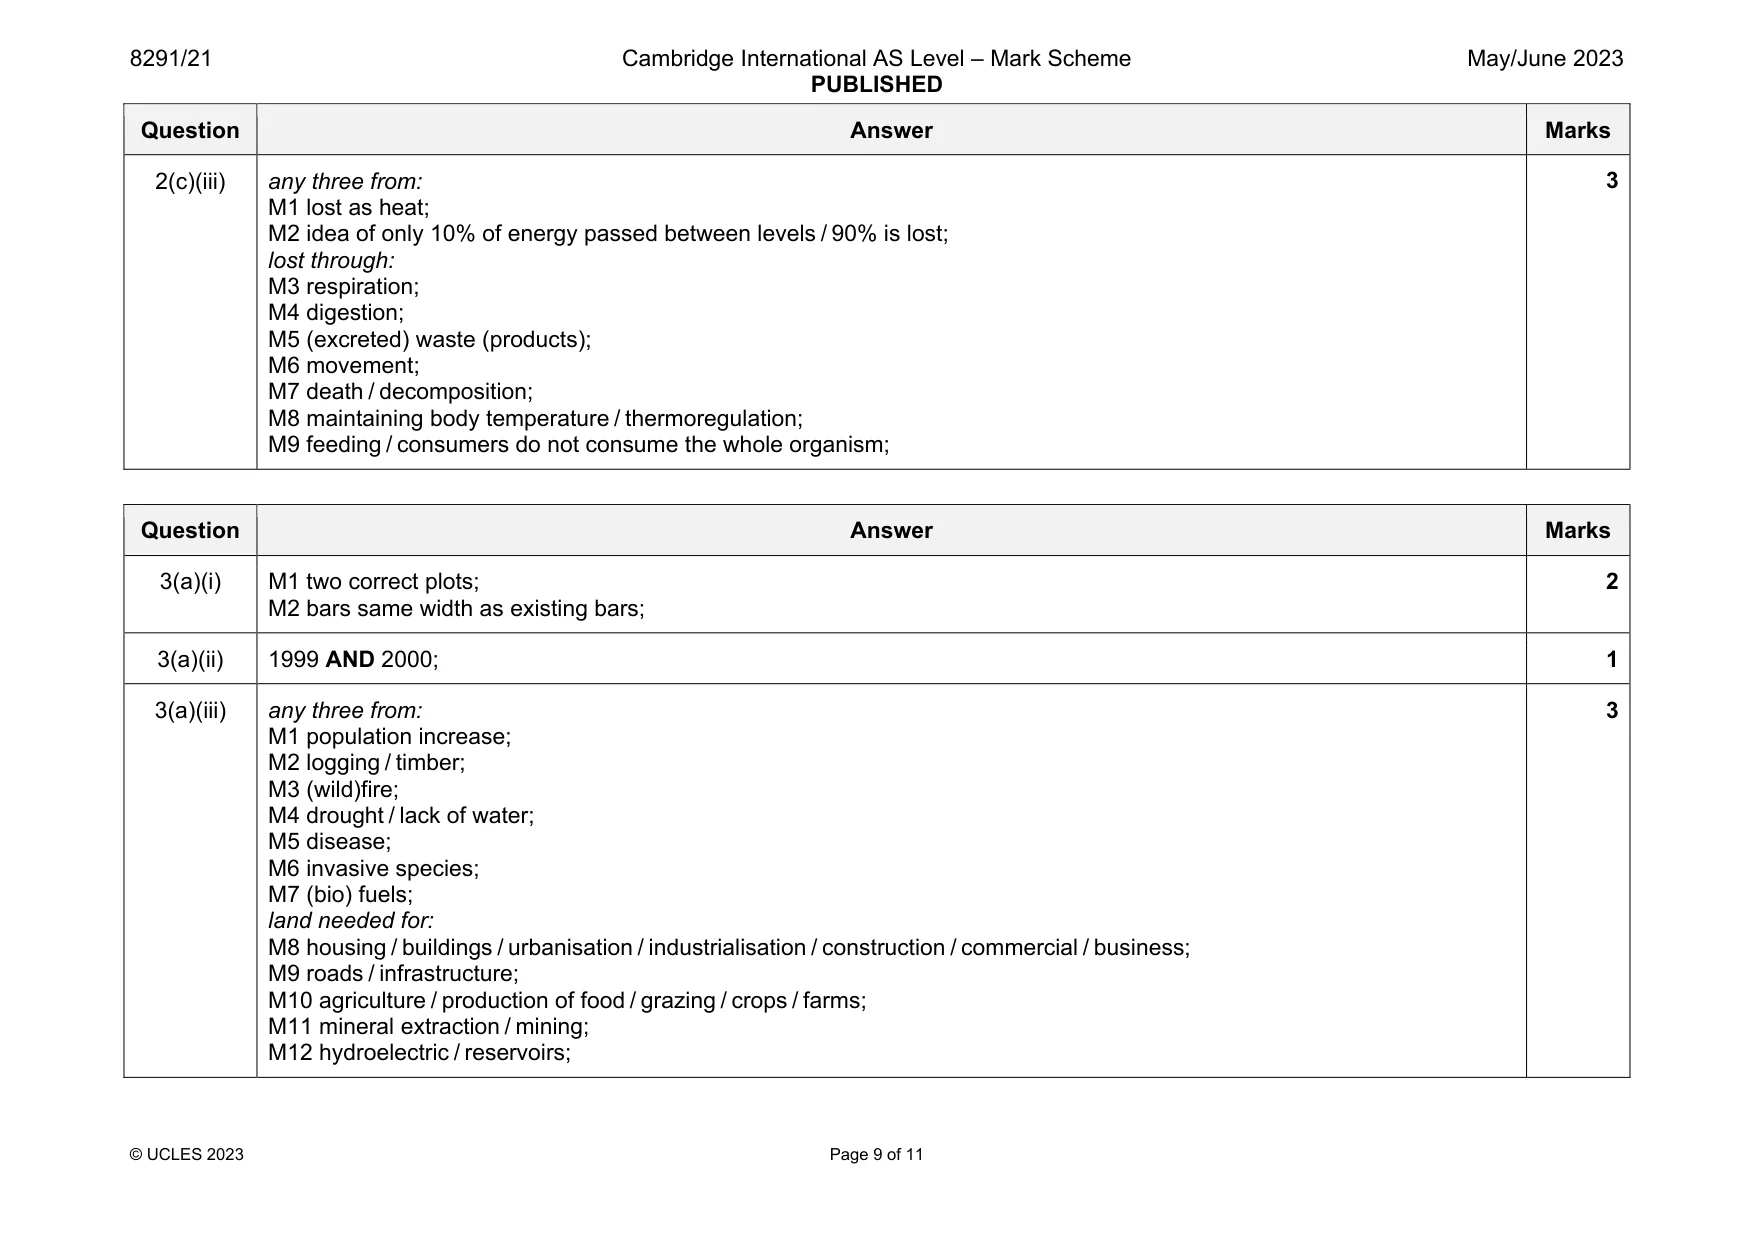
Mark scheme: 3(a)(i) M1 two correct plots; M2 bars same width as existing bars; 2 3(a)(ii) 1999 AND 2000; 1 3(a)(iii) any three from: M1 population increase; M2 logging / timber; M3 (wild)fire; M4 drought / lack of water; M5 disease; M6 invasive species; M7 (bio) fuels; land needed for: M8 housing / buildings / urbanisation / industrialisation / construction / commercial / business; M9 roads / infrastructure; M10 agriculture / production of food / grazing / crops / farms; M11 mineral extraction / mining; M12 hydroelectric / reservoirs; 3 Question Answer Marks 3(b) any three from: M1 idea of: ($21 million of) Brazil’s debt (to USA) cancelled; money is then invested in ways to improve the forest: M2 idea of preserving or increasing biodiversity; M3 ecotourism; M4 national parks; M5 afforestation / re-forestation / replanting; M6 compensating farmers / helping people financially / financial incentive to individuals (to not cut down trees); 3 3(c)(i) any three from: M1 no information on number of houses in street; M2 may be too much data or too little data, to analyse; M3 only women selected / ora; M4 only 2030 year olds selected / no stated other age range; M5 only Sao Paulo selected / only one street or area selected; M6 data is not representative; M7 data could be biased; 3 3(c)(ii) quick or easy / do not have to read long responses / answers are limited or quantifiable / not ambiguous / does not need interpretation / AVP; 1
Q4 · Scientists on the international space station (ISS) get some of their water from the…
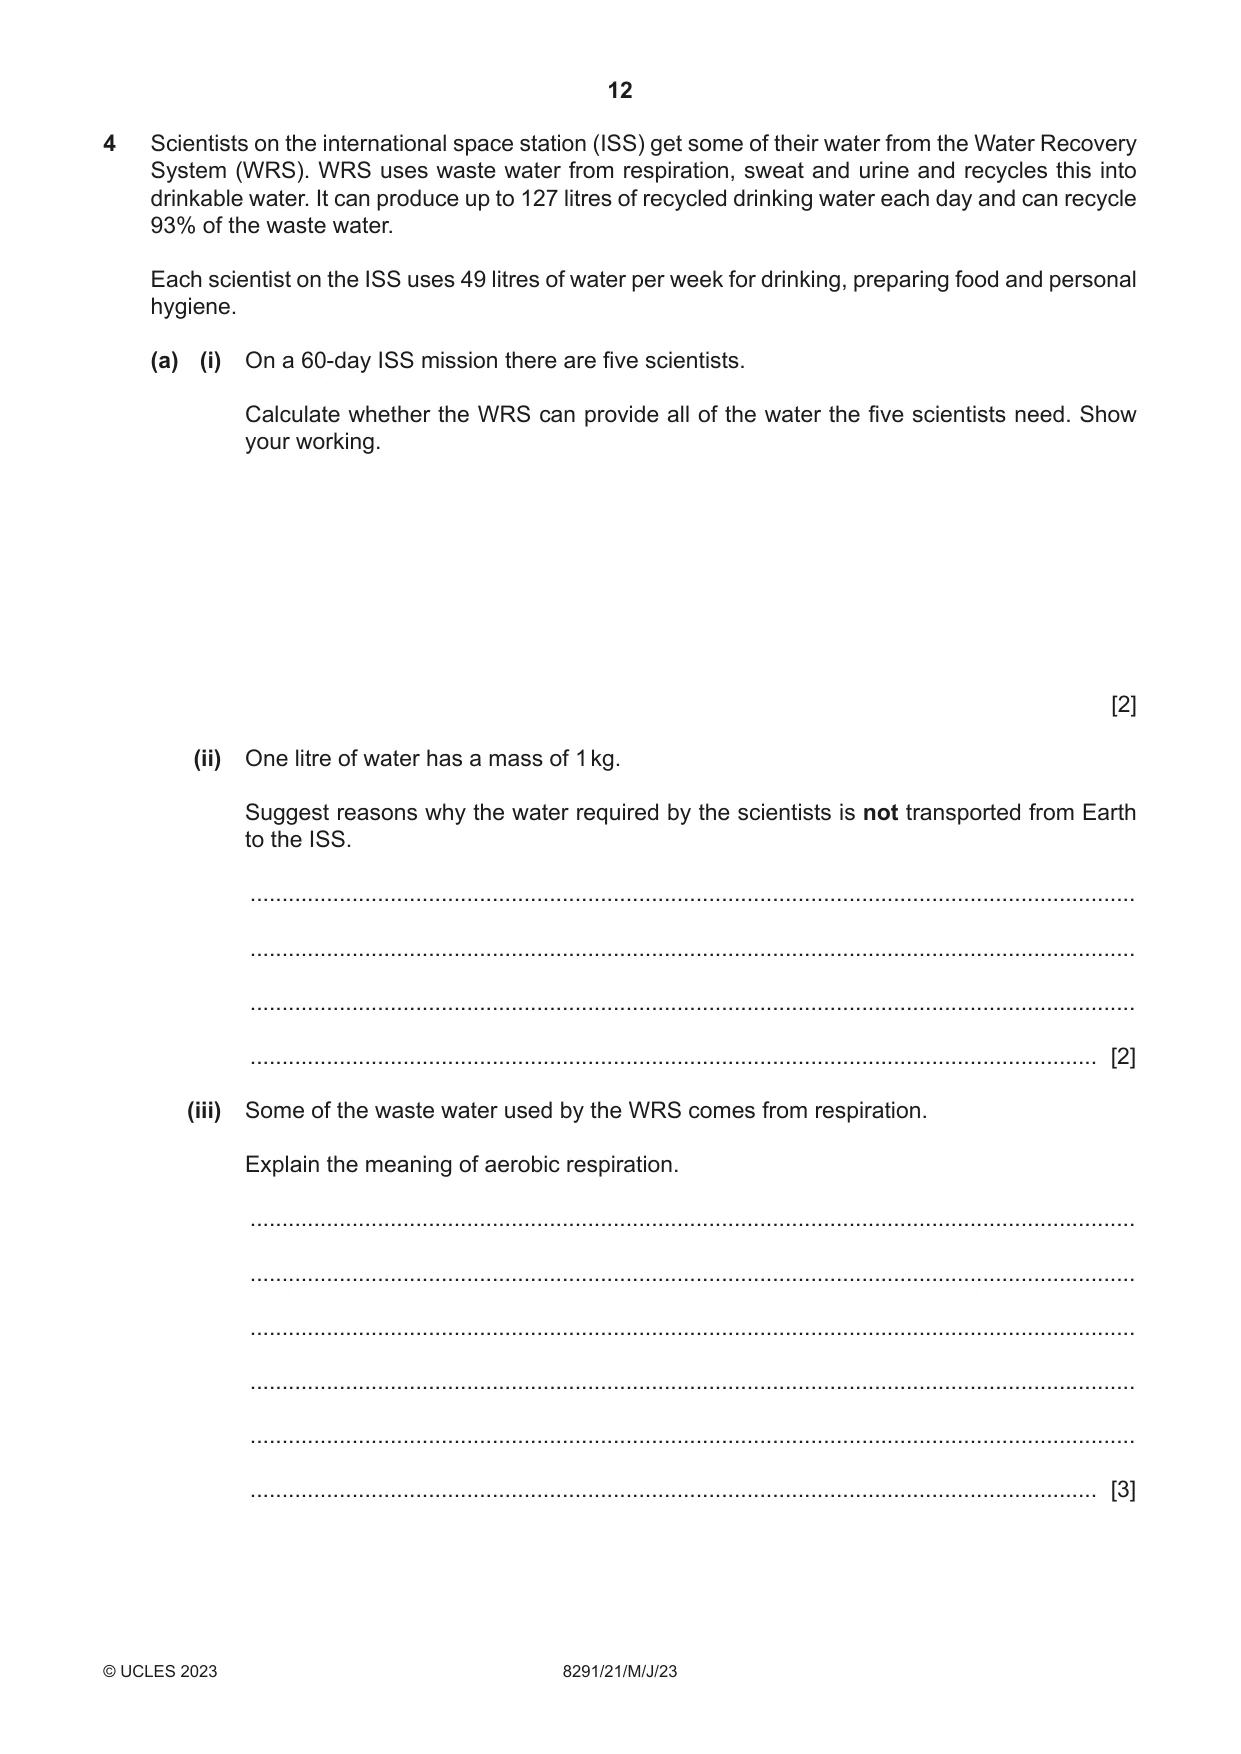
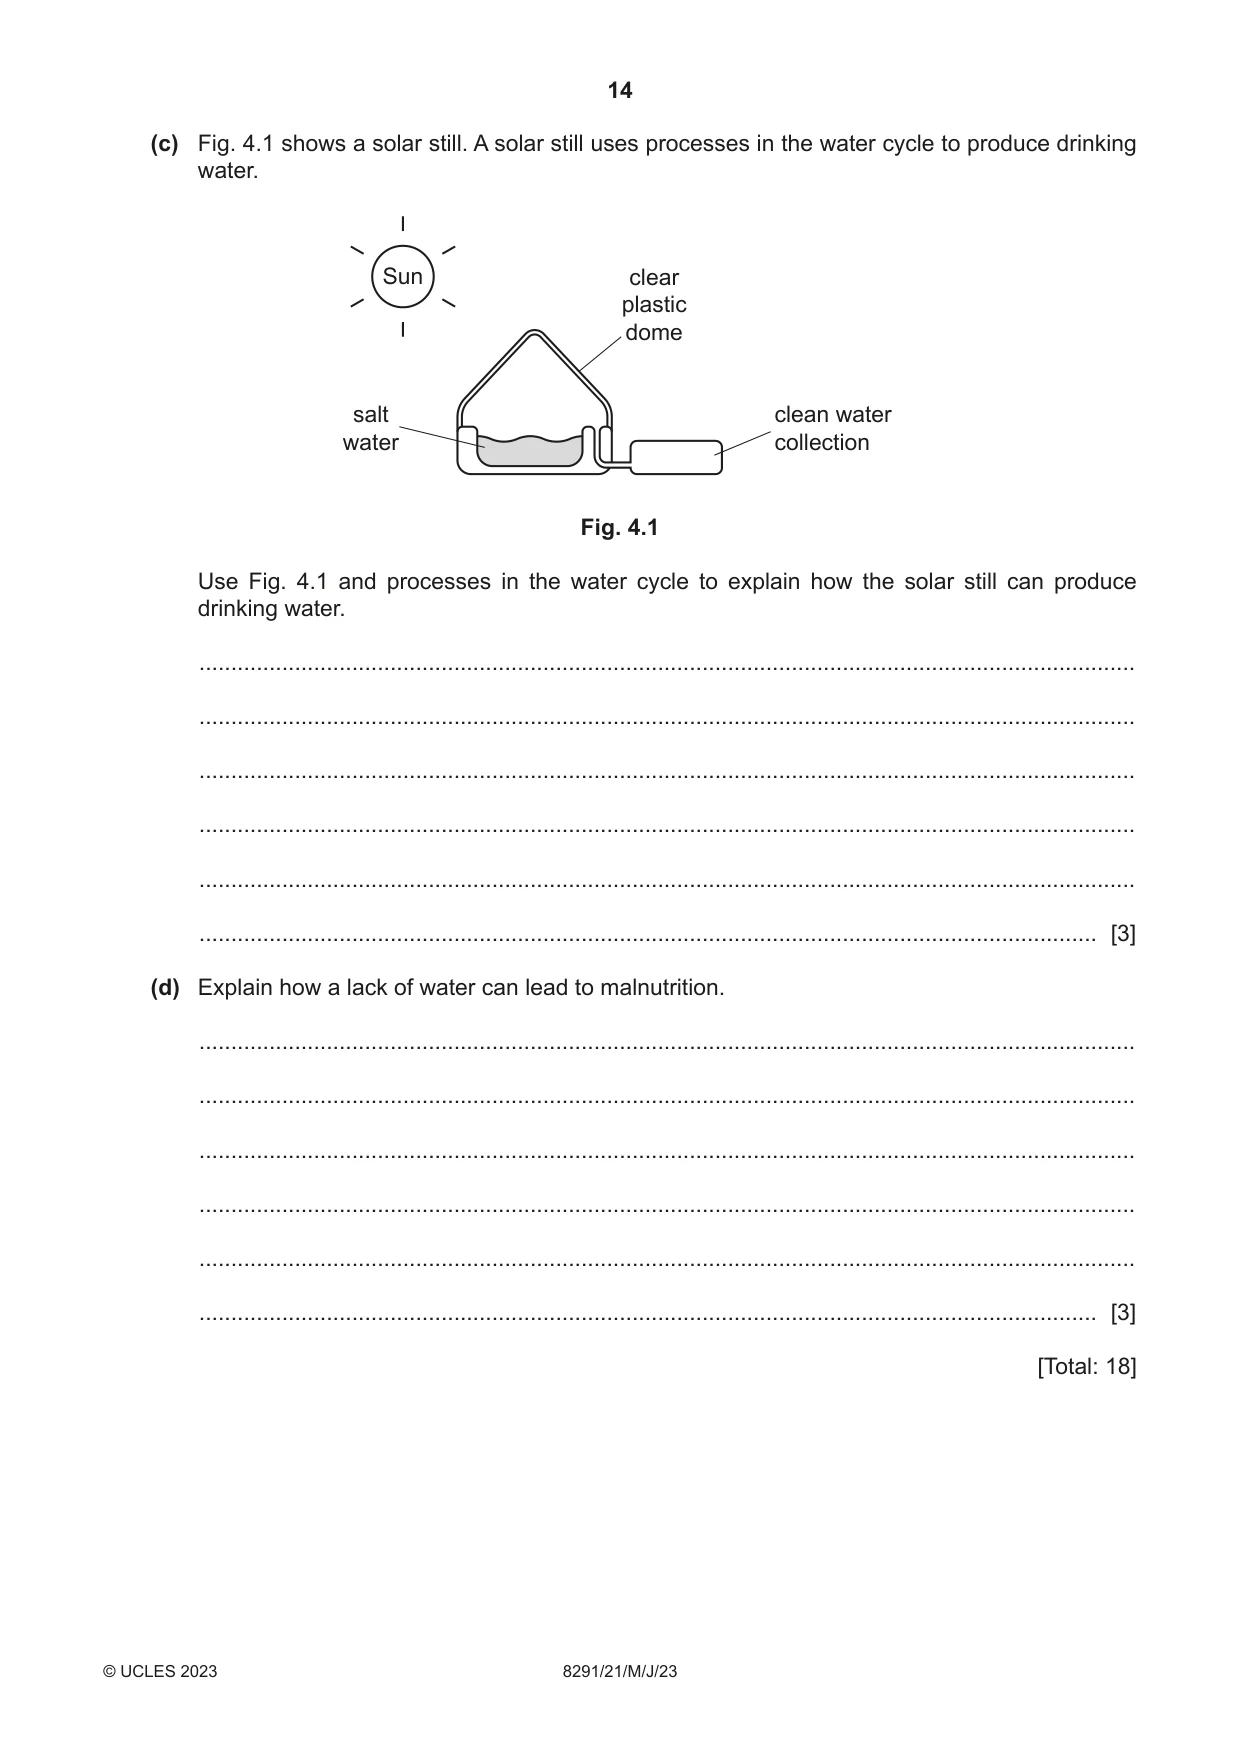
4 Scientists on the international space station (ISS) get some of their water from the Water Recovery System (WRS). WRS uses waste water from respiration, sweat and urine and recycles this into drinkable water. It can produce up to 127 litres of recycled drinking water each day and can recycle 93% of the waste water. Each scientist on the ISS uses 49 litres of water per week for drinking, preparing food and personal hygiene. (a) (i) On a 60-day ISS mission there are five scientists. Calculate whether the WRS can provide all of the water the five scientists need. Show your working. [2] (ii) One litre of water has a mass of 1 kg. Suggest reasons why the water required by the scientists is not transported from Earth to the ISS. ........................................................................................................................................... ........................................................................................................................................... ........................................................................................................................................... ..................................................................................................................................... [2] (iii) Some of the waste water used by the WRS comes from respiration. Explain the meaning of aerobic respiration. ........................................................................................................................................... ........................................................................................................................................... ........................................................................................................................................... ........................................................................................................................................... ........................................................................................................................................... ..................................................................................................................................... [3] (b) The WRS uses a process called distillation to remove impurities from the waste water. Electricity is used to break down any organic matter. The process needs very high temperatures and pressures. Globally, one in three people do not have access to safe drinking water. Discuss the benefits and limitations of using the WRS to provide safe drinking water to people on Earth. ................................................................................................................................................... ................................................................................................................................................... ................................................................................................................................................... ................................................................................................................................................... ................................................................................................................................................... ................................................................................................................................................... ................................................................................................................................................... ................................................................................................................................................... ................................................................................................................................................... ............................................................................................................................................. [5] (c) Fig. 4.1 shows a solar still. A solar still uses processes in the water cycle to produce drinking water. Sun clear plastic dome salt clean water water collection Fig. 4.1 Use Fig. 4.1 and processes in the water cycle to explain how the solar still can produce drinking water. ................................................................................................................................................... ................................................................................................................................................... ................................................................................................................................................... ................................................................................................................................................... ................................................................................................................................................... ............................................................................................................................................. [3] (d) Explain how a lack of water can lead to malnutrition. ................................................................................................................................................... ................................................................................................................................................... ................................................................................................................................................... ................................................................................................................................................... ................................................................................................................................................... ............................................................................................................................................. [3] [Total: 18]
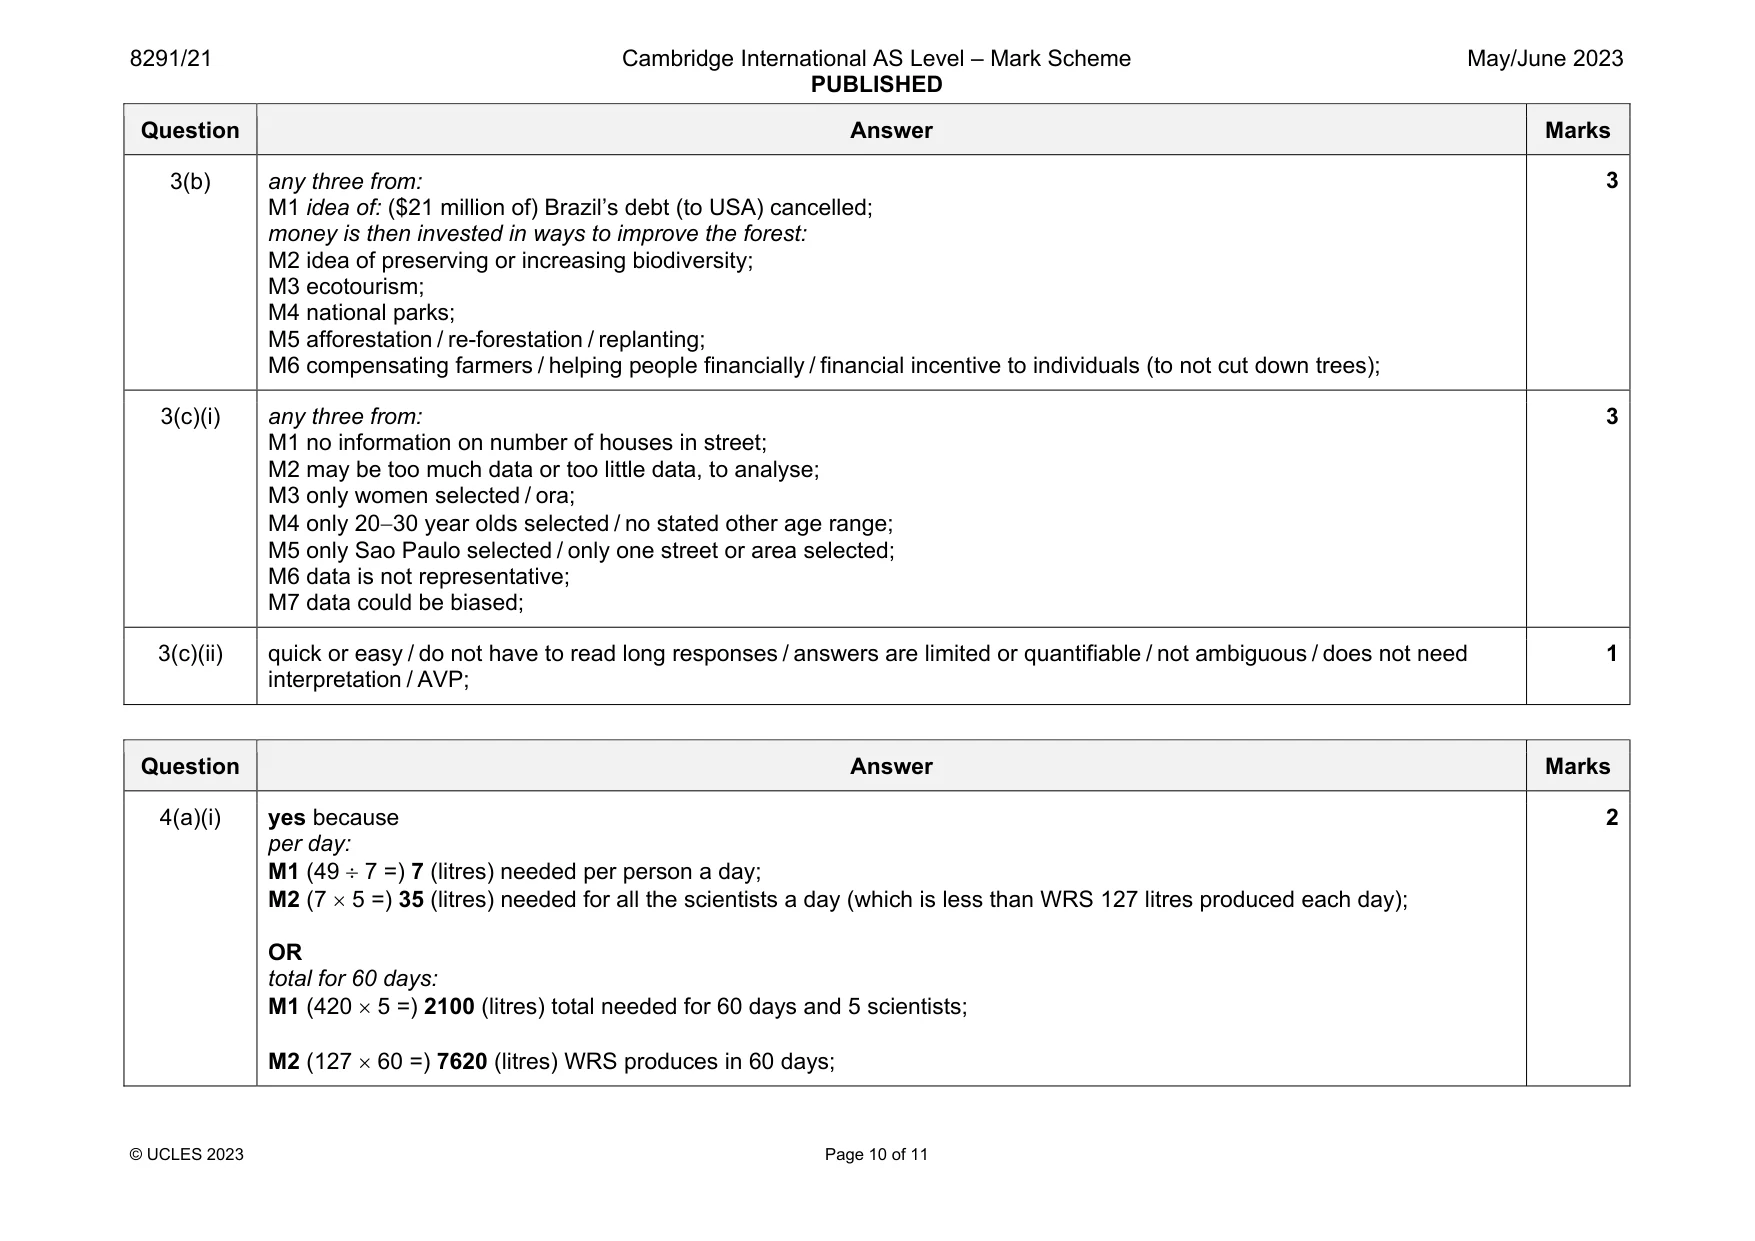
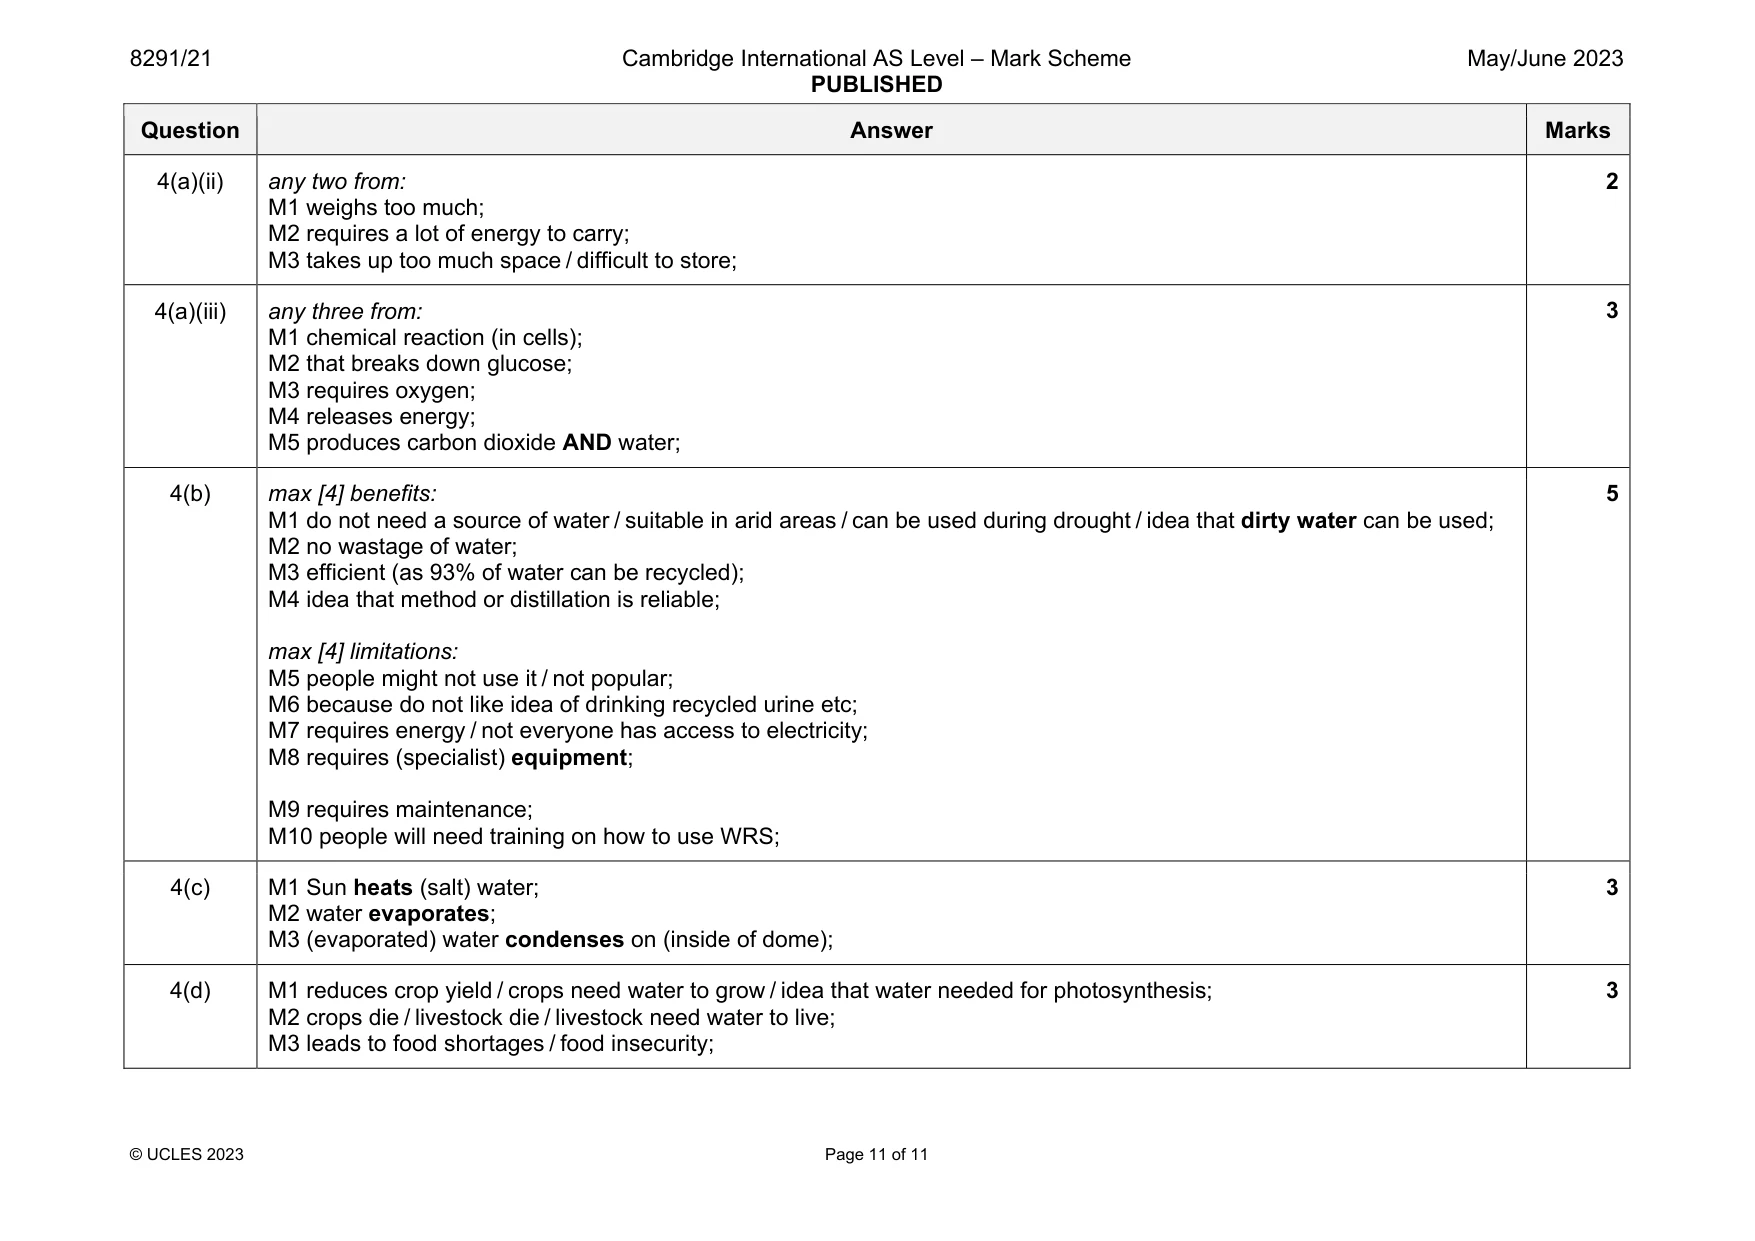
Mark scheme: 4(a)(i) yes because per day: M1 (49 7 =) 7 (litres) needed per person a day; M2 (7 5 =) 35 (litres) needed for all the scientists a day (which is less than WRS 127 litres produced each day); OR total for 60 days: M1 (420 5 =) 2100 (litres) total needed for 60 days and 5 scientists; M2 (127 60 =) 7620 (litres) WRS produces in 60 days; 2 Question Answer Marks 4(a)(ii) any two from: M1 weighs too much; M2 requires a lot of energy to carry; M3 takes up too much space / difficult to store; 2 4(a)(iii) any three from: M1 chemical reaction (in cells); M2 that breaks down glucose; M3 requires oxygen; M4 releases energy; M5 produces carbon dioxide AND water; 3 4(b) max [4] benefits: M1 do not need a source of water / suitable in arid areas / can be used during drought / idea that dirty water can be used; M2 no wastage of water; M3 efficient (as 93% of water can be recycled); M4 idea that method or distillation is reliable; max [4] limitations: M5 people might not use it / not popular; M6 because do not like idea of drinking recycled urine etc; M7 requires energy / not everyone has access to electricity; M8 requires (specialist) equipment; M9 requires maintenance; M10 people will need training on how to use WRS; 5 4(c) M1 Sun heats (salt) water; M2 water evaporates; M3 (evaporated) water condenses on (inside of dome); 3 4(d) M1 reduces crop yield / crops need water to grow / idea that water needed for photosynthesis; M2 crops die / livestock die / livestock need water to live; M3 leads to food shortages / food insecurity; 3
What was in this paper
The subtopics covered by these 4 questions, and how many questions each got. Open one in a new tab to see every Cambridge question on it.
What you needed in this session
Cambridge’s own grade thresholds for 2023 May/June, Paper 2 · Variant 1. A higher threshold means an easier paper — the bar moves with how the cohort did.