Cambridge A Level Environmental Management (AS only) 8291 — 2020 Oct/Nov Paper 2 · Variant 1
8291/21/O/N/20 · 5 questions · 80 marks · ≈90 min
The question paper and its mark scheme, free to read here and free to download. This is Cambridge’s own paper, exactly as it was sat.
Question paper12 pages

Mark scheme14 pages
Answers below. Sit the paper first if you are practising.
Questions as text
Q1 · How the mass of plants changes during primary succession following a major environmental…
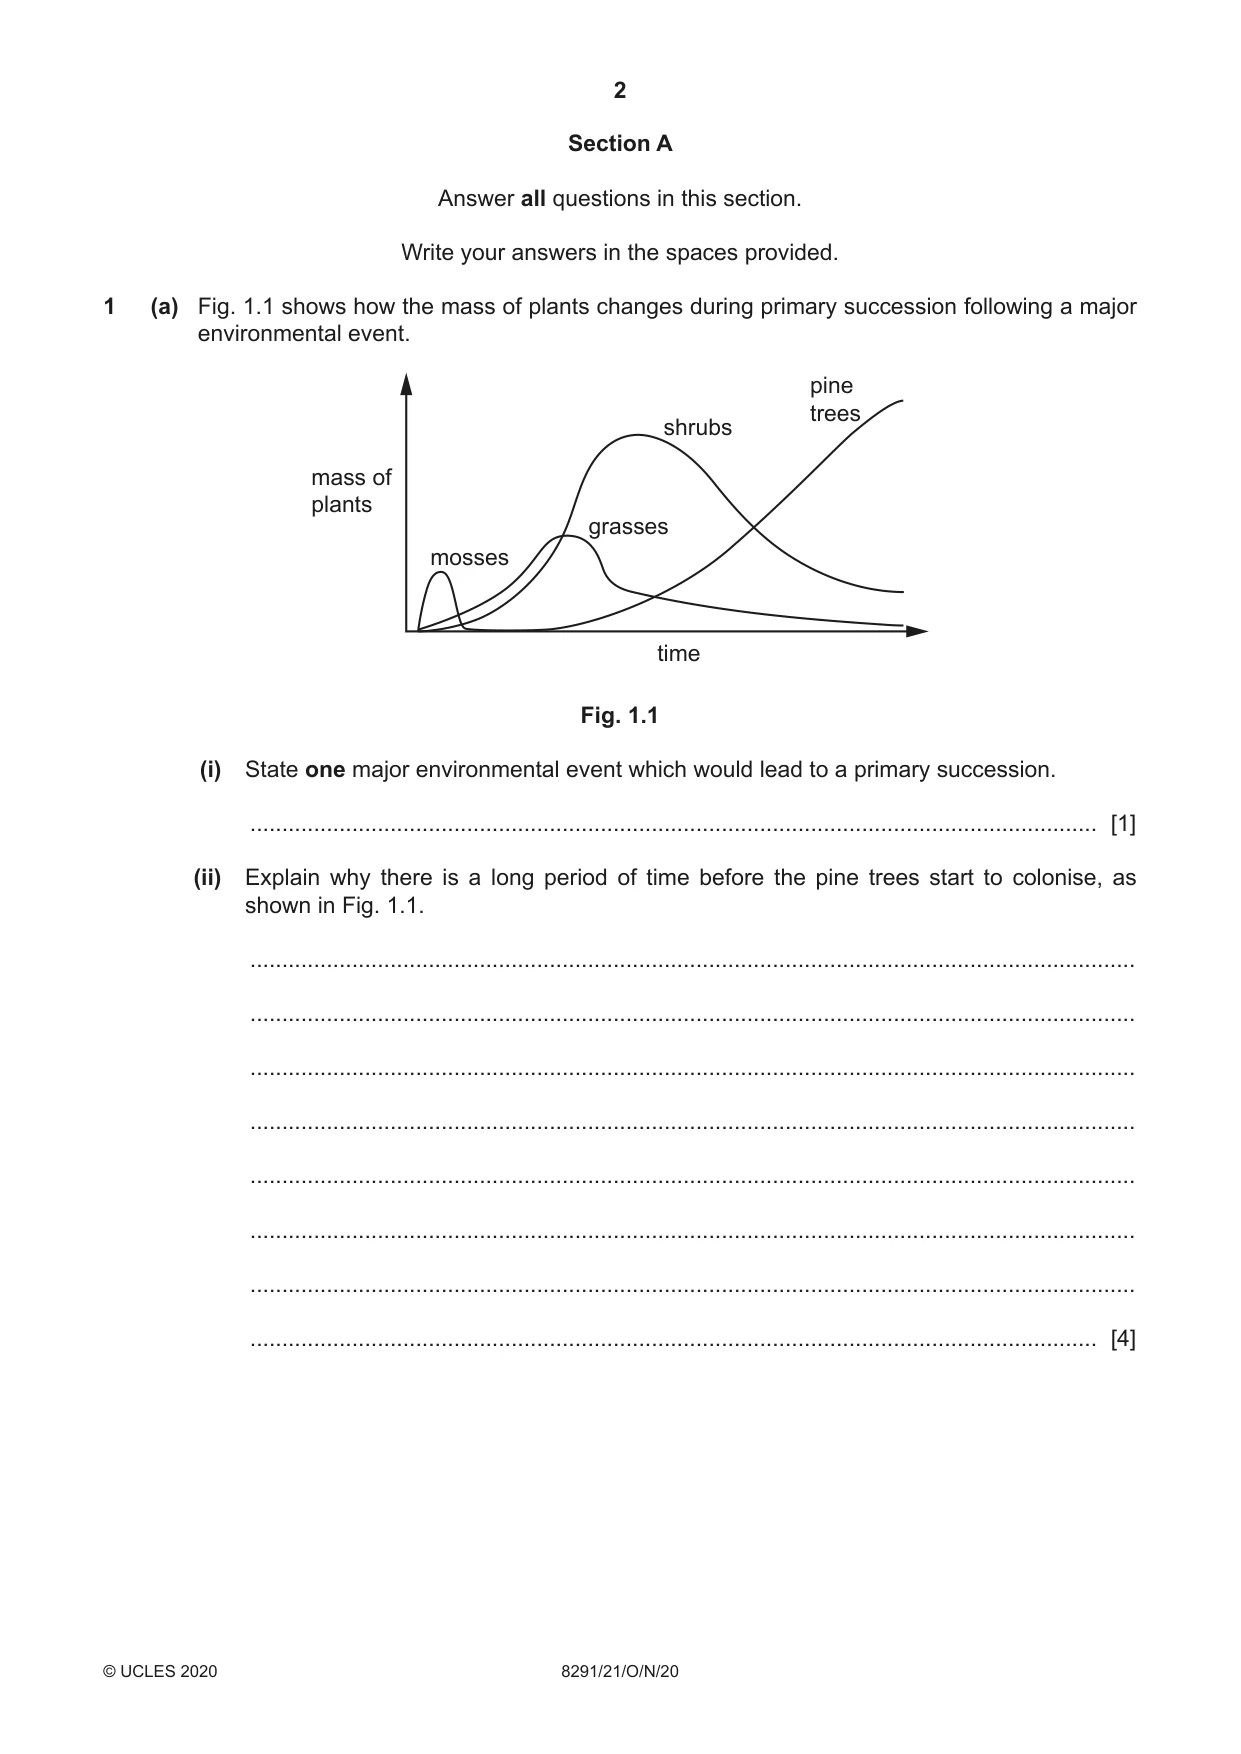
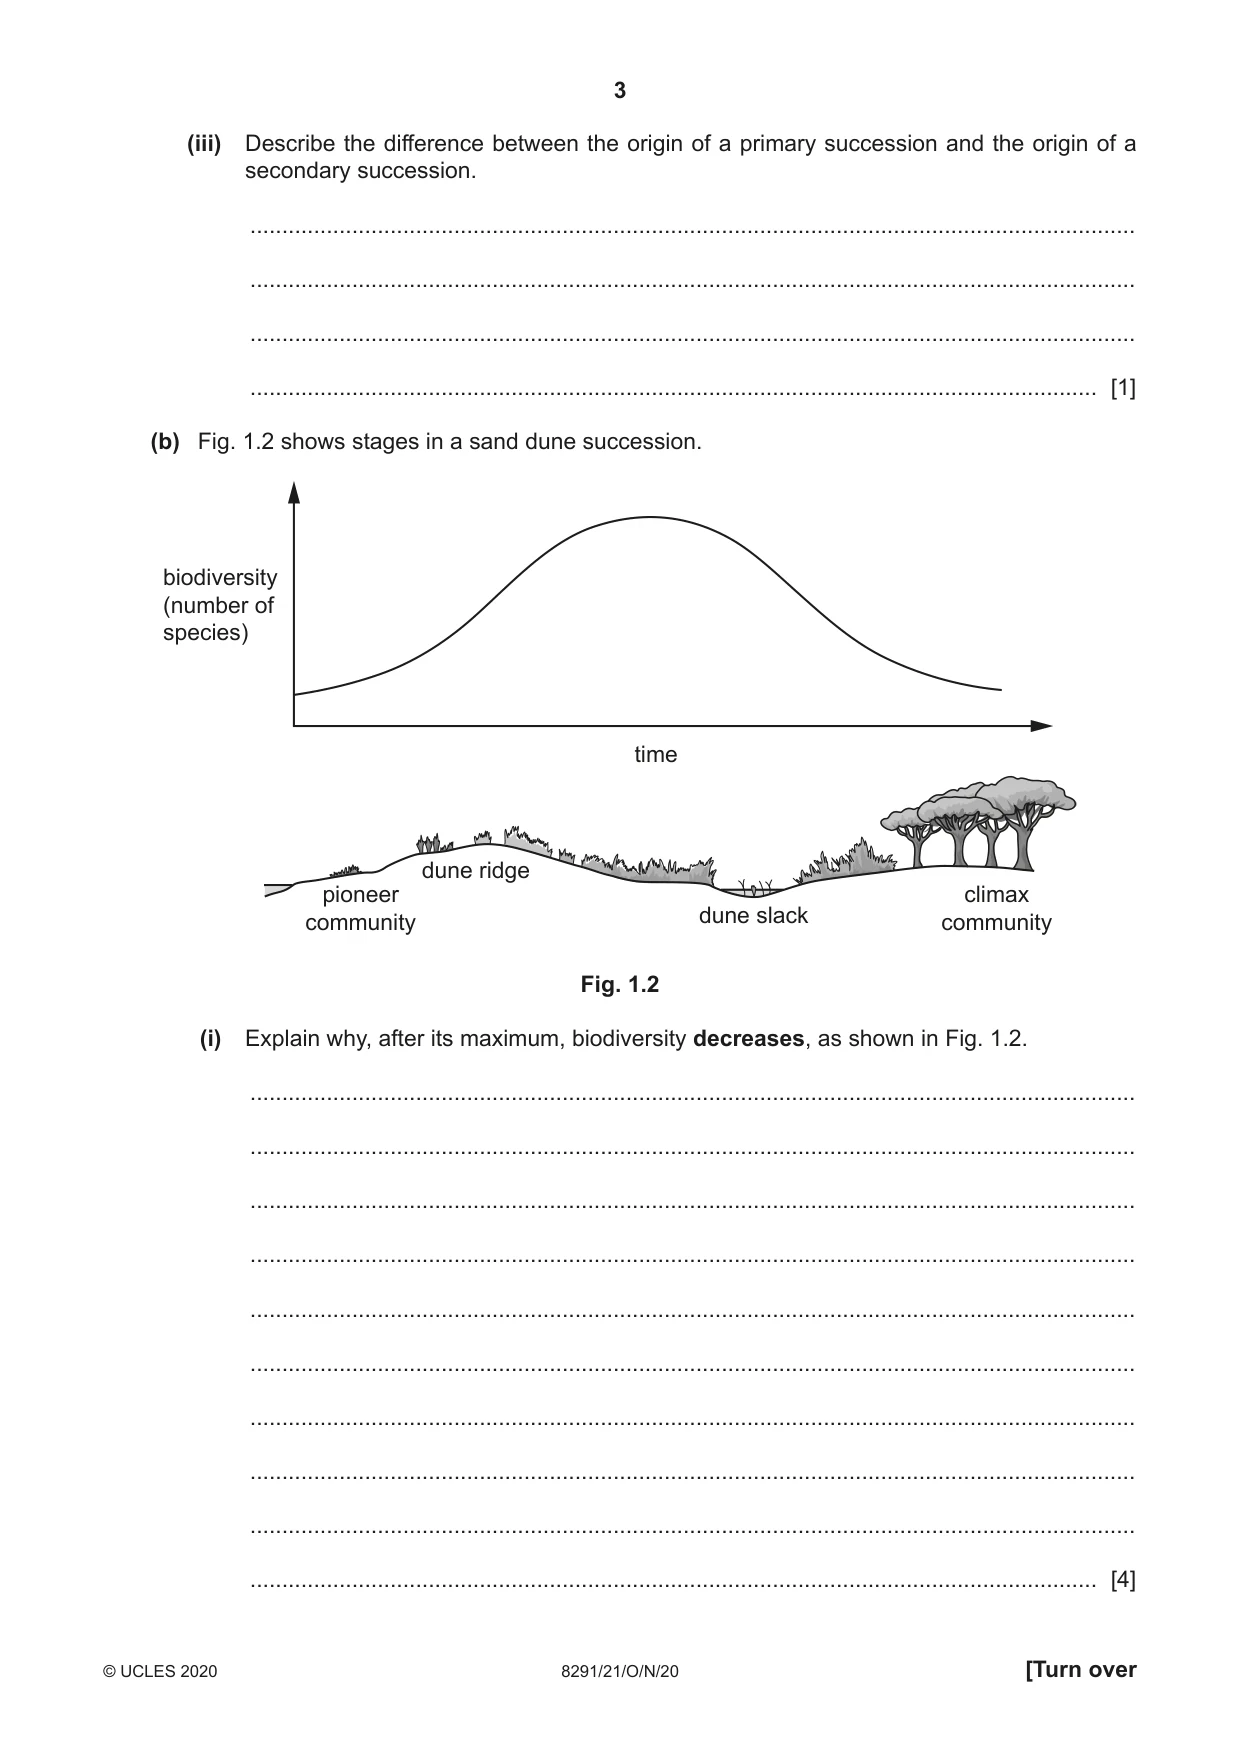
1 (a) Fig. 1.1 shows how the mass of plants changes during primary succession following a major environmental event. pine trees shrubs mass of plants grasses mosses time Fig. 1.1 (i) State one major environmental event which would lead to a primary succession. ..................................................................................................................................... [1] (ii) Explain why there is a long period of time before the pine trees start to colonise, as shown in Fig. 1.1. ........................................................................................................................................... ........................................................................................................................................... ........................................................................................................................................... ........................................................................................................................................... ........................................................................................................................................... ........................................................................................................................................... ........................................................................................................................................... ..................................................................................................................................... [4] (iii) Describe the difference between the origin of a primary succession and the origin of a secondary succession. ........................................................................................................................................... ........................................................................................................................................... ........................................................................................................................................... ..................................................................................................................................... [1] (b) Fig. 1.2 shows stages in a sand dune succession. biodiversity (number of species) time dune ridge pioneer climax dune slack community community Fig. 1.2 (i) Explain why, after its maximum, biodiversity decreases, as shown in Fig. 1.2. ........................................................................................................................................... ........................................................................................................................................... ........................................................................................................................................... ........................................................................................................................................... ........................................................................................................................................... ........................................................................................................................................... ........................................................................................................................................... ........................................................................................................................................... ........................................................................................................................................... ..................................................................................................................................... [4] (ii) Name two abiotic factors and describe how they differ at the pioneer stage and at the climax community stage shown in Fig. 1.2. abiotic factor ................................................. ........................................................................................................................................... ........................................................................................................................................... abiotic factor ................................................. ........................................................................................................................................... ........................................................................................................................................... [4] (iii) Explain why it is important to conserve and manage ecosystems such as the sand dune ecosystem. ........................................................................................................................................... ........................................................................................................................................... ........................................................................................................................................... ........................................................................................................................................... ........................................................................................................................................... ........................................................................................................................................... ........................................................................................................................................... ..................................................................................................................................... [4] (c) Suggest how arrested succession can occur in an ecosystem. ................................................................................................................................................... ................................................................................................................................................... ............................................................................................................................................. [2] [Total: 20]
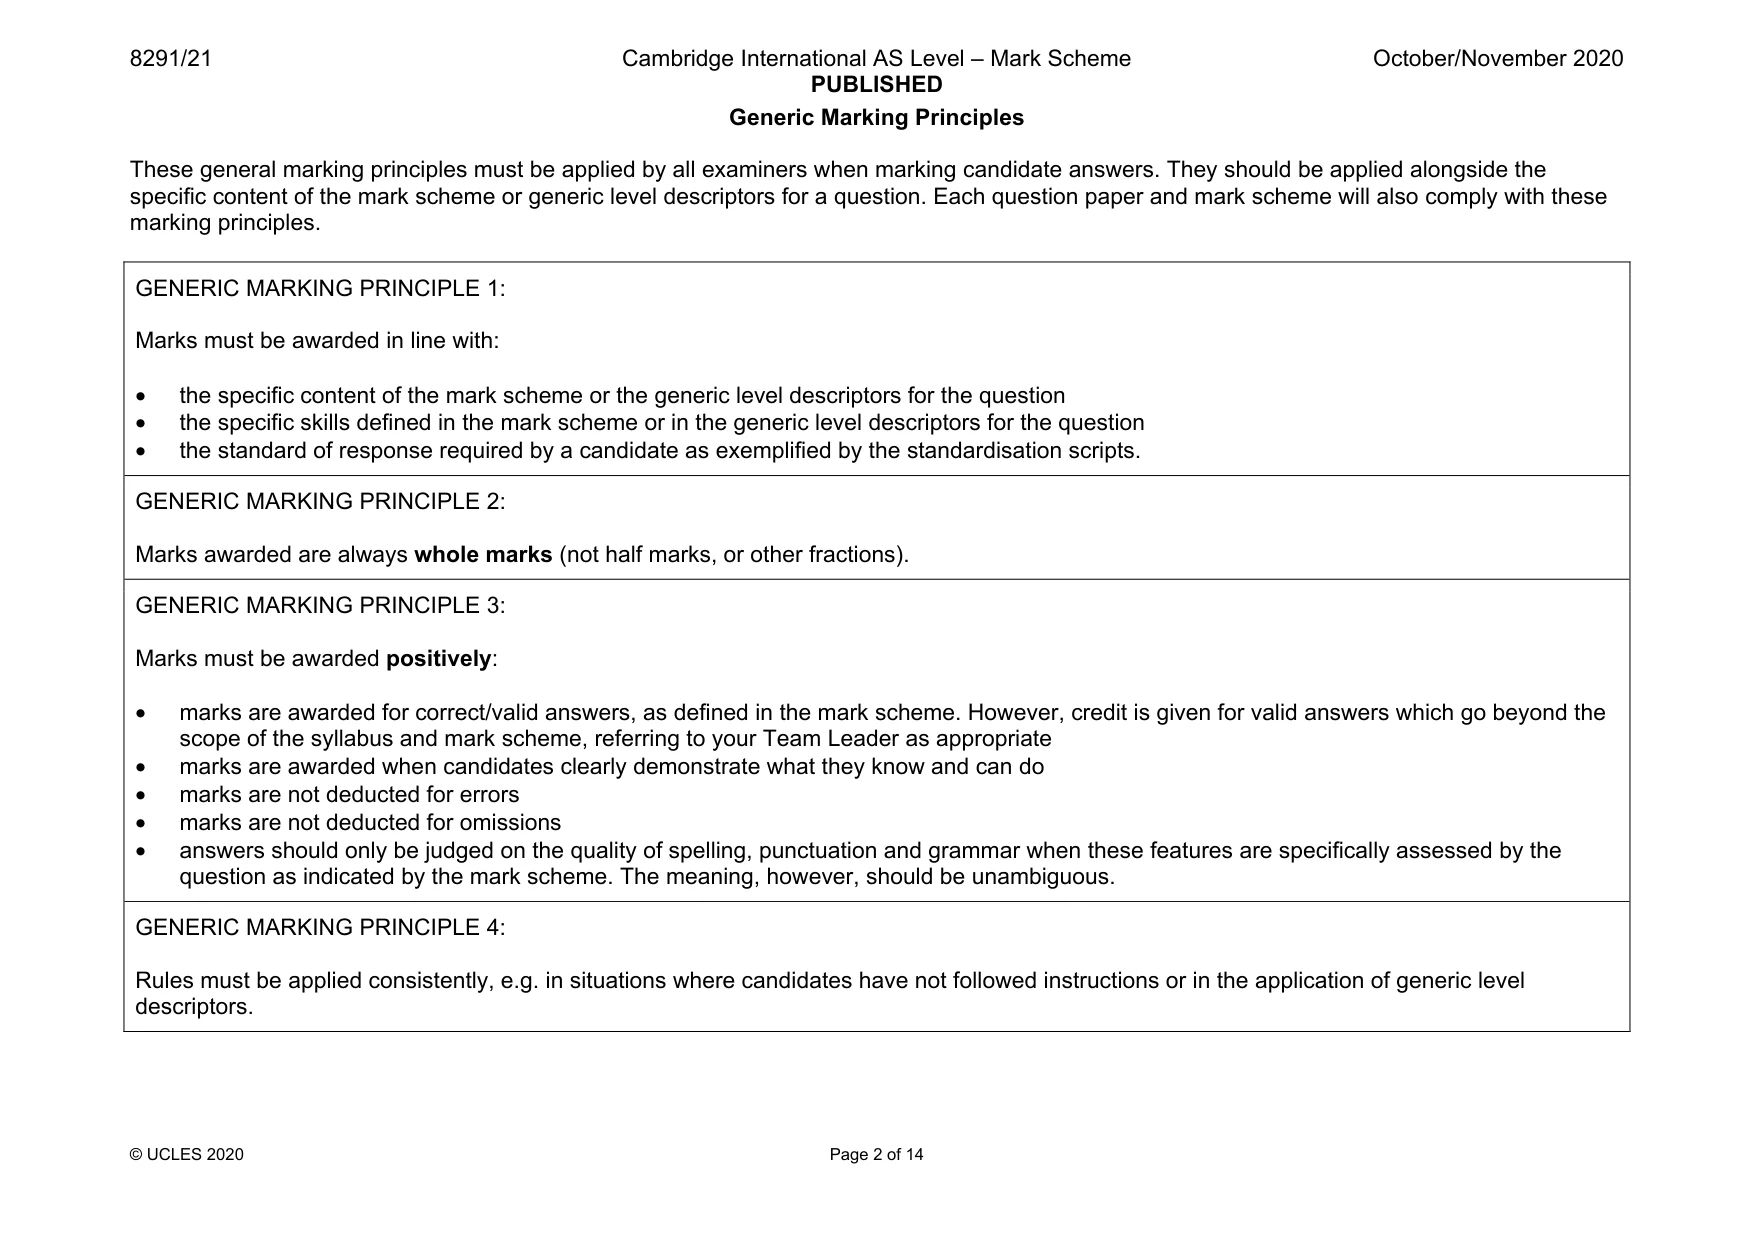
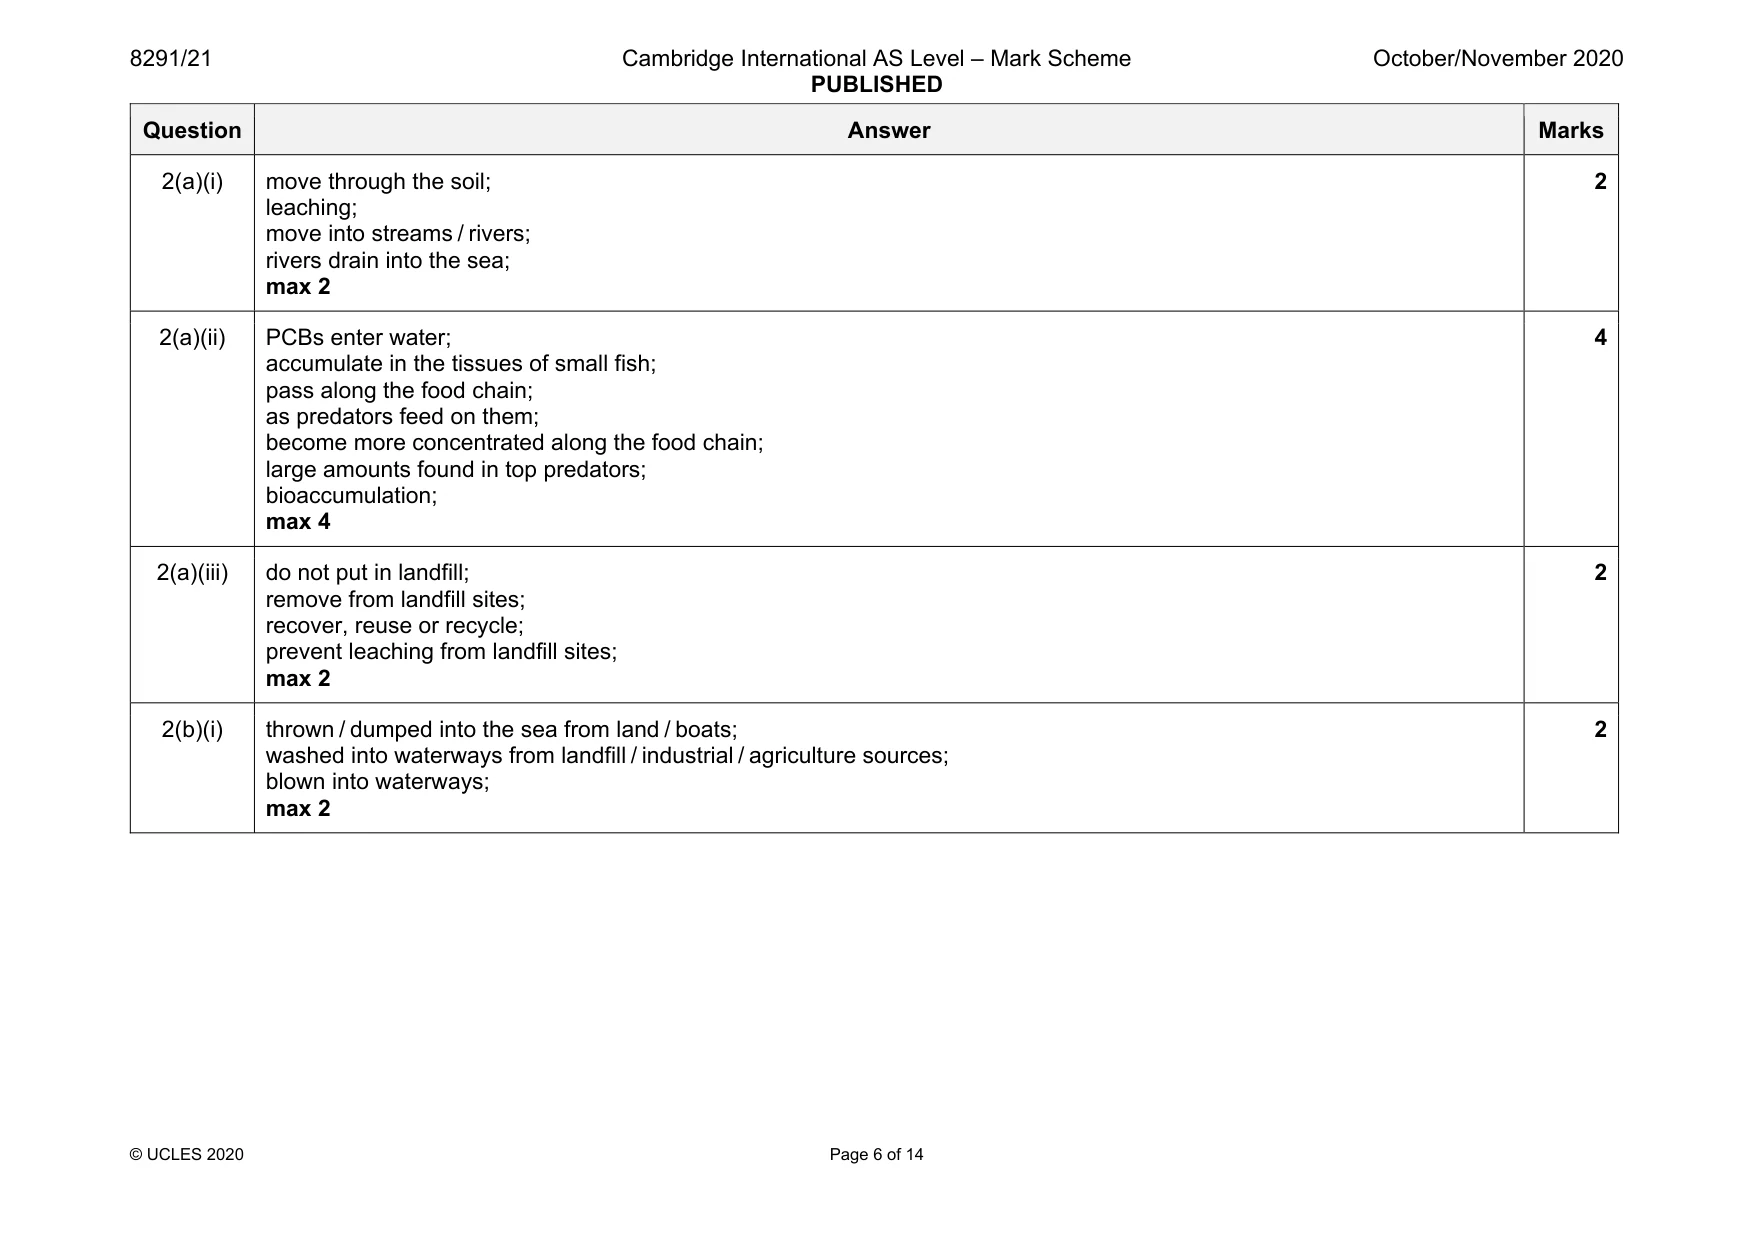
Mark scheme: 1(a)(i) lava flow; volcano eruption; retreating glacier; newly formed sand dune; abandoned strip mine / opencast mine; mining spoil / waste heap; max 1 1(a)(ii) need to establish fertile soil; pioneer species grow; die / lose leaves; leaves rot; due to decomposers; increasing nutrients in soil; more advanced species can colonise max 4 4 1(a)(iii) primary starts from lifeless region; secondary starts from area previously inhabited; valid example described; max 1 1 1(b)(i) biodiversity changes as the biotic and abiotic factors change; named examples; pioneer species bind the dune; humus is added; soil fertility increases; other soil factors change, e.g. soil water; competition between species increases; new species come in and survive / some species can’t survive; some species out-competed for nutrients / sunlight, etc.; climax community reached; climax species shade out / out-compete others; some release toxins into the soil to remove competitors; max 4 4 Question Answer Marks 1(b)(ii) temperature; more extreme in pioneer stage / cooler in climax stage; water; dry in pioneer stage / moister in climax stage; soil; dry and sandy in pioneer stage / moist and loamy in climax stage; nutrients; such as nitrate and phosphate increase as succession continues; max 4 4 1(b)(iii) unique habitat; protect rare species; maintain biodiversity; important role in coastal erosion; resist action of wind / waves; prevent salt water intrusion; reduce risk of salinization of soils; dune succession leads to fertile soil development inland; max 4 4 1(c) arrested succession caused by human interference / natural event; named example; 2
Q2 · An extract from a scientific report published on the internet
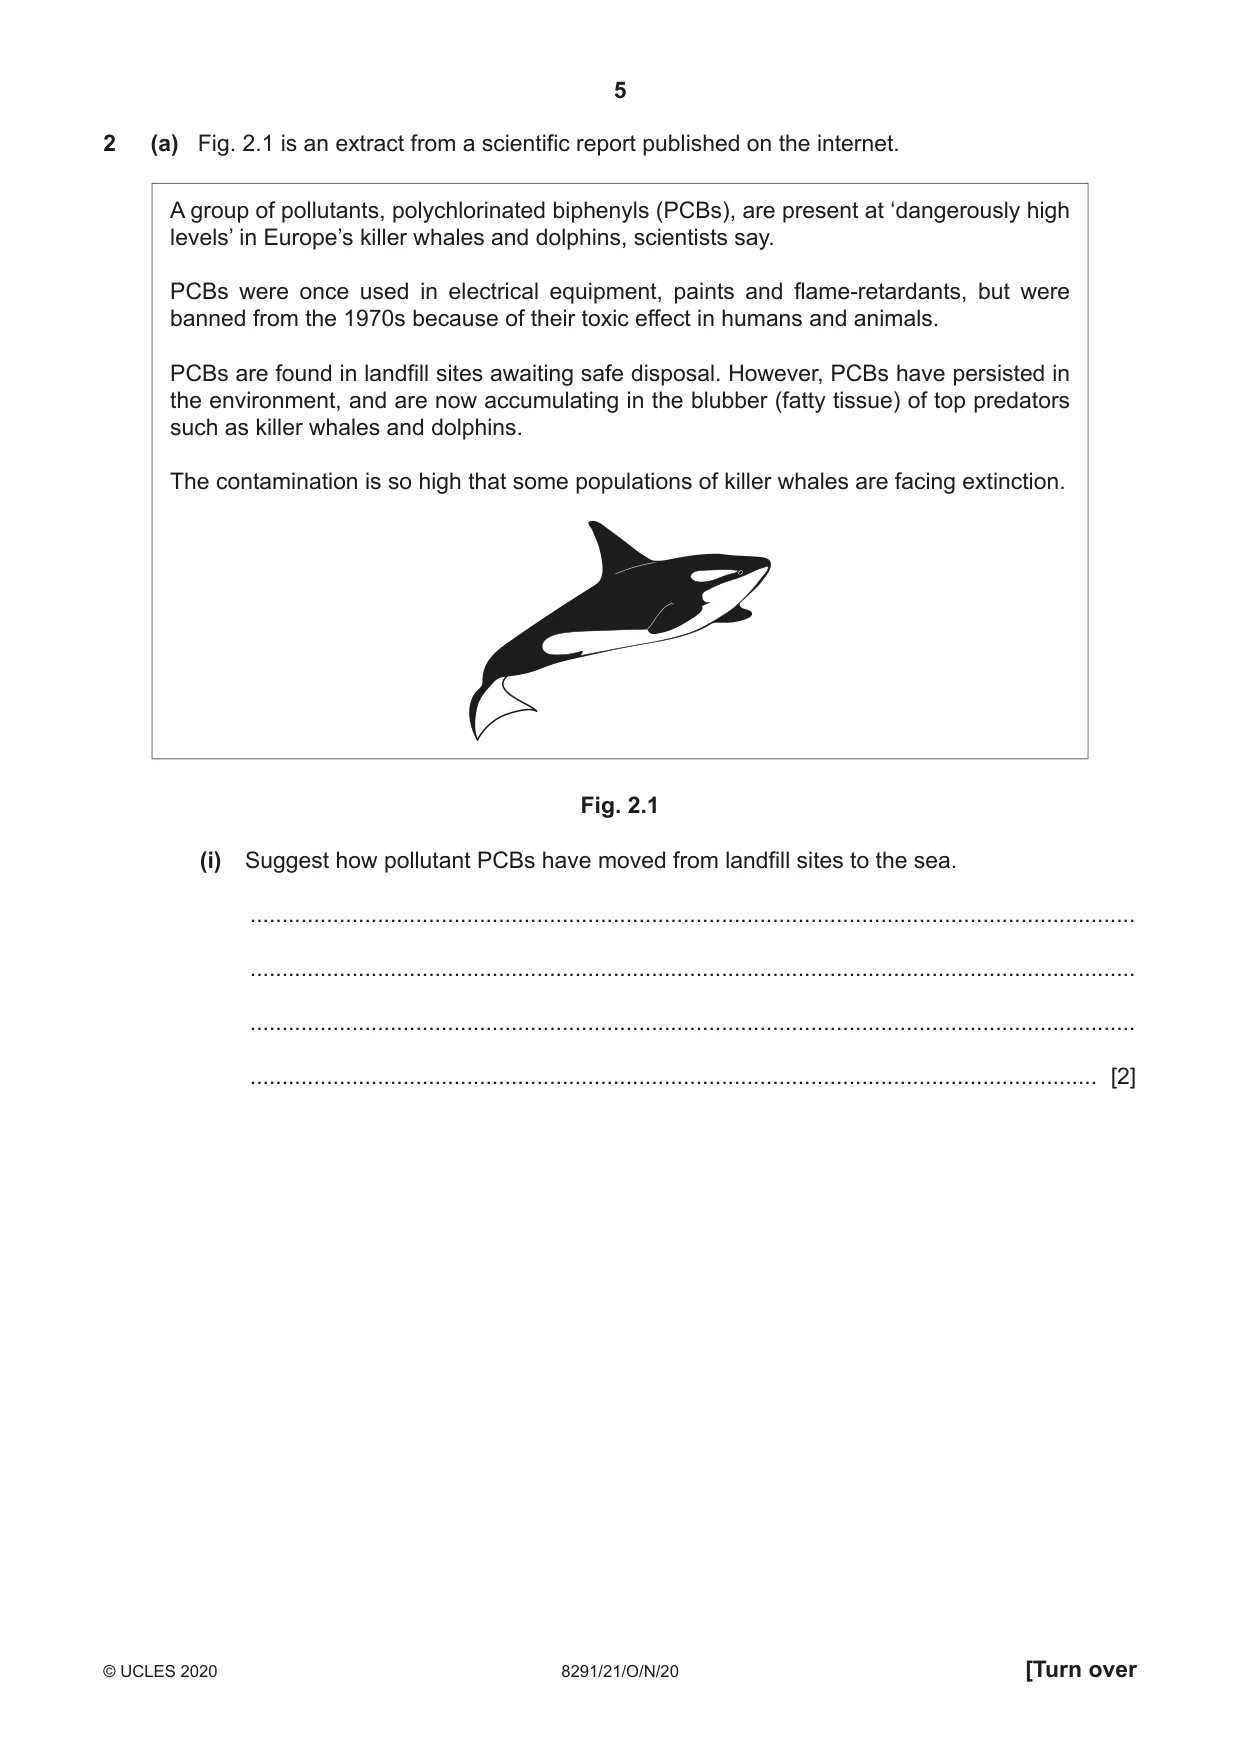
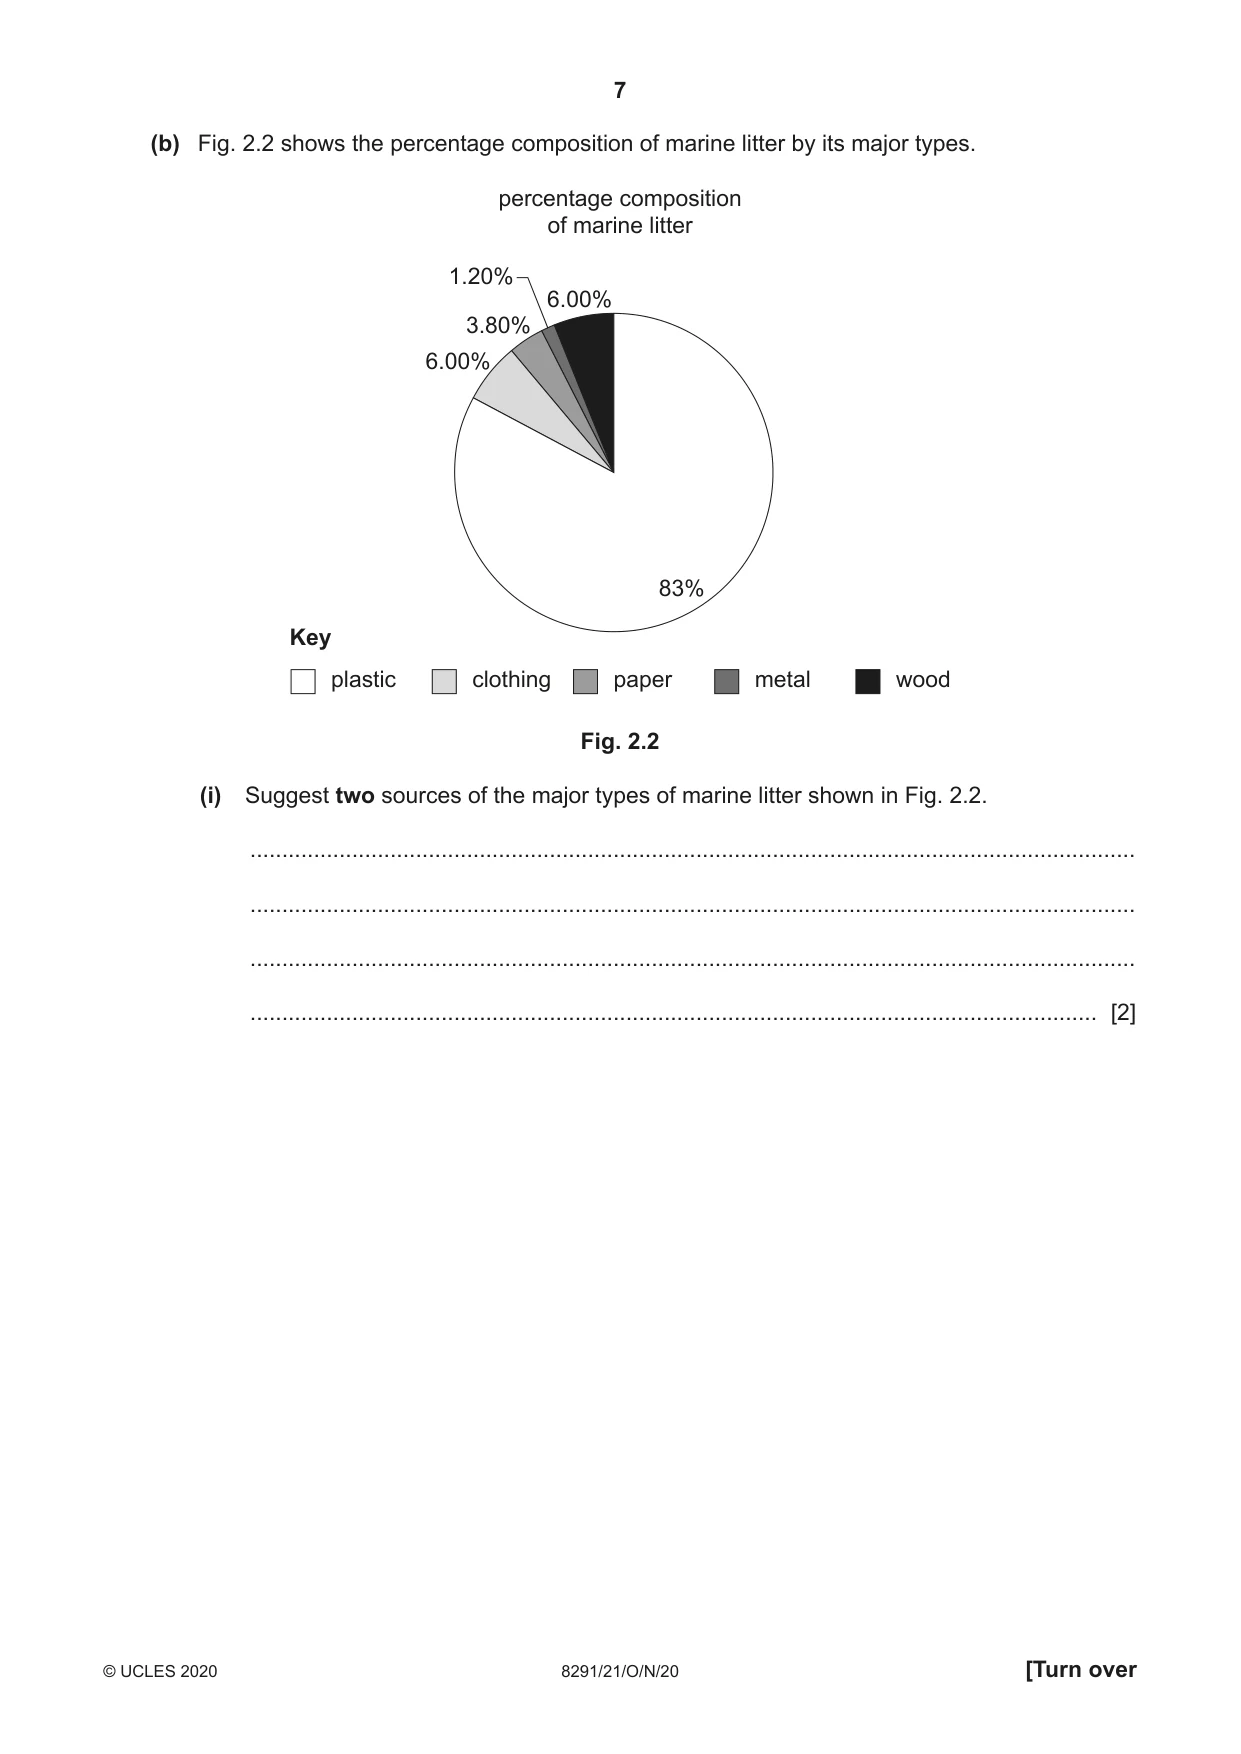
2 (a) Fig. 2.1 is an extract from a scientific report published on the internet. A group of pollutants, polychlorinated biphenyls (PCBs), are present at ‘dangerously high levels’ in Europe’s killer whales and dolphins, scientists say. PCBs were once used in electrical equipment, paints and flame-retardants, but were banned from the 1970s because of their toxic effect in humans and animals. PCBs are found in landfill sites awaiting safe disposal. However, PCBs have persisted in the environment, and are now accumulating in the blubber (fatty tissue) of top predators such as killer whales and dolphins. The contamination is so high that some populations of killer whales are facing extinction. Fig. 2.1 (i) Suggest how pollutant PCBs have moved from landfill sites to the sea. ........................................................................................................................................... ........................................................................................................................................... ........................................................................................................................................... ..................................................................................................................................... [2] (ii) Explain how pollutant PCBs are accumulating in top predators such as the killer whale and dolphins. ........................................................................................................................................... ........................................................................................................................................... ........................................................................................................................................... ........................................................................................................................................... ........................................................................................................................................... ........................................................................................................................................... ........................................................................................................................................... ..................................................................................................................................... [4] (iii) Suggest two ways the problem of pollutant PCBs could be reduced. ........................................................................................................................................... ........................................................................................................................................... ........................................................................................................................................... ..................................................................................................................................... [2] (b) Fig. 2.2 shows the percentage composition of marine litter by its major types. percentage composition of marine litter 1.20% 6.00% 3.80% 6.00% 83% Key plastic clothing paper metal wood Fig. 2.2 (i) Suggest two sources of the major types of marine litter shown in Fig. 2.2. ........................................................................................................................................... ........................................................................................................................................... ........................................................................................................................................... ..................................................................................................................................... [2] (ii) Describe three environmental problems caused by the major types of marine litter shown in Fig. 2.2. ........................................................................................................................................... ........................................................................................................................................... ........................................................................................................................................... ........................................................................................................................................... ........................................................................................................................................... ........................................................................................................................................... ........................................................................................................................................... ........................................................................................................................................... ........................................................................................................................................... ........................................................................................................................................... ........................................................................................................................................... ..................................................................................................................................... [6] (iii) Describe two strategies to prevent the increase in marine litter. ........................................................................................................................................... ........................................................................................................................................... ........................................................................................................................................... ........................................................................................................................................... ........................................................................................................................................... ........................................................................................................................................... ........................................................................................................................................... ..................................................................................................................................... [4] [Total: 20]
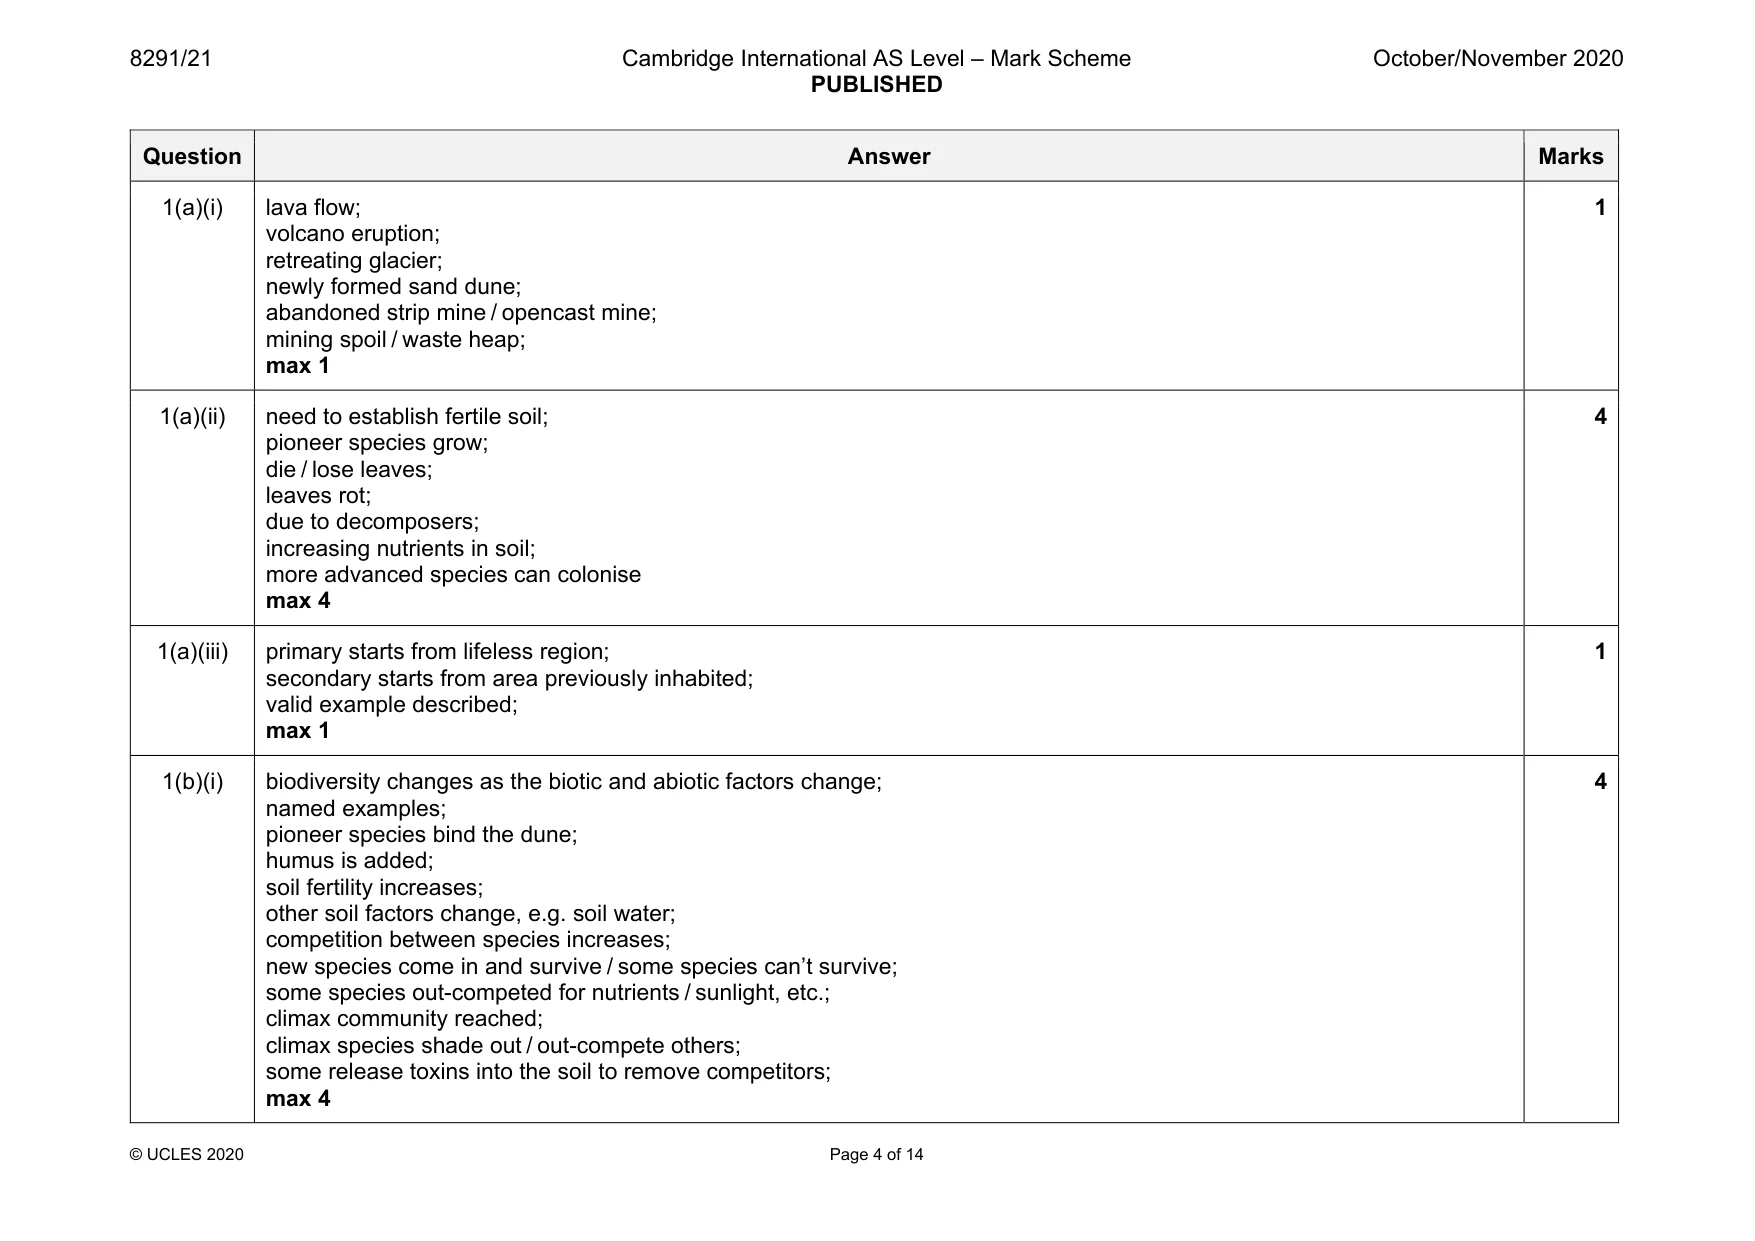
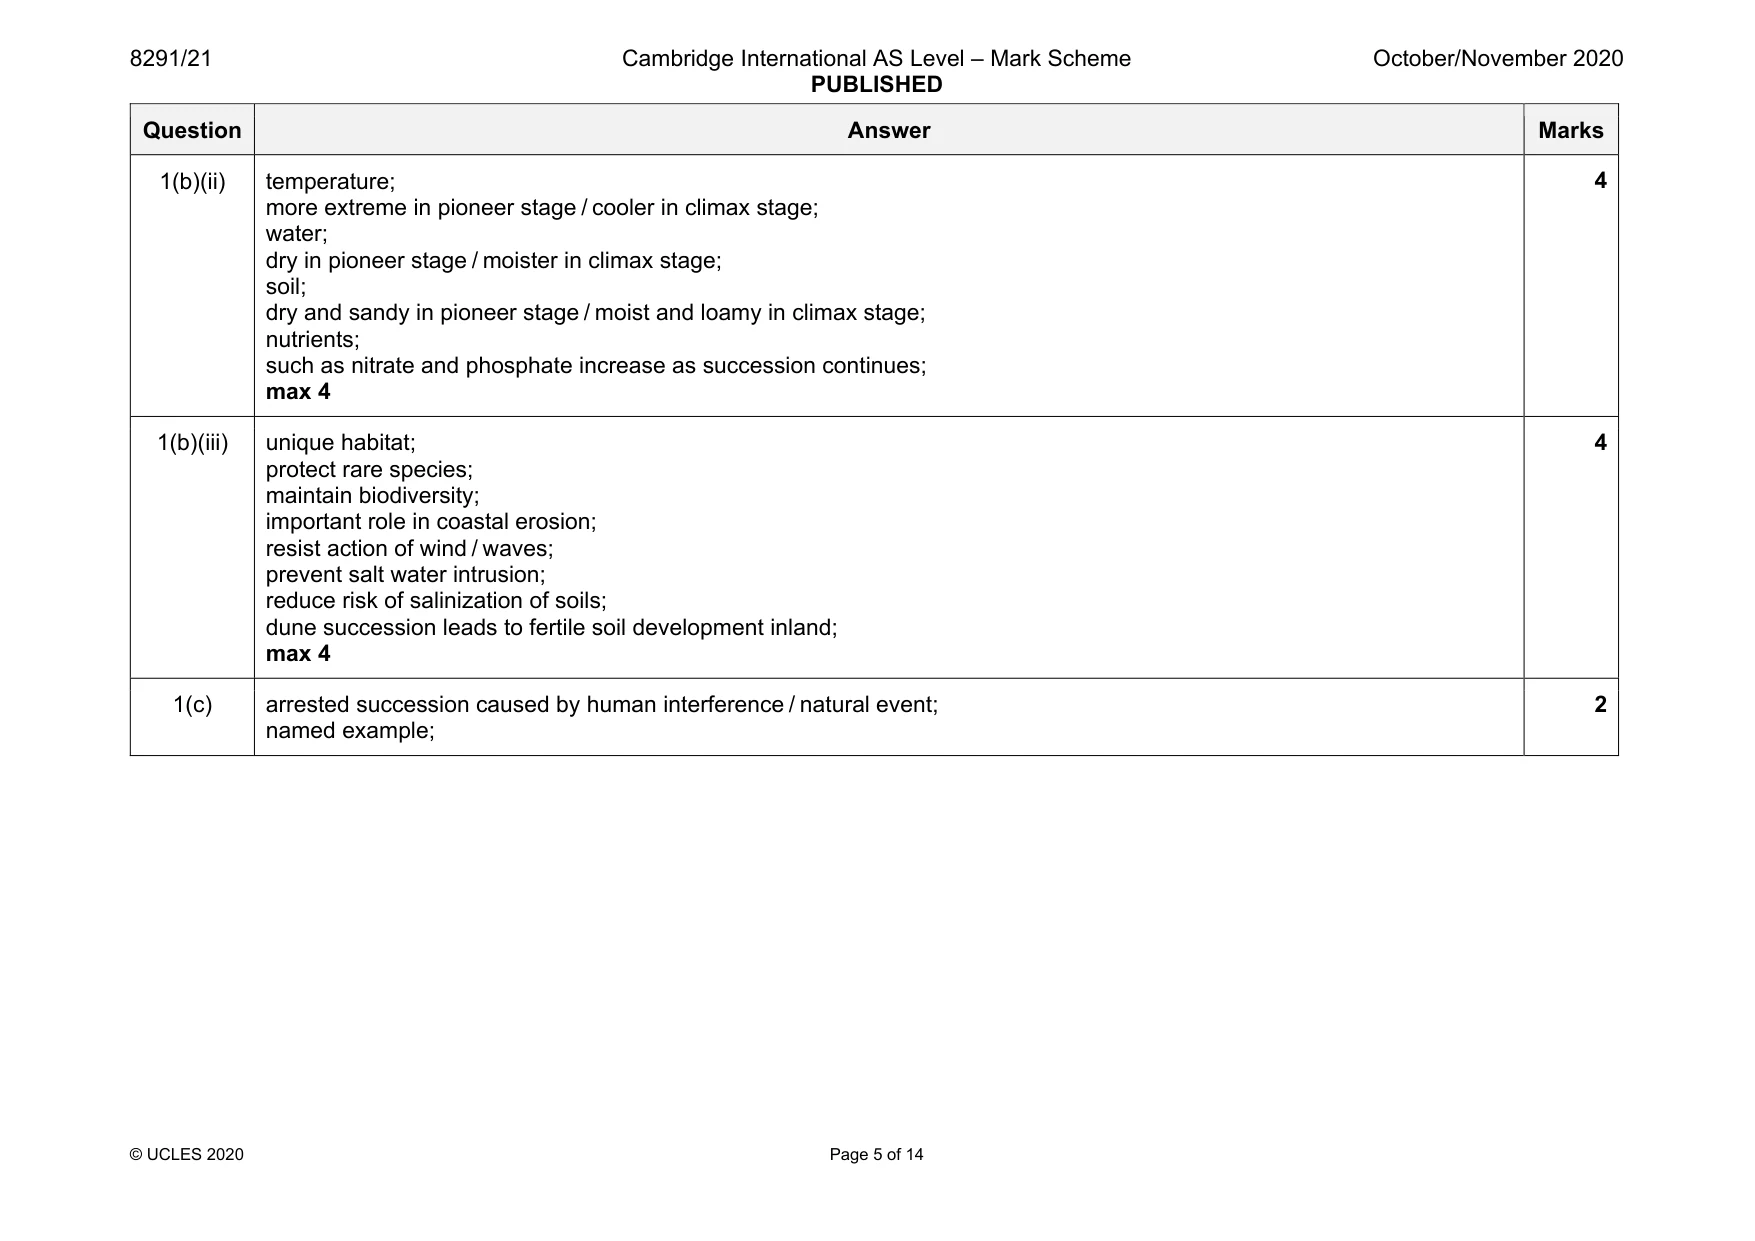
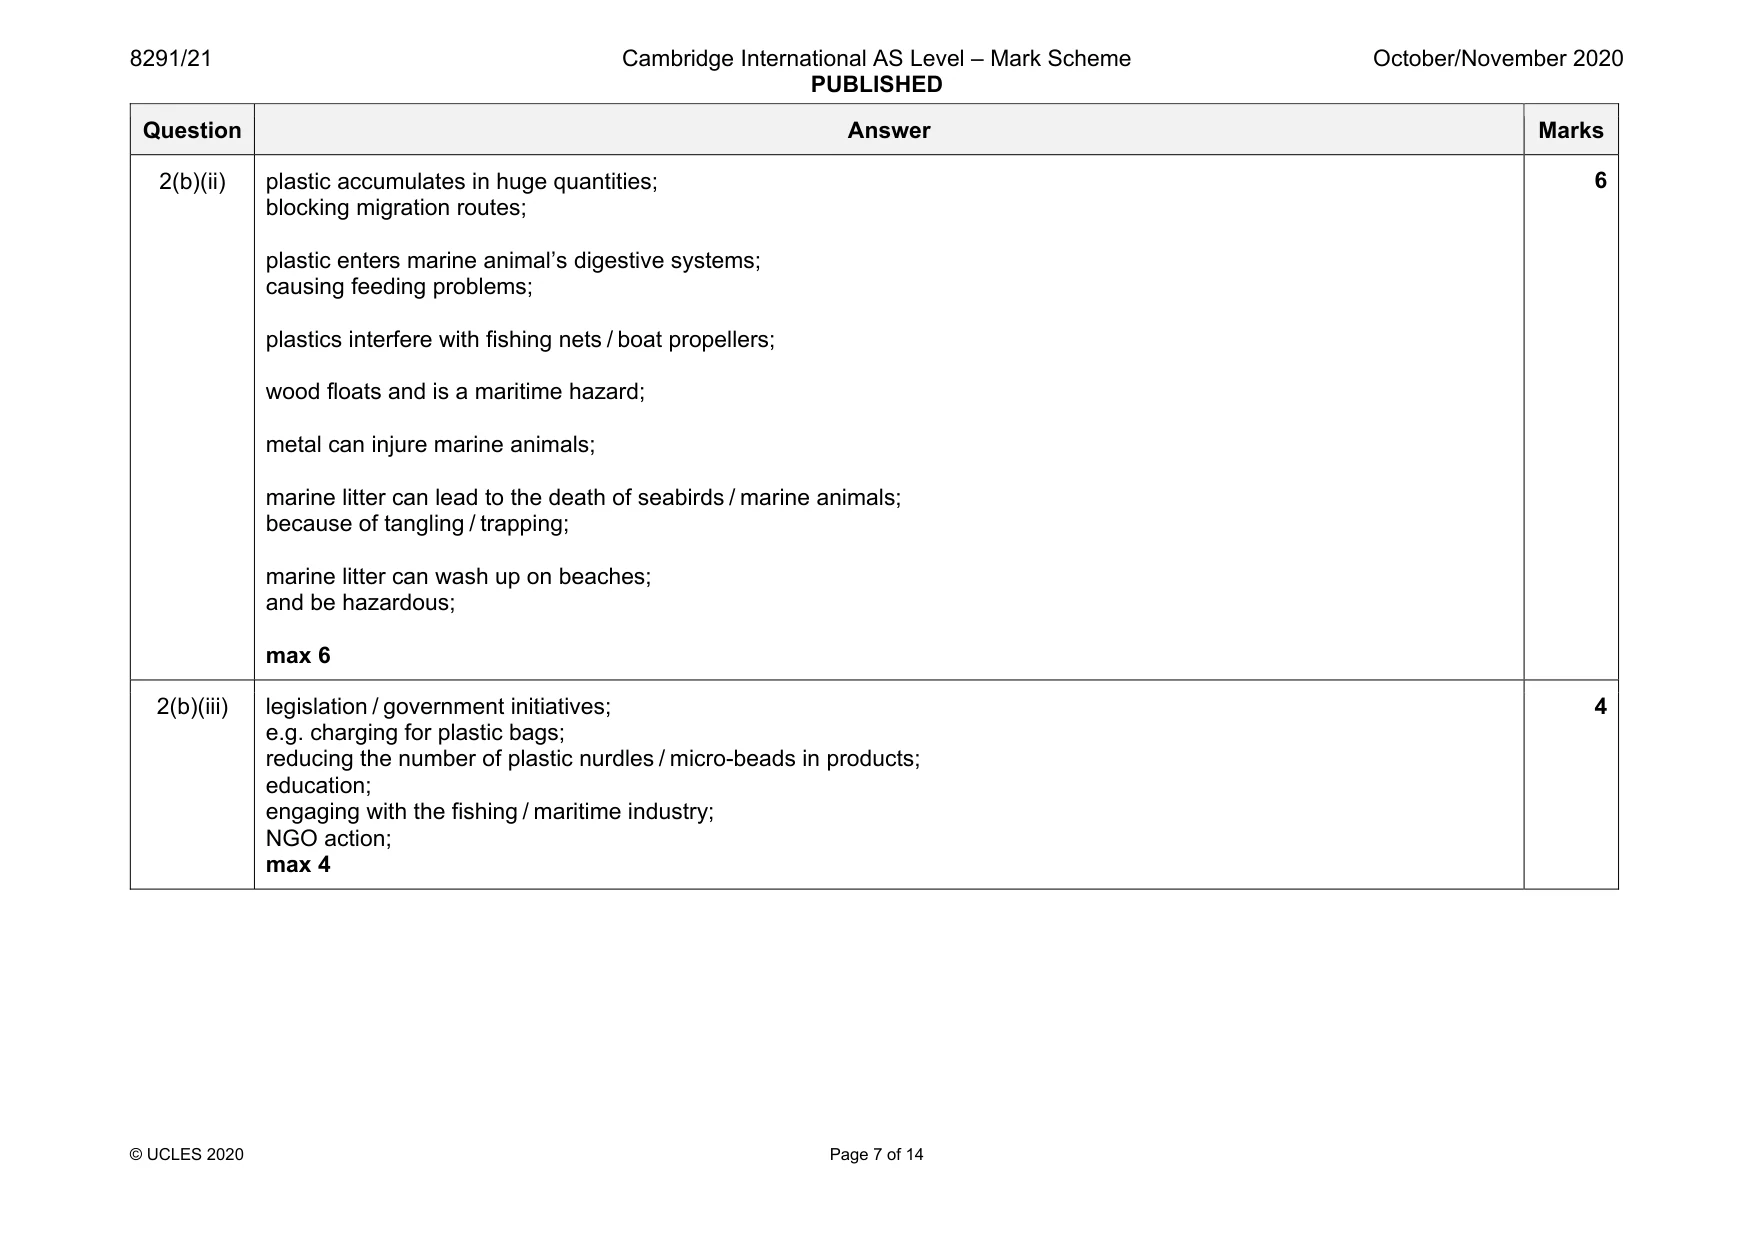
Mark scheme: 2(a)(i) move through the soil; leaching; move into streams / rivers; rivers drain into the sea; max 2 2 2(a)(ii) PCBs enter water; accumulate in the tissues of small fish; pass along the food chain; as predators feed on them; become more concentrated along the food chain; large amounts found in top predators; bioaccumulation; max 4 4 2(a)(iii) do not put in landfill; remove from landfill sites; recover, reuse or recycle; prevent leaching from landfill sites; max 2 2 2(b)(i) thrown / dumped into the sea from land / boats; washed into waterways from landfill / industrial / agriculture sources; blown into waterways; max 2 2 Question Answer Marks 2(b)(ii) plastic accumulates in huge quantities; blocking migration routes; plastic enters marine animal’s digestive systems; causing feeding problems; plastics interfere with fishing nets / boat propellers; wood floats and is a maritime hazard; metal can injure marine animals; marine litter can lead to the death of seabirds / marine animals; because of tangling / trapping; marine litter can wash up on beaches; and be hazardous; max 6 6 2(b)(iii) legislation / government initiatives; e.g. charging for plastic bags; reducing the number of plastic nurdles / micro-beads in products; education; engaging with the fishing / maritime industry; NGO action; max 4 4
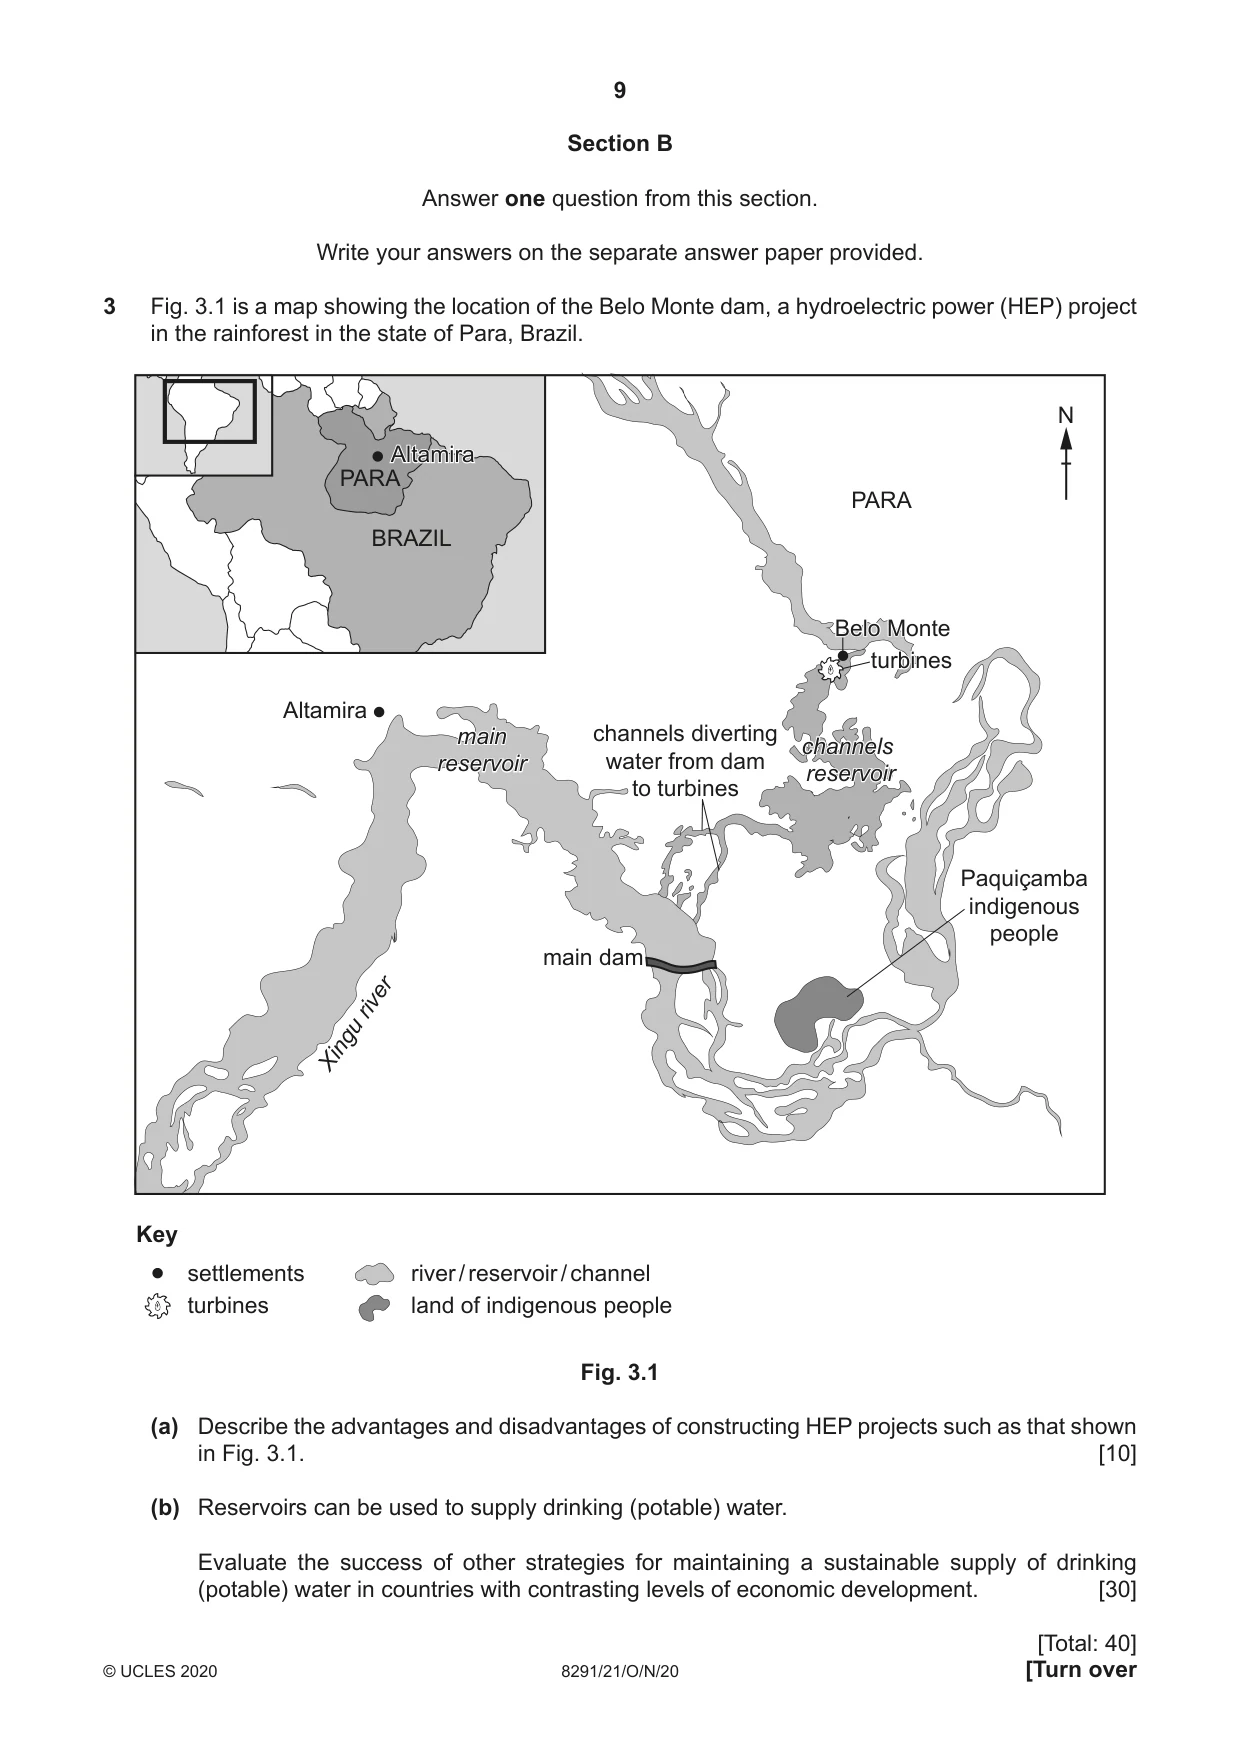
Q3 · A map showing the location of the Belo Monte dam, a hydroelectric power (HEP) project in…
3 Fig. 3.1 is a map showing the location of the Belo Monte dam, a hydroelectric power (HEP) project in the rainforest in the state of Para, Brazil. N AltamiraAltamira PARA PARA BRAZIL BeloBelo MonteMonte turbinesturbines Altamira mainmain channels diverting channelschannels reservoirreservoir water from dam reservoirreservoir to turbines Paquiçamba indigenous people main dam river Xingu Key settlements river / reservoir / channel turbines land of indigenous people Fig. 3.1 (a) Describe the advantages and disadvantages of constructing HEP projects such as that shown in Fig. 3.1. [10] (b) Reservoirs can be used to supply drinking (potable) water. Evaluate the success of other strategies for maintaining a sustainable supply of drinking (potable) water in countries with contrasting levels of economic development. [30]
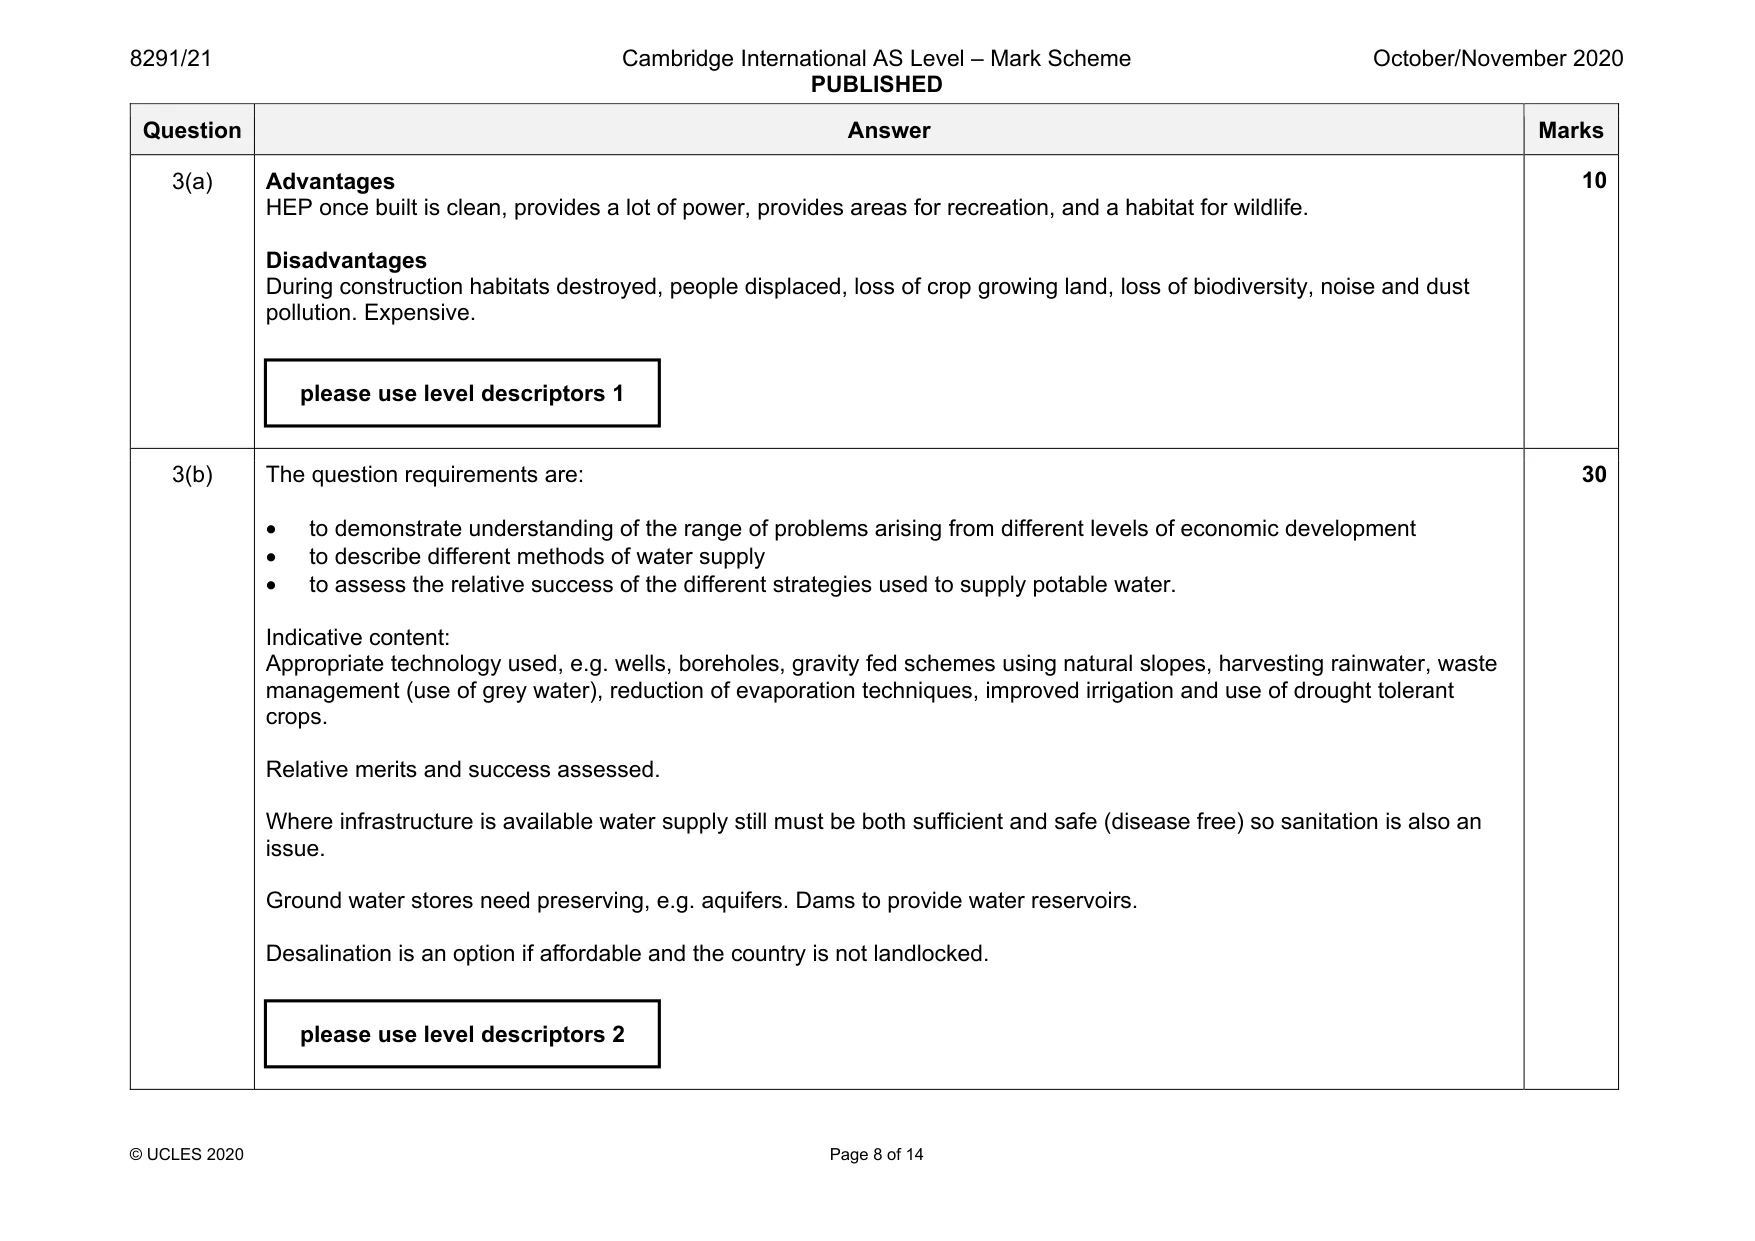
Mark scheme: 3(a) Advantages HEP once built is clean, provides a lot of power, provides areas for recreation, and a habitat for wildlife. Disadvantages During construction habitats destroyed, people displaced, loss of crop growing land, loss of biodiversity, noise and dust pollution. Expensive. 3(b) The question requirements are: • to demonstrate understanding of the range of problems arising from different levels of economic development • to describe different methods of water supply • to assess the relative success of the different strategies used to supply potable water. Indicative content: Appropriate technology used, e.g. wells, boreholes, gravity fed schemes using natural slopes, harvesting rainwater, waste management (use of grey water), reduction of evaporation techniques, improved irrigation and use of drought tolerant crops. Relative merits and success assessed. Where infrastructure is available water supply still must be both sufficient and safe (disease free) so sanitation is also an issue. Ground water stores need preserving, e.g. aquifers. Dams to provide water reservoirs. Desalination is an option if affordable and the country is not landlocked. 30 please use level descriptors 2 please use level descriptors 1
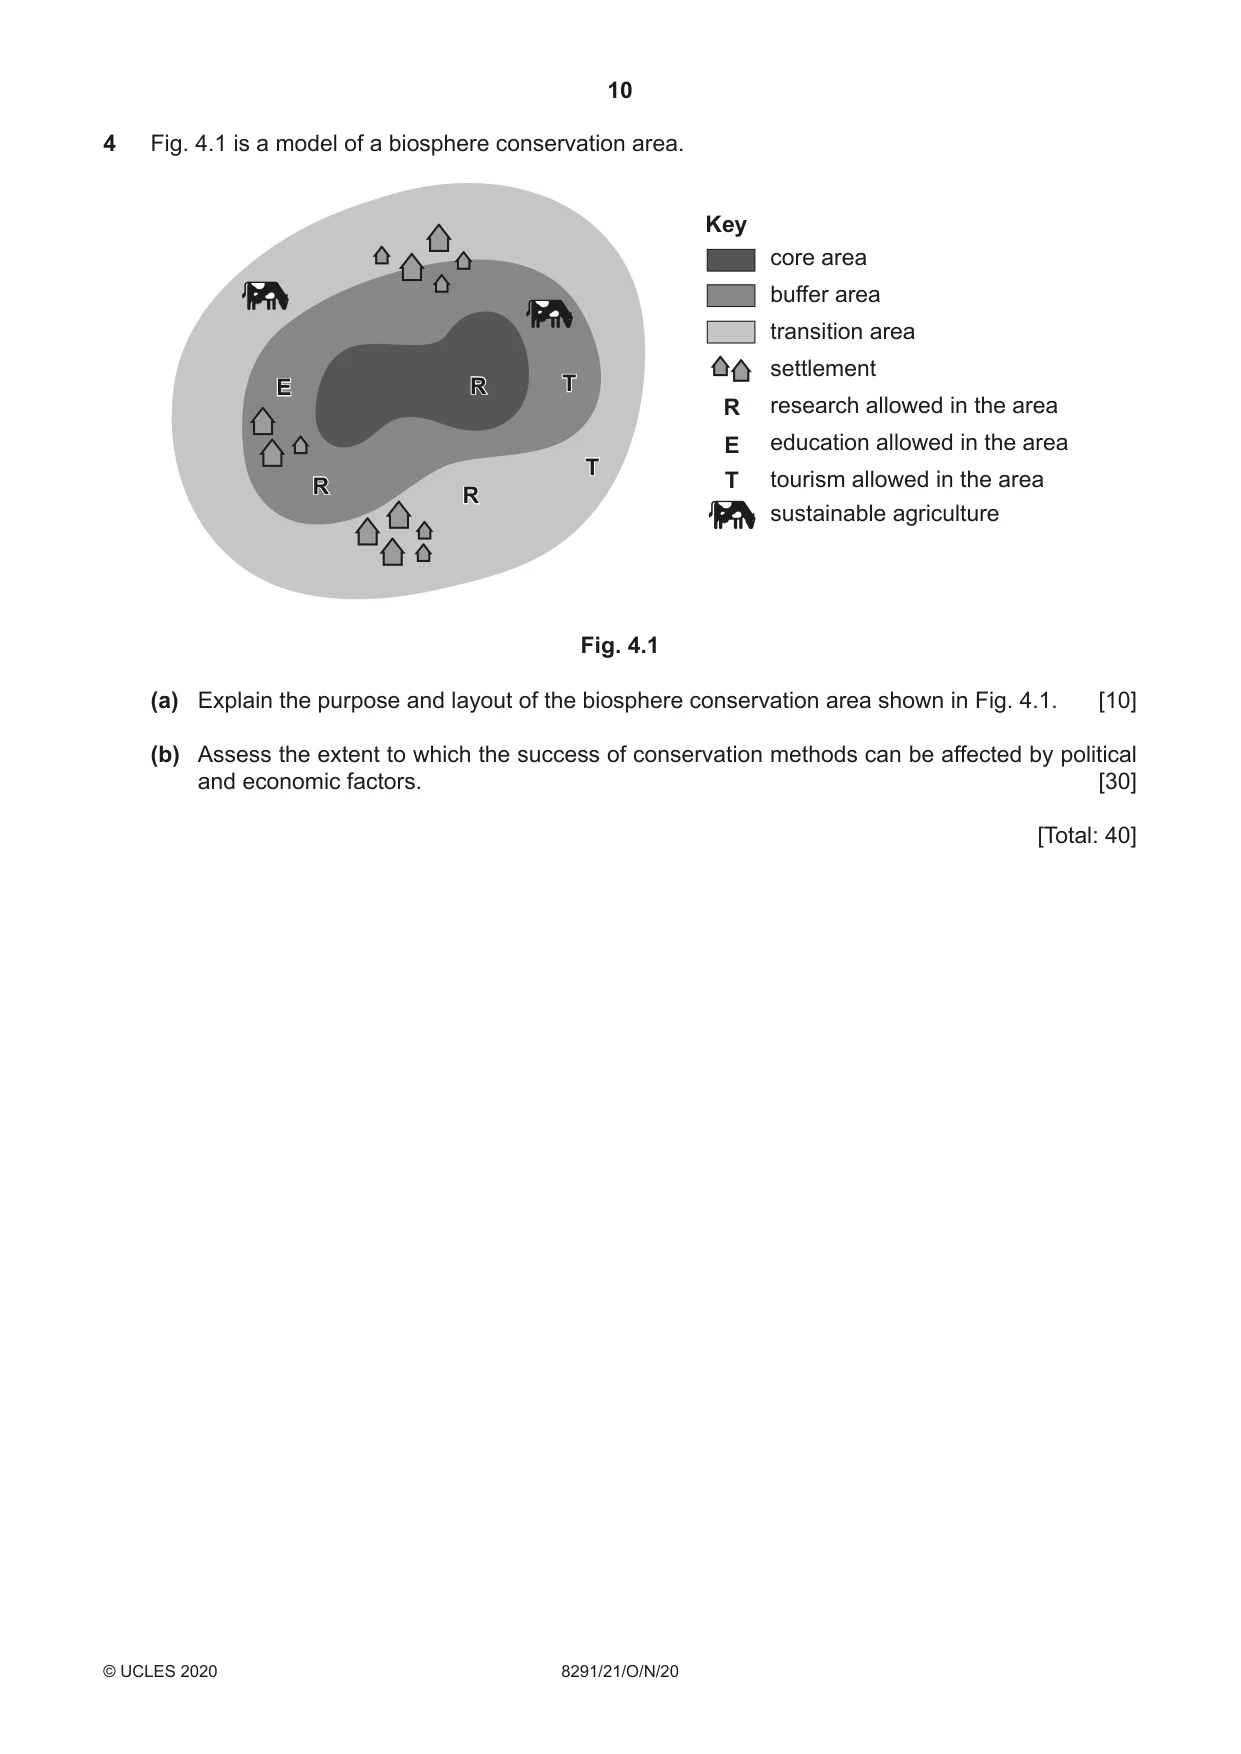
Q4 · A model of a biosphere conservation area
4 Fig. 4.1 is a model of a biosphere conservation area. Key core area buffer area transition area settlement EE RR TT R research allowed in the area E education allowed in the area TT RR T tourism allowed in the area RR sustainable agriculture Fig. 4.1 (a) Explain the purpose and layout of the biosphere conservation area shown in Fig. 4.1. [10] (b) Assess the extent to which the success of conservation methods can be affected by political and economic factors. [30] [Total: 40]
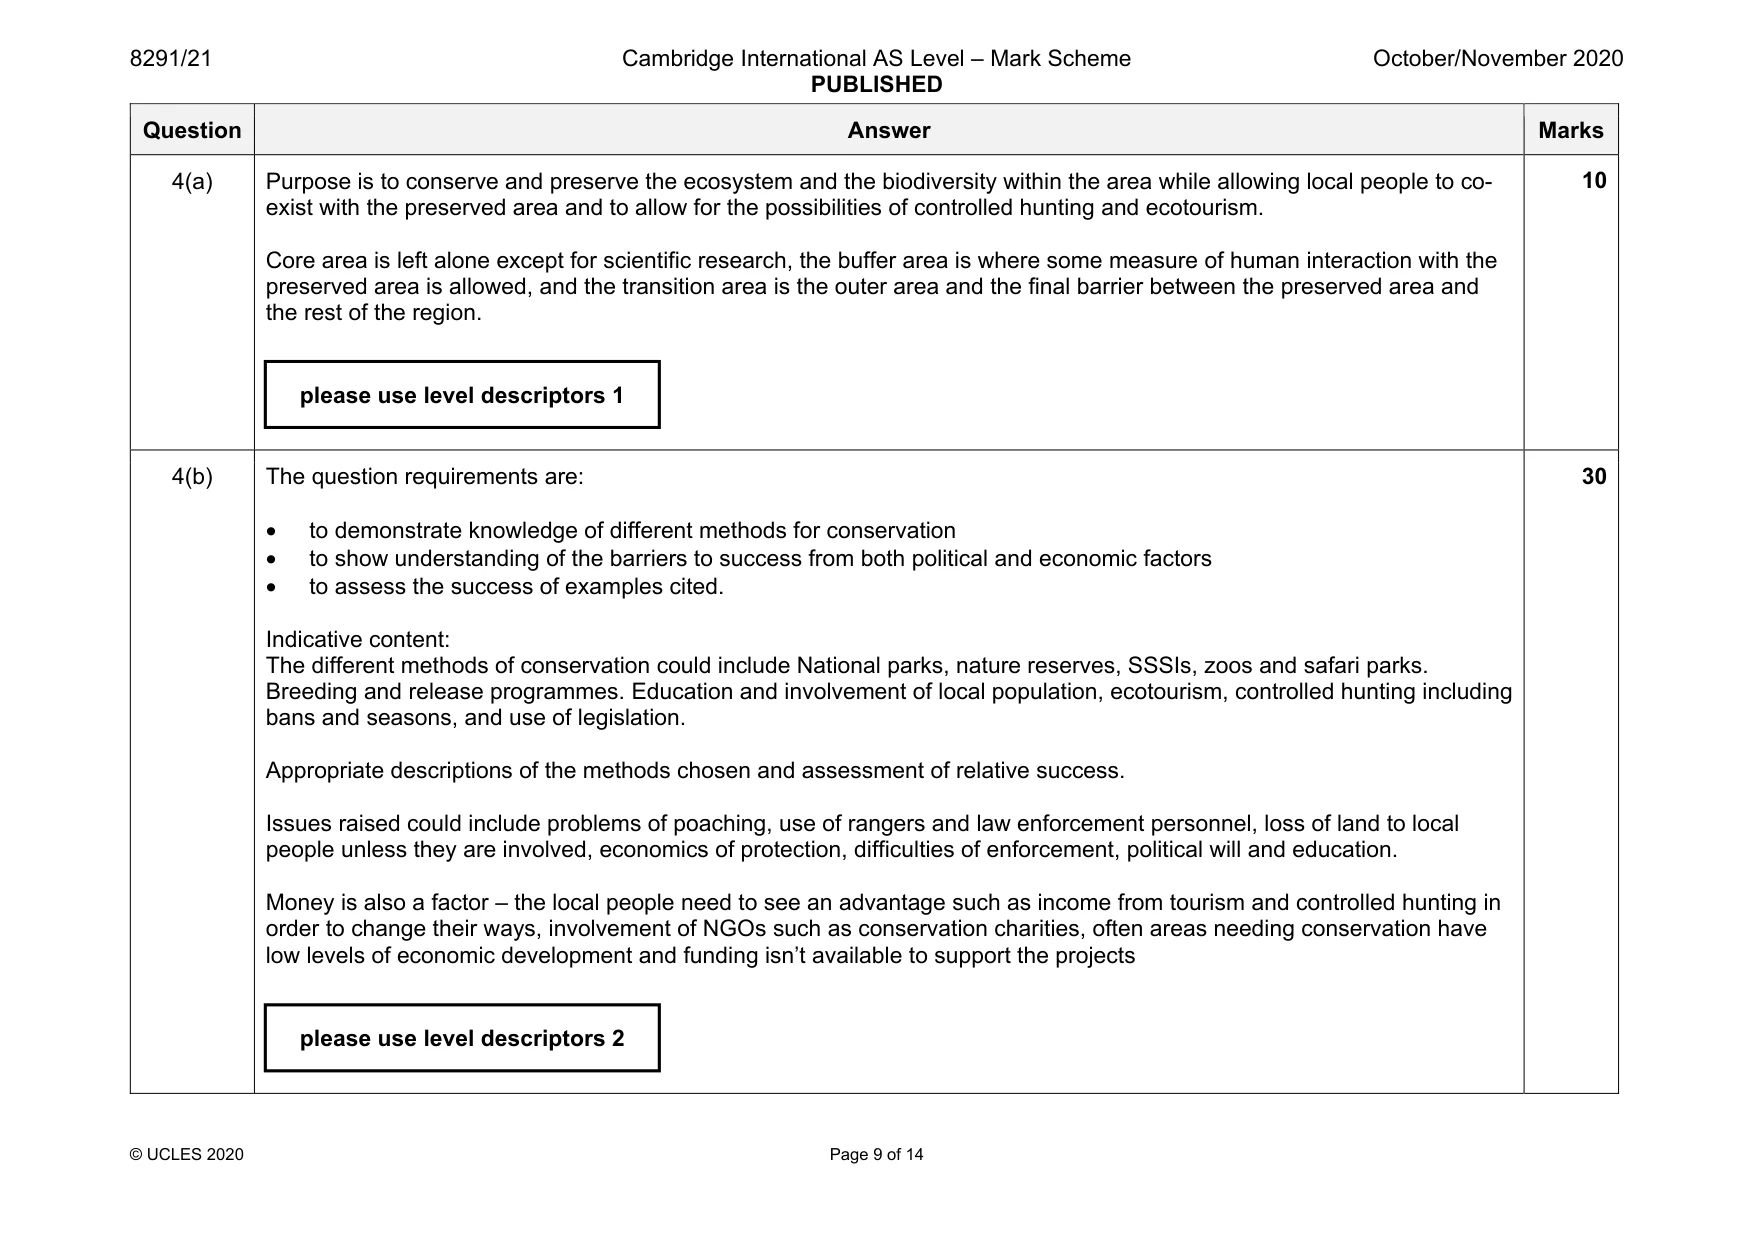
Mark scheme: 4(a) Purpose is to conserve and preserve the ecosystem and the biodiversity within the area while allowing local people to co- exist with the preserved area and to allow for the possibilities of controlled hunting and ecotourism. Core area is left alone except for scientific research, the buffer area is where some measure of human interaction with the preserved area is allowed, and the transition area is the outer area and the final barrier between the preserved area and the rest of the region. 4(b) The question requirements are: • to demonstrate knowledge of different methods for conservation • to show understanding of the barriers to success from both political and economic factors • to assess the success of examples cited. Indicative content: The different methods of conservation could include National parks, nature reserves, SSSIs, zoos and safari parks. Breeding and release programmes. Education and involvement of local population, ecotourism, controlled hunting including bans and seasons, and use of legislation. Appropriate descriptions of the methods chosen and assessment of relative success. Issues raised could include problems of poaching, use of rangers and law enforcement personnel, loss of land to local people unless they are involved, economics of protection, difficulties of enforcement, political will and education. Money is also a factor – the local people need to see an advantage such as income from tourism and controlled hunting in order to change their ways, involvement of NGOs such as conservation charities, often areas needing conservation have low levels of economic development and funding isn’t available to support the projects 30 please use level descriptors 1 please use level descriptors 2
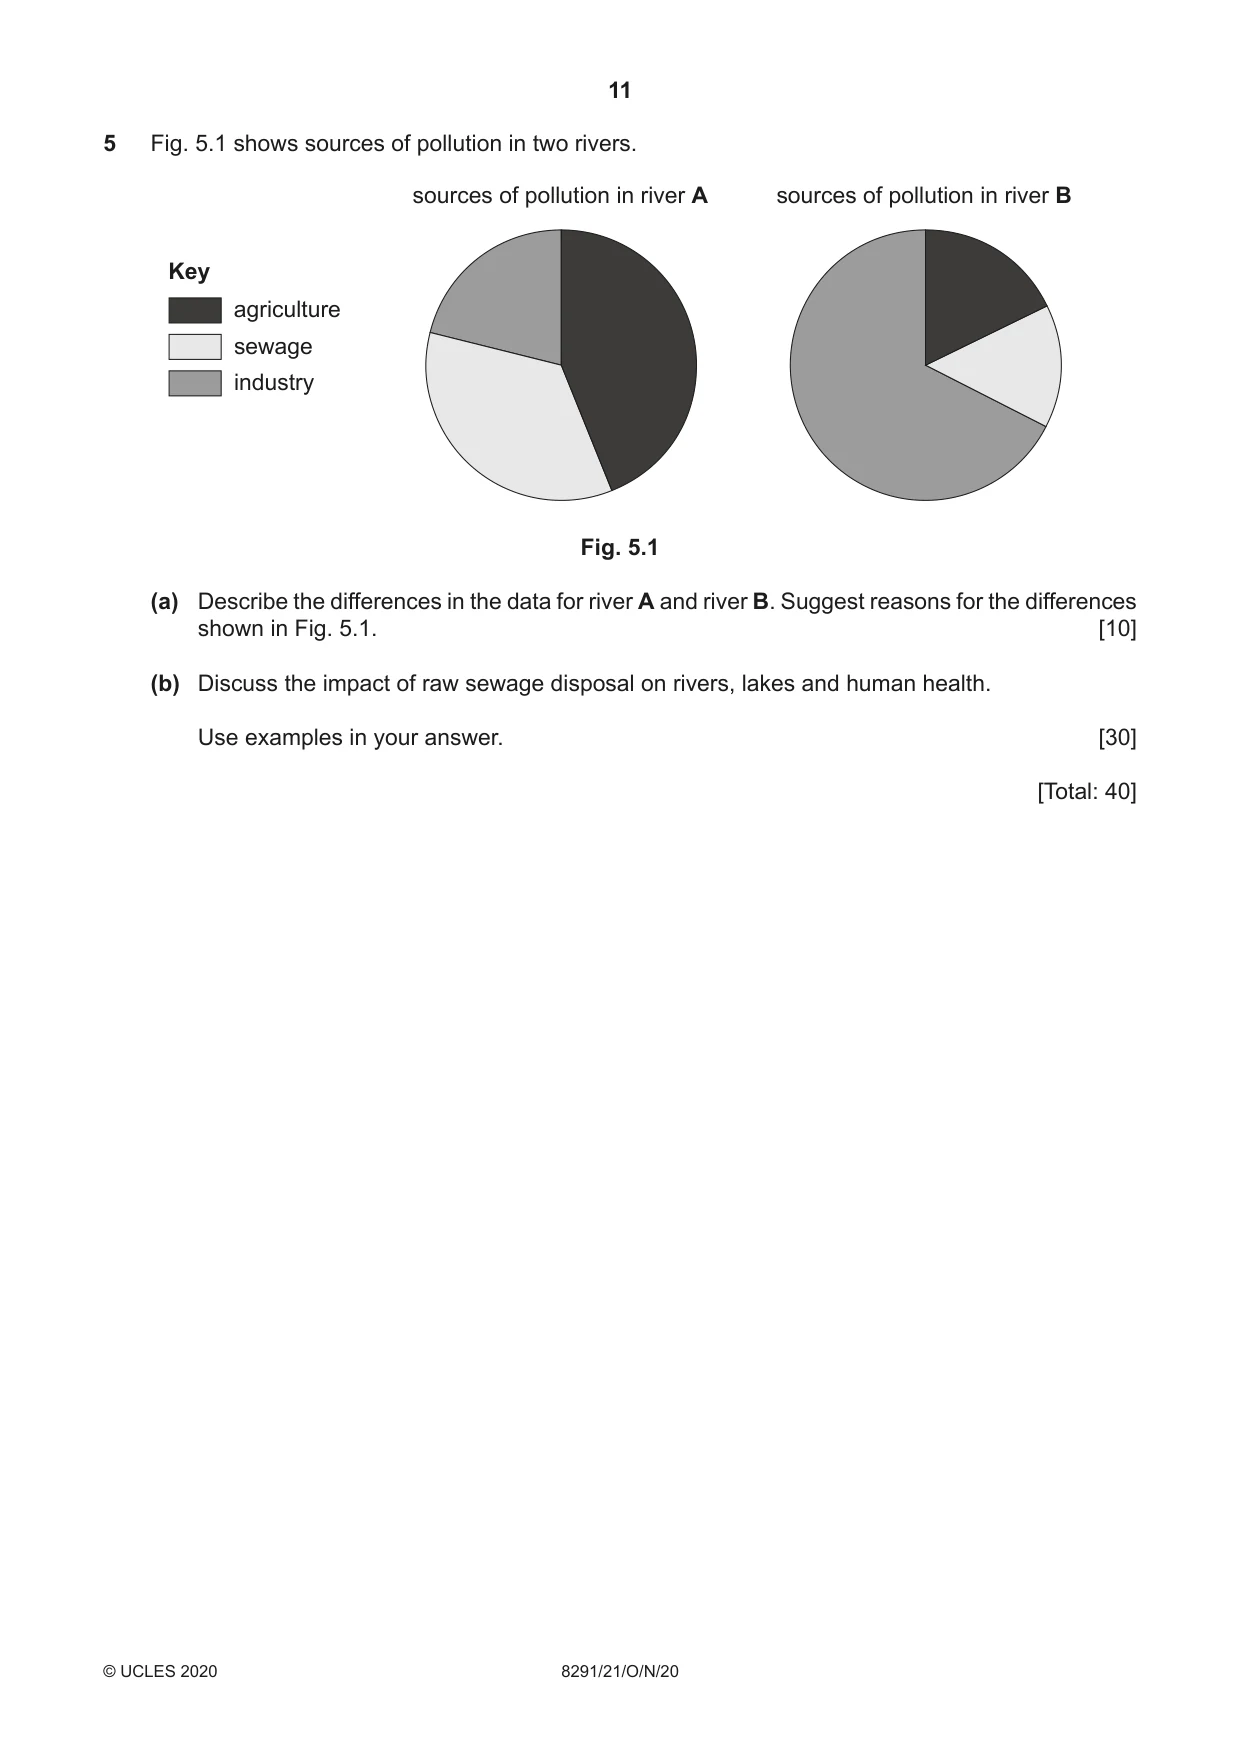
Q5 · Sources of pollution in two rivers
5 Fig. 5.1 shows sources of pollution in two rivers. sources of pollution in river A sources of pollution in river B Key agriculture sewage industry Fig. 5.1 (a) Describe the differences in the data for river A and river B. Suggest reasons for the differences shown in Fig. 5.1. [10] (b) Discuss the impact of raw sewage disposal on rivers, lakes and human health. Use examples in your answer. [30] [Total: 40]
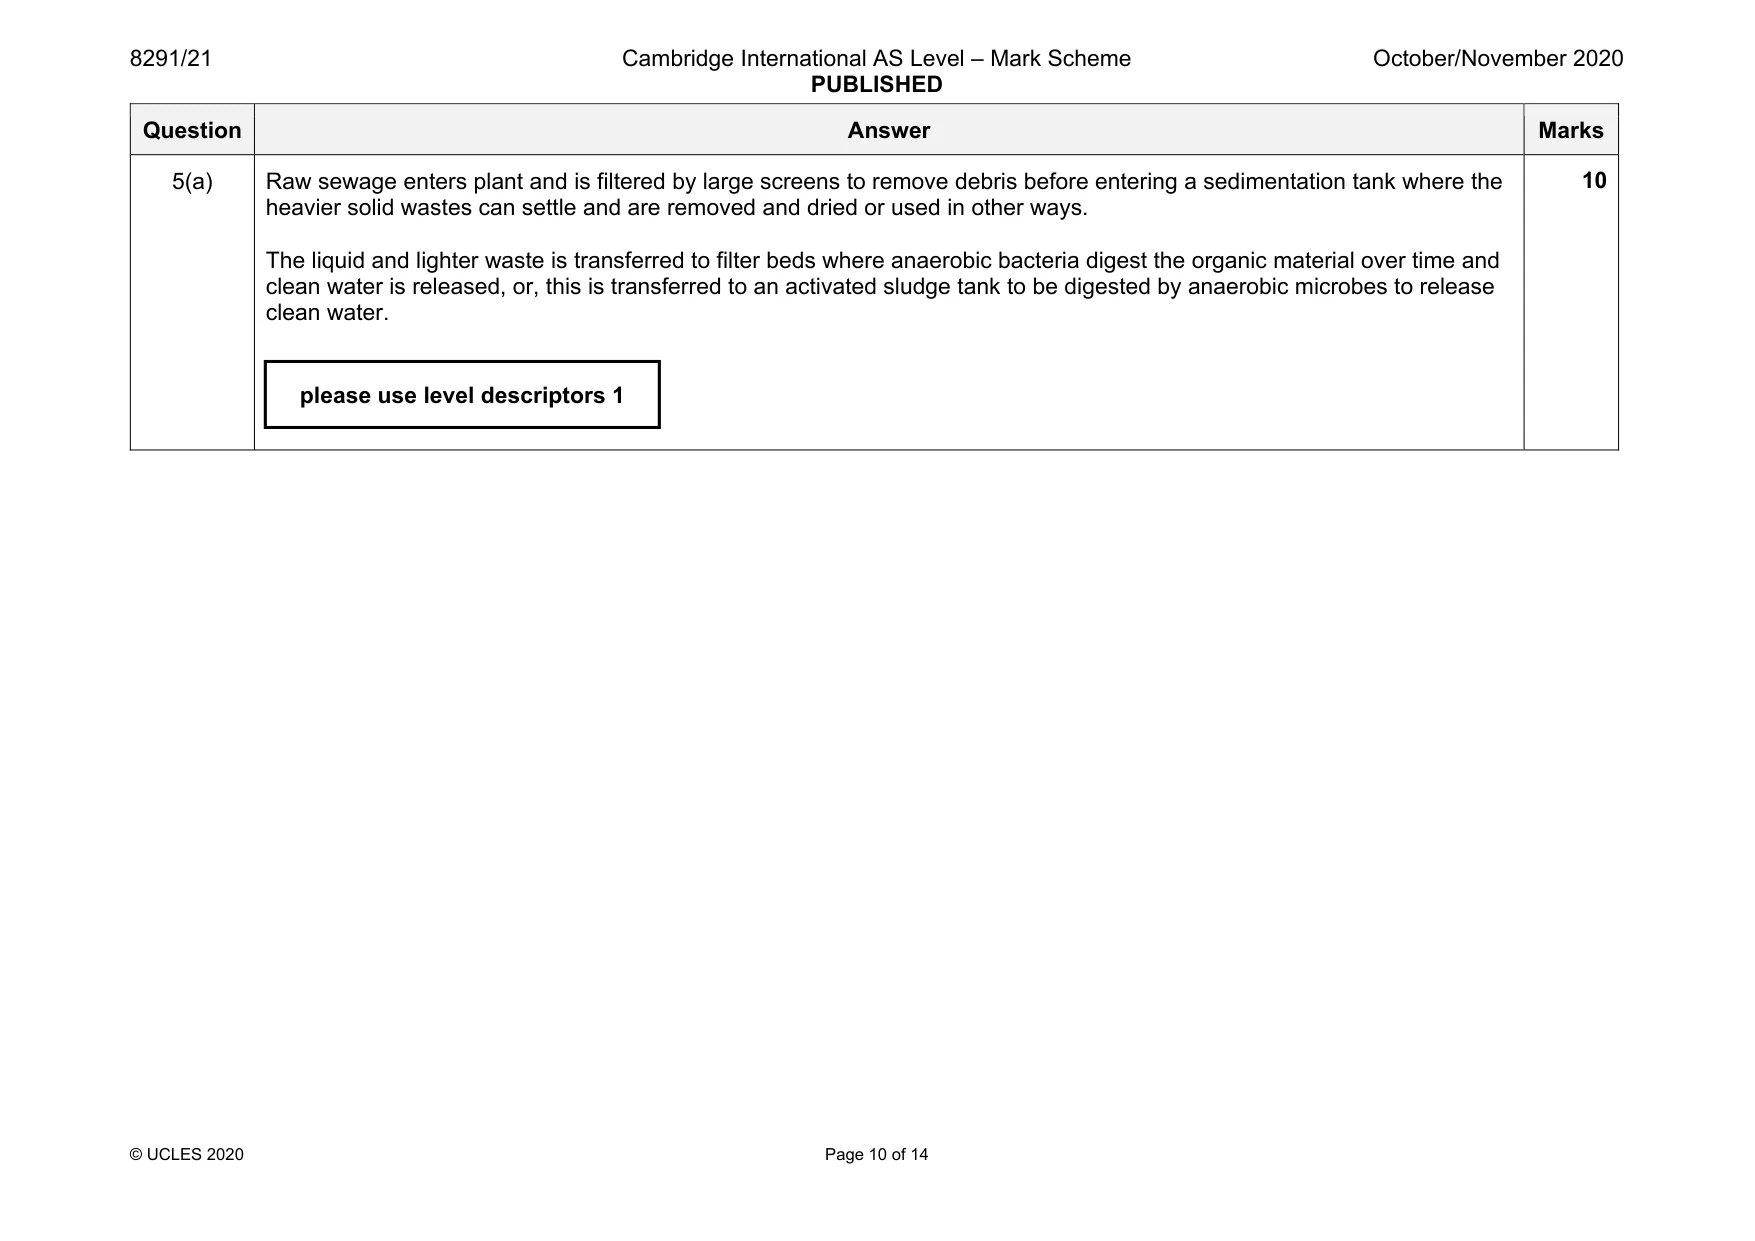
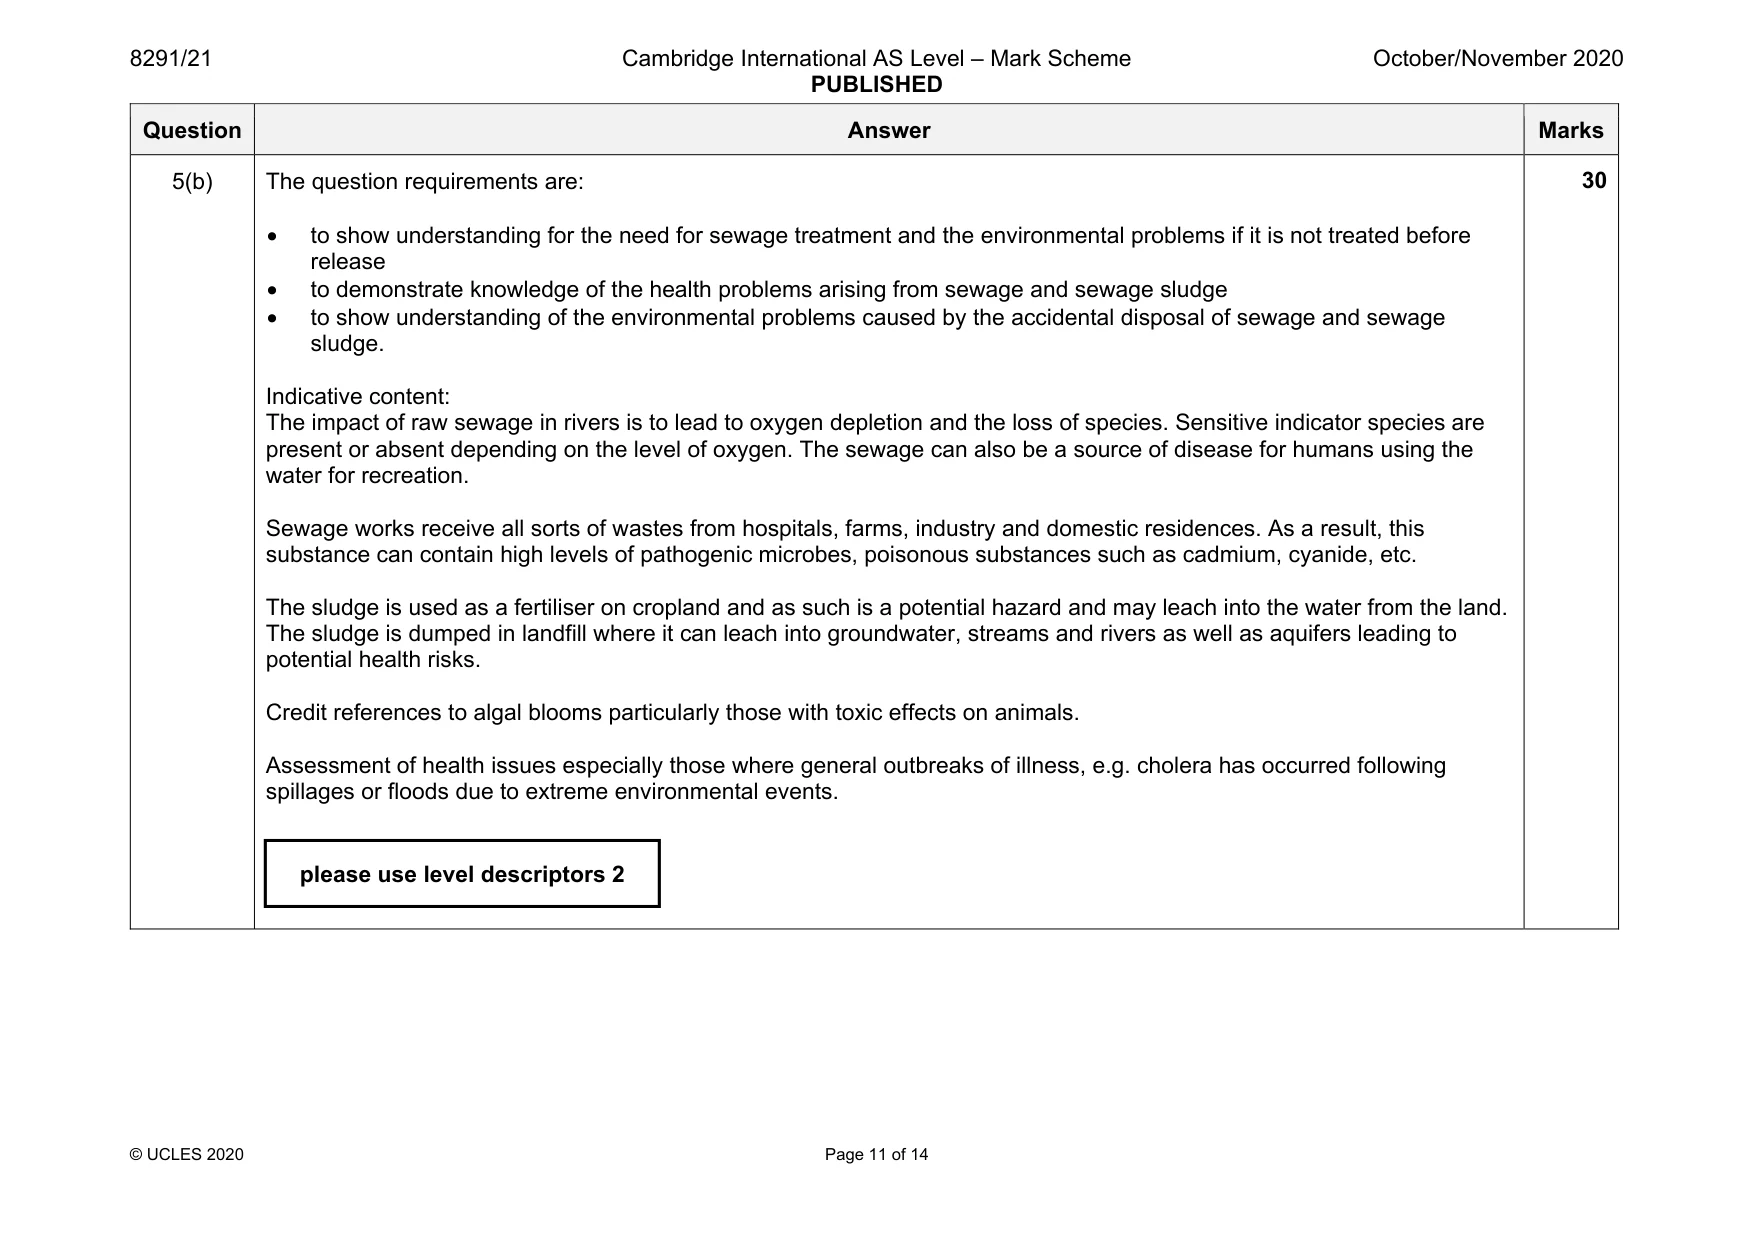
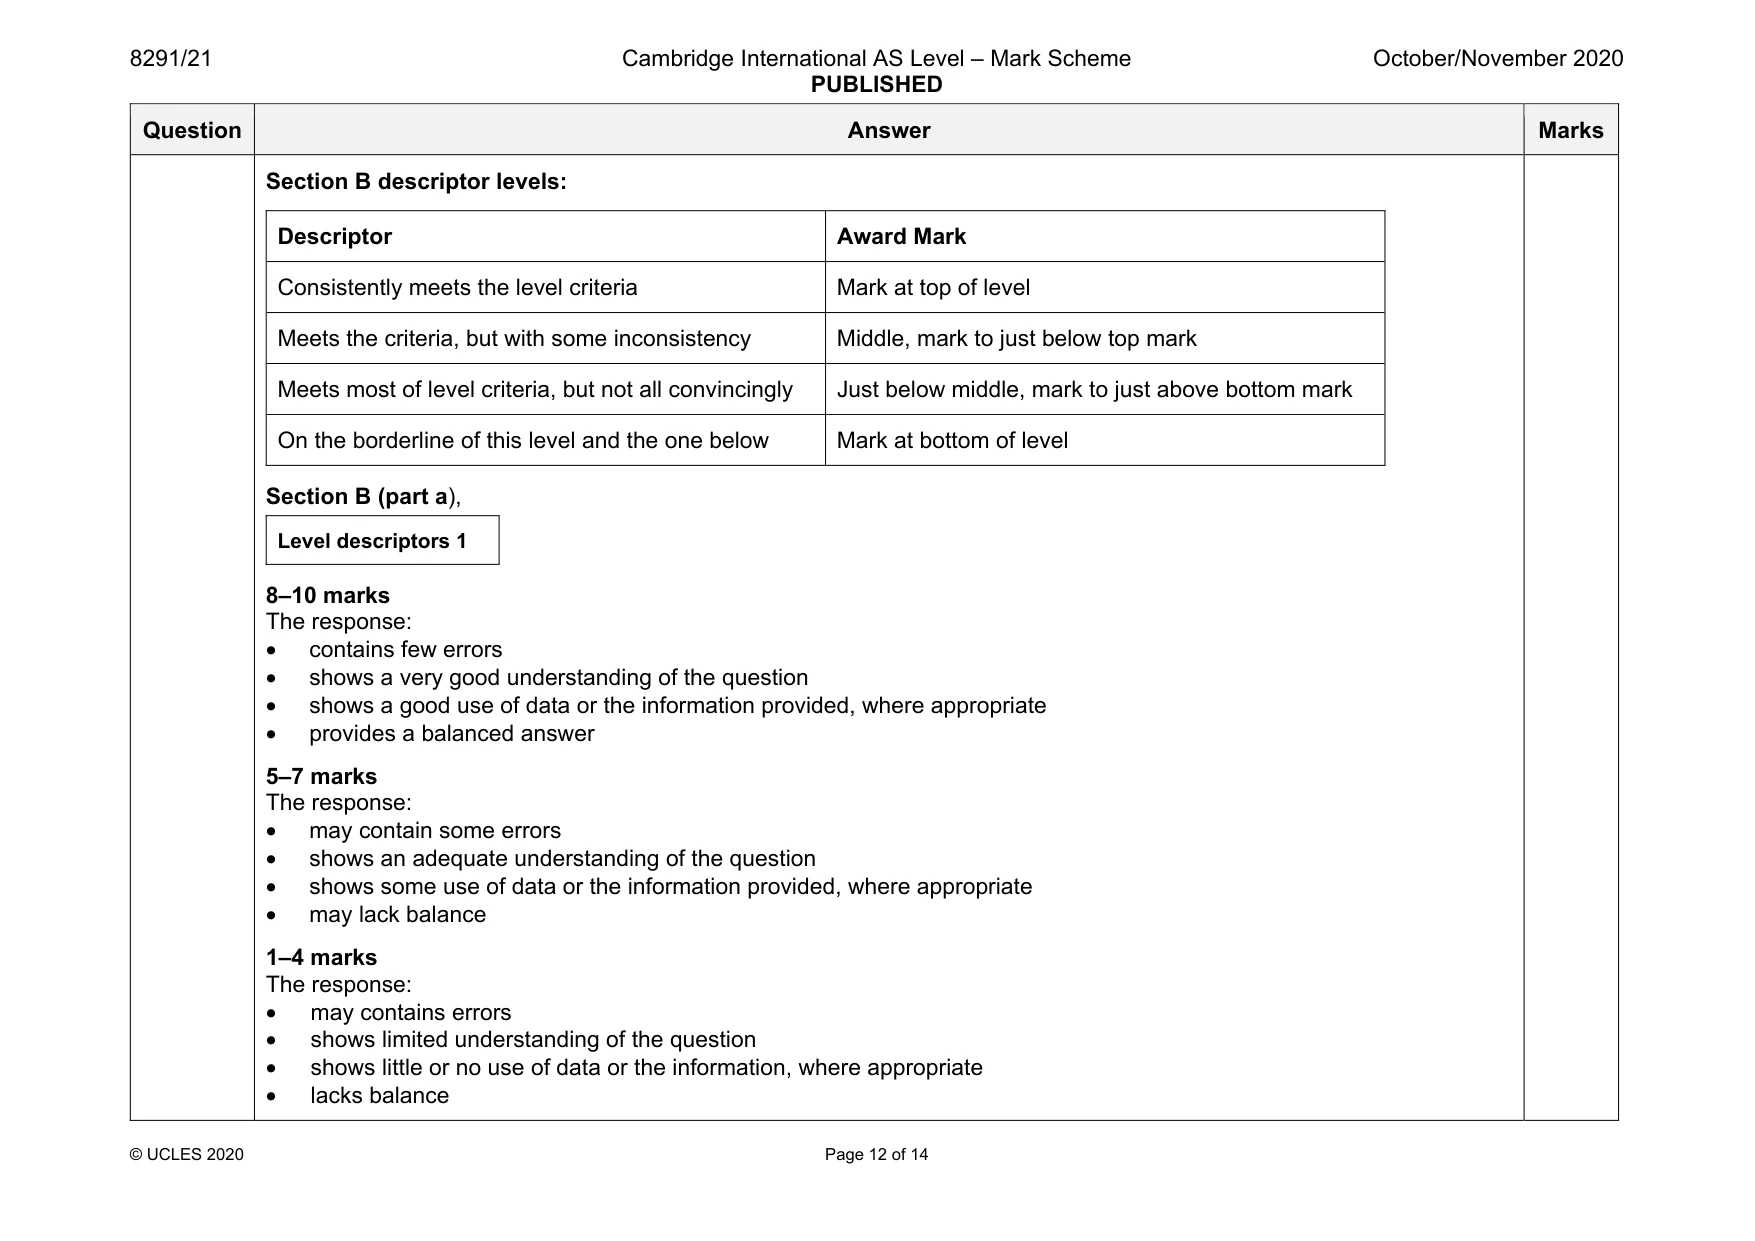
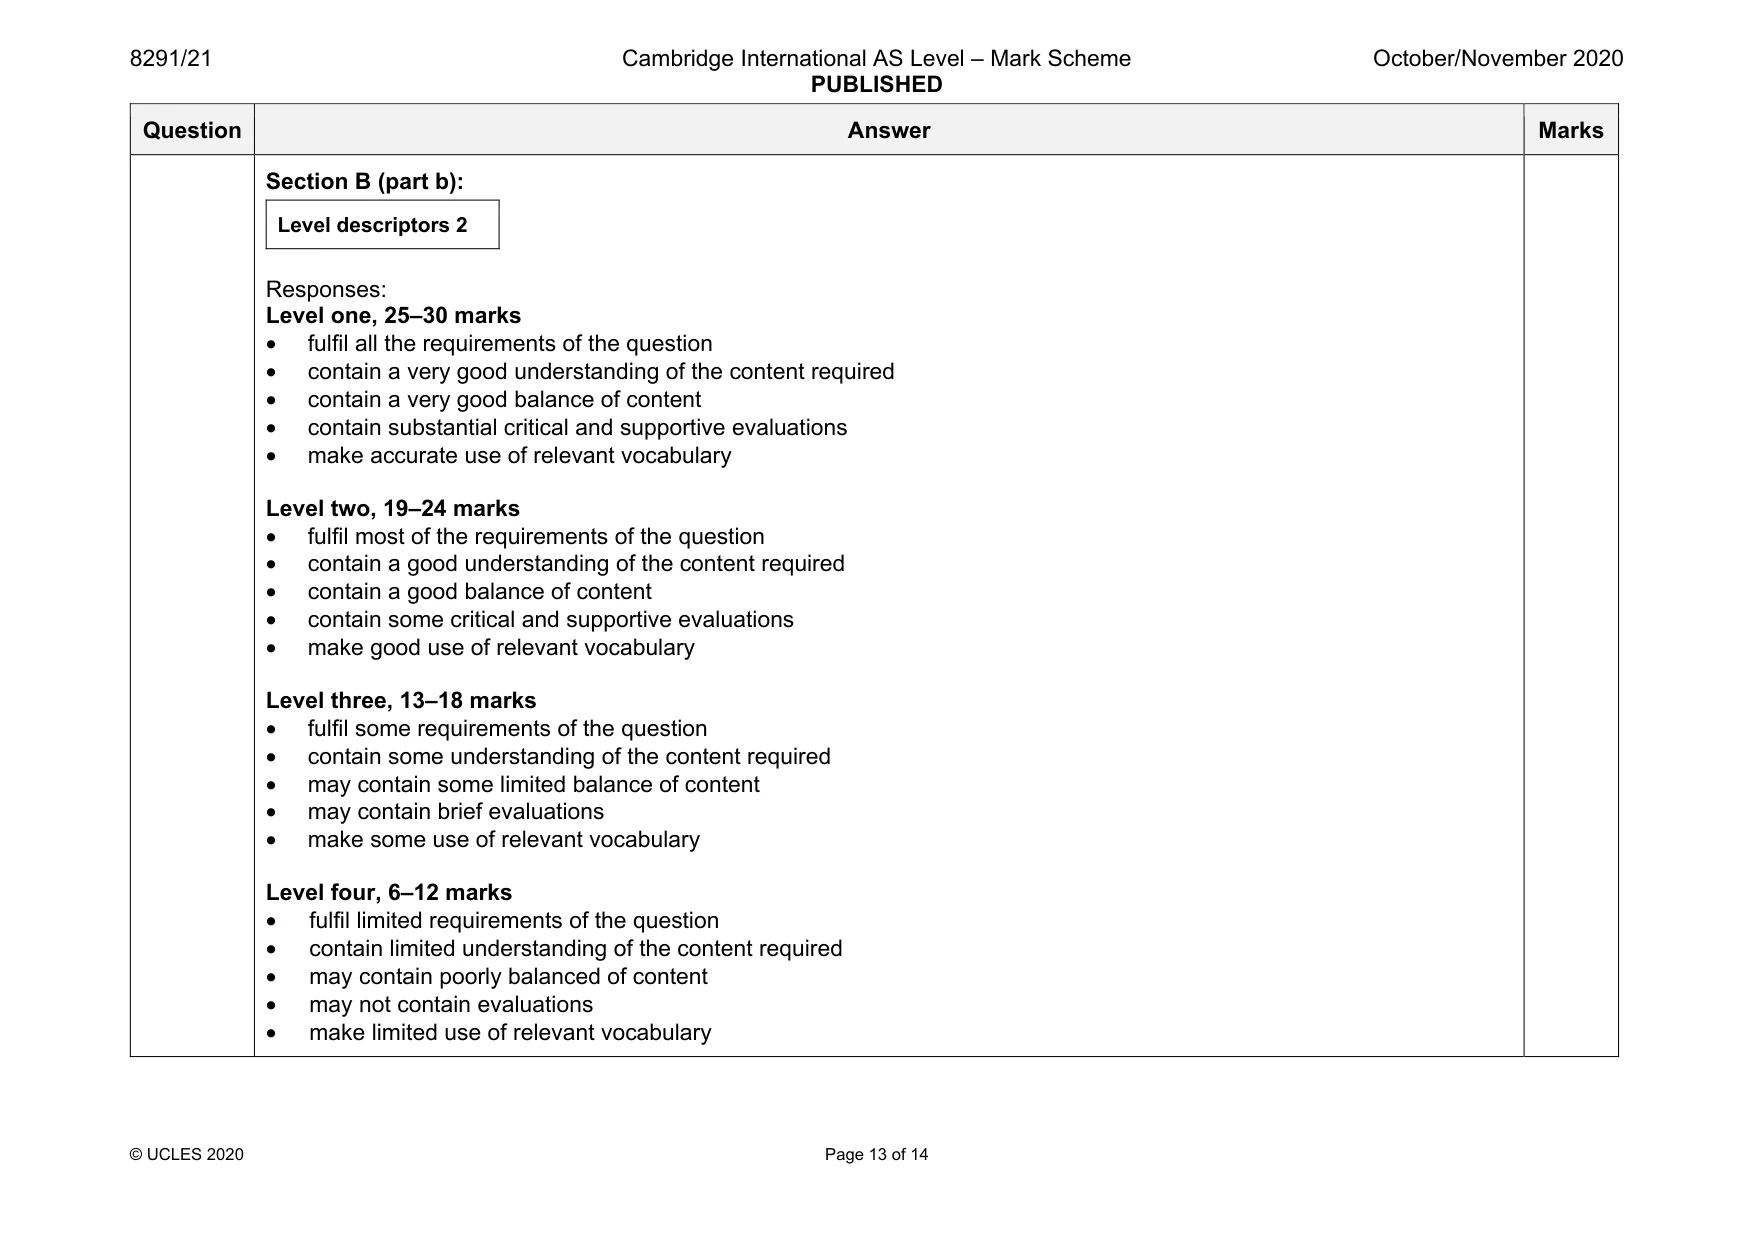
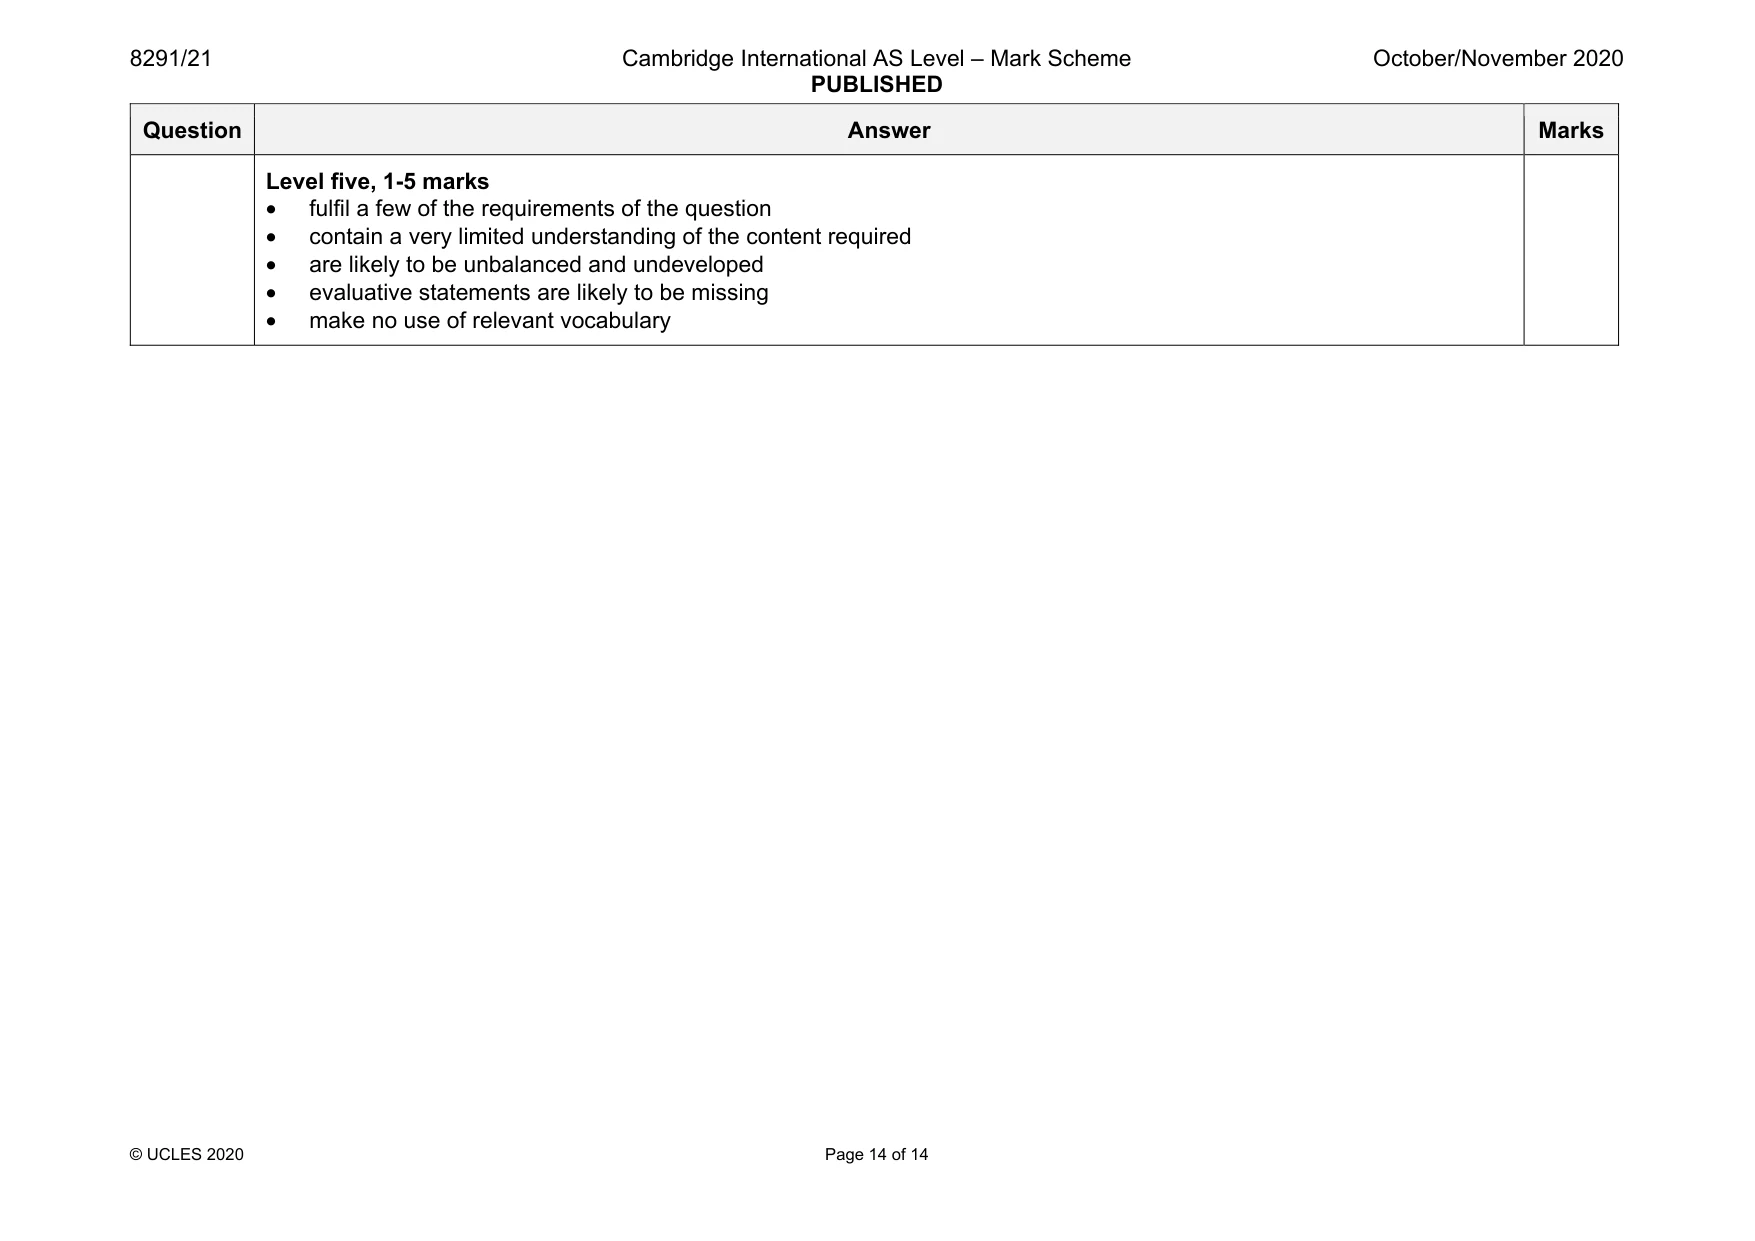
Mark scheme: 5(a) Raw sewage enters plant and is filtered by large screens to remove debris before entering a sedimentation tank where the heavier solid wastes can settle and are removed and dried or used in other ways. The liquid and lighter waste is transferred to filter beds where anaerobic bacteria digest the organic material over time and clean water is released, or, this is transferred to an activated sludge tank to be digested by anaerobic microbes to release clean water. please use level descriptors 1 Question Answer Marks 5(b) The question requirements are: • to show understanding for the need for sewage treatment and the environmental problems if it is not treated before release • to demonstrate knowledge of the health problems arising from sewage and sewage sludge • to show understanding of the environmental problems caused by the accidental disposal of sewage and sewage sludge. Indicative content: The impact of raw sewage in rivers is to lead to oxygen depletion and the loss of species. Sensitive indicator species are present or absent depending on the level of oxygen. The sewage can also be a source of disease for humans using the water for recreation. Sewage works receive all sorts of wastes from hospitals, farms, industry and domestic residences. As a result, this substance can contain high levels of pathogenic microbes, poisonous substances such as cadmium, cyanide, etc. The sludge is used as a fertiliser on cropland and as such is a potential hazard and may leach into the water from the land. The sludge is dumped in landfill where it can leach into groundwater, streams and rivers as well as aquifers leading to potential health risks. Credit references to algal blooms particularly those with toxic effects on animals. Assessment of health issues especially those where general outbreaks of illness, e.g. cholera has occurred following spillages or floods due to extreme environmental events. 30 please use level descriptors 2 Question Answer Marks Section B descriptor levels: Descriptor Award Mark Consistently meets the level criteria Mark at top of level Meets the criteria, but with some inconsistency Middle, mark to just below top mark Meets most of level criteria, but not all convincingly Just below middle, mark to just above bottom mark On the borderline of this level and the one below Mark at bottom of level Section B (part a), Level descriptors 1 8–10 marks The response: • contains few errors • shows a very good understanding of the question • shows a good use of data or the information provided, where appropriate • provides a balanced answer 5–7 marks The response: • may contain some errors • shows an adequate understanding of the question • shows some use of data or the information provided, where appropriate • may lack balance 1–4 marks The response: • may contains errors • shows limited understanding of the question • shows little or no use of data or the information, where appropriate • lacks balance Question Answer Marks Section B (part b): Level descriptors 2 Responses: Level one, 25–30 marks • fulfil all the requirements of the question • contain a very good understanding of the content required • contain a very good balance of content • contain substantial critical and supportive evaluations • make accurate use of relevant vocabulary Level two, 19–24 marks • fulfil most of the requirements of the question • contain a good understanding of the content required • contain a good balance of content • contain some critical and supportive evaluations • make good use of relevant vocabulary Level three, 13–18 marks • fulfil some requirements of the question • contain some understanding of the content required • may contain some limited balance of content • may contain brief evaluations • make some use of relevant vocabulary Level four, 6–12 marks • fulfil limited requirements of the question • contain limited understanding of the content required • may contain poorly balanced of content • may not contain evaluations • make limited use of relevant vocabulary Question Answer Marks Level five, 1-5 marks • fulfil a few of the requirements of the question • contain a very limited understanding of the content required • are likely to be unbalanced and undeveloped • evaluative statements are likely to be missing • make no use of relevant vocabulary
What was in this paper
The subtopics covered by these 5 questions, and how many questions each got. Open one in a new tab to see every Cambridge question on it.
What you needed in this session
Cambridge’s own grade thresholds for 2020 Oct/Nov, Paper 2 · Variant 1. A higher threshold means an easier paper — the bar moves with how the cohort did.