Cambridge A Level Environmental Management (AS only) 8291 — 2024 Oct/Nov Paper 2 · Variant 3
8291/23/O/N/24 · 4 questions · 80 marks · ≈90 min
The question paper and its mark scheme, free to read here and free to download. This is Cambridge’s own paper, exactly as it was sat.
Question paper24 pages




Mark scheme14 pages
Answers below. Sit the paper first if you are practising.
Questions as text
Q1 · Carbon capture and storage are strategies for managing climate change
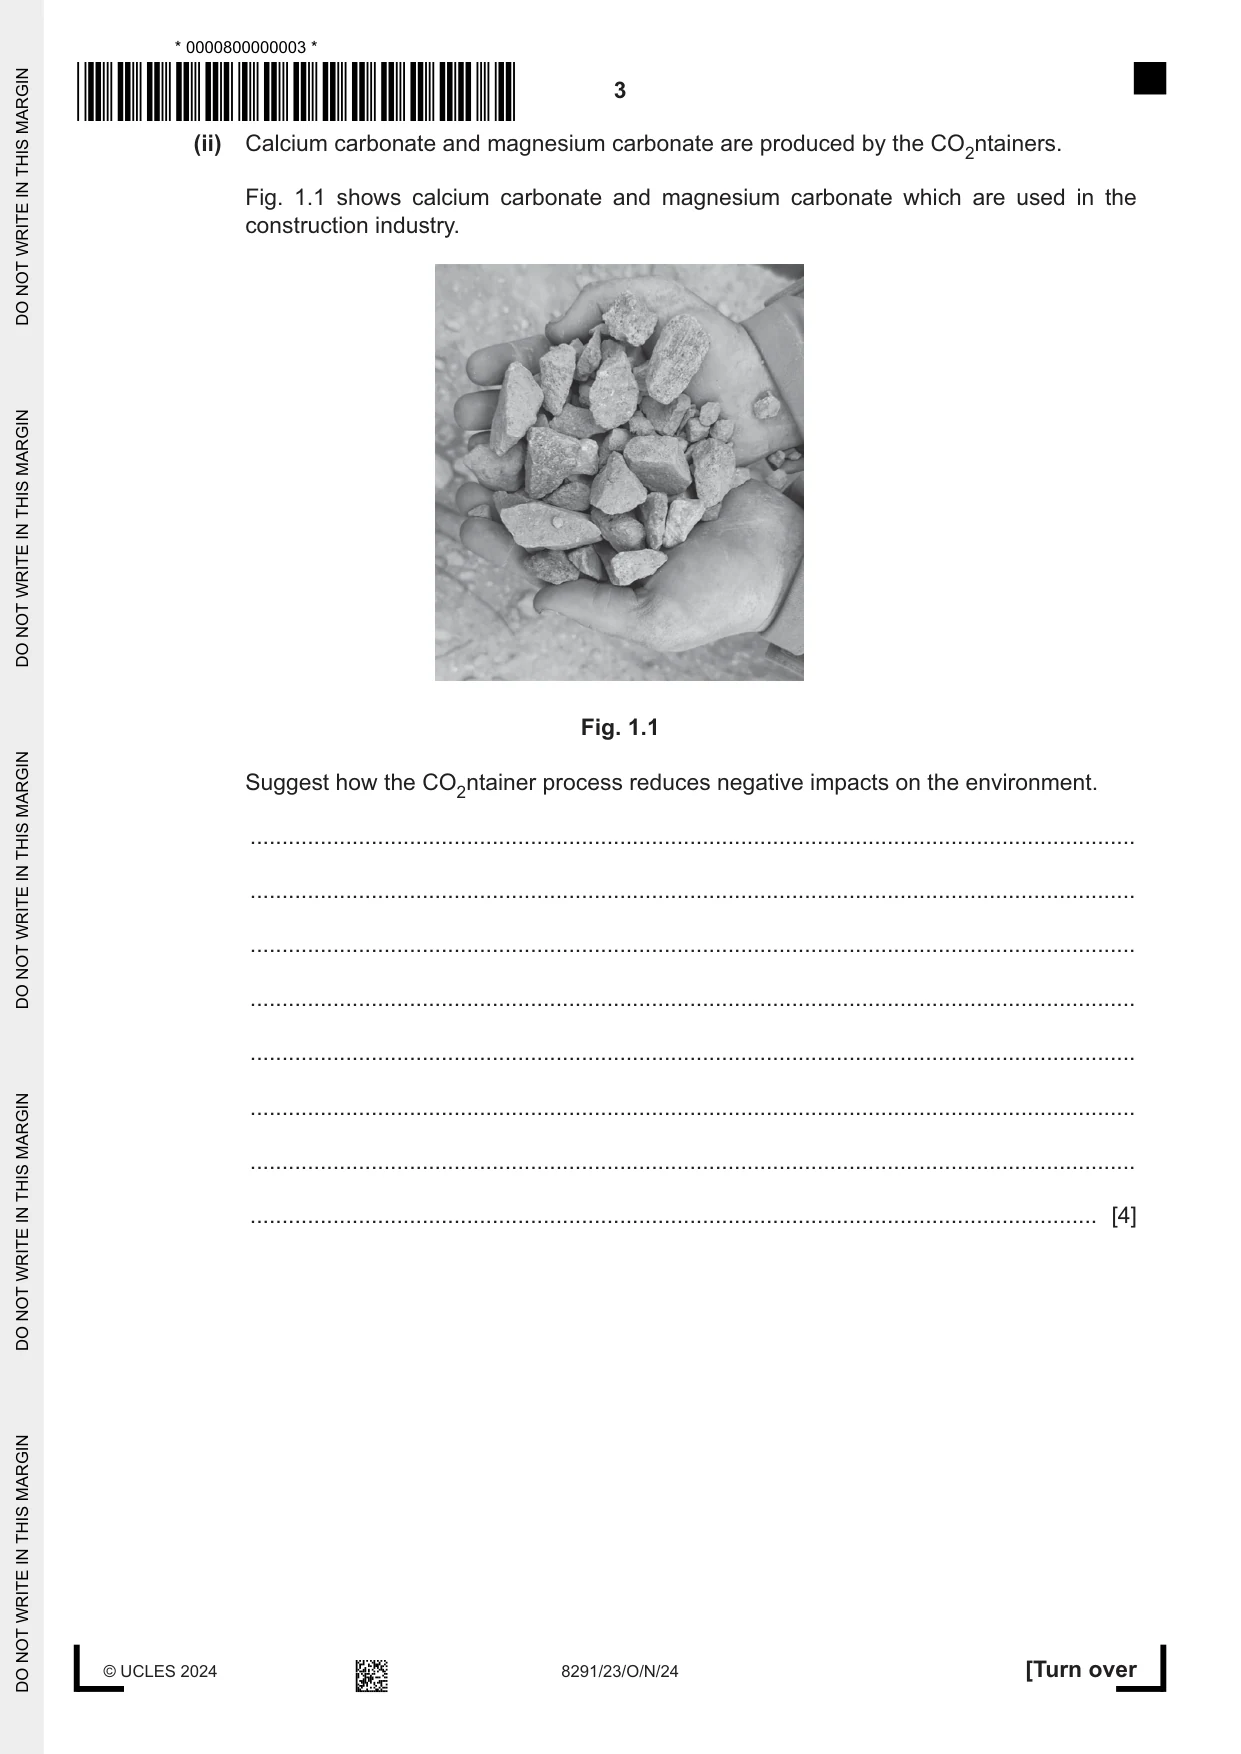
1 Carbon capture and storage are strategies for managing climate change. Some companies are developing strategies to use captured carbon instead of storing the captured carbon. (a) Suggest the disadvantages of storing captured carbon rather than using captured carbon. ................................................................................................................................................... ................................................................................................................................................... ................................................................................................................................................... ................................................................................................................................................... ................................................................................................................................................... ............................................................................................................................................. [3] (b) In 2018, a company developed a unit for using carbon dioxide emitted from industry. The units are called ‘CO2ntainers’. Industrial waste products are reacted in a CO2ntainer with captured carbon dioxide at the location where the carbon dioxide is emitted. (i) Each CO2ntainer can treat a maximum of 12 000 tonnes of industrial waste per year. Four CO2ntainers are used at a factory. Calculate the maximum mass of industrial waste the four CO2ntainers can treat in five years. mass = ............................................. tonnes [2] (ii) Calcium carbonate and magnesium carbonate are produced by the CO2ntainers. Fig. 1.1 shows calcium carbonate and magnesium carbonate which are used in the construction industry. Fig. 1.1 Suggest how the CO2ntainer process reduces negative impacts on the environment. ........................................................................................................................................... ........................................................................................................................................... ........................................................................................................................................... ........................................................................................................................................... ........................................................................................................................................... ........................................................................................................................................... ........................................................................................................................................... ..................................................................................................................................... [4] (iii) The CO2ntainers use a process called carbonation. This process also occurs naturally. Organisms with shells absorb carbon dioxide from sea water and produce calcium carbonate for their shells. Suggest how this carbon dioxide is naturally stored for millions of years. ........................................................................................................................................... ........................................................................................................................................... ........................................................................................................................................... ........................................................................................................................................... ........................................................................................................................................... ..................................................................................................................................... [3] (c) Carbon dioxide is a limiting factor in the process of photosynthesis. State two other limiting factors in the process of photosynthesis. 1 ................................................................................................................................................ 2 ................................................................................................................................................ [2] [Total: 14]
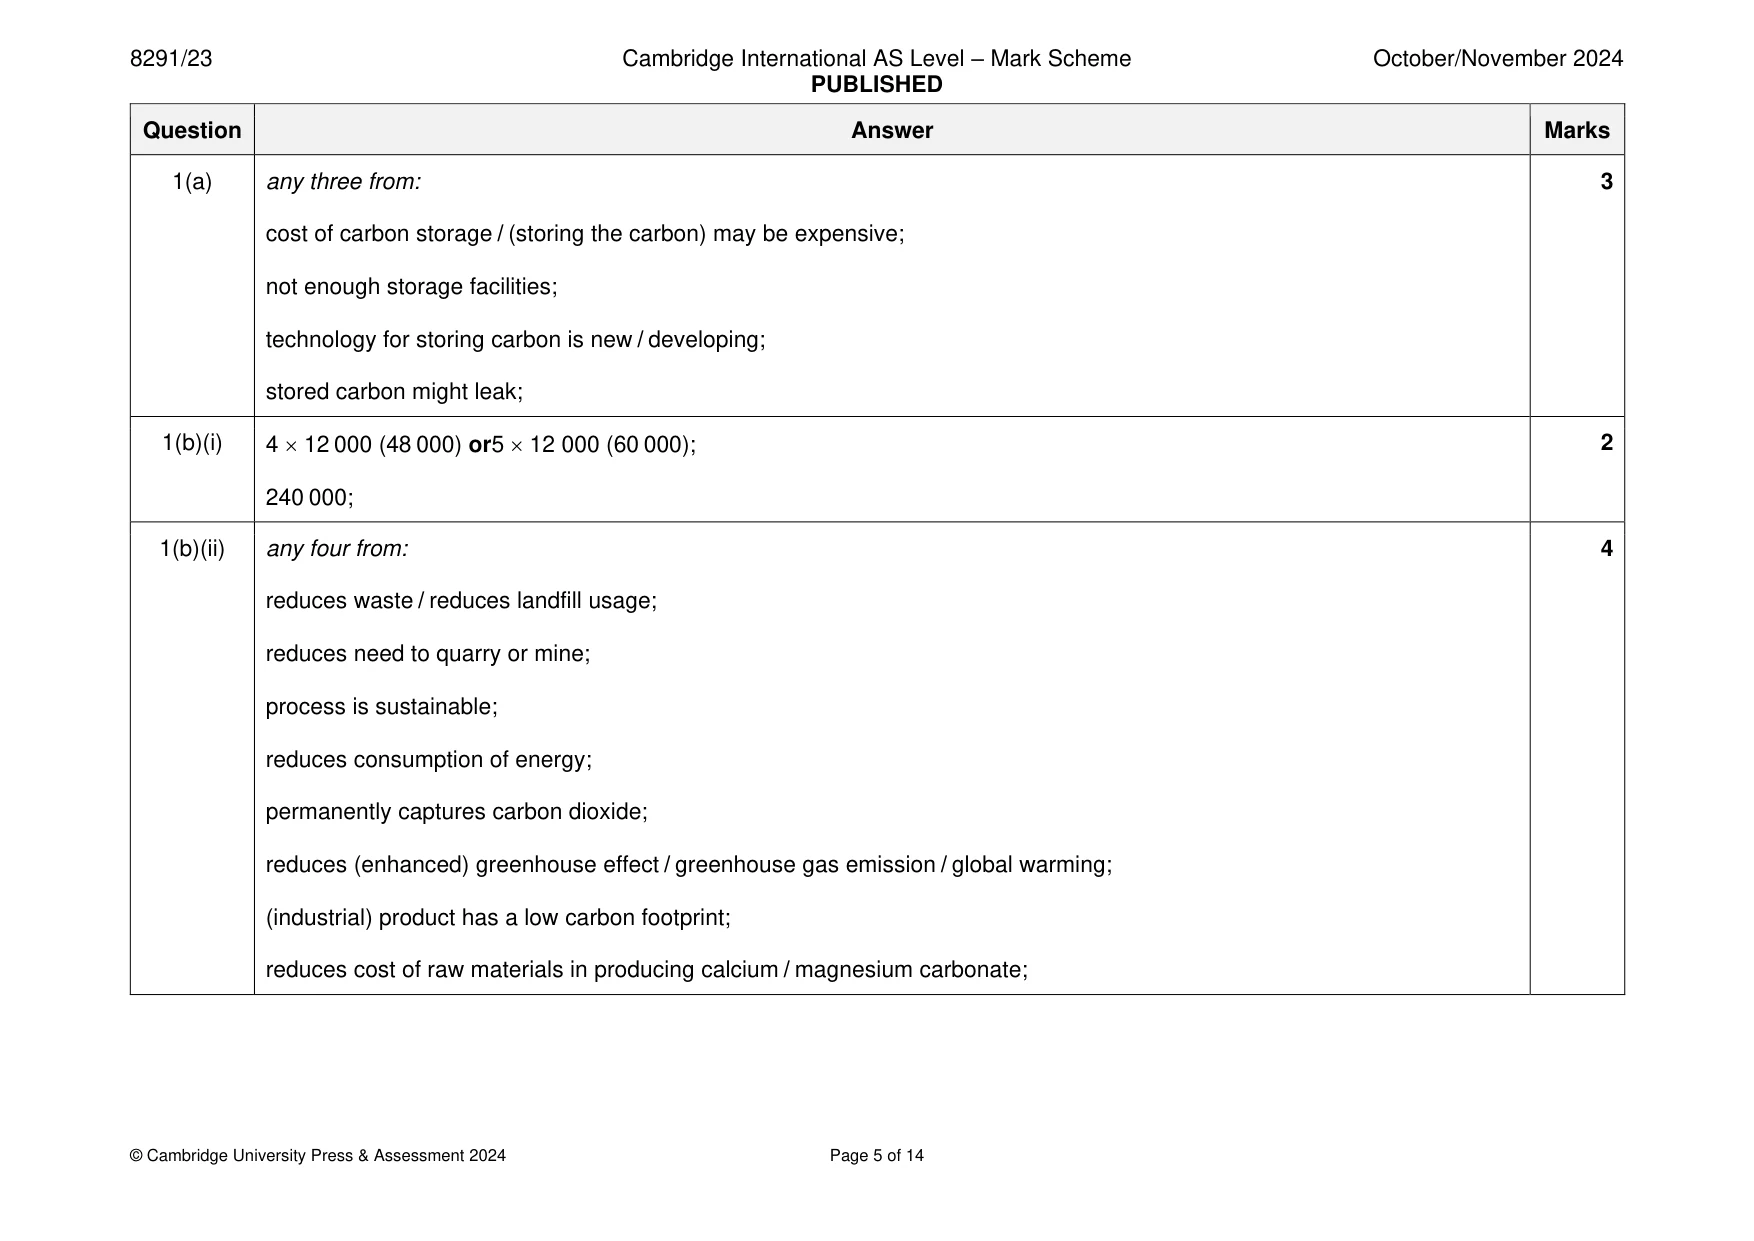
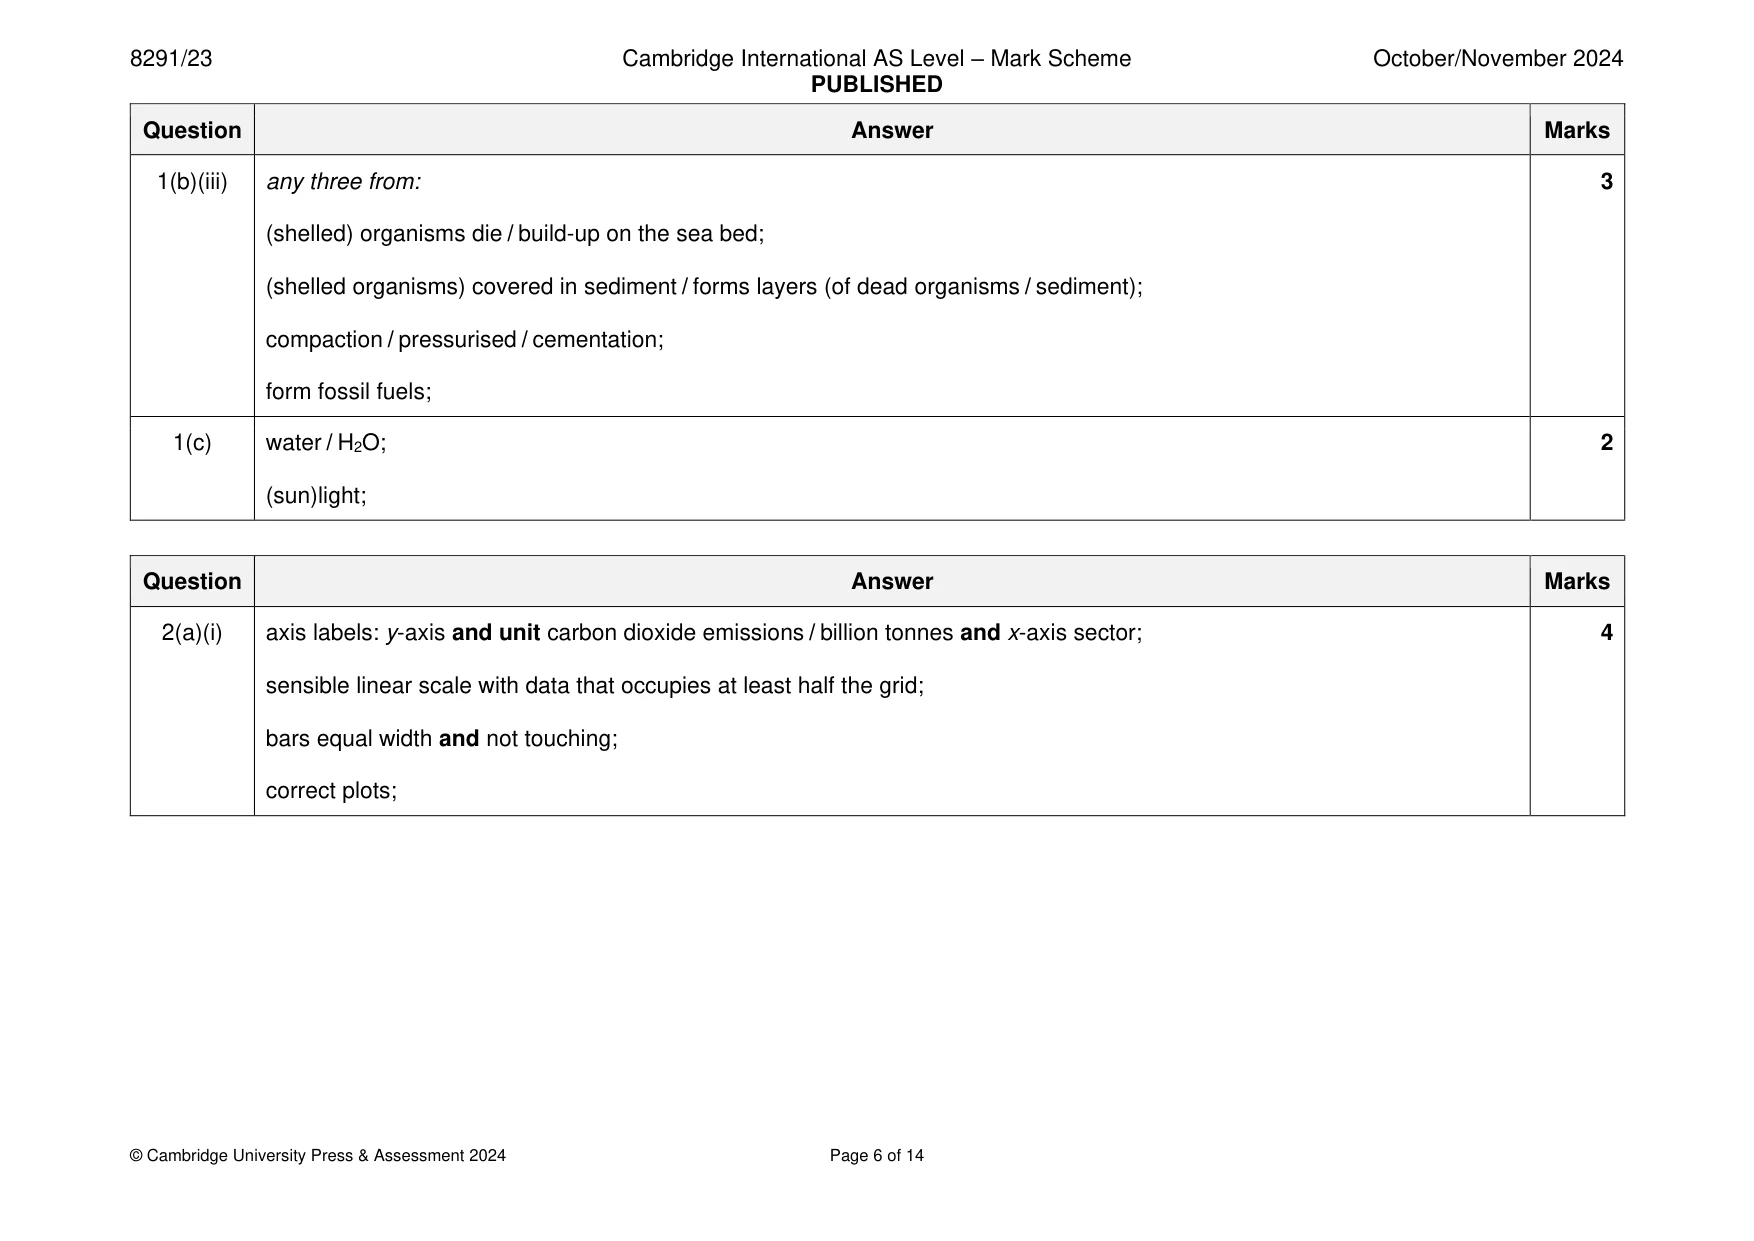
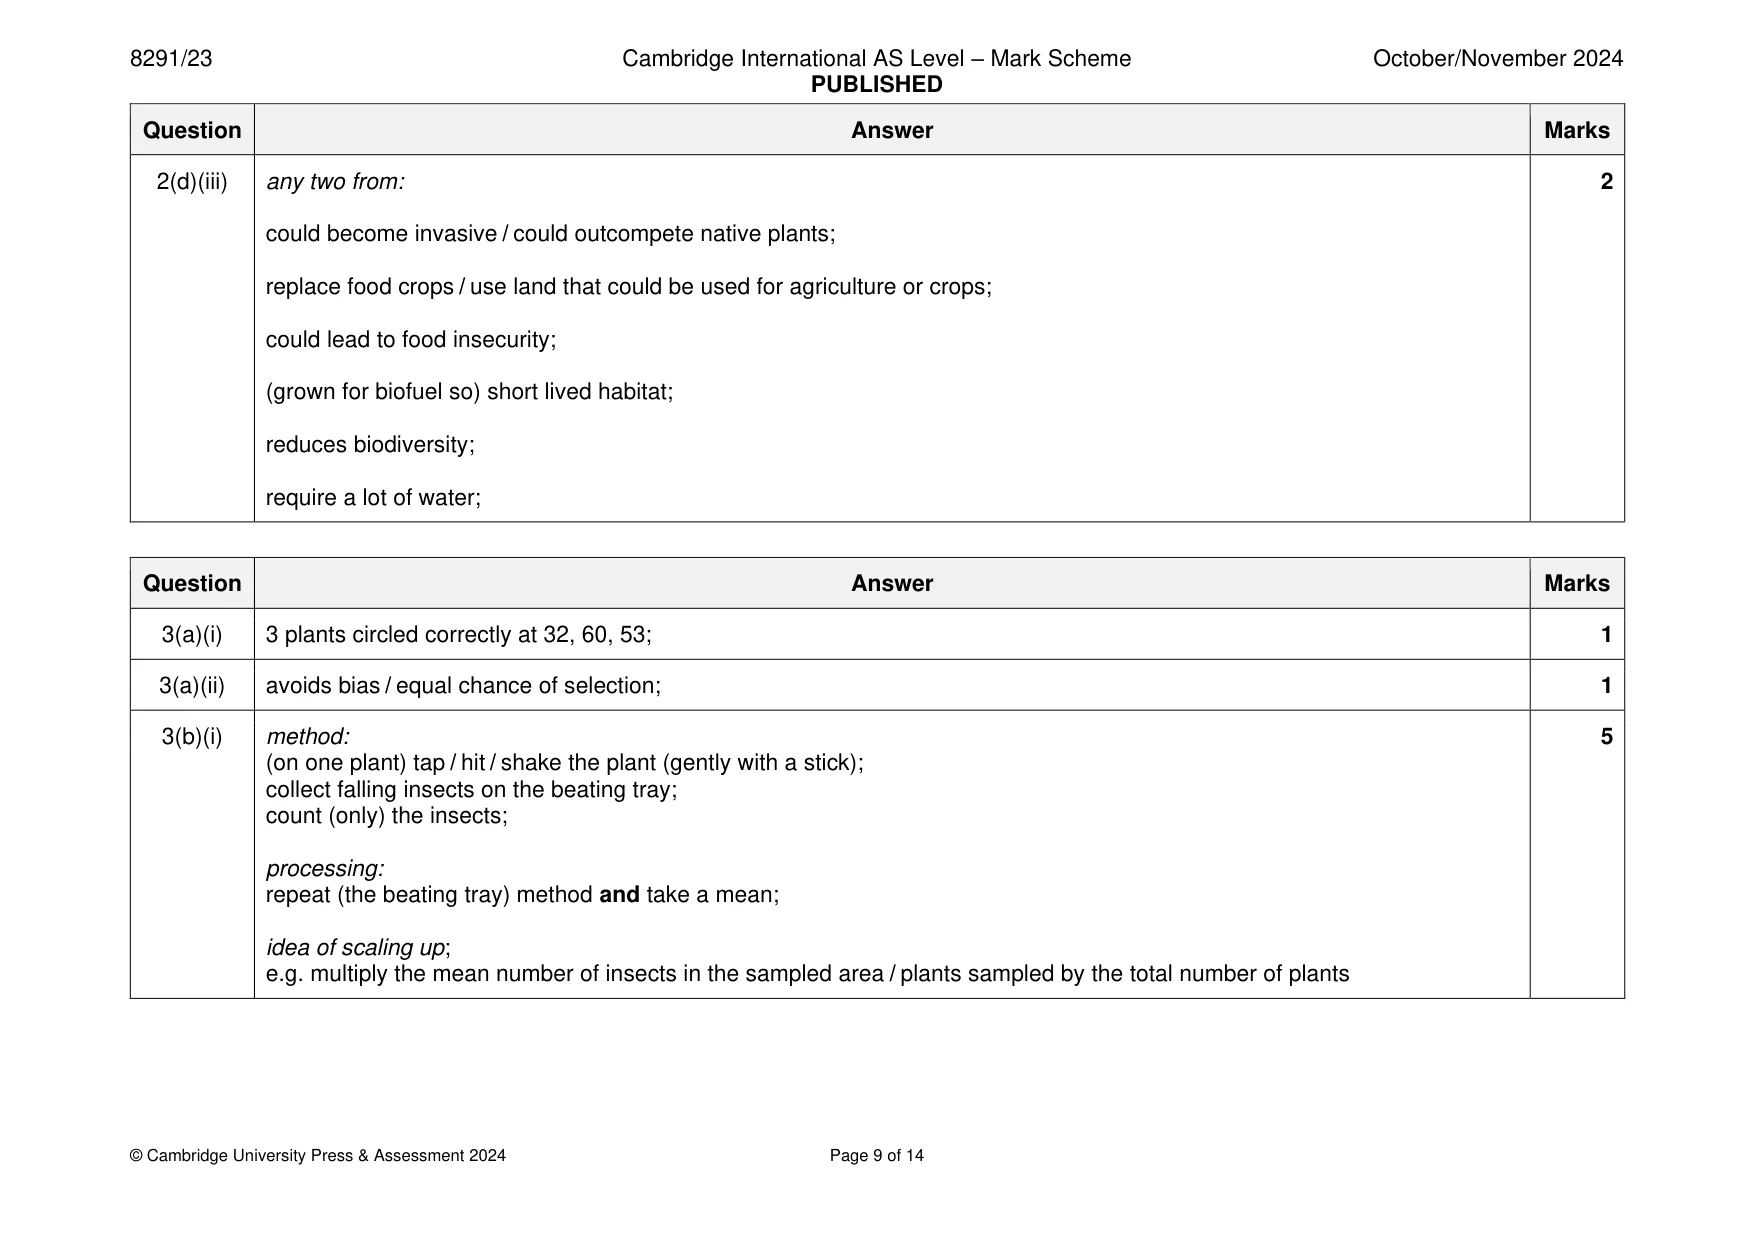
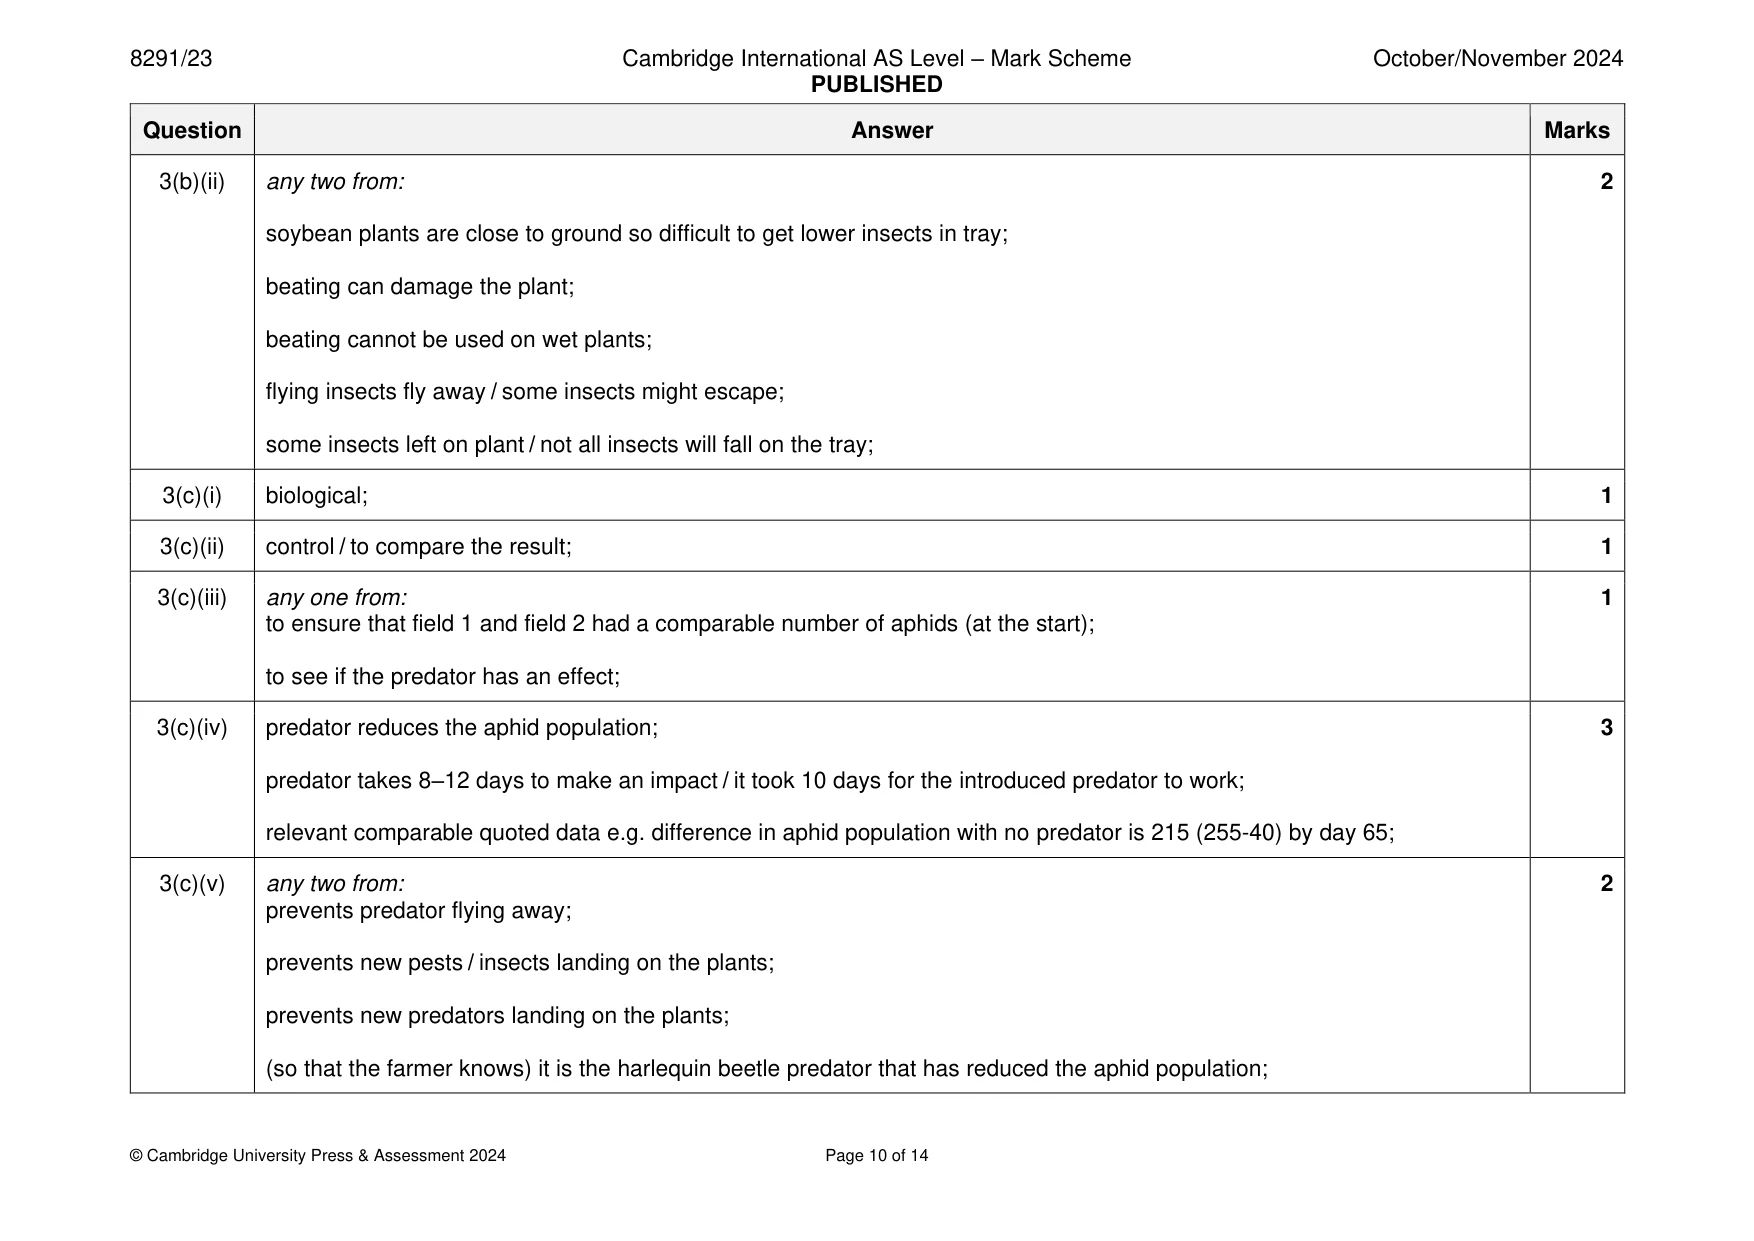
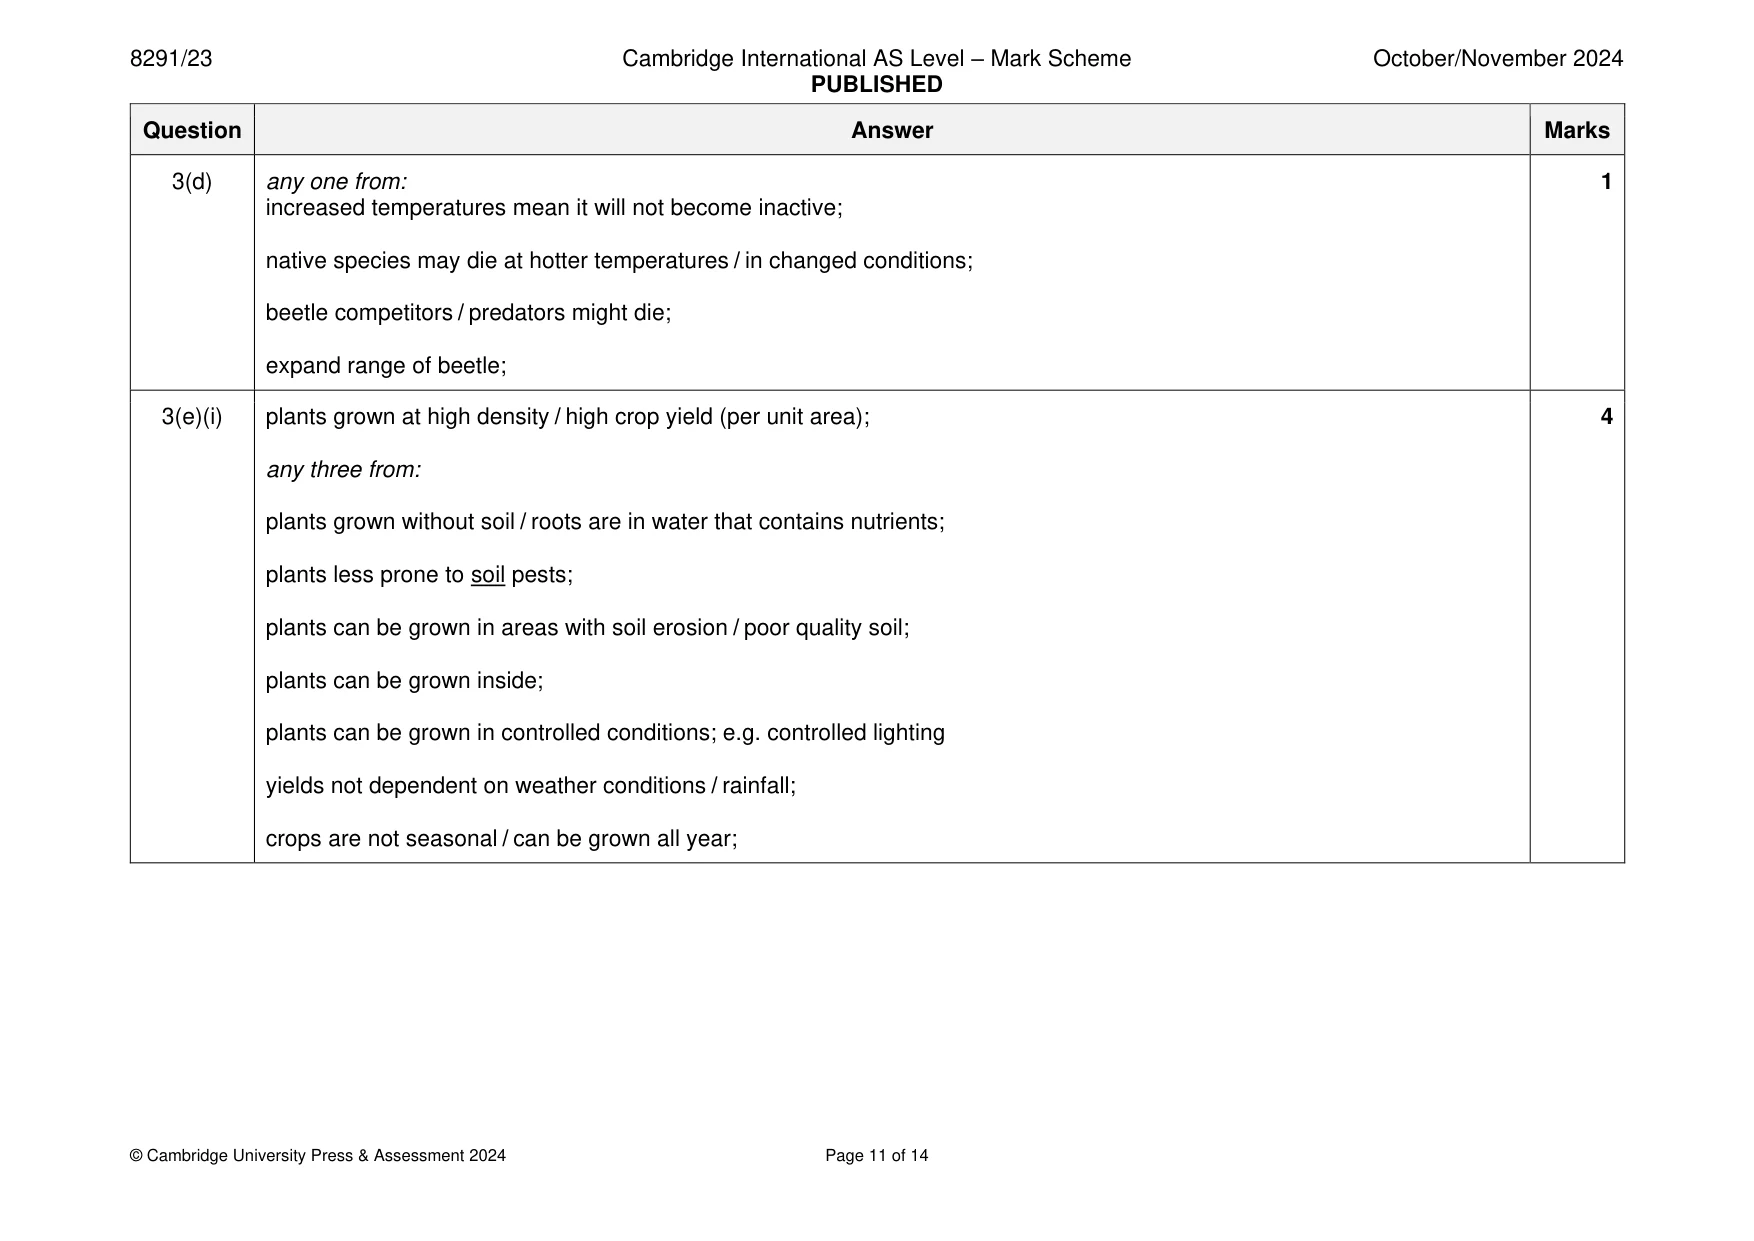
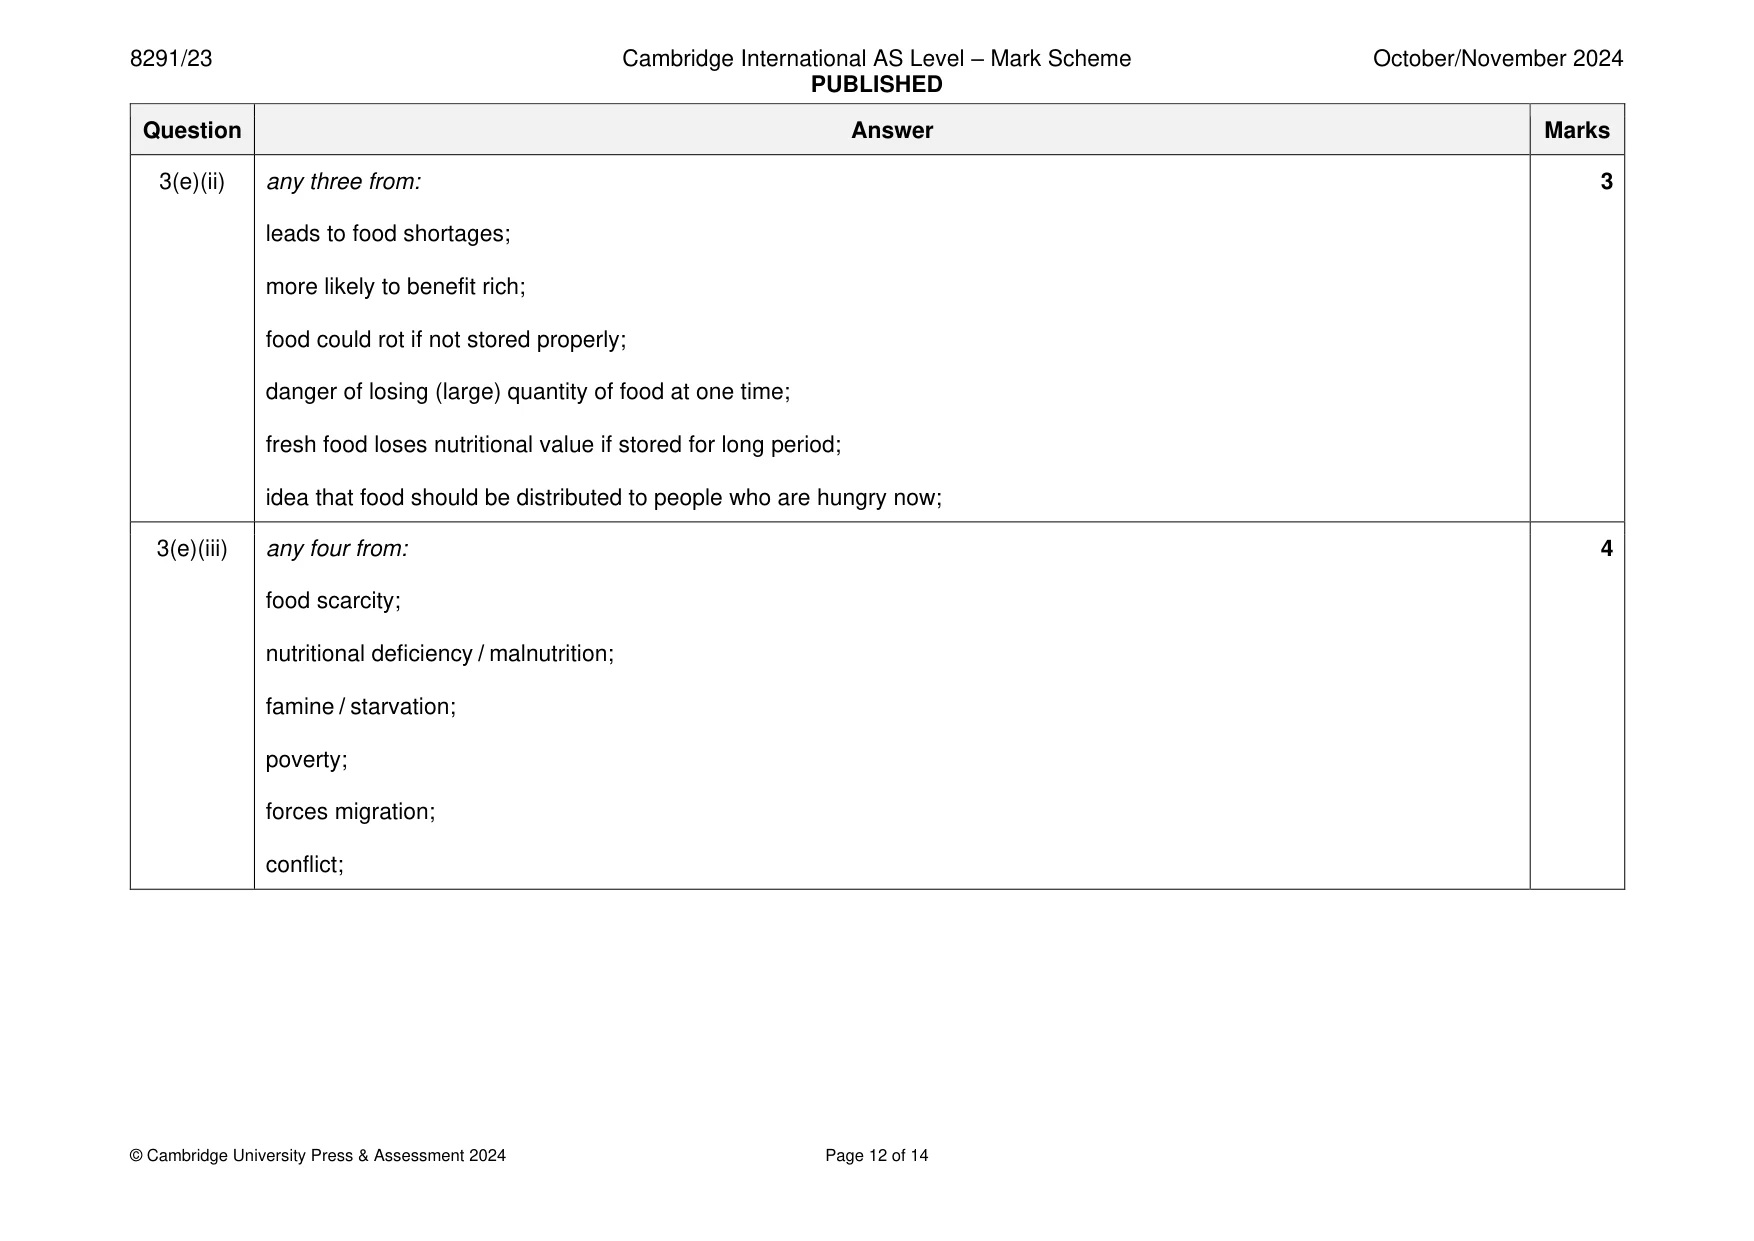
Mark scheme: Question Answer Marks 1(a) any three from: 3 cost of carbon storage / (storing the carbon) may be expensive; not enough storage facilities; technology for storing carbon is new / developing; stored carbon might leak; 1(b)(i) 4 12 000 (48 000) or5 12 000 (60 000); 2 240 000; 1(b)(ii) any four from: 4 reduces waste / reduces landfill usage; reduces need to quarry or mine; process is sustainable; reduces consumption of energy; permanently captures carbon dioxide; reduces (enhanced) greenhouse effect / greenhouse gas emission / global warming; (industrial) product has a low carbon footprint; reduces cost of raw materials in producing calcium / magnesium carbonate; 1(b)(iii) any three from: 3 (shelled) organisms die / build-up on the sea bed; (shelled organisms) covered in sediment / forms layers (of dead organisms / sediment); compaction / pressurised / cementation; form fossil fuels; 1(c) water / H2O; 2 (sun)light;
Q2 · ‘Climate TRACE’ is a global organisation that collects and shares data on greenhouse gas…
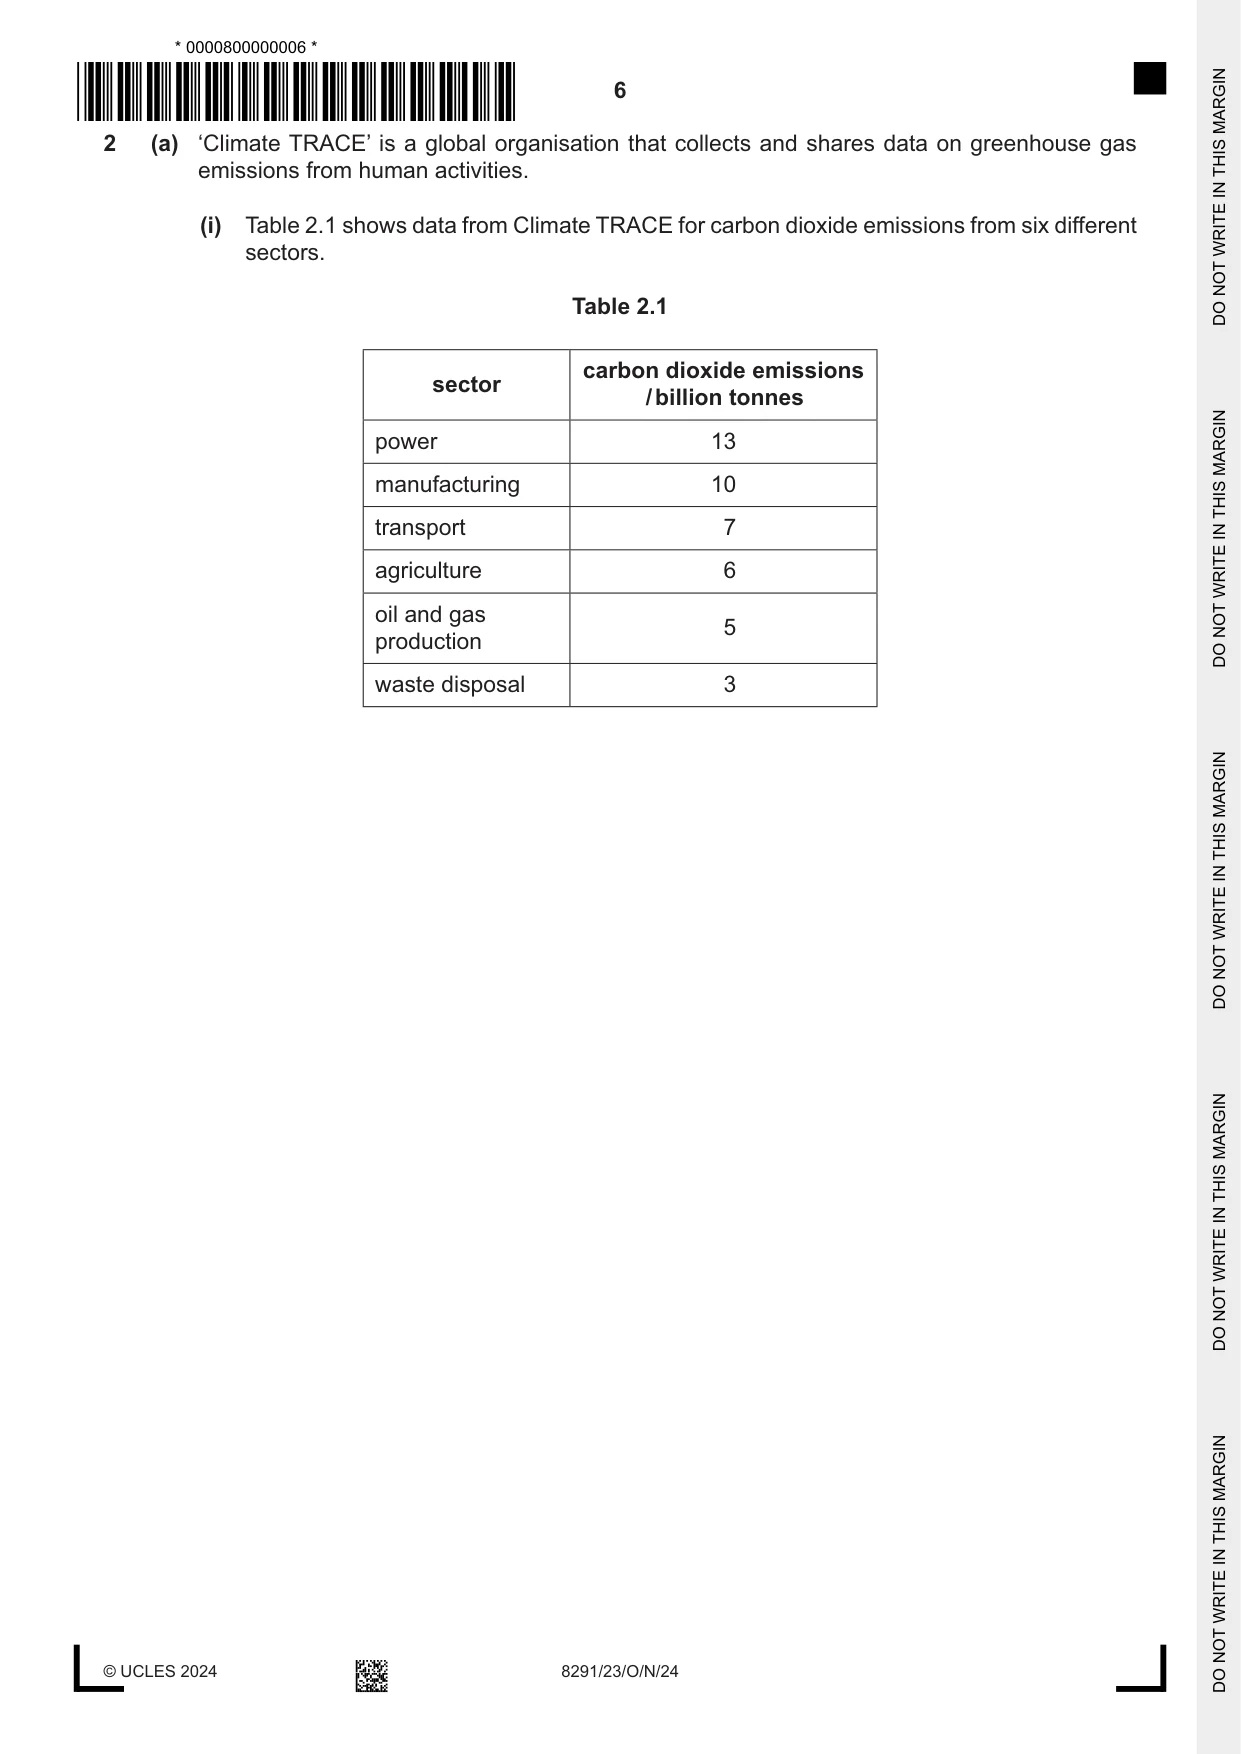
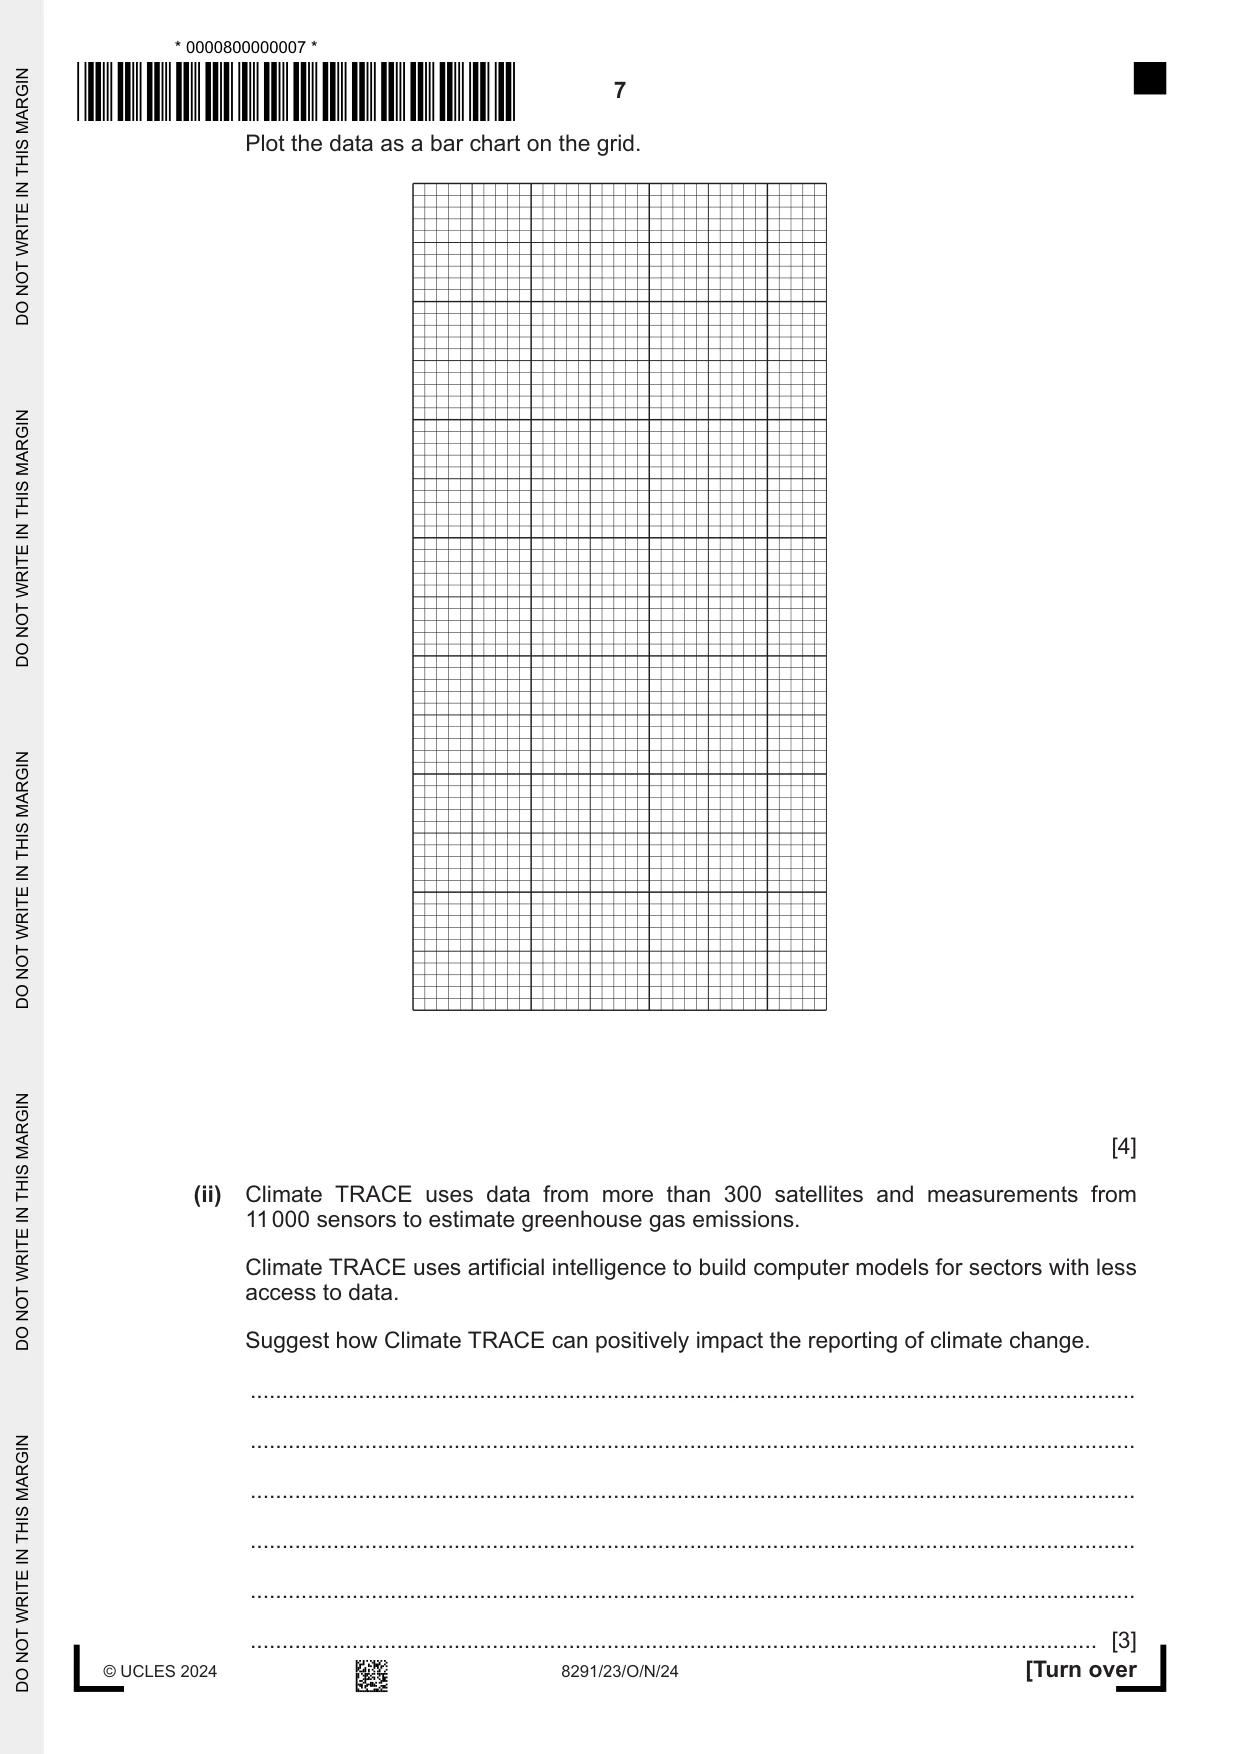
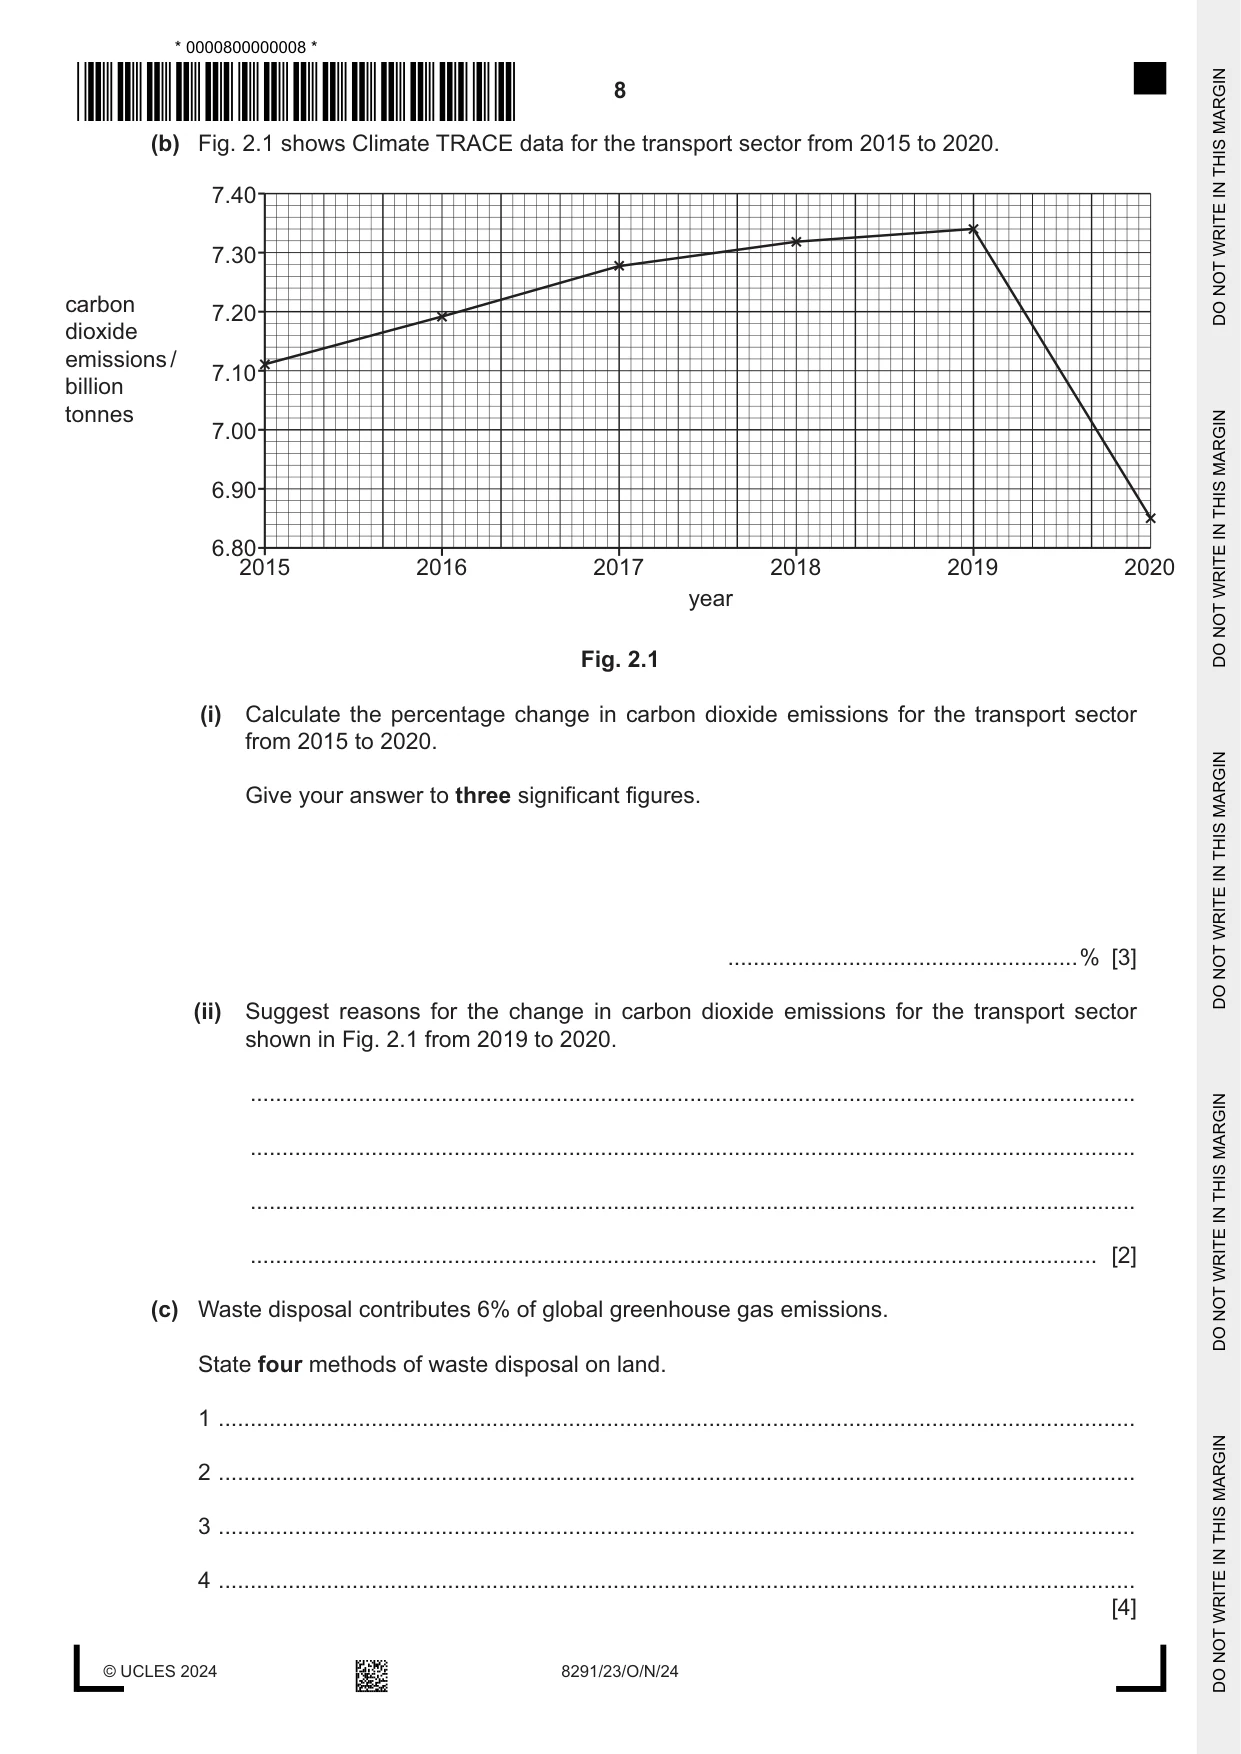
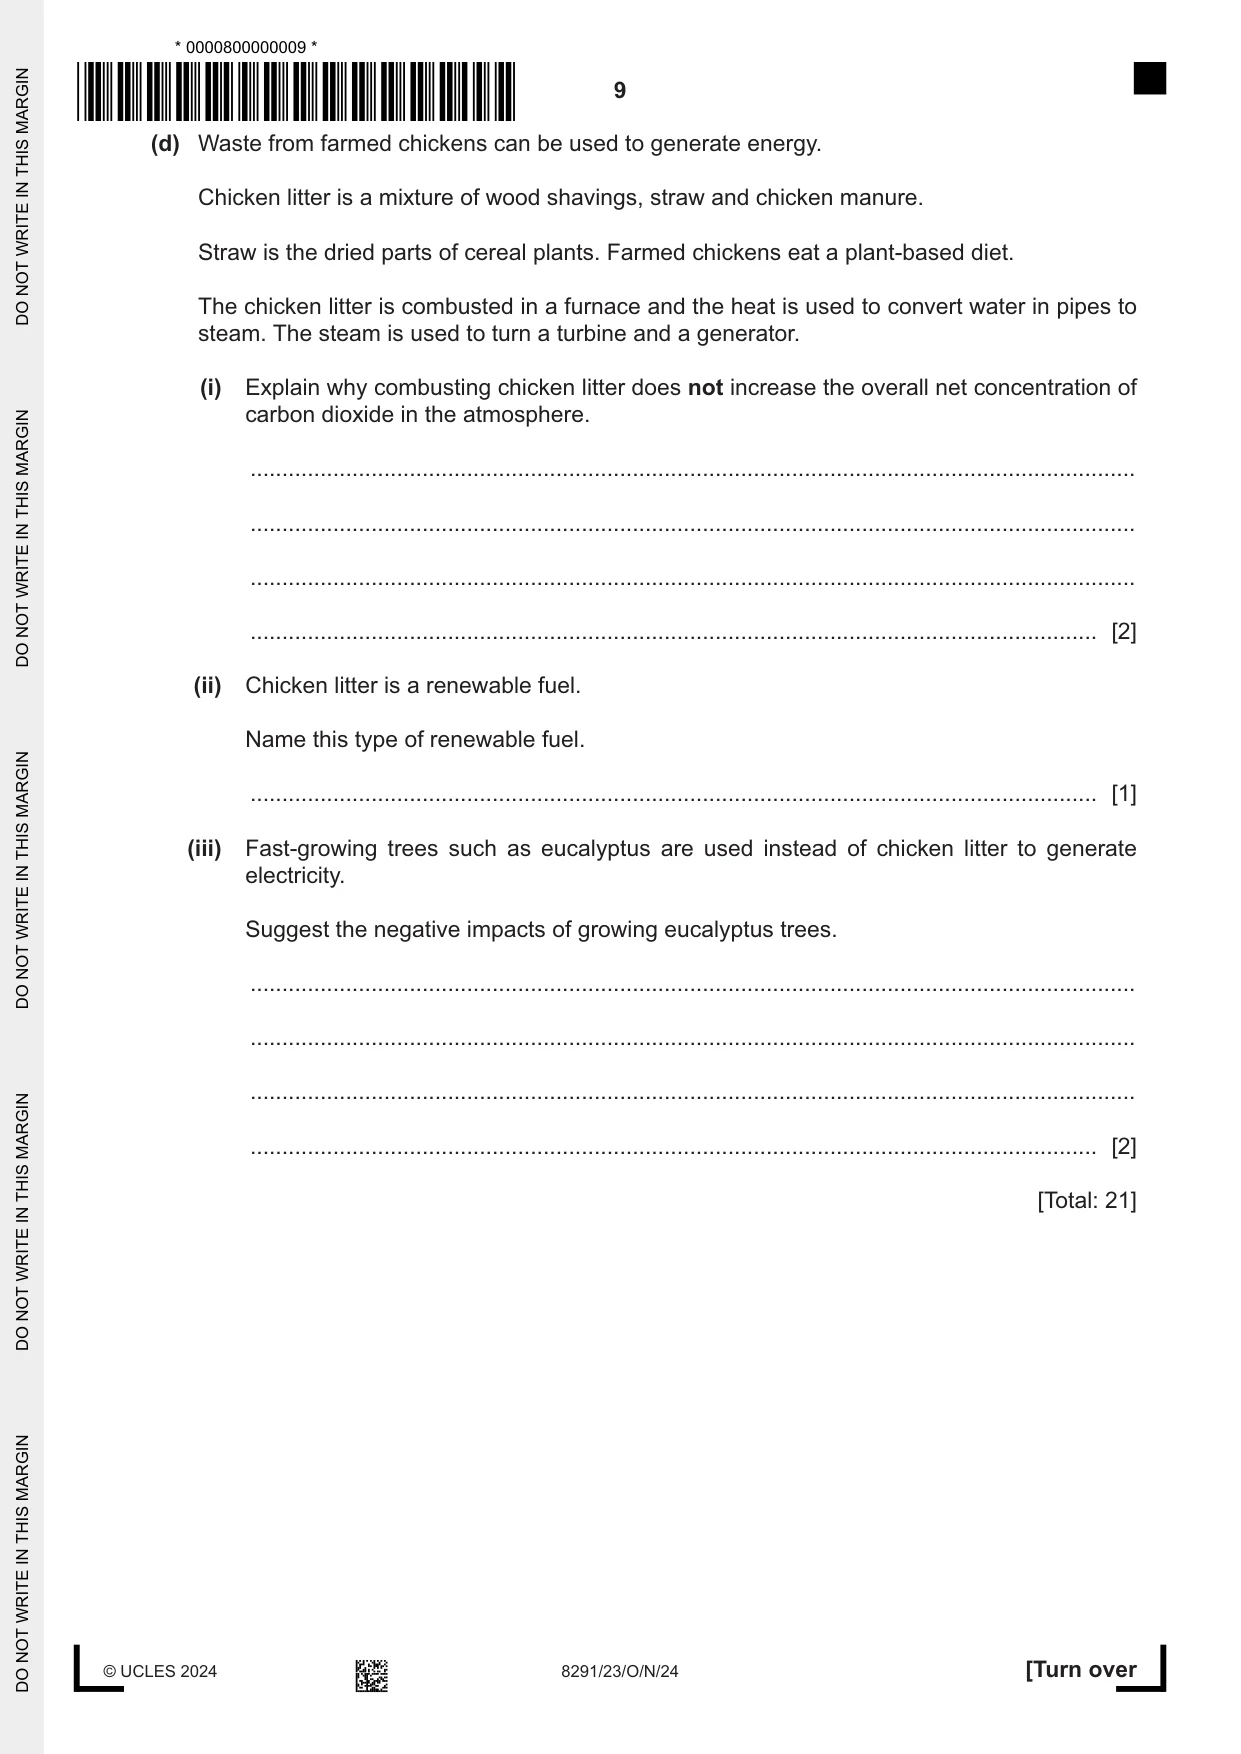
2 (a) ‘Climate TRACE’ is a global organisation that collects and shares data on greenhouse gas emissions from human activities. (i) Table 2.1 shows data from Climate TRACE for carbon dioxide emissions from six different sectors. Table 2.1 carbon dioxide emissions sector / billion tonnes power 13 manufacturing 10 transport 7 agriculture 6 oil and gas 5 production waste disposal 3 Plot the data as a bar chart on the grid. [4] (ii) Climate TRACE uses data from more than 300 satellites and measurements from 11 000 sensors to estimate greenhouse gas emissions. Climate TRACE uses artificial intelligence to build computer models for sectors with less access to data. Suggest how Climate TRACE can positively impact the reporting of climate change. ........................................................................................................................................... ........................................................................................................................................... ........................................................................................................................................... ........................................................................................................................................... ........................................................................................................................................... ..................................................................................................................................... [3] (b) Fig. 2.1 shows Climate TRACE data for the transport sector from 2015 to 2020. 7.40 7.30 carbon 7.20 dioxide emissions / 7.10 billion tonnes 7.00 6.90 6.80 2015 2016 2017 2018 2019 2020 year Fig. 2.1 (i) Calculate the percentage change in carbon dioxide emissions for the transport sector from 2015 to 2020. Give your answer to three significant figures. .......................................................% [3] (ii) Suggest reasons for the change in carbon dioxide emissions for the transport sector shown in Fig. 2.1 from 2019 to 2020. ........................................................................................................................................... ........................................................................................................................................... ........................................................................................................................................... ..................................................................................................................................... [2] (c) Waste disposal contributes 6% of global greenhouse gas emissions. State four methods of waste disposal on land. 1 ................................................................................................................................................ 2 ................................................................................................................................................ 3 ................................................................................................................................................ 4 ................................................................................................................................................ [4] (d) Waste from farmed chickens can be used to generate energy. Chicken litter is a mixture of wood shavings, straw and chicken manure. Straw is the dried parts of cereal plants. Farmed chickens eat a plant-based diet. The chicken litter is combusted in a furnace and the heat is used to convert water in pipes to steam. The steam is used to turn a turbine and a generator. (i) Explain why combusting chicken litter does not increase the overall net concentration of carbon dioxide in the atmosphere. ........................................................................................................................................... ........................................................................................................................................... ........................................................................................................................................... ..................................................................................................................................... [2] (ii) Chicken litter is a renewable fuel. Name this type of renewable fuel. ..................................................................................................................................... [1] (iii) Fast-growing trees such as eucalyptus are used instead of chicken litter to generate electricity. Suggest the negative impacts of growing eucalyptus trees. ........................................................................................................................................... ........................................................................................................................................... ........................................................................................................................................... ..................................................................................................................................... [2] [Total: 21]
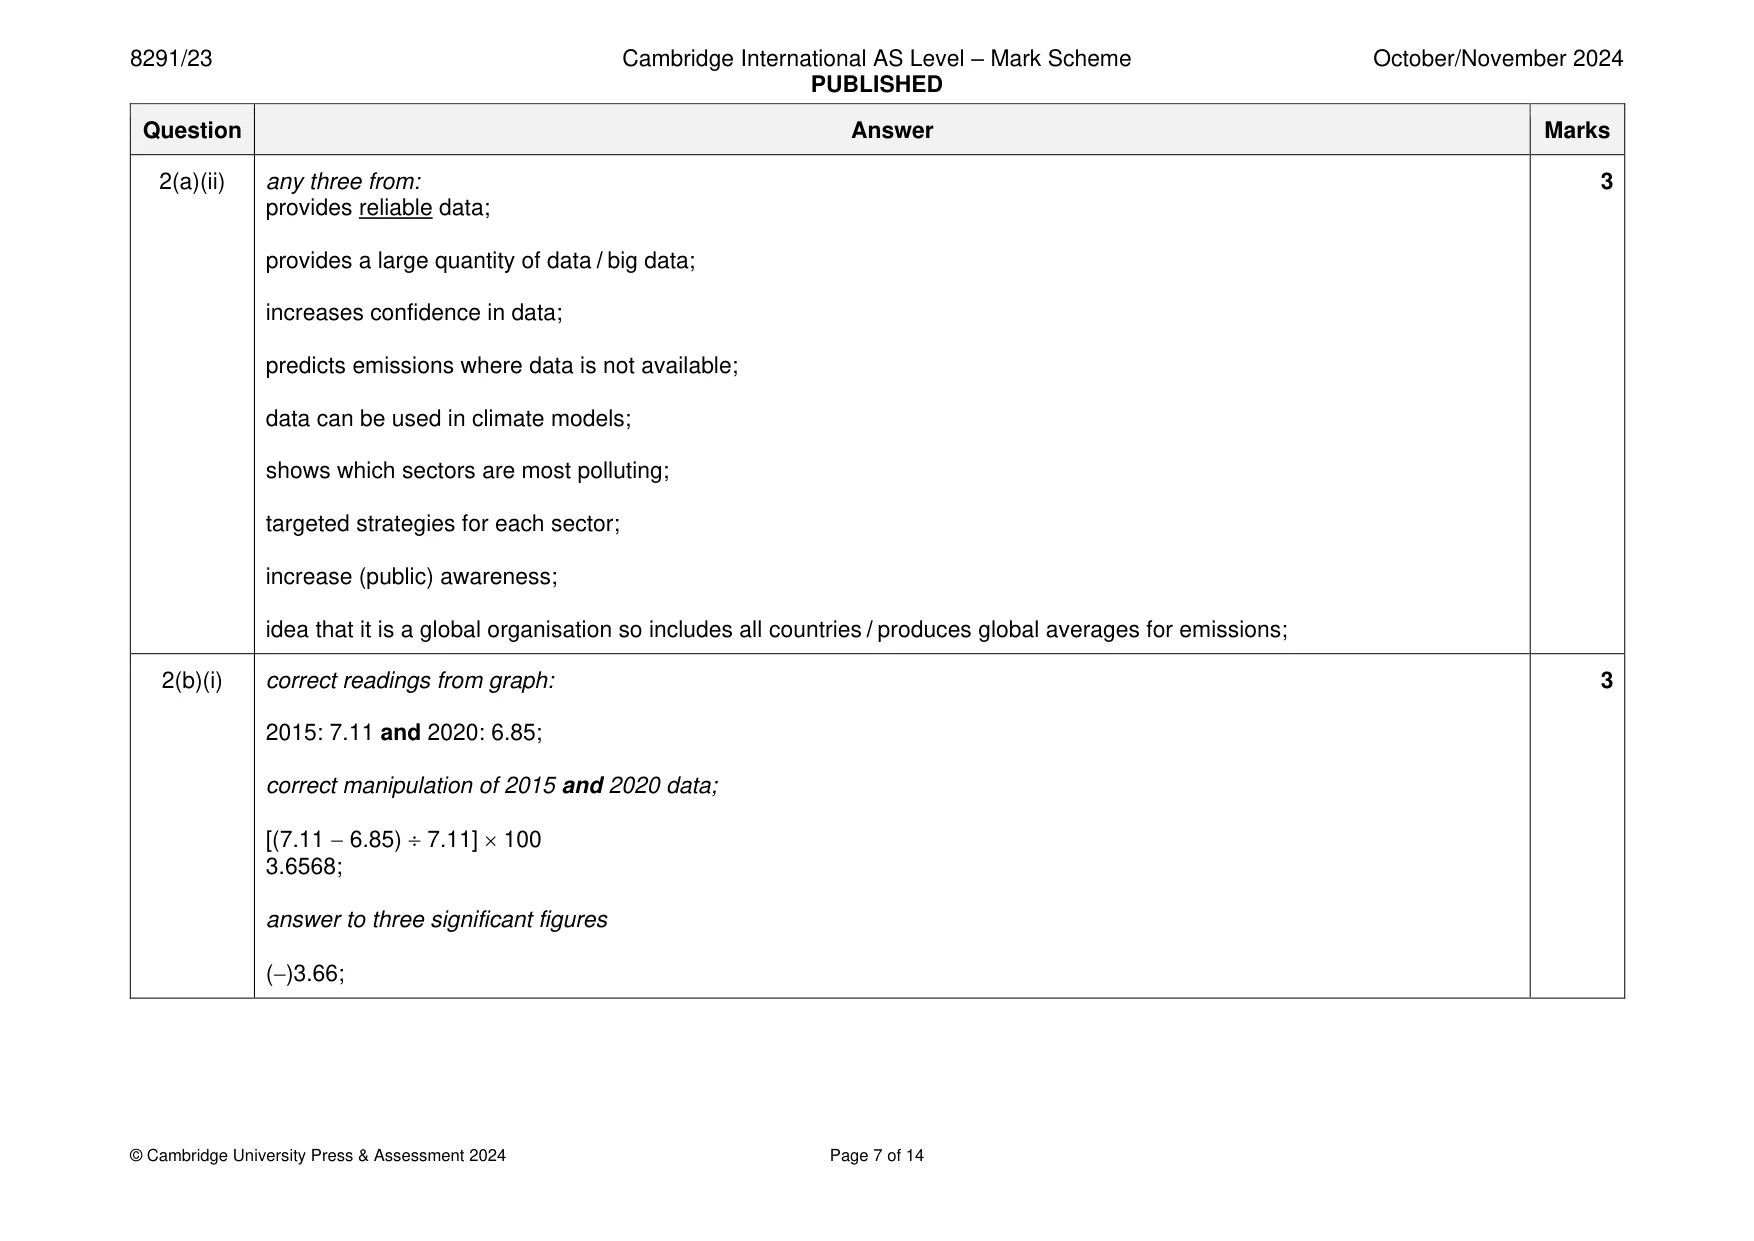
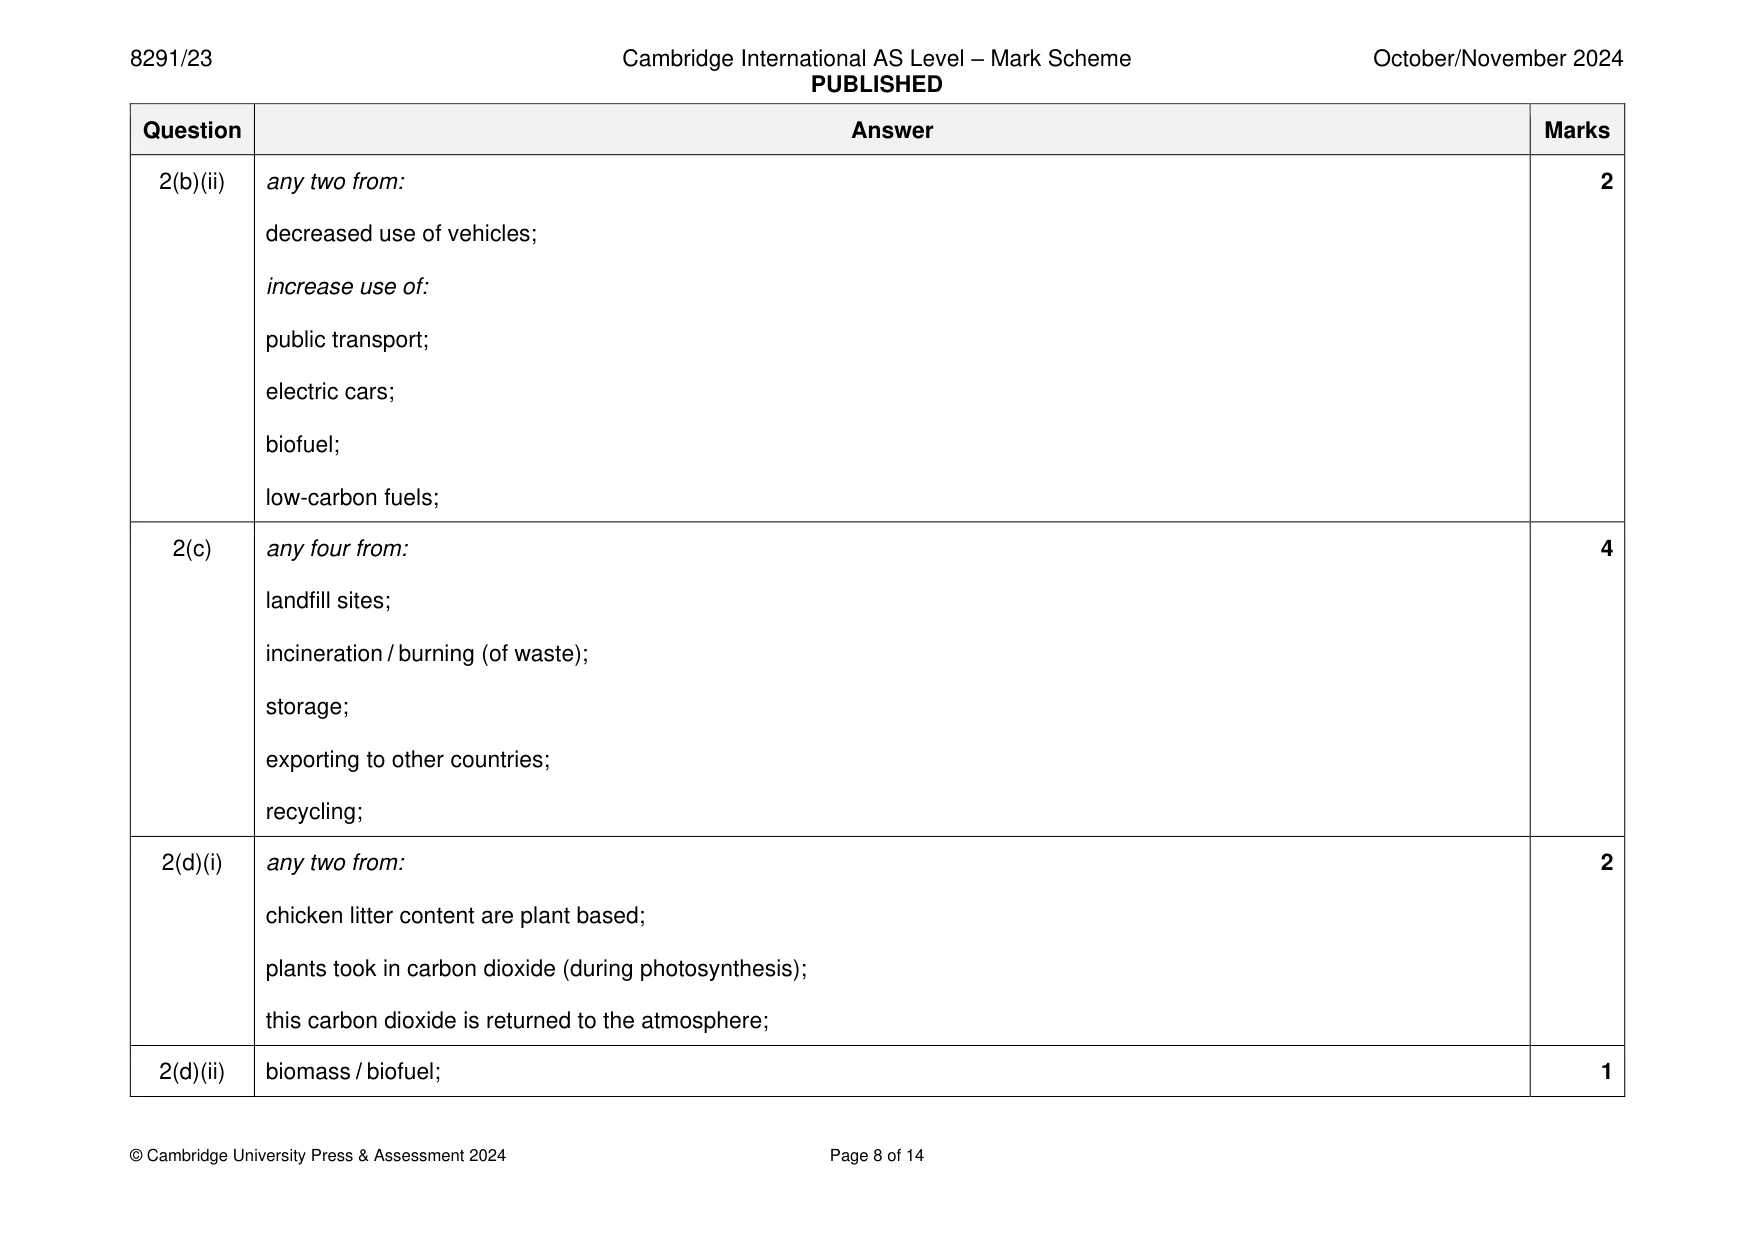
Mark scheme: 2(a)(i) axis labels: y-axis and unit carbon dioxide emissions / billion tonnes and x-axis sector; 4 sensible linear scale with data that occupies at least half the grid; bars equal width and not touching; correct plots; 2(a)(ii) any three from: 3 provides reliable data; provides a large quantity of data / big data; increases confidence in data; predicts emissions where data is not available; data can be used in climate models; shows which sectors are most polluting; targeted strategies for each sector; increase (public) awareness; idea that it is a global organisation so includes all countries / produces global averages for emissions; 2(b)(i) correct readings from graph: 3 2015: 7.11 and 2020: 6.85; correct manipulation of 2015 and 2020 data; [(7.11 − 6.85) 7.11] 100 3.6568; answer to three significant figures (−)3.66; 2(b)(ii) any two from: 2 decreased use of vehicles; increase use of: public transport; electric cars; biofuel; low-carbon fuels; 2(c) any four from: 4 landfill sites; incineration / burning (of waste); storage; exporting to other countries; recycling; 2(d)(i) any two from: 2 chicken litter content are plant based; plants took in carbon dioxide (during photosynthesis); this carbon dioxide is returned to the atmosphere; 2(d)(ii) biomass / biofuel; 1 2(d)(iii) any two from: 2 could become invasive / could outcompete native plants; replace food crops / use land that could be used for agriculture or crops; could lead to food insecurity; (grown for biofuel so) short lived habitat; reduces biodiversity; require a lot of water;
More questions on Data collection techniques and data analysis
Q3 · A farmer investigates insect pests on soybean plants
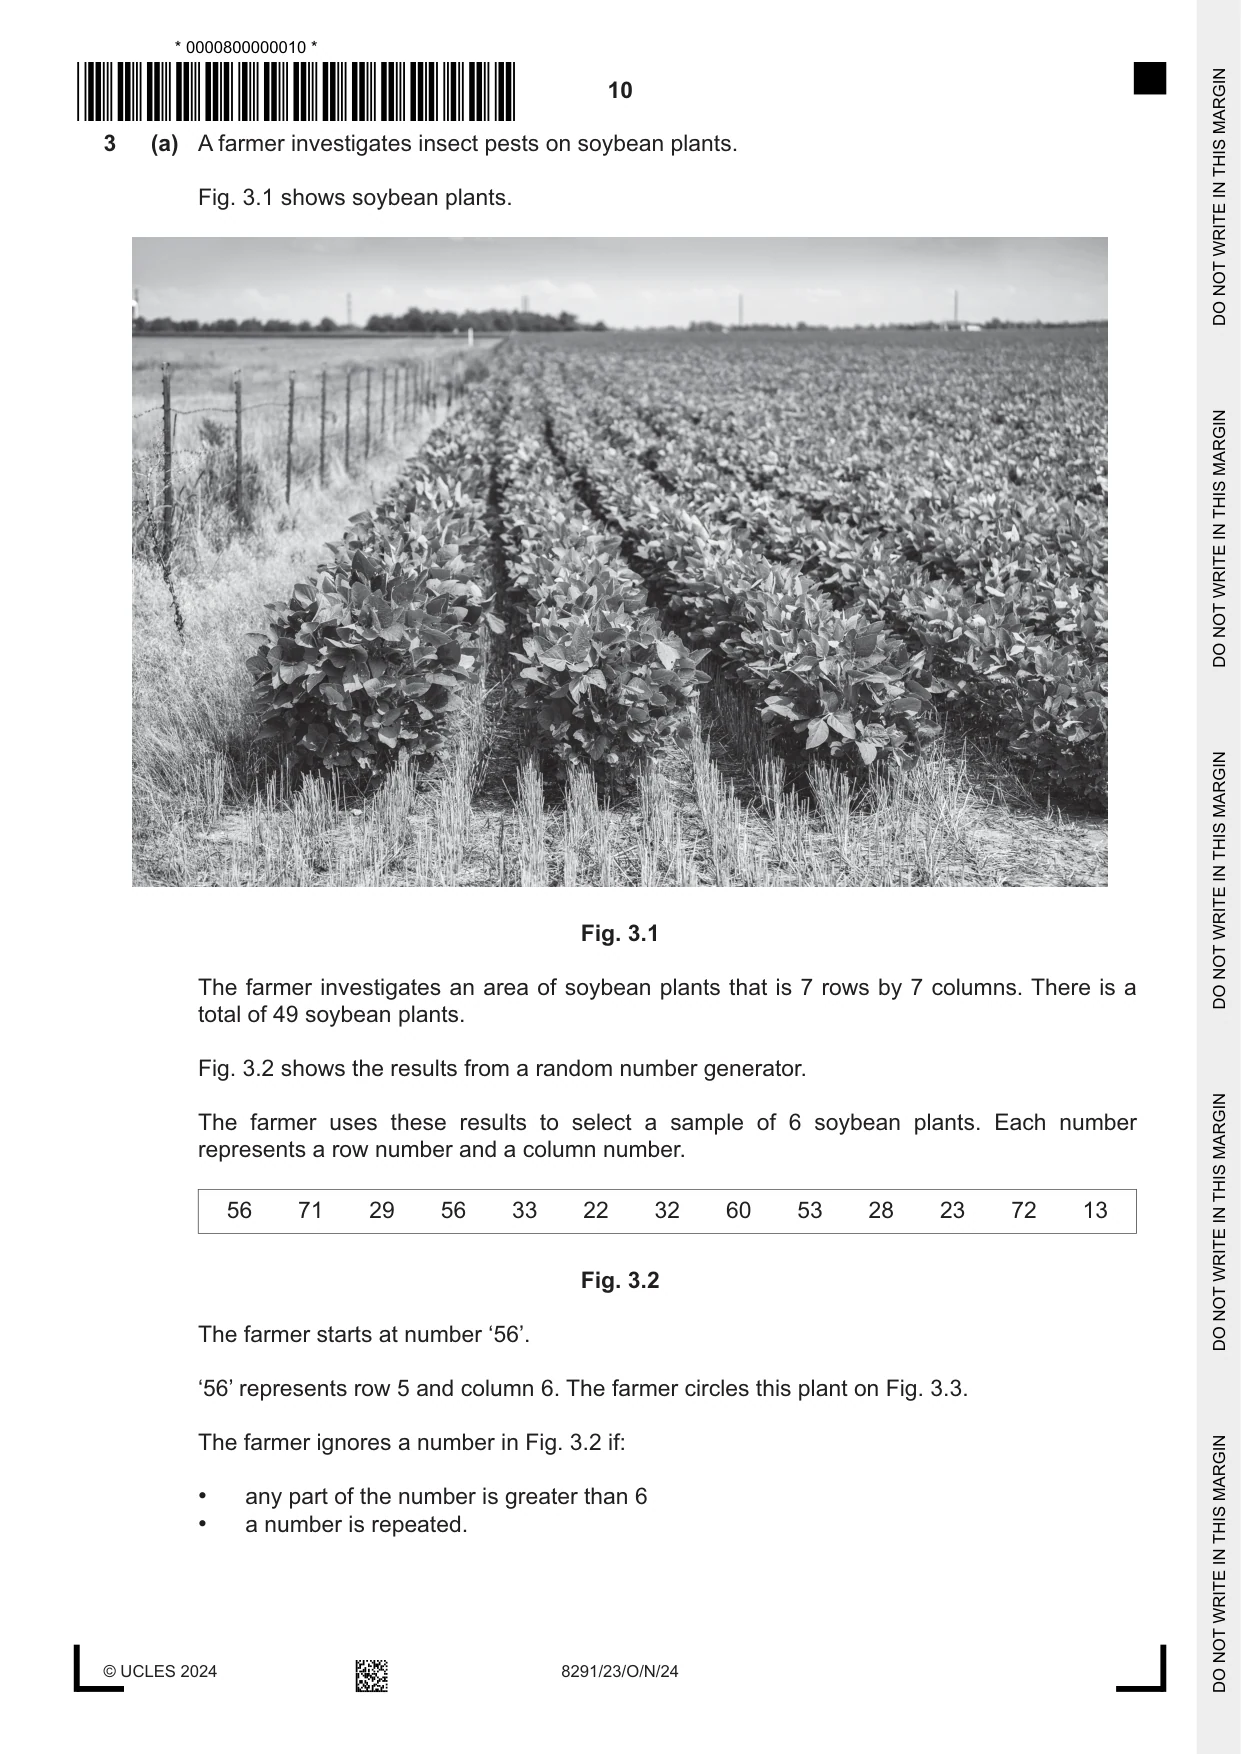
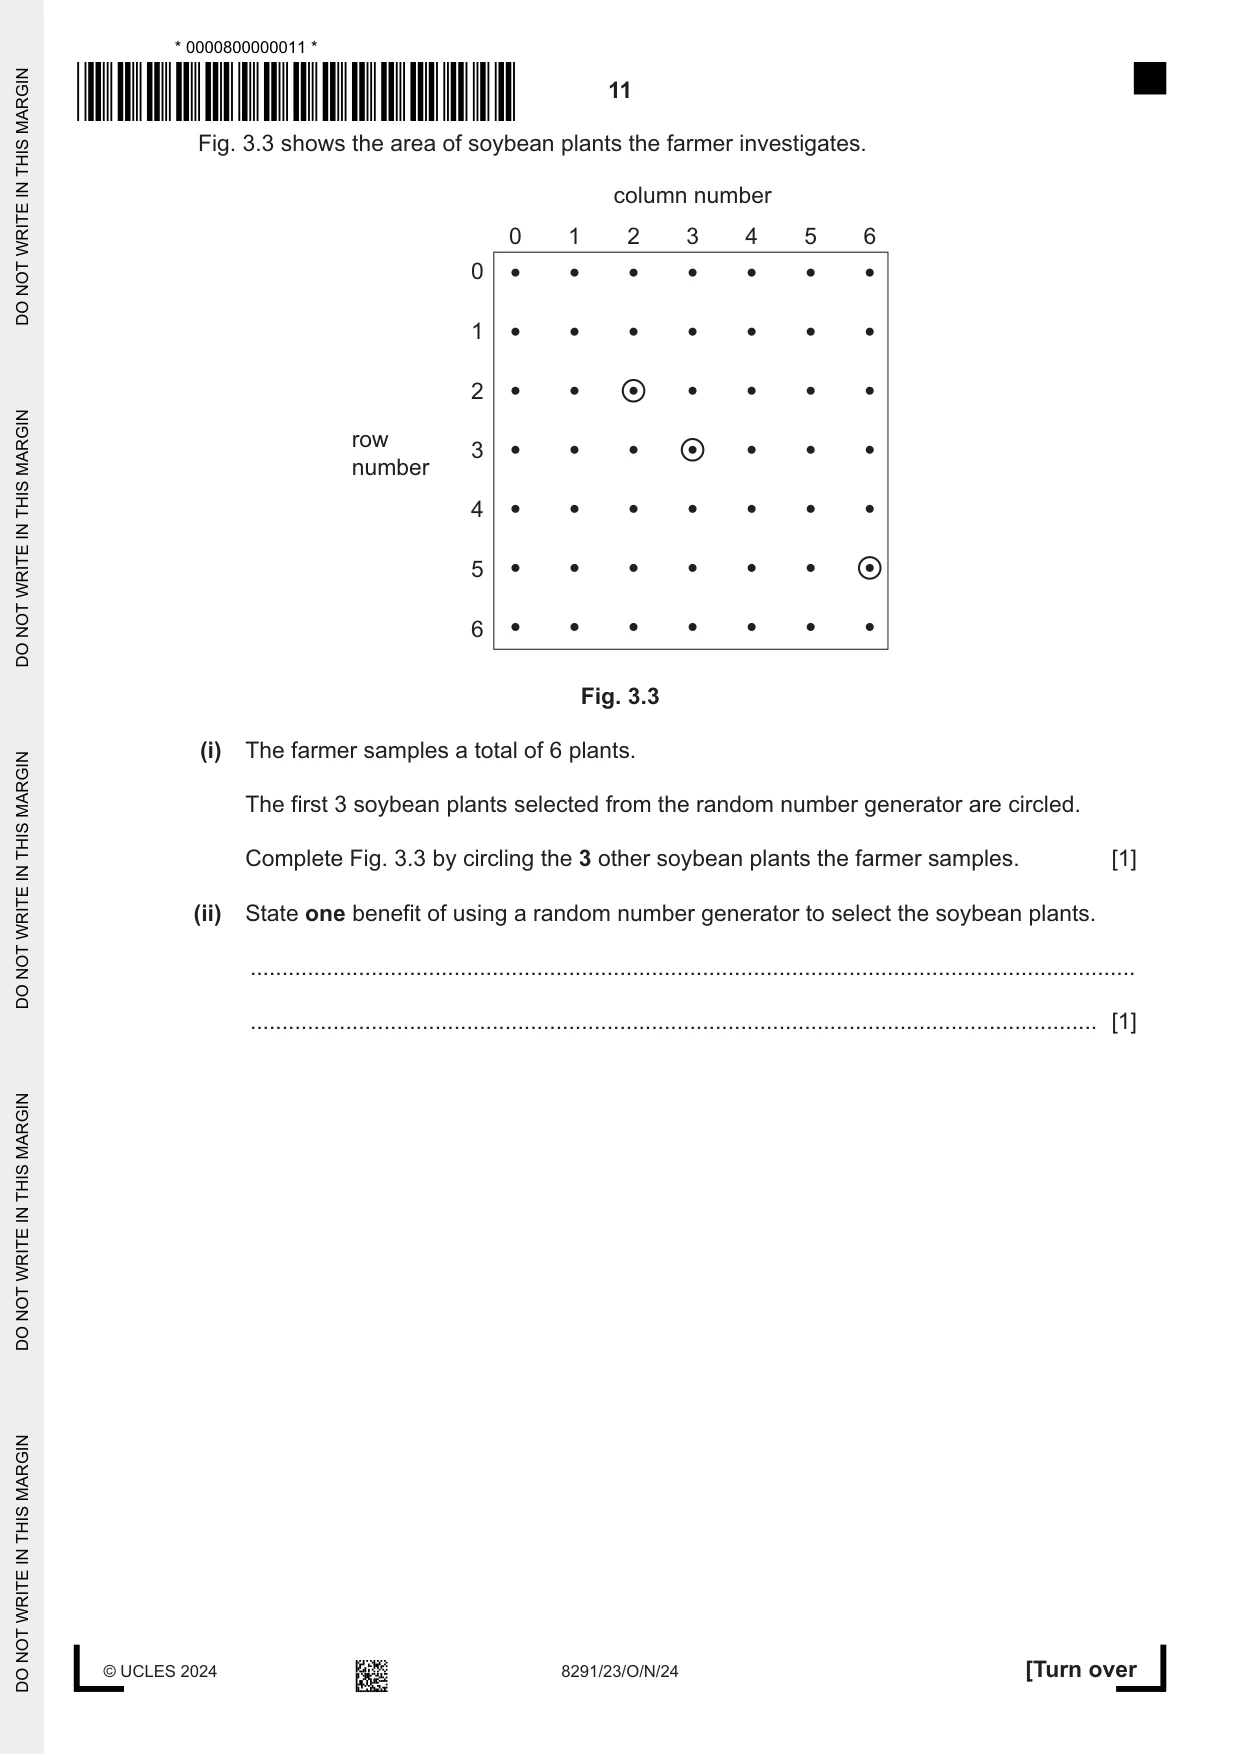
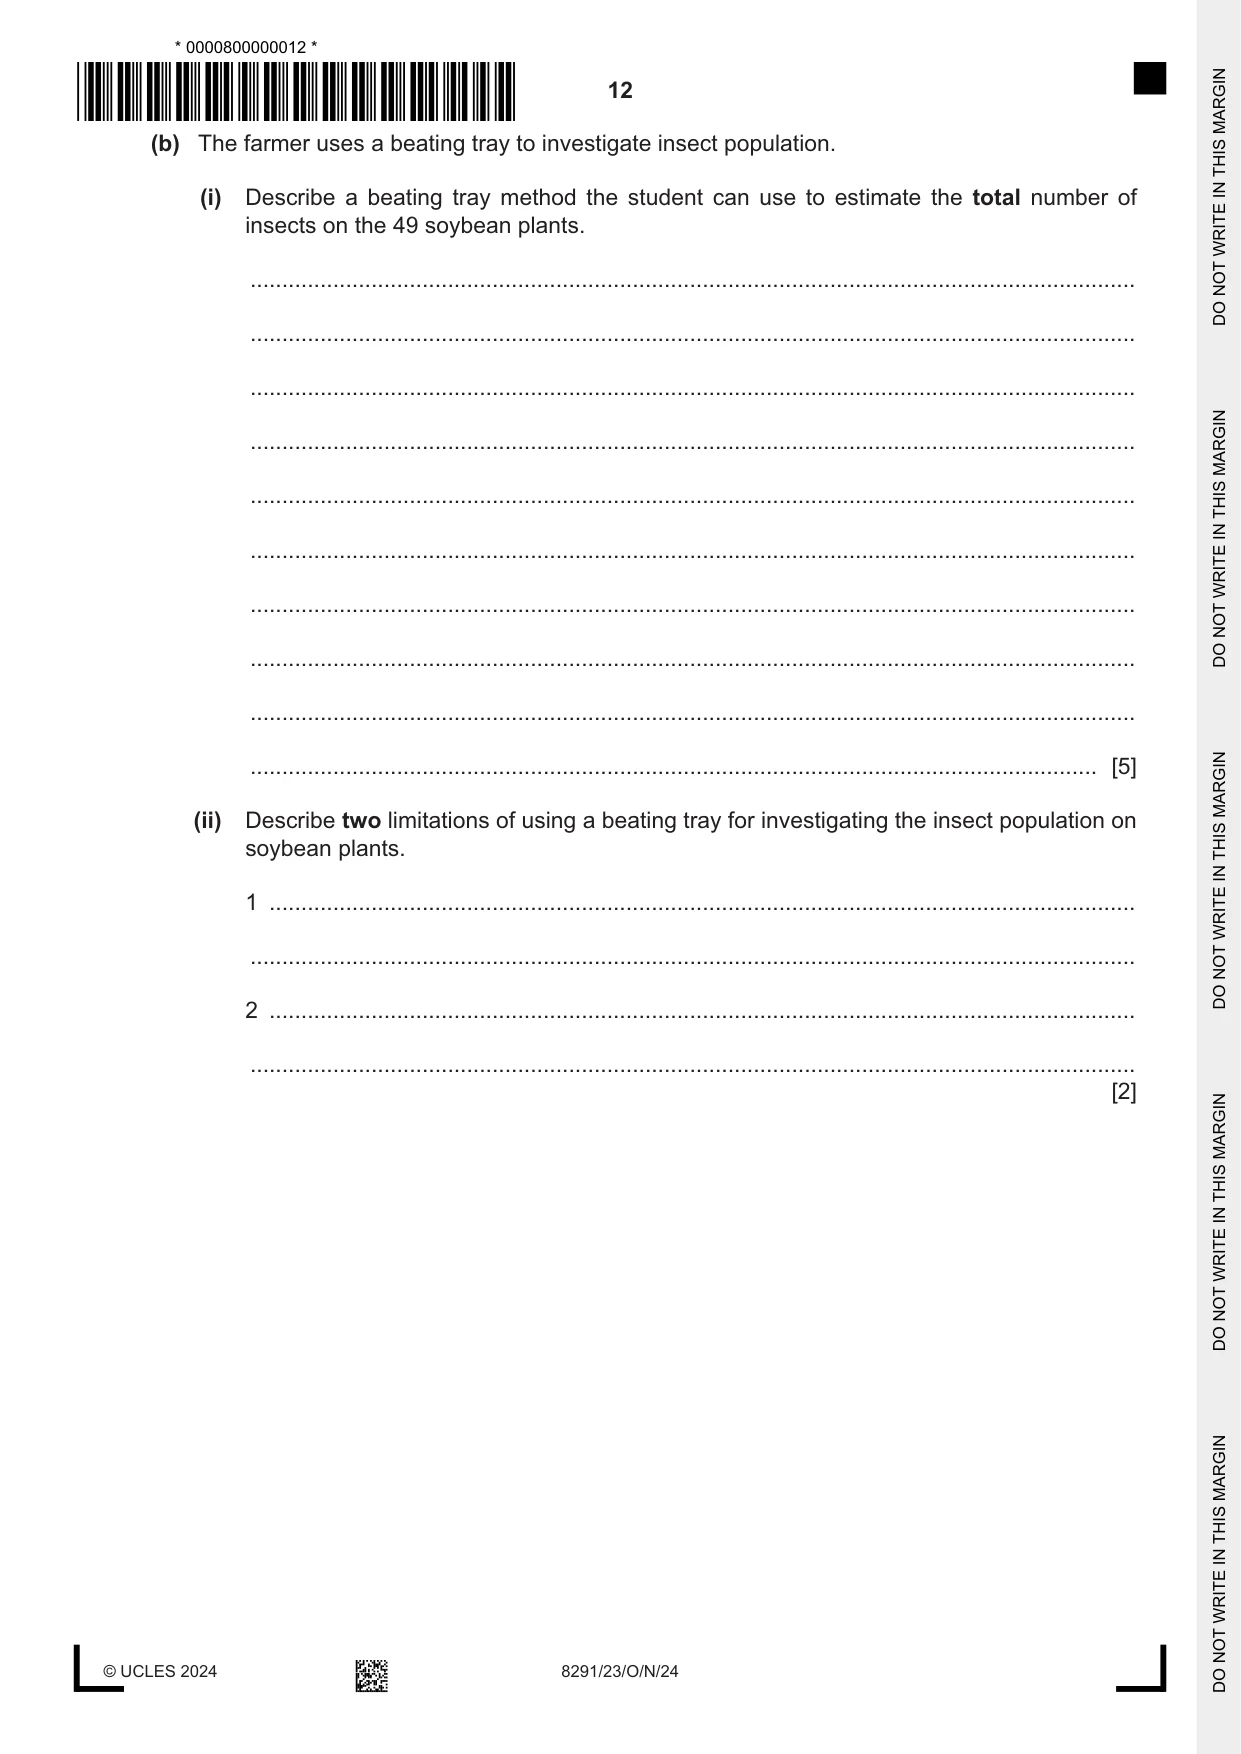
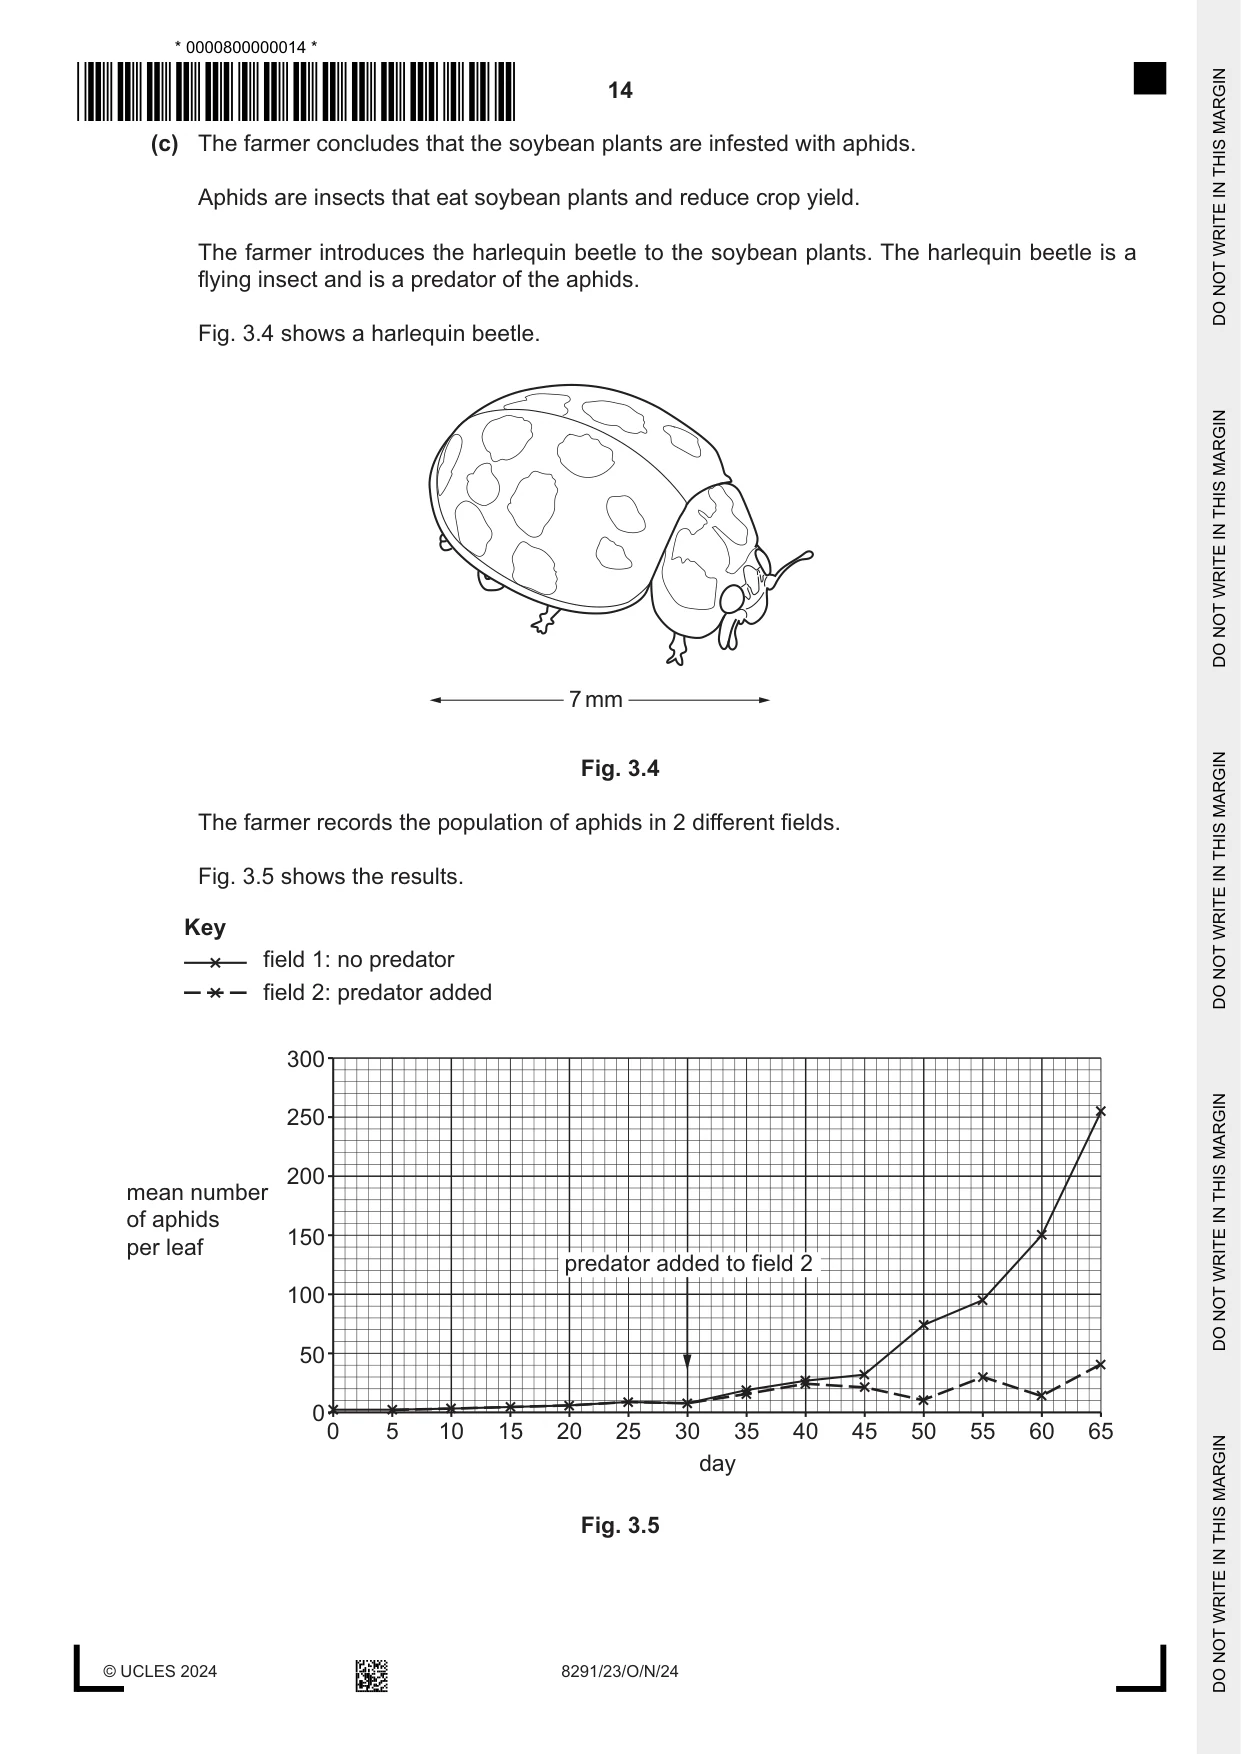
3 (a) A farmer investigates insect pests on soybean plants. Fig. 3.1 shows soybean plants. Fig. 3.1 The farmer investigates an area of soybean plants that is 7 rows by 7 columns. There is a total of 49 soybean plants. Fig. 3.2 shows the results from a random number generator. The farmer uses these results to select a sample of 6 soybean plants. Each number represents a row number and a column number. 56 71 29 56 33 22 32 60 53 28 23 72 13 Fig. 3.2 The farmer starts at number ‘56’. ‘56’ represents row 5 and column 6. The farmer circles this plant on Fig. 3.3. The farmer ignores a number in Fig. 3.2 if: • any part of the number is greater than 6 • a number is repeated. Fig. 3.3 shows the area of soybean plants the farmer investigates. column number 0 1 2 3 4 5 6 0 1 2 row 3 number 4 5 6 Fig. 3.3 (i) The farmer samples a total of 6 plants. The first 3 soybean plants selected from the random number generator are circled. Complete Fig. 3.3 by circling the 3 other soybean plants the farmer samples. [1] (ii) State one benefit of using a random number generator to select the soybean plants. ........................................................................................................................................... ..................................................................................................................................... [1] (b) The farmer uses a beating tray to investigate insect population. (i) Describe a beating tray method the student can use to estimate the total number of insects on the 49 soybean plants. ........................................................................................................................................... ........................................................................................................................................... ........................................................................................................................................... ........................................................................................................................................... ........................................................................................................................................... ........................................................................................................................................... ........................................................................................................................................... ........................................................................................................................................... ........................................................................................................................................... ..................................................................................................................................... [5] (ii) Describe two limitations of using a beating tray for investigating the insect population on soybean plants. 1 ........................................................................................................................................ ........................................................................................................................................... 2 ........................................................................................................................................ ........................................................................................................................................... [2] (c) The farmer concludes that the soybean plants are infested with aphids. Aphids are insects that eat soybean plants and reduce crop yield. The farmer introduces the harlequin beetle to the soybean plants. The harlequin beetle is a flying insect and is a predator of the aphids. Fig. 3.4 shows a harlequin beetle. 7 mm Fig. 3.4 The farmer records the population of aphids in 2 different fields. Fig. 3.5 shows the results. Key field 1: no predator field 2: predator added 300 250 200 mean number of aphids 150per leaf predator added to field 2 100 50 00 5 10 15 20 25 30 35 40 45 50 55 60 65 day Fig. 3.5 (i) Name the type of method for controlling the aphid population using a predator. ..................................................................................................................................... [1] (ii) Suggest why the predator was not added to field 1. ..................................................................................................................................... [1] (iii) Suggest why the aphid population was measured before the predator was added to field 2. ........................................................................................................................................... ..................................................................................................................................... [1] (iv) Write a conclusion using the data in Fig. 3.5. ........................................................................................................................................... ........................................................................................................................................... ........................................................................................................................................... ........................................................................................................................................... ........................................................................................................................................... ..................................................................................................................................... [3] (v) Suggest why the farmer covers the soybean plants with nets after the predator is added. ........................................................................................................................................... ........................................................................................................................................... ........................................................................................................................................... ..................................................................................................................................... [2] (d) The harlequin beetle was introduced to North America and Europe to control aphid populations. The harlequin beetle is now considered to be one of the world’s most invasive species. The harlequin beetle becomes inactive when temperatures are lower than 10 °C. Suggest why climate change could benefit the harlequin beetle. ................................................................................................................................................... ............................................................................................................................................. [1] (e) Increasing crop productivity by reducing pests is a strategy for managing food security. Hydroponics can also improve food security. (i) Explain how hydroponics improves food security. ........................................................................................................................................... ........................................................................................................................................... ........................................................................................................................................... ........................................................................................................................................... ........................................................................................................................................... ........................................................................................................................................... ........................................................................................................................................... ..................................................................................................................................... [4] (ii) Describe the limitations of large-scale food stockpiling as a method of reducing food insecurity. ........................................................................................................................................... ........................................................................................................................................... ........................................................................................................................................... ........................................................................................................................................... ........................................................................................................................................... ..................................................................................................................................... [3] (iii) Outline the impacts of food insecurity. ........................................................................................................................................... ........................................................................................................................................... ........................................................................................................................................... ........................................................................................................................................... ........................................................................................................................................... ........................................................................................................................................... ........................................................................................................................................... ..................................................................................................................................... [4] [Total: 29]
Mark scheme: 3(a)(i) 3 plants circled correctly at 32, 60, 53; 1 3(a)(ii) avoids bias / equal chance of selection; 1 3(b)(i) method: 5 (on one plant) tap / hit / shake the plant (gently with a stick); collect falling insects on the beating tray; count (only) the insects; processing: repeat (the beating tray) method and take a mean; idea of scaling up; e.g. multiply the mean number of insects in the sampled area / plants sampled by the total number of plants 3(b)(ii) any two from: 2 soybean plants are close to ground so difficult to get lower insects in tray; beating can damage the plant; beating cannot be used on wet plants; flying insects fly away / some insects might escape; some insects left on plant / not all insects will fall on the tray; 3(c)(i) biological; 1 3(c)(ii) control / to compare the result; 1 3(c)(iii) any one from: 1 to ensure that field 1 and field 2 had a comparable number of aphids (at the start); to see if the predator has an effect; 3(c)(iv) predator reduces the aphid population; 3 predator takes 8–12 days to make an impact / it took 10 days for the introduced predator to work; relevant comparable quoted data e.g. difference in aphid population with no predator is 215 (255-40) by day 65; 3(c)(v) any two from: 2 prevents predator flying away; prevents new pests / insects landing on the plants; prevents new predators landing on the plants; (so that the farmer knows) it is the harlequin beetle predator that has reduced the aphid population; 3(d) any one from: 1 increased temperatures mean it will not become inactive; native species may die at hotter temperatures / in changed conditions; beetle competitors / predators might die; expand range of beetle; 3(e)(i) plants grown at high density / high crop yield (per unit area); 4 any three from: plants grown without soil / roots are in water that contains nutrients; plants less prone to soil pests; plants can be grown in areas with soil erosion / poor quality soil; plants can be grown inside; plants can be grown in controlled conditions; e.g. controlled lighting yields not dependent on weather conditions / rainfall; crops are not seasonal / can be grown all year; 3(e)(ii) any three from: 3 leads to food shortages; more likely to benefit rich; food could rot if not stored properly; danger of losing (large) quantity of food at one time; fresh food loses nutritional value if stored for long period; idea that food should be distributed to people who are hungry now; 3(e)(iii) any four from: 4 food scarcity; nutritional deficiency / malnutrition; famine / starvation; poverty; forces migration; conflict;
Q4 · The distribution of hot desert biomes
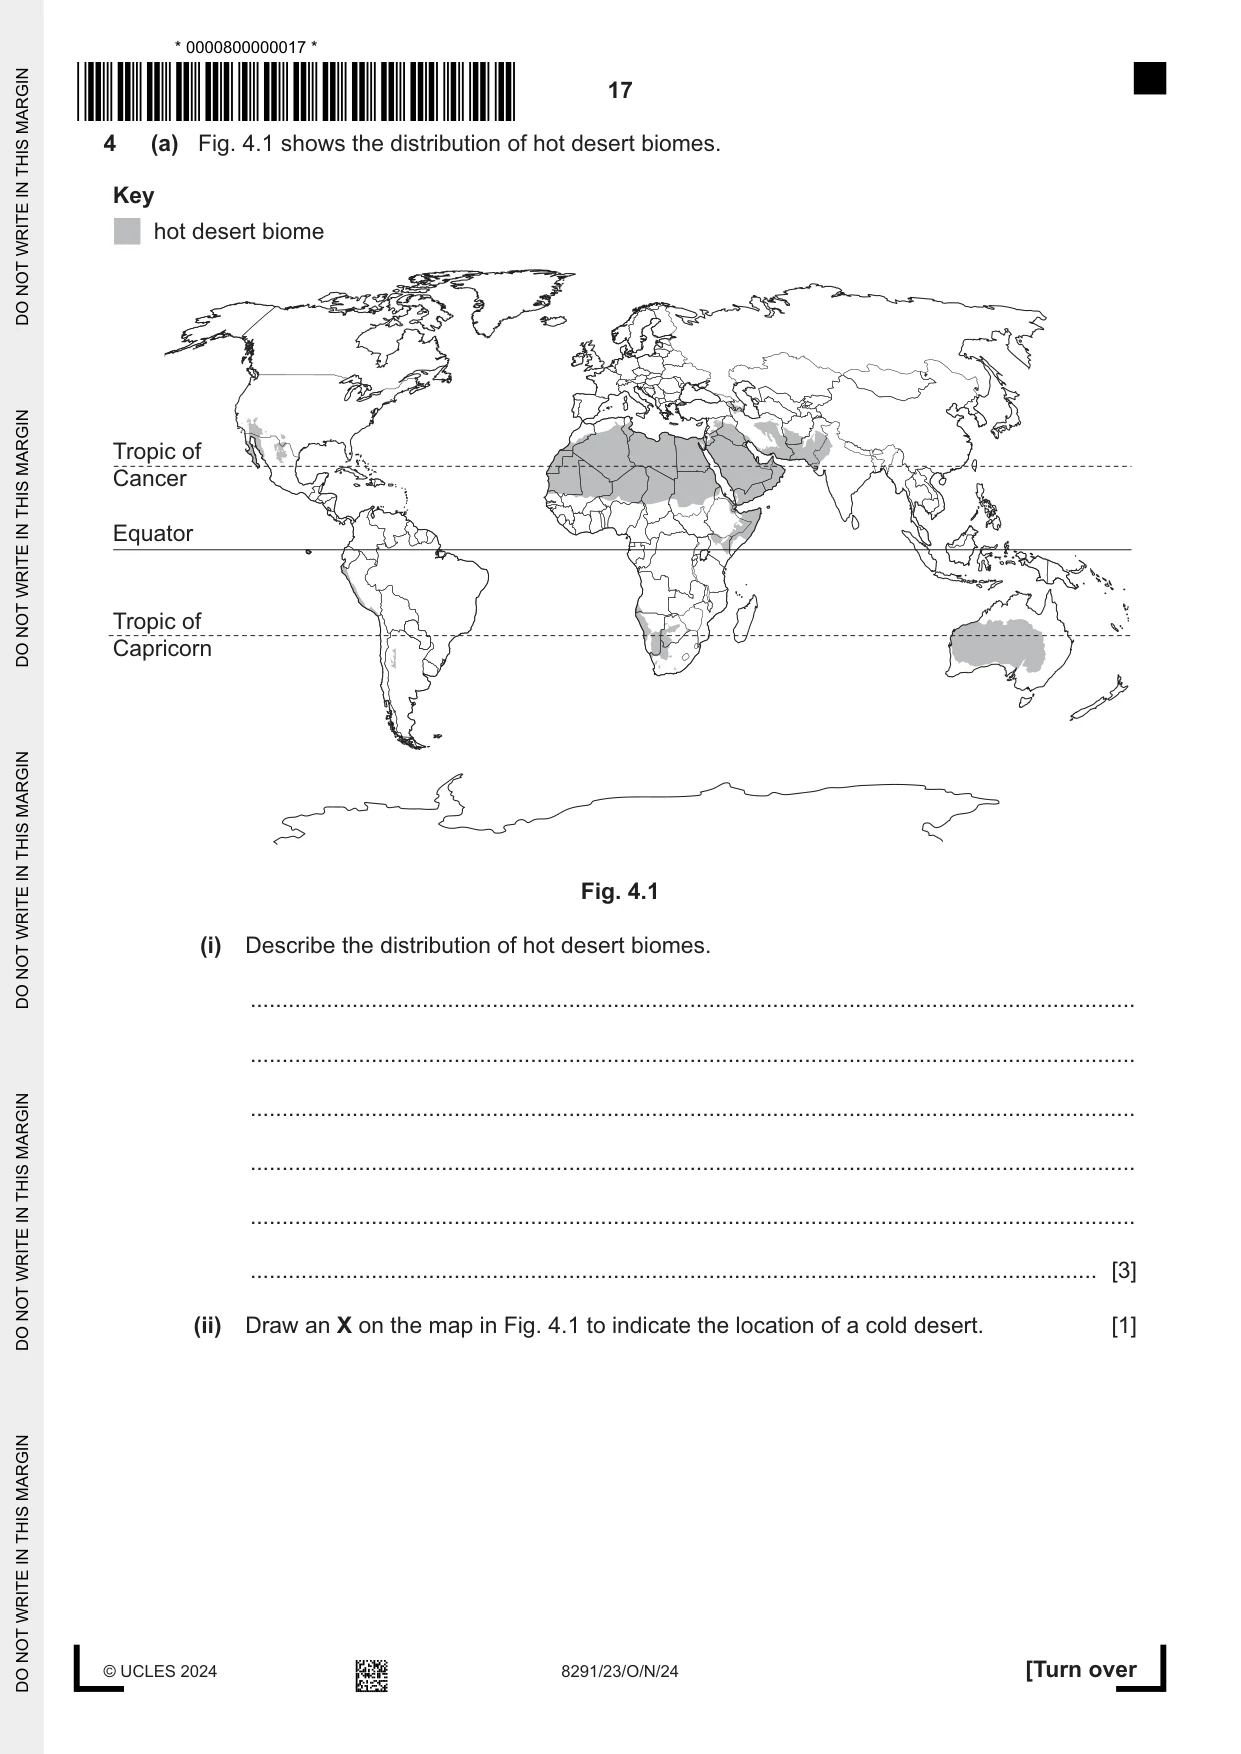
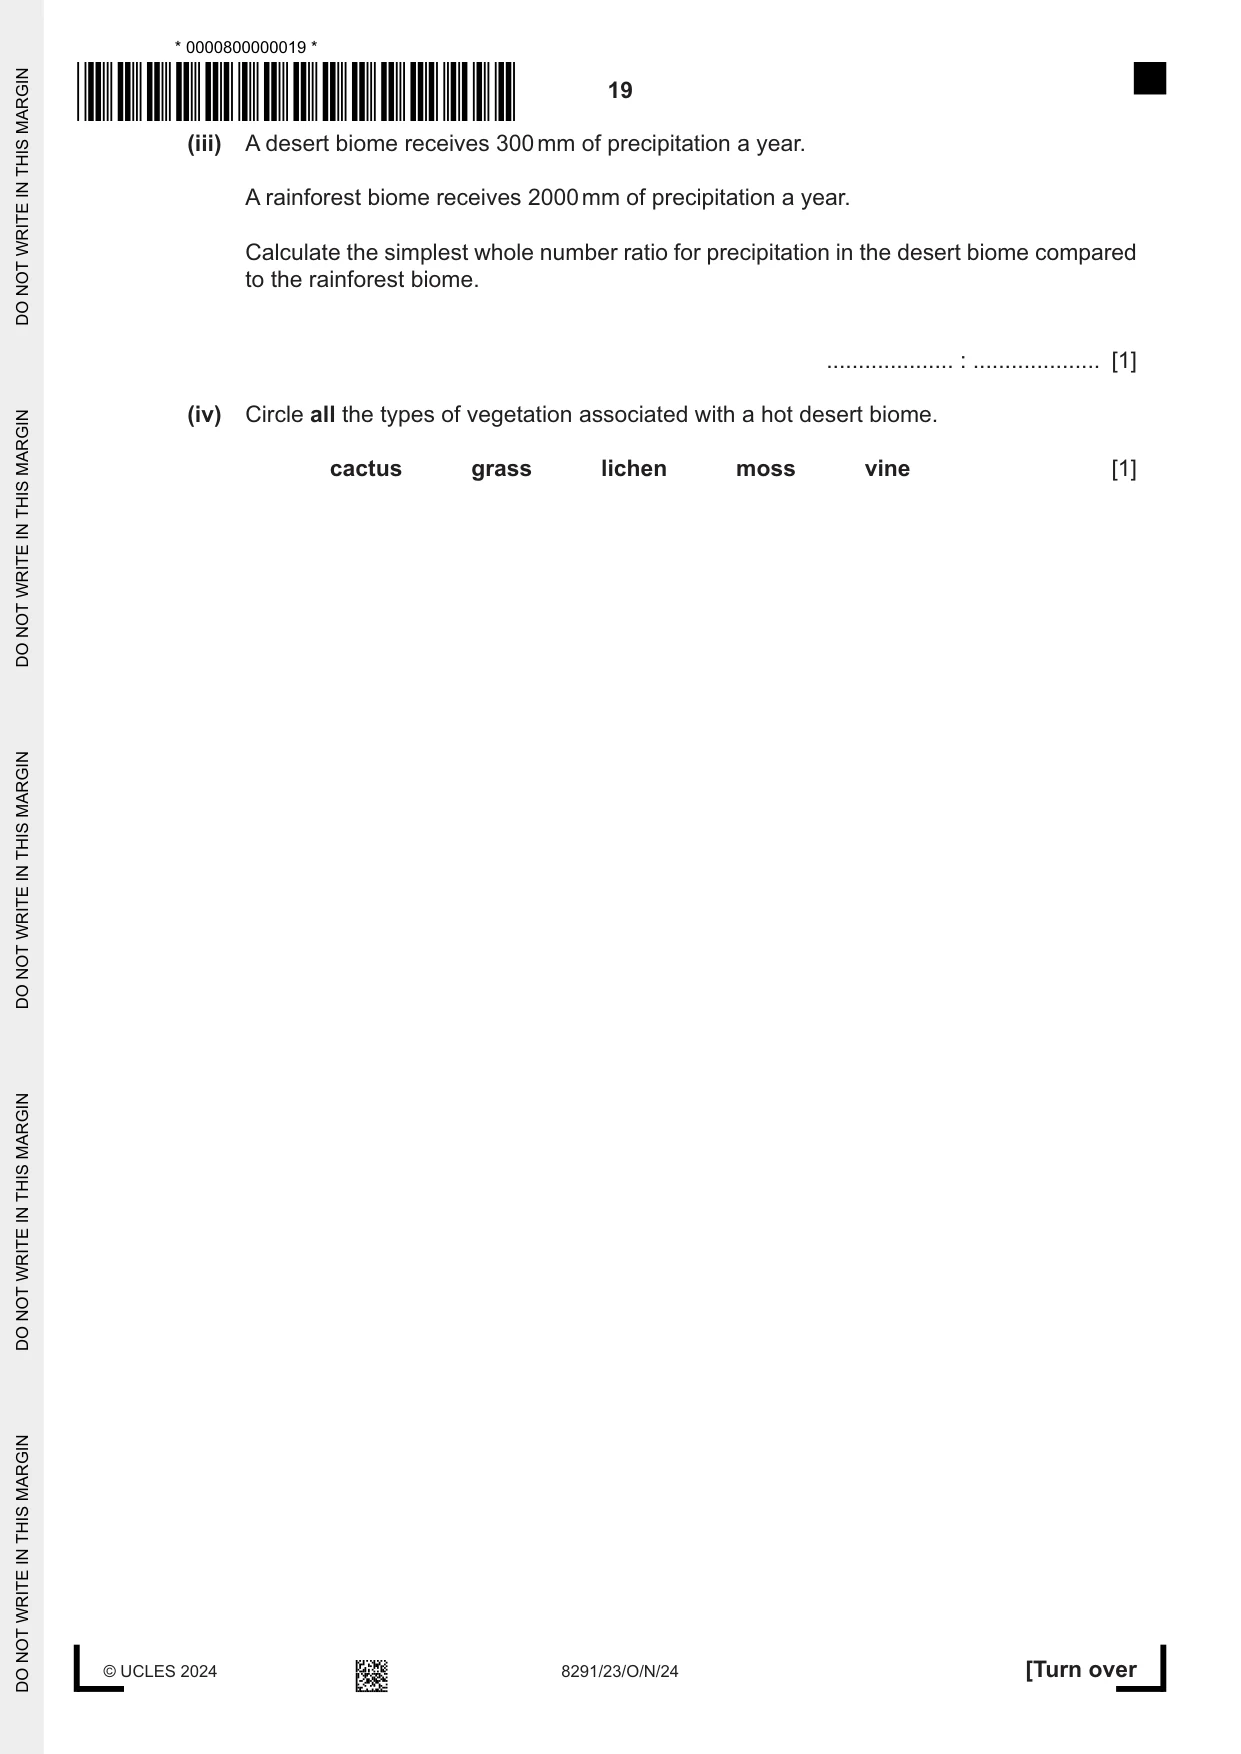
4 (a) Fig. 4.1 shows the distribution of hot desert biomes. Key hot desert biome Tropic of Cancer Equator Tropic of Capricorn Fig. 4.1 (i) Describe the distribution of hot desert biomes. ........................................................................................................................................... ........................................................................................................................................... ........................................................................................................................................... ........................................................................................................................................... ........................................................................................................................................... ..................................................................................................................................... [3] (ii) Draw an X on the map in Fig. 4.1 to indicate the location of a cold desert. [1] (b) Fig. 4.2 shows climate data for a hot desert biome. Content removed due to copyright restrictions. Fig. 4.2 (i) Complete Fig. 4.2 by drawing a line between data points for the temperature data. [1] (ii) Calculate the range for precipitation in the desert biome in Fig. 4.2. .................................................... mm [1] (iii) A desert biome receives 300 mm of precipitation a year. A rainforest biome receives 2000 mm of precipitation a year. Calculate the simplest whole number ratio for precipitation in the desert biome compared to the rainforest biome. .................... : .................... [1] (iv) Circle all the types of vegetation associated with a hot desert biome. cactus grass lichen moss vine [1]
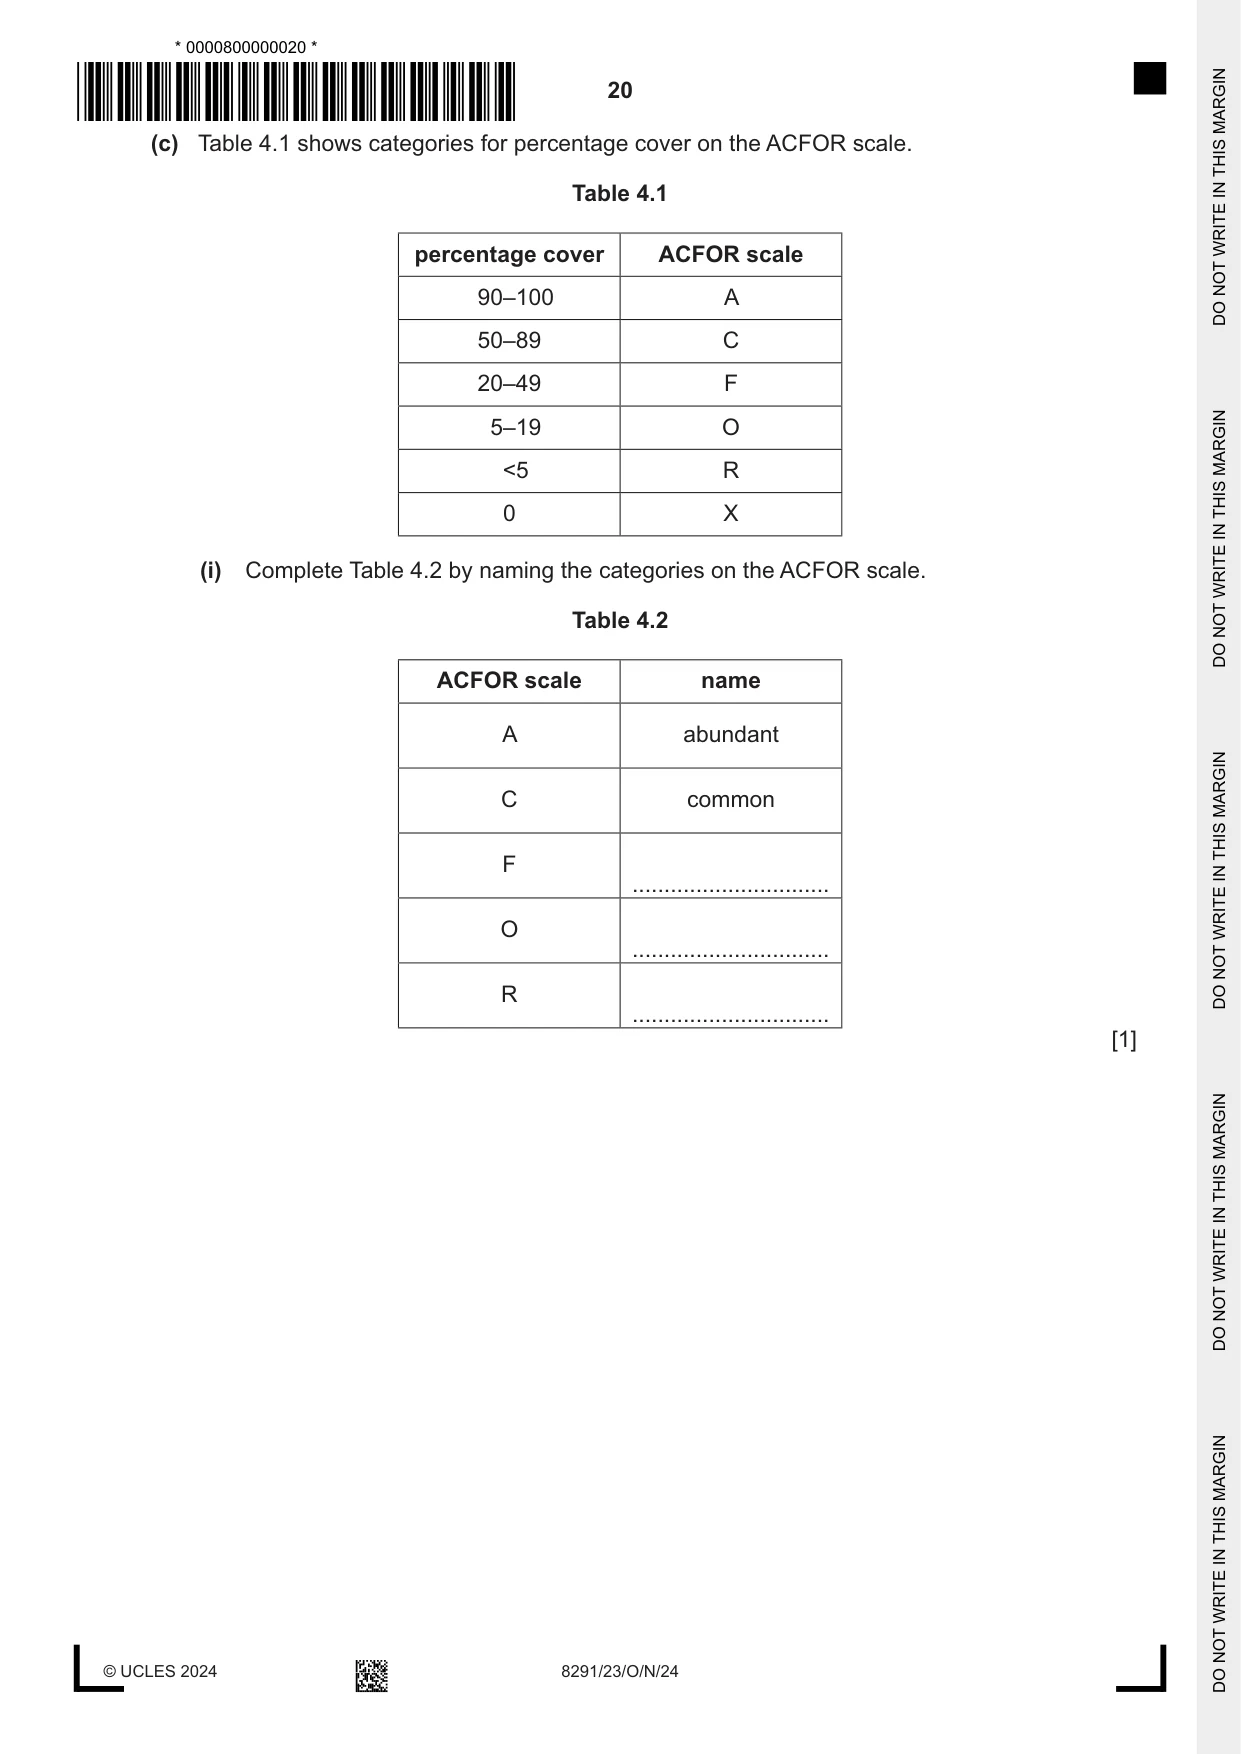
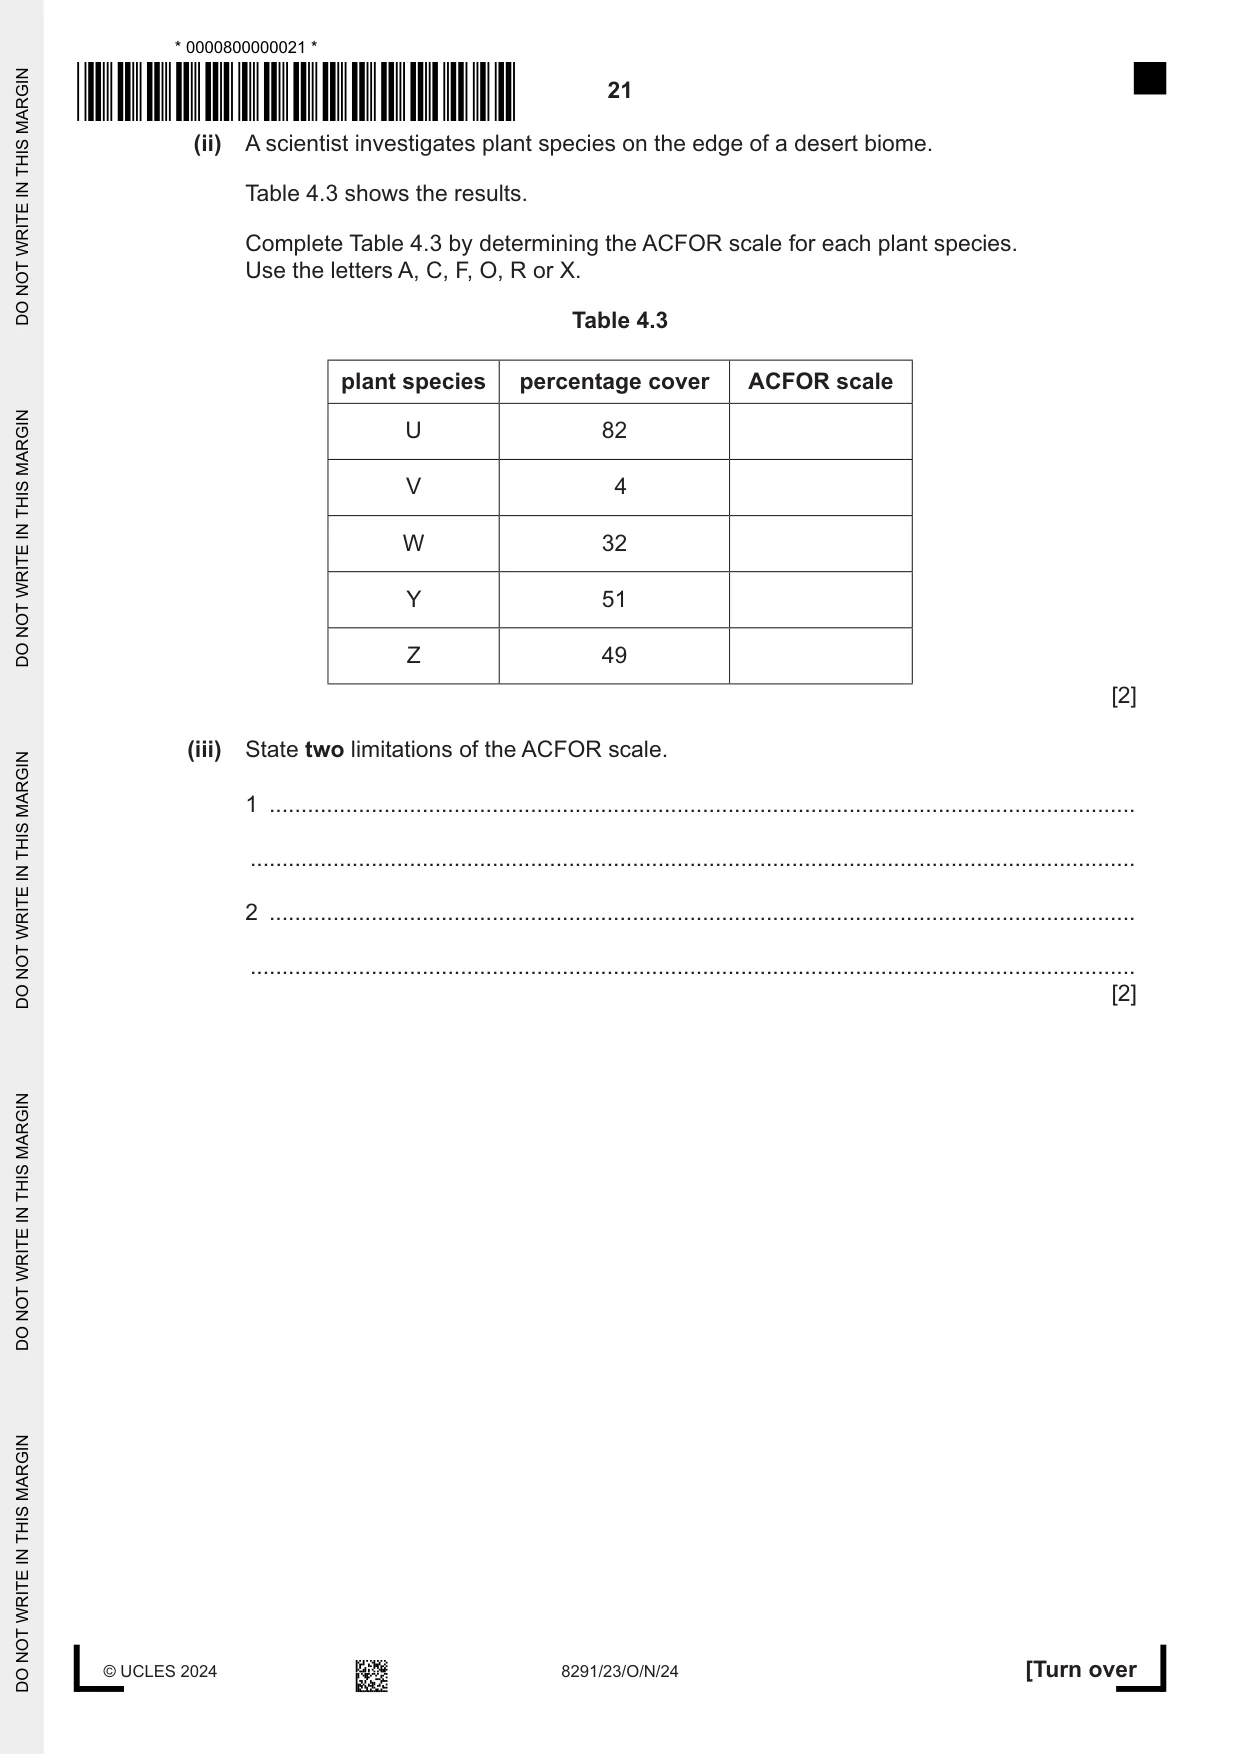
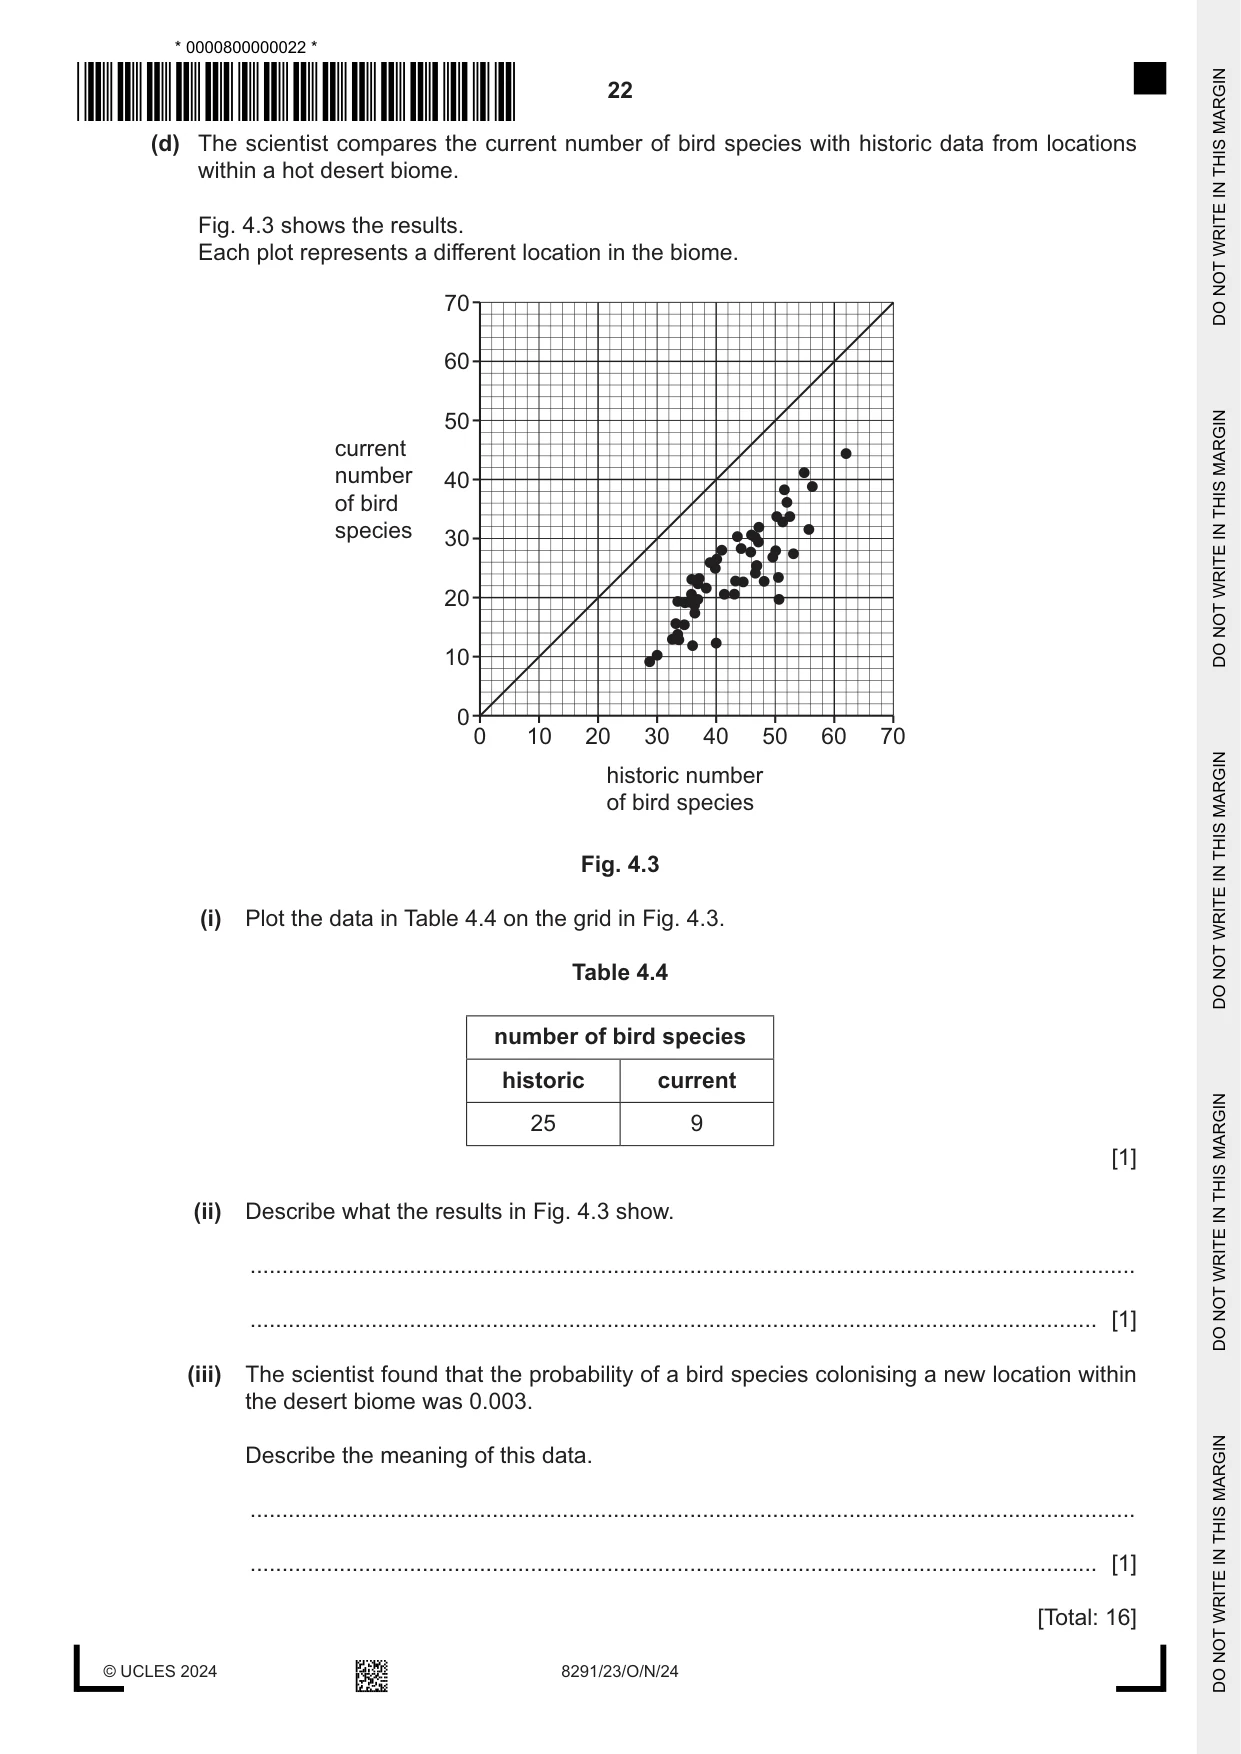
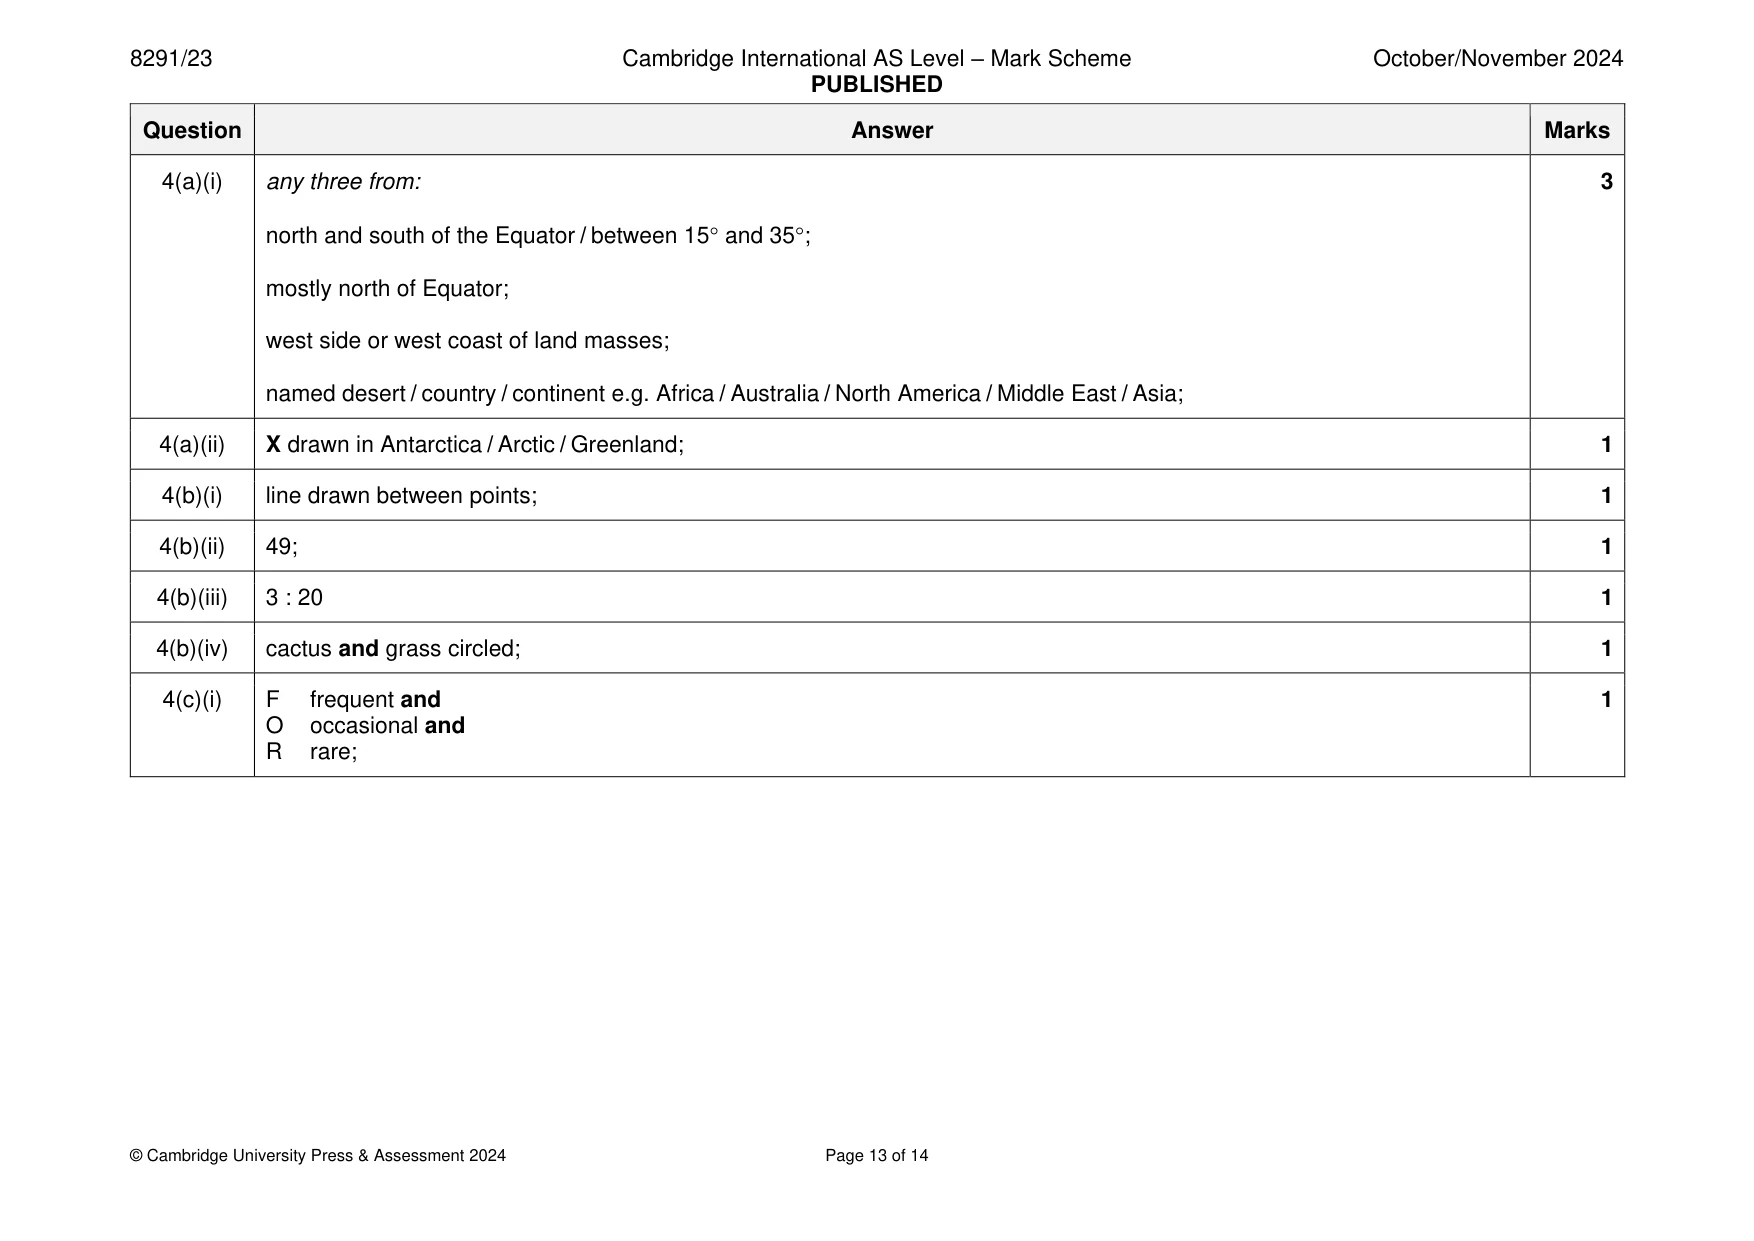
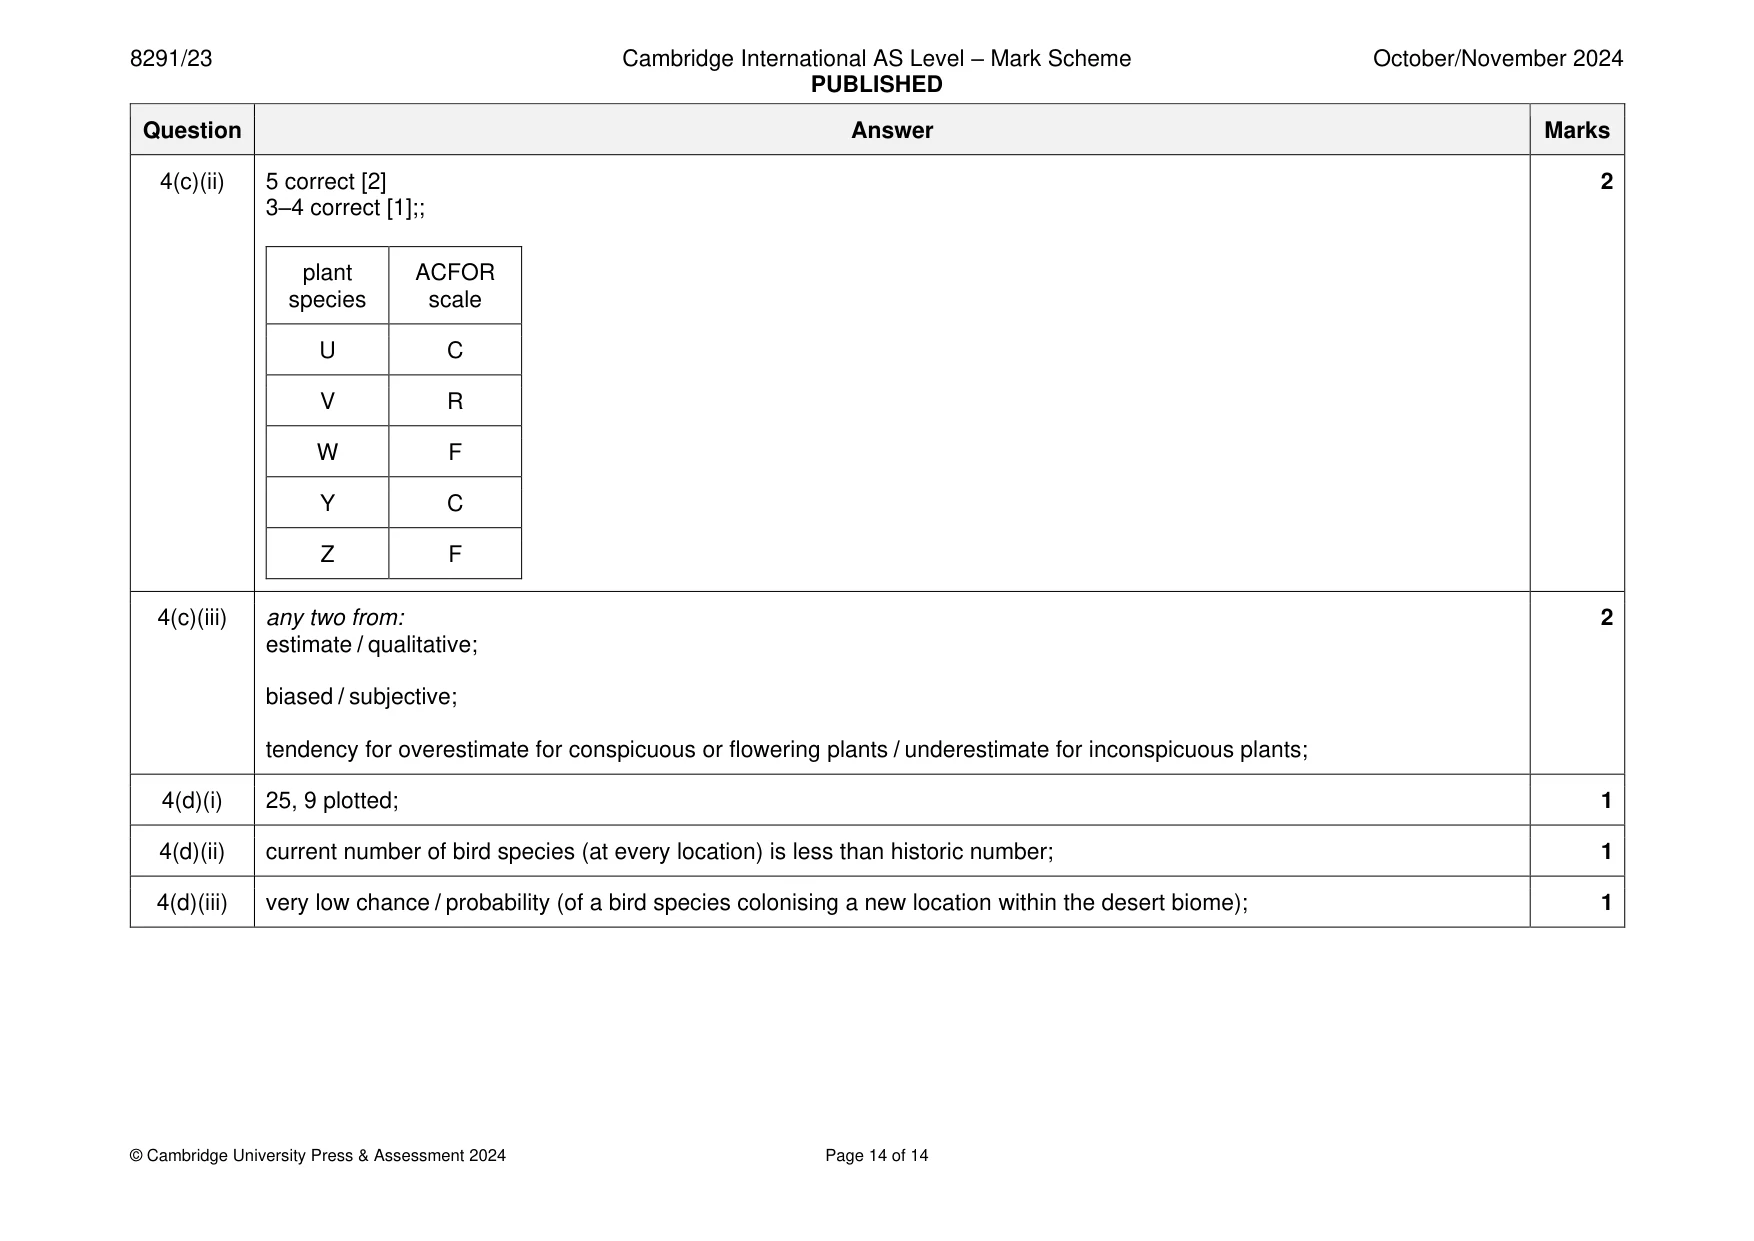
Mark scheme: 4(a)(i) any three from: 3 north and south of the Equator / between 15 and 35; mostly north of Equator; west side or west coast of land masses; named desert / country / continent e.g. Africa / Australia / North America / Middle East / Asia; 4(a)(ii) X drawn in Antarctica / Arctic / Greenland; 1 4(b)(i) line drawn between points; 1 4(b)(ii) 49; 1 4(b)(iii) 3 : 20 1 4(b)(iv) cactus and grass circled; 1 4(c)(i) F frequent and 1 O occasional and R rare; 4(c)(ii) 5 correct [2] 2 3–4 correct [1];; plant ACFOR species scale U C V R W F Y C Z F 4(c)(iii) any two from: 2 estimate / qualitative; biased / subjective; tendency for overestimate for conspicuous or flowering plants / underestimate for inconspicuous plants; 4(d)(i) 25, 9 plotted; 1 4(d)(ii) current number of bird species (at every location) is less than historic number; 1 4(d)(iii) very low chance / probability (of a bird species colonising a new location within the desert biome); 1
What was in this paper
The subtopics covered by these 4 questions, and how many questions each got. Open one in a new tab to see every Cambridge question on it.
What you needed in this session
Cambridge’s own grade thresholds for 2024 Oct/Nov, Paper 2 · Variant 3. A higher threshold means an easier paper — the bar moves with how the cohort did.