Cambridge A Level Environmental Management (AS only) 8291 — 2022 May/June Paper 2 · Variant 1
8291/21/M/J/22 · 5 questions · 80 marks · ≈90 min
The question paper and its mark scheme, free to read here and free to download. This is Cambridge’s own paper, exactly as it was sat.
Question paper20 pages


Mark scheme17 pages
Answers below. Sit the paper first if you are practising.
Questions as text
Q1 · In 2020, 83% of homes in the United Kingdom combusted natural gas (methane) for heating
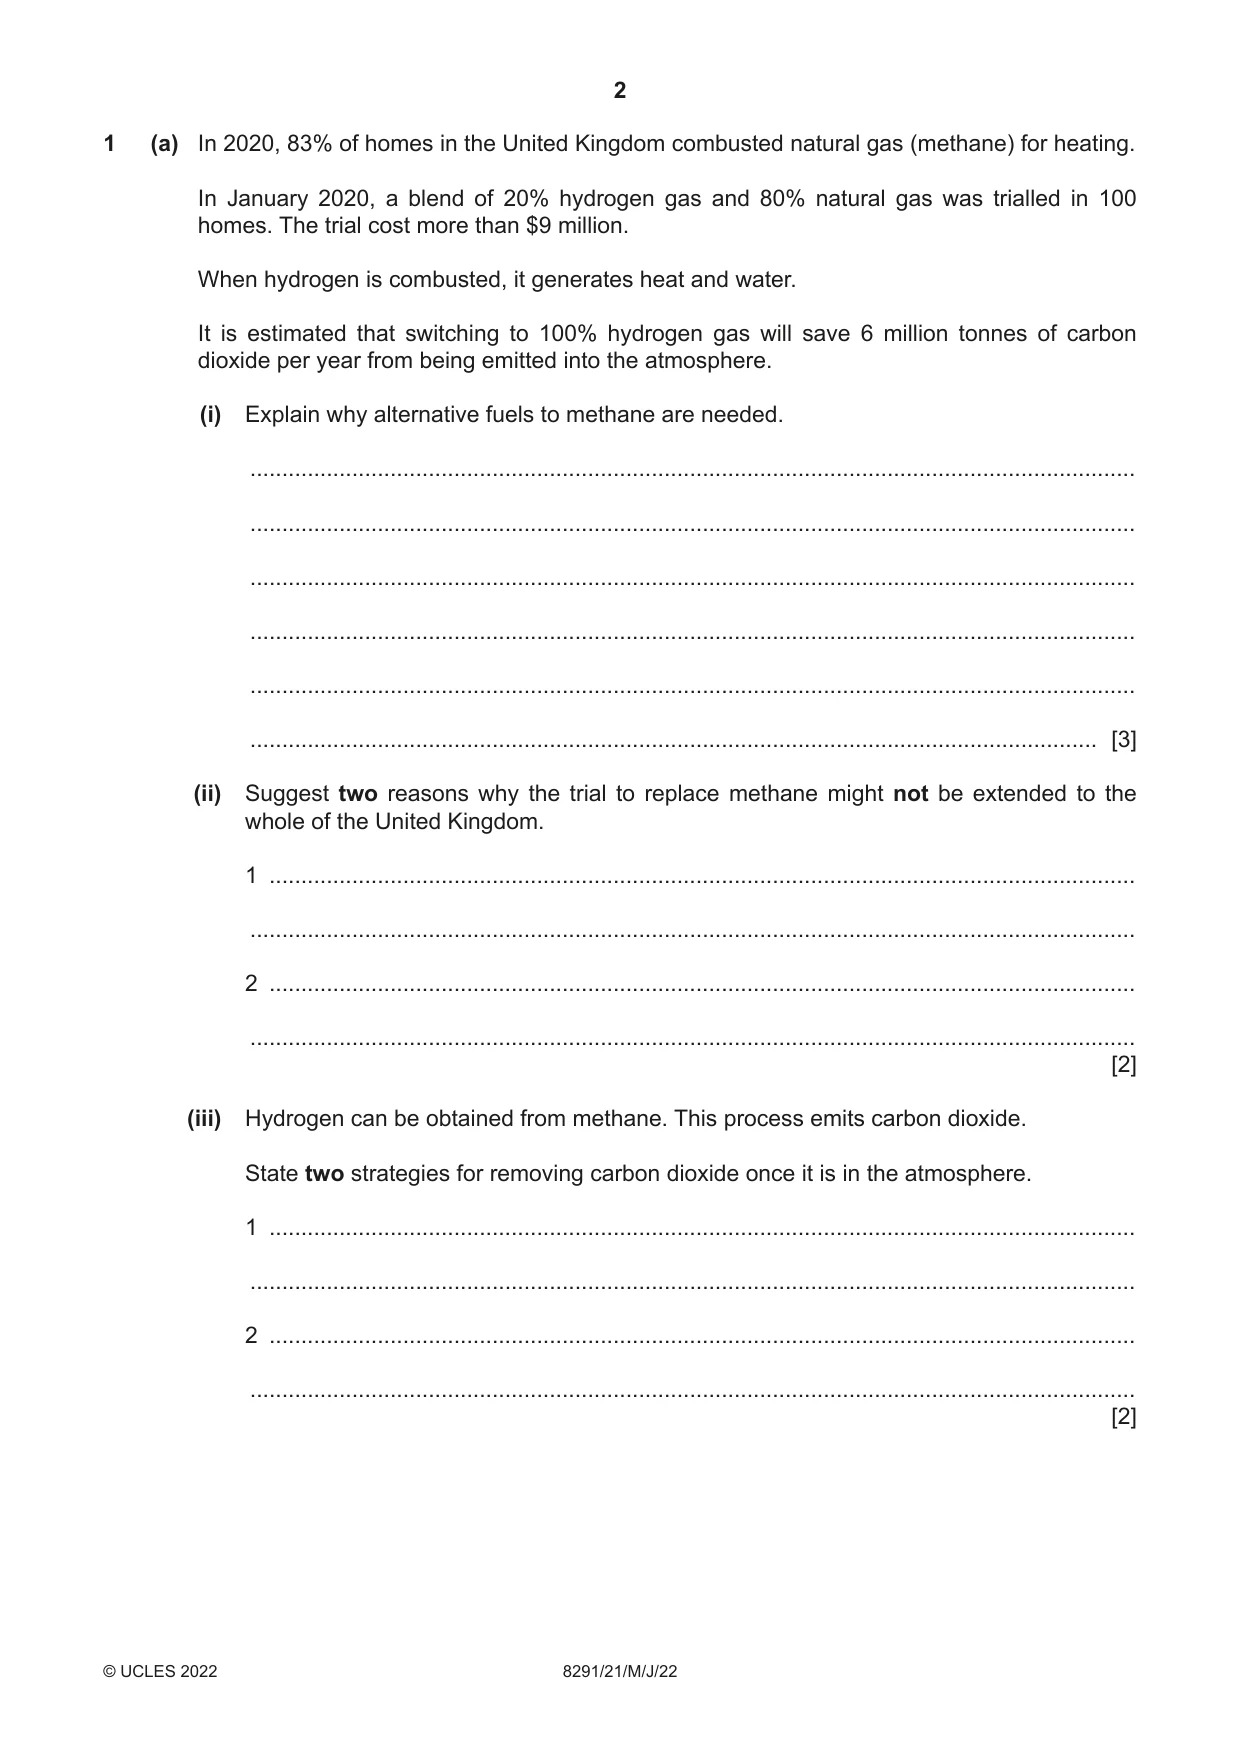
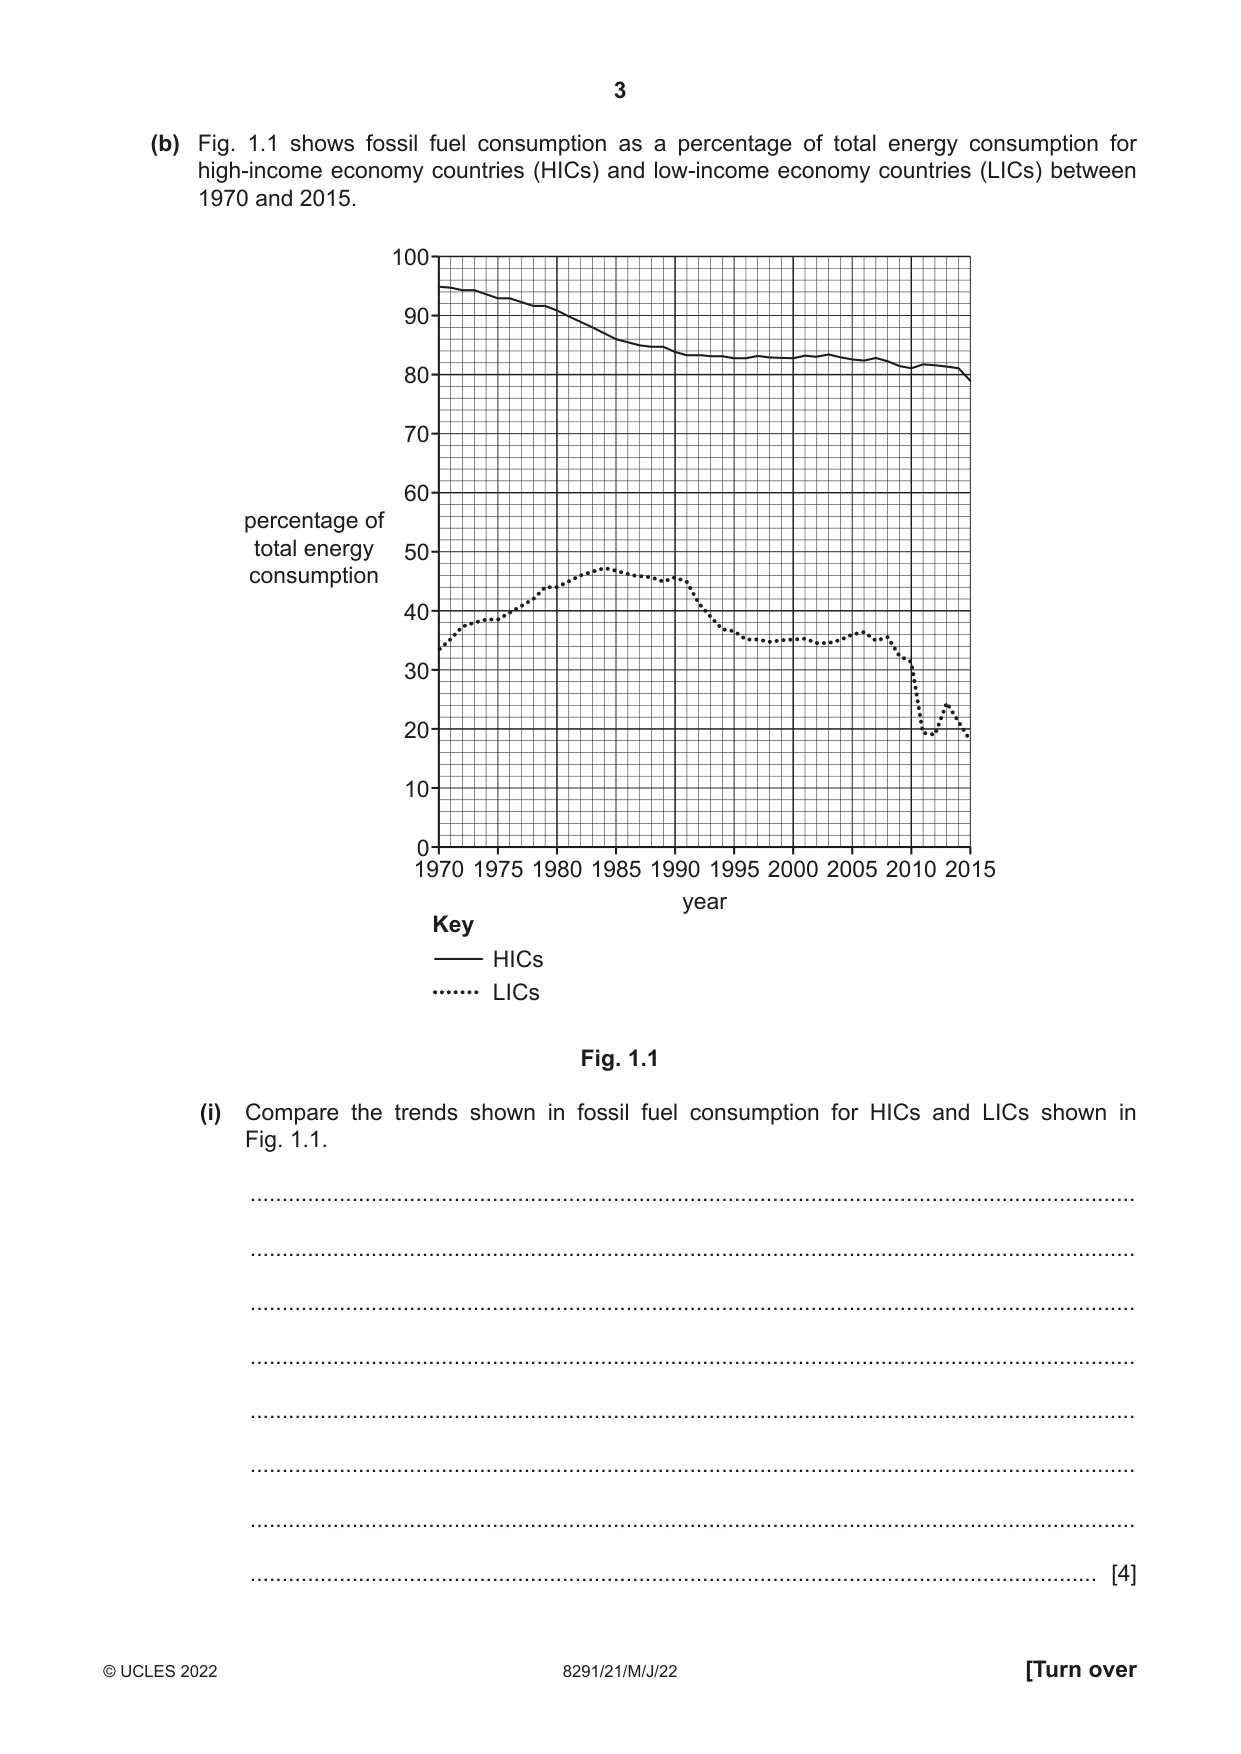
1 (a) In 2020, 83% of homes in the United Kingdom combusted natural gas (methane) for heating. In January 2020, a blend of 20% hydrogen gas and 80% natural gas was trialled in 100 homes. The trial cost more than $9 million. When hydrogen is combusted, it generates heat and water. It is estimated that switching to 100% hydrogen gas will save 6 million tonnes of carbon dioxide per year from being emitted into the atmosphere. (i) Explain why alternative fuels to methane are needed. ........................................................................................................................................... ........................................................................................................................................... ........................................................................................................................................... ........................................................................................................................................... ........................................................................................................................................... ..................................................................................................................................... [3] (ii) Suggest two reasons why the trial to replace methane might not be extended to the whole of the United Kingdom. 1 ........................................................................................................................................ ........................................................................................................................................... 2 ........................................................................................................................................ ........................................................................................................................................... [2] (iii) Hydrogen can be obtained from methane. This process emits carbon dioxide. State two strategies for removing carbon dioxide once it is in the atmosphere. 1 ........................................................................................................................................ ........................................................................................................................................... 2 ........................................................................................................................................ ........................................................................................................................................... [2] (b) Fig. 1.1 shows fossil fuel consumption as a percentage of total energy consumption for high-income economy countries (HICs) and low-income economy countries (LICs) between 1970 and 2015. 100 90 80 70 60 percentage of total energy 50 consumption 40 30 20 10 0 1970 1975 1980 1985 1990 1995 2000 2005 2010 2015 year Key HICs LICs Fig. 1.1 (i) Compare the trends shown in fossil fuel consumption for HICs and LICs shown in Fig. 1.1. ........................................................................................................................................... ........................................................................................................................................... ........................................................................................................................................... ........................................................................................................................................... ........................................................................................................................................... ........................................................................................................................................... ........................................................................................................................................... ..................................................................................................................................... [4] (ii) Some countries do not have a supply of fossil fuels. They have to import fossil fuels into their country. Explain how this can lead to energy insecurity. ........................................................................................................................................... ........................................................................................................................................... ........................................................................................................................................... ..................................................................................................................................... [2] [Total: 13]
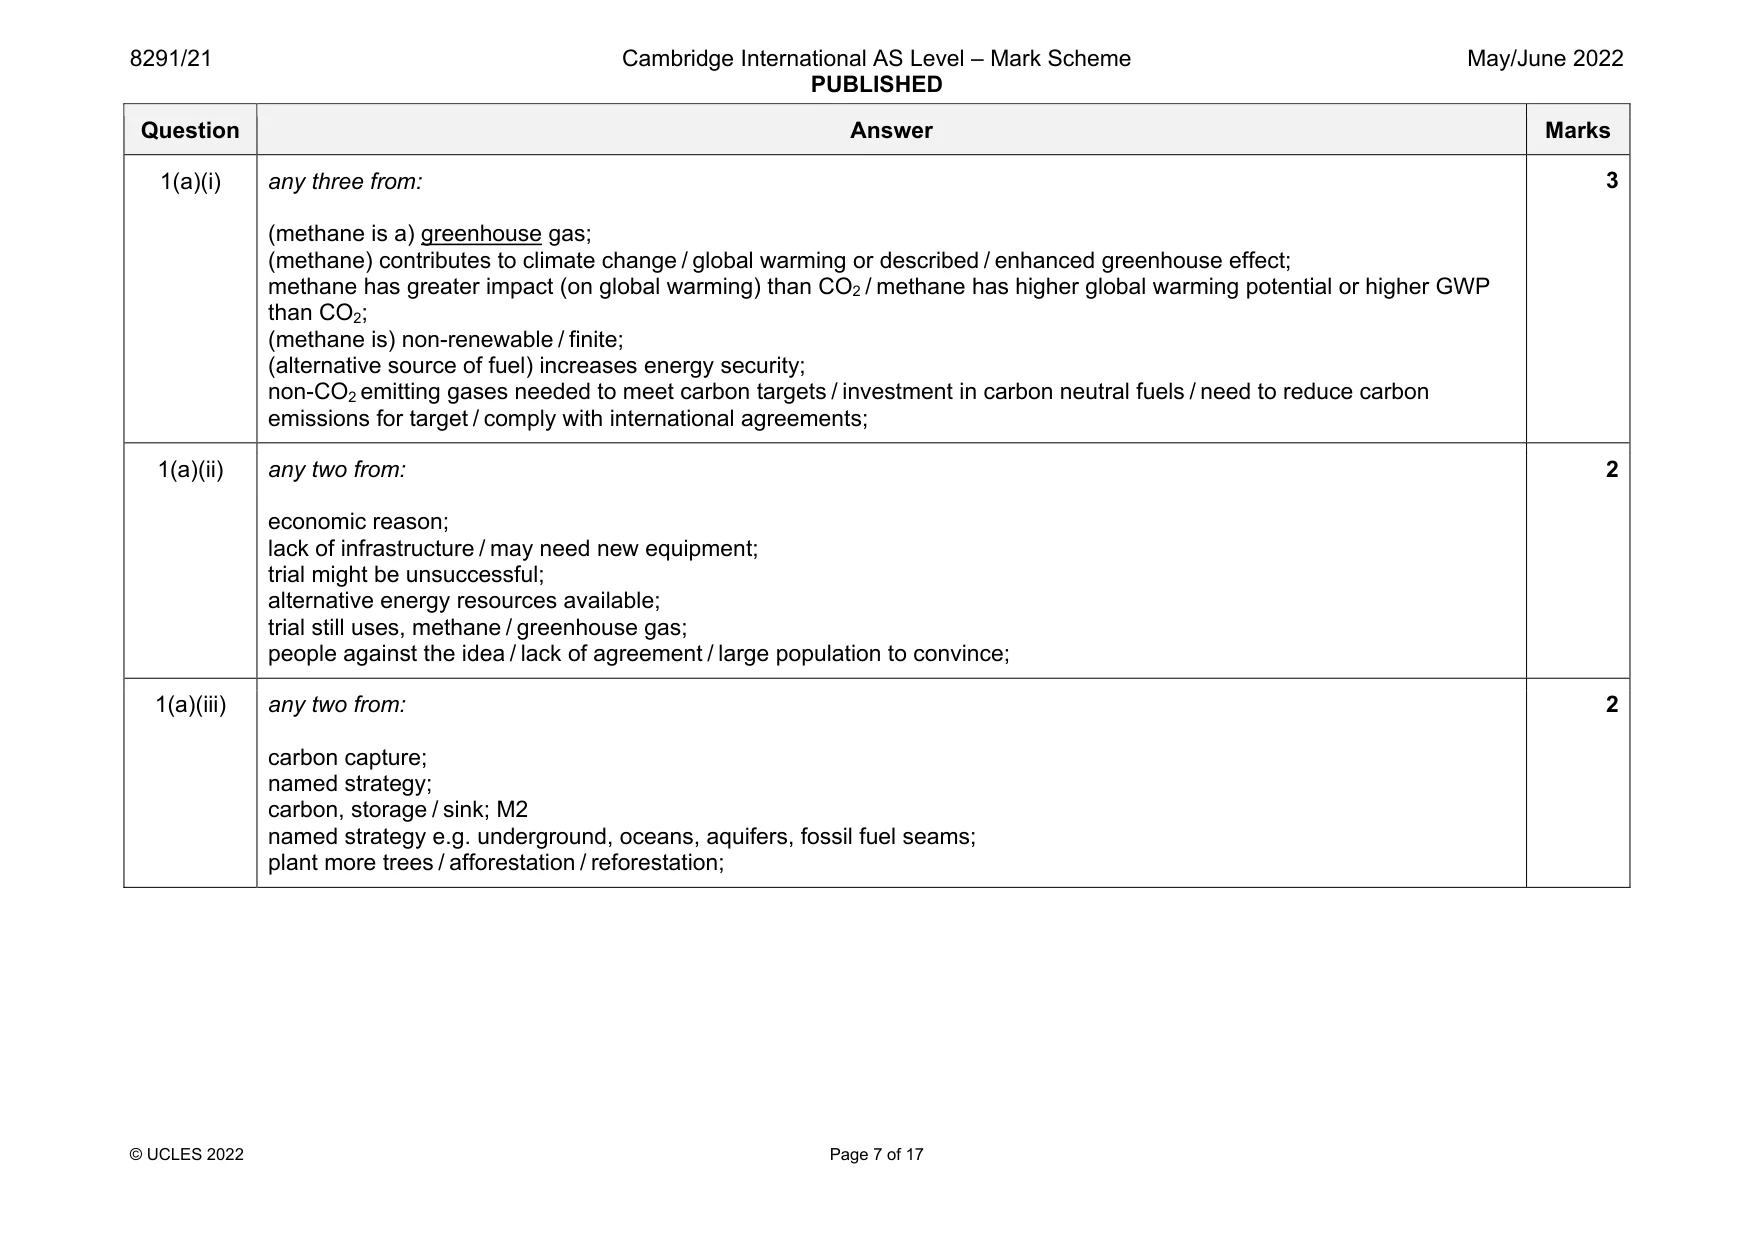
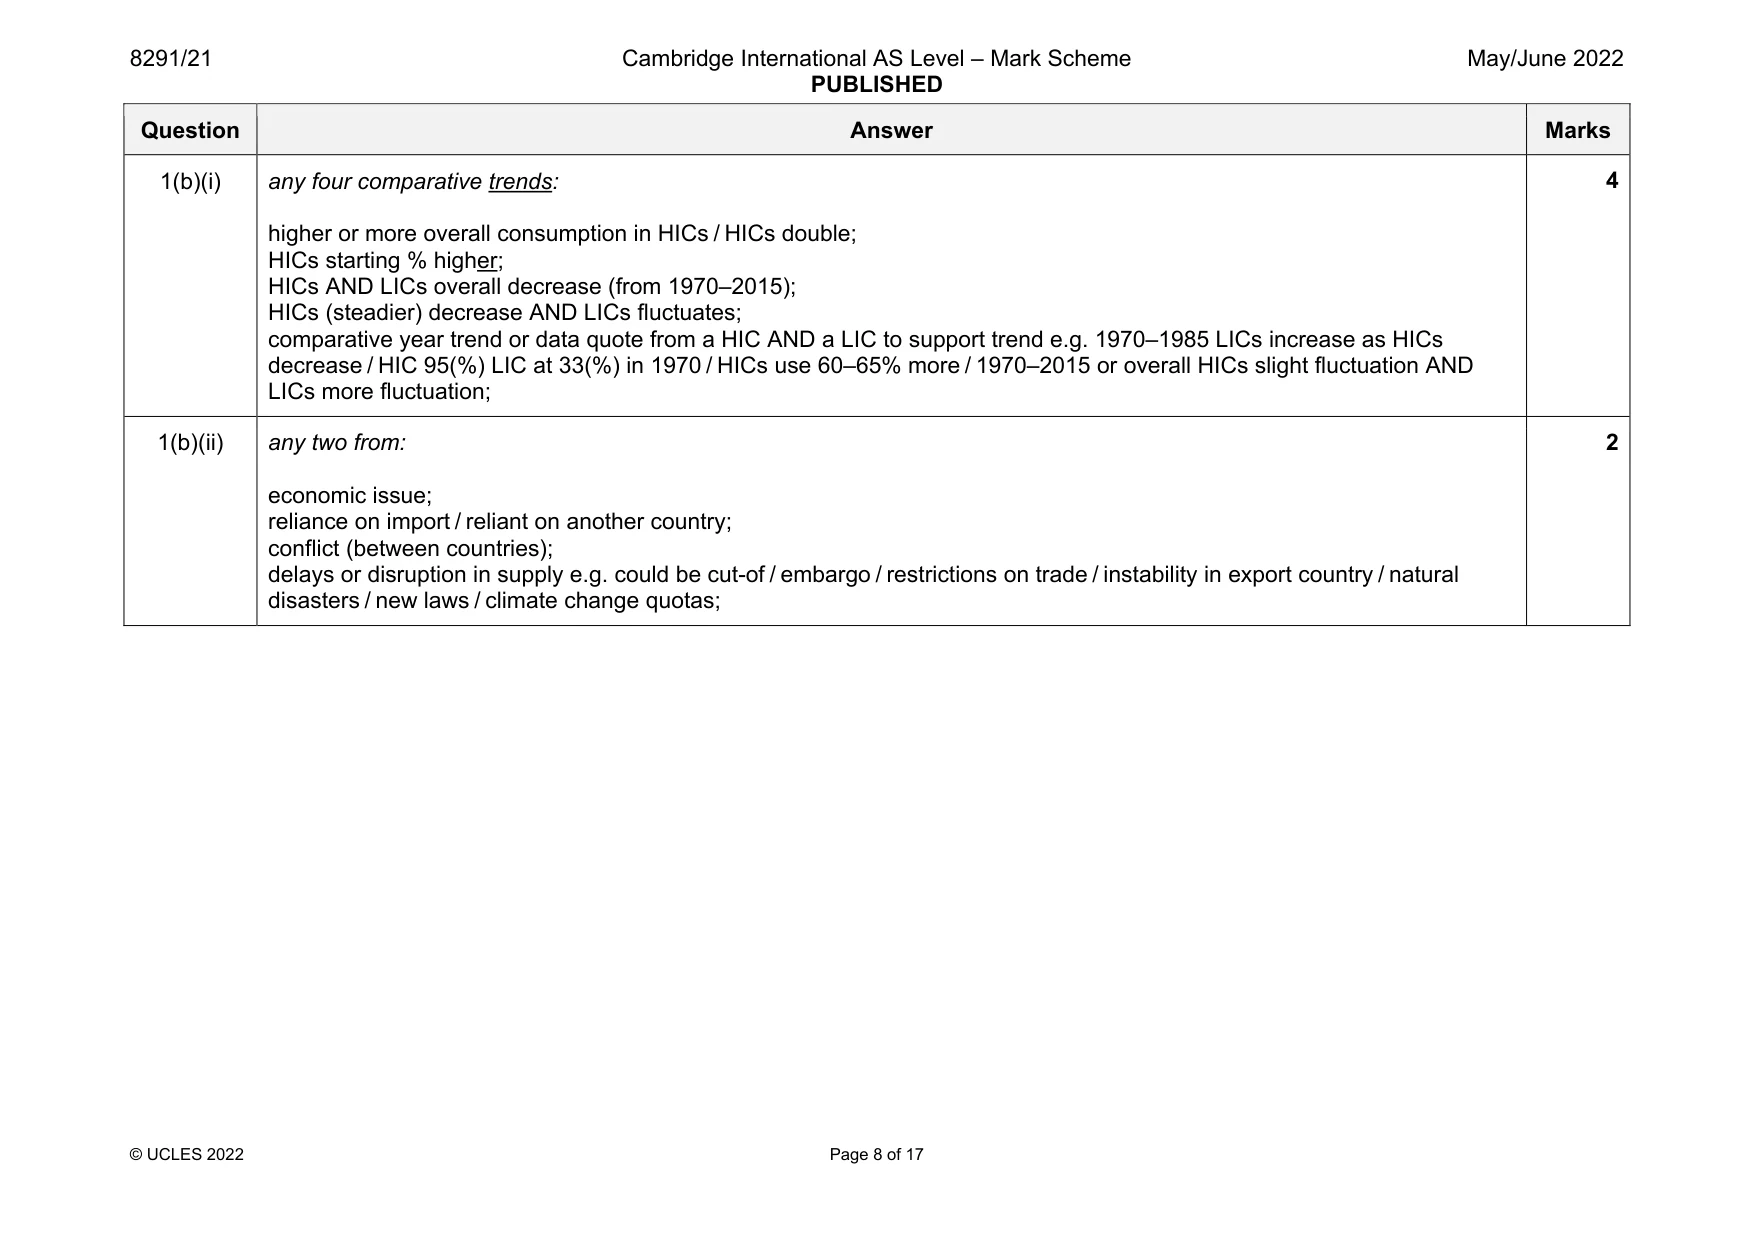
Mark scheme: 1(a)(i) any three from: (methane is a) greenhouse gas; (methane) contributes to climate change / global warming or described / enhanced greenhouse effect; methane has greater impact (on global warming) than CO2 / methane has higher global warming potential or higher GWP than CO2; (methane is) non-renewable / finite; (alternative source of fuel) increases energy security; non-CO2 emitting gases needed to meet carbon targets / investment in carbon neutral fuels / need to reduce carbon emissions for target / comply with international agreements; 1(a)(ii) any two from: economic reason; lack of infrastructure / may need new equipment; trial might be unsuccessful; alternative energy resources available; trial still uses, methane / greenhouse gas; people against the idea / lack of agreement / large population to convince; 2 1(a)(iii) any two from: carbon capture; named strategy; carbon, storage / sink; M2 named strategy e.g. underground, oceans, aquifers, fossil fuel seams; plant more trees / afforestation / reforestation; 2 Question Answer Marks 1(b)(i) any four comparative trends: higher or more overall consumption in HICs / HICs double; HICs starting % higher; HICs AND LICs overall decrease (from 1970–2015); HICs (steadier) decrease AND LICs fluctuates; comparative year trend or data quote from a HIC AND a LIC to support trend e.g. 1970–1985 LICs increase as HICs decrease / HIC 95(%) LIC at 33(%) in 1970 / HICs use 60–65% more / 1970–2015 or overall HICs slight fluctuation AND LICs more fluctuation; 4 1(b)(ii) any two from: economic issue; reliance on import / reliant on another country; conflict (between countries); delays or disruption in supply e.g. could be cut-of / embargo / restrictions on trade / instability in export country / natural disasters / new laws / climate change quotas; 2
Q2 · The mass of waste generated per person in seven countries in Europe in 2016
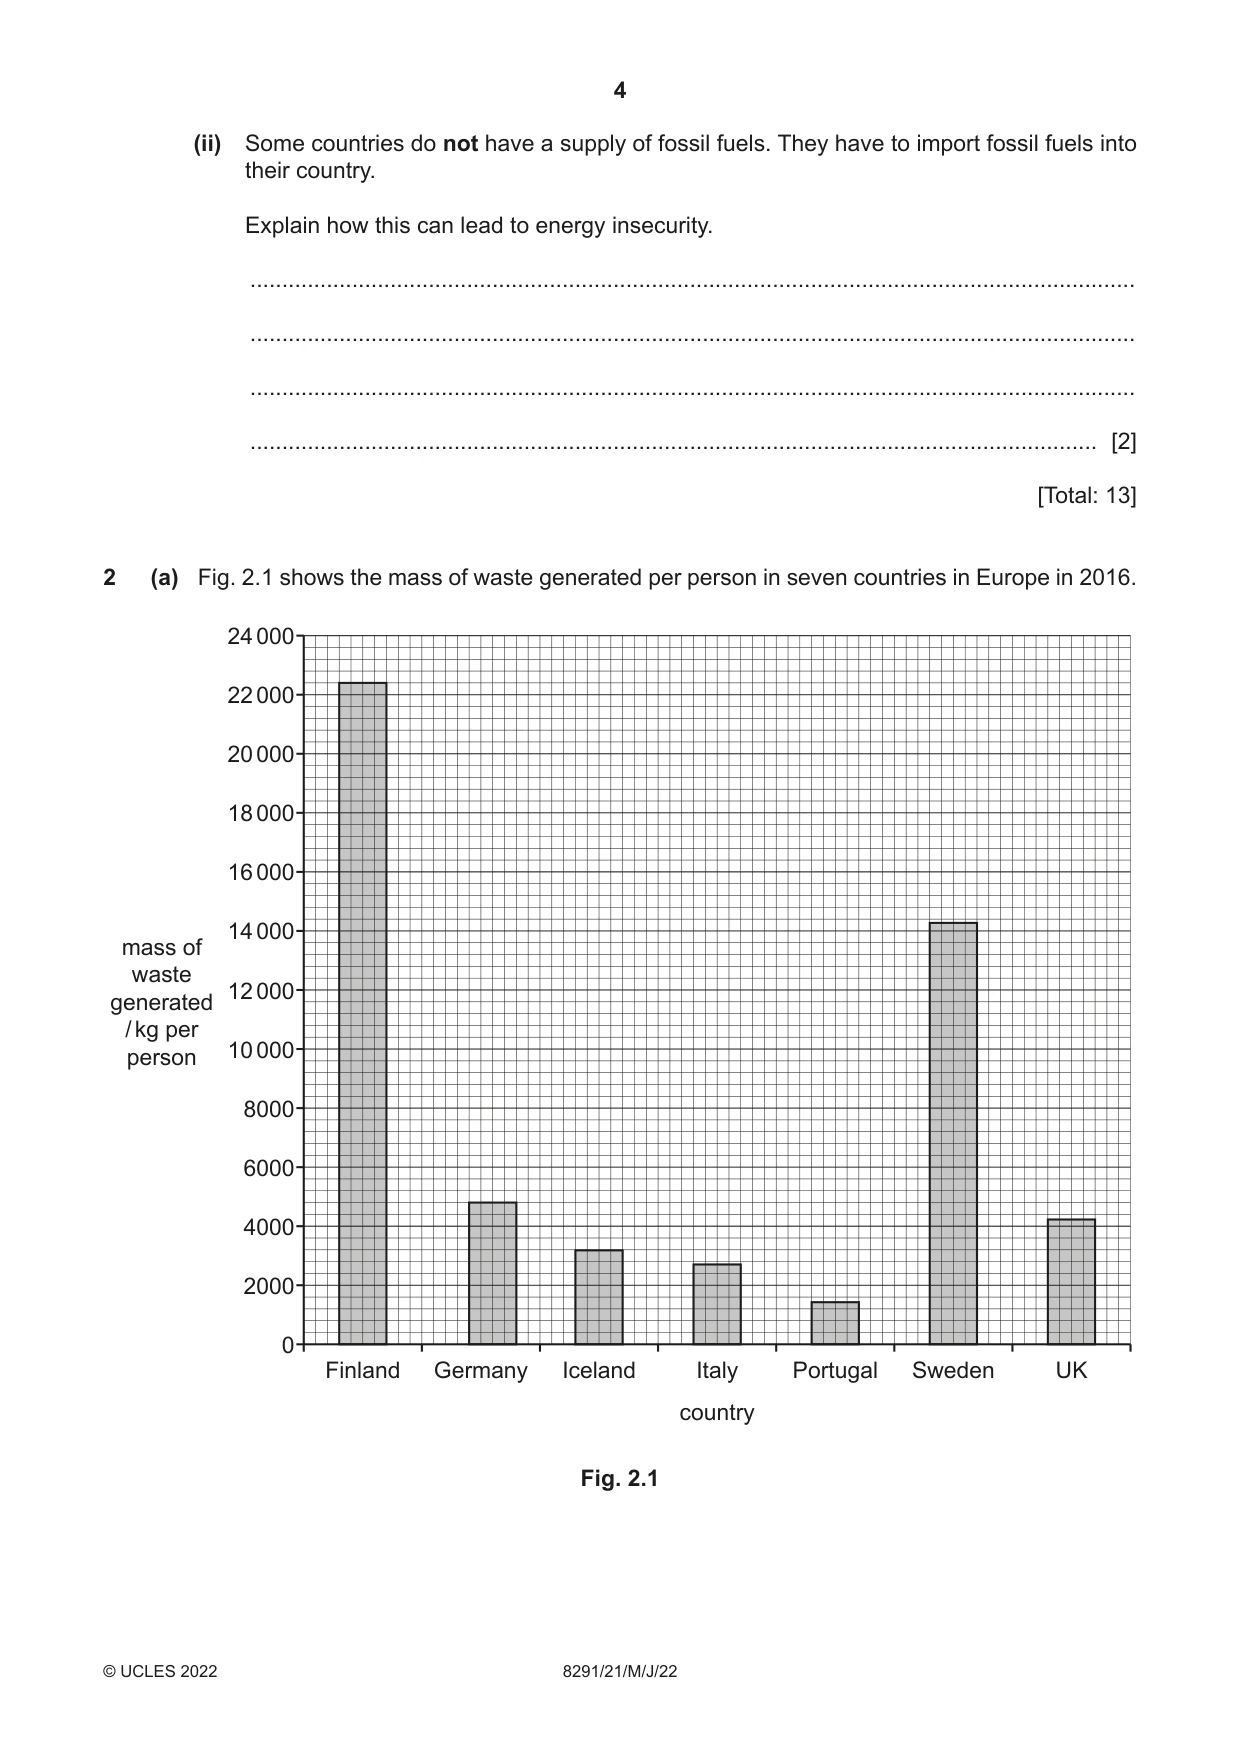
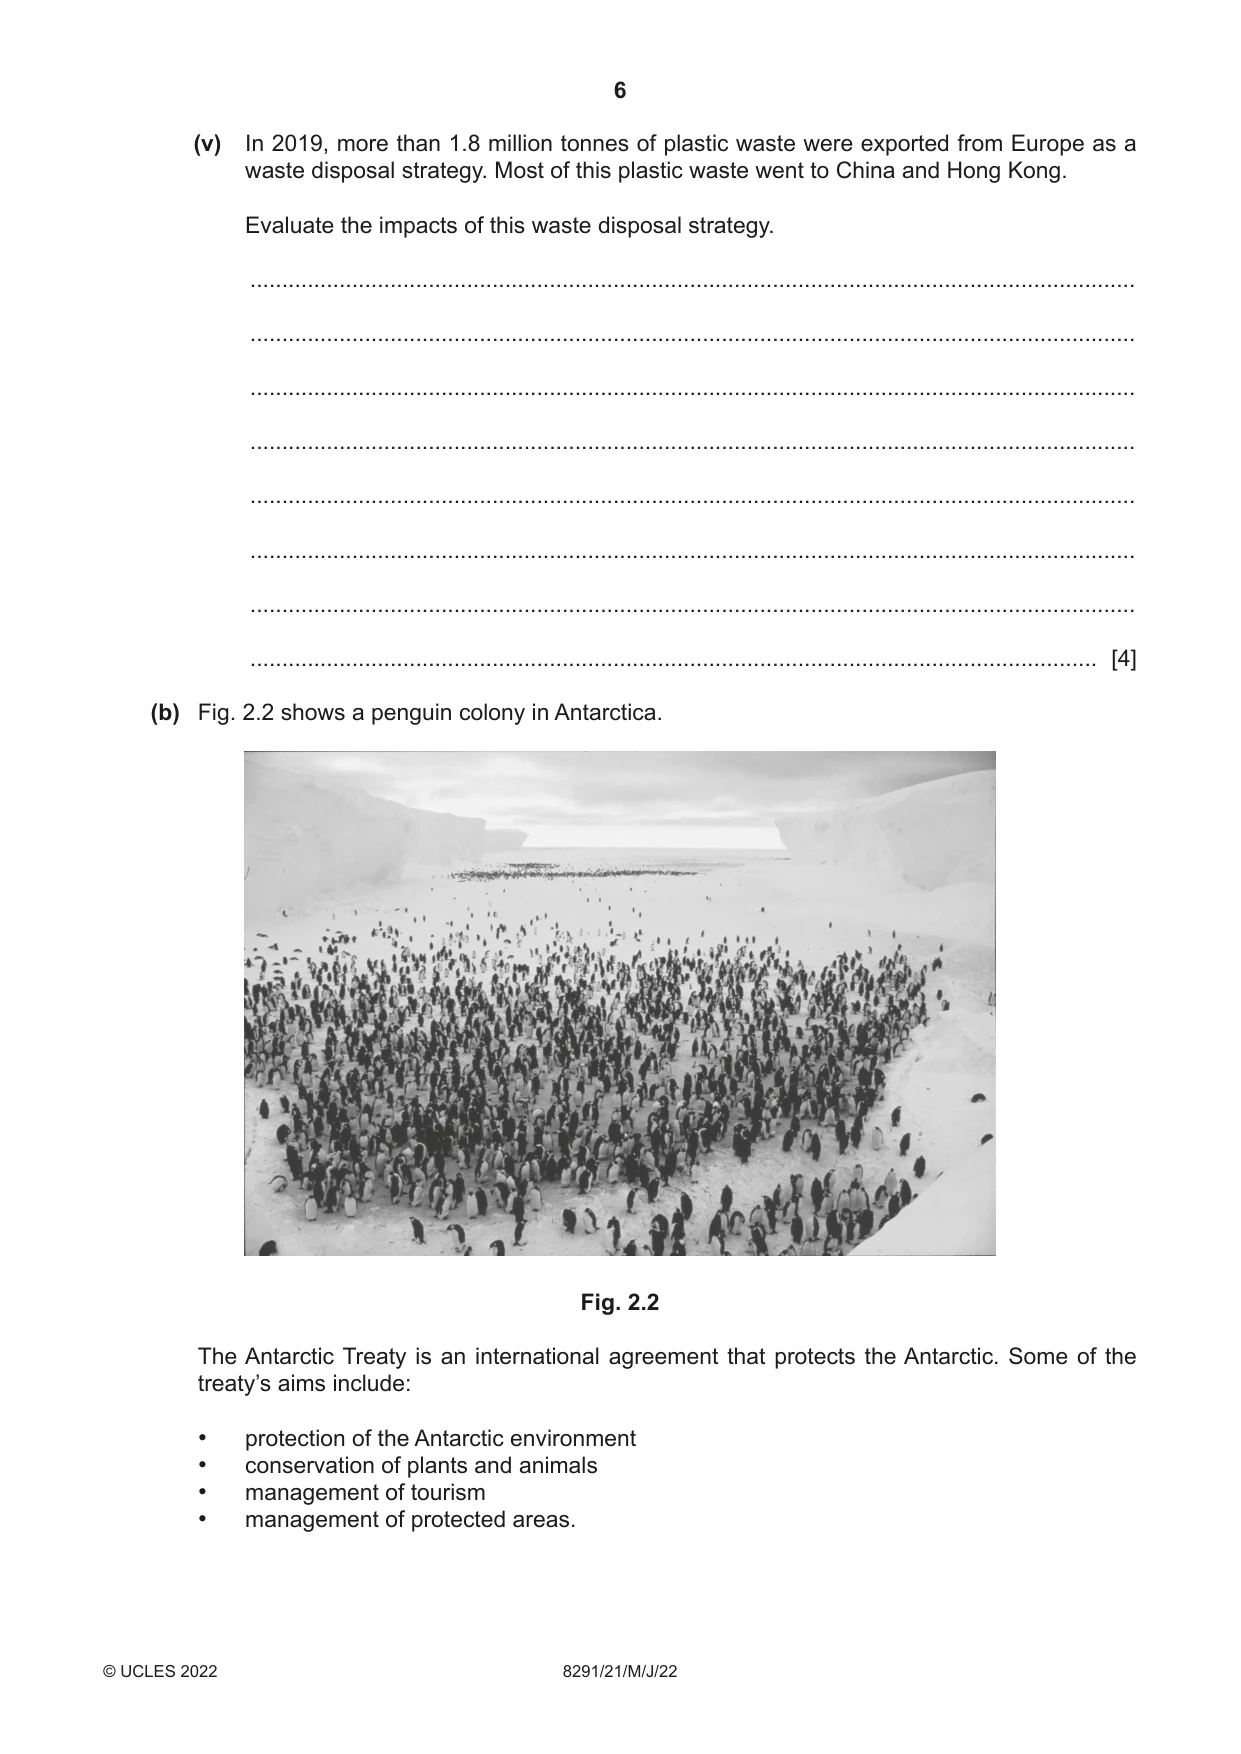
2 (a) Fig. 2.1 shows the mass of waste generated per person in seven countries in Europe in 2016. 24 000 22 000 20 000 18 000 16 000 14 000 mass of waste 12 000 generated / kg per 10 000 person 8000 6000 4000 2000 0 Finland Germany Iceland Italy Portugal Sweden UK country Fig. 2.1 (i) The average mass of waste generated per person in Europe is 5000 kg. State the number of the countries shown in Fig. 2.1 that generated more than this value. ..................................................................................................................................... [1] (ii) A report stated that in 2016 Germany recycled 65% and Finland recycled 40% of the waste they generated. Use Fig. 2.1 to calculate: • the mass of waste recycled in Germany in 2016 ......................................... kg per person • the mass of waste not recycled in Finland in 2016. ......................................... kg per person [2] (iii) State two strategies to increase the percentage of waste that is recycled in a country. 1 ........................................................................................................................................ 2 ........................................................................................................................................ [2] (iv) Incineration is used to dispose of waste. Suggest benefits and negative impacts of waste incineration. benefits .............................................................................................................................. ........................................................................................................................................... ........................................................................................................................................... ........................................................................................................................................... negative impacts ............................................................................................................... ........................................................................................................................................... ........................................................................................................................................... ........................................................................................................................................... [4] (v) In 2019, more than 1.8 million tonnes of plastic waste were exported from Europe as a waste disposal strategy. Most of this plastic waste went to China and Hong Kong. Evaluate the impacts of this waste disposal strategy. ........................................................................................................................................... ........................................................................................................................................... ........................................................................................................................................... ........................................................................................................................................... ........................................................................................................................................... ........................................................................................................................................... ........................................................................................................................................... ..................................................................................................................................... [4] (b) Fig. 2.2 shows a penguin colony in Antarctica. Fig. 2.2 The Antarctic Treaty is an international agreement that protects the Antarctic. Some of the treaty’s aims include: • protection of the Antarctic environment • conservation of plants and animals • management of tourism • management of protected areas. (i) All waste, other than sewage and food waste, is removed from Antarctica. Suggest why sewage and food waste are not removed from Antarctica. ........................................................................................................................................... ..................................................................................................................................... [1] (ii) Suggest why all other waste is removed from Antarctica. ........................................................................................................................................... ........................................................................................................................................... ........................................................................................................................................... ..................................................................................................................................... [2] (c) Approximately 30 000 tourists visit Antarctica each year. Describe how tourism can be controlled in protected environments such as Antarctica. ................................................................................................................................................... ................................................................................................................................................... ................................................................................................................................................... ................................................................................................................................................... ................................................................................................................................................... ............................................................................................................................................. [3] [Total: 19]
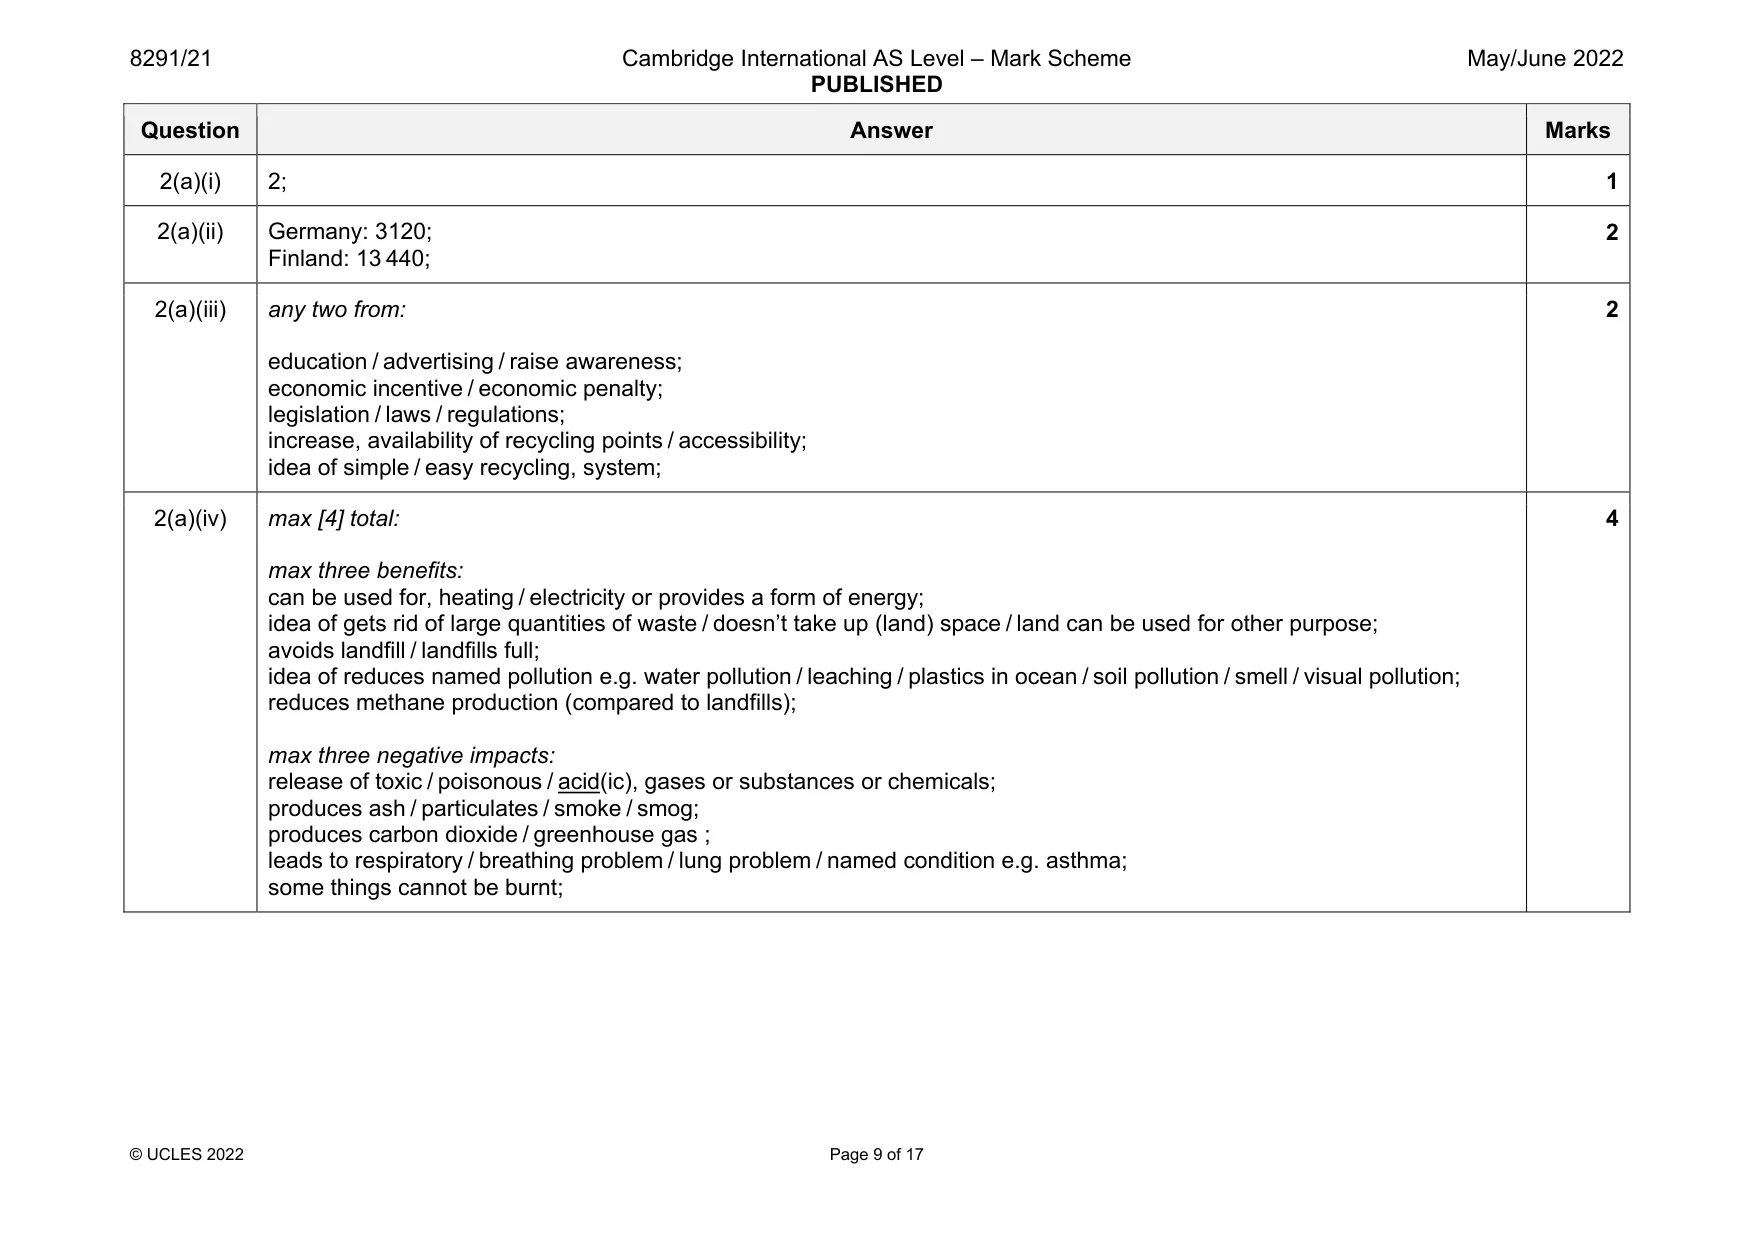
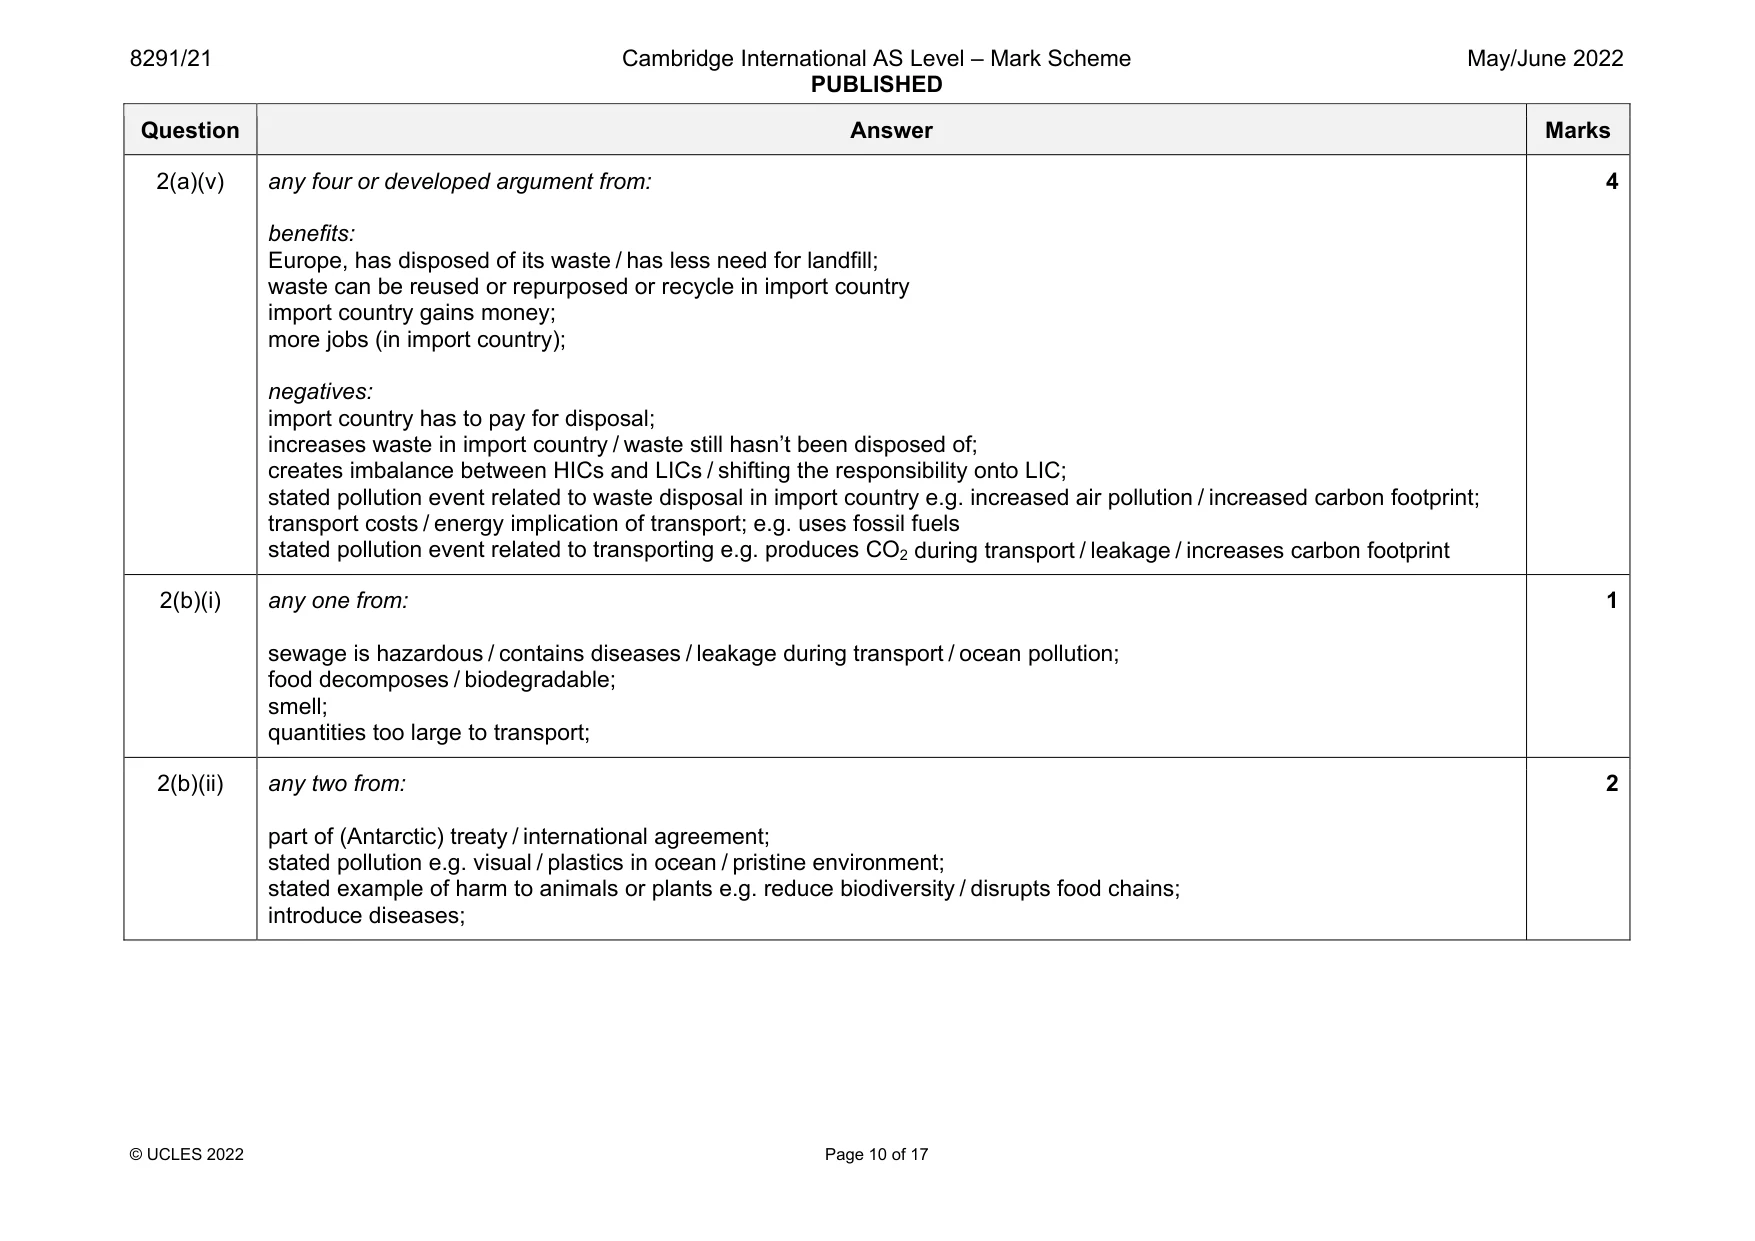
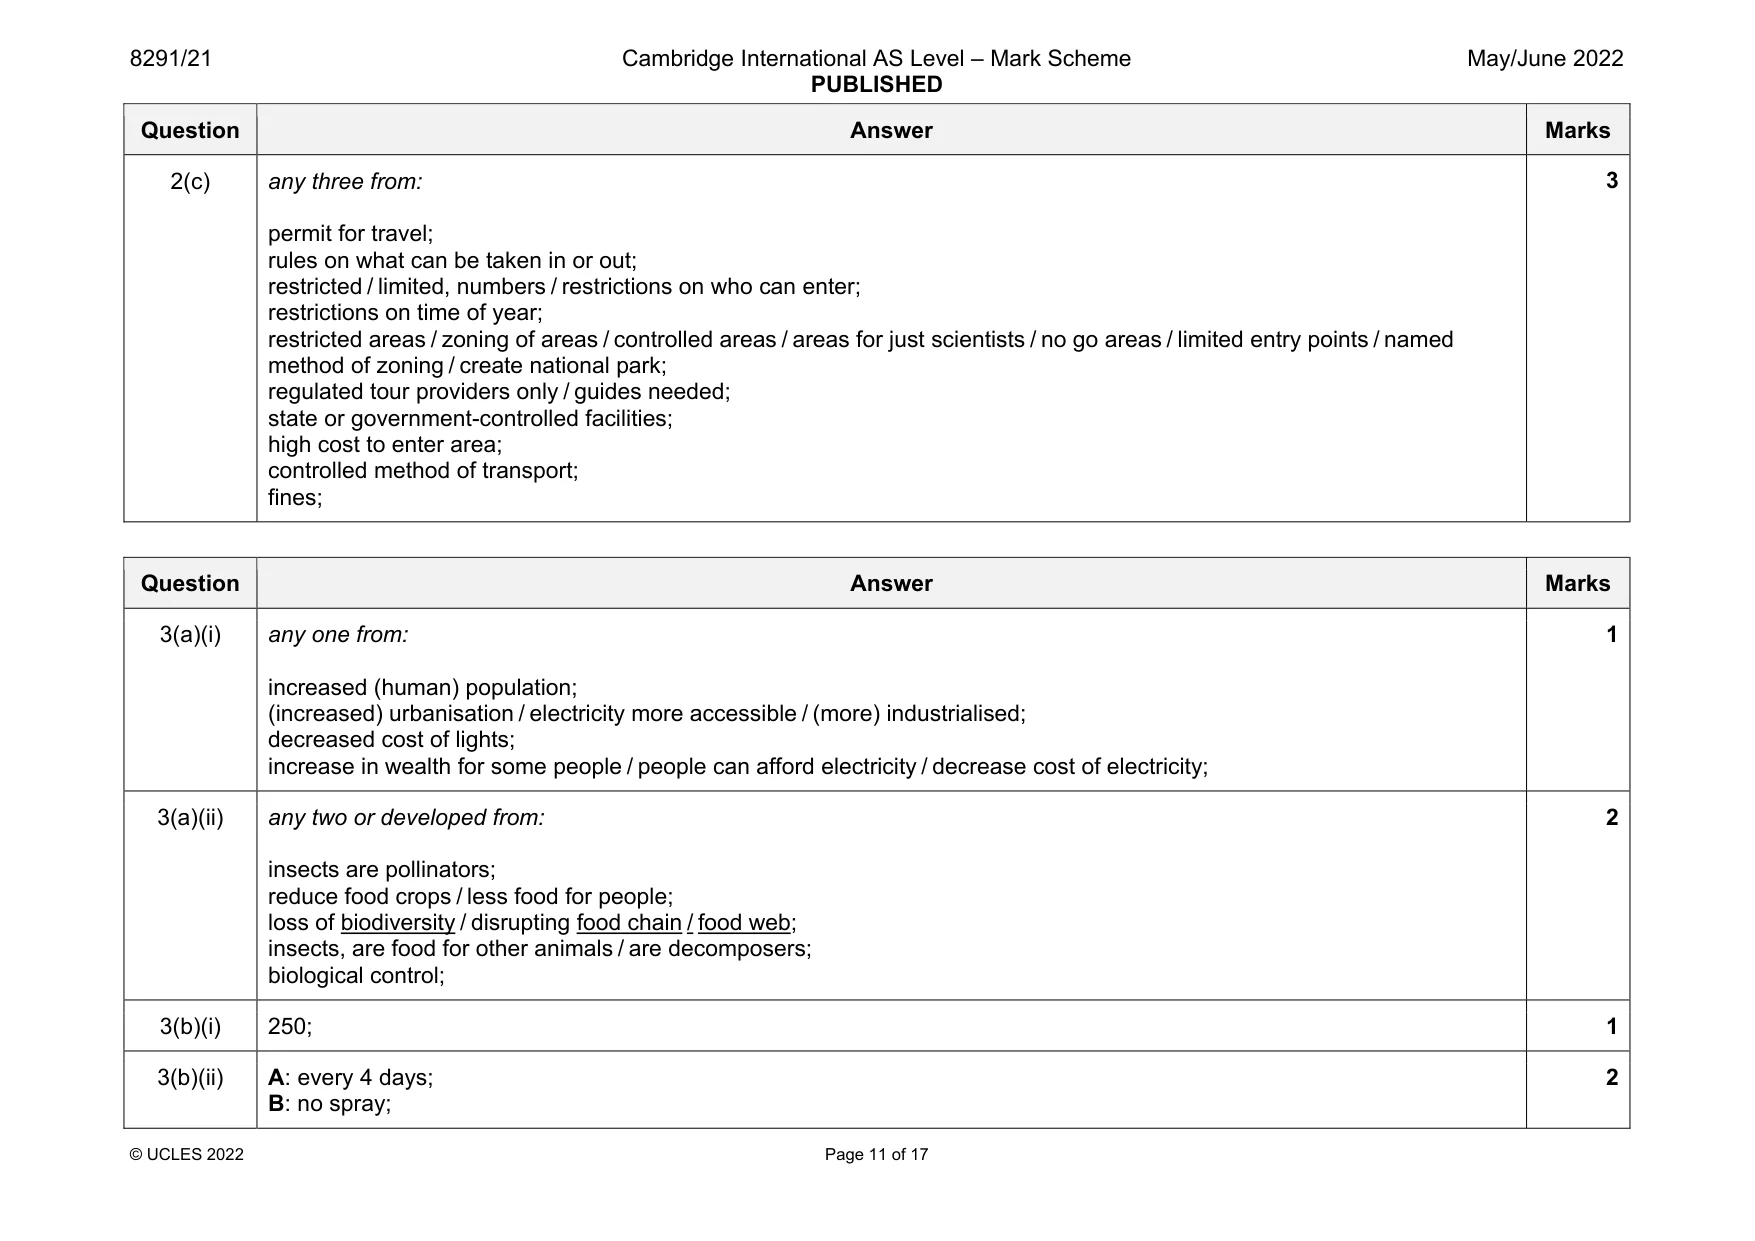
Mark scheme: 2(a)(i) 2; 1 2(a)(ii) Germany: 3120; Finland: 13 440; 2 2(a)(iii) any two from: education / advertising / raise awareness; economic incentive / economic penalty; legislation / laws / regulations; increase, availability of recycling points / accessibility; idea of simple / easy recycling, system; 2 2(a)(iv) max [4] total: max three benefits: can be used for, heating / electricity or provides a form of energy; idea of gets rid of large quantities of waste / doesn’t take up (land) space / land can be used for other purpose; avoids landfill / landfills full; idea of reduces named pollution e.g. water pollution / leaching / plastics in ocean / soil pollution / smell / visual pollution; reduces methane production (compared to landfills); max three negative impacts: release of toxic / poisonous / acid(ic), gases or substances or chemicals; produces ash / particulates / smoke / smog; produces carbon dioxide / greenhouse gas ; leads to respiratory / breathing problem / lung problem / named condition e.g. asthma; some things cannot be burnt; 4 Question Answer Marks 2(a)(v) any four or developed argument from: benefits: Europe, has disposed of its waste / has less need for landfill; waste can be reused or repurposed or recycle in import country import country gains money; more jobs (in import country); negatives: import country has to pay for disposal; increases waste in import country / waste still hasn’t been disposed of; creates imbalance between HICs and LICs / shifting the responsibility onto LIC; stated pollution event related to waste disposal in import country e.g. increased air pollution / increased carbon footprint; transport costs / energy implication of transport; e.g. uses fossil fuels stated pollution event related to transporting e.g. produces CO2 during transport / leakage / increases carbon footprint 4 2(b)(i) any one from: sewage is hazardous / contains diseases / leakage during transport / ocean pollution; food decomposes / biodegradable; smell; quantities too large to transport; 1 2(b)(ii) any two from: part of (Antarctic) treaty / international agreement; stated pollution e.g. visual / plastics in ocean / pristine environment; stated example of harm to animals or plants e.g. reduce biodiversity / disrupts food chains; introduce diseases; 2 Question Answer Marks 2(c) any three from: permit for travel; rules on what can be taken in or out; restricted / limited, numbers / restrictions on who can enter; restrictions on time of year; restricted areas / zoning of areas / controlled areas / areas for just scientists / no go areas / limited entry points / named method of zoning / create national park; regulated tour providers only / guides needed; state or government-controlled facilities; high cost to enter area; controlled method of transport; fines; 3
Q3 · Light pollution is caused by the use of artificial light
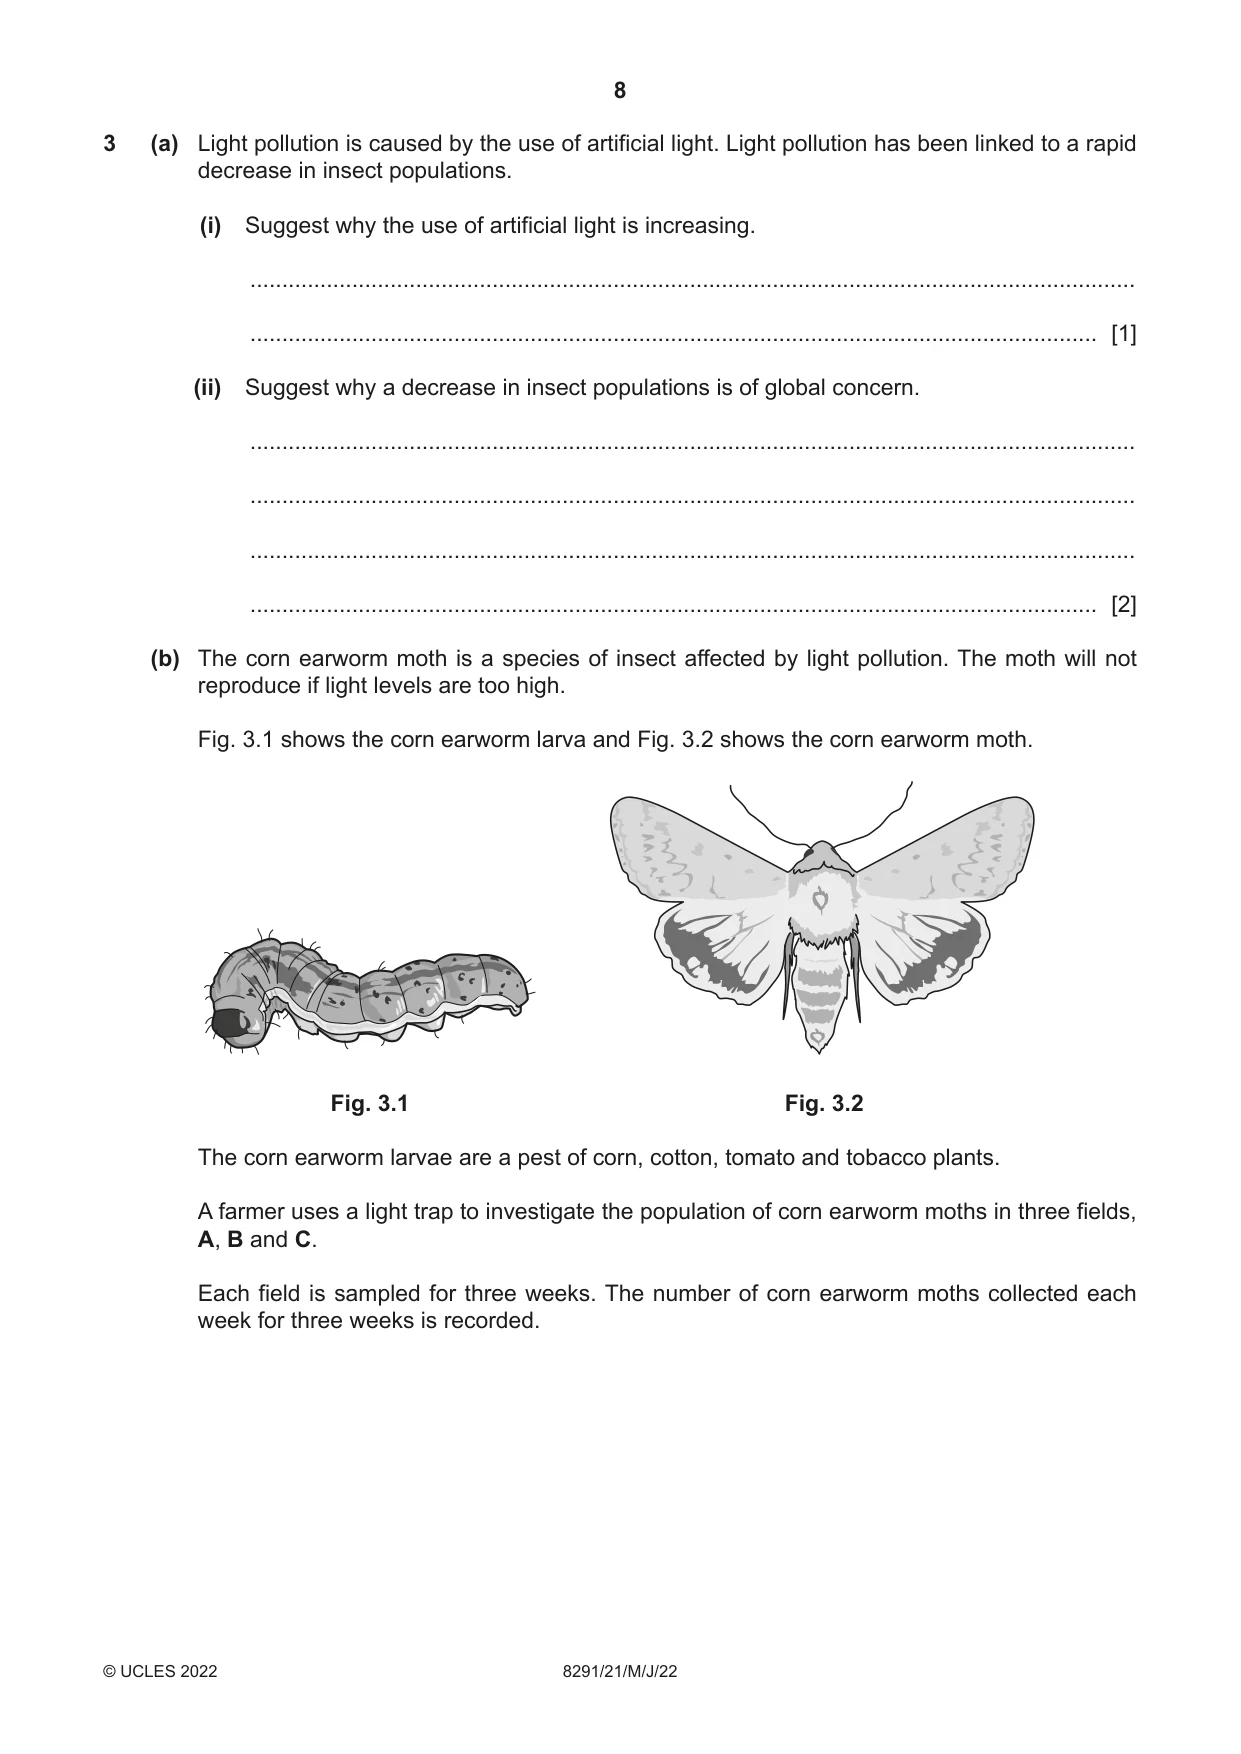
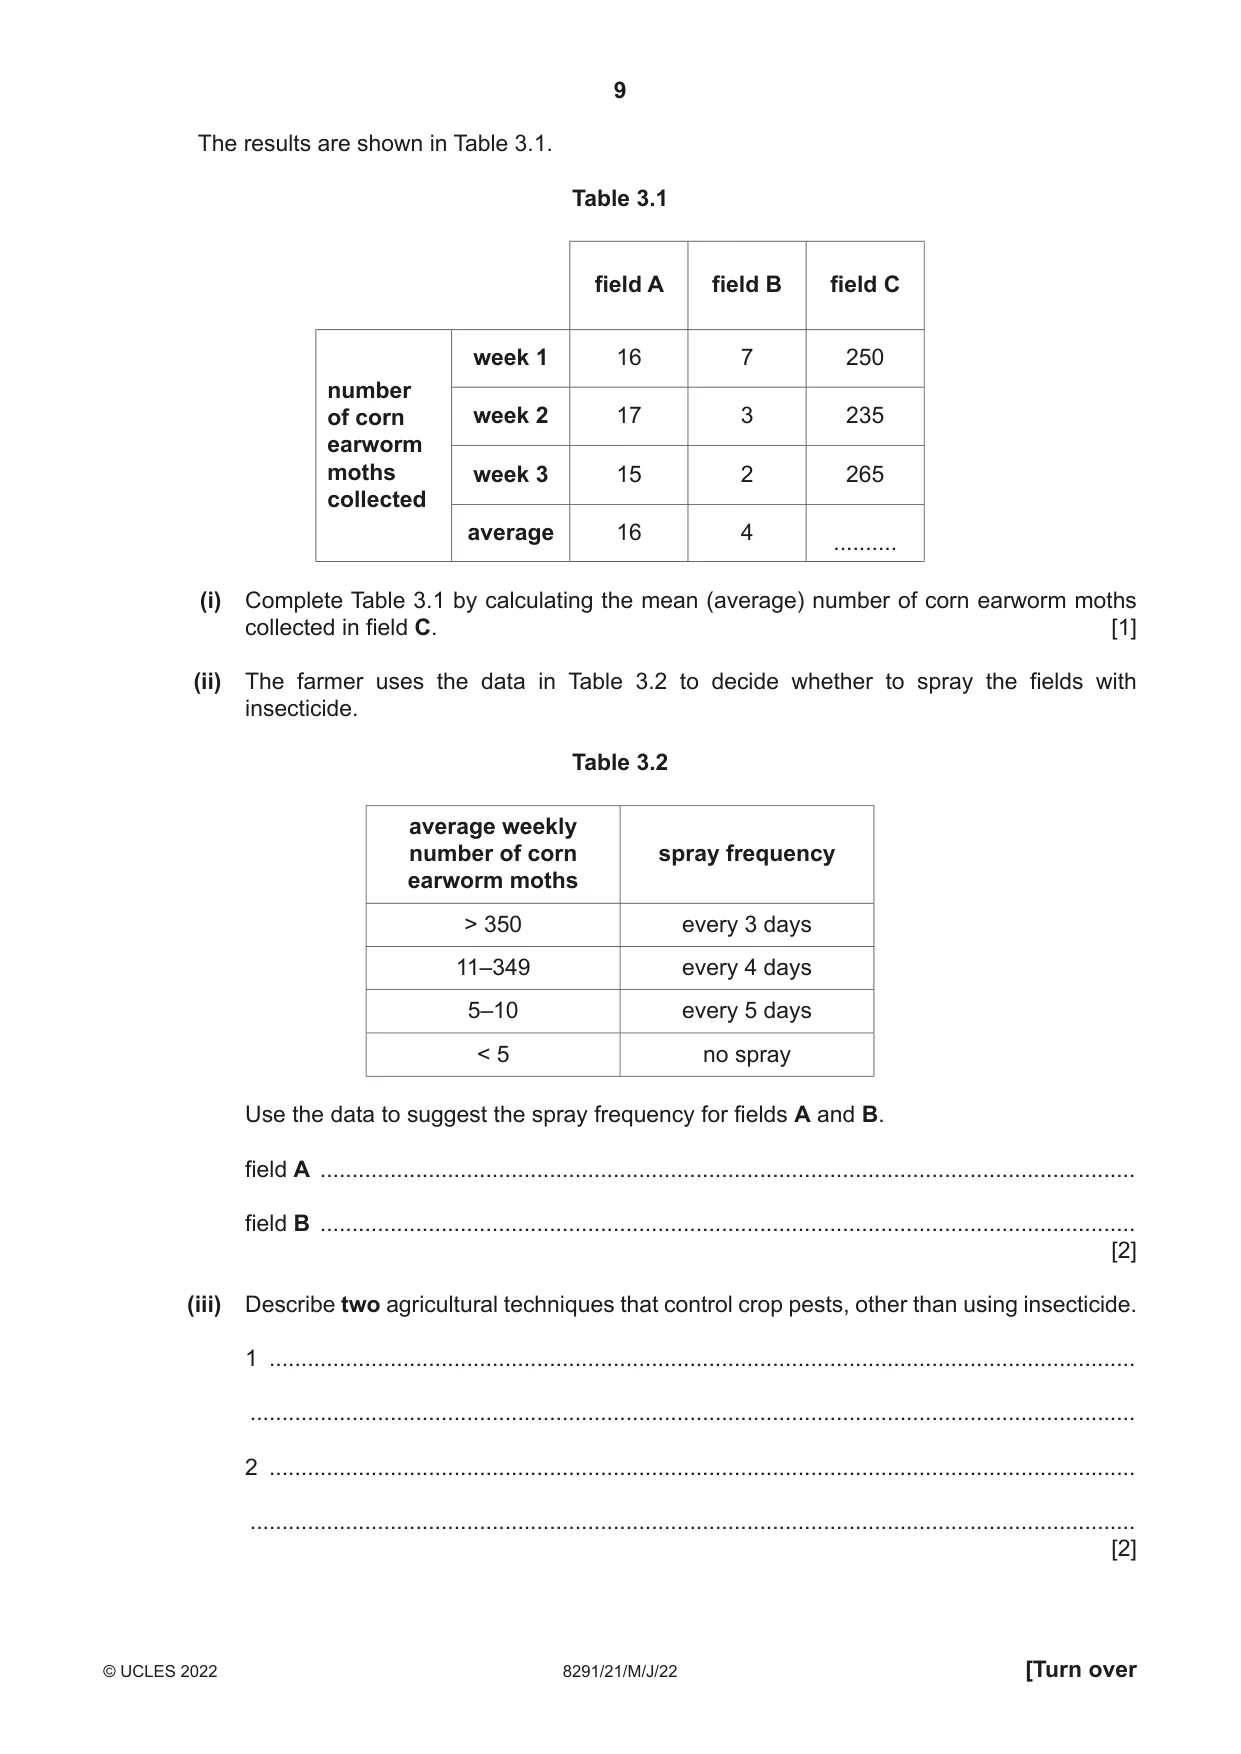
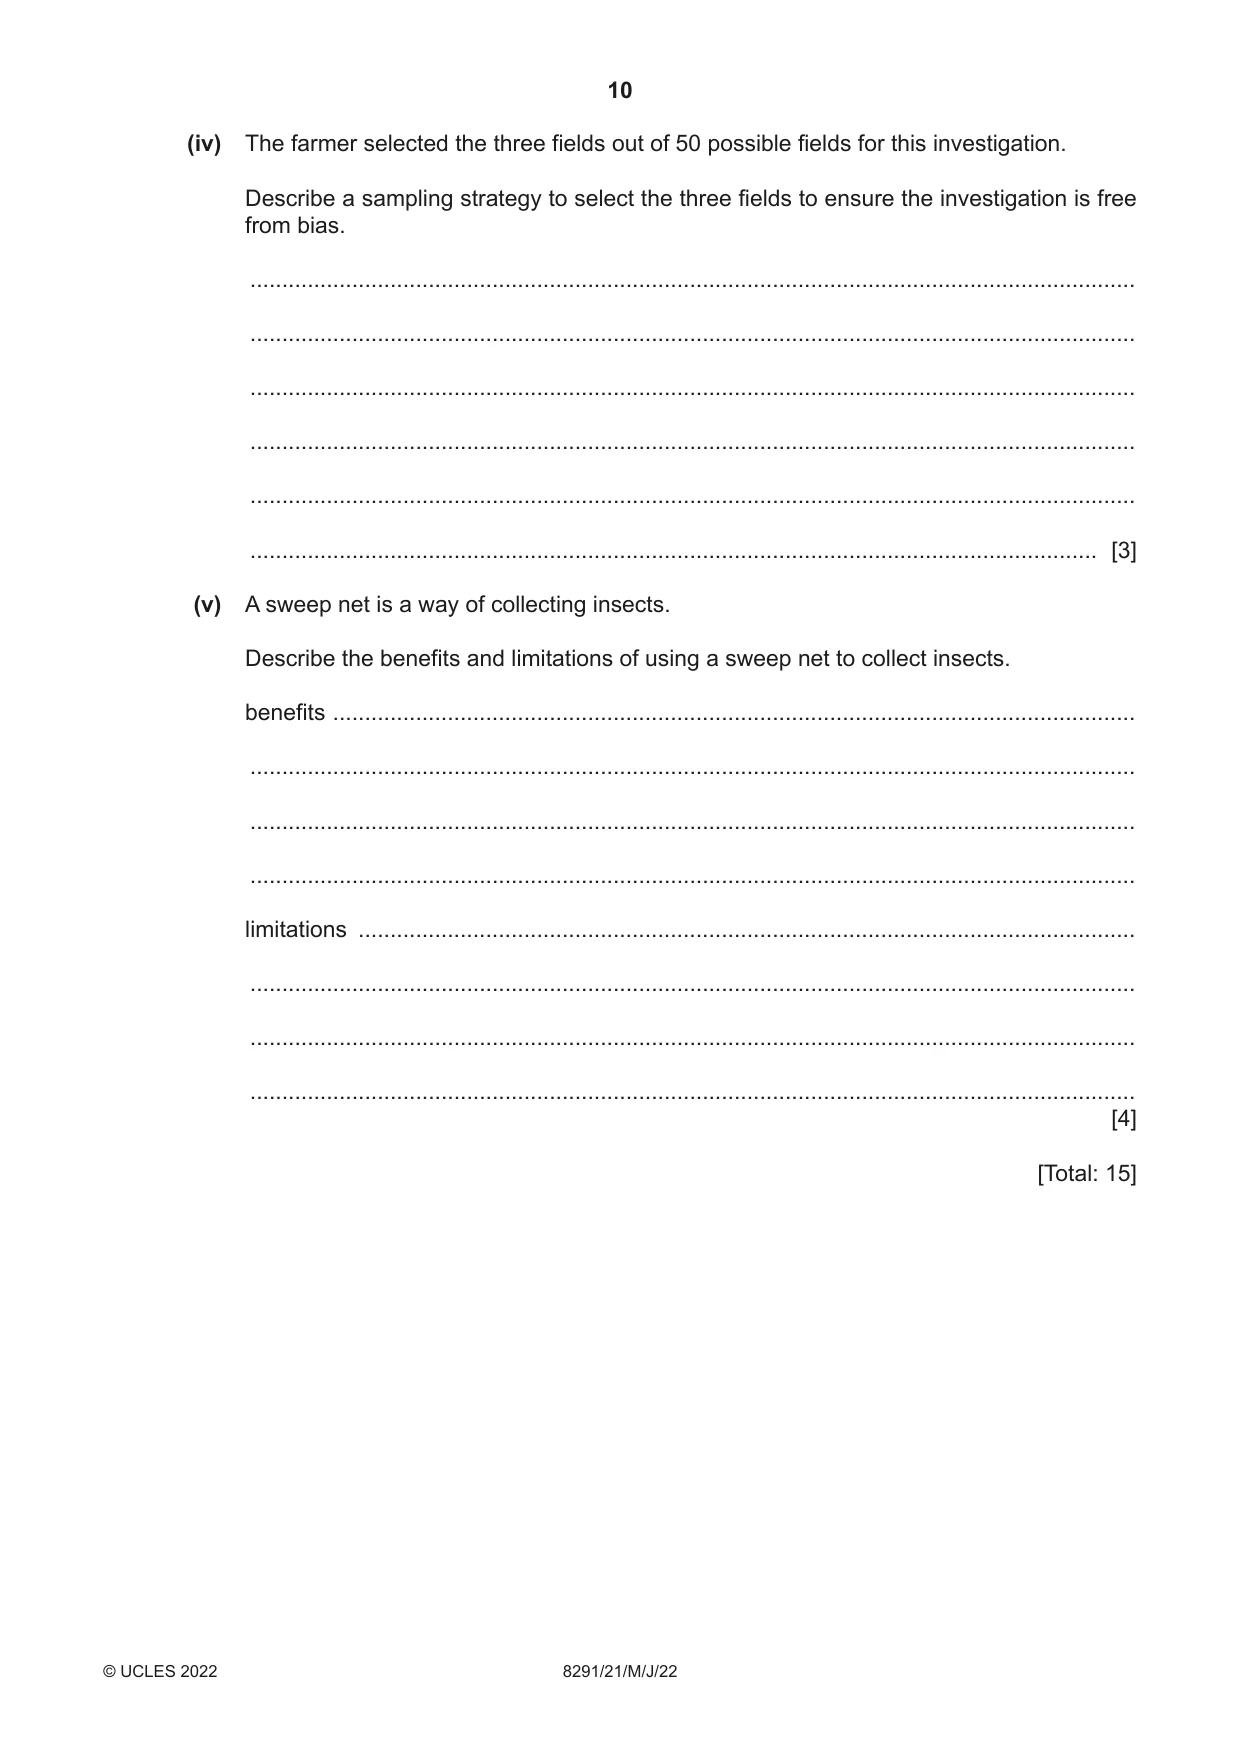
3 (a) Light pollution is caused by the use of artificial light. Light pollution has been linked to a rapid decrease in insect populations. (i) Suggest why the use of artificial light is increasing. ........................................................................................................................................... ..................................................................................................................................... [1] (ii) Suggest why a decrease in insect populations is of global concern. ........................................................................................................................................... ........................................................................................................................................... ........................................................................................................................................... ..................................................................................................................................... [2] (b) The corn earworm moth is a species of insect affected by light pollution. The moth will not reproduce if light levels are too high. Fig. 3.1 shows the corn earworm larva and Fig. 3.2 shows the corn earworm moth. Fig. 3.1 Fig. 3.2 The corn earworm larvae are a pest of corn, cotton, tomato and tobacco plants. A farmer uses a light trap to investigate the population of corn earworm moths in three fields, A, B and C. Each field is sampled for three weeks. The number of corn earworm moths collected each week for three weeks is recorded. The results are shown in Table 3.1. Table 3.1 field A field B field C week 1 16 7 250 number of corn week 2 17 3 235 earworm moths week 3 15 2 265 collected average 16 4 .......... (i) Complete Table 3.1 by calculating the mean (average) number of corn earworm moths collected in field C. [1] (ii) The farmer uses the data in Table 3.2 to decide whether to spray the fields with insecticide. Table 3.2 average weekly number of corn spray frequency earworm moths > 350 every 3 days 11–349 every 4 days 5–10 every 5 days < 5 no spray Use the data to suggest the spray frequency for fields A and B. field A ................................................................................................................................ field B ................................................................................................................................ [2] (iii) Describe two agricultural techniques that control crop pests, other than using insecticide. 1 ........................................................................................................................................ ........................................................................................................................................... 2 ........................................................................................................................................ ........................................................................................................................................... [2] (iv) The farmer selected the three fields out of 50 possible fields for this investigation. Describe a sampling strategy to select the three fields to ensure the investigation is free from bias. ........................................................................................................................................... ........................................................................................................................................... ........................................................................................................................................... ........................................................................................................................................... ........................................................................................................................................... ..................................................................................................................................... [3] (v) A sweep net is a way of collecting insects. Describe the benefits and limitations of using a sweep net to collect insects. benefits .............................................................................................................................. ........................................................................................................................................... ........................................................................................................................................... ........................................................................................................................................... limitations .......................................................................................................................... ........................................................................................................................................... ........................................................................................................................................... ........................................................................................................................................... [4] [Total: 15]
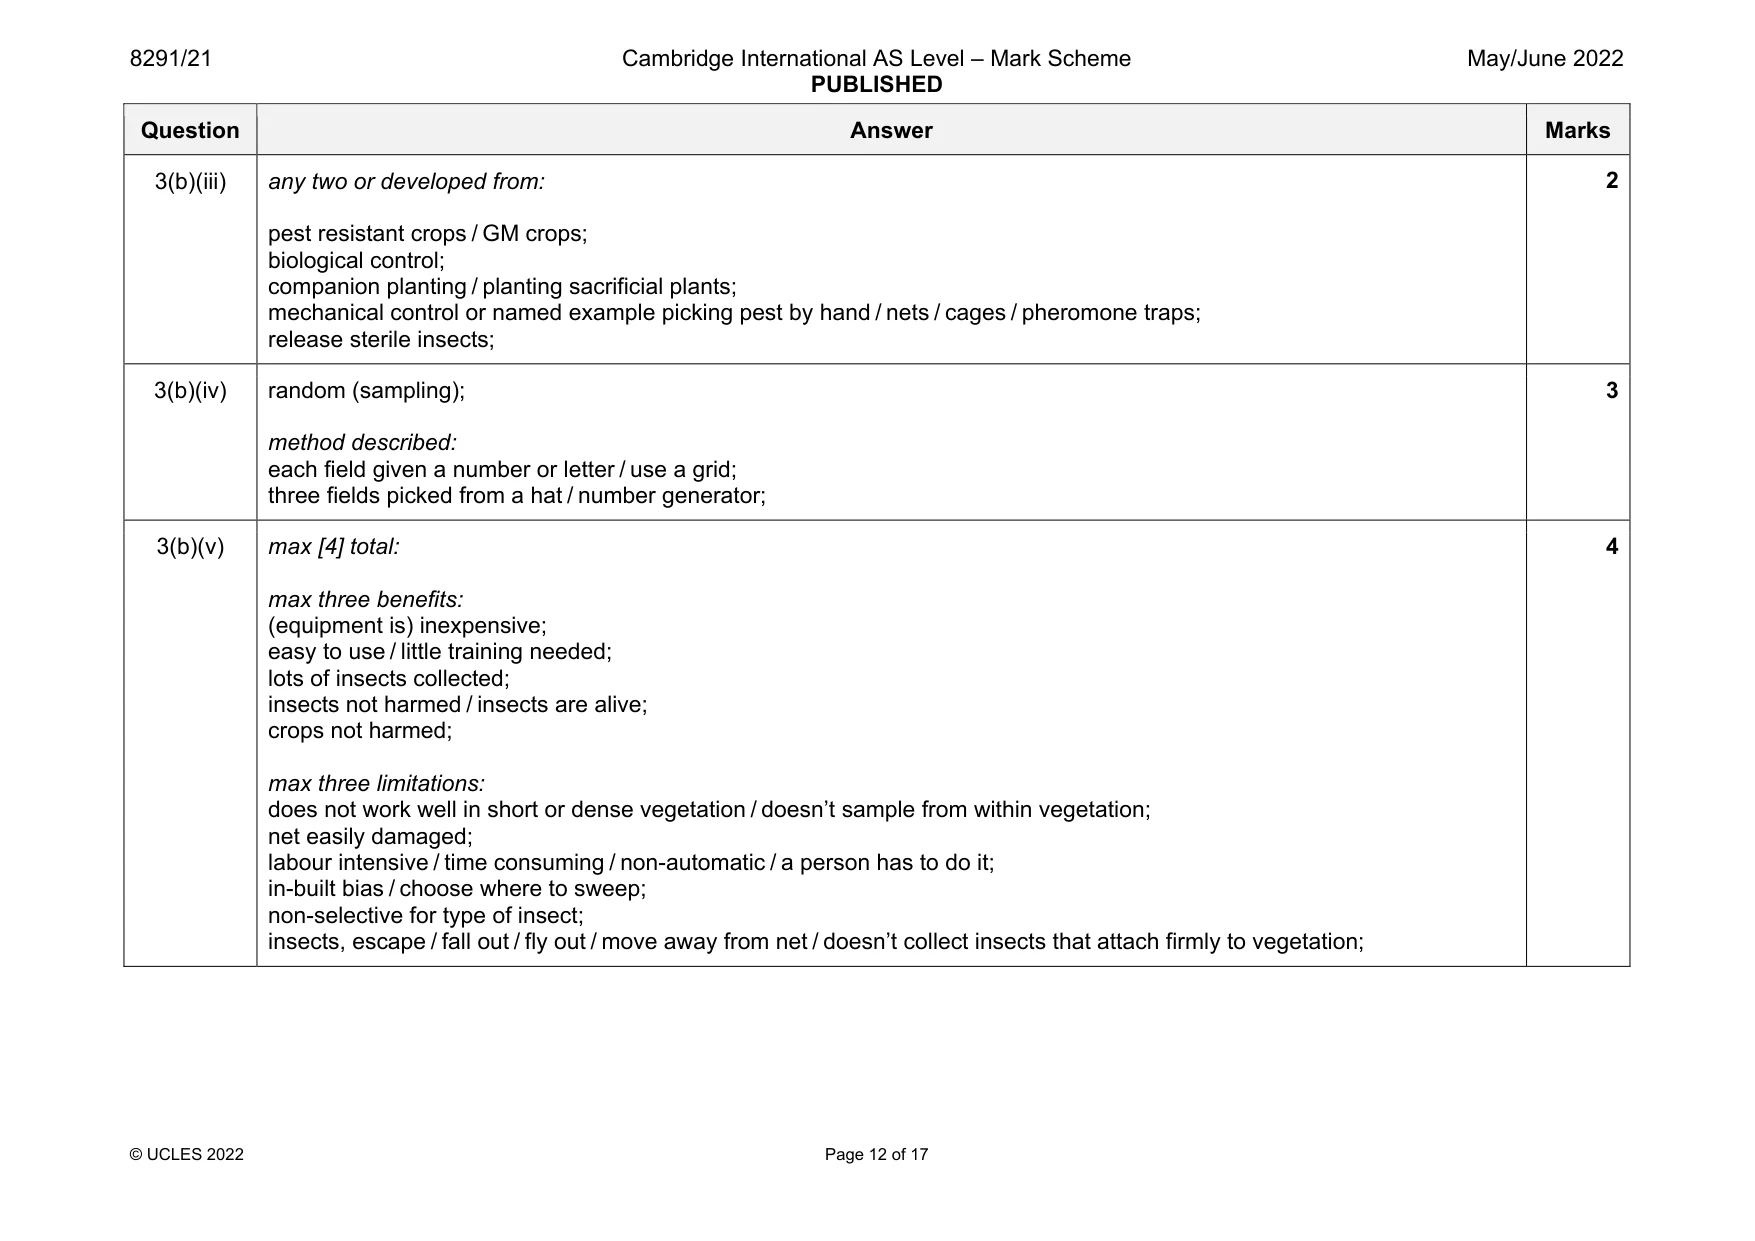
Mark scheme: 3(a)(i) any one from: increased (human) population; (increased) urbanisation / electricity more accessible / (more) industrialised; decreased cost of lights; increase in wealth for some people / people can afford electricity / decrease cost of electricity; 3(a)(ii) any two or developed from: insects are pollinators; reduce food crops / less food for people; loss of biodiversity / disrupting food chain / food web; insects, are food for other animals / are decomposers; biological control; 2 3(b)(i) 250; 1 3(b)(ii) A: every 4 days; B: no spray; 2 Question Answer Marks 3(b)(iii) any two or developed from: pest resistant crops / GM crops; biological control; companion planting / planting sacrificial plants; mechanical control or named example picking pest by hand / nets / cages / pheromone traps; release sterile insects; 2 3(b)(iv) random (sampling); method described: each field given a number or letter / use a grid; three fields picked from a hat / number generator; 3 3(b)(v) max [4] total: max three benefits: (equipment is) inexpensive; easy to use / little training needed; lots of insects collected; insects not harmed / insects are alive; crops not harmed; max three limitations: does not work well in short or dense vegetation / doesn’t sample from within vegetation; net easily damaged; labour intensive / time consuming / non-automatic / a person has to do it; in-built bias / choose where to sweep; non-selective for type of insect; insects, escape / fall out / fly out / move away from net / doesn’t collect insects that attach firmly to vegetation; 4
Q4 · In 2020, Ethiopia, a country in Africa, had 15% of its land covered by forest
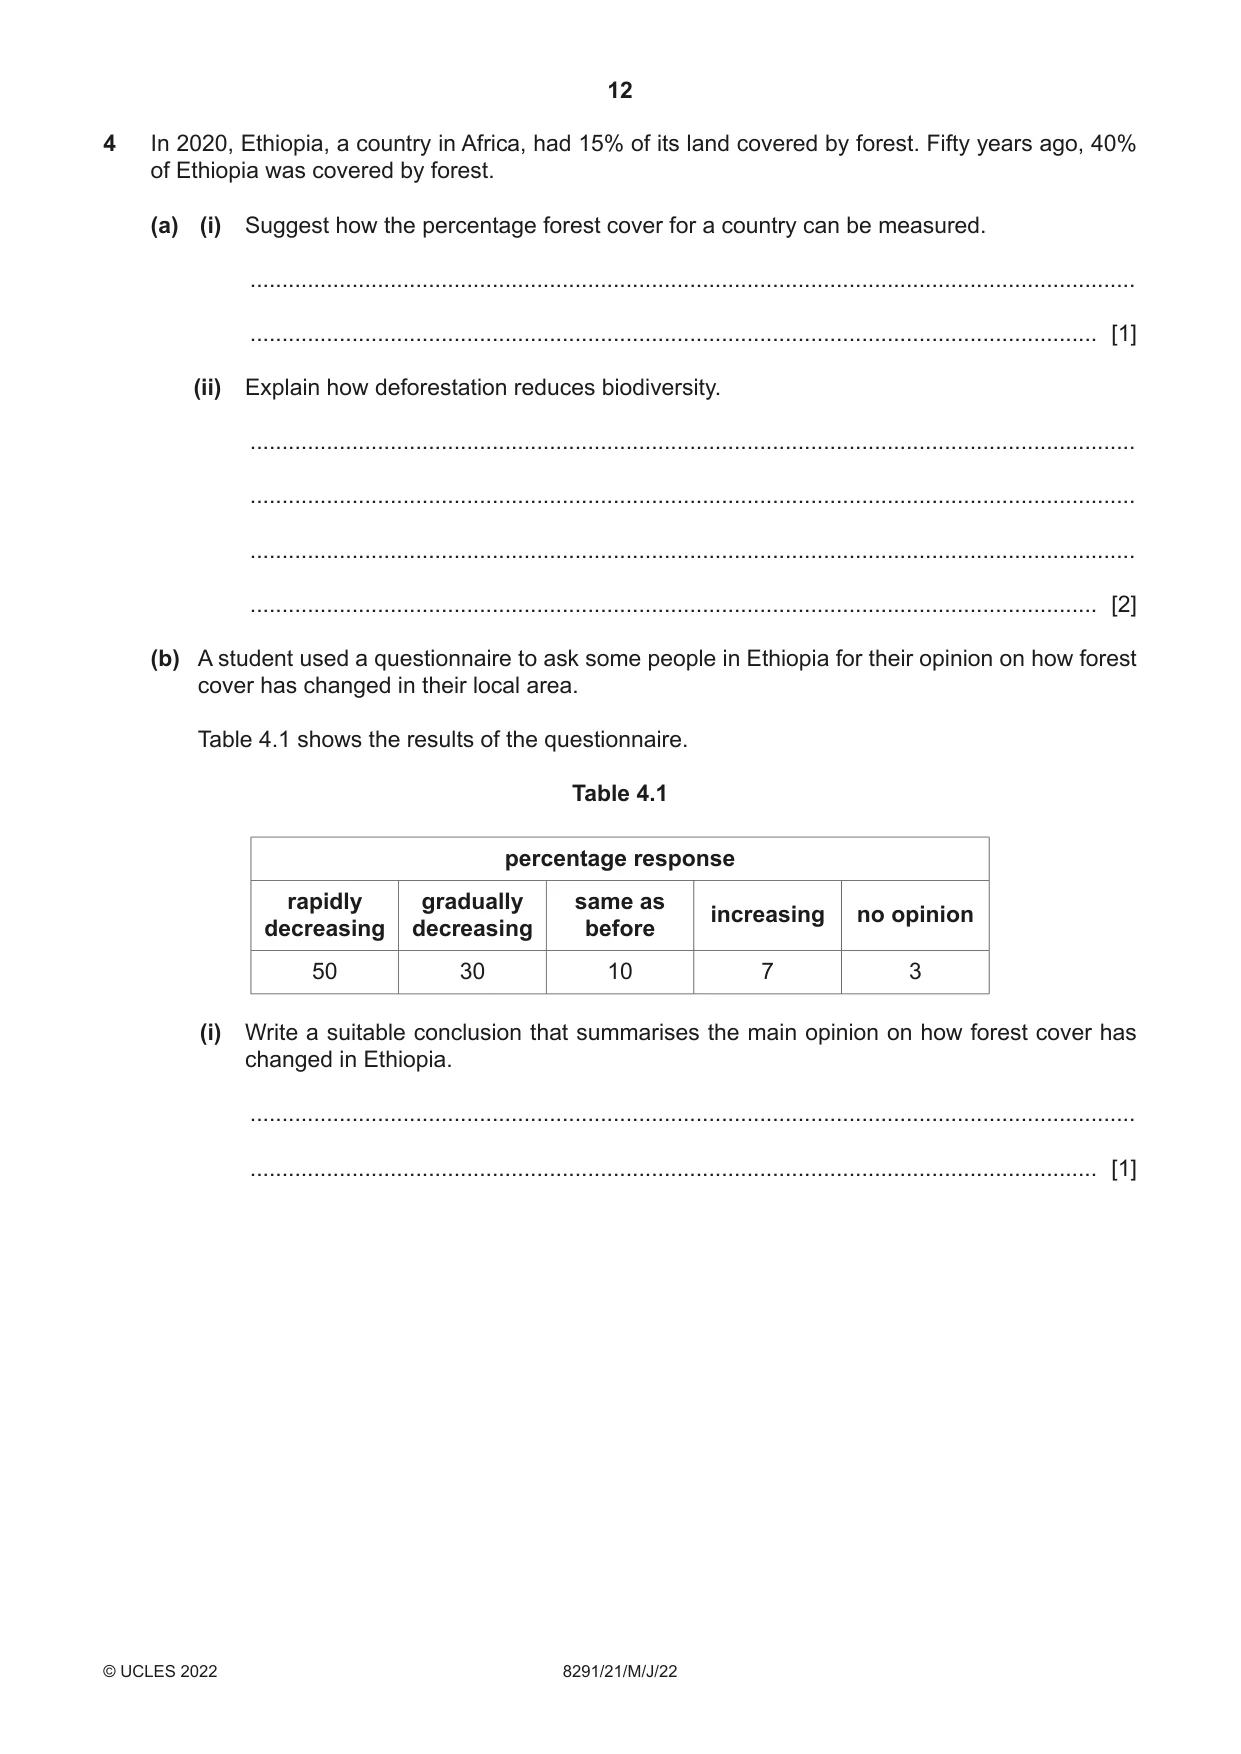
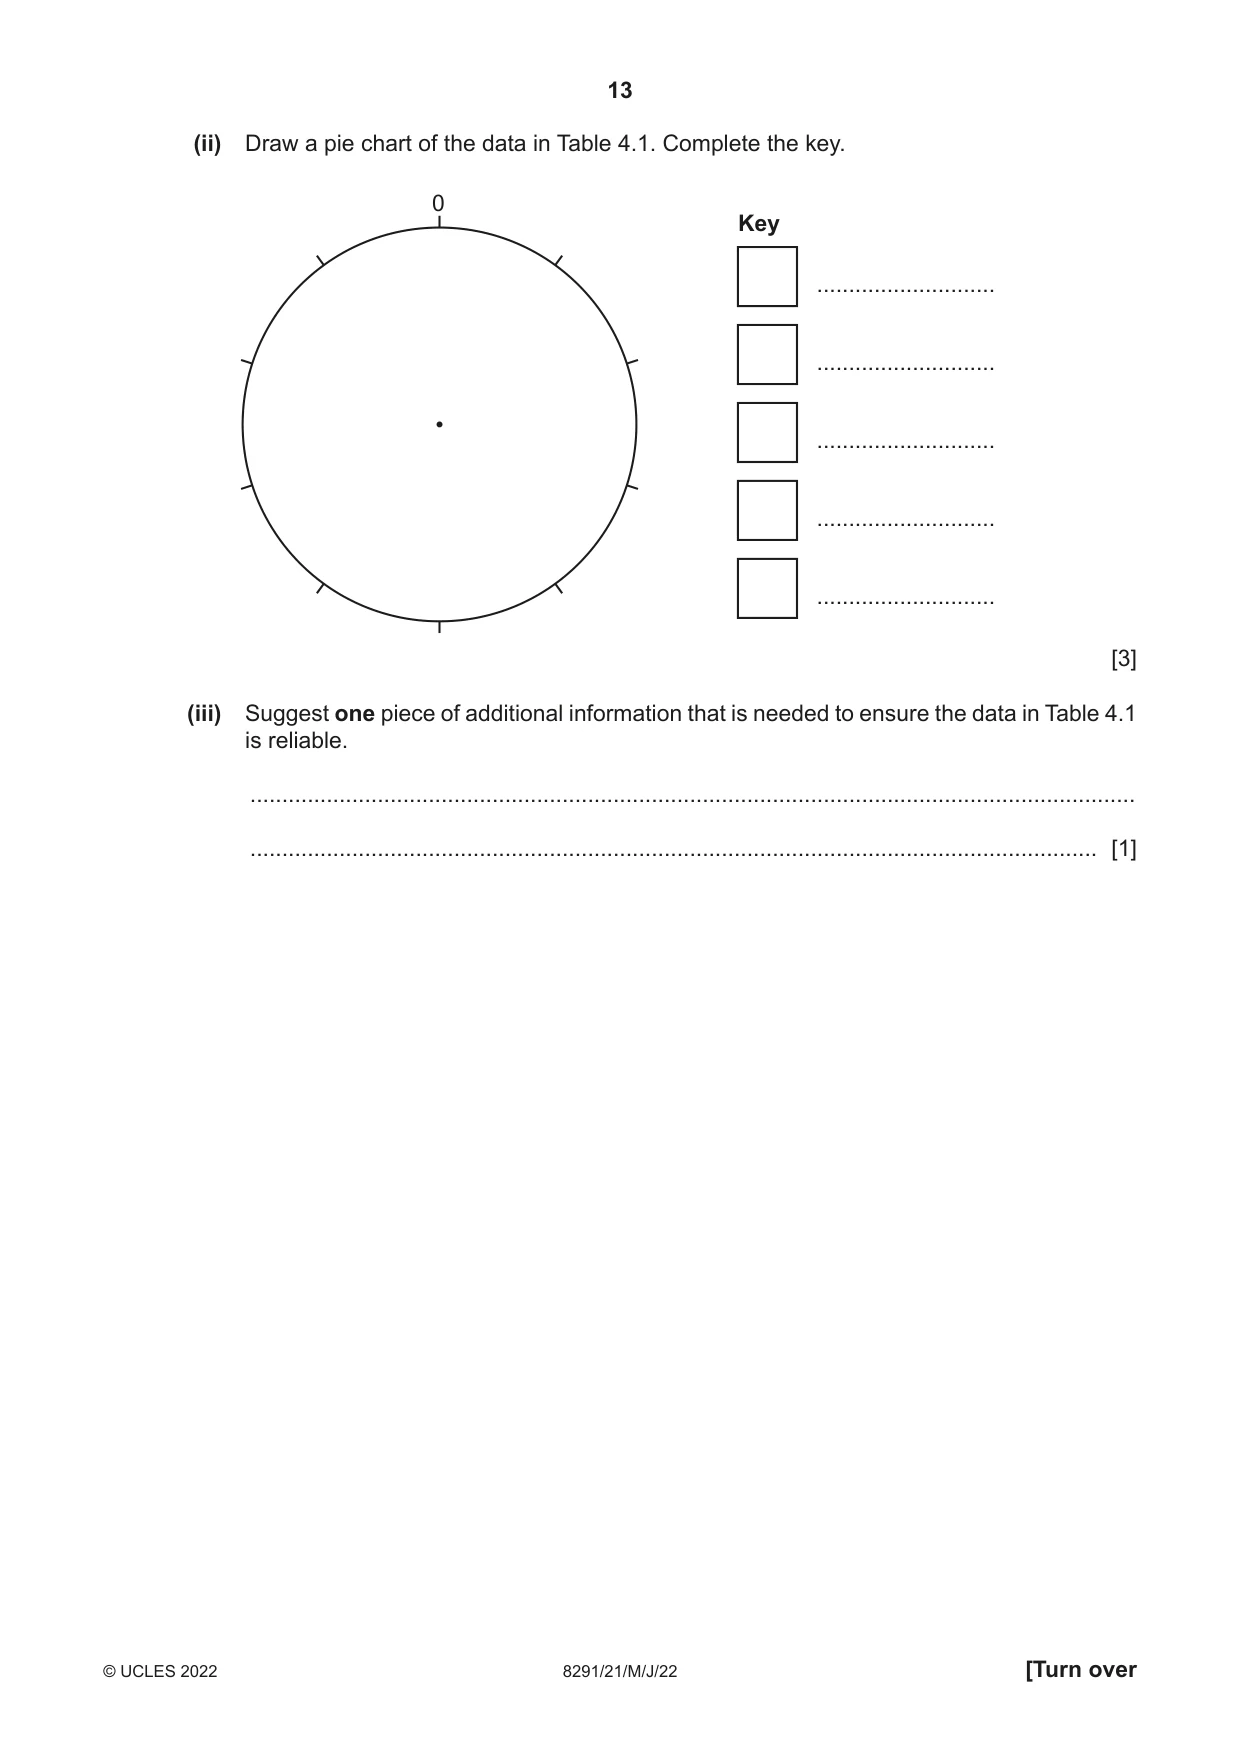
4 In 2020, Ethiopia, a country in Africa, had 15% of its land covered by forest. Fifty years ago, 40% of Ethiopia was covered by forest. (a) (i) Suggest how the percentage forest cover for a country can be measured. ........................................................................................................................................... ..................................................................................................................................... [1] (ii) Explain how deforestation reduces biodiversity. ........................................................................................................................................... ........................................................................................................................................... ........................................................................................................................................... ..................................................................................................................................... [2] (b) A student used a questionnaire to ask some people in Ethiopia for their opinion on how forest cover has changed in their local area. Table 4.1 shows the results of the questionnaire. Table 4.1 percentage response rapidly gradually same as increasing no opinion decreasing decreasing before 50 30 10 7 3 (i) Write a suitable conclusion that summarises the main opinion on how forest cover has changed in Ethiopia. ........................................................................................................................................... ..................................................................................................................................... [1] (ii) Draw a pie chart of the data in Table 4.1. Complete the key. 0 Key ............................ ............................ ............................ ............................ ............................ [3] (iii) Suggest one piece of additional information that is needed to ensure the data in Table 4.1 is reliable. ........................................................................................................................................... ..................................................................................................................................... [1] (c) In 2019, a major reforestation programme took place in Ethiopia. 350 million trees were planted over a 12-hour period in July. (i) Suggest one reason why not all of the 350 million trees planted will grow into mature trees. ........................................................................................................................................... ..................................................................................................................................... [1] (ii) Suggest one reason why other countries do not have a similar reforestation programme. ........................................................................................................................................... ..................................................................................................................................... [1] (iii) Explain how reforestation can improve water security in a region. ........................................................................................................................................... ........................................................................................................................................... ........................................................................................................................................... ........................................................................................................................................... ........................................................................................................................................... ..................................................................................................................................... [3] (iv) In the past, eucalyptus trees were used to reforest areas of Ethiopia. Eucalyptus trees are not native to Ethiopia. Suggest the negative impacts of planting non-native trees. ........................................................................................................................................... ........................................................................................................................................... ........................................................................................................................................... ........................................................................................................................................... ........................................................................................................................................... ..................................................................................................................................... [3] (v) Explain how reforestation can help manage climate change. ........................................................................................................................................... ........................................................................................................................................... ........................................................................................................................................... ........................................................................................................................................... ........................................................................................................................................... ........................................................................................................................................... ........................................................................................................................................... ..................................................................................................................................... [4] [Total: 20]
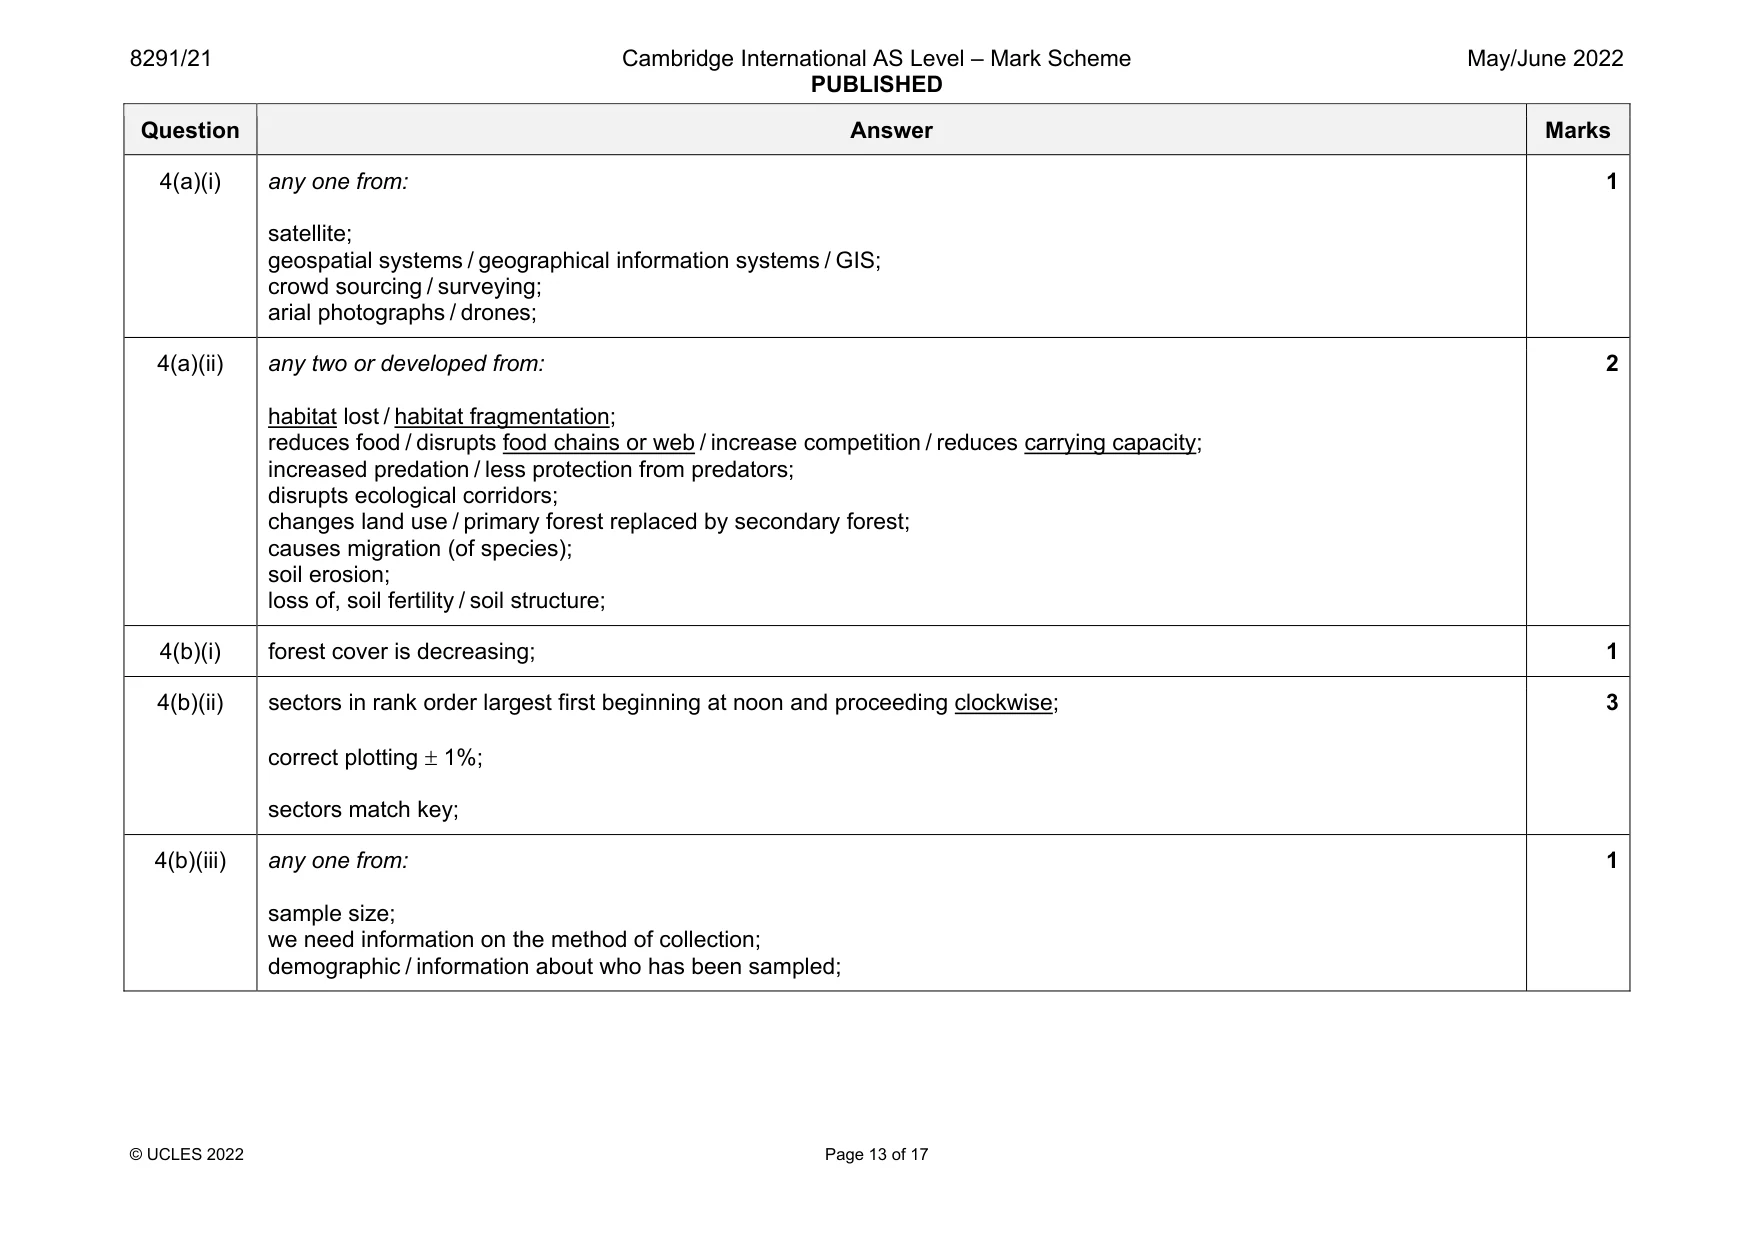
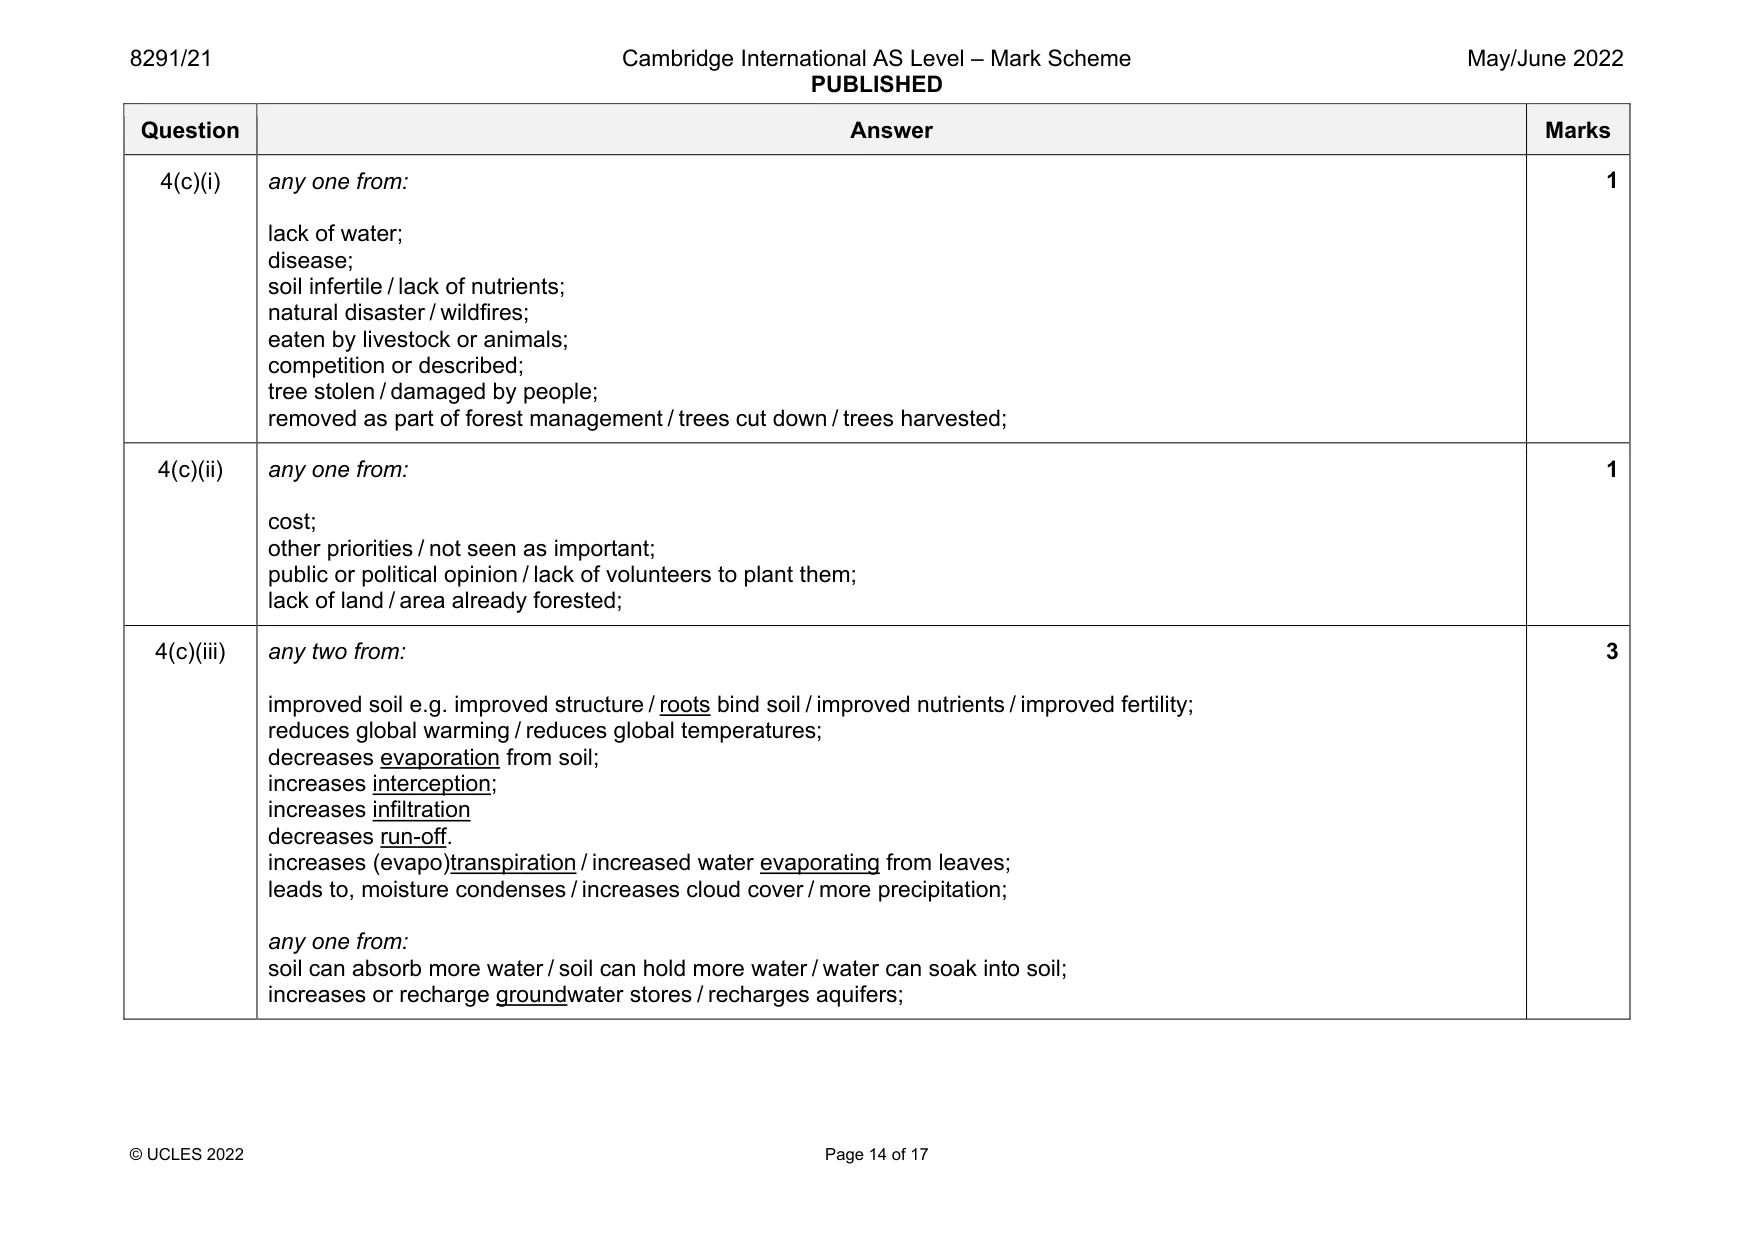
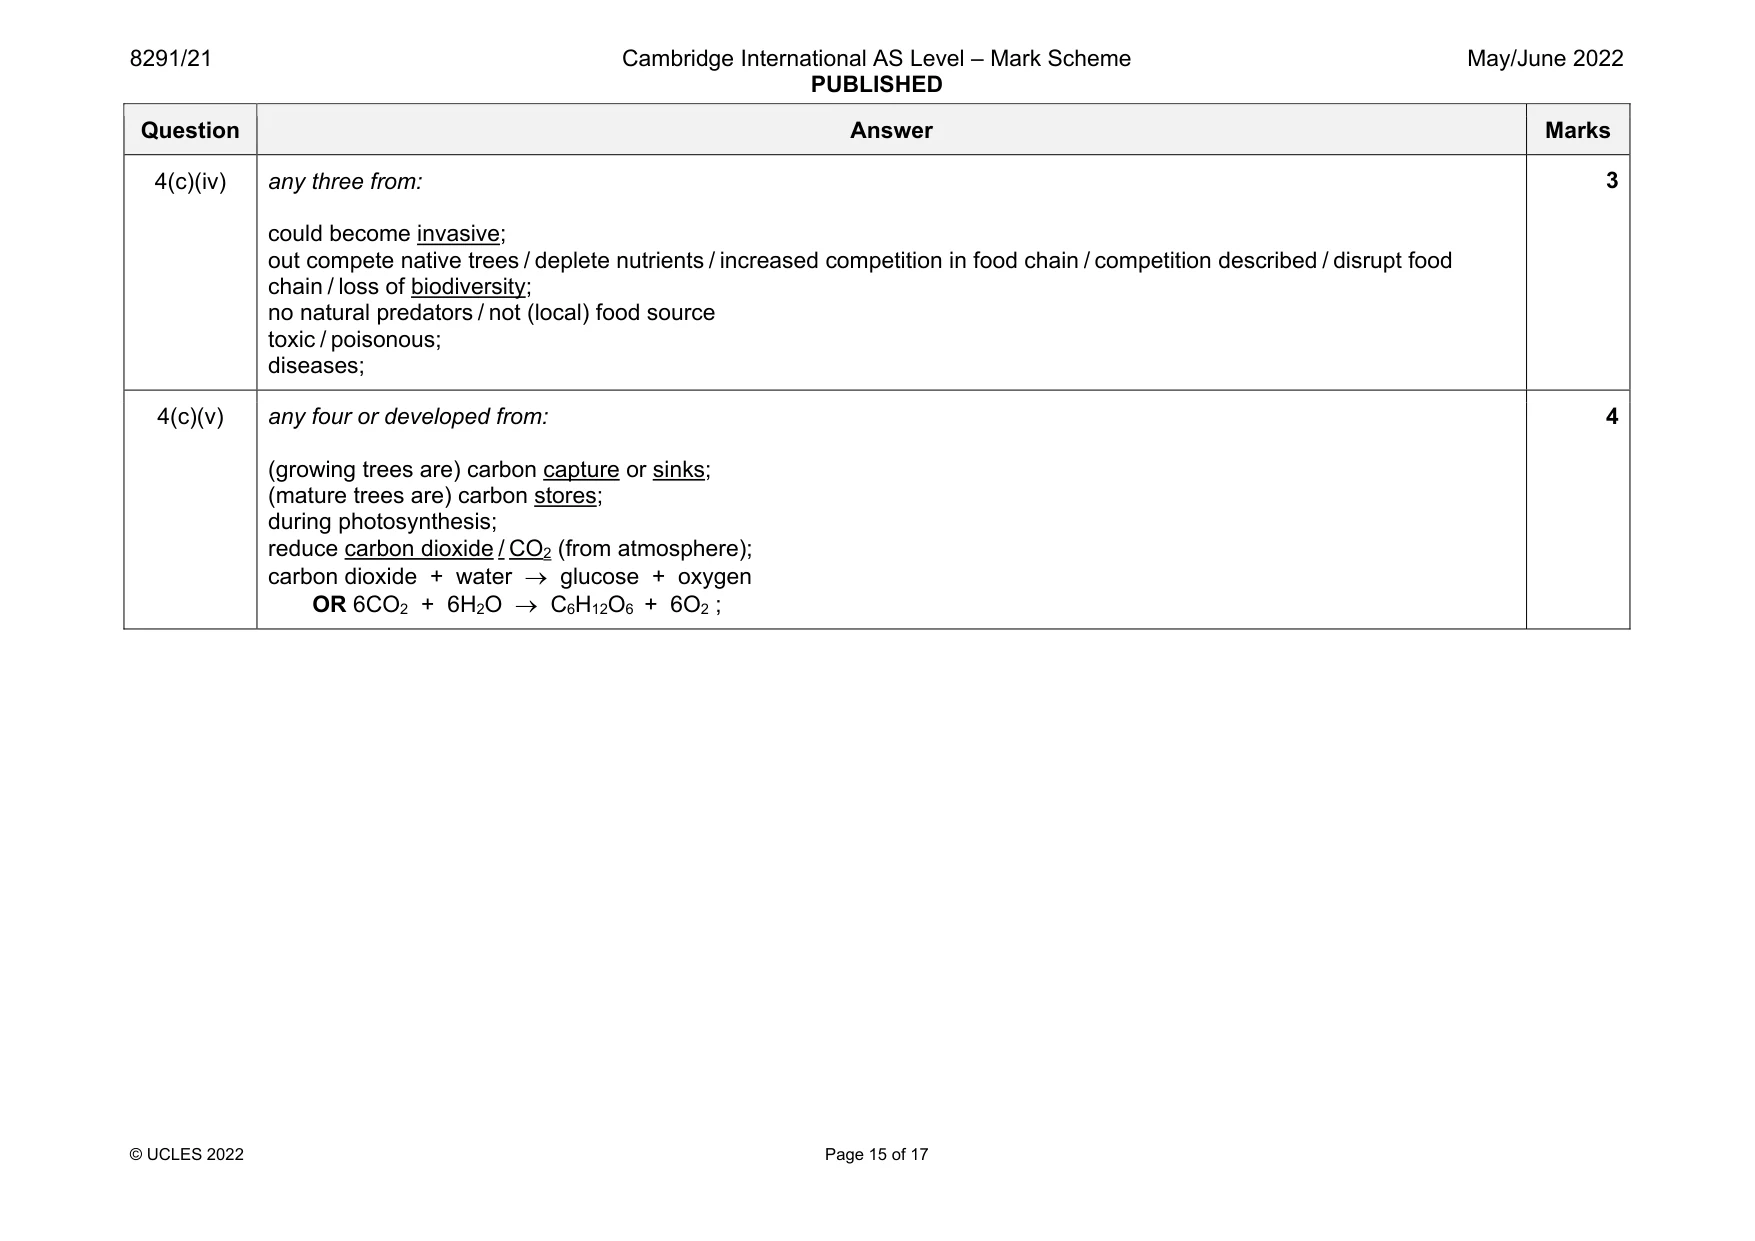
Mark scheme: 4(a)(i) any one from: satellite; geospatial systems / geographical information systems / GIS; crowd sourcing / surveying; arial photographs / drones; 1 4(a)(ii) any two or developed from: habitat lost / habitat fragmentation; reduces food / disrupts food chains or web / increase competition / reduces carrying capacity; increased predation / less protection from predators; disrupts ecological corridors; changes land use / primary forest replaced by secondary forest; causes migration (of species); soil erosion; loss of, soil fertility / soil structure; 2 4(b)(i) forest cover is decreasing; 1 4(b)(ii) sectors in rank order largest first beginning at noon and proceeding clockwise; correct plotting 1%; sectors match key; 3 4(b)(iii) any one from: sample size; we need information on the method of collection; demographic / information about who has been sampled; 1 Question Answer Marks 4(c)(i) any one from: lack of water; disease; soil infertile / lack of nutrients; natural disaster / wildfires; eaten by livestock or animals; competition or described; tree stolen / damaged by people; removed as part of forest management / trees cut down / trees harvested; 1 4(c)(ii) any one from: cost; other priorities / not seen as important; public or political opinion / lack of volunteers to plant them; lack of land / area already forested; 1 4(c)(iii) any two from: improved soil e.g. improved structure / roots bind soil / improved nutrients / improved fertility; reduces global warming / reduces global temperatures; decreases evaporation from soil; increases interception; increases infiltration decreases run-off. increases (evapo)transpiration / increased water evaporating from leaves; leads to, moisture condenses / increases cloud cover / more precipitation; any one from: soil can absorb more water / soil can hold more water / water can soak into soil; increases or recharge groundwater stores / recharges aquifers; 3 Question Answer Marks 4(c)(iv) any three from: could become invasive; out compete native trees / deplete nutrients / increased competition in food chain / competition described / disrupt food chain / loss of biodiversity; no natural predators / not (local) food source toxic / poisonous; diseases; 3 4(c)(v) any four or developed from: (growing trees are) carbon capture or sinks; (mature trees are) carbon stores; during photosynthesis; reduce carbon dioxide / CO2 (from atmosphere); carbon dioxide + water glucose + oxygen OR 6CO2 + 6H2O C6H12O6 + 6O2 ; 4
More questions on Data collection techniques and data analysis
Q5 · A report stated that 3 billion people cook their food using stoves that require open fires
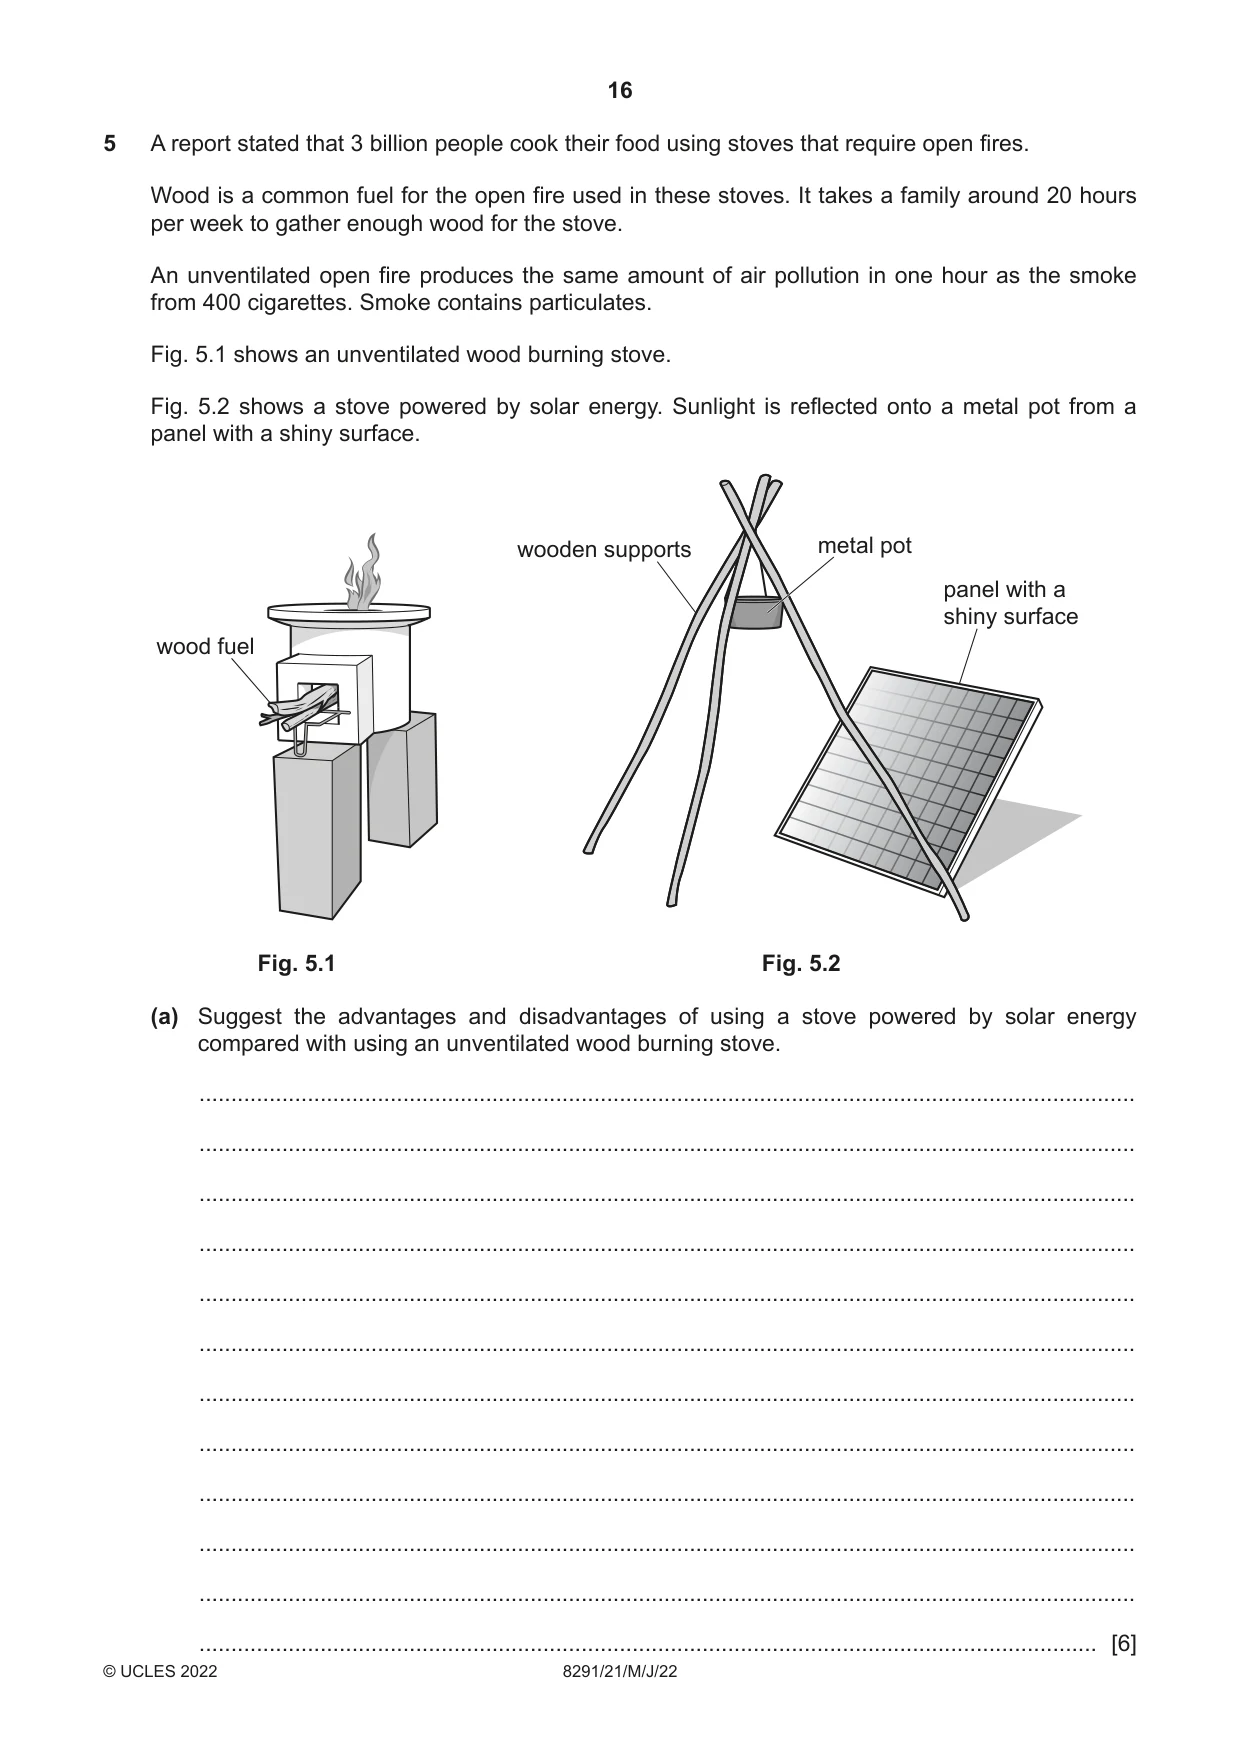
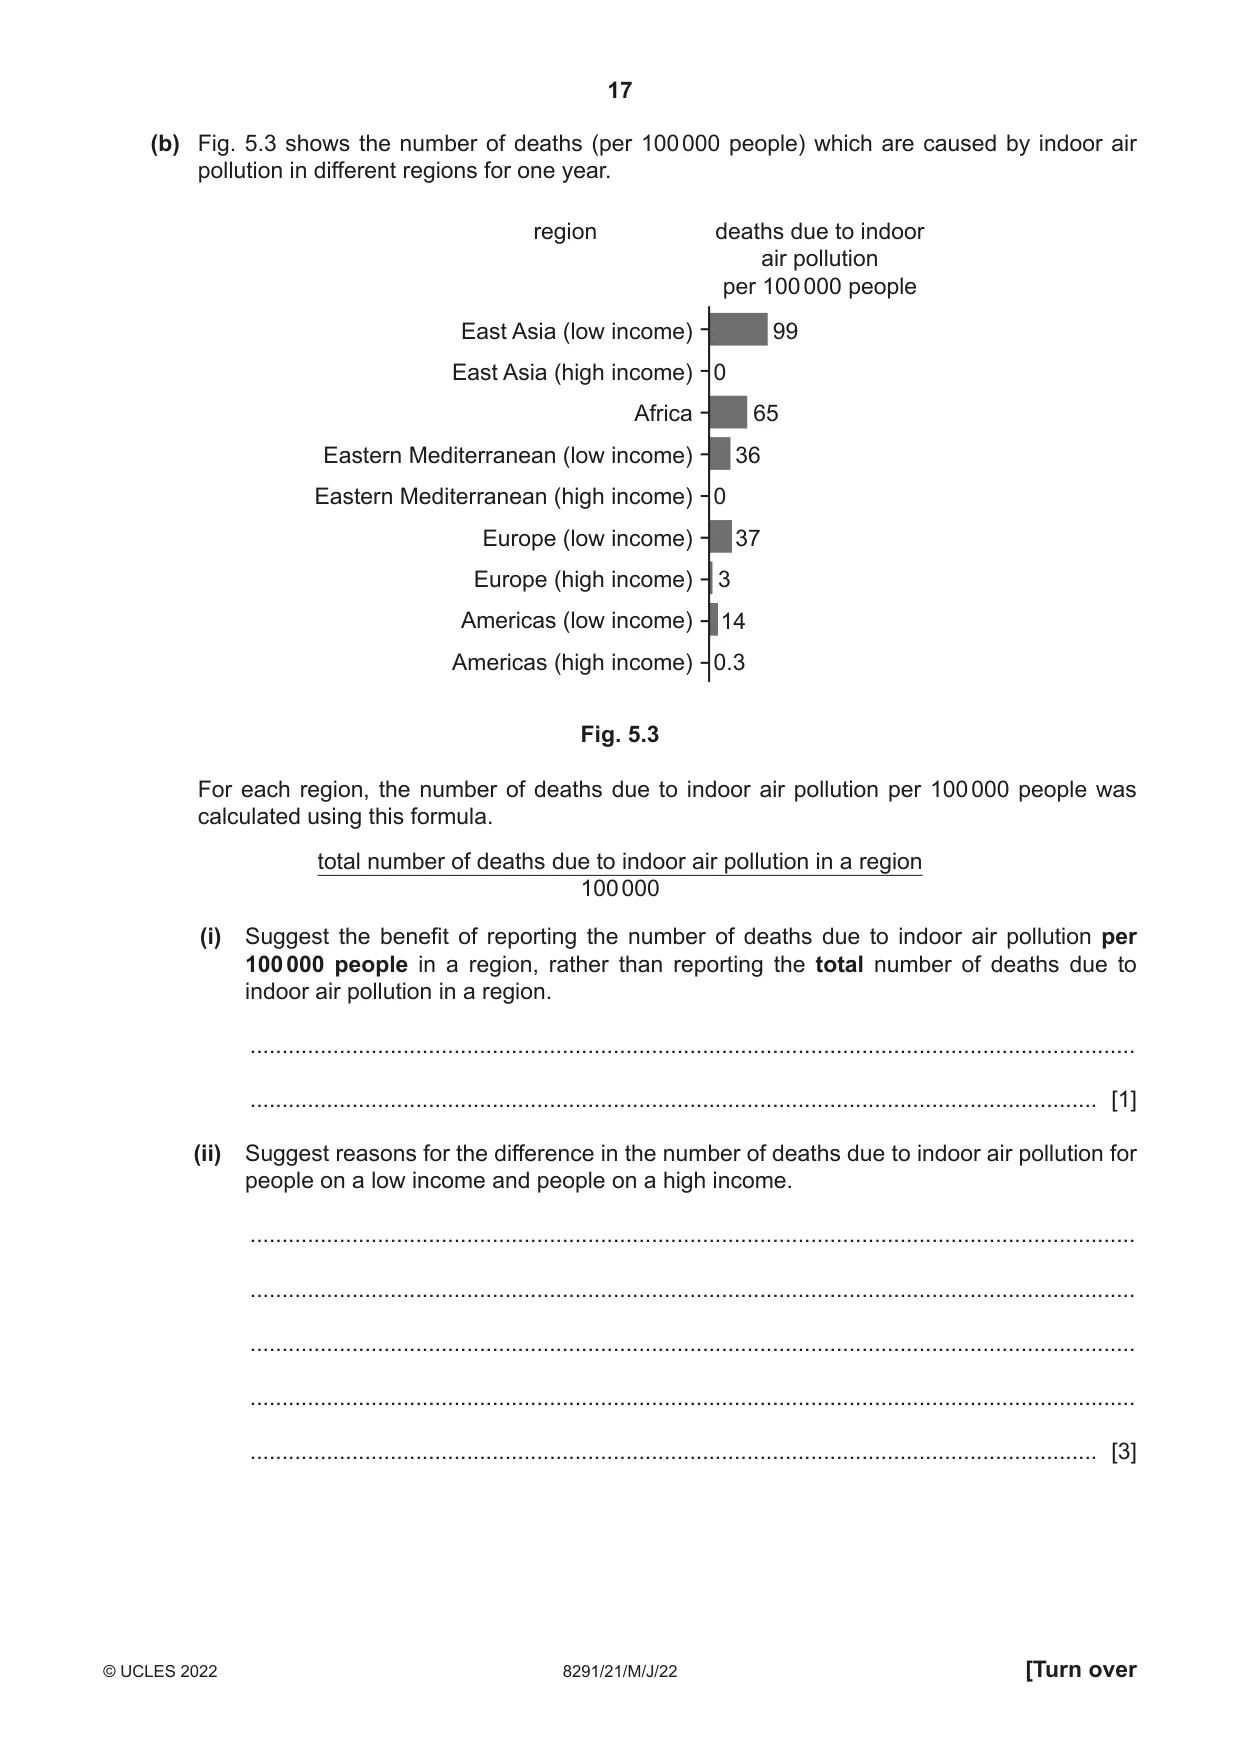
5 A report stated that 3 billion people cook their food using stoves that require open fires. Wood is a common fuel for the open fire used in these stoves. It takes a family around 20 hours per week to gather enough wood for the stove. An unventilated open fire produces the same amount of air pollution in one hour as the smoke from 400 cigarettes. Smoke contains particulates. Fig. 5.1 shows an unventilated wood burning stove. Fig. 5.2 shows a stove powered by solar energy. Sunlight is reflected onto a metal pot from a panel with a shiny surface. wooden supports metal pot panel with a shiny surface wood fuel Fig. 5.1 Fig. 5.2 (a) Suggest the advantages and disadvantages of using a stove powered by solar energy compared with using an unventilated wood burning stove. ................................................................................................................................................... ................................................................................................................................................... ................................................................................................................................................... ................................................................................................................................................... ................................................................................................................................................... ................................................................................................................................................... ................................................................................................................................................... ................................................................................................................................................... ................................................................................................................................................... ................................................................................................................................................... ................................................................................................................................................... ............................................................................................................................................. [6] (b) Fig. 5.3 shows the number of deaths (per 100 000 people) which are caused by indoor air pollution in different regions for one year. region deaths due to indoor air pollution per 100 000 people East Asia (low income) 99 East Asia (high income) 0 Africa 65 Eastern Mediterranean (low income) 36 Eastern Mediterranean (high income) 0 Europe (low income) 37 Europe (high income) 3 Americas (low income) 14 Americas (high income) 0.3 Fig. 5.3 For each region, the number of deaths due to indoor air pollution per 100 000 people was calculated using this formula. total number of deaths due to indoor air pollution in a region 100 000 (i) Suggest the benefit of reporting the number of deaths due to indoor air pollution per 100 000 people in a region, rather than reporting the total number of deaths due to indoor air pollution in a region. ........................................................................................................................................... ..................................................................................................................................... [1] (ii) Suggest reasons for the difference in the number of deaths due to indoor air pollution for people on a low income and people on a high income. ........................................................................................................................................... ........................................................................................................................................... ........................................................................................................................................... ........................................................................................................................................... ..................................................................................................................................... [3] (c) Fig. 5.4 is a blog about a strategy to manage pollution, called the polluter pays principle. The polluter pays principle states that those who produce pollution should pay for the management of preventing damage to human health and to the environment. In Switzerland, an extra cost is added to waste collection bags with pay-per-bag fees. In the United States, polluters are required to pay for clean-up of hazardous waste sites. An extra cost is added to vehicles that have a low fuel efficiency. Fig. 5.4 (i) Suggest why the polluter pays principle described in Fig. 5.4 is not always implemented. ........................................................................................................................................... ..................................................................................................................................... [1] (ii) Suggest why some people are against the polluter pays principle. ........................................................................................................................................... ........................................................................................................................................... ........................................................................................................................................... ..................................................................................................................................... [2] [Total: 13]
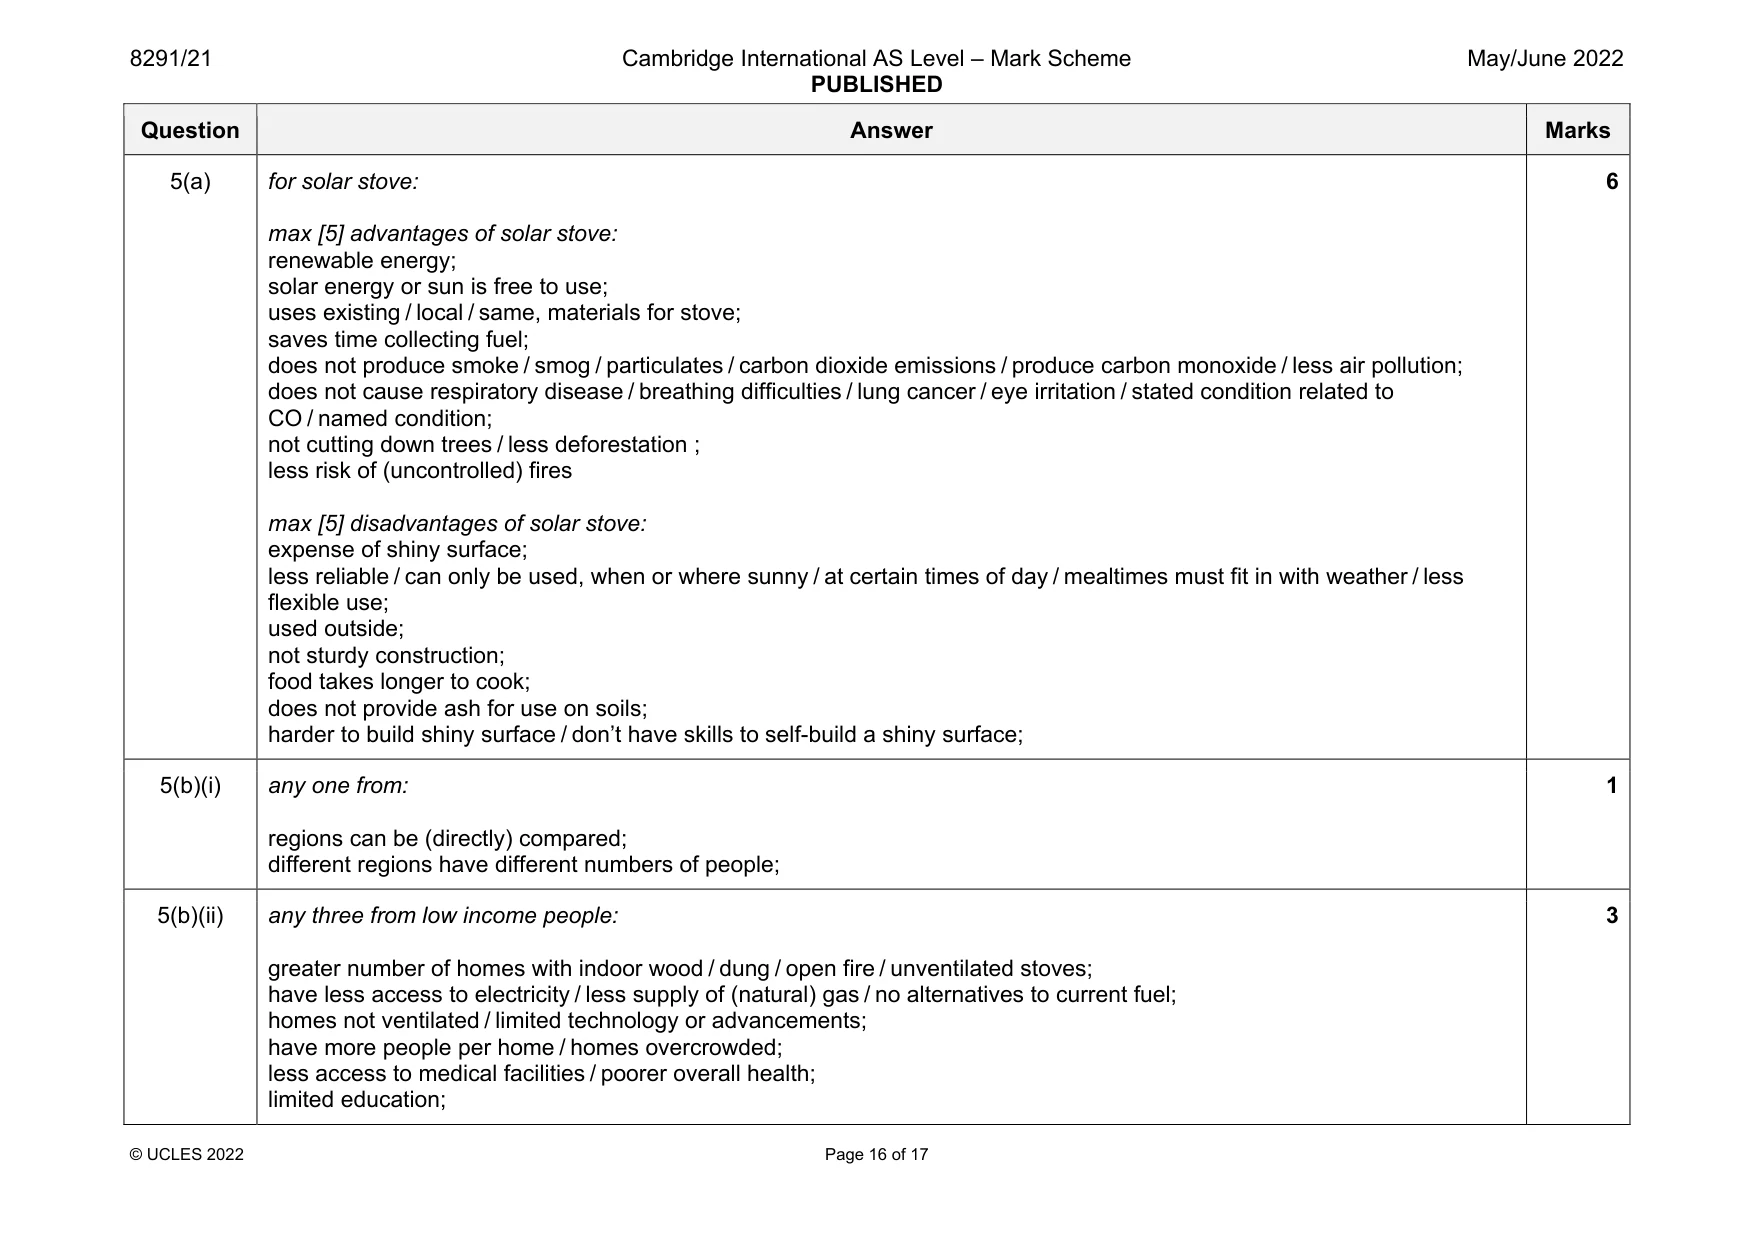
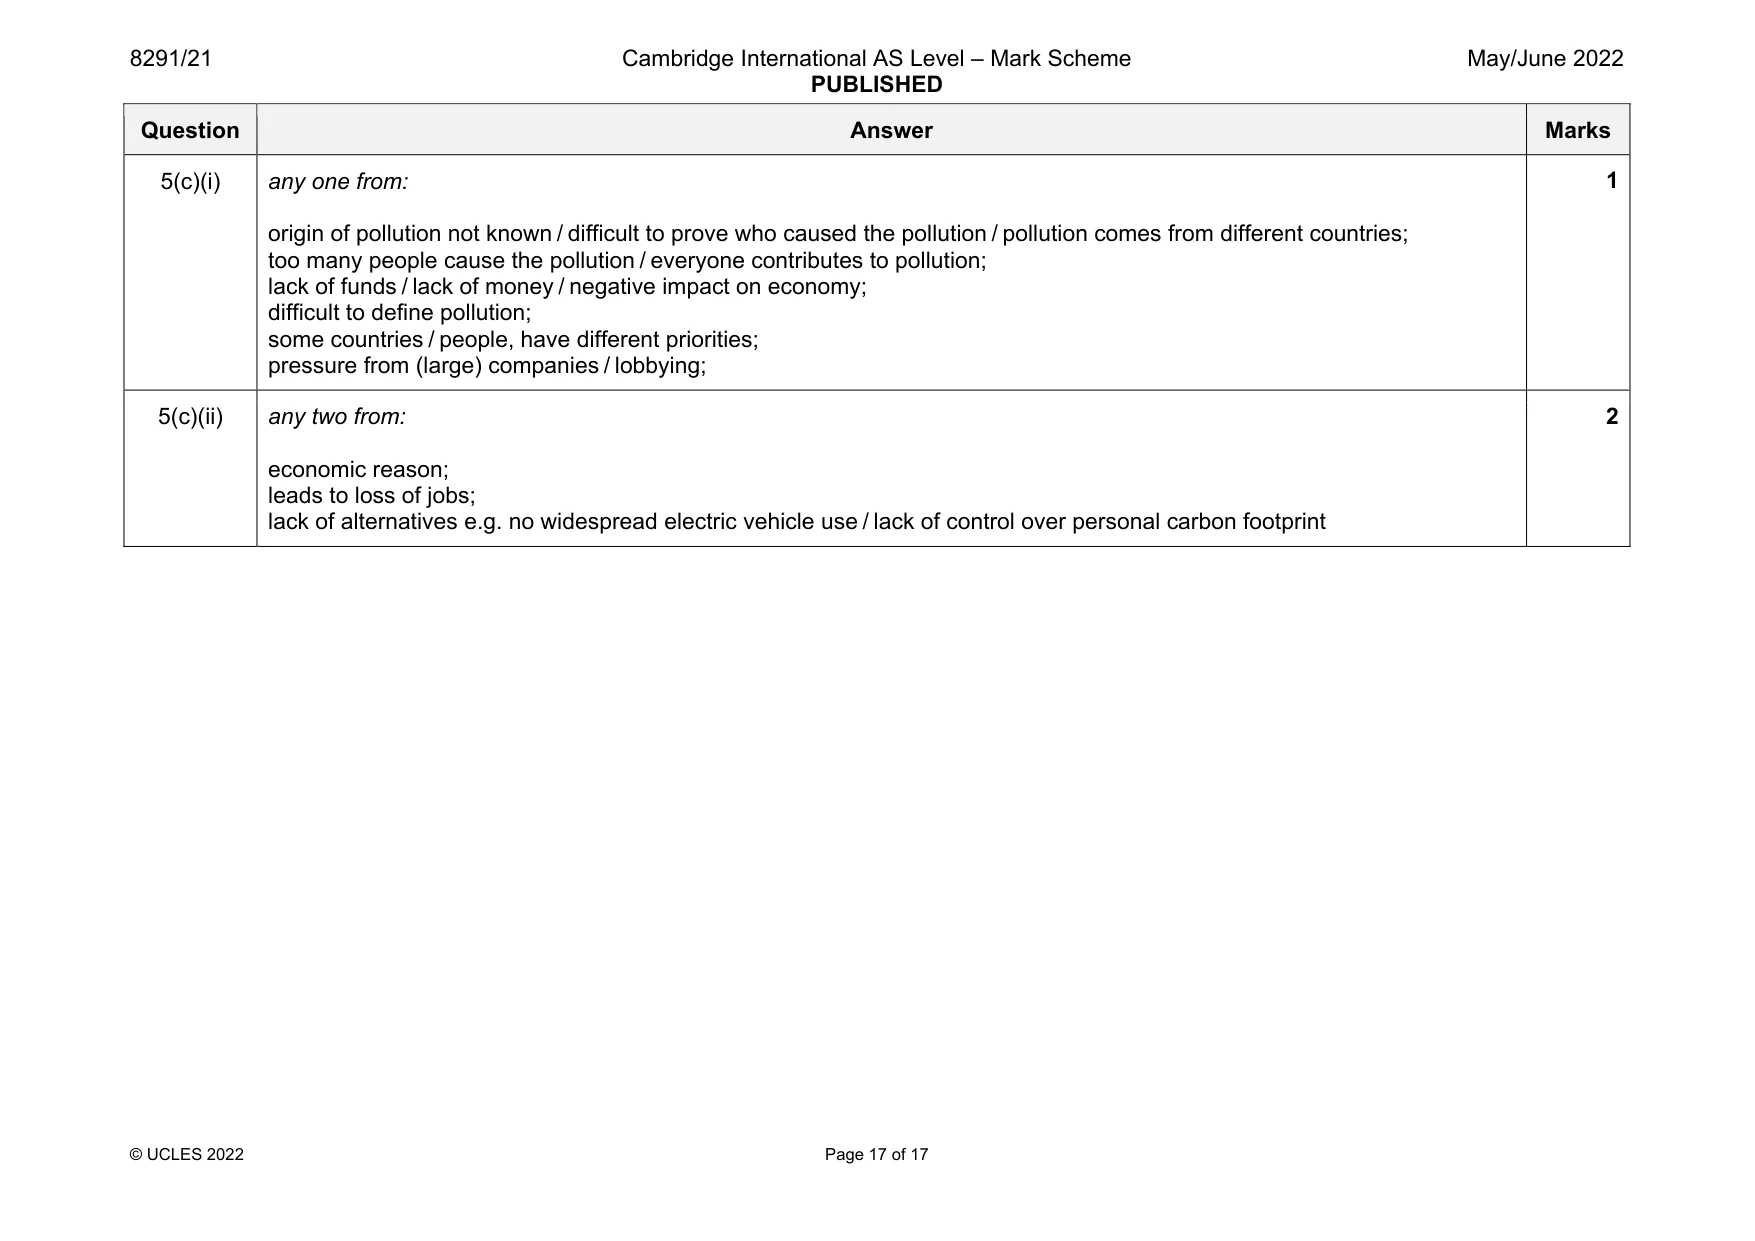
Mark scheme: 5(a) for solar stove: max [5] advantages of solar stove: renewable energy; solar energy or sun is free to use; uses existing / local / same, materials for stove; saves time collecting fuel; does not produce smoke / smog / particulates / carbon dioxide emissions / produce carbon monoxide / less air pollution; does not cause respiratory disease / breathing difficulties / lung cancer / eye irritation / stated condition related to CO / named condition; not cutting down trees / less deforestation ; less risk of (uncontrolled) fires max [5] disadvantages of solar stove: expense of shiny surface; less reliable / can only be used, when or where sunny / at certain times of day / mealtimes must fit in with weather / less flexible use; used outside; not sturdy construction; food takes longer to cook; does not provide ash for use on soils; harder to build shiny surface / don’t have skills to self-build a shiny surface; 6 5(b)(i) any one from: regions can be (directly) compared; different regions have different numbers of people; 1 5(b)(ii) any three from low income people: greater number of homes with indoor wood / dung / open fire / unventilated stoves; have less access to electricity / less supply of (natural) gas / no alternatives to current fuel; homes not ventilated / limited technology or advancements; have more people per home / homes overcrowded; less access to medical facilities / poorer overall health; limited education; 3 Question Answer Marks 5(c)(i) any one from: origin of pollution not known / difficult to prove who caused the pollution / pollution comes from different countries; too many people cause the pollution / everyone contributes to pollution; lack of funds / lack of money / negative impact on economy; difficult to define pollution; some countries / people, have different priorities; pressure from (large) companies / lobbying; 1 5(c)(ii) any two from: economic reason; leads to loss of jobs; lack of alternatives e.g. no widespread electric vehicle use / lack of control over personal carbon footprint 2
What was in this paper
The subtopics covered by these 5 questions, and how many questions each got. Open one in a new tab to see every Cambridge question on it.
What you needed in this session
Cambridge’s own grade thresholds for 2022 May/June, Paper 2 · Variant 1. A higher threshold means an easier paper — the bar moves with how the cohort did.