Questions as text
Q1 · Trends in global water use by sector 8291/21 May/June 2017
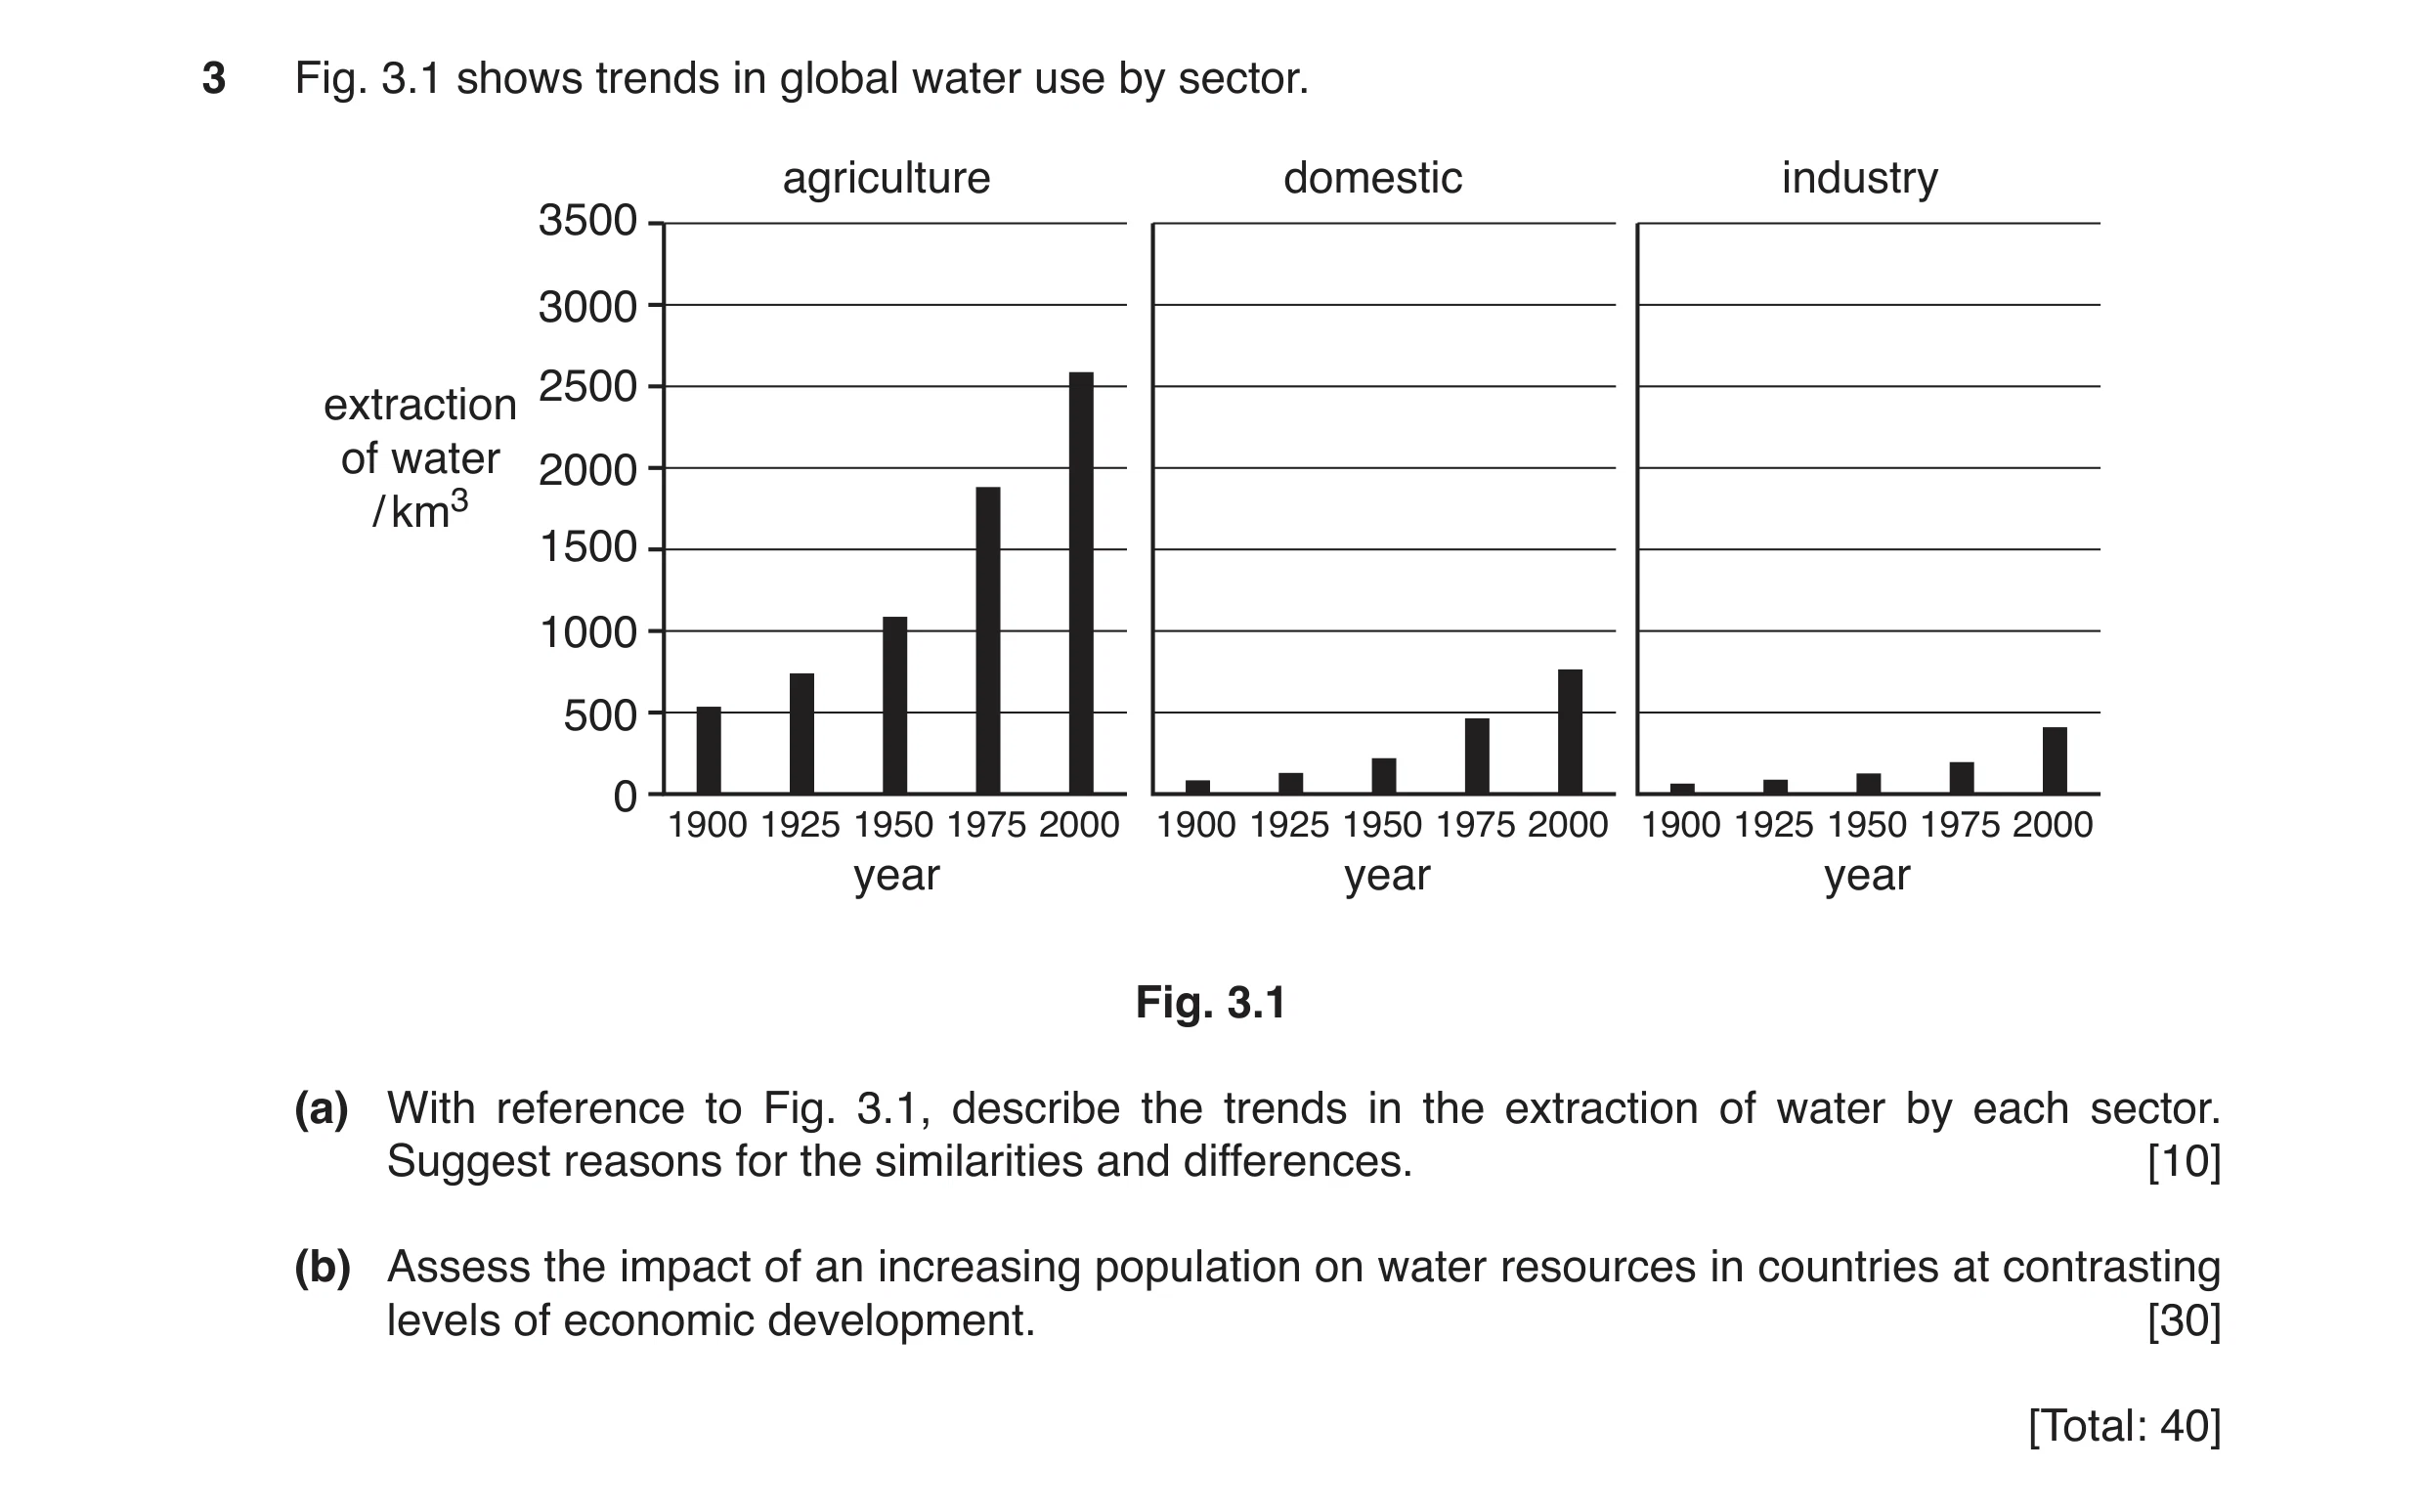
3 Fig. 3.1 shows trends in global water use by sector. agriculture domestic industry 3500 3000 2500 extraction of water 2000 / km3 1500 1000 500 0 1900 1925 1950 1975 2000 1900 1925 1950 1975 2000 1900 1925 1950 1975 2000 year year year Fig. 3.1 (a) With reference to Fig. 3.1, describe the trends in the extraction of water by each sector. Suggest reasons for the similarities and differences. [10] (b) Assess the impact of an increasing population on water resources in countries at contrasting levels of economic development. [30] [Total: 40]
40 marks
Mark scheme: 3(a) similarities: In all sectors extractions have increased and increased at a faster rate as the years go by. For example, between 1900 and 2000 extractions for agriculture have increased by approx. 2000 cubic kilometres, industry by approx. 300 cubic kilometres and domestic by approx. 625 cubic kilometres. An accelerating rate of increase is shown, for example, in agriculture by comparing an increase of approx. 500 cubic kilometres between 1900 and 1950 in a 50-year period, with approx. 600 cubic kilometres between 1975 and 2000, i.e. in only 25 years. More intensive exploitation of water in all sectors is due to increasing population size and increasing demands in all sectors, e.g. improved sanitation. differences: Extraction of water is greater in the agricultural sector and the largest increase occurred 1950–1975. More water is consumed in the agricultural sector with large volumes of fresh water used in irrigation. Increased agricultural output requires more intensive farming, often with increased irrigation requirements. In the domestic sector less water is used than in agriculture and the largest increase occurred 1975–2000. In the domestic sector waste water can be treated, recycled and reused so less is extracted. Overall industry consumes less water than other sectors. The largest increase occurred 1975–2000, e.g. with an increasing demand in newly industrialised countries. Please use level descriptors 1 10 Question Answer Marks 3(b) The question requirements are: • to use examples of countries at contrasting levels of economic development • to consider the impact of increasing population on water resources. Indicative content: A shortage of fresh water will be a global crisis as population continues to increase with no increase in freshwater supplies. An increasing population will continue to increase demand for water resources in all sectors. For example, less productive land will need to be cultivated to increase food production and will require even more water for irrigation. The impact of an increasing population on both the quantity and quality of water resources should be considered. A reduction in the quantity of freshwater resources available may result from increased withdrawals of groundwater, leading to diminishing supplies and the depletion of aquifers. Pollution originating from agricultural, domestic and industrial sources will reduce the quality of freshwater resources. Countries at contrasting levels of economic development should be compared in terms of the availability of water resources, the use of resources and increasing demands. Please use level descriptors 2 30
This question in 8291/21 May/June 2017
Q2 · A model showing the relationship between death rate, birth rate, population size and… 8291/22 May/June 2017
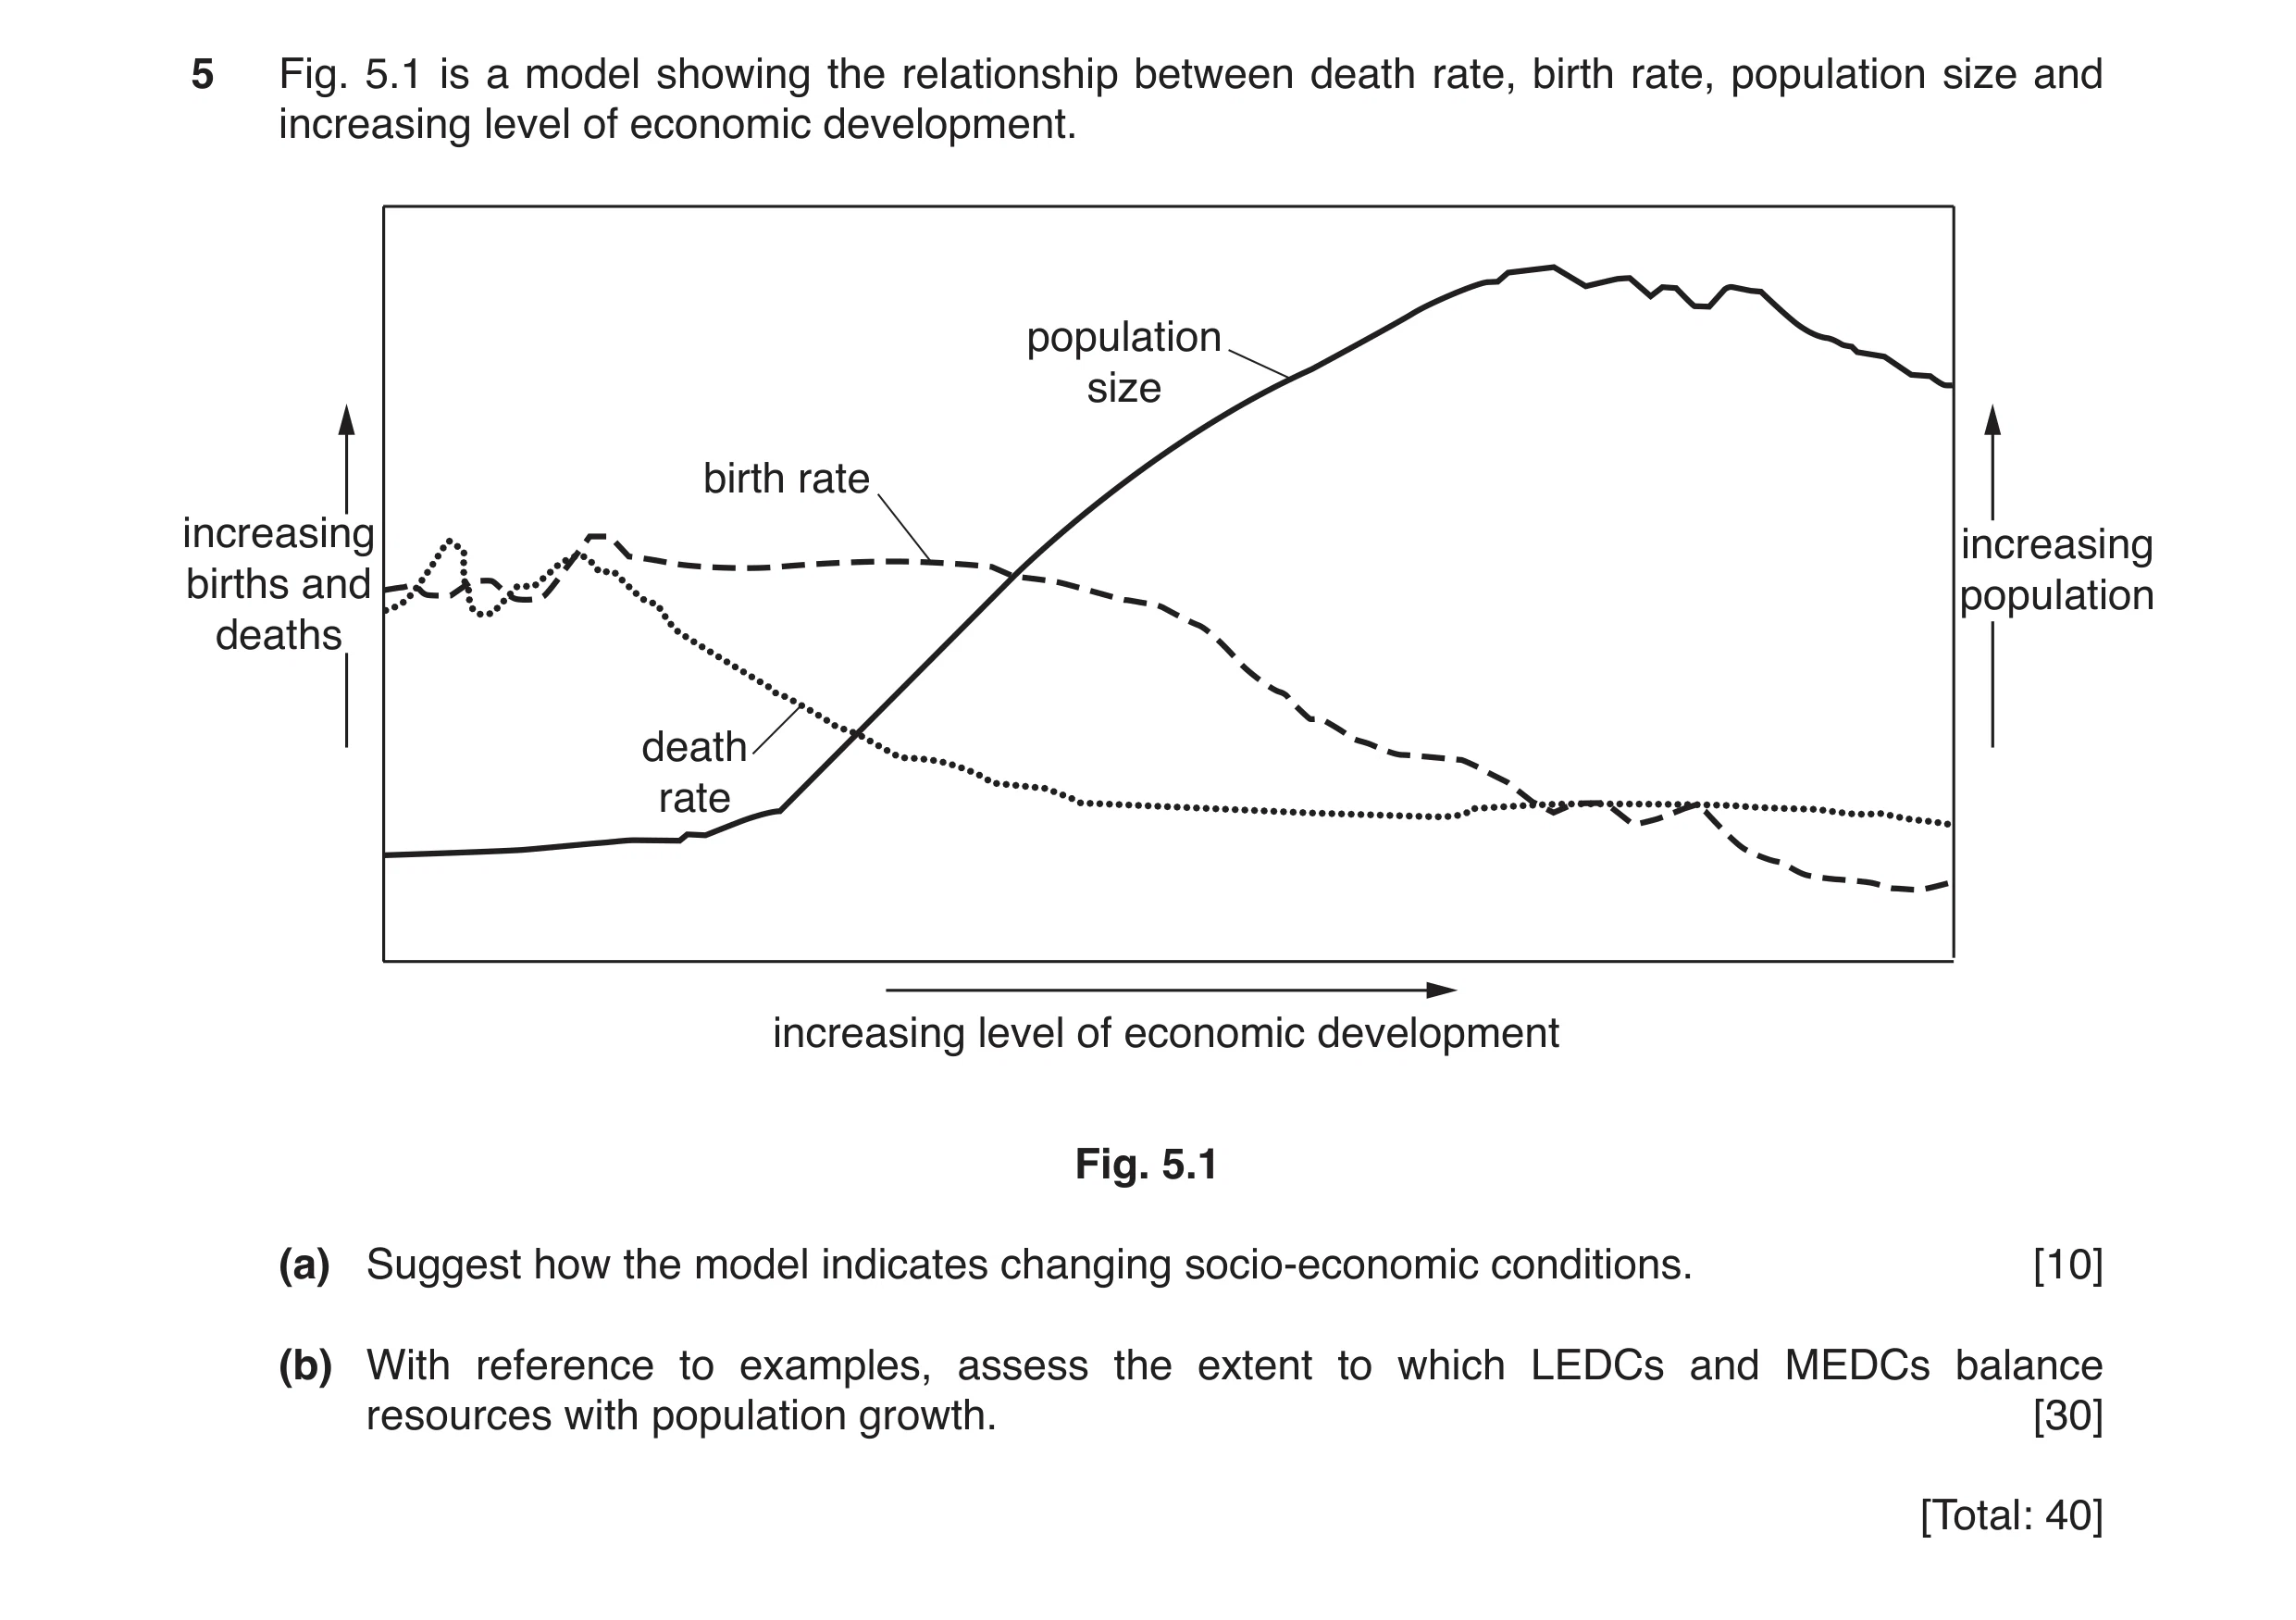
5 Fig. 5.1 is a model showing the relationship between death rate, birth rate, population size and increasing level of economic development. population size birth rate increasing increasing births and population deaths death rate increasing level of economic development Fig. 5.1 (a) Suggest how the model indicates changing socio-economic conditions. [10] (b) With reference to examples, assess the extent to which LEDCs and MEDCs balance resources with population growth. [30] [Total: 40]
40 marks
Mark scheme: 5(a) Initially birth rate and death rate are both high and the birth rate is approximately equal to death rate. The population grows slowly and remains low due to high infant mortality and low life expectancy. With increasing economic development and an improvement in medicine and health facilities, the death rate falls and birth rate remains high. With lower infant mortality and increased life expectancy, the population increases exponentially and birth rate is greater than death rate. With continuing economic development, with improvements in education, employment, career opportunities and availability of family planning, the birth rate starts to fall. The death rate remains stable and low and the population size begins to stabilise. Birth rate and death rate are approximately equal. With more economic development a declining population occurs when the birth rate continues to fall, the death rate remains low. Please use level descriptors 1 10 Question Answer Marks 5(b) The question requirements are: • to use examples from both MEDCs and LEDCs • to consider the balance between population and resources • to assess the extent to which there is balance between resources and population growth in countries at different levels of economic development. Indicative content: Countries where resources are balanced with population size have optimum populations. In these countries a balance between resources and population is maintained by preventing or restricting growth of the population through population control measures, for example, migration. Or through the sustainable use of resources such as better rain-fed agriculture and irrigation management, agro-ecological farming and reducing material use per unit of output. Alternatively, by an increase in the provision of resources through improved technology, including more productive farming methods, for example, genetic engineering to produce higher yielding crops or drought-resistant crops. Countries where resources are not balanced with population size may be overpopulated or underpopulated. Overpopulated countries where there is an increase in the demand for food, energy and raw materials are unsustainable. An increased population would increase the pressure to farm more intensively and cultivate poorer land leading to poorer yields. Overcultivation of arable land will result in soil erosion, degrading soil fertility and crop failures reducing food supply may result. Other countries are underpopulated where there is underutilisation of resources for the population. Please use level descriptors 2 30 Section B descriptor levels: Descriptor Award Mark Consistently meets the level criteria Mark at top of level Meets the criteria, but with some inconsistency Middle, mark to just below top mark Meets most of level criteria, but not all convincingly Just below middle, mark to just above bottom mark On the borderline of this level and the one below Mark at bottom of level level descriptors 1 Level one, 8–10 marks The response: • contains few errors • shows a very good understanding of the question • shows a good use of data or the information provided, where appropriate • provides a balanced answer Level two, 5–7 marks The response: • may contain some errors • shows an adequate understanding of the question • shows some use of data or the information provided, where appropriate • may lack balance Level three, 1–4 marks The response: • may contain errors • shows limited understanding of the question • shows little or no use of data or the information, where appropriate • lacks balance Section B descriptor levels: level descriptors 2 Responses: Level one, 25–30 marks • fulfil all the requirements of the question • contain a very good understanding of the content required • contain a very good balance of content • contain substantial critical and supportive evaluations • make accurate use of relevant vocabulary Level two, 19–24 marks • fulfil most of the requirements of the question • contain a good understanding of the content required • contain a good balance of content • contain some critical and supportive evaluations • make good use of relevant vocabulary Level three, 13–18 marks • fulfil some requirements of the question • contain some understanding of the content required • may contain some limited balance of content • may contain brief evaluations • make some use of relevant vocabulary Level four, 6–12 marks • fulfil limited requirements of the question • contain limited understanding of the content required • may contain poor balanced of content • may not contain evaluations • make limited use of relevant vocabulary Section B descriptor levels: Level five, 1–5 marks • fulfil a few requirements of the question • contain a very limited understanding of the content required • are likely to be unbalanced and undeveloped • evaluative statements are likely to be missing • make no use of relevant vocabulary
This question in 8291/22 May/June 2017
Q3 · A model showing the relationship between death rate, birth rate, population size and… 8291/23 May/June 2017
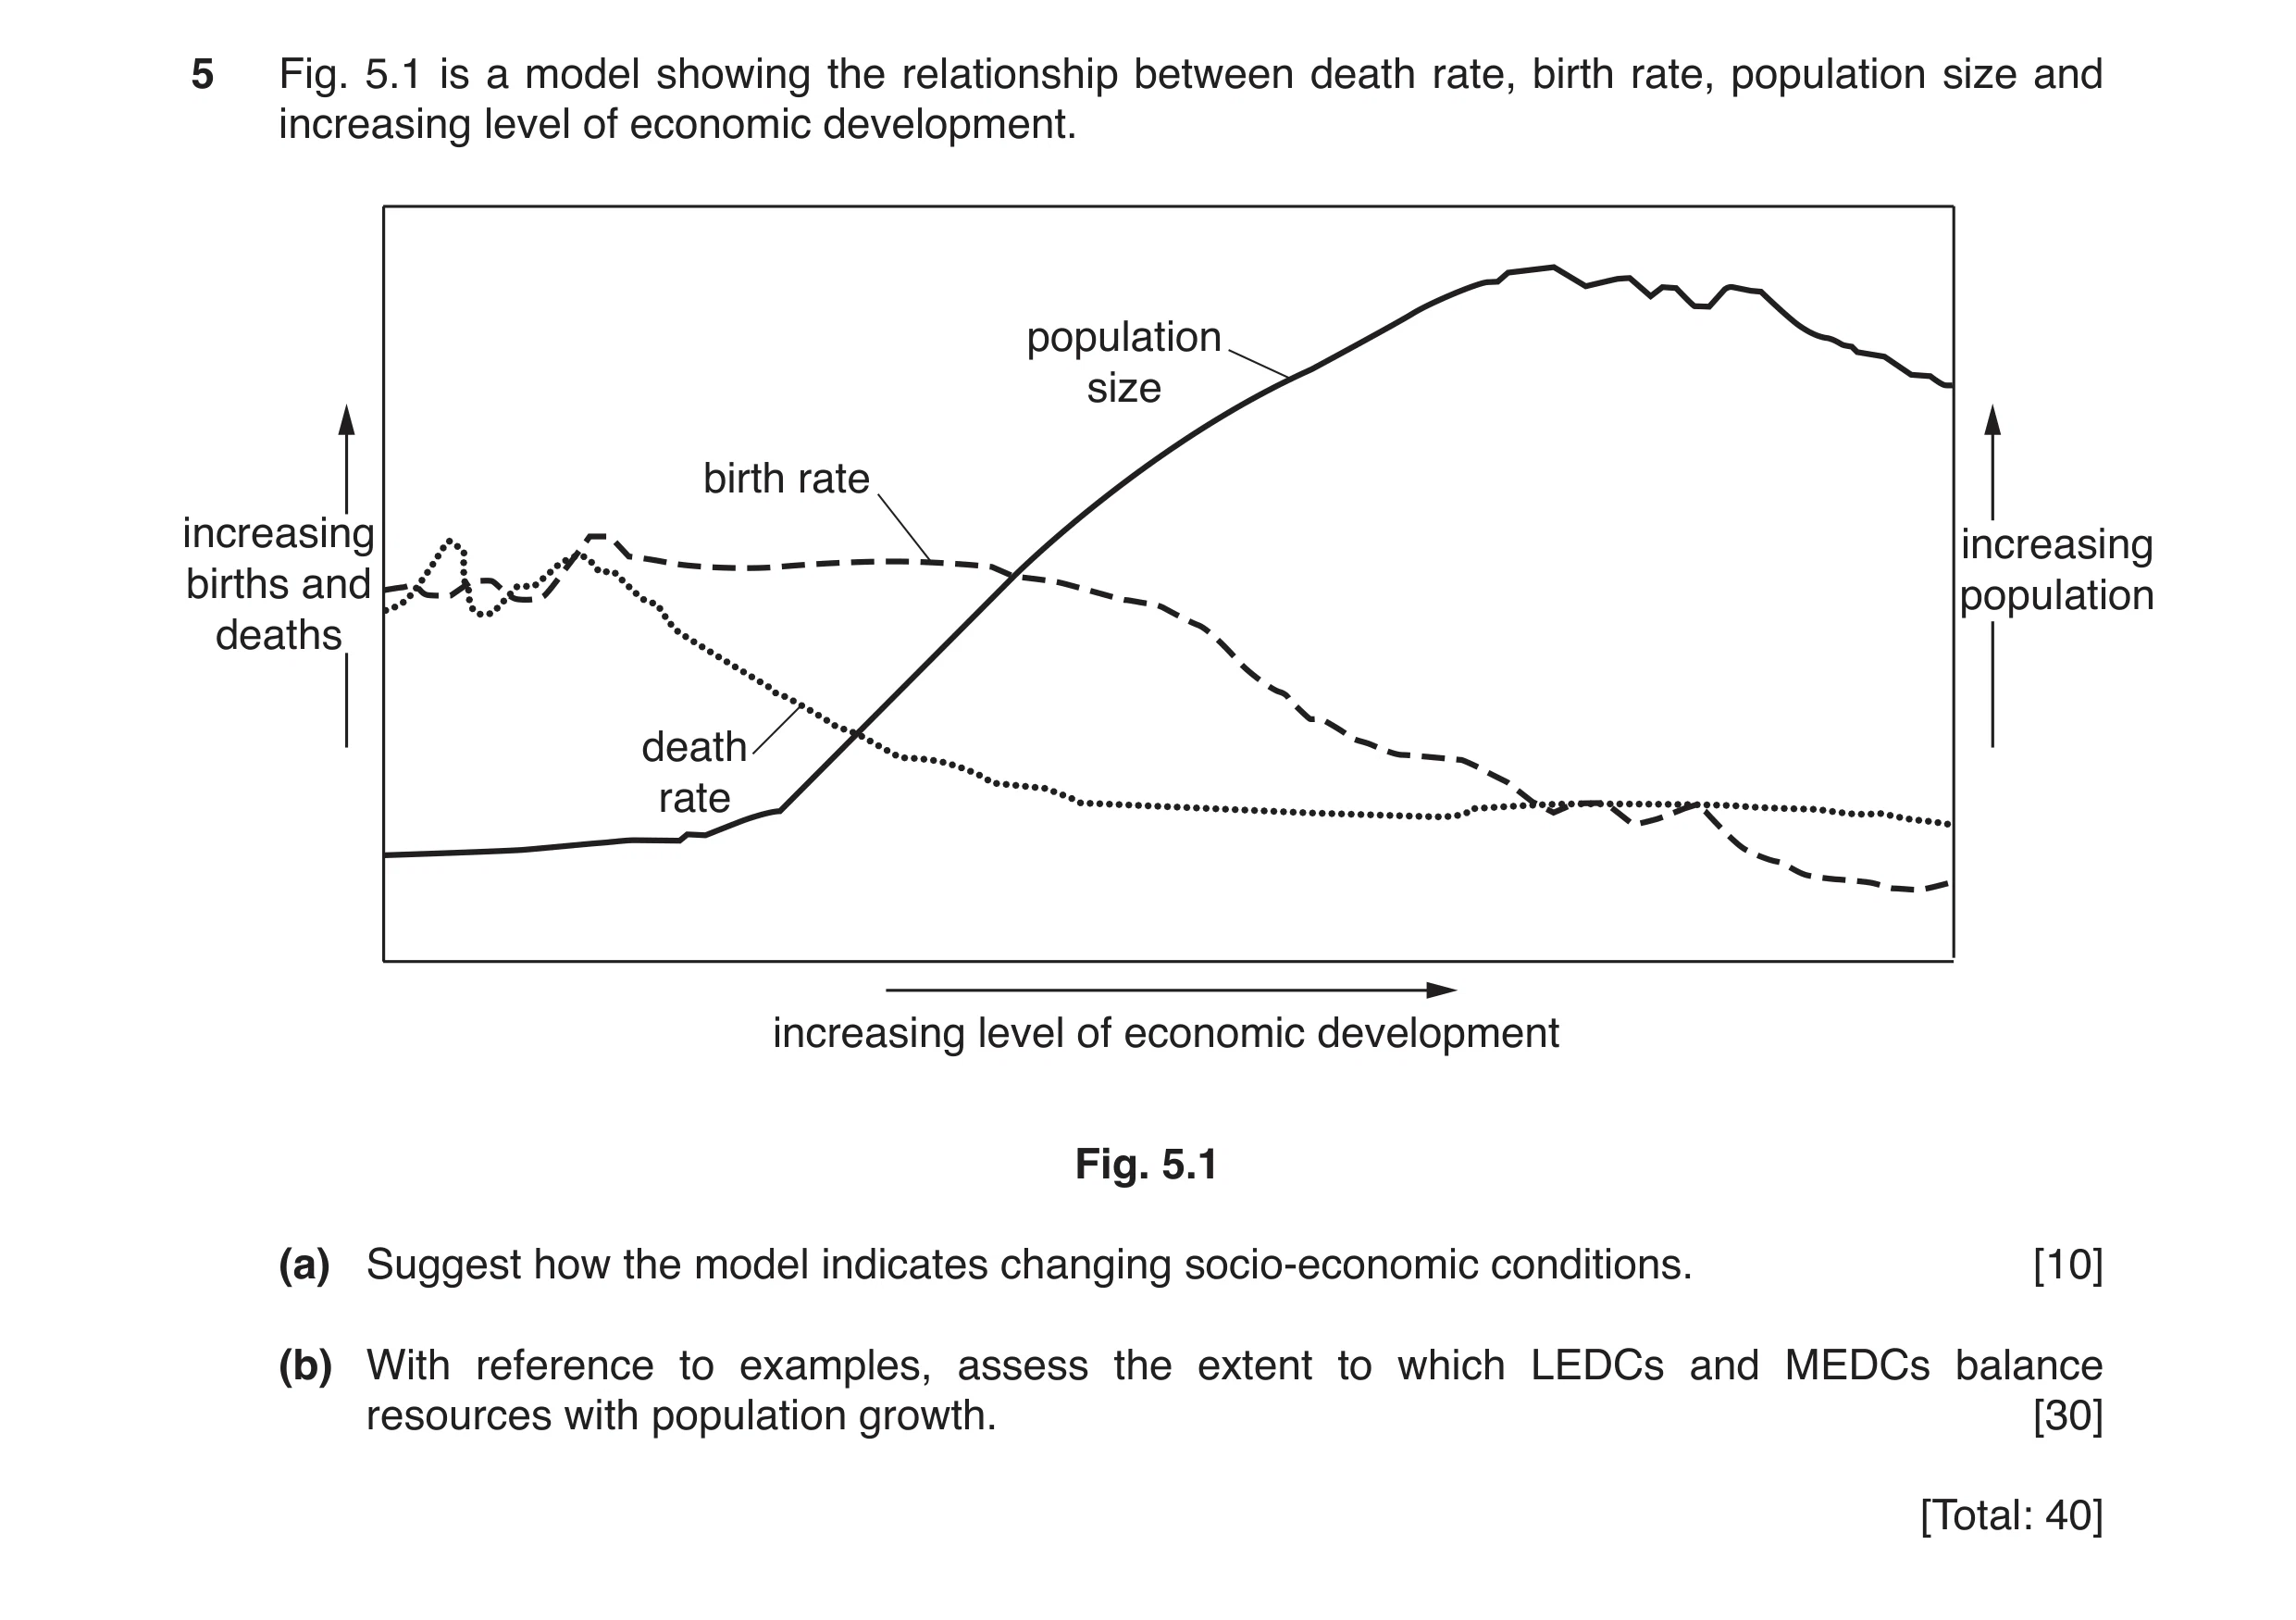
5 Fig. 5.1 is a model showing the relationship between death rate, birth rate, population size and increasing level of economic development. population size birth rate increasing increasing births and population deaths death rate increasing level of economic development Fig. 5.1 (a) Suggest how the model indicates changing socio-economic conditions. [10] (b) With reference to examples, assess the extent to which LEDCs and MEDCs balance resources with population growth. [30] [Total: 40]
40 marks
Mark scheme: 5(a) Initially birth rate and death rate are both high and the birth rate is approximately equal to death rate. The population grows slowly and remains low due to high infant mortality and low life expectancy. With increasing economic development and an improvement in medicine and health facilities, the death rate falls and birth rate remains high. With lower infant mortality and increased life expectancy, the population increases exponentially and birth rate is greater than death rate. With continuing economic development, with improvements in education, employment, career opportunities and availability of family planning, the birth rate starts to fall. The death rate remains stable and low and the population size begins to stabilise. Birth rate and death rate are approximately equal. With more economic development a declining population occurs when the birth rate continues to fall, the death rate remains low. Please use level descriptors 1 10 Question Answer Marks 5(b) The question requirements are: • to use examples from both MEDCs and LEDCs • to consider the balance between population and resources • to assess the extent to which there is balance between resources and population growth in countries at different levels of economic development. Indicative content: Countries where resources are balanced with population size have optimum populations. In these countries a balance between resources and population is maintained by preventing or restricting growth of the population through population control measures, for example, migration. Or through the sustainable use of resources such as better rain-fed agriculture and irrigation management, agro-ecological farming and reducing material use per unit of output. Alternatively, by an increase in the provision of resources through improved technology, including more productive farming methods, for example, genetic engineering to produce higher yielding crops or drought-resistant crops. Countries where resources are not balanced with population size may be overpopulated or underpopulated. Overpopulated countries where there is an increase in the demand for food, energy and raw materials are unsustainable. An increased population would increase the pressure to farm more intensively and cultivate poorer land leading to poorer yields. Overcultivation of arable land will result in soil erosion, degrading soil fertility and crop failures reducing food supply may result. Other countries are underpopulated where there is underutilisation of resources for the population. Please use level descriptors 2 30 Section B descriptor levels: Descriptor Award Mark Consistently meets the level criteria Mark at top of level Meets the criteria, but with some inconsistency Middle, mark to just below top mark Meets most of level criteria, but not all convincingly Just below middle, mark to just above bottom mark On the borderline of this level and the one below Mark at bottom of level level descriptors 1 Level one, 8–10 marks The response: • contains few errors • shows a very good understanding of the question • shows a good use of data or the information provided, where appropriate • provides a balanced answer Level two, 5–7 marks The response: • may contain some errors • shows an adequate understanding of the question • shows some use of data or the information provided, where appropriate • may lack balance Level three, 1–4 marks The response: • may contain errors • shows limited understanding of the question • shows little or no use of data or the information, where appropriate • lacks balance Section B descriptor levels: level descriptors 2 Responses: Level one, 25–30 marks • fulfil all the requirements of the question • contain a very good understanding of the content required • contain a very good balance of content • contain substantial critical and supportive evaluations • make accurate use of relevant vocabulary Level two, 19–24 marks • fulfil most of the requirements of the question • contain a good understanding of the content required • contain a good balance of content • contain some critical and supportive evaluations • make good use of relevant vocabulary Level three, 13–18 marks • fulfil some requirements of the question • contain some understanding of the content required • may contain some limited balance of content • may contain brief evaluations • make some use of relevant vocabulary Level four, 6–12 marks • fulfil limited requirements of the question • contain limited understanding of the content required • may contain poor balanced of content • may not contain evaluations • make limited use of relevant vocabulary Section B descriptor levels: Level five, 1–5 marks • fulfil a few requirements of the question • contain a very limited understanding of the content required • are likely to be unbalanced and undeveloped • evaluative statements are likely to be missing • make no use of relevant vocabulary
This question in 8291/23 May/June 2017
Q4 · The total global population and its percentage annual growth rate, from 1900 to 2015 8291/21 May/June 2018
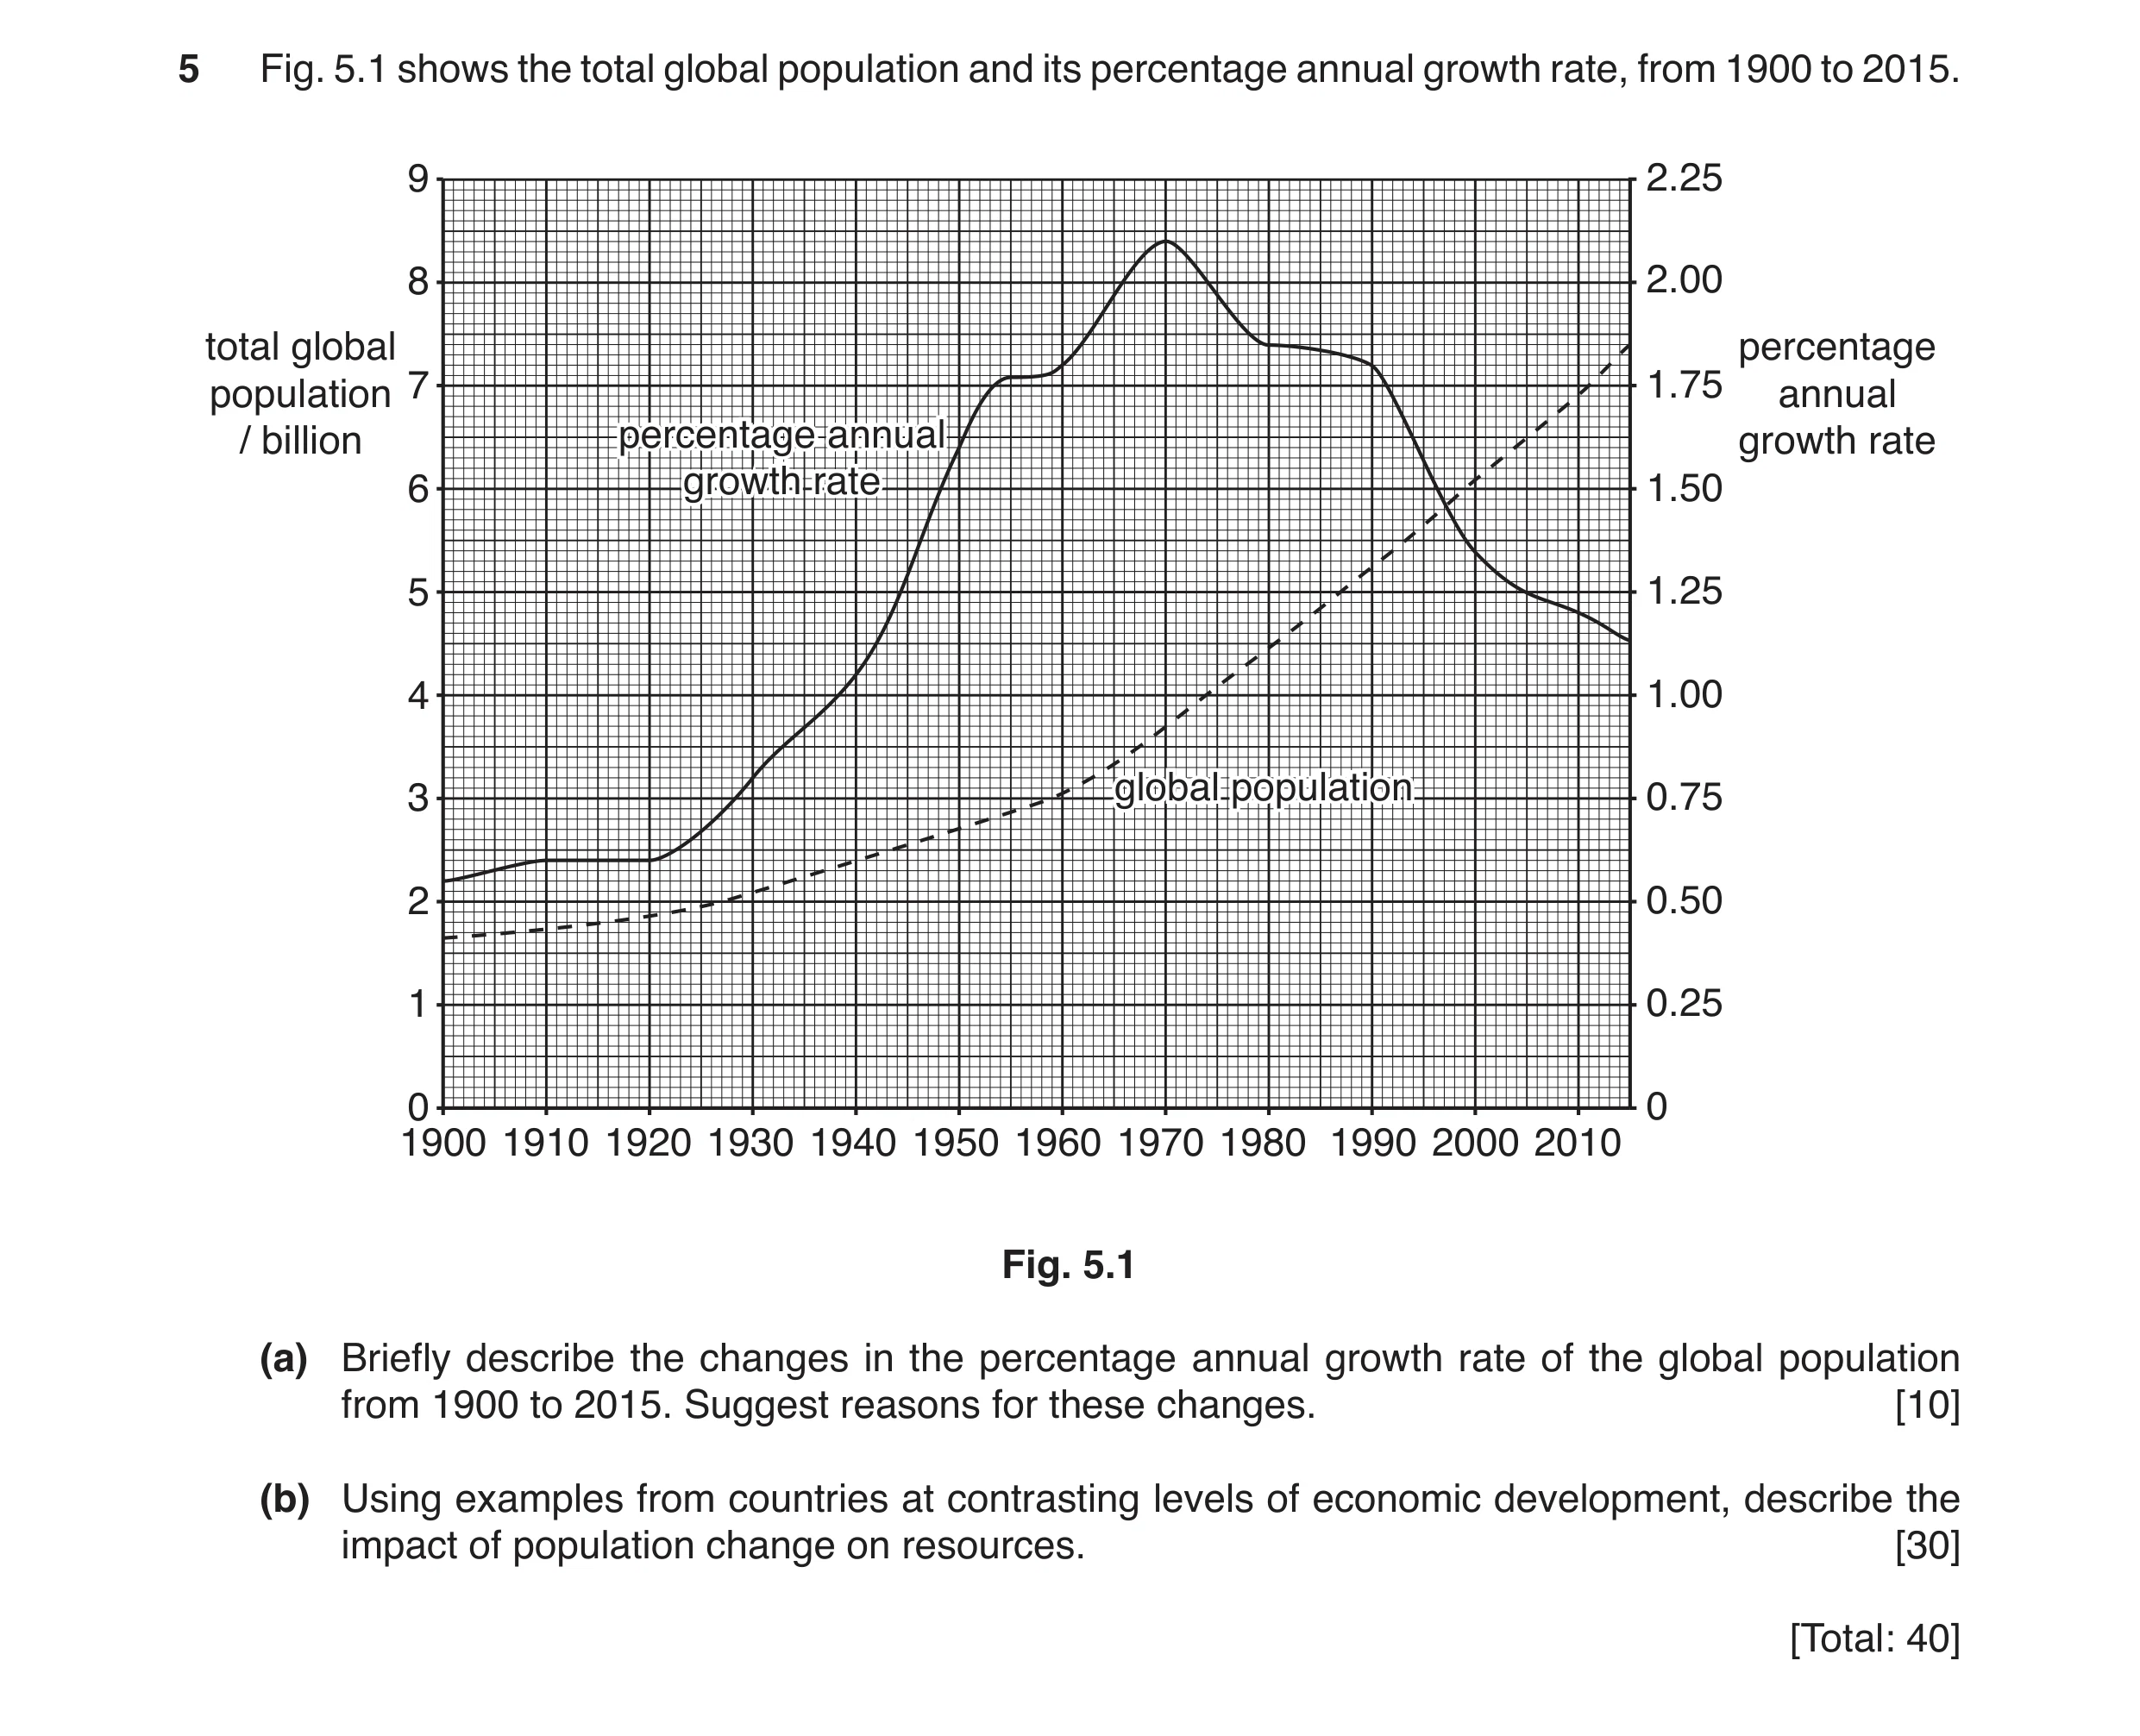
5 Fig. 5.1 shows the total global population and its percentage annual growth rate, from 1900 to 2015. 9 2.25 8 2.00 total global percentage population 7 1.75 annual / billion percentagepercentage annualannual growth rate 6 growthgrowth raterate 1.50 5 1.25 4 1.00 3 globalglobal populationpopulation 0.75 2 0.50 1 0.25 0 0 1900 1910 1920 1930 1940 1950 1960 1970 1980 1990 2000 2010 Fig. 5.1 (a) Briefly describe the changes in the percentage annual growth rate of the global population from 1900 to 2015. Suggest reasons for these changes. [10] (b) Using examples from countries at contrasting levels of economic development, describe the impact of population change on resources. [30] [Total: 40]
40 marks
Mark scheme: 5(a) Changes in the percentage annual growth rate of the global population should be described with reference to an overall increase between 1920 and 1970 and an overall decrease between 1970 and 2015. Variation in the overall rates of increase and decrease during these periods should be considered. Increasing percentage annual growth rate can be attributed to reasons such as increased birth rates, a reduction in the rate of infant mortality, medical improvements and incentives to have larger families. Slower periods of growth rate at can be attributed to significant periods of war, disease or famine. Reasons for a decreasing percentage annual global growth rate can include reference to family planning, the increased use of contraceptives, and population policies. Continuing decreasing growth rate can be linked to economic and social development. Please use level descriptors 1 10 Question Answer Marks 5(b) The question requirements are: • to use contrasting examples • to describe the impact of population change on resources Indicative content: An answer may consider issues arising from an increasing global population, with overpopulation negatively impacting on global resources. Demand for food is expected to continue to grow due to the rising global population. Increased crop and meat production and increasingly more biofuels will be required. This will increase pressure on land resources. Expansion of farmland into areas less suitable for agriculture will require greater use of irrigation and fertilisers. More irrigation will impact on the quantity of water; the use of fertilisers will result in more water pollution. More and more of the natural environment will be used and destroyed e.g. deforestation of the tropical rainforest for agriculture will result in soil degradation. A growing population will also require land for housing and industry as well as agriculture. Alternatively a decreasing percentage annual growth rate of the global population may eventually lead to equilibrium and optimum population size. A fairer distribution of resources, the sustainable use of resources and protection of resources with less impact upon global resources. Please use level descriptors 2 30 Question Answer Marks Section B descriptor levels: Descriptor Award Mark Consistently meets the level criteria Mark at top of level Meets the criteria, but with some inconsistency Middle, mark to just below top mark Meets most of level criteria, but not all convincingly Just below middle, mark to just above bottom mark On the borderline of this level and the one below Mark at bottom of level Section B (part a), Level descriptors 1 8–10 marks The response: • contains few errors • shows a very good understanding of the question • shows a good use of data or the information provided, where appropriate • provides a balanced answer 5–7 marks The response: • may contain some errors • shows an adequate understanding of the question • shows some use of data or the information provided, where appropriate • may lack balance Question Answer Marks 1–4 marks The response: • may contains errors • shows limited understanding of the question • shows little or no use of data or the information, where appropriate • lacks balance Section B (part b): Level descriptors 2 Responses: Level one, 25–30 marks • fulfil all the requirements of the question • contain a very good understanding of the content required • contain a very good balance of content • contain substantial critical and supportive evaluations • make accurate use of relevant vocabulary Level two, 19–24 marks • fulfil most of the requirements of the question • contain a good understanding of the content required • contain a good balance of content • contain some critical and supportive evaluations • make good use of relevant vocabulary Level three, 13–18 marks • fulfil some requirements of the question • contain some understanding of the content required • may contain some limited balance of content • may contain brief evaluations • make some use of relevant vocabulary Question Answer Marks Level four, 6–12 marks • fulfil limited requirements of the question • contain limited understanding of the content required • may contain poor balance of content • may not contain evaluations • make limited use of relevant vocabulary Level five, 1–5 marks • fulfil a few of the requirements of the question • contain a very limited understanding of the content required • are likely to be unbalanced and undeveloped • evaluative statements are likely to be missing • make no use of relevant vocabulary
This question in 8291/21 May/June 2018
Q5 · The water demands of different groups of countries for the year 2000 and the predicted… 8291/22 Oct/Nov 2018
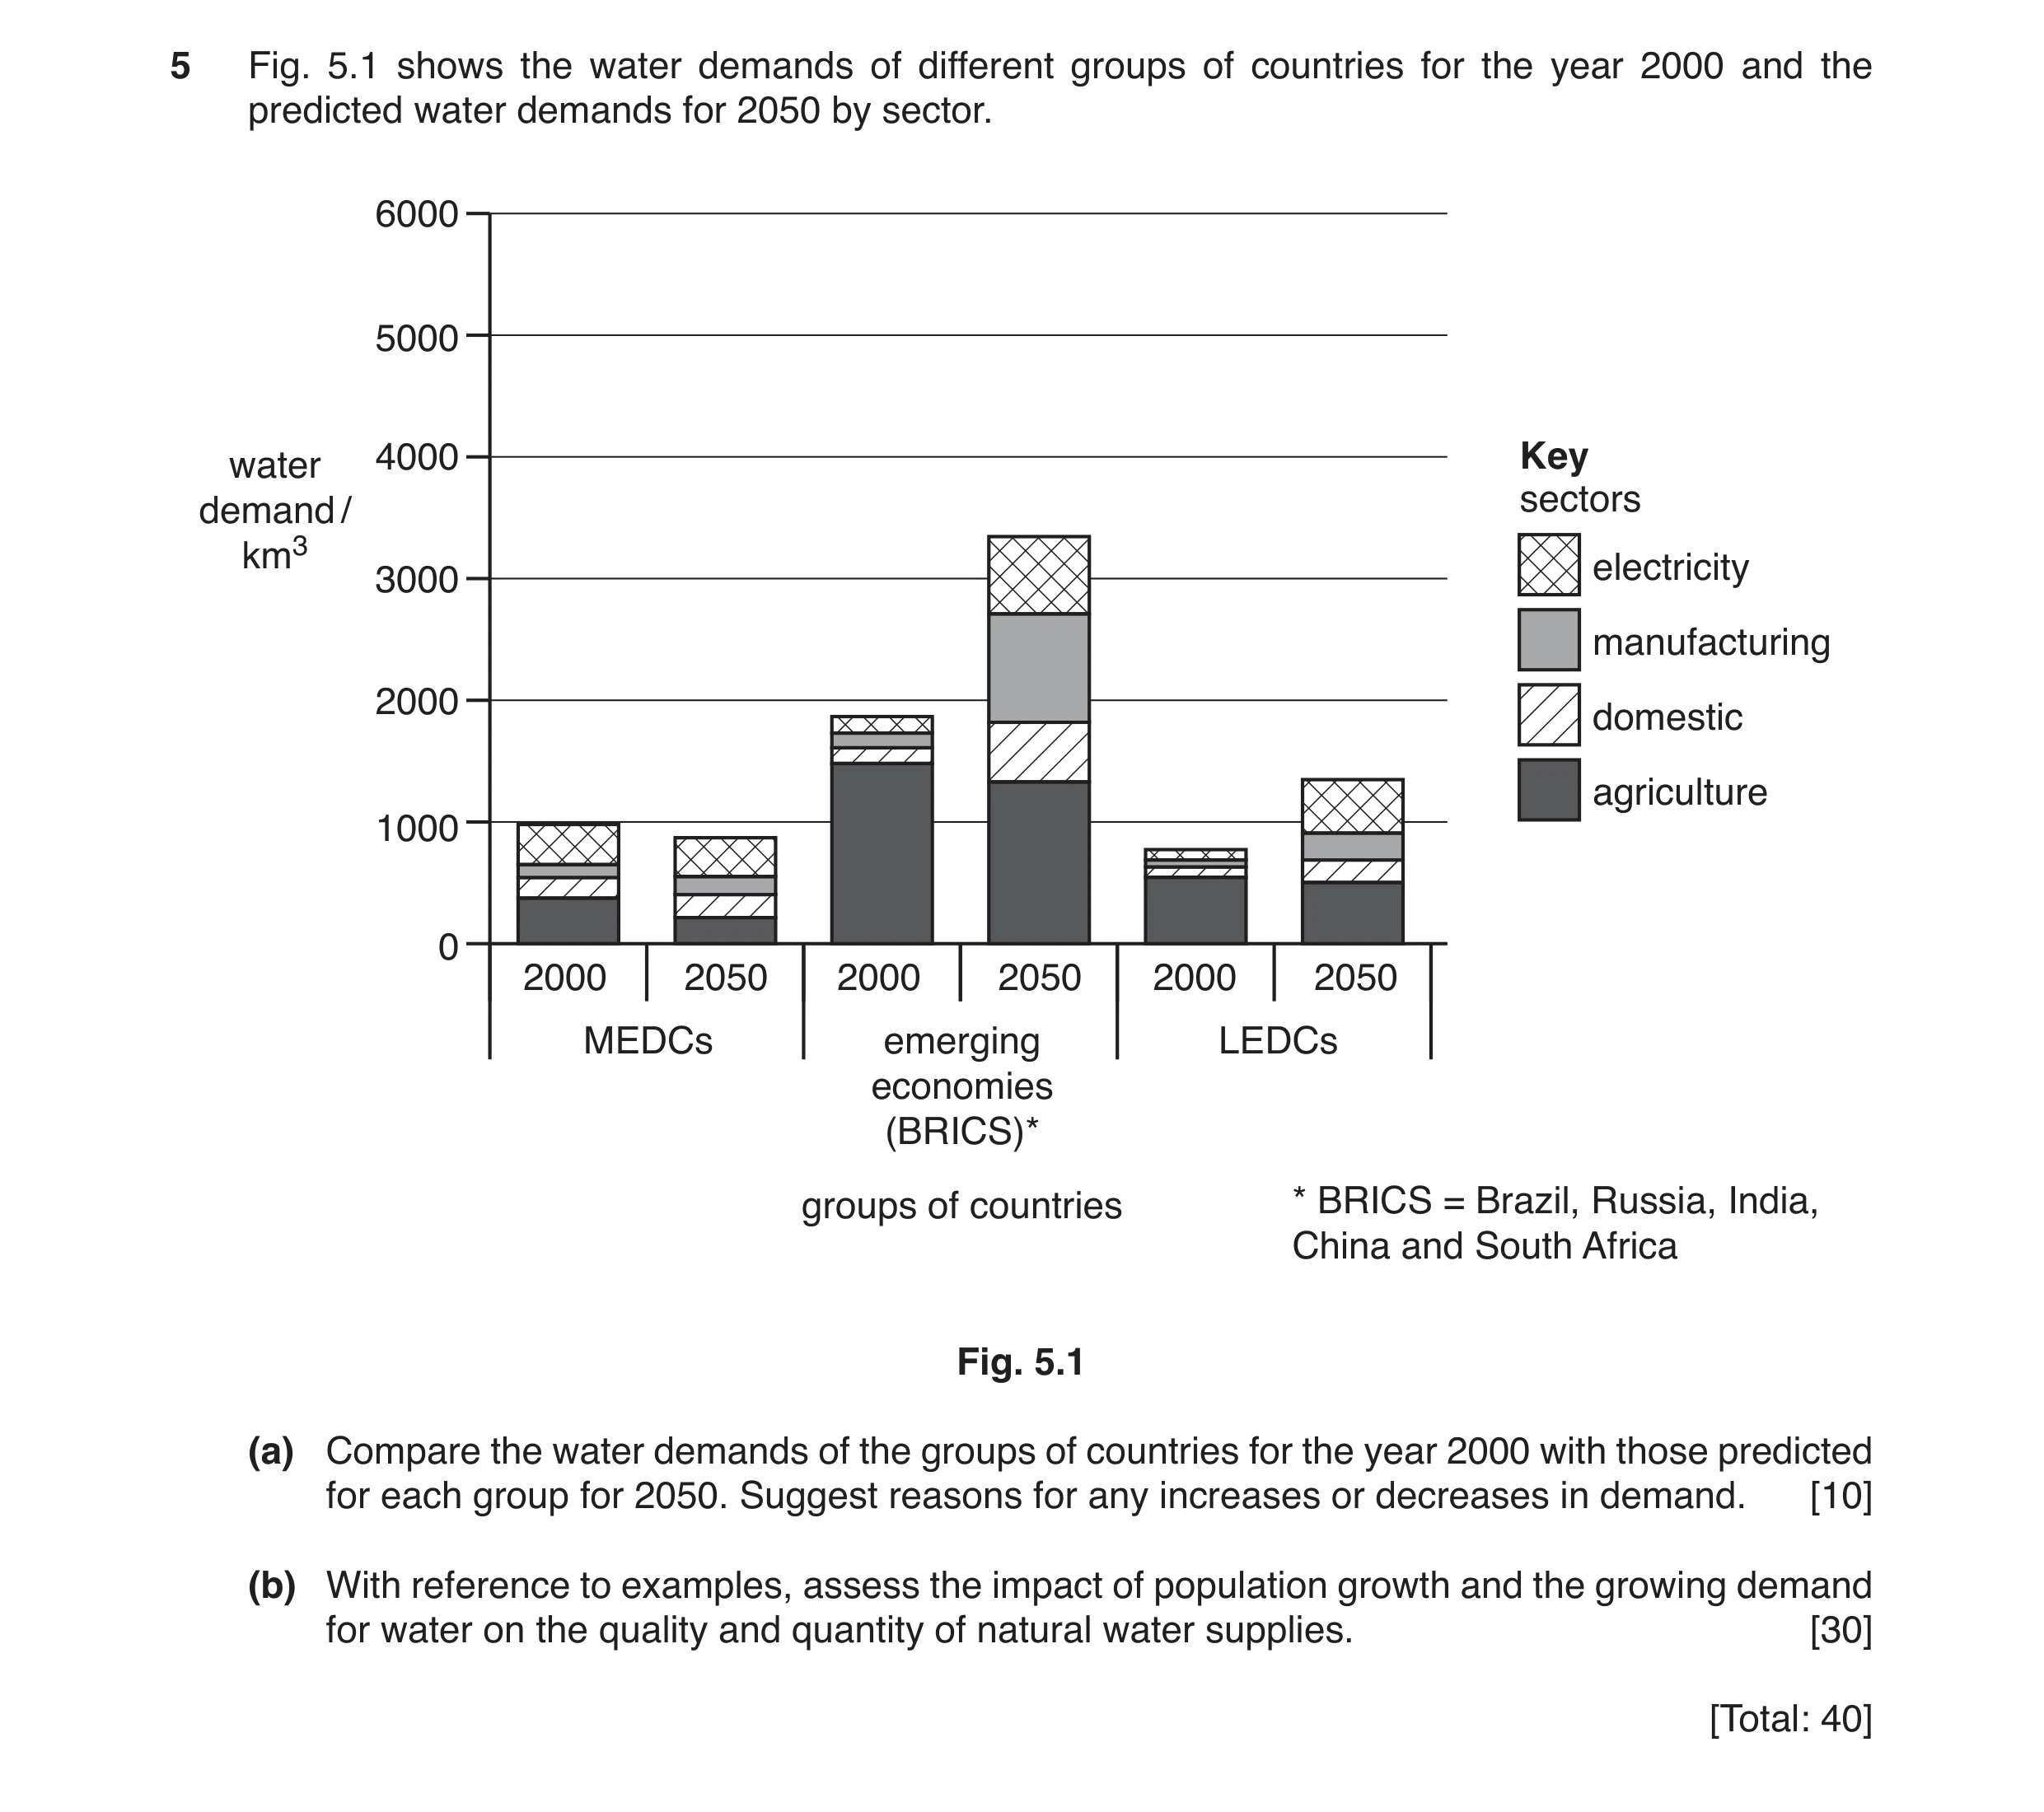
5 Fig. 5.1 shows the water demands of different groups of countries for the year 2000 and the predicted water demands for 2050 by sector. 6000 5000 water 4000 Key sectors demand / km3 electricity 3000 manufacturing 2000 domestic agriculture 1000 0 2000 2050 2000 2050 2000 2050 MEDCs emerging LEDCs economies (BRICS)* groups of countries * BRICS = Brazil, Russia, India, China and South Africa Fig. 5.1 (a) Compare the water demands of the groups of countries for the year 2000 with those predicted for each group for 2050. Suggest reasons for any increases or decreases in demand. [10] (b) With reference to examples, assess the impact of population growth and the growing demand for water on the quality and quantity of natural water supplies. [30] [Total: 40]
40 marks
Mark scheme: 5(a) Overall increases in water demand are predicted for both BRICS and LEDCs while in MEDCs an overall decrease in demand is predicted. Increases in water demand are predicted in the electricity sector in both BRICS and LEDCs. The demand for water in both domestic and manufacturing industry sectors is expected to increase in all groups of countries but with greater increases in BRICS and LEDCs. There is a predicted overall decrease in water demand in the agricultural sector in both MEDCs and BRICS. Economic development and industrialisation in BRICS and LEDCs will result in increased demand in electricity and manufacturing sectors. These competing demands for water will leave little scope for water for irrigation. Thus the agricultural sector will have less water and while irrigation use in agriculture is still the largest use of water, a decreasing demand for water for agriculture is predicted due to water scarcity and decreasing supplies. The reduced demand for water in MEDCs may develop from the sustainable use of water, water conservation, the recycling of water, metering of water or legislation. Increasing population in BRIC’s and LEDCs increases the demand for a domestic supply so that overall domestic demand is expected to increase. please use level descriptors 1 10 Question Answer Marks 5(b) The question requirements are: • to use examples of different countries to consider population growth and the growing demand for water • to assess the impact on quality of natural water supplies • to assess the impact on quantity of natural water supplies. Indicative content: Population is expected to reach 10 billion by 2050 and overall water demand will increase by a third, mostly in the economically developing countries. There is growing demand for water with economic development which will continue to increase demand in domestic and industrial sectors. More water is required for energy. This will Impact on the quality of water. Increased domestic use will generate more waste water and more industry, manufacturing and power generation will produce more pollutants resulting in increased water pollution. Increased agricultural output will be required to feed an increasing global population, resulting in the increased use of fertilisers and more eutrophication. Increased water demand will impact upon the quantity of water. The increased of extraction from rivers, and groundwater stores will deplete water resources. For example the overuse of wells for irrigation water will deplete groundwater stores. please use level descriptors 2 30 Section B descriptor levels: Descriptor Award Mark Consistently meets the level criteria Mark at top of level Meets the criteria, but with some inconsistency Middle, mark to just below top mark Meets most of level criteria, but not all convincingly Just below middle, mark to just above bottom mark On the borderline of this level and the one below Mark at bottom of level Section B descriptor levels: Section B (part a) Level descriptors 1 8–10 marks The response: • contains few errors • shows a very good understanding of the question • shows a good use of data or the information provided, where appropriate • provides a balanced answer 5–7 marks The response: • may contain some errors • shows an adequate understanding of the question • shows some use of data or the information provided, where appropriate • may lack balance 1–4 marks The response: • may contains errors • shows limited understanding of the question • shows little or no use of data or the information, where appropriate • lacks balance Section B descriptor levels: Section B (part b): Level descriptors 2 Responses: Level one, 25–30 marks • fulfil all the requirements of the question • contain a very good understanding of the content required • contain a very good balance of content • contain substantial critical and supportive evaluations • make accurate use of relevant vocabulary Level two, 19–24 marks • fulfil most of the requirements of the question • contain a good understanding of the content required • contain a good balance of content • contain some critical and supportive evaluations • make good use of relevant vocabulary Level three, 13–18 marks • fulfil some requirements of the question • contain some understanding of the content required • may contain some limited balance of content • may contain brief evaluations • make some use of relevant vocabulary Level four, 6–12 marks • fulfil limited requirements of the question • contain limited understanding of the content required • may contain poorly balanced of content • may not contain evaluations • make limited use of relevant vocabulary Section B descriptor levels: Level five, 1–5 marks • fulfil a few of the requirements of the question • contain a very limited understanding of the content required • are likely to be unbalanced and undeveloped • evaluative statements are likely to be missing • make no use of relevant vocabulary
This question in 8291/22 Oct/Nov 2018
Q6 · Maps of Bangladesh and the surrounding area 8291/21 May/June 2019
1 (a) Fig. 1.1 shows maps of Bangladesh and the surrounding area. Most of Bangladesh is a low‑lying area where floods often occur. Key CHINA international boundary NEPAL BHUTAN disputed boundary INDIA hills / mountains BANGLADESH INDIA MYANMAR THAILAND N Key Brahmaputra low-lying land Dinajpur hills / mountains Rangpur INDIA water international boundary city Jamalpur capital city Sylhet major river Mymensingh Rajshahi river Pabna Brahmanbaria Dhaka INDIA Narayanganj BANGLADESH Comilla Jessore Khulna INDIA Barisal Chittagong Mongla Bay of Bengal Cox’s Bazar 0 60 Indian Ocean km Fig. 1.1 (i) With reference to Fig. 1.1, suggest how the following human activities could cause flooding in Bangladesh: increased deforestation in Nepal … … … … increased dam building in India … … … … increased population in Bangladesh. … … … … [6] (ii) With reference to Fig. 1.1, suggest the impacts on Bangladesh of rising sea levels due to global warming. … … … … … … … … [4] (b) Fig. 1.2 is an internet article about world population growth and water supply. The 2009 World Water Development report stated that in 2000, 508 million people inhabited water‑scarce regions. The report predicted that the percentage of the world population affected by water scarcity could increase from 8% in 2000 to 47% in 2030. Water scarcity is directly linked to poverty. World population is expanding by 80 million people per year, increasing the demand for fresh water by about 64 billion m3 a year. Water withdrawals tripled over the last 50 years as a result of population growth. This rapid growth also caused the potential global availability of fresh water to decline. Fig. 1.2 (i) Using Fig. 1.2, describe the relationship between human population growth and water scarcity. … … … … [2] (ii) The human population is predicted to be 8.5 billion (8 500 000 000) in 2030. Calculate how many people could be affected by water scarcity according to Fig. 1.2. … billion [2] (iii) State what is meant by the term water demand. … … [1] (iv) Outline five ways population growth increases the demand for water. … … … … … … … … … … [5] [Total: 20]
20 marks
Mark scheme: 1(a)(i) Deforestation in Nepal: reduced evapotranspiration; increased run-off; faster soil erosion; increased silting; increased volume of water in rivers; Dams in India: reduced / intermittent flow; increases silting in Bangladesh; which reduces river depth; Increased Population: increasing urbanisation / construction; removal of trees; reduction in absorbent surfaces; increases run-off; more wells dug; lowers water table; leading to land subsidence; max 6 1(a)(ii) 70% of land is < 1 m above sea level / low-lying; Bangladesh is a flood plain; coastal defences inundated from both sides; coastal cities / named cities could flood / flooding occurs; damaging property / housing / infrastructure; increased salinization of soil leads to agricultural land being abandoned; salinization of water supply; less likely to have maintained levees; increased snow melt / increased rainfall contributes to flooding; population movement; loss of biodiversity; max 4 Question Answer Marks 1(b)(i) as population grows; the percentage of people in water scarcity increases; as population grows; the amount of water withdrawals triples; as population grows; global water availability declines; max 2 1(b)(ii) 8.5 × (47 / 100); 3.995 (Billion) / 3 995 000 000; 2 1(b)(iii) water demand is total needed from sources for domestic / industrial / agricultural use / for population to survive; 1 1(b)(iv) water needed for basic / domestic needs; example / e.g. hydration / hygiene / cooking / sewage systems; industrial use; for manufacture of goods / construction / energy generation; agricultural use; for growing food / animals; water used for non-basic needs; example / dishwashers, washing machines / washing cars / watering gardens; max 5
This question in 8291/21 May/June 2019
Q7 · A flow diagram showing the effect of human pressure on an ecosystem and the possible… 8291/21 May/June 2019
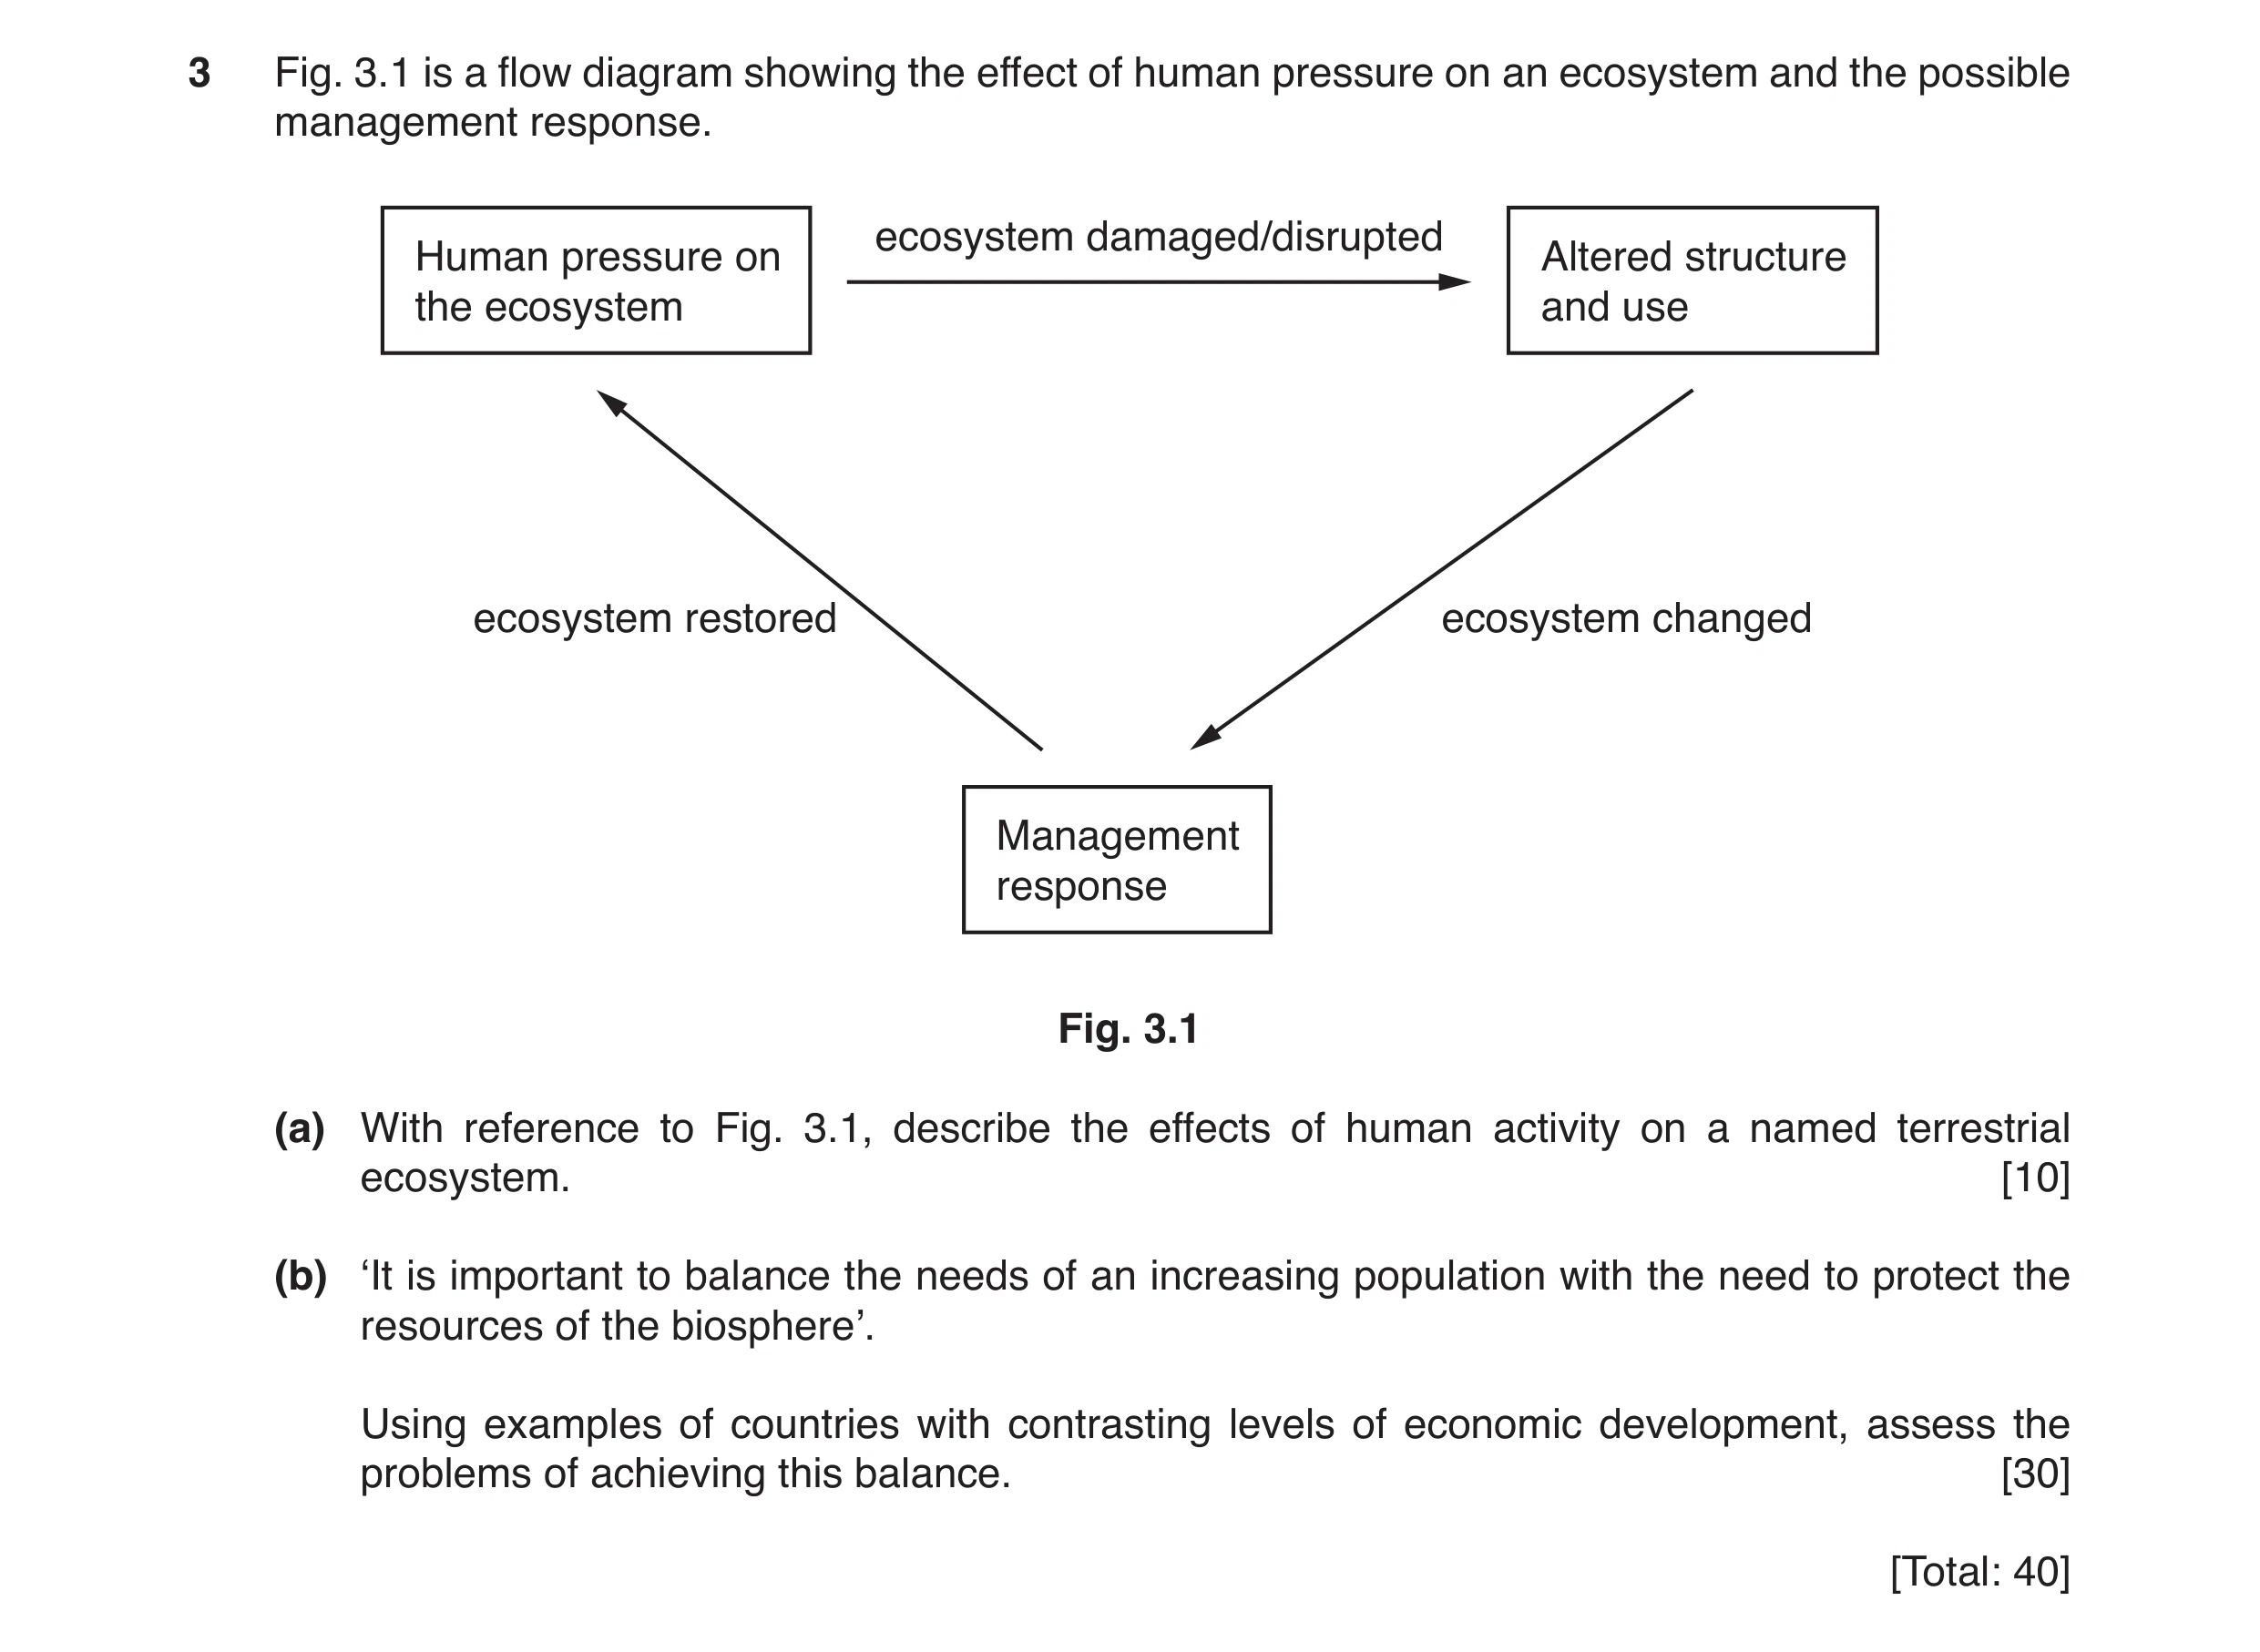
3 Fig. 3.1 is a flow diagram showing the effect of human pressure on an ecosystem and the possible management response. ecosystem damaged/disrupted Human pressure on Altered structure the ecosystem and use ecosystem restored ecosystem changed Management response Fig. 3.1 (a) With reference to Fig. 3.1, describe the effects of human activity on a named terrestrial ecosystem. [10] (b) ‘It is important to balance the needs of an increasing population with the need to protect the resources of the biosphere’. Using examples of countries with contrasting levels of economic development, assess the problems of achieving this balance. [30] [Total: 40]
40 marks
Mark scheme: 3(a) Human activity could include pollution (named pollutant), physical habitat changes such as deforestation, dams and agriculture, urban sprawl, infrastructure building, poaching and hunting. These can lead to lower biodiversity, change in succession, eutrophication, flooding and loss of habitat. Human activity could also be the various management strategies to protect the terrestrial ecosystems Please use level descriptors 1 10 3(b) The question requirements are: • To explain the demands made by increasing population • To explain the importance of protecting the resources of the biosphere • To assess the different problems faced by countries with different levels of economic development in meeting both demands Increasing population leads to increased demands for living space (development and infrastructure) and pressure on the resources of the biosphere (loss of habitat, pollution, agriculture demands). Protection of the biosphere is important to maintain the balance in the biomes and to prevent irreversible change and loss of biodiversity. Such protection requires will, finance, legislation and education. Countries with different levels of economic development face different challenges and demands placed on resources including financial. Some mention of international agreements impacting developing countries is valid. Please use level descriptors 2 30
This question in 8291/21 May/June 2019
Q8 · Data about traffic congestion in four of India’s cities 8291/22 May/June 2022
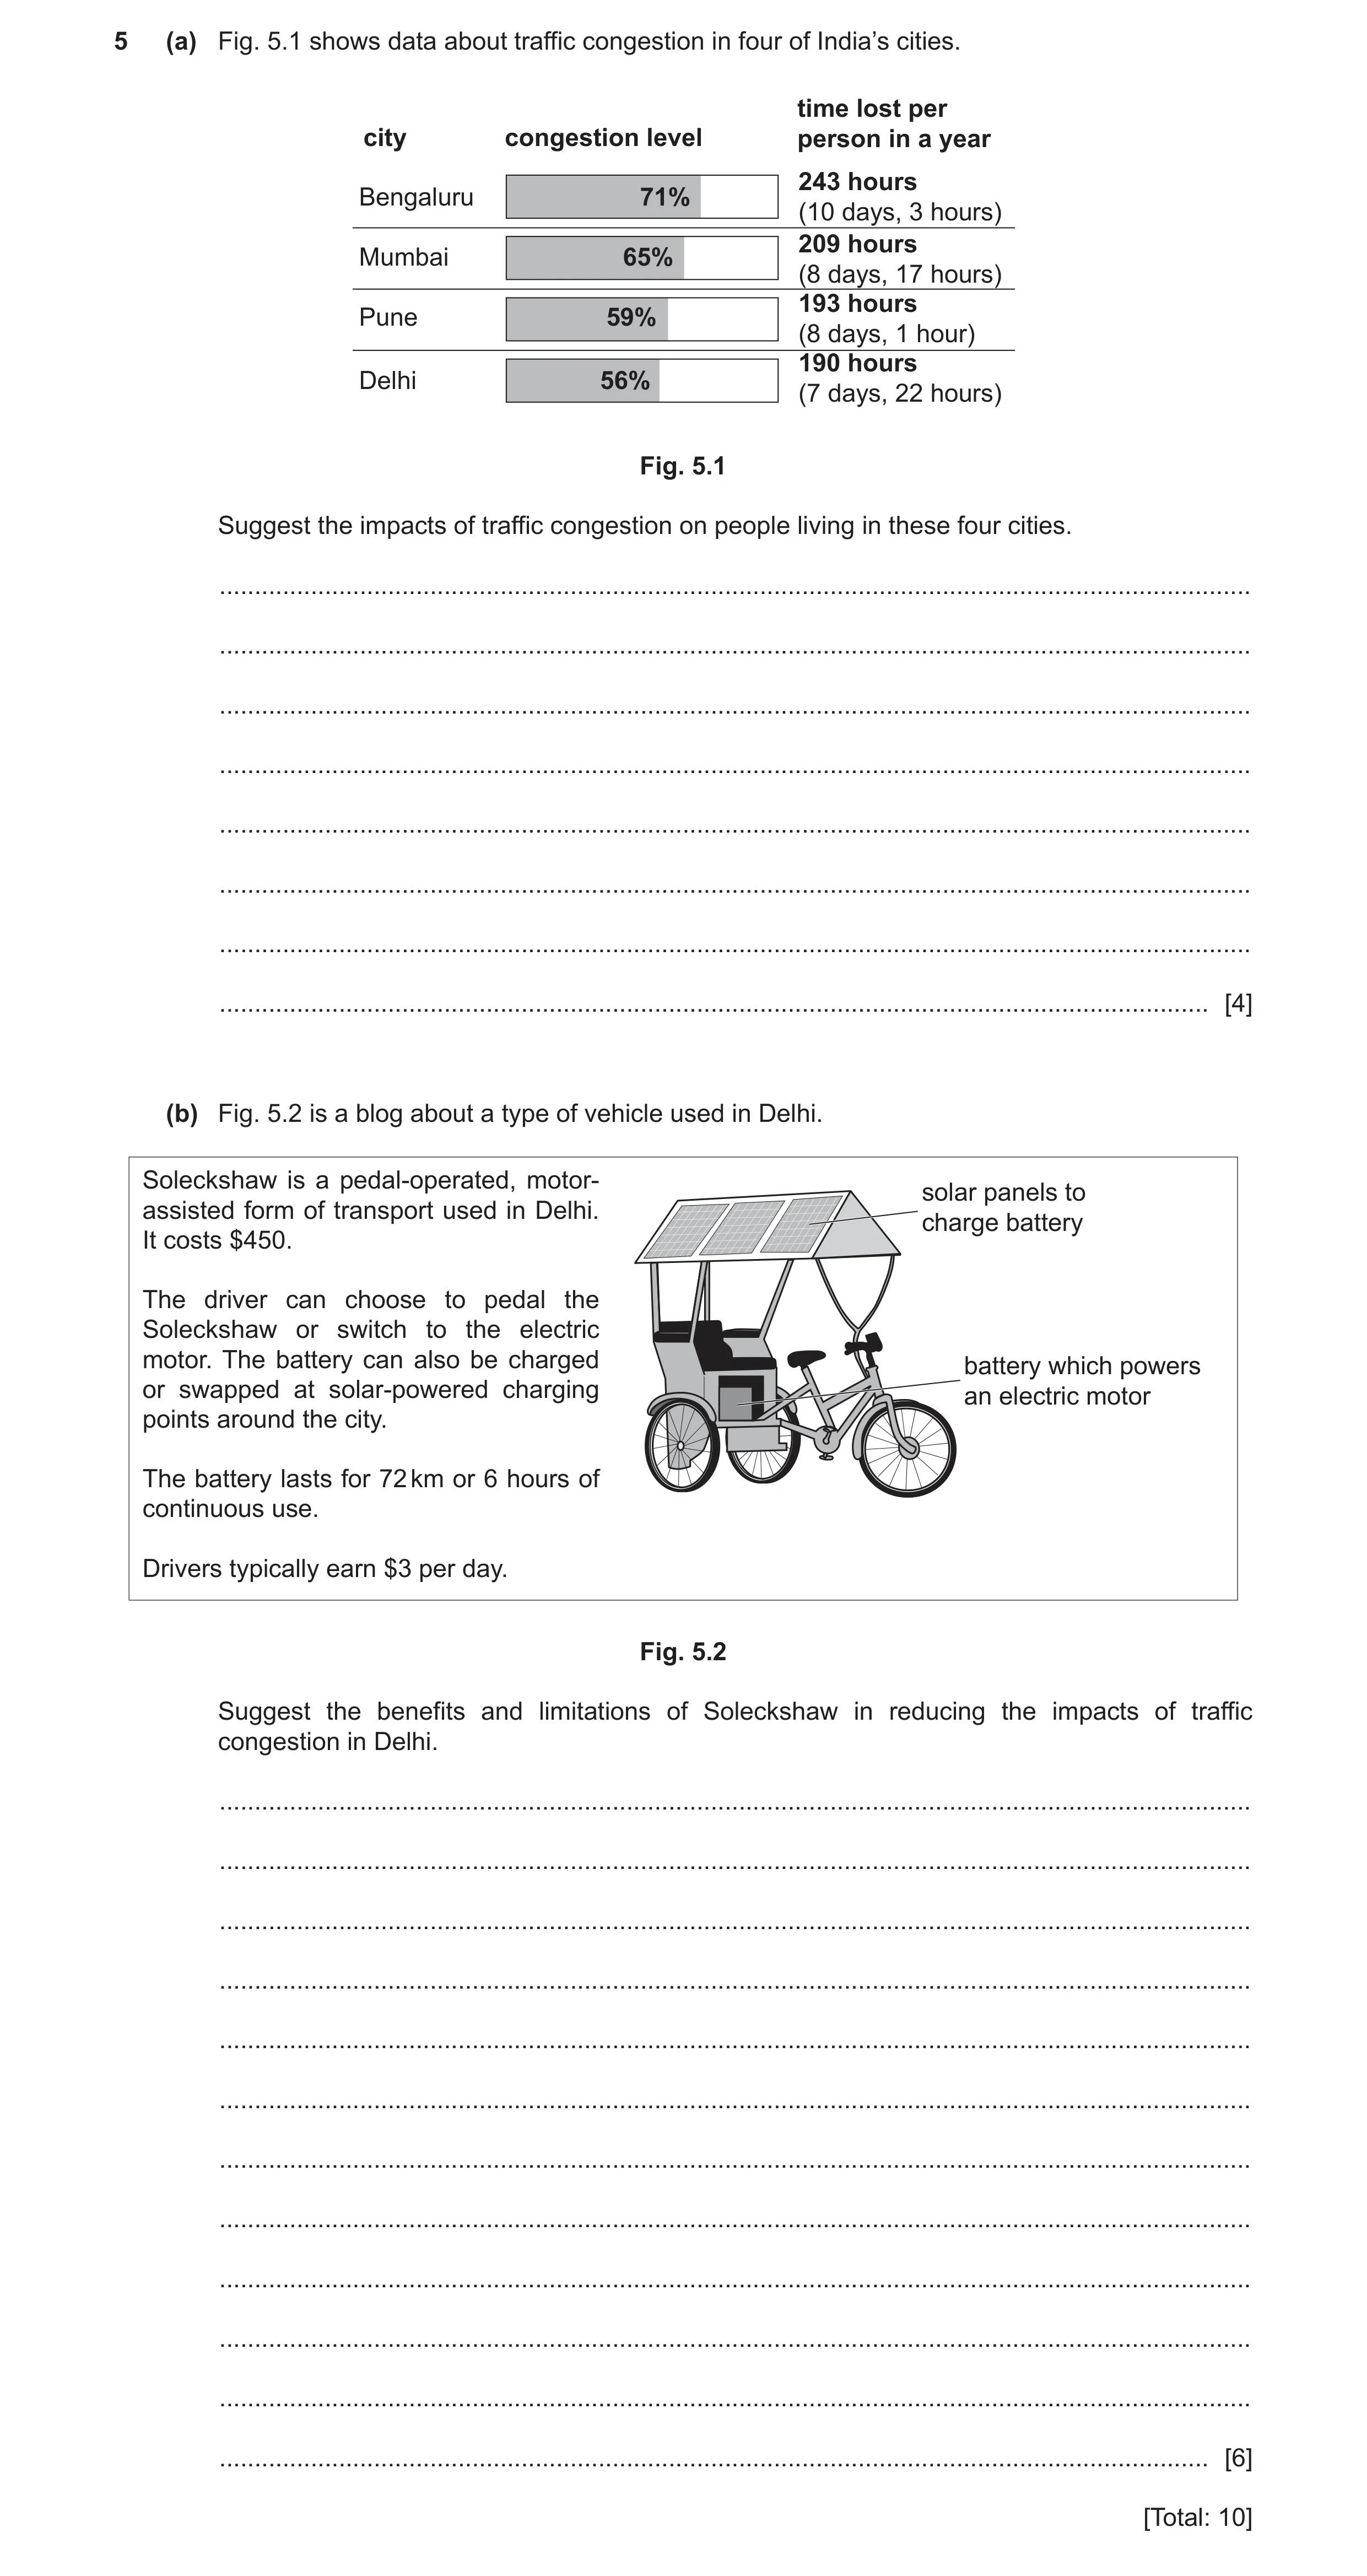
5 (a) Fig. 5.1 shows data about traffic congestion in four of India’s cities. time lost per city congestion level person in a year 243 hours Bengaluru 71% (10 days, 3 hours) 209 hours Mumbai 65% (8 days, 17 hours) 193 hours Pune 59% (8 days, 1 hour) 190 hours Delhi 56% (7 days, 22 hours) Fig. 5.1 Suggest the impacts of traffic congestion on people living in these four cities. … … … … … … … … [4] (b) Fig. 5.2 is a blog about a type of vehicle used in Delhi. Soleckshaw is a pedal-operated, motor- solar panels to assisted form of transport used in Delhi. charge battery It costs $450. The driver can choose to pedal the Soleckshaw or switch to the electric motor. The battery can also be charged battery which powers or swapped at solar-powered charging an electric motor points around the city. The battery lasts for 72 km or 6 hours of continuous use. Drivers typically earn $3 per day. Fig. 5.2 Suggest the benefits and limitations of Soleckshaw in reducing the impacts of traffic congestion in Delhi. … … … … … … … … … … … … [6] [Total: 10]
10 marks
Mark scheme: 5(a) any four from: loss of income; time lost (in travelling to work); respiratory illness; eye irritation; from vehicle emissions or named emission e.g. SO2, NOx, VOCs, particulates / unburnt hydrocarbons; formation of emission described; impact of emission described e.g. acid rain / photochemical smog; carbon dioxide emissions; impact of CO2 emissions global warming; 5(b) any six from but at least one benefit and one limitation: benefit: does not use, fossil fuels / petrol; (solar) is renewable / non-finite; does not emit, CO2 / air pollution (at point of use); will improve quality of life for drivers; do not need to wait for battery to charge / can swop battery rather than charging it / battery charges as you go; limitation: expensive / drivers unlikely to be able to afford them / drivers low wage; extra equipment likely to be heavy; range is short / only lasts for 6 hours; solar panel needs Sun / won’t operate at night or when cloudy; 6
This question in 8291/22 May/June 2022
Q9 · Data about traffic congestion in four of India’s cities 8291/23 May/June 2022
5 (a) Fig. 5.1 shows data about traffic congestion in four of India’s cities. time lost per city congestion level person in a year 243 hours Bengaluru 71% (10 days, 3 hours) 209 hours Mumbai 65% (8 days, 17 hours) 193 hours Pune 59% (8 days, 1 hour) 190 hours Delhi 56% (7 days, 22 hours) Fig. 5.1 Suggest the impacts of traffic congestion on people living in these four cities. … … … … … … … … [4] (b) Fig. 5.2 is a blog about a type of vehicle used in Delhi. Soleckshaw is a pedal-operated, motor- solar panels to assisted form of transport used in Delhi. charge battery It costs $450. The driver can choose to pedal the Soleckshaw or switch to the electric motor. The battery can also be charged battery which powers or swapped at solar-powered charging an electric motor points around the city. The battery lasts for 72 km or 6 hours of continuous use. Drivers typically earn $3 per day. Fig. 5.2 Suggest the benefits and limitations of Soleckshaw in reducing the impacts of traffic congestion in Delhi. … … … … … … … … … … … … [6] [Total: 10]
10 marks
Mark scheme: 5(a) any four from: loss of income; time lost (in travelling to work); respiratory illness; eye irritation; from vehicle emissions or named emission e.g. SO2, NOx, VOCs, particulates / unburnt hydrocarbons; formation of emission described; impact of emission described e.g. acid rain / photochemical smog; carbon dioxide emissions; impact of CO2 emissions global warming; 5(b) any six from but at least one benefit and one limitation: benefit: does not use, fossil fuels / petrol; (solar) is renewable / non-finite; does not emit, CO2 / air pollution (at point of use); will improve quality of life for drivers; do not need to wait for battery to charge / can swop battery rather than charging it / battery charges as you go; limitation: expensive / drivers unlikely to be able to afford them / drivers low wage; extra equipment likely to be heavy; range is short / only lasts for 6 hours; solar panel needs Sun / won’t operate at night or when cloudy; 6
This question in 8291/23 May/June 2022
Q10 · A map of Singapore, Southeast Asia 8291/21 Oct/Nov 2022
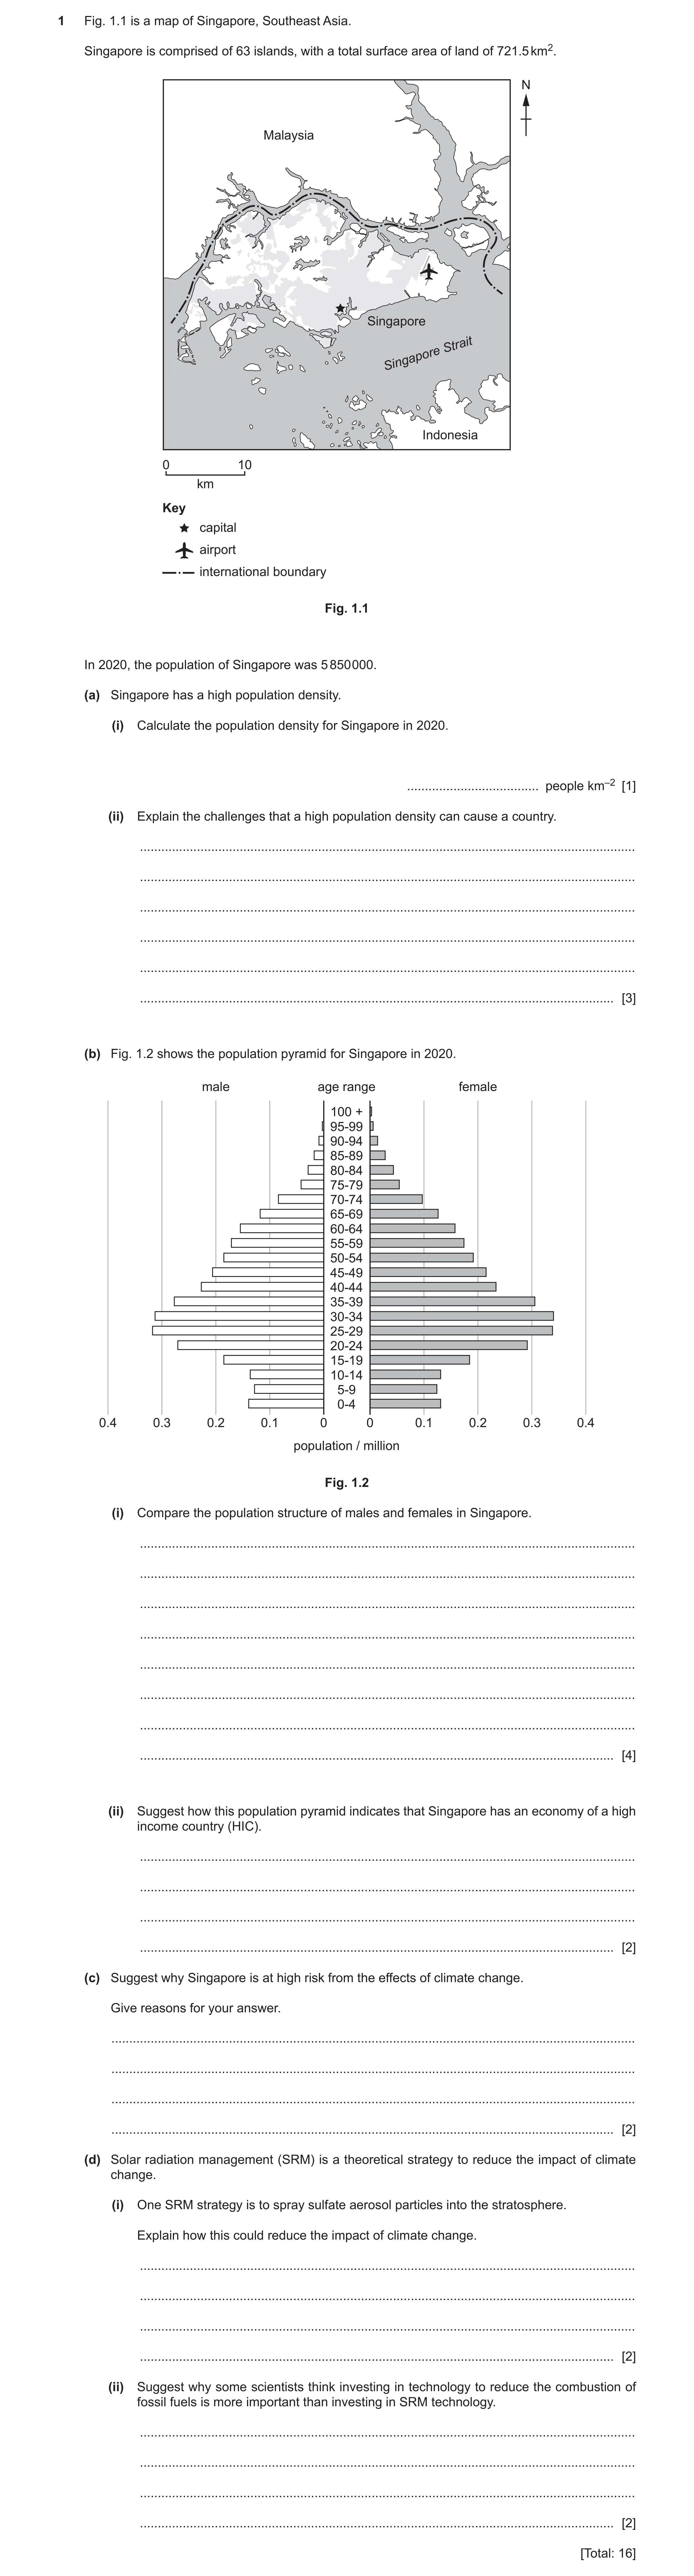
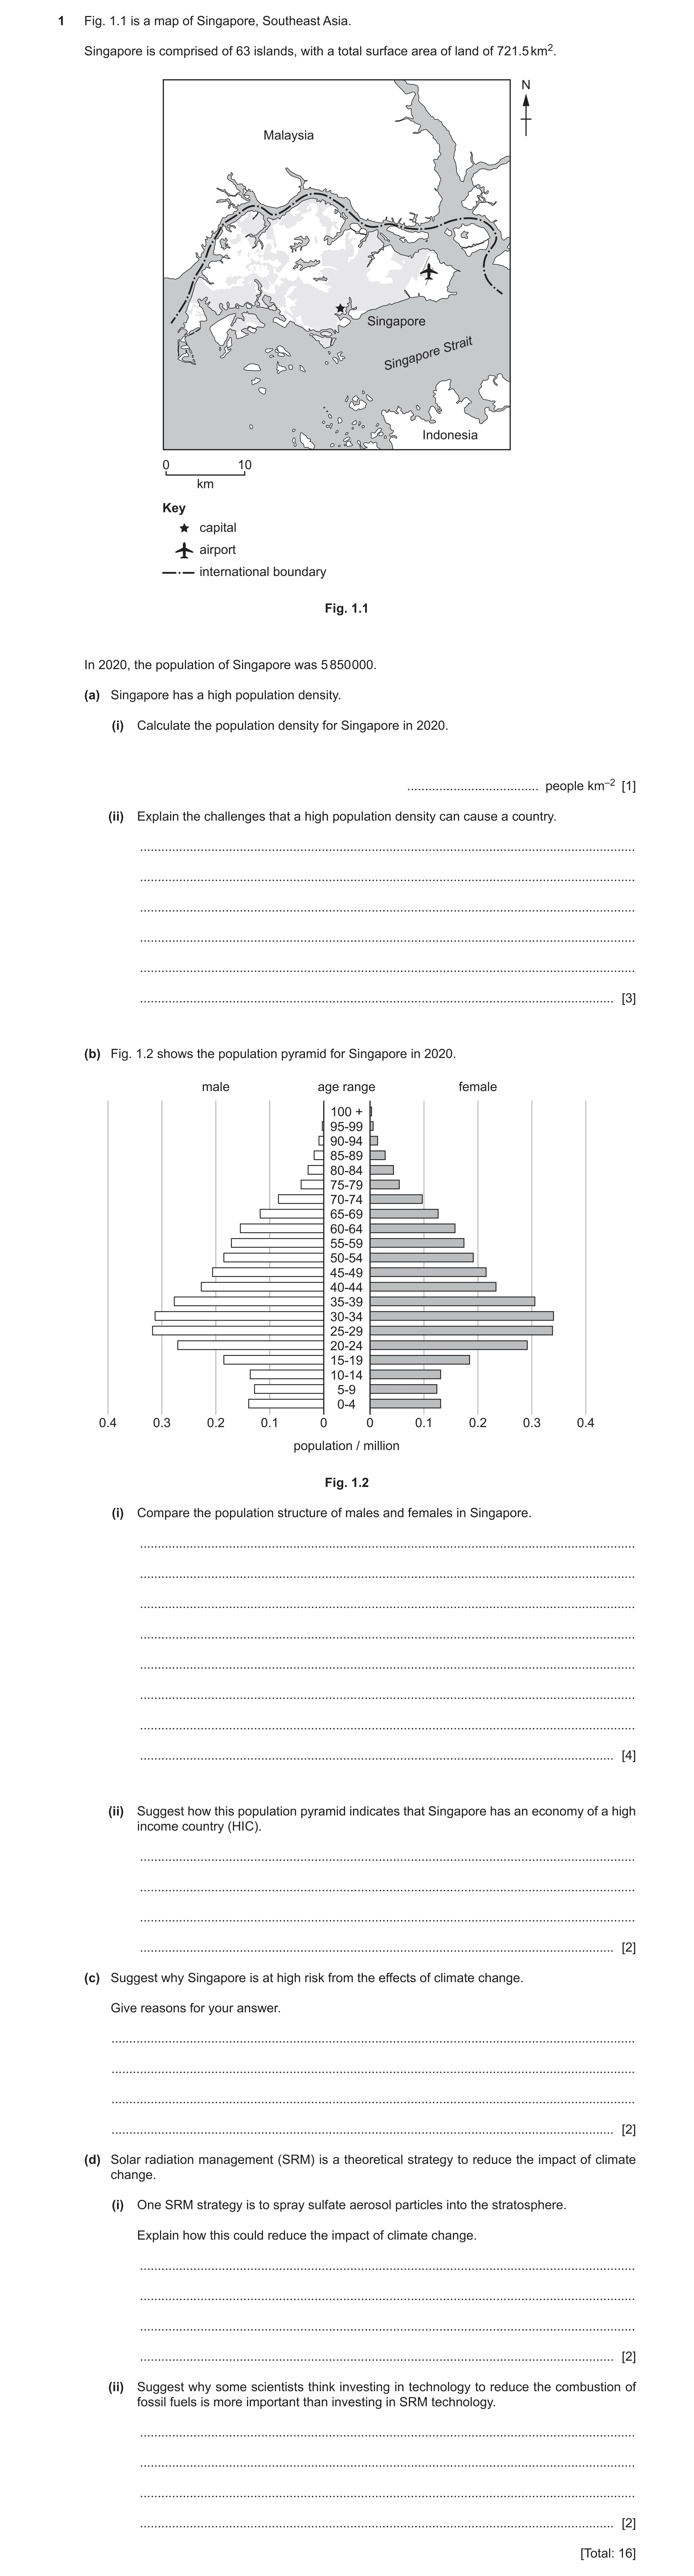
1 Fig. 1.1 is a map of Singapore, Southeast Asia. Singapore is comprised of 63 islands, with a total surface area of land of 721.5 km2. N Malaysia Singapore Strait Singapore Indonesia 0 10 km Key capital airport international boundary Fig. 1.1 In 2020, the population of Singapore was 5 850 000. (a) Singapore has a high population density. (i) Calculate the population density for Singapore in 2020. … people km–2 [1] (ii) Explain the challenges that a high population density can cause a country. … … … … … … [3] (b) Fig. 1.2 shows the population pyramid for Singapore in 2020. male age range female 100 + 95-99 90-94 85-89 80-84 75-79 70-74 65-69 60-64 55-59 50-54 45-49 40-44 35-39 30-34 25-29 20-24 15-19 10-14 5-9 0-4 0.4 0.3 0.2 0.1 0 0 0.1 0.2 0.3 0.4 population / million Fig. 1.2 (i) Compare the population structure of males and females in Singapore. … … … … … … … … [4] (ii) Suggest how this population pyramid indicates that Singapore has an economy of a high income country (HIC). … … … … [2] (c) Suggest why Singapore is at high risk from the effects of climate change. Give reasons for your answer. … … … … [2] (d) Solar radiation management (SRM) is a theoretical strategy to reduce the impact of climate change. (i) One SRM strategy is to spray sulfate aerosol particles into the stratosphere. Explain how this could reduce the impact of climate change. … … … … [2] (ii) Suggest why some scientists think investing in technology to reduce the combustion of fossil fuels is more important than investing in SRM technology. … … … … [2] [Total: 16]
16 marks
Mark scheme: Question Answer Marks 1(a)(i) 8108(.108108); 1 1(a)(ii) any three from: 3 limited land area to accommodate people / not enough houses; overcrowding; leads to spread of disease / named disease (more quickly); limited land area for infrastructure / roads; leads to increased house prices / land prices / negative economic impact on population; not enough jobs available; high level of car use / factory emissions; leads to congestion; leads to air pollution / acid rain / global warming / smog; effect of stated air pollution, e.g. acidification of lakes / climate change; limited green spaces / limited agricultural land / high level of urbanisation; leads to food shortages; leads to water shortages / water pollution; waste management; AVP; 1(b)(i) any four from: 4 (approximately) equal numbers / same trend; more females in older age / more females aged 70+ / woman live longer; more females in, working age / 15–39 age; no males in 100+ age range; 1(b)(ii) any two from: 2 high life expectancy / people live a long time / taller (than LIC); high(er) number of older dependents (than LIC); low(er) number of young dependents (than LIC); high(er) number of economically active (than LIC); indicates low birth / death rate; 1(c) any two from: 2 island / surrounded by sea; at risk from flooding; change in ocean / wind circulation; increased ocean temperatures lead to extreme weather events; high population density / limited land area: food / energy / water insecurity; 1(d)(i) (small amounts of) inbound sunlight are reflected back (into space); 2 cools planet / reduces global temperatures / reduces speed of climate change; 1(d)(ii) any two from: 2 combustion of fossil fuels produces, greenhouse gases / carbon dioxide; idea that SRM: does not reduce greenhouse gases / only deals with symptom not the problem / may only work for a short period / not a long-term solution; SRM: untested theory / might have negative effect, e.g. effect on ozone layer / health impact;
This question in 8291/21 Oct/Nov 2022
Q11 · A map of Mongolia 8291/22 Oct/Nov 2022
1 Fig. 1.1 is a map of Mongolia. Mongolia has a total land area of 1 560 000 km2. N RUSSIA CHINA Ulaanbaatar MONGOLIA CHINA Desert Gobi 0 200 km Key capital international boundary Fig. 1.1 In 2020, the population of Mongolia was 3 170 000. (a) Mongolia has a low population density. (i) Calculate the population density for Mongolia in 2020. … people km–2 [1] (ii) Explain the challenges faced by countries with a low population density. … … … … … … … … [4] (b) Fig. 1.2 shows the age dependency ratio in Mongolia from 1960 to 2018. 110 100 90 80 age dependency ratio 70 60 50 40 1960 1965 1970 1975 1980 1985 1990 1995 2000 2005 2010 2015 2020 year Fig. 1.2 The higher the ratio, the larger the dependent population compared to the working-age population. A ratio of 100 indicates that the number of dependents is exactly the same as the number of working-age people. Describe the trend shown by the data in Fig. 1.2. … … … … … … [3] (c) Fig. 1.3 shows the population pyramid for Mongolia in 2020. age male range female 100+ 95–99 90–94 85–89 80–84 75–79 70–74 65–69 60–64 55–59 50–54 45–49 40–44 35–39 30–34 25–29 20–24 15–19 10–14 5–9 0–4 0.2 0.15 0.1 0.05 0 0 0.05 0.1 0.15 0.2 population / million Fig. 1.3 Suggest how the shape of the population pyramid for Mongolia in 1975 was different from the 2020 shape. Give reasons for your answer. … … … … [2] (d) The Gobi Desert in Mongolia is a cold desert. Describe the climate of a cold desert biome in winter and in summer. winter … … summer … … [3] (e) The photograph in Fig. 1.4 shows an area of desert during primary succession. Fig. 1.4 (i) Suggest how the pioneer species in Fig. 1.4 colonised this area of desert. … … … … [2] (ii) Suggest the characteristics of the pioneer species in Fig. 1.4. … … … … [2] (iii) Explain how the death of pioneer species can lead to secondary succession. … … … … [2] (f) The total area of land in Mongolia is 1 560 000 km2. The area of this land covered by water in Mongolia is 10 560 km2. (i) Calculate the percentage of land area covered by water in Mongolia. percentage = … [1] (ii) Suggest why climate change can increase water insecurity in Mongolia. … … … … [2] (iii) Explain the impacts of water insecurity. … … … … … … … … [4] (g) Solar radiation management (SRM) is a theoretical strategy to reduce the impact of climate change. (i) One SRM strategy is the use of space reflectors. Outline how space reflectors could reduce the impact of climate change. … … … … [2] (ii) Suggest why some people think investing in SRM technology is more important than reducing our combustion of fossil fuels. … … [1] [Total: 29]
29 marks
Mark scheme: Question Answer Marks 1(a)(i) 2 / 2.03; 1 1(a)(ii) any four from: 4 difficult to find a partner / low marriage rates; leads to low birth rate; leads to population decline; fewer jobs in rural areas; leads to abandonment of, rural areas / agricultural land; leads to urbanisation; less economically active people / fall in GDP; less people to purchase products / services, reduces economy of country; lack of available healthcare / supply of goods / accessing amenities due to large distances between people; people have to travel large distances / transportation more costly / not enough transport available; less technological advancement / create ideas to boost economy; reduction in tourism; AVP; 1(b) any three from: 3 1960–1973: increasing age dependency ratio / decreasing number of working age people / increasing number of dependents; 1973–1975: age dependency ratio plateaus / just above 100 / number of dependents exactly the same / slightly higher than number of working-age people; 1975–2010: decreasing age dependency ratio / increasing number of working age people / decreasing number of dependents; 2010–2018: increasing age dependency ratio / decreasing number of working age people / increasing number of dependents; 1(c) any two from (for 1975): 2 narrower at old age / top; lower life expectancy; improved medical care in 2020; wider for young dependents / base; birth rate higher; 1(d) any three from: 3 winter long; cold / snowfall; temperature between –2 to –14 °C; lower rainfall; summer short; hot; low rainfall (higher than the winter); (moderately) warm summer; temperature between 21 to 26 °C; 1(e)(i) seeds / spores; 2 carried by wind / insects / animals / birds / humans; 1(e)(ii) any two from: 2 fungi / lichen; high stress tolerance / hardy / withstands harsh environment; grow quickly; tough outer layer; adapted to conserve water, e.g. waxy outer layer / spiny leaves; short / shallow roots; 1(e)(iii) any two from: 2 adds organic matter / humus; adds nutrients through decomposition; reduces competition / free up space; increases water holding capacity; 1(f)(i) 0.677 / 0.68 / 0.7; 1 1(f)(ii) any two from: 2 landlocked; few existing water sources; increased temperatures / global warming; leads to drought; climate change alters rainfall patterns; 1(f)(iii) any four from: 4 reduced crop yield / crop failure; livestock death; leads to food shortages / malnutrition / famine; leads to poverty / increase in cost of food; farmers lose income from their crops; reduced water for industrial processes / loss of manufactured goods; disrupts education (particularly girls) as take time out to collect water; dehydration from lack of water to drink; limited access to clean drinking water / forced to drink contaminated water; leads to water related illnesses / cholera / typhoid / diarrhoea; migration / refugees; 1(g)(i) mirrors in space / stratosphere; 2 reflect or reduce the amount of incoming solar radiation (reaching Earth); which reduces temperature of Earth’s surface / reduces greenhouse effect / reduces global warming; 1(g)(ii) any one from: 1 we can continue to use fossil fuels / no changes needed to our way of life; hard to reduce combustion of fossil fuels;
This question in 8291/22 Oct/Nov 2022
Q12 · A map of Singapore, Southeast Asia 8291/23 Oct/Nov 2022
1 Fig. 1.1 is a map of Singapore, Southeast Asia. Singapore is comprised of 63 islands, with a total surface area of land of 721.5 km2. N Malaysia Singapore Strait Singapore Indonesia 0 10 km Key capital airport international boundary Fig. 1.1 In 2020, the population of Singapore was 5 850 000. (a) Singapore has a high population density. (i) Calculate the population density for Singapore in 2020. … people km–2 [1] (ii) Explain the challenges that a high population density can cause a country. … … … … … … [3] (b) Fig. 1.2 shows the population pyramid for Singapore in 2020. male age range female 100 + 95-99 90-94 85-89 80-84 75-79 70-74 65-69 60-64 55-59 50-54 45-49 40-44 35-39 30-34 25-29 20-24 15-19 10-14 5-9 0-4 0.4 0.3 0.2 0.1 0 0 0.1 0.2 0.3 0.4 population / million Fig. 1.2 (i) Compare the population structure of males and females in Singapore. … … … … … … … … [4] (ii) Suggest how this population pyramid indicates that Singapore has an economy of a high income country (HIC). … … … … [2] (c) Suggest why Singapore is at high risk from the effects of climate change. Give reasons for your answer. … … … … [2] (d) Solar radiation management (SRM) is a theoretical strategy to reduce the impact of climate change. (i) One SRM strategy is to spray sulfate aerosol particles into the stratosphere. Explain how this could reduce the impact of climate change. … … … … [2] (ii) Suggest why some scientists think investing in technology to reduce the combustion of fossil fuels is more important than investing in SRM technology. … … … … [2] [Total: 16]
16 marks
Mark scheme: Question Answer Marks 1(a)(i) 8108(.108108); 1 1(a)(ii) any three from: 3 limited land area to accommodate people / not enough houses; overcrowding; leads to spread of disease / named disease (more quickly); limited land area for infrastructure / roads; leads to increased house prices / land prices / negative economic impact on population; not enough jobs available; high level of car use / factory emissions; leads to congestion; leads to air pollution / acid rain / global warming / smog; effect of stated air pollution, e.g. acidification of lakes / climate change; limited green spaces / limited agricultural land / high level of urbanisation; leads to food shortages; leads to water shortages / water pollution; waste management; AVP; 1(b)(i) any four from: 4 (approximately) equal numbers / same trend; more females in older age / more females aged 70+ / woman live longer; more females in, working age / 15–39 age; no males in 100+ age range; 1(b)(ii) any two from: 2 high life expectancy / people live a long time / taller (than LIC); high(er) number of older dependents (than LIC); low(er) number of young dependents (than LIC); high(er) number of economically active (than LIC); indicates low birth / death rate; 1(c) any two from: 2 island / surrounded by sea; at risk from flooding; change in ocean / wind circulation; increased ocean temperatures lead to extreme weather events; high population density / limited land area: food / energy / water insecurity; 1(d)(i) (small amounts of) inbound sunlight are reflected back (into space); 2 cools planet / reduces global temperatures / reduces speed of climate change; 1(d)(ii) any two from: 2 combustion of fossil fuels produces, greenhouse gases / carbon dioxide; idea that SRM: does not reduce greenhouse gases / only deals with symptom not the problem / may only work for a short period / not a long-term solution; SRM: untested theory / might have negative effect, e.g. effect on ozone layer / health impact;
This question in 8291/23 Oct/Nov 2022
Q13 · The World Bank classifies countries into income groups 8291/21 Oct/Nov 2023
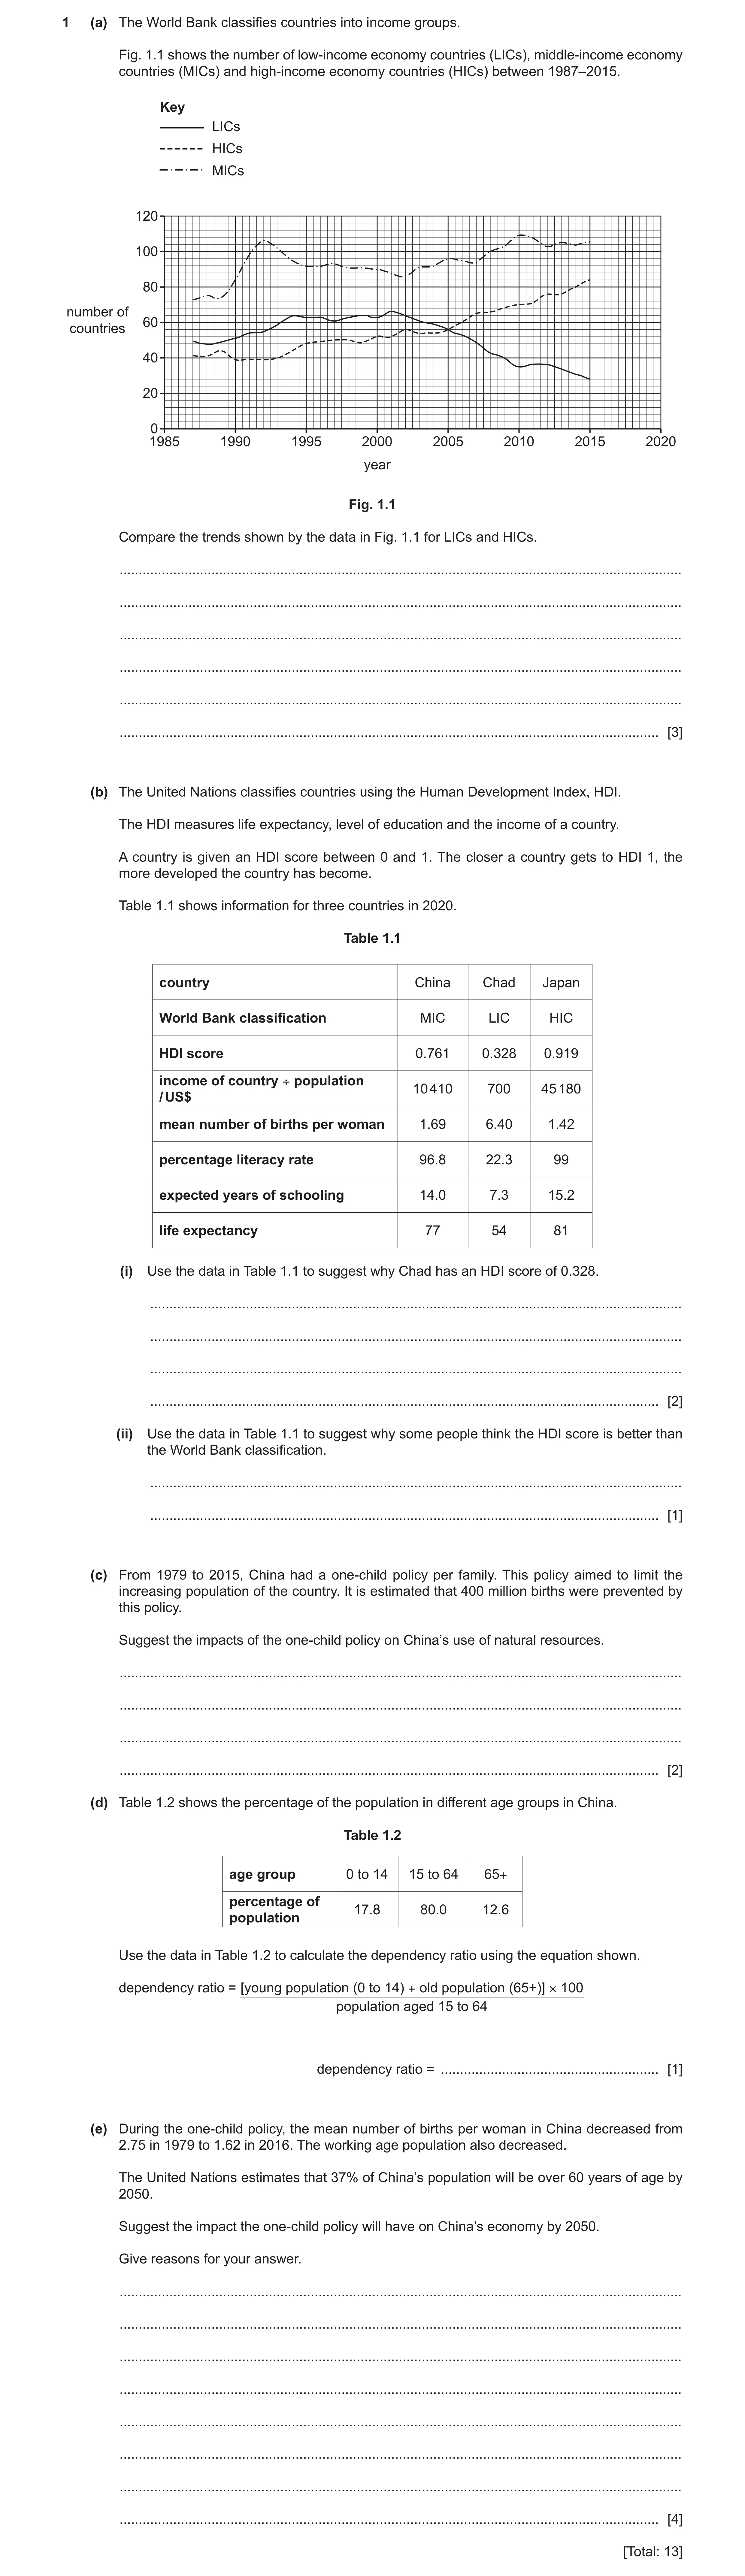
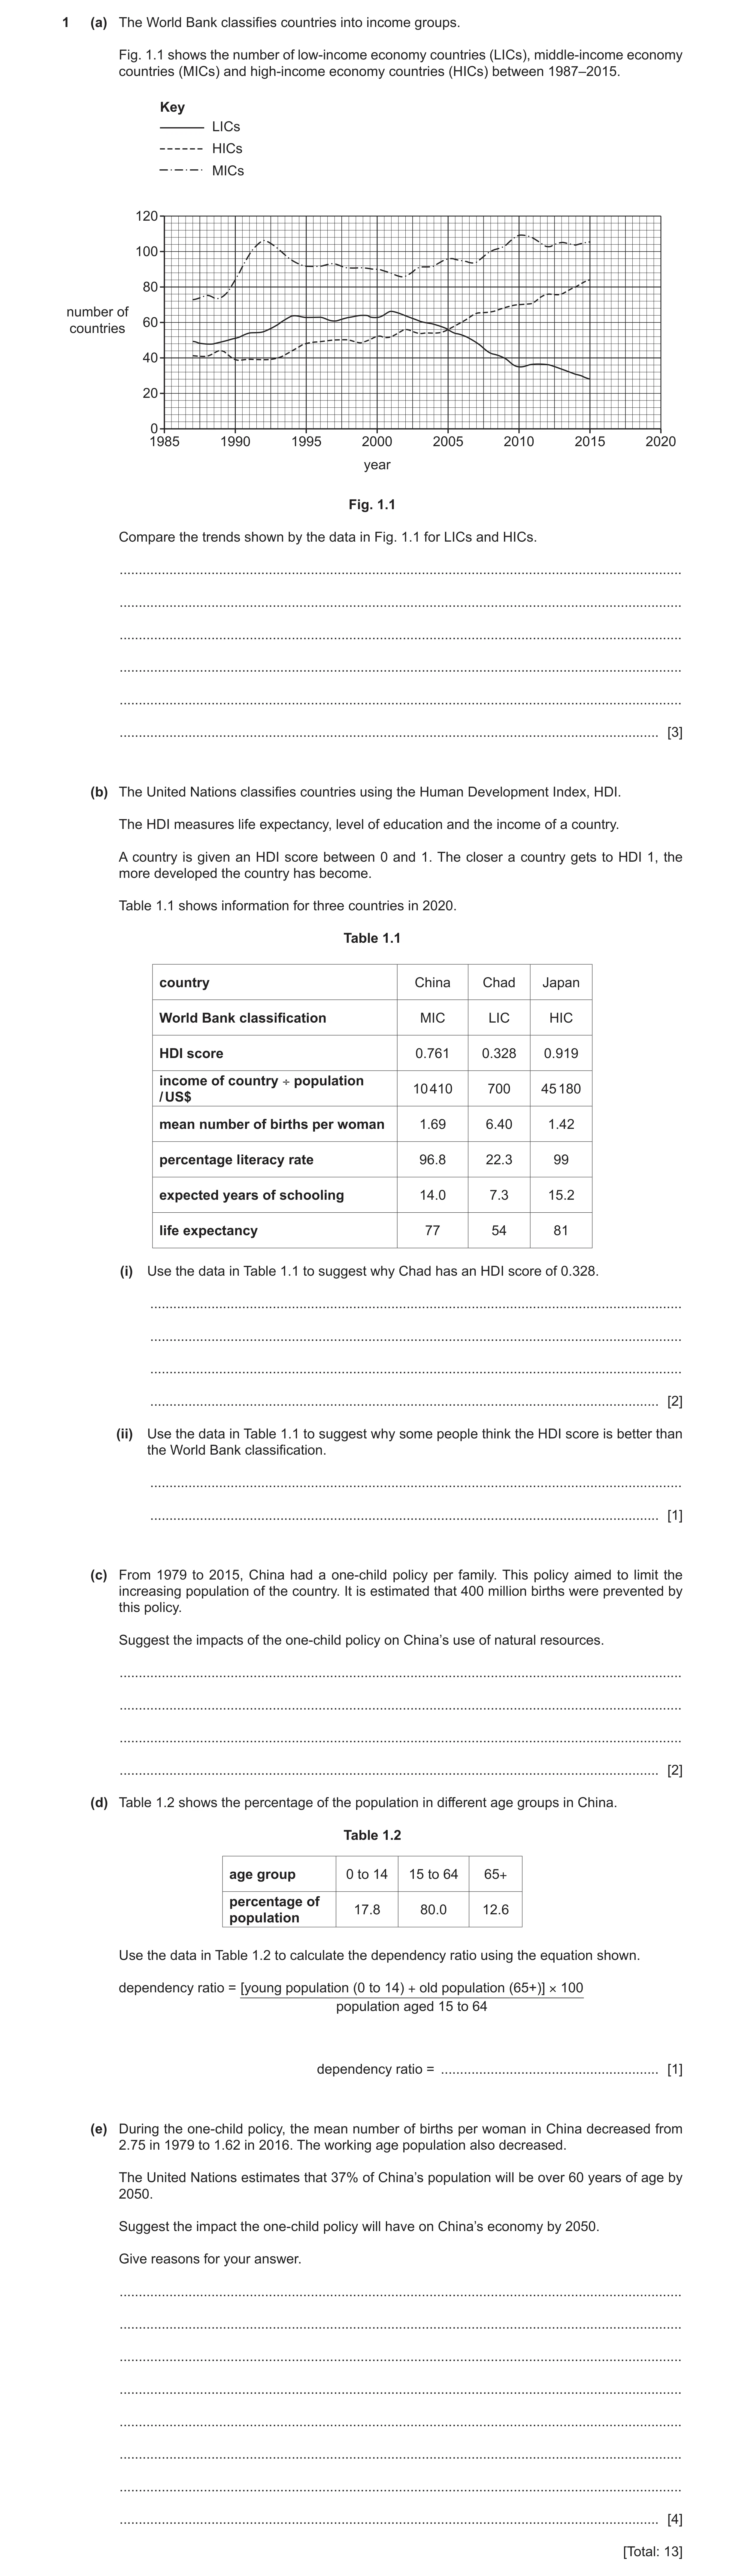
1 (a) The World Bank classifies countries into income groups. Fig. 1.1 shows the number of low-income economy countries (LICs), middle-income economy countries (MICs) and high-income economy countries (HICs) between 1987–2015. Key LICs HICs MICs 120 100 80 number of 60 countries 40 20 0 1985 1990 1995 2000 2005 2010 2015 2020 year Fig. 1.1 Compare the trends shown by the data in Fig. 1.1 for LICs and HICs. … … … … … … [3] (b) The United Nations classifies countries using the Human Development Index, HDI. The HDI measures life expectancy, level of education and the income of a country. A country is given an HDI score between 0 and 1. The closer a country gets to HDI 1, the more developed the country has become. Table 1.1 shows information for three countries in 2020. Table 1.1 country China Chad Japan World Bank classification MIC LIC HIC HDI score 0.761 0.328 0.919 income of country ÷ population 10 410 700 45 180 / US$ mean number of births per woman 1.69 6.40 1.42 percentage literacy rate 96.8 22.3 99 expected years of schooling 14.0 7.3 15.2 life expectancy 77 54 81 (i) Use the data in Table 1.1 to suggest why Chad has an HDI score of 0.328. … … … … [2] (ii) Use the data in Table 1.1 to suggest why some people think the HDI score is better than the World Bank classification. … … [1] (c) From 1979 to 2015, China had a one-child policy per family. This policy aimed to limit the increasing population of the country. It is estimated that 400 million births were prevented by this policy. Suggest the impacts of the one-child policy on China’s use of natural resources. … … … … [2] (d) Table 1.2 shows the percentage of the population in different age groups in China. Table 1.2 age group 0 to 14 15 to 64 65+ percentage of 17.8 80.0 12.6 population Use the data in Table 1.2 to calculate the dependency ratio using the equation shown. dependency ratio = [young population (0 to 14) + old population (65+)] × 100 population aged 15 to 64 dependency ratio = … [1] (e) During the one-child policy, the mean number of births per woman in China decreased from 2.75 in 1979 to 1.62 in 2016. The working age population also decreased. The United Nations estimates that 37% of China’s population will be over 60 years of age by 2050. Suggest the impact the one-child policy will have on China’s economy by 2050. Give reasons for your answer. … … … … … … … … [4] [Total: 13]
13 marks
Mark scheme: Question Answer Marks 1(a) any three comparisons from: 3 overall HICs increased and LICs decreased; 2005 LICs and HICs equal / HICs overtake LICs at crossover point; after 2005, LICs decreasing and HICs increasing / before 2005, HICs always lower than LICs; before 2005, both fluctuate; quote comparative (quantitative or qualitative) data e.g. in 2015 there were 84 HICs compared to 28 LICs or in 1987 LICs were higher than HICs; 1(b)(i) any two from: 2 shows Chad is a developing country / less developed; low level of education / low number of years of schooling / low literacy; low income / Chad is a LIC; low life expectancy / life expectancy only 54; high birth rate; 1(b)(ii) any one from: 1 China: World Bank classification is MIC but HDI score is high; HDI shows how close the country is to a boundary whereas the World Bank classification does not allow this / HDI more specific (e.g. Japan and China only 0.158 difference but classes an HIC and MIC); World Bank classification only measures income / HDI measures more factors / how developed a country is; 1(c) any two from: 2 less use of (natural) resources / reduces depletion of resources; e.g. fossil fuels / food / land / water; so conserved for future generations / idea of sustainability / preserved better; improved food / water / energy security; 1(d) 38; 1 1(e) any three from: 4 reduced economic growth / economy decreases; lower numbers in the work place / high number of job vacancies; lower tax revenues; greater spending on pensions; greater spending on health care; less experience in the workplace; less innovation;
This question in 8291/21 Oct/Nov 2023
Q14 · The World Bank classifies countries into income groups 8291/23 Oct/Nov 2023
1 (a) The World Bank classifies countries into income groups. Fig. 1.1 shows the number of low-income economy countries (LICs), middle-income economy countries (MICs) and high-income economy countries (HICs) between 1987–2015. Key LICs HICs MICs 120 100 80 number of 60 countries 40 20 0 1985 1990 1995 2000 2005 2010 2015 2020 year Fig. 1.1 Compare the trends shown by the data in Fig. 1.1 for LICs and HICs. … … … … … … [3] (b) The United Nations classifies countries using the Human Development Index, HDI. The HDI measures life expectancy, level of education and the income of a country. A country is given an HDI score between 0 and 1. The closer a country gets to HDI 1, the more developed the country has become. Table 1.1 shows information for three countries in 2020. Table 1.1 country China Chad Japan World Bank classification MIC LIC HIC HDI score 0.761 0.328 0.919 income of country ÷ population 10 410 700 45 180 / US$ mean number of births per woman 1.69 6.40 1.42 percentage literacy rate 96.8 22.3 99 expected years of schooling 14.0 7.3 15.2 life expectancy 77 54 81 (i) Use the data in Table 1.1 to suggest why Chad has an HDI score of 0.328. … … … … [2] (ii) Use the data in Table 1.1 to suggest why some people think the HDI score is better than the World Bank classification. … … [1] (c) From 1979 to 2015, China had a one-child policy per family. This policy aimed to limit the increasing population of the country. It is estimated that 400 million births were prevented by this policy. Suggest the impacts of the one-child policy on China’s use of natural resources. … … … … [2] (d) Table 1.2 shows the percentage of the population in different age groups in China. Table 1.2 age group 0 to 14 15 to 64 65+ percentage of 17.8 80.0 12.6 population Use the data in Table 1.2 to calculate the dependency ratio using the equation shown. dependency ratio = [young population (0 to 14) + old population (65+)] × 100 population aged 15 to 64 dependency ratio = … [1] (e) During the one-child policy, the mean number of births per woman in China decreased from 2.75 in 1979 to 1.62 in 2016. The working age population also decreased. The United Nations estimates that 37% of China’s population will be over 60 years of age by 2050. Suggest the impact the one-child policy will have on China’s economy by 2050. Give reasons for your answer. … … … … … … … … [4] [Total: 13]
13 marks
Mark scheme: Question Answer Marks 1(a) any three comparisons from: 3 overall HICs increased and LICs decreased; 2005 LICs and HICs equal / HICs overtake LICs at crossover point; after 2005, LICs decreasing and HICs increasing / before 2005, HICs always lower than LICs; before 2005, both fluctuate; quote comparative (quantitative or qualitative) data e.g. in 2015 there were 84 HICs compared to 28 LICs or in 1987 LICs were higher than HICs; 1(b)(i) any two from: 2 shows Chad is a developing country / less developed; low level of education / low number of years of schooling / low literacy; low income / Chad is a LIC; low life expectancy / life expectancy only 54; high birth rate; 1(b)(ii) any one from: 1 China: World Bank classification is MIC but HDI score is high; HDI shows how close the country is to a boundary whereas the World Bank classification does not allow this / HDI more specific (e.g. Japan and China only 0.158 difference but classes an HIC and MIC); World Bank classification only measures income / HDI measures more factors / how developed a country is; 1(c) any two from: 2 less use of (natural) resources / reduces depletion of resources; e.g. fossil fuels / food / land / water; so conserved for future generations / idea of sustainability / preserved better; improved food / water / energy security; 1(d) 38; 1 1(e) any three from: 4 reduced economic growth / economy decreases; lower numbers in the work place / high number of job vacancies; lower tax revenues; greater spending on pensions; greater spending on health care; less experience in the workplace; less innovation;
This question in 8291/23 Oct/Nov 2023
Q15 · In 2022, the world population was 7.9 billion 8291/22 May/June 2025
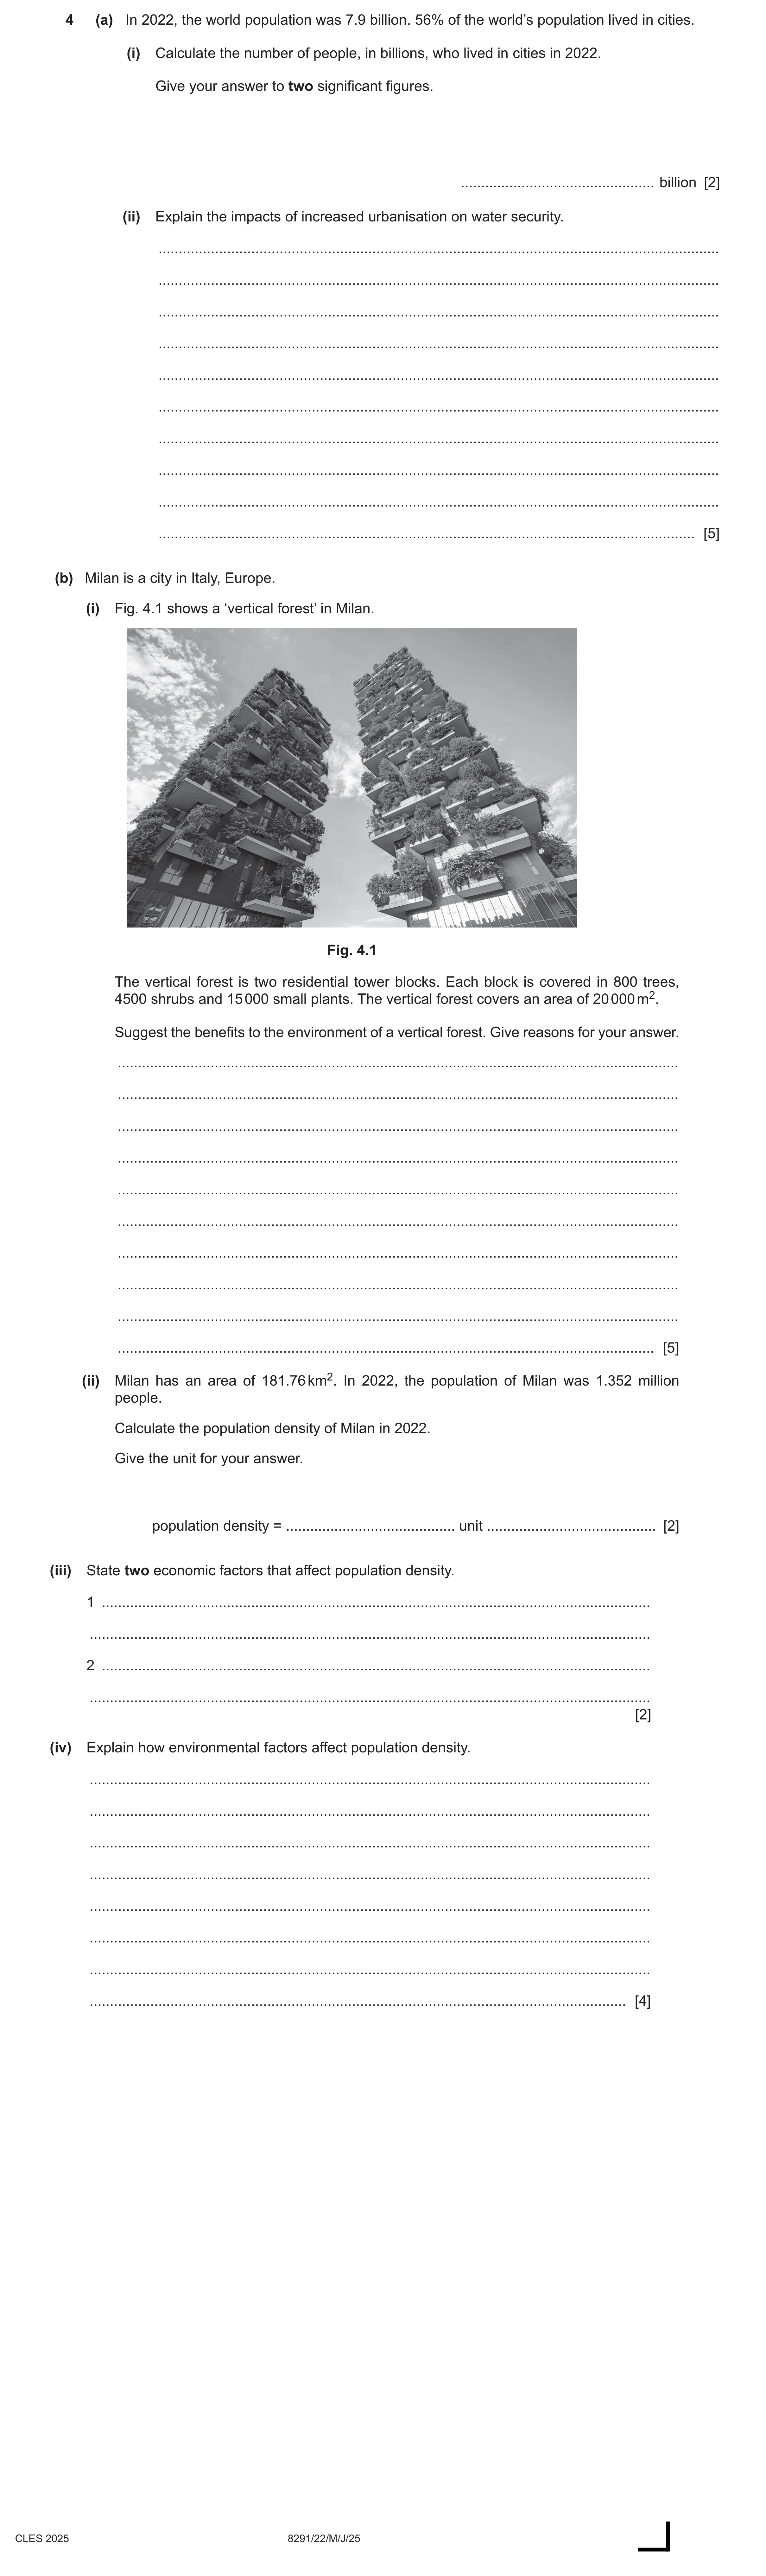
4 (a) In 2022, the world population was 7.9 billion. 56% of the world’s population lived in cities. (i) Calculate the number of people, in billions, who lived in cities in 2022. Give your answer to two significant figures. … billion [2] (ii) Explain the impacts of increased urbanisation on water security. … … … … … … … … … … [5] (b) Milan is a city in Italy, Europe. (i) Fig. 4.1 shows a ‘vertical forest’ in Milan. Fig. 4.1 The vertical forest is two residential tower blocks. Each block is covered in 800 trees, 4500 shrubs and 15 000 small plants. The vertical forest covers an area of 20 000 m2. Suggest the benefits to the environment of a vertical forest. Give reasons for your answer. … … … … … … … … … … [5] (ii) Milan has an area of 181.76 km2. In 2022, the population of Milan was 1.352 million people. Calculate the population density of Milan in 2022. Give the unit for your answer. population density = … unit … [2] (iii) State two economic factors that affect population density. 1 … … 2 … … [2] (iv) Explain how environmental factors affect population density. … … … … … … … … [4] CLES 2025 8291/22/M/J/25
20 marks
Mark scheme: 4(a)(i) MP1 4.424; 2 MP2 4.4; 4(a)(ii) any five from: 5 MP1 increase cost of water; MP2 greater demand / demand greater than supply; MP3 more water intensive e.g. more manufacturing or use of domestic appliance; MP4 increased burden on sanitation services; MP5 leads to contamination of water; MP6 disruption of water cycle; MP7 more run-off; MP8 more groundwater extracted; 4(b)(i) any five from: 5 MP1 plants remove carbon dioxide from the atmosphere; MP2 carbon dioxide + water → oxygen + glucose; MP3 by photosynthesis; MP4 reduces impact of, global warming / climate change; MP5 habitat for organisms / increase biodiversity; MP6 absorb / trap atmospheric pollutants e.g. particulates; MP7 increase interception of rain; MP8 trees can cool local temperatures; 4(b)(ii) MP1 7438(.380); 2 MP2 people / km2; 4(b)(iii) any two from: 2 MP1 (availability) of jobs; MP2 (rate of pay) for jobs; MP3 cost of healthcare; MP4 cost of land / cost of houses; MP5 level of taxation; MP6 cost of education; MP7 available transport services; 4(b)(iv) any four from: 4 MP1 relief of land / terrain AND low land enables more building / mountains, limits building / flood plains more liable to flood; MP2 tectonic activity / natural disasters / earthquakes / volcanoes / tsunamis AND discourages settlement; MP3 extreme weather / extreme temperatures / desert conditions AND prevents or discourages settlement; MP4 enough water AND to grow crops / human survival; MP5 abundance of resources AND e.g. coal/oil/wood/fishing enables trade or provides food; MP6 high soil fertility AND enables enough food to be grown; AVP; 4(c)(i) 2 MP1 line drawn where two bars meet between 65–69 and 60–64; MP2 line drawn where two bars meet between 15–19 and 10–14; 4(c)(ii) any two from for a LIC: 2 MP1 higher number of young dependents; MP2 wide base; MP3 fewer people reach older age; MP4 tapers or become narrower / height of pyramid lower;
This question in 8291/22 May/June 2025
Q16 · In 2022, the world population was 7.9 billion 8291/23 May/June 2025
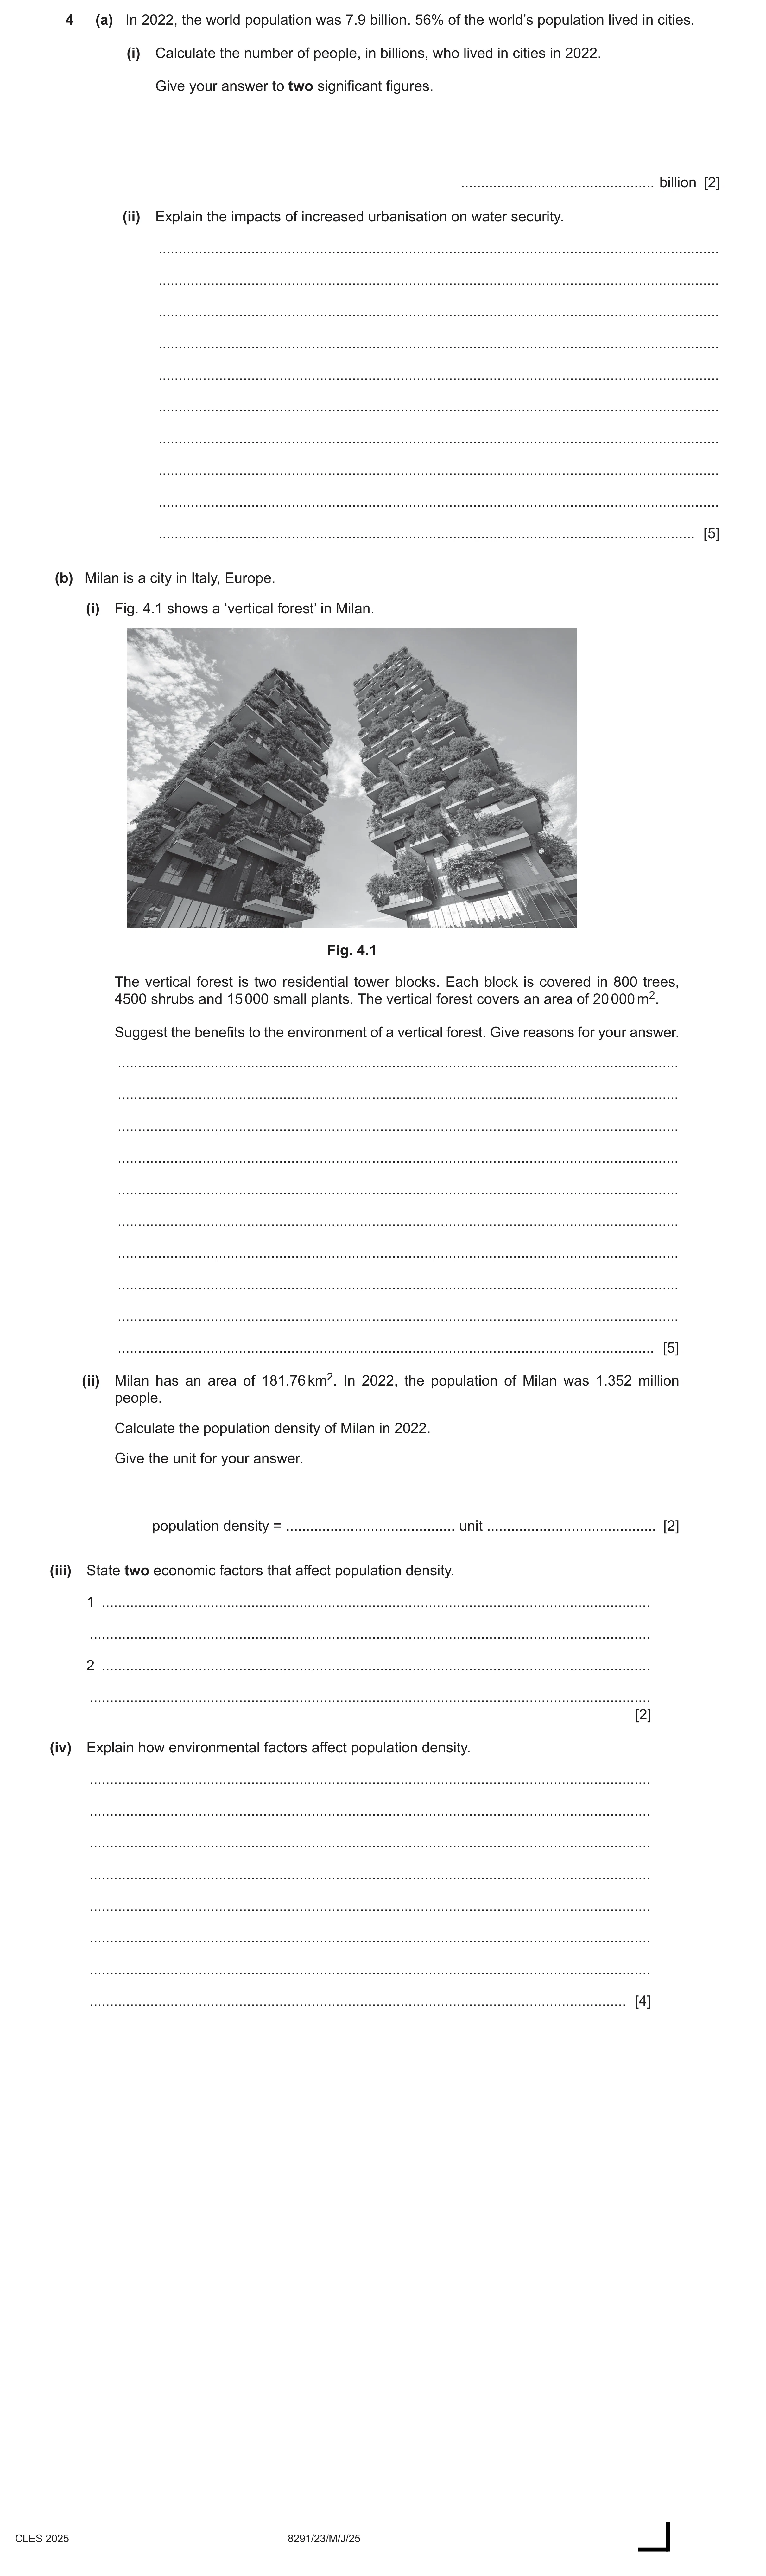
4 (a) In 2022, the world population was 7.9 billion. 56% of the world’s population lived in cities. (i) Calculate the number of people, in billions, who lived in cities in 2022. Give your answer to two significant figures. … billion [2] (ii) Explain the impacts of increased urbanisation on water security. … … … … … … … … … … [5] (b) Milan is a city in Italy, Europe. (i) Fig. 4.1 shows a ‘vertical forest’ in Milan. Fig. 4.1 The vertical forest is two residential tower blocks. Each block is covered in 800 trees, 4500 shrubs and 15 000 small plants. The vertical forest covers an area of 20 000 m2. Suggest the benefits to the environment of a vertical forest. Give reasons for your answer. … … … … … … … … … … [5] (ii) Milan has an area of 181.76 km2. In 2022, the population of Milan was 1.352 million people. Calculate the population density of Milan in 2022. Give the unit for your answer. population density = … unit … [2] (iii) State two economic factors that affect population density. 1 … … 2 … … [2] (iv) Explain how environmental factors affect population density. … … … … … … … … [4] CLES 2025 8291/23/M/J/25
20 marks
Mark scheme: 4(a)(i) MP1 4.424; 2 MP2 4.4; 4(a)(ii) any five from: 5 MP1 increase cost of water; MP2 greater demand / demand greater than supply; MP3 more water intensive e.g. more manufacturing or use of domestic appliance; MP4 increased burden on sanitation services; MP5 leads to contamination of water; MP6 disruption of water cycle; MP7 more run-off; MP8 more groundwater extracted; 4(b)(i) any five from: 5 MP1 plants remove carbon dioxide from the atmosphere; MP2 carbon dioxide + water → oxygen + glucose; MP3 by photosynthesis; MP4 reduces impact of, global warming / climate change; MP5 habitat for organisms / increase biodiversity; MP6 absorb / trap atmospheric pollutants e.g. particulates; MP7 increase interception of rain; MP8 trees can cool local temperatures; 4(b)(ii) MP1 7438(.380); 2 MP2 people / km2; 4(b)(iii) any two from: 2 MP1 (availability) of jobs; MP2 (rate of pay) for jobs; MP3 cost of healthcare; MP4 cost of land / cost of houses; MP5 level of taxation; MP6 cost of education; MP7 available transport services; 4(b)(iv) any four from: 4 MP1 relief of land / terrain AND low land enables more building / mountains, limits building / flood plains more liable to flood; MP2 tectonic activity / natural disasters / earthquakes / volcanoes / tsunamis AND discourages settlement; MP3 extreme weather / extreme temperatures / desert conditions AND prevents or discourages settlement; MP4 enough water AND to grow crops / human survival; MP5 abundance of resources AND e.g. coal/oil/wood/fishing enables trade or provides food; MP6 high soil fertility AND enables enough food to be grown; AVP; 4(c)(i) 2 MP1 line drawn where two bars meet between 65–69 and 60–64; MP2 line drawn where two bars meet between 15–19 and 10–14; 4(c)(ii) any two from for a LIC: 2 MP1 higher number of young dependents; MP2 wide base; MP3 fewer people reach older age; MP4 tapers or become narrower / height of pyramid lower;
This question in 8291/23 May/June 2025
 1 / 33
 2 / 33
 3 / 33
 4 / 33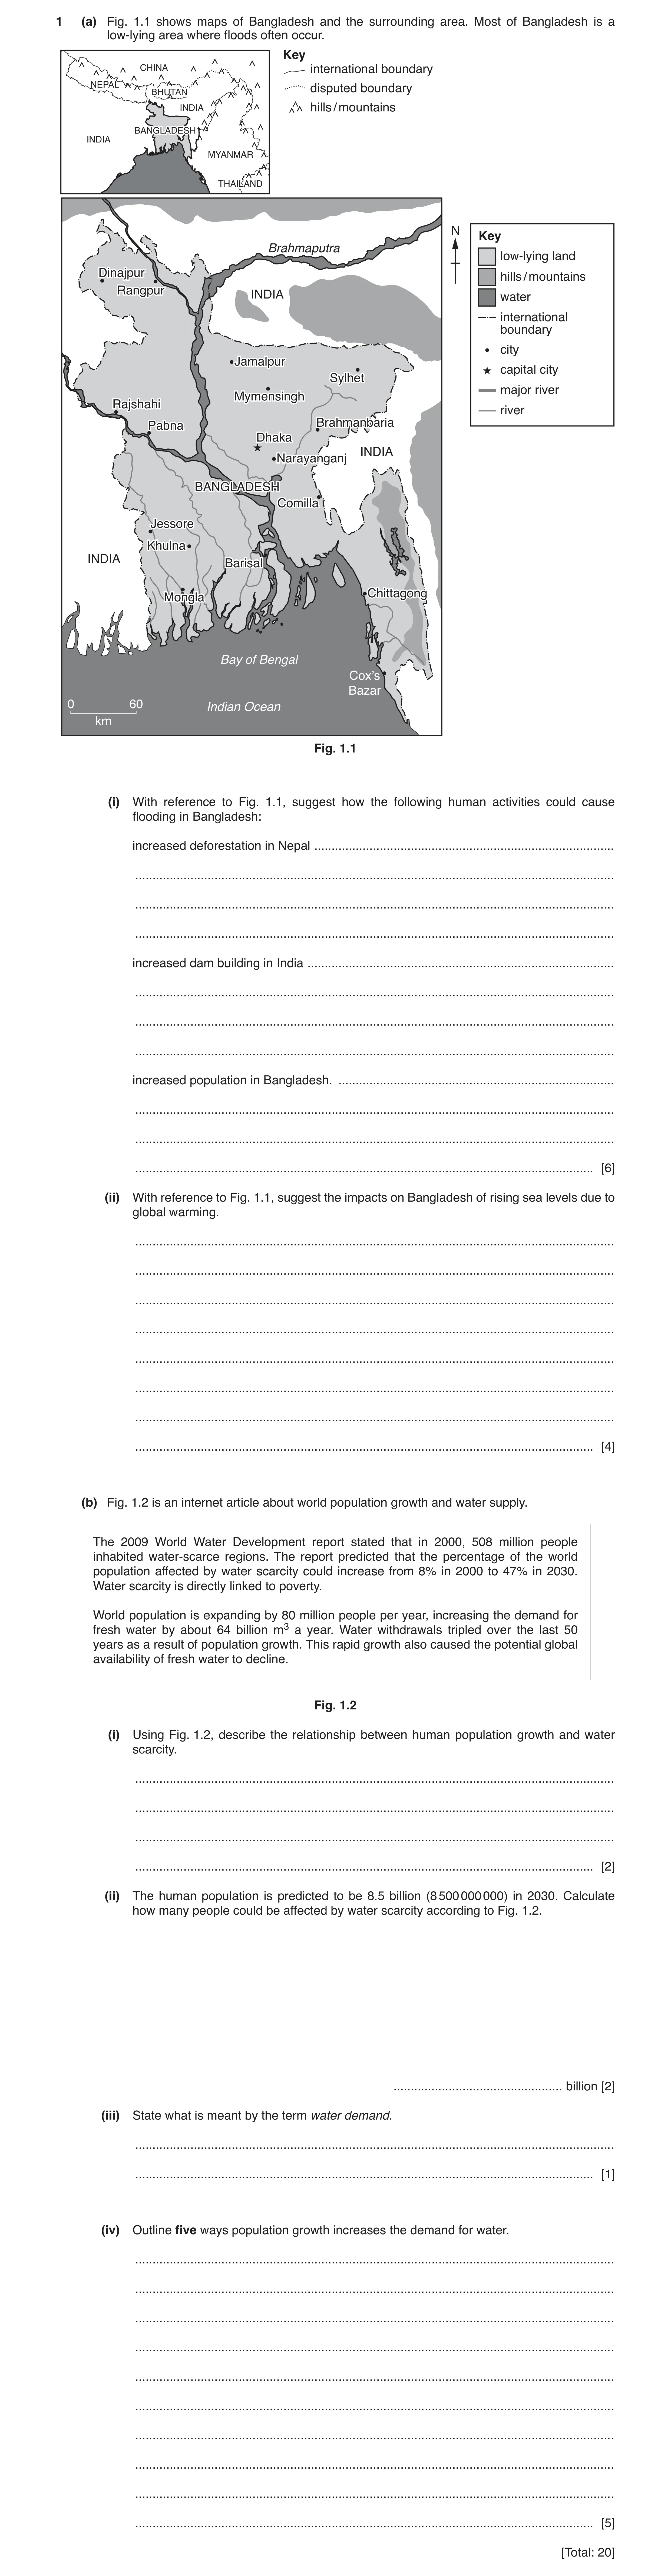
 8 / 33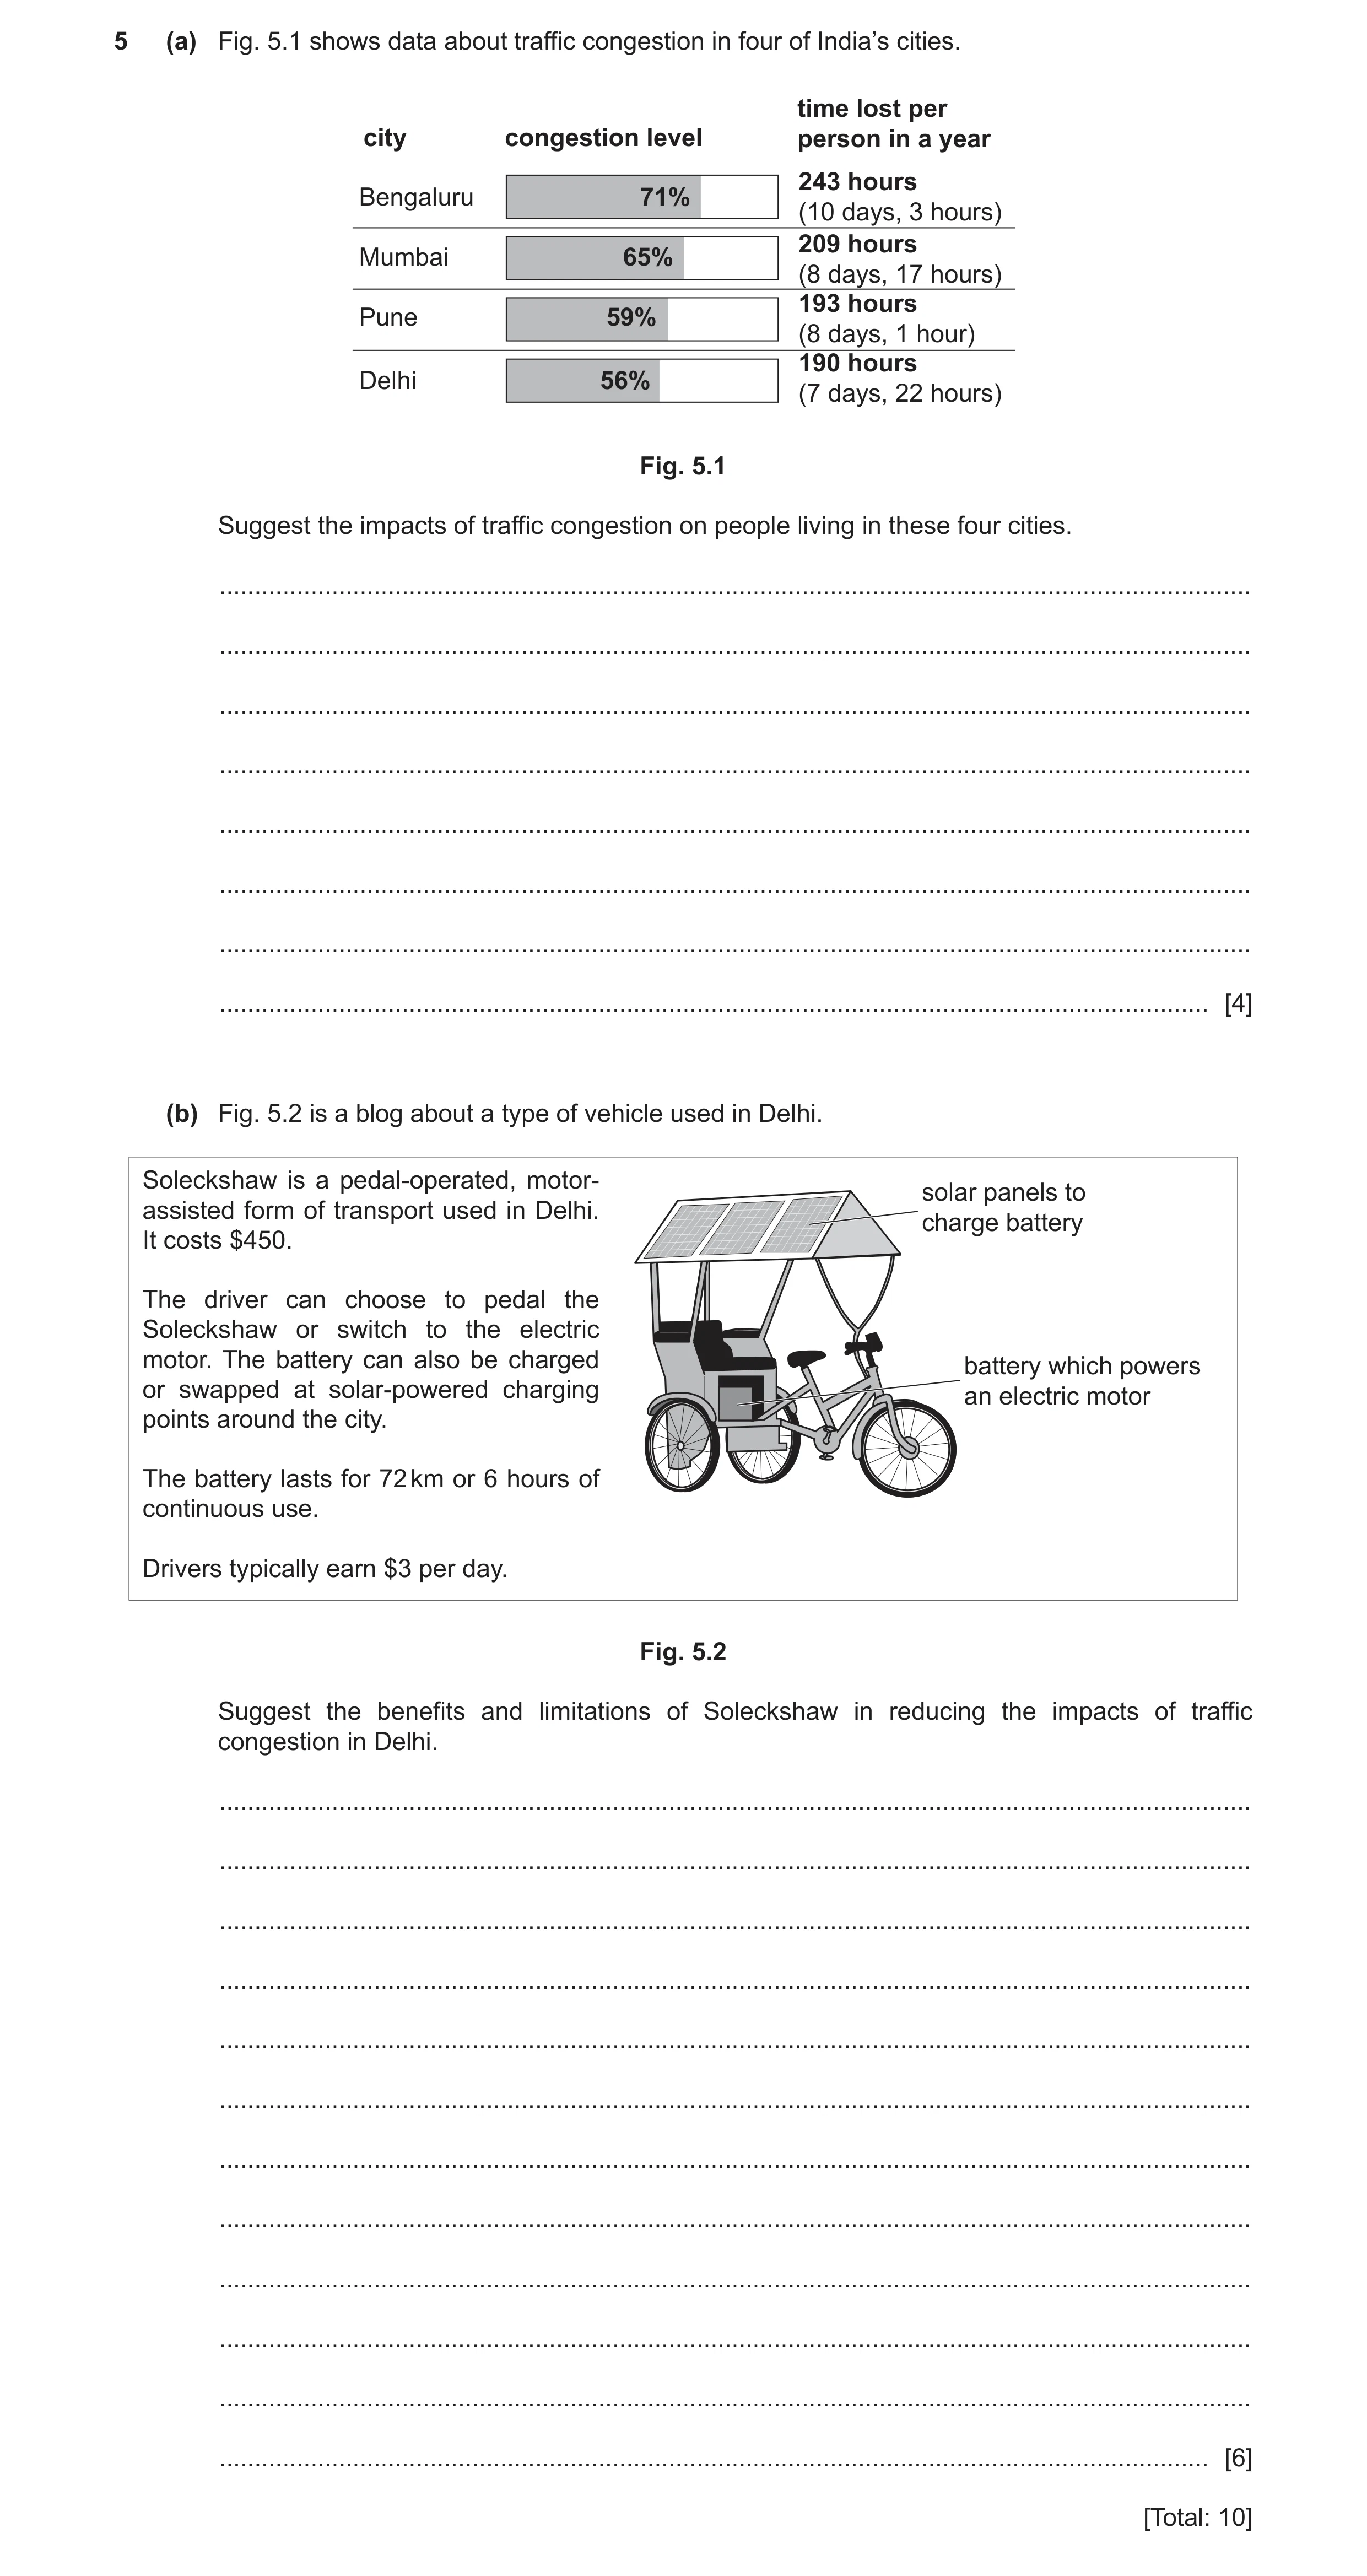

 40
40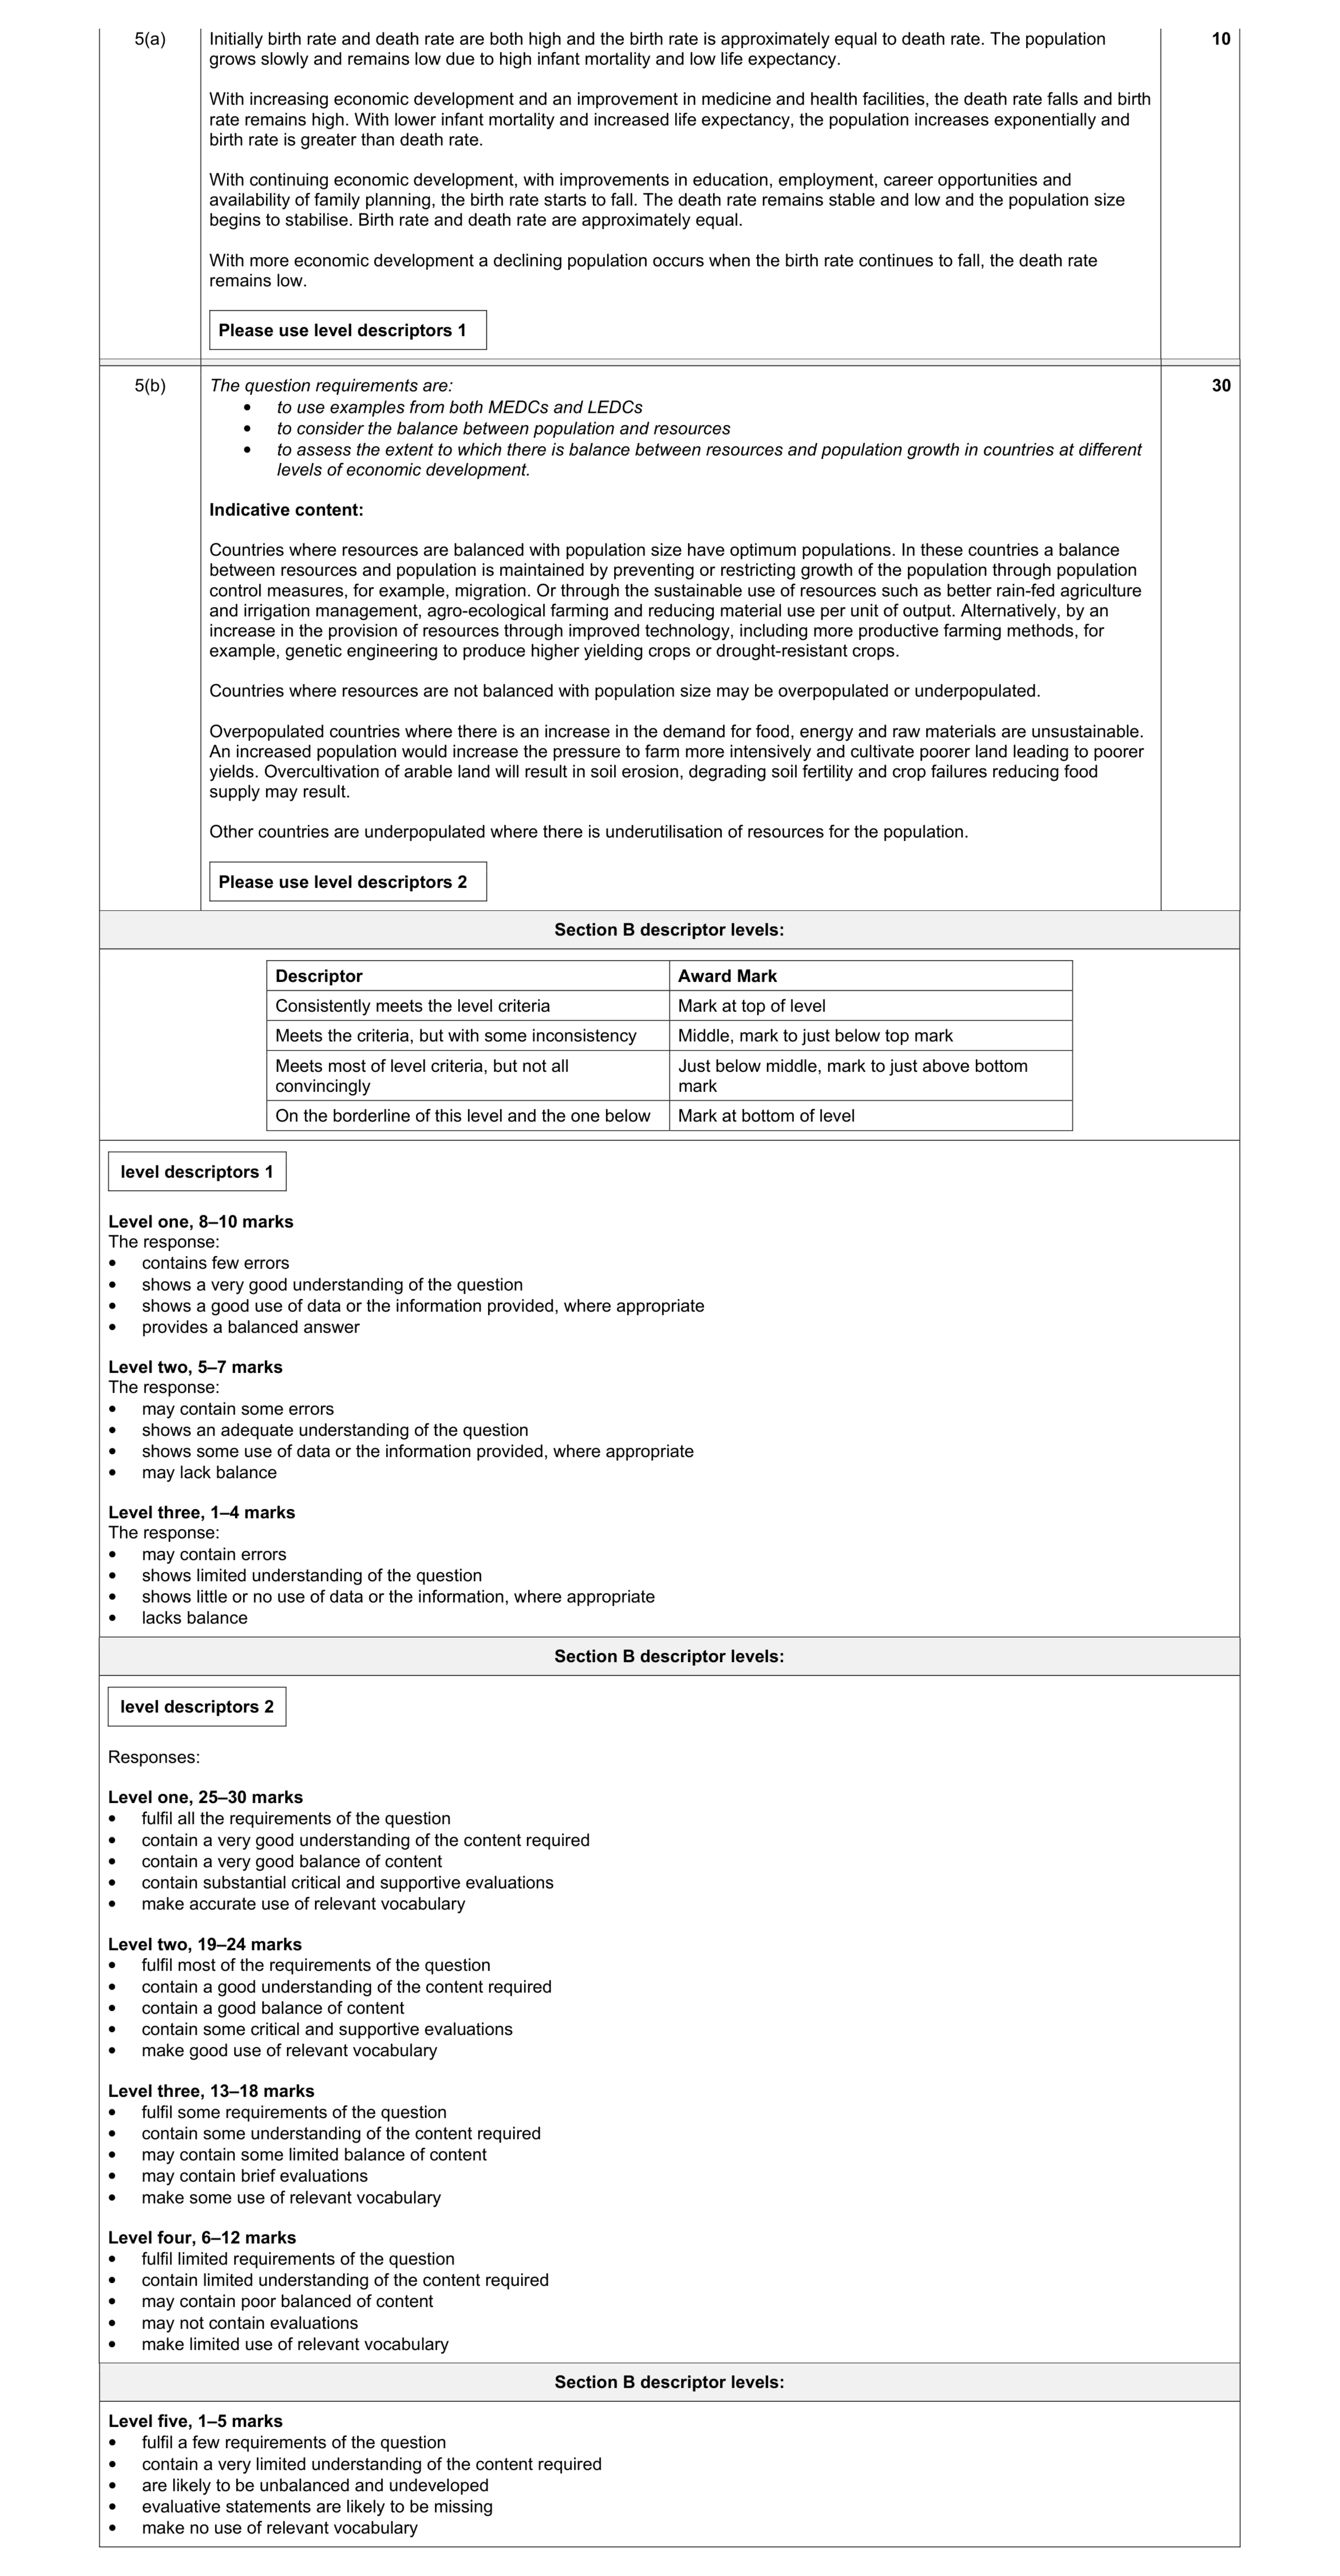 40
40 40
40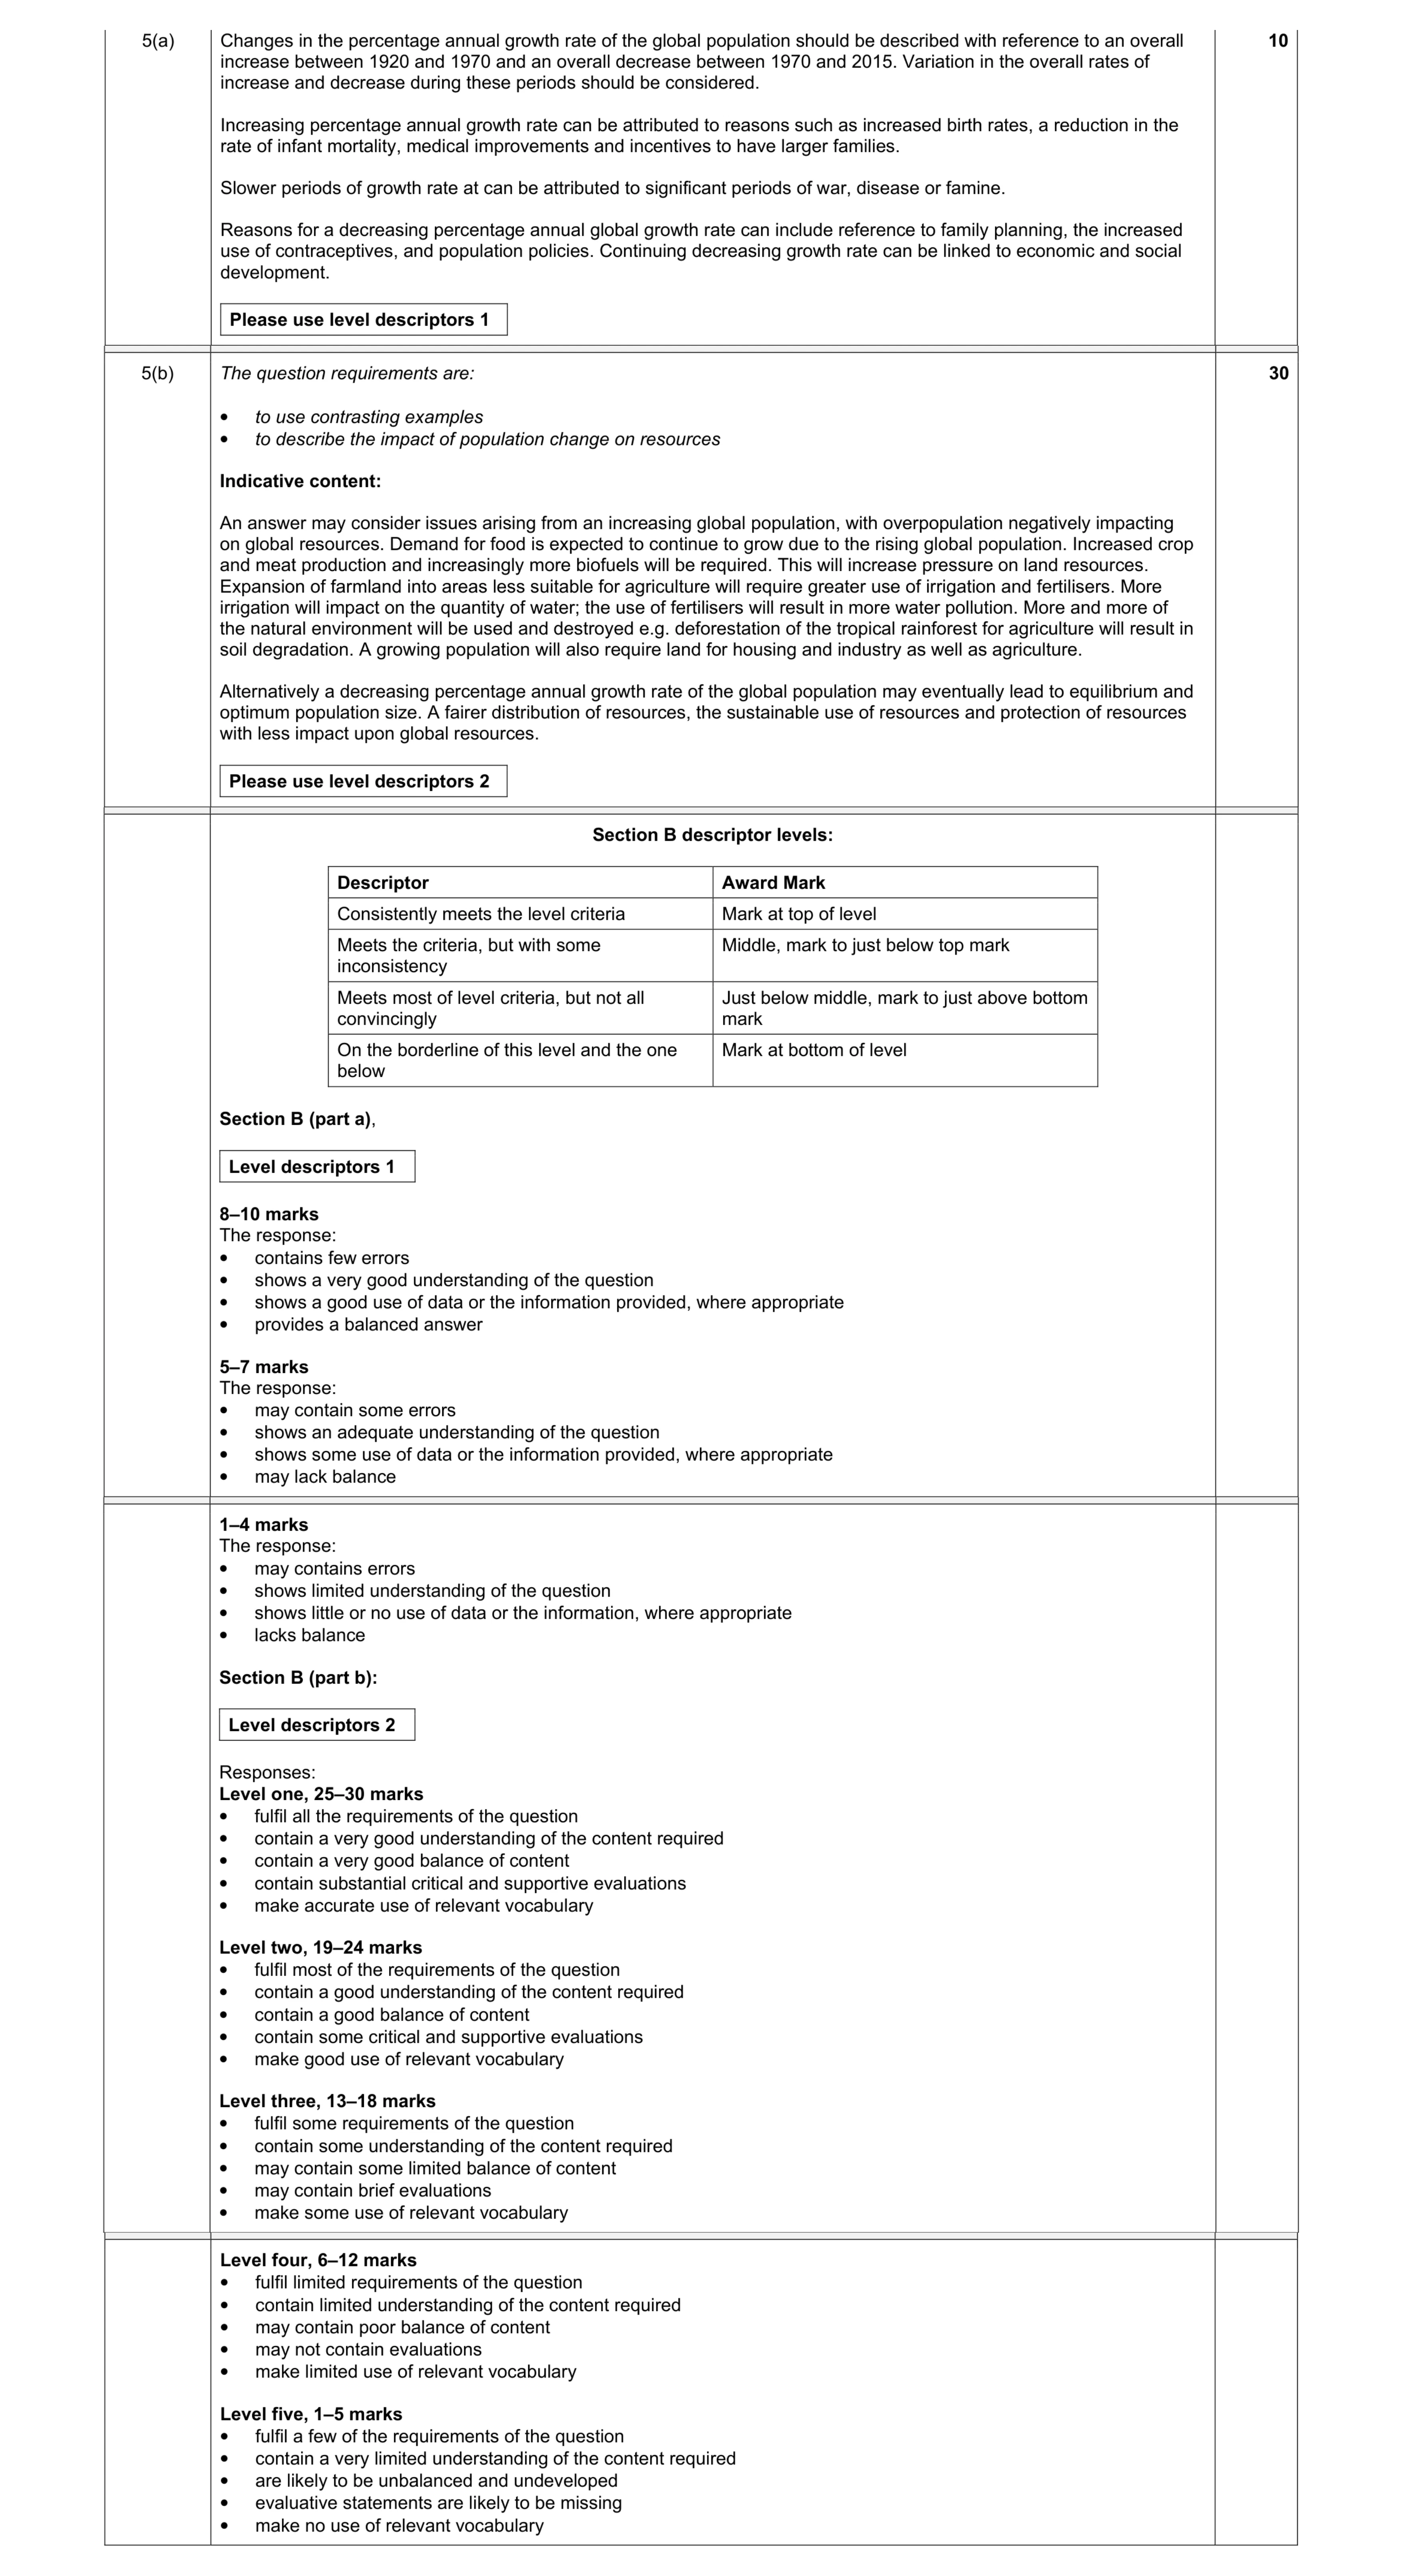 40
40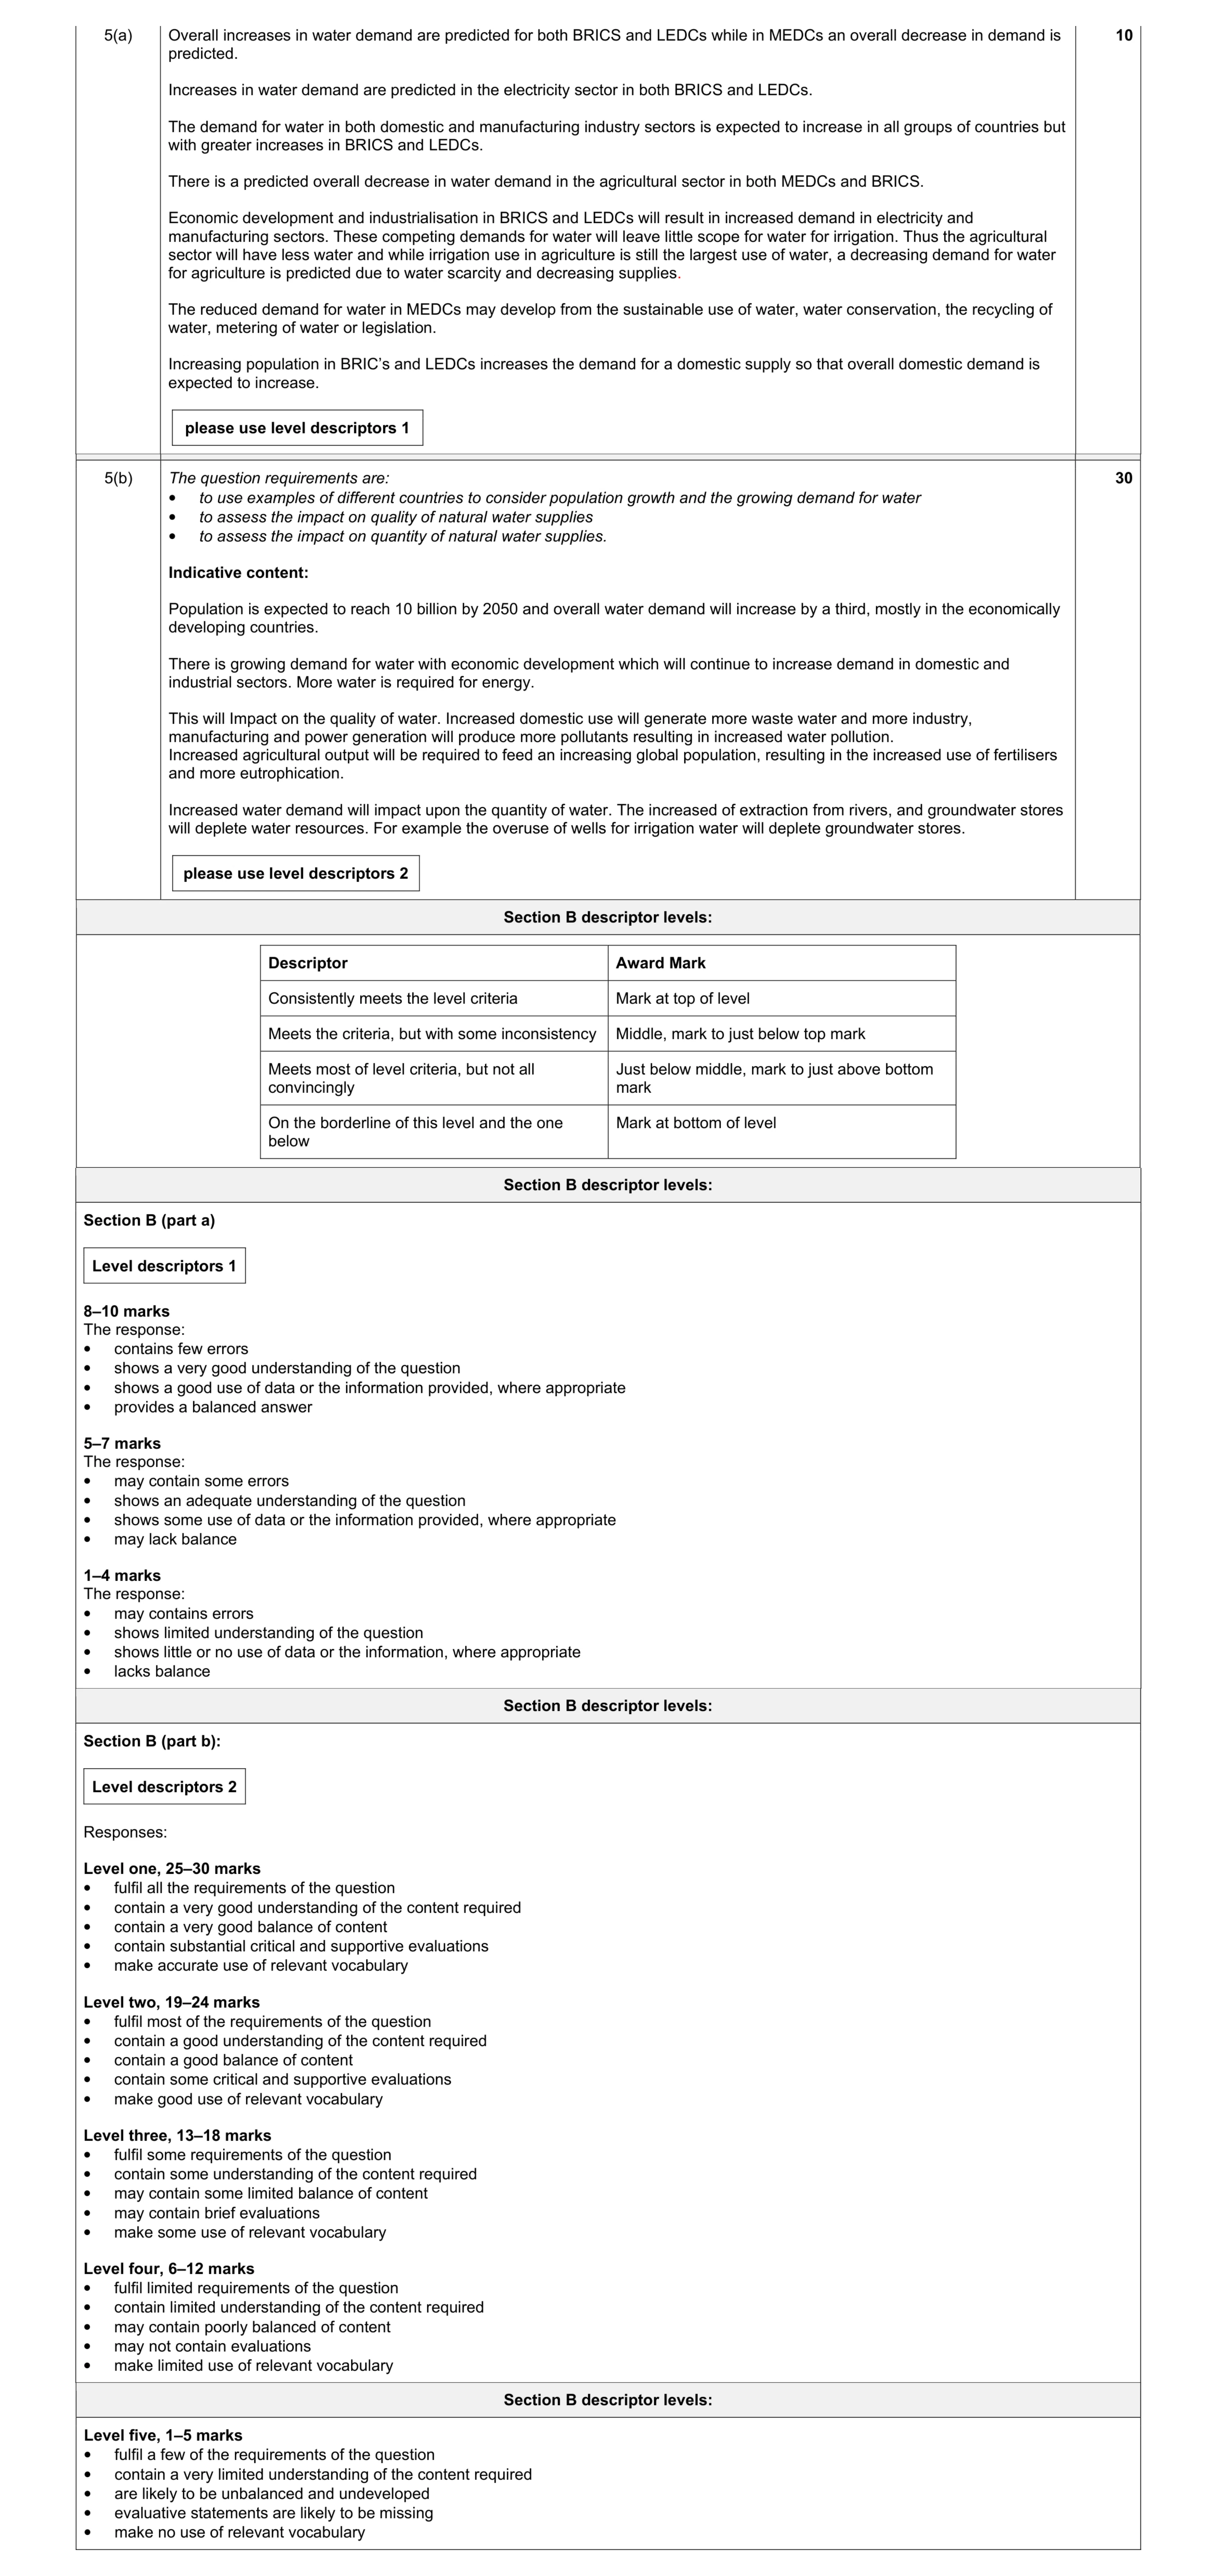 40
40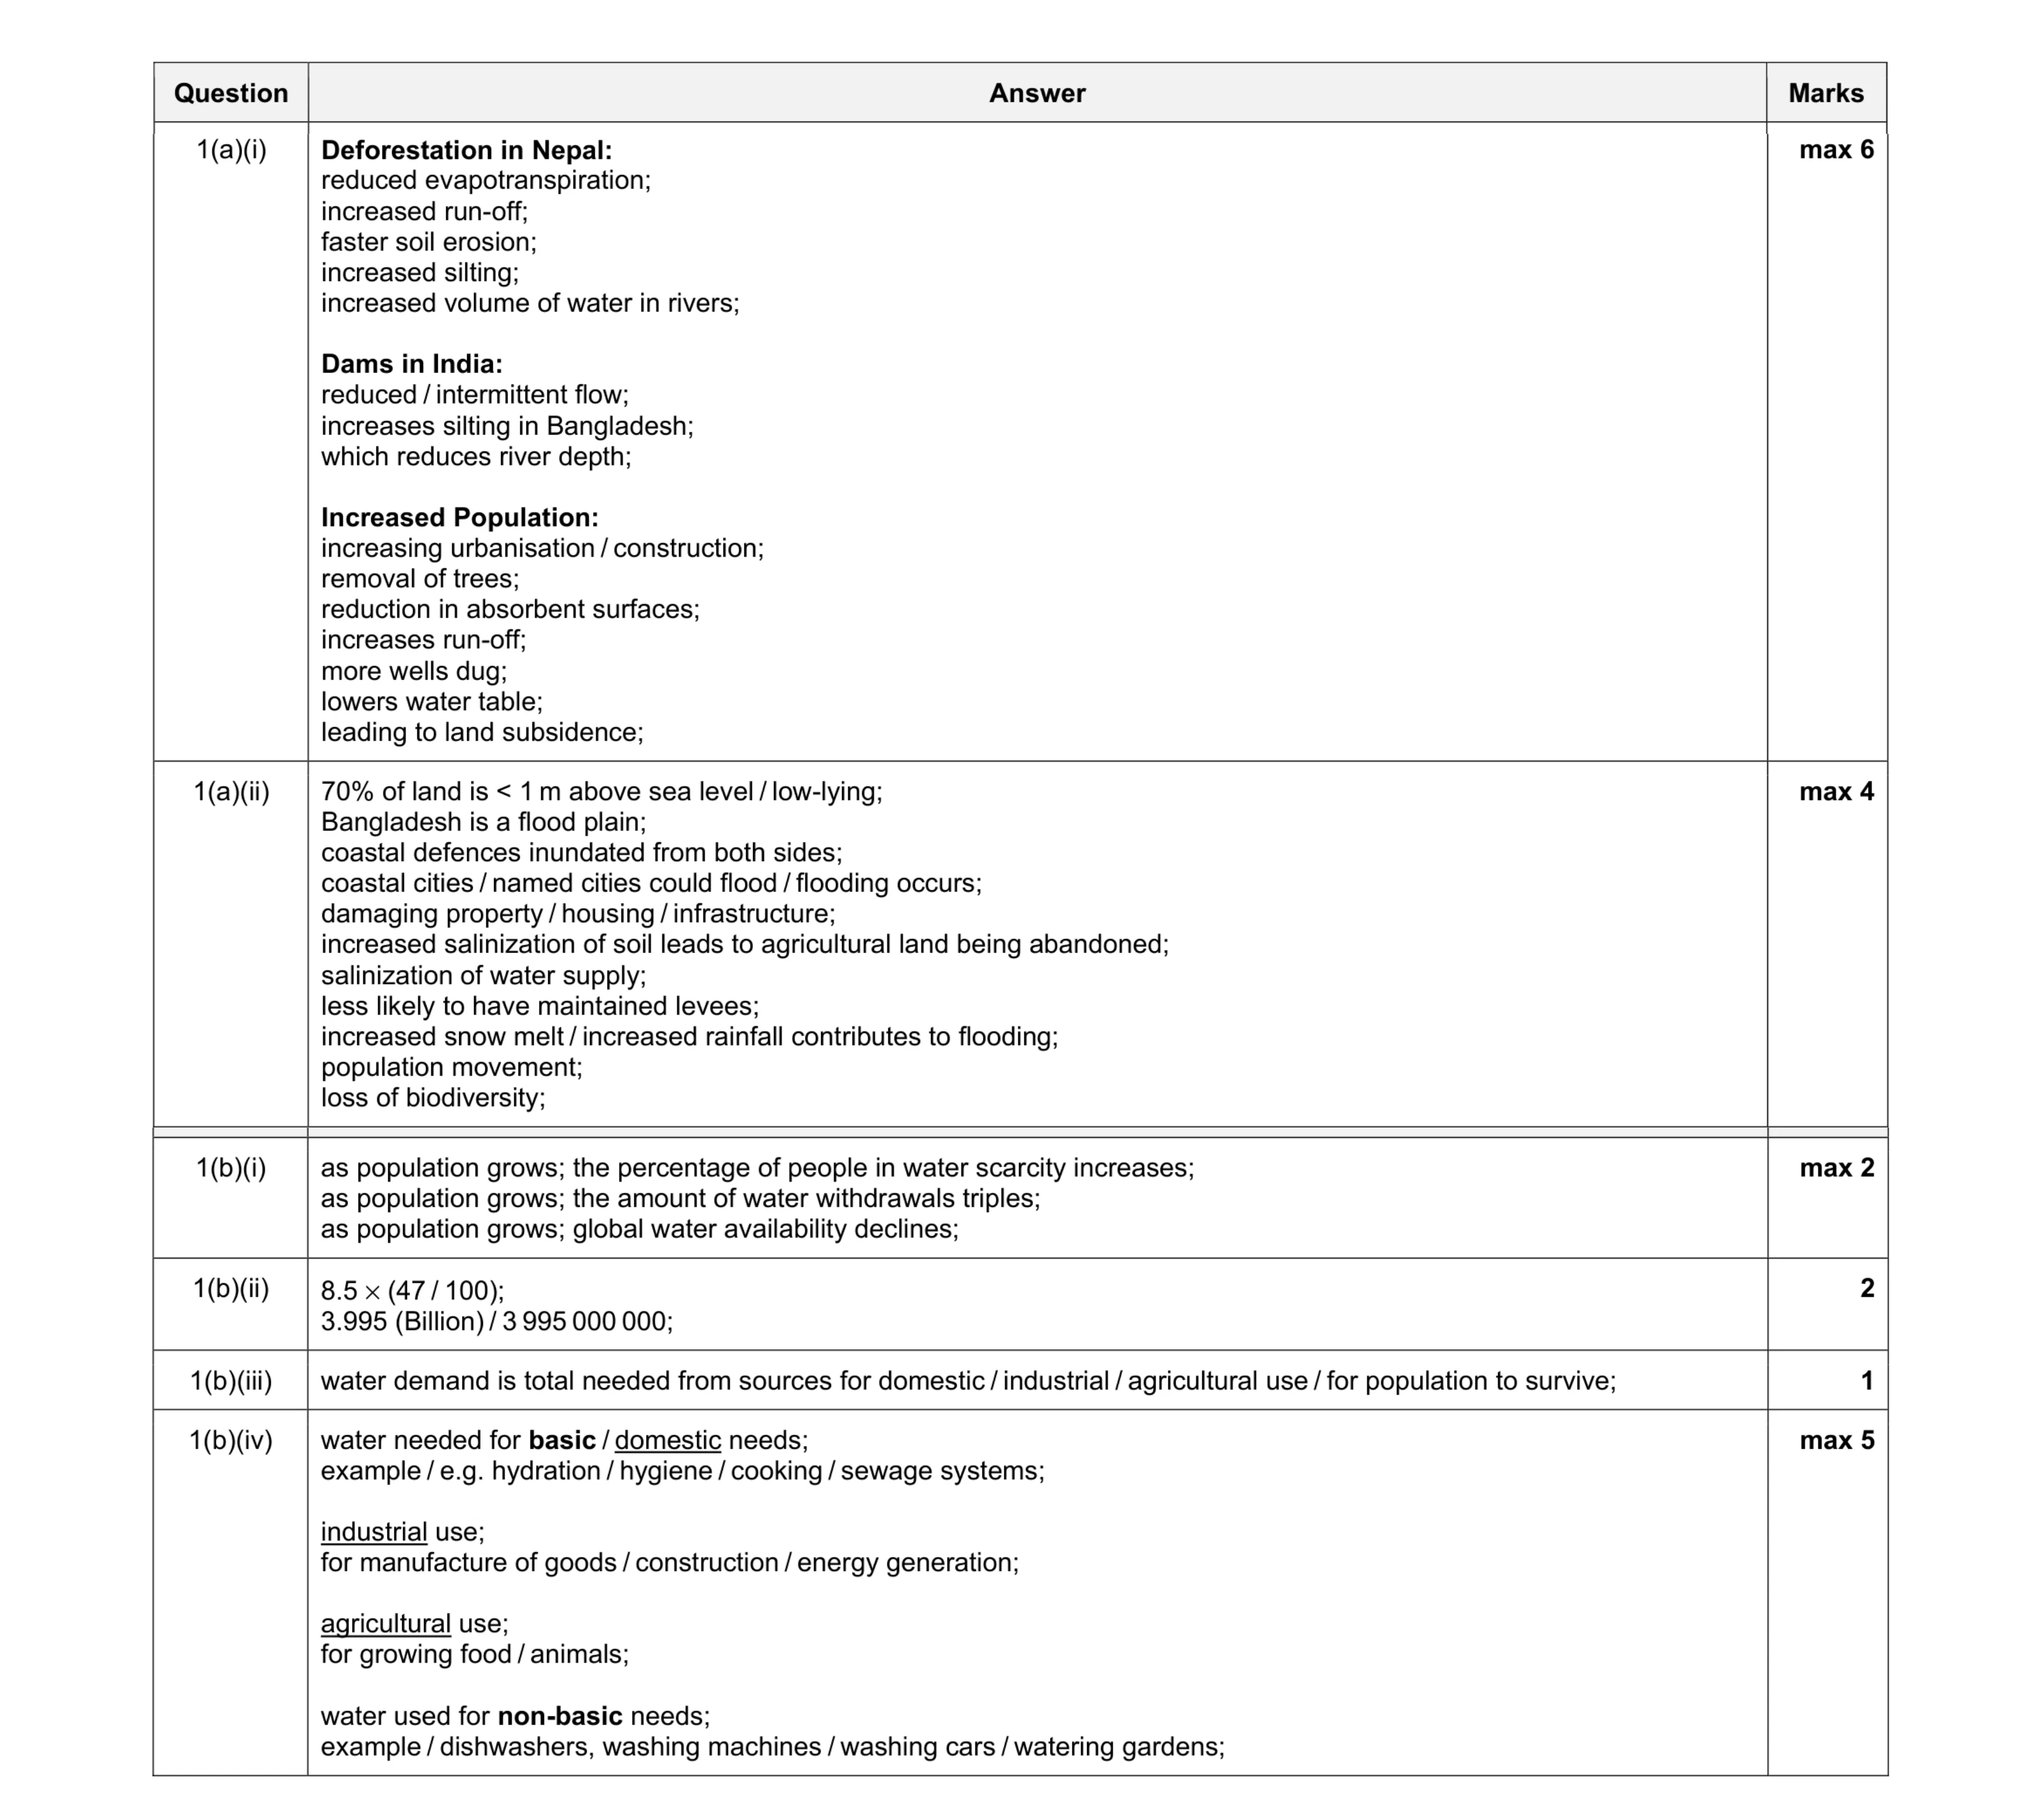 20
20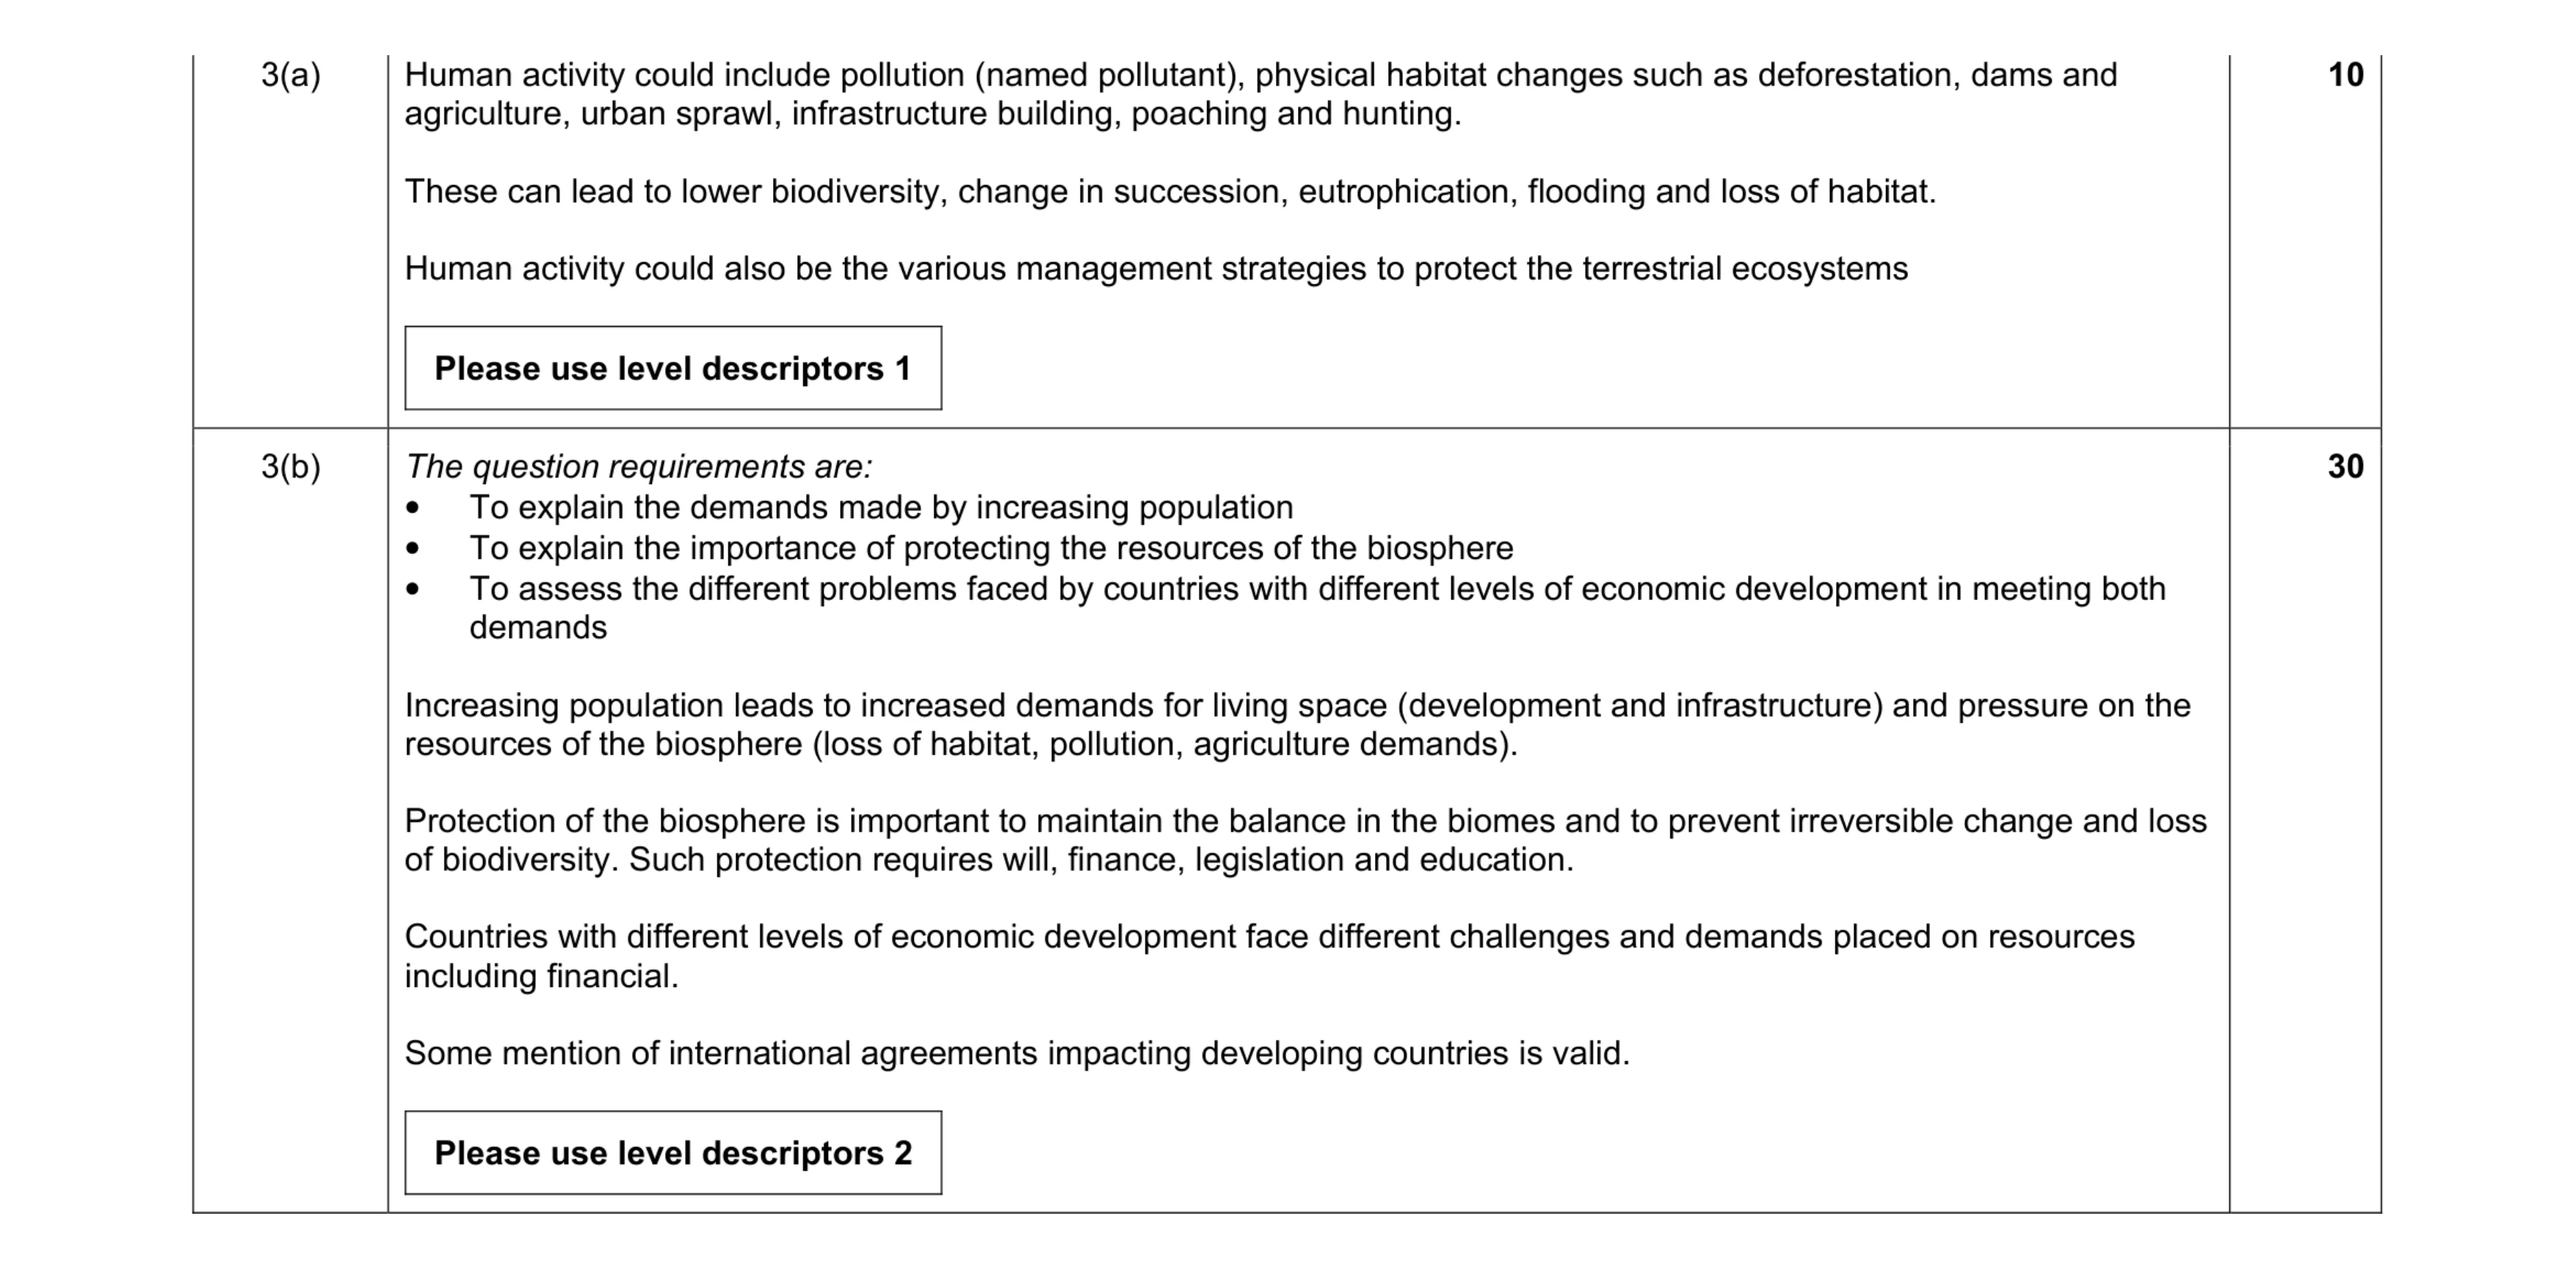 40
40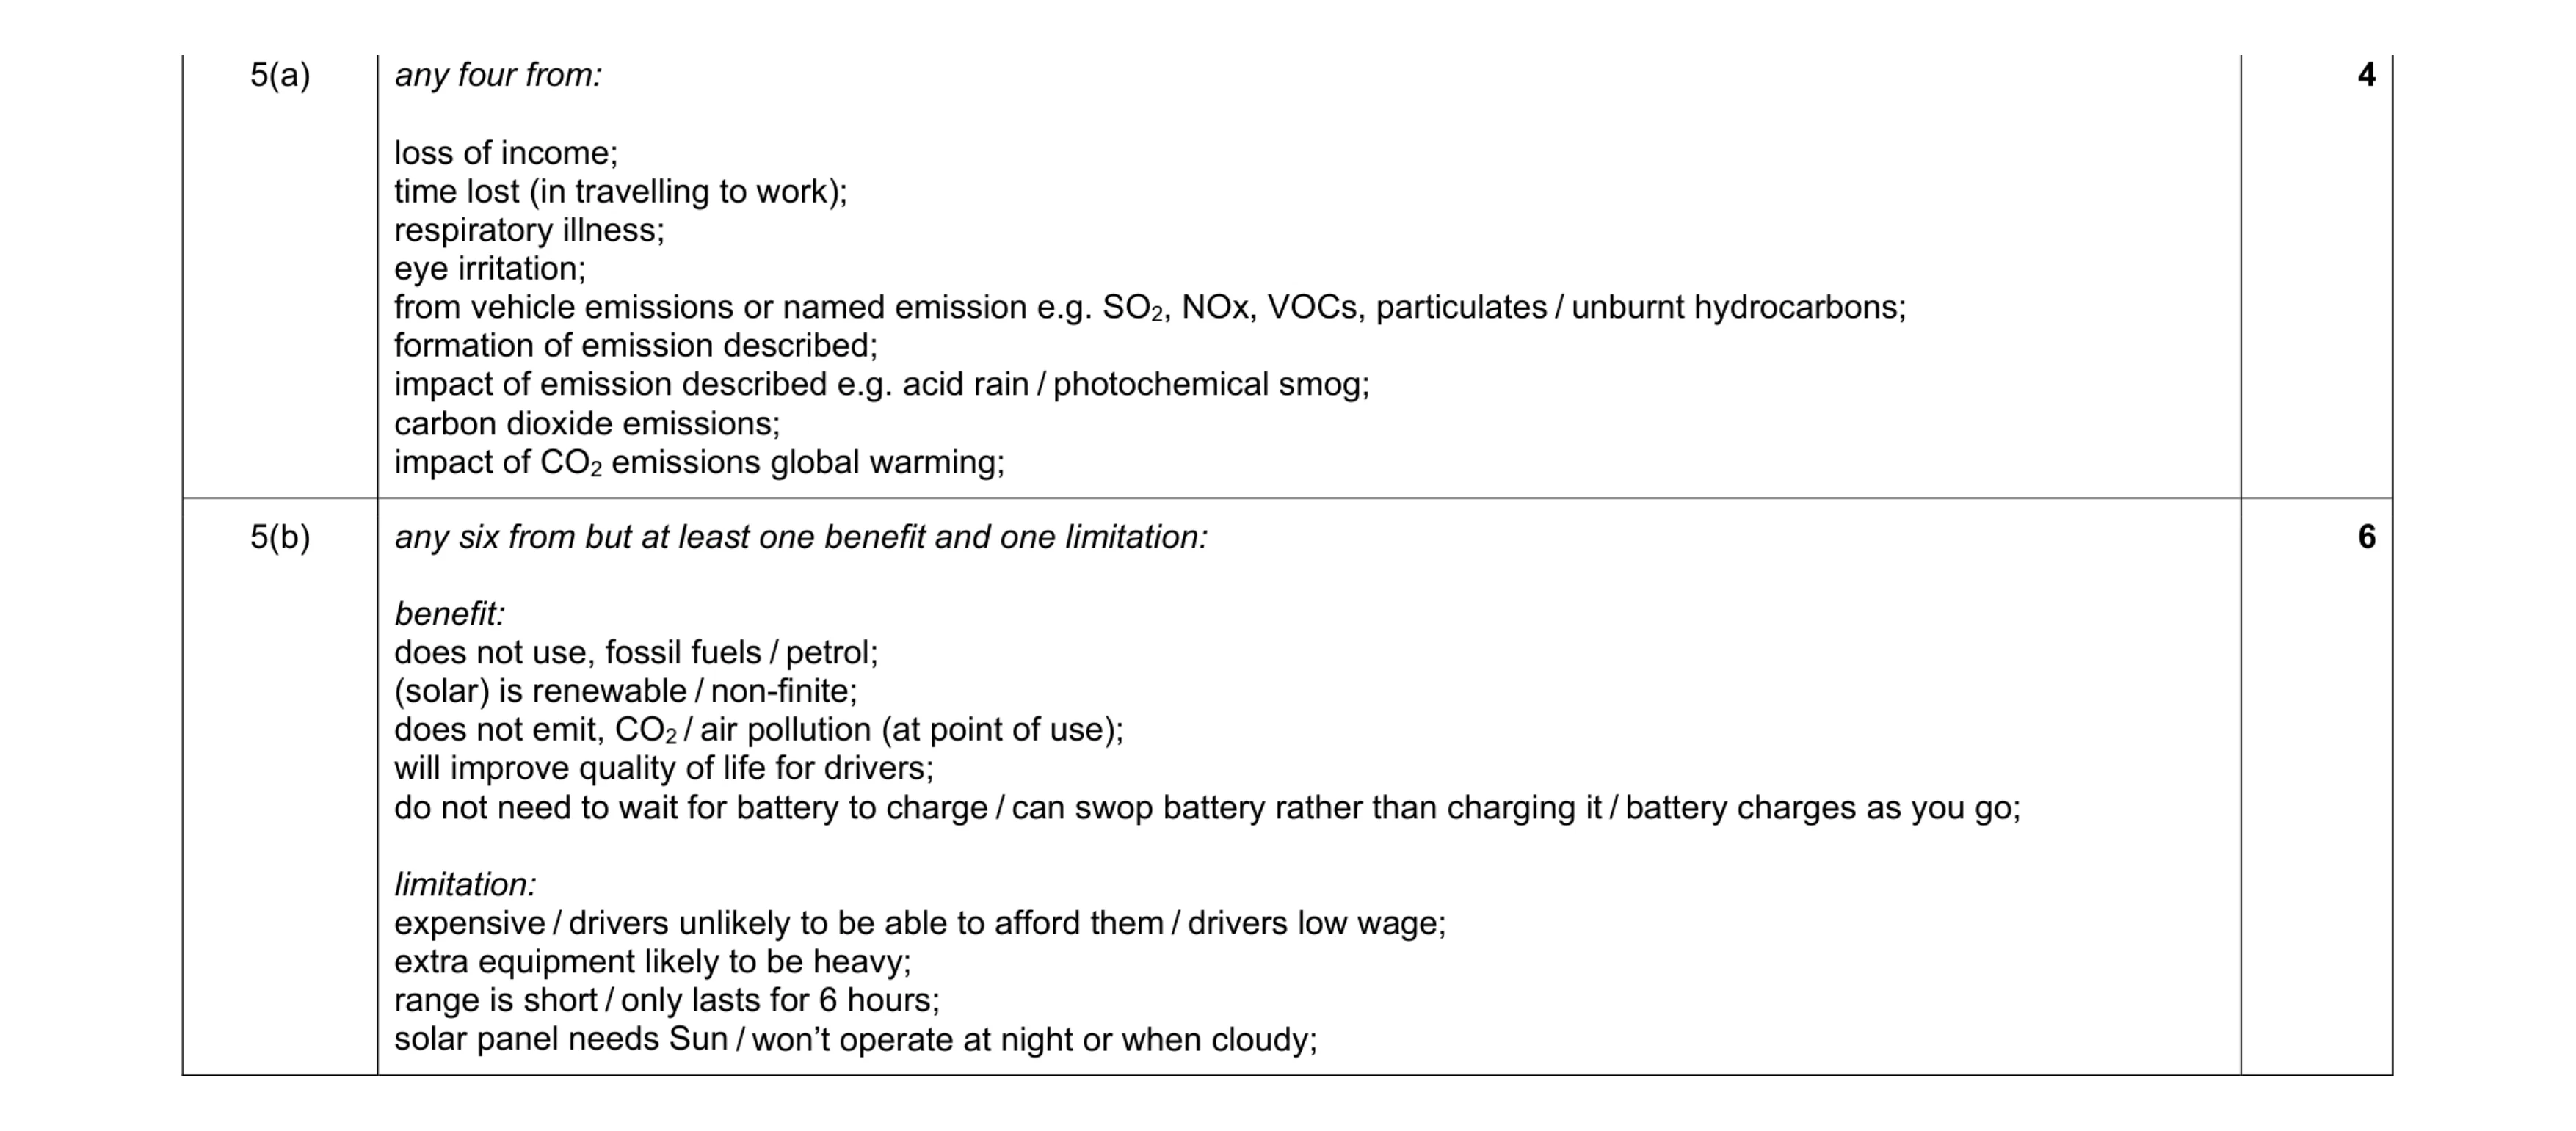 10
10 10
10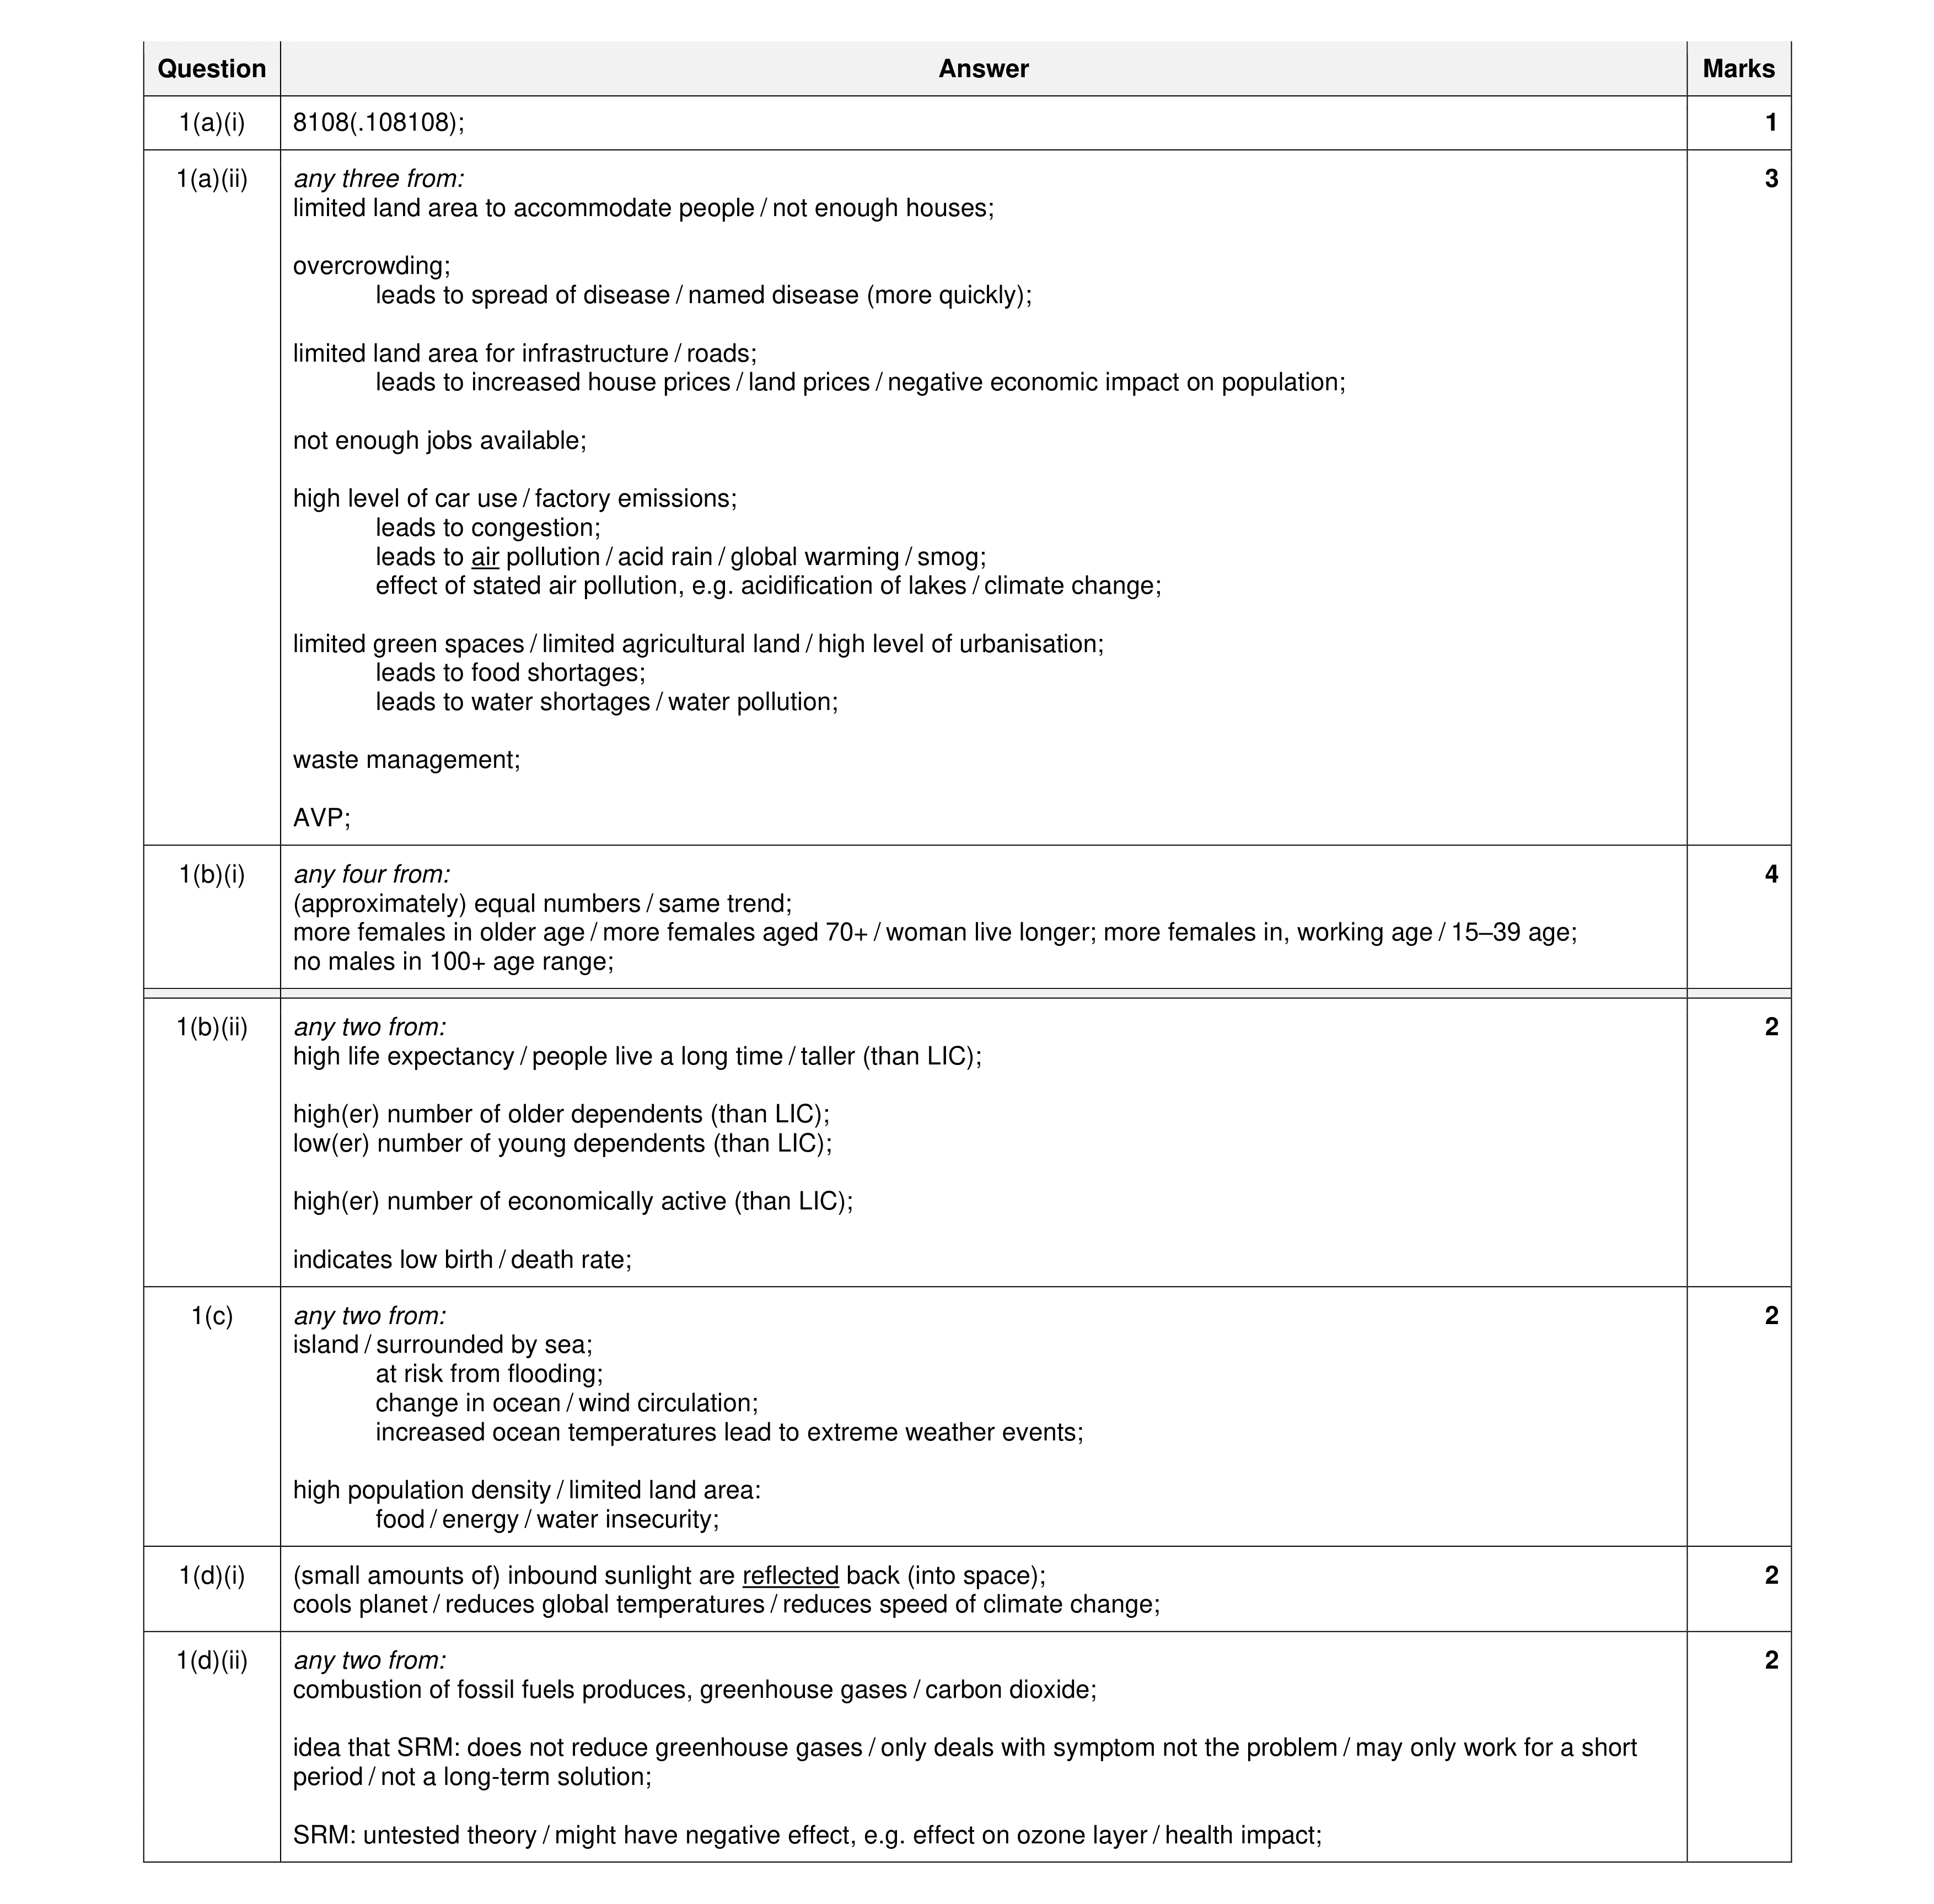 16
16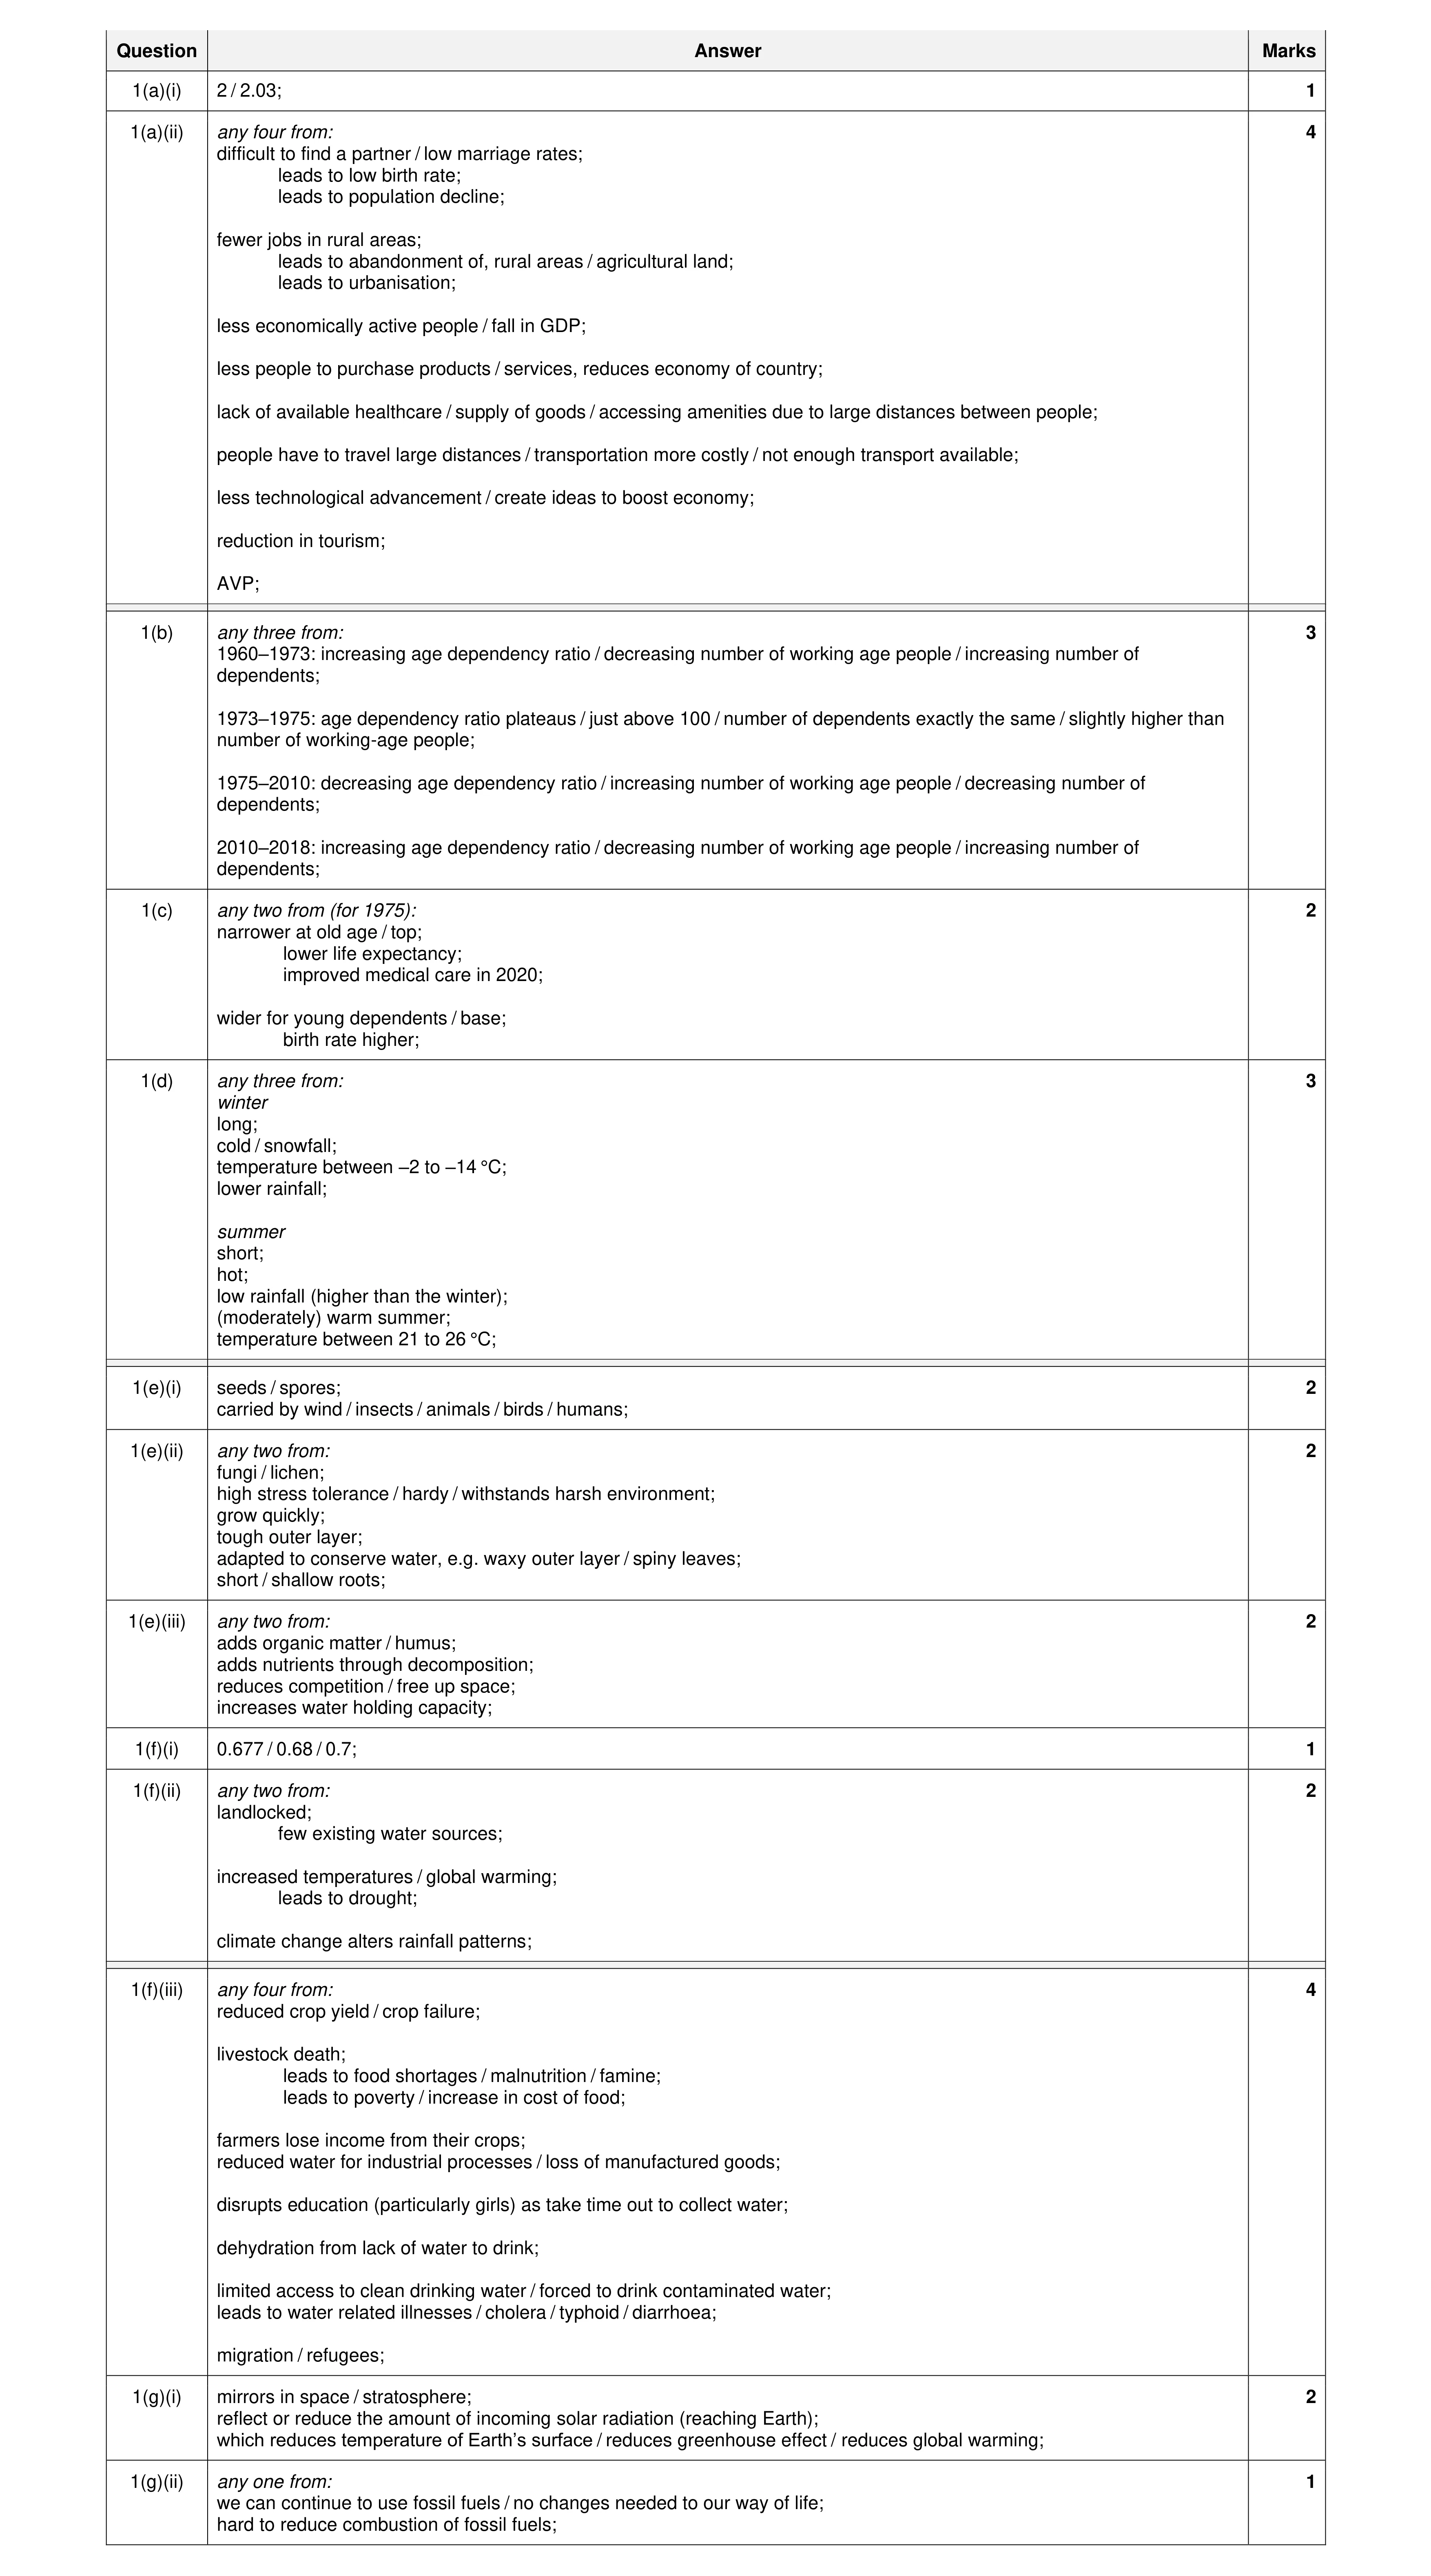 29
29 16
16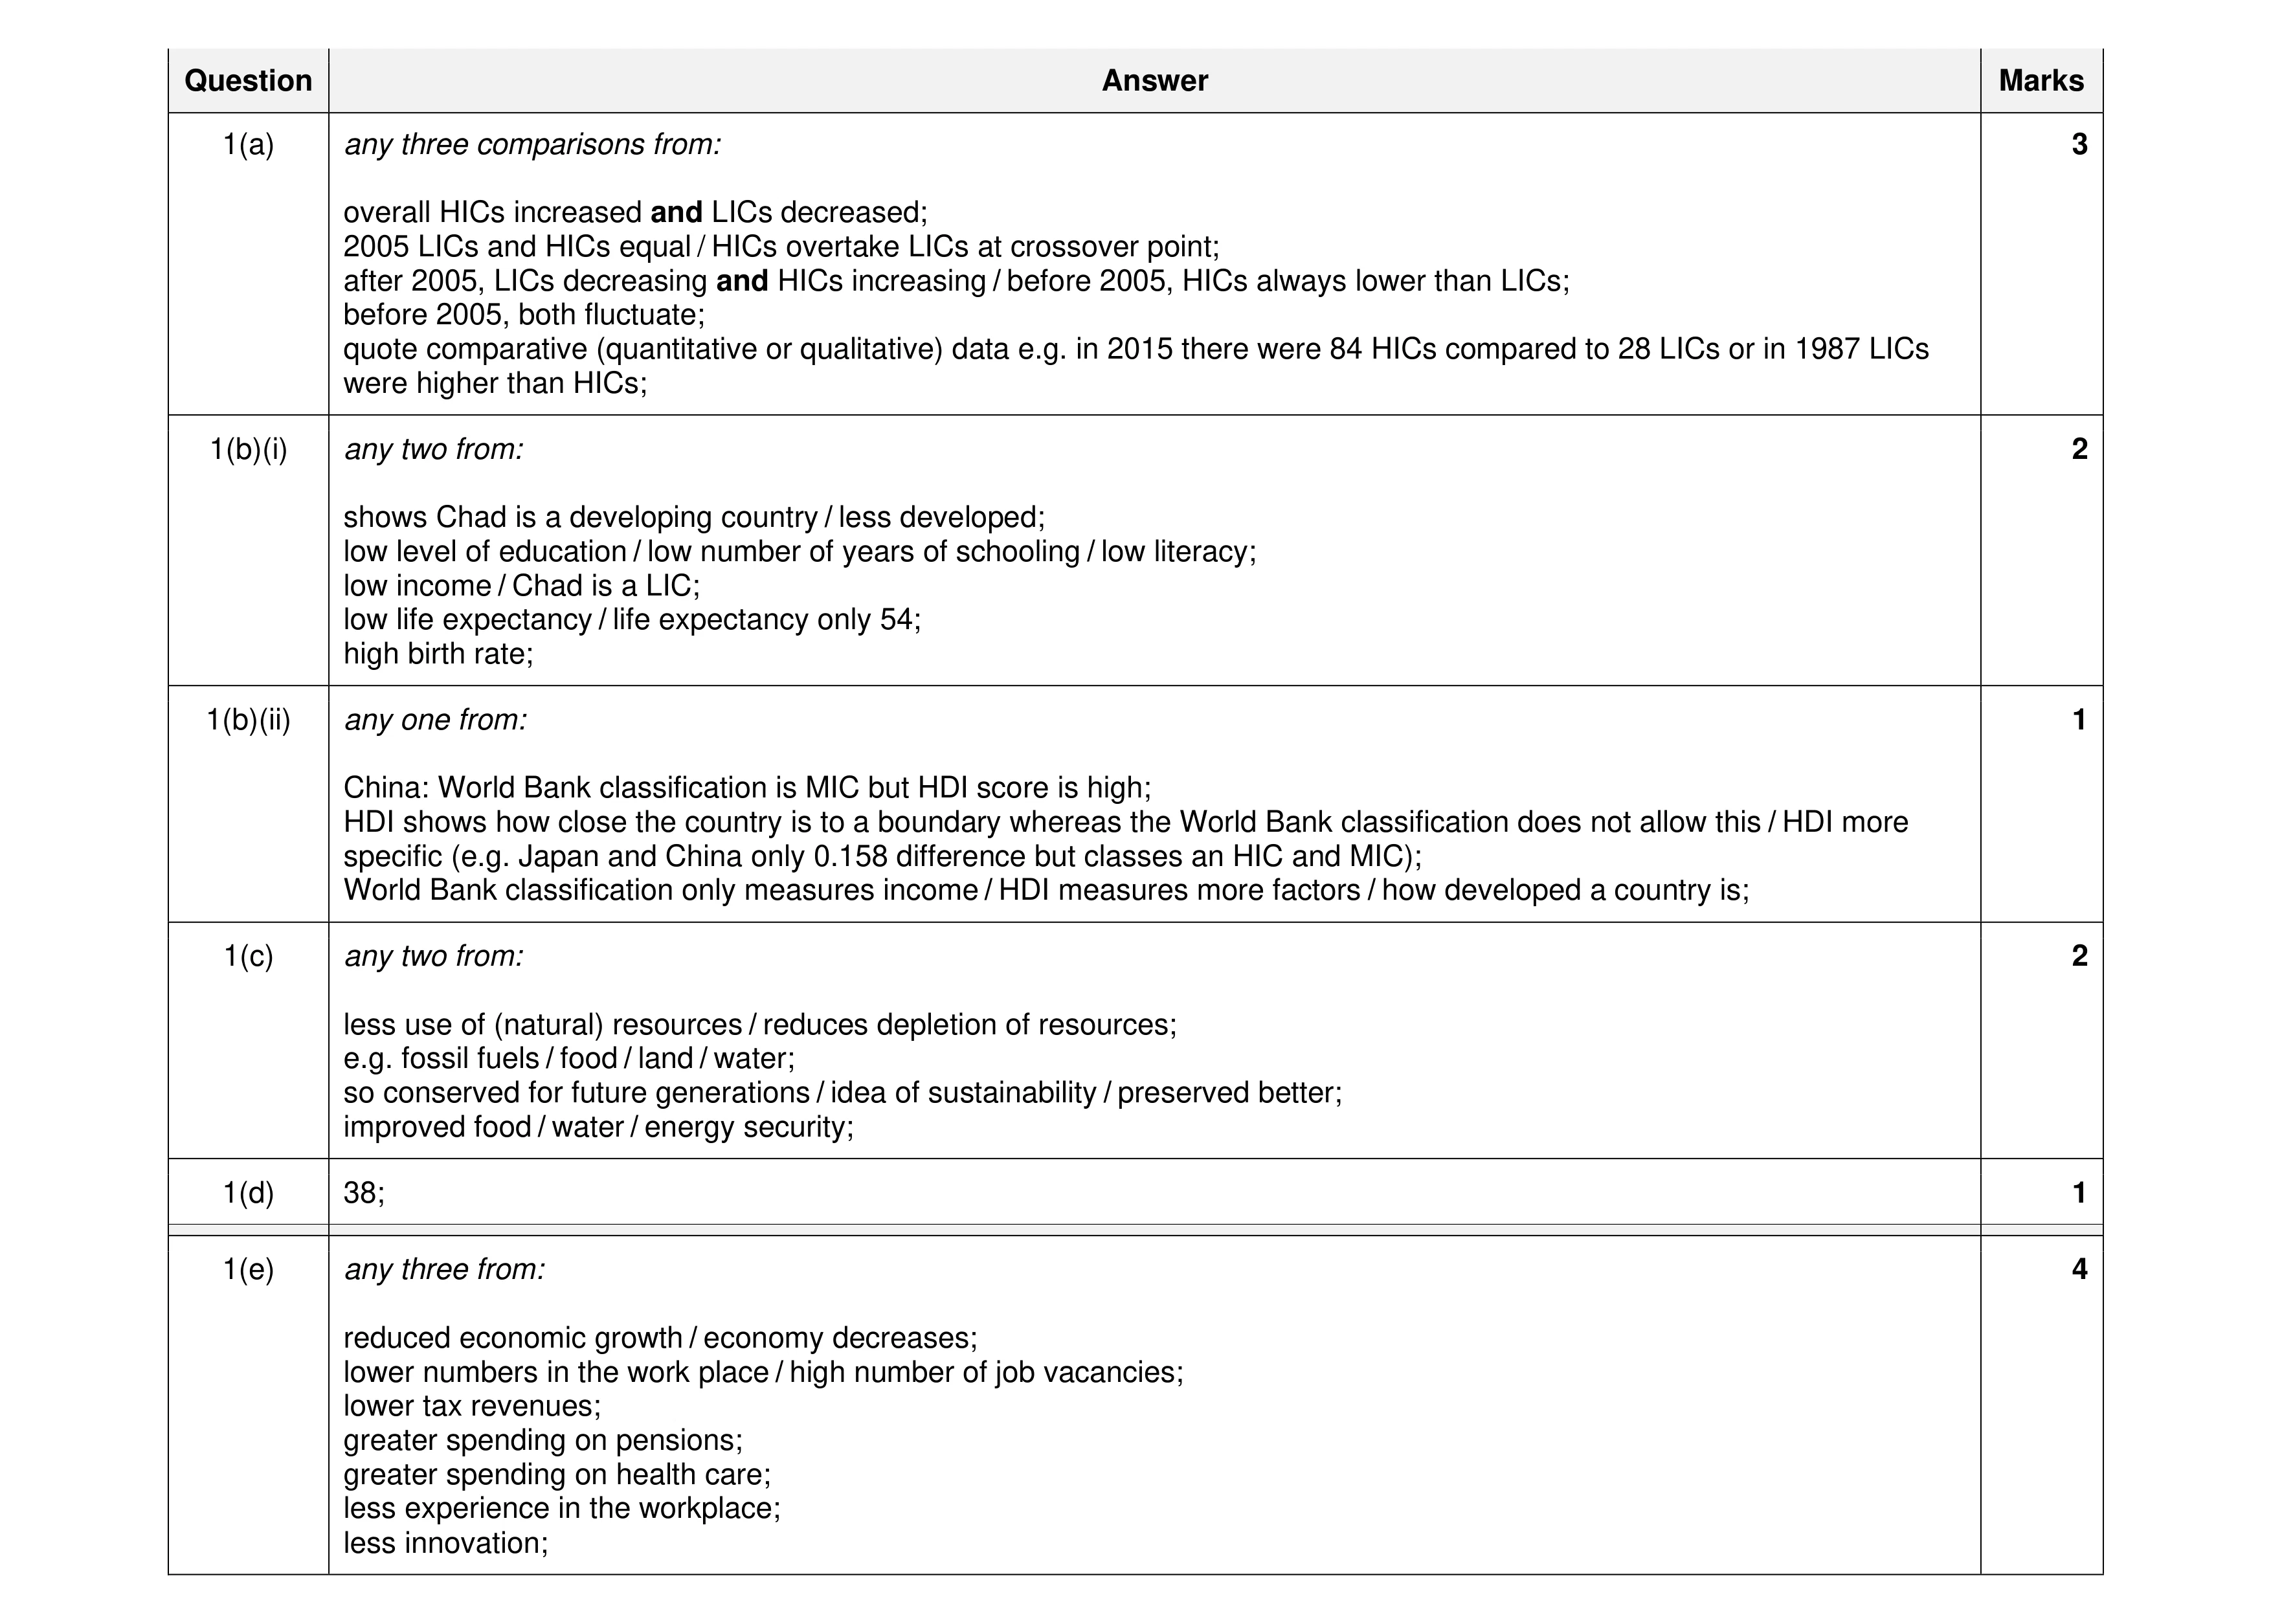 13
13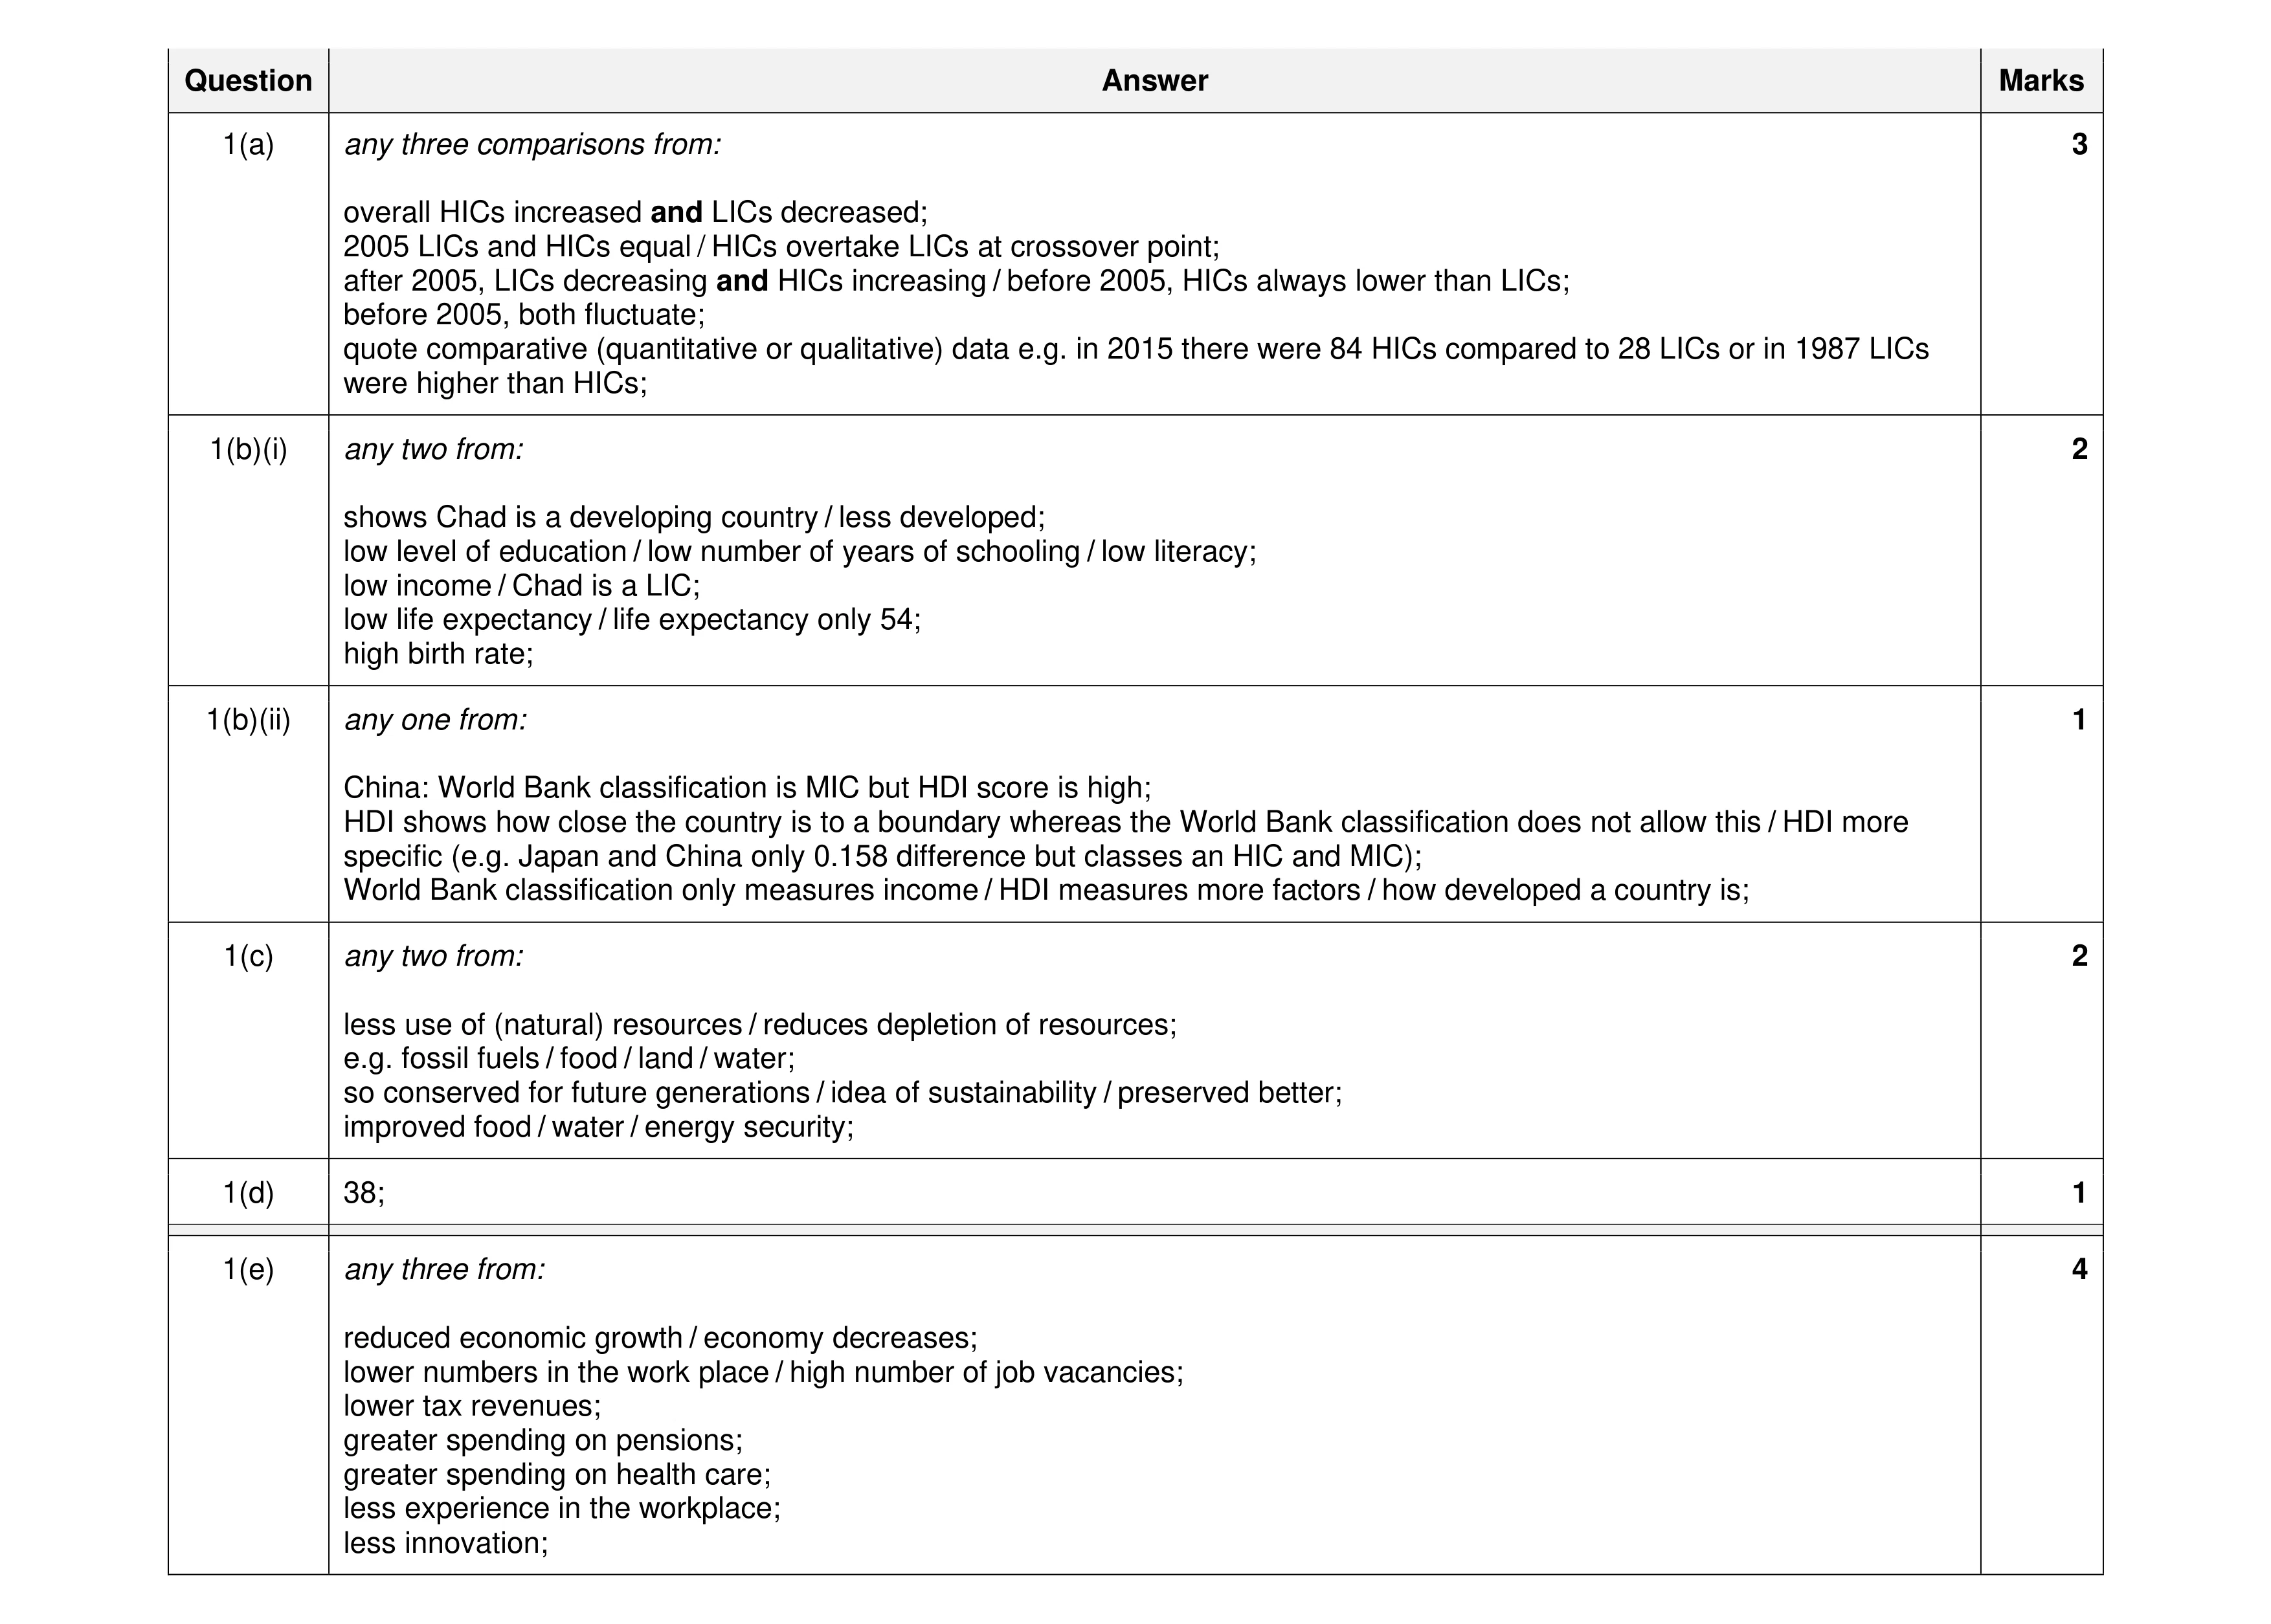 13
13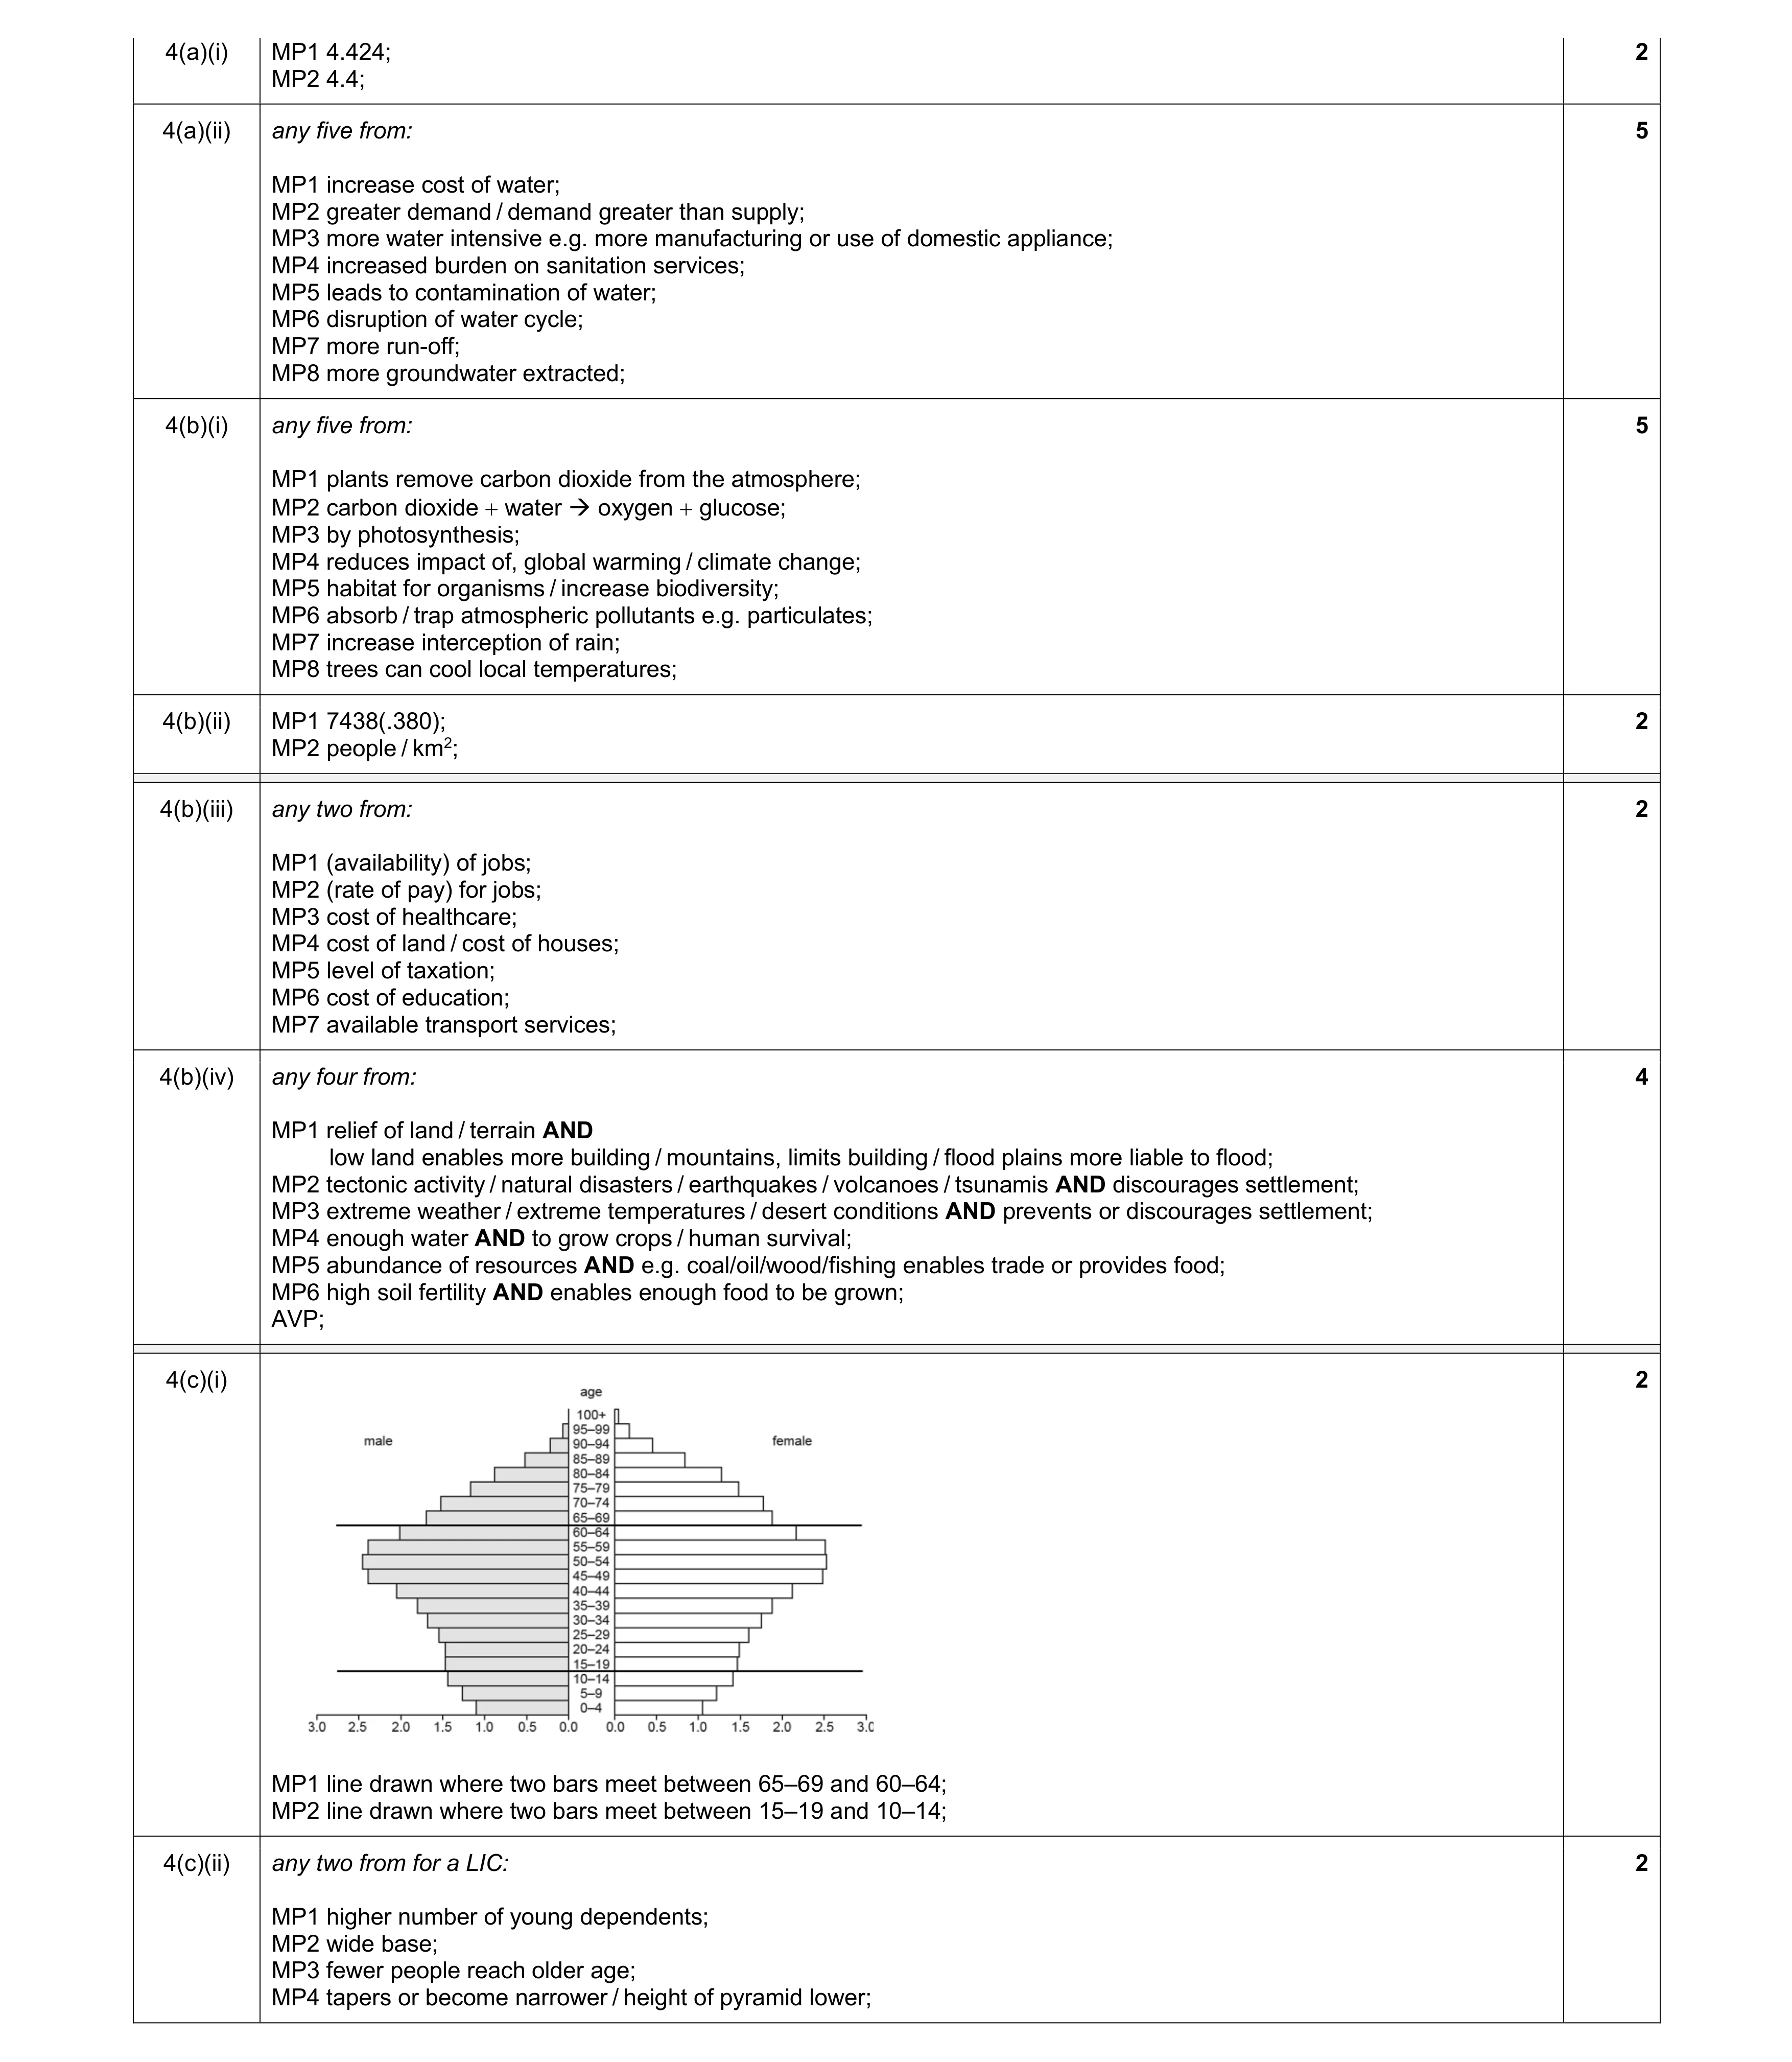 20
20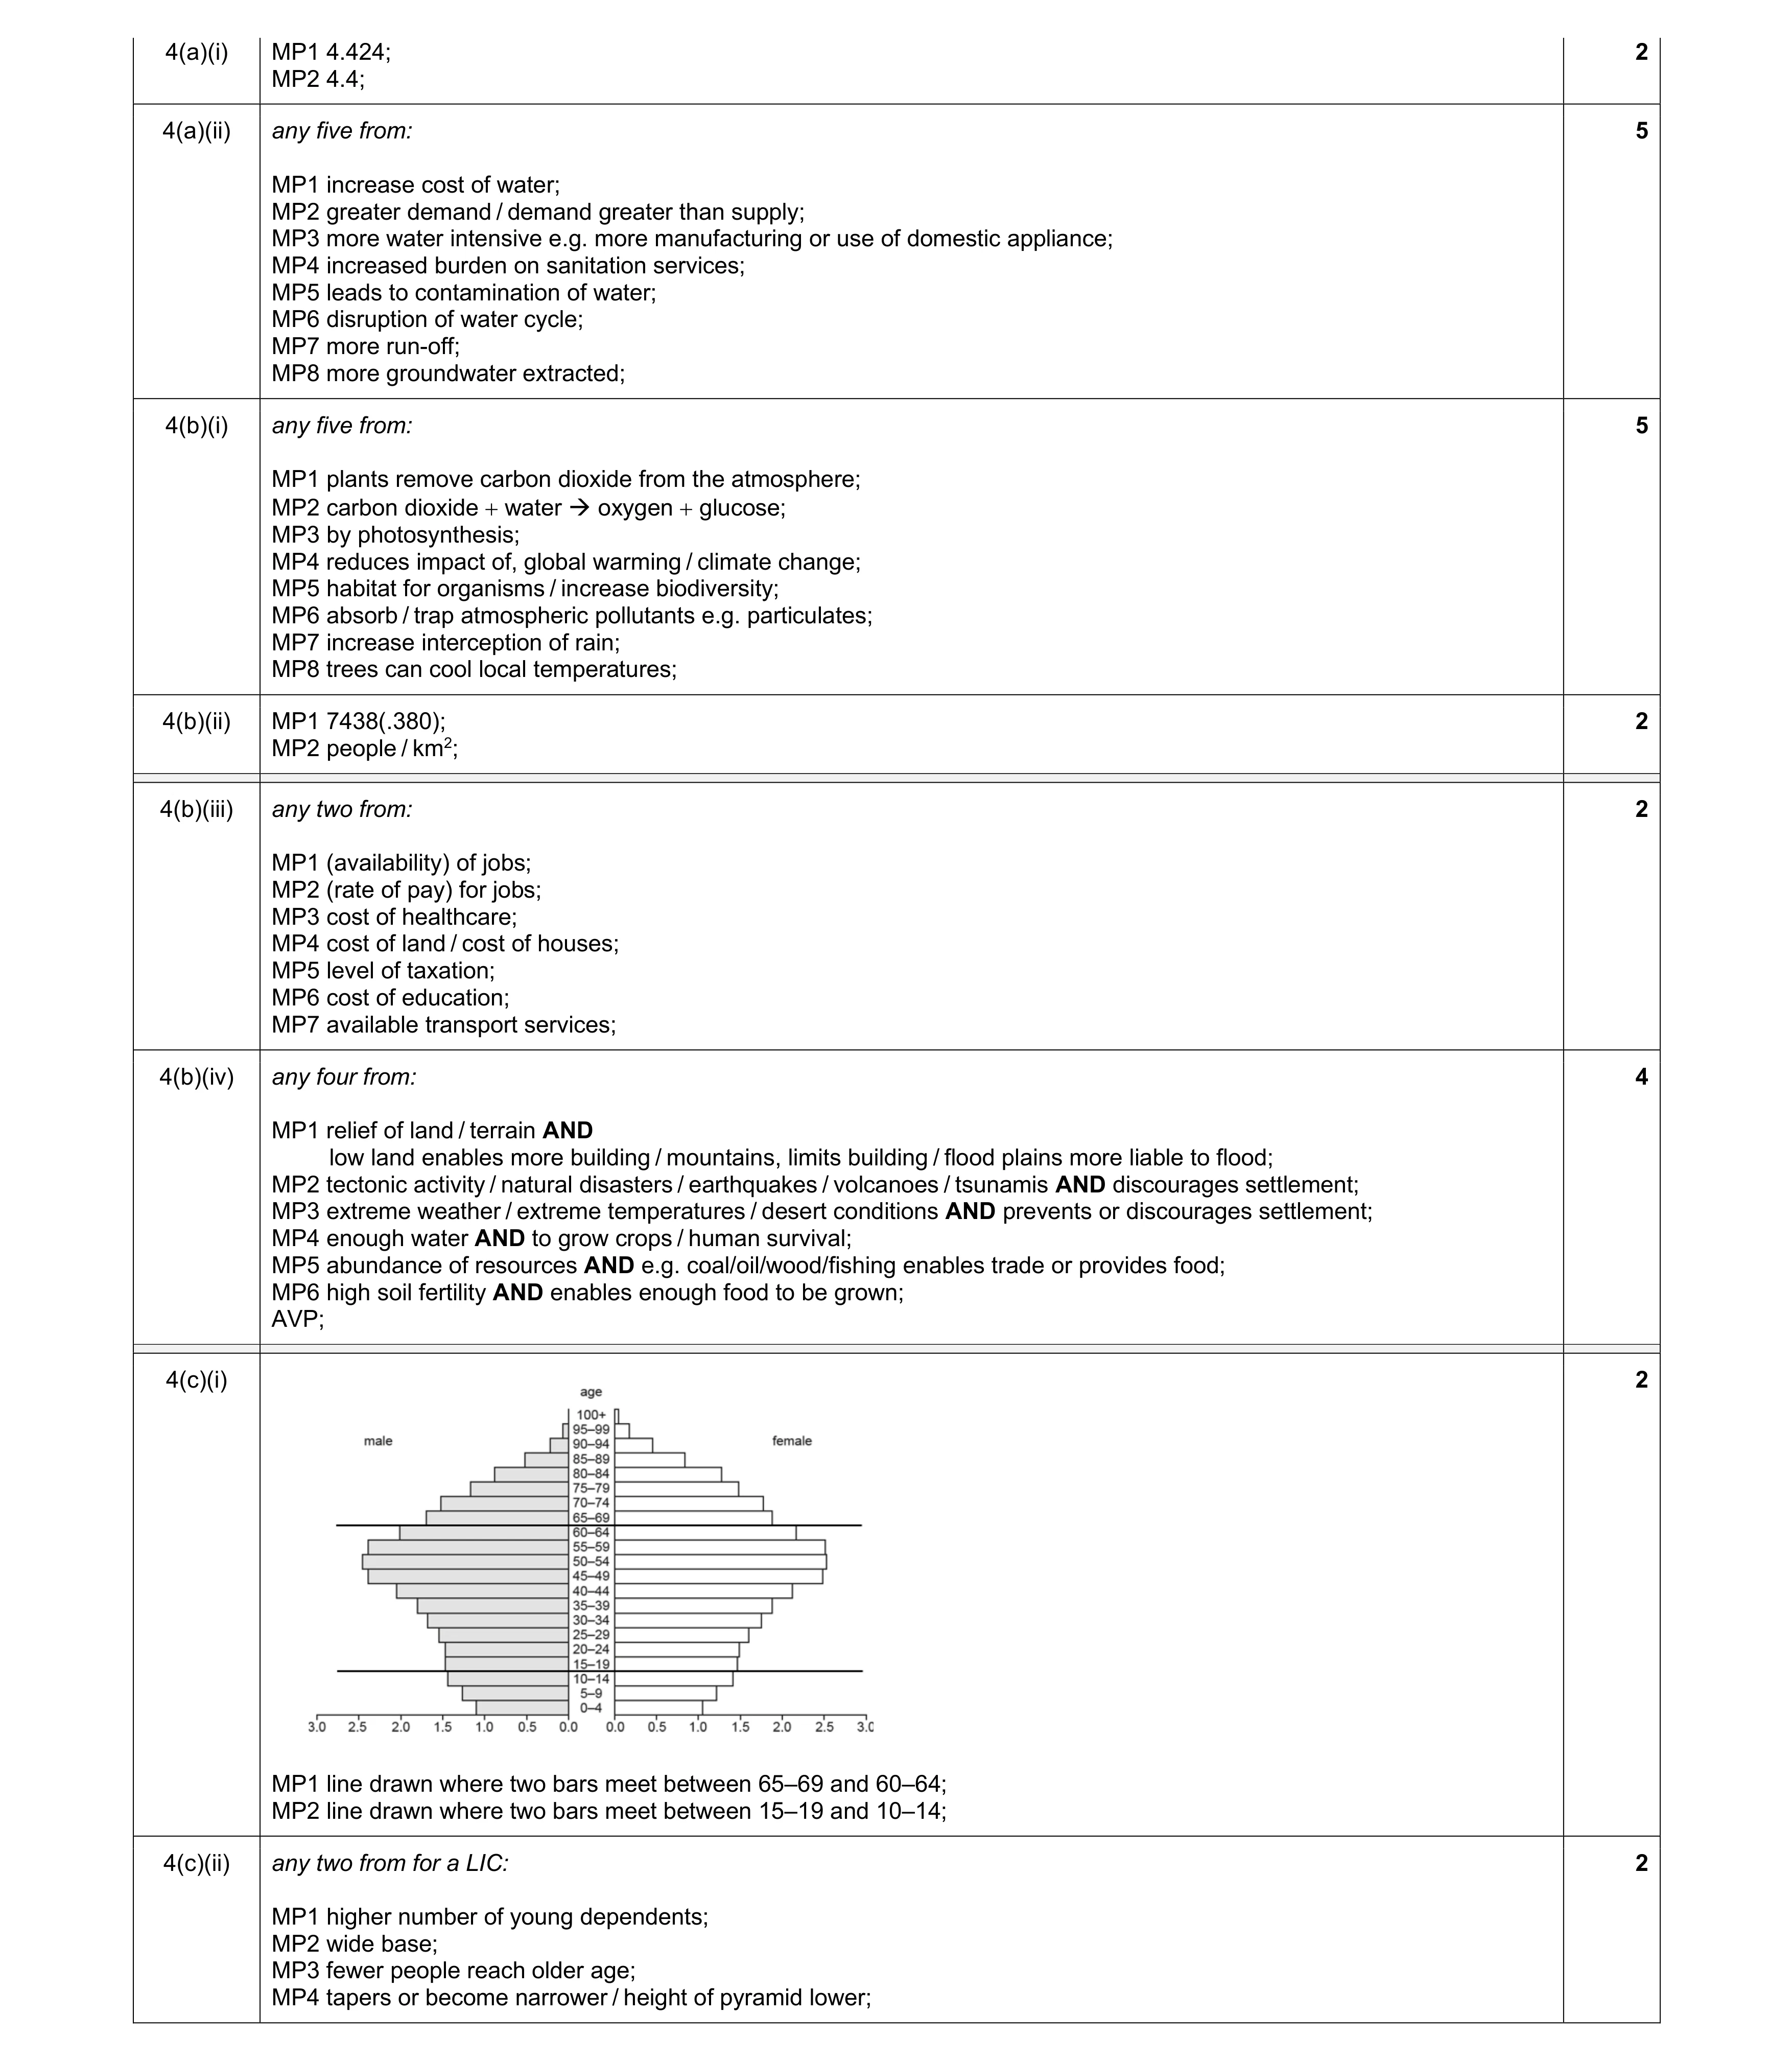 20
20