Cambridge A Level Environmental Management (AS only) 8291 — 2022 Oct/Nov Paper 2 · Variant 2
8291/22/O/N/22 · 4 questions · 80 marks · ≈90 min
The question paper and its mark scheme, free to read here and free to download. This is Cambridge’s own paper, exactly as it was sat.
Question paper20 pages



Mark scheme14 pages
Answers below. Sit the paper first if you are practising.
Questions as text
Q1 · A map of Mongolia
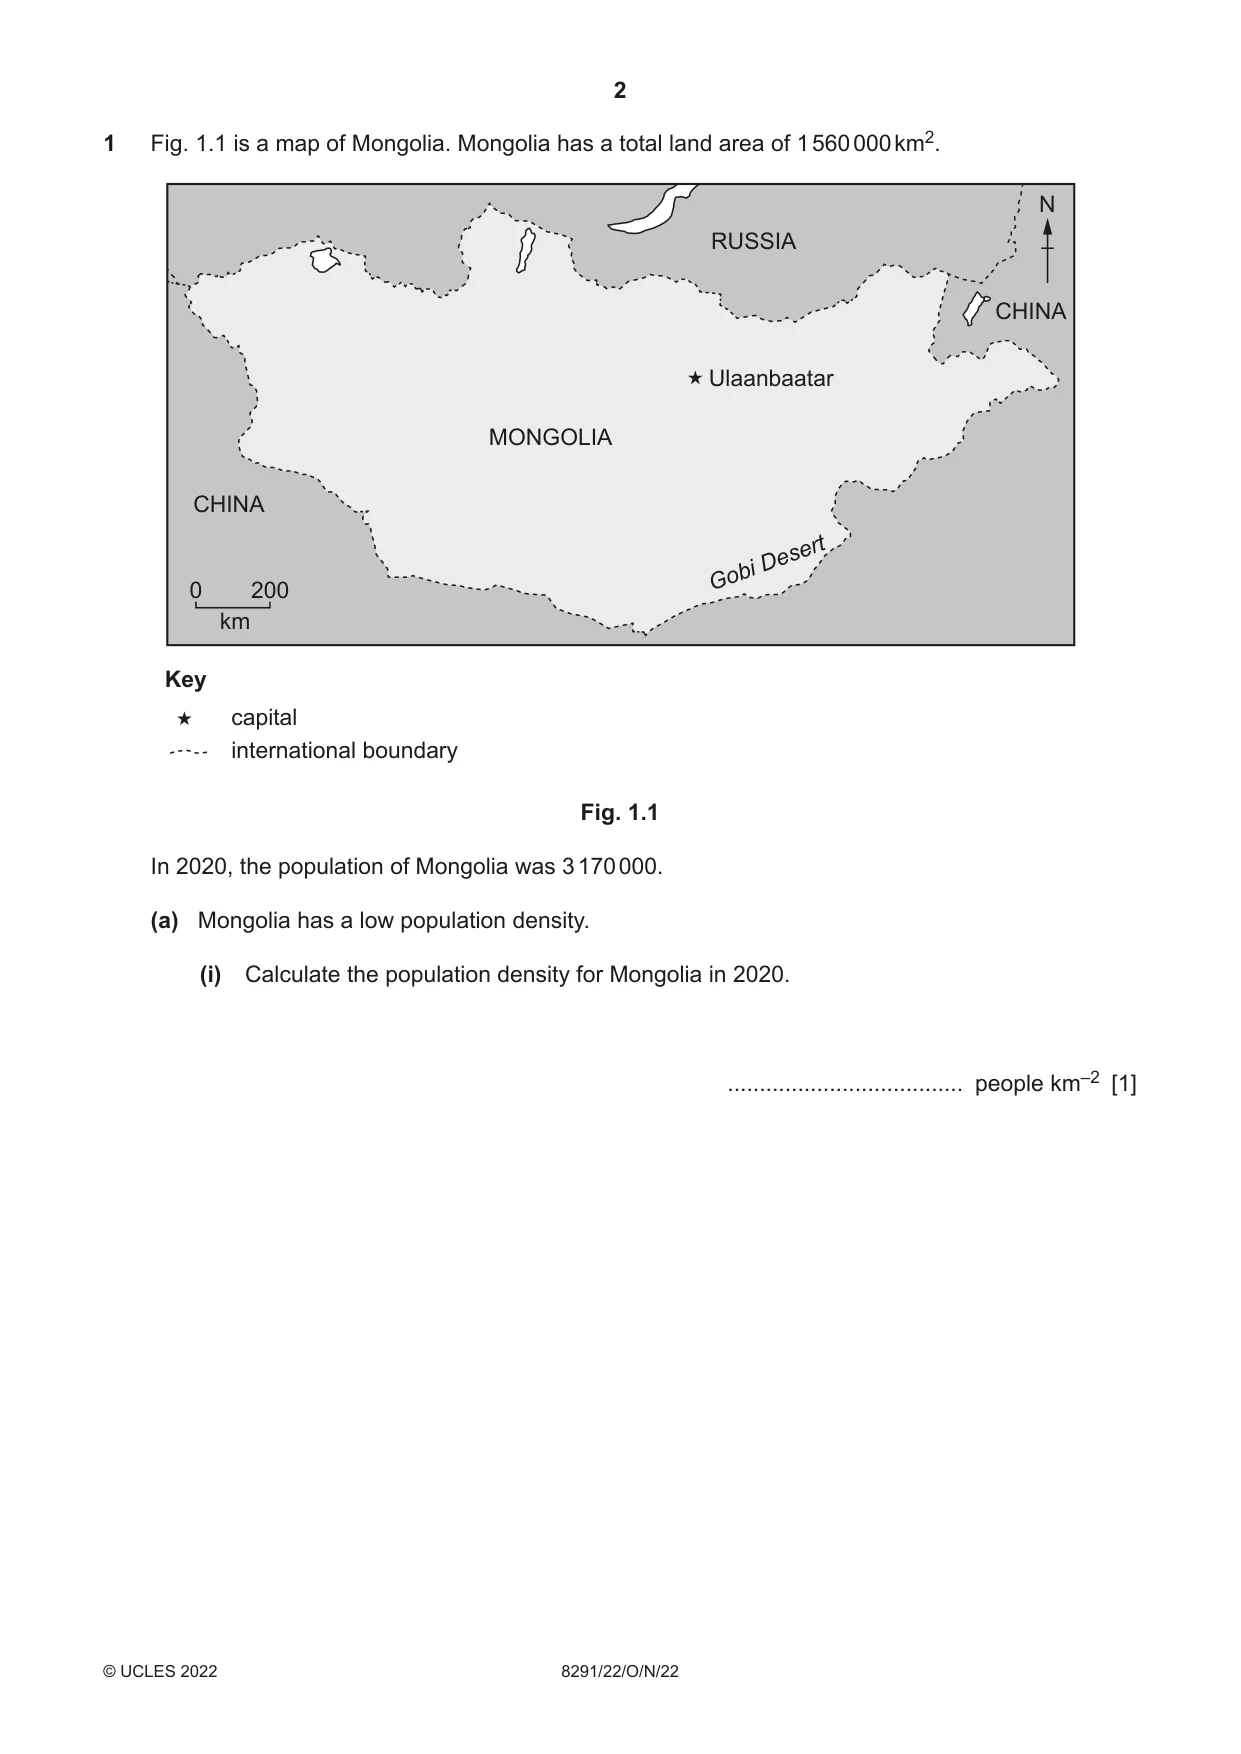
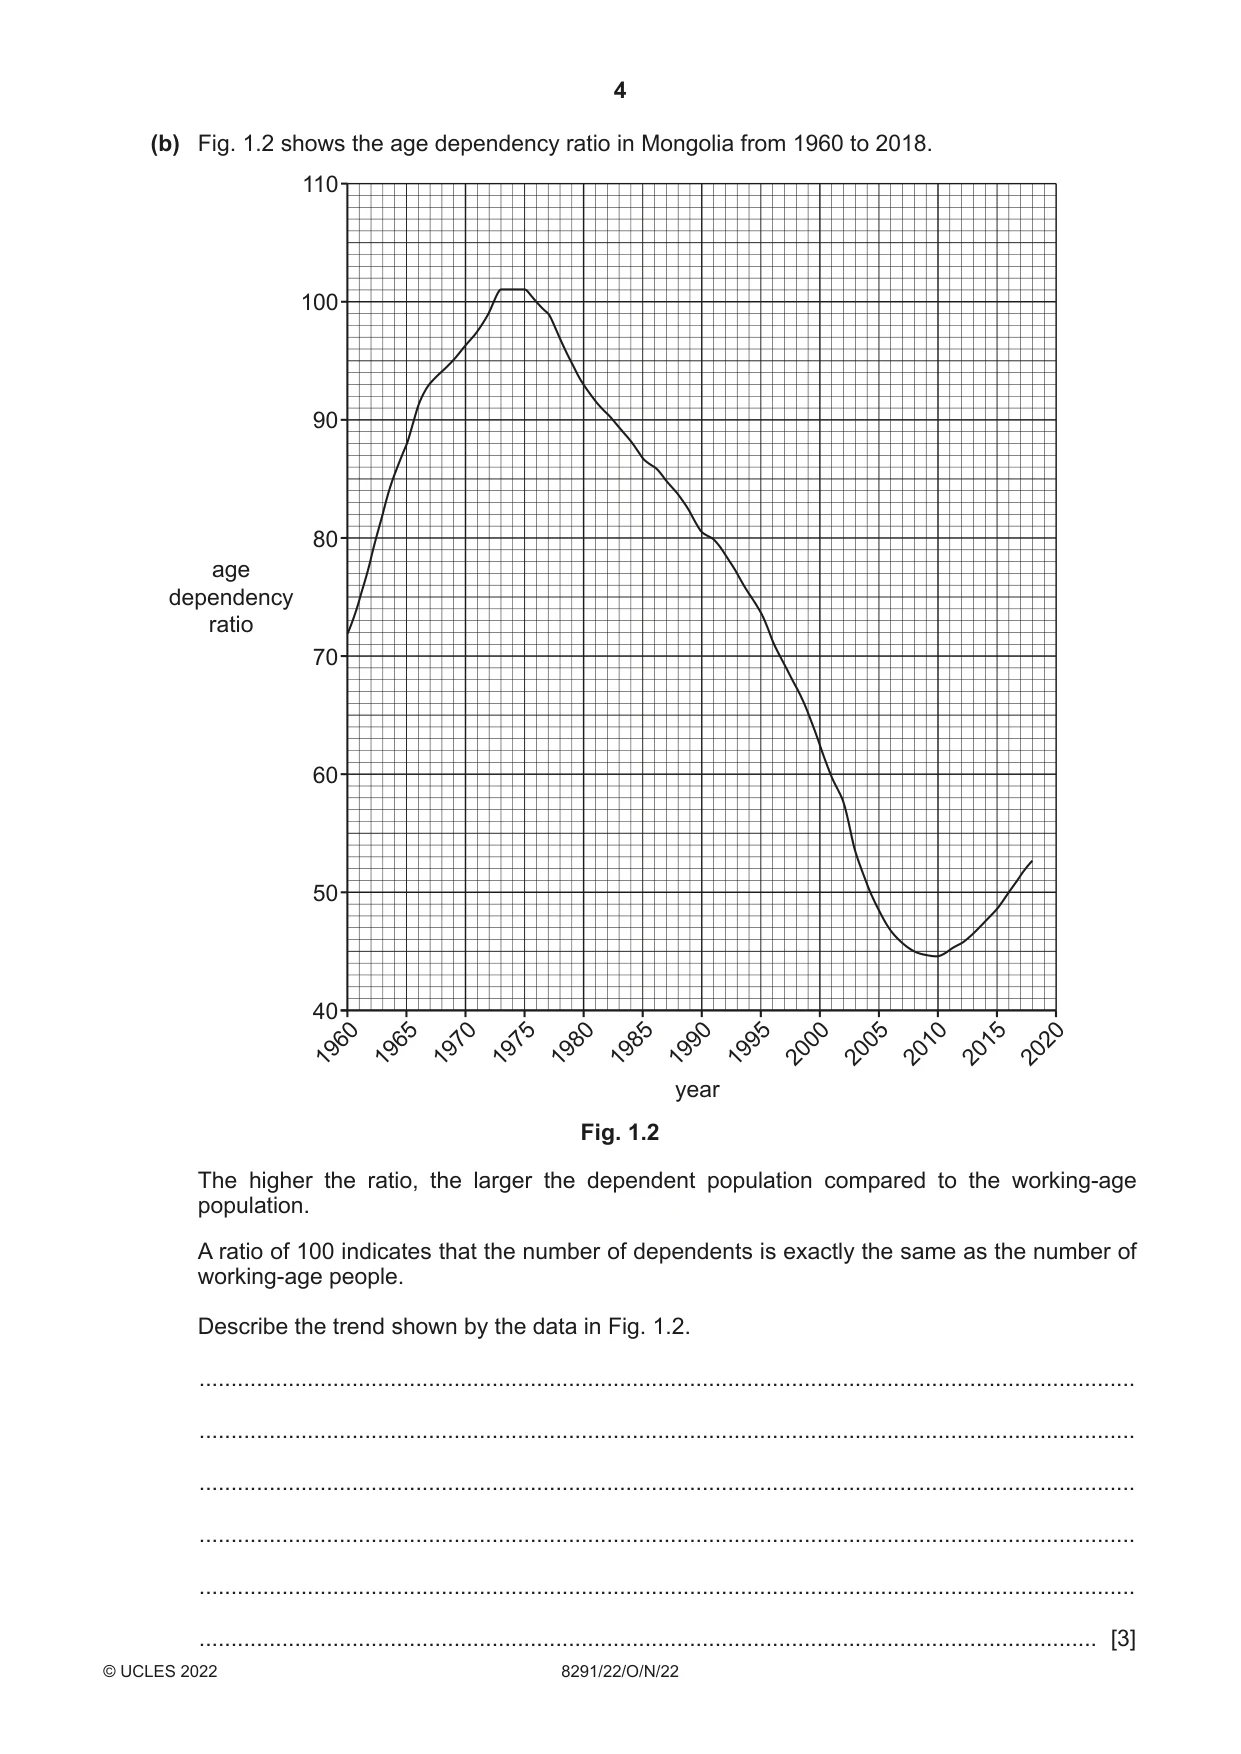
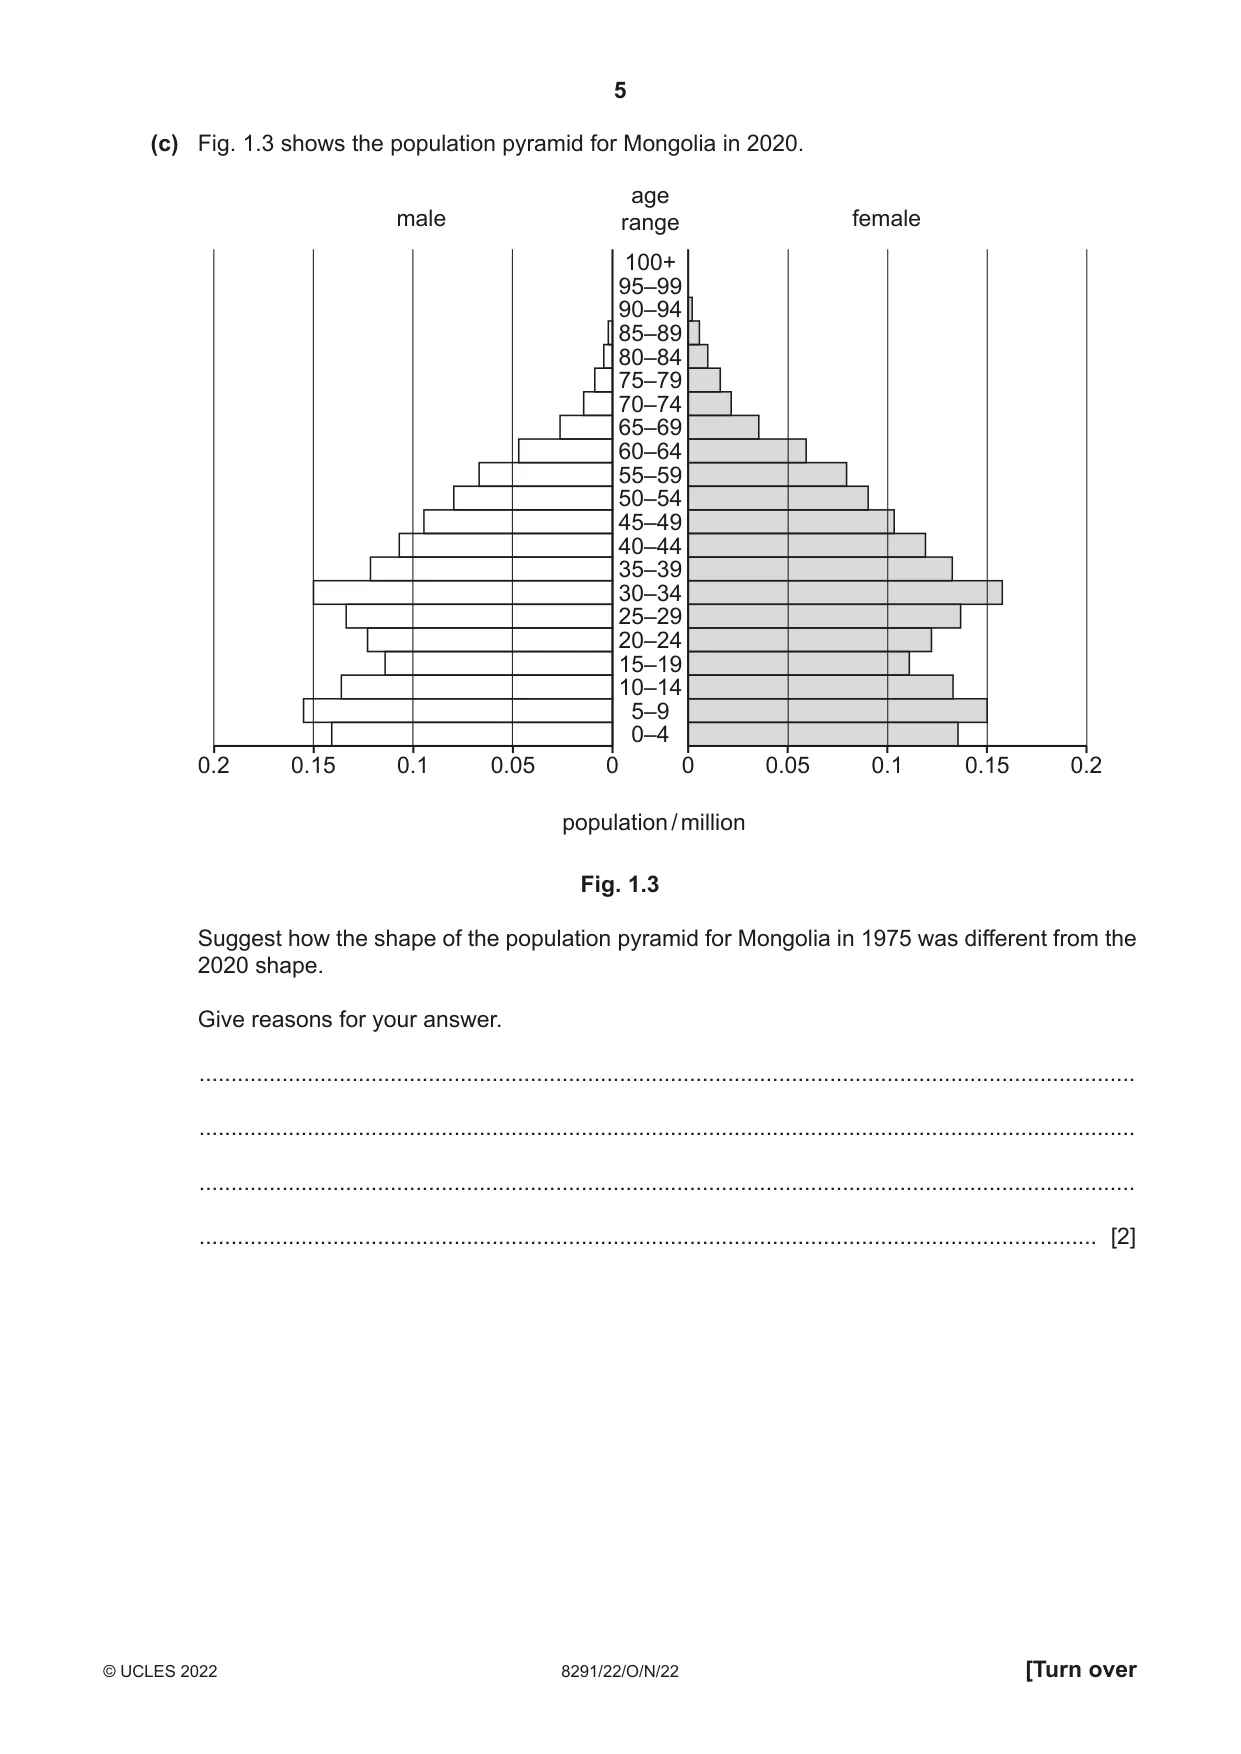
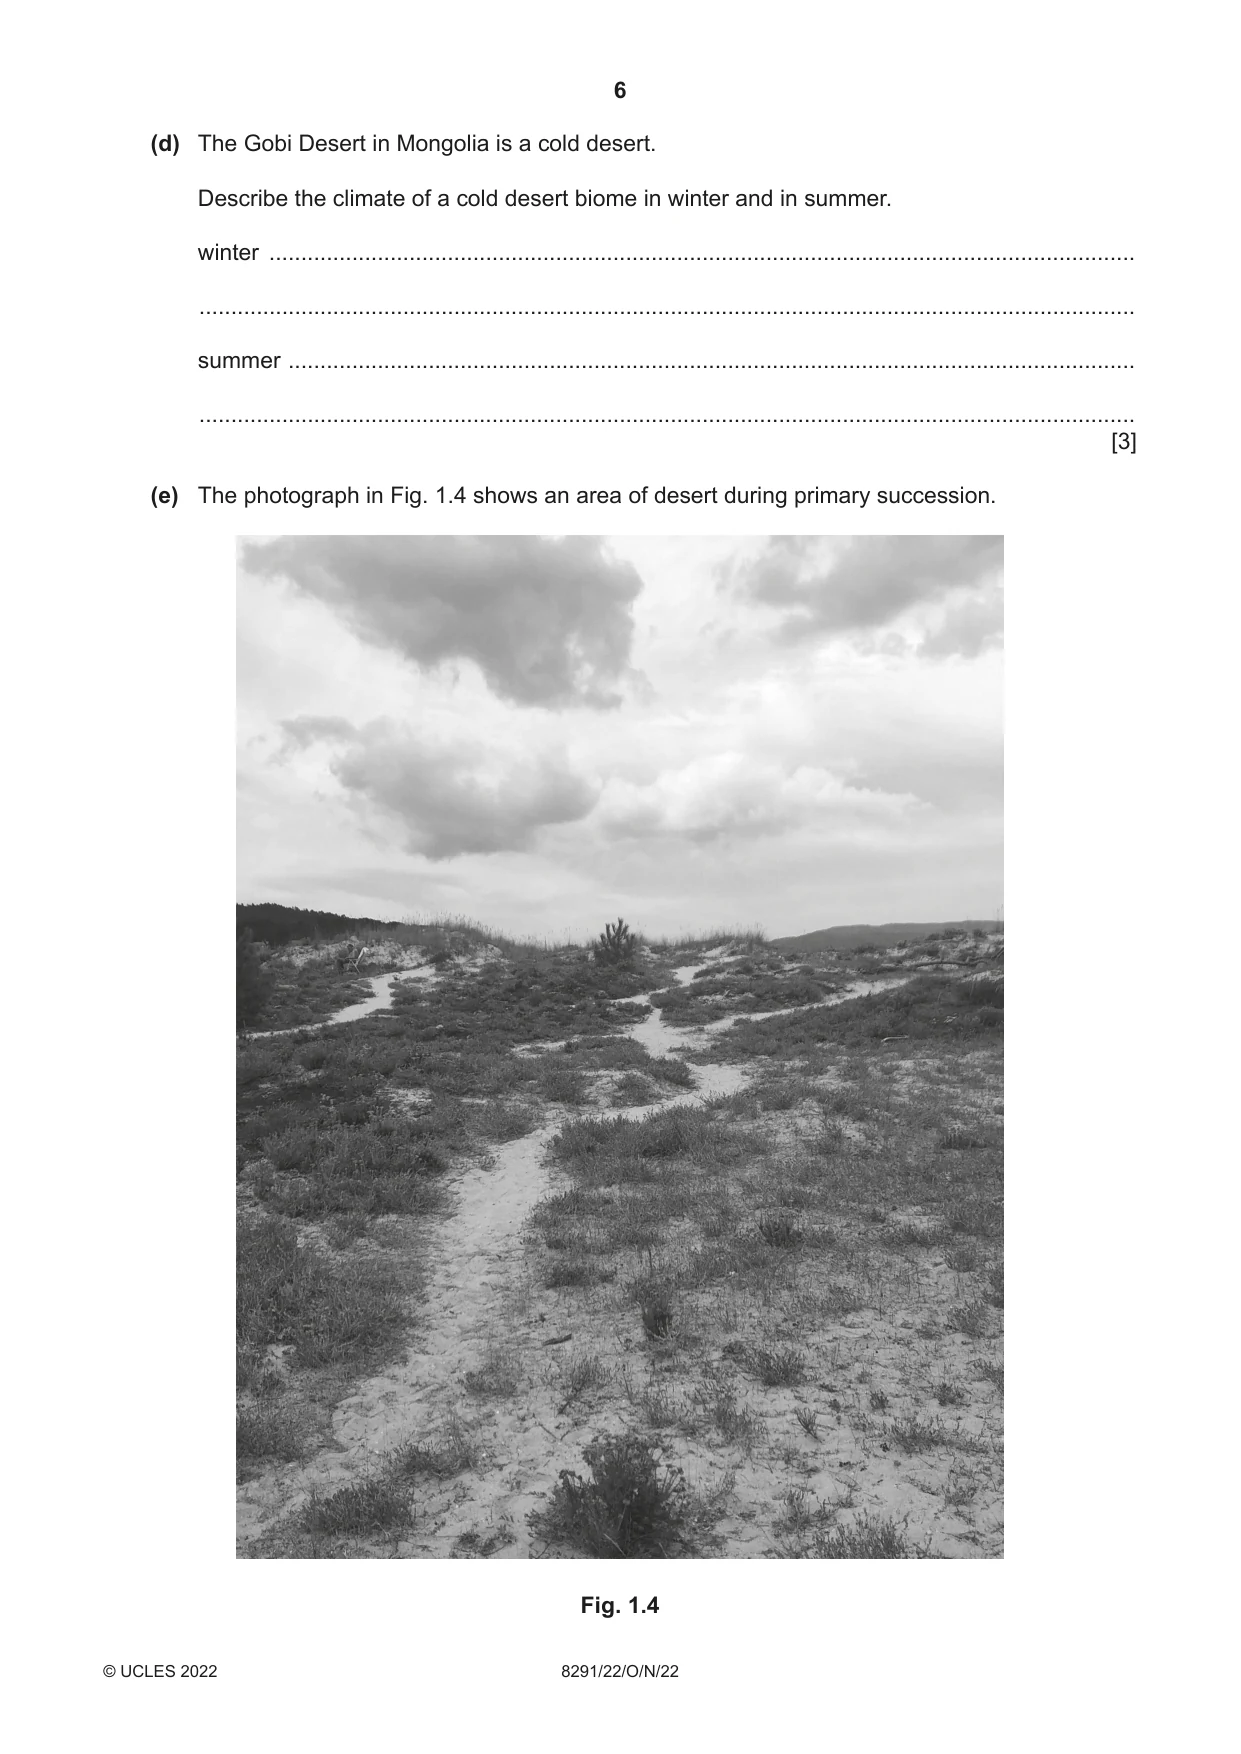
1 Fig. 1.1 is a map of Mongolia. Mongolia has a total land area of 1 560 000 km2. N RUSSIA CHINA Ulaanbaatar MONGOLIA CHINA Desert Gobi 0 200 km Key capital international boundary Fig. 1.1 In 2020, the population of Mongolia was 3 170 000. (a) Mongolia has a low population density. (i) Calculate the population density for Mongolia in 2020. ..................................... people km–2 [1] (ii) Explain the challenges faced by countries with a low population density. ........................................................................................................................................... ........................................................................................................................................... ........................................................................................................................................... ........................................................................................................................................... ........................................................................................................................................... ........................................................................................................................................... ........................................................................................................................................... ..................................................................................................................................... [4] (b) Fig. 1.2 shows the age dependency ratio in Mongolia from 1960 to 2018. 110 100 90 80 age dependency ratio 70 60 50 40 1960 1965 1970 1975 1980 1985 1990 1995 2000 2005 2010 2015 2020 year Fig. 1.2 The higher the ratio, the larger the dependent population compared to the working-age population. A ratio of 100 indicates that the number of dependents is exactly the same as the number of working-age people. Describe the trend shown by the data in Fig. 1.2. ................................................................................................................................................... ................................................................................................................................................... ................................................................................................................................................... ................................................................................................................................................... ................................................................................................................................................... ............................................................................................................................................. [3] (c) Fig. 1.3 shows the population pyramid for Mongolia in 2020. age male range female 100+ 95–99 90–94 85–89 80–84 75–79 70–74 65–69 60–64 55–59 50–54 45–49 40–44 35–39 30–34 25–29 20–24 15–19 10–14 5–9 0–4 0.2 0.15 0.1 0.05 0 0 0.05 0.1 0.15 0.2 population / million Fig. 1.3 Suggest how the shape of the population pyramid for Mongolia in 1975 was different from the 2020 shape. Give reasons for your answer. ................................................................................................................................................... ................................................................................................................................................... ................................................................................................................................................... ............................................................................................................................................. [2] (d) The Gobi Desert in Mongolia is a cold desert. Describe the climate of a cold desert biome in winter and in summer. winter ........................................................................................................................................ ................................................................................................................................................... summer ..................................................................................................................................... ................................................................................................................................................... [3] (e) The photograph in Fig. 1.4 shows an area of desert during primary succession. Fig. 1.4 (i) Suggest how the pioneer species in Fig. 1.4 colonised this area of desert. ........................................................................................................................................... ........................................................................................................................................... ........................................................................................................................................... ..................................................................................................................................... [2] (ii) Suggest the characteristics of the pioneer species in Fig. 1.4. ........................................................................................................................................... ........................................................................................................................................... ........................................................................................................................................... ..................................................................................................................................... [2] (iii) Explain how the death of pioneer species can lead to secondary succession. ........................................................................................................................................... ........................................................................................................................................... ........................................................................................................................................... ..................................................................................................................................... [2] (f) The total area of land in Mongolia is 1 560 000 km2. The area of this land covered by water in Mongolia is 10 560 km2. (i) Calculate the percentage of land area covered by water in Mongolia. percentage = ......................................................... [1] (ii) Suggest why climate change can increase water insecurity in Mongolia. ........................................................................................................................................... ........................................................................................................................................... ........................................................................................................................................... ..................................................................................................................................... [2] (iii) Explain the impacts of water insecurity. ........................................................................................................................................... ........................................................................................................................................... ........................................................................................................................................... ........................................................................................................................................... ........................................................................................................................................... ........................................................................................................................................... ........................................................................................................................................... ..................................................................................................................................... [4] (g) Solar radiation management (SRM) is a theoretical strategy to reduce the impact of climate change. (i) One SRM strategy is the use of space reflectors. Outline how space reflectors could reduce the impact of climate change. ........................................................................................................................................... ........................................................................................................................................... ........................................................................................................................................... ..................................................................................................................................... [2] (ii) Suggest why some people think investing in SRM technology is more important than reducing our combustion of fossil fuels. ........................................................................................................................................... ..................................................................................................................................... [1] [Total: 29]
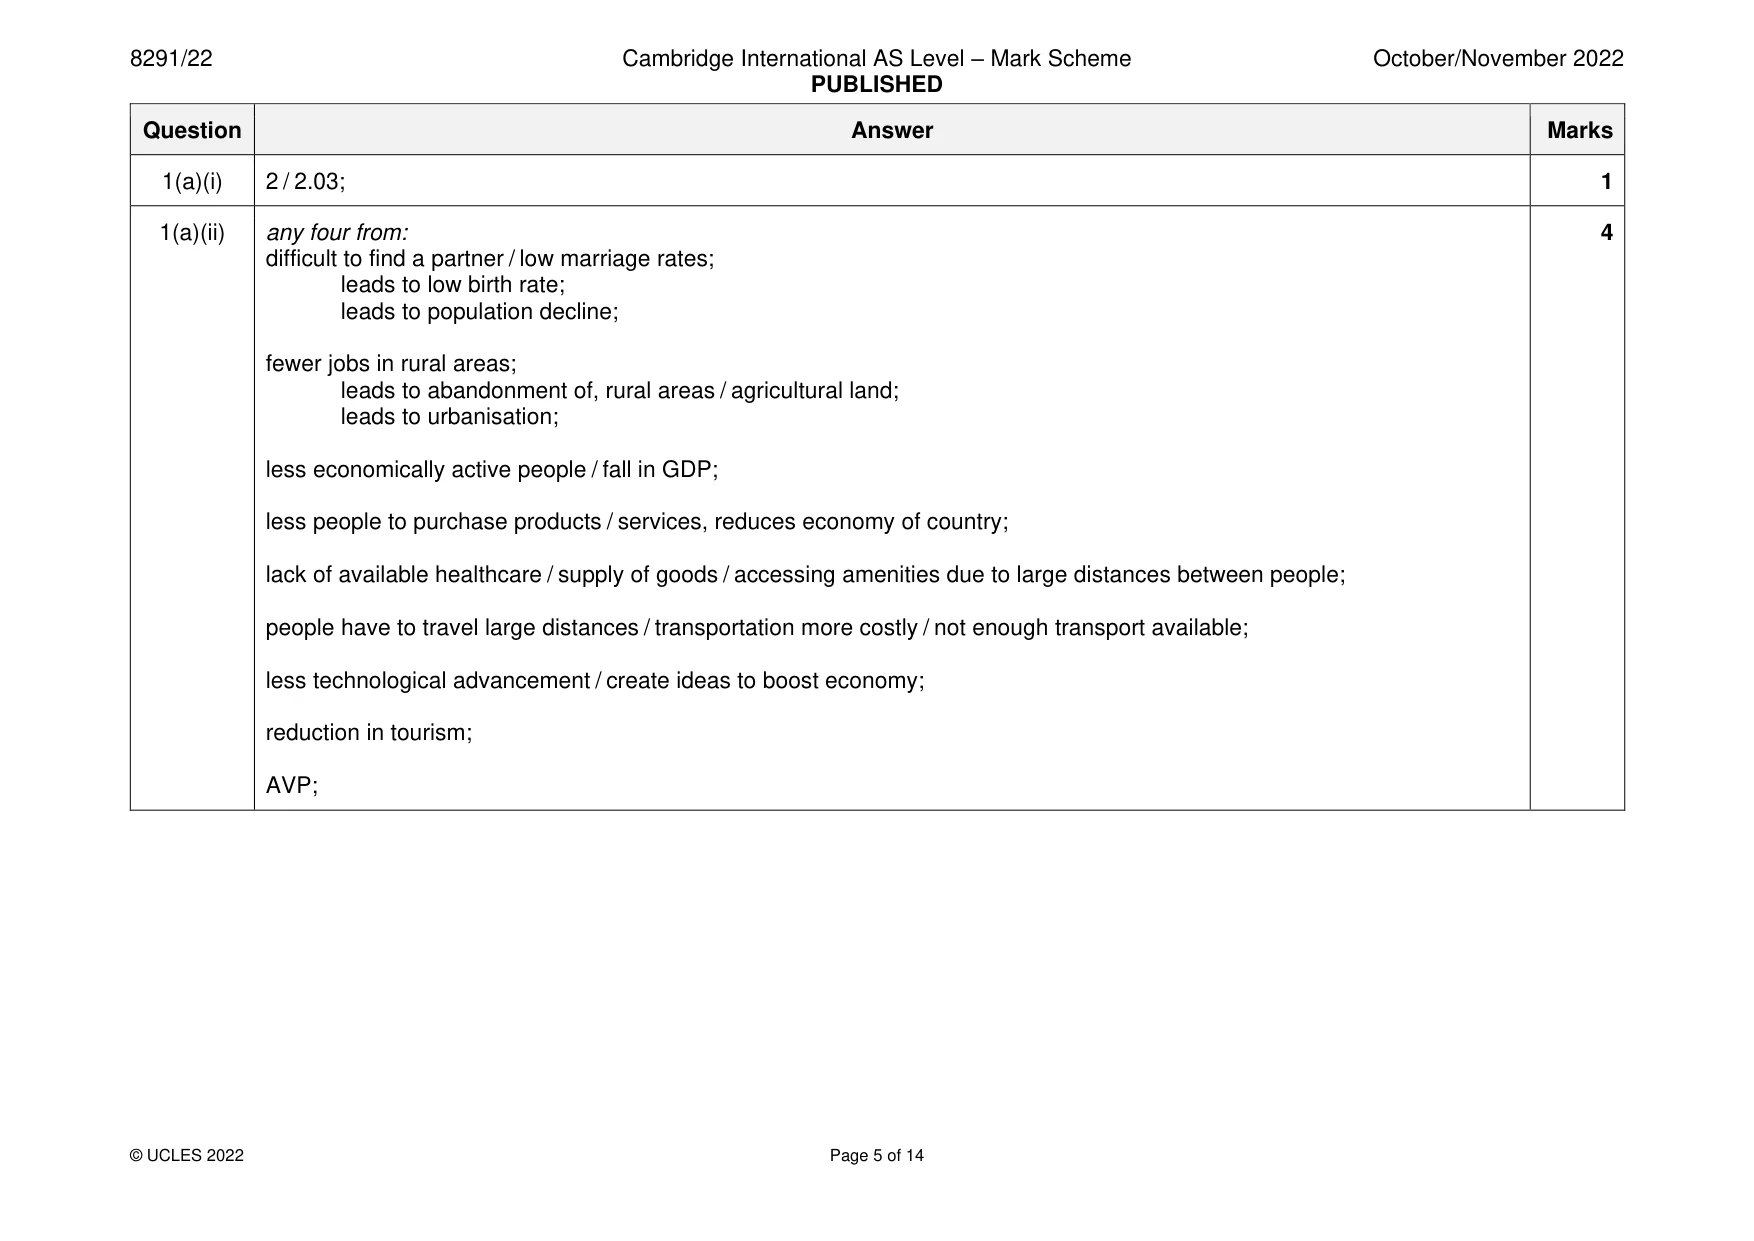
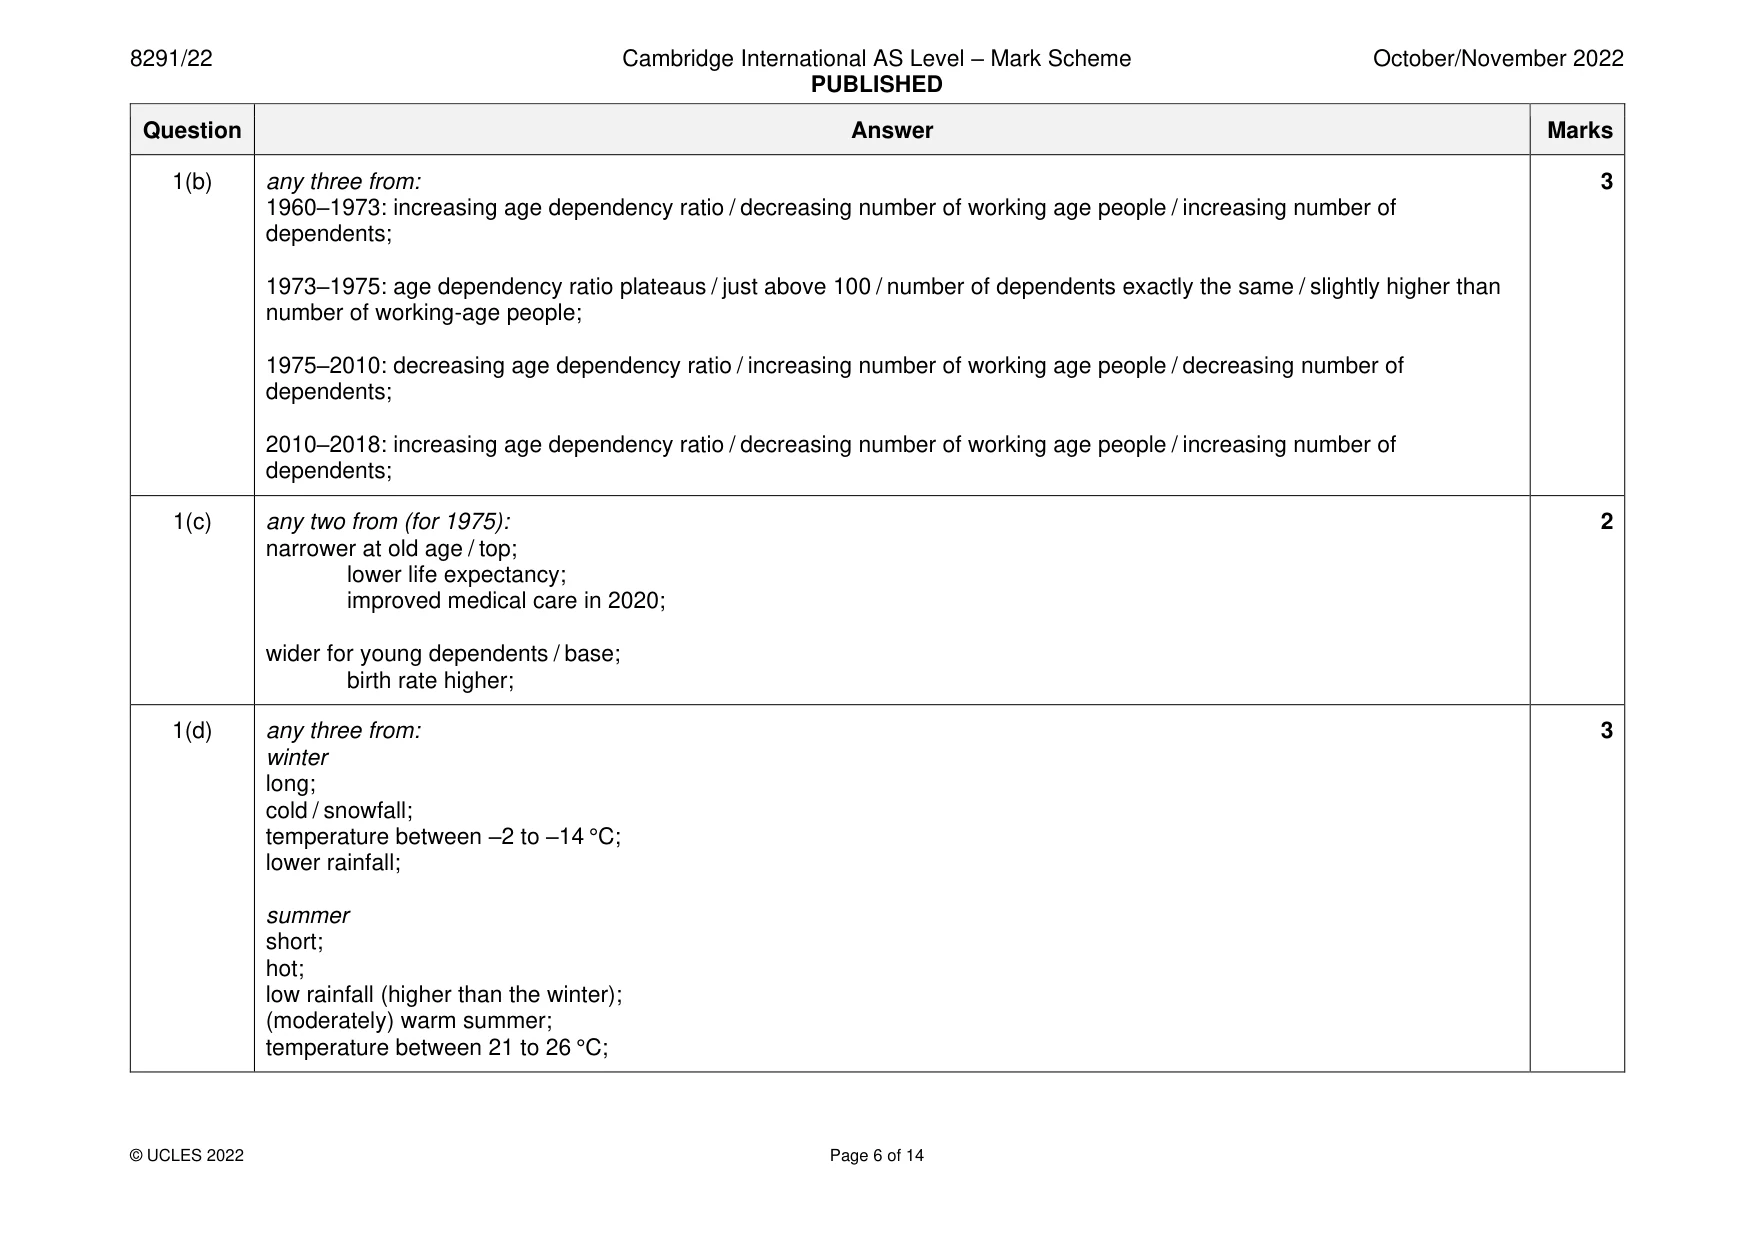
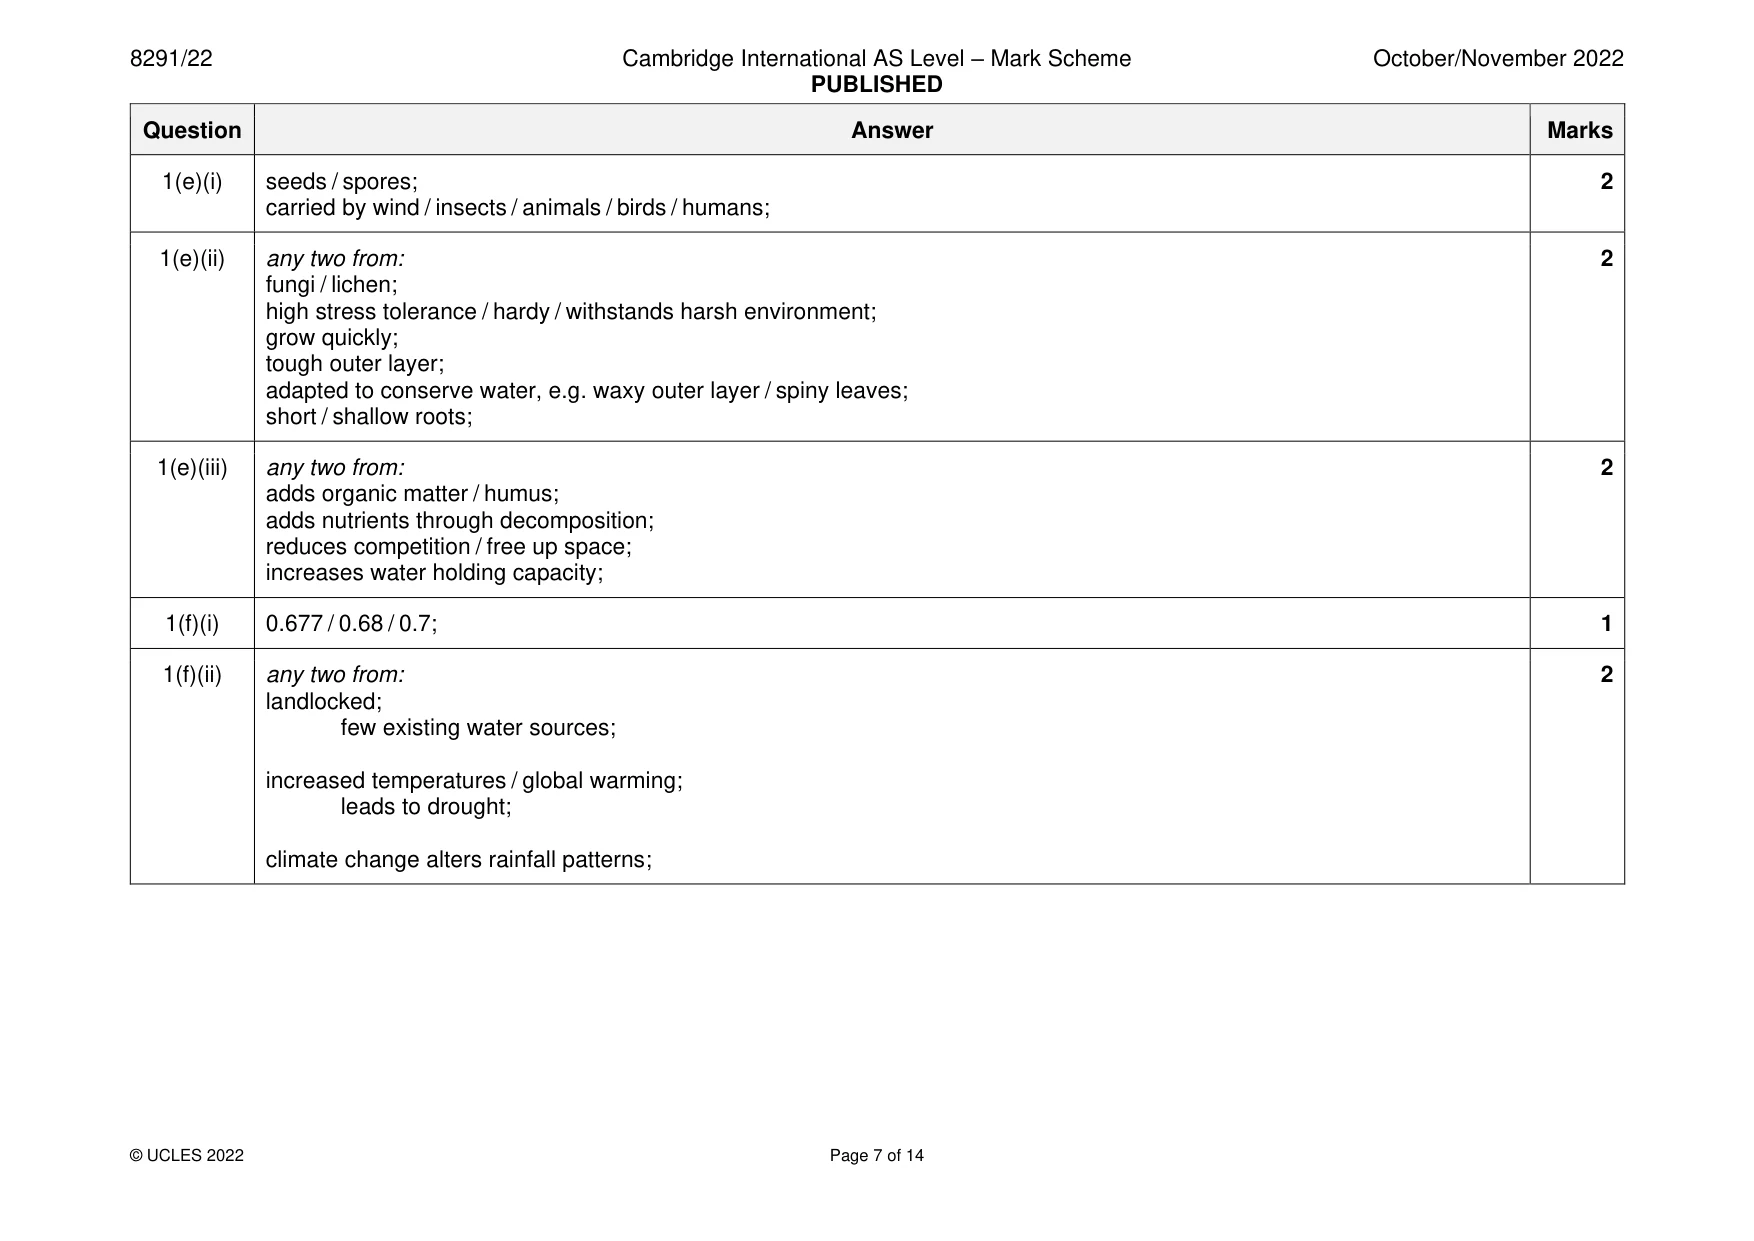
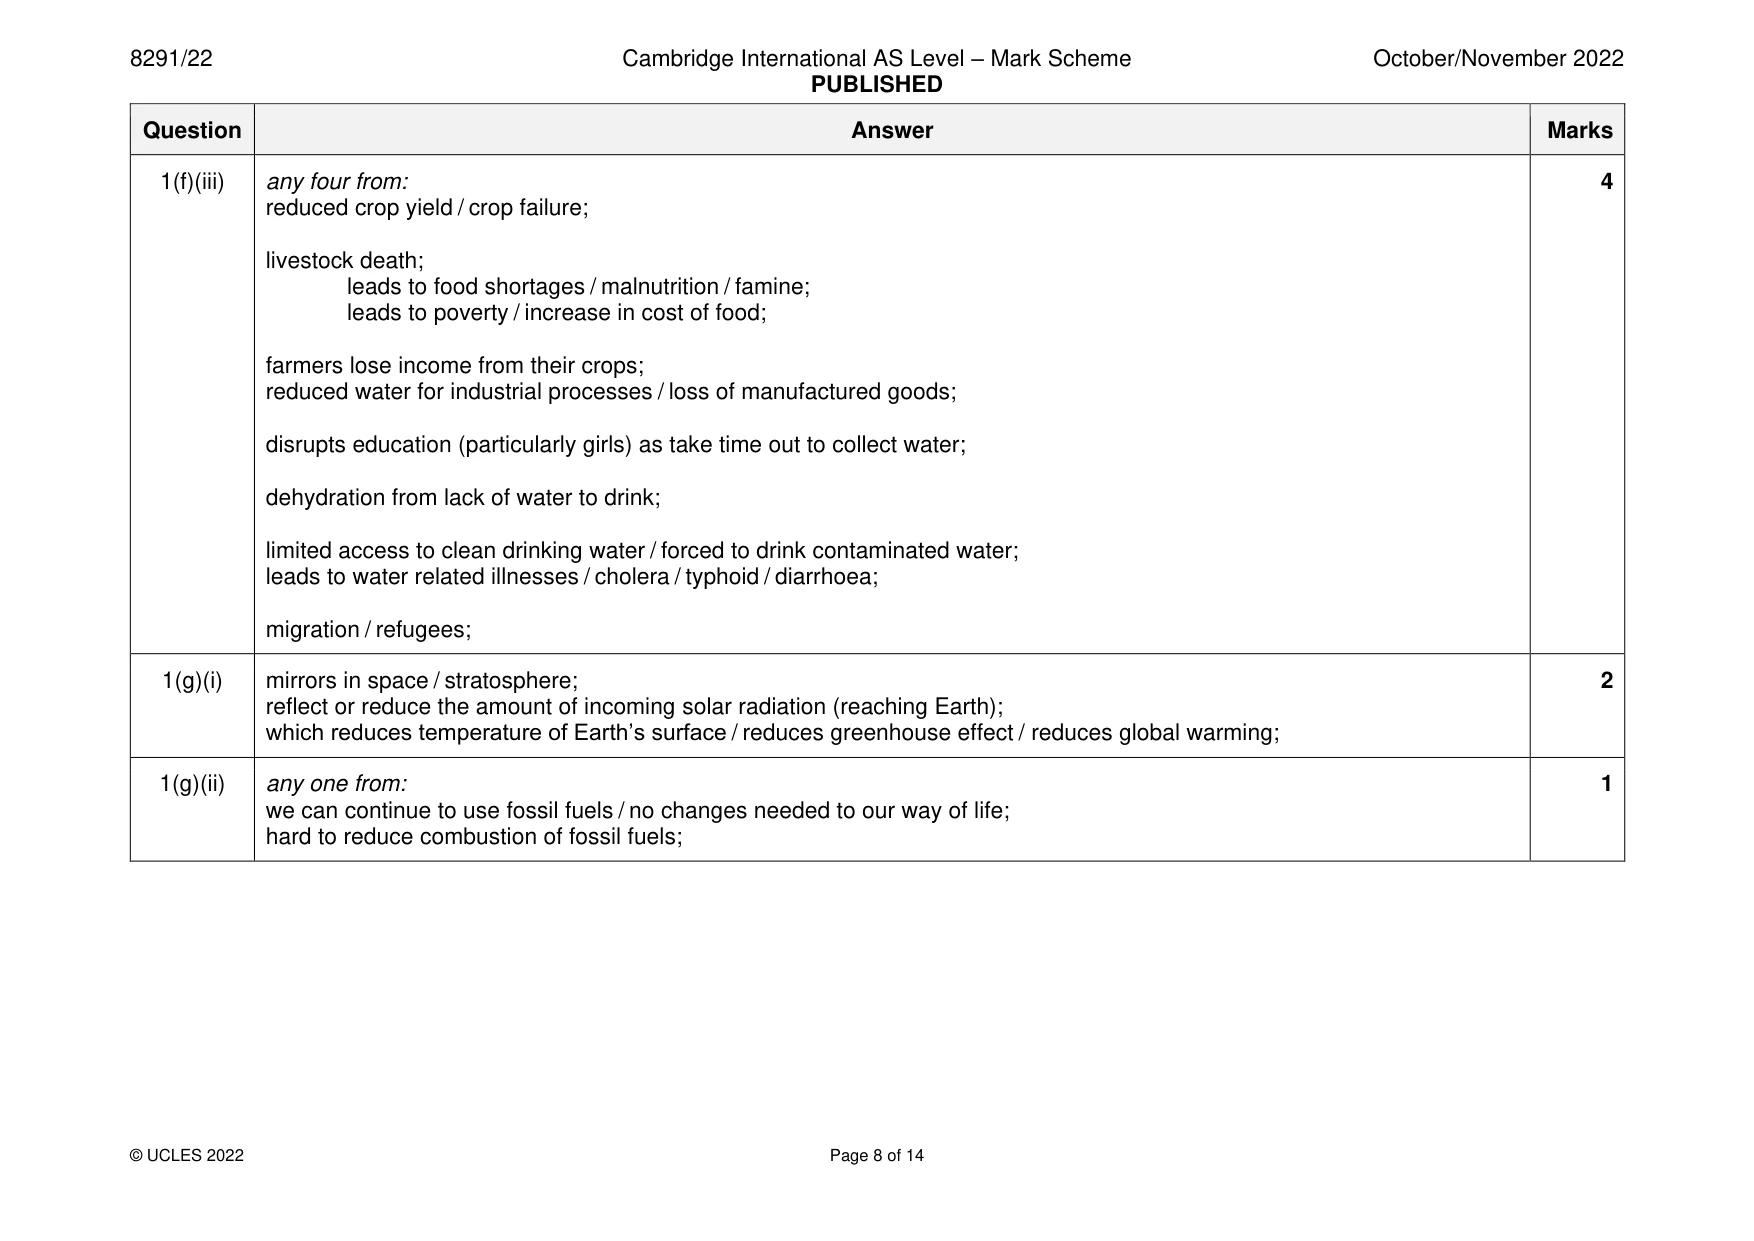
Mark scheme: Question Answer Marks 1(a)(i) 2 / 2.03; 1 1(a)(ii) any four from: 4 difficult to find a partner / low marriage rates; leads to low birth rate; leads to population decline; fewer jobs in rural areas; leads to abandonment of, rural areas / agricultural land; leads to urbanisation; less economically active people / fall in GDP; less people to purchase products / services, reduces economy of country; lack of available healthcare / supply of goods / accessing amenities due to large distances between people; people have to travel large distances / transportation more costly / not enough transport available; less technological advancement / create ideas to boost economy; reduction in tourism; AVP; 1(b) any three from: 3 1960–1973: increasing age dependency ratio / decreasing number of working age people / increasing number of dependents; 1973–1975: age dependency ratio plateaus / just above 100 / number of dependents exactly the same / slightly higher than number of working-age people; 1975–2010: decreasing age dependency ratio / increasing number of working age people / decreasing number of dependents; 2010–2018: increasing age dependency ratio / decreasing number of working age people / increasing number of dependents; 1(c) any two from (for 1975): 2 narrower at old age / top; lower life expectancy; improved medical care in 2020; wider for young dependents / base; birth rate higher; 1(d) any three from: 3 winter long; cold / snowfall; temperature between –2 to –14 °C; lower rainfall; summer short; hot; low rainfall (higher than the winter); (moderately) warm summer; temperature between 21 to 26 °C; 1(e)(i) seeds / spores; 2 carried by wind / insects / animals / birds / humans; 1(e)(ii) any two from: 2 fungi / lichen; high stress tolerance / hardy / withstands harsh environment; grow quickly; tough outer layer; adapted to conserve water, e.g. waxy outer layer / spiny leaves; short / shallow roots; 1(e)(iii) any two from: 2 adds organic matter / humus; adds nutrients through decomposition; reduces competition / free up space; increases water holding capacity; 1(f)(i) 0.677 / 0.68 / 0.7; 1 1(f)(ii) any two from: 2 landlocked; few existing water sources; increased temperatures / global warming; leads to drought; climate change alters rainfall patterns; 1(f)(iii) any four from: 4 reduced crop yield / crop failure; livestock death; leads to food shortages / malnutrition / famine; leads to poverty / increase in cost of food; farmers lose income from their crops; reduced water for industrial processes / loss of manufactured goods; disrupts education (particularly girls) as take time out to collect water; dehydration from lack of water to drink; limited access to clean drinking water / forced to drink contaminated water; leads to water related illnesses / cholera / typhoid / diarrhoea; migration / refugees; 1(g)(i) mirrors in space / stratosphere; 2 reflect or reduce the amount of incoming solar radiation (reaching Earth); which reduces temperature of Earth’s surface / reduces greenhouse effect / reduces global warming; 1(g)(ii) any one from: 1 we can continue to use fossil fuels / no changes needed to our way of life; hard to reduce combustion of fossil fuels;
Q2 · The photograph in Fig
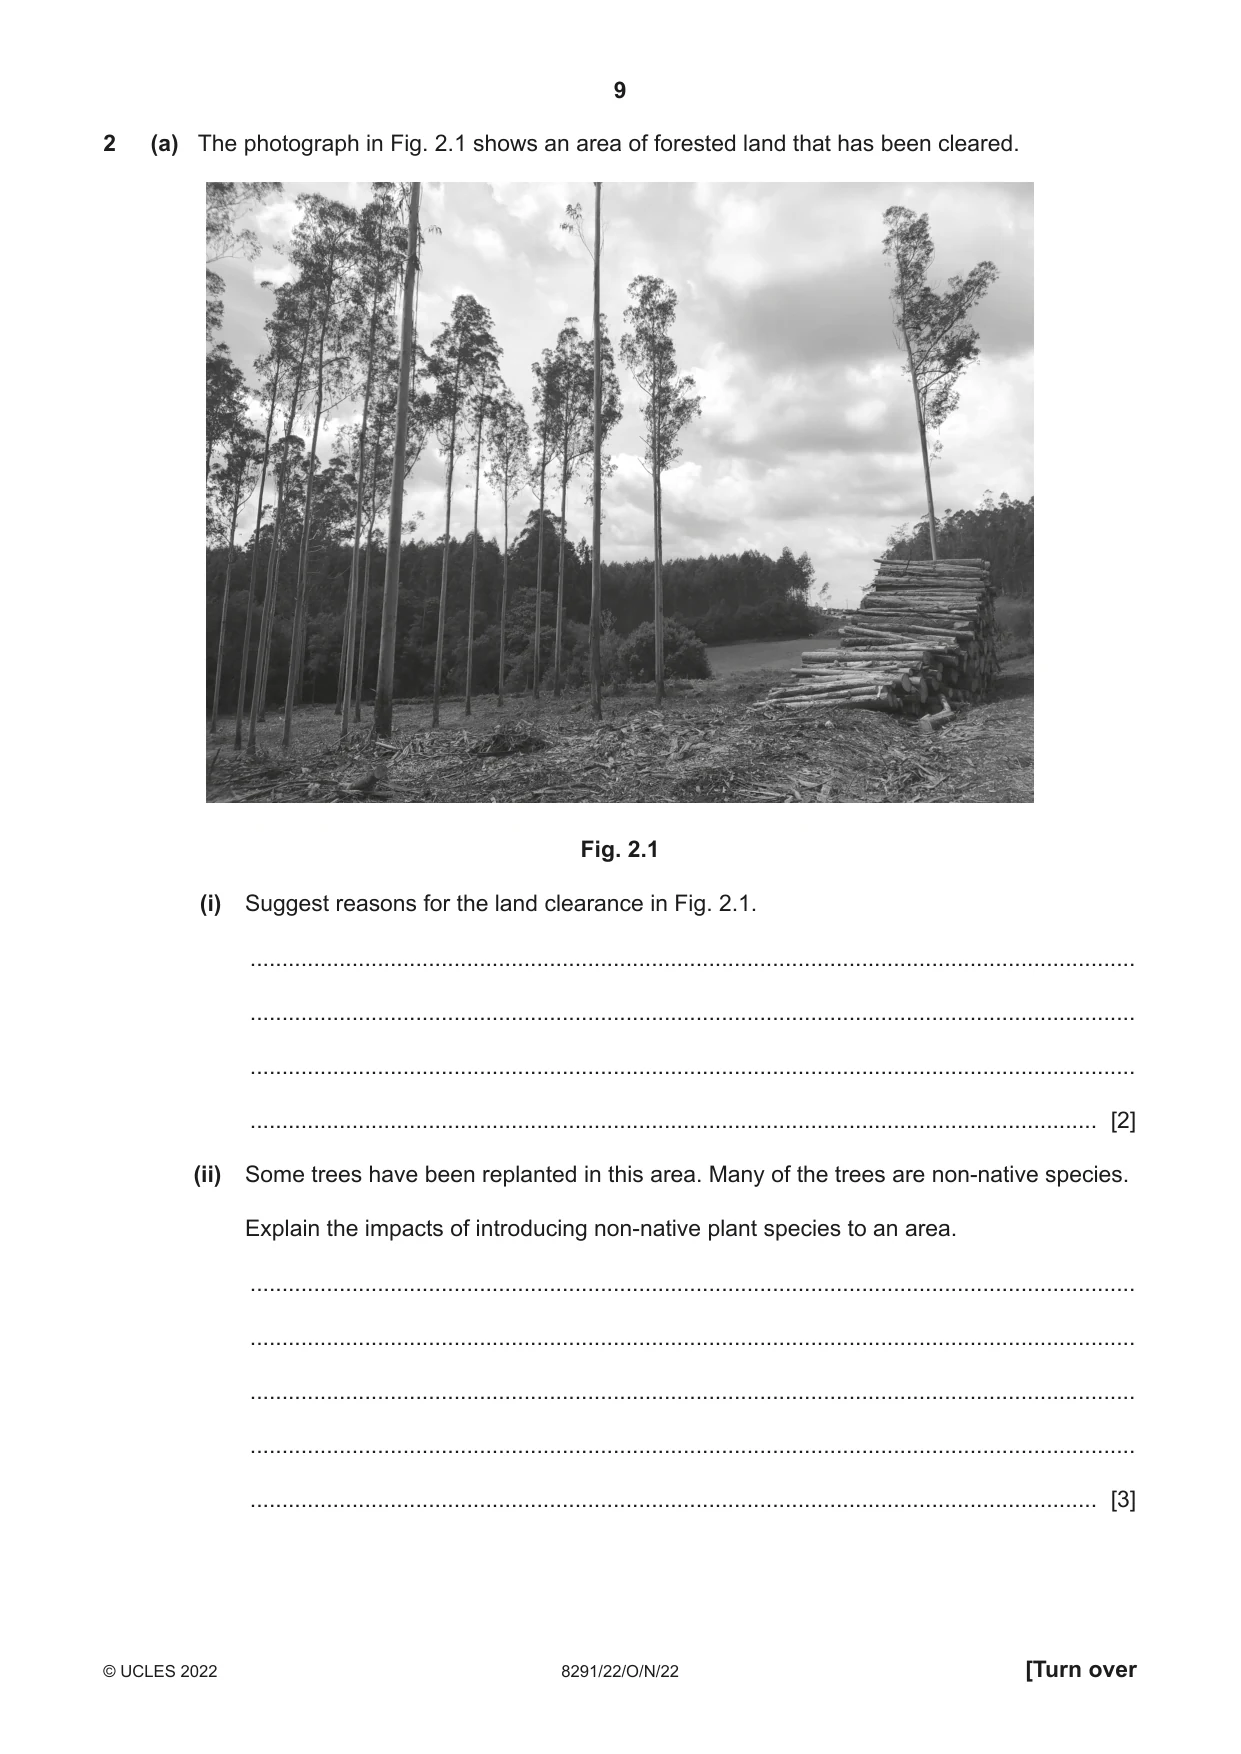
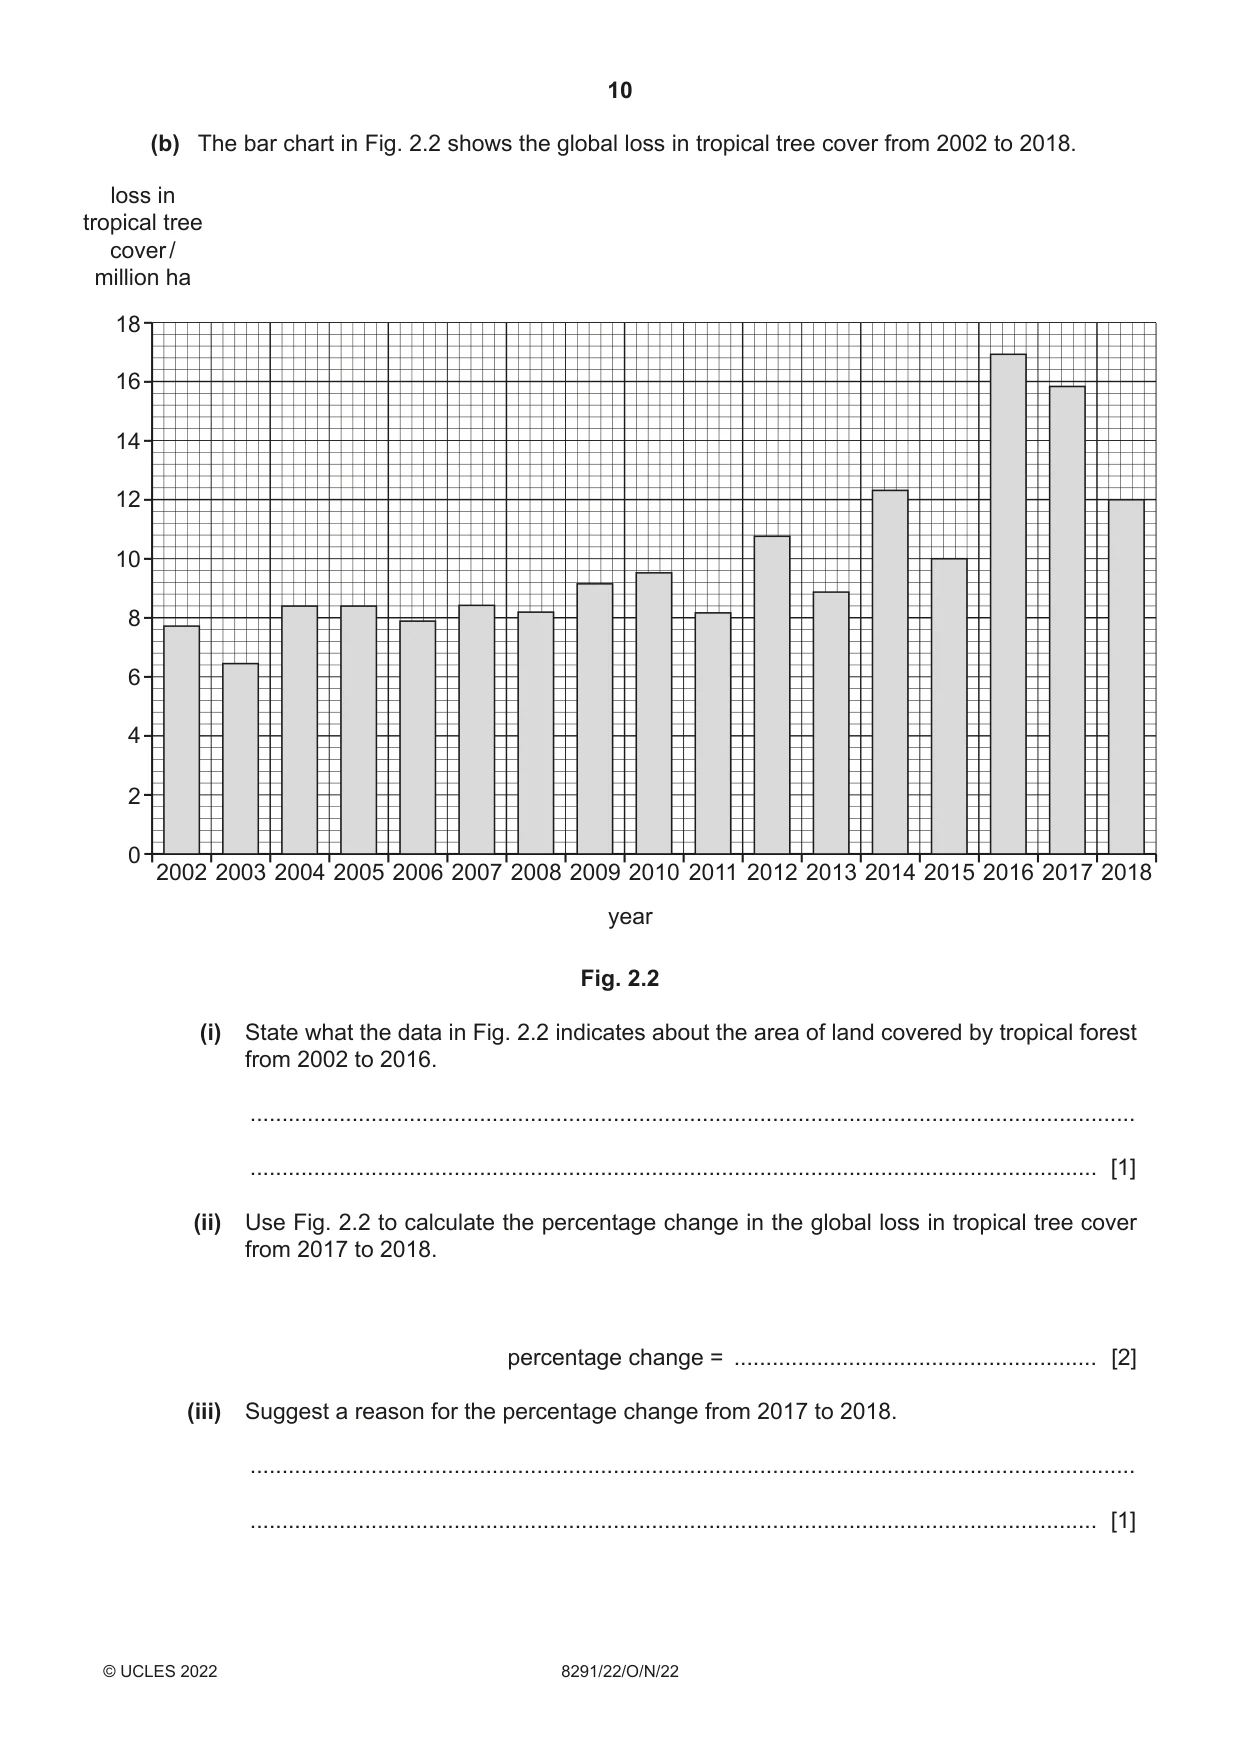
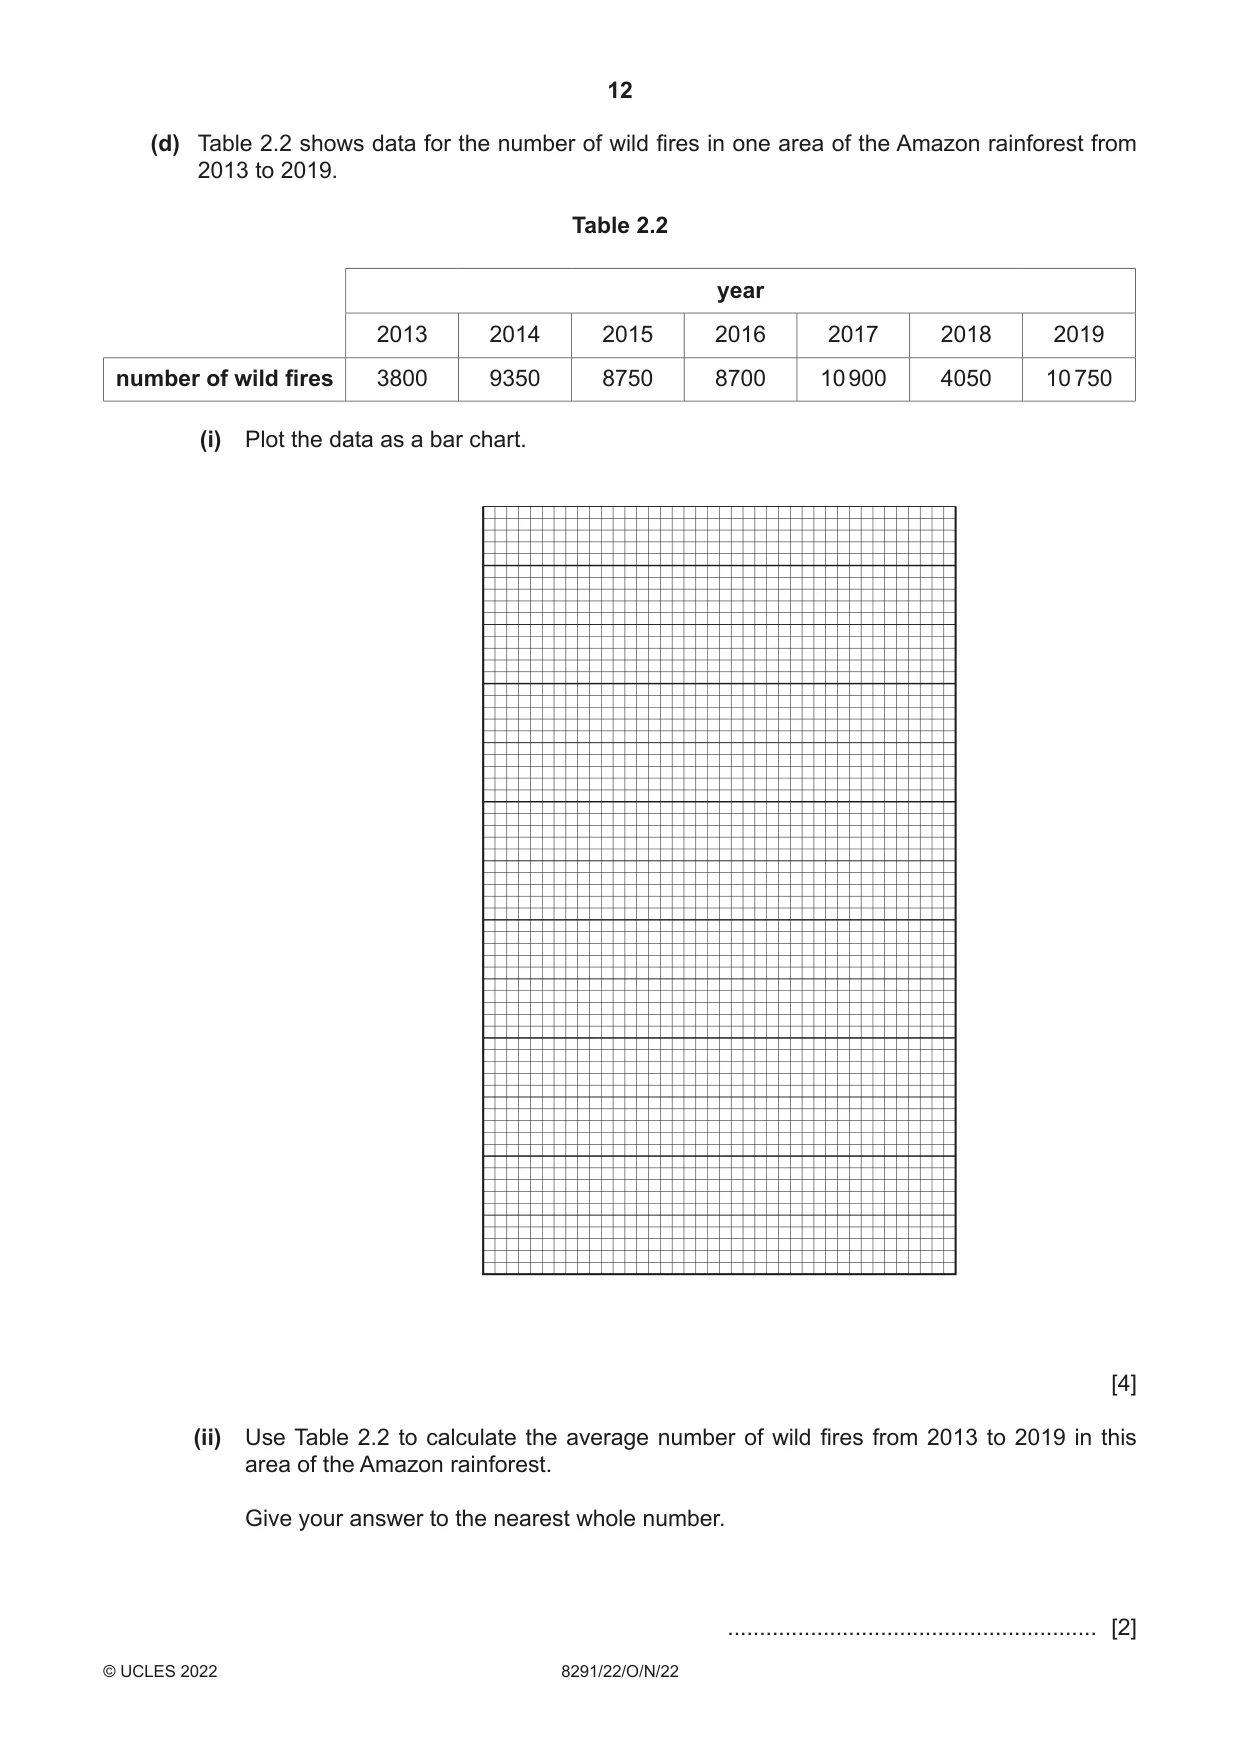
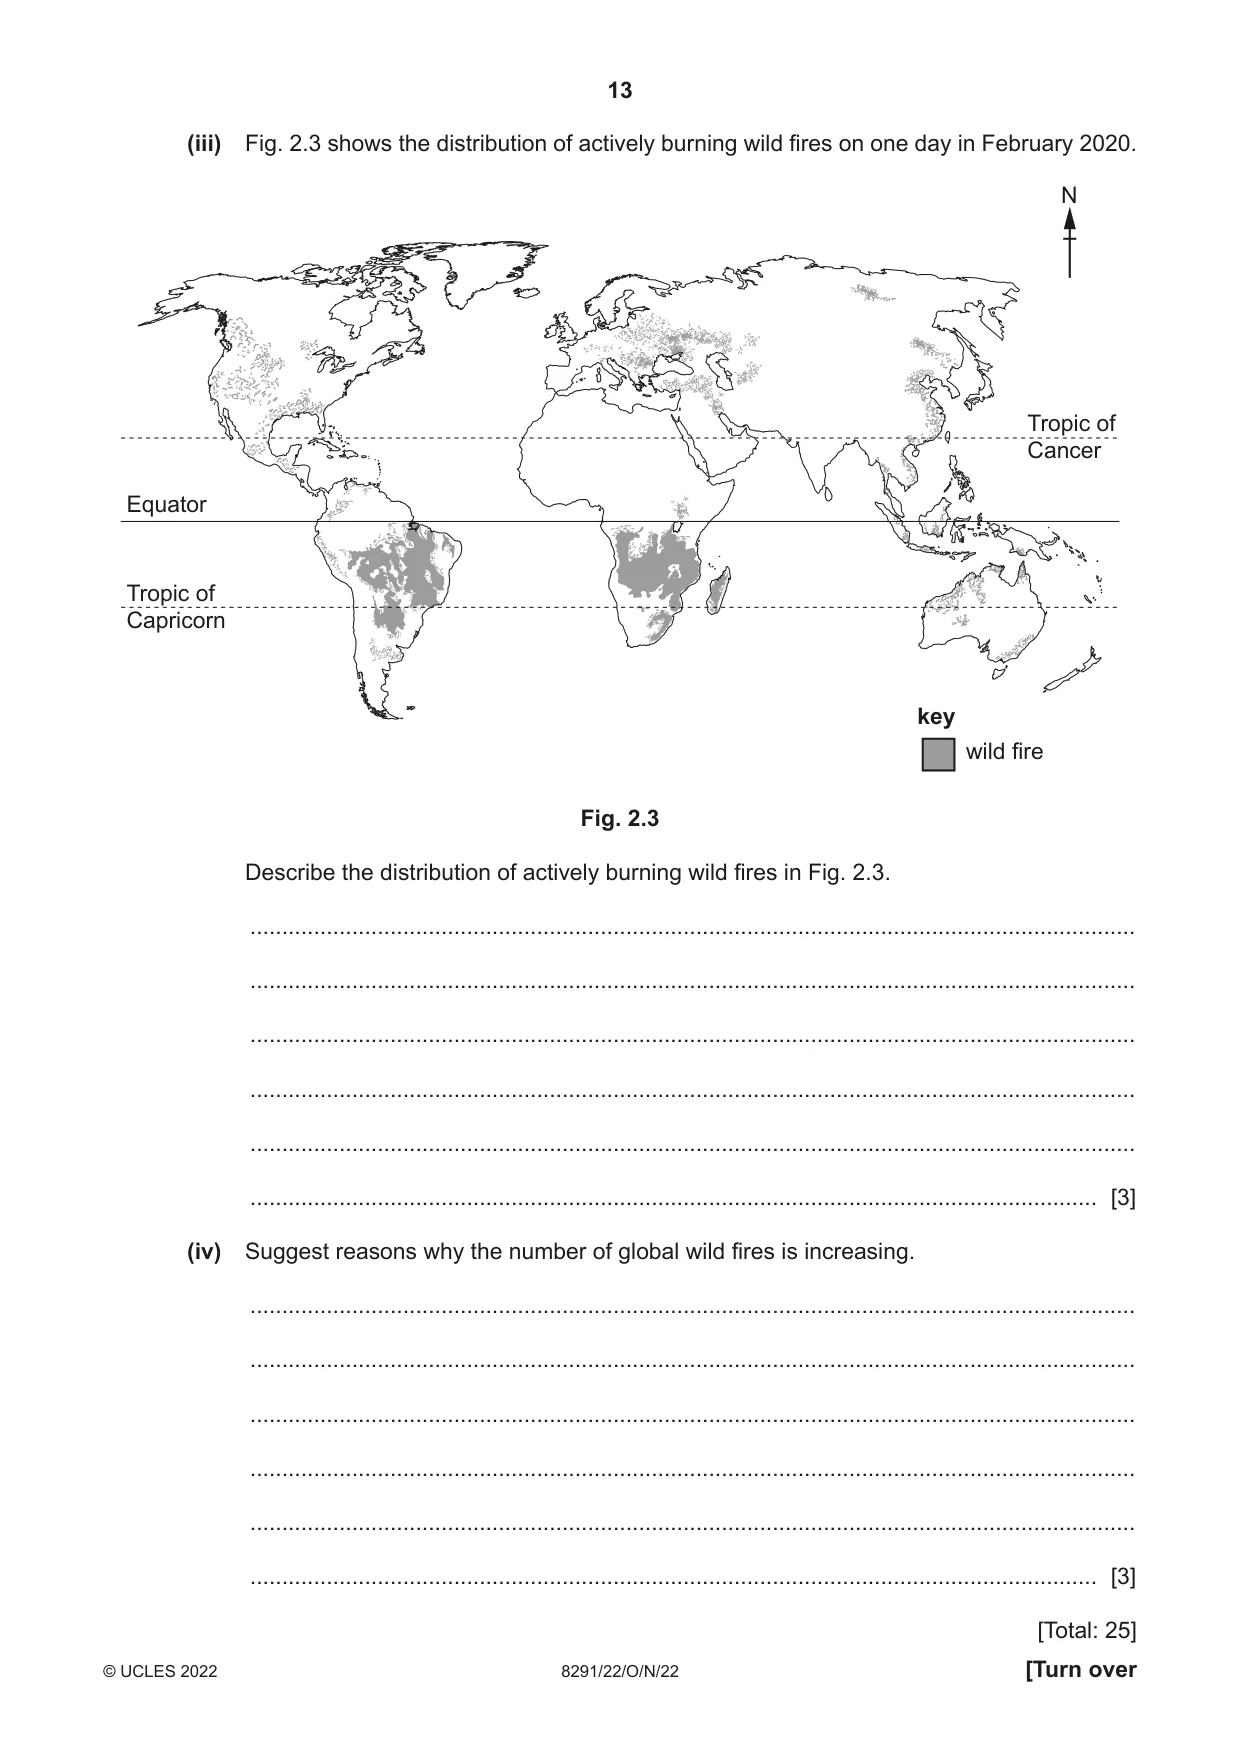
2 (a) The photograph in Fig. 2.1 shows an area of forested land that has been cleared. Fig. 2.1 (i) Suggest reasons for the land clearance in Fig. 2.1. ........................................................................................................................................... ........................................................................................................................................... ........................................................................................................................................... ..................................................................................................................................... [2] (ii) Some trees have been replanted in this area. Many of the trees are non-native species. Explain the impacts of introducing non-native plant species to an area. ........................................................................................................................................... ........................................................................................................................................... ........................................................................................................................................... ........................................................................................................................................... ..................................................................................................................................... [3] (b) The bar chart in Fig. 2.2 shows the global loss in tropical tree cover from 2002 to 2018. loss in tropical tree cover / million ha 18 16 14 12 10 8 6 4 2 0 2002 2003 2004 2005 2006 2007 2008 2009 2010 2011 2012 2013 2014 2015 2016 2017 2018 year Fig. 2.2 (i) State what the data in Fig. 2.2 indicates about the area of land covered by tropical forest from 2002 to 2016. ........................................................................................................................................... ..................................................................................................................................... [1] (ii) Use Fig. 2.2 to calculate the percentage change in the global loss in tropical tree cover from 2017 to 2018. percentage change = ......................................................... [2] (iii) Suggest a reason for the percentage change from 2017 to 2018. ........................................................................................................................................... ..................................................................................................................................... [1] (c) Explain the benefits of afforestation. ................................................................................................................................................... ................................................................................................................................................... ................................................................................................................................................... ................................................................................................................................................... ................................................................................................................................................... ................................................................................................................................................... ................................................................................................................................................... ............................................................................................................................................. [4] (d) Table 2.2 shows data for the number of wild fires in one area of the Amazon rainforest from 2013 to 2019. Table 2.2 year 2013 2014 2015 2016 2017 2018 2019 number of wild fires 3800 9350 8750 8700 10 900 4050 10 750 (i) Plot the data as a bar chart. [4] (ii) Use Table 2.2 to calculate the average number of wild fires from 2013 to 2019 in this area of the Amazon rainforest. Give your answer to the nearest whole number. .......................................................... [2] (iii) Fig. 2.3 shows the distribution of actively burning wild fires on one day in February 2020. N Tropic of Cancer Equator Tropic of Capricorn key wild fire Fig. 2.3 Describe the distribution of actively burning wild fires in Fig. 2.3. ........................................................................................................................................... ........................................................................................................................................... ........................................................................................................................................... ........................................................................................................................................... ........................................................................................................................................... ..................................................................................................................................... [3] (iv) Suggest reasons why the number of global wild fires is increasing. ........................................................................................................................................... ........................................................................................................................................... ........................................................................................................................................... ........................................................................................................................................... ........................................................................................................................................... ..................................................................................................................................... [3] [Total: 25]
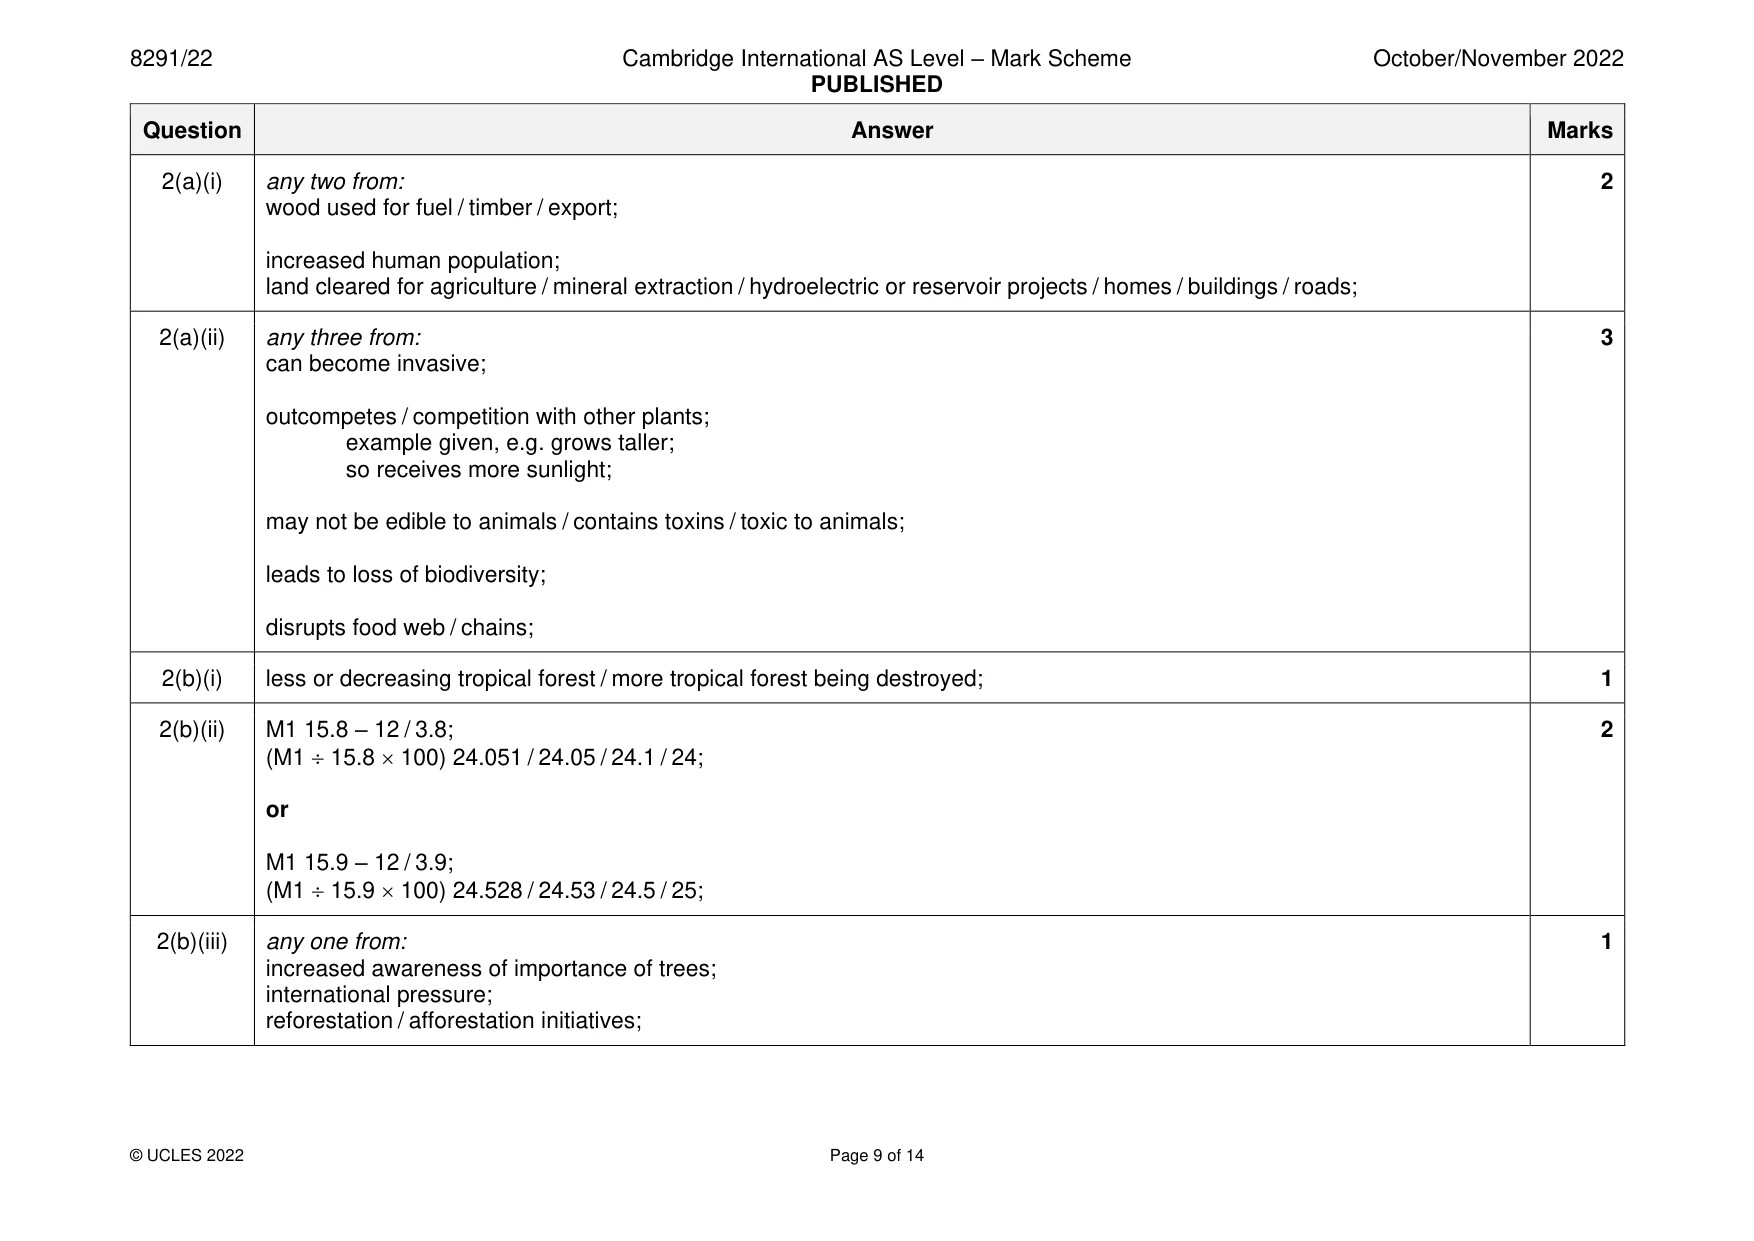
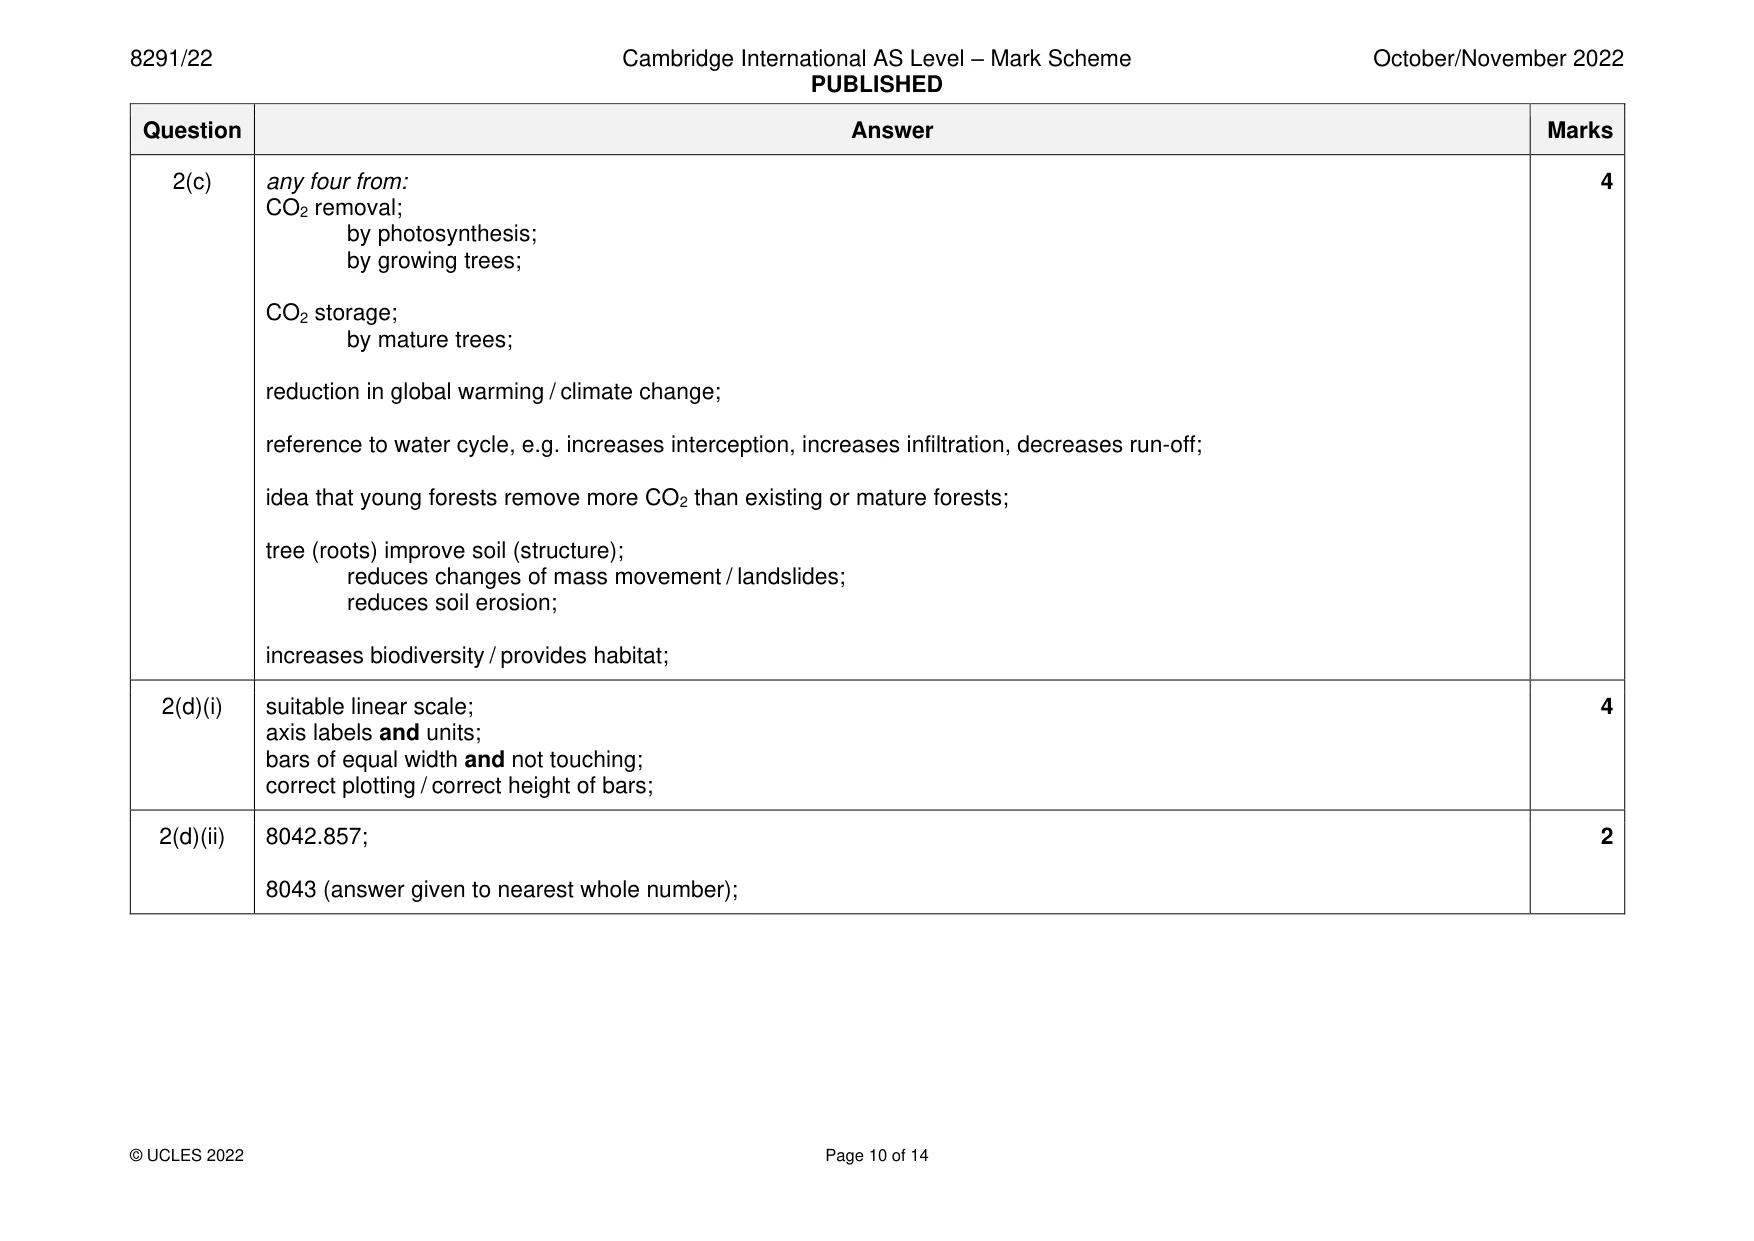
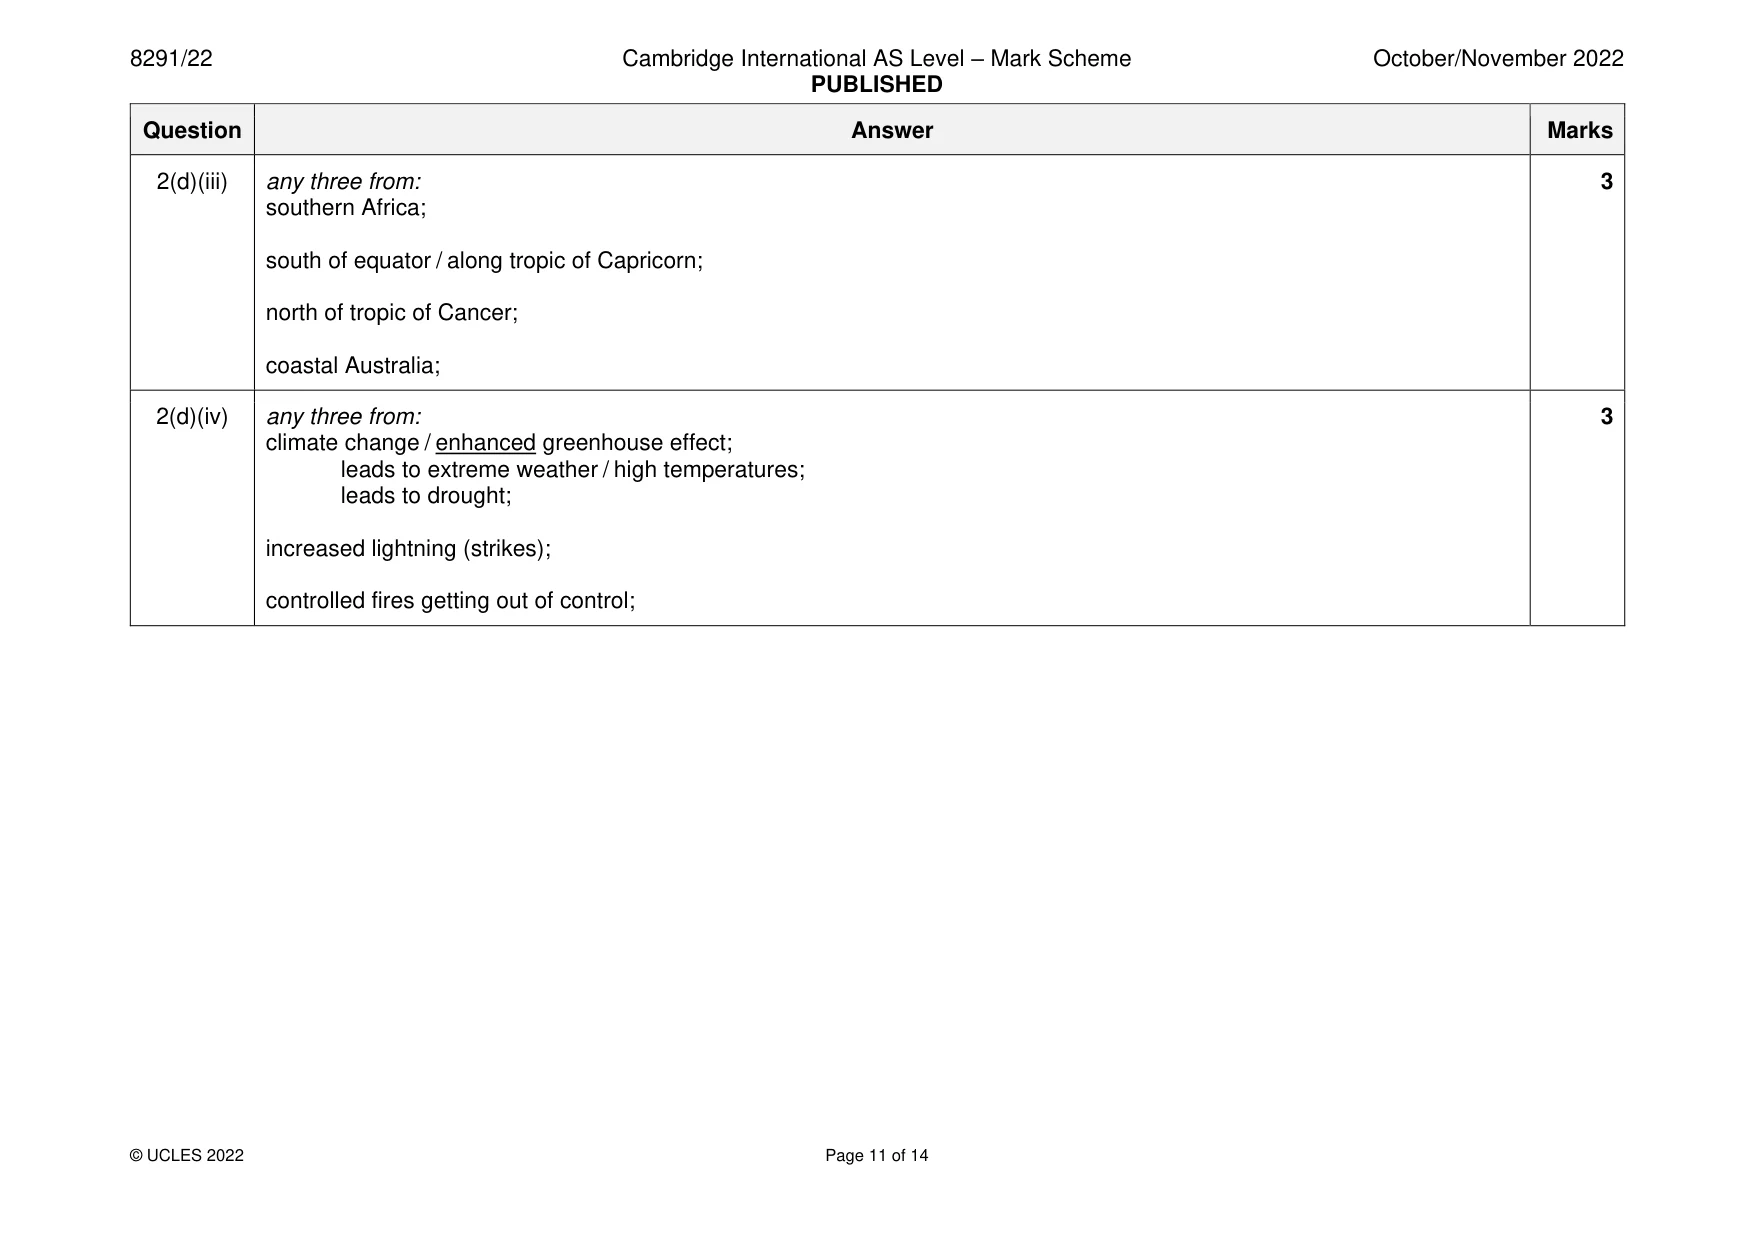
Mark scheme: 2(a)(i) any two from: 2 wood used for fuel / timber / export; increased human population; land cleared for agriculture / mineral extraction / hydroelectric or reservoir projects / homes / buildings / roads; 2(a)(ii) any three from: 3 can become invasive; outcompetes / competition with other plants; example given, e.g. grows taller; so receives more sunlight; may not be edible to animals / contains toxins / toxic to animals; leads to loss of biodiversity; disrupts food web / chains; 2(b)(i) less or decreasing tropical forest / more tropical forest being destroyed; 1 2(b)(ii) M1 15.8 – 12 / 3.8; 2 (M1 15.8 100) 24.051 / 24.05 / 24.1 / 24; or M1 15.9 – 12 / 3.9; (M1 15.9 100) 24.528 / 24.53 / 24.5 / 25; 2(b)(iii) any one from: 1 increased awareness of importance of trees; international pressure; reforestation / afforestation initiatives; 2(c) any four from: 4 CO2 removal; by photosynthesis; by growing trees; CO2 storage; by mature trees; reduction in global warming / climate change; reference to water cycle, e.g. increases interception, increases infiltration, decreases run-off; idea that young forests remove more CO2 than existing or mature forests; tree (roots) improve soil (structure); reduces changes of mass movement / landslides; reduces soil erosion; increases biodiversity / provides habitat; 2(d)(i) suitable linear scale; 4 axis labels and units; bars of equal width and not touching; correct plotting / correct height of bars; 2(d)(ii) 8042.857; 2 8043 (answer given to nearest whole number); 2(d)(iii) any three from: 3 southern Africa; south of equator / along tropic of Capricorn; north of tropic of Cancer; coastal Australia; 2(d)(iv) any three from: 3 climate change / enhanced greenhouse effect; leads to extreme weather / high temperatures; leads to drought; increased lightning (strikes); controlled fires getting out of control;
Q3 · A biologist wants to investigate the biodiversity in a stream using a kick sampling method
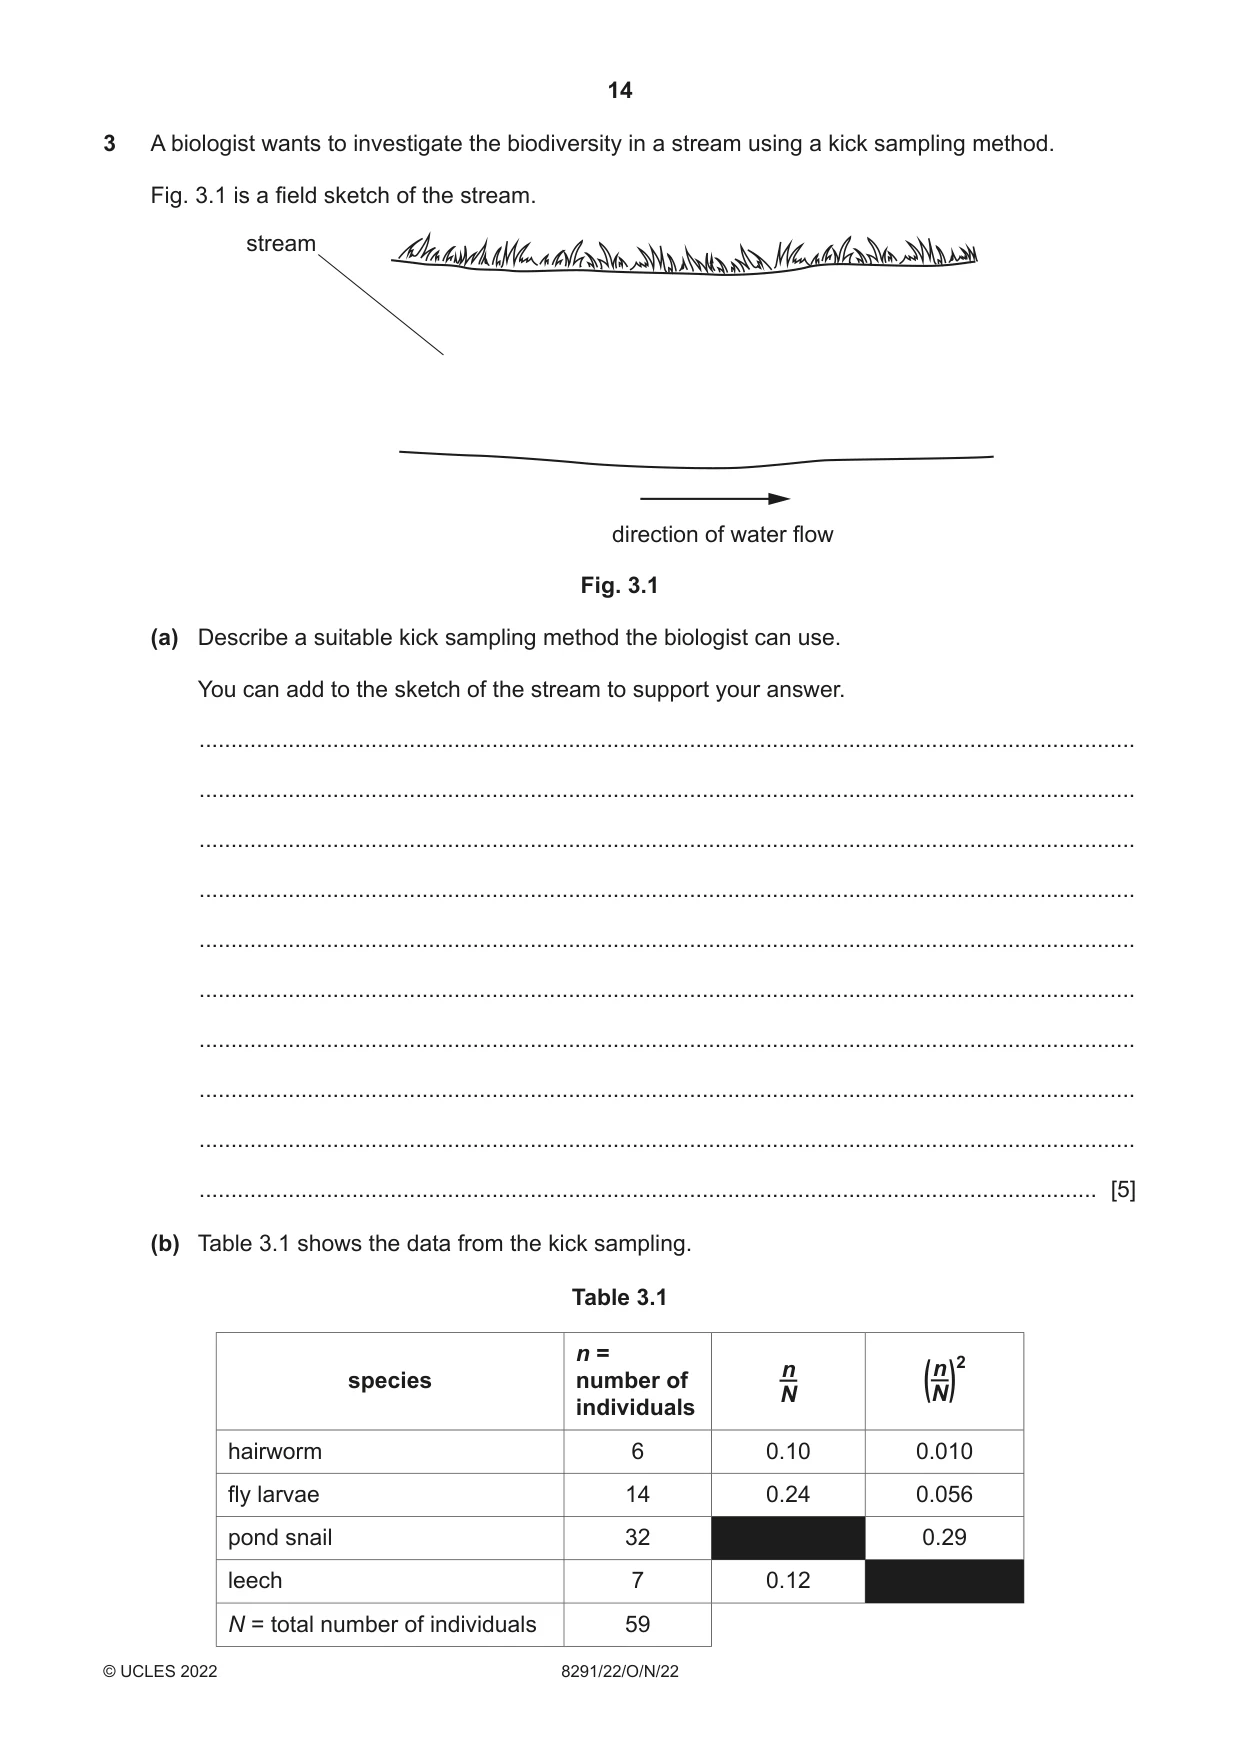
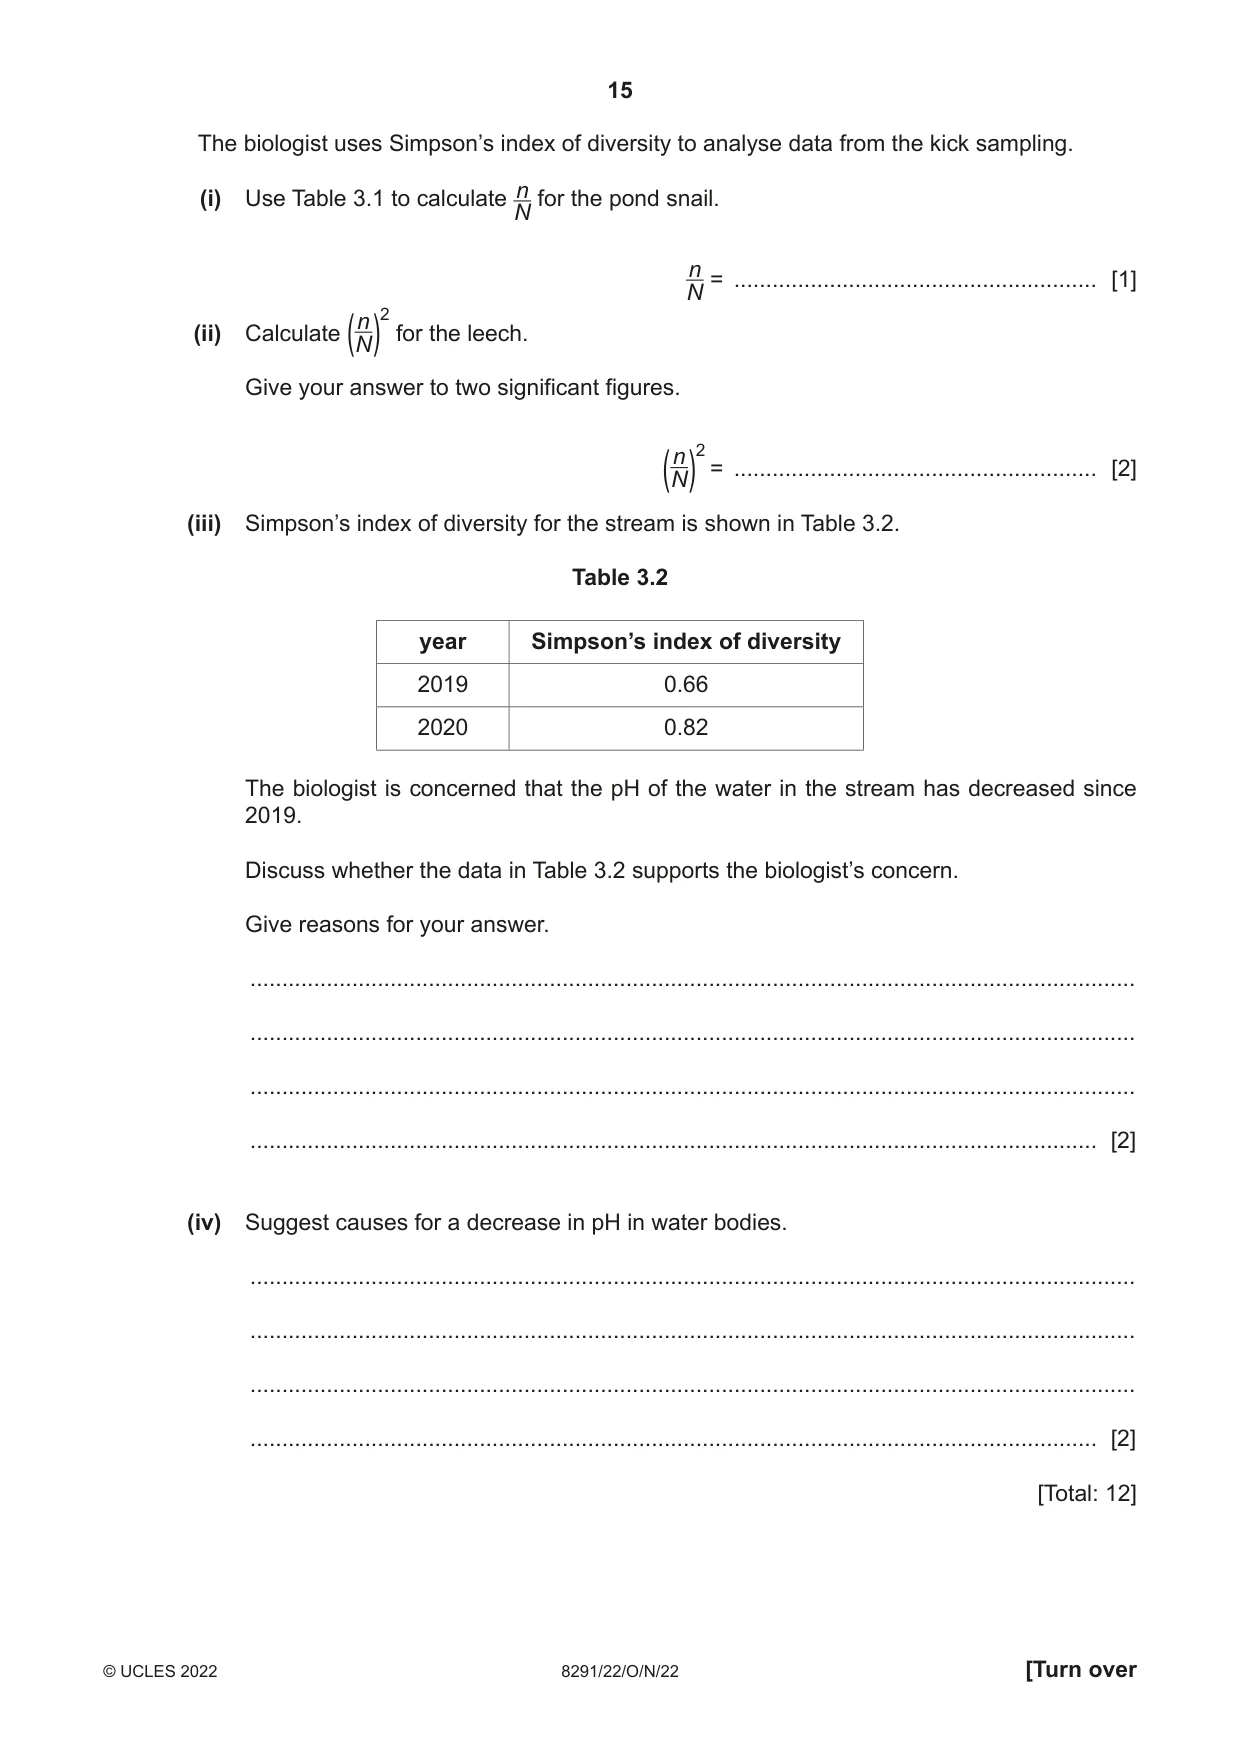
3 A biologist wants to investigate the biodiversity in a stream using a kick sampling method. Fig. 3.1 is a field sketch of the stream. stream direction of water flow Fig. 3.1 (a) Describe a suitable kick sampling method the biologist can use. You can add to the sketch of the stream to support your answer. ................................................................................................................................................... ................................................................................................................................................... ................................................................................................................................................... ................................................................................................................................................... ................................................................................................................................................... ................................................................................................................................................... ................................................................................................................................................... ................................................................................................................................................... ................................................................................................................................................... ............................................................................................................................................. [5] (b) Table 3.1 shows the data from the kick sampling. Table 3.1 n = 2 n species number of N (nN) individuals hairworm 6 0.10 0.010 fly larvae 14 0.24 0.056 pond snail 32 0.29 leech 7 0.12 N = total number of individuals 59 The biologist uses Simpson’s index of diversity to analyse data from the kick sampling. n (i) Use Table 3.1 to calculate for the pond snail. N n = ......................................................... [1] N n 2 (ii) Calculate for the leech. ( N) Give your answer to two significant figures. n 2 = ......................................................... [2] ( N) (iii) Simpson’s index of diversity for the stream is shown in Table 3.2. Table 3.2 year Simpson’s index of diversity 2019 0.66 2020 0.82 The biologist is concerned that the pH of the water in the stream has decreased since 2019. Discuss whether the data in Table 3.2 supports the biologist’s concern. Give reasons for your answer. ........................................................................................................................................... ........................................................................................................................................... ........................................................................................................................................... ..................................................................................................................................... [2] (iv) Suggest causes for a decrease in pH in water bodies. ........................................................................................................................................... ........................................................................................................................................... ........................................................................................................................................... ..................................................................................................................................... [2] [Total: 12]
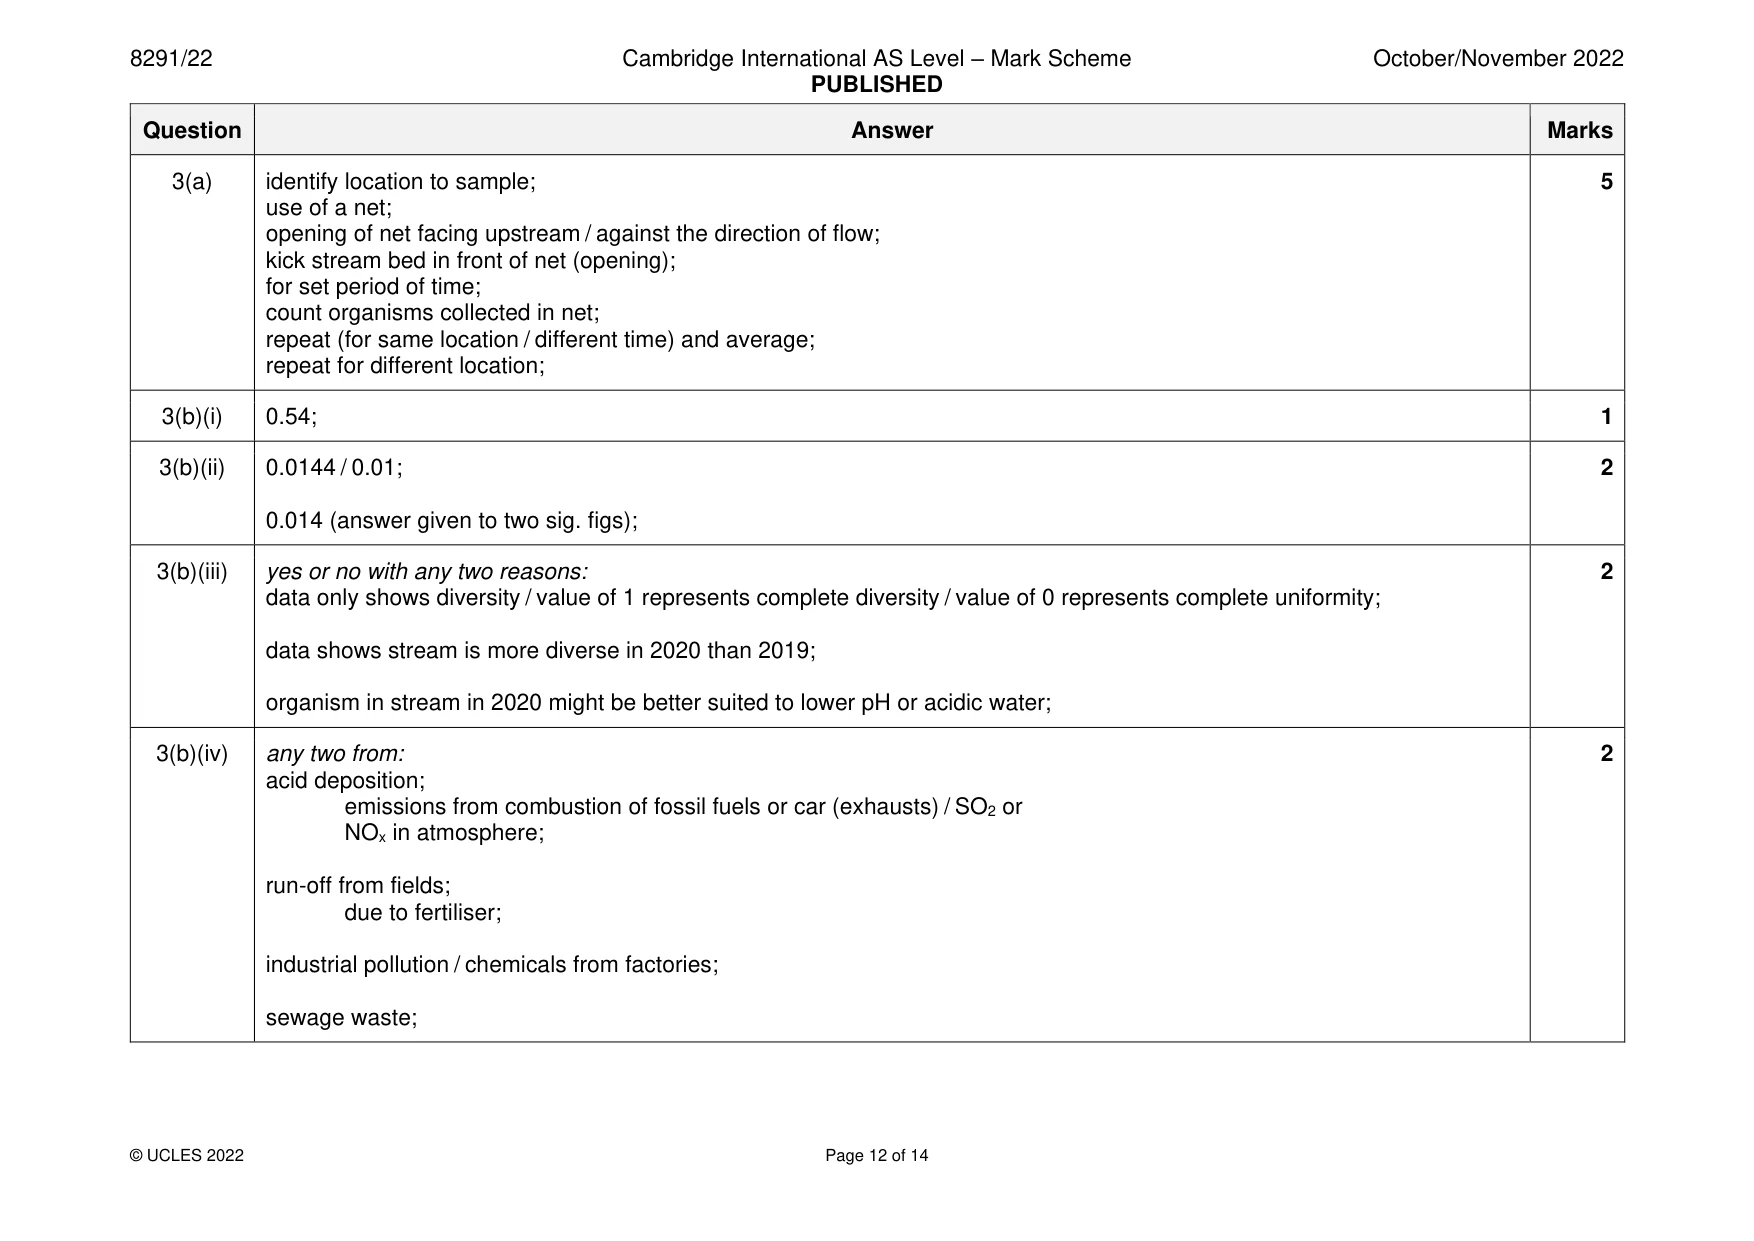
Mark scheme: 3(a) identify location to sample; 5 use of a net; opening of net facing upstream / against the direction of flow; kick stream bed in front of net (opening); for set period of time; count organisms collected in net; repeat (for same location / different time) and average; repeat for different location; 3(b)(i) 0.54; 1 3(b)(ii) 0.0144 / 0.01; 2 0.014 (answer given to two sig. figs); 3(b)(iii) yes or no with any two reasons: 2 data only shows diversity / value of 1 represents complete diversity / value of 0 represents complete uniformity; data shows stream is more diverse in 2020 than 2019; organism in stream in 2020 might be better suited to lower pH or acidic water; 3(b)(iv) any two from: 2 acid deposition; emissions from combustion of fossil fuels or car (exhausts) / SO2 or NOx in atmosphere; run-off from fields; due to fertiliser; industrial pollution / chemicals from factories; sewage waste;
More questions on Data collection techniques and data analysis
Q4 · Approximately 623 million people practise open defecation
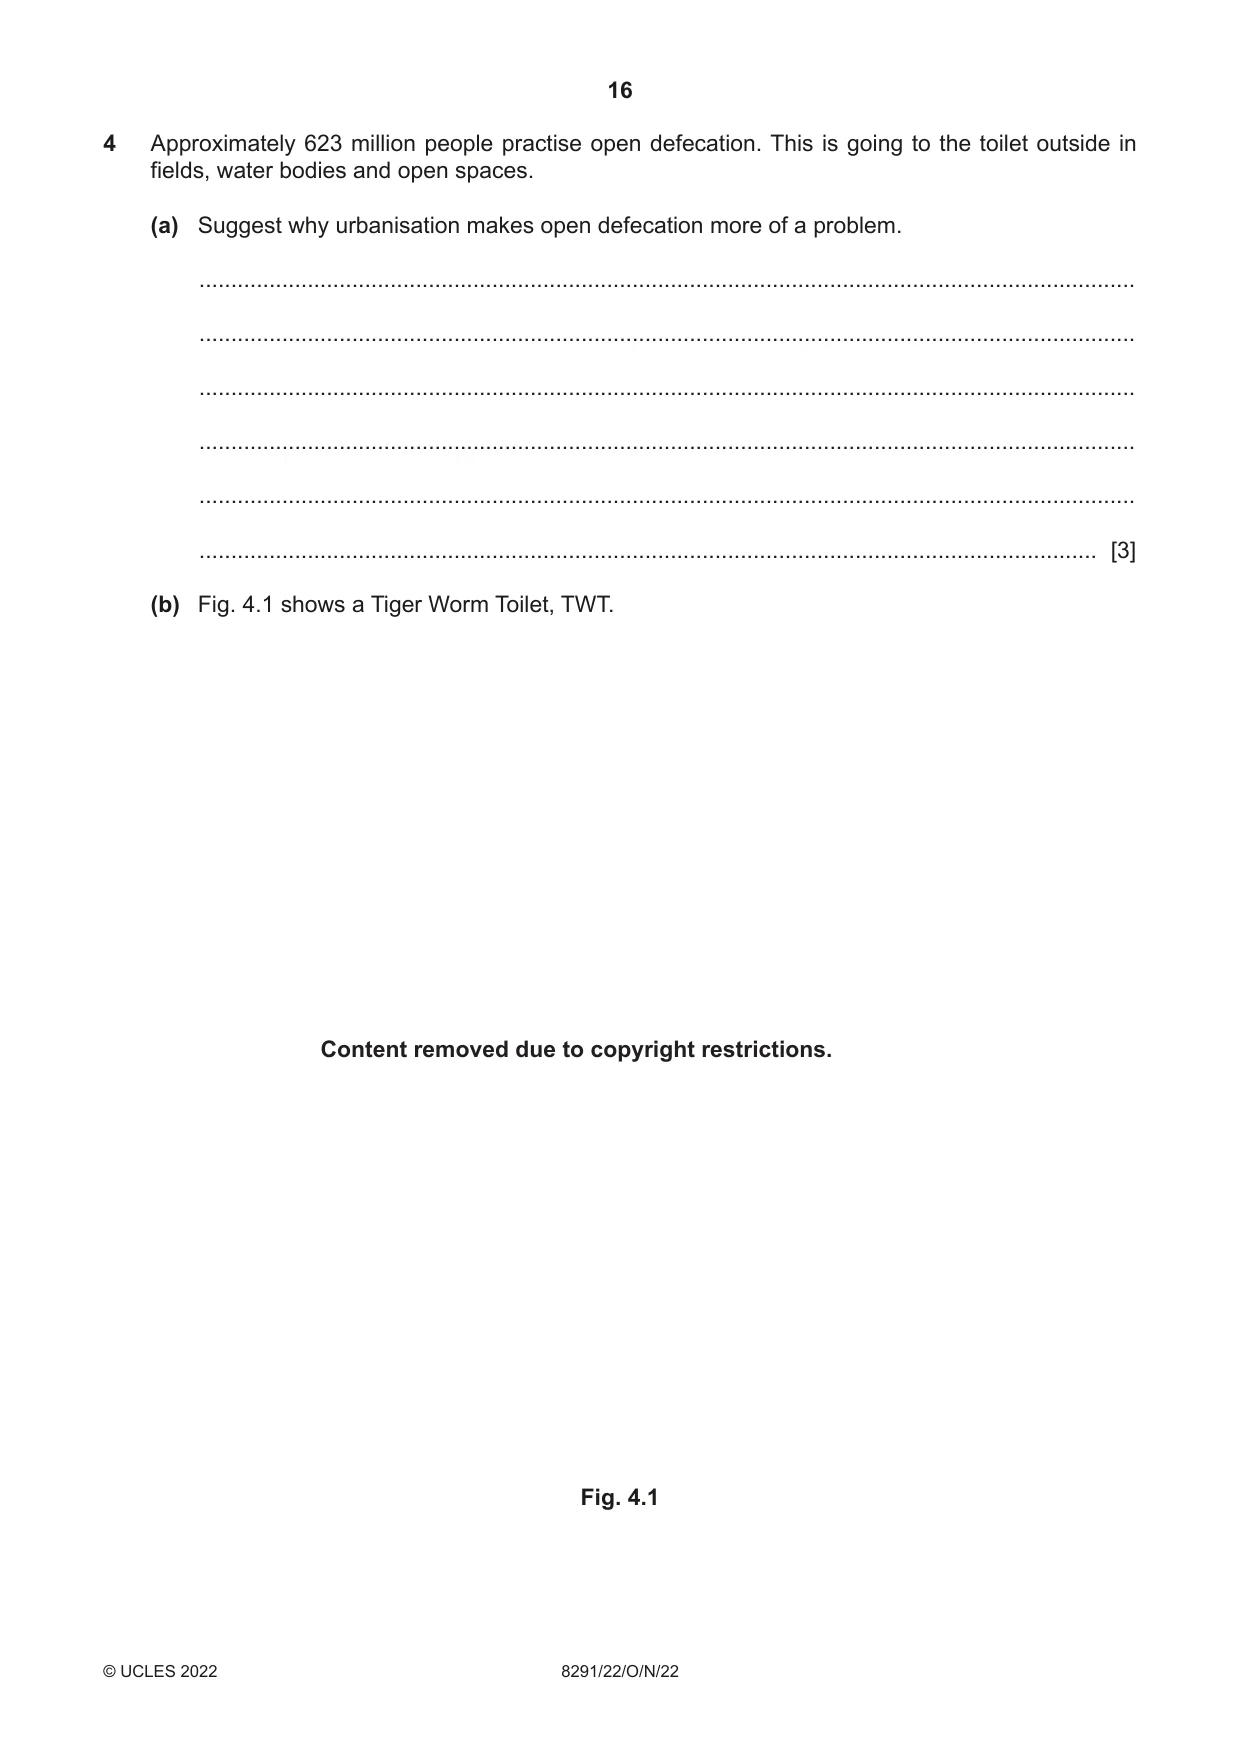
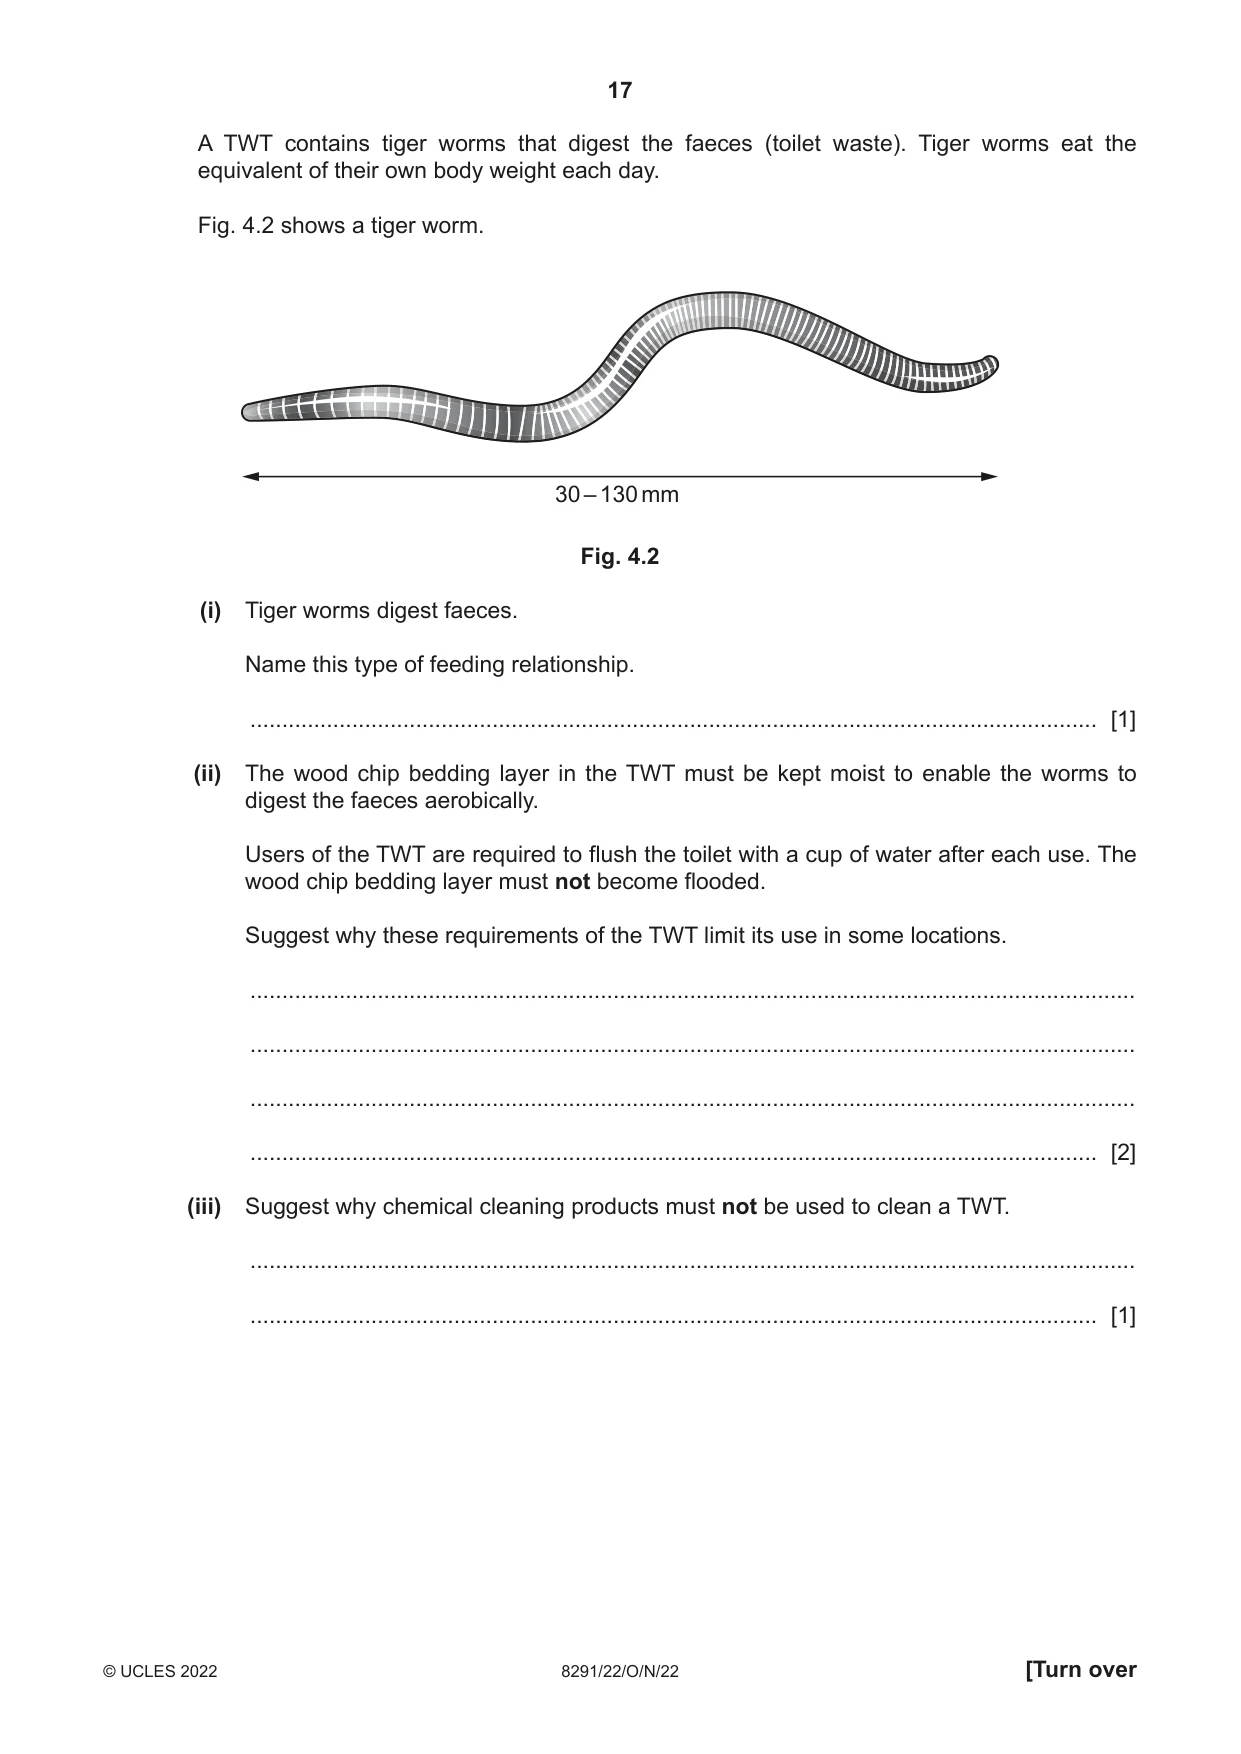
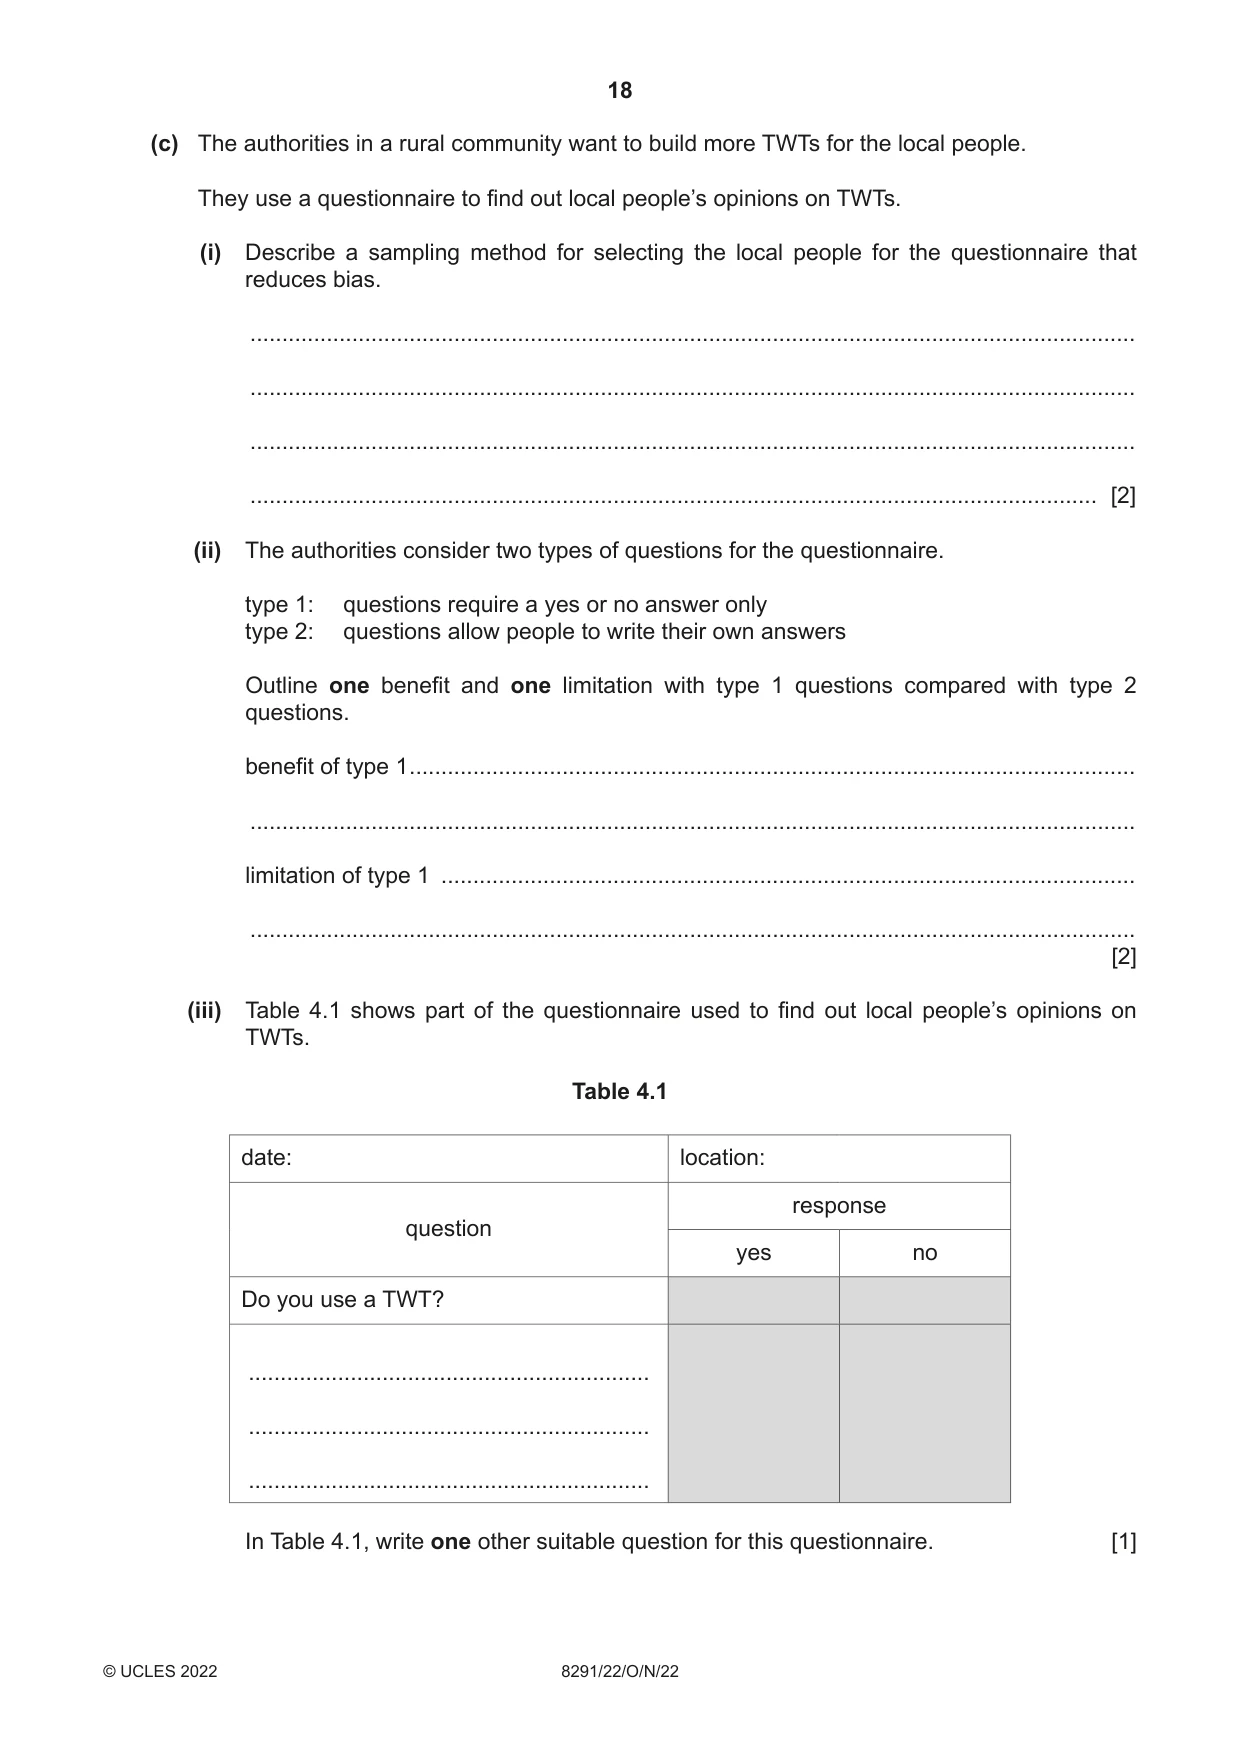
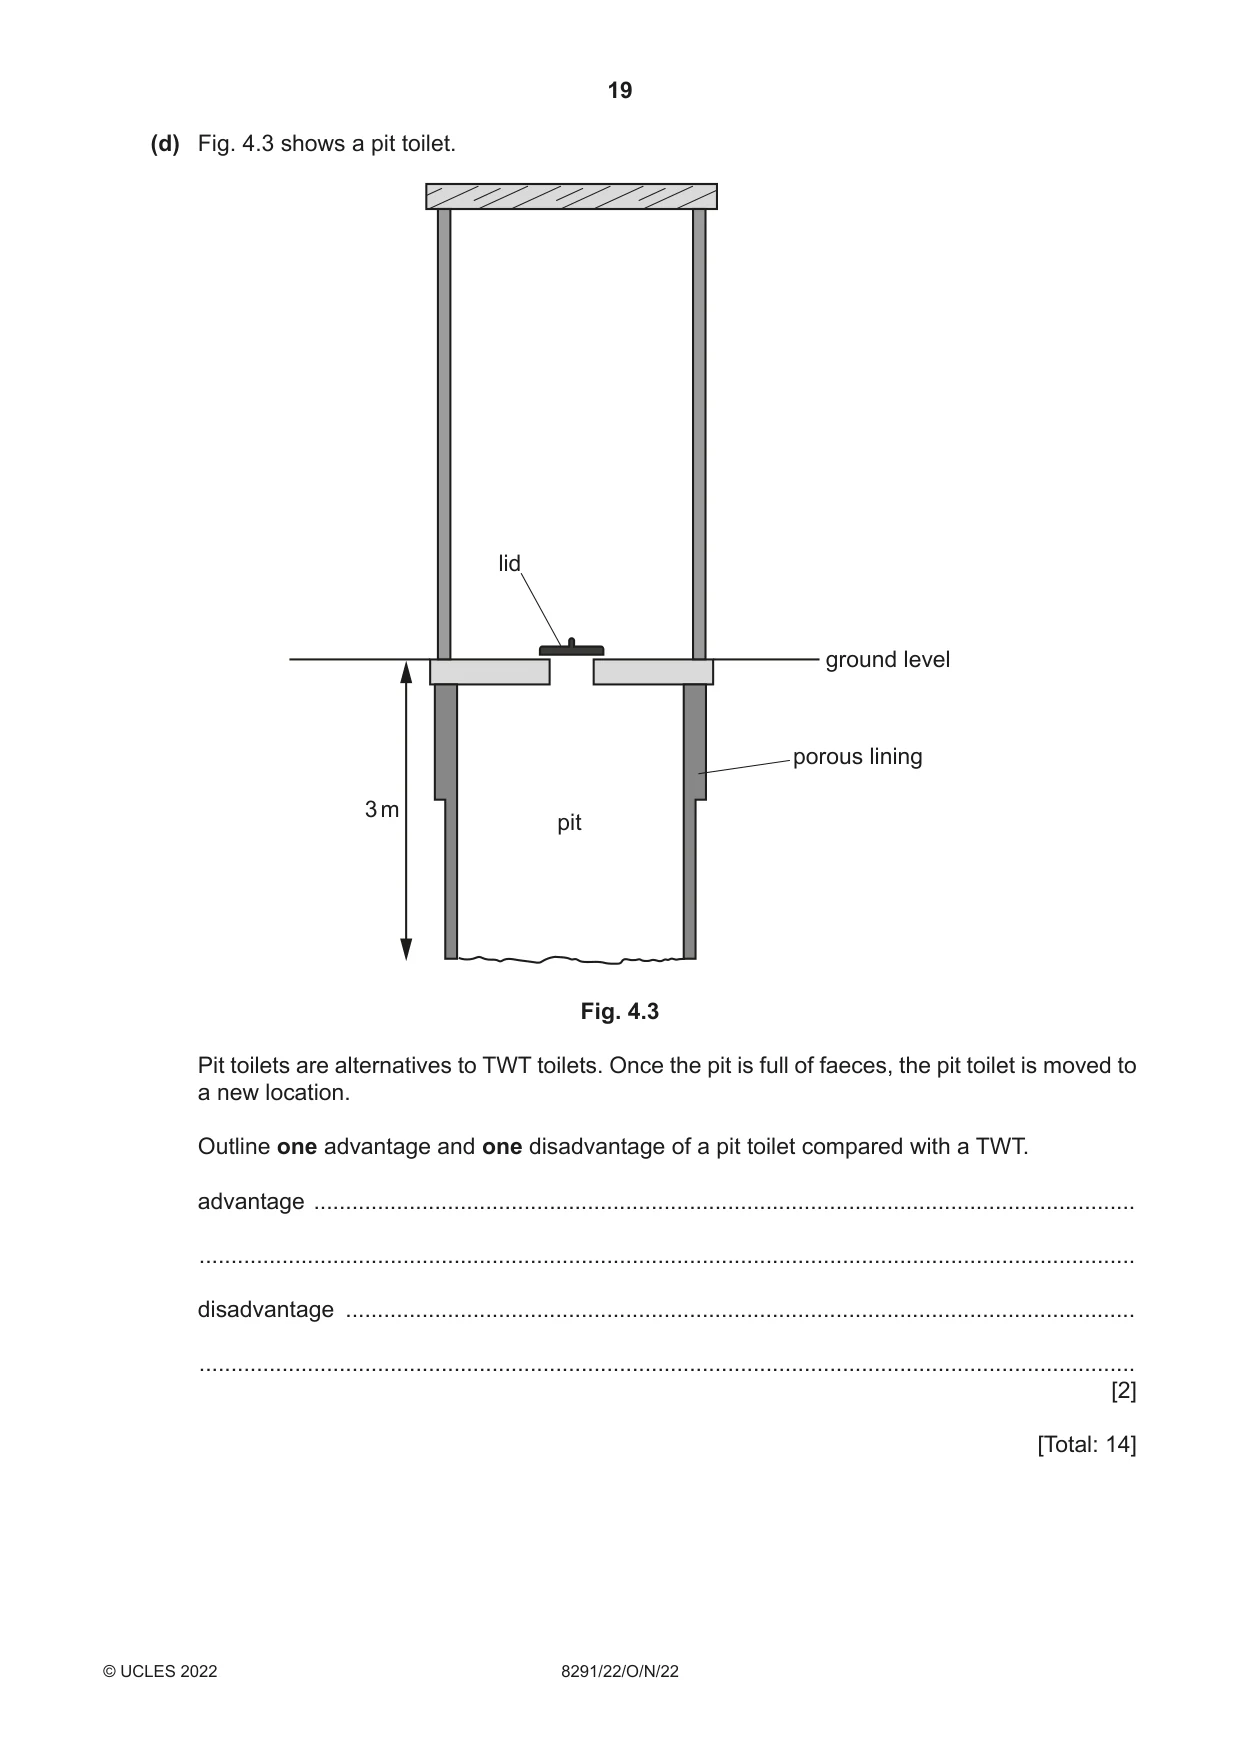
4 Approximately 623 million people practise open defecation. This is going to the toilet outside in fields, water bodies and open spaces. (a) Suggest why urbanisation makes open defecation more of a problem. ................................................................................................................................................... ................................................................................................................................................... ................................................................................................................................................... ................................................................................................................................................... ................................................................................................................................................... ............................................................................................................................................. [3] (b) Fig. 4.1 shows a Tiger Worm Toilet, TWT. Content removed due to copyright restrictions. Fig. 4.1 A TWT contains tiger worms that digest the faeces (toilet waste). Tiger worms eat the equivalent of their own body weight each day. Fig. 4.2 shows a tiger worm. 30 – 130 mm Fig. 4.2 (i) Tiger worms digest faeces. Name this type of feeding relationship. ..................................................................................................................................... [1] (ii) The wood chip bedding layer in the TWT must be kept moist to enable the worms to digest the faeces aerobically. Users of the TWT are required to flush the toilet with a cup of water after each use. The wood chip bedding layer must not become flooded. Suggest why these requirements of the TWT limit its use in some locations. ........................................................................................................................................... ........................................................................................................................................... ........................................................................................................................................... ..................................................................................................................................... [2] (iii) Suggest why chemical cleaning products must not be used to clean a TWT. ........................................................................................................................................... ..................................................................................................................................... [1] (c) The authorities in a rural community want to build more TWTs for the local people. They use a questionnaire to find out local people’s opinions on TWTs. (i) Describe a sampling method for selecting the local people for the questionnaire that reduces bias. ........................................................................................................................................... ........................................................................................................................................... ........................................................................................................................................... ..................................................................................................................................... [2] (ii) The authorities consider two types of questions for the questionnaire. type 1: questions require a yes or no answer only type 2: questions allow people to write their own answers Outline one benefit and one limitation with type 1 questions compared with type 2 questions. benefit of type 1 .................................................................................................................. ........................................................................................................................................... limitation of type 1 ............................................................................................................. ........................................................................................................................................... [2] (iii) Table 4.1 shows part of the questionnaire used to find out local people’s opinions on TWTs. Table 4.1 date: location: response question yes no Do you use a TWT? ............................................................... ............................................................... ............................................................... In Table 4.1, write one other suitable question for this questionnaire. [1]
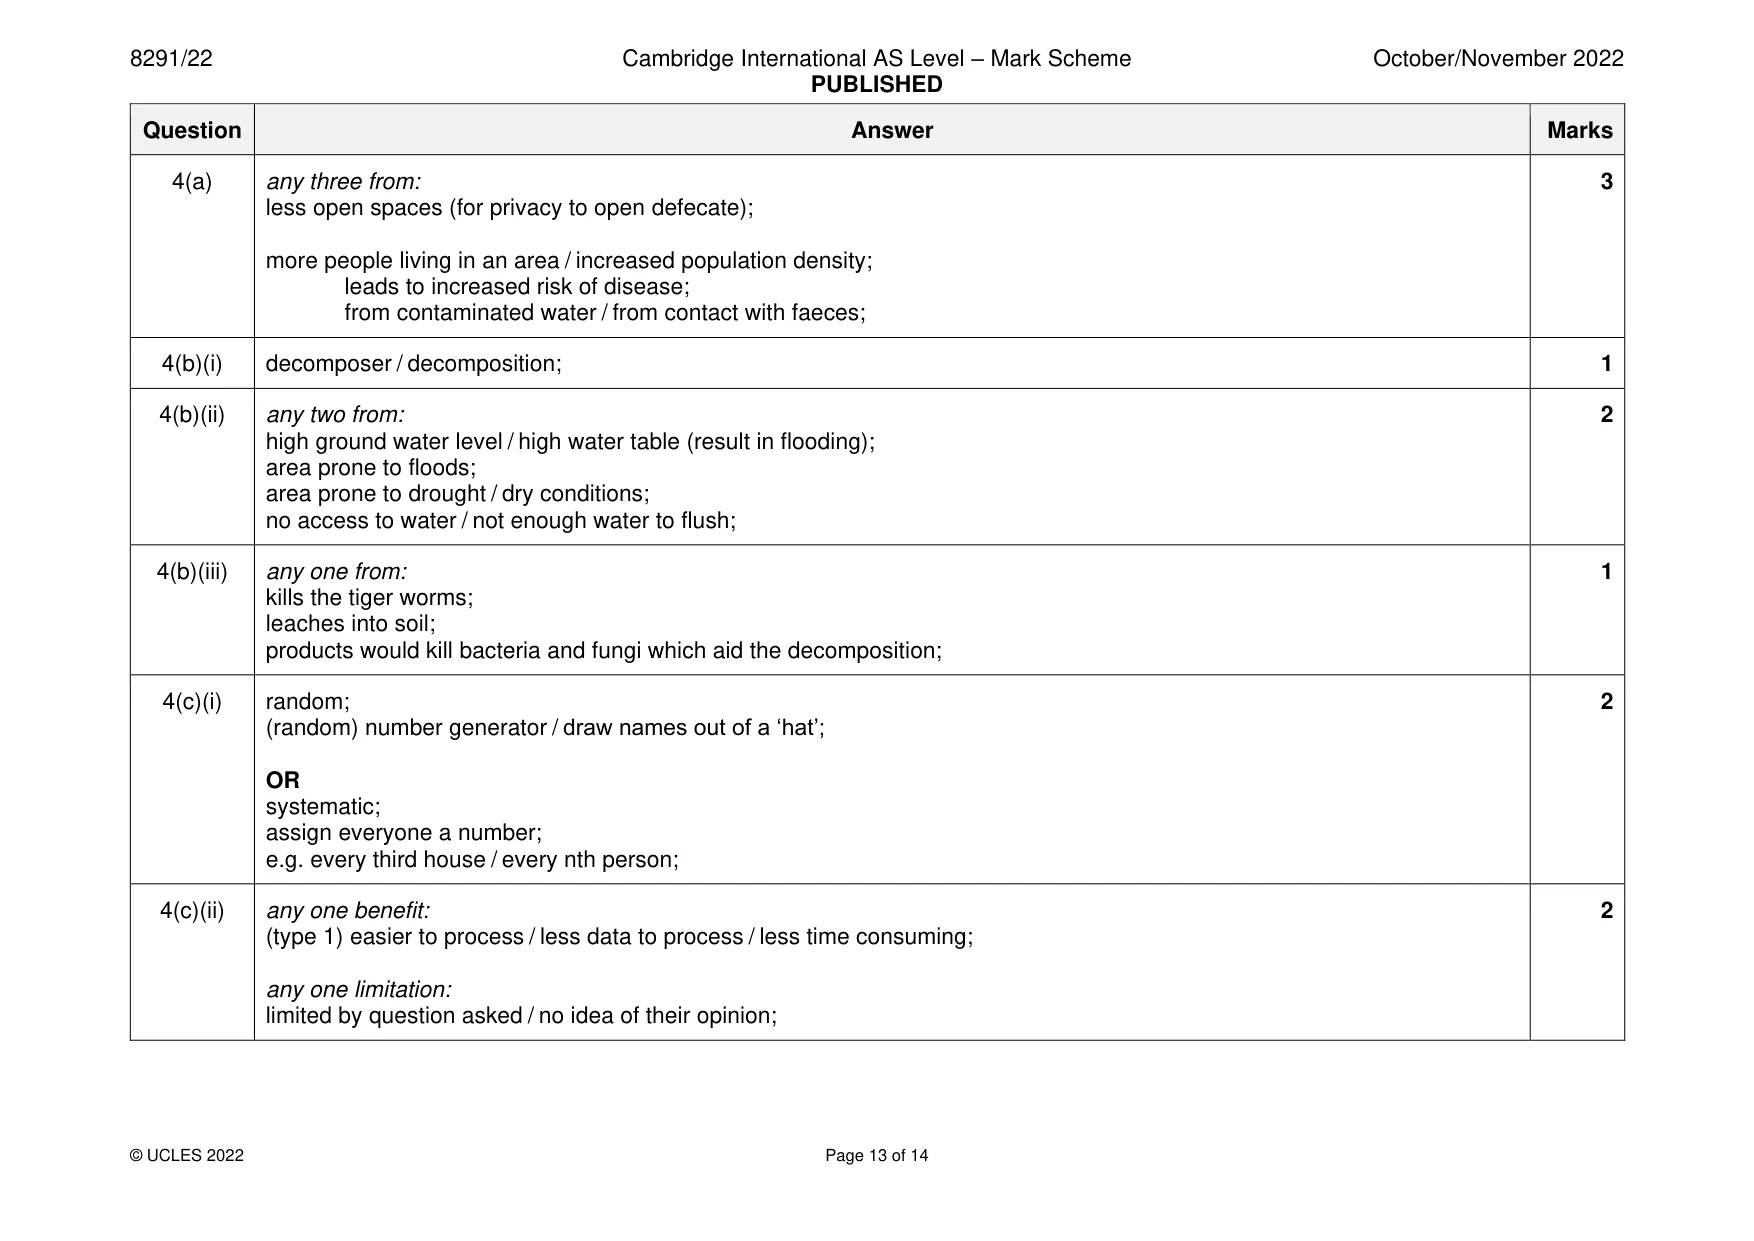
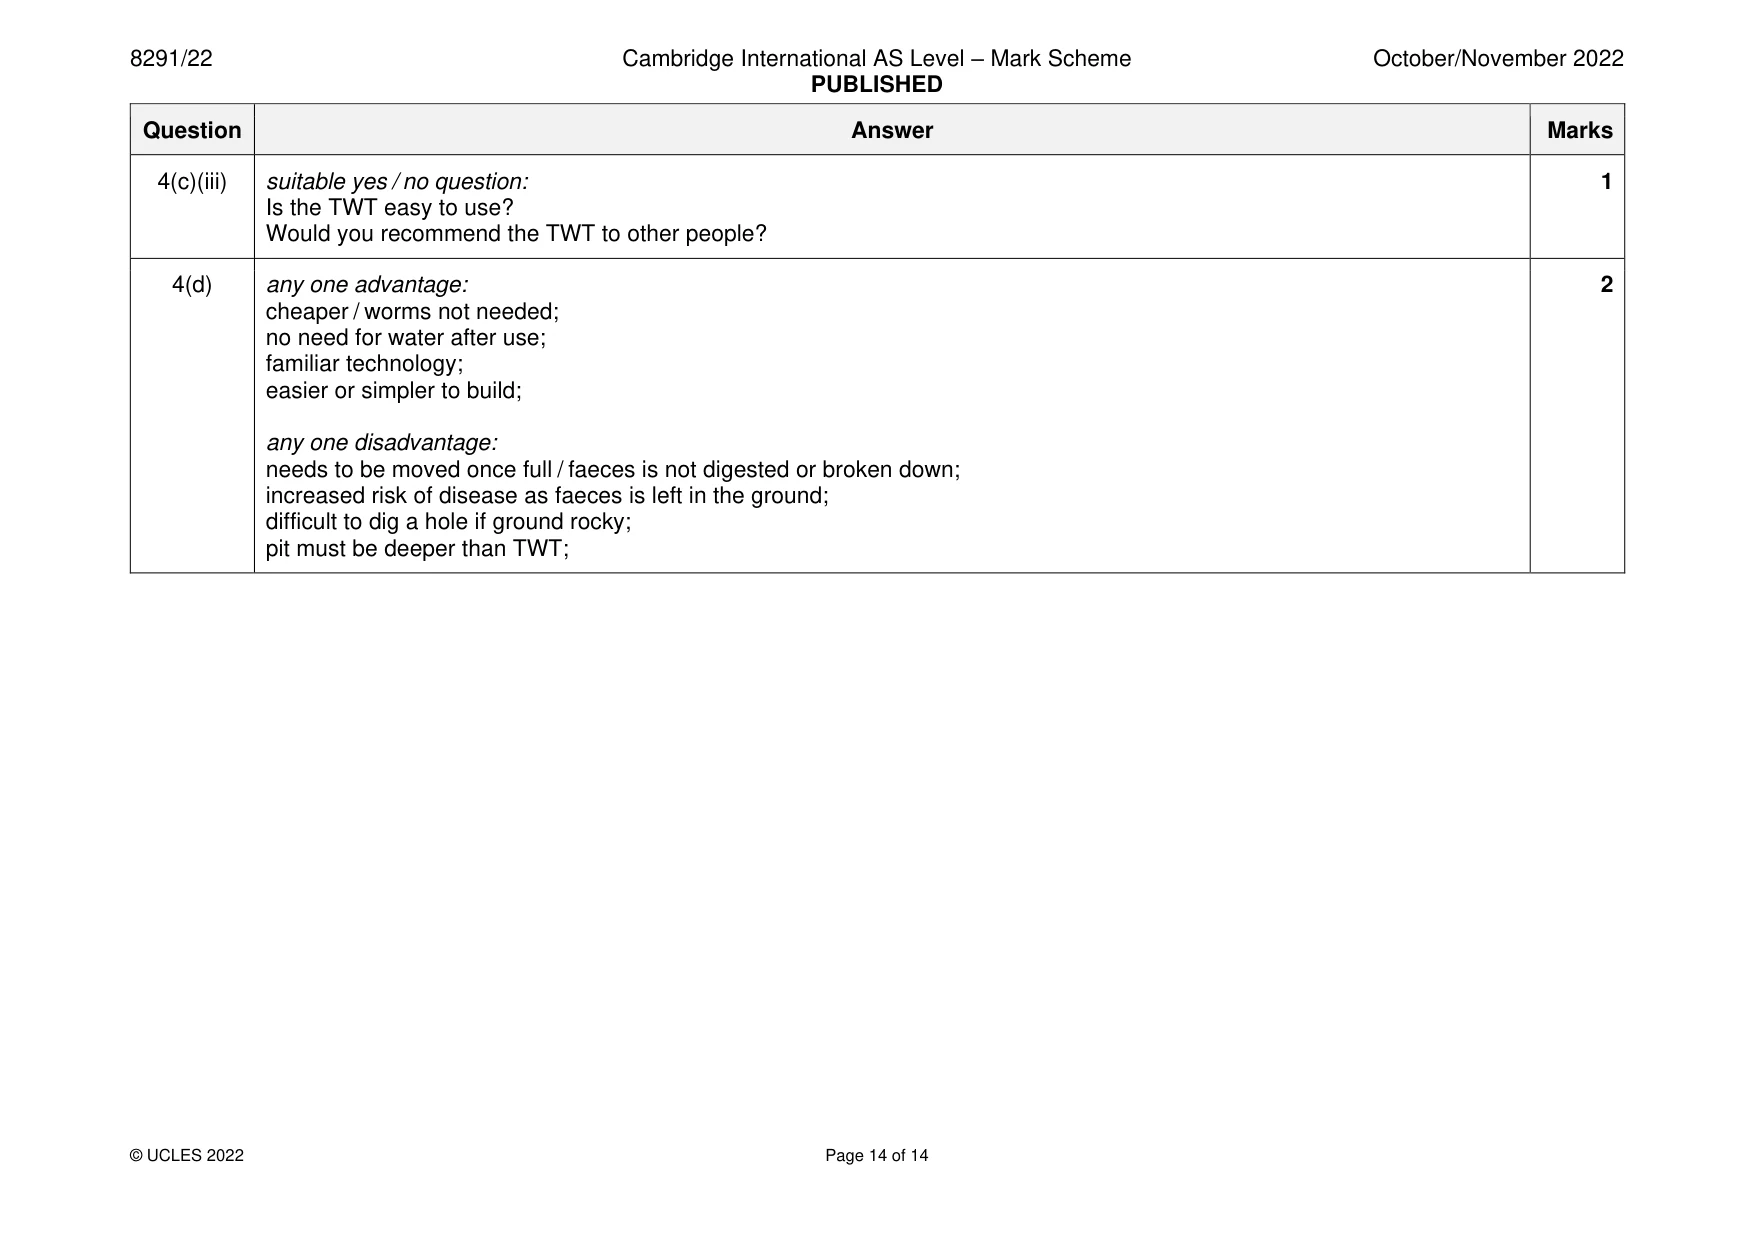
Mark scheme: 4(a) any three from: 3 less open spaces (for privacy to open defecate); more people living in an area / increased population density; leads to increased risk of disease; from contaminated water / from contact with faeces; 4(b)(i) decomposer / decomposition; 1 4(b)(ii) any two from: 2 high ground water level / high water table (result in flooding); area prone to floods; area prone to drought / dry conditions; no access to water / not enough water to flush; 4(b)(iii) any one from: 1 kills the tiger worms; leaches into soil; products would kill bacteria and fungi which aid the decomposition; 4(c)(i) random; 2 (random) number generator / draw names out of a ‘hat’; OR systematic; assign everyone a number; e.g. every third house / every nth person; 4(c)(ii) any one benefit: 2 (type 1) easier to process / less data to process / less time consuming; any one limitation: limited by question asked / no idea of their opinion; 4(c)(iii) suitable yes / no question: 1 Is the TWT easy to use? Would you recommend the TWT to other people? 4(d) any one advantage: 2 cheaper / worms not needed; no need for water after use; familiar technology; easier or simpler to build; any one disadvantage: needs to be moved once full / faeces is not digested or broken down; increased risk of disease as faeces is left in the ground; difficult to dig a hole if ground rocky; pit must be deeper than TWT;
More questions on Data collection techniques and data analysis
What was in this paper
The subtopics covered by these 4 questions, and how many questions each got. Open one in a new tab to see every Cambridge question on it.
What you needed in this session
Cambridge’s own grade thresholds for 2022 Oct/Nov, Paper 2 · Variant 2. A higher threshold means an easier paper — the bar moves with how the cohort did.