Cambridge A Level Environmental Management (AS only) 8291 — 2017 May/June Paper 2 · Variant 3
8291/23/M/J/17 · 5 questions · 80 marks · ≈90 min
The question paper and its mark scheme, free to read here and free to download. This is Cambridge’s own paper, exactly as it was sat.
Question paper12 pages
Mark scheme16 pages
Answers below. Sit the paper first if you are practising.
Questions as text
Q1 · A pyramid of biomass with three trophic levels
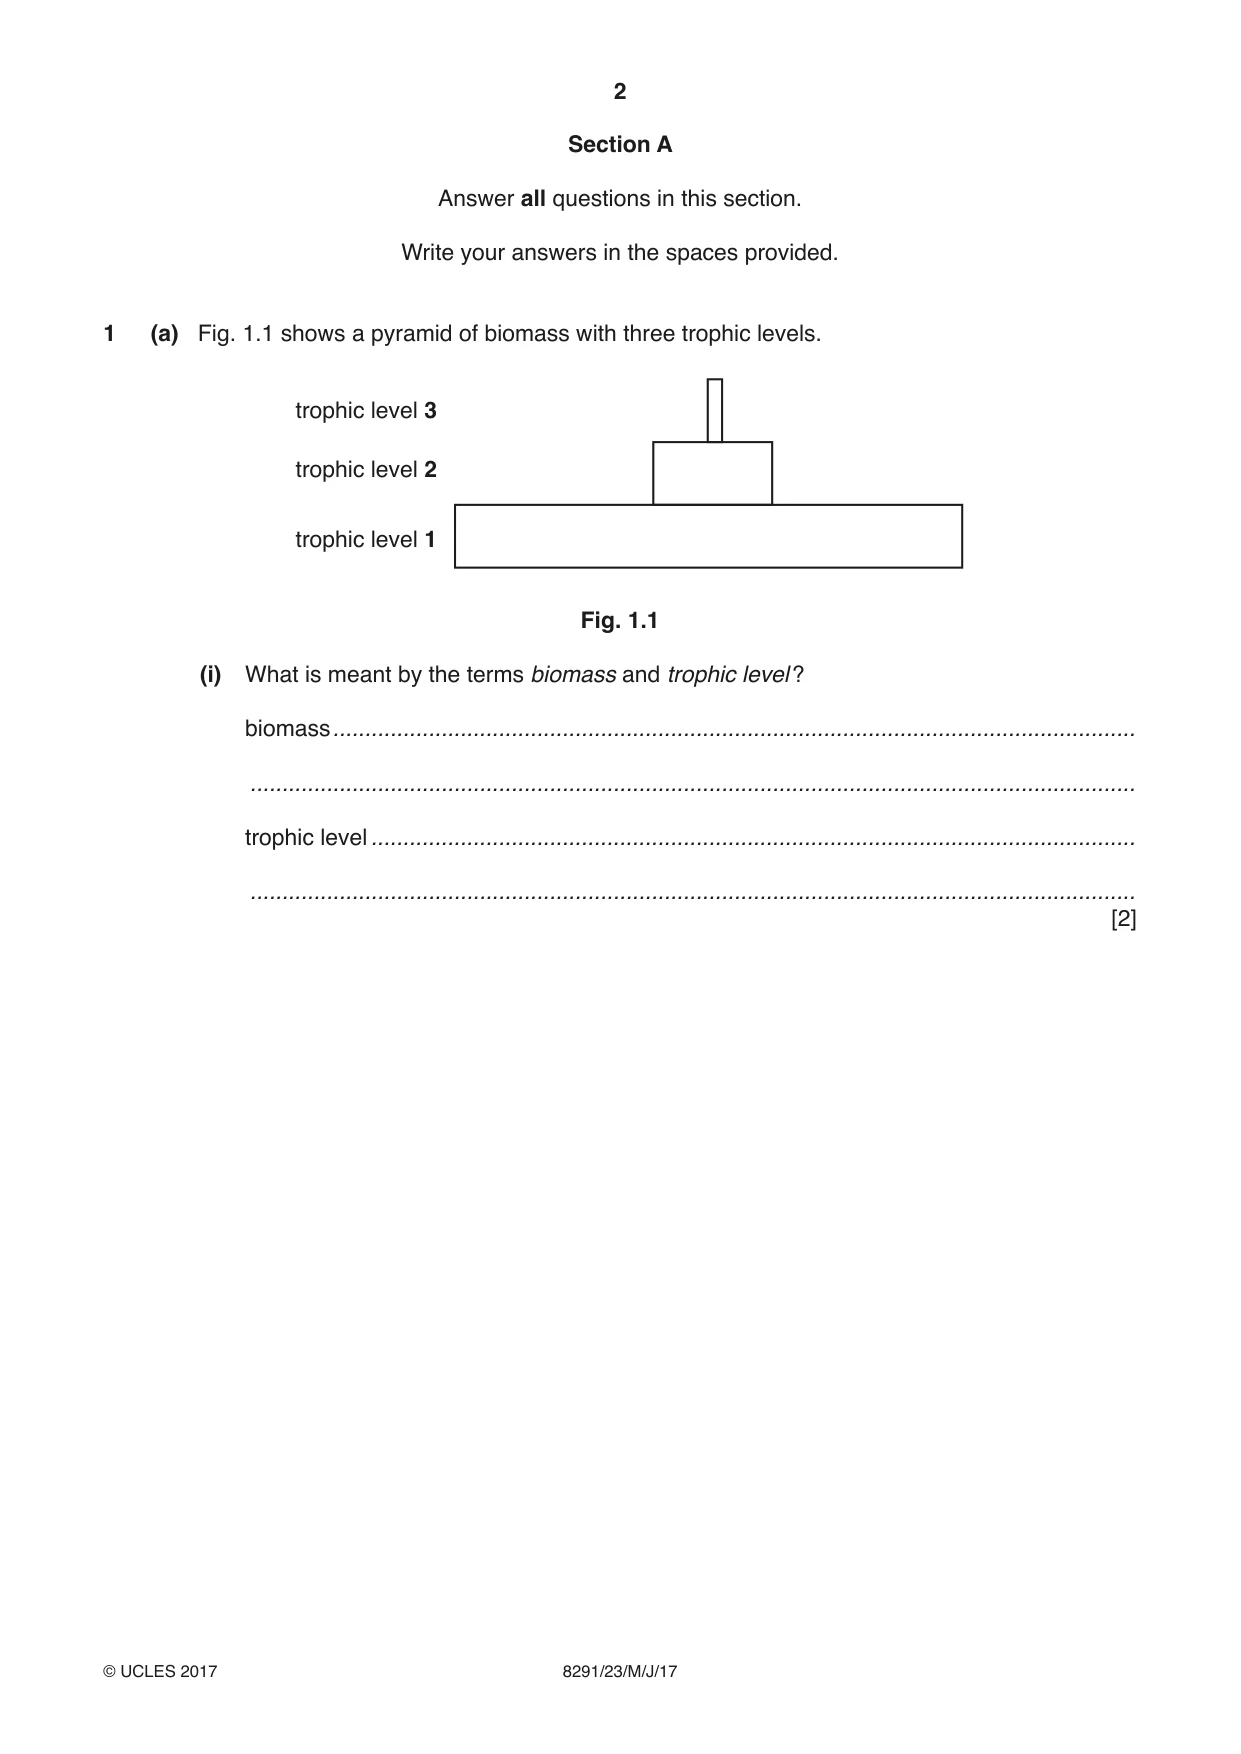
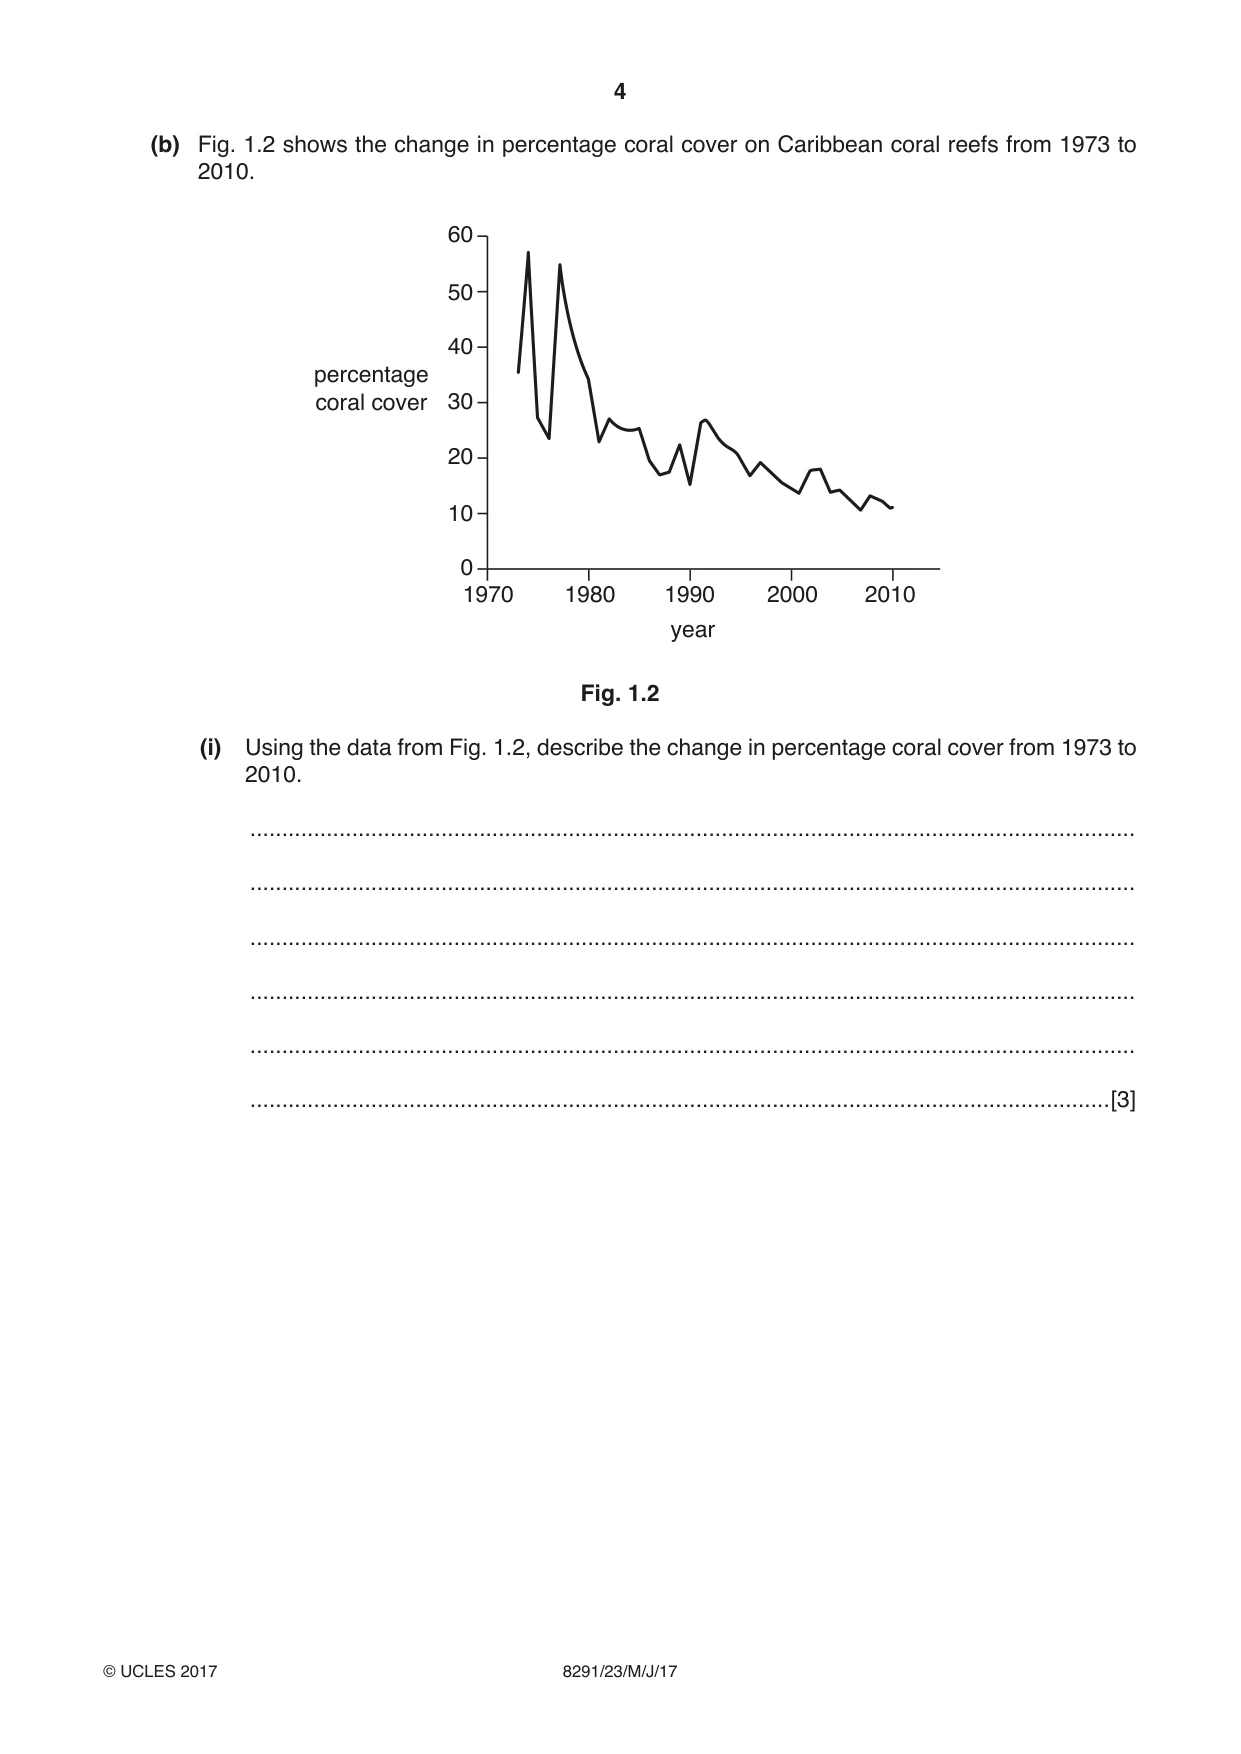
1 (a) Fig. 1.1 shows a pyramid of biomass with three trophic levels. trophic level 3 trophic level 2 trophic level 1 Fig. 1.1 (i) What is meant by the terms biomass and trophic level ? biomass .............................................................................................................................. ........................................................................................................................................... trophic level ........................................................................................................................ ........................................................................................................................................... [2] (ii) State the names of the trophic levels shown in Fig. 1.1. trophic level 3 .................................................................................................................... trophic level 2 .................................................................................................................... trophic level 1 .................................................................................................................... [3] (iii) Describe the relationship between the trophic levels shown in the pyramid in Fig. 1.1 and explain its shape. ........................................................................................................................................... ........................................................................................................................................... ........................................................................................................................................... ........................................................................................................................................... ........................................................................................................................................... ........................................................................................................................................... ........................................................................................................................................... .......................................................................................................................................[4] (b) Fig. 1.2 shows the change in percentage coral cover on Caribbean coral reefs from 1973 to 2010. 60 50 40 percentage coral cover 30 20 10 0 1970 1980 1990 2000 2010 year Fig. 1.2 (i) Using the data from Fig. 1.2, describe the change in percentage coral cover from 1973 to 2010. ........................................................................................................................................... ........................................................................................................................................... ........................................................................................................................................... ........................................................................................................................................... ........................................................................................................................................... .......................................................................................................................................[3] (ii) Suggest how human activities can contribute to the loss of coral cover. ........................................................................................................................................... ........................................................................................................................................... ........................................................................................................................................... ........................................................................................................................................... ........................................................................................................................................... ........................................................................................................................................... ........................................................................................................................................... ........................................................................................................................................... ........................................................................................................................................... ........................................................................................................................................... ........................................................................................................................................... ........................................................................................................................................... ........................................................................................................................................... ........................................................................................................................................... ........................................................................................................................................... .......................................................................................................................................[8] [Total: 20]
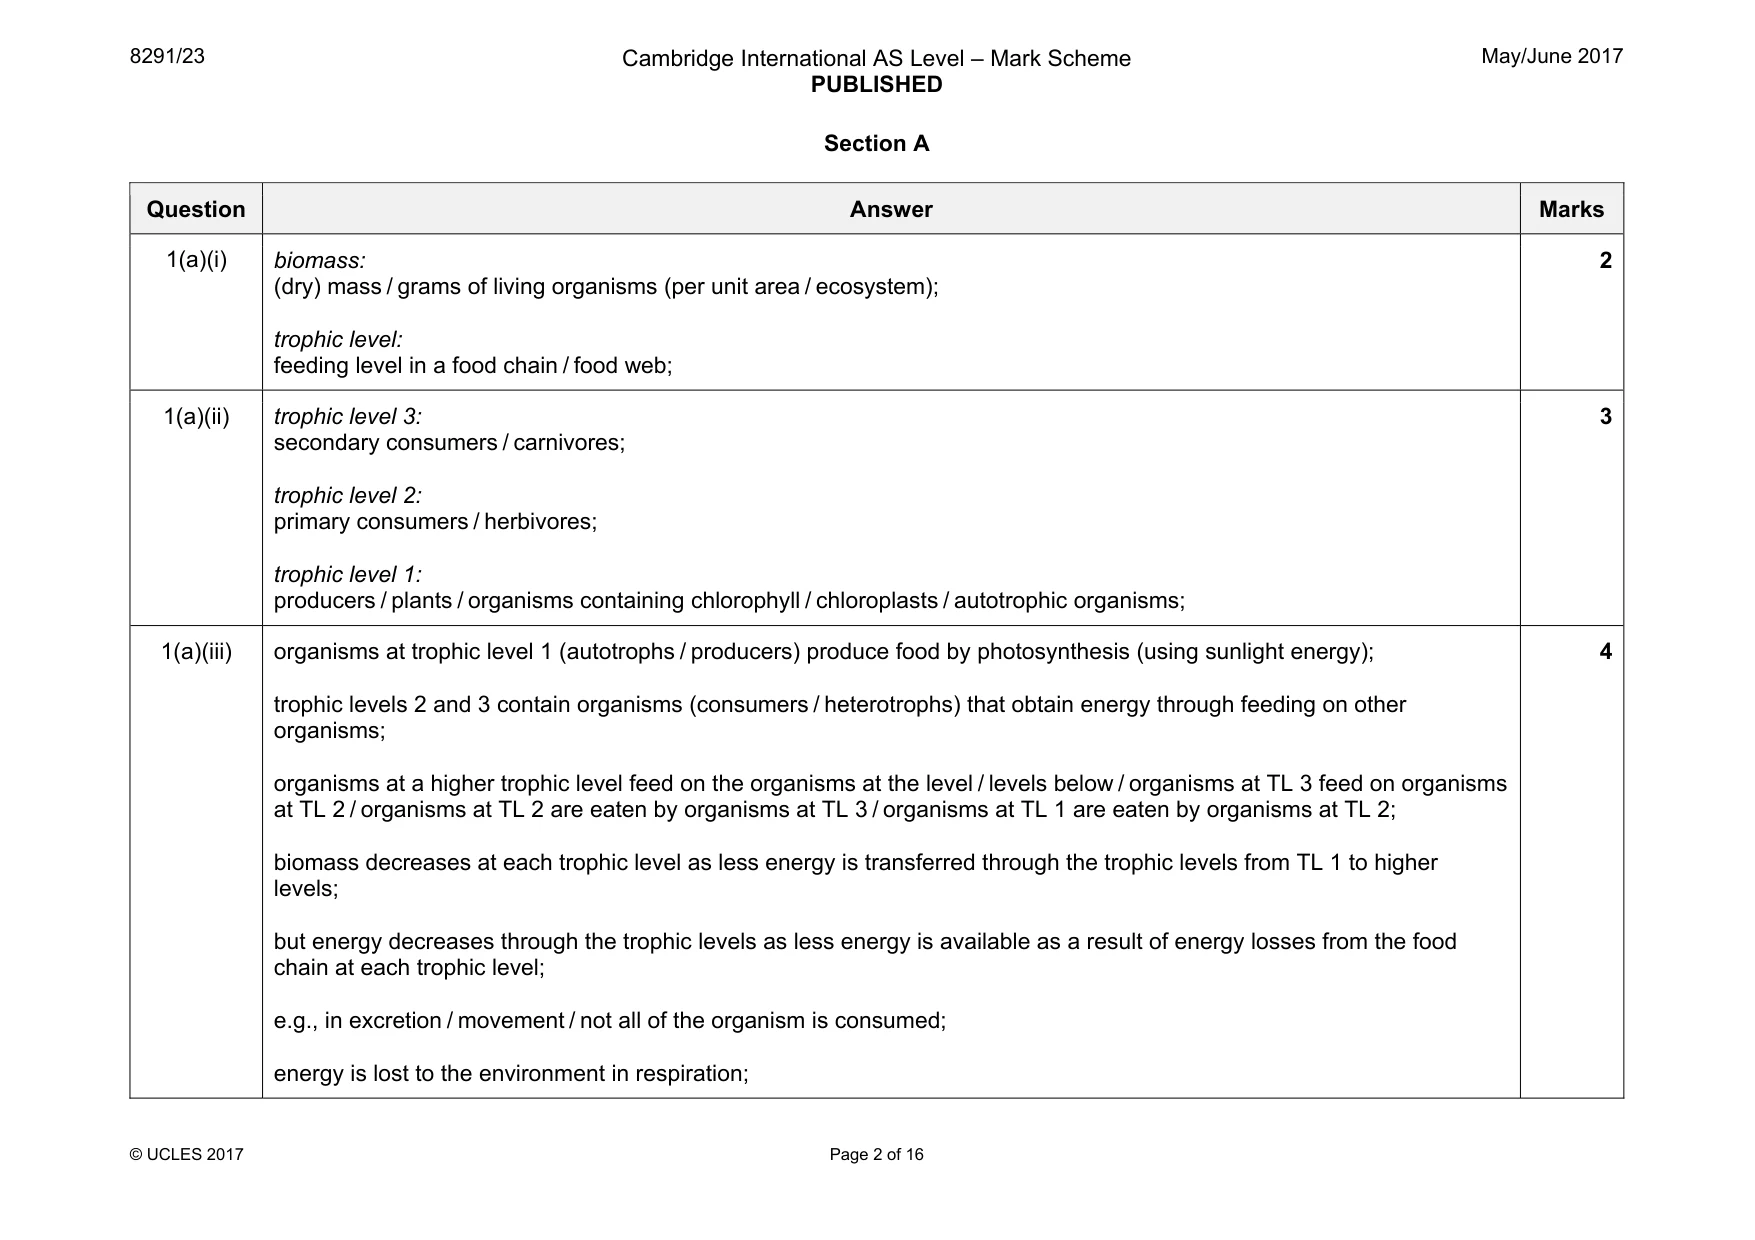
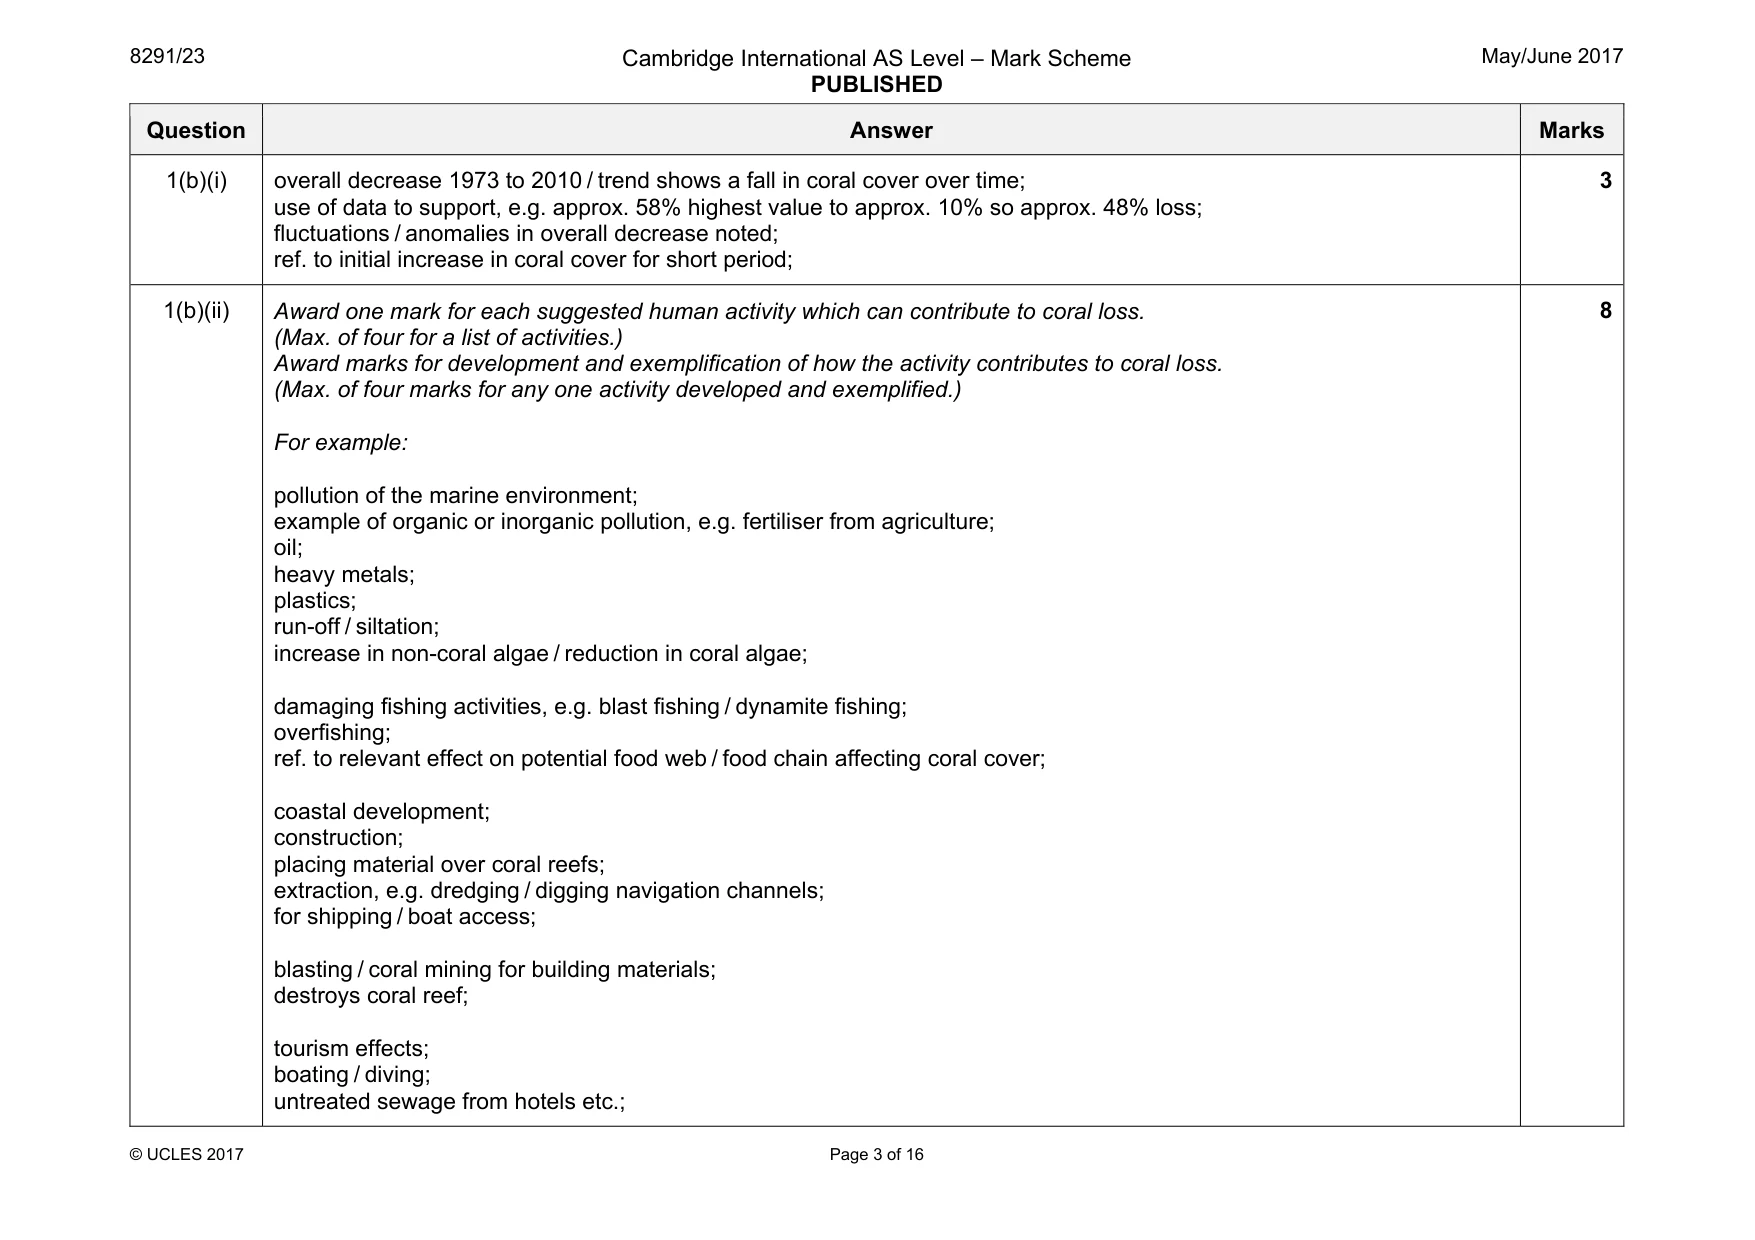
Mark scheme: 1(a)(i) biomass: (dry) mass / grams of living organisms (per unit area / ecosystem); trophic level: feeding level in a food chain / food web; 2 1(a)(ii) trophic level 3: secondary consumers / carnivores; trophic level 2: primary consumers / herbivores; trophic level 1: producers / plants / organisms containing chlorophyll / chloroplasts / autotrophic organisms; 3 1(a)(iii) organisms at trophic level 1 (autotrophs / producers) produce food by photosynthesis (using sunlight energy); trophic levels 2 and 3 contain organisms (consumers / heterotrophs) that obtain energy through feeding on other organisms; organisms at a higher trophic level feed on the organisms at the level / levels below / organisms at TL 3 feed on organisms at TL 2 / organisms at TL 2 are eaten by organisms at TL 3 / organisms at TL 1 are eaten by organisms at TL 2; biomass decreases at each trophic level as less energy is transferred through the trophic levels from TL 1 to higher levels; but energy decreases through the trophic levels as less energy is available as a result of energy losses from the food chain at each trophic level; e.g., in excretion / movement / not all of the organism is consumed; energy is lost to the environment in respiration; 4 Question Answer Marks 1(b)(i) overall decrease 1973 to 2010 / trend shows a fall in coral cover over time; use of data to support, e.g. approx. 58% highest value to approx. 10% so approx. 48% loss; fluctuations / anomalies in overall decrease noted; ref. to initial increase in coral cover for short period; 3 1(b)(ii) Award one mark for each suggested human activity which can contribute to coral loss. (Max. of four for a list of activities.) Award marks for development and exemplification of how the activity contributes to coral loss. (Max. of four marks for any one activity developed and exemplified.) For example: pollution of the marine environment; example of organic or inorganic pollution, e.g. fertiliser from agriculture; oil; heavy metals; plastics; run-off / siltation; increase in non-coral algae / reduction in coral algae; damaging fishing activities, e.g. blast fishing / dynamite fishing; overfishing; ref. to relevant effect on potential food web / food chain affecting coral cover; coastal development; construction; placing material over coral reefs; extraction, e.g. dredging / digging navigation channels; for shipping / boat access; blasting / coral mining for building materials; destroys coral reef; tourism effects; boating / diving; untreated sewage from hotels etc.; 8 Question Answer Marks 1(b)(ii) coral harvesting; e.g. use in jewellery; e.g. use in fish tanks etc.; burning of fossil fuels; increasing carbon dioxide levels / rising of sea levels / climate change; ocean warming; acidification; coral bleaching;
Q2 · Part of a water cycle in a tropical rainforest
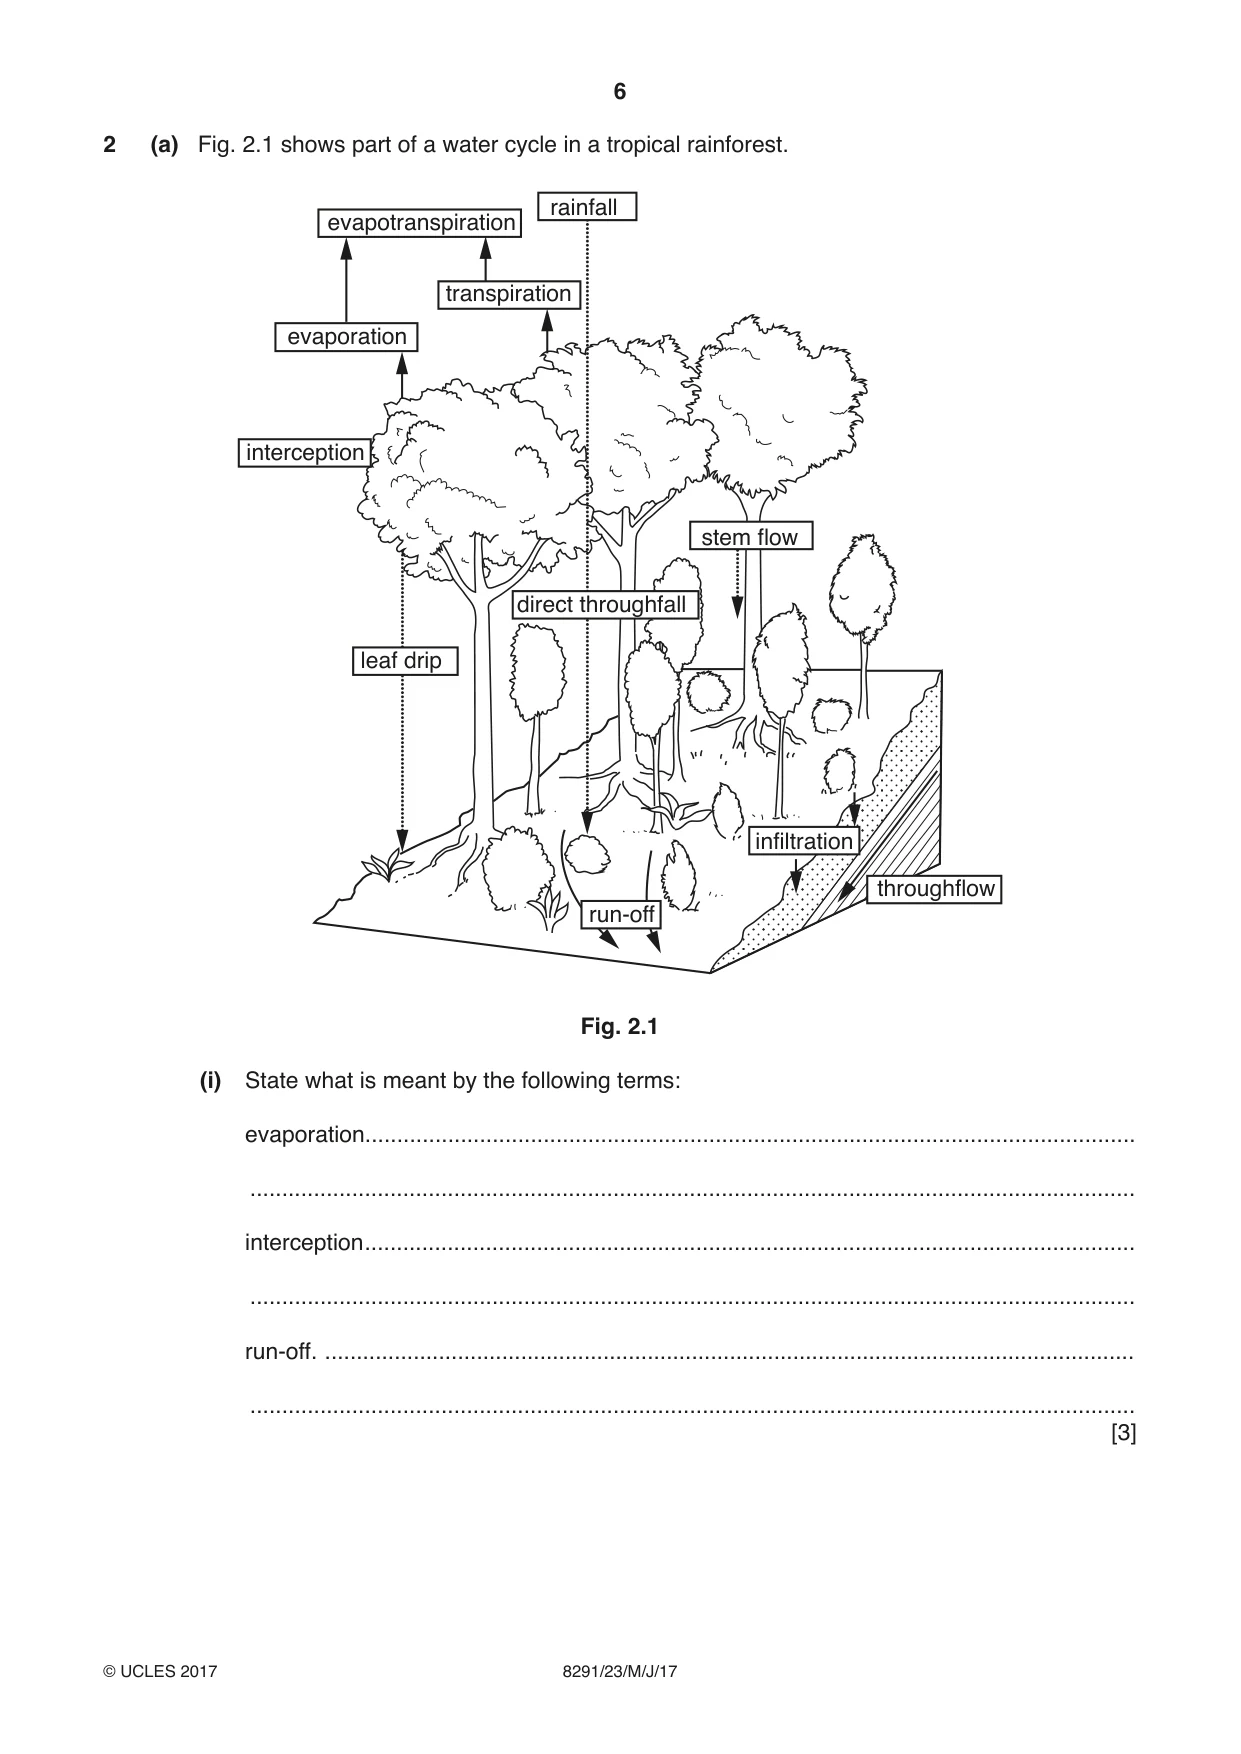
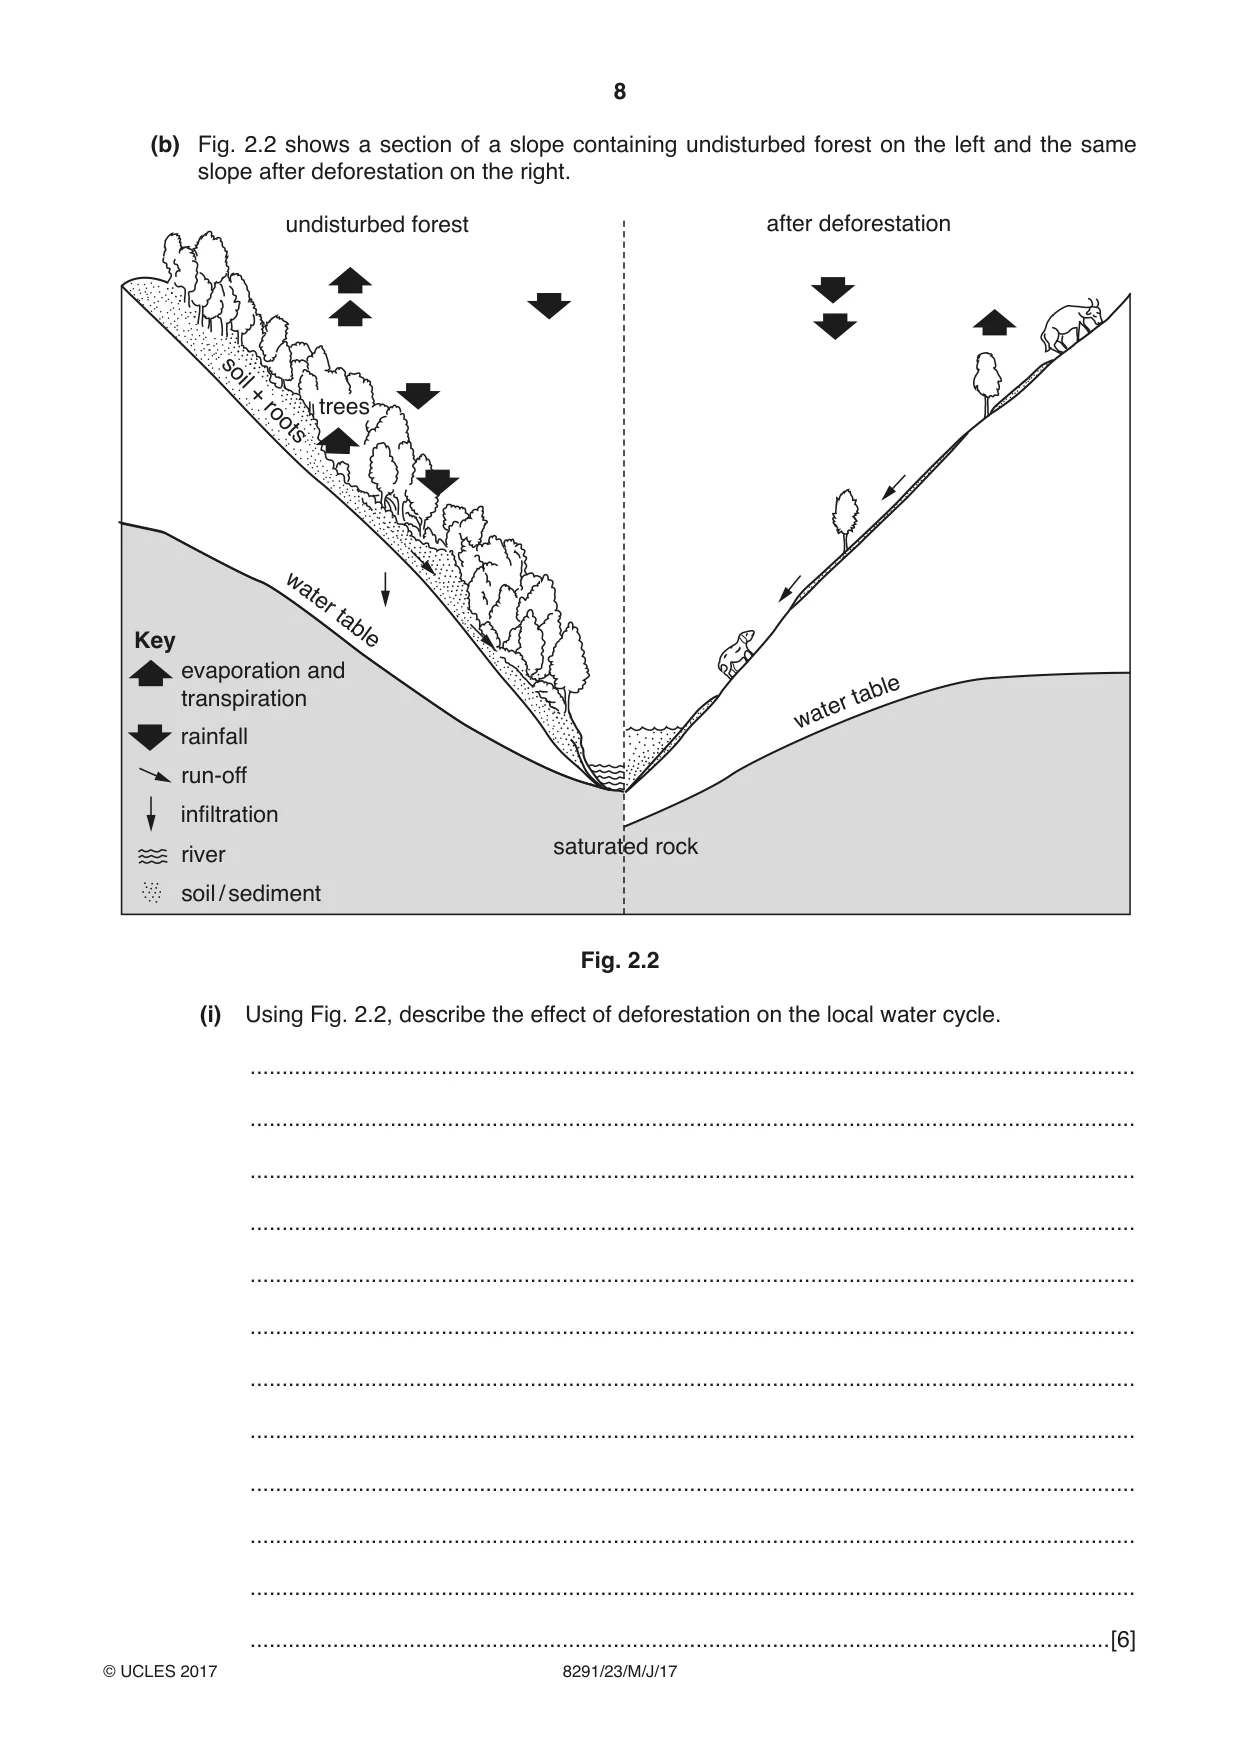
2 (a) Fig. 2.1 shows part of a water cycle in a tropical rainforest. rainfall evapotranspiration transpiration evaporation interception stem flow direct throughfall leaf drip infiltration throughflow run-off Fig. 2.1 (i) State what is meant by the following terms: evaporation......................................................................................................................... ........................................................................................................................................... interception ......................................................................................................................... ........................................................................................................................................... run-off. ................................................................................................................................ ........................................................................................................................................... [3] (ii) With reference to Fig. 2.1, describe how a balance between inputs and outputs of water can be maintained in a tropical rainforest. ........................................................................................................................................... ........................................................................................................................................... ........................................................................................................................................... ........................................................................................................................................... ........................................................................................................................................... ........................................................................................................................................... ........................................................................................................................................... ........................................................................................................................................... ........................................................................................................................................... ........................................................................................................................................... ........................................................................................................................................... .......................................................................................................................................[6] (b) Fig. 2.2 shows a section of a slope containing undisturbed forest on the left and the same slope after deforestation on the right. undisturbed forest after deforestation soil + roots trees water tableKey evaporation and transpiration table water rainfall run-off infiltration saturated rock river soil / sediment Fig. 2.2 (i) Using Fig. 2.2, describe the effect of deforestation on the local water cycle. ........................................................................................................................................... ........................................................................................................................................... ........................................................................................................................................... ........................................................................................................................................... ........................................................................................................................................... ........................................................................................................................................... ........................................................................................................................................... ........................................................................................................................................... ........................................................................................................................................... ........................................................................................................................................... ........................................................................................................................................... .......................................................................................................................................[6] (ii) Suggest methods that can be used to reduce the impact of deforestation on the local environment. ........................................................................................................................................... ........................................................................................................................................... ........................................................................................................................................... ........................................................................................................................................... ........................................................................................................................................... ........................................................................................................................................... ........................................................................................................................................... ........................................................................................................................................... ........................................................................................................................................... .......................................................................................................................................[5] [Total: 20]
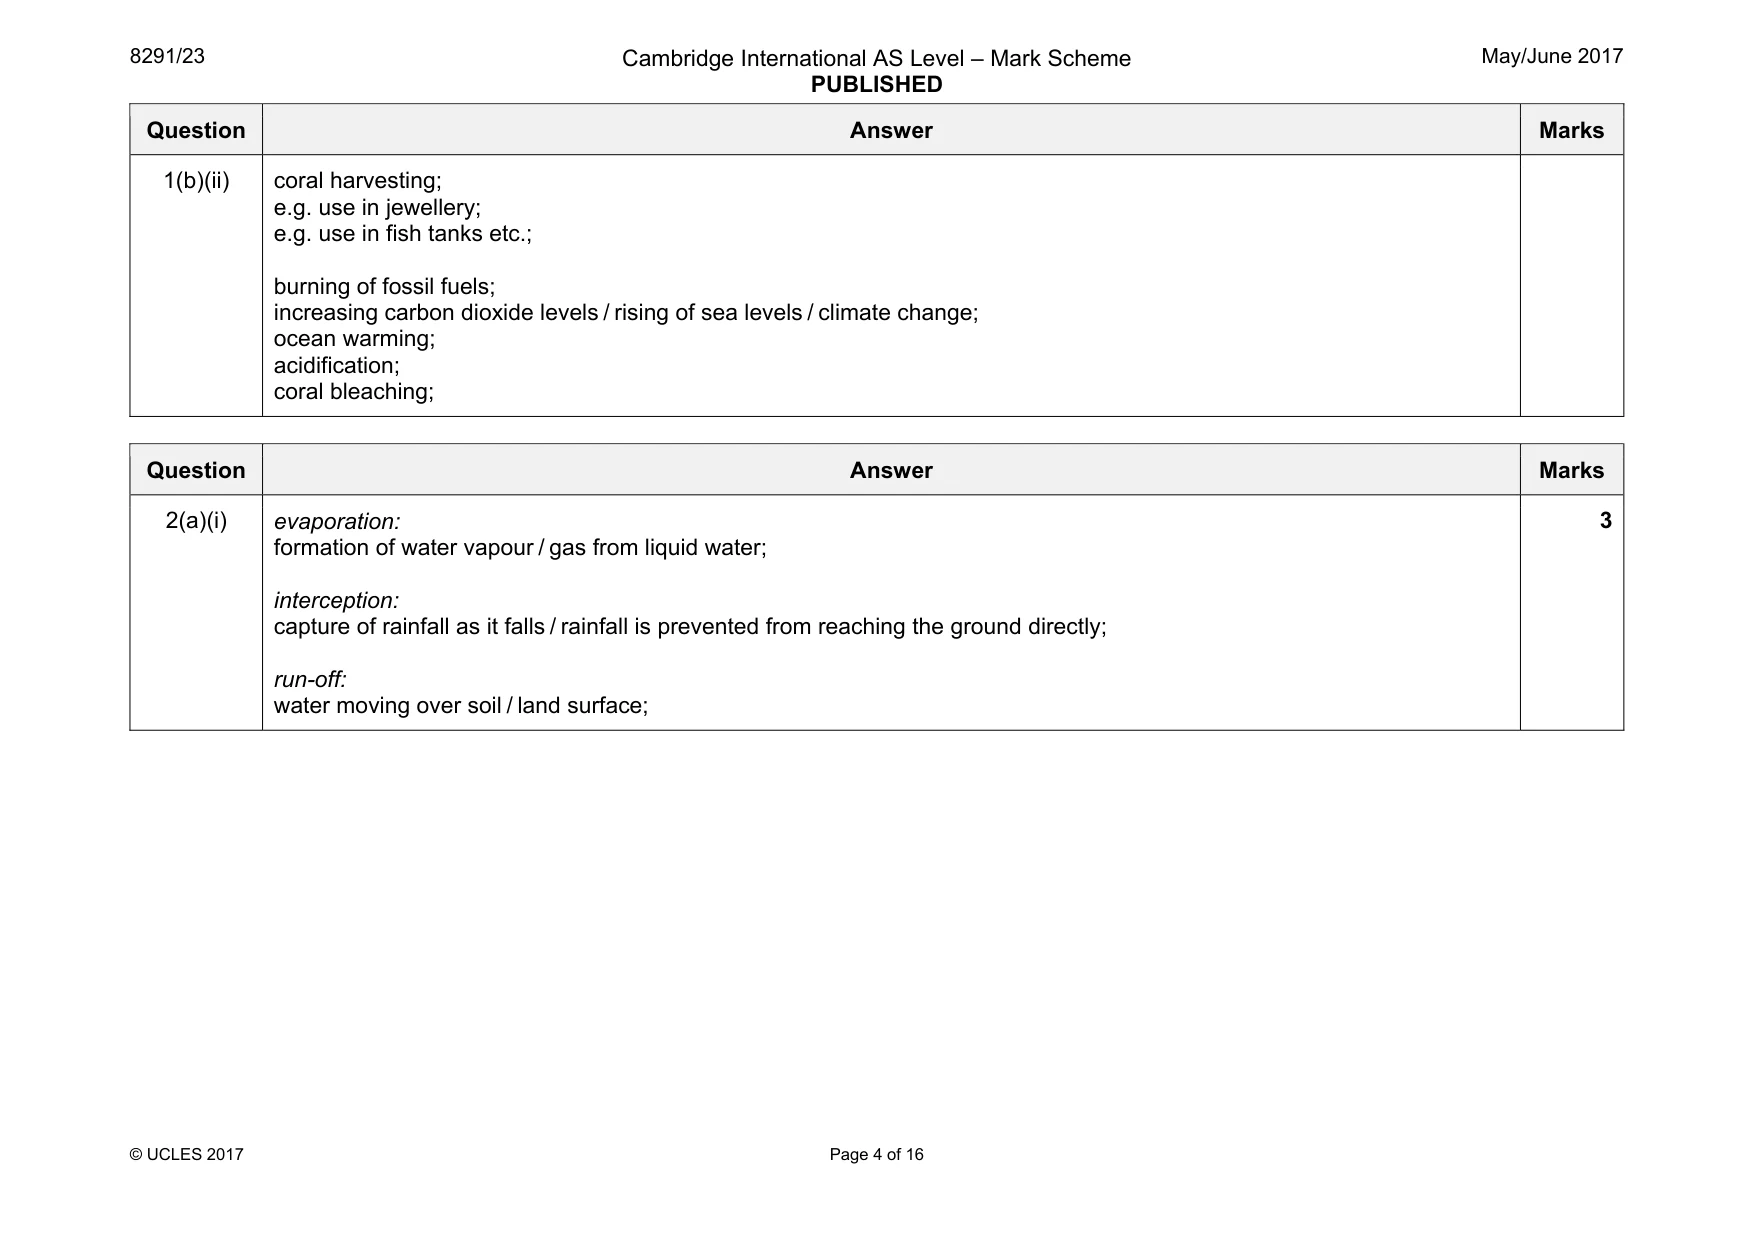
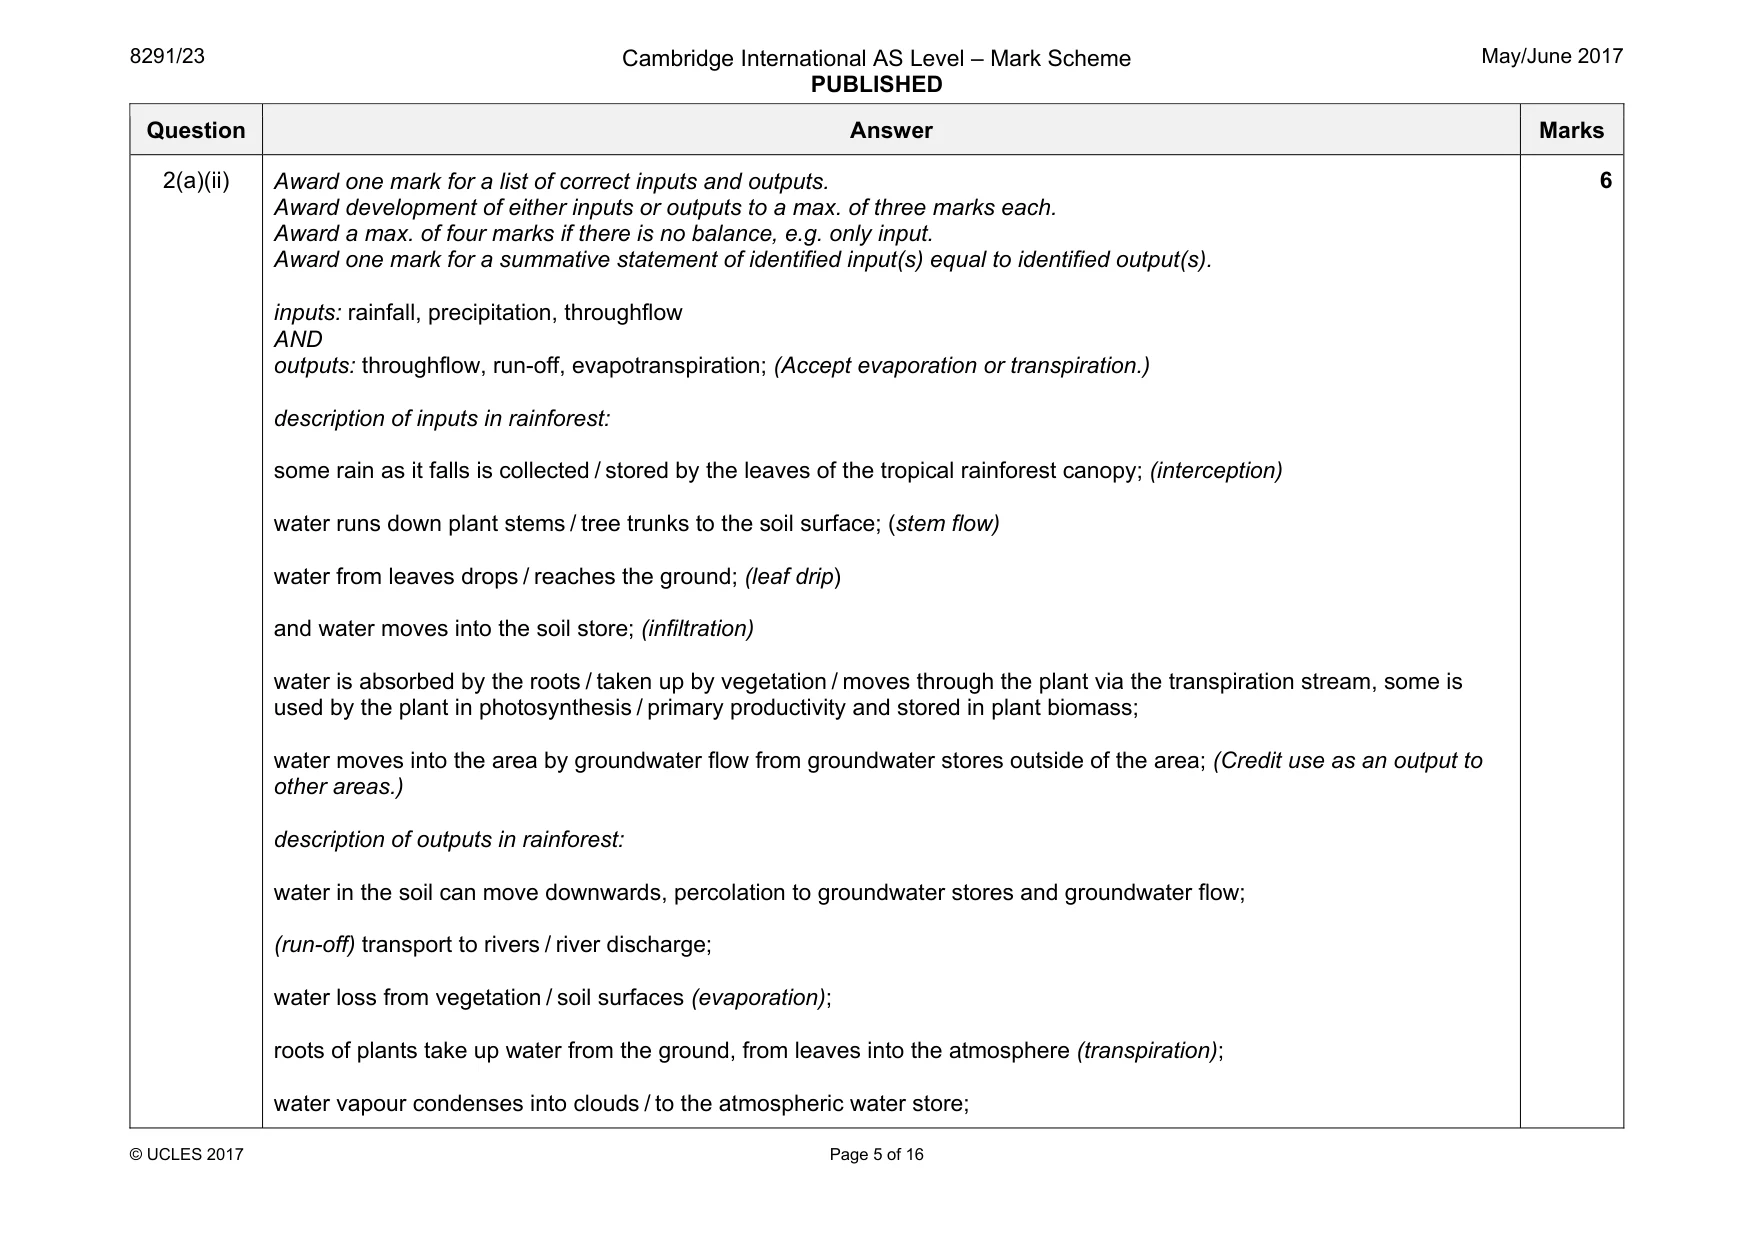
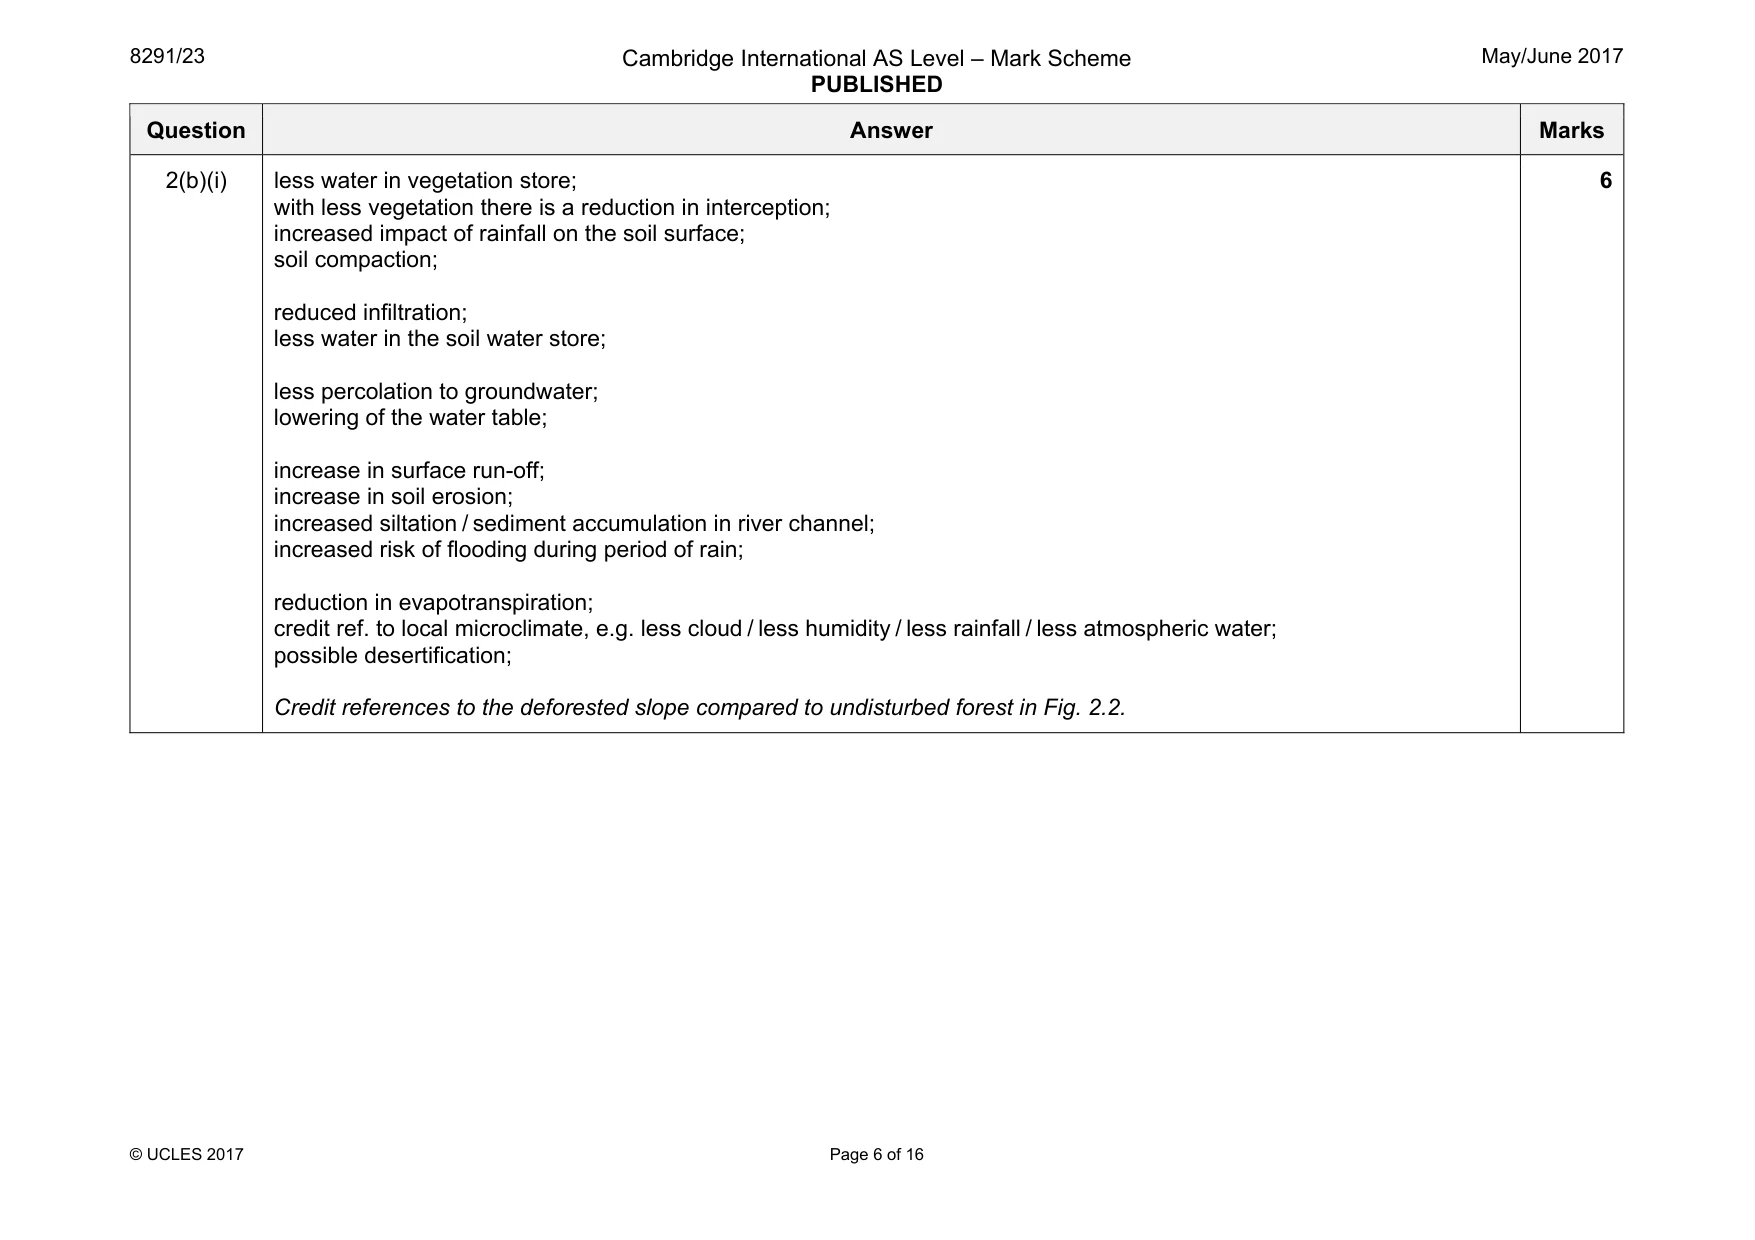
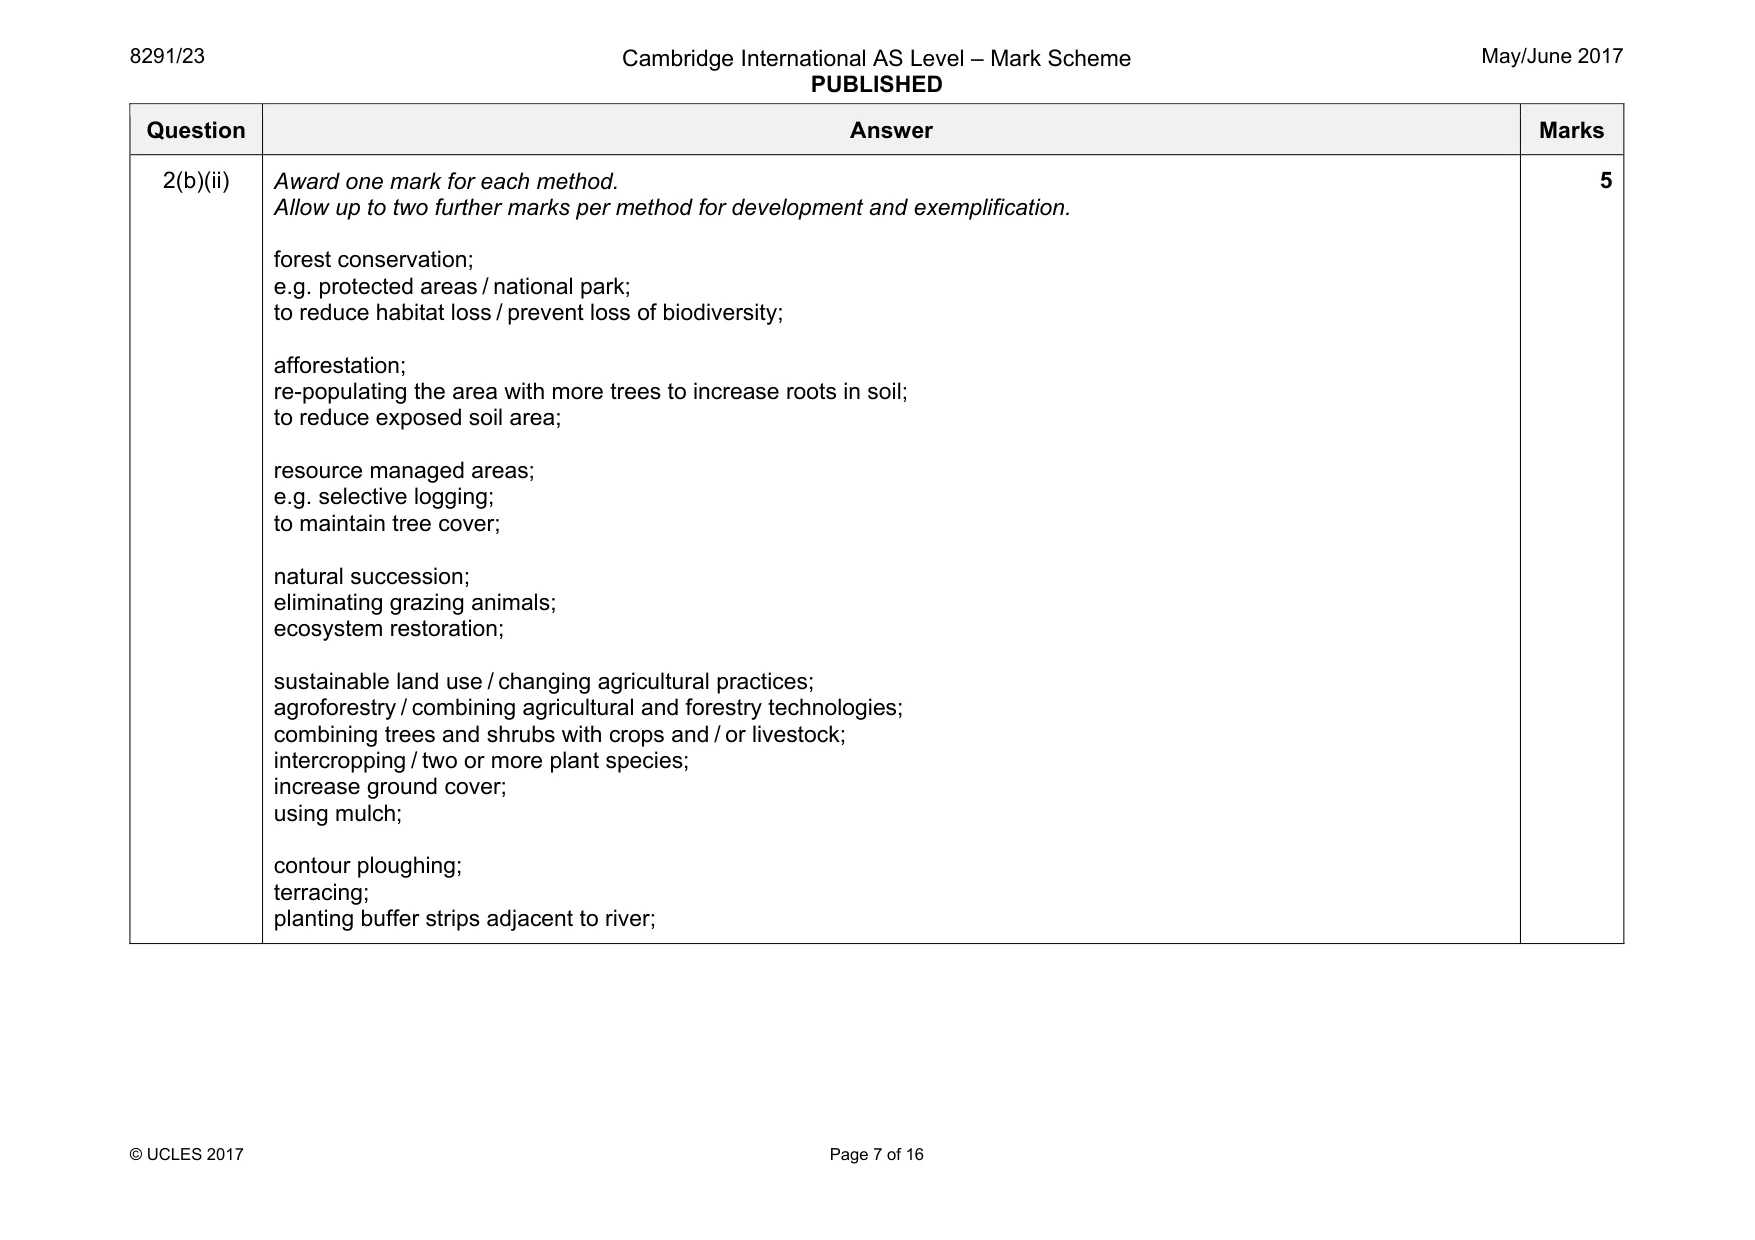
Mark scheme: 2(a)(i) evaporation: formation of water vapour / gas from liquid water; interception: capture of rainfall as it falls / rainfall is prevented from reaching the ground directly; run-off: water moving over soil / land surface; 3 Question Answer Marks 2(a)(ii) Award one mark for a list of correct inputs and outputs. Award development of either inputs or outputs to a max. of three marks each. Award a max. of four marks if there is no balance, e.g. only input. Award one mark for a summative statement of identified input(s) equal to identified output(s). inputs: rainfall, precipitation, throughflow AND outputs: throughflow, run-off, evapotranspiration; (Accept evaporation or transpiration.) description of inputs in rainforest: some rain as it falls is collected / stored by the leaves of the tropical rainforest canopy; (interception) water runs down plant stems / tree trunks to the soil surface; (stem flow) water from leaves drops / reaches the ground; (leaf drip) and water moves into the soil store; (infiltration) water is absorbed by the roots / taken up by vegetation / moves through the plant via the transpiration stream, some is used by the plant in photosynthesis / primary productivity and stored in plant biomass; water moves into the area by groundwater flow from groundwater stores outside of the area; (Credit use as an output to other areas.) description of outputs in rainforest: water in the soil can move downwards, percolation to groundwater stores and groundwater flow; (run-off) transport to rivers / river discharge; water loss from vegetation / soil surfaces (evaporation); roots of plants take up water from the ground, from leaves into the atmosphere (transpiration); water vapour condenses into clouds / to the atmospheric water store; 6 Question Answer Marks 2(b)(i) less water in vegetation store; with less vegetation there is a reduction in interception; increased impact of rainfall on the soil surface; soil compaction; reduced infiltration; less water in the soil water store; less percolation to groundwater; lowering of the water table; increase in surface run-off; increase in soil erosion; increased siltation / sediment accumulation in river channel; increased risk of flooding during period of rain; reduction in evapotranspiration; credit ref. to local microclimate, e.g. less cloud / less humidity / less rainfall / less atmospheric water; possible desertification; Credit references to the deforested slope compared to undisturbed forest in Fig. 2.2. 6 Question Answer Marks 2(b)(ii) Award one mark for each method. Allow up to two further marks per method for development and exemplification. forest conservation; e.g. protected areas / national park; to reduce habitat loss / prevent loss of biodiversity; afforestation; re-populating the area with more trees to increase roots in soil; to reduce exposed soil area; resource managed areas; e.g. selective logging; to maintain tree cover; natural succession; eliminating grazing animals; ecosystem restoration; sustainable land use / changing agricultural practices; agroforestry / combining agricultural and forestry technologies; combining trees and shrubs with crops and / or livestock; intercropping / two or more plant species; increase ground cover; using mulch; contour ploughing; terracing; planting buffer strips adjacent to river; 5 Section B
Q3 · The percentage share of total water usage in three countries
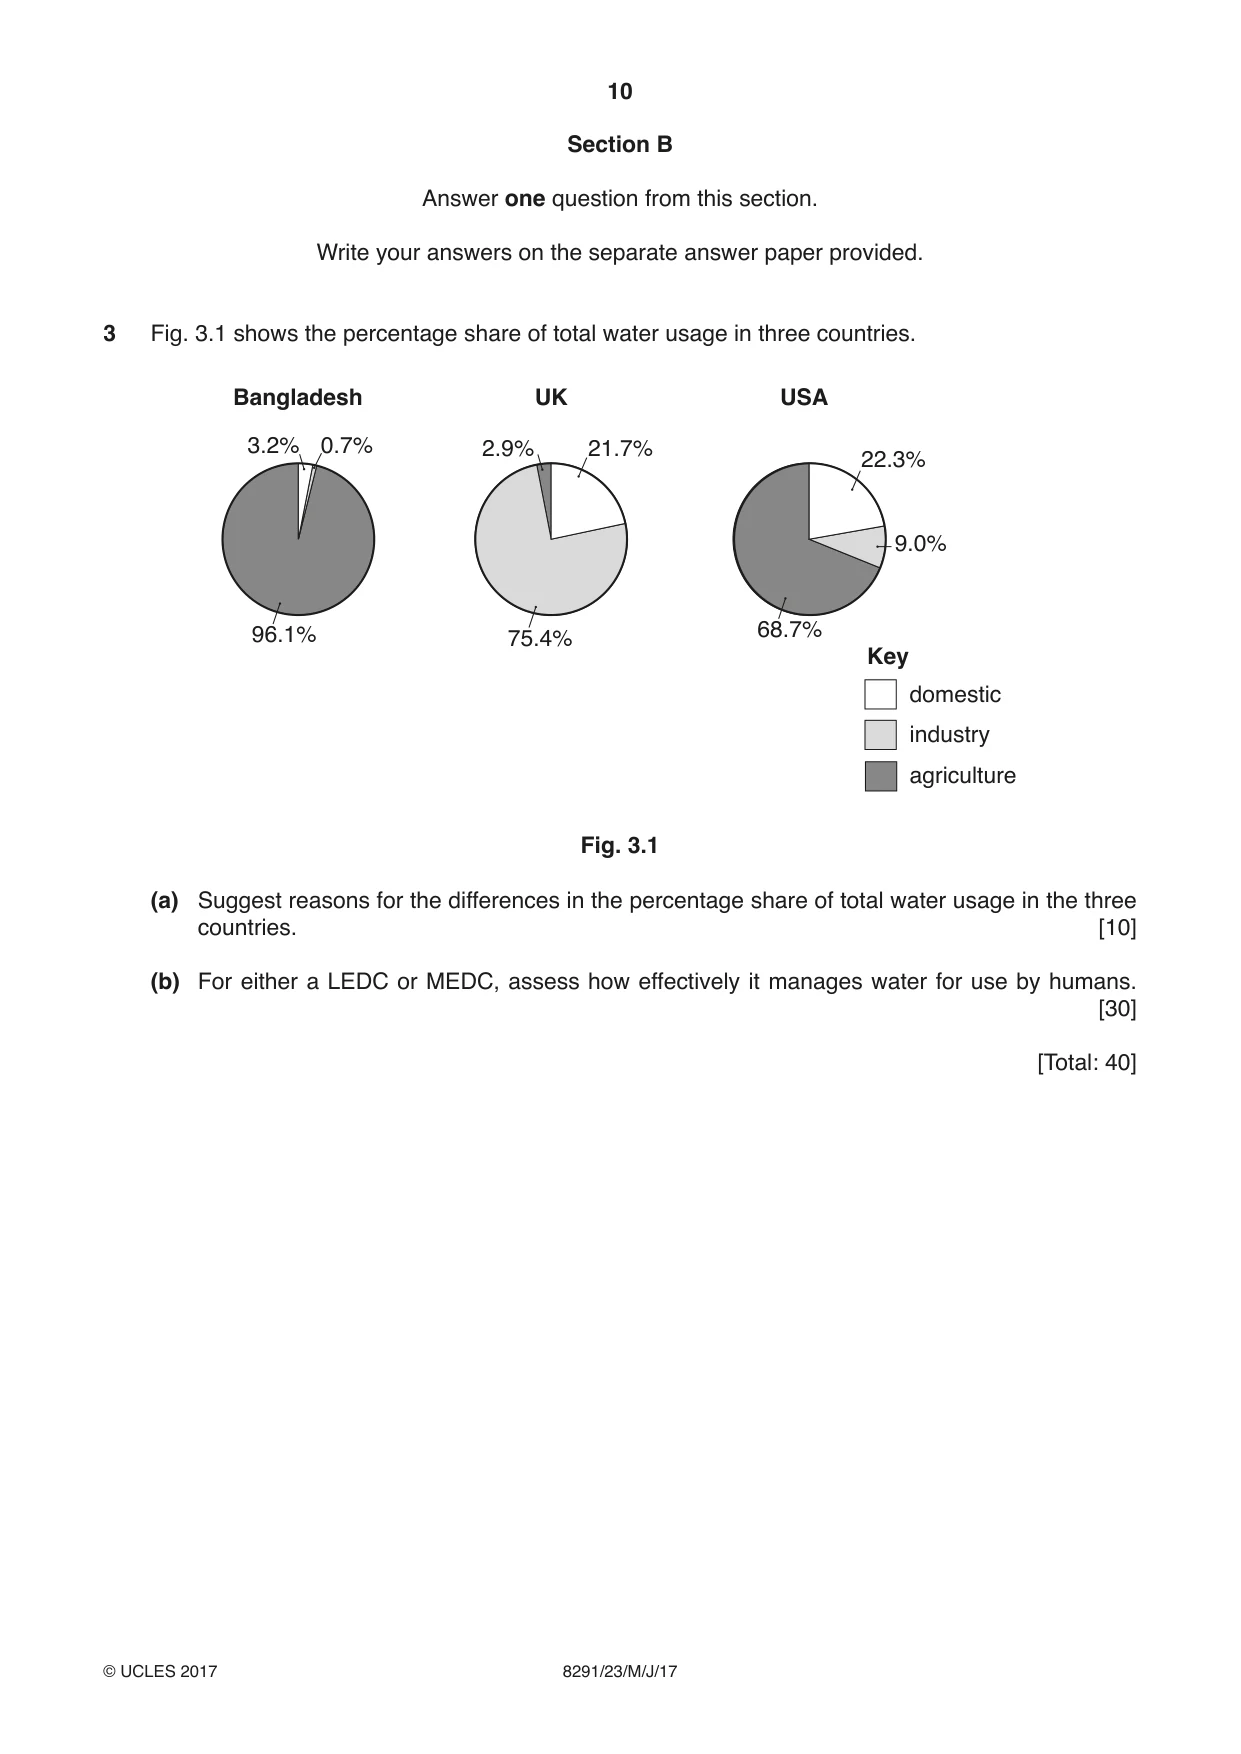
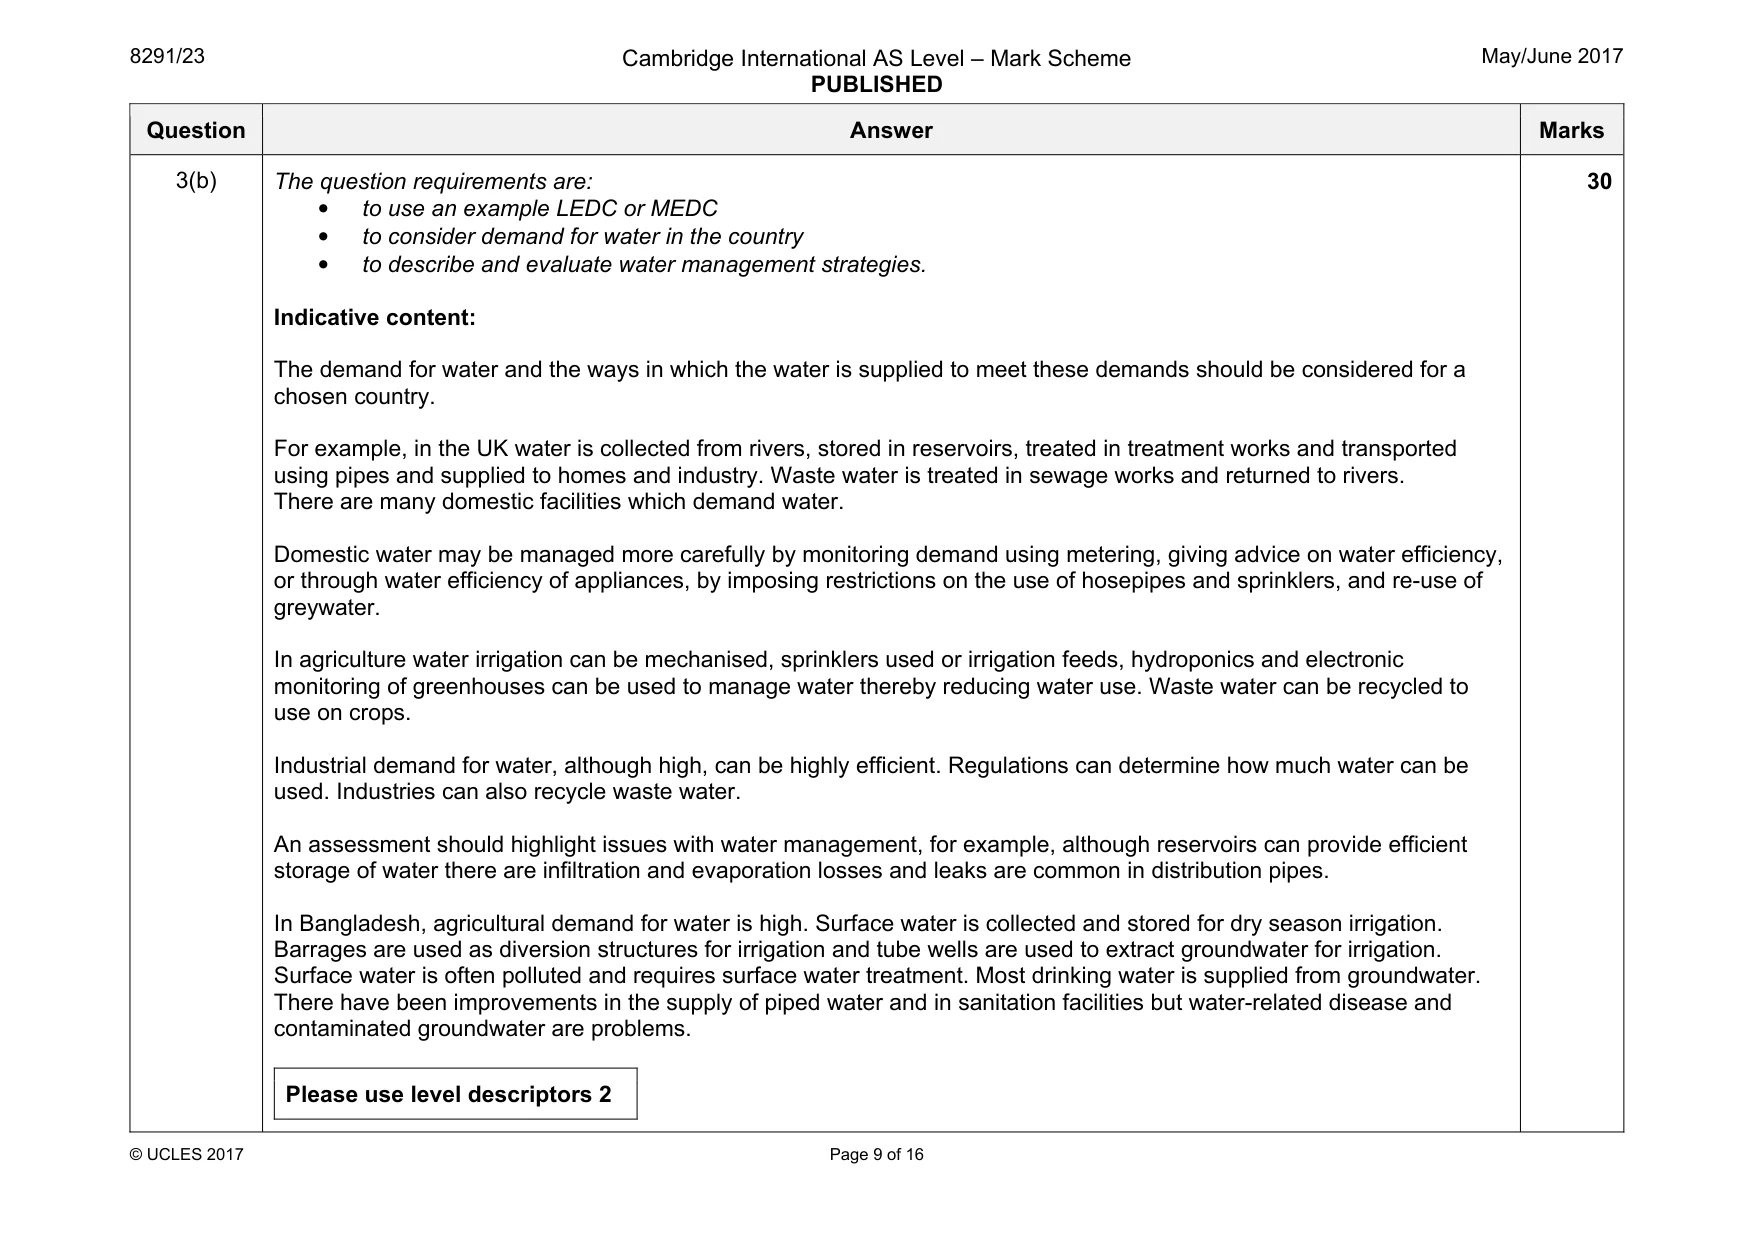
3 Fig. 3.1 shows the percentage share of total water usage in three countries. Bangladesh UK USA 3.2% 0.7% 2.9% 21.7% 22.3% 9.0% 96.1% 75.4% 68.7% Key domestic industry agriculture Fig. 3.1 (a) Suggest reasons for the differences in the percentage share of total water usage in the three countries. [10] (b) For either a LEDC or MEDC, assess how effectively it manages water for use by humans. [30] [Total: 40]
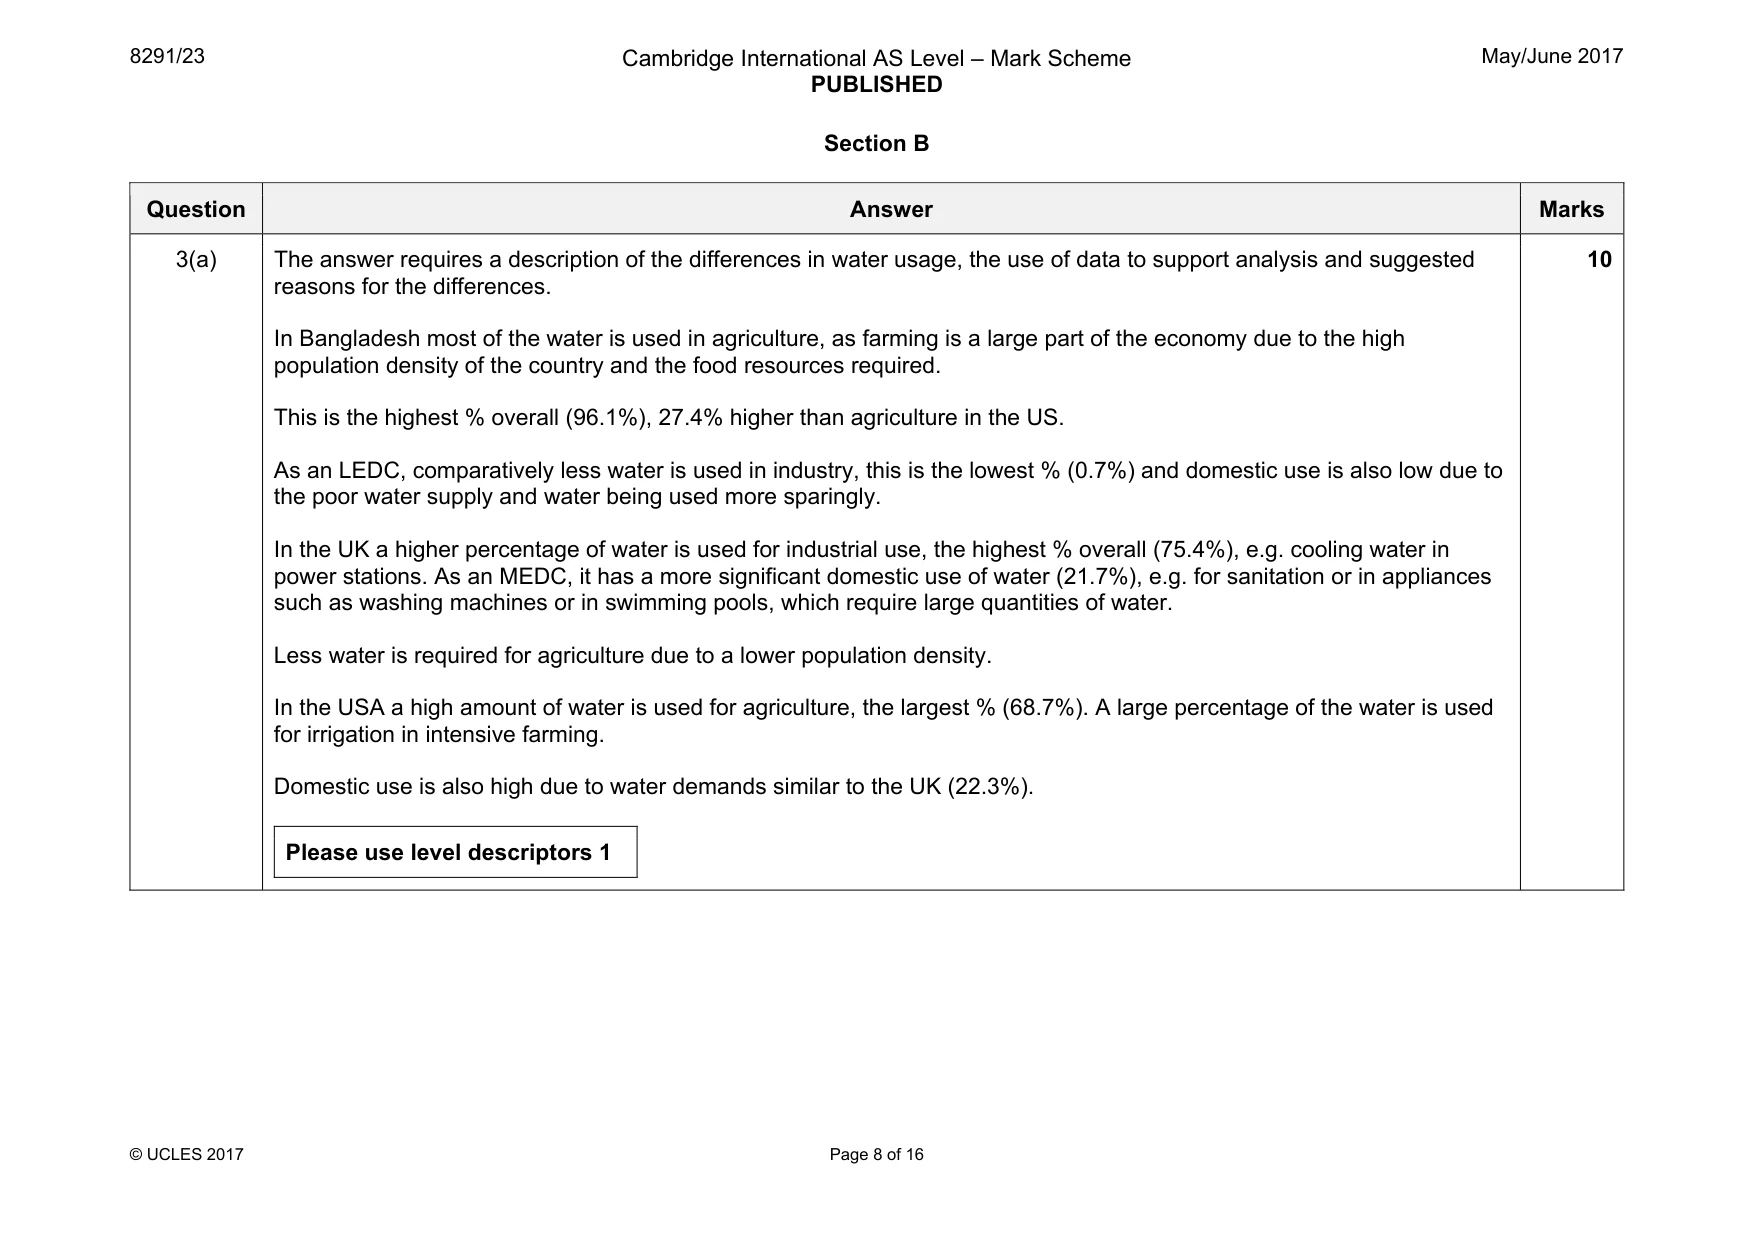
Mark scheme: 3(a) The answer requires a description of the differences in water usage, the use of data to support analysis and suggested reasons for the differences. In Bangladesh most of the water is used in agriculture, as farming is a large part of the economy due to the high population density of the country and the food resources required. This is the highest % overall (96.1%), 27.4% higher than agriculture in the US. As an LEDC, comparatively less water is used in industry, this is the lowest % (0.7%) and domestic use is also low due to the poor water supply and water being used more sparingly. In the UK a higher percentage of water is used for industrial use, the highest % overall (75.4%), e.g. cooling water in power stations. As an MEDC, it has a more significant domestic use of water (21.7%), e.g. for sanitation or in appliances such as washing machines or in swimming pools, which require large quantities of water. Less water is required for agriculture due to a lower population density. In the USA a high amount of water is used for agriculture, the largest % (68.7%). A large percentage of the water is used for irrigation in intensive farming. Domestic use is also high due to water demands similar to the UK (22.3%). Please use level descriptors 1 10 Question Answer Marks 3(b) The question requirements are: • to use an example LEDC or MEDC • to consider demand for water in the country • to describe and evaluate water management strategies. Indicative content: The demand for water and the ways in which the water is supplied to meet these demands should be considered for a chosen country. For example, in the UK water is collected from rivers, stored in reservoirs, treated in treatment works and transported using pipes and supplied to homes and industry. Waste water is treated in sewage works and returned to rivers. There are many domestic facilities which demand water. Domestic water may be managed more carefully by monitoring demand using metering, giving advice on water efficiency, or through water efficiency of appliances, by imposing restrictions on the use of hosepipes and sprinklers, and re-use of greywater. In agriculture water irrigation can be mechanised, sprinklers used or irrigation feeds, hydroponics and electronic monitoring of greenhouses can be used to manage water thereby reducing water use. Waste water can be recycled to use on crops. Industrial demand for water, although high, can be highly efficient. Regulations can determine how much water can be used. Industries can also recycle waste water. An assessment should highlight issues with water management, for example, although reservoirs can provide efficient storage of water there are infiltration and evaporation losses and leaks are common in distribution pipes. In Bangladesh, agricultural demand for water is high. Surface water is collected and stored for dry season irrigation. Barrages are used as diversion structures for irrigation and tube wells are used to extract groundwater for irrigation. Surface water is often polluted and requires surface water treatment. Most drinking water is supplied from groundwater. There have been improvements in the supply of piped water and in sanitation facilities but water-related disease and contaminated groundwater are problems. Please use level descriptors 2 30
Q4 · A mangrove ecosystem, which is an example of a coastal water ecosystem
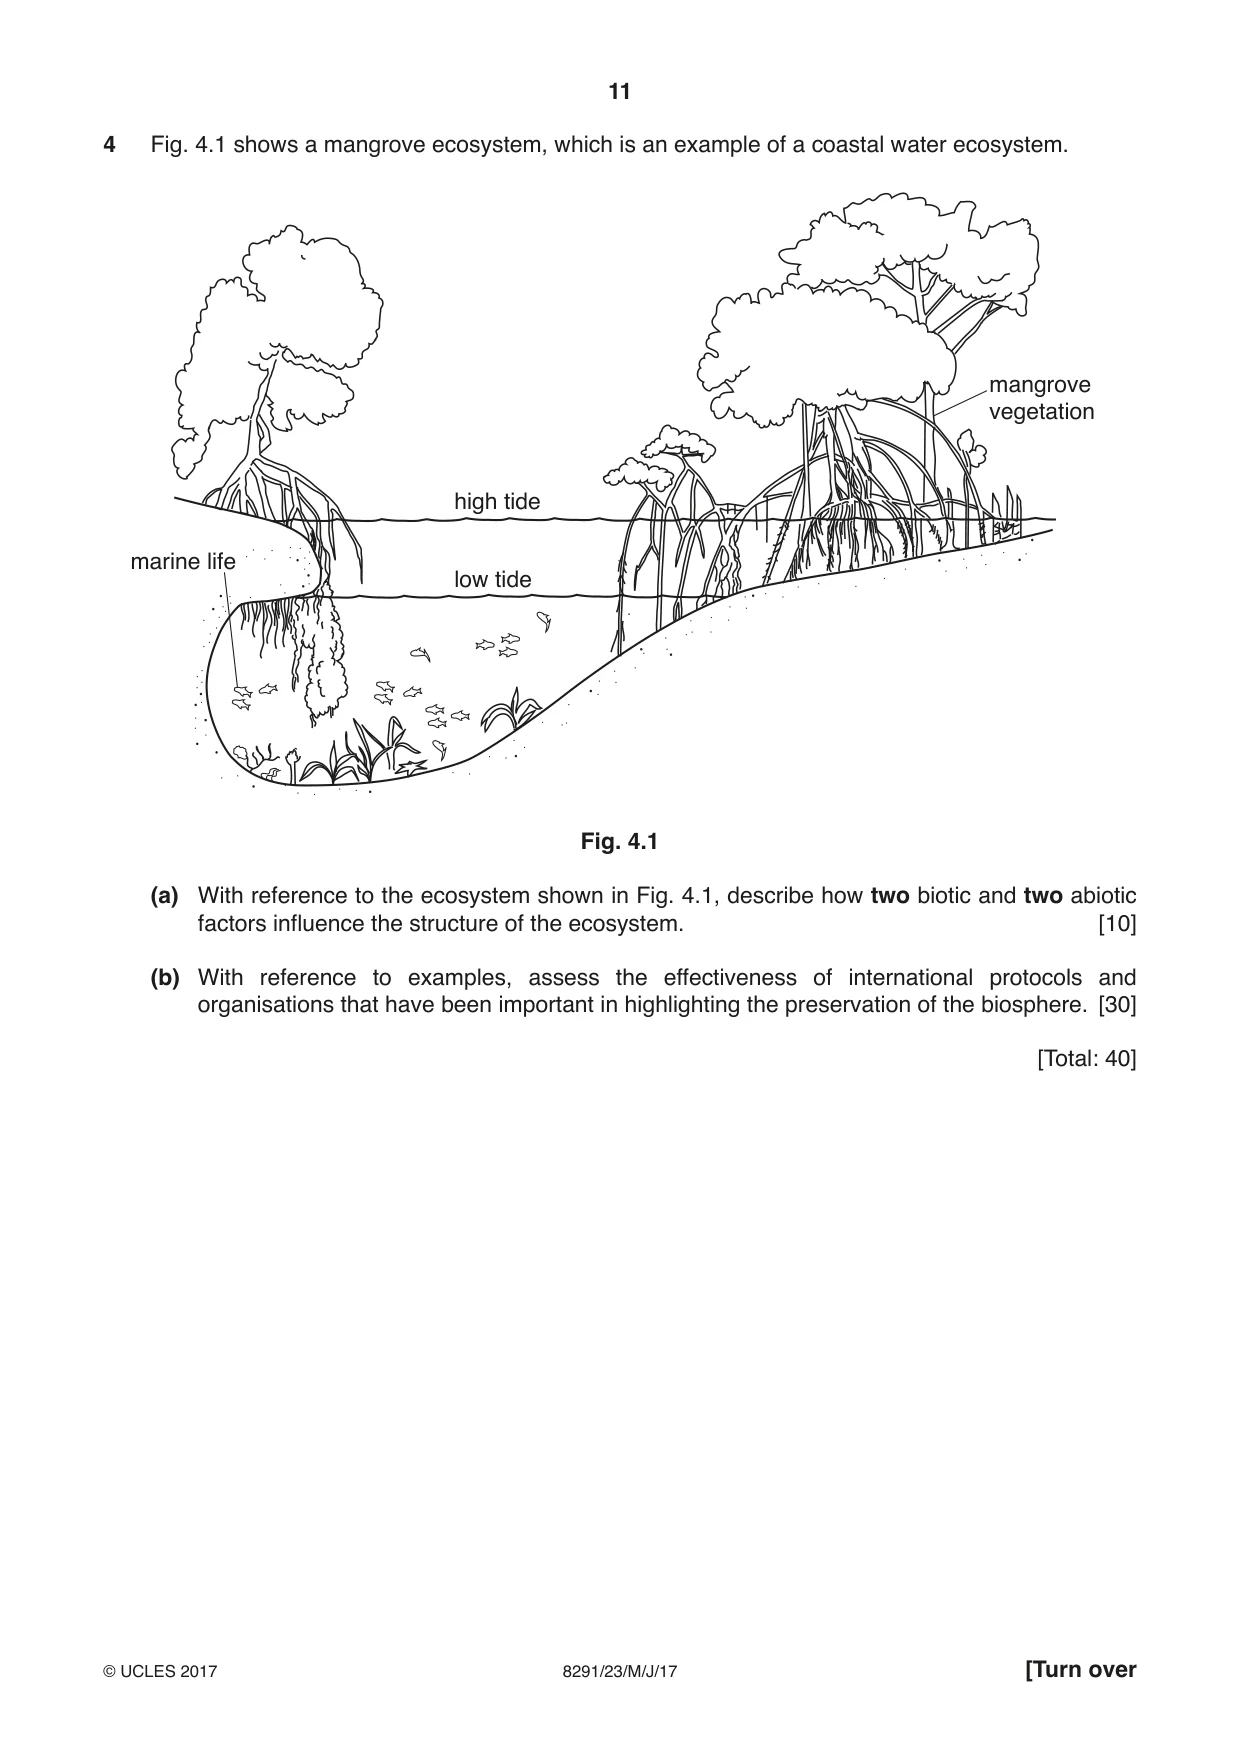
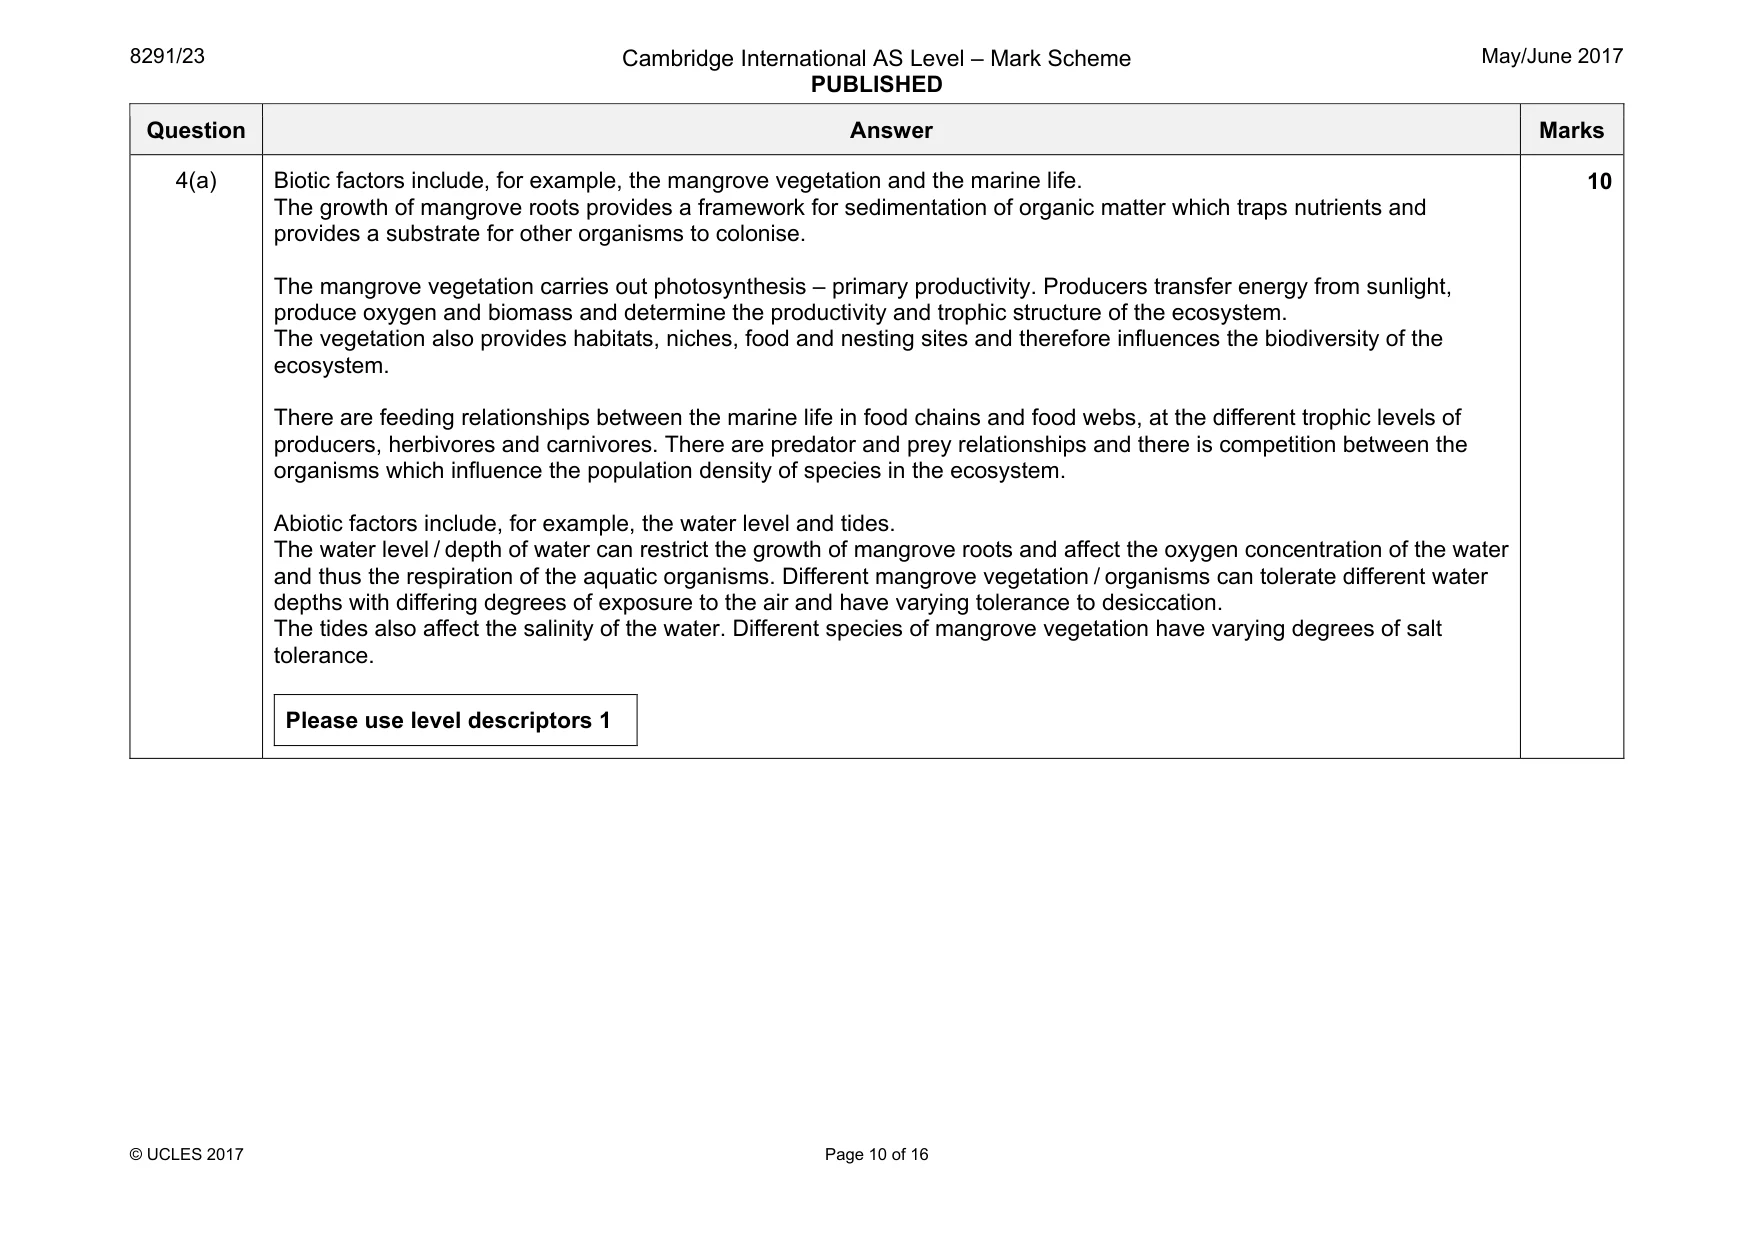
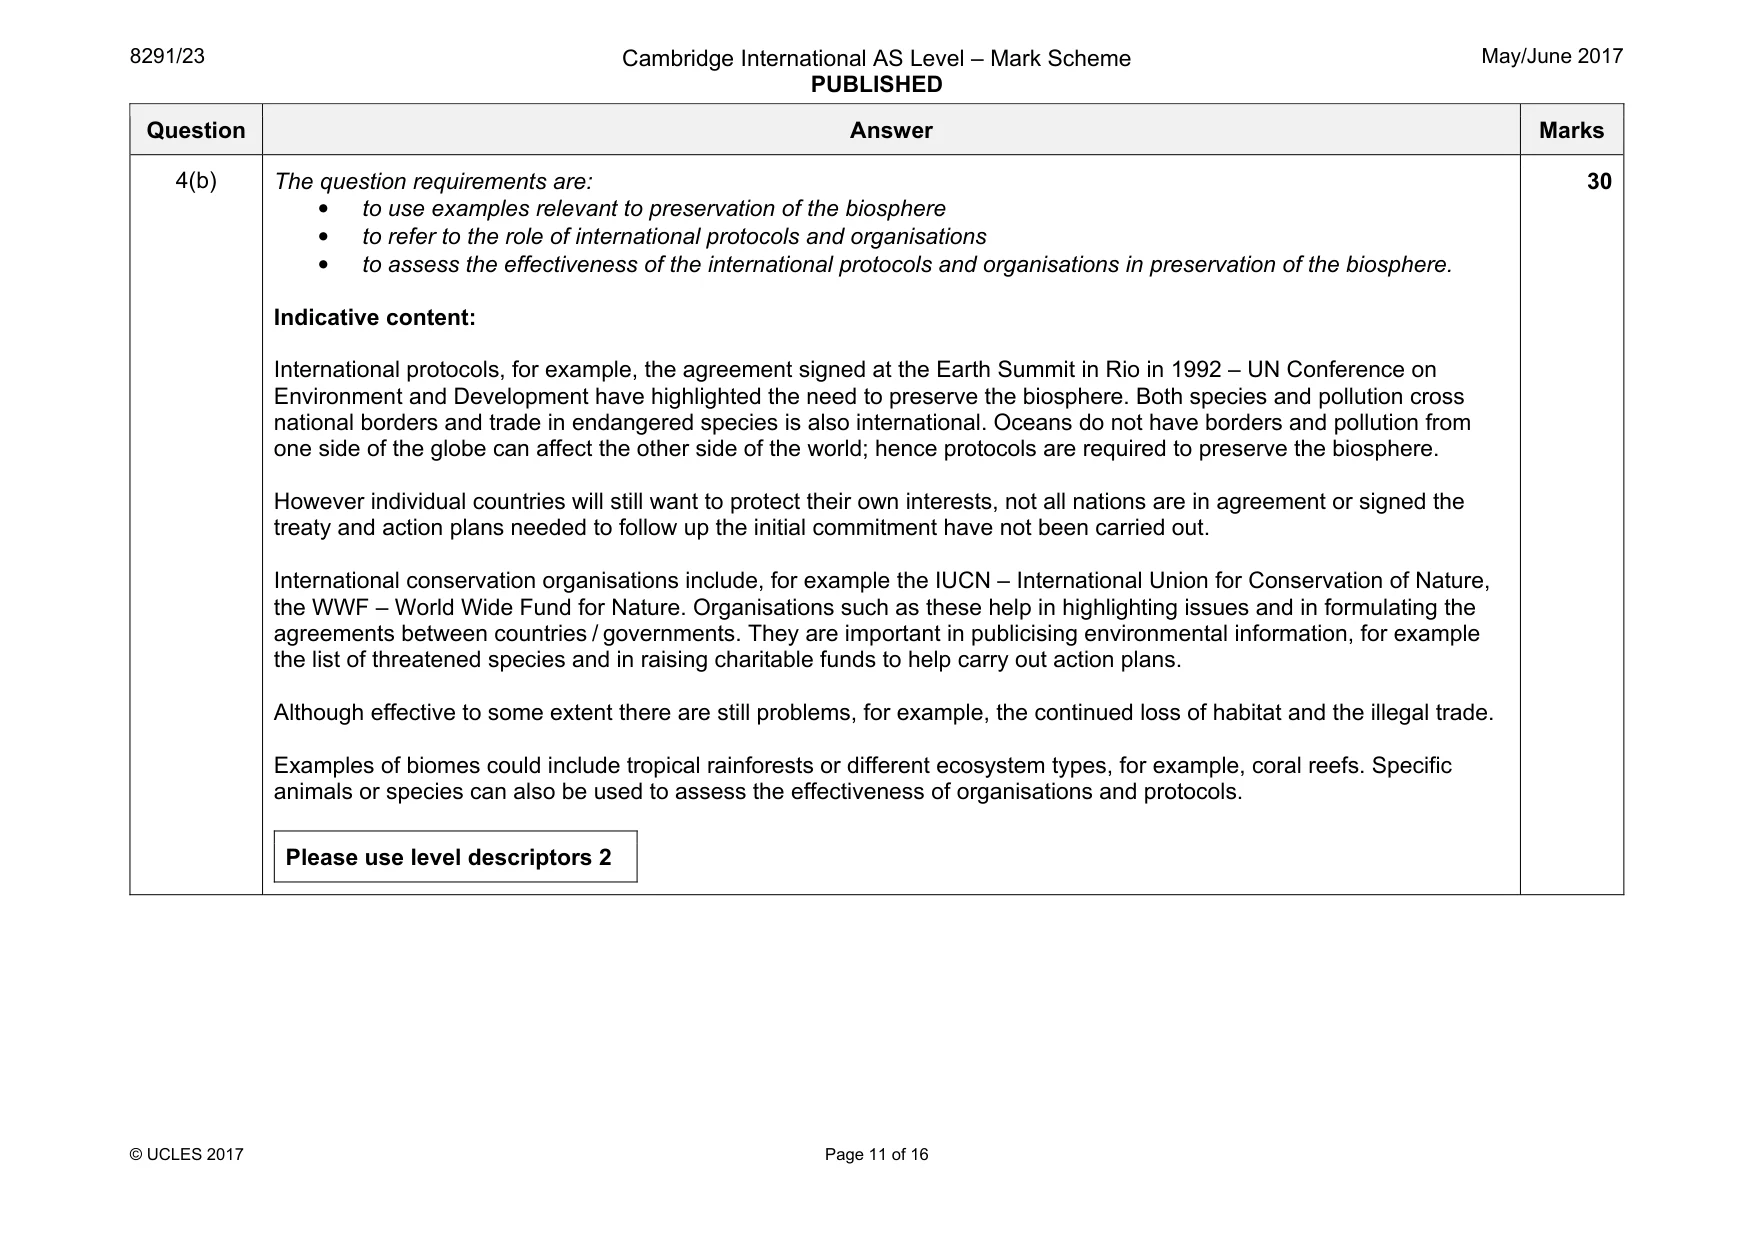
4 Fig. 4.1 shows a mangrove ecosystem, which is an example of a coastal water ecosystem. mangrove vegetation high tide marine life low tide Fig. 4.1 (a) With reference to the ecosystem shown in Fig. 4.1, describe how two biotic and two abiotic factors influence the structure of the ecosystem. [10] (b) With reference to examples, assess the effectiveness of international protocols and organisations that have been important in highlighting the preservation of the biosphere. [30] [Total: 40]
Mark scheme: 4(a) Biotic factors include, for example, the mangrove vegetation and the marine life. The growth of mangrove roots provides a framework for sedimentation of organic matter which traps nutrients and provides a substrate for other organisms to colonise. The mangrove vegetation carries out photosynthesis – primary productivity. Producers transfer energy from sunlight, produce oxygen and biomass and determine the productivity and trophic structure of the ecosystem. The vegetation also provides habitats, niches, food and nesting sites and therefore influences the biodiversity of the ecosystem. There are feeding relationships between the marine life in food chains and food webs, at the different trophic levels of producers, herbivores and carnivores. There are predator and prey relationships and there is competition between the organisms which influence the population density of species in the ecosystem. Abiotic factors include, for example, the water level and tides. The water level / depth of water can restrict the growth of mangrove roots and affect the oxygen concentration of the water and thus the respiration of the aquatic organisms. Different mangrove vegetation / organisms can tolerate different water depths with differing degrees of exposure to the air and have varying tolerance to desiccation. The tides also affect the salinity of the water. Different species of mangrove vegetation have varying degrees of salt tolerance. Please use level descriptors 1 10 Question Answer Marks 4(b) The question requirements are: • to use examples relevant to preservation of the biosphere • to refer to the role of international protocols and organisations • to assess the effectiveness of the international protocols and organisations in preservation of the biosphere. Indicative content: International protocols, for example, the agreement signed at the Earth Summit in Rio in 1992 – UN Conference on Environment and Development have highlighted the need to preserve the biosphere. Both species and pollution cross national borders and trade in endangered species is also international. Oceans do not have borders and pollution from one side of the globe can affect the other side of the world; hence protocols are required to preserve the biosphere. However individual countries will still want to protect their own interests, not all nations are in agreement or signed the treaty and action plans needed to follow up the initial commitment have not been carried out. International conservation organisations include, for example the IUCN – International Union for Conservation of Nature, the WWF – World Wide Fund for Nature. Organisations such as these help in highlighting issues and in formulating the agreements between countries / governments. They are important in publicising environmental information, for example the list of threatened species and in raising charitable funds to help carry out action plans. Although effective to some extent there are still problems, for example, the continued loss of habitat and the illegal trade. Examples of biomes could include tropical rainforests or different ecosystem types, for example, coral reefs. Specific animals or species can also be used to assess the effectiveness of organisations and protocols. Please use level descriptors 2 30
Q5 · A model showing the relationship between death rate, birth rate, population size and…
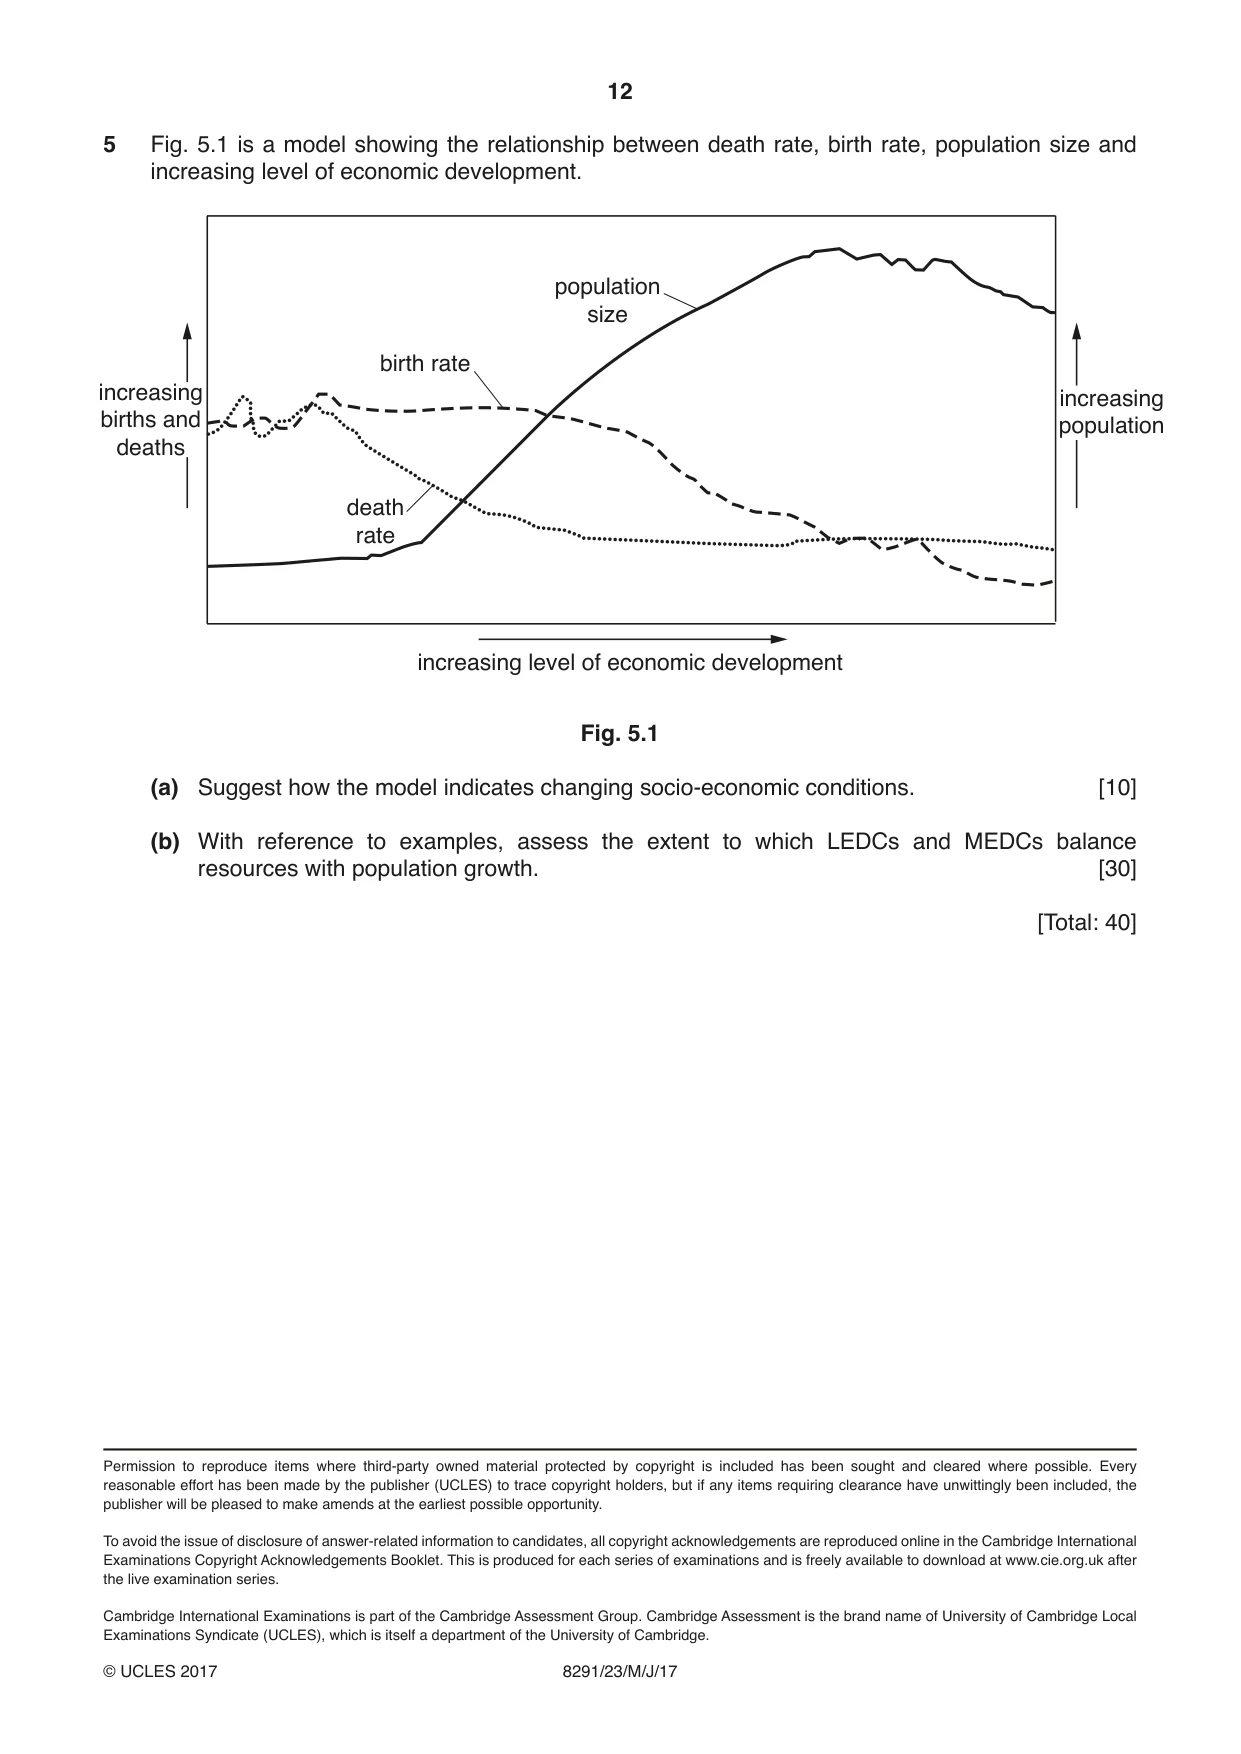
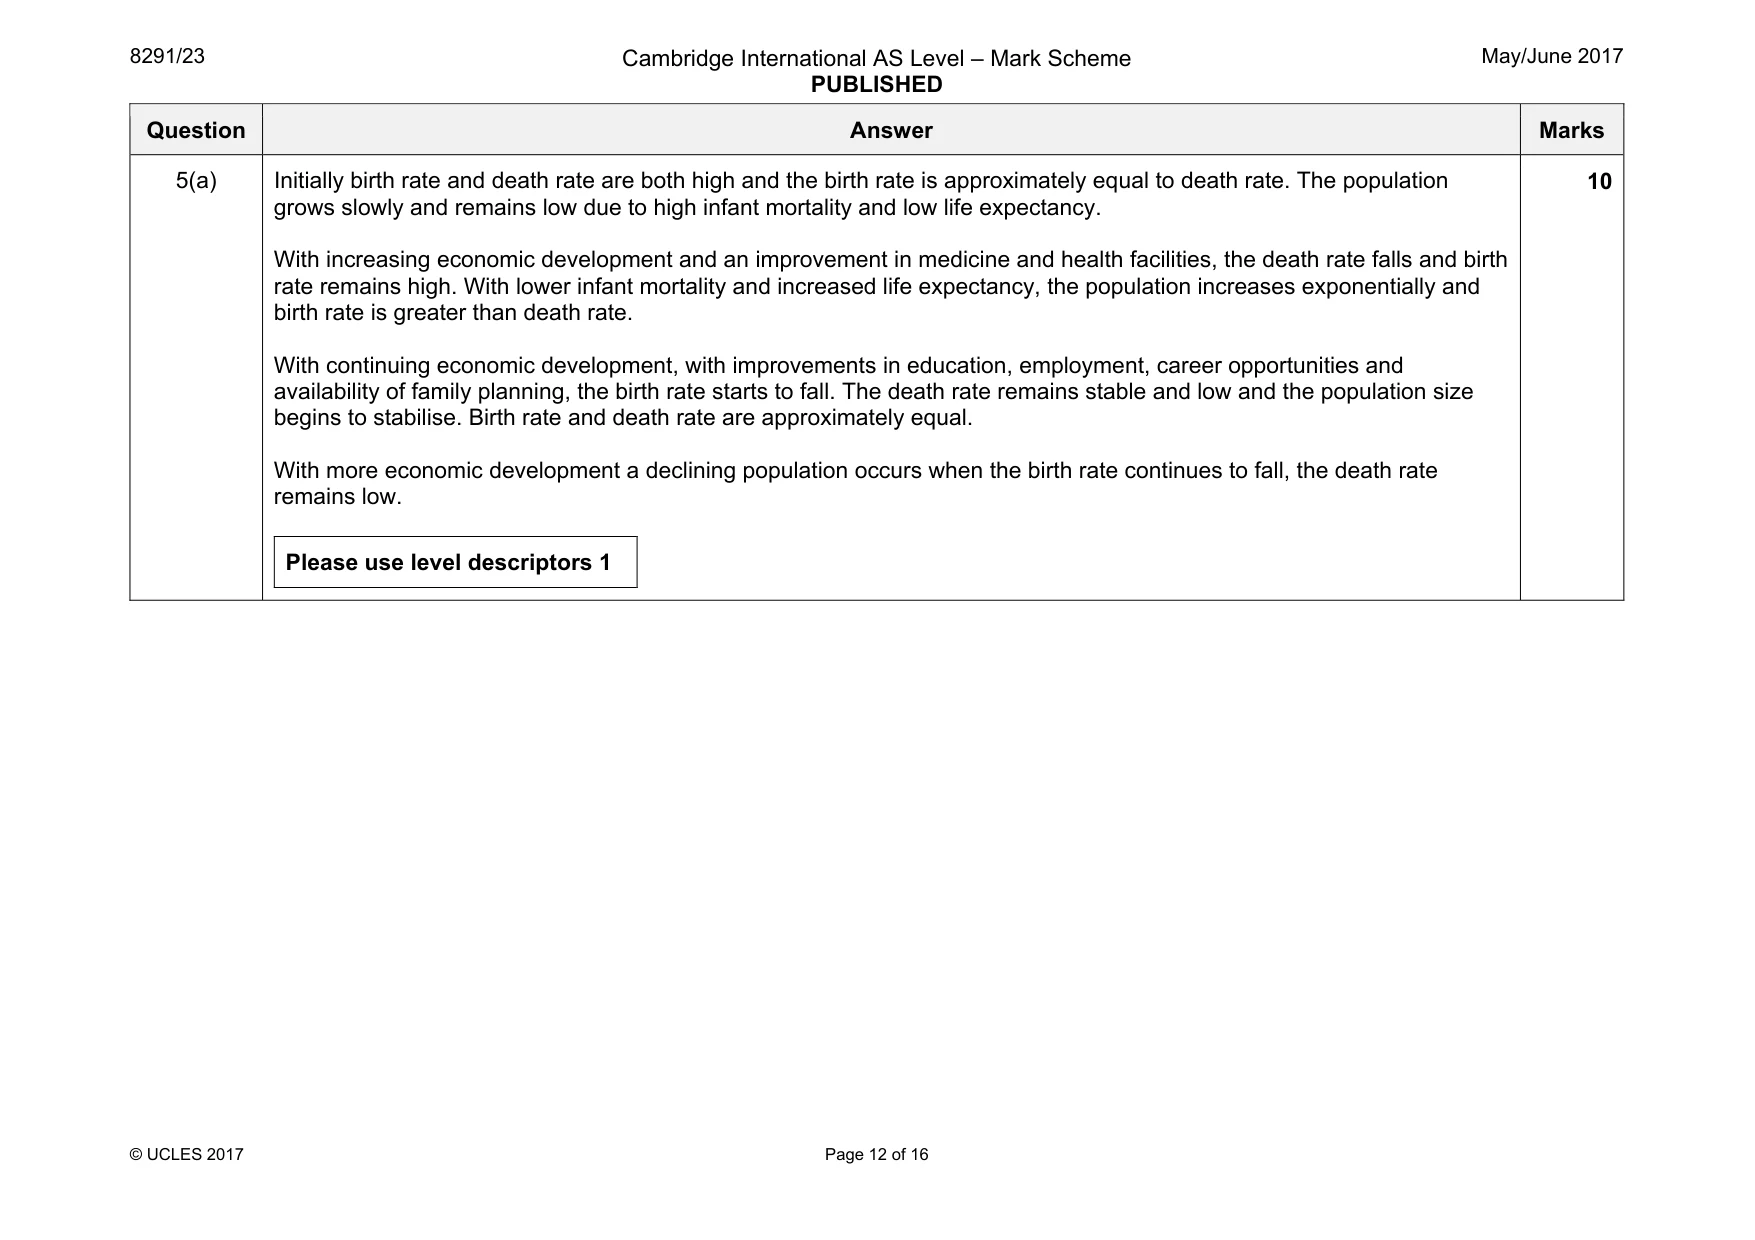
5 Fig. 5.1 is a model showing the relationship between death rate, birth rate, population size and increasing level of economic development. population size birth rate increasing increasing births and population deaths death rate increasing level of economic development Fig. 5.1 (a) Suggest how the model indicates changing socio-economic conditions. [10] (b) With reference to examples, assess the extent to which LEDCs and MEDCs balance resources with population growth. [30] [Total: 40]
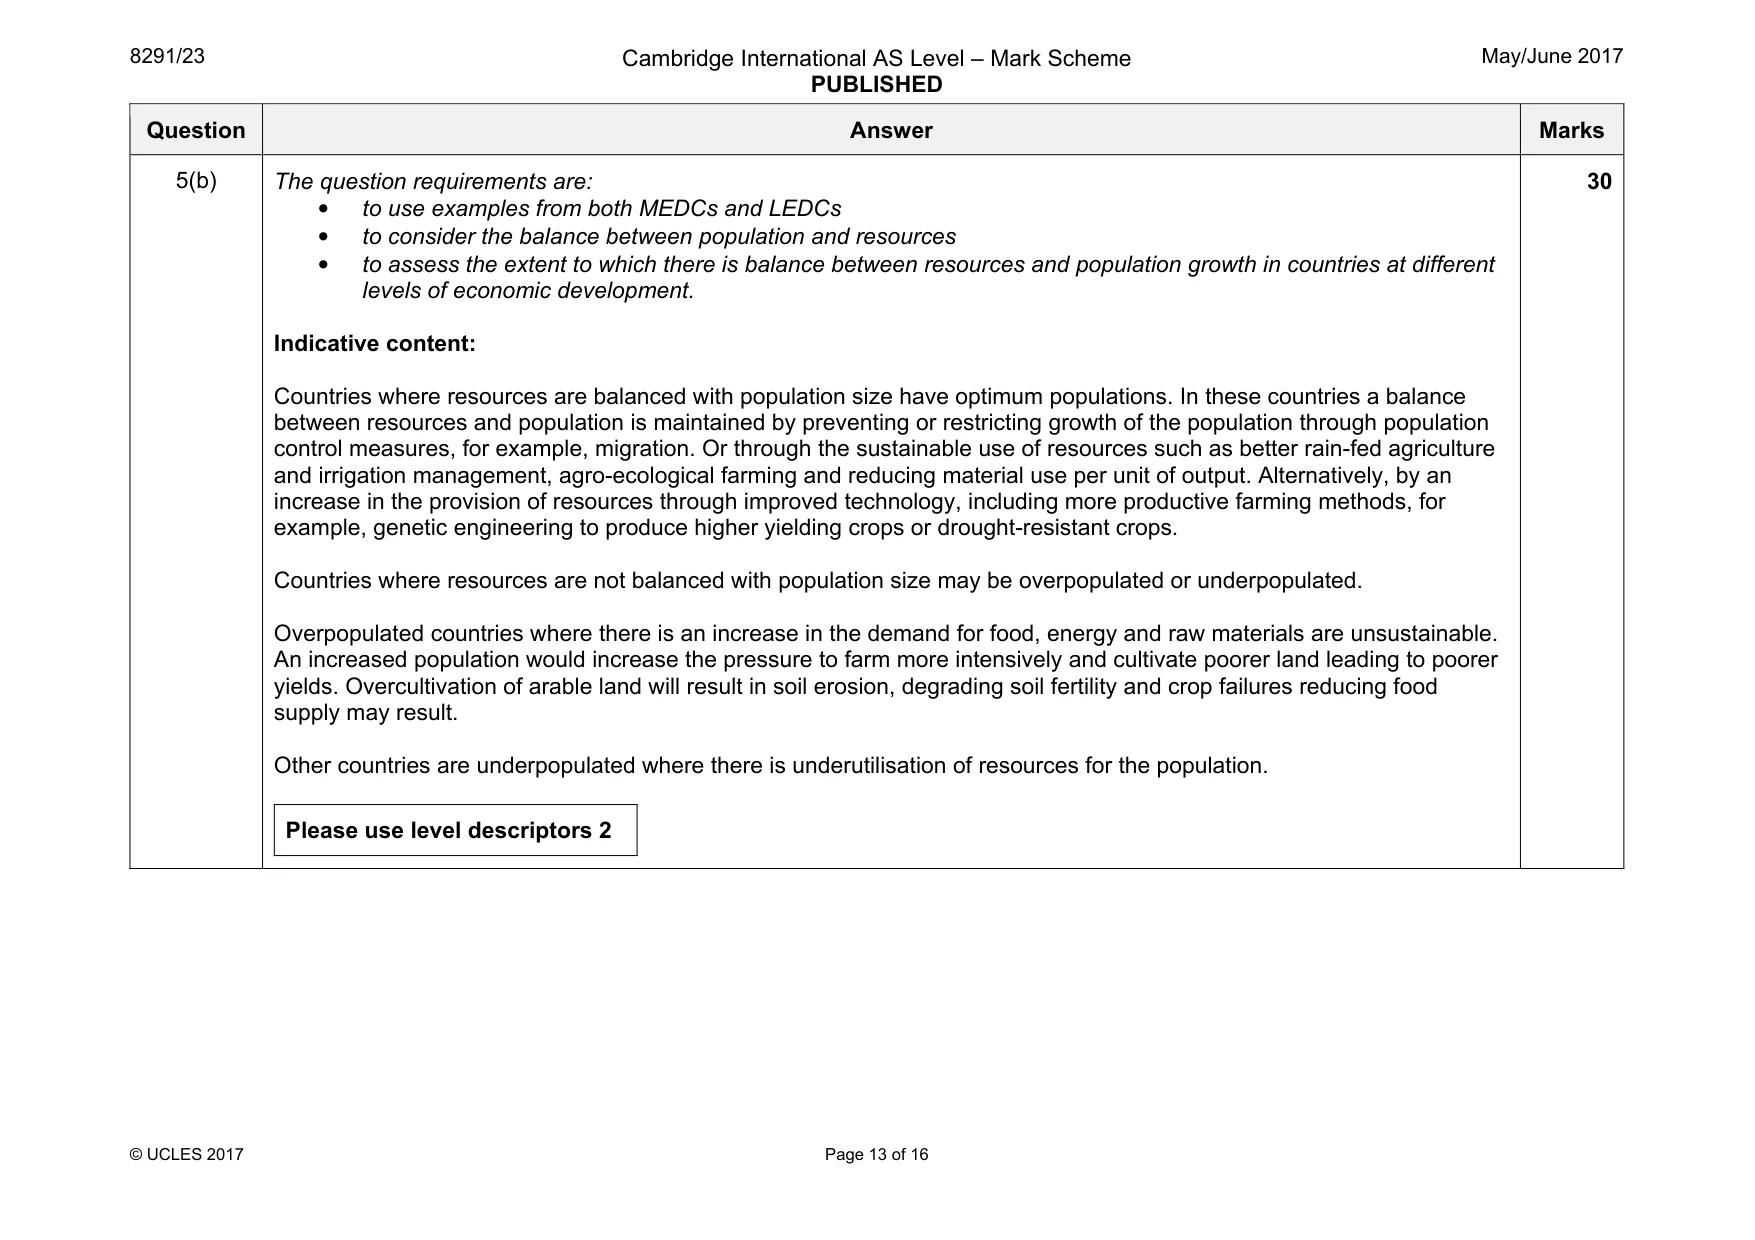
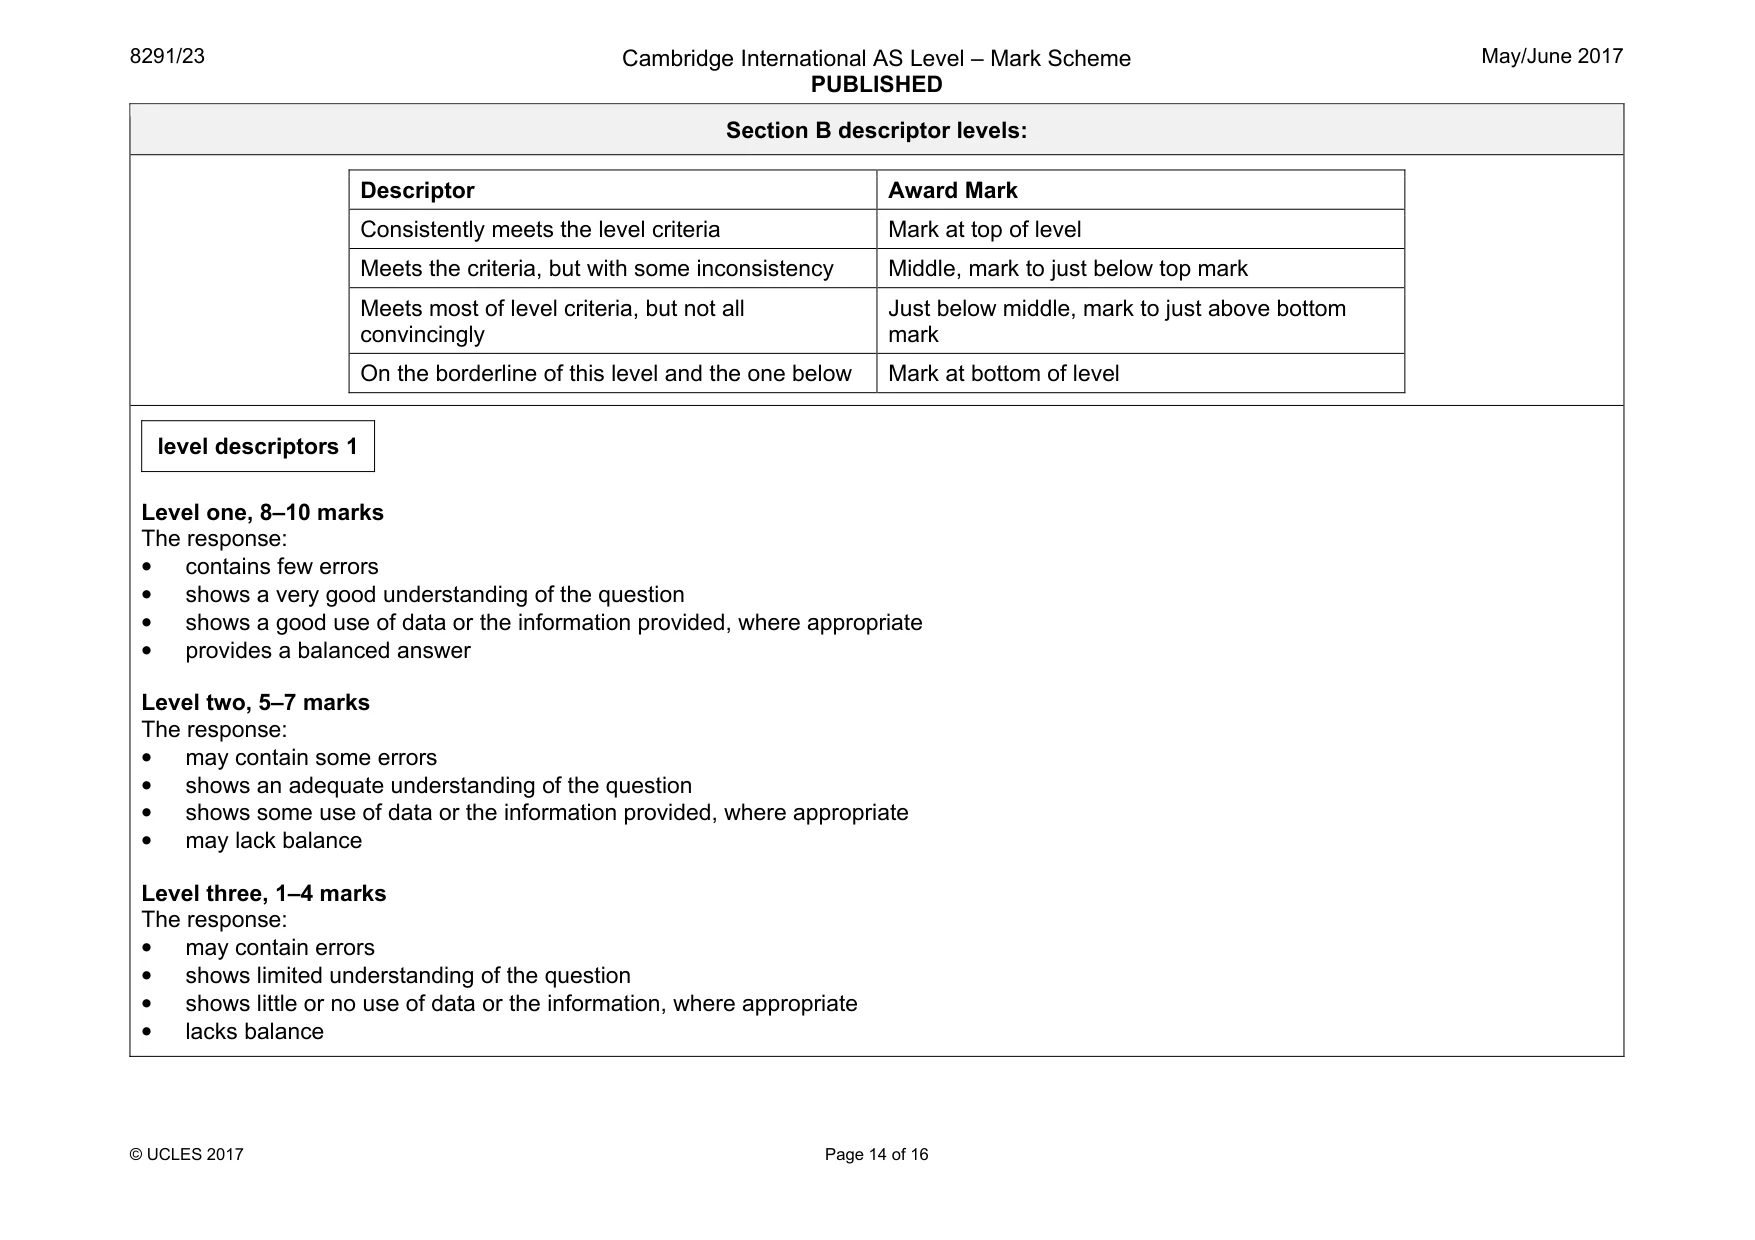
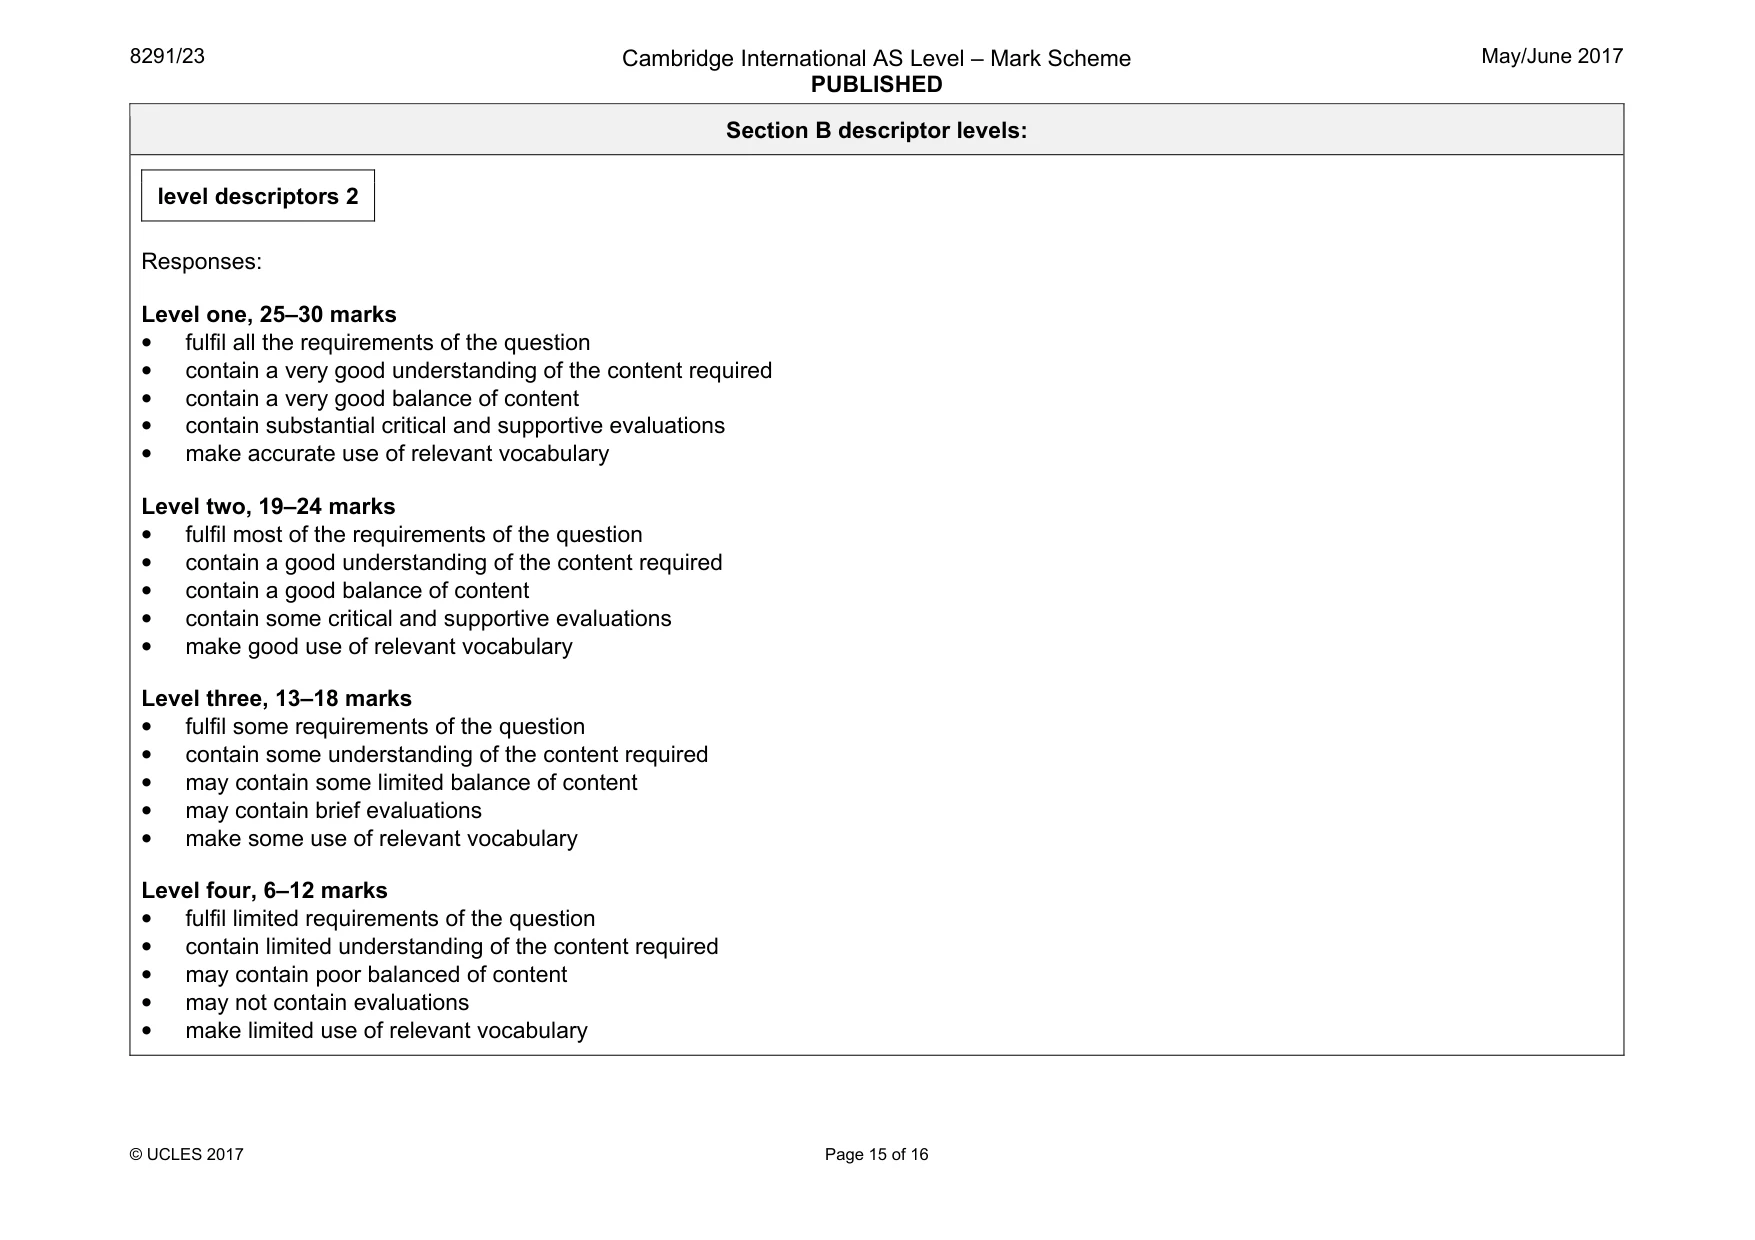
Mark scheme: 5(a) Initially birth rate and death rate are both high and the birth rate is approximately equal to death rate. The population grows slowly and remains low due to high infant mortality and low life expectancy. With increasing economic development and an improvement in medicine and health facilities, the death rate falls and birth rate remains high. With lower infant mortality and increased life expectancy, the population increases exponentially and birth rate is greater than death rate. With continuing economic development, with improvements in education, employment, career opportunities and availability of family planning, the birth rate starts to fall. The death rate remains stable and low and the population size begins to stabilise. Birth rate and death rate are approximately equal. With more economic development a declining population occurs when the birth rate continues to fall, the death rate remains low. Please use level descriptors 1 10 Question Answer Marks 5(b) The question requirements are: • to use examples from both MEDCs and LEDCs • to consider the balance between population and resources • to assess the extent to which there is balance between resources and population growth in countries at different levels of economic development. Indicative content: Countries where resources are balanced with population size have optimum populations. In these countries a balance between resources and population is maintained by preventing or restricting growth of the population through population control measures, for example, migration. Or through the sustainable use of resources such as better rain-fed agriculture and irrigation management, agro-ecological farming and reducing material use per unit of output. Alternatively, by an increase in the provision of resources through improved technology, including more productive farming methods, for example, genetic engineering to produce higher yielding crops or drought-resistant crops. Countries where resources are not balanced with population size may be overpopulated or underpopulated. Overpopulated countries where there is an increase in the demand for food, energy and raw materials are unsustainable. An increased population would increase the pressure to farm more intensively and cultivate poorer land leading to poorer yields. Overcultivation of arable land will result in soil erosion, degrading soil fertility and crop failures reducing food supply may result. Other countries are underpopulated where there is underutilisation of resources for the population. Please use level descriptors 2 30 Section B descriptor levels: Descriptor Award Mark Consistently meets the level criteria Mark at top of level Meets the criteria, but with some inconsistency Middle, mark to just below top mark Meets most of level criteria, but not all convincingly Just below middle, mark to just above bottom mark On the borderline of this level and the one below Mark at bottom of level level descriptors 1 Level one, 8–10 marks The response: • contains few errors • shows a very good understanding of the question • shows a good use of data or the information provided, where appropriate • provides a balanced answer Level two, 5–7 marks The response: • may contain some errors • shows an adequate understanding of the question • shows some use of data or the information provided, where appropriate • may lack balance Level three, 1–4 marks The response: • may contain errors • shows limited understanding of the question • shows little or no use of data or the information, where appropriate • lacks balance Section B descriptor levels: level descriptors 2 Responses: Level one, 25–30 marks • fulfil all the requirements of the question • contain a very good understanding of the content required • contain a very good balance of content • contain substantial critical and supportive evaluations • make accurate use of relevant vocabulary Level two, 19–24 marks • fulfil most of the requirements of the question • contain a good understanding of the content required • contain a good balance of content • contain some critical and supportive evaluations • make good use of relevant vocabulary Level three, 13–18 marks • fulfil some requirements of the question • contain some understanding of the content required • may contain some limited balance of content • may contain brief evaluations • make some use of relevant vocabulary Level four, 6–12 marks • fulfil limited requirements of the question • contain limited understanding of the content required • may contain poor balanced of content • may not contain evaluations • make limited use of relevant vocabulary Section B descriptor levels: Level five, 1–5 marks • fulfil a few requirements of the question • contain a very limited understanding of the content required • are likely to be unbalanced and undeveloped • evaluative statements are likely to be missing • make no use of relevant vocabulary
What was in this paper
The subtopics covered by these 5 questions, and how many questions each got. Open one in a new tab to see every Cambridge question on it.
What you needed in this session
Cambridge’s own grade thresholds for 2017 May/June, Paper 2 · Variant 3. A higher threshold means an easier paper — the bar moves with how the cohort did.