Cambridge A Level Environmental Management (AS only) 8291 — 2025 May/June Paper 2 · Variant 2
8291/22/M/J/25 · 4 questions · 80 marks · 105 min
The question paper and its mark scheme, free to read here and free to download. This is Cambridge’s own paper, exactly as it was sat.
Question paper20 pages

Mark scheme16 pages
Answers below. Sit the paper first if you are practising.
Questions as text
Q1 · A questionnaire is used to obtain the opinions of people in different regions on the…
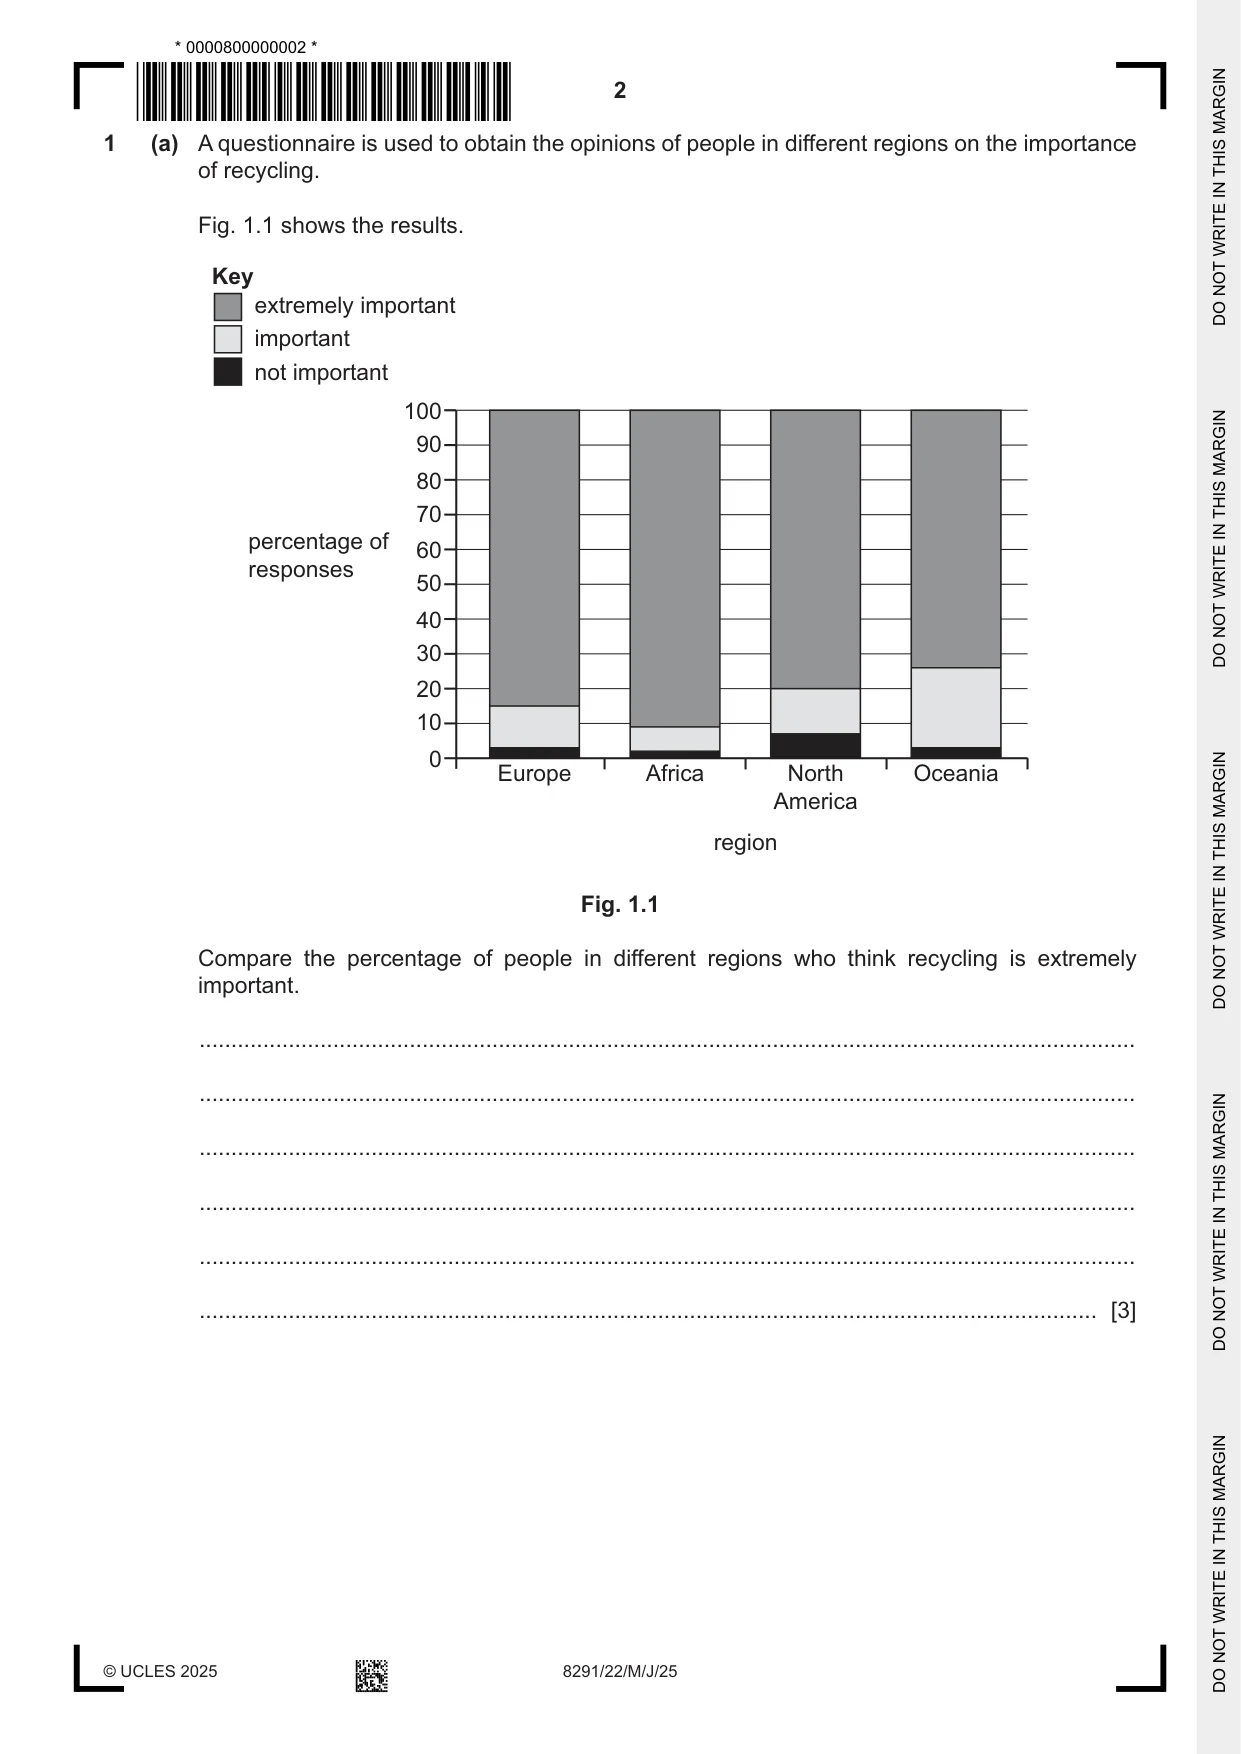
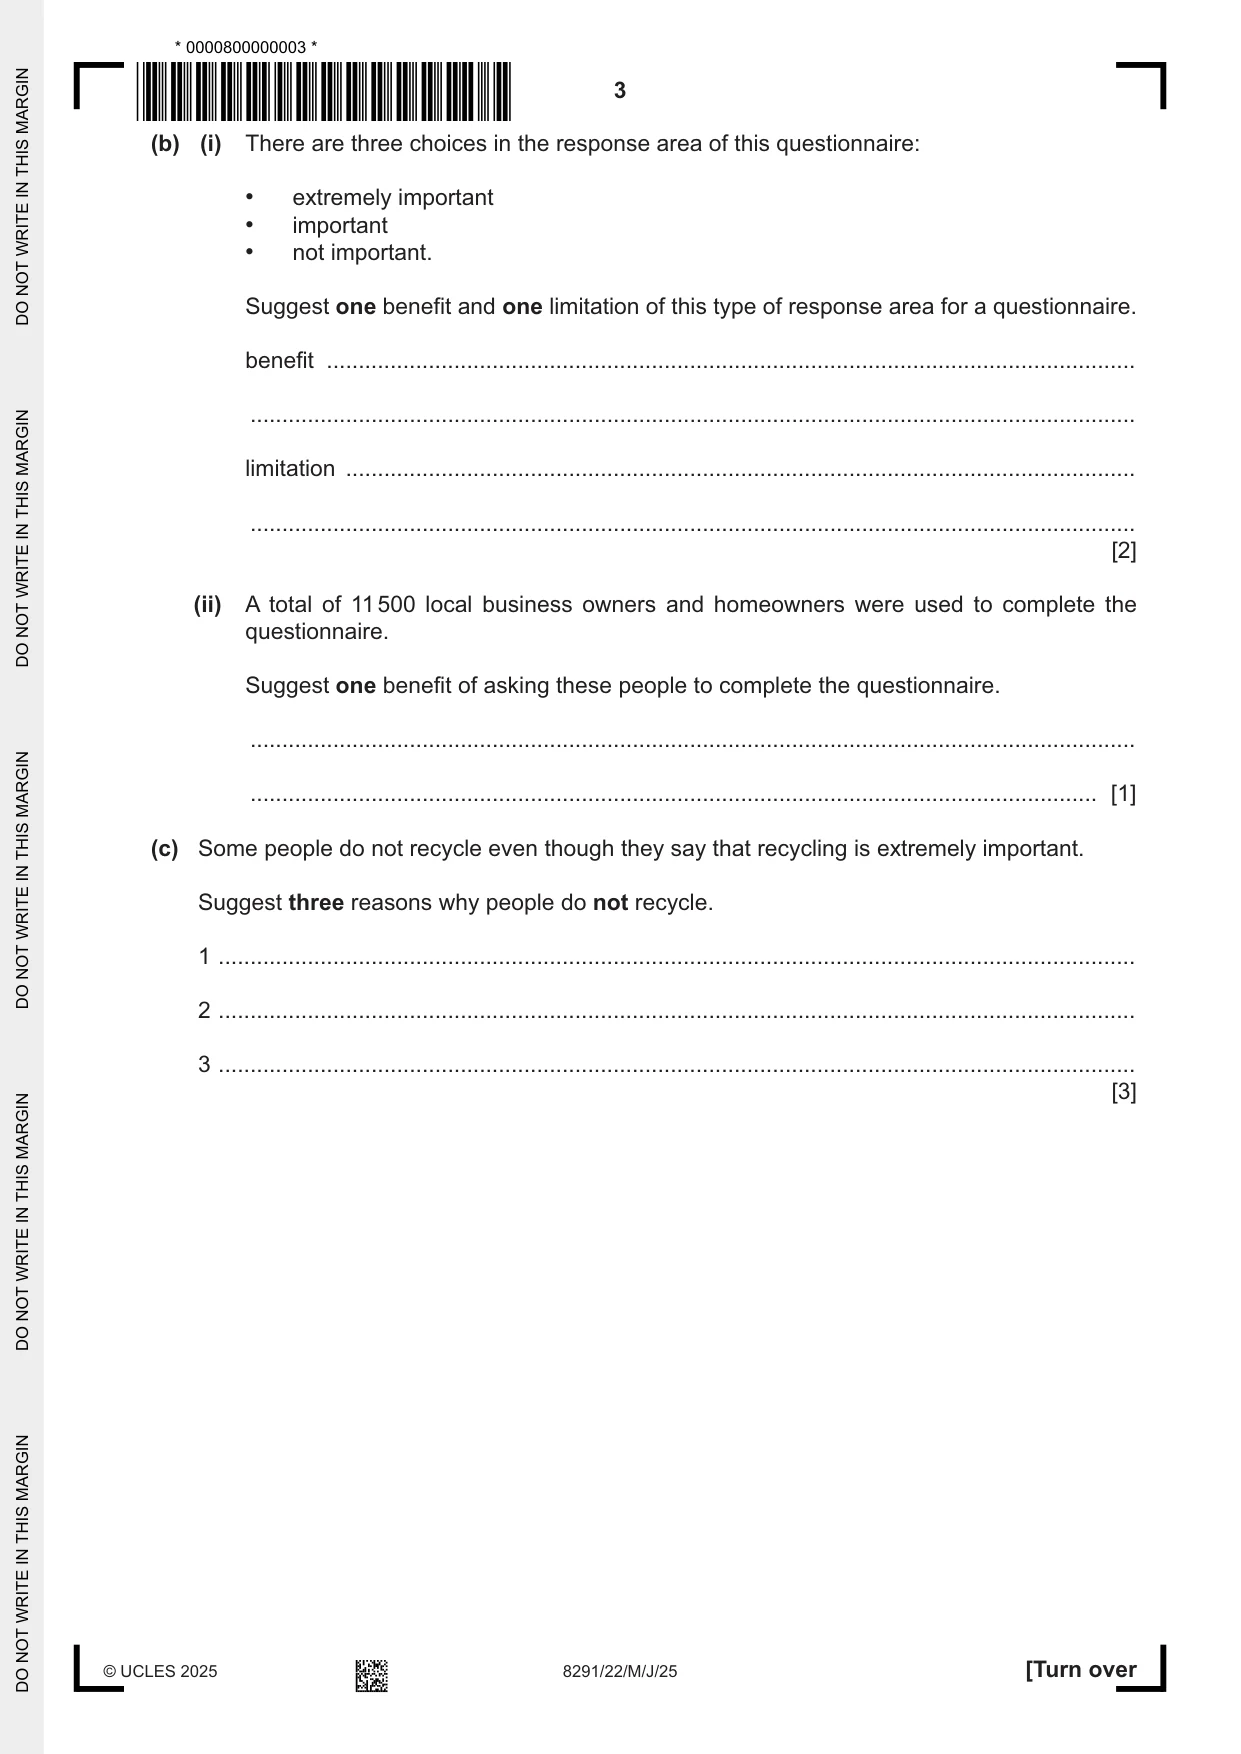
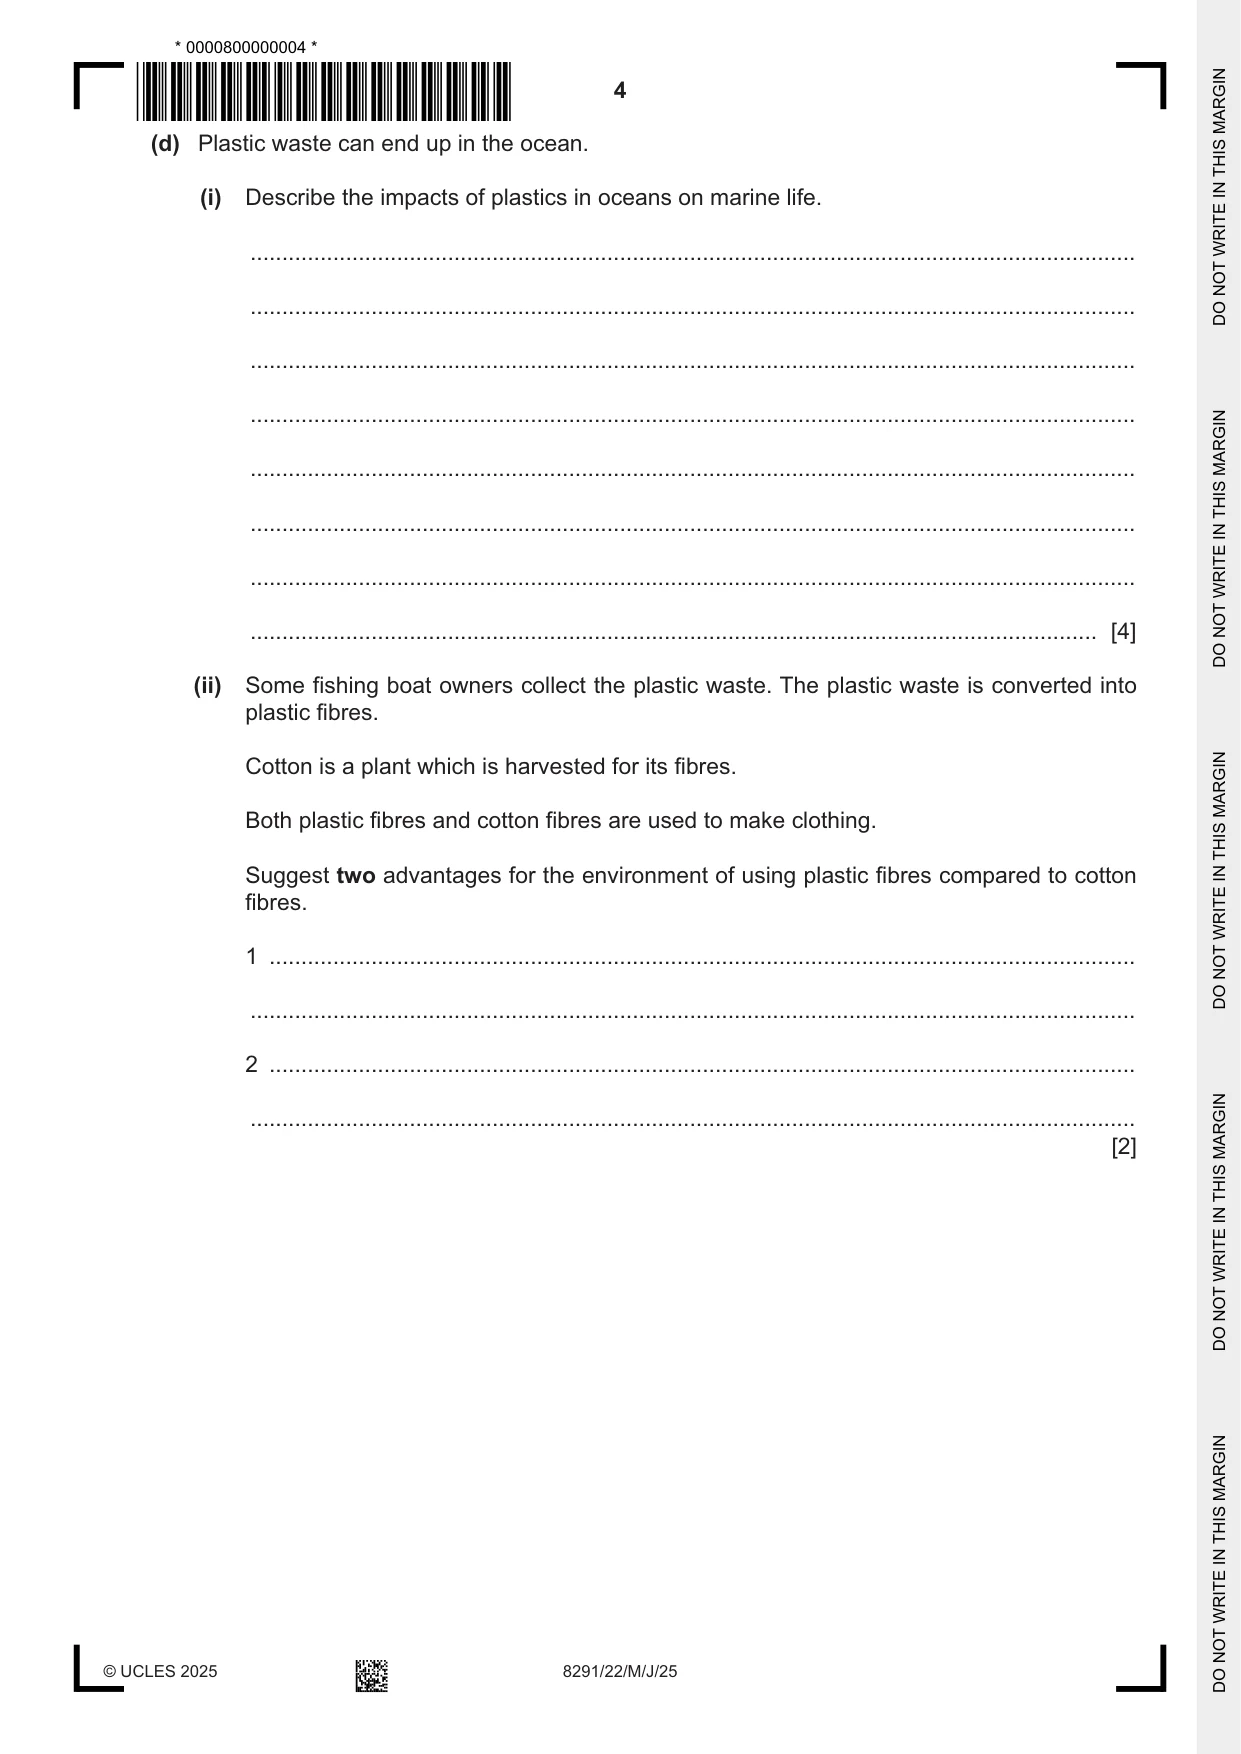
1 (a) A questionnaire is used to obtain the opinions of people in different regions on the importance of recycling. Fig. 1.1 shows the results. Key extremely important important not important 100 90 80 70 percentage of 60 responses 50 40 30 20 10 0 Europe Africa North Oceania America region Fig. 1.1 Compare the percentage of people in different regions who think recycling is extremely important. ................................................................................................................................................... ................................................................................................................................................... ................................................................................................................................................... ................................................................................................................................................... ................................................................................................................................................... ............................................................................................................................................. [3] (b) (i) There are three choices in the response area of this questionnaire: • extremely important • important • not important. Suggest one benefit and one limitation of this type of response area for a questionnaire. benefit ............................................................................................................................... ........................................................................................................................................... limitation ............................................................................................................................ ........................................................................................................................................... [2] (ii) A total of 11 500 local business owners and homeowners were used to complete the questionnaire. Suggest one benefit of asking these people to complete the questionnaire. ........................................................................................................................................... ..................................................................................................................................... [1] (c) Some people do not recycle even though they say that recycling is extremely important. Suggest three reasons why people do not recycle. 1 ................................................................................................................................................ 2 ................................................................................................................................................ 3 ................................................................................................................................................ [3] (d) Plastic waste can end up in the ocean. (i) Describe the impacts of plastics in oceans on marine life. ........................................................................................................................................... ........................................................................................................................................... ........................................................................................................................................... ........................................................................................................................................... ........................................................................................................................................... ........................................................................................................................................... ........................................................................................................................................... ..................................................................................................................................... [4] (ii) Some fishing boat owners collect the plastic waste. The plastic waste is converted into plastic fibres. Cotton is a plant which is harvested for its fibres. Both plastic fibres and cotton fibres are used to make clothing. Suggest two advantages for the environment of using plastic fibres compared to cotton fibres. 1 ........................................................................................................................................ ........................................................................................................................................... 2 ........................................................................................................................................ ........................................................................................................................................... [2] (e) A report states that 25% of plastic waste is incinerated. Describe the benefits and limitations of incineration as a method of plastic waste disposal. benefits ..................................................................................................................................... ................................................................................................................................................... ................................................................................................................................................... ................................................................................................................................................... limitations .................................................................................................................................. ................................................................................................................................................... ................................................................................................................................................... ................................................................................................................................................... [4] [Total: 19]
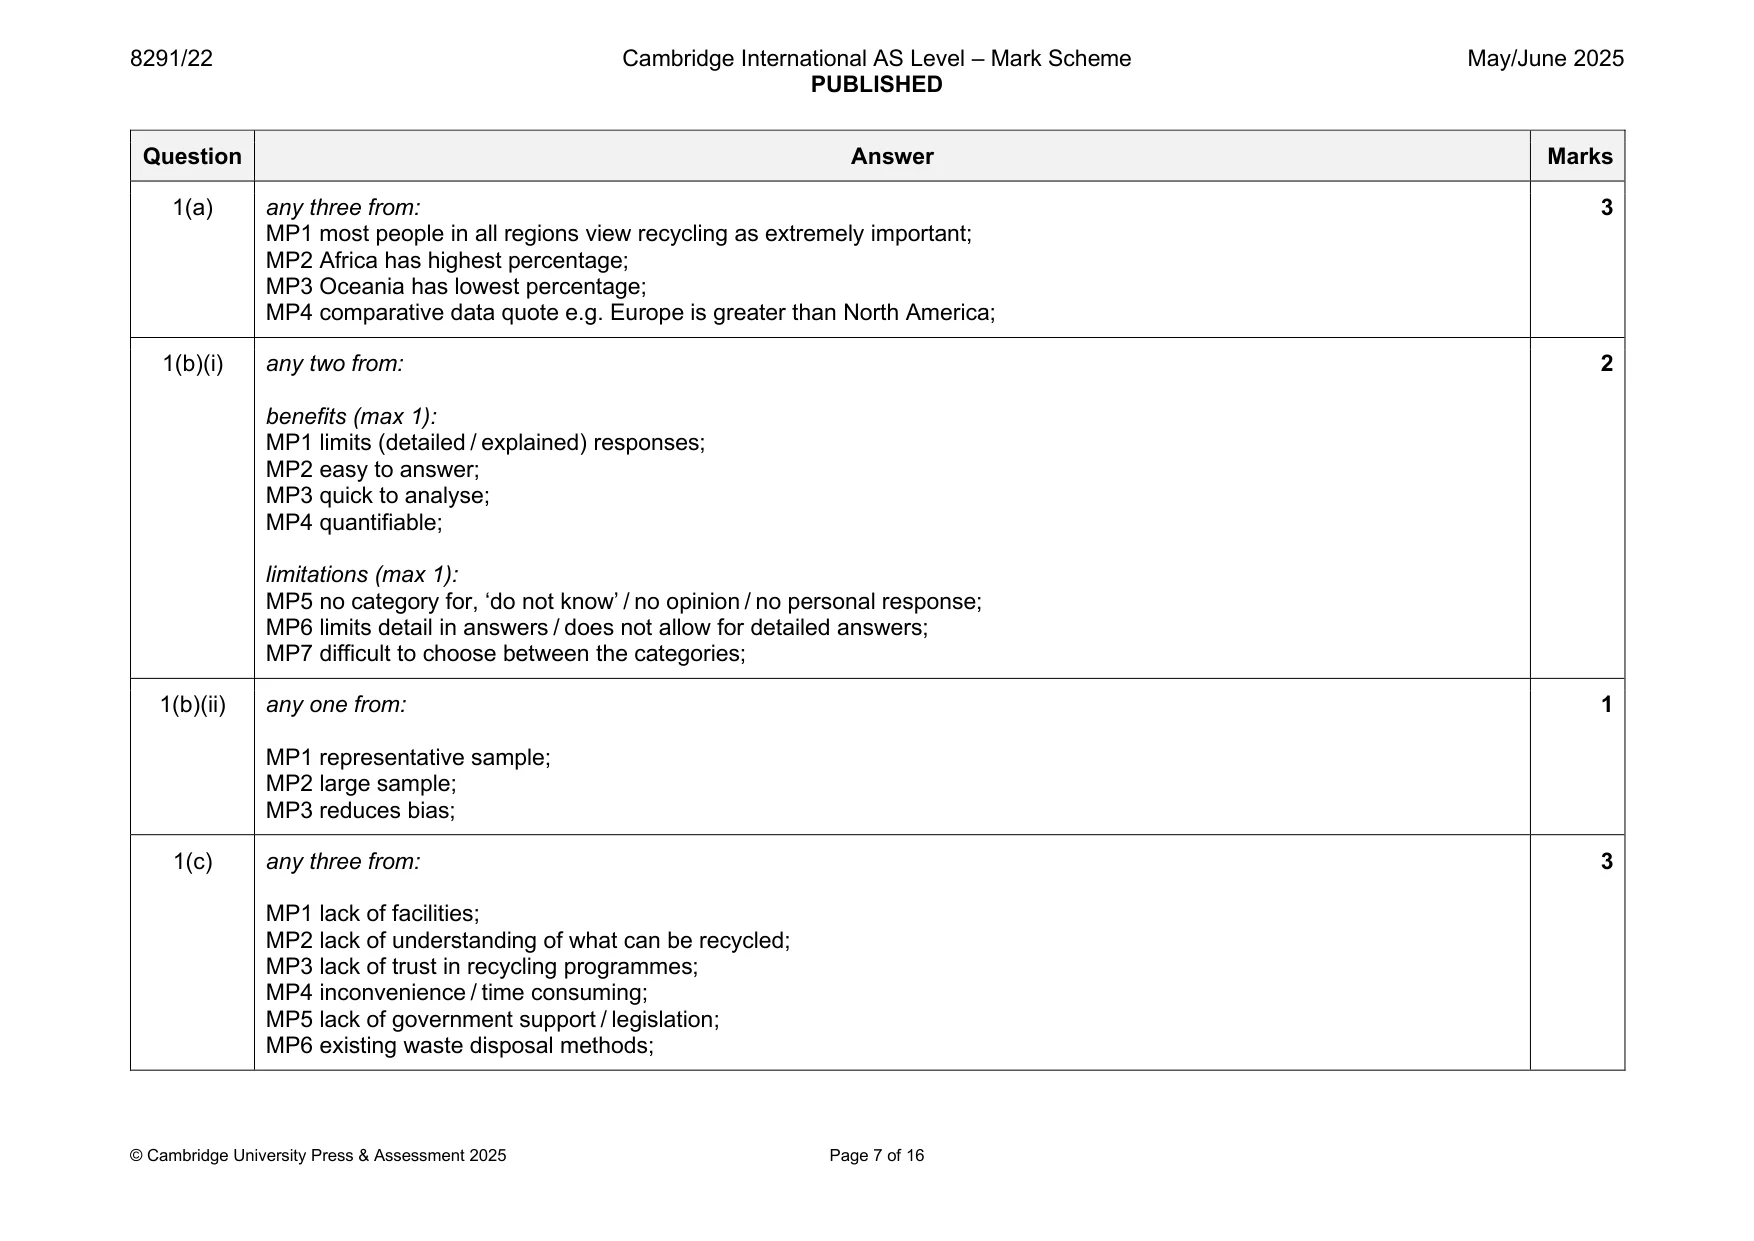
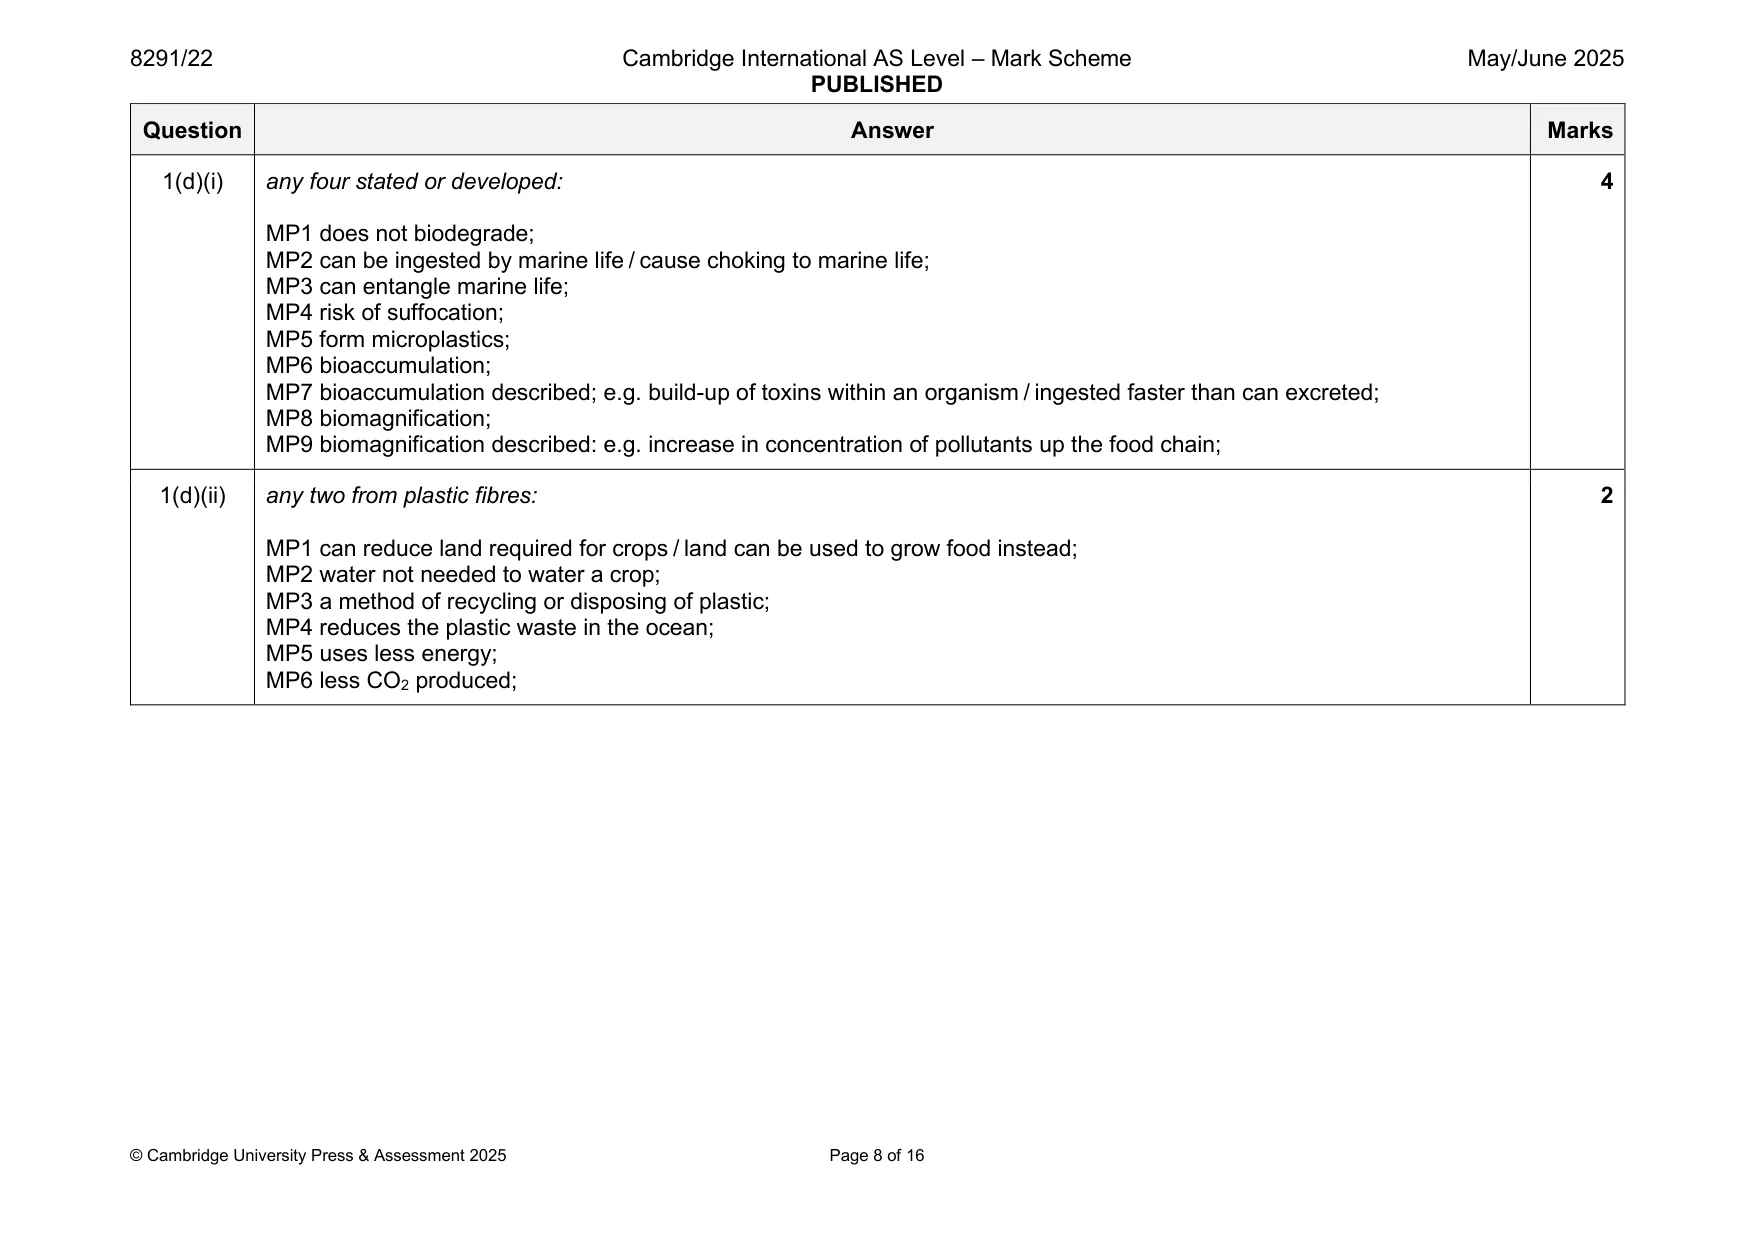
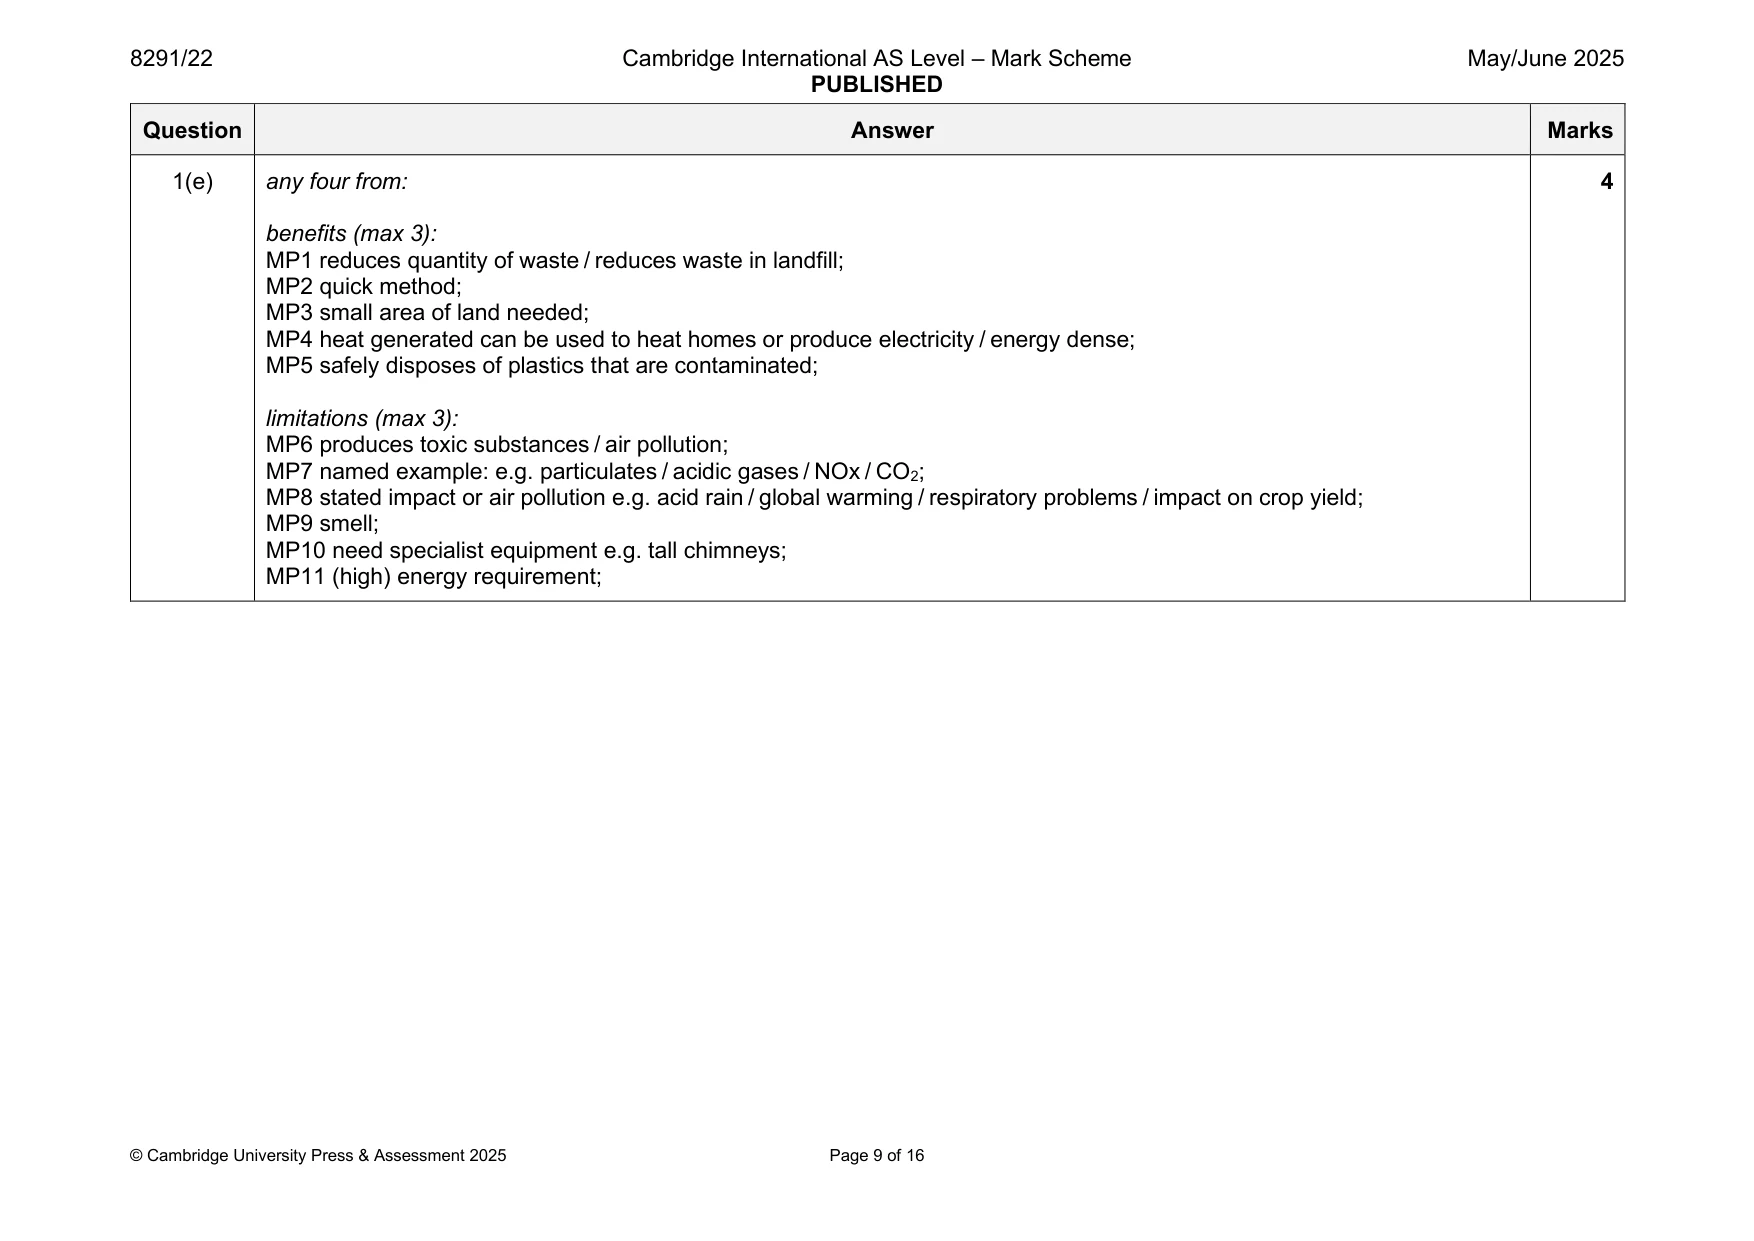
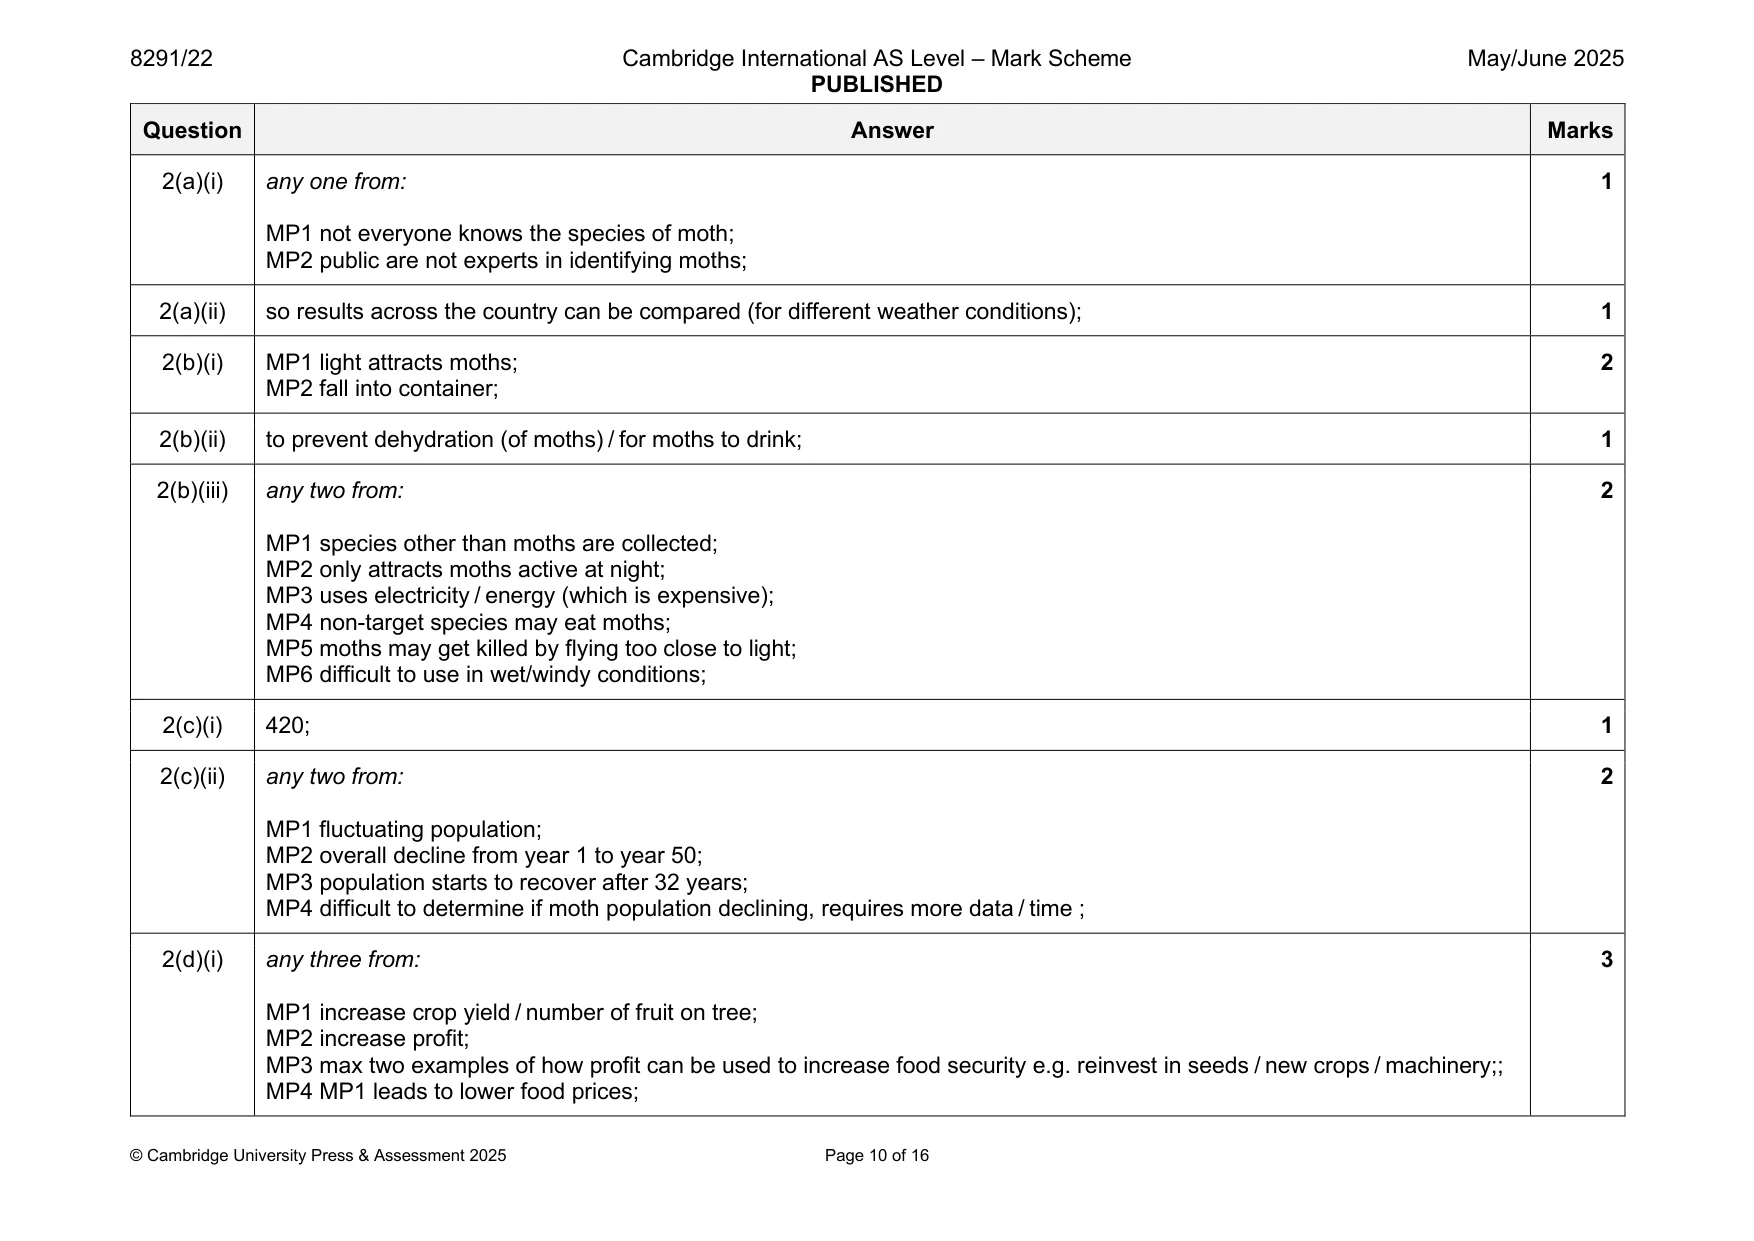
Mark scheme: Question Answer Marks 1(a) any three from: 3 MP1 most people in all regions view recycling as extremely important; MP2 Africa has highest percentage; MP3 Oceania has lowest percentage; MP4 comparative data quote e.g. Europe is greater than North America; 1(b)(i) any two from: 2 benefits (max 1): MP1 limits (detailed / explained) responses; MP2 easy to answer; MP3 quick to analyse; MP4 quantifiable; limitations (max 1): MP5 no category for, ‘do not know’ / no opinion / no personal response; MP6 limits detail in answers / does not allow for detailed answers; MP7 difficult to choose between the categories; 1(b)(ii) any one from: 1 MP1 representative sample; MP2 large sample; MP3 reduces bias; 1(c) any three from: 3 MP1 lack of facilities; MP2 lack of understanding of what can be recycled; MP3 lack of trust in recycling programmes; MP4 inconvenience / time consuming; MP5 lack of government support / legislation; MP6 existing waste disposal methods; 1(d)(i) any four stated or developed: 4 MP1 does not biodegrade; MP2 can be ingested by marine life / cause choking to marine life; MP3 can entangle marine life; MP4 risk of suffocation; MP5 form microplastics; MP6 bioaccumulation; MP7 bioaccumulation described; e.g. build-up of toxins within an organism / ingested faster than can excreted; MP8 biomagnification; MP9 biomagnification described: e.g. increase in concentration of pollutants up the food chain; 1(d)(ii) any two from plastic fibres: 2 MP1 can reduce land required for crops / land can be used to grow food instead; MP2 water not needed to water a crop; MP3 a method of recycling or disposing of plastic; MP4 reduces the plastic waste in the ocean; MP5 uses less energy; MP6 less CO2 produced; 1(e) any four from: 4 benefits (max 3): MP1 reduces quantity of waste / reduces waste in landfill; MP2 quick method; MP3 small area of land needed; MP4 heat generated can be used to heat homes or produce electricity / energy dense; MP5 safely disposes of plastics that are contaminated; limitations (max 3): MP6 produces toxic substances / air pollution; MP7 named example: e.g. particulates / acidic gases / NOx / CO2; MP8 stated impact or air pollution e.g. acid rain / global warming / respiratory problems / impact on crop yield; MP9 smell; MP10 need specialist equipment e.g. tall chimneys; MP11 (high) energy requirement;
Q2 · A ghost swift moth
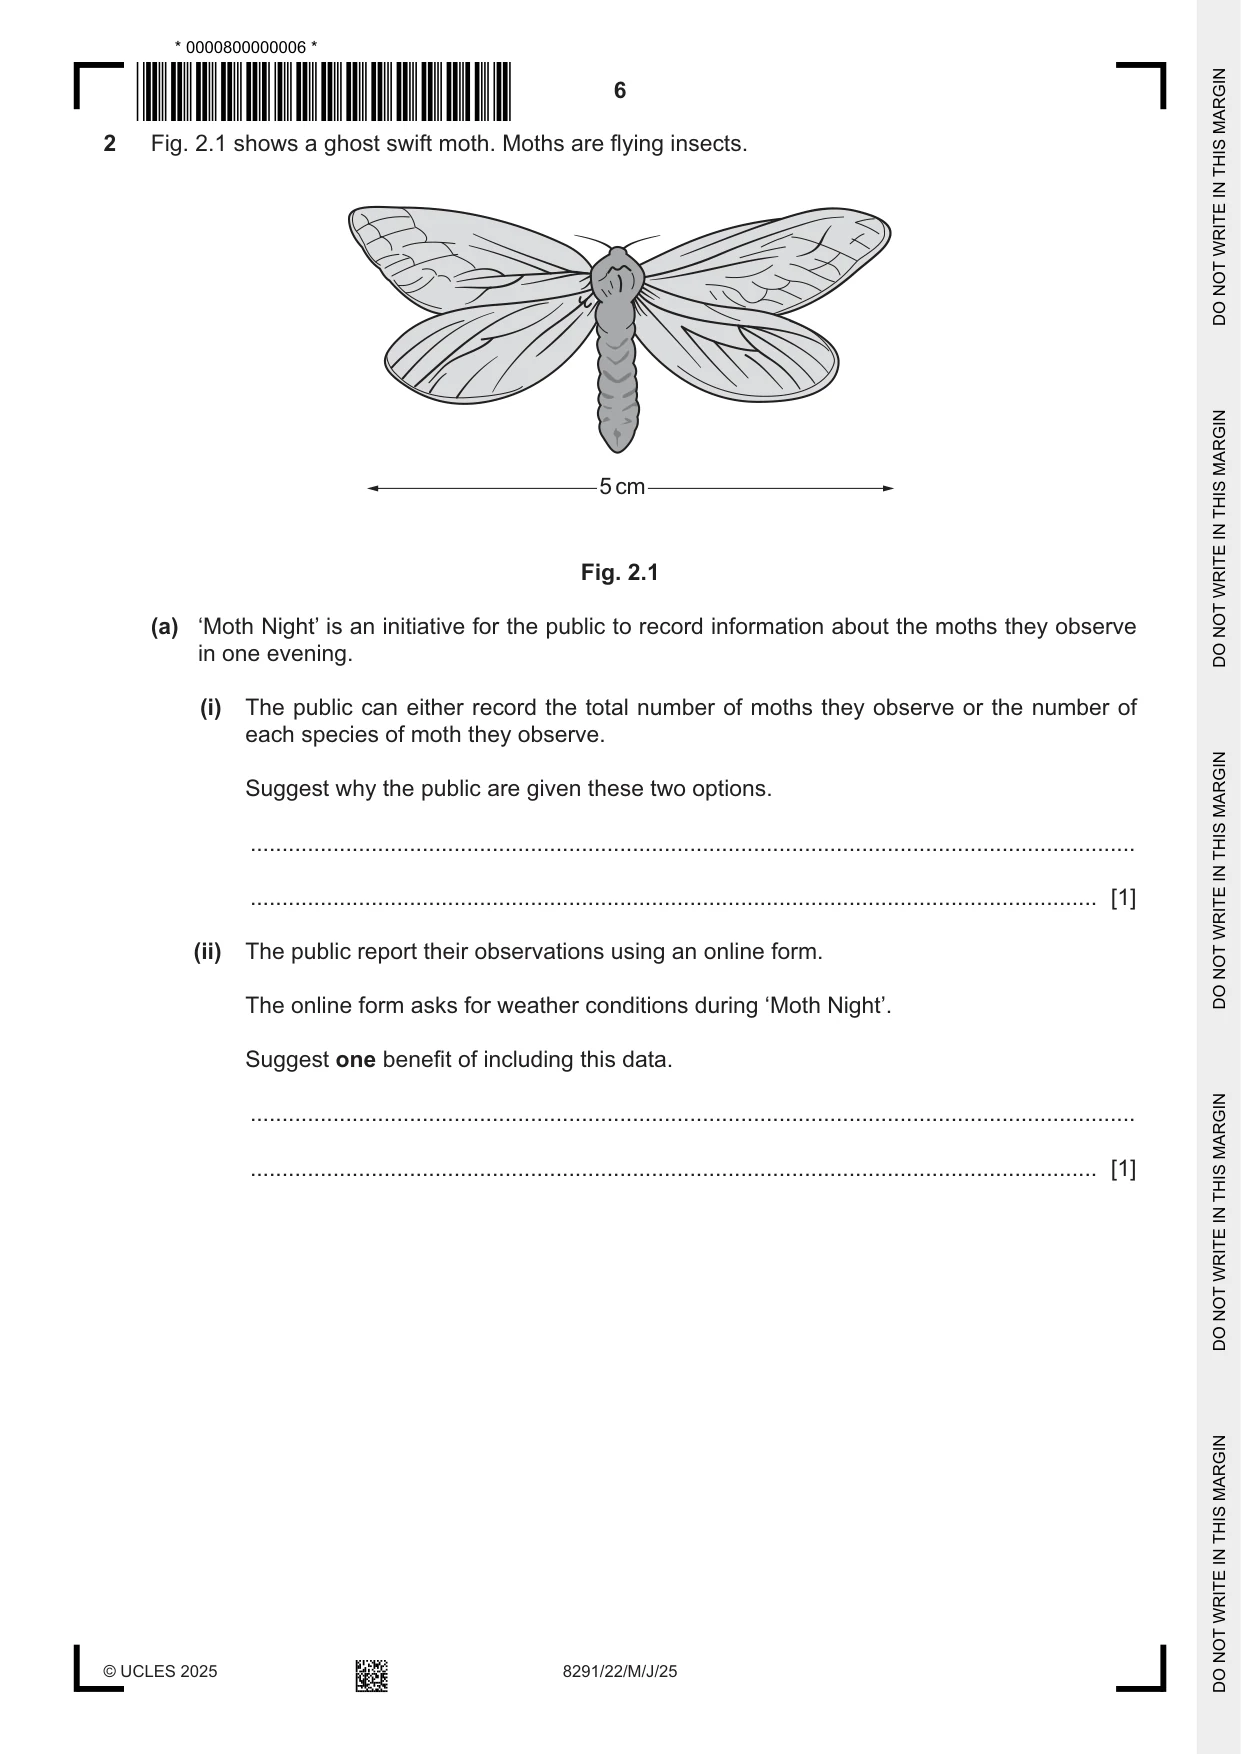
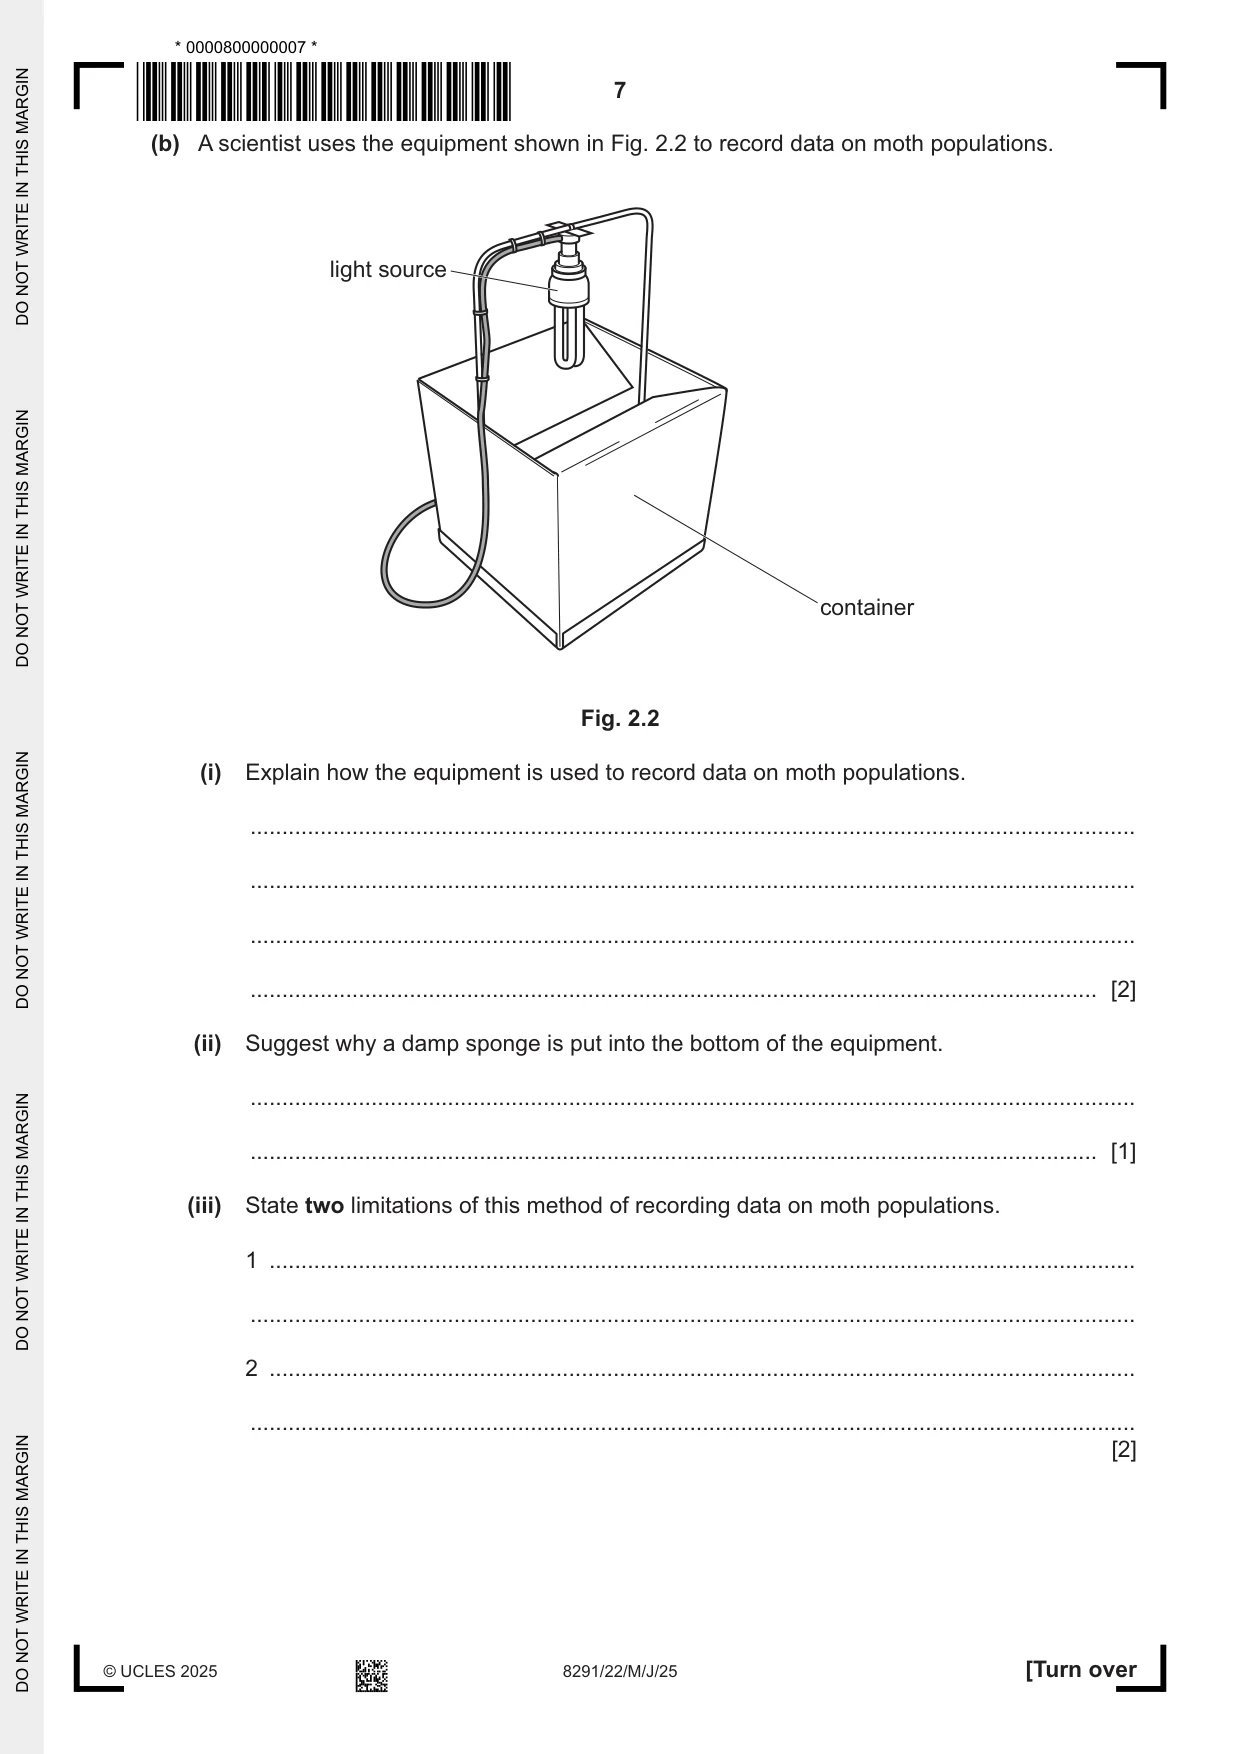
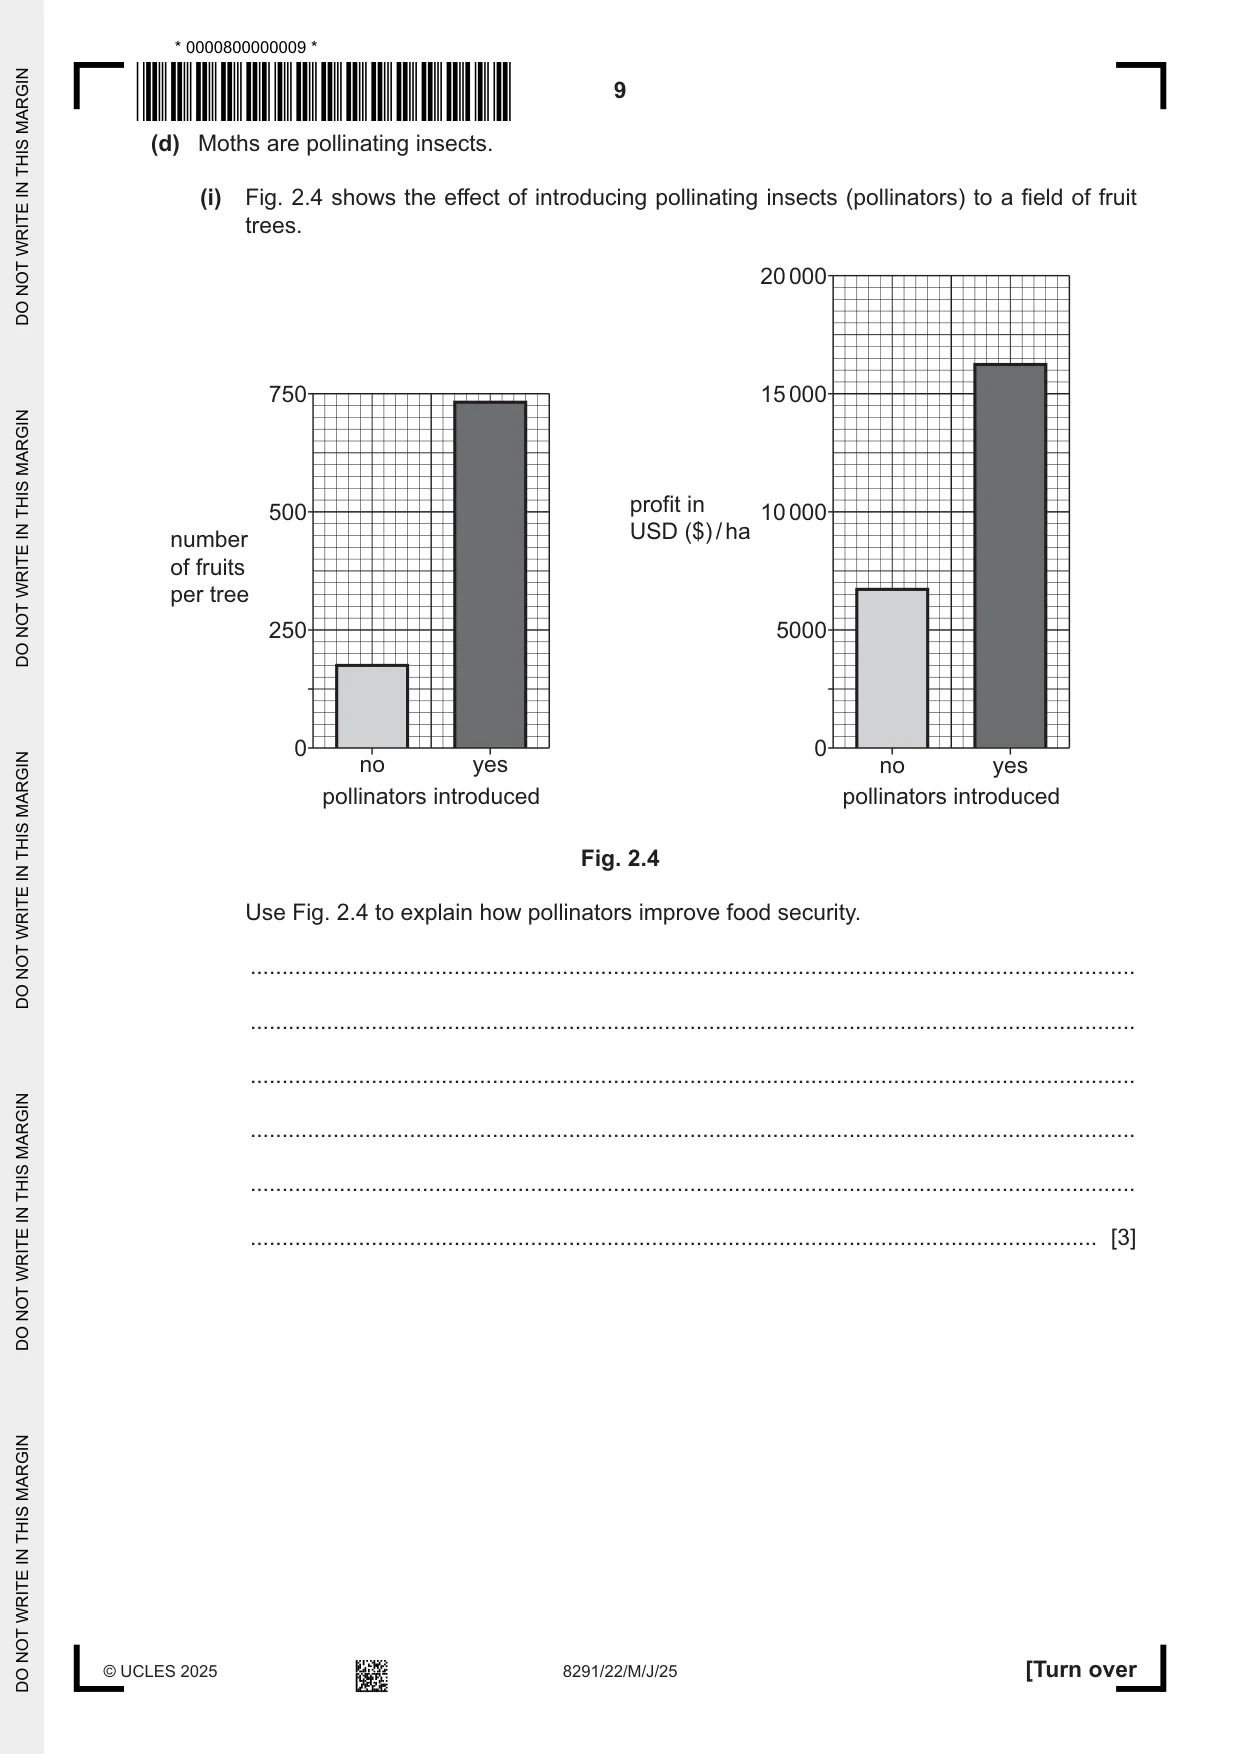
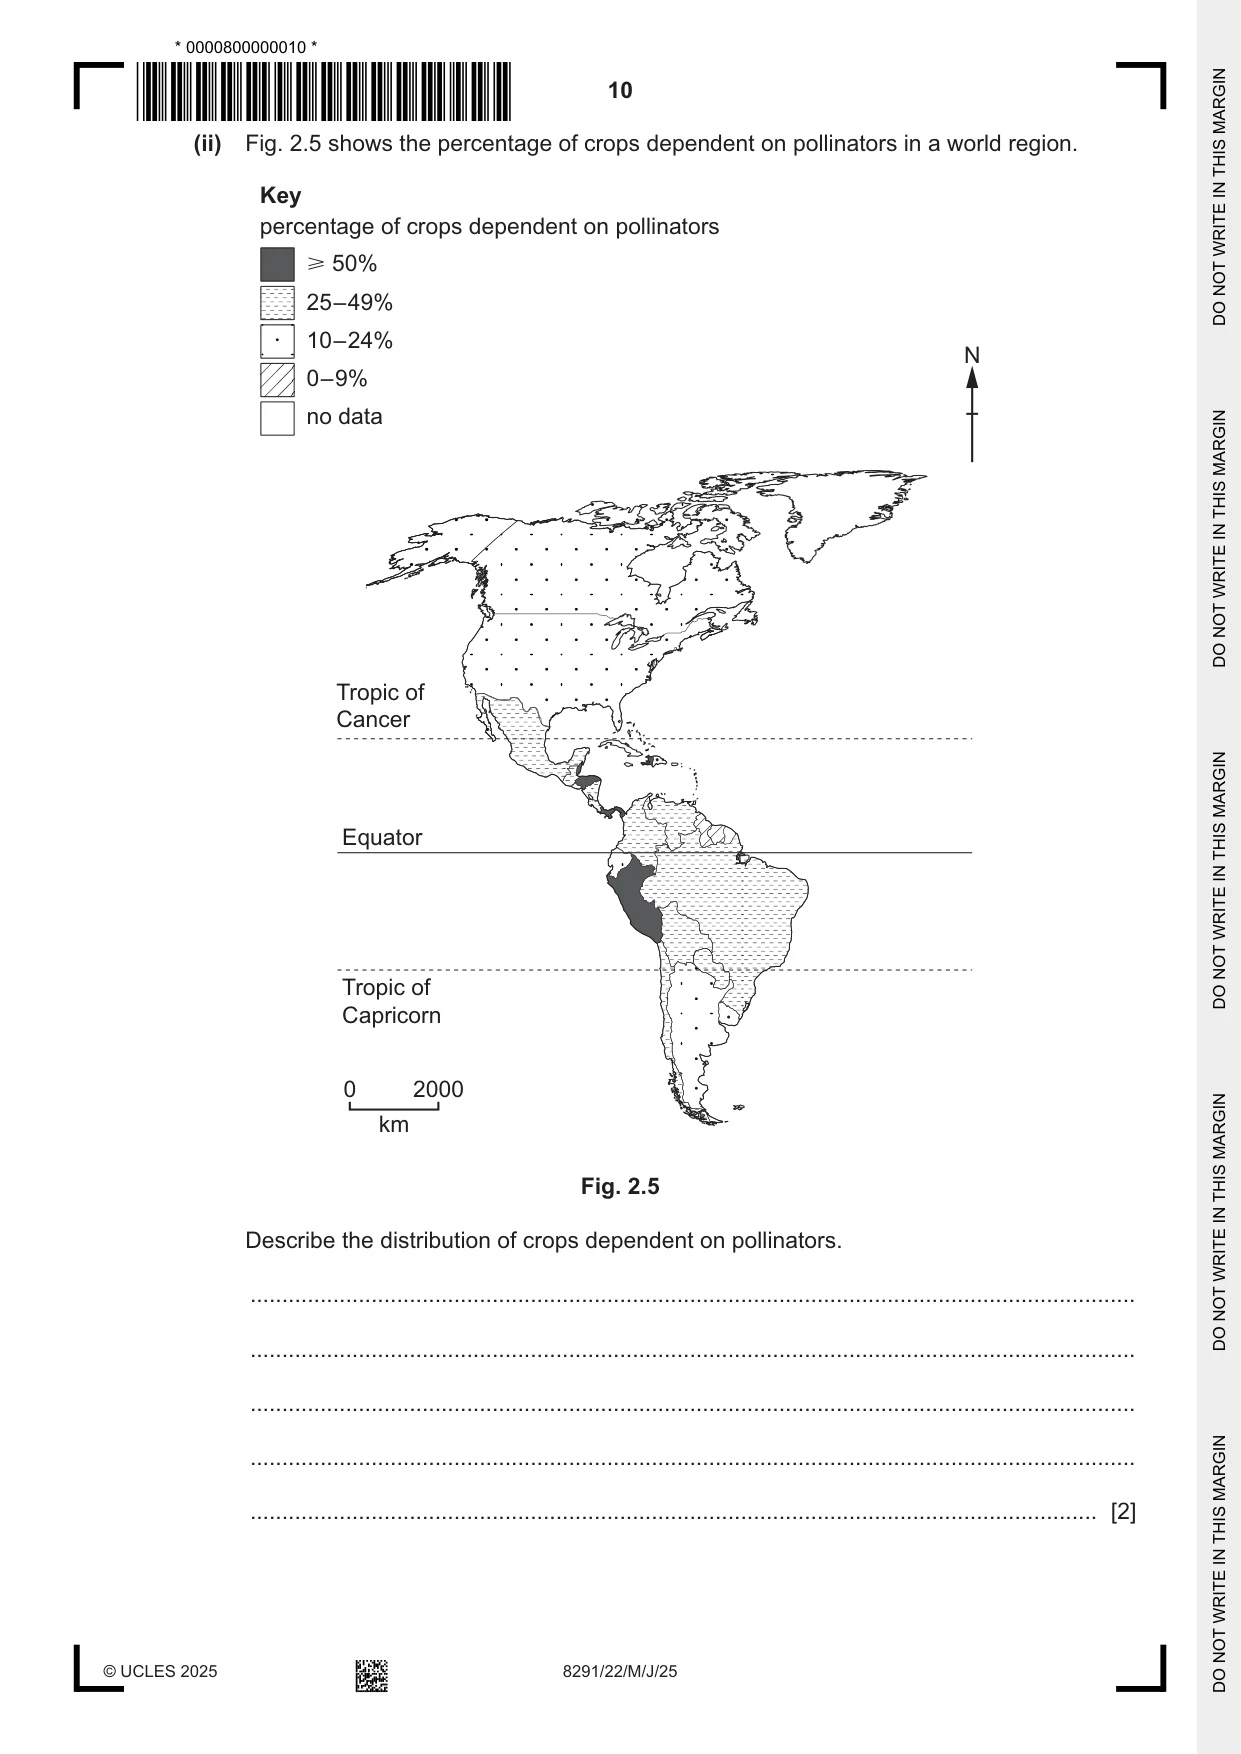
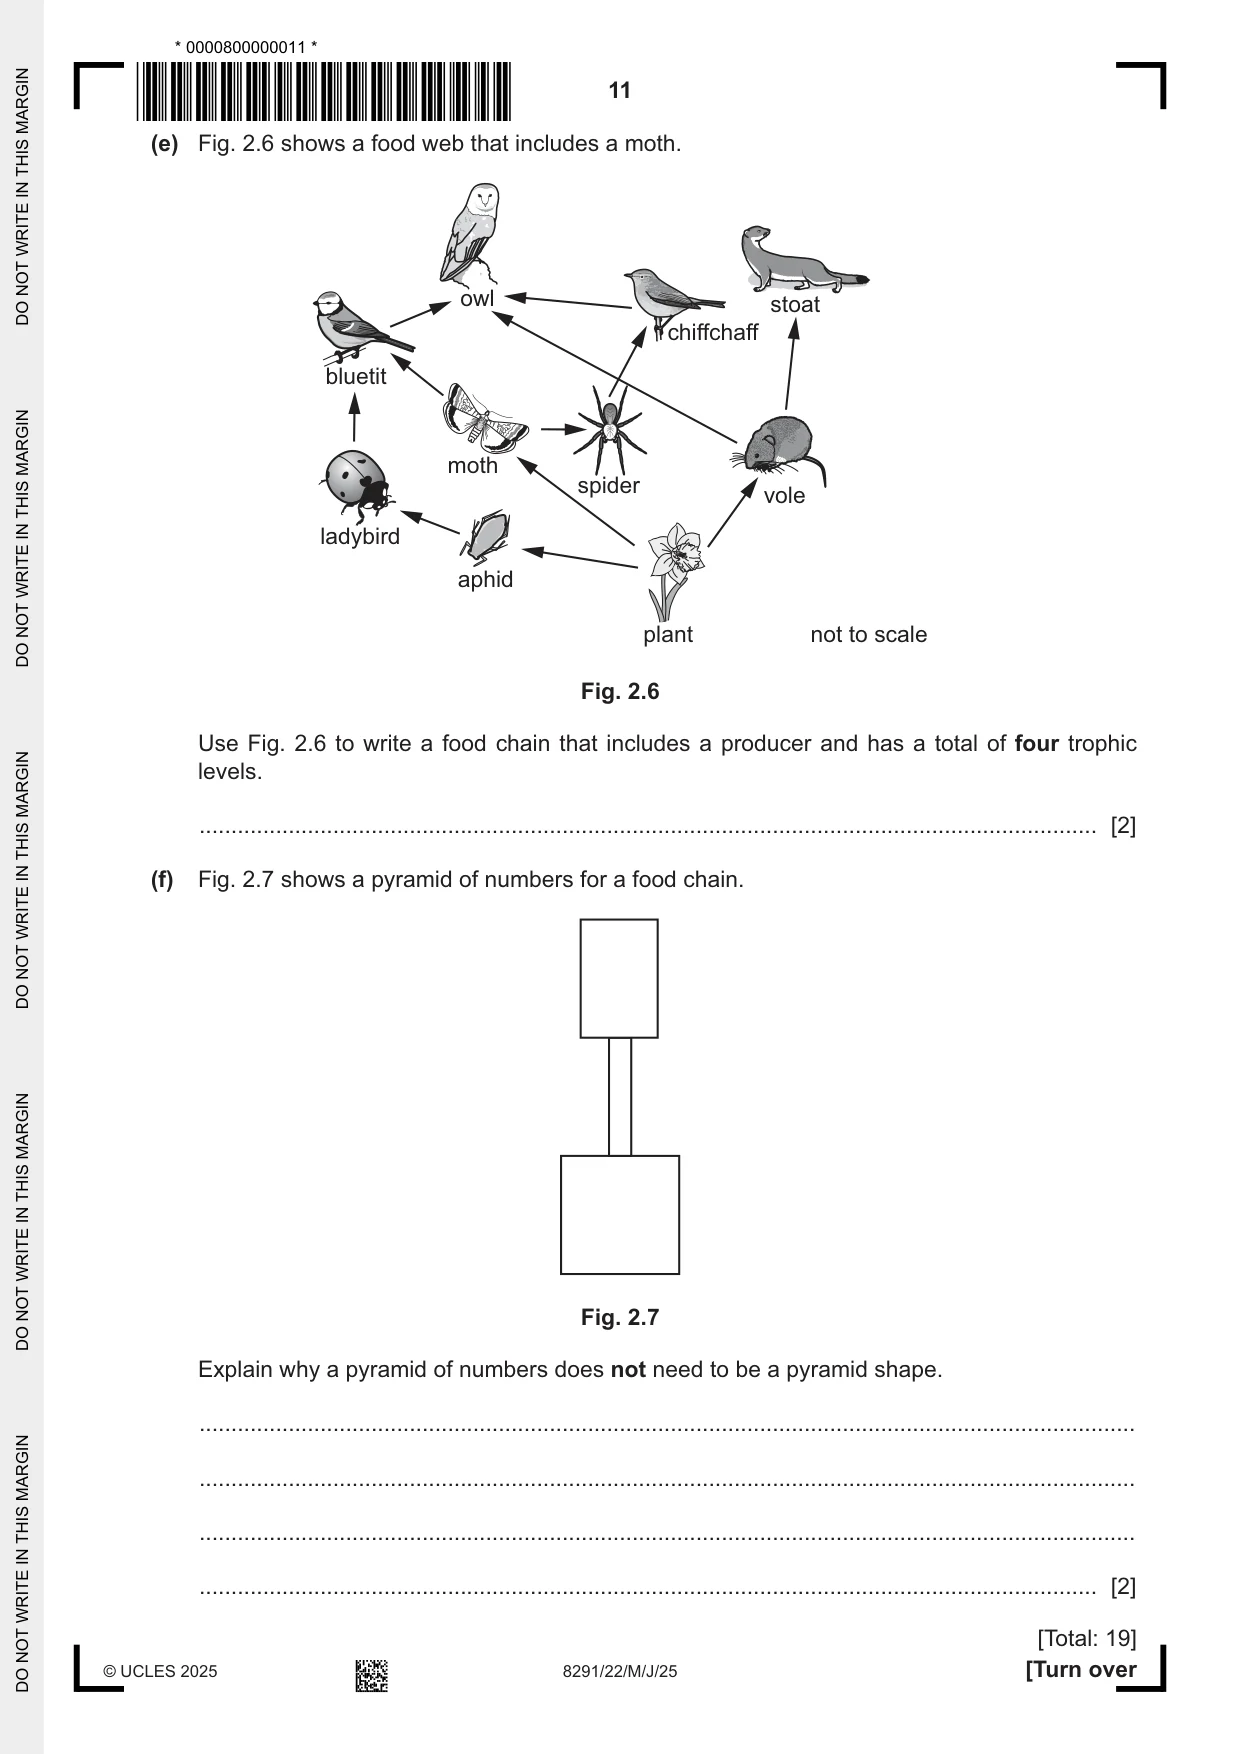
2 Fig. 2.1 shows a ghost swift moth. Moths are flying insects. 5 cm Fig. 2.1 (a) ‘Moth Night’ is an initiative for the public to record information about the moths they observe in one evening. (i) The public can either record the total number of moths they observe or the number of each species of moth they observe. Suggest why the public are given these two options. ........................................................................................................................................... ..................................................................................................................................... [1] (ii) The public report their observations using an online form. The online form asks for weather conditions during ‘Moth Night’. Suggest one benefit of including this data. ........................................................................................................................................... ..................................................................................................................................... [1] (b) A scientist uses the equipment shown in Fig. 2.2 to record data on moth populations. light source container Fig. 2.2 (i) Explain how the equipment is used to record data on moth populations. ........................................................................................................................................... ........................................................................................................................................... ........................................................................................................................................... ..................................................................................................................................... [2] (ii) Suggest why a damp sponge is put into the bottom of the equipment. ........................................................................................................................................... ..................................................................................................................................... [1] (iii) State two limitations of this method of recording data on moth populations. 1 ........................................................................................................................................ ........................................................................................................................................... 2 ........................................................................................................................................ ........................................................................................................................................... [2] (c) The scientist uses the equipment in (b) to record the number of ghost swift moths collected over a 50-year period. Fig. 2.3 shows the results. Content removed due to copyright restrictions. Fig. 2.3 (i) State the range for the number of moths collected. range = ......................................................... [1] (ii) Use Fig. 2.3 to write two conclusions about the ghost swift moth population. 1 ........................................................................................................................................ ........................................................................................................................................... 2 ........................................................................................................................................ ........................................................................................................................................... [2] (d) Moths are pollinating insects. (i) Fig. 2.4 shows the effect of introducing pollinating insects (pollinators) to a field of fruit trees. 20 000 750 15 000 profit in 500 10 000 USD ($) / ha number of fruits per tree 250 5000 0 0 no yes no yes pollinators introduced pollinators introduced Fig. 2.4 Use Fig. 2.4 to explain how pollinators improve food security. ........................................................................................................................................... ........................................................................................................................................... ........................................................................................................................................... ........................................................................................................................................... ........................................................................................................................................... ..................................................................................................................................... [3] (ii) Fig. 2.5 shows the percentage of crops dependent on pollinators in a world region. Key percentage of crops dependent on pollinators > 50% 25 – 49% 10 – 24% N 0 – 9% no data Tropic of Cancer Equator Tropic of Capricorn 0 2000 km Fig. 2.5 Describe the distribution of crops dependent on pollinators. ........................................................................................................................................... ........................................................................................................................................... ........................................................................................................................................... ........................................................................................................................................... ..................................................................................................................................... [2] (e) Fig. 2.6 shows a food web that includes a moth. owl stoat chiffchaff bluetit moth spider vole ladybird aphid plant not to scale Fig. 2.6 Use Fig. 2.6 to write a food chain that includes a producer and has a total of four trophic levels. ............................................................................................................................................. [2] (f) Fig. 2.7 shows a pyramid of numbers for a food chain. Fig. 2.7 Explain why a pyramid of numbers does not need to be a pyramid shape. ................................................................................................................................................... ................................................................................................................................................... ................................................................................................................................................... ............................................................................................................................................. [2] [Total: 19]
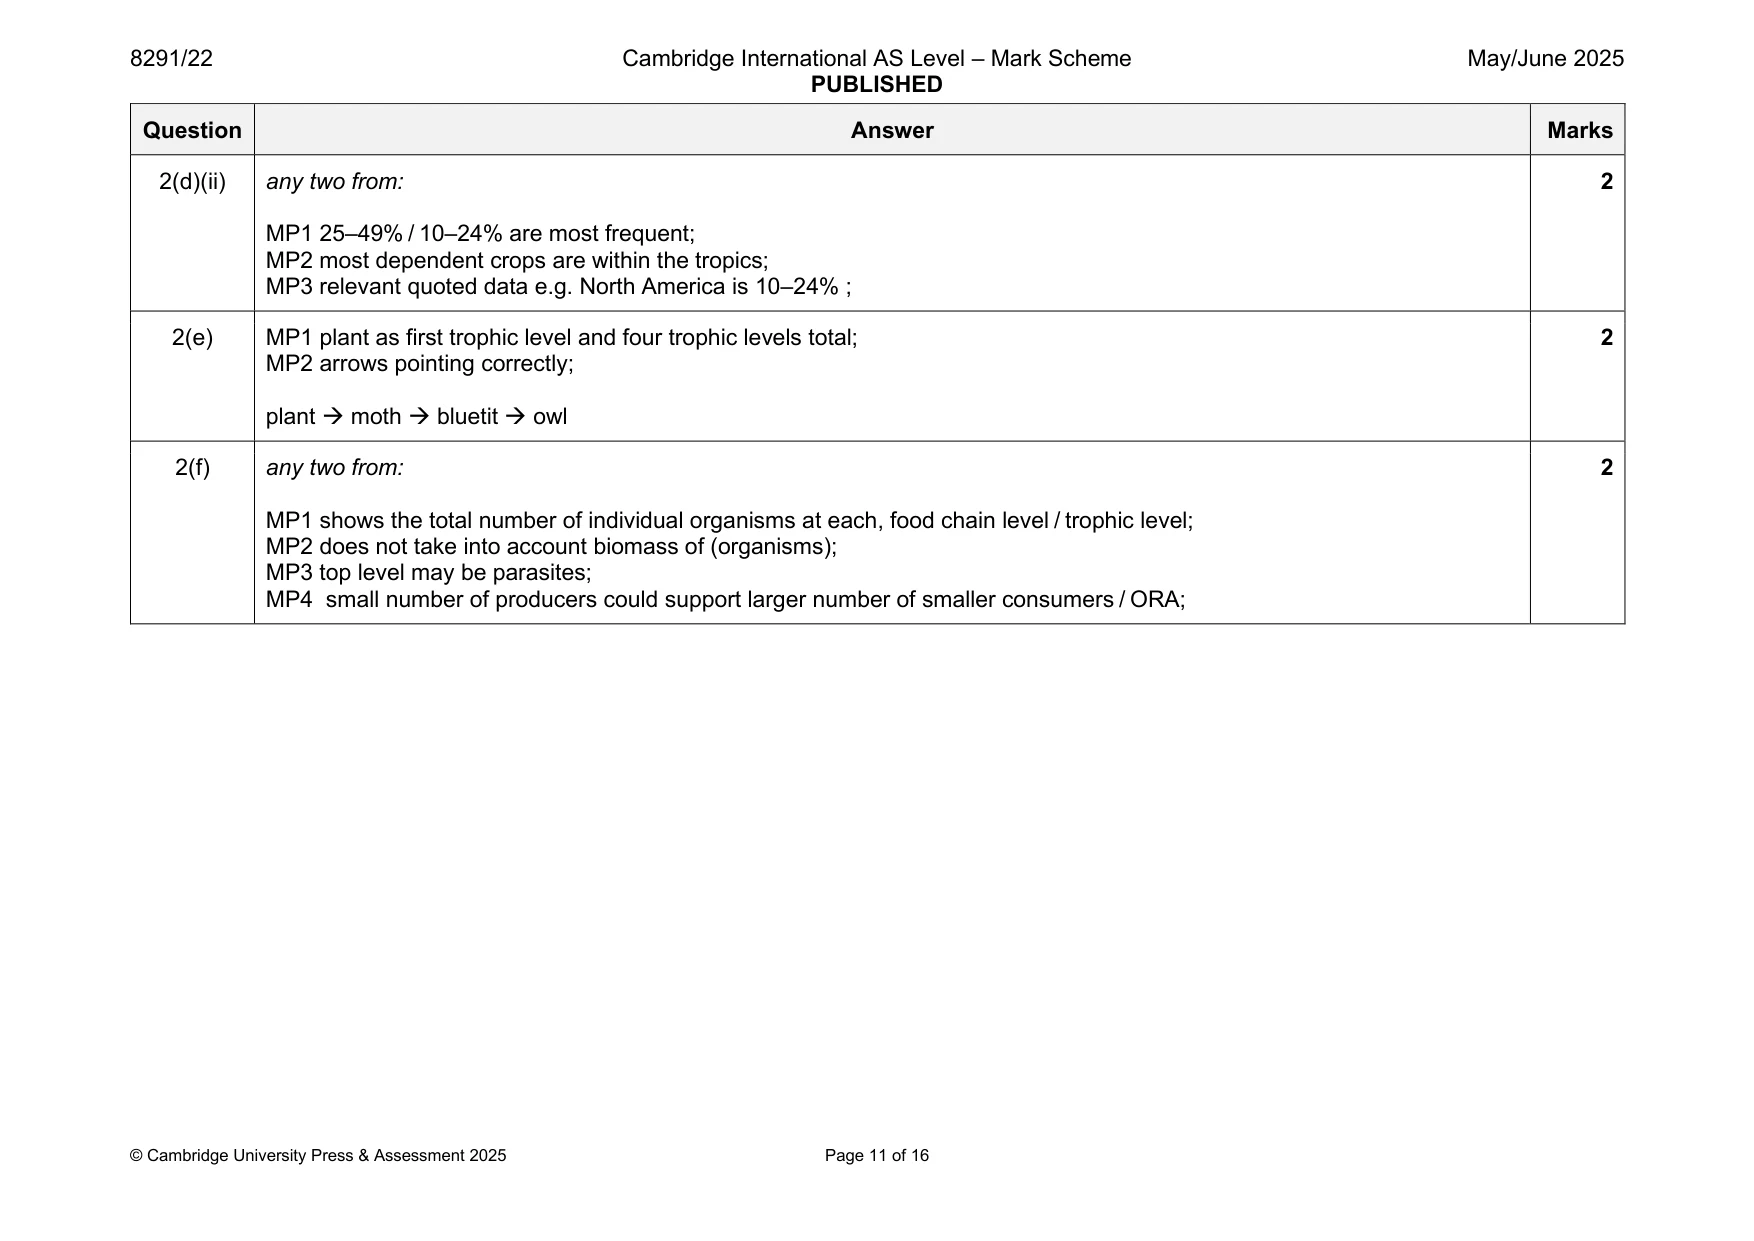
Mark scheme: 2(a)(i) any one from: 1 MP1 not everyone knows the species of moth; MP2 public are not experts in identifying moths; 2(a)(ii) so results across the country can be compared (for different weather conditions); 1 2(b)(i) MP1 light attracts moths; 2 MP2 fall into container; 2(b)(ii) to prevent dehydration (of moths) / for moths to drink; 1 2(b)(iii) any two from: 2 MP1 species other than moths are collected; MP2 only attracts moths active at night; MP3 uses electricity / energy (which is expensive); MP4 non-target species may eat moths; MP5 moths may get killed by flying too close to light; MP6 difficult to use in wet/windy conditions; 2(c)(i) 420; 1 2(c)(ii) any two from: 2 MP1 fluctuating population; MP2 overall decline from year 1 to year 50; MP3 population starts to recover after 32 years; MP4 difficult to determine if moth population declining, requires more data / time ; 2(d)(i) any three from: 3 MP1 increase crop yield / number of fruit on tree; MP2 increase profit; MP3 max two examples of how profit can be used to increase food security e.g. reinvest in seeds / new crops / machinery;; MP4 MP1 leads to lower food prices; 2(d)(ii) any two from: 2 MP1 25–49% / 10–24% are most frequent; MP2 most dependent crops are within the tropics; MP3 relevant quoted data e.g. North America is 10–24% ; 2(e) MP1 plant as first trophic level and four trophic levels total; 2 MP2 arrows pointing correctly; plant → moth → bluetit → owl 2(f) any two from: 2 MP1 shows the total number of individual organisms at each, food chain level / trophic level; MP2 does not take into account biomass of (organisms); MP3 top level may be parasites; MP4 small number of producers could support larger number of smaller consumers / ORA;
More questions on Data collection techniques and data analysis
Q3 · An increase in wild fires is an impact of climate change
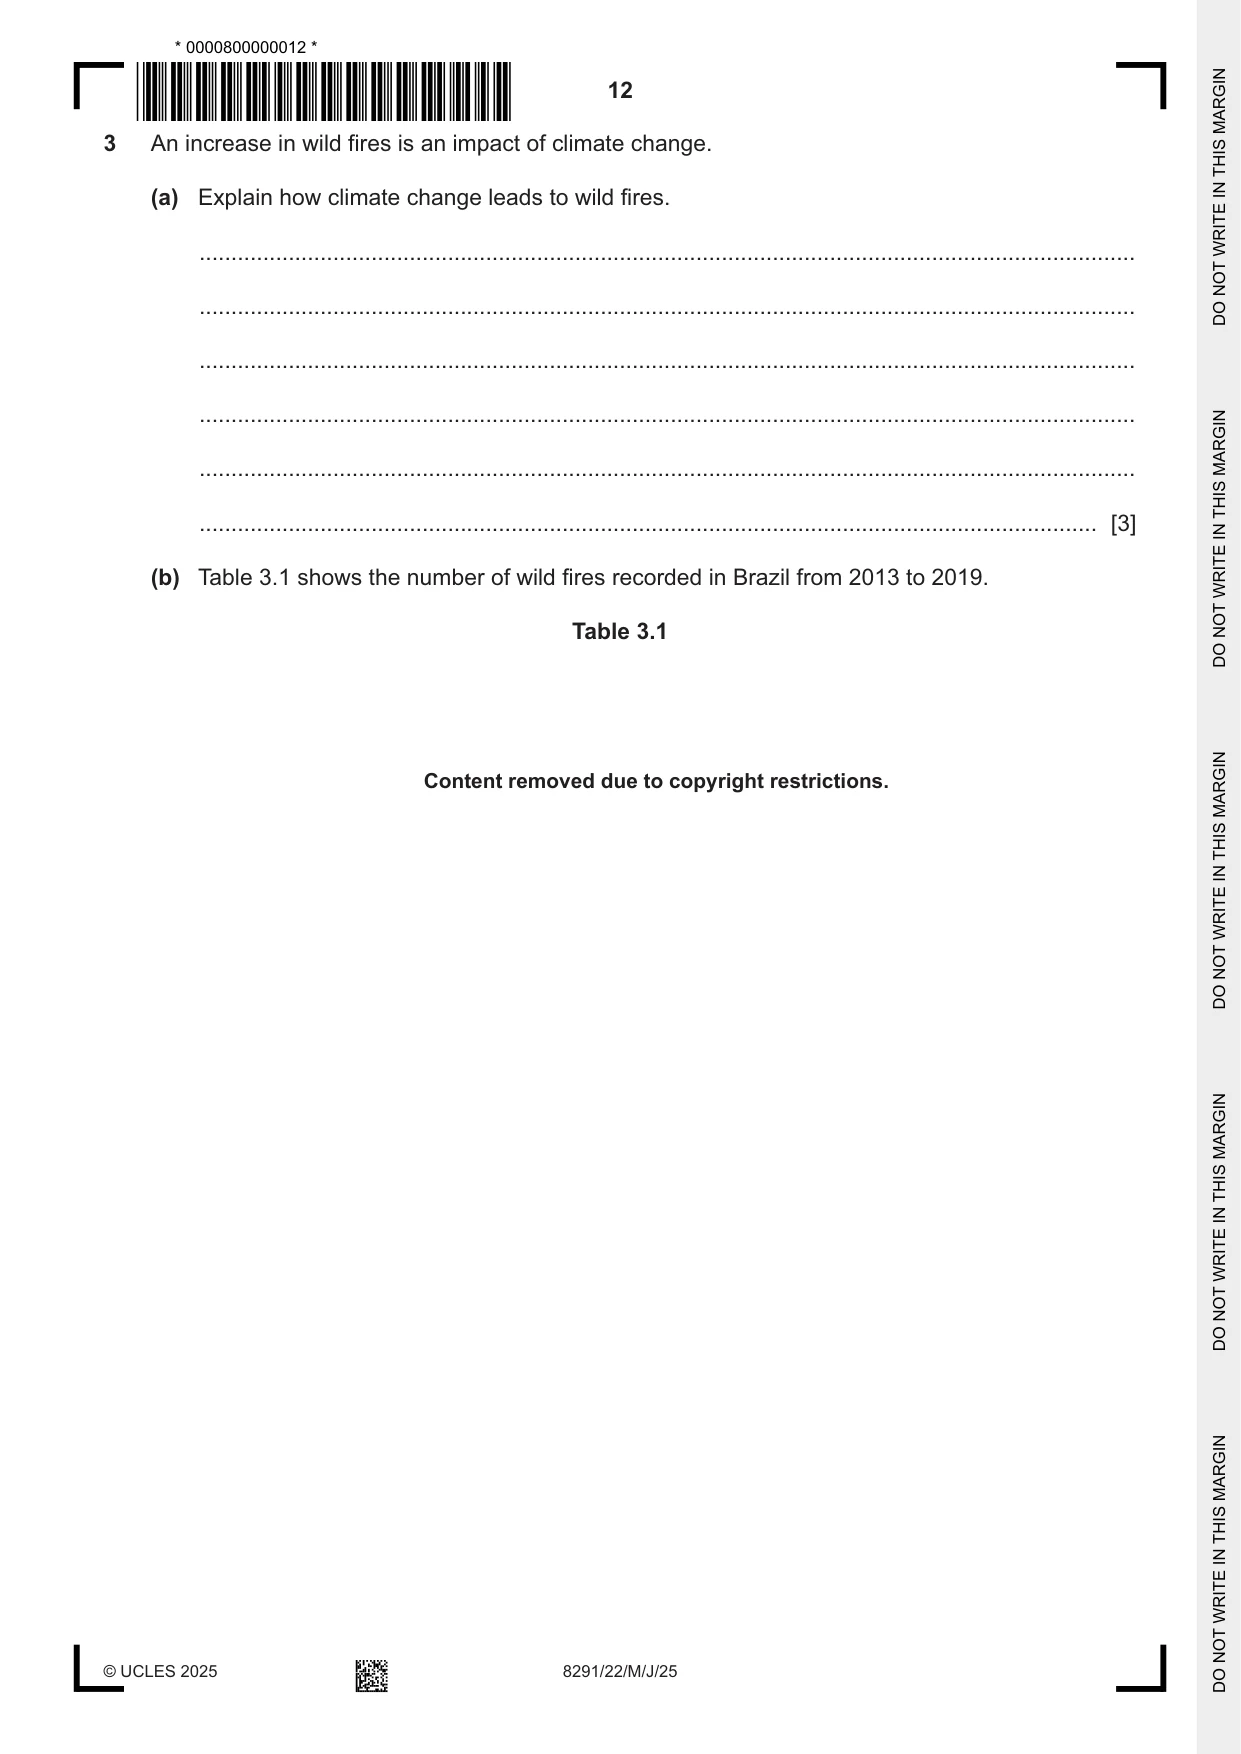
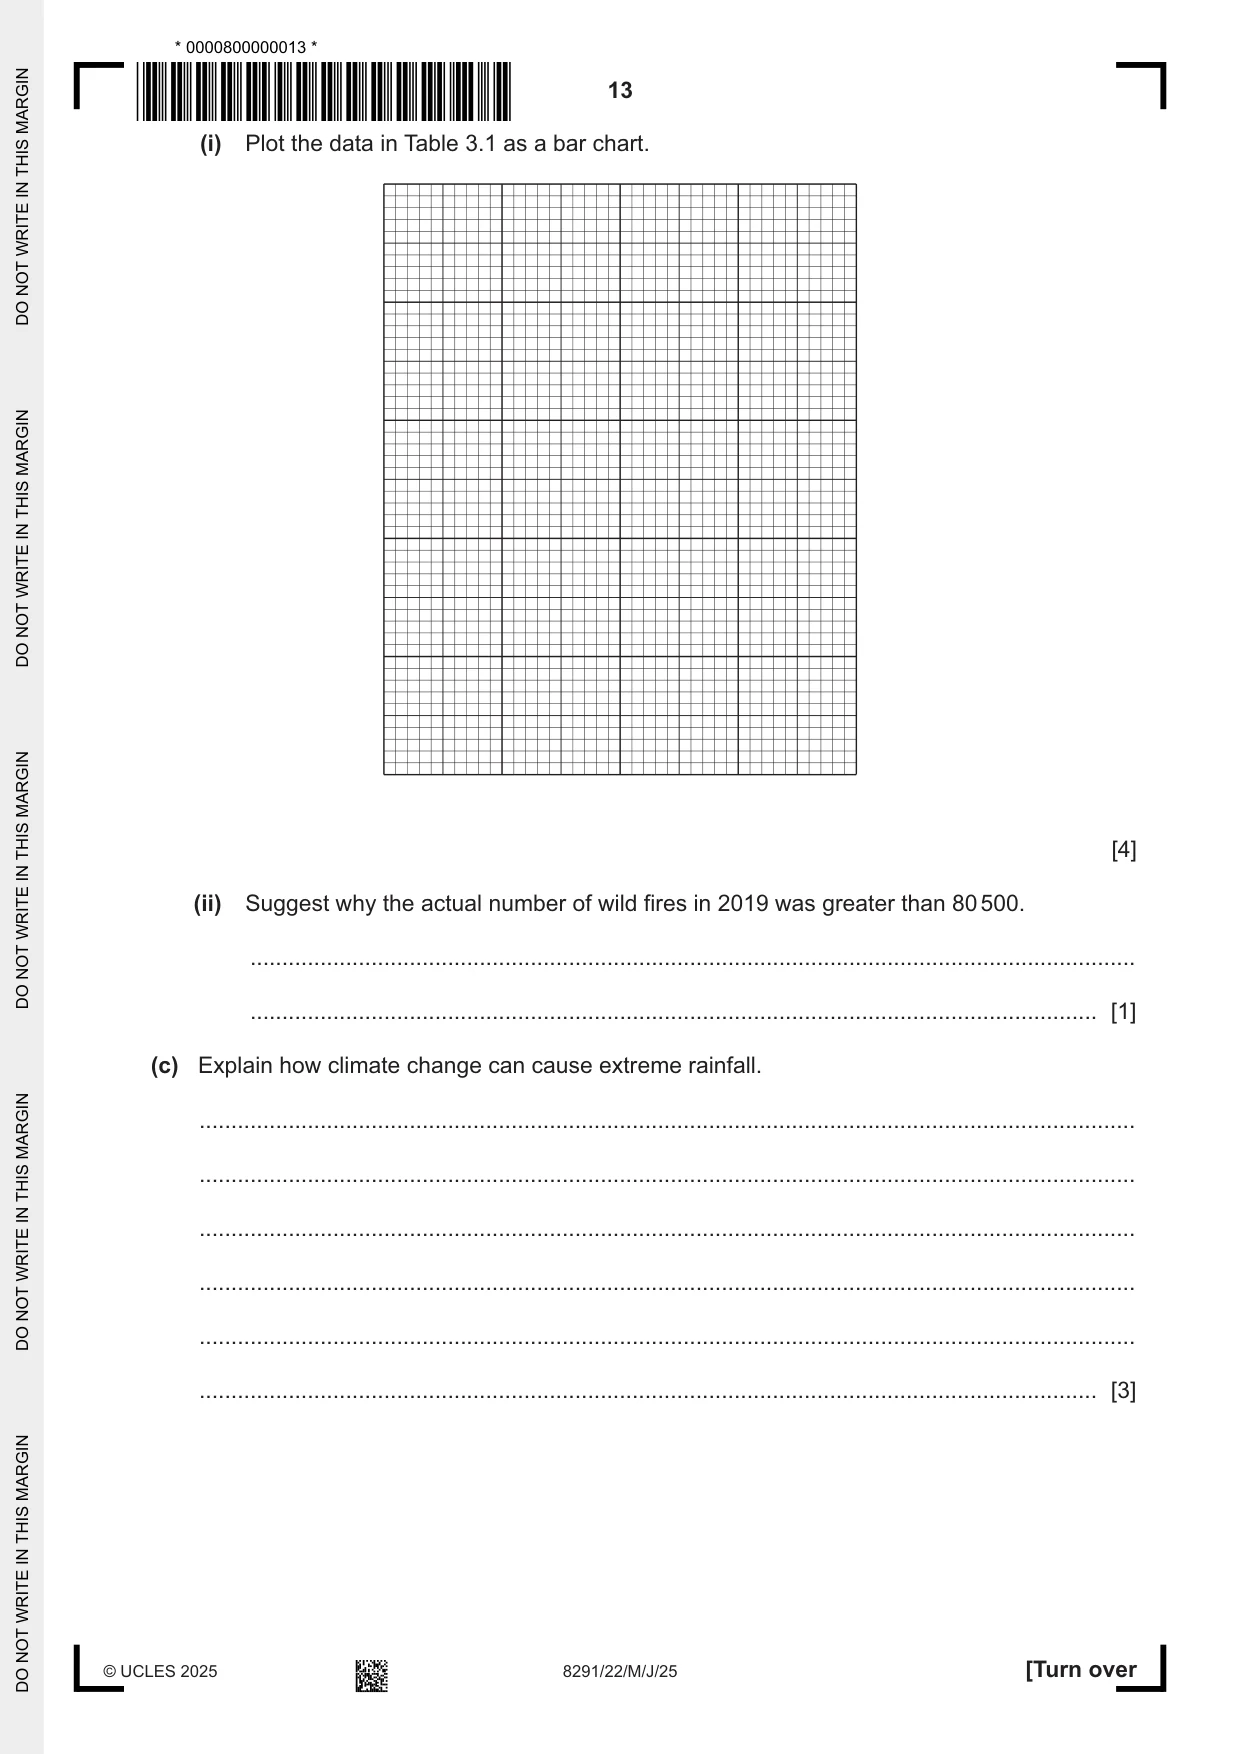
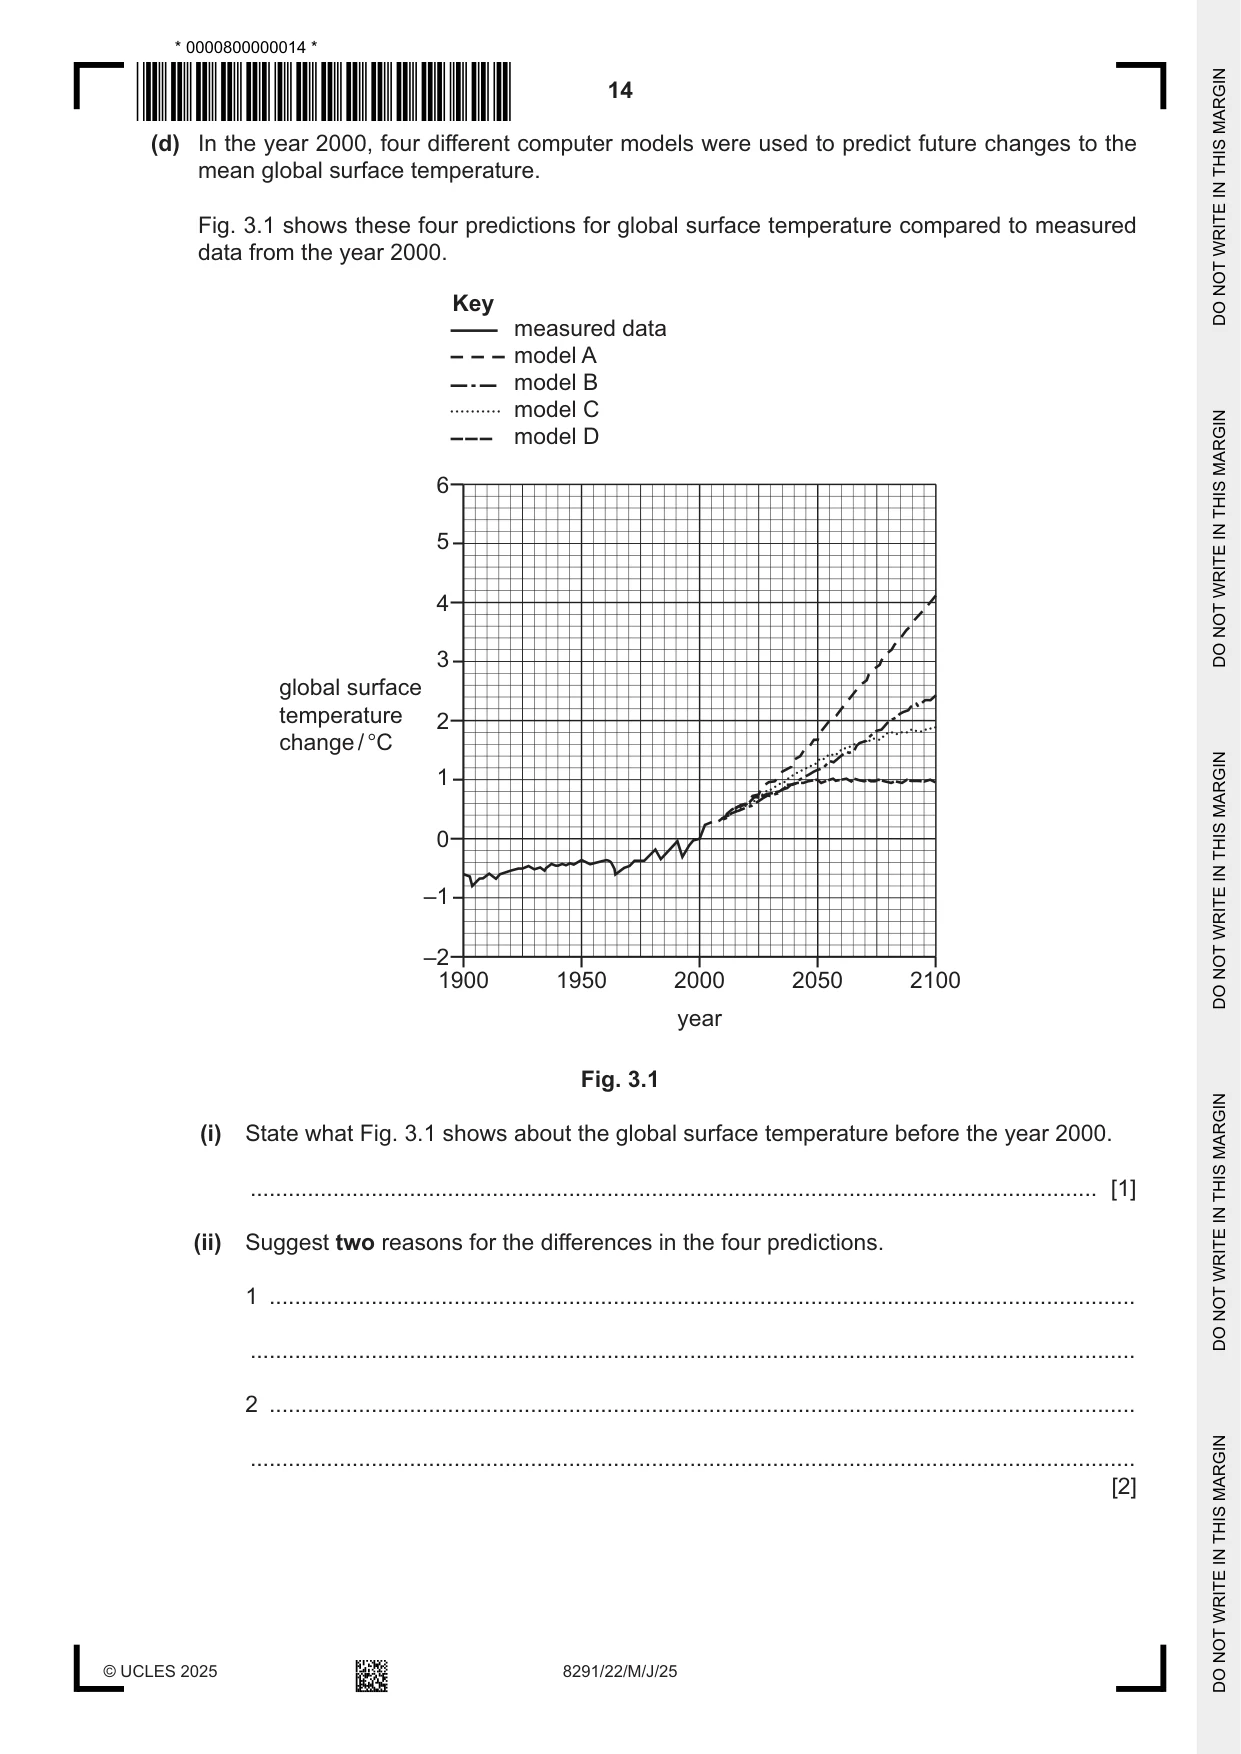
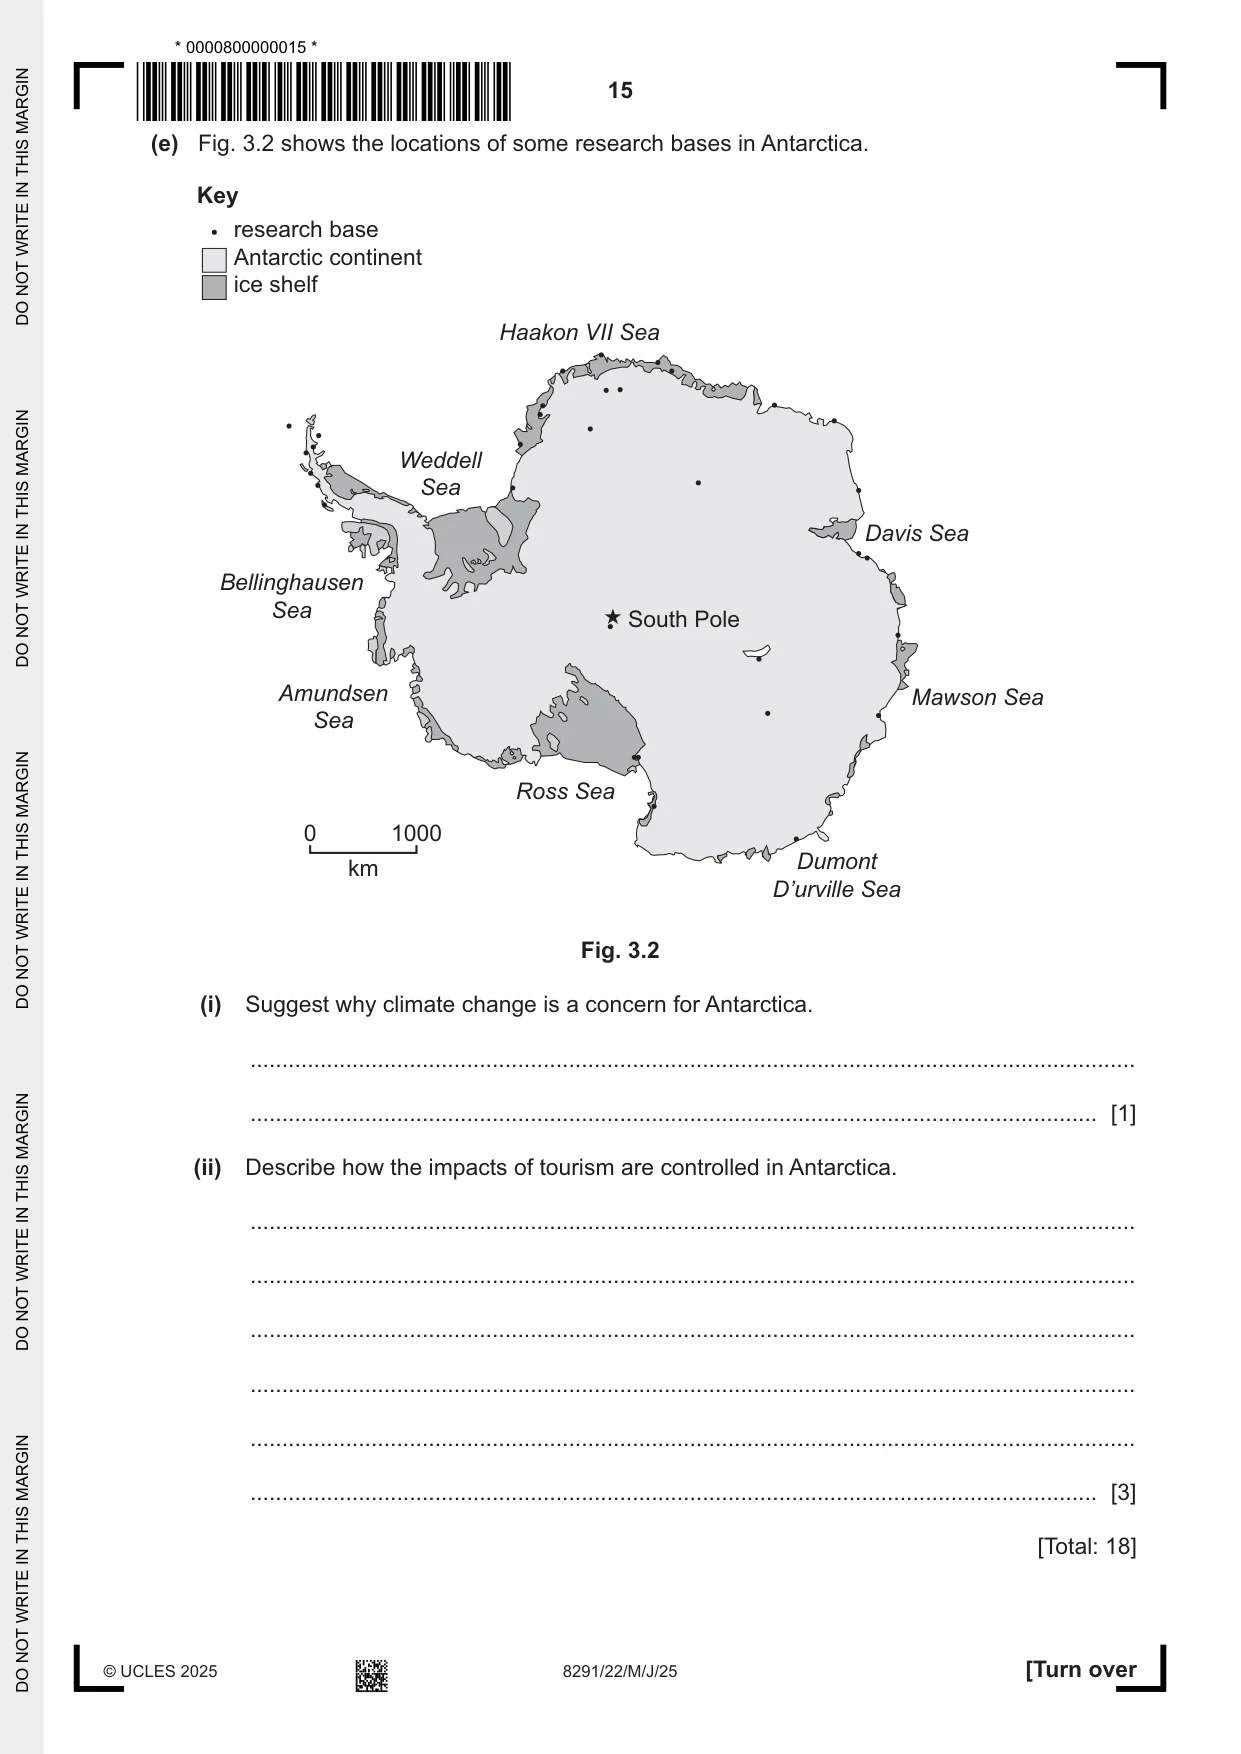
3 An increase in wild fires is an impact of climate change. (a) Explain how climate change leads to wild fires. ................................................................................................................................................... ................................................................................................................................................... ................................................................................................................................................... ................................................................................................................................................... ................................................................................................................................................... ............................................................................................................................................. [3] (b) Table 3.1 shows the number of wild fires recorded in Brazil from 2013 to 2019. Table 3.1 Content removed due to copyright restrictions. (i) Plot the data in Table 3.1 as a bar chart. [4] (ii) Suggest why the actual number of wild fires in 2019 was greater than 80 500. ........................................................................................................................................... ..................................................................................................................................... [1] (c) Explain how climate change can cause extreme rainfall. ................................................................................................................................................... ................................................................................................................................................... ................................................................................................................................................... ................................................................................................................................................... ................................................................................................................................................... ............................................................................................................................................. [3] (d) In the year 2000, four different computer models were used to predict future changes to the mean global surface temperature. Fig. 3.1 shows these four predictions for global surface temperature compared to measured data from the year 2000. Key measured data model A model B model C model D 6 5 4 3 global surface temperature 2 change / °C 1 0 –1 –2 1900 1950 2000 2050 2100 year Fig. 3.1 (i) State what Fig. 3.1 shows about the global surface temperature before the year 2000. ..................................................................................................................................... [1] (ii) Suggest two reasons for the differences in the four predictions. 1 ........................................................................................................................................ ........................................................................................................................................... 2 ........................................................................................................................................ ........................................................................................................................................... [2] (e) Fig. 3.2 shows the locations of some research bases in Antarctica. Key research base Antarctic continent ice shelf Haakon VII Sea Weddell Sea Davis Sea Bellinghausen Sea South Pole Amundsen Mawson Sea Sea Ross Sea 0 1000 Dumont km D’urville Sea Fig. 3.2 (i) Suggest why climate change is a concern for Antarctica. ........................................................................................................................................... ..................................................................................................................................... [1] (ii) Describe how the impacts of tourism are controlled in Antarctica. ........................................................................................................................................... ........................................................................................................................................... ........................................................................................................................................... ........................................................................................................................................... ........................................................................................................................................... ..................................................................................................................................... [3] [Total: 18]
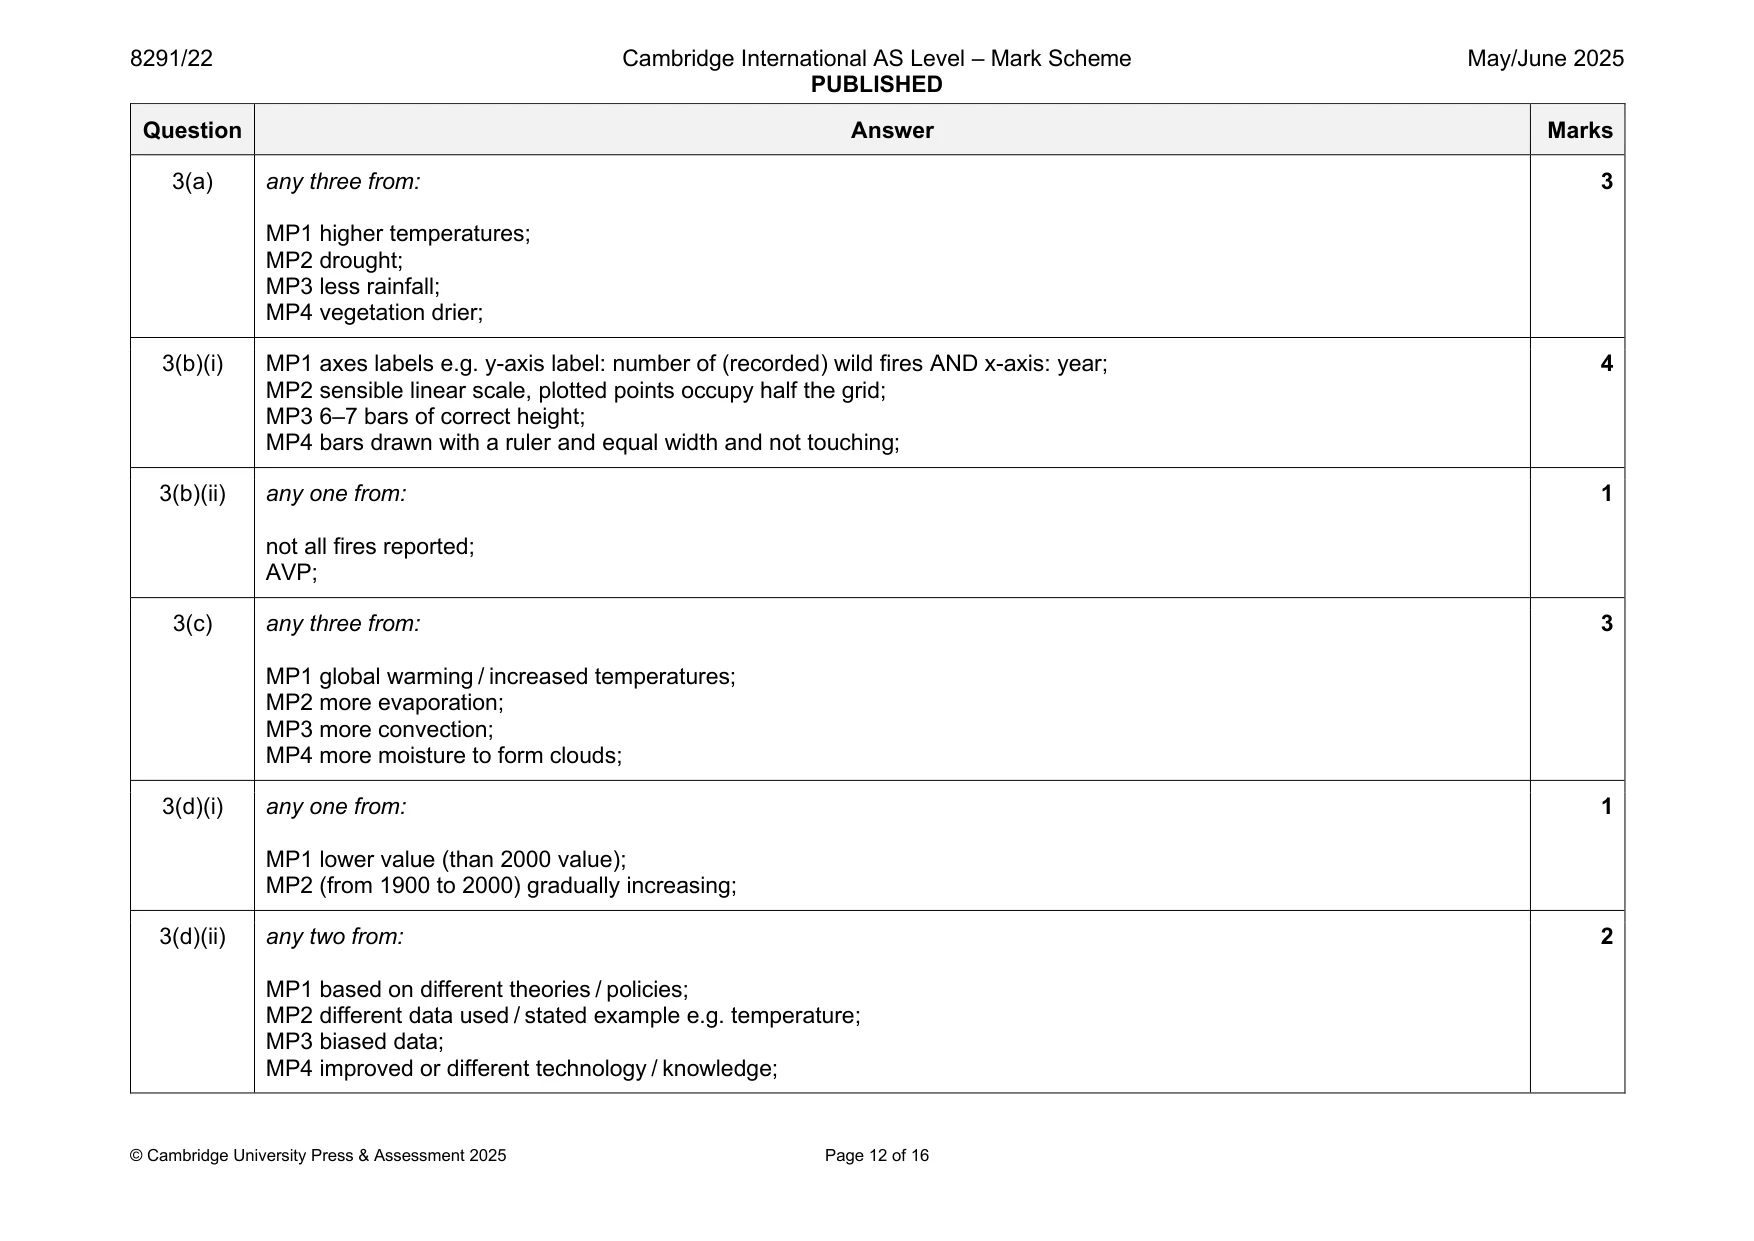
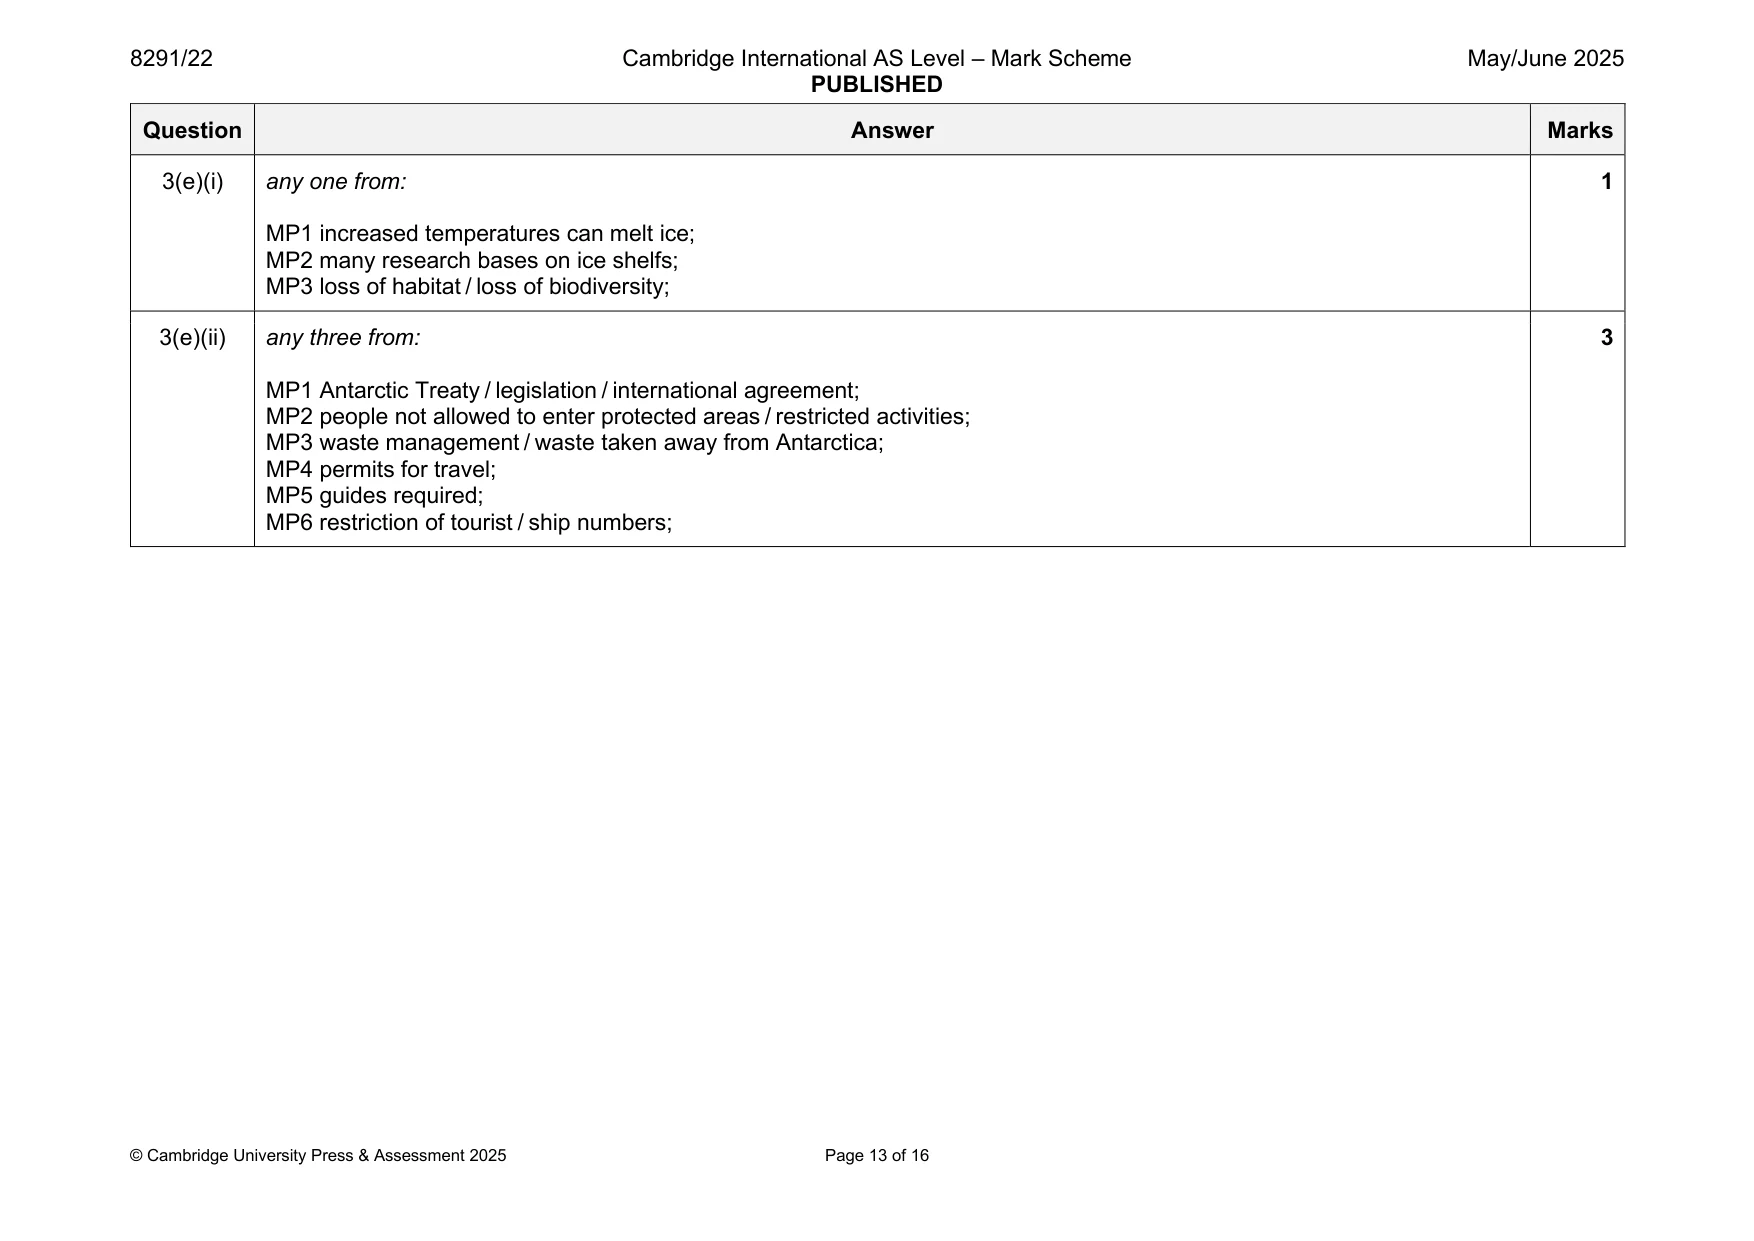
Mark scheme: 3(a) any three from: 3 MP1 higher temperatures; MP2 drought; MP3 less rainfall; MP4 vegetation drier; 3(b)(i) MP1 axes labels e.g. y-axis label: number of (recorded) wild fires AND x-axis: year; 4 MP2 sensible linear scale, plotted points occupy half the grid; MP3 6–7 bars of correct height; MP4 bars drawn with a ruler and equal width and not touching; 3(b)(ii) any one from: 1 not all fires reported; AVP; 3(c) any three from: 3 MP1 global warming / increased temperatures; MP2 more evaporation; MP3 more convection; MP4 more moisture to form clouds; 3(d)(i) any one from: 1 MP1 lower value (than 2000 value); MP2 (from 1900 to 2000) gradually increasing; 3(d)(ii) any two from: 2 MP1 based on different theories / policies; MP2 different data used / stated example e.g. temperature; MP3 biased data; MP4 improved or different technology / knowledge; 3(e)(i) any one from: 1 MP1 increased temperatures can melt ice; MP2 many research bases on ice shelfs; MP3 loss of habitat / loss of biodiversity; 3(e)(ii) any three from: 3 MP1 Antarctic Treaty / legislation / international agreement; MP2 people not allowed to enter protected areas / restricted activities; MP3 waste management / waste taken away from Antarctica; MP4 permits for travel; MP5 guides required; MP6 restriction of tourist / ship numbers;
Q4 · In 2022, the world population was 7.9 billion
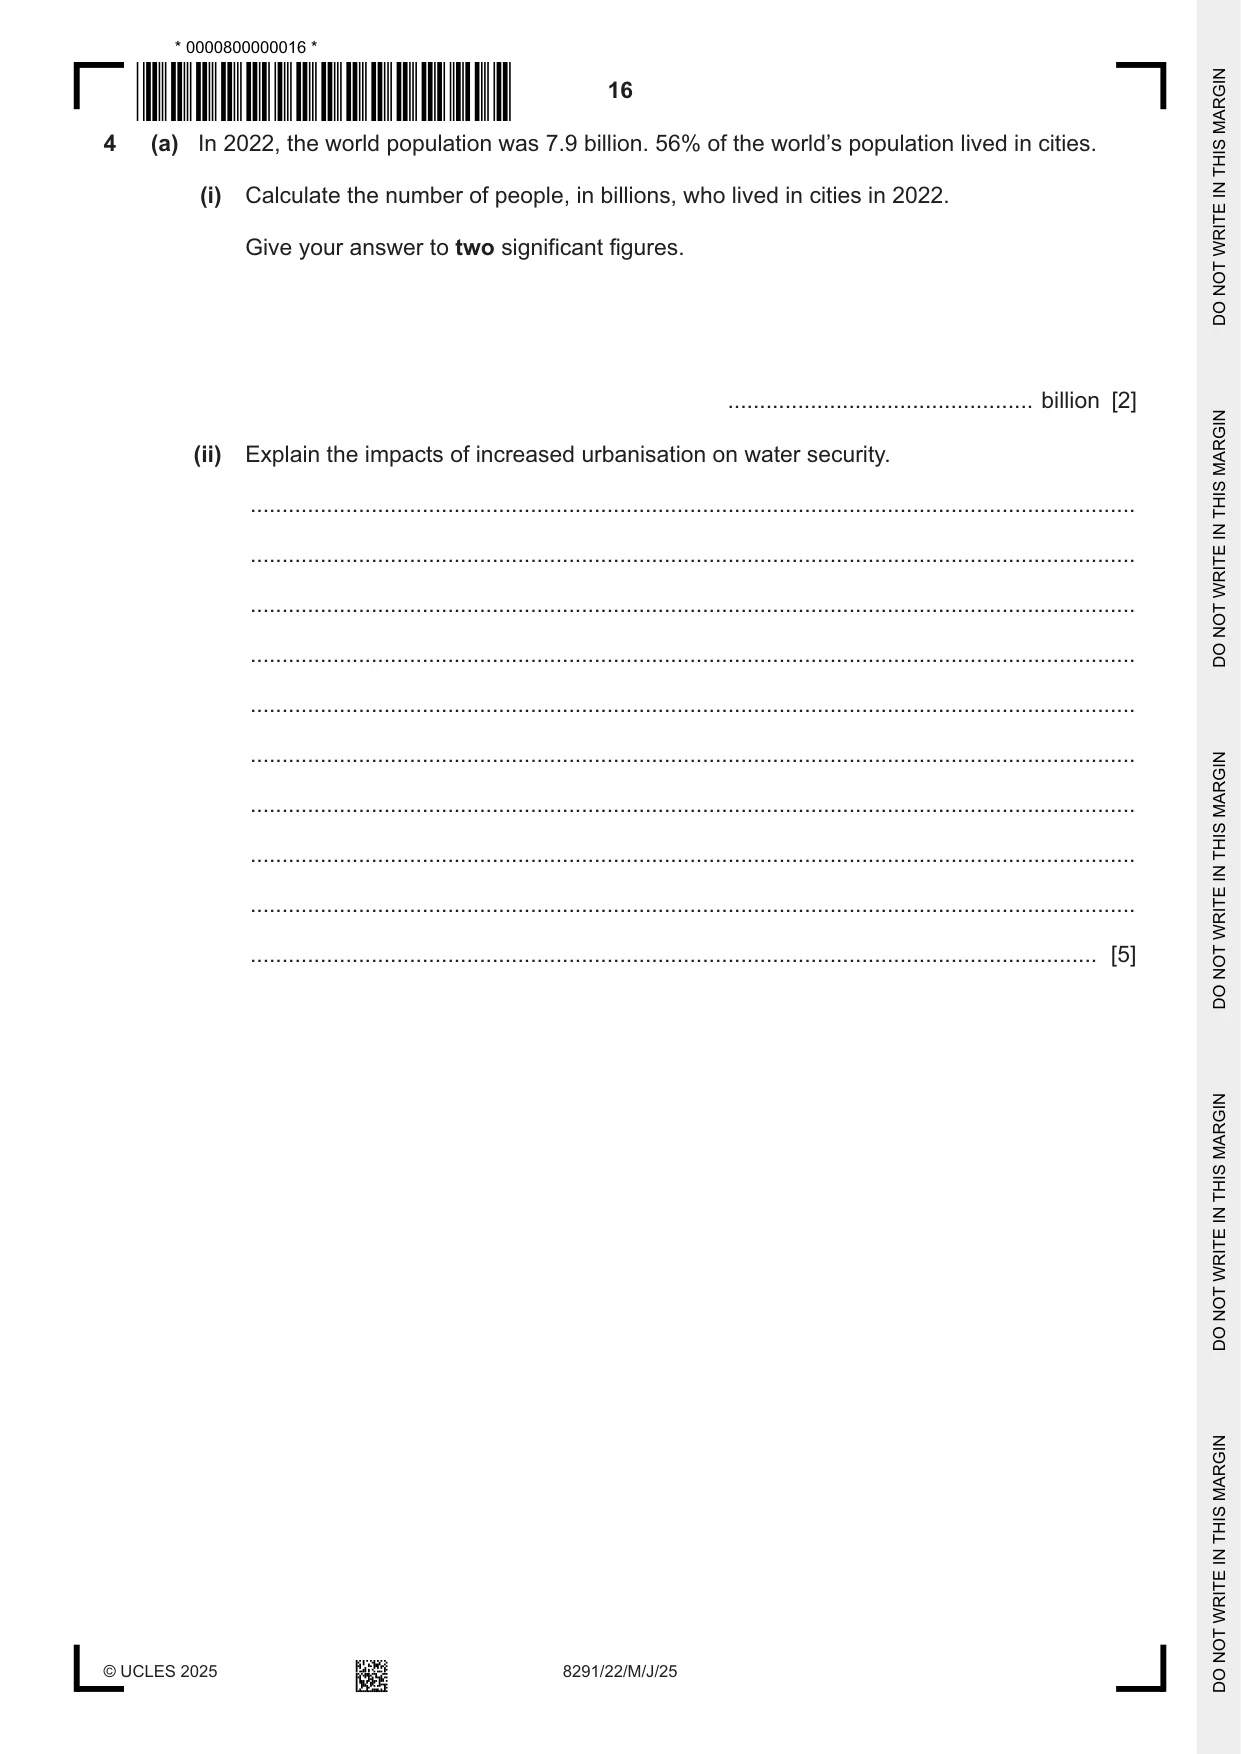
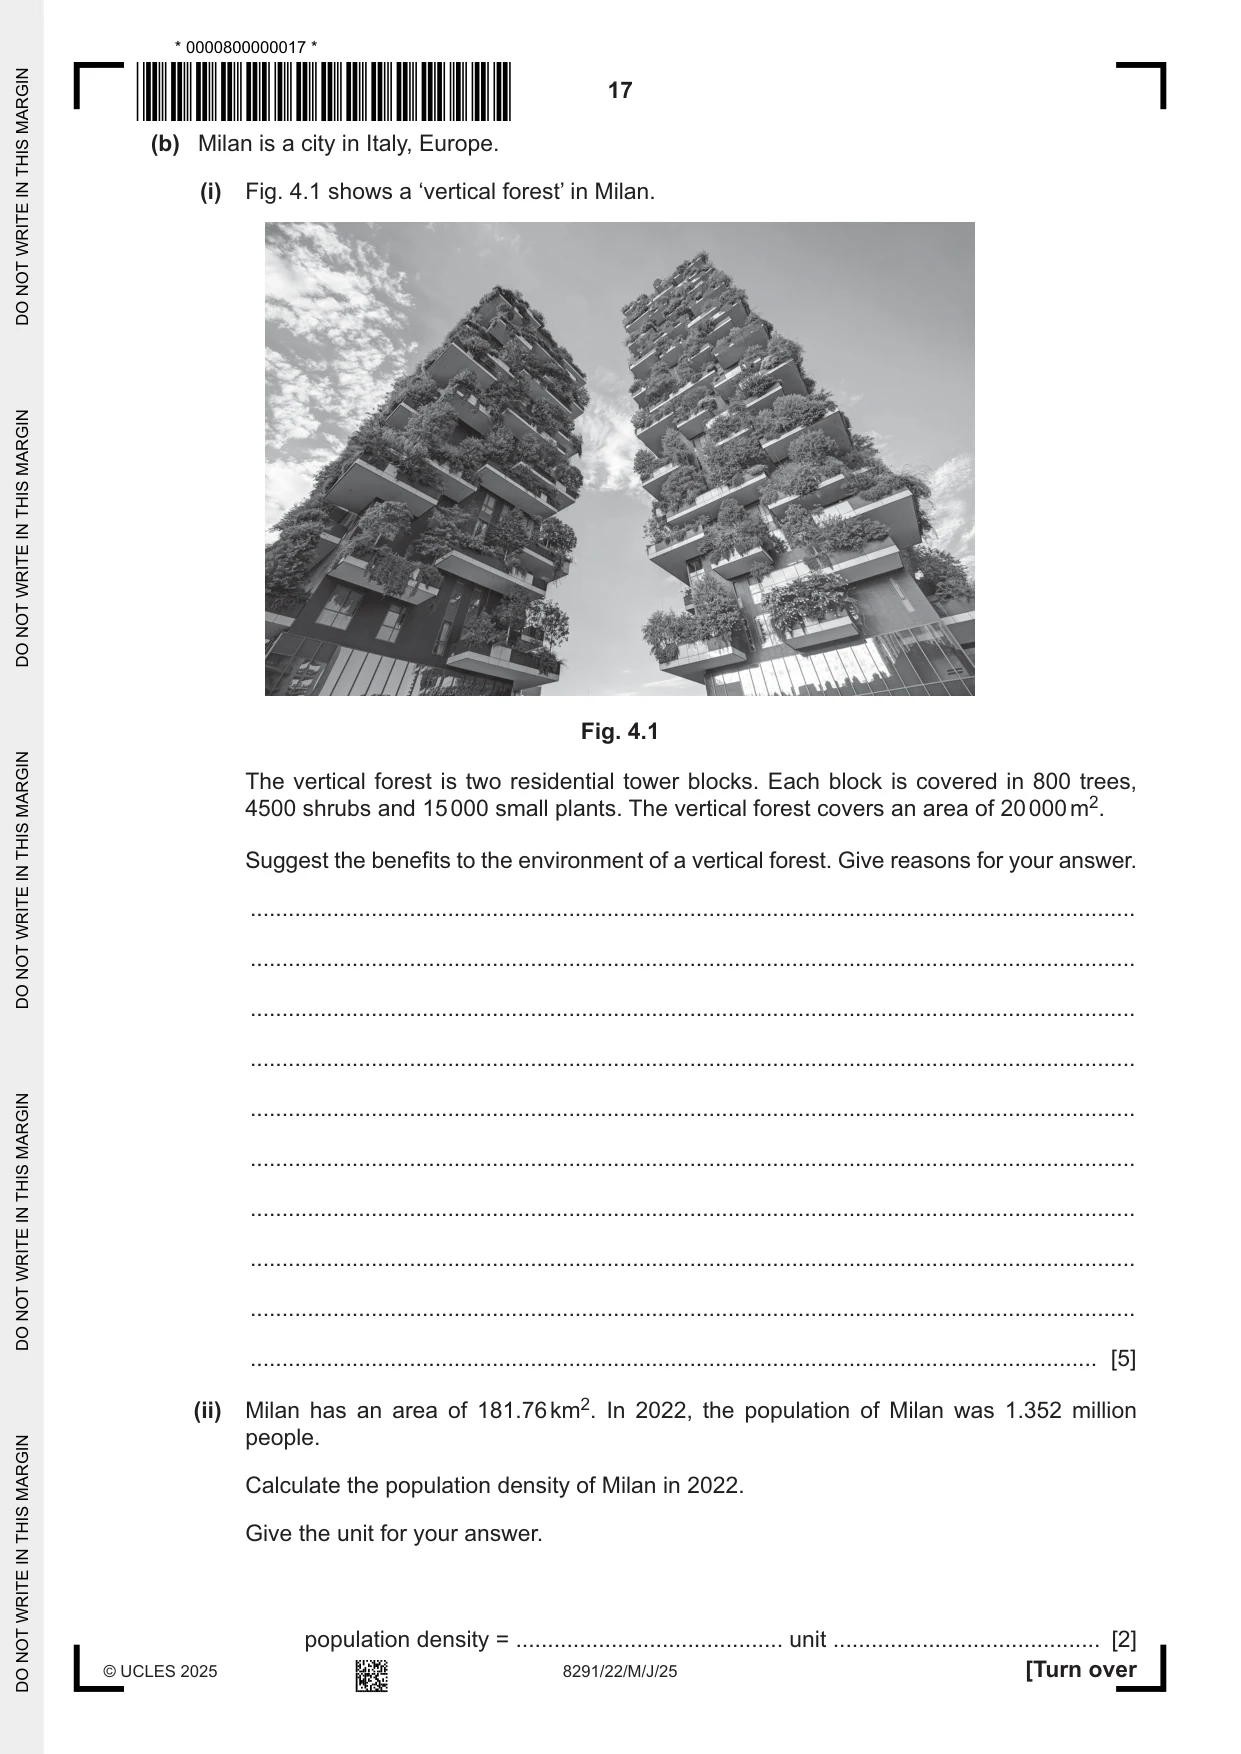
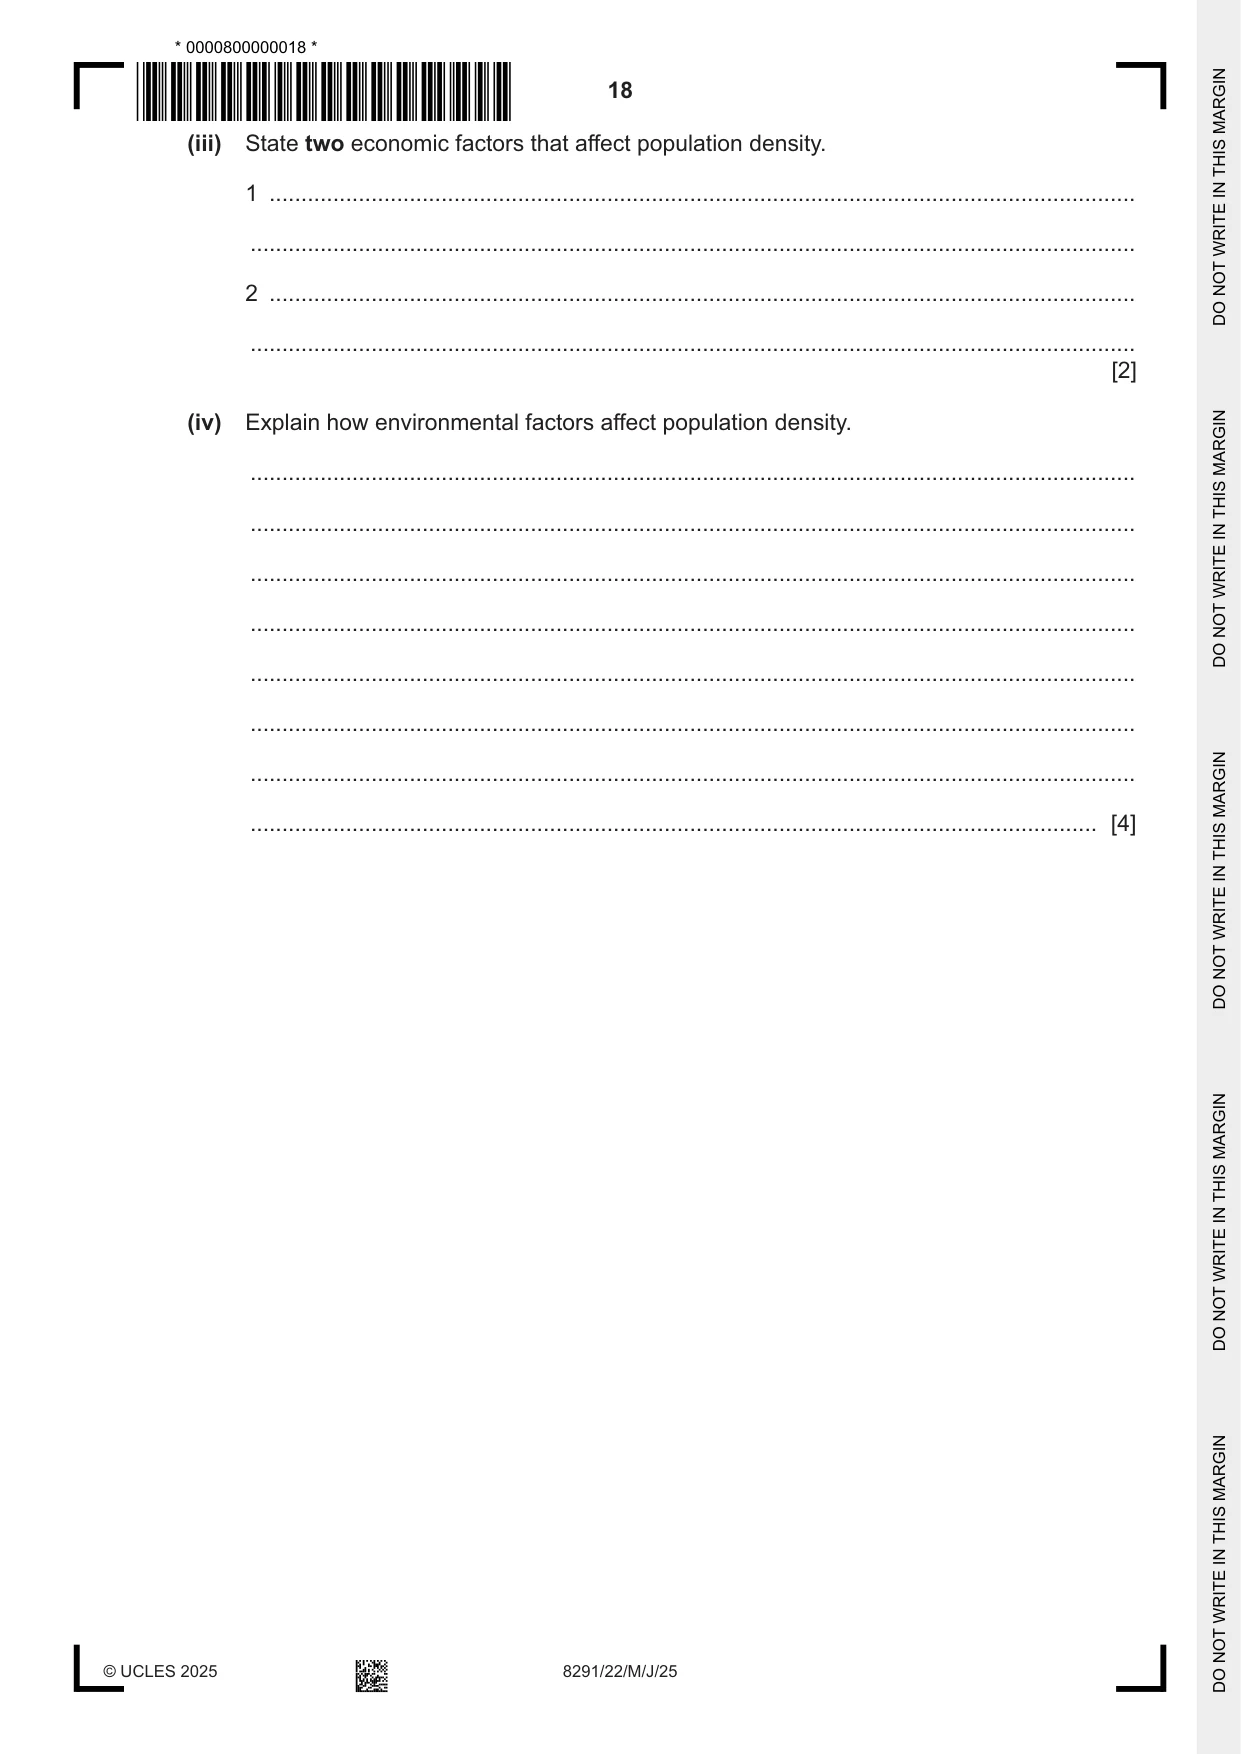
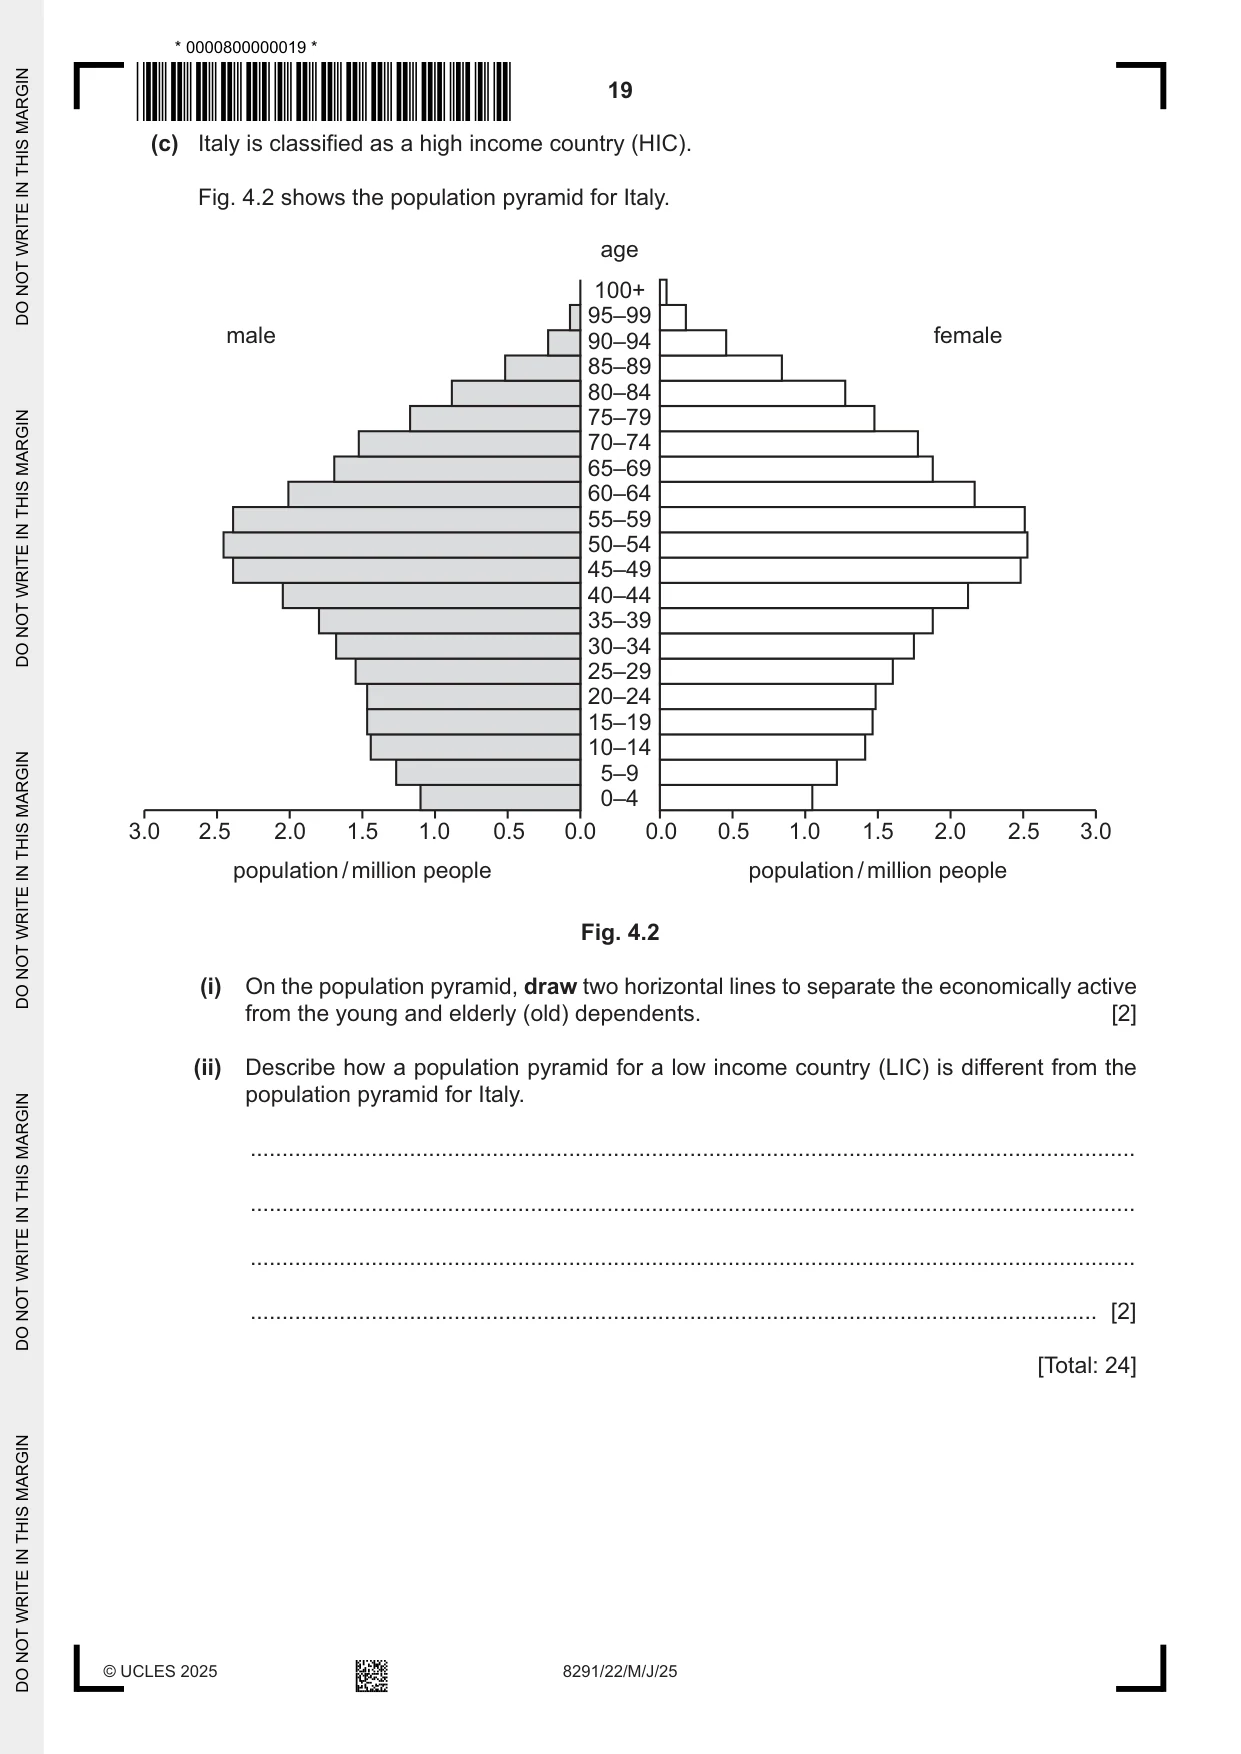
4 (a) In 2022, the world population was 7.9 billion. 56% of the world’s population lived in cities. (i) Calculate the number of people, in billions, who lived in cities in 2022. Give your answer to two significant figures. ................................................ billion [2] (ii) Explain the impacts of increased urbanisation on water security. ........................................................................................................................................... ........................................................................................................................................... ........................................................................................................................................... ........................................................................................................................................... ........................................................................................................................................... ........................................................................................................................................... ........................................................................................................................................... ........................................................................................................................................... ........................................................................................................................................... ..................................................................................................................................... [5] (b) Milan is a city in Italy, Europe. (i) Fig. 4.1 shows a ‘vertical forest’ in Milan. Fig. 4.1 The vertical forest is two residential tower blocks. Each block is covered in 800 trees, 4500 shrubs and 15 000 small plants. The vertical forest covers an area of 20 000 m2. Suggest the benefits to the environment of a vertical forest. Give reasons for your answer. ........................................................................................................................................... ........................................................................................................................................... ........................................................................................................................................... ........................................................................................................................................... ........................................................................................................................................... ........................................................................................................................................... ........................................................................................................................................... ........................................................................................................................................... ........................................................................................................................................... ..................................................................................................................................... [5] (ii) Milan has an area of 181.76 km2. In 2022, the population of Milan was 1.352 million people. Calculate the population density of Milan in 2022. Give the unit for your answer. population density = .......................................... unit .......................................... [2] (iii) State two economic factors that affect population density. 1 ........................................................................................................................................ ........................................................................................................................................... 2 ........................................................................................................................................ ........................................................................................................................................... [2] (iv) Explain how environmental factors affect population density. ........................................................................................................................................... ........................................................................................................................................... ........................................................................................................................................... ........................................................................................................................................... ........................................................................................................................................... ........................................................................................................................................... ........................................................................................................................................... ..................................................................................................................................... [4] CLES 2025 8291/22/M/J/25
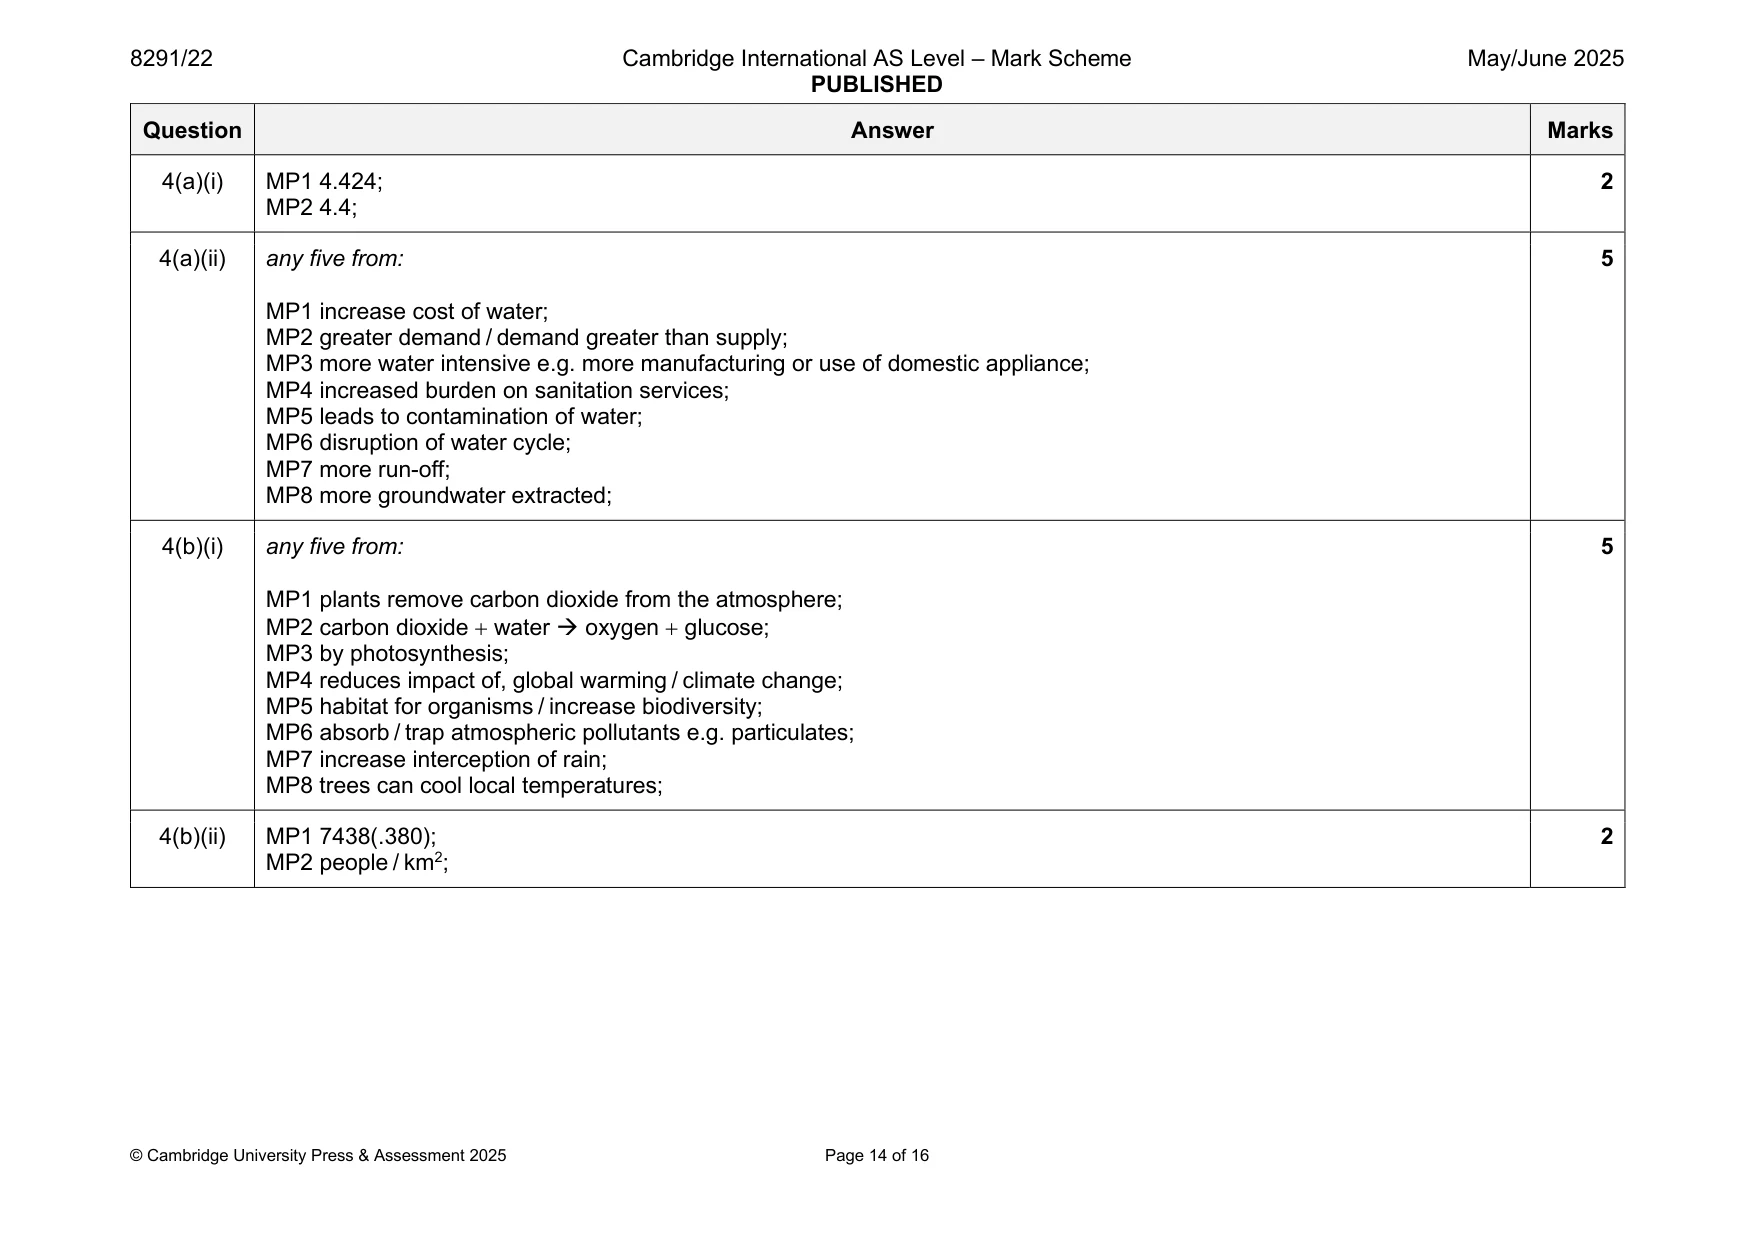
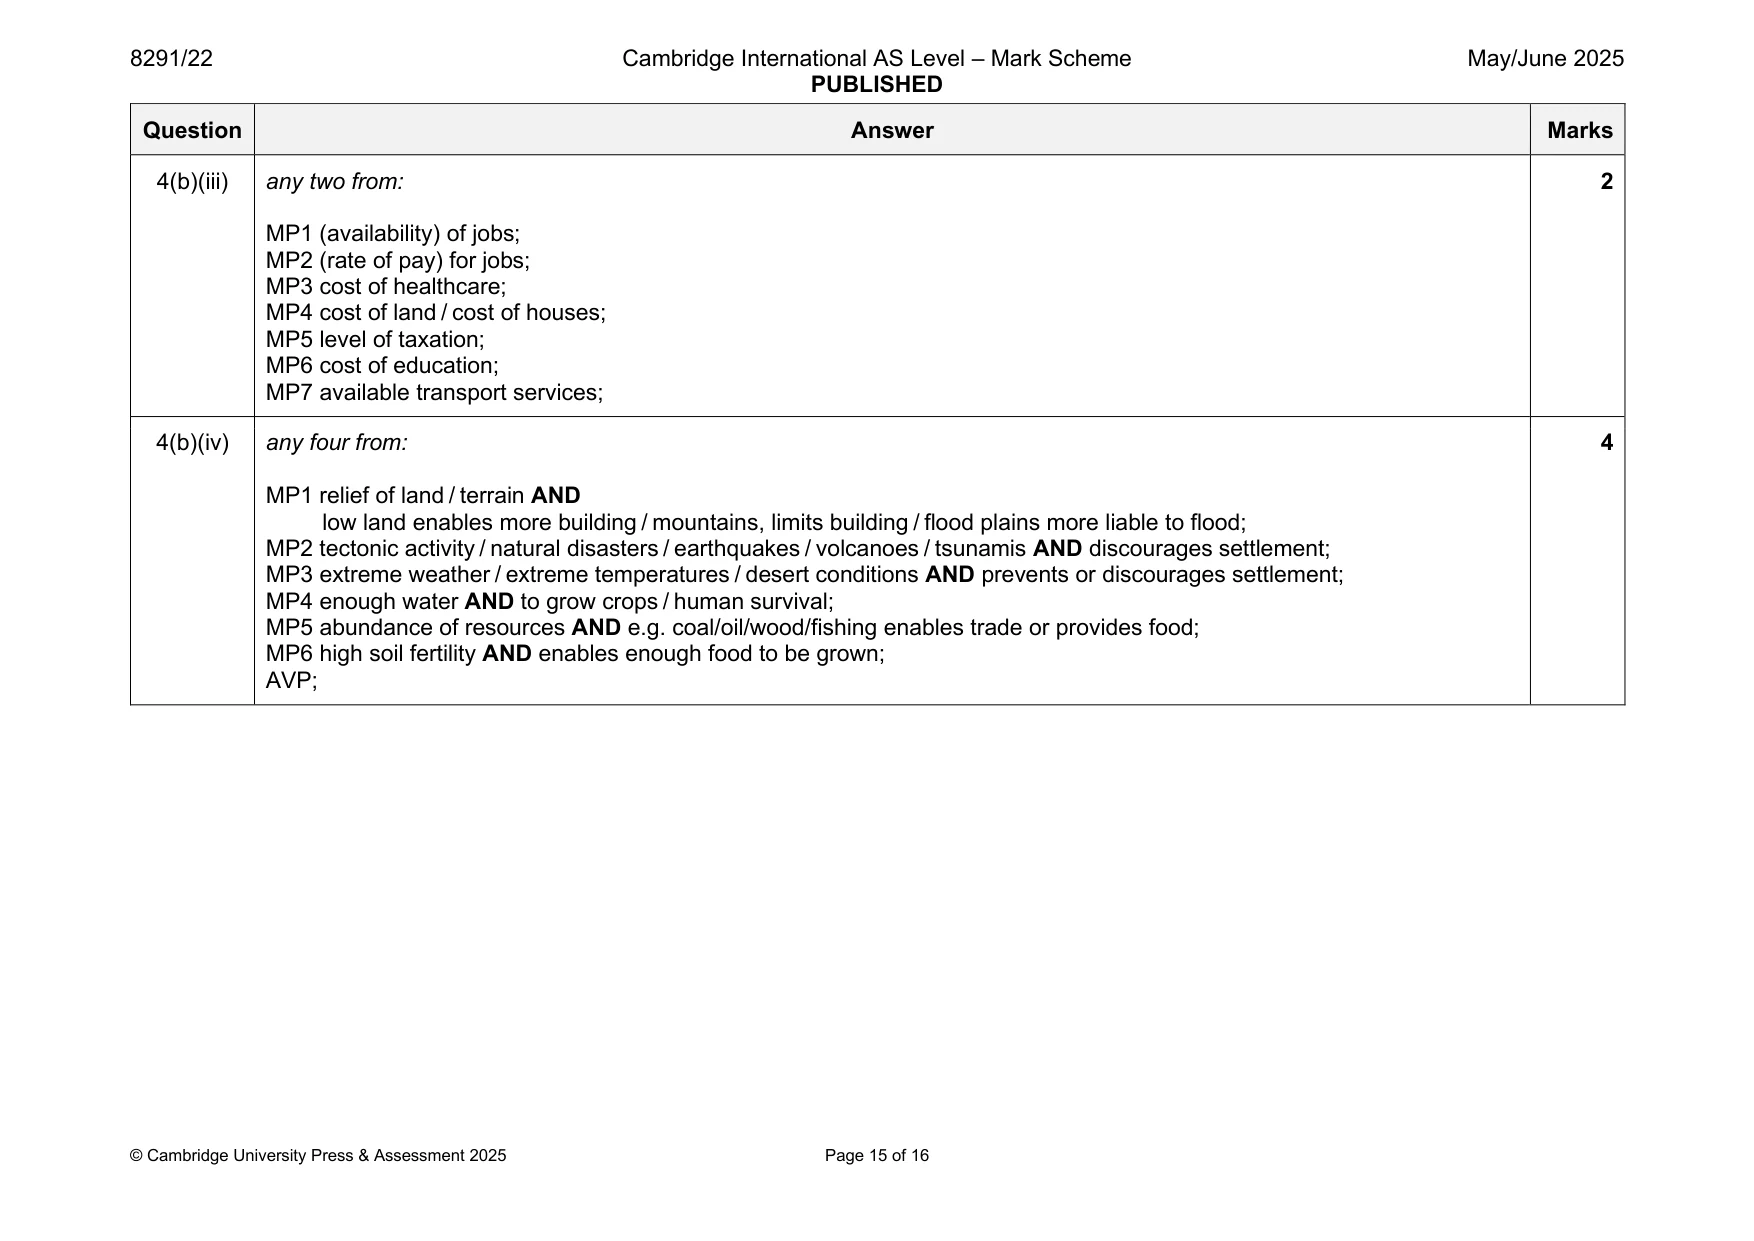
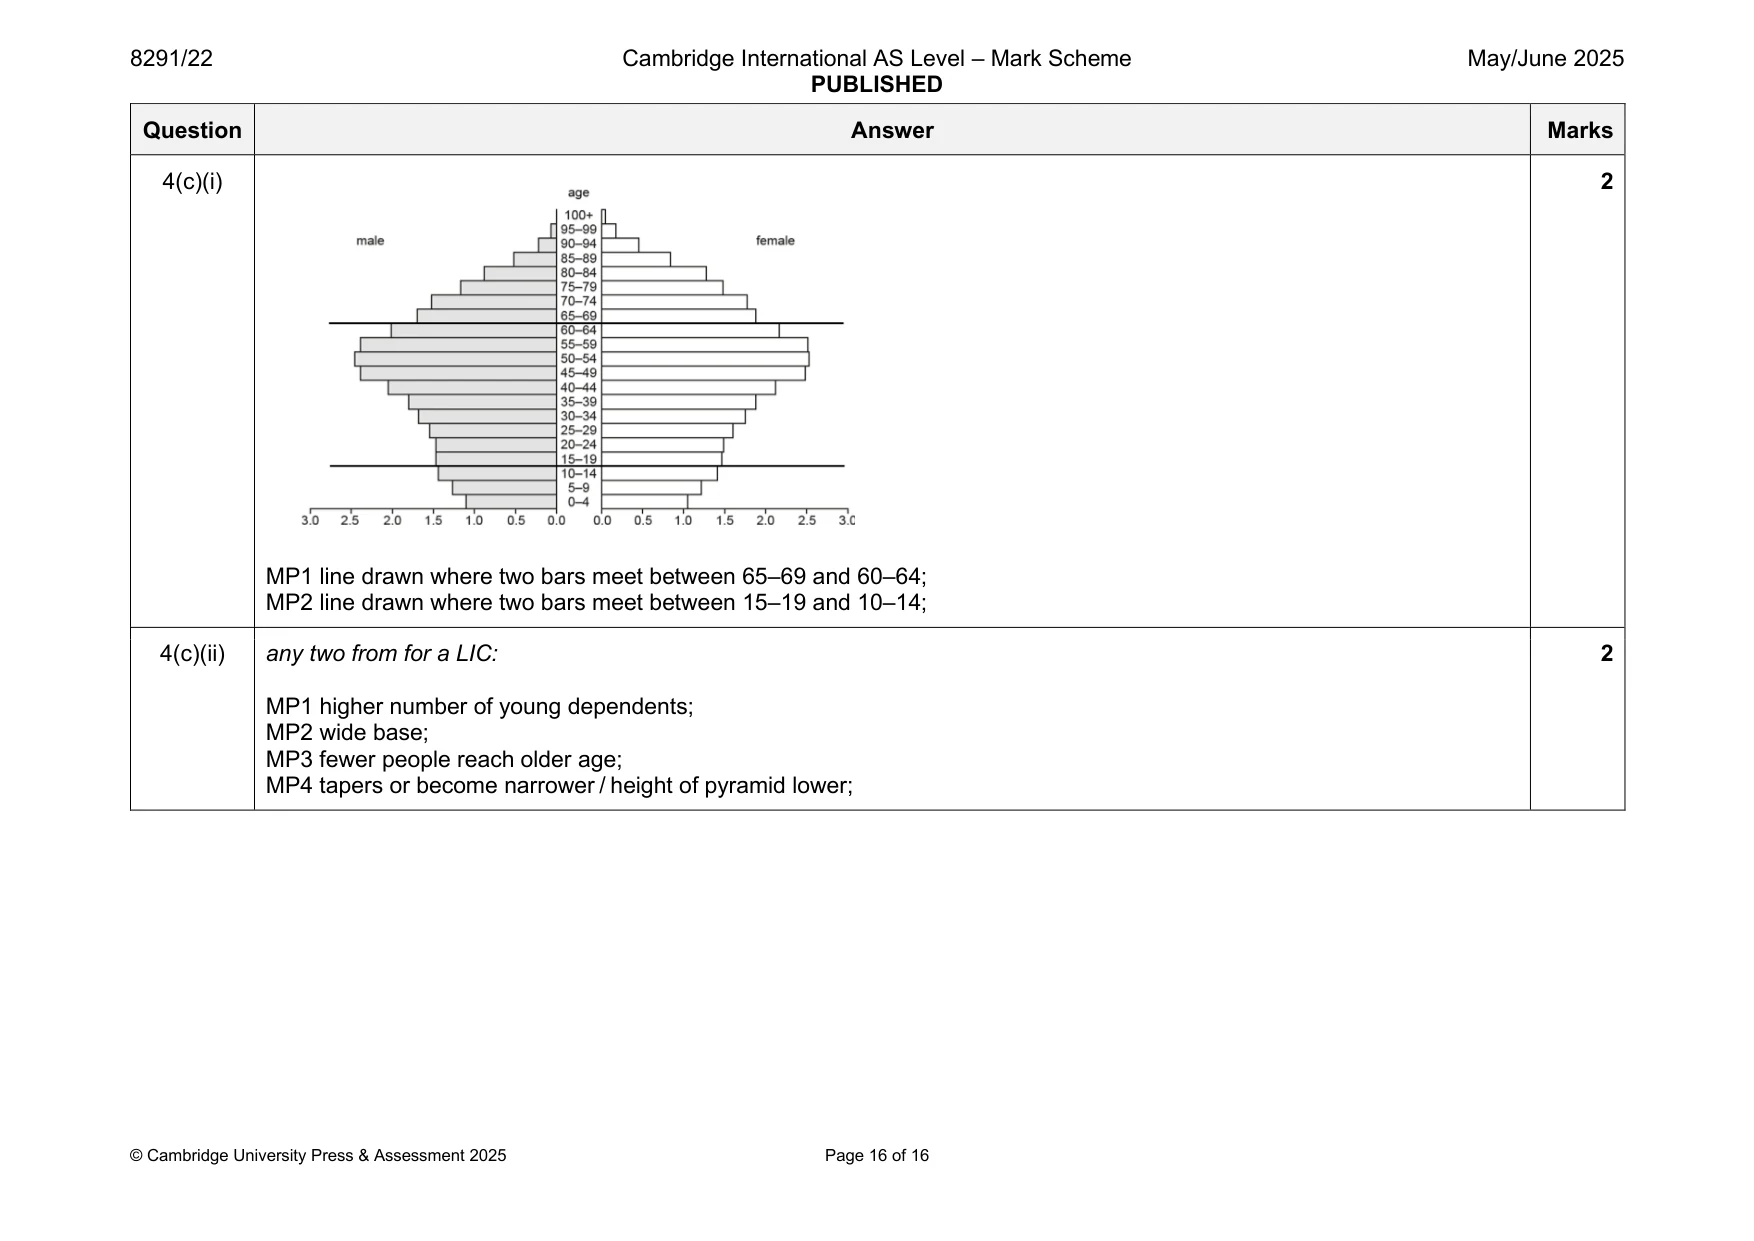
Mark scheme: 4(a)(i) MP1 4.424; 2 MP2 4.4; 4(a)(ii) any five from: 5 MP1 increase cost of water; MP2 greater demand / demand greater than supply; MP3 more water intensive e.g. more manufacturing or use of domestic appliance; MP4 increased burden on sanitation services; MP5 leads to contamination of water; MP6 disruption of water cycle; MP7 more run-off; MP8 more groundwater extracted; 4(b)(i) any five from: 5 MP1 plants remove carbon dioxide from the atmosphere; MP2 carbon dioxide + water → oxygen + glucose; MP3 by photosynthesis; MP4 reduces impact of, global warming / climate change; MP5 habitat for organisms / increase biodiversity; MP6 absorb / trap atmospheric pollutants e.g. particulates; MP7 increase interception of rain; MP8 trees can cool local temperatures; 4(b)(ii) MP1 7438(.380); 2 MP2 people / km2; 4(b)(iii) any two from: 2 MP1 (availability) of jobs; MP2 (rate of pay) for jobs; MP3 cost of healthcare; MP4 cost of land / cost of houses; MP5 level of taxation; MP6 cost of education; MP7 available transport services; 4(b)(iv) any four from: 4 MP1 relief of land / terrain AND low land enables more building / mountains, limits building / flood plains more liable to flood; MP2 tectonic activity / natural disasters / earthquakes / volcanoes / tsunamis AND discourages settlement; MP3 extreme weather / extreme temperatures / desert conditions AND prevents or discourages settlement; MP4 enough water AND to grow crops / human survival; MP5 abundance of resources AND e.g. coal/oil/wood/fishing enables trade or provides food; MP6 high soil fertility AND enables enough food to be grown; AVP; 4(c)(i) 2 MP1 line drawn where two bars meet between 65–69 and 60–64; MP2 line drawn where two bars meet between 15–19 and 10–14; 4(c)(ii) any two from for a LIC: 2 MP1 higher number of young dependents; MP2 wide base; MP3 fewer people reach older age; MP4 tapers or become narrower / height of pyramid lower;
What was in this paper
The subtopics covered by these 4 questions, and how many questions each got. Open one in a new tab to see every Cambridge question on it.
What you needed in this session
Cambridge’s own grade thresholds for 2025 May/June, Paper 2 · Variant 2. A higher threshold means an easier paper — the bar moves with how the cohort did.