Cambridge A Level Environmental Management (AS only) 8291 — 2017 May/June Paper 2 · Variant 1
8291/21/M/J/17 · 5 questions · 80 marks · ≈90 min
The question paper and its mark scheme, free to read here and free to download. This is Cambridge’s own paper, exactly as it was sat.
Question paper16 pages




Mark scheme19 pages
Answers below. Sit the paper first if you are practising.
Questions as text
Q1 · A diagram representing some of the flows and stores of the hydrological cycle
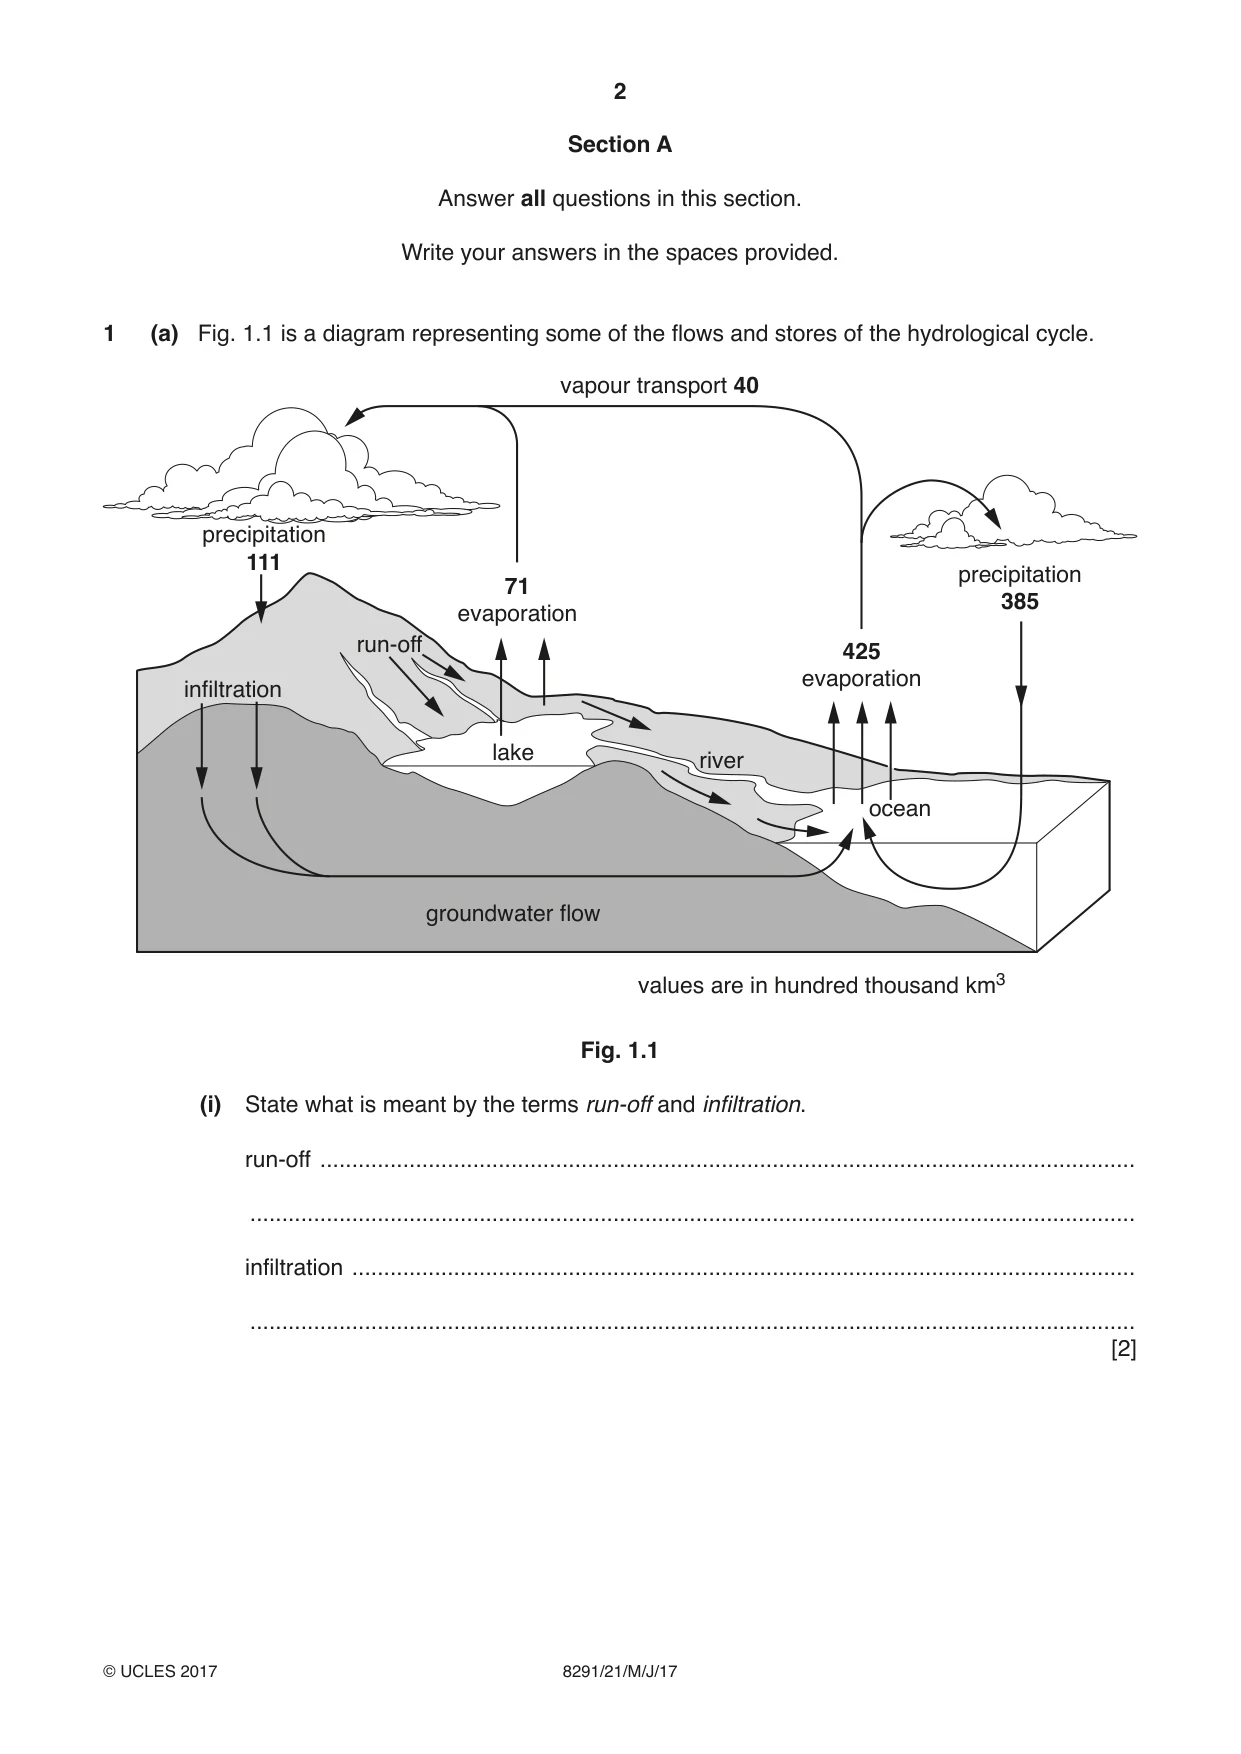
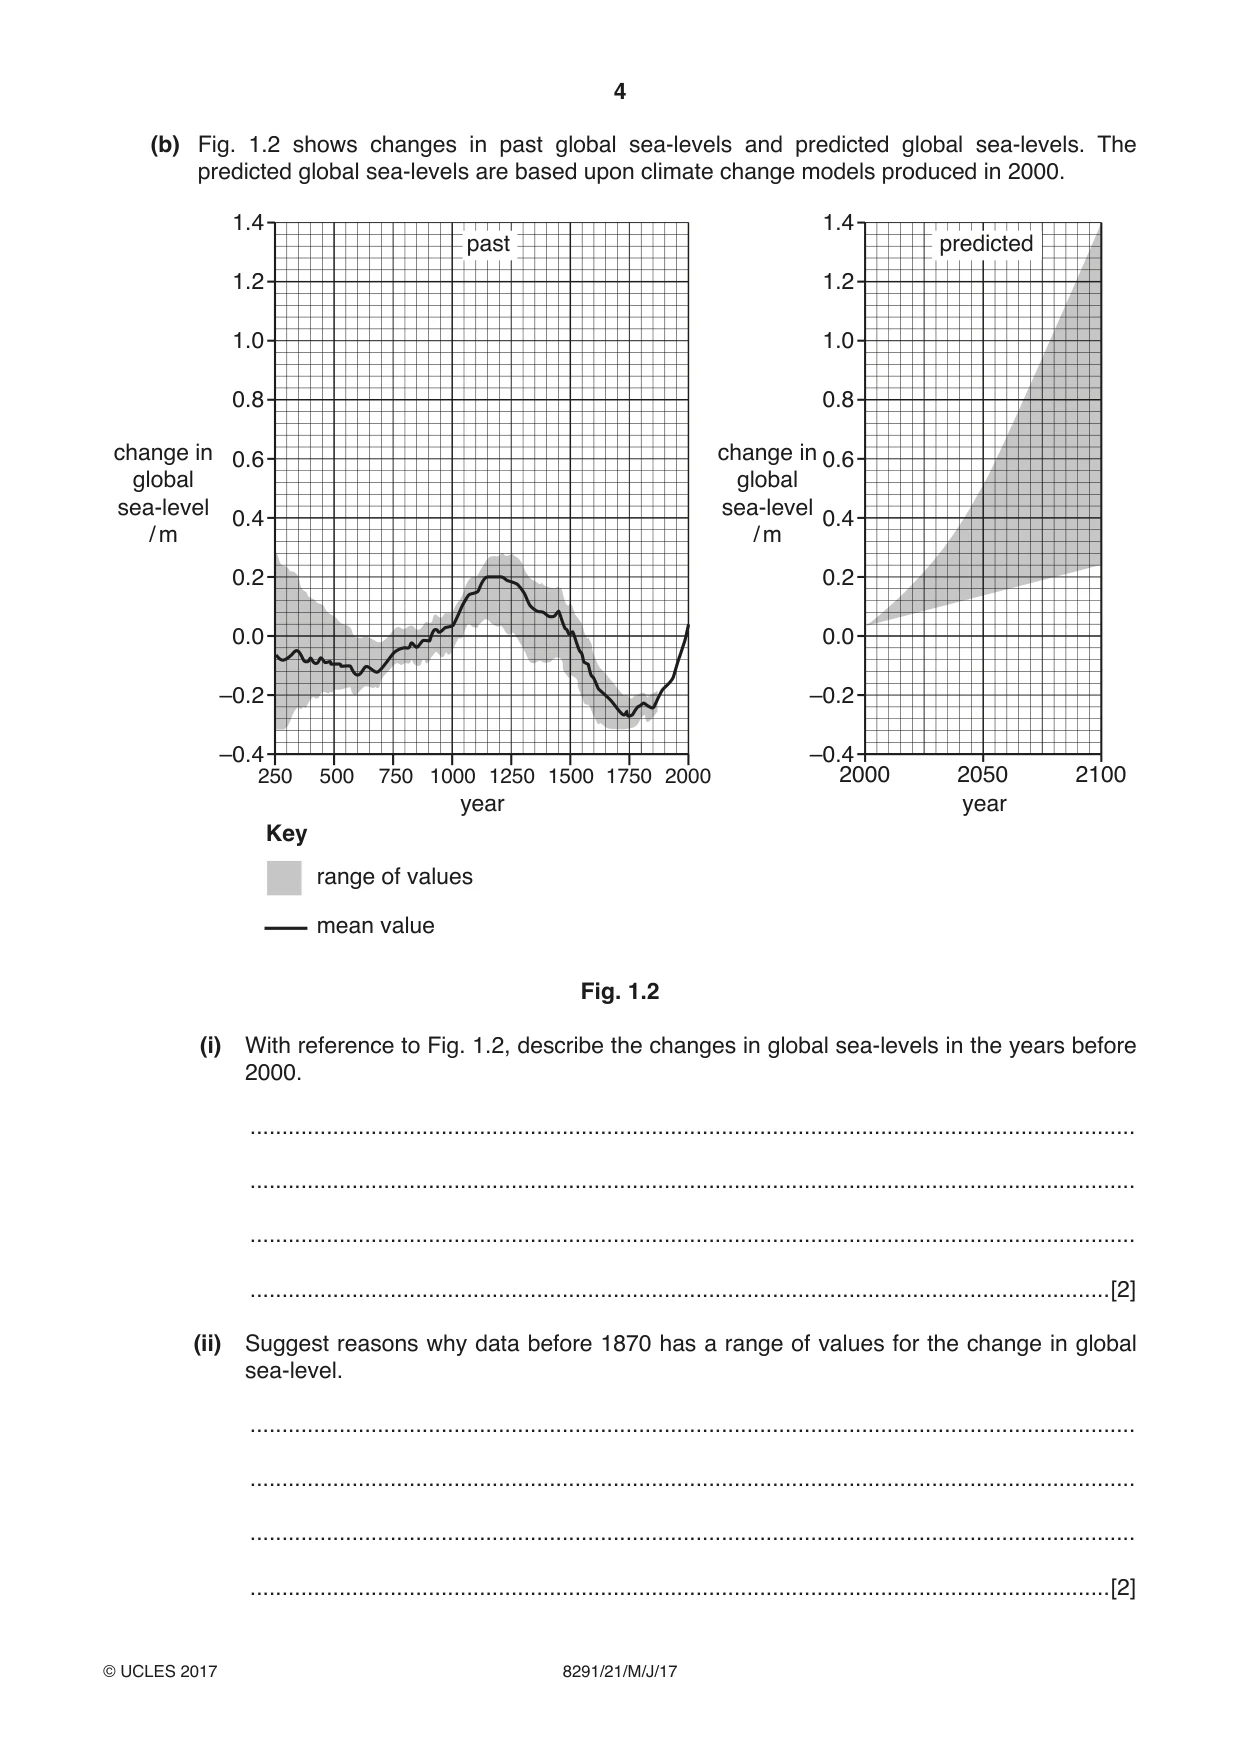
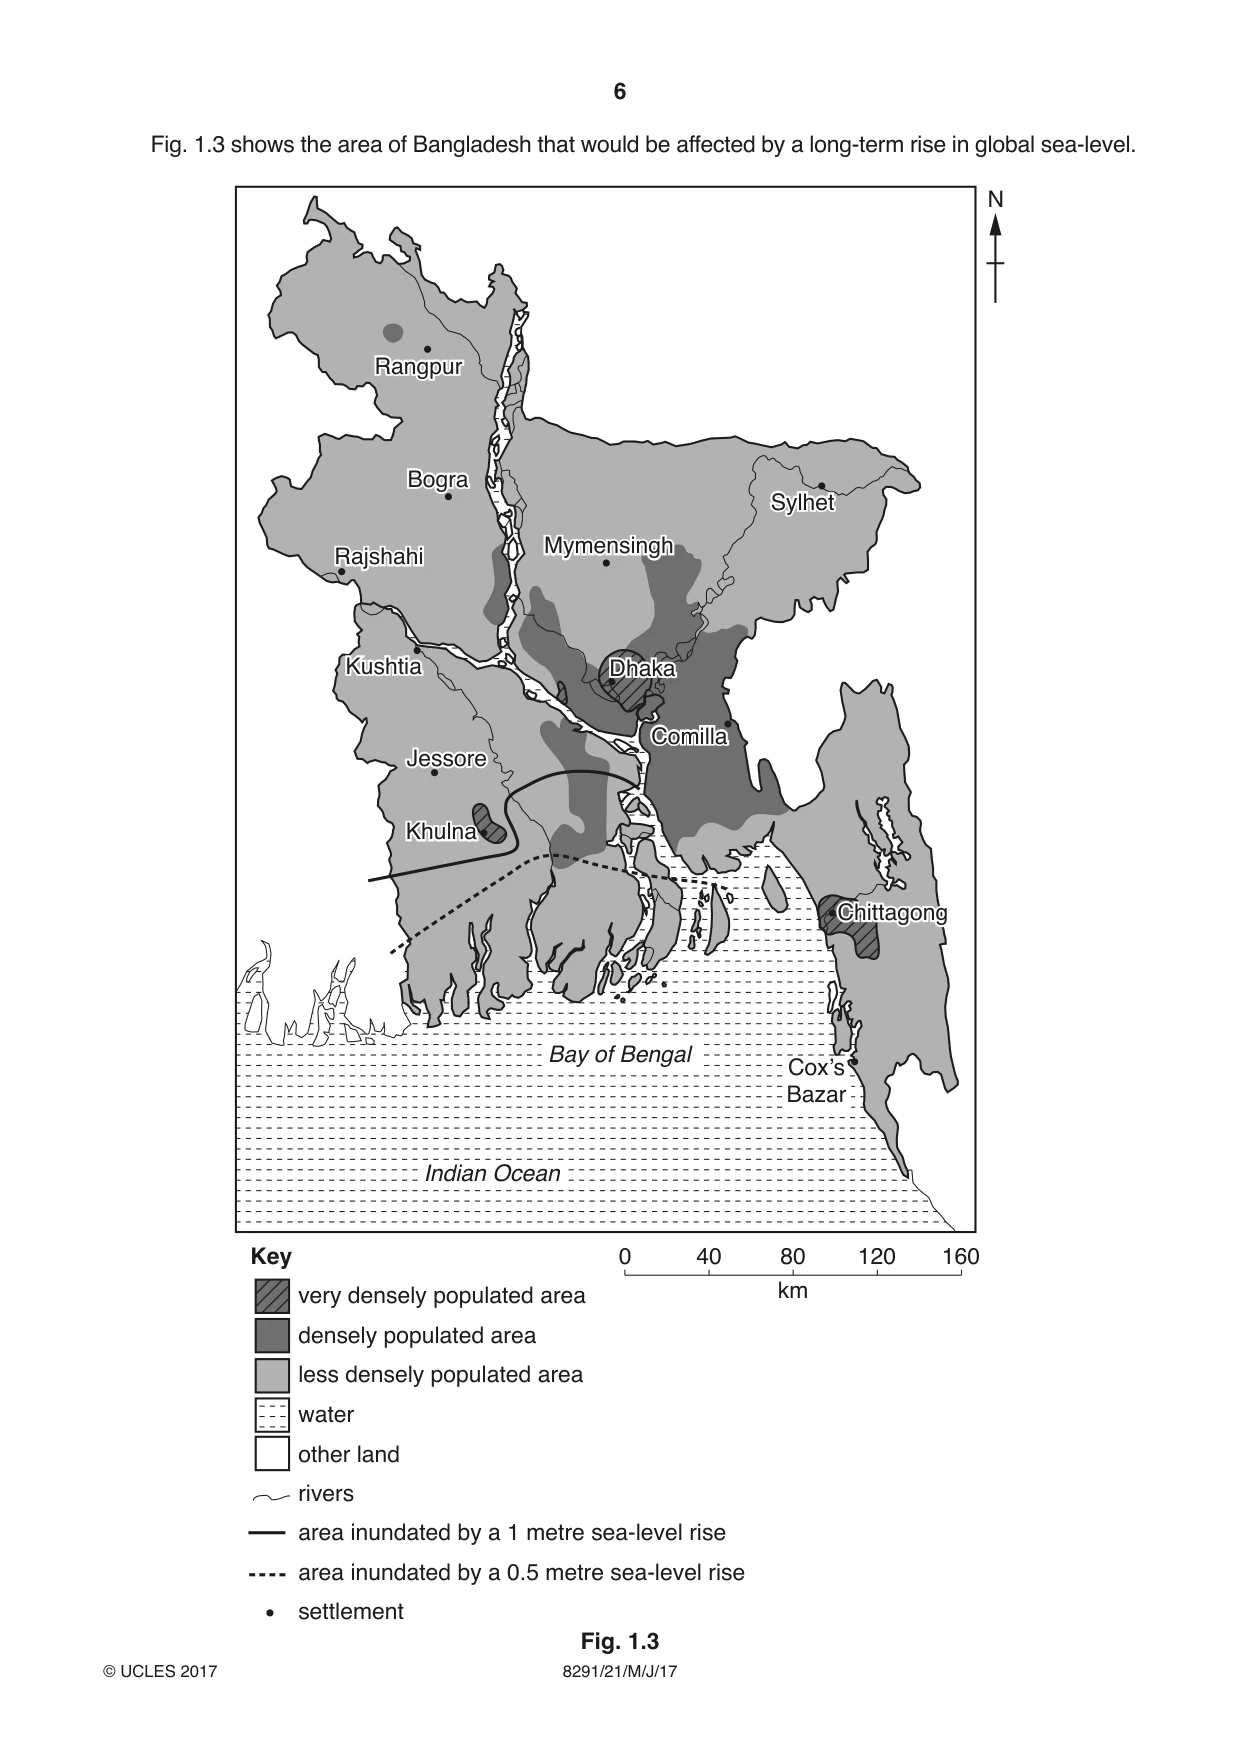
1 (a) Fig. 1.1 is a diagram representing some of the flows and stores of the hydrological cycle. vapour transport 40 precipitation 111 precipitation 71 385 evaporation run-off 425 evaporation infiltration lake river ocean groundwater flow values are in hundred thousand km3 Fig. 1.1 (i) State what is meant by the terms run-off and infiltration. run-off ................................................................................................................................ ........................................................................................................................................... infiltration ........................................................................................................................... ........................................................................................................................................... [2] (ii) Use Fig. 1.1 to explain why more water evaporates from the ocean than returns to the ocean as precipitation. ........................................................................................................................................... ........................................................................................................................................... ........................................................................................................................................... ........................................................................................................................................... ........................................................................................................................................... ........................................................................................................................................... ........................................................................................................................................... .......................................................................................................................................[4] (iii) Describe one process, other than evaporation, in which water changes state in the hydrological cycle. ........................................................................................................................................... ........................................................................................................................................... ........................................................................................................................................... .......................................................................................................................................[2] (b) Fig. 1.2 shows changes in past global sea-levels and predicted global sea-levels. The predicted global sea-levels are based upon climate change models produced in 2000. 1.4 1.4 past predicted 1.2 1.2 1.0 1.0 0.8 0.8 change in change in 0.6 0.6 global global sea-level sea-level 0.4 0.4 / m / m 0.2 0.2 0.0 0.0 –0.2 –0.2 –0.4 –0.4 250 500 750 1000 1250 1500 1750 2000 2000 2050 2100 year year Key range of values mean value Fig. 1.2 (i) With reference to Fig. 1.2, describe the changes in global sea-levels in the years before 2000. ........................................................................................................................................... ........................................................................................................................................... ........................................................................................................................................... .......................................................................................................................................[2] (ii) Suggest reasons why data before 1870 has a range of values for the change in global sea-level. ........................................................................................................................................... ........................................................................................................................................... ........................................................................................................................................... .......................................................................................................................................[2] Fig. 1.3 shows the area of Bangladesh that would be affected by a long-term rise in global sea-level. N Rangpur Bogra Sylhet Mymensingh Rajshahi Kushtia Dhaka Comilla Jessore Khulna Chittagong Bay of Bengal Cox’s Bazar Indian Ocean Key 0 40 80 120 160 very densely populated area km densely populated area less densely populated area water other land rivers area inundated by a 1 metre sea-level rise area inundated by a 0.5 metre sea-level rise settlement Fig. 1.3 (iii) Suggest the likely effects of a long-term rise in global sea-level on the environment and people of Bangladesh by the year 2100. Refer to Fig. 1.2 and Fig. 1.3 in your answer. ........................................................................................................................................... ........................................................................................................................................... ........................................................................................................................................... ........................................................................................................................................... ........................................................................................................................................... ........................................................................................................................................... ........................................................................................................................................... ........................................................................................................................................... ........................................................................................................................................... ........................................................................................................................................... ........................................................................................................................................... ........................................................................................................................................... ........................................................................................................................................... ........................................................................................................................................... ........................................................................................................................................... .......................................................................................................................................[8] [Total: 20]
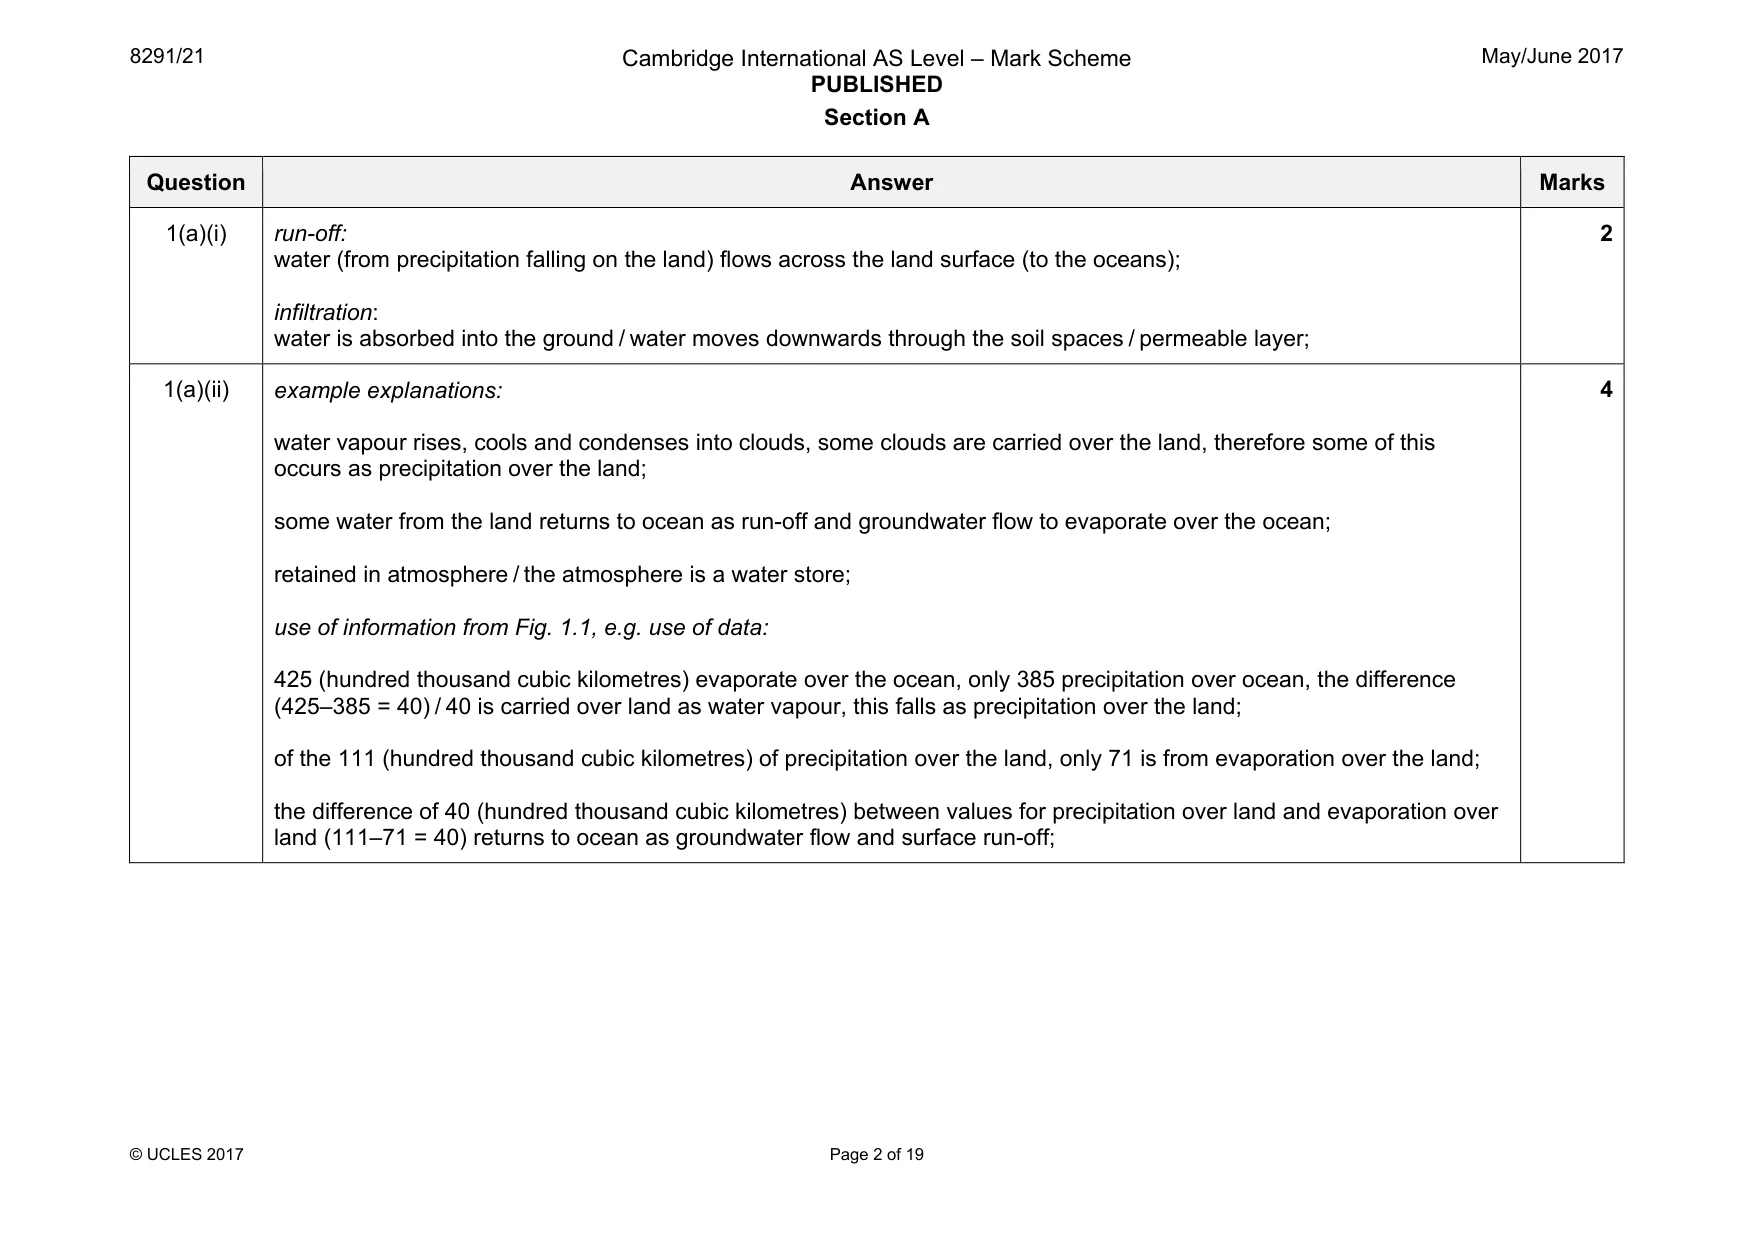
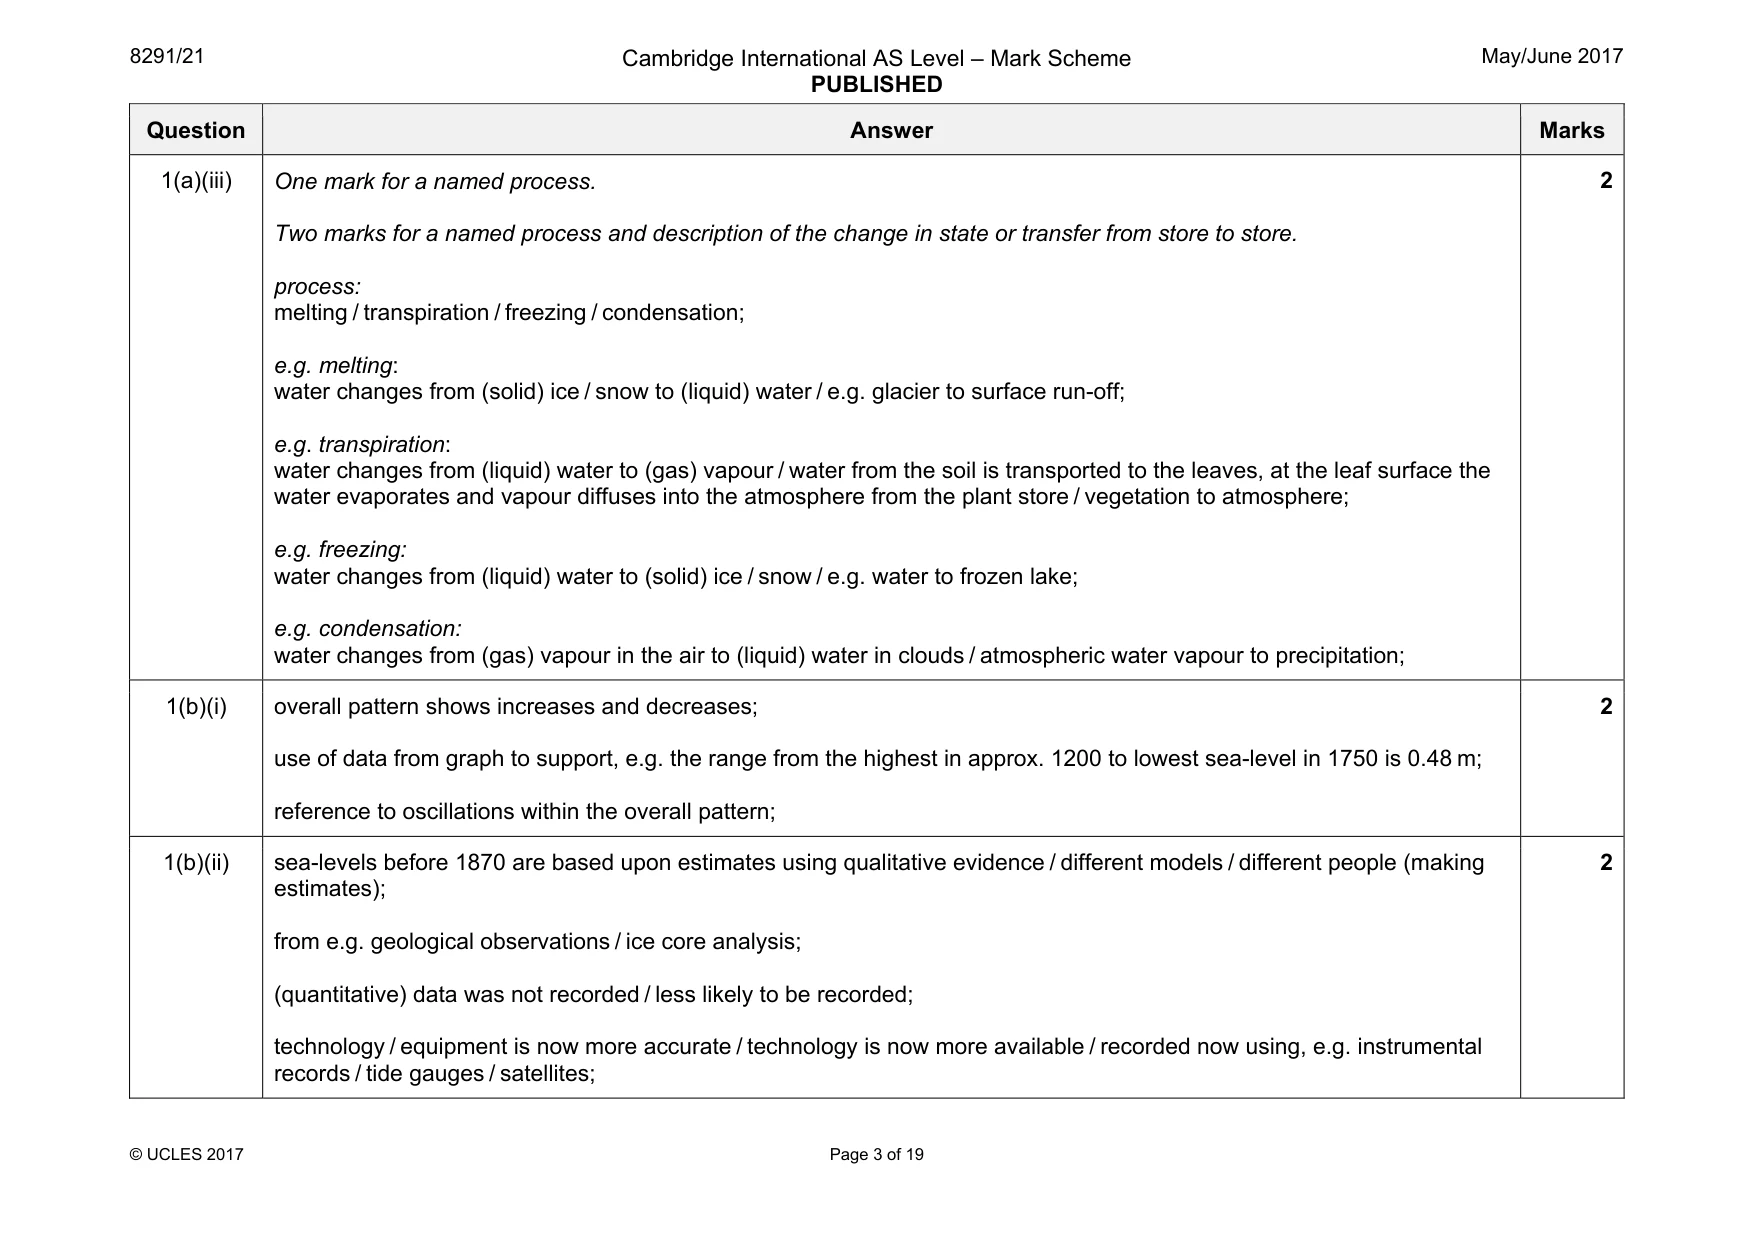
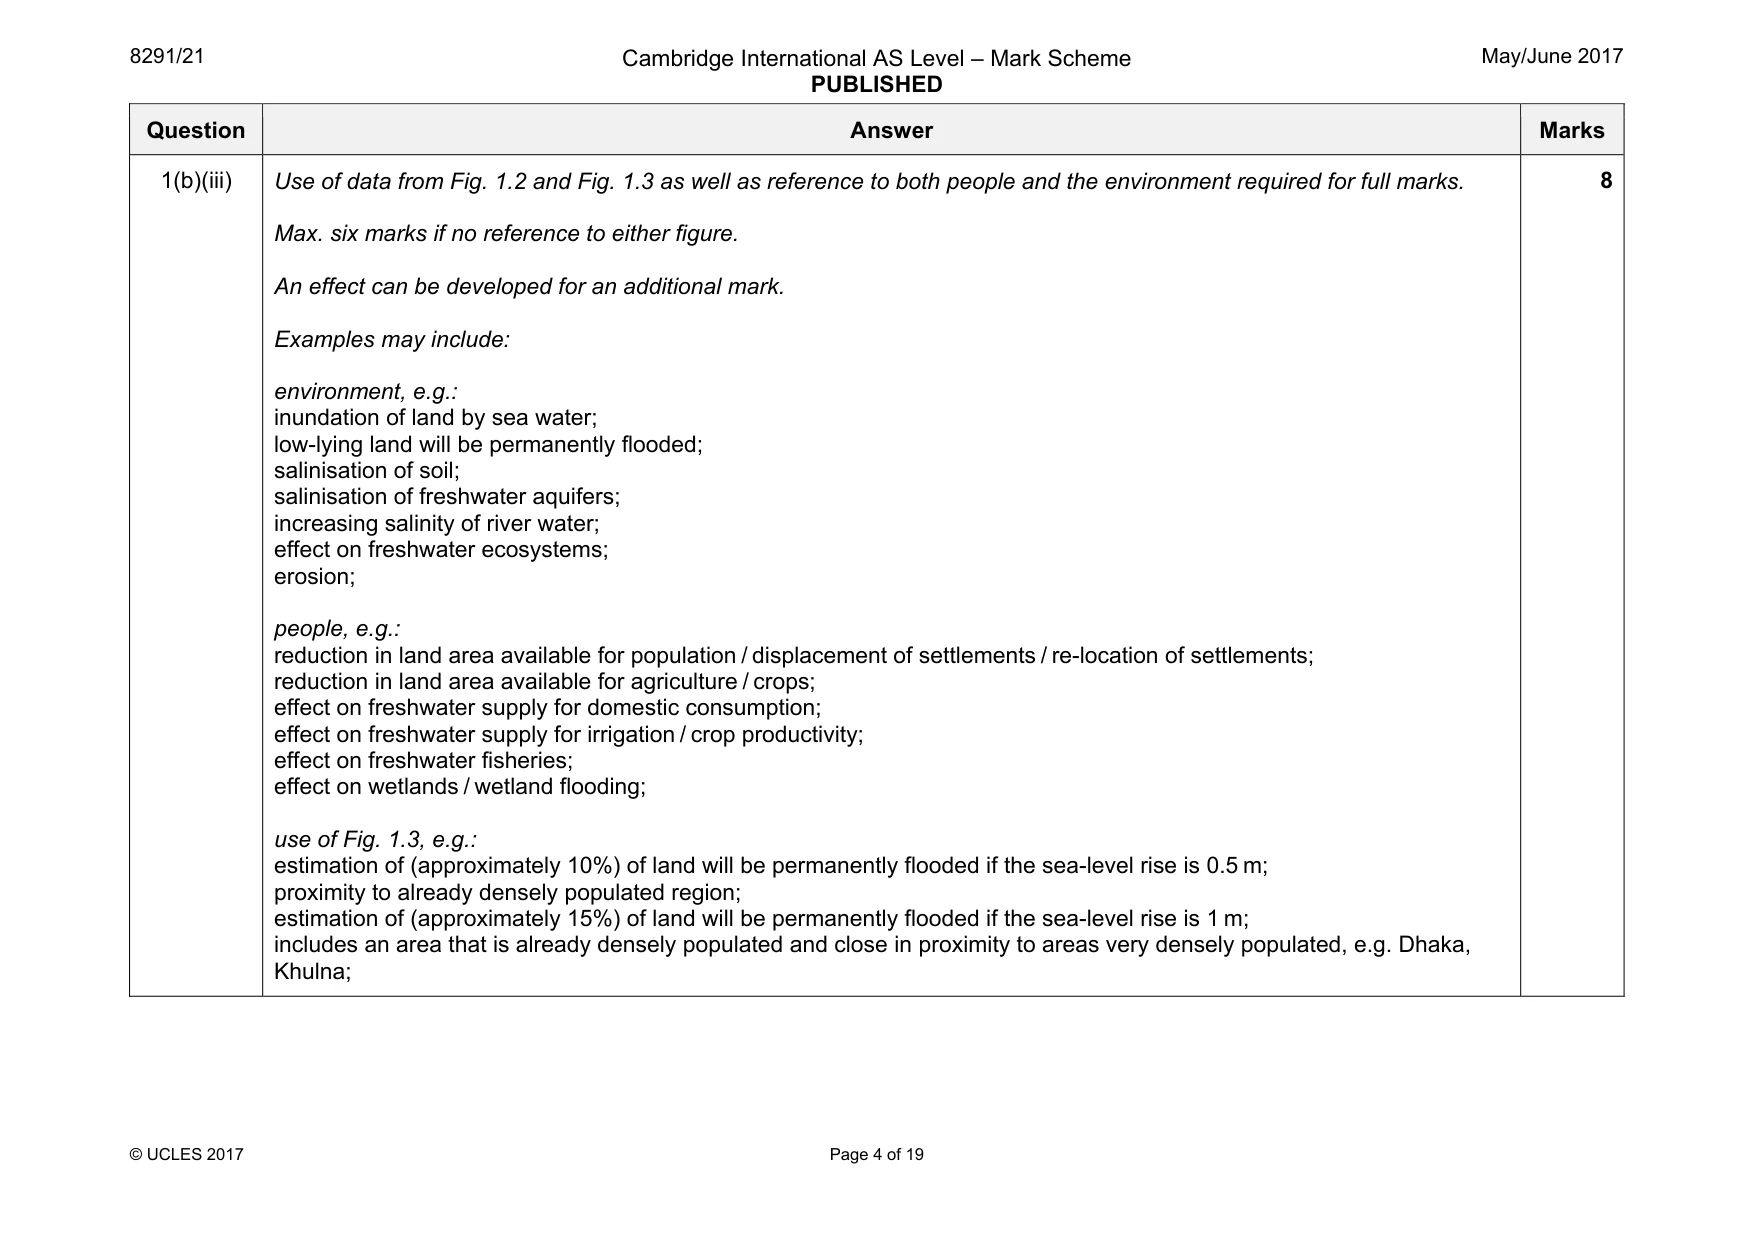
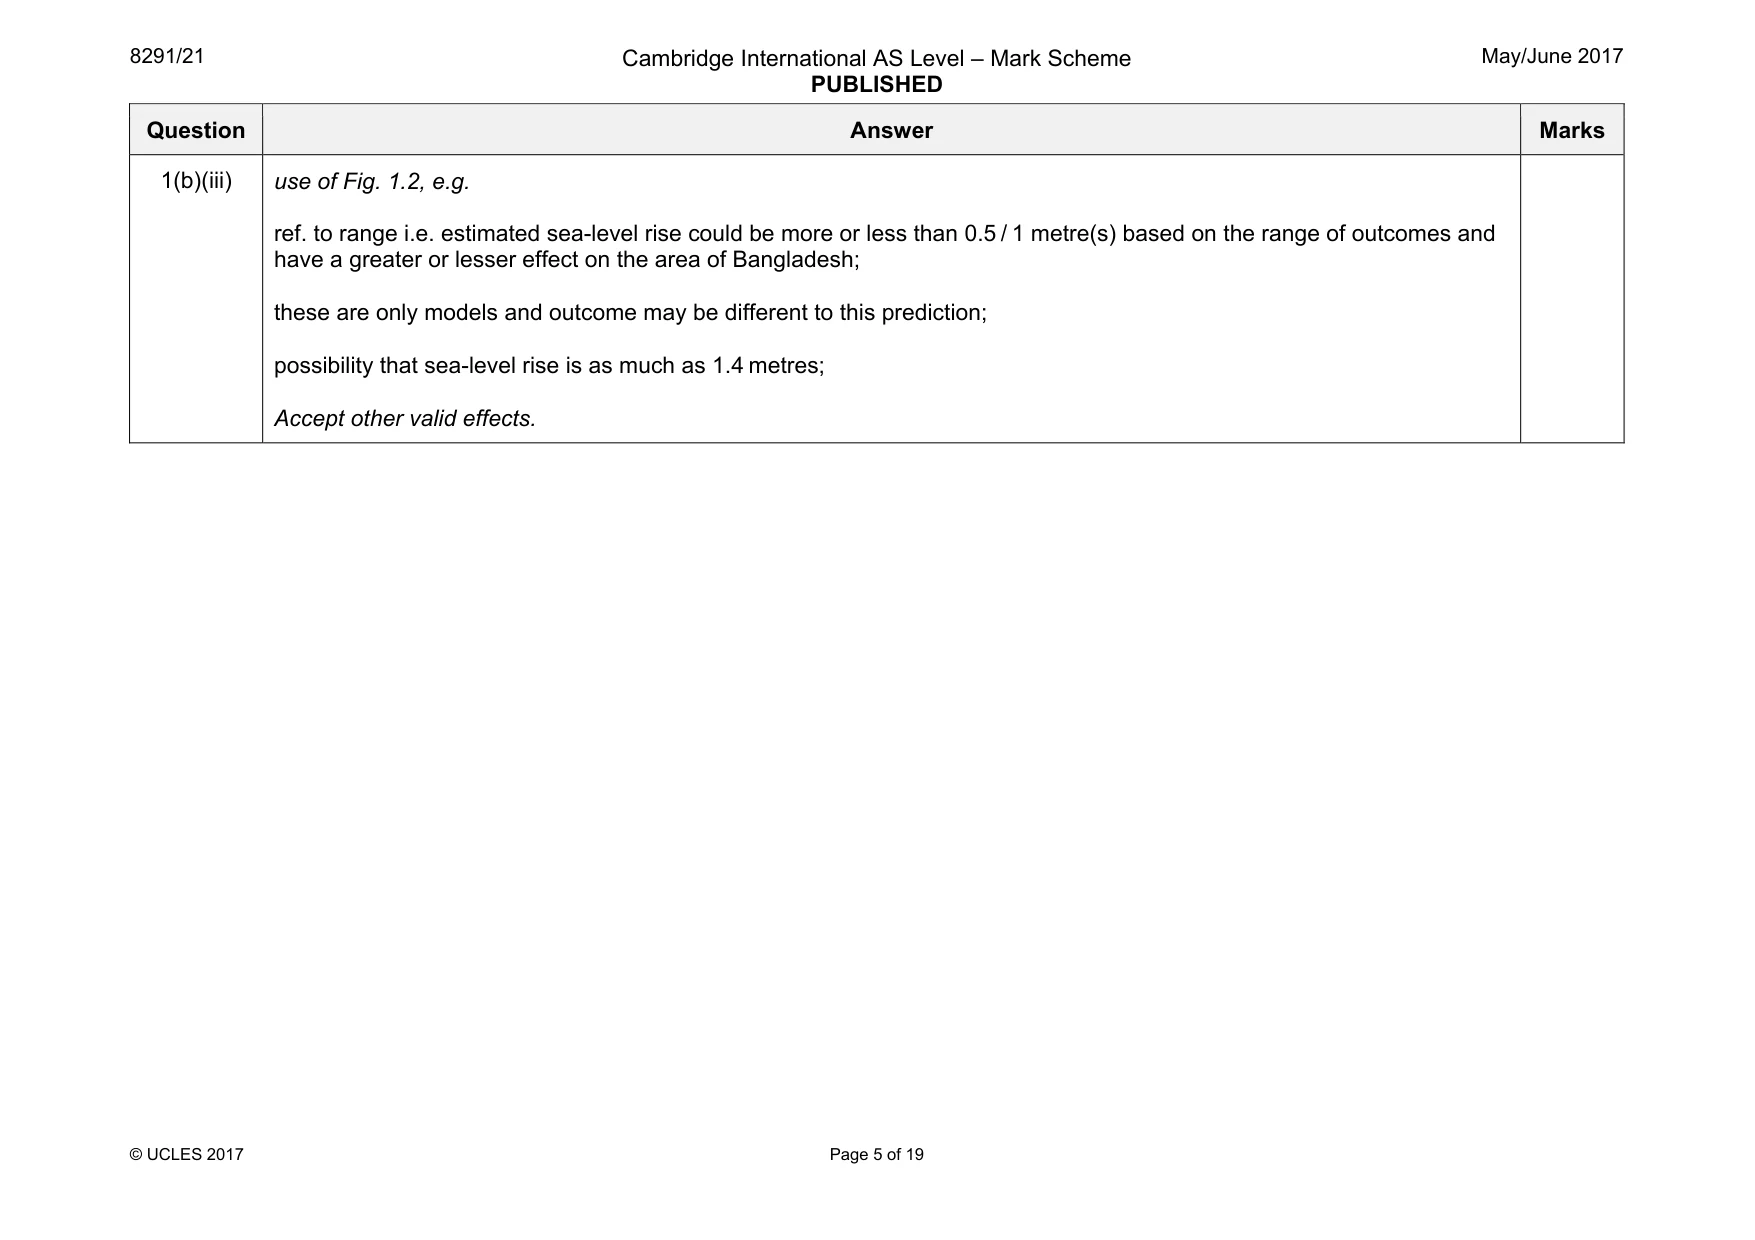
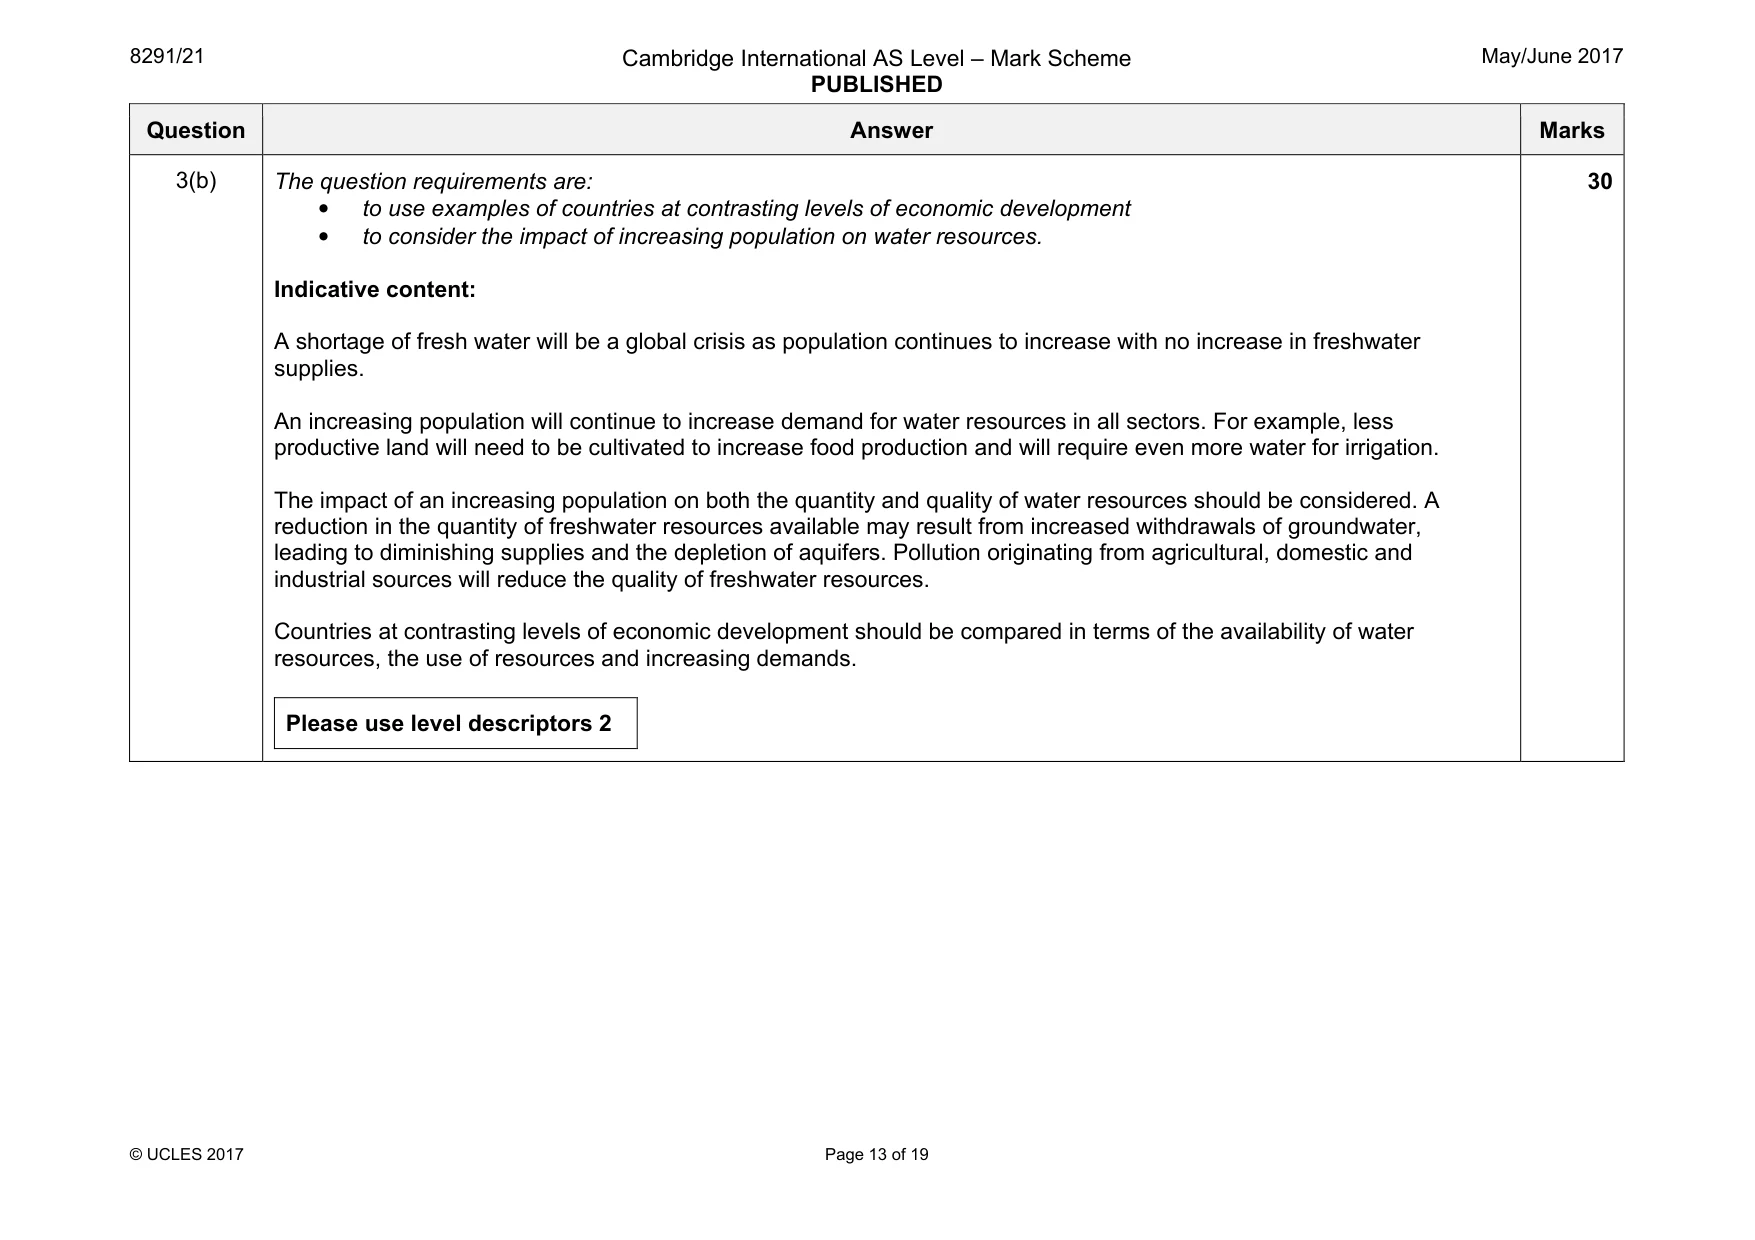
Mark scheme: 1(a)(i) run-off: water (from precipitation falling on the land) flows across the land surface (to the oceans); infiltration: water is absorbed into the ground / water moves downwards through the soil spaces / permeable layer; 2 1(a)(ii) example explanations: water vapour rises, cools and condenses into clouds, some clouds are carried over the land, therefore some of this occurs as precipitation over the land; some water from the land returns to ocean as run-off and groundwater flow to evaporate over the ocean; retained in atmosphere / the atmosphere is a water store; use of information from Fig. 1.1, e.g. use of data: 425 (hundred thousand cubic kilometres) evaporate over the ocean, only 385 precipitation over ocean, the difference (425–385 = 40) / 40 is carried over land as water vapour, this falls as precipitation over the land; of the 111 (hundred thousand cubic kilometres) of precipitation over the land, only 71 is from evaporation over the land; the difference of 40 (hundred thousand cubic kilometres) between values for precipitation over land and evaporation over land (111–71 = 40) returns to ocean as groundwater flow and surface run-off; 4 Question Answer Marks 1(a)(iii) One mark for a named process. Two marks for a named process and description of the change in state or transfer from store to store. process: melting / transpiration / freezing / condensation; e.g. melting: water changes from (solid) ice / snow to (liquid) water / e.g. glacier to surface run-off; e.g. transpiration: water changes from (liquid) water to (gas) vapour / water from the soil is transported to the leaves, at the leaf surface the water evaporates and vapour diffuses into the atmosphere from the plant store / vegetation to atmosphere; e.g. freezing: water changes from (liquid) water to (solid) ice / snow / e.g. water to frozen lake; e.g. condensation: water changes from (gas) vapour in the air to (liquid) water in clouds / atmospheric water vapour to precipitation; 2 1(b)(i) overall pattern shows increases and decreases; use of data from graph to support, e.g. the range from the highest in approx. 1200 to lowest sea-level in 1750 is 0.48 m; reference to oscillations within the overall pattern; 2 1(b)(ii) sea-levels before 1870 are based upon estimates using qualitative evidence / different models / different people (making estimates); from e.g. geological observations / ice core analysis; (quantitative) data was not recorded / less likely to be recorded; technology / equipment is now more accurate / technology is now more available / recorded now using, e.g. instrumental records / tide gauges / satellites; 2 Question Answer Marks 1(b)(iii) Use of data from Fig. 1.2 and Fig. 1.3 as well as reference to both people and the environment required for full marks. Max. six marks if no reference to either figure. An effect can be developed for an additional mark. Examples may include: environment, e.g.: inundation of land by sea water; low-lying land will be permanently flooded; salinisation of soil; salinisation of freshwater aquifers; increasing salinity of river water; effect on freshwater ecosystems; erosion; people, e.g.: reduction in land area available for population / displacement of settlements / re-location of settlements; reduction in land area available for agriculture / crops; effect on freshwater supply for domestic consumption; effect on freshwater supply for irrigation / crop productivity; effect on freshwater fisheries; effect on wetlands / wetland flooding; use of Fig. 1.3, e.g.: estimation of (approximately 10%) of land will be permanently flooded if the sea-level rise is 0.5 m; proximity to already densely populated region; estimation of (approximately 15%) of land will be permanently flooded if the sea-level rise is 1 m; includes an area that is already densely populated and close in proximity to areas very densely populated, e.g. Dhaka, Khulna; 8 Question Answer Marks 1(b)(iii) use of Fig. 1.2, e.g. ref. to range i.e. estimated sea-level rise could be more or less than 0.5 / 1 metre(s) based on the range of outcomes and have a greater or lesser effect on the area of Bangladesh; these are only models and outcome may be different to this prediction; possibility that sea-level rise is as much as 1.4 metres; Accept other valid effects.
Q2 · A lake is an example of an ecosystem
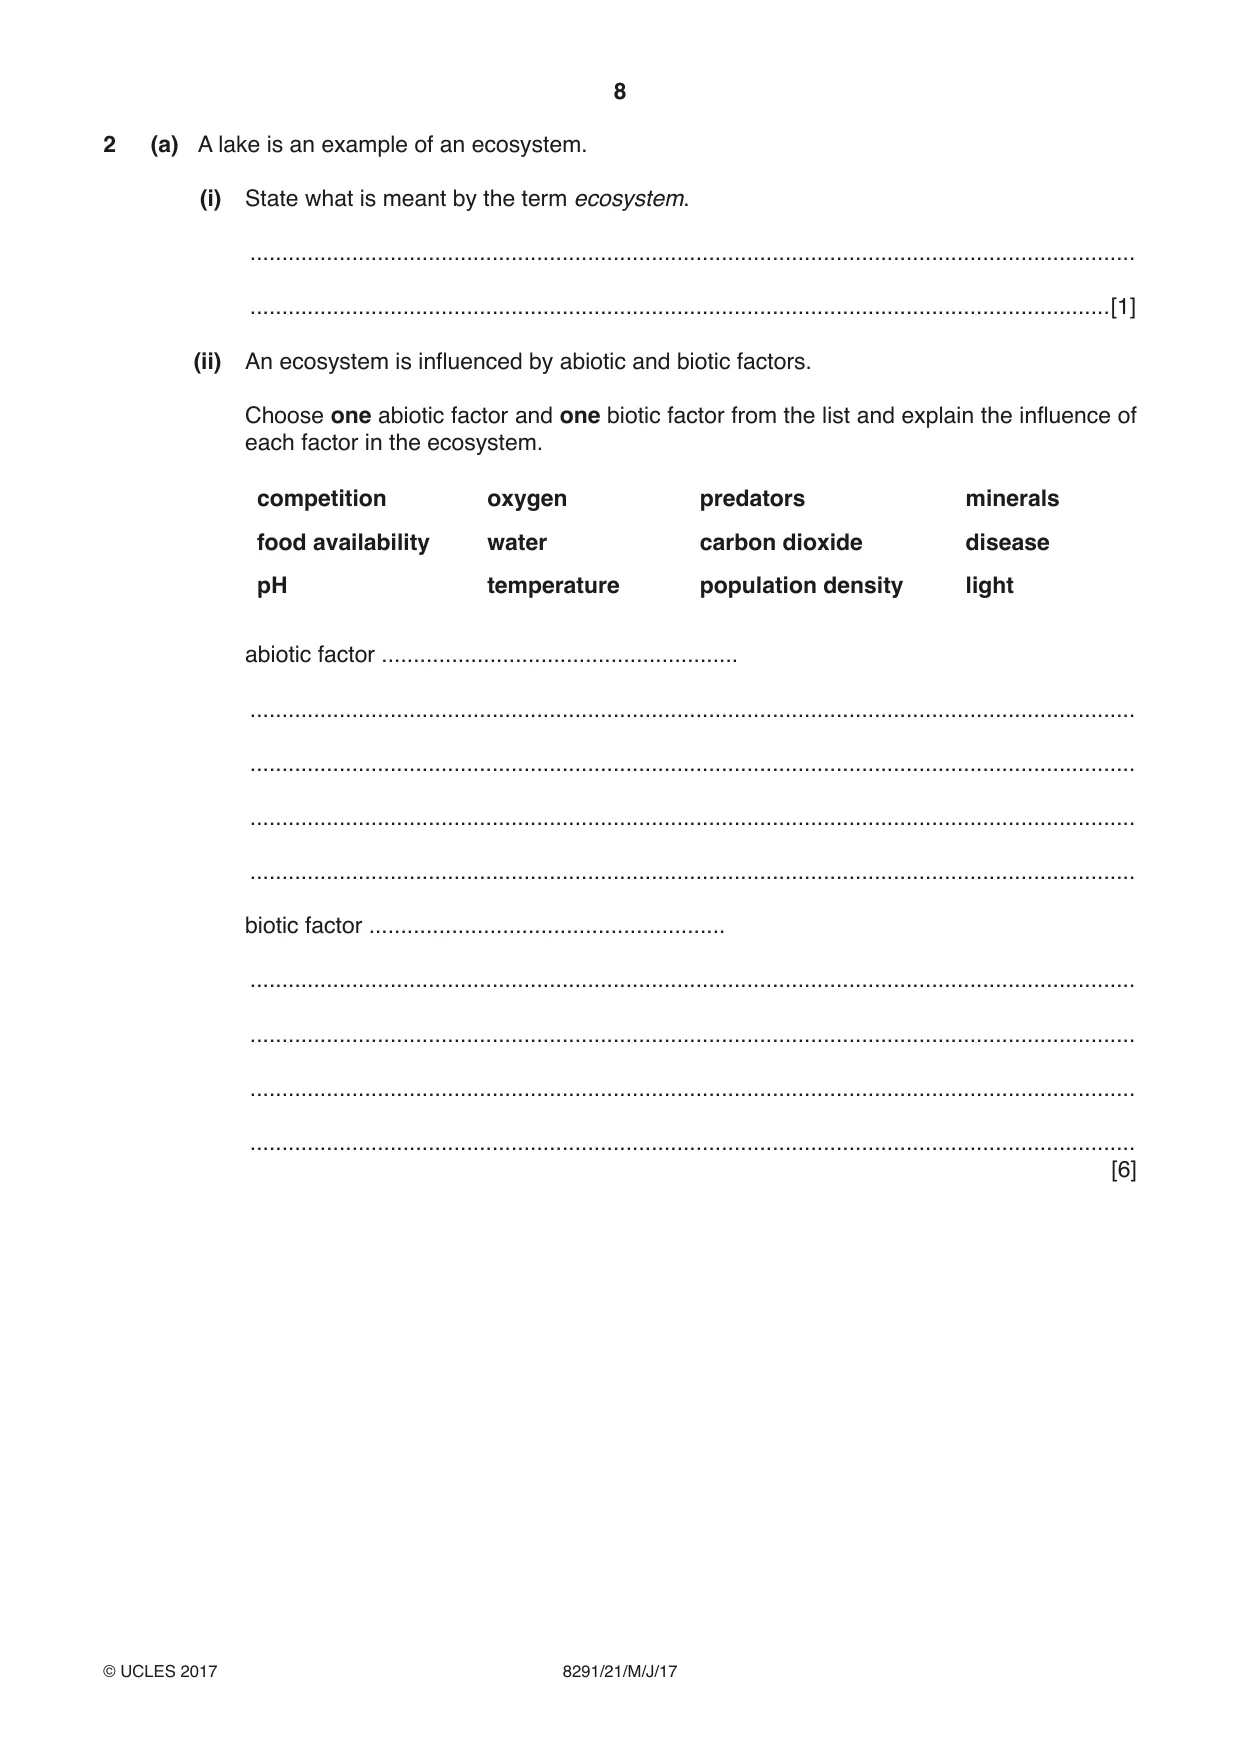
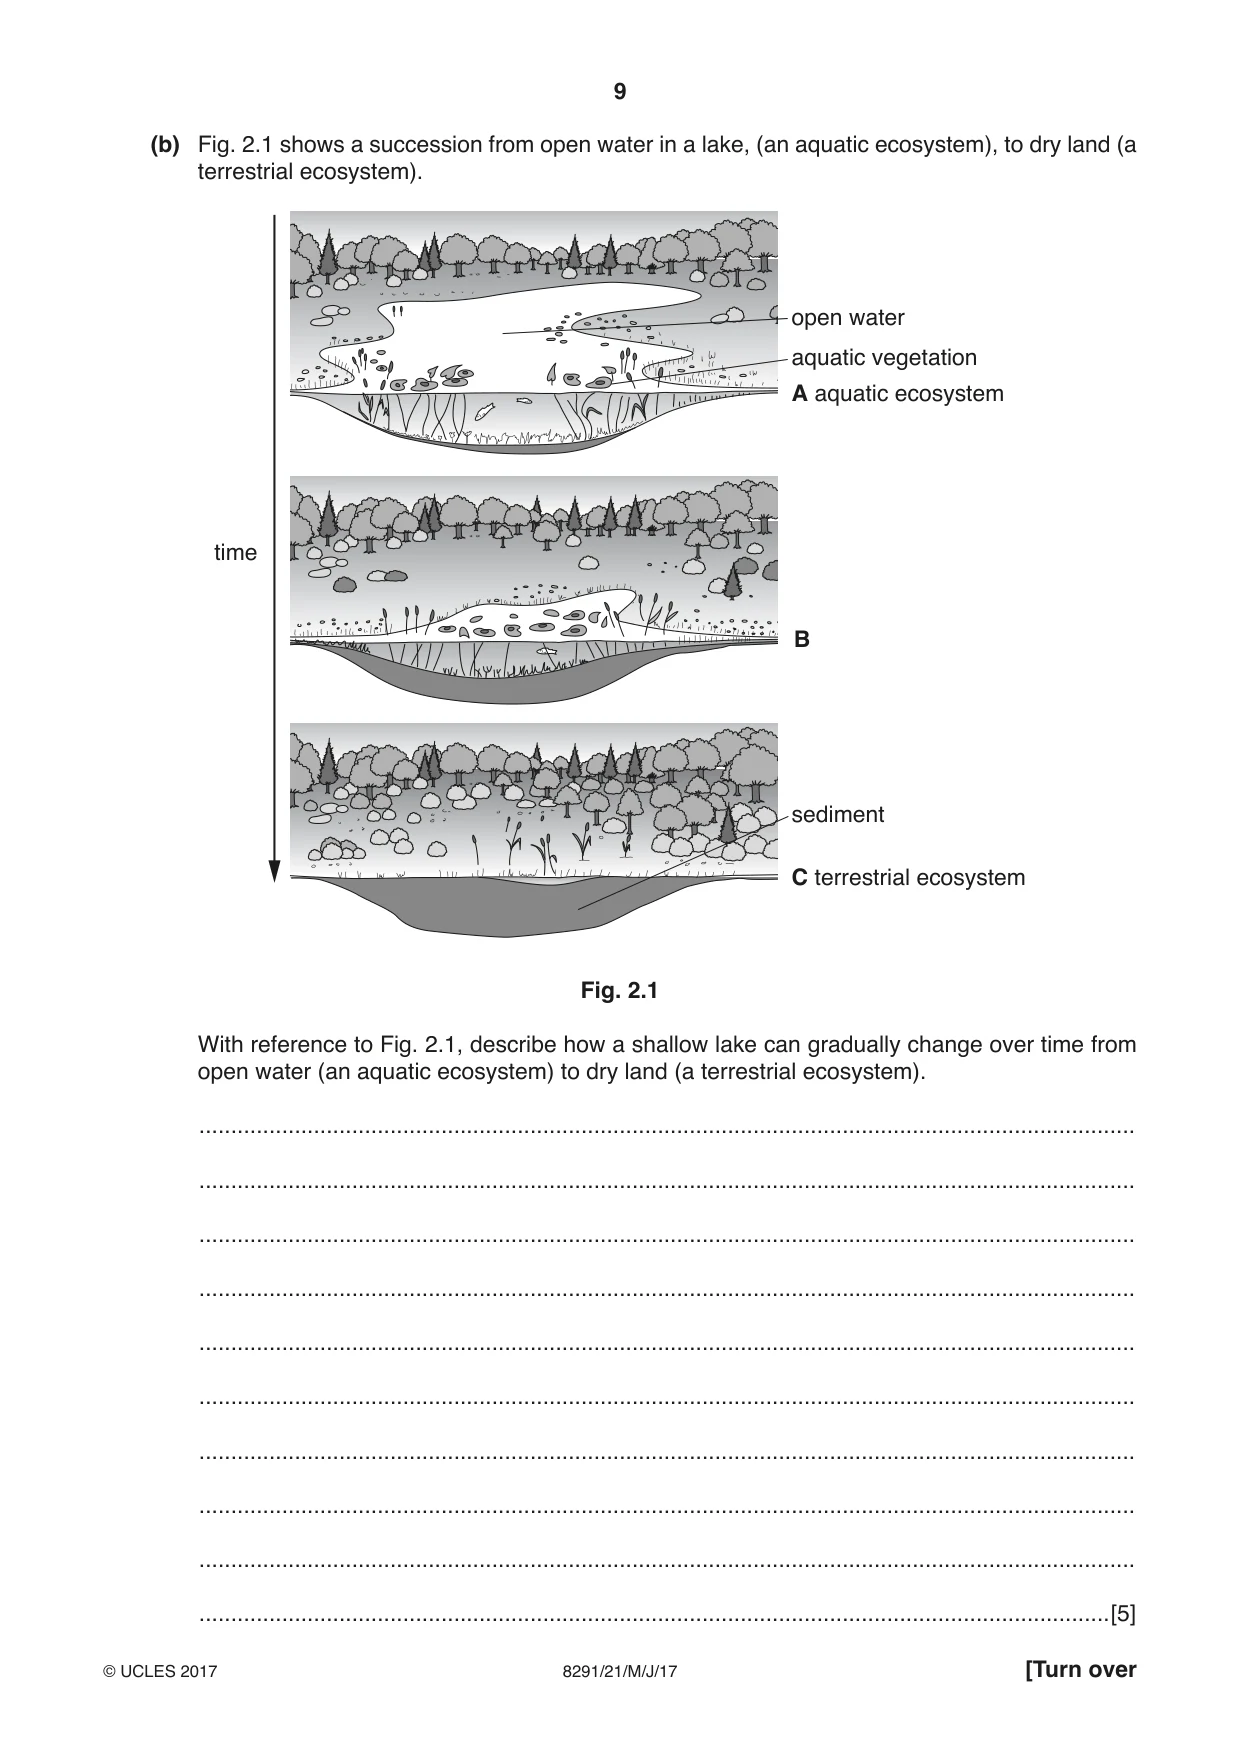
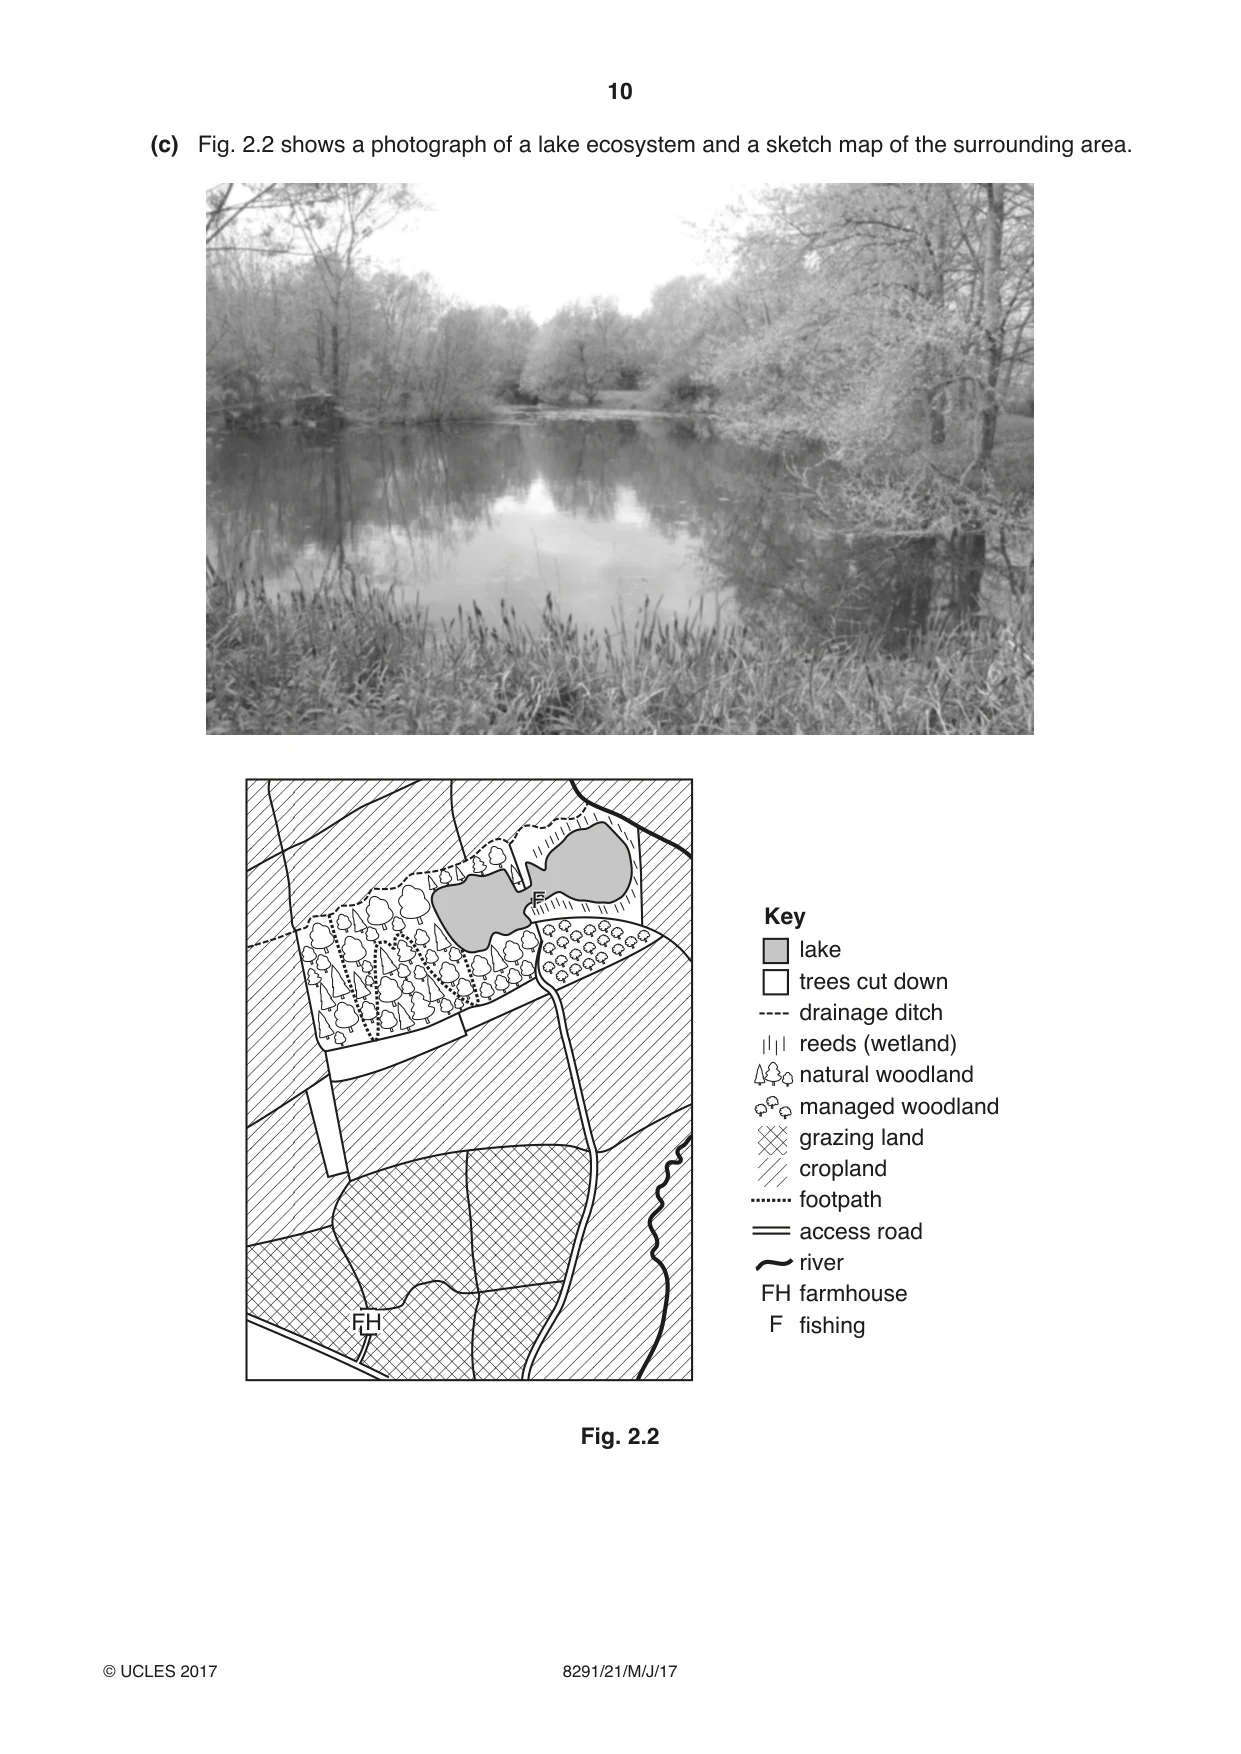
2 (a) A lake is an example of an ecosystem. (i) State what is meant by the term ecosystem. ........................................................................................................................................... .......................................................................................................................................[1] (ii) An ecosystem is influenced by abiotic and biotic factors. Choose one abiotic factor and one biotic factor from the list and explain the influence of each factor in the ecosystem. competition oxygen predators minerals food availability water carbon dioxide disease pH temperature population density light abiotic factor ........................................................ ........................................................................................................................................... ........................................................................................................................................... ........................................................................................................................................... ........................................................................................................................................... biotic factor ........................................................ ........................................................................................................................................... ........................................................................................................................................... ........................................................................................................................................... ........................................................................................................................................... [6] (b) Fig. 2.1 shows a succession from open water in a lake, (an aquatic ecosystem), to dry land (a terrestrial ecosystem). open water aquatic vegetation A aquatic ecosystem time B sediment C terrestrial ecosystem Fig. 2.1 With reference to Fig. 2.1, describe how a shallow lake can gradually change over time from open water (an aquatic ecosystem) to dry land (a terrestrial ecosystem). ................................................................................................................................................... ................................................................................................................................................... ................................................................................................................................................... ................................................................................................................................................... ................................................................................................................................................... ................................................................................................................................................... ................................................................................................................................................... ................................................................................................................................................... ................................................................................................................................................... ...............................................................................................................................................[5] (c) Fig. 2.2 shows a photograph of a lake ecosystem and a sketch map of the surrounding area. F Key lake trees cut down drainage ditch reeds (wetland) natural woodland managed woodland grazing land cropland footpath access road river FH farmhouse FH F fishing Fig. 2.2 (i) Outline the benefits of conserving a lake ecosystem. ........................................................................................................................................... ........................................................................................................................................... ........................................................................................................................................... ........................................................................................................................................... ........................................................................................................................................... .......................................................................................................................................[3] (ii) Suggest ways in which a lake and surrounding area can be managed for conservation. Refer to Fig. 2.2 in your answer. ........................................................................................................................................... ........................................................................................................................................... ........................................................................................................................................... ........................................................................................................................................... ........................................................................................................................................... ........................................................................................................................................... ........................................................................................................................................... ........................................................................................................................................... ........................................................................................................................................... .......................................................................................................................................[5] [Total: 20]
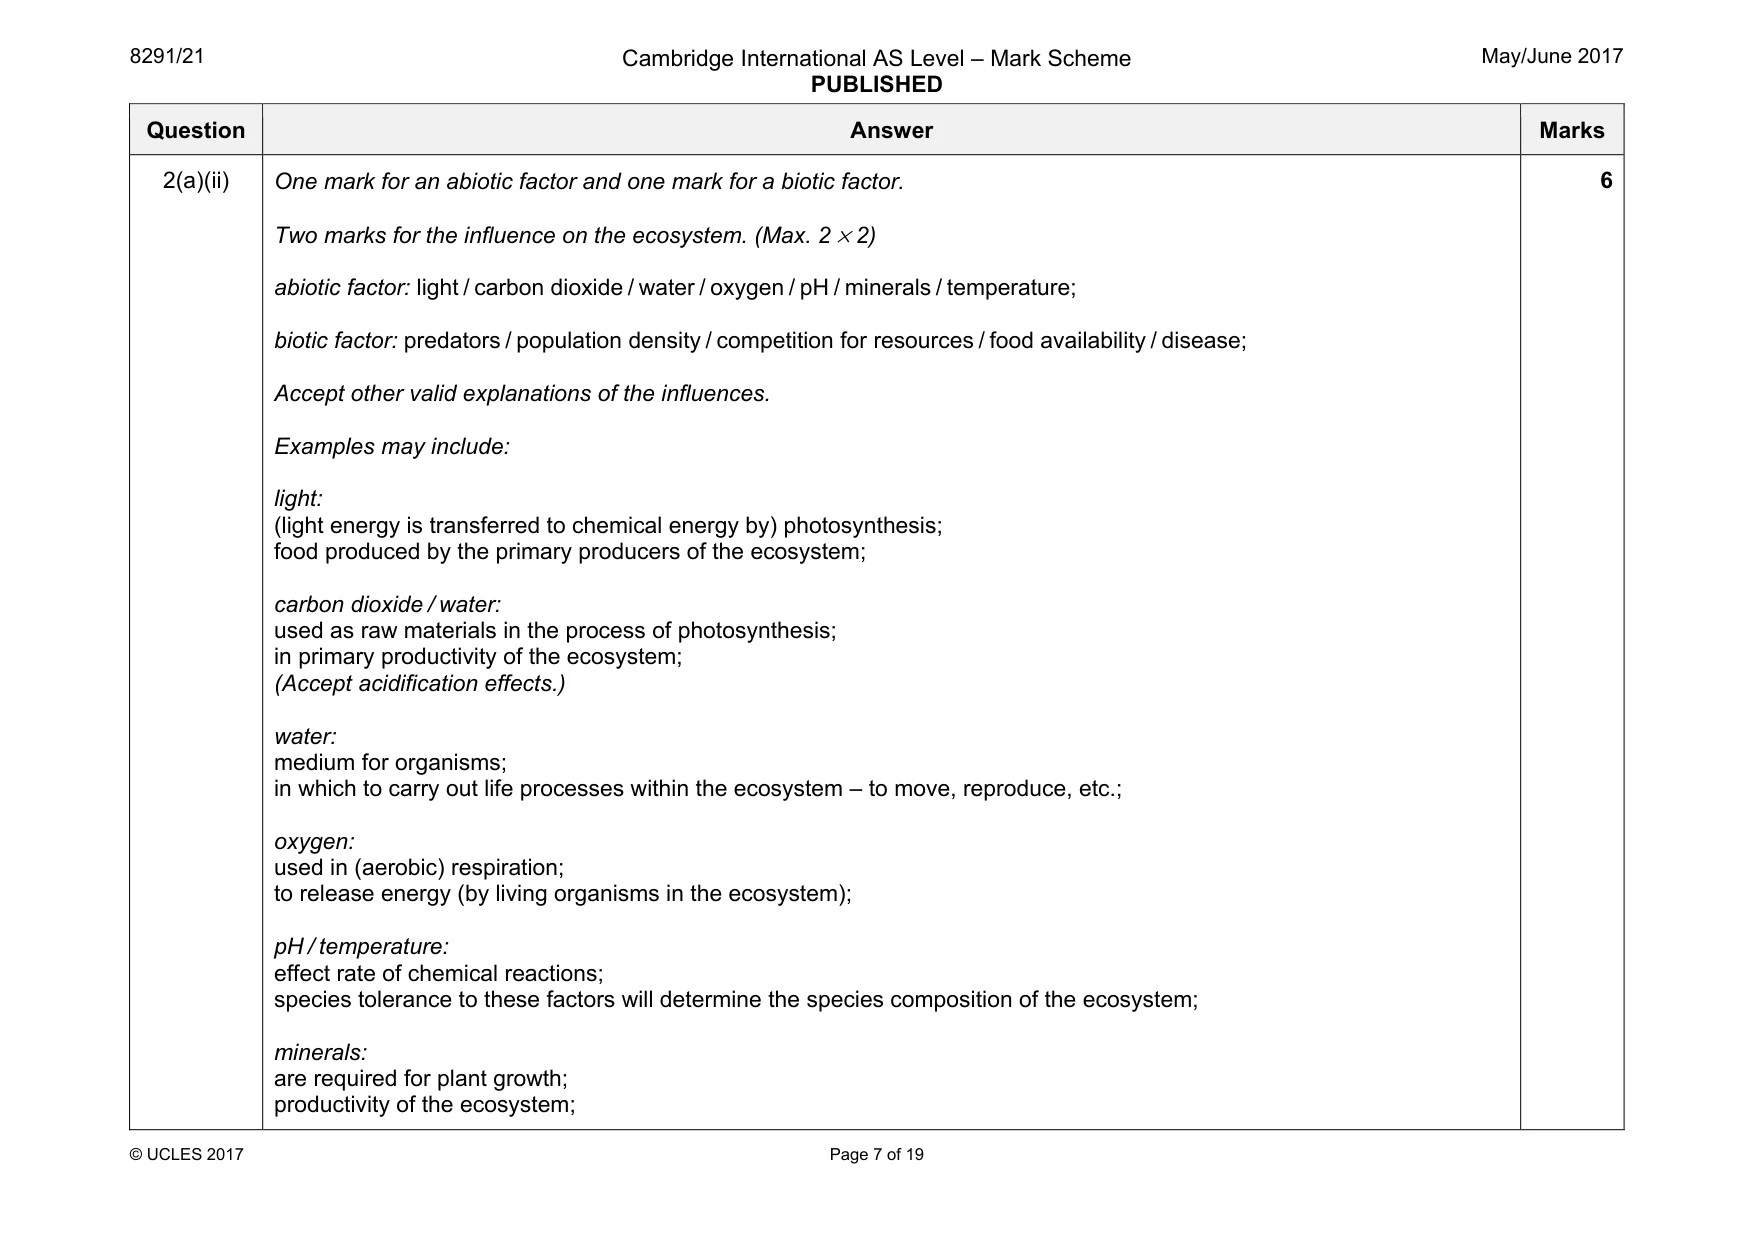
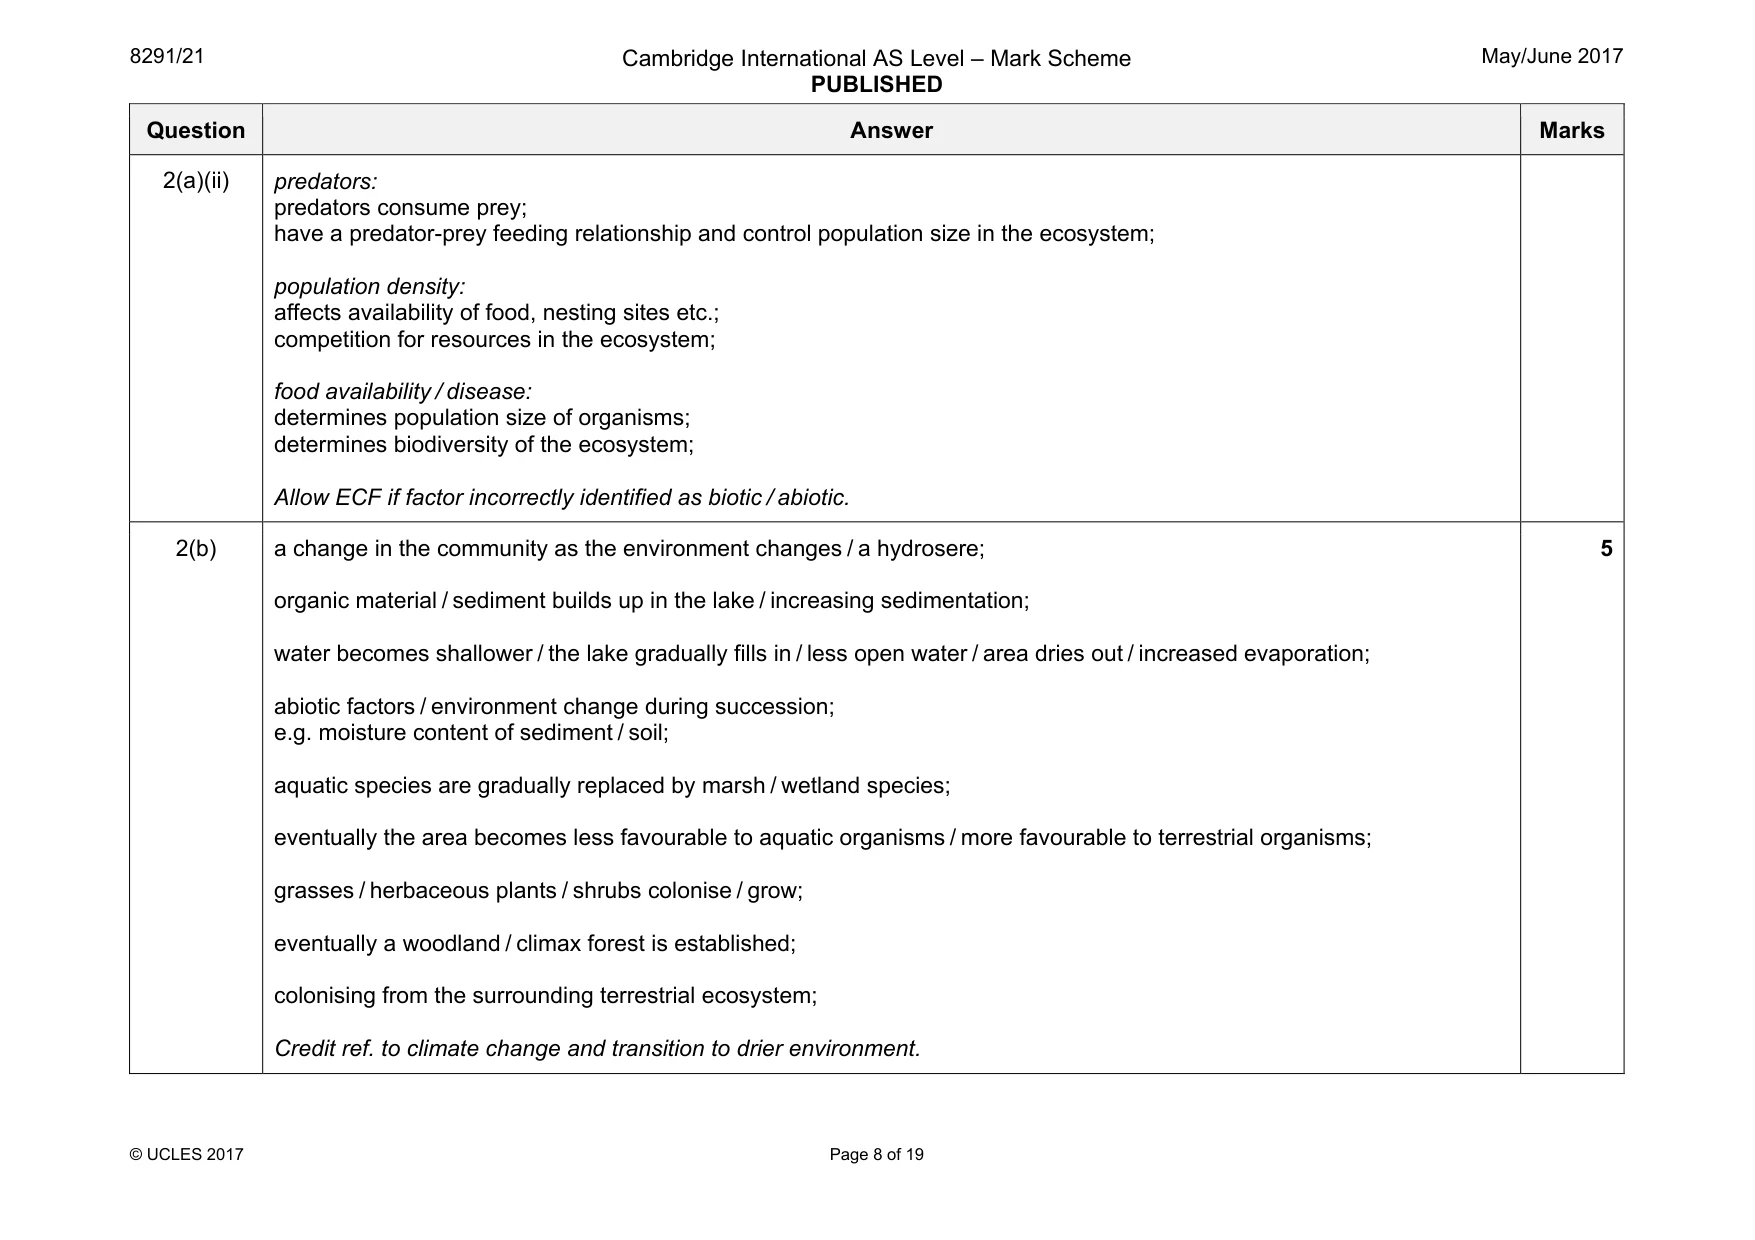
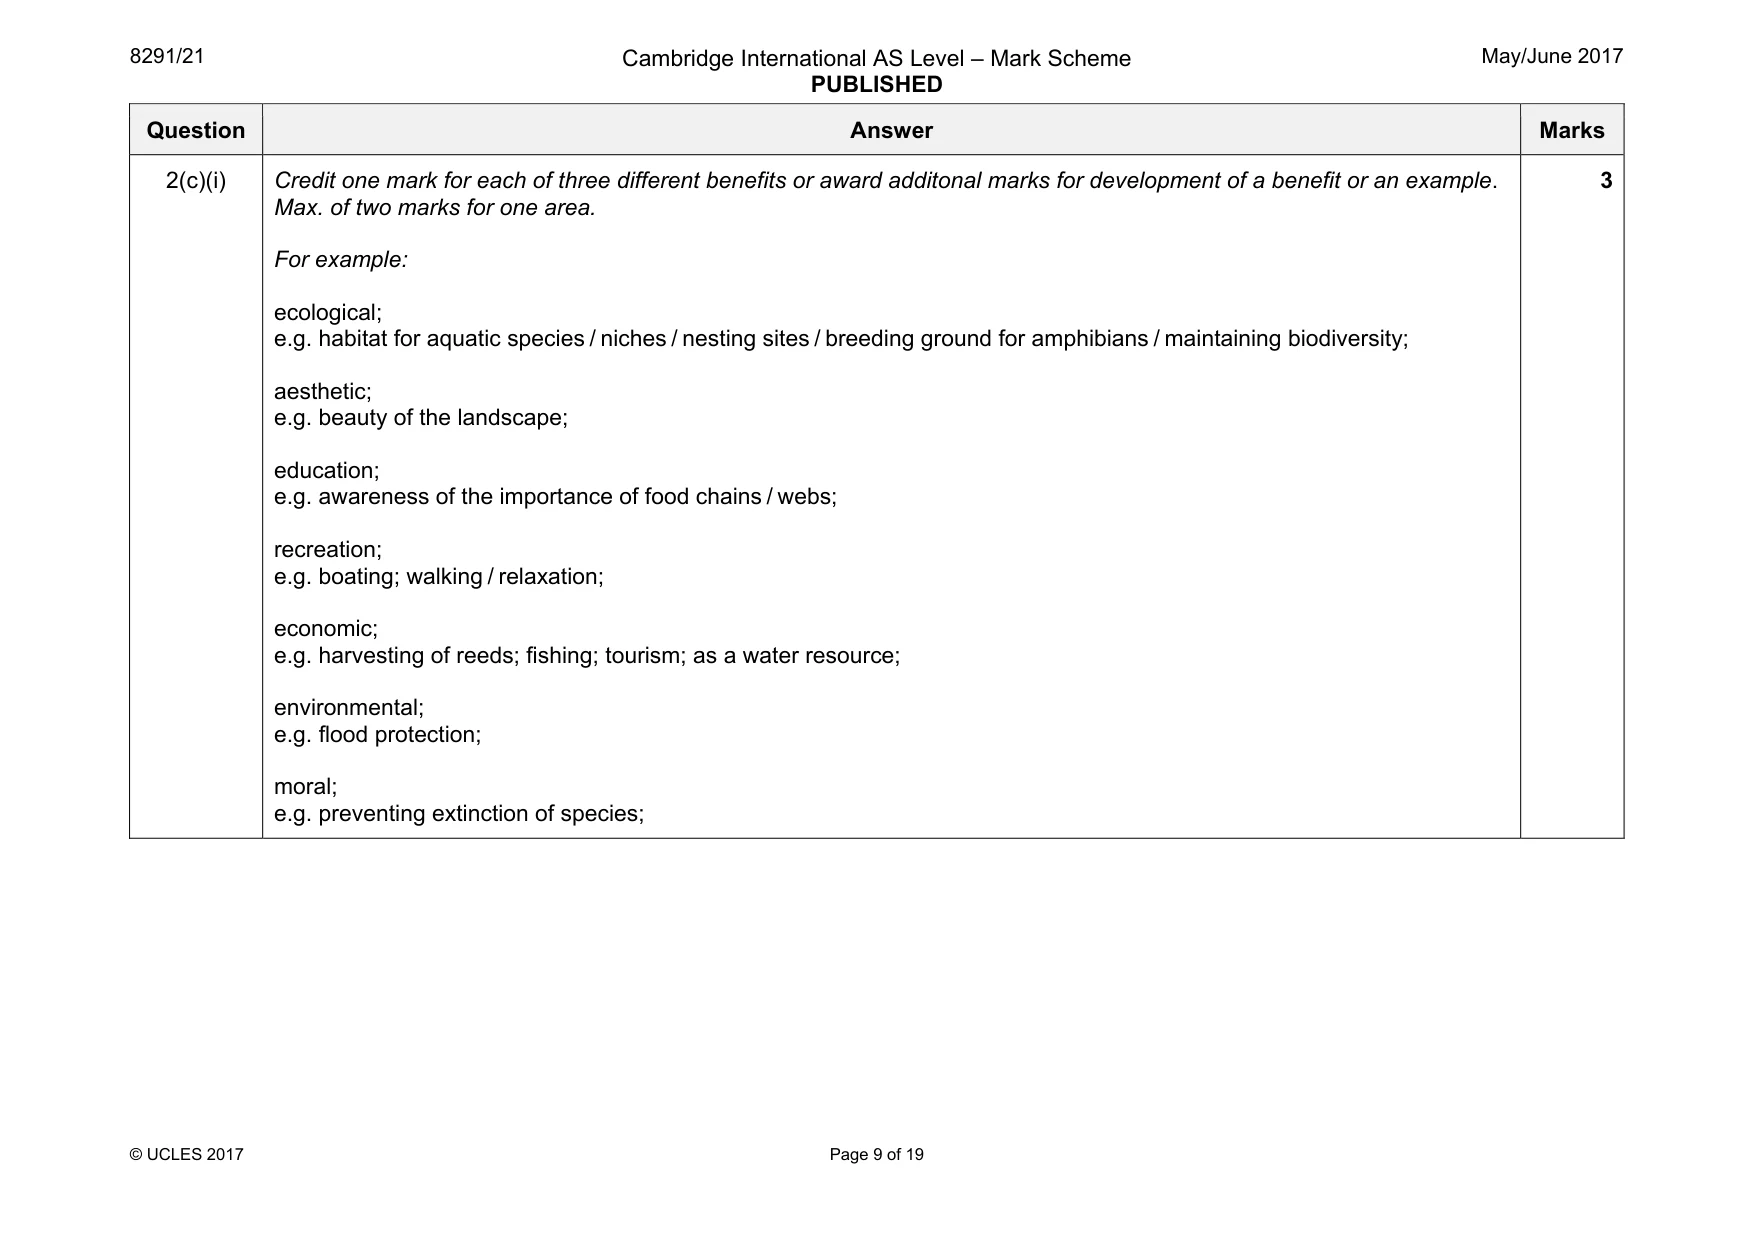
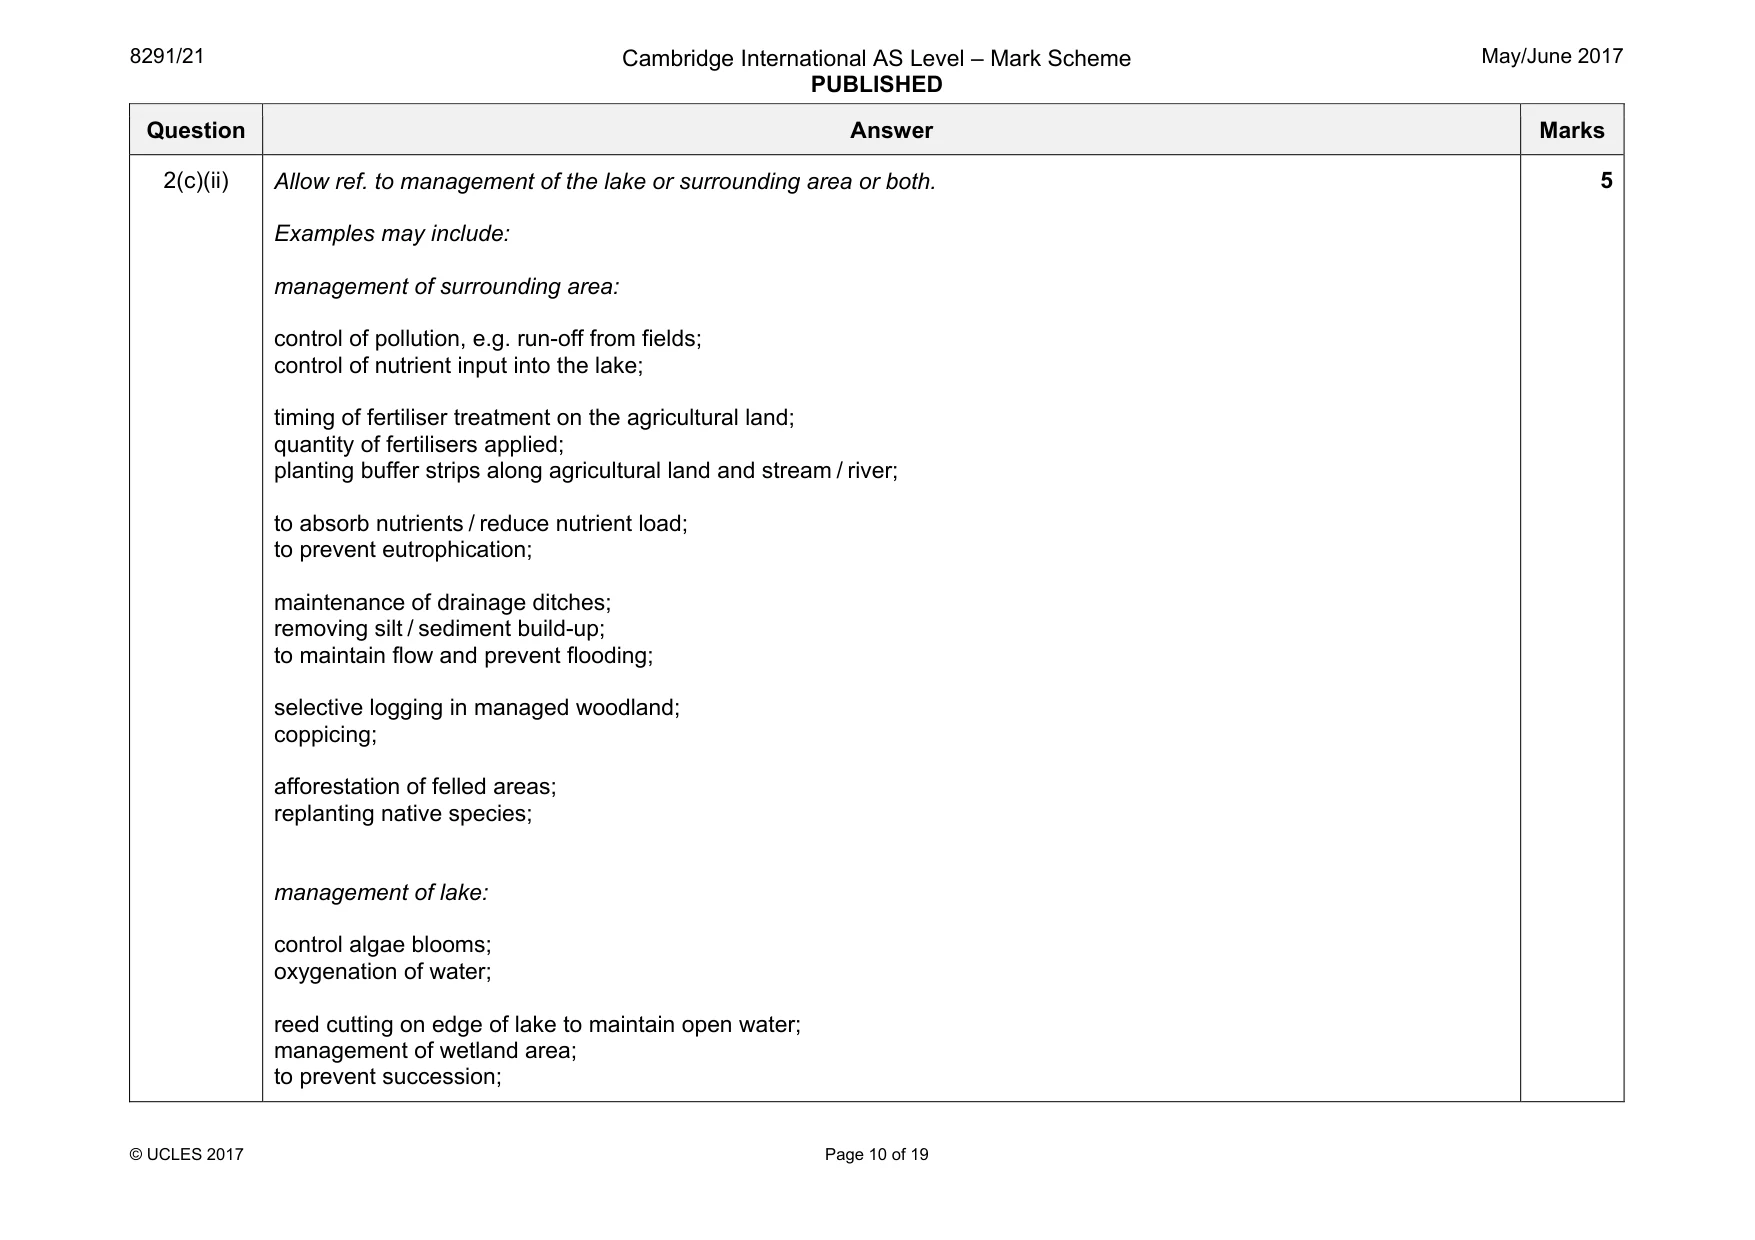
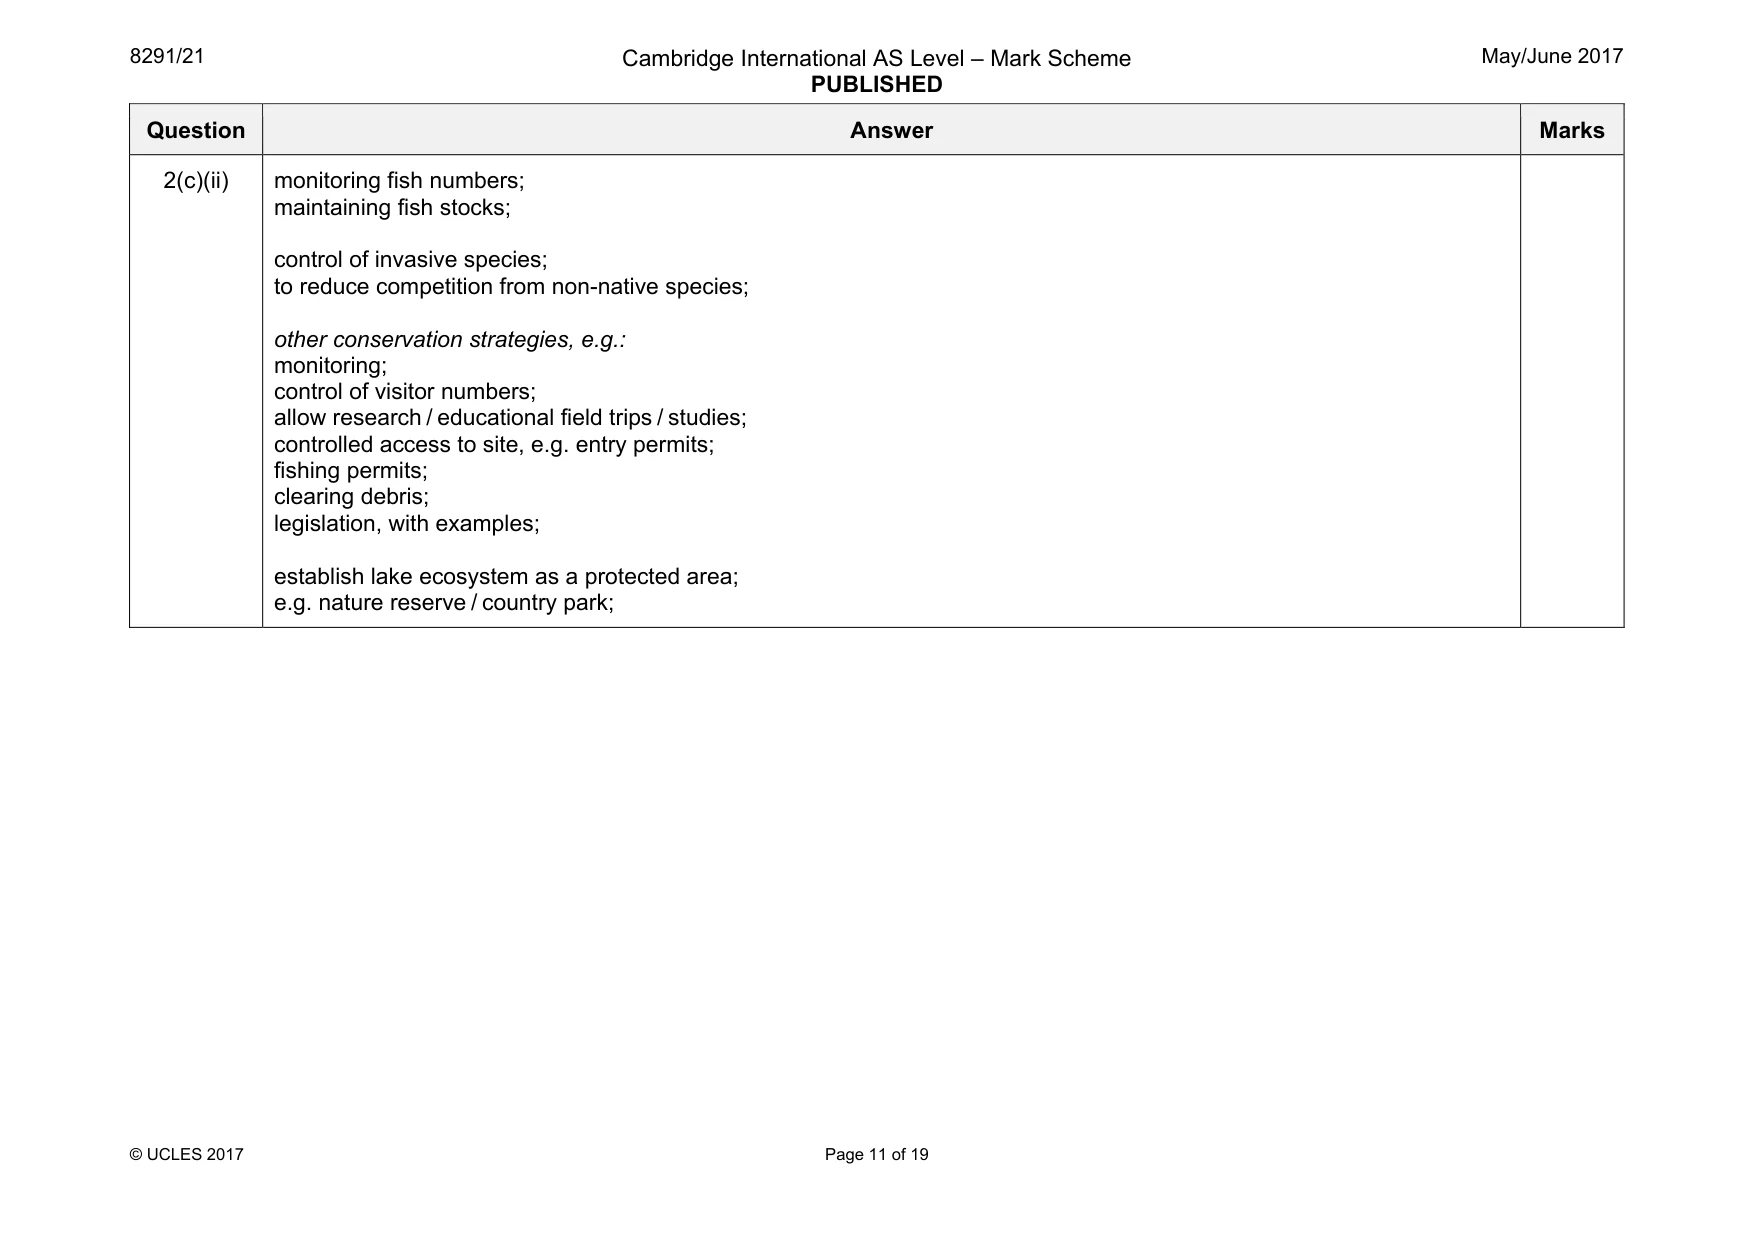
Mark scheme: 2(a)(i) (interactions between) a community of organisms / eq. and the environment / eq.; 1 Question Answer Marks 2(a)(ii) One mark for an abiotic factor and one mark for a biotic factor. Two marks for the influence on the ecosystem. (Max. 2 × 2) abiotic factor: light / carbon dioxide / water / oxygen / pH / minerals / temperature; biotic factor: predators / population density / competition for resources / food availability / disease; Accept other valid explanations of the influences. Examples may include: light: (light energy is transferred to chemical energy by) photosynthesis; food produced by the primary producers of the ecosystem; carbon dioxide / water: used as raw materials in the process of photosynthesis; in primary productivity of the ecosystem; (Accept acidification effects.) water: medium for organisms; in which to carry out life processes within the ecosystem – to move, reproduce, etc.; oxygen: used in (aerobic) respiration; to release energy (by living organisms in the ecosystem); pH / temperature: effect rate of chemical reactions; species tolerance to these factors will determine the species composition of the ecosystem; minerals: are required for plant growth; productivity of the ecosystem; 6 Question Answer Marks 2(a)(ii) predators: predators consume prey; have a predator-prey feeding relationship and control population size in the ecosystem; population density: affects availability of food, nesting sites etc.; competition for resources in the ecosystem; food availability / disease: determines population size of organisms; determines biodiversity of the ecosystem; Allow ECF if factor incorrectly identified as biotic / abiotic. 2(b) a change in the community as the environment changes / a hydrosere; organic material / sediment builds up in the lake / increasing sedimentation; water becomes shallower / the lake gradually fills in / less open water / area dries out / increased evaporation; abiotic factors / environment change during succession; e.g. moisture content of sediment / soil; aquatic species are gradually replaced by marsh / wetland species; eventually the area becomes less favourable to aquatic organisms / more favourable to terrestrial organisms; grasses / herbaceous plants / shrubs colonise / grow; eventually a woodland / climax forest is established; colonising from the surrounding terrestrial ecosystem; Credit ref. to climate change and transition to drier environment. 5 Question Answer Marks 2(c)(i) Credit one mark for each of three different benefits or award additonal marks for development of a benefit or an example. Max. of two marks for one area. For example: ecological; e.g. habitat for aquatic species / niches / nesting sites / breeding ground for amphibians / maintaining biodiversity; aesthetic; e.g. beauty of the landscape; education; e.g. awareness of the importance of food chains / webs; recreation; e.g. boating; walking / relaxation; economic; e.g. harvesting of reeds; fishing; tourism; as a water resource; environmental; e.g. flood protection; moral; e.g. preventing extinction of species; 3 Question Answer Marks 2(c)(ii) Allow ref. to management of the lake or surrounding area or both. Examples may include: management of surrounding area: control of pollution, e.g. run-off from fields; control of nutrient input into the lake; timing of fertiliser treatment on the agricultural land; quantity of fertilisers applied; planting buffer strips along agricultural land and stream / river; to absorb nutrients / reduce nutrient load; to prevent eutrophication; maintenance of drainage ditches; removing silt / sediment build-up; to maintain flow and prevent flooding; selective logging in managed woodland; coppicing; afforestation of felled areas; replanting native species; management of lake: control algae blooms; oxygenation of water; reed cutting on edge of lake to maintain open water; management of wetland area; to prevent succession; 5 Question Answer Marks 2(c)(ii) monitoring fish numbers; maintaining fish stocks; control of invasive species; to reduce competition from non-native species; other conservation strategies, e.g.: monitoring; control of visitor numbers; allow research / educational field trips / studies; controlled access to site, e.g. entry permits; fishing permits; clearing debris; legislation, with examples; establish lake ecosystem as a protected area; e.g. nature reserve / country park;
Q3 · Trends in global water use by sector
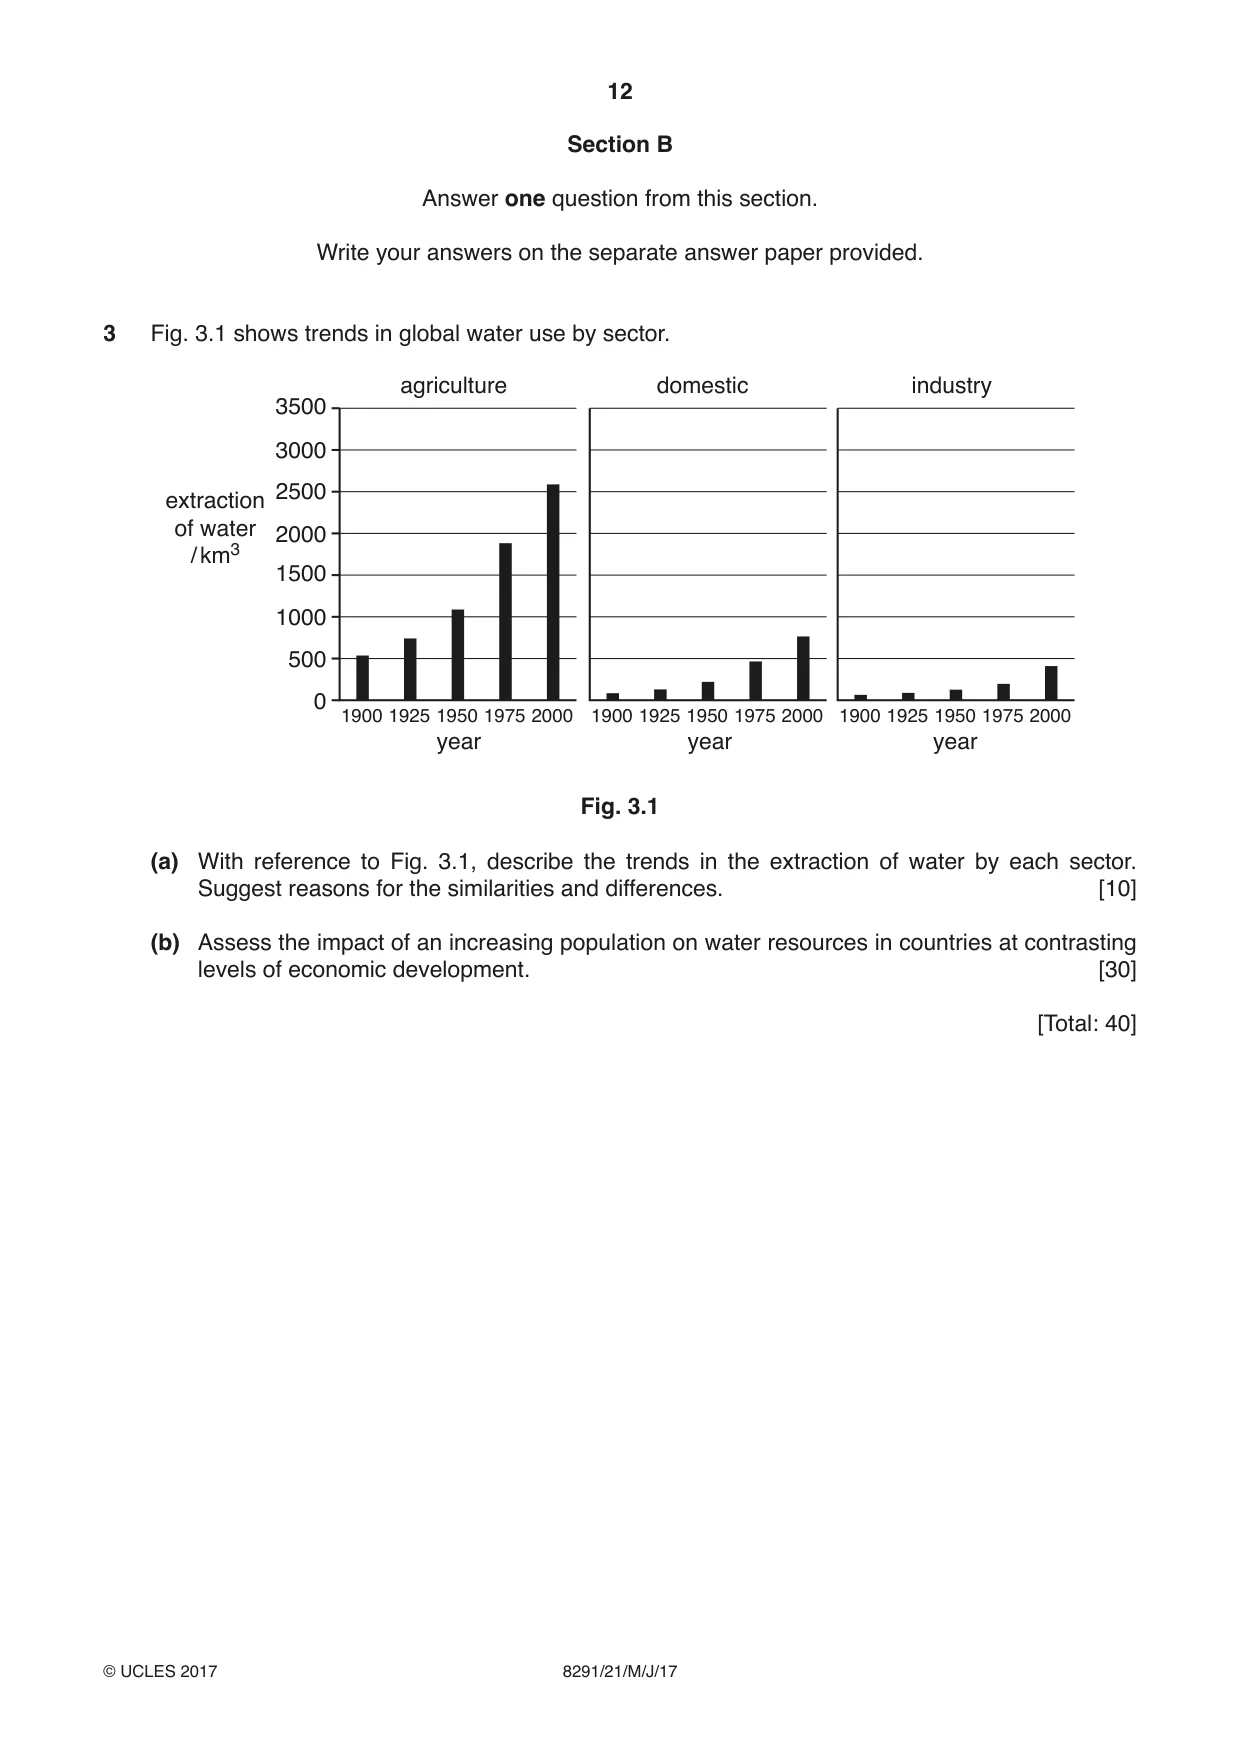
3 Fig. 3.1 shows trends in global water use by sector. agriculture domestic industry 3500 3000 2500 extraction of water 2000 / km3 1500 1000 500 0 1900 1925 1950 1975 2000 1900 1925 1950 1975 2000 1900 1925 1950 1975 2000 year year year Fig. 3.1 (a) With reference to Fig. 3.1, describe the trends in the extraction of water by each sector. Suggest reasons for the similarities and differences. [10] (b) Assess the impact of an increasing population on water resources in countries at contrasting levels of economic development. [30] [Total: 40]
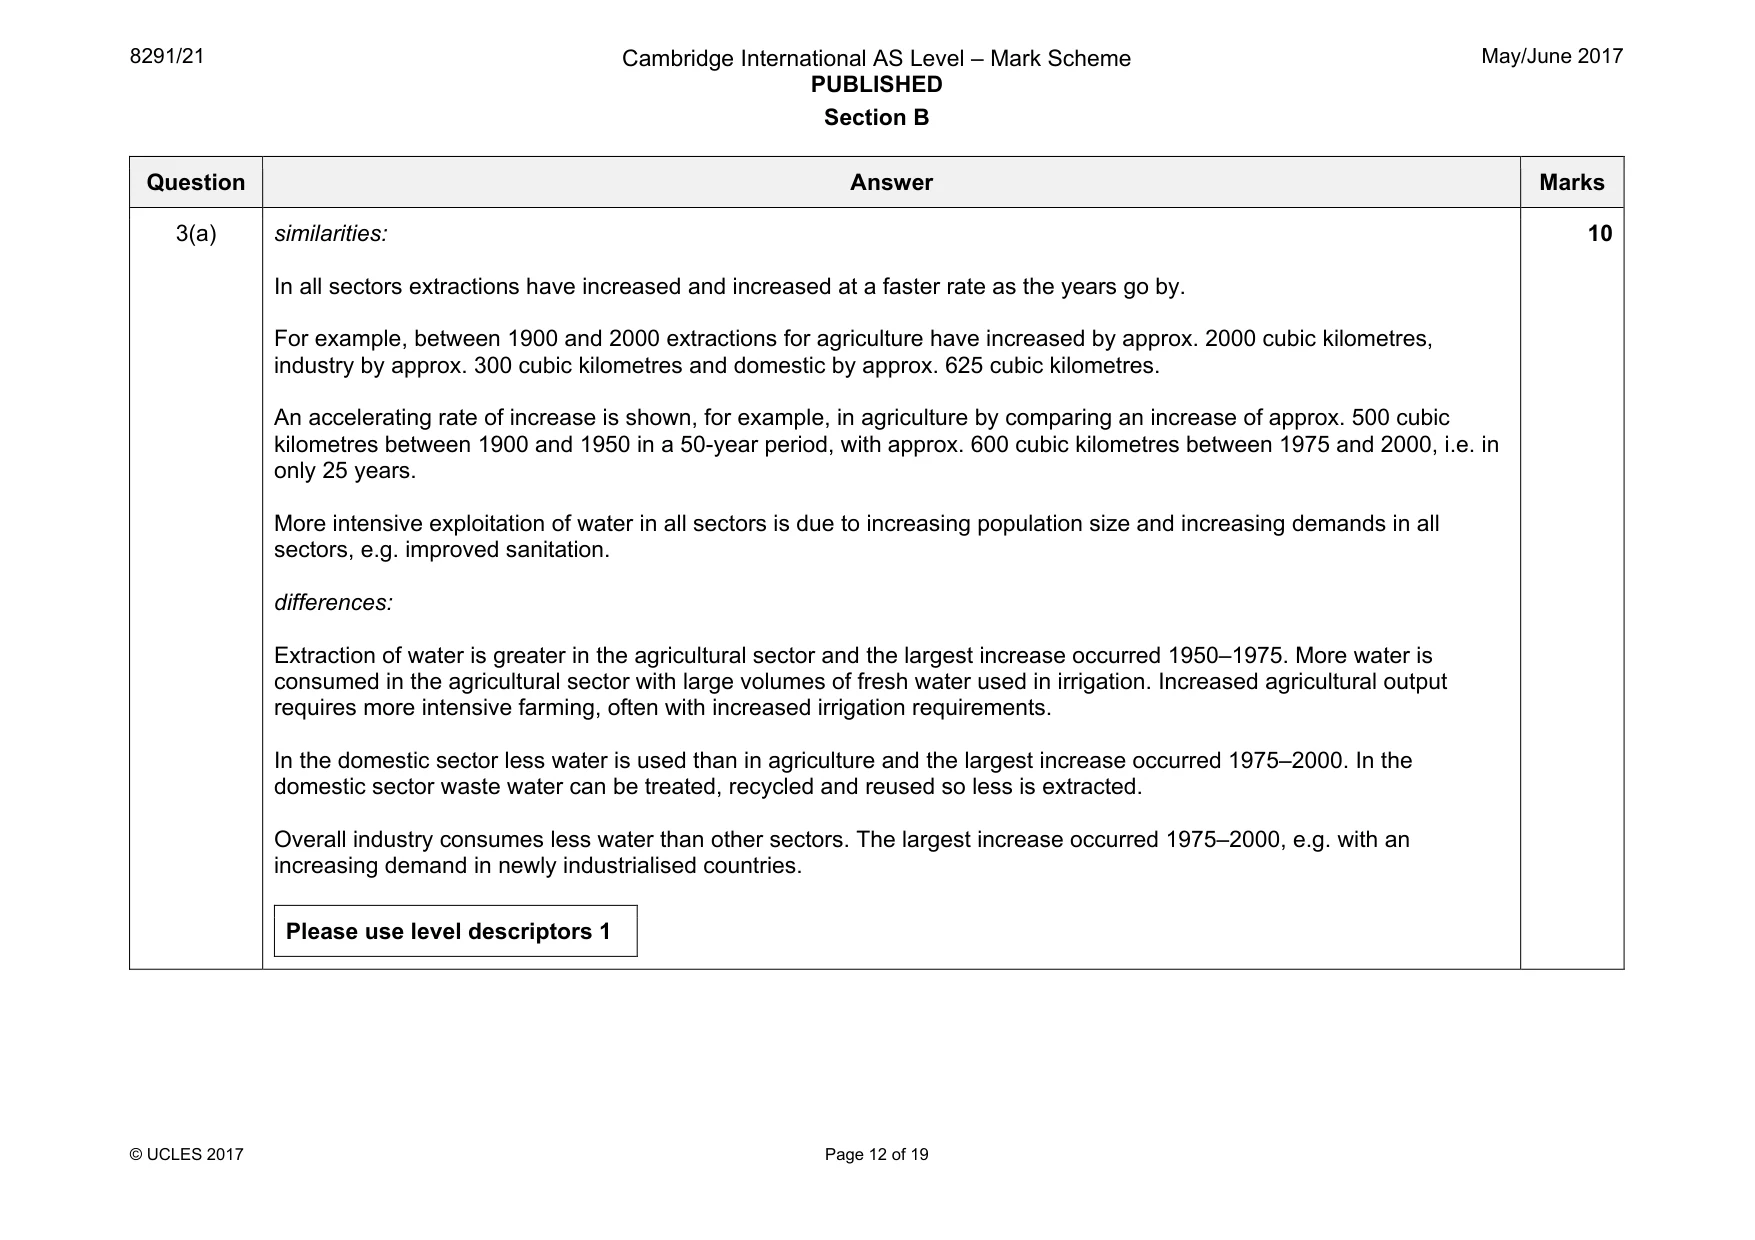
Mark scheme: 3(a) similarities: In all sectors extractions have increased and increased at a faster rate as the years go by. For example, between 1900 and 2000 extractions for agriculture have increased by approx. 2000 cubic kilometres, industry by approx. 300 cubic kilometres and domestic by approx. 625 cubic kilometres. An accelerating rate of increase is shown, for example, in agriculture by comparing an increase of approx. 500 cubic kilometres between 1900 and 1950 in a 50-year period, with approx. 600 cubic kilometres between 1975 and 2000, i.e. in only 25 years. More intensive exploitation of water in all sectors is due to increasing population size and increasing demands in all sectors, e.g. improved sanitation. differences: Extraction of water is greater in the agricultural sector and the largest increase occurred 1950–1975. More water is consumed in the agricultural sector with large volumes of fresh water used in irrigation. Increased agricultural output requires more intensive farming, often with increased irrigation requirements. In the domestic sector less water is used than in agriculture and the largest increase occurred 1975–2000. In the domestic sector waste water can be treated, recycled and reused so less is extracted. Overall industry consumes less water than other sectors. The largest increase occurred 1975–2000, e.g. with an increasing demand in newly industrialised countries. Please use level descriptors 1 10 Question Answer Marks 3(b) The question requirements are: • to use examples of countries at contrasting levels of economic development • to consider the impact of increasing population on water resources. Indicative content: A shortage of fresh water will be a global crisis as population continues to increase with no increase in freshwater supplies. An increasing population will continue to increase demand for water resources in all sectors. For example, less productive land will need to be cultivated to increase food production and will require even more water for irrigation. The impact of an increasing population on both the quantity and quality of water resources should be considered. A reduction in the quantity of freshwater resources available may result from increased withdrawals of groundwater, leading to diminishing supplies and the depletion of aquifers. Pollution originating from agricultural, domestic and industrial sources will reduce the quality of freshwater resources. Countries at contrasting levels of economic development should be compared in terms of the availability of water resources, the use of resources and increasing demands. Please use level descriptors 2 30
Q4 · Changes in the world’s biodiversity according to the Living Planet Index from 1970 to 2003
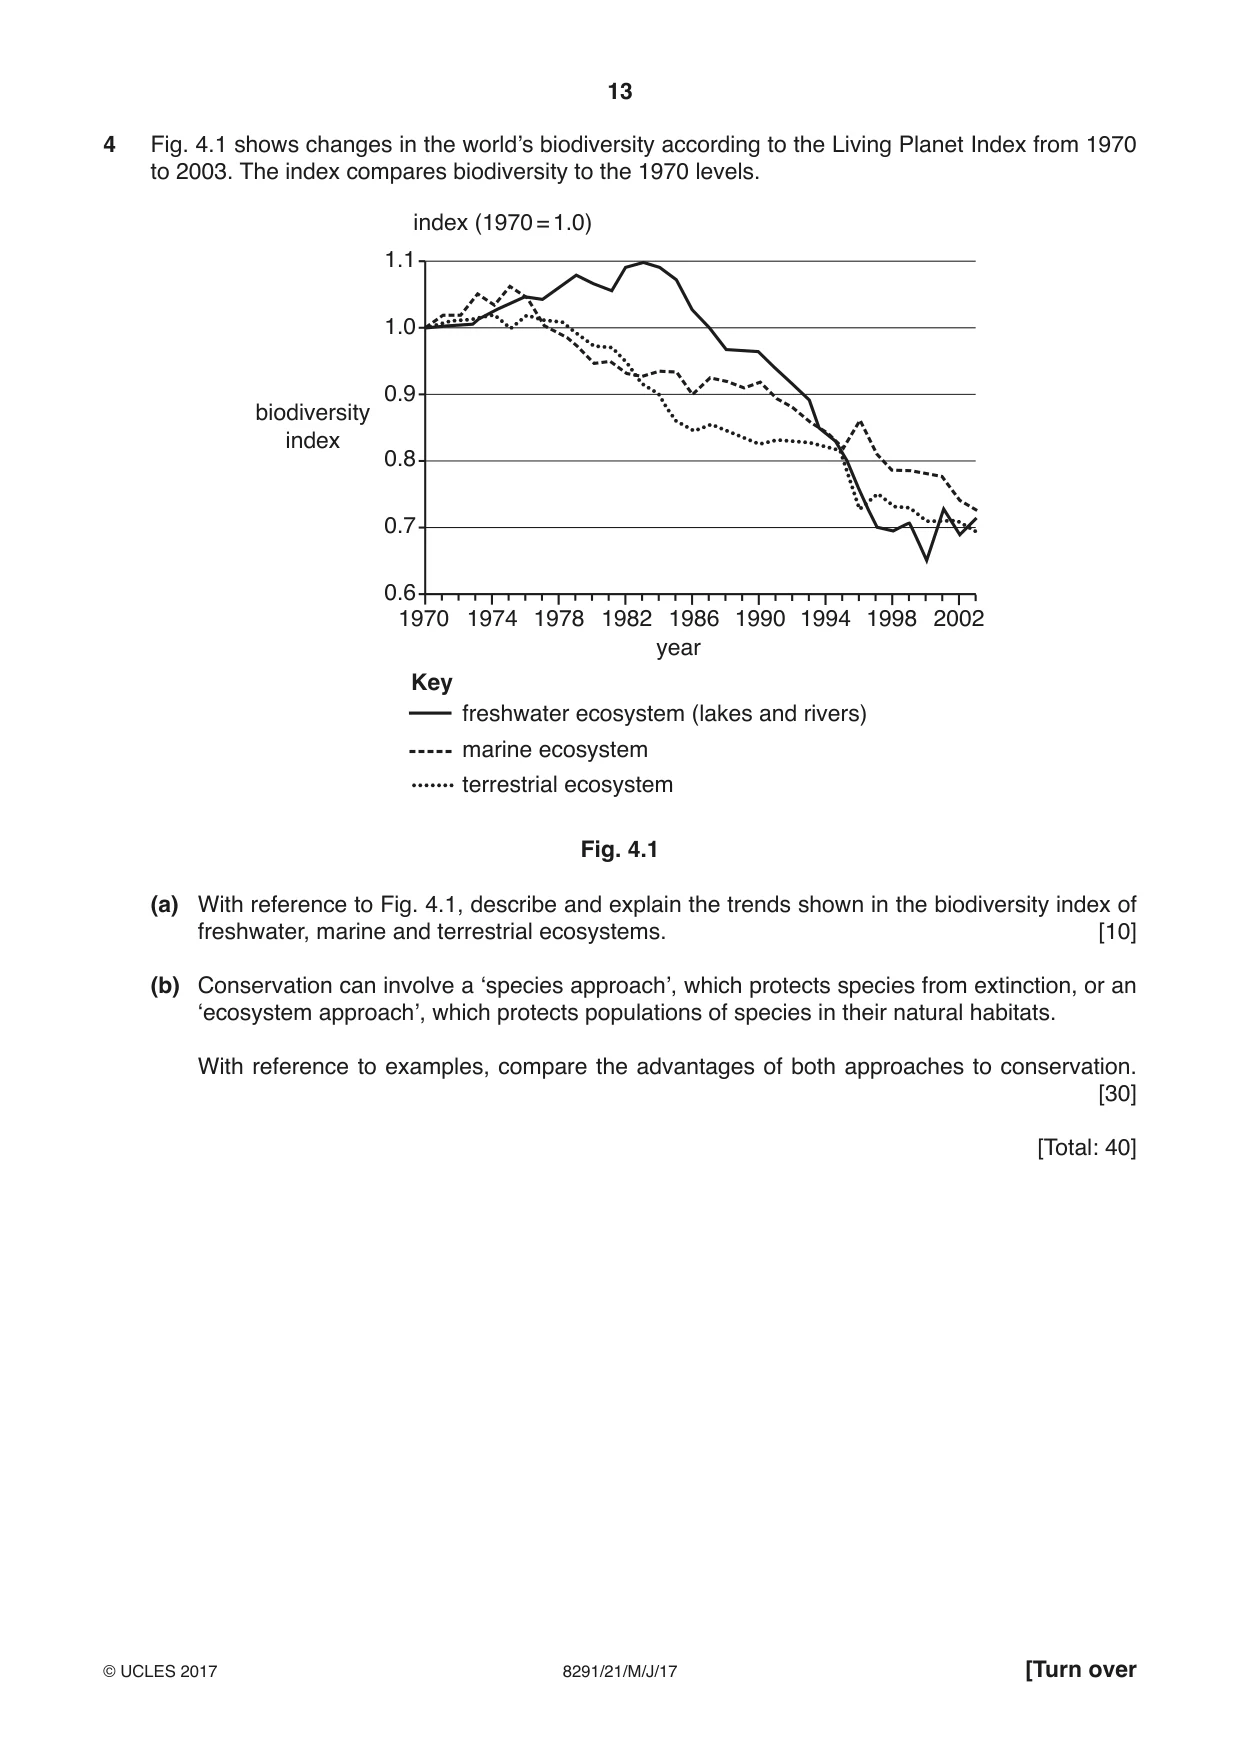
4 Fig. 4.1 shows changes in the world’s biodiversity according to the Living Planet Index from 1970 to 2003. The index compares biodiversity to the 1970 levels. index (1970 = 1.0) 1.1 1.0 0.9 biodiversity index 0.8 0.7 0.6 1970 1974 1978 1982 1986 1990 1994 1998 2002 year Key freshwater ecosystem (lakes and rivers) marine ecosystem terrestrial ecosystem Fig. 4.1 (a) With reference to Fig. 4.1, describe and explain the trends shown in the biodiversity index of freshwater, marine and terrestrial ecosystems. [10] (b) Conservation can involve a ‘species approach’, which protects species from extinction, or an ‘ecosystem approach’, which protects populations of species in their natural habitats. With reference to examples, compare the advantages of both approaches to conservation. [30] [Total: 40]
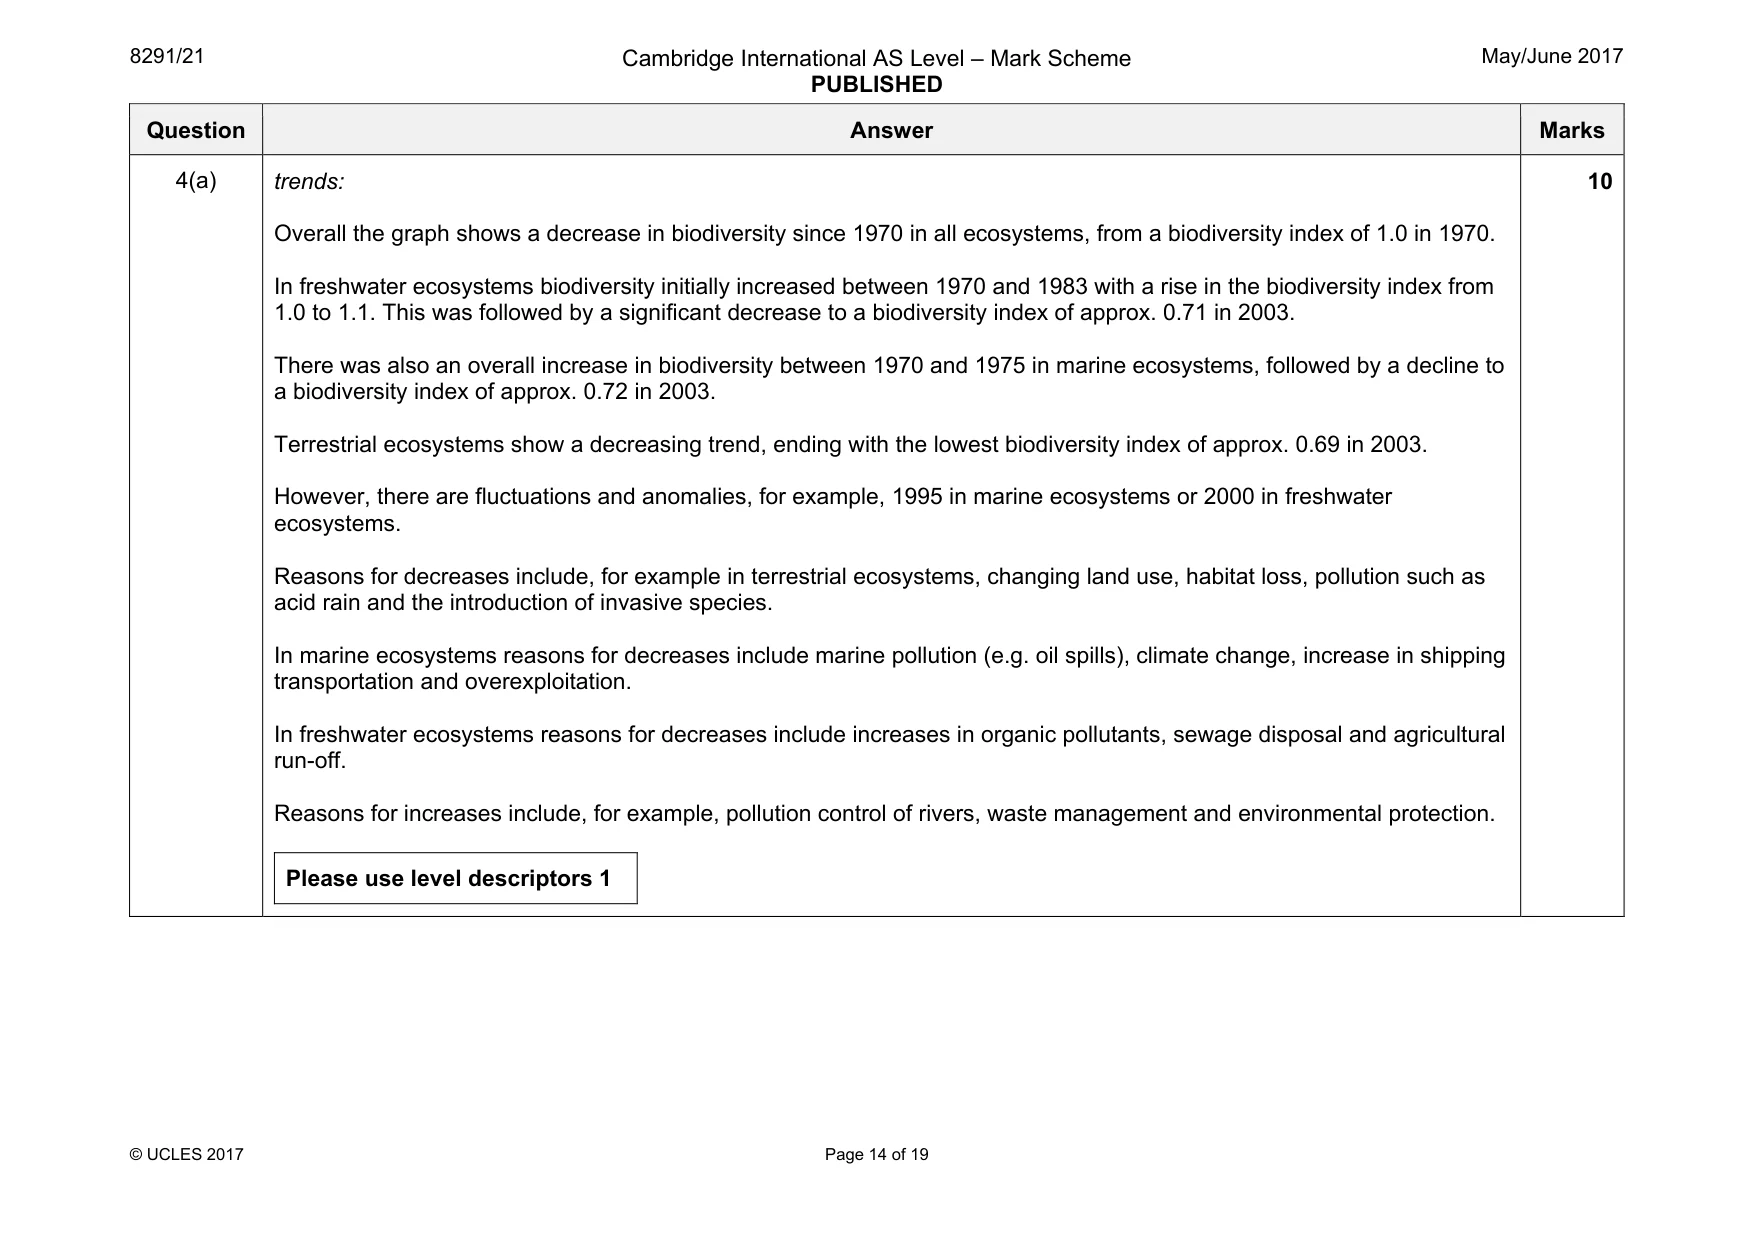
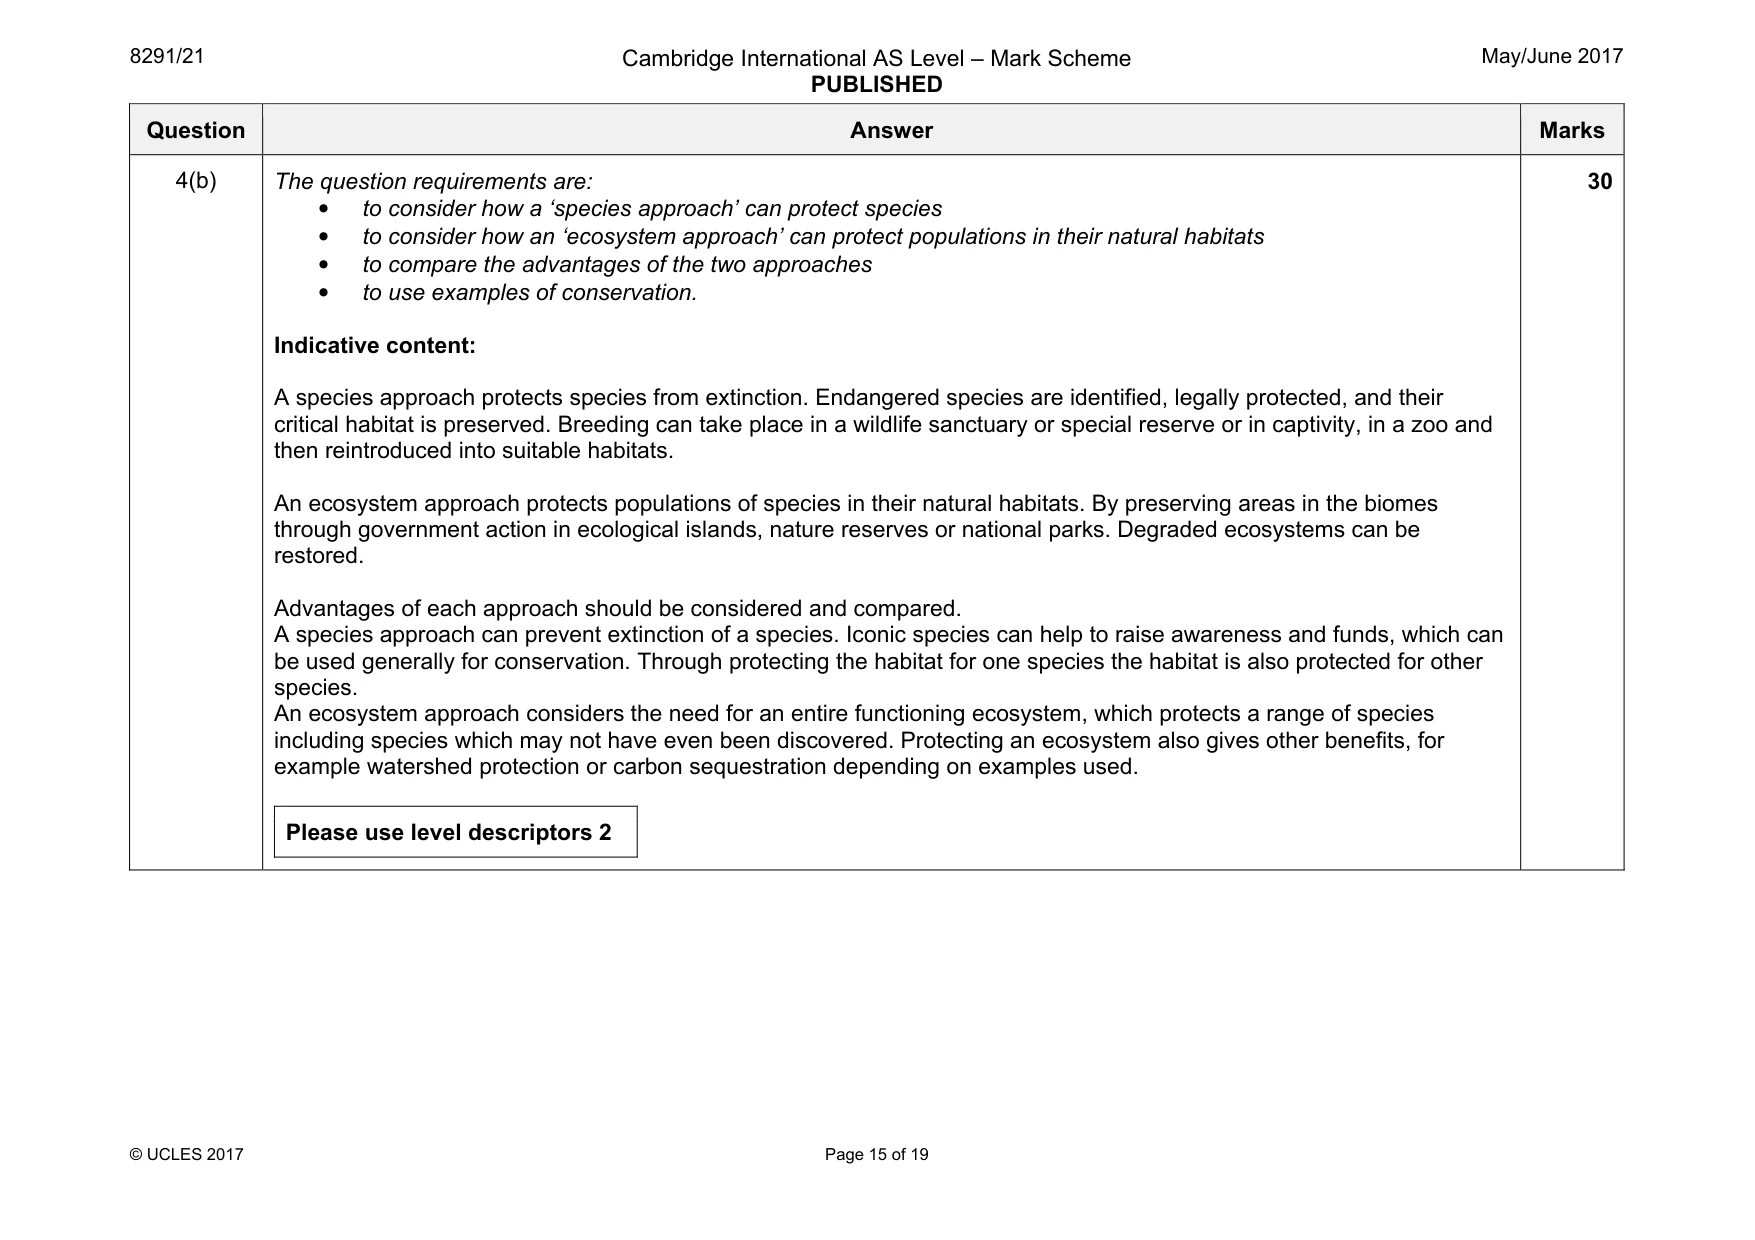
Mark scheme: 4(a) trends: Overall the graph shows a decrease in biodiversity since 1970 in all ecosystems, from a biodiversity index of 1.0 in 1970. In freshwater ecosystems biodiversity initially increased between 1970 and 1983 with a rise in the biodiversity index from 1.0 to 1.1. This was followed by a significant decrease to a biodiversity index of approx. 0.71 in 2003. There was also an overall increase in biodiversity between 1970 and 1975 in marine ecosystems, followed by a decline to a biodiversity index of approx. 0.72 in 2003. Terrestrial ecosystems show a decreasing trend, ending with the lowest biodiversity index of approx. 0.69 in 2003. However, there are fluctuations and anomalies, for example, 1995 in marine ecosystems or 2000 in freshwater ecosystems. Reasons for decreases include, for example in terrestrial ecosystems, changing land use, habitat loss, pollution such as acid rain and the introduction of invasive species. In marine ecosystems reasons for decreases include marine pollution (e.g. oil spills), climate change, increase in shipping transportation and overexploitation. In freshwater ecosystems reasons for decreases include increases in organic pollutants, sewage disposal and agricultural run-off. Reasons for increases include, for example, pollution control of rivers, waste management and environmental protection. Please use level descriptors 1 10 Question Answer Marks 4(b) The question requirements are: • to consider how a ‘species approach’ can protect species • to consider how an ‘ecosystem approach’ can protect populations in their natural habitats • to compare the advantages of the two approaches • to use examples of conservation. Indicative content: A species approach protects species from extinction. Endangered species are identified, legally protected, and their critical habitat is preserved. Breeding can take place in a wildlife sanctuary or special reserve or in captivity, in a zoo and then reintroduced into suitable habitats. An ecosystem approach protects populations of species in their natural habitats. By preserving areas in the biomes through government action in ecological islands, nature reserves or national parks. Degraded ecosystems can be restored. Advantages of each approach should be considered and compared. A species approach can prevent extinction of a species. Iconic species can help to raise awareness and funds, which can be used generally for conservation. Through protecting the habitat for one species the habitat is also protected for other species. An ecosystem approach considers the need for an entire functioning ecosystem, which protects a range of species including species which may not have even been discovered. Protecting an ecosystem also gives other benefits, for example watershed protection or carbon sequestration depending on examples used. Please use level descriptors 2 30
Q5 · Some ways groundwater is polluted
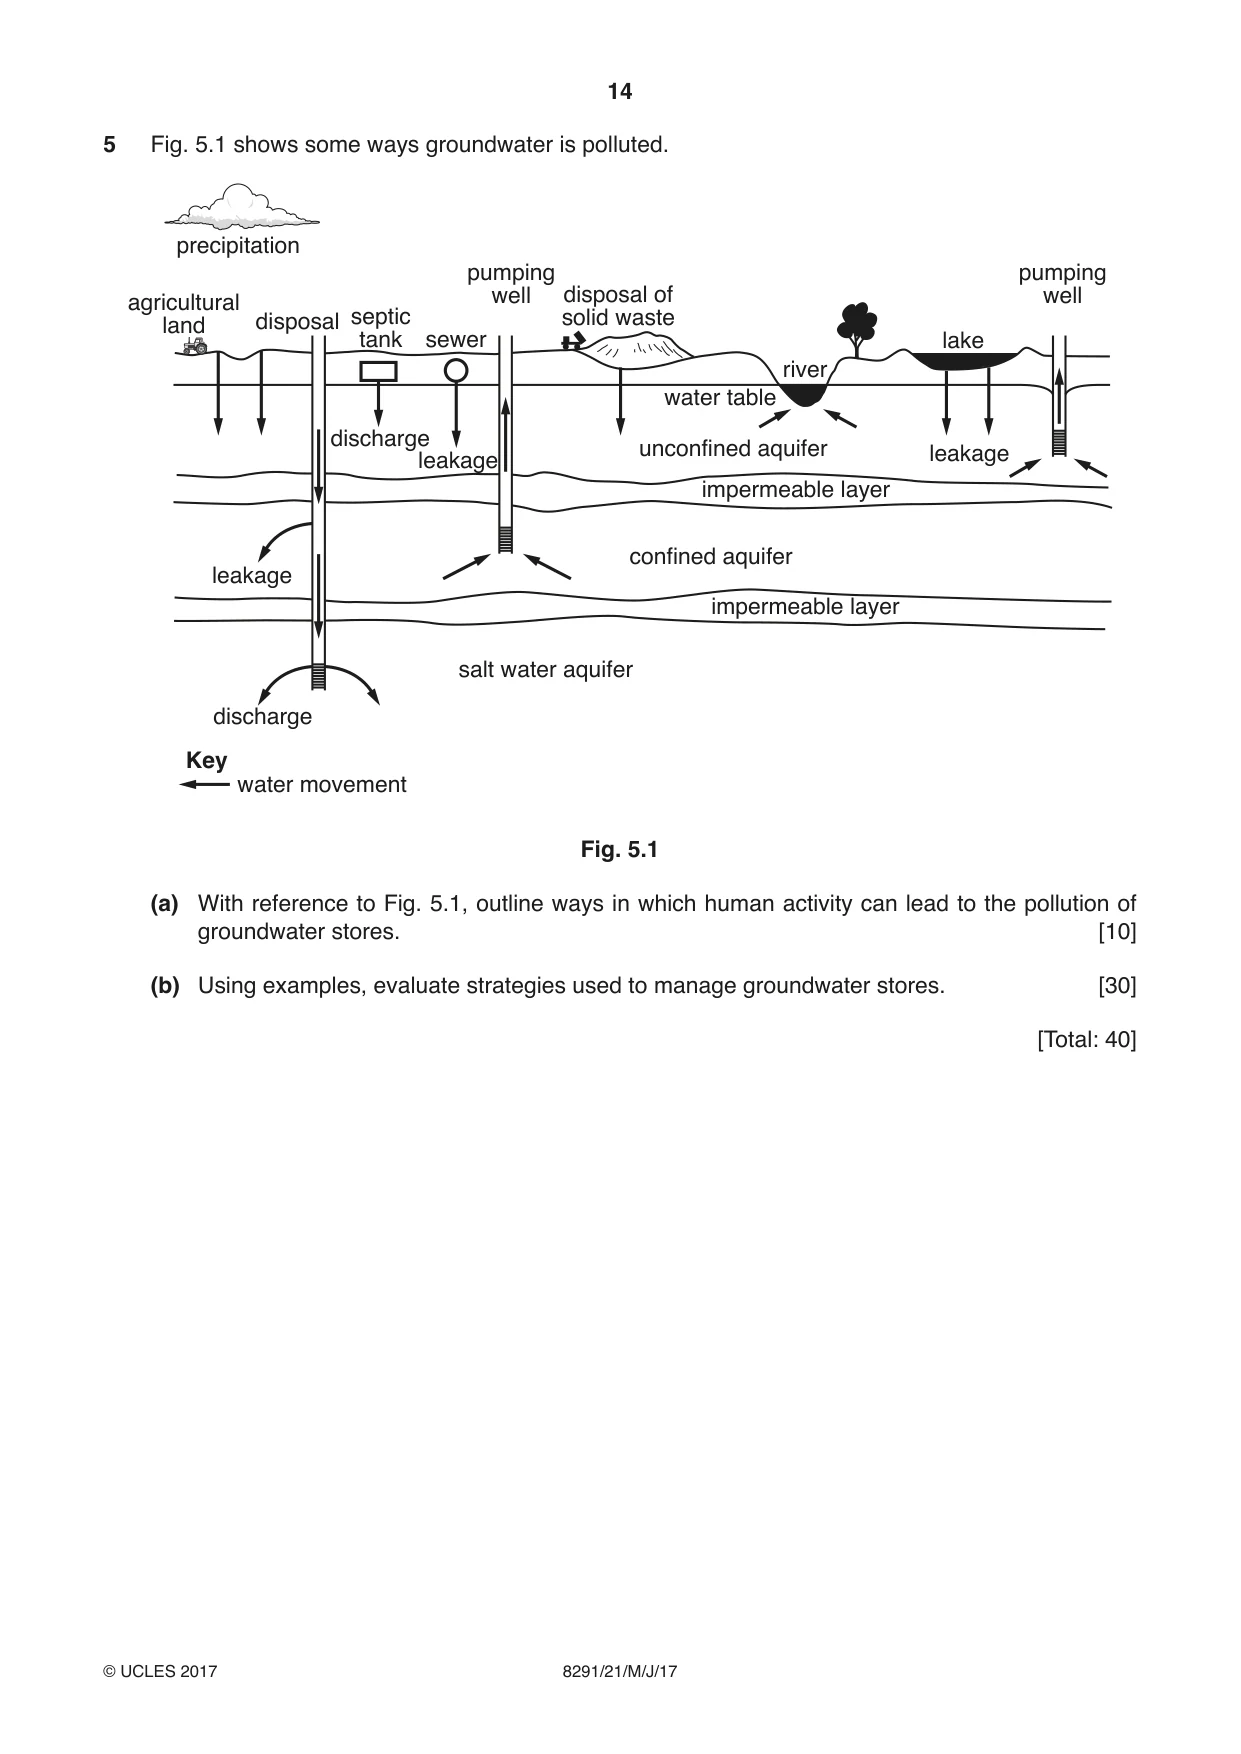
5 Fig. 5.1 shows some ways groundwater is polluted. precipitation pumping pumping well disposal of well agricultural land disposal septic solid waste tank sewer lake river water table discharge unconfined aquifer leakage leakage impermeable layer confined aquifer leakage impermeable layer salt water aquifer discharge Key water movement Fig. 5.1 (a) With reference to Fig. 5.1, outline ways in which human activity can lead to the pollution of groundwater stores. [10] (b) Using examples, evaluate strategies used to manage groundwater stores. [30] [Total: 40]
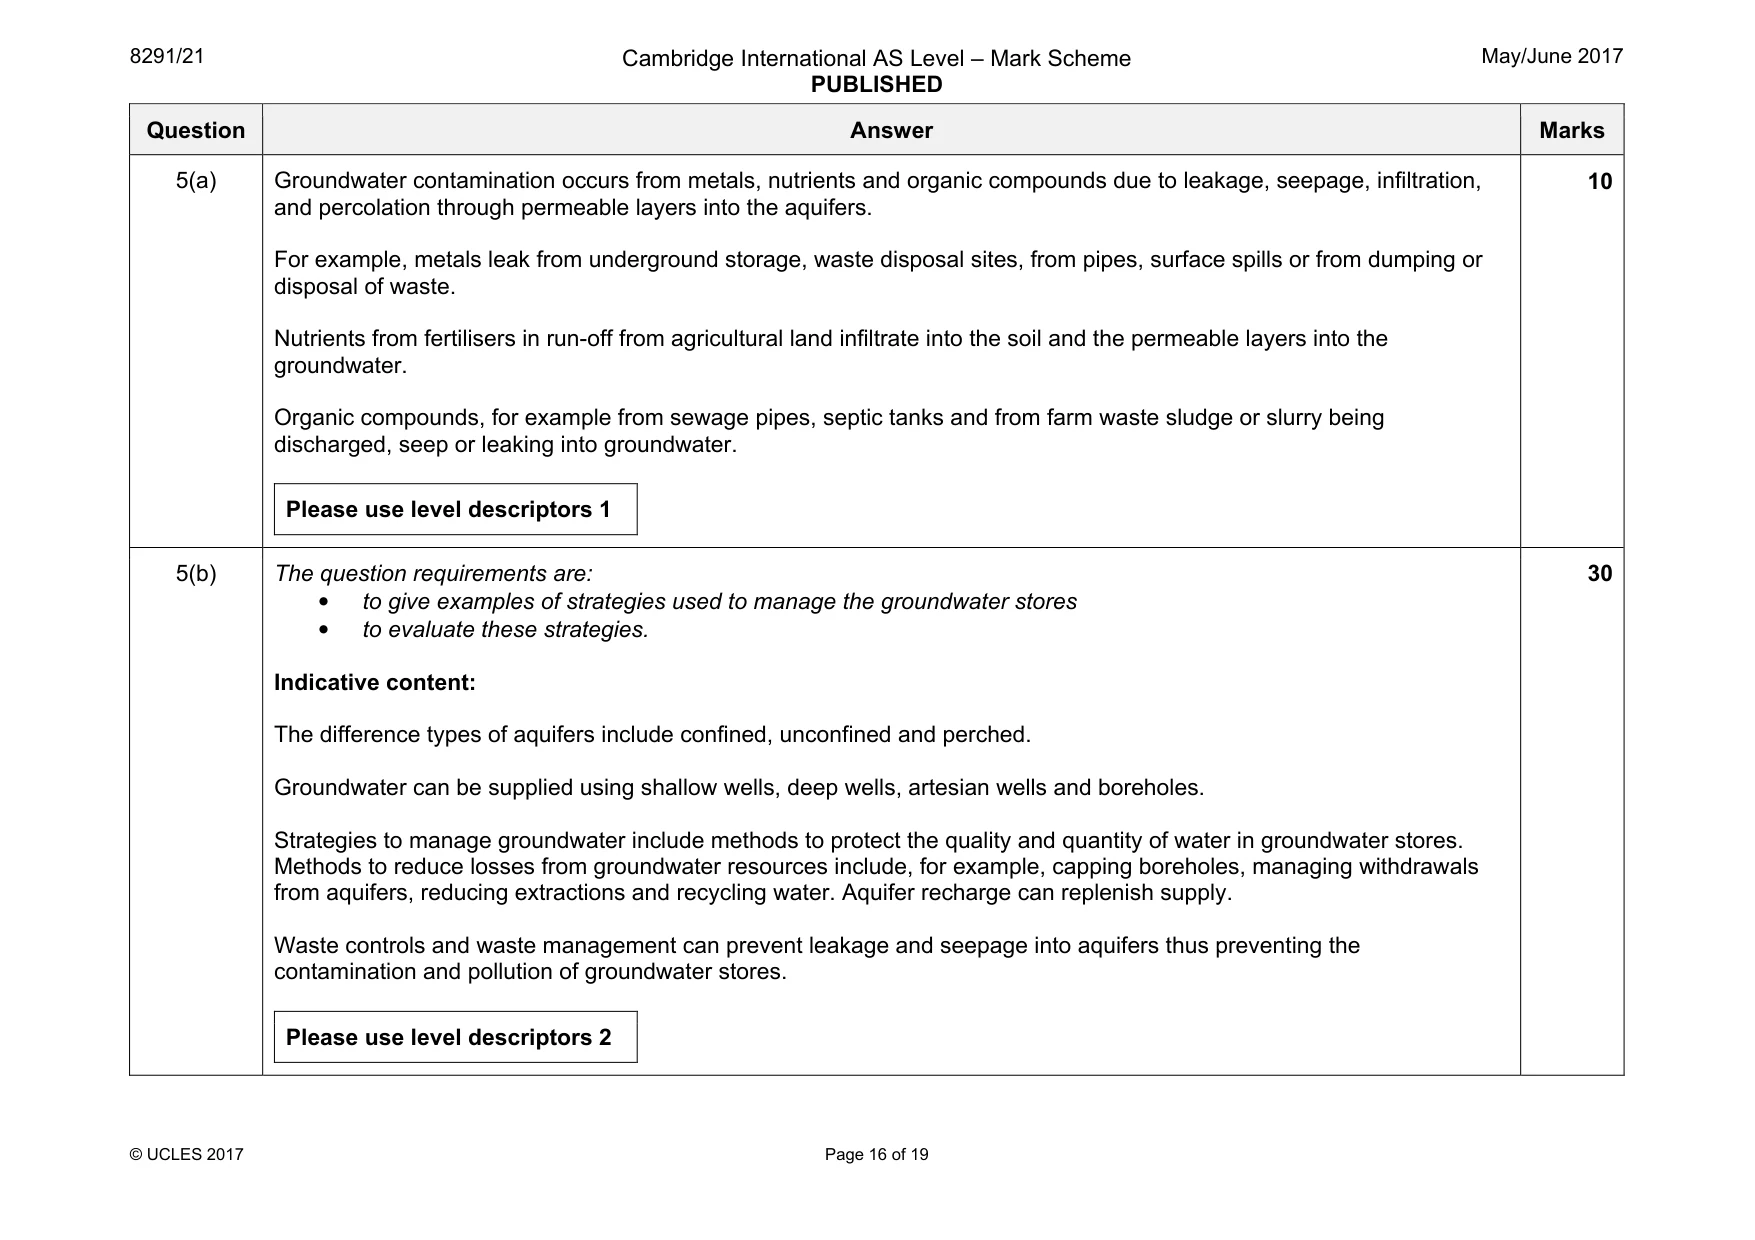
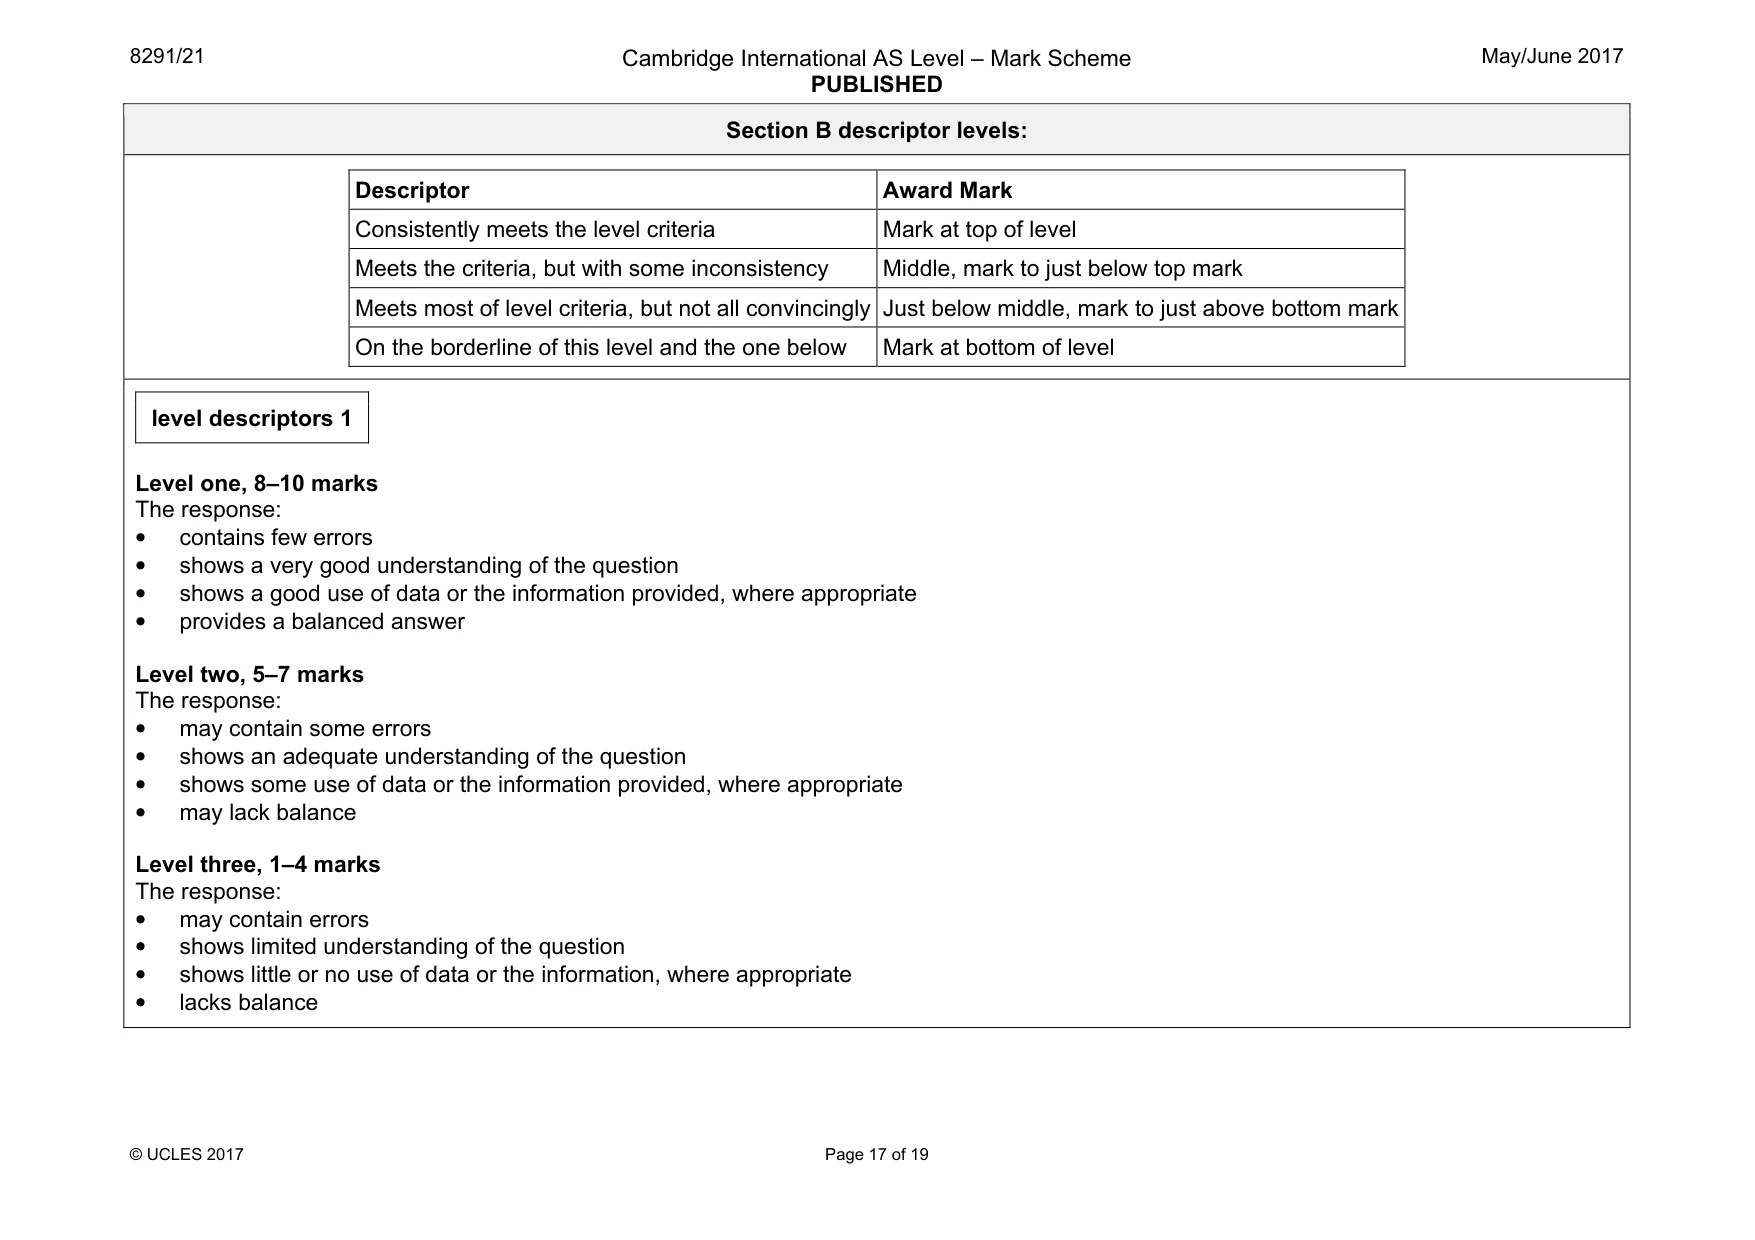
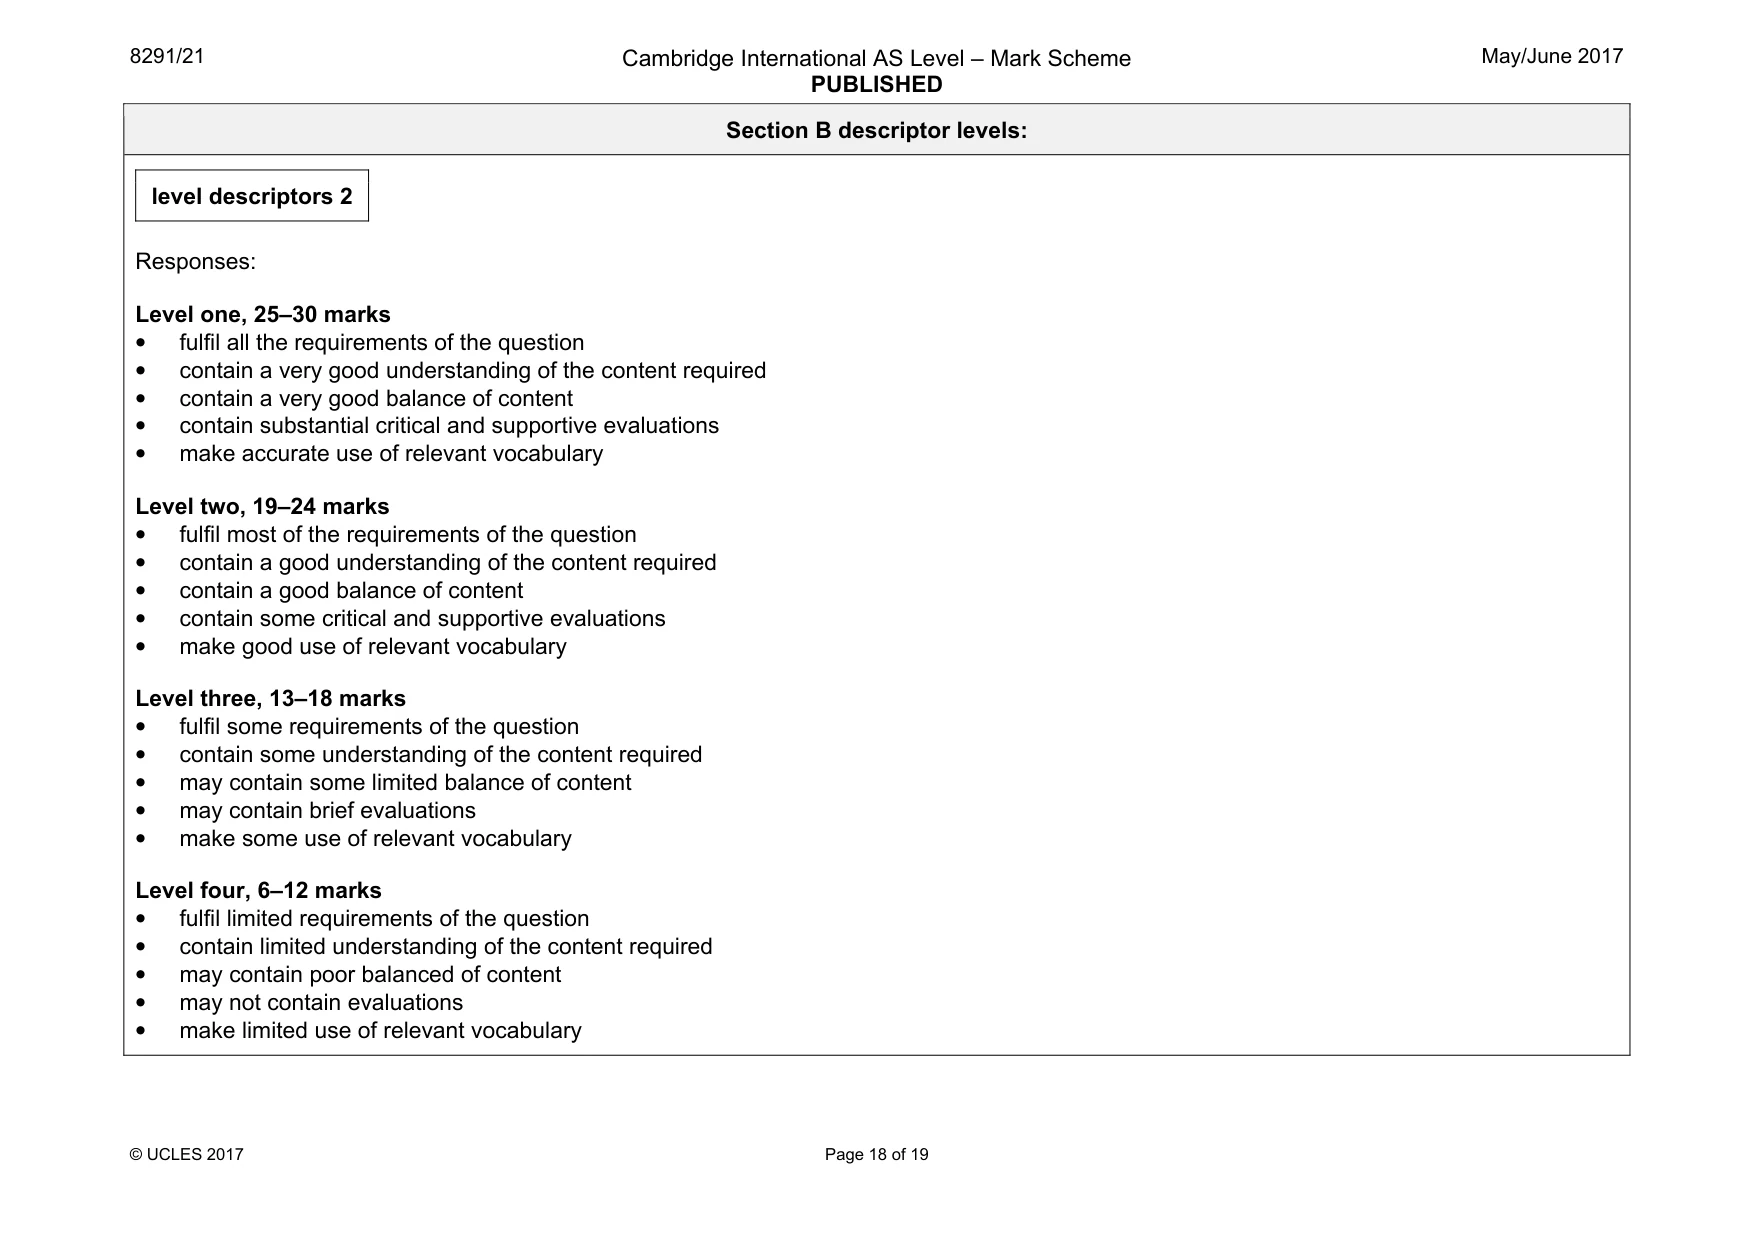
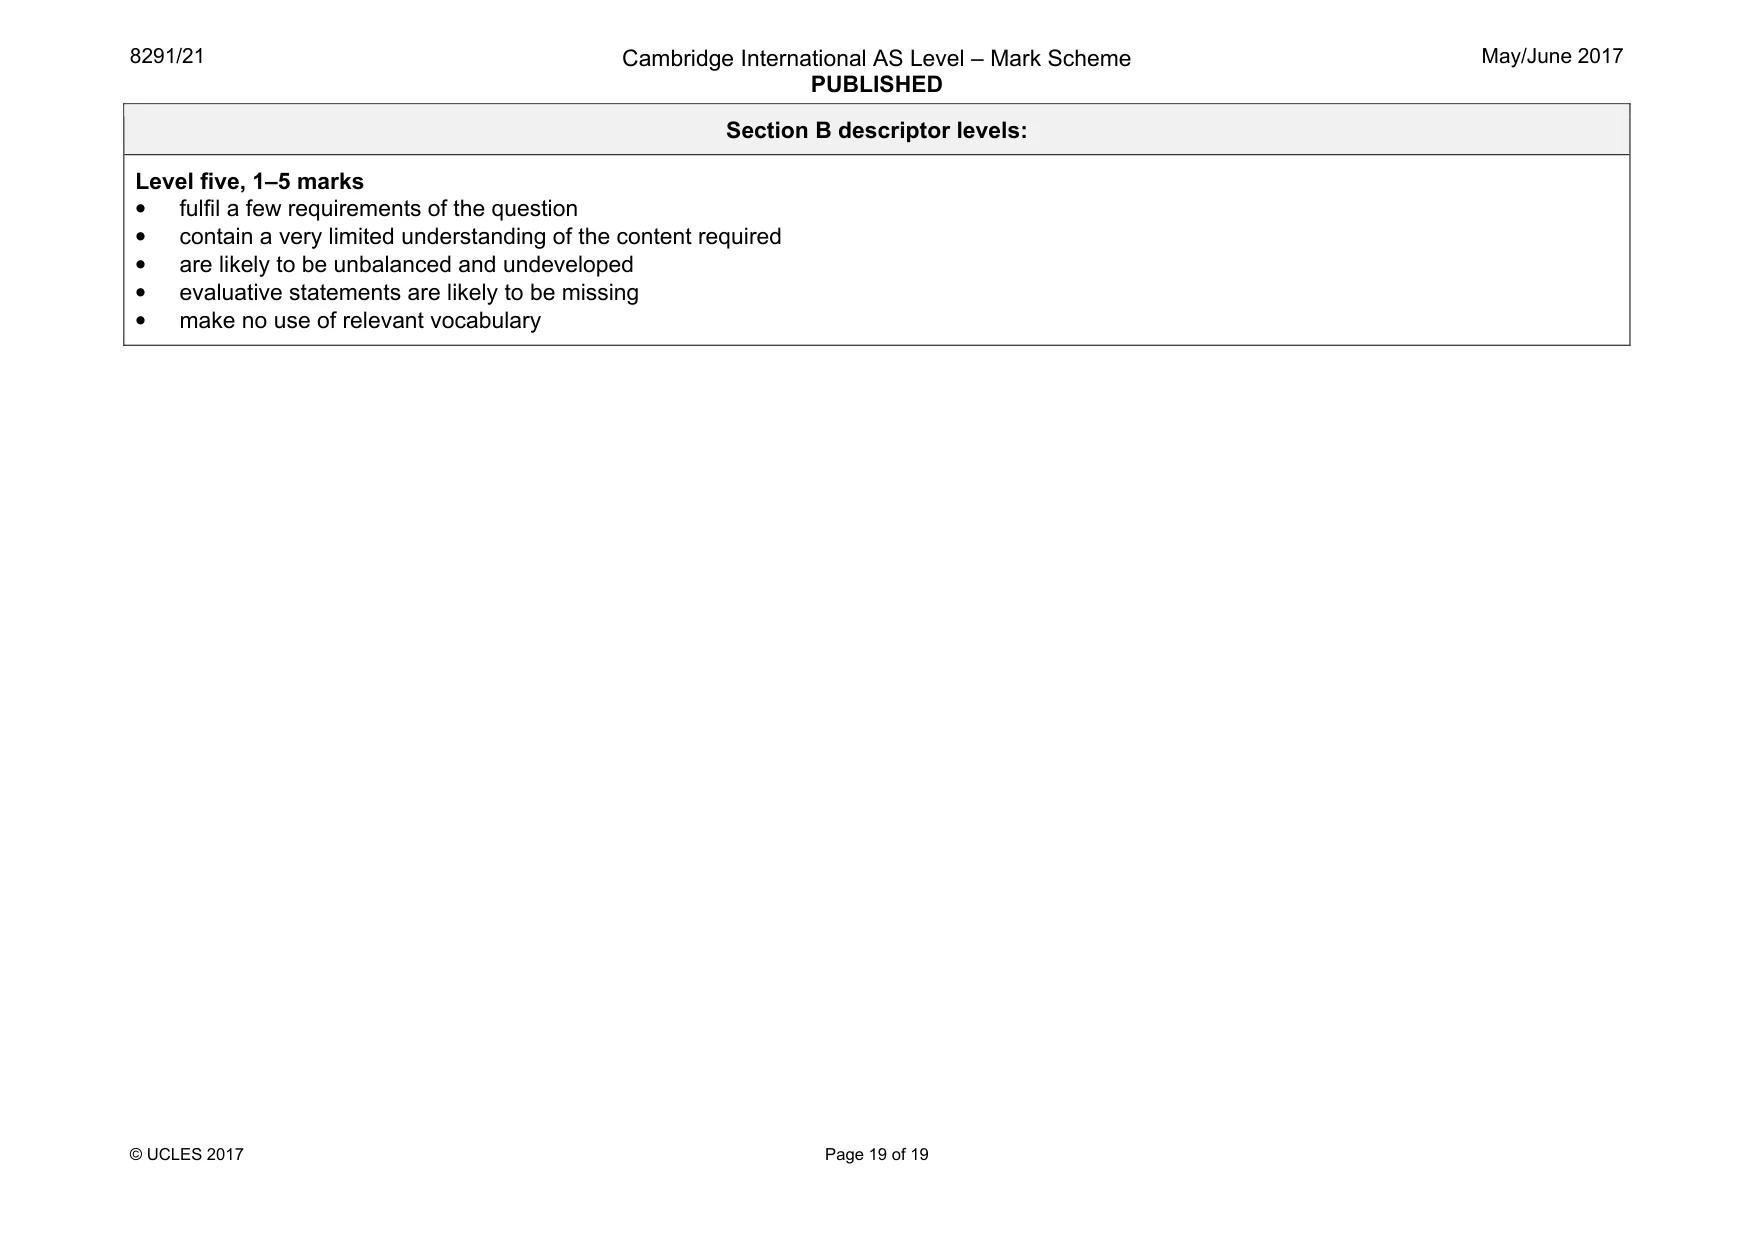
Mark scheme: 5(a) Groundwater contamination occurs from metals, nutrients and organic compounds due to leakage, seepage, infiltration, and percolation through permeable layers into the aquifers. For example, metals leak from underground storage, waste disposal sites, from pipes, surface spills or from dumping or disposal of waste. Nutrients from fertilisers in run-off from agricultural land infiltrate into the soil and the permeable layers into the groundwater. Organic compounds, for example from sewage pipes, septic tanks and from farm waste sludge or slurry being discharged, seep or leaking into groundwater. Please use level descriptors 1 10 5(b) The question requirements are: • to give examples of strategies used to manage the groundwater stores • to evaluate these strategies. Indicative content: The difference types of aquifers include confined, unconfined and perched. Groundwater can be supplied using shallow wells, deep wells, artesian wells and boreholes. Strategies to manage groundwater include methods to protect the quality and quantity of water in groundwater stores. Methods to reduce losses from groundwater resources include, for example, capping boreholes, managing withdrawals from aquifers, reducing extractions and recycling water. Aquifer recharge can replenish supply. Waste controls and waste management can prevent leakage and seepage into aquifers thus preventing the contamination and pollution of groundwater stores. Please use level descriptors 2 30 Section B descriptor levels: Descriptor Award Mark Consistently meets the level criteria Mark at top of level Meets the criteria, but with some inconsistency Middle, mark to just below top mark Meets most of level criteria, but not all convincingly Just below middle, mark to just above bottom mark On the borderline of this level and the one below Mark at bottom of level level descriptors 1 Level one, 8–10 marks The response: • contains few errors • shows a very good understanding of the question • shows a good use of data or the information provided, where appropriate • provides a balanced answer Level two, 5–7 marks The response: • may contain some errors • shows an adequate understanding of the question • shows some use of data or the information provided, where appropriate • may lack balance Level three, 1–4 marks The response: • may contain errors • shows limited understanding of the question • shows little or no use of data or the information, where appropriate • lacks balance Section B descriptor levels: level descriptors 2 Responses: Level one, 25–30 marks • fulfil all the requirements of the question • contain a very good understanding of the content required • contain a very good balance of content • contain substantial critical and supportive evaluations • make accurate use of relevant vocabulary Level two, 19–24 marks • fulfil most of the requirements of the question • contain a good understanding of the content required • contain a good balance of content • contain some critical and supportive evaluations • make good use of relevant vocabulary Level three, 13–18 marks • fulfil some requirements of the question • contain some understanding of the content required • may contain some limited balance of content • may contain brief evaluations • make some use of relevant vocabulary Level four, 6–12 marks • fulfil limited requirements of the question • contain limited understanding of the content required • may contain poor balanced of content • may not contain evaluations • make limited use of relevant vocabulary Section B descriptor levels: Level five, 1–5 marks • fulfil a few requirements of the question • contain a very limited understanding of the content required • are likely to be unbalanced and undeveloped • evaluative statements are likely to be missing • make no use of relevant vocabulary
What was in this paper
The subtopics covered by these 5 questions, and how many questions each got. Open one in a new tab to see every Cambridge question on it.
What you needed in this session
Cambridge’s own grade thresholds for 2017 May/June, Paper 2 · Variant 1. A higher threshold means an easier paper — the bar moves with how the cohort did.