Cambridge A Level Environmental Management (AS only) 8291 — 2019 May/June Paper 2 · Variant 1
8291/21/M/J/19 · 5 questions · 80 marks · ≈90 min
The question paper and its mark scheme, free to read here and free to download. This is Cambridge’s own paper, exactly as it was sat.
Question paper12 pages
Mark scheme14 pages
Answers below. Sit the paper first if you are practising.
Questions as text
Q1 · Maps of Bangladesh and the surrounding area
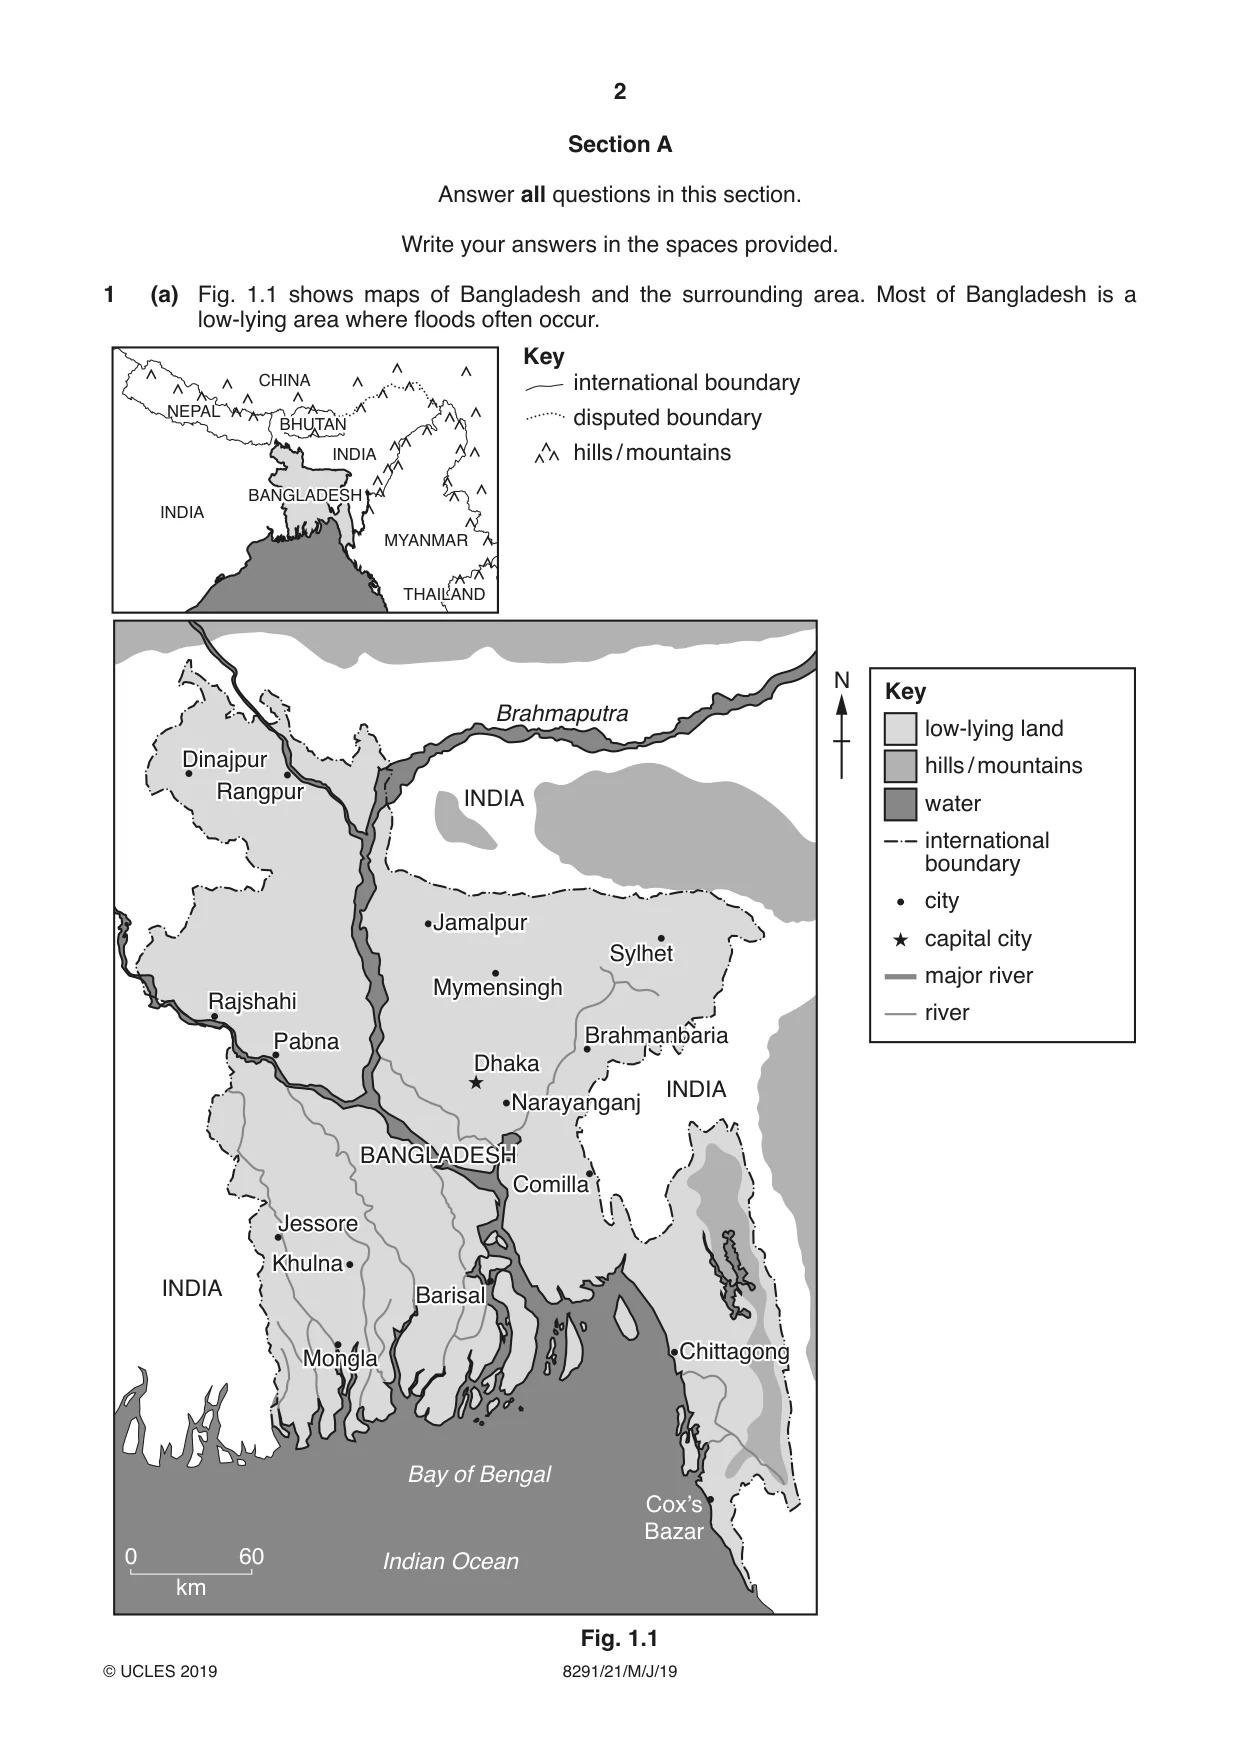
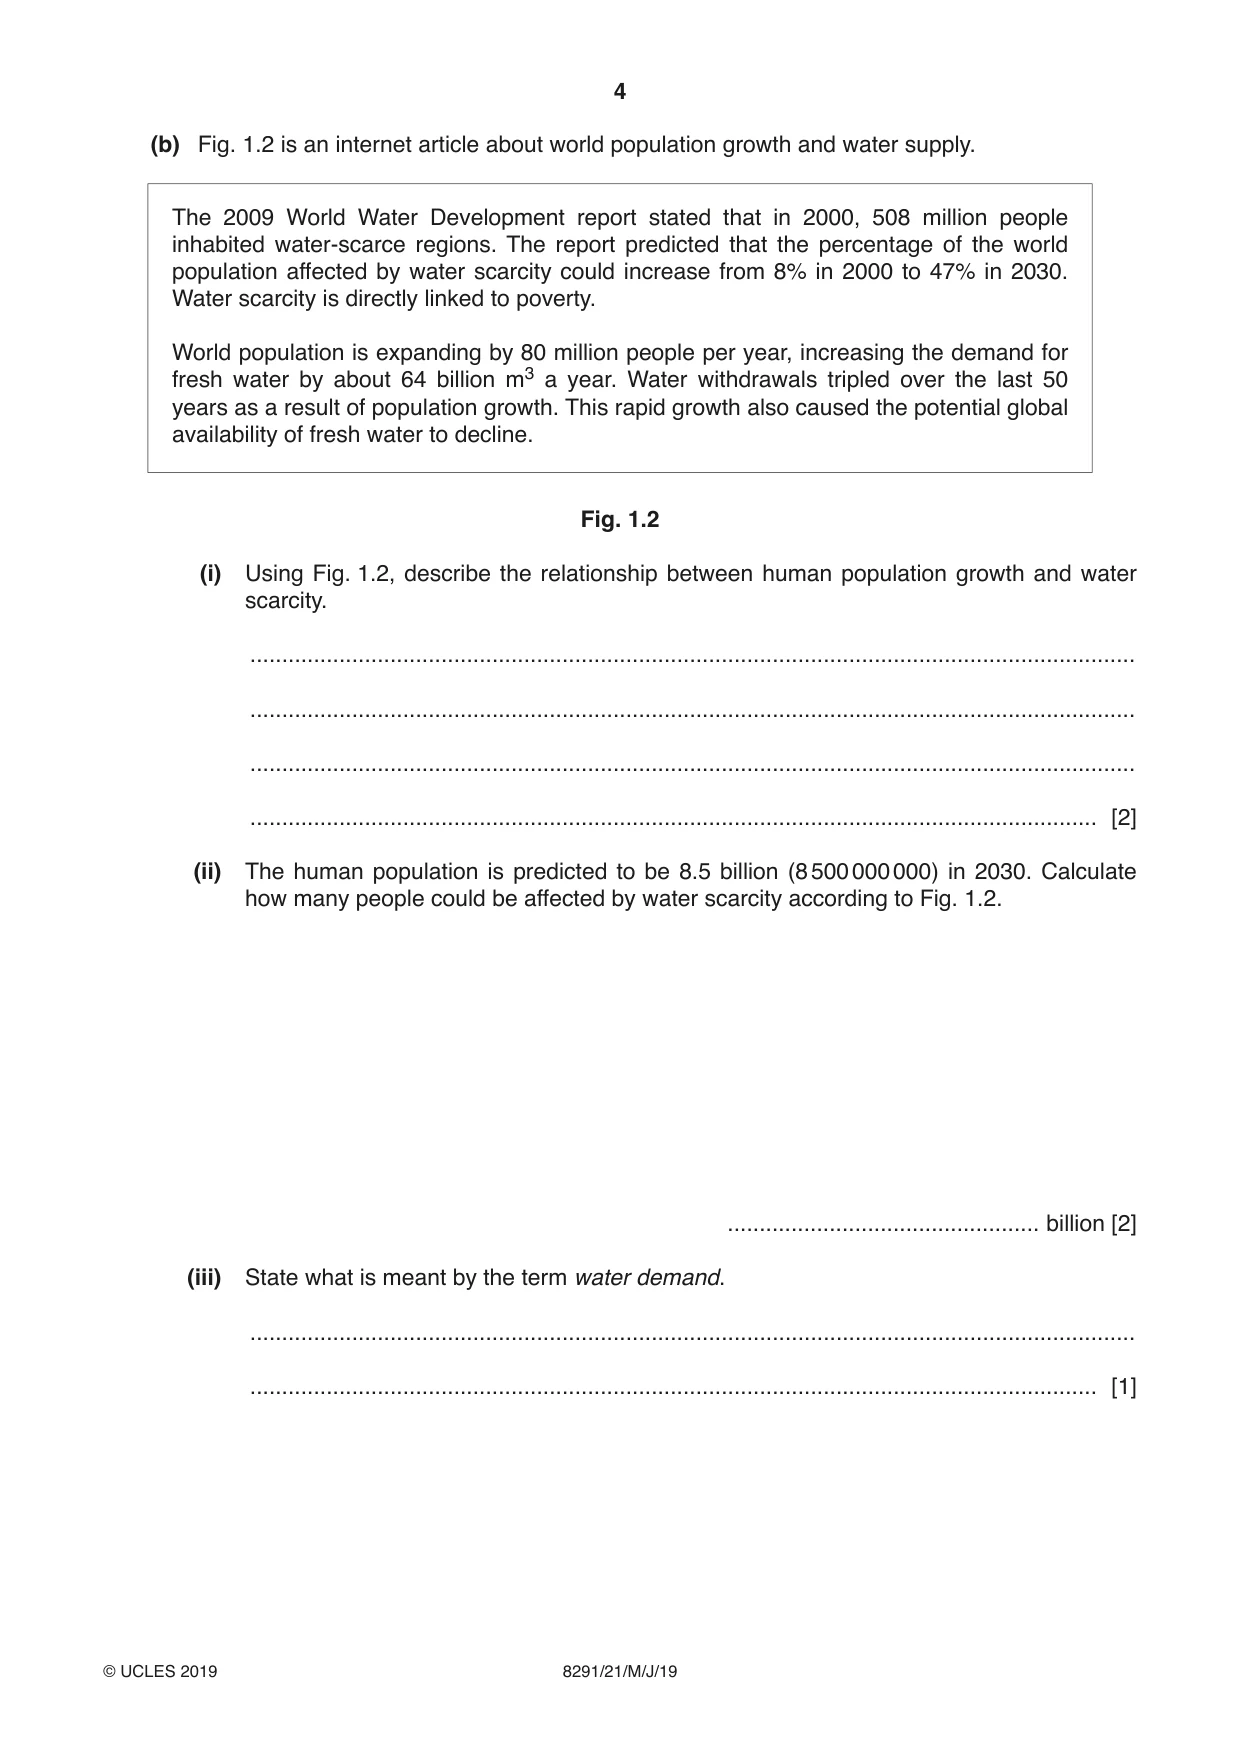
1 (a) Fig. 1.1 shows maps of Bangladesh and the surrounding area. Most of Bangladesh is a low‑lying area where floods often occur. Key CHINA international boundary NEPAL BHUTAN disputed boundary INDIA hills / mountains BANGLADESH INDIA MYANMAR THAILAND N Key Brahmaputra low-lying land Dinajpur hills / mountains Rangpur INDIA water international boundary city Jamalpur capital city Sylhet major river Mymensingh Rajshahi river Pabna Brahmanbaria Dhaka INDIA Narayanganj BANGLADESH Comilla Jessore Khulna INDIA Barisal Chittagong Mongla Bay of Bengal Cox’s Bazar 0 60 Indian Ocean km Fig. 1.1 (i) With reference to Fig. 1.1, suggest how the following human activities could cause flooding in Bangladesh: increased deforestation in Nepal ....................................................................................... ........................................................................................................................................... ........................................................................................................................................... ........................................................................................................................................... increased dam building in India ......................................................................................... ........................................................................................................................................... ........................................................................................................................................... ........................................................................................................................................... increased population in Bangladesh. ................................................................................ ........................................................................................................................................... ........................................................................................................................................... ..................................................................................................................................... [6] (ii) With reference to Fig. 1.1, suggest the impacts on Bangladesh of rising sea levels due to global warming. ........................................................................................................................................... ........................................................................................................................................... ........................................................................................................................................... ........................................................................................................................................... ........................................................................................................................................... ........................................................................................................................................... ........................................................................................................................................... ..................................................................................................................................... [4] (b) Fig. 1.2 is an internet article about world population growth and water supply. The 2009 World Water Development report stated that in 2000, 508 million people inhabited water‑scarce regions. The report predicted that the percentage of the world population affected by water scarcity could increase from 8% in 2000 to 47% in 2030. Water scarcity is directly linked to poverty. World population is expanding by 80 million people per year, increasing the demand for fresh water by about 64 billion m3 a year. Water withdrawals tripled over the last 50 years as a result of population growth. This rapid growth also caused the potential global availability of fresh water to decline. Fig. 1.2 (i) Using Fig. 1.2, describe the relationship between human population growth and water scarcity. ........................................................................................................................................... ........................................................................................................................................... ........................................................................................................................................... ..................................................................................................................................... [2] (ii) The human population is predicted to be 8.5 billion (8 500 000 000) in 2030. Calculate how many people could be affected by water scarcity according to Fig. 1.2. ................................................. billion [2] (iii) State what is meant by the term water demand. ........................................................................................................................................... ..................................................................................................................................... [1] (iv) Outline five ways population growth increases the demand for water. ........................................................................................................................................... ........................................................................................................................................... ........................................................................................................................................... ........................................................................................................................................... ........................................................................................................................................... ........................................................................................................................................... ........................................................................................................................................... ........................................................................................................................................... ........................................................................................................................................... ..................................................................................................................................... [5] [Total: 20]
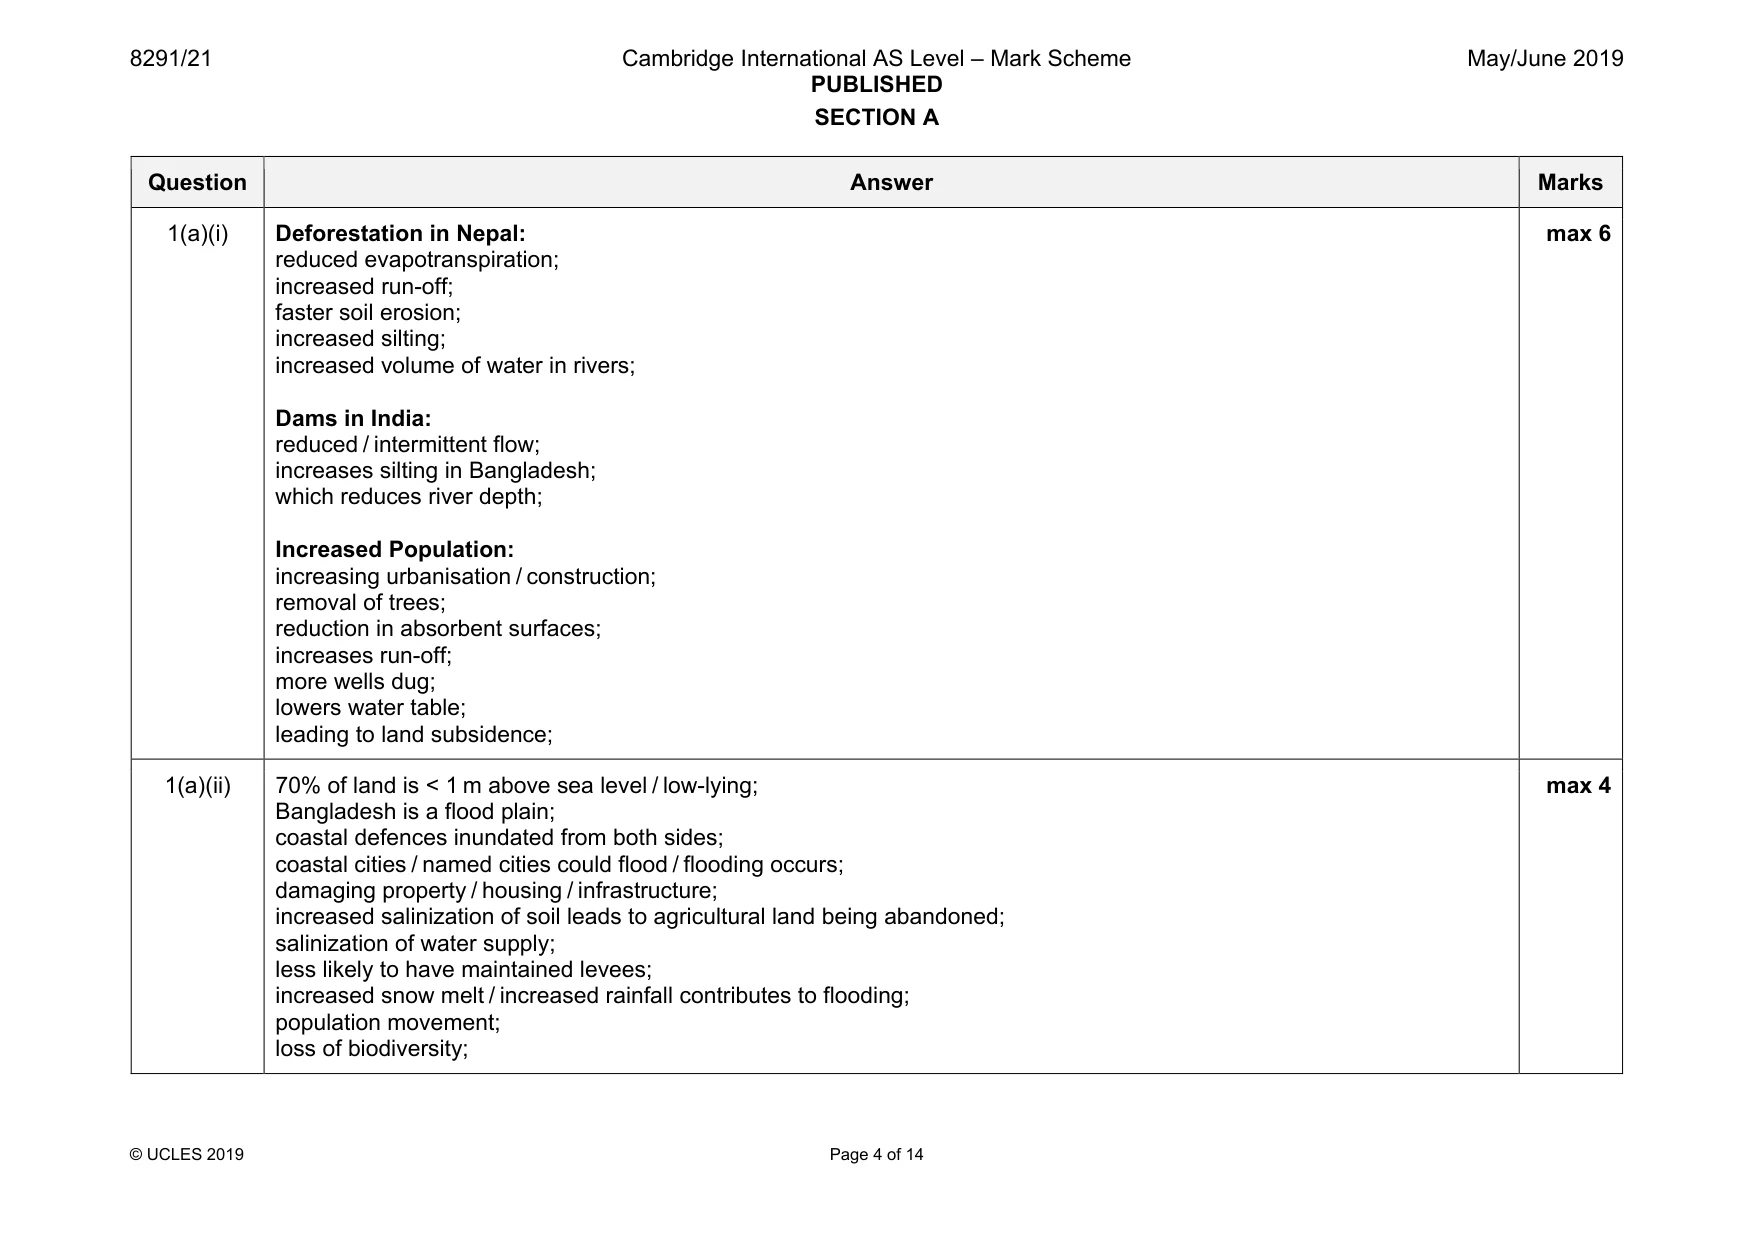
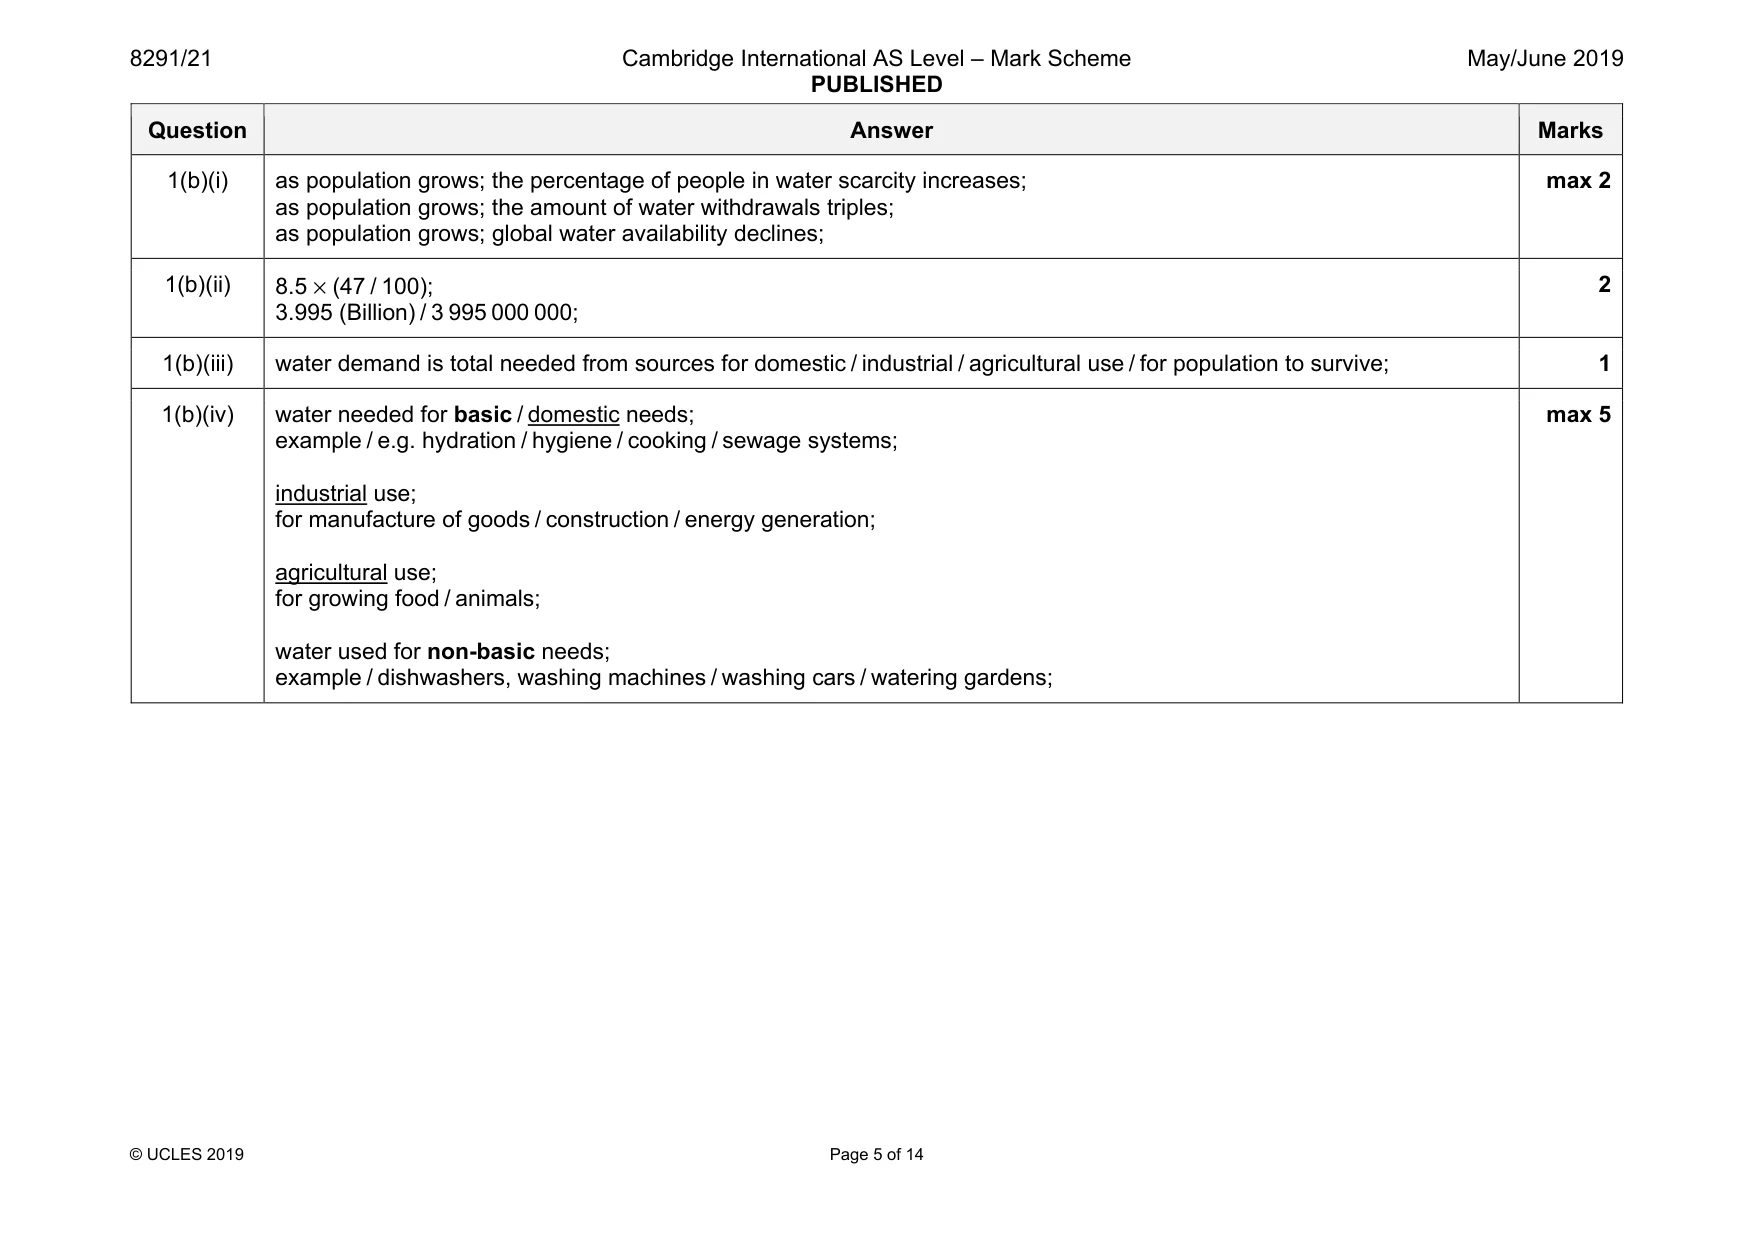
Mark scheme: 1(a)(i) Deforestation in Nepal: reduced evapotranspiration; increased run-off; faster soil erosion; increased silting; increased volume of water in rivers; Dams in India: reduced / intermittent flow; increases silting in Bangladesh; which reduces river depth; Increased Population: increasing urbanisation / construction; removal of trees; reduction in absorbent surfaces; increases run-off; more wells dug; lowers water table; leading to land subsidence; max 6 1(a)(ii) 70% of land is < 1 m above sea level / low-lying; Bangladesh is a flood plain; coastal defences inundated from both sides; coastal cities / named cities could flood / flooding occurs; damaging property / housing / infrastructure; increased salinization of soil leads to agricultural land being abandoned; salinization of water supply; less likely to have maintained levees; increased snow melt / increased rainfall contributes to flooding; population movement; loss of biodiversity; max 4 Question Answer Marks 1(b)(i) as population grows; the percentage of people in water scarcity increases; as population grows; the amount of water withdrawals triples; as population grows; global water availability declines; max 2 1(b)(ii) 8.5 × (47 / 100); 3.995 (Billion) / 3 995 000 000; 2 1(b)(iii) water demand is total needed from sources for domestic / industrial / agricultural use / for population to survive; 1 1(b)(iv) water needed for basic / domestic needs; example / e.g. hydration / hygiene / cooking / sewage systems; industrial use; for manufacture of goods / construction / energy generation; agricultural use; for growing food / animals; water used for non-basic needs; example / dishwashers, washing machines / washing cars / watering gardens; max 5
Q2 · A map of a region of the North West Pacific and a graph showing total input of nitrogen…
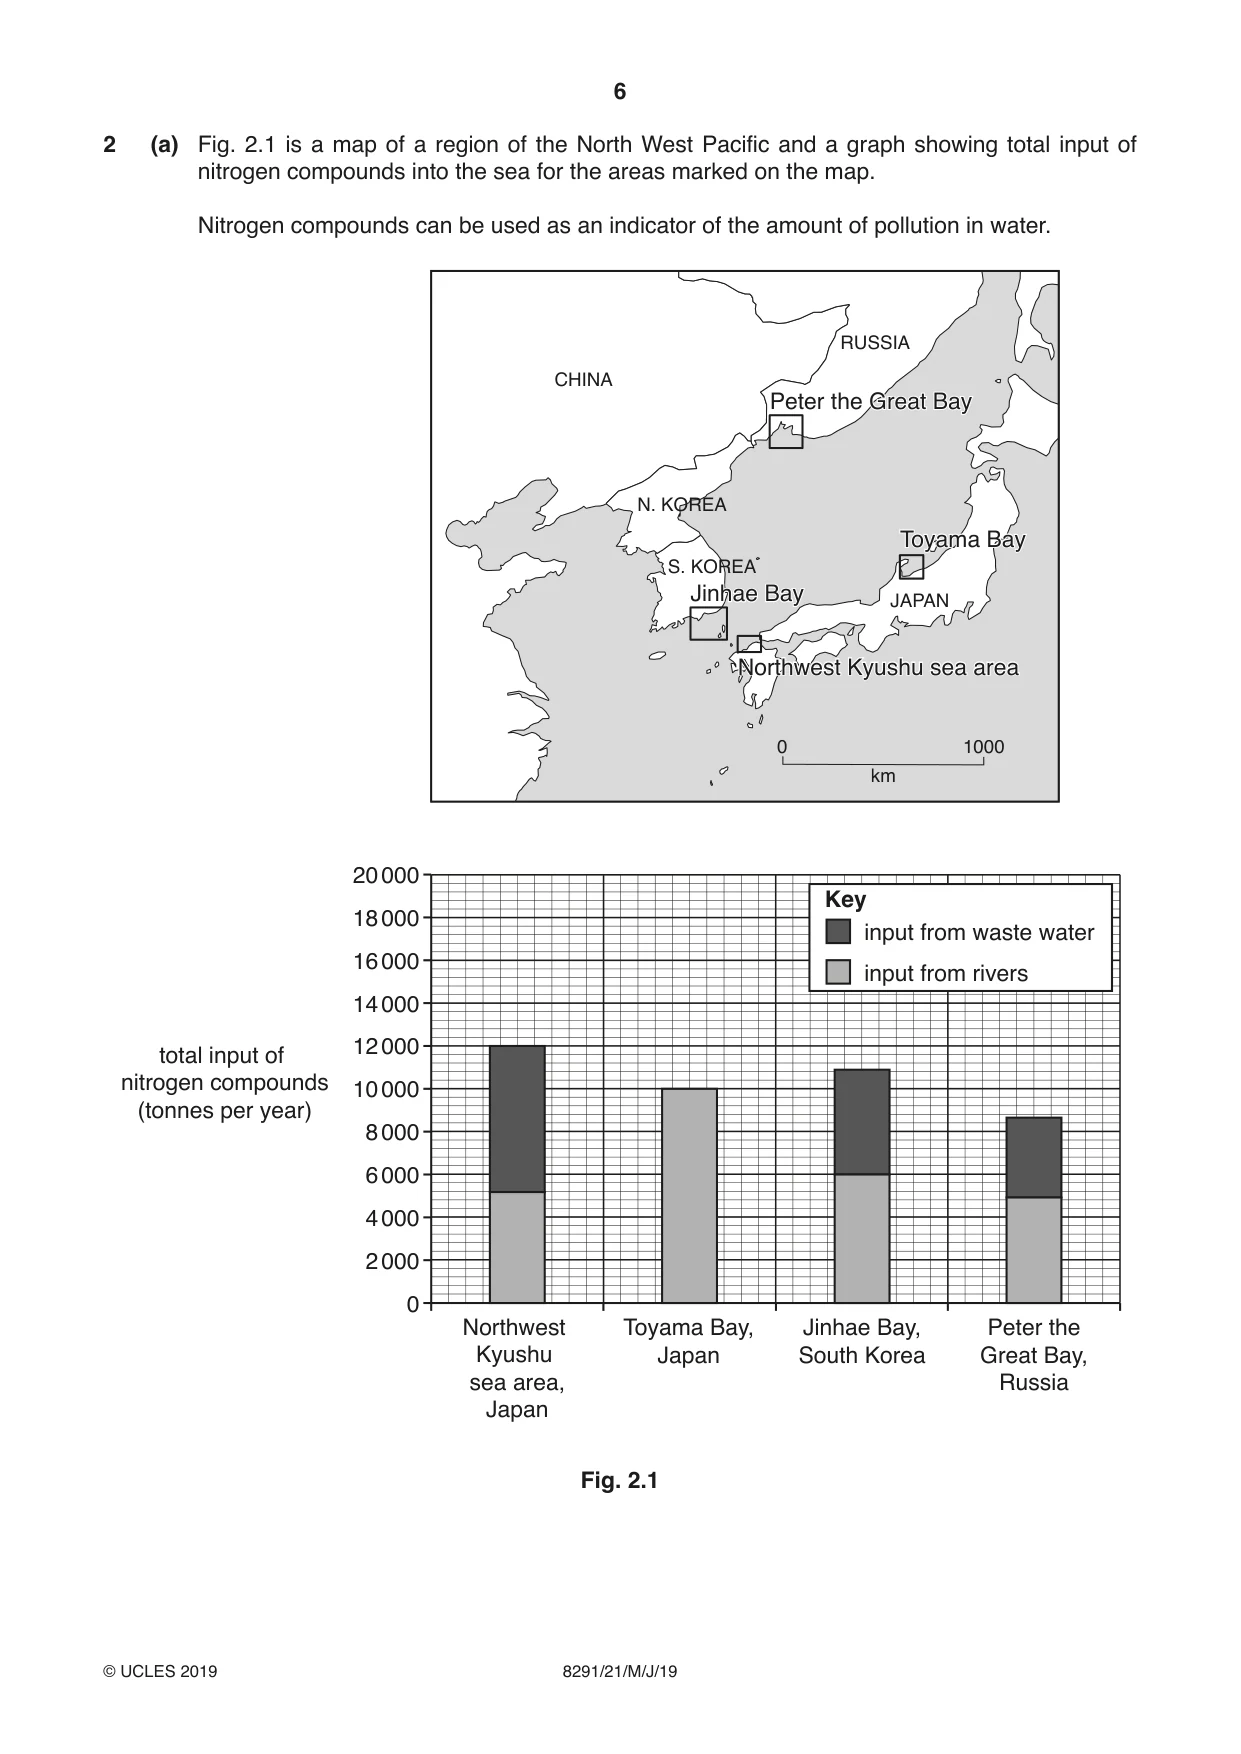
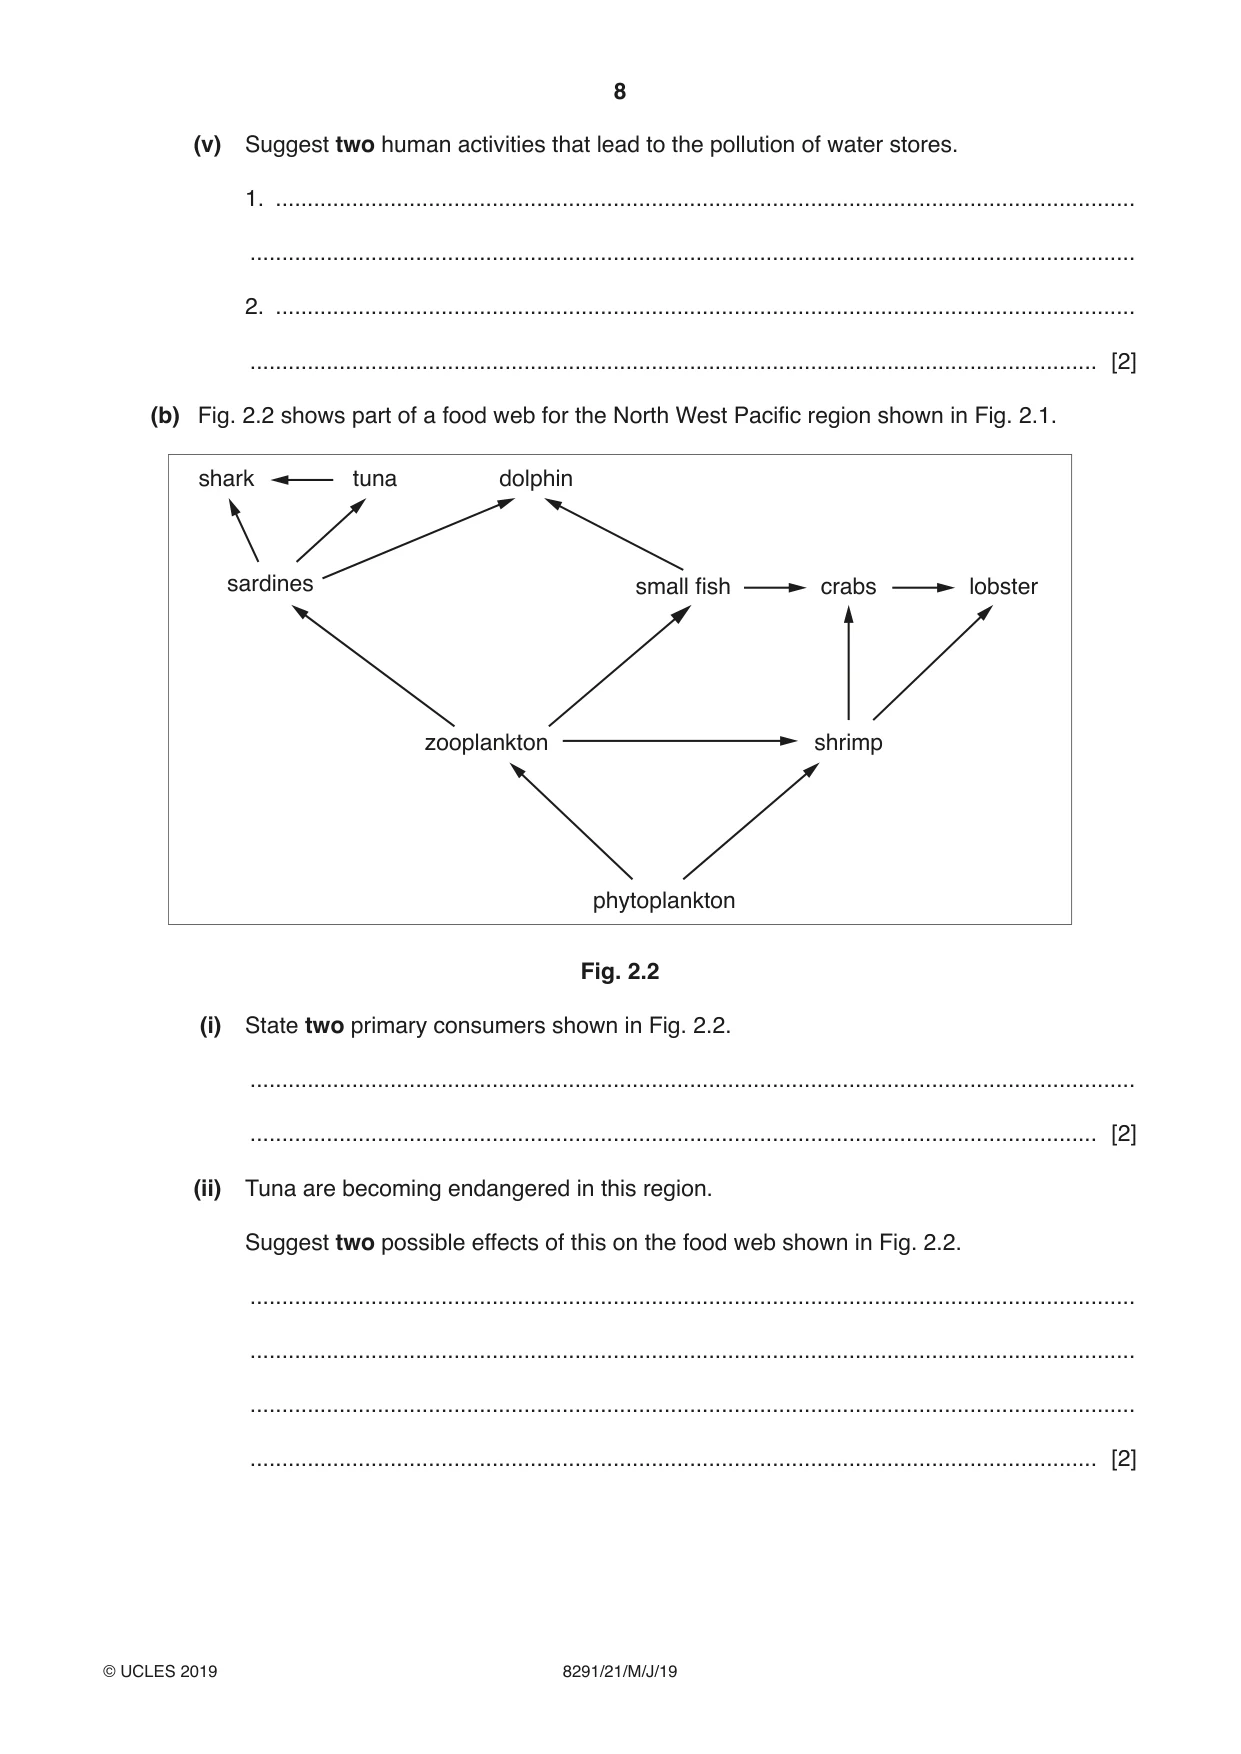
2 (a) Fig. 2.1 is a map of a region of the North West Pacific and a graph showing total input of nitrogen compounds into the sea for the areas marked on the map. Nitrogen compounds can be used as an indicator of the amount of pollution in water. RUSSIA CHINA Peter the Great Bay N. KOREA Toyama Bay S. KOREA Jinhae Bay JAPAN Northwest Kyushu sea area 0 1000 km 20 000 Key 18 000 input from waste water 16 000 input from rivers 14 000 12 000 total input of nitrogen compounds 10 000 (tonnes per year) 8 000 6 000 4 000 2 000 0 Northwest Toyama Bay, Jinhae Bay, Peter the Kyushu Japan South Korea Great Bay, sea area, Russia Japan Fig. 2.1 (i) Using Fig. 2.1, state which area receives the highest total input of nitrogen compounds from waste water. ........................................................................................................................................... ..................................................................................................................................... [1] (ii) Using Fig. 2.1, calculate the total input of nitrogen compounds from rivers per year into the four areas. .................... tonnes of nitrogen per year [2] (iii) Name the process in which pollution of lakes by compounds containing nitrogen and phosphorus leads to algal blooms. ..................................................................................................................................... [1] (iv) Explain how the process named in 2(a)(iii) leads to the loss of biodiversity. ........................................................................................................................................... ........................................................................................................................................... ........................................................................................................................................... ........................................................................................................................................... ........................................................................................................................................... ........................................................................................................................................... ........................................................................................................................................... ........................................................................................................................................... ........................................................................................................................................... ........................................................................................................................................... ........................................................................................................................................... ..................................................................................................................................... [6] (v) Suggest two human activities that lead to the pollution of water stores. 1. ....................................................................................................................................... ........................................................................................................................................... 2. ....................................................................................................................................... ..................................................................................................................................... [2] (b) Fig. 2.2 shows part of a food web for the North West Pacific region shown in Fig. 2.1. shark tuna dolphin sardines small fish crabs lobster zooplankton shrimp phytoplankton Fig. 2.2 (i) State two primary consumers shown in Fig. 2.2. ........................................................................................................................................... ..................................................................................................................................... [2] (ii) Tuna are becoming endangered in this region. Suggest two possible effects of this on the food web shown in Fig. 2.2. ........................................................................................................................................... ........................................................................................................................................... ........................................................................................................................................... ..................................................................................................................................... [2] (iii) Marine ecosystems are under threat from a range of human activities. Suggest strategies to manage these threats and to conserve these important habitats. ........................................................................................................................................... ........................................................................................................................................... ........................................................................................................................................... ........................................................................................................................................... ........................................................................................................................................... ........................................................................................................................................... ........................................................................................................................................... ..................................................................................................................................... [4] [Total: 20]
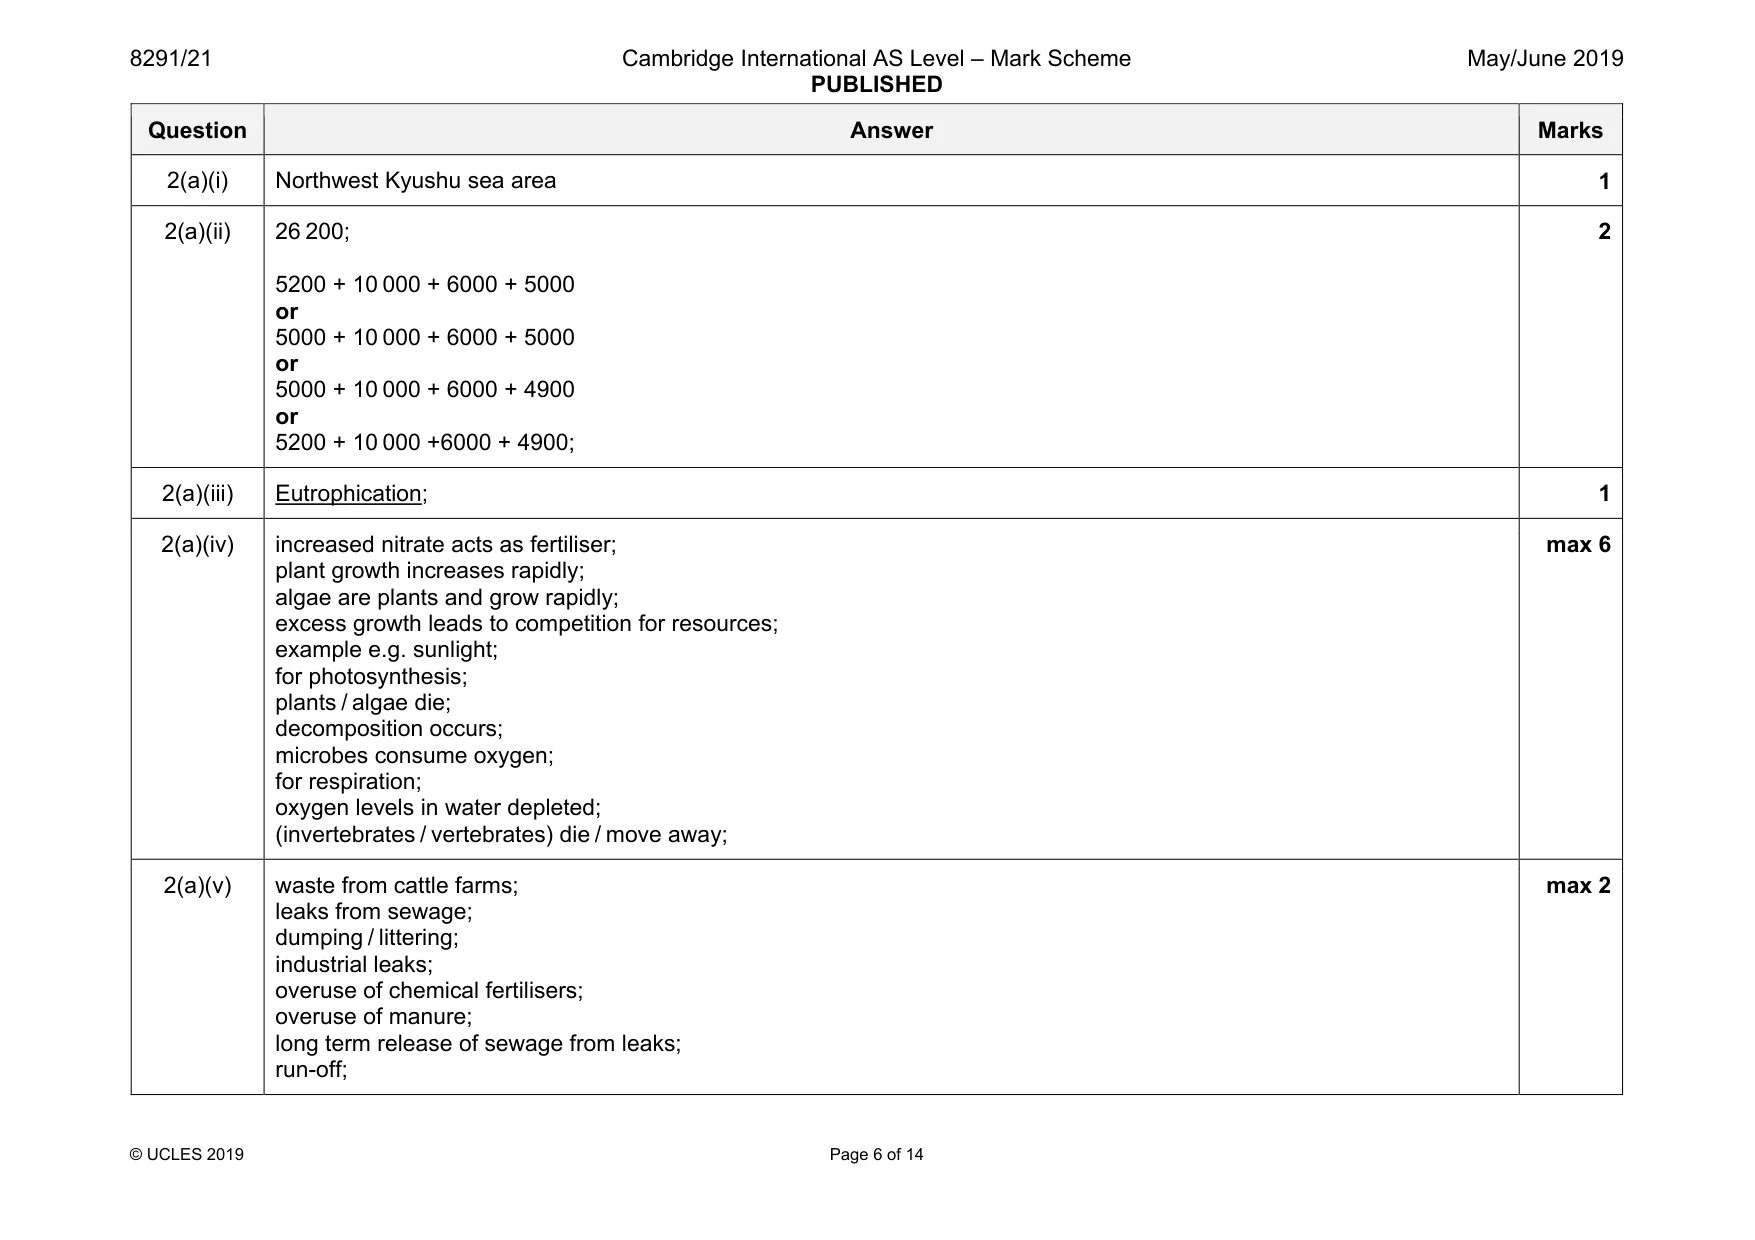
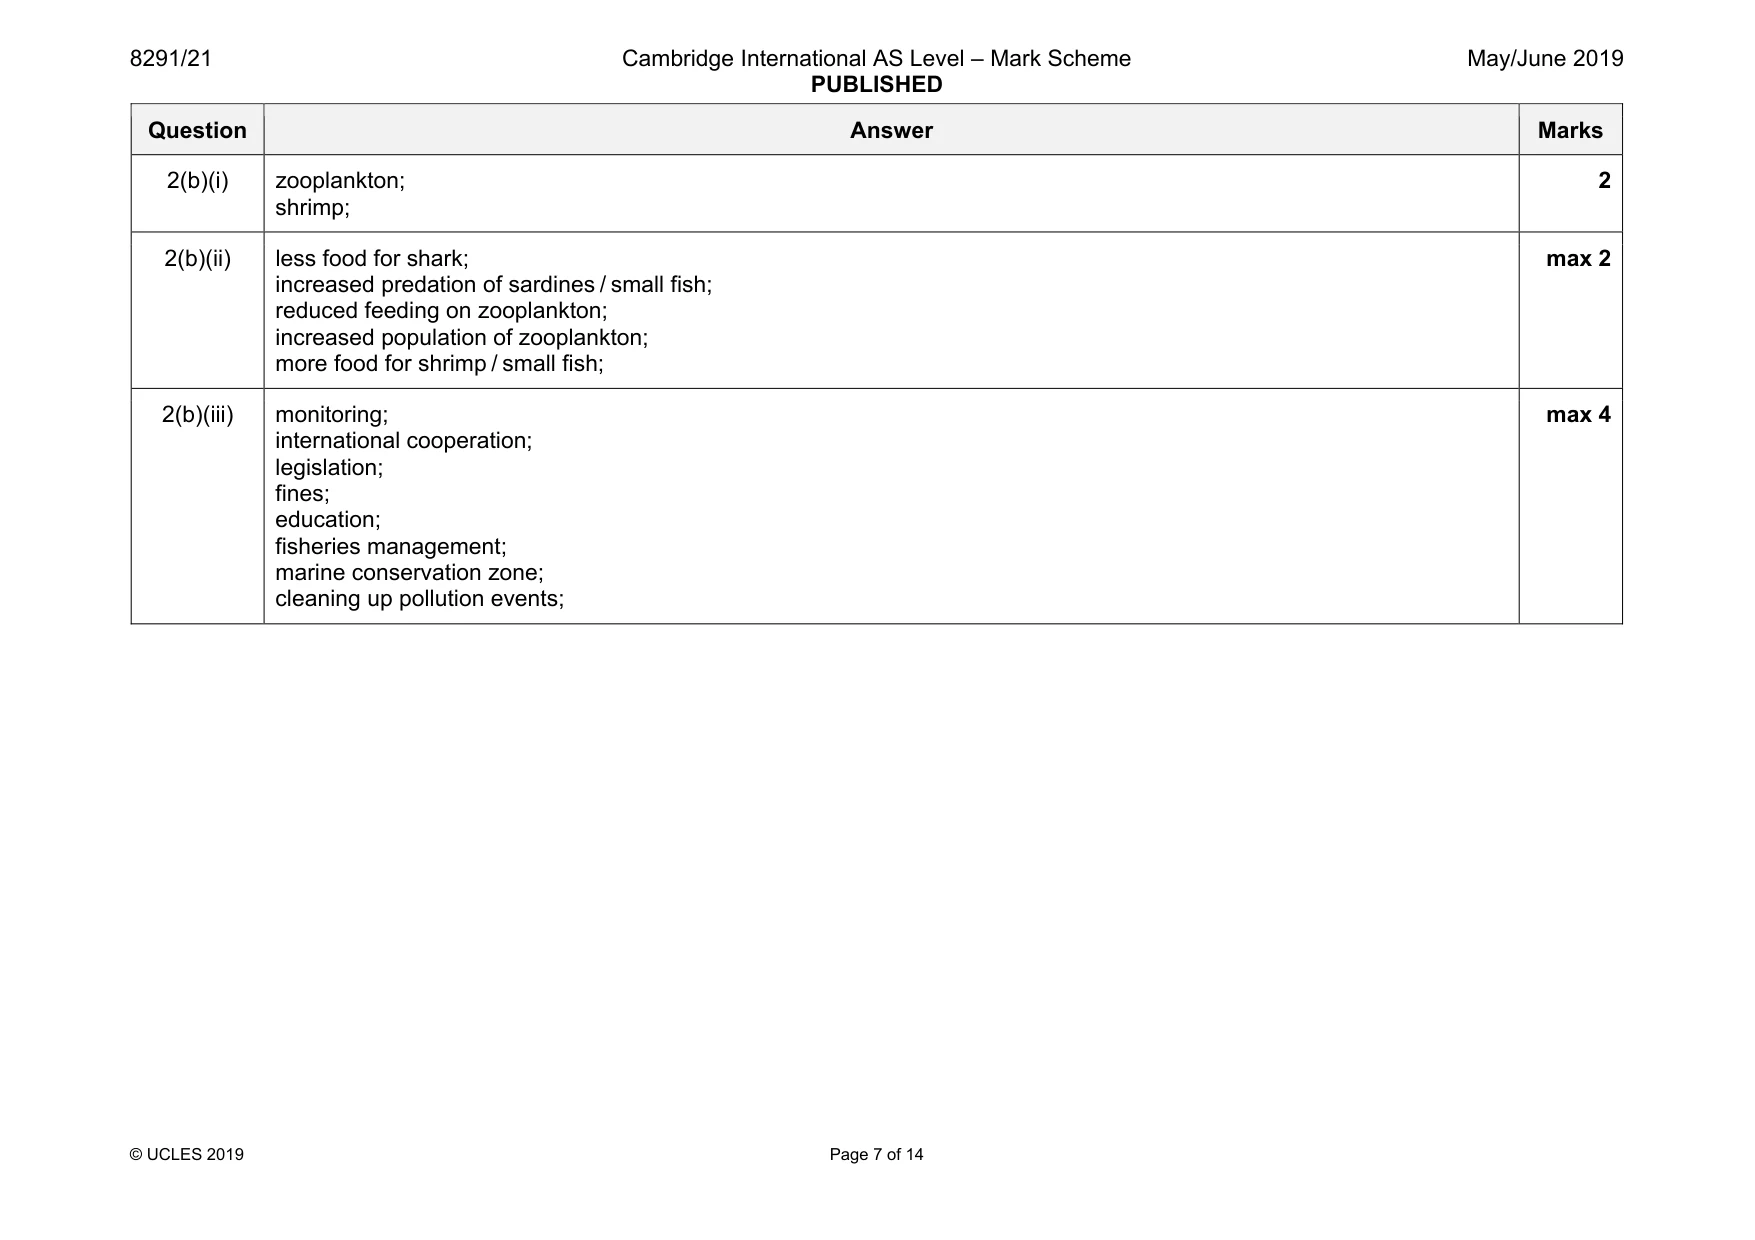
Mark scheme: 2(a)(i) Northwest Kyushu sea area 1 2(a)(ii) 26 200; 5200 + 10 000 + 6000 + 5000 or 5000 + 10 000 + 6000 + 5000 or 5000 + 10 000 + 6000 + 4900 or 5200 + 10 000 +6000 + 4900; 2 2(a)(iii) Eutrophication; 1 2(a)(iv) increased nitrate acts as fertiliser; plant growth increases rapidly; algae are plants and grow rapidly; excess growth leads to competition for resources; example e.g. sunlight; for photosynthesis; plants / algae die; decomposition occurs; microbes consume oxygen; for respiration; oxygen levels in water depleted; (invertebrates / vertebrates) die / move away; max 6 2(a)(v) waste from cattle farms; leaks from sewage; dumping / littering; industrial leaks; overuse of chemical fertilisers; overuse of manure; long term release of sewage from leaks; run-off; max 2 Question Answer Marks 2(b)(i) zooplankton; shrimp; 2 2(b)(ii) less food for shark; increased predation of sardines / small fish; reduced feeding on zooplankton; increased population of zooplankton; more food for shrimp / small fish; max 2 2(b)(iii) monitoring; international cooperation; legislation; fines; education; fisheries management; marine conservation zone; cleaning up pollution events; max 4
Q3 · A flow diagram showing the effect of human pressure on an ecosystem and the possible…
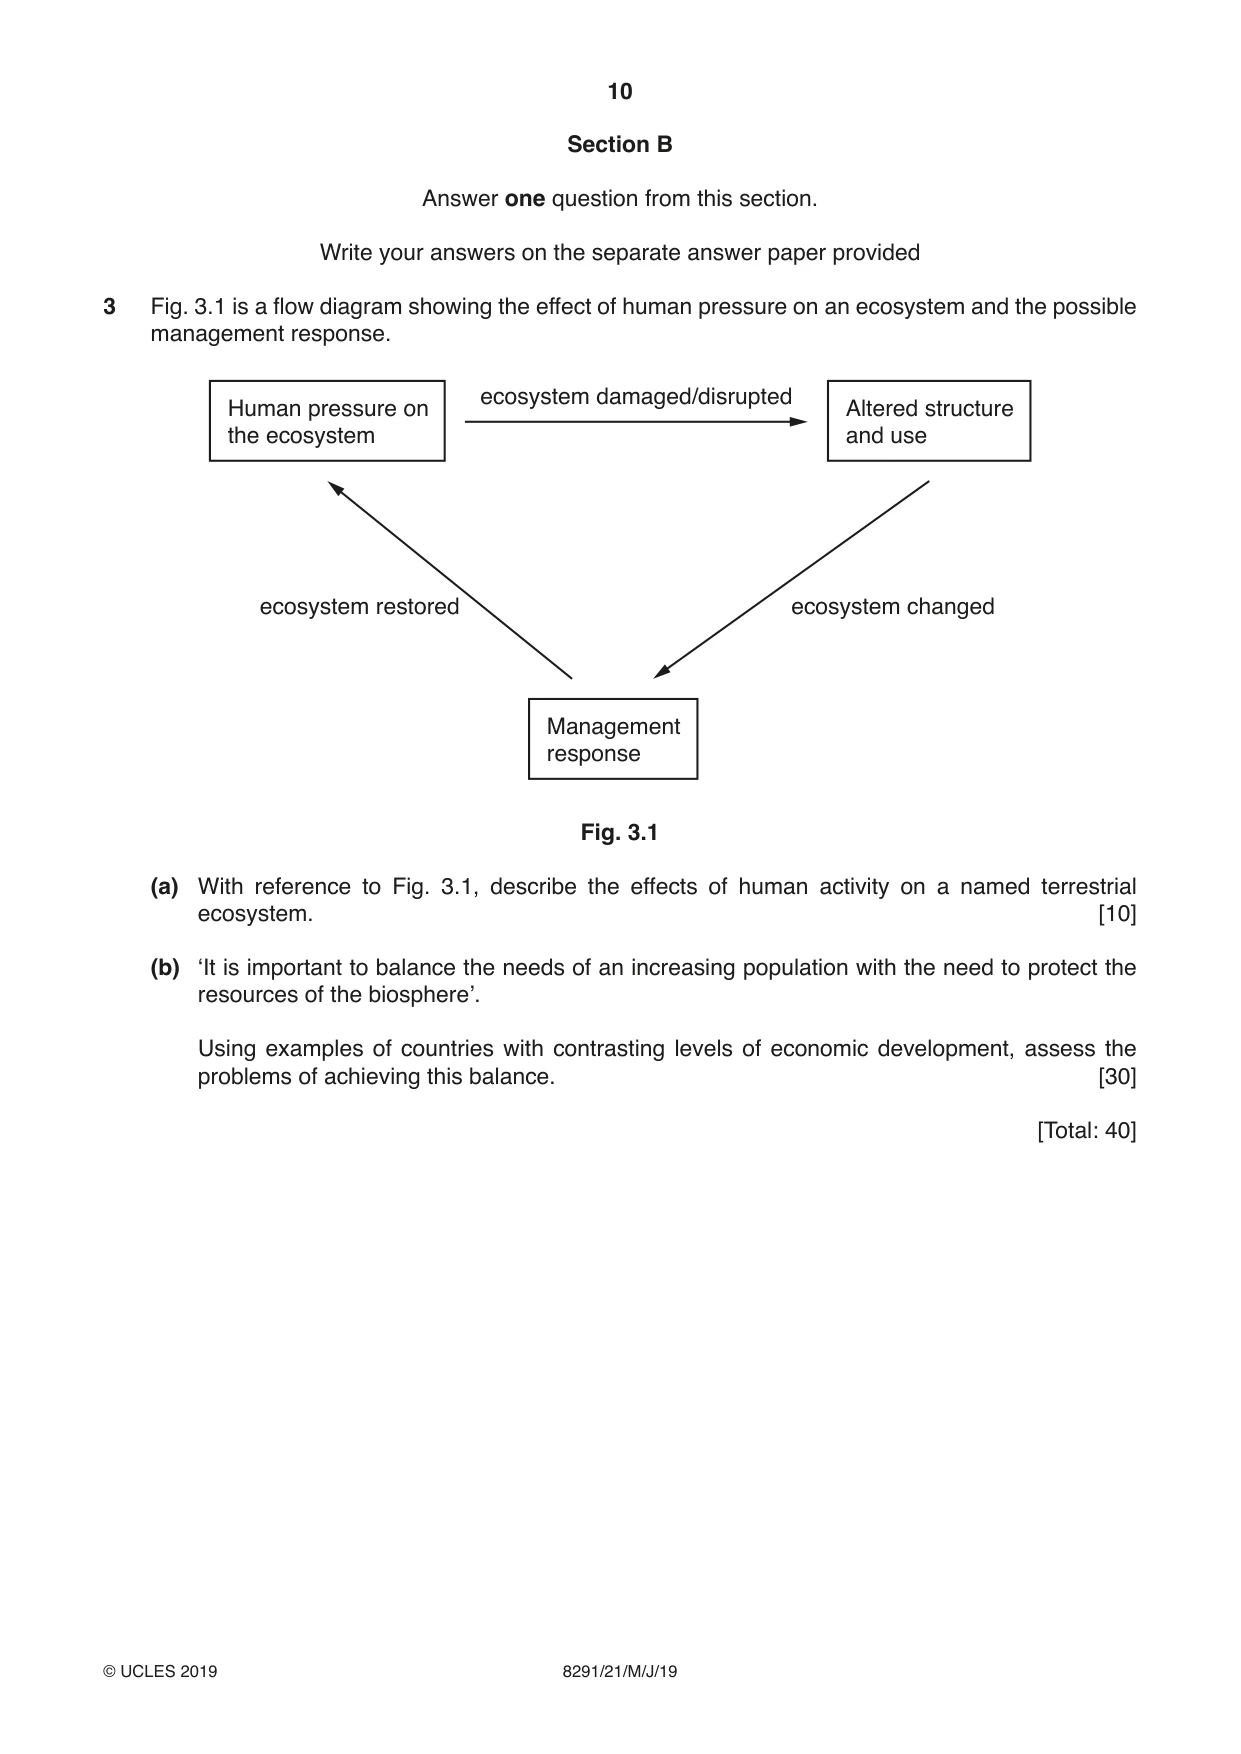
3 Fig. 3.1 is a flow diagram showing the effect of human pressure on an ecosystem and the possible management response. ecosystem damaged/disrupted Human pressure on Altered structure the ecosystem and use ecosystem restored ecosystem changed Management response Fig. 3.1 (a) With reference to Fig. 3.1, describe the effects of human activity on a named terrestrial ecosystem. [10] (b) ‘It is important to balance the needs of an increasing population with the need to protect the resources of the biosphere’. Using examples of countries with contrasting levels of economic development, assess the problems of achieving this balance. [30] [Total: 40]
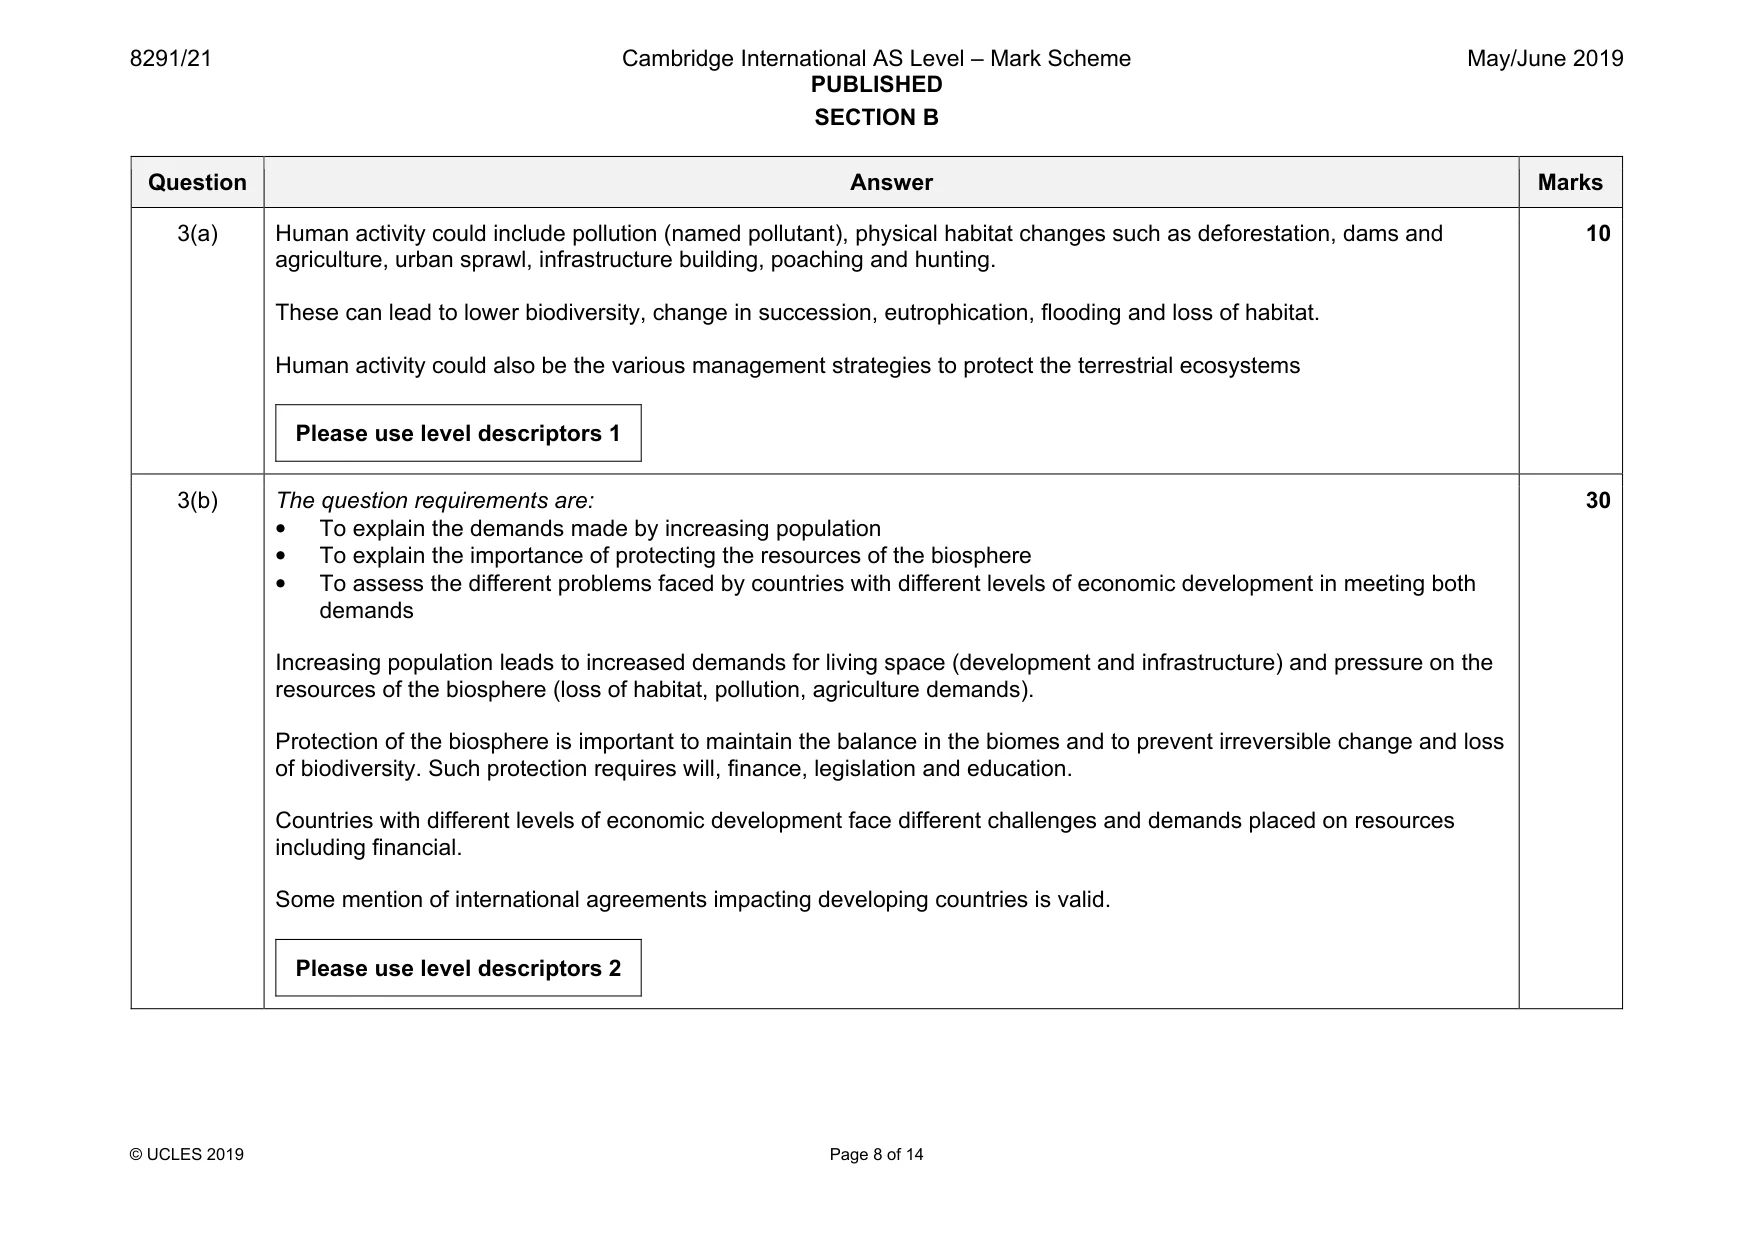
Mark scheme: 3(a) Human activity could include pollution (named pollutant), physical habitat changes such as deforestation, dams and agriculture, urban sprawl, infrastructure building, poaching and hunting. These can lead to lower biodiversity, change in succession, eutrophication, flooding and loss of habitat. Human activity could also be the various management strategies to protect the terrestrial ecosystems Please use level descriptors 1 10 3(b) The question requirements are: • To explain the demands made by increasing population • To explain the importance of protecting the resources of the biosphere • To assess the different problems faced by countries with different levels of economic development in meeting both demands Increasing population leads to increased demands for living space (development and infrastructure) and pressure on the resources of the biosphere (loss of habitat, pollution, agriculture demands). Protection of the biosphere is important to maintain the balance in the biomes and to prevent irreversible change and loss of biodiversity. Such protection requires will, finance, legislation and education. Countries with different levels of economic development face different challenges and demands placed on resources including financial. Some mention of international agreements impacting developing countries is valid. Please use level descriptors 2 30
Q4 · A series of photographs showing changes in the Grinnell Glacier, Montana, USA, between…
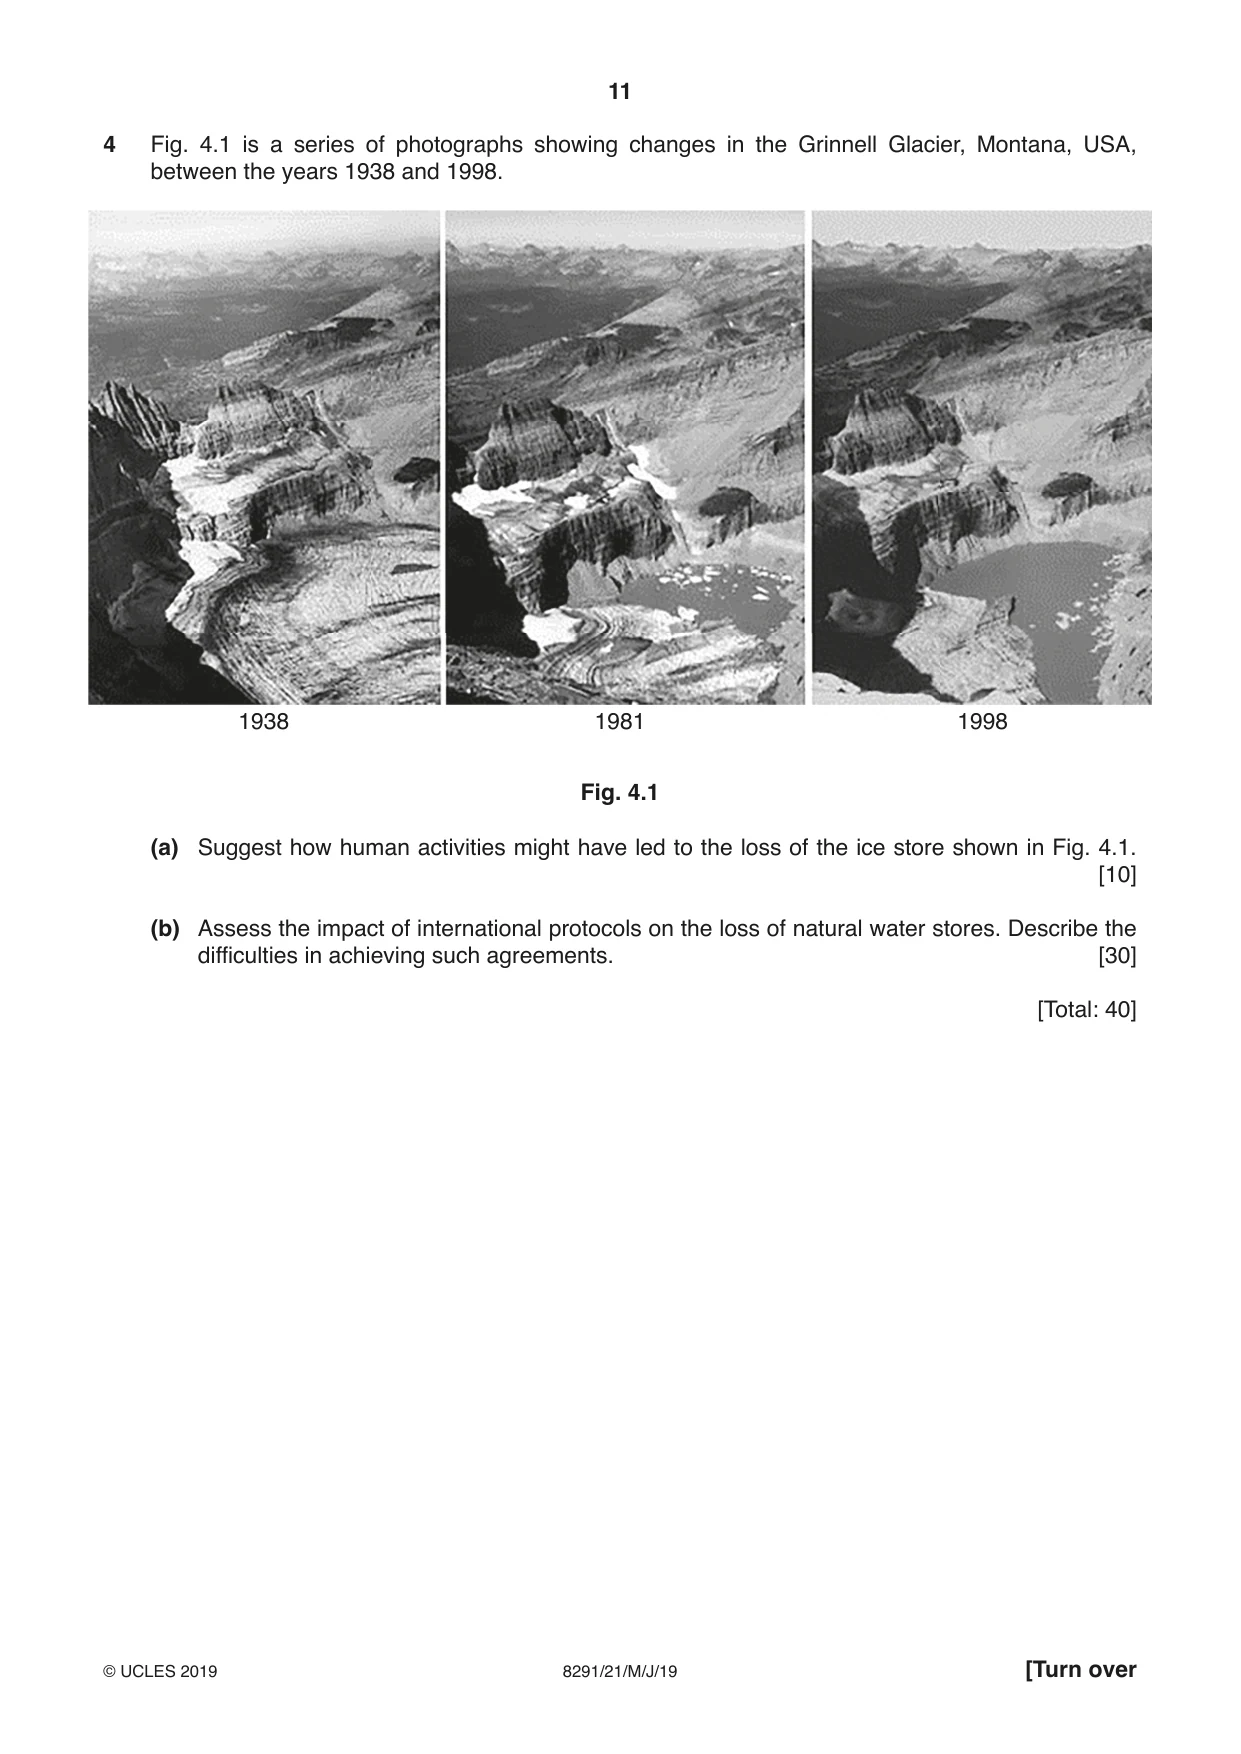
4 Fig. 4.1 is a series of photographs showing changes in the Grinnell Glacier, Montana, USA, between the years 1938 and 1998. 1938 1981 1998 Fig. 4.1 (a) Suggest how human activities might have led to the loss of the ice store shown in Fig. 4.1. [10] (b) Assess the impact of international protocols on the loss of natural water stores. Describe the difficulties in achieving such agreements. [30] [Total: 40]
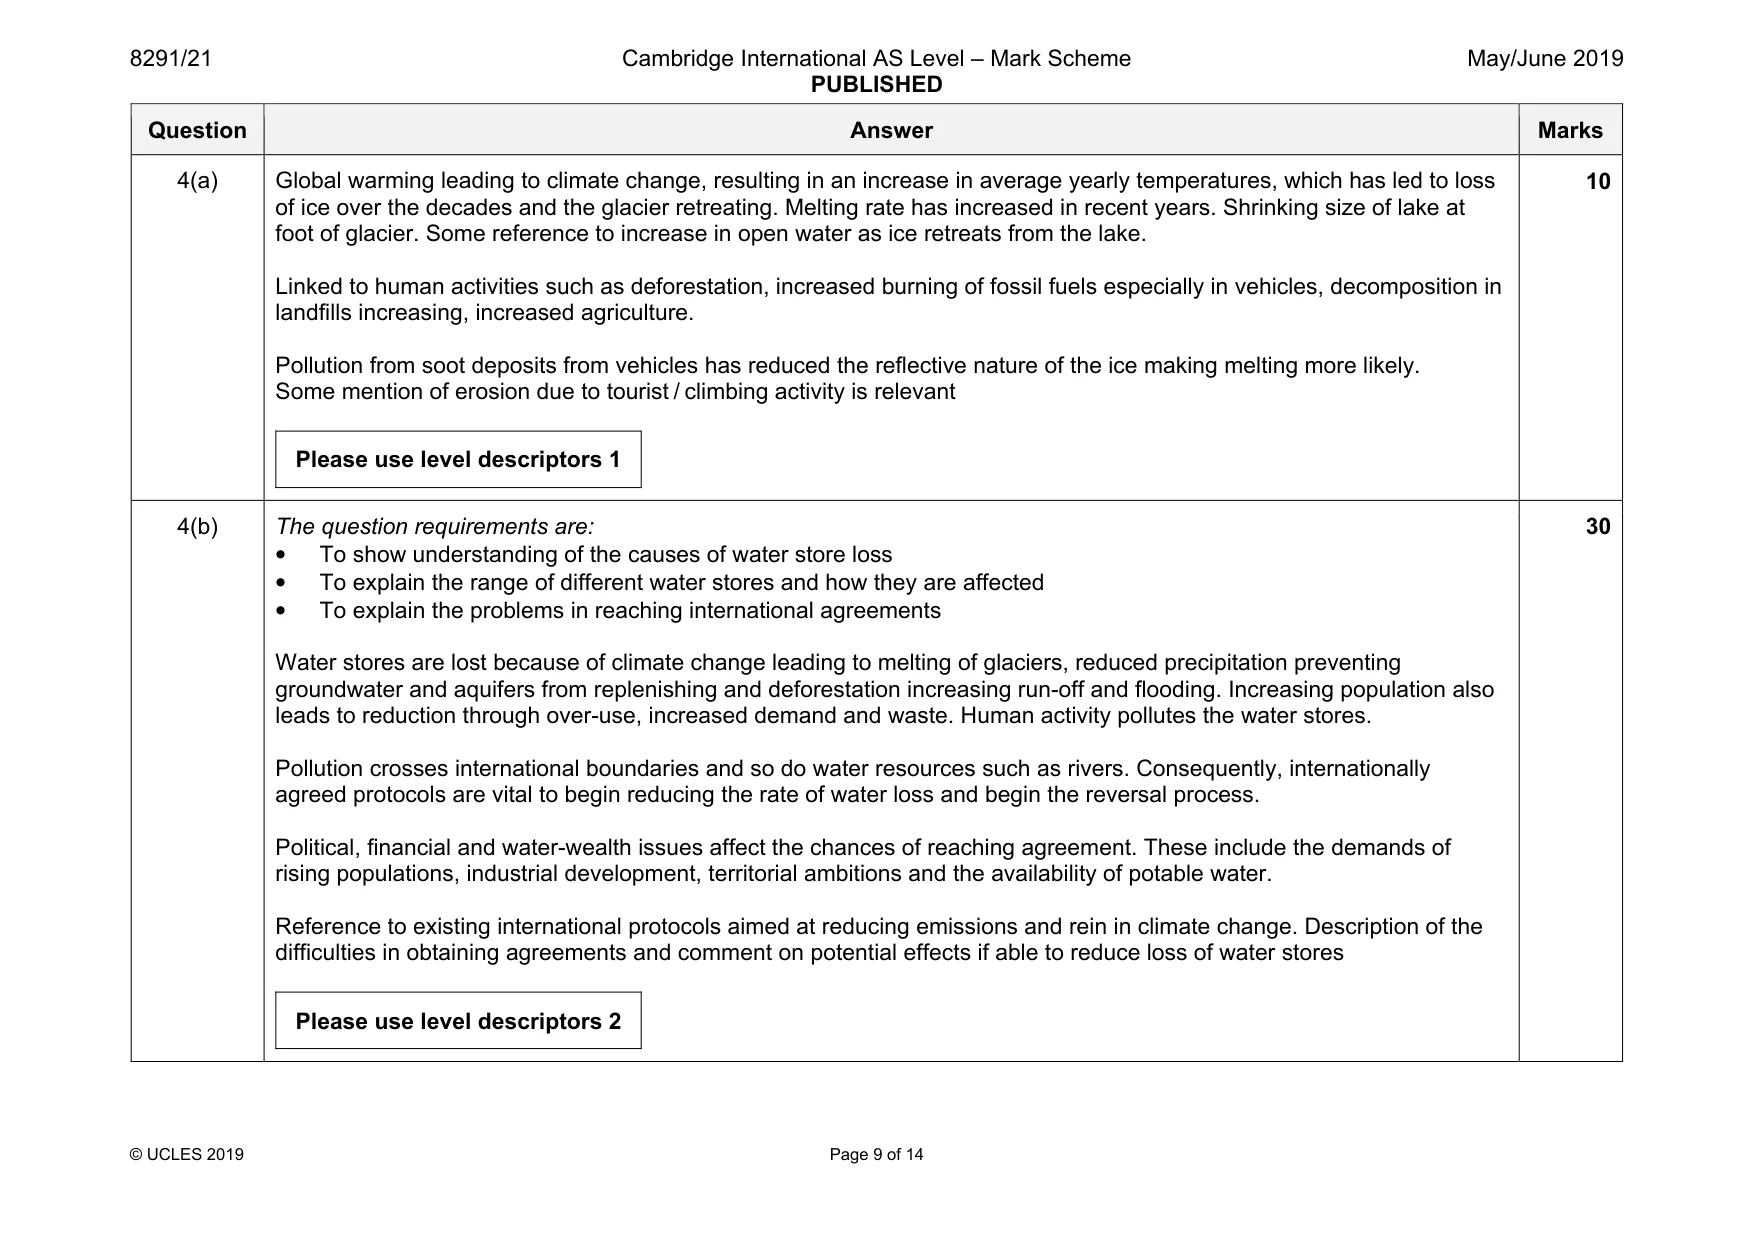
Mark scheme: 4(a) Global warming leading to climate change, resulting in an increase in average yearly temperatures, which has led to loss of ice over the decades and the glacier retreating. Melting rate has increased in recent years. Shrinking size of lake at foot of glacier. Some reference to increase in open water as ice retreats from the lake. Linked to human activities such as deforestation, increased burning of fossil fuels especially in vehicles, decomposition in landfills increasing, increased agriculture. Pollution from soot deposits from vehicles has reduced the reflective nature of the ice making melting more likely. Some mention of erosion due to tourist / climbing activity is relevant Please use level descriptors 1 10 4(b) The question requirements are: • To show understanding of the causes of water store loss • To explain the range of different water stores and how they are affected • To explain the problems in reaching international agreements Water stores are lost because of climate change leading to melting of glaciers, reduced precipitation preventing groundwater and aquifers from replenishing and deforestation increasing run-off and flooding. Increasing population also leads to reduction through over-use, increased demand and waste. Human activity pollutes the water stores. Pollution crosses international boundaries and so do water resources such as rivers. Consequently, internationally agreed protocols are vital to begin reducing the rate of water loss and begin the reversal process. Political, financial and water-wealth issues affect the chances of reaching agreement. These include the demands of rising populations, industrial development, territorial ambitions and the availability of potable water. Reference to existing international protocols aimed at reducing emissions and rein in climate change. Description of the difficulties in obtaining agreements and comment on potential effects if able to reduce loss of water stores Please use level descriptors 2 30
Q5 · Details of the tropical rainforests in West and Central Africa
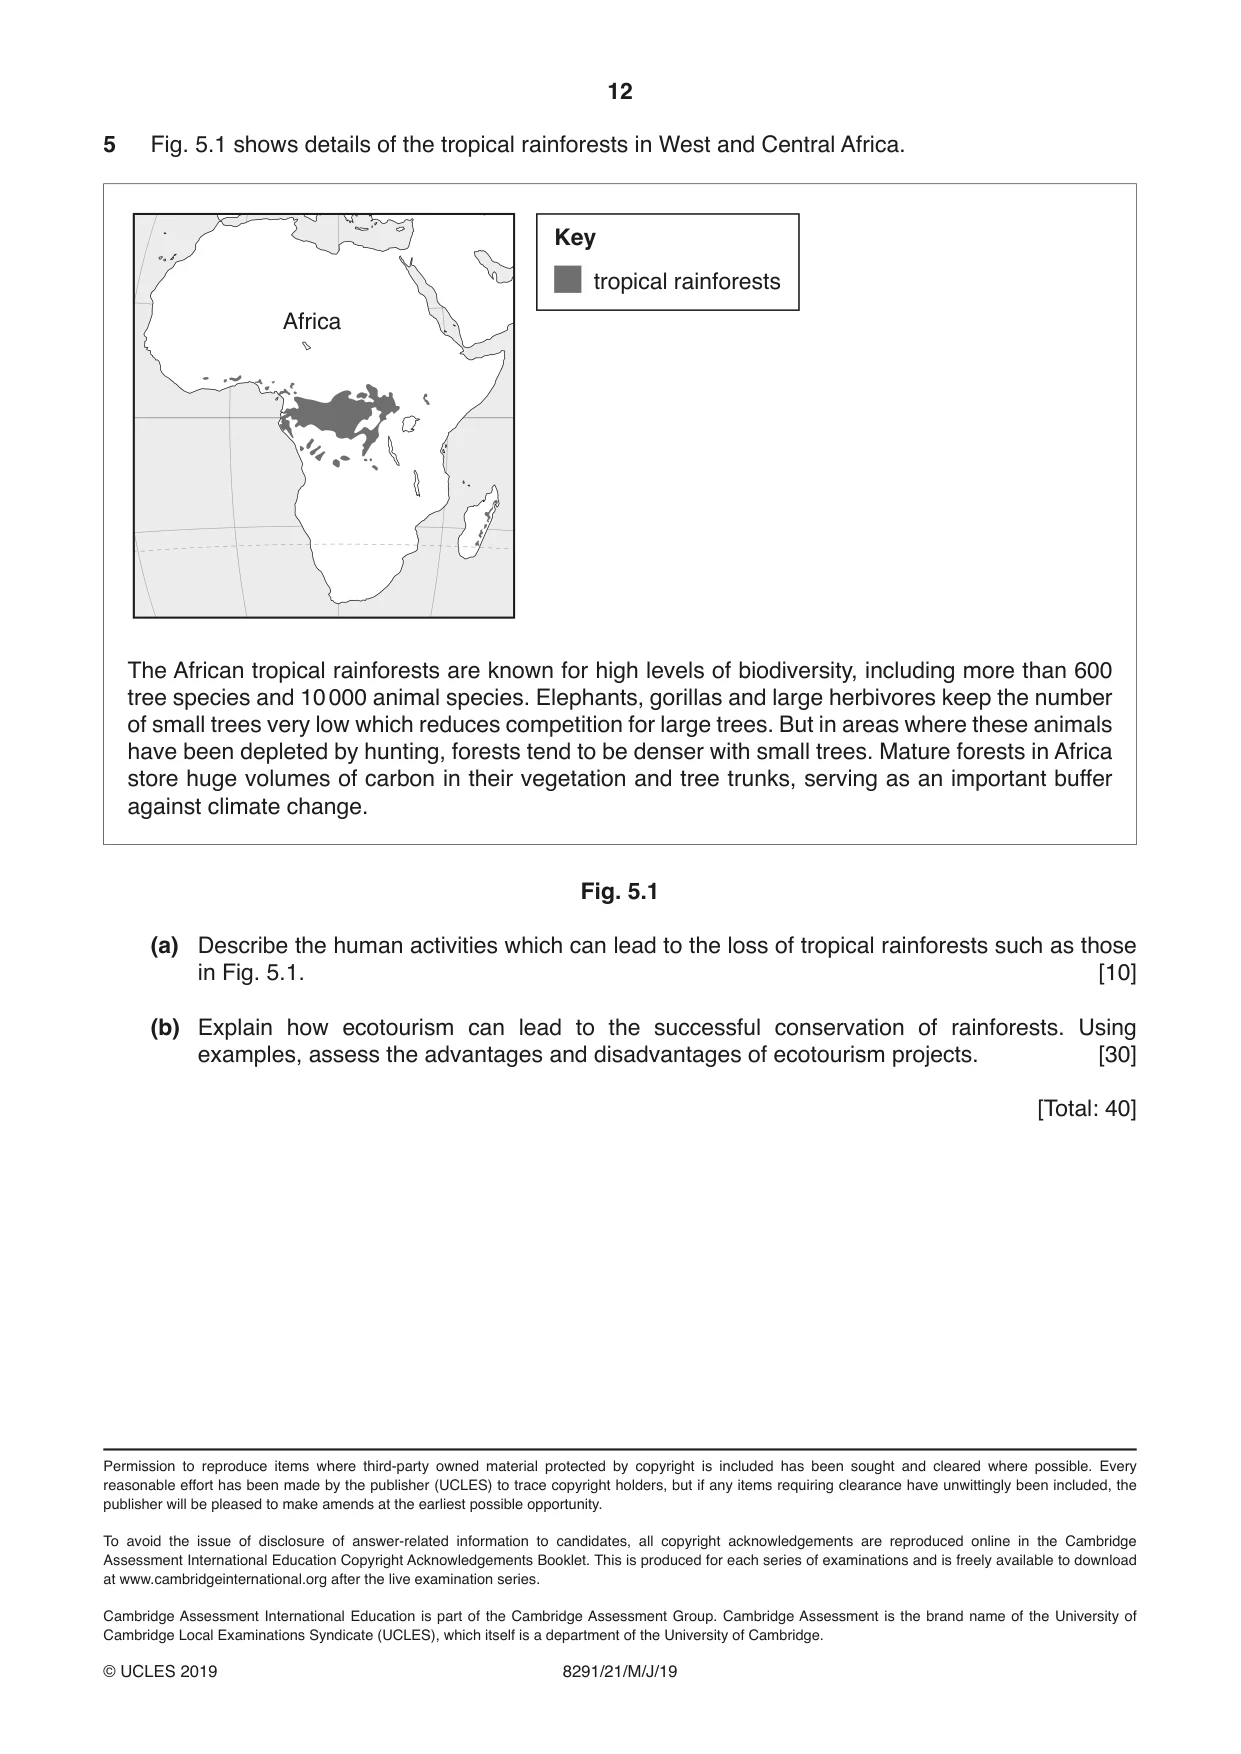
5 Fig. 5.1 shows details of the tropical rainforests in West and Central Africa. Key tropical rainforests Africa The African tropical rainforests are known for high levels of biodiversity, including more than 600 tree species and 10 000 animal species. Elephants, gorillas and large herbivores keep the number of small trees very low which reduces competition for large trees. But in areas where these animals have been depleted by hunting, forests tend to be denser with small trees. Mature forests in Africa store huge volumes of carbon in their vegetation and tree trunks, serving as an important buffer against climate change. Fig. 5.1 (a) Describe the human activities which can lead to the loss of tropical rainforests such as those in Fig. 5.1. [10] (b) Explain how ecotourism can lead to the successful conservation of rainforests. Using examples, assess the advantages and disadvantages of ecotourism projects. [30] [Total: 40]
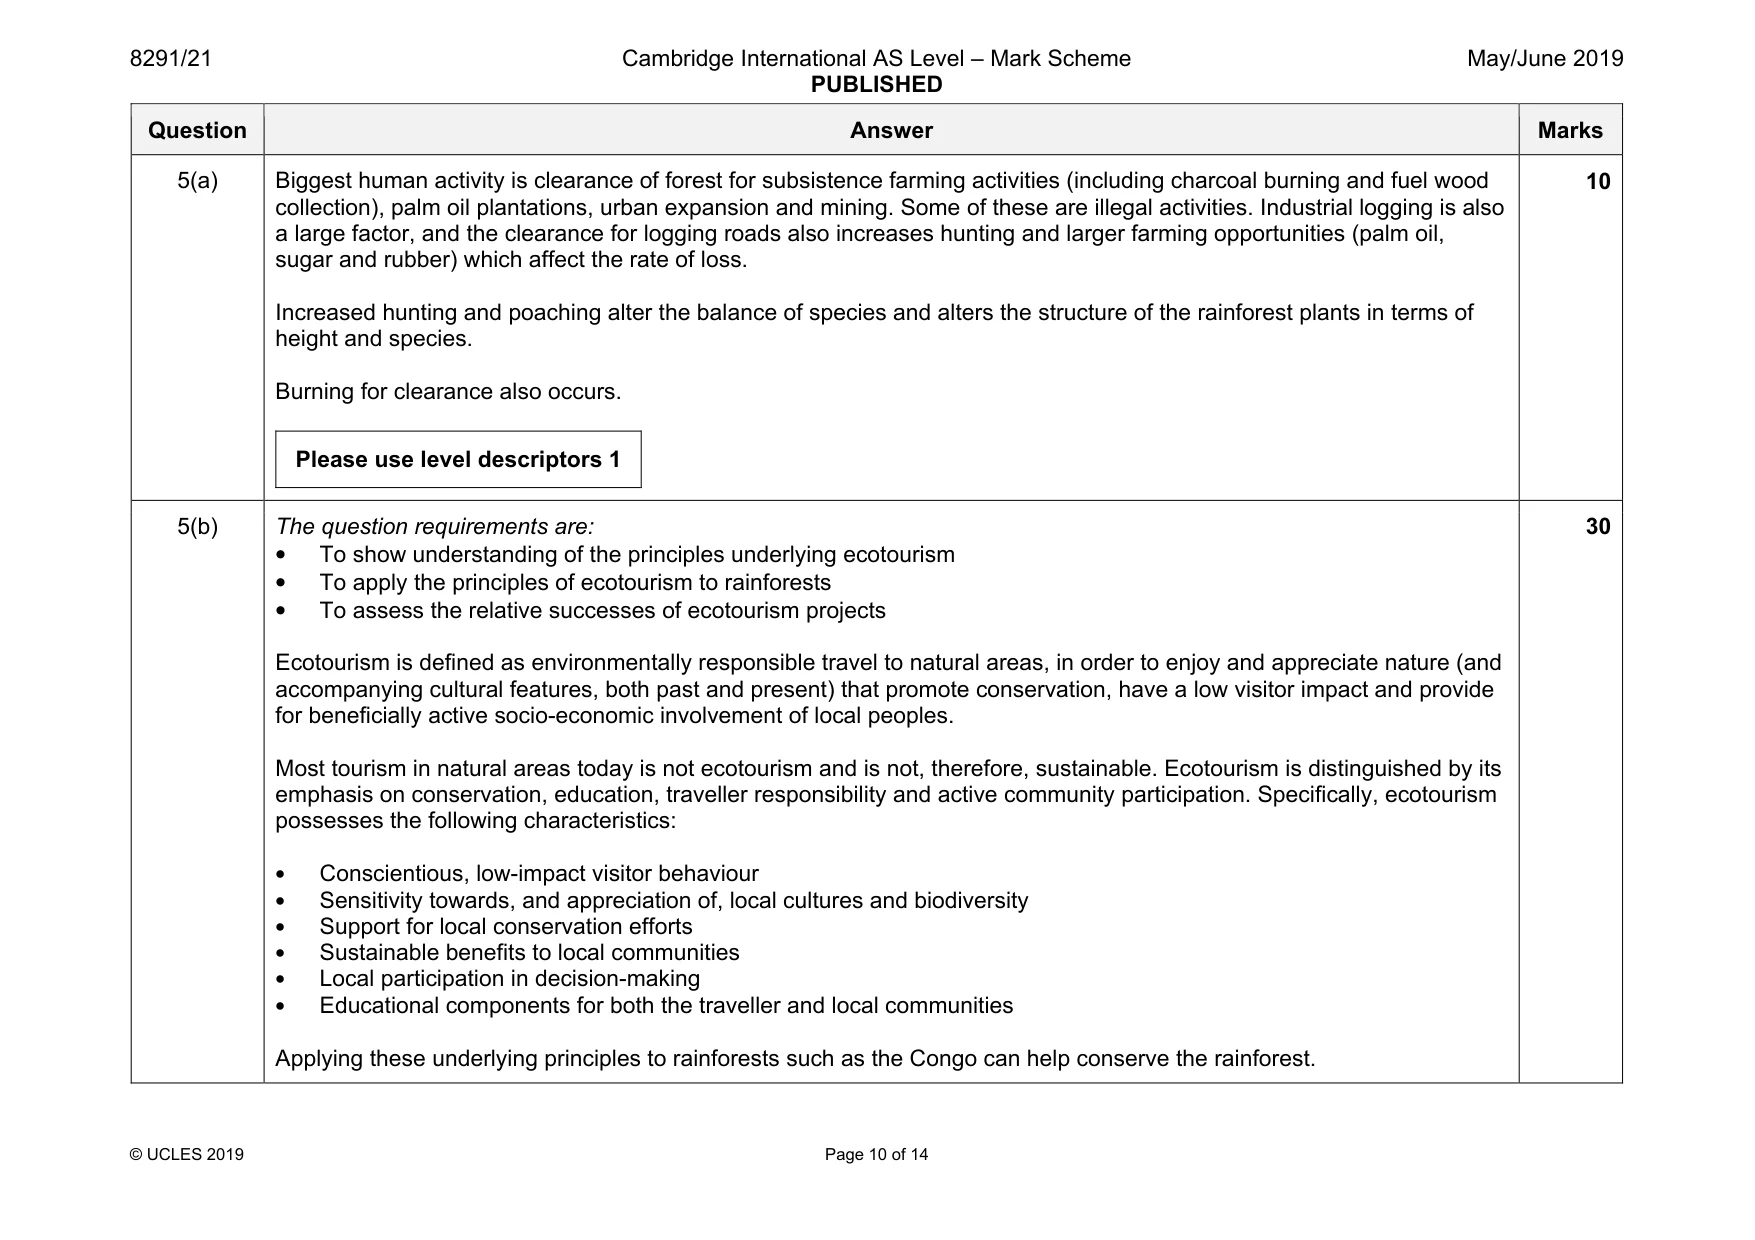
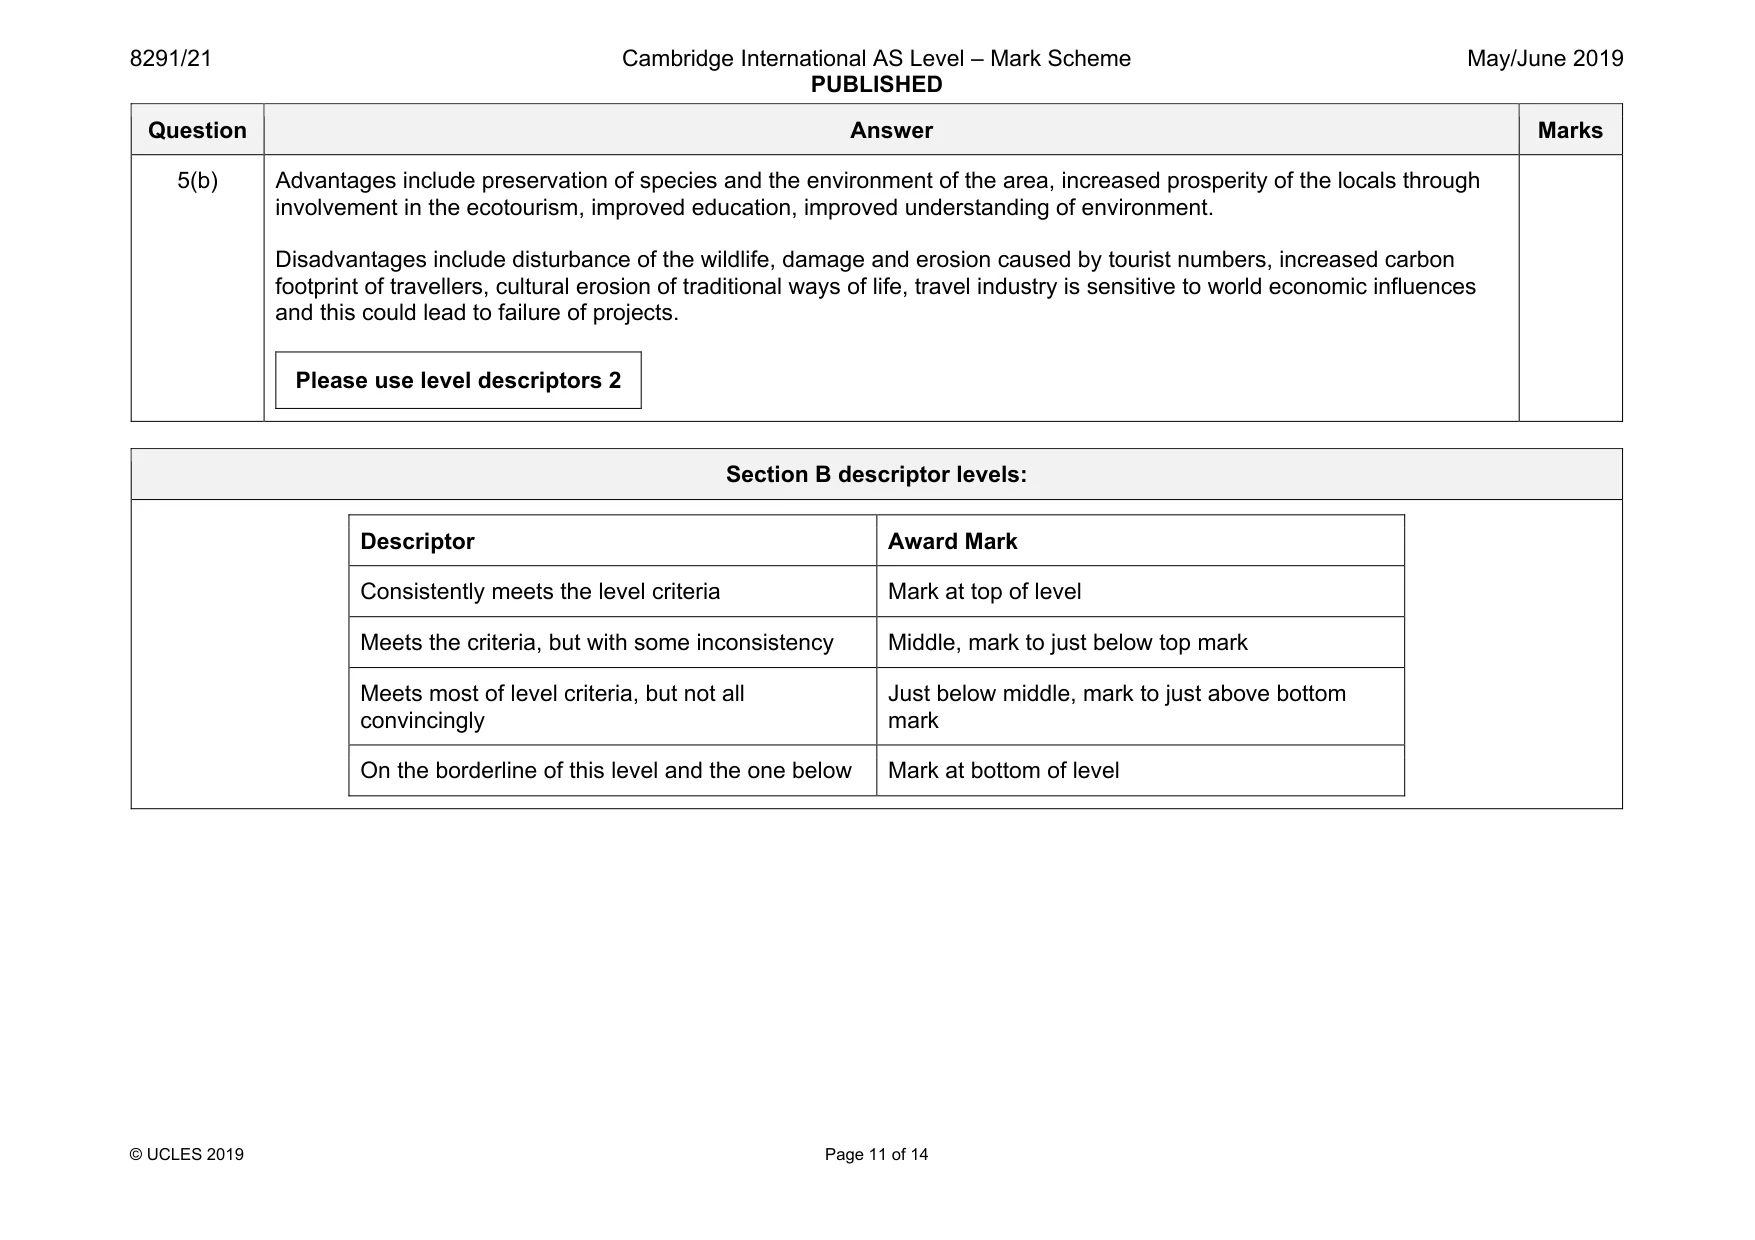
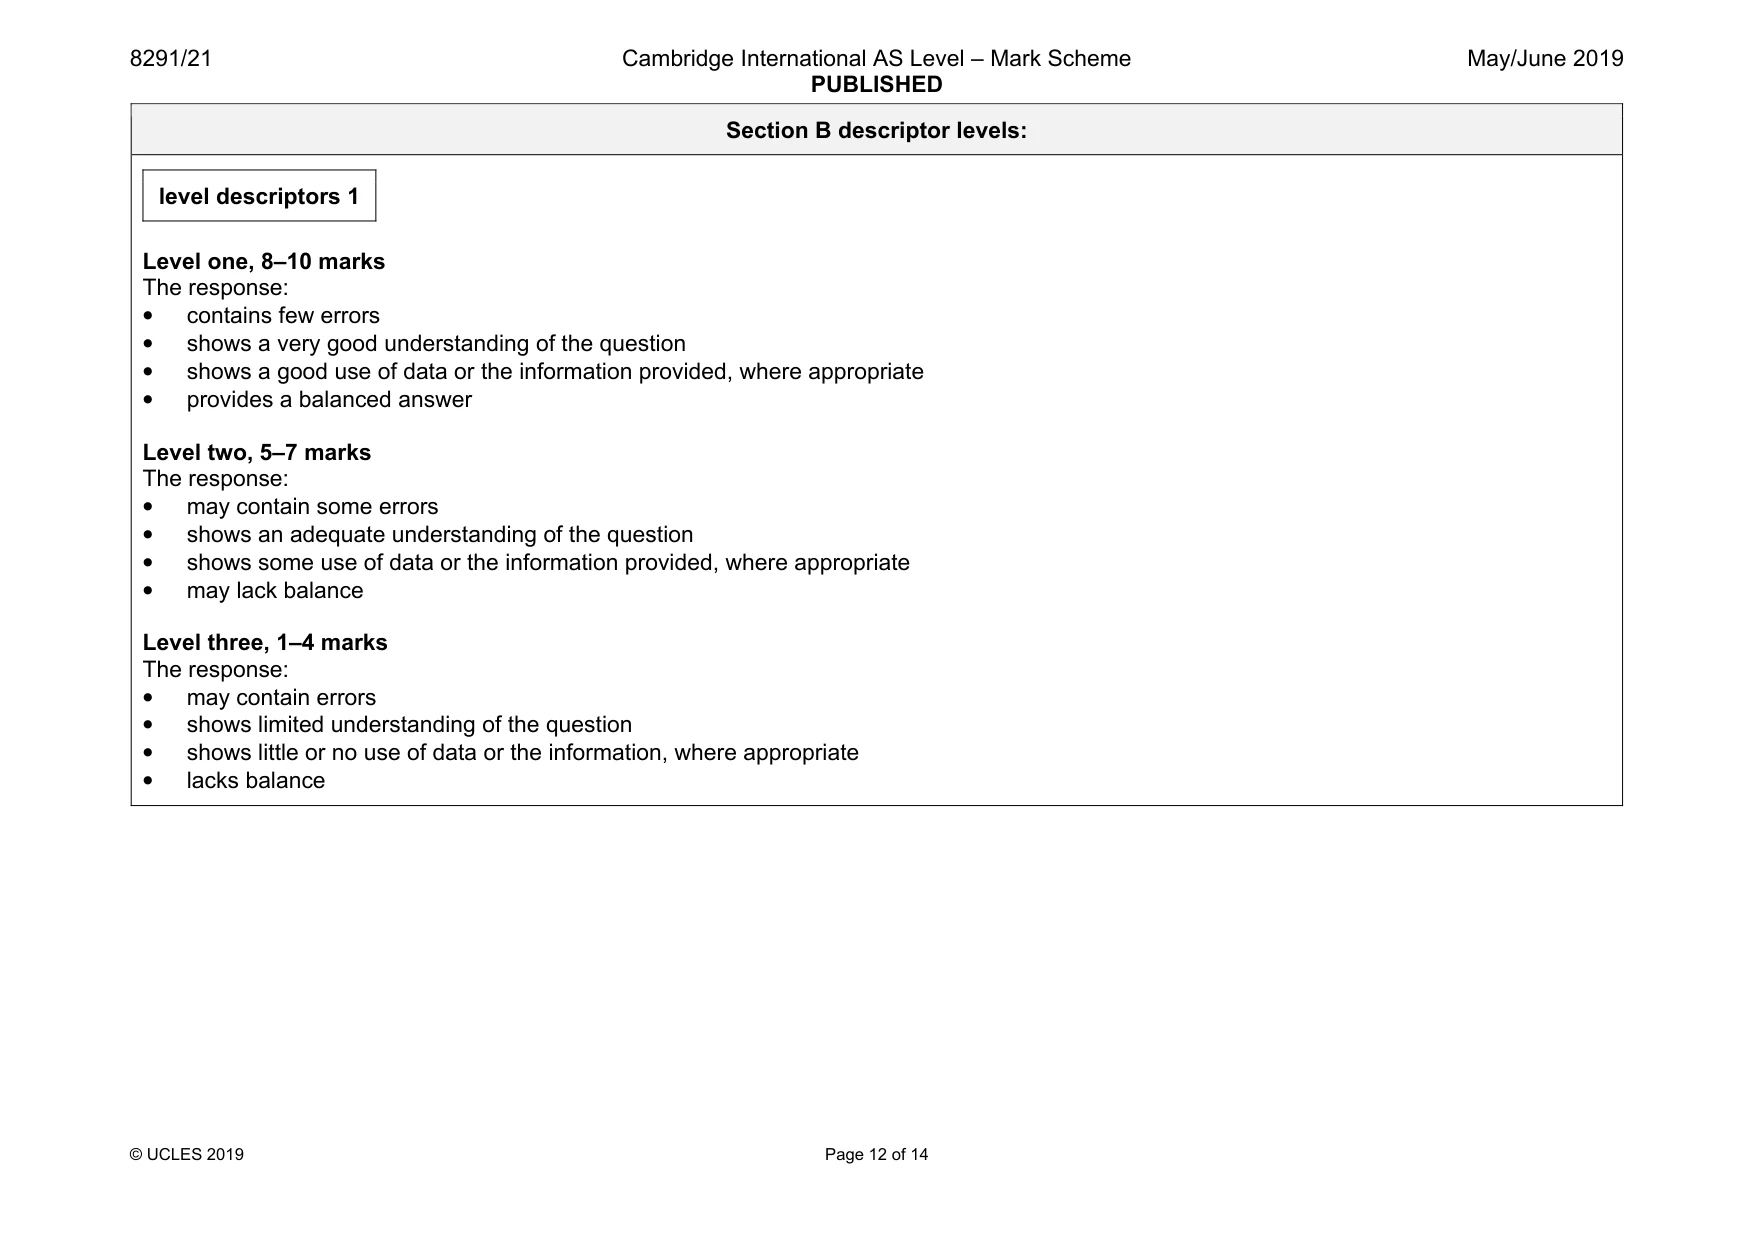
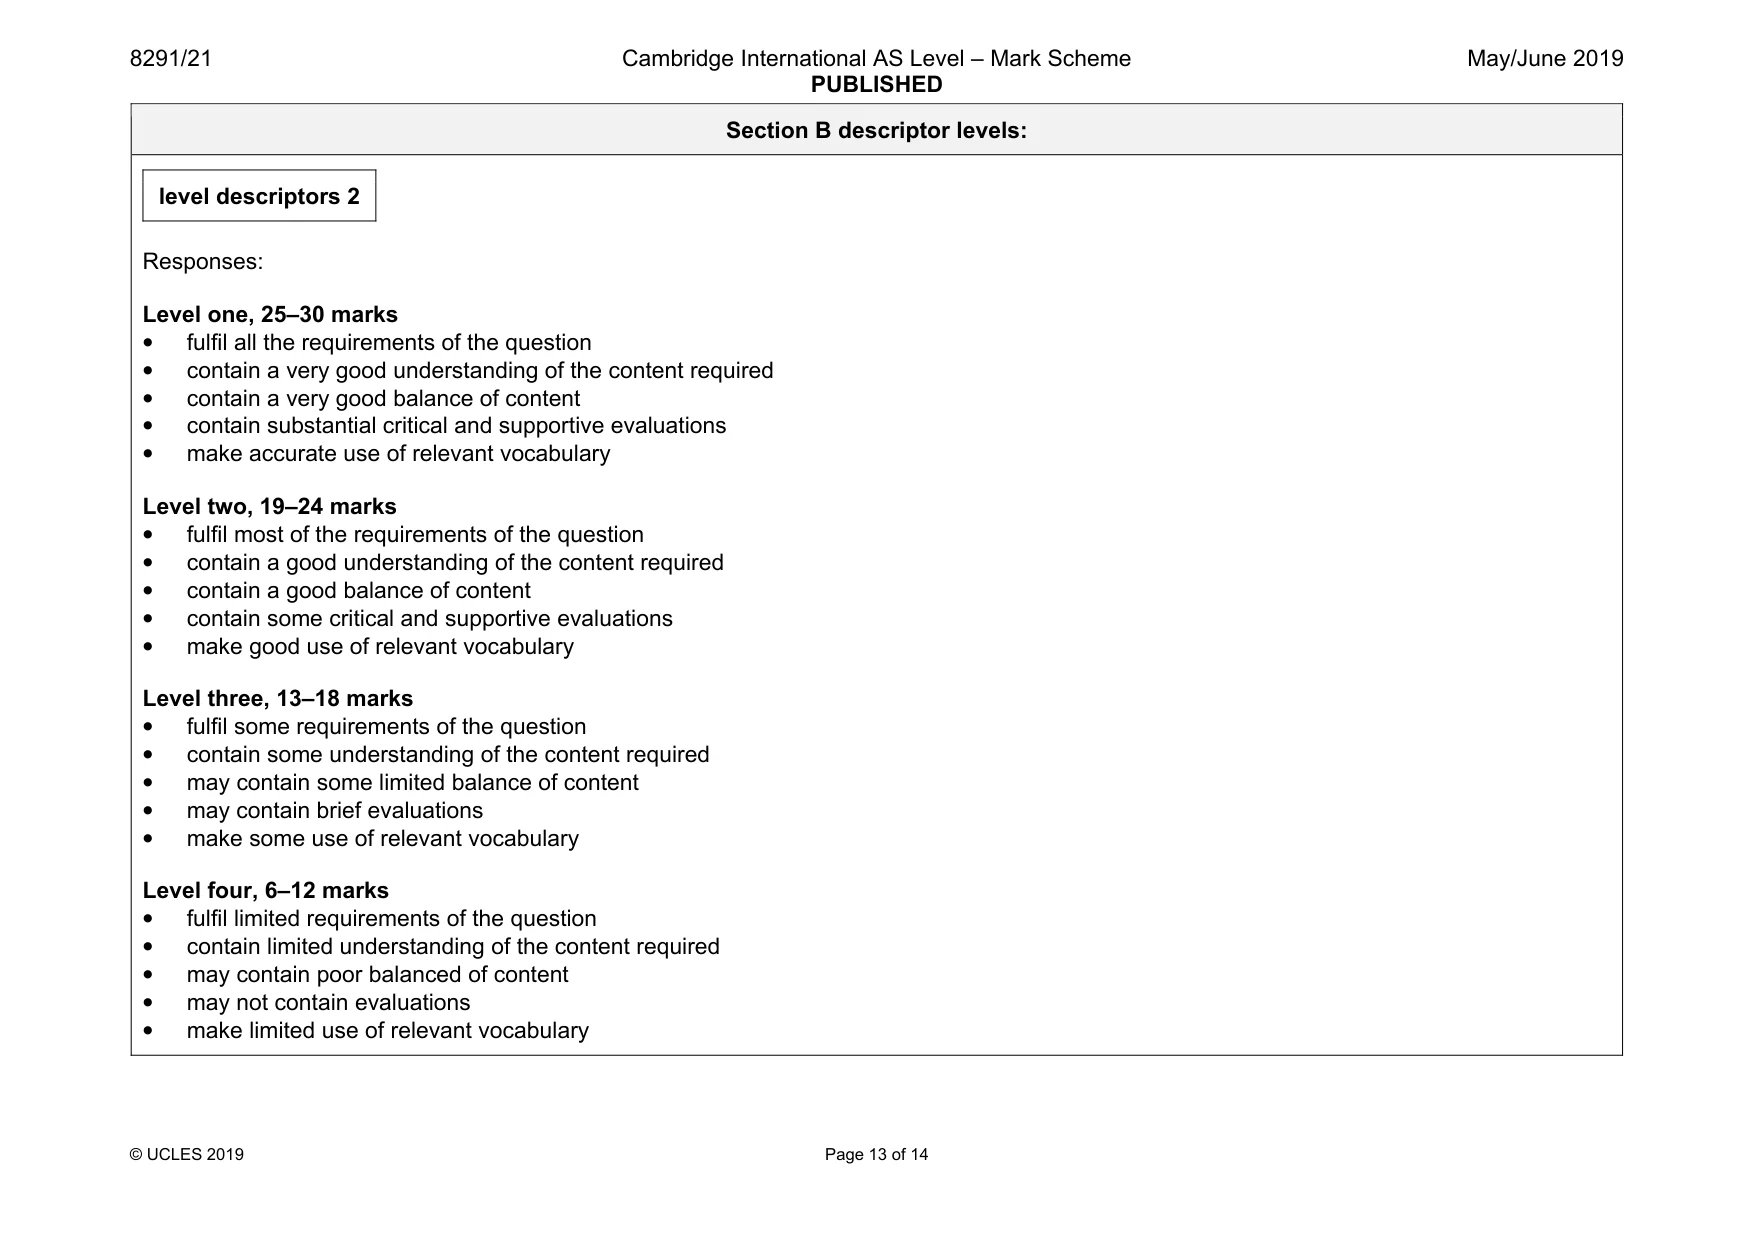
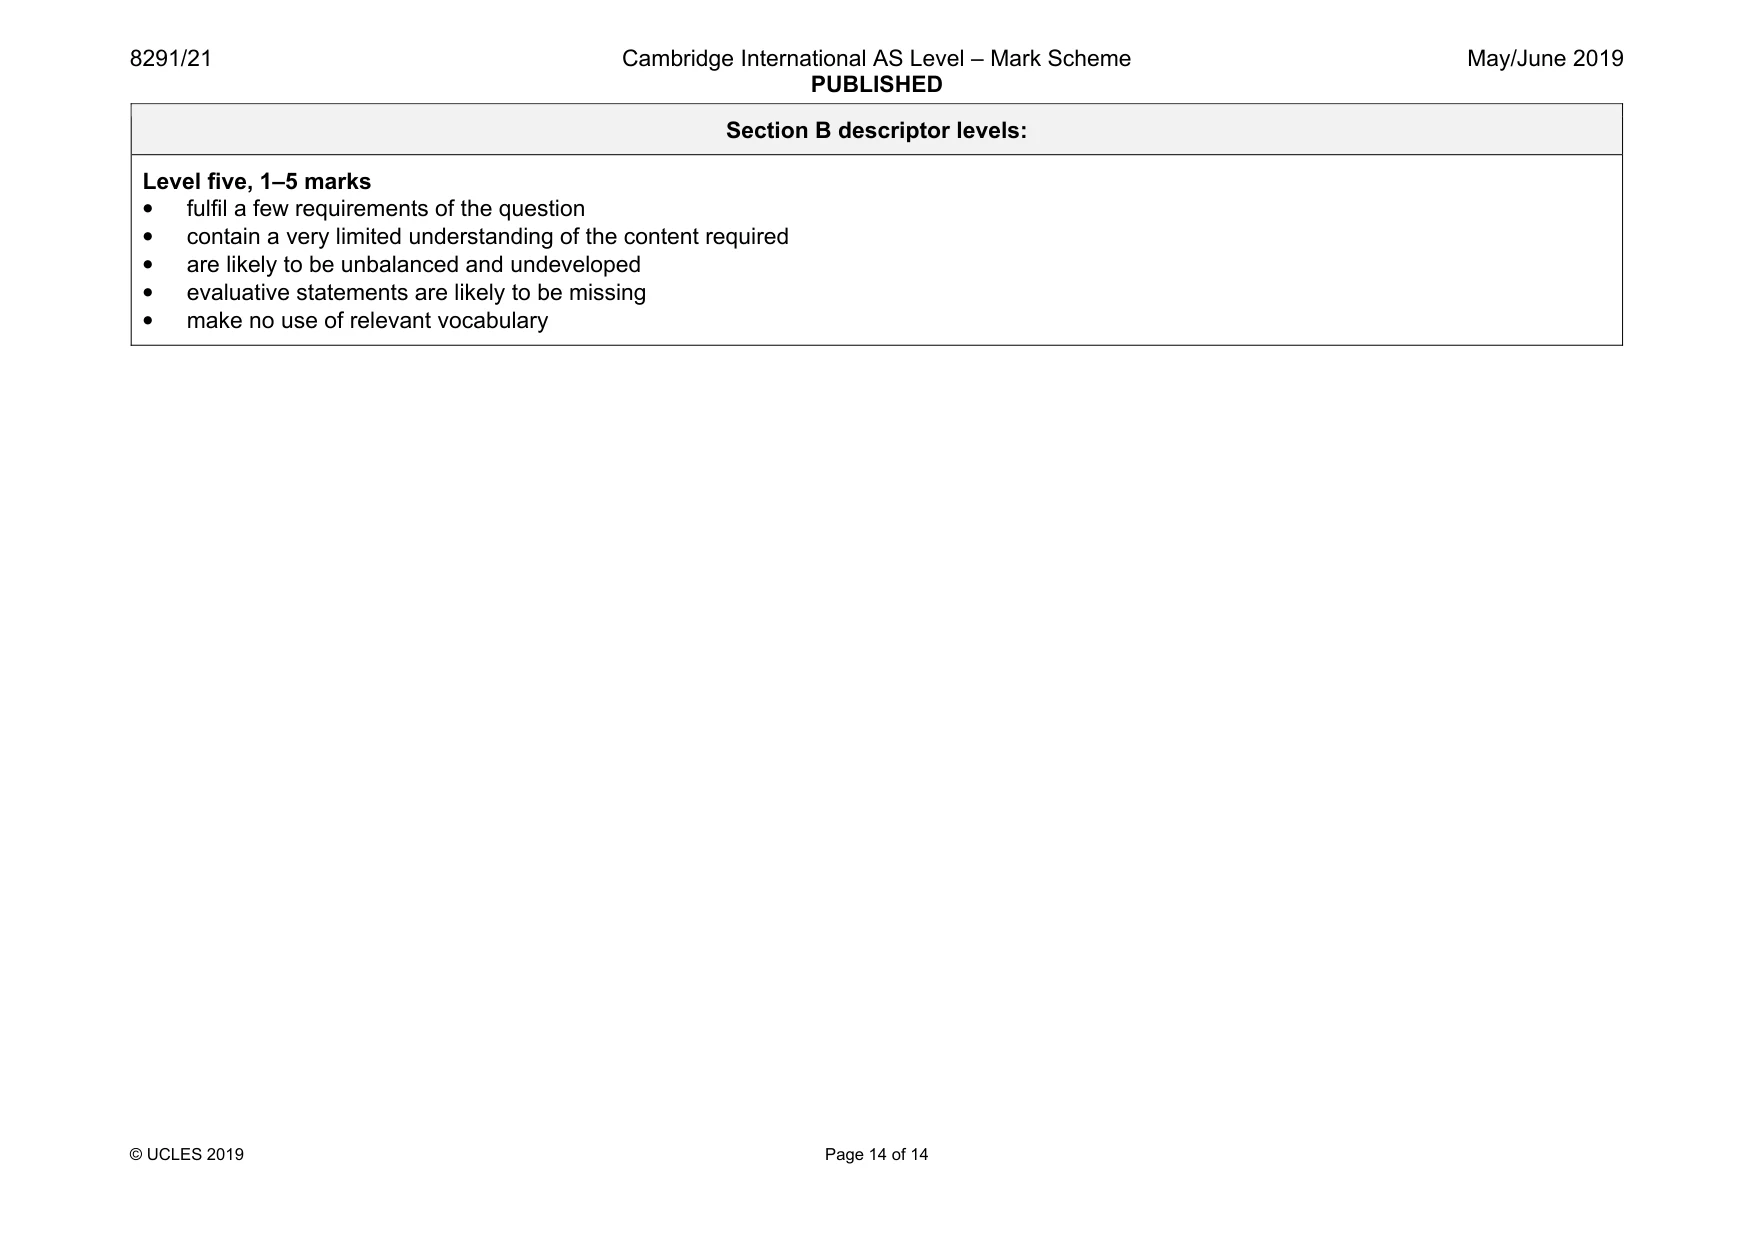
Mark scheme: 5(a) Biggest human activity is clearance of forest for subsistence farming activities (including charcoal burning and fuel wood collection), palm oil plantations, urban expansion and mining. Some of these are illegal activities. Industrial logging is also a large factor, and the clearance for logging roads also increases hunting and larger farming opportunities (palm oil, sugar and rubber) which affect the rate of loss. Increased hunting and poaching alter the balance of species and alters the structure of the rainforest plants in terms of height and species. Burning for clearance also occurs. Please use level descriptors 1 10 5(b) The question requirements are: • To show understanding of the principles underlying ecotourism • To apply the principles of ecotourism to rainforests • To assess the relative successes of ecotourism projects Ecotourism is defined as environmentally responsible travel to natural areas, in order to enjoy and appreciate nature (and accompanying cultural features, both past and present) that promote conservation, have a low visitor impact and provide for beneficially active socio-economic involvement of local peoples. Most tourism in natural areas today is not ecotourism and is not, therefore, sustainable. Ecotourism is distinguished by its emphasis on conservation, education, traveller responsibility and active community participation. Specifically, ecotourism possesses the following characteristics: • Conscientious, low-impact visitor behaviour • Sensitivity towards, and appreciation of, local cultures and biodiversity • Support for local conservation efforts • Sustainable benefits to local communities • Local participation in decision-making • Educational components for both the traveller and local communities Applying these underlying principles to rainforests such as the Congo can help conserve the rainforest. 30 Question Answer Marks 5(b) Advantages include preservation of species and the environment of the area, increased prosperity of the locals through involvement in the ecotourism, improved education, improved understanding of environment. Disadvantages include disturbance of the wildlife, damage and erosion caused by tourist numbers, increased carbon footprint of travellers, cultural erosion of traditional ways of life, travel industry is sensitive to world economic influences and this could lead to failure of projects. Please use level descriptors 2 Section B descriptor levels: Descriptor Award Mark Consistently meets the level criteria Mark at top of level Meets the criteria, but with some inconsistency Middle, mark to just below top mark Meets most of level criteria, but not all convincingly Just below middle, mark to just above bottom mark On the borderline of this level and the one below Mark at bottom of level Section B descriptor levels: level descriptors 1 Level one, 8–10 marks The response: • contains few errors • shows a very good understanding of the question • shows a good use of data or the information provided, where appropriate • provides a balanced answer Level two, 5–7 marks The response: • may contain some errors • shows an adequate understanding of the question • shows some use of data or the information provided, where appropriate • may lack balance Level three, 1–4 marks The response: • may contain errors • shows limited understanding of the question • shows little or no use of data or the information, where appropriate • lacks balance Section B descriptor levels: level descriptors 2 Responses: Level one, 25–30 marks • fulfil all the requirements of the question • contain a very good understanding of the content required • contain a very good balance of content • contain substantial critical and supportive evaluations • make accurate use of relevant vocabulary Level two, 19–24 marks • fulfil most of the requirements of the question • contain a good understanding of the content required • contain a good balance of content • contain some critical and supportive evaluations • make good use of relevant vocabulary Level three, 13–18 marks • fulfil some requirements of the question • contain some understanding of the content required • may contain some limited balance of content • may contain brief evaluations • make some use of relevant vocabulary Level four, 6–12 marks • fulfil limited requirements of the question • contain limited understanding of the content required • may contain poor balanced of content • may not contain evaluations • make limited use of relevant vocabulary Section B descriptor levels: Level five, 1–5 marks • fulfil a few requirements of the question • contain a very limited understanding of the content required • are likely to be unbalanced and undeveloped • evaluative statements are likely to be missing • make no use of relevant vocabulary
What was in this paper
The subtopics covered by these 5 questions, and how many questions each got. Open one in a new tab to see every Cambridge question on it.
What you needed in this session
Cambridge’s own grade thresholds for 2019 May/June, Paper 2 · Variant 1. A higher threshold means an easier paper — the bar moves with how the cohort did.