Cambridge A Level Economics 9708 — 2025 Oct/Nov Paper 2 · Variant 3
9708/23/O/N/25 · 5 questions · 60 marks · ≈68 min
The question paper and its mark scheme, free to read here and free to download. This is Cambridge’s own paper, exactly as it was sat.
Question paper4 pages
Mark scheme24 pages
Answers below. Sit the paper first if you are practising.

Questions as text
Q1 · Malaysia’s uncertain economic prospects Malaysia is an emerging middle-income country
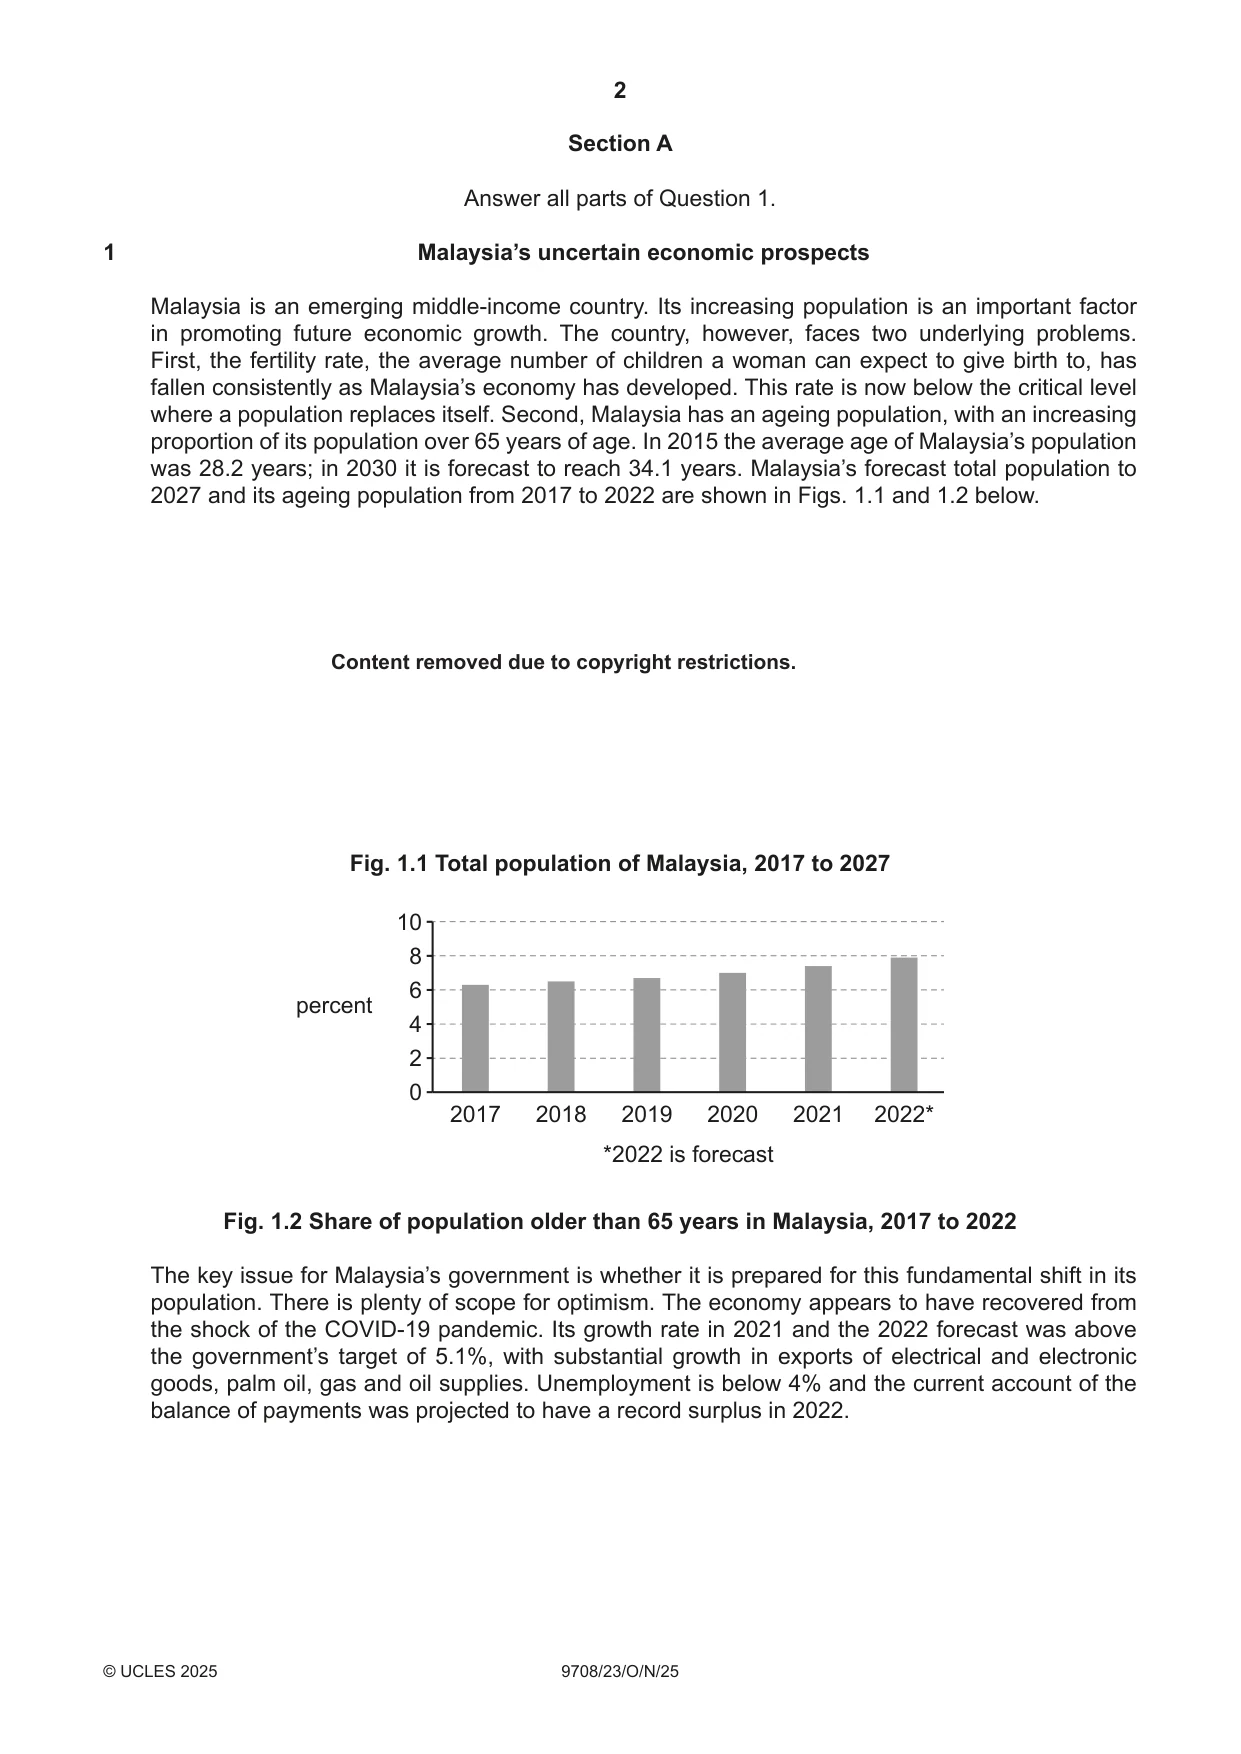
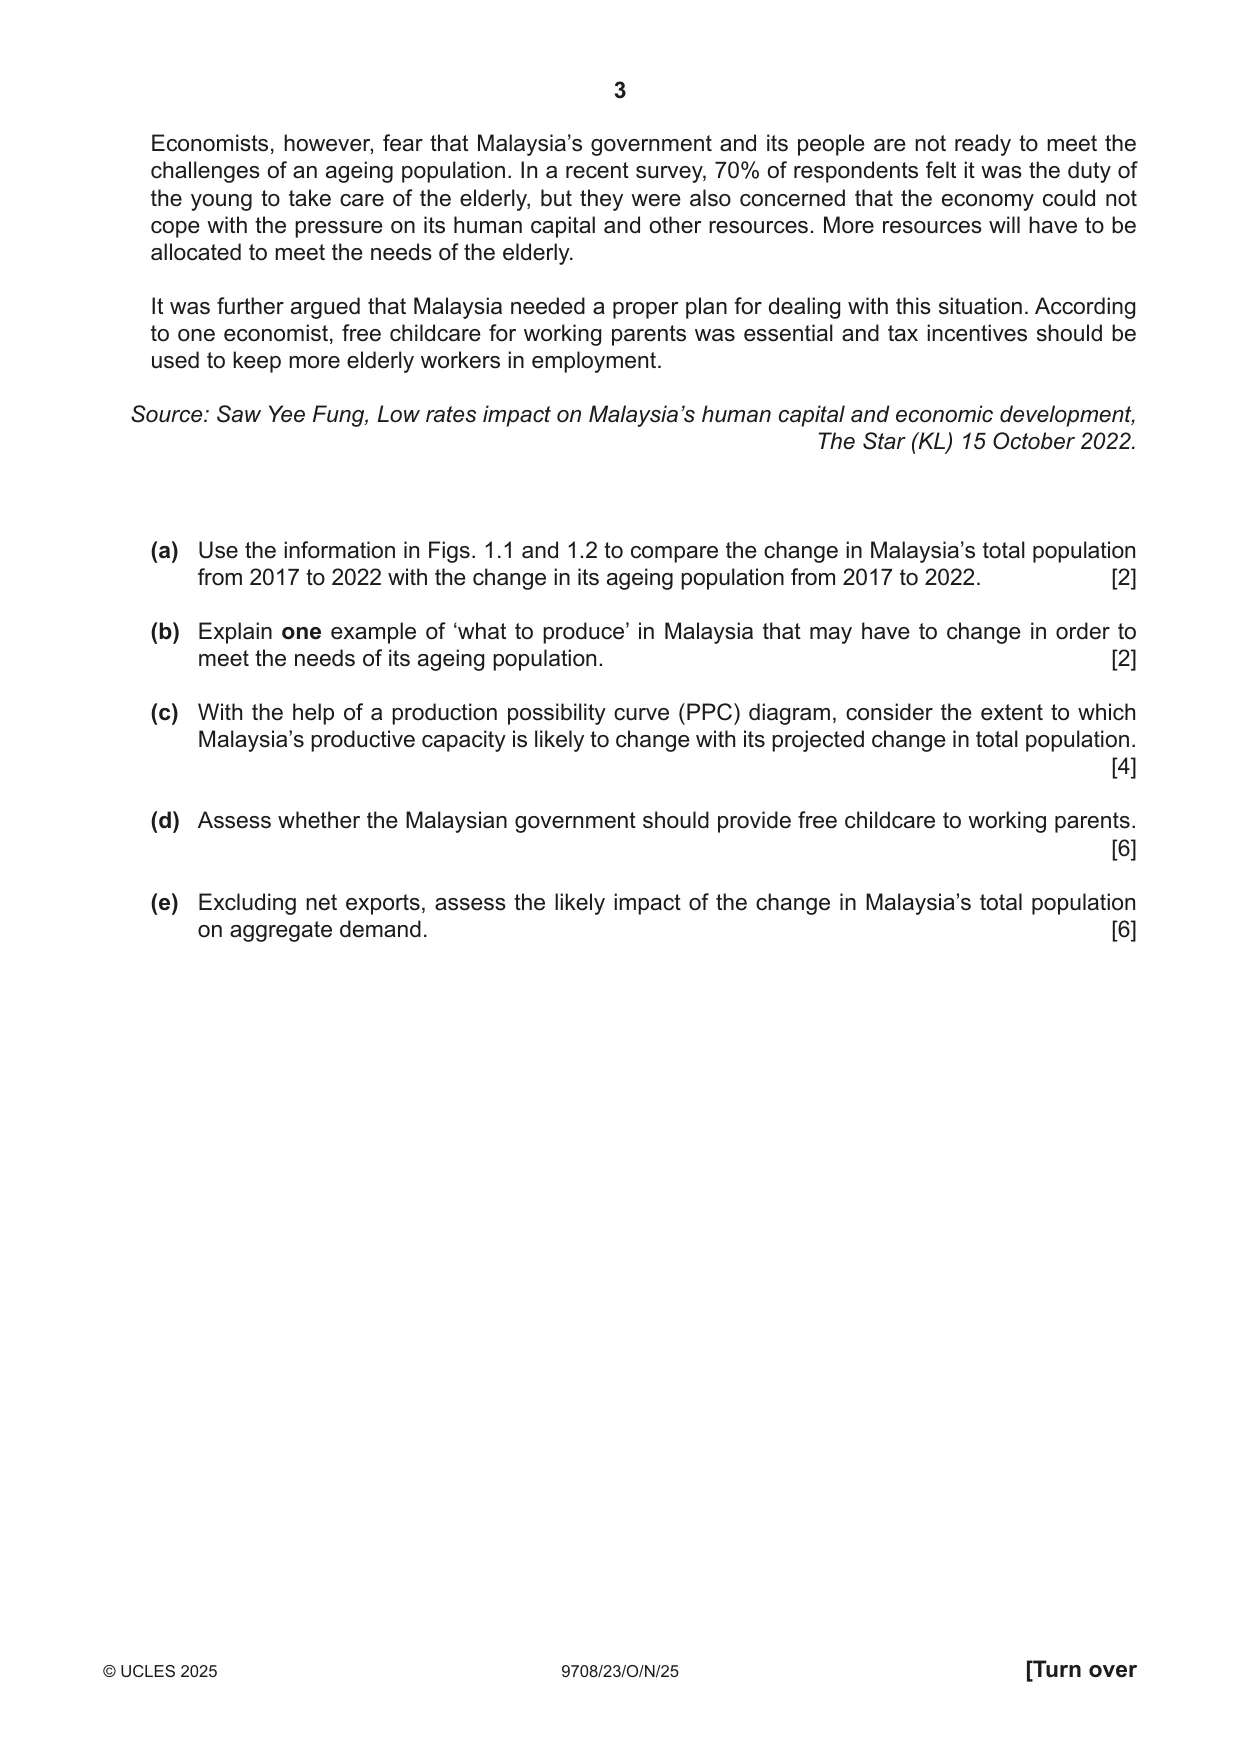
1 Malaysia’s uncertain economic prospects Malaysia is an emerging middle-income country. Its increasing population is an important factor in promoting future economic growth. The country, however, faces two underlying problems. First, the fertility rate, the average number of children a woman can expect to give birth to, has fallen consistently as Malaysia’s economy has developed. This rate is now below the critical level where a population replaces itself. Second, Malaysia has an ageing population, with an increasing proportion of its population over 65 years of age. In 2015 the average age of Malaysia’s population was 28.2 years; in 2030 it is forecast to reach 34.1 years. Malaysia’s forecast total population to 2027 and its ageing population from 2017 to 2022 are shown in Figs. 1.1 and 1.2 below. Content removed due to copyright restrictions. Fig. 1.1 Total population of Malaysia, 2017 to 2027 10 8 6 percent 4 2 0 2017 2018 2019 2020 2021 2022* *2022 is forecast Fig. 1.2 Share of population older than 65 years in Malaysia, 2017 to 2022 The key issue for Malaysia’s government is whether it is prepared for this fundamental shift in its population. There is plenty of scope for optimism. The economy appears to have recovered from the shock of the COVID-19 pandemic. Its growth rate in 2021 and the 2022 forecast was above the government’s target of 5.1%, with substantial growth in exports of electrical and electronic goods, palm oil, gas and oil supplies. Unemployment is below 4% and the current account of the balance of payments was projected to have a record surplus in 2022. Economists, however, fear that Malaysia’s government and its people are not ready to meet the challenges of an ageing population. In a recent survey, 70% of respondents felt it was the duty of the young to take care of the elderly, but they were also concerned that the economy could not cope with the pressure on its human capital and other resources. More resources will have to be allocated to meet the needs of the elderly. It was further argued that Malaysia needed a proper plan for dealing with this situation. According to one economist, free childcare for working parents was essential and tax incentives should be used to keep more elderly workers in employment. Source: Saw Yee Fung, Low rates impact on Malaysia’s human capital and economic development, The Star (KL) 15 October 2022. (a) Use the information in Figs. 1.1 and 1.2 to compare the change in Malaysia’s total population from 2017 to 2022 with the change in its ageing population from 2017 to 2022. [2] (b) Explain one example of ‘what to produce’ in Malaysia that may have to change in order to meet the needs of its ageing population. [2] (c) With the help of a production possibility curve (PPC) diagram, consider the extent to which Malaysia’s productive capacity is likely to change with its projected change in total population. [4] (d) Assess whether the Malaysian government should provide free childcare to working parents. [6] (e) Excluding net exports, assess the likely impact of the change in Malaysia’s total population on aggregate demand. [6]
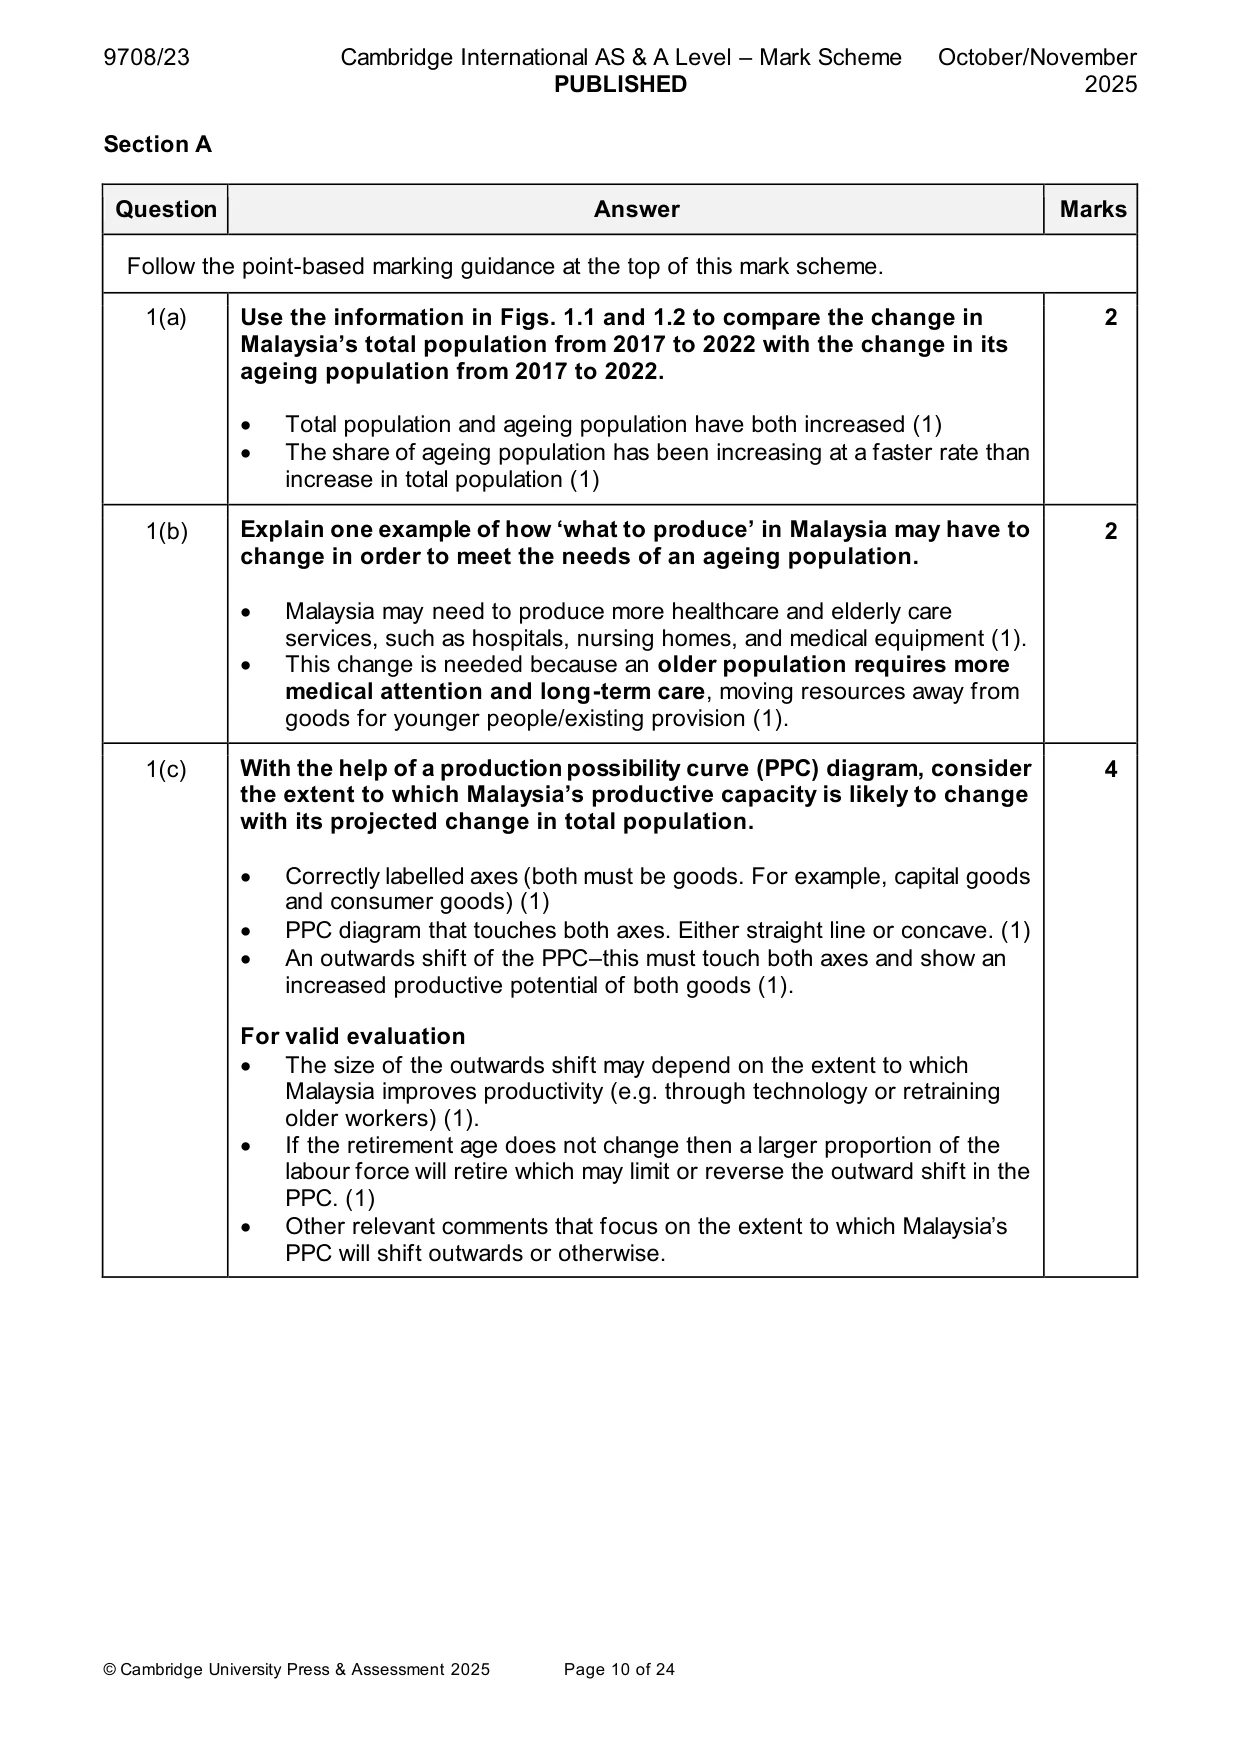
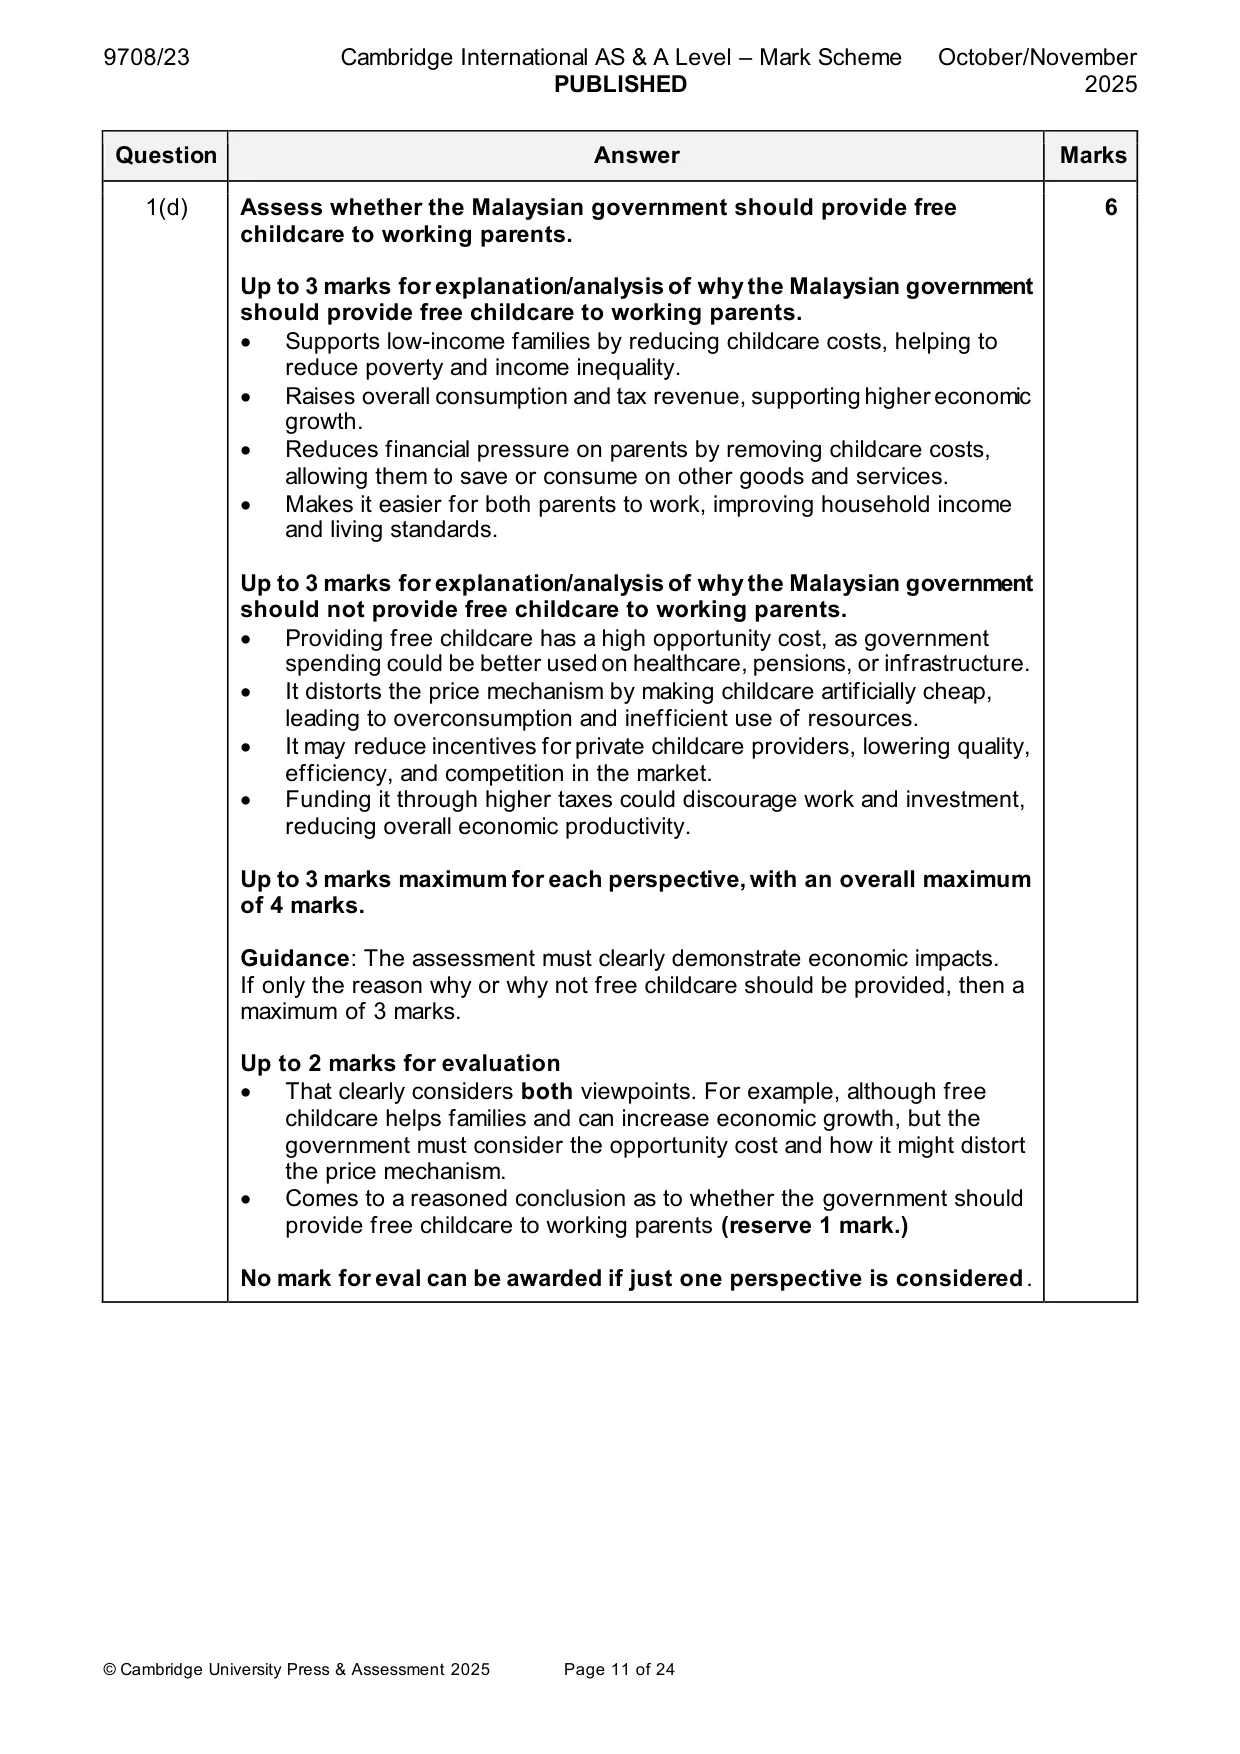
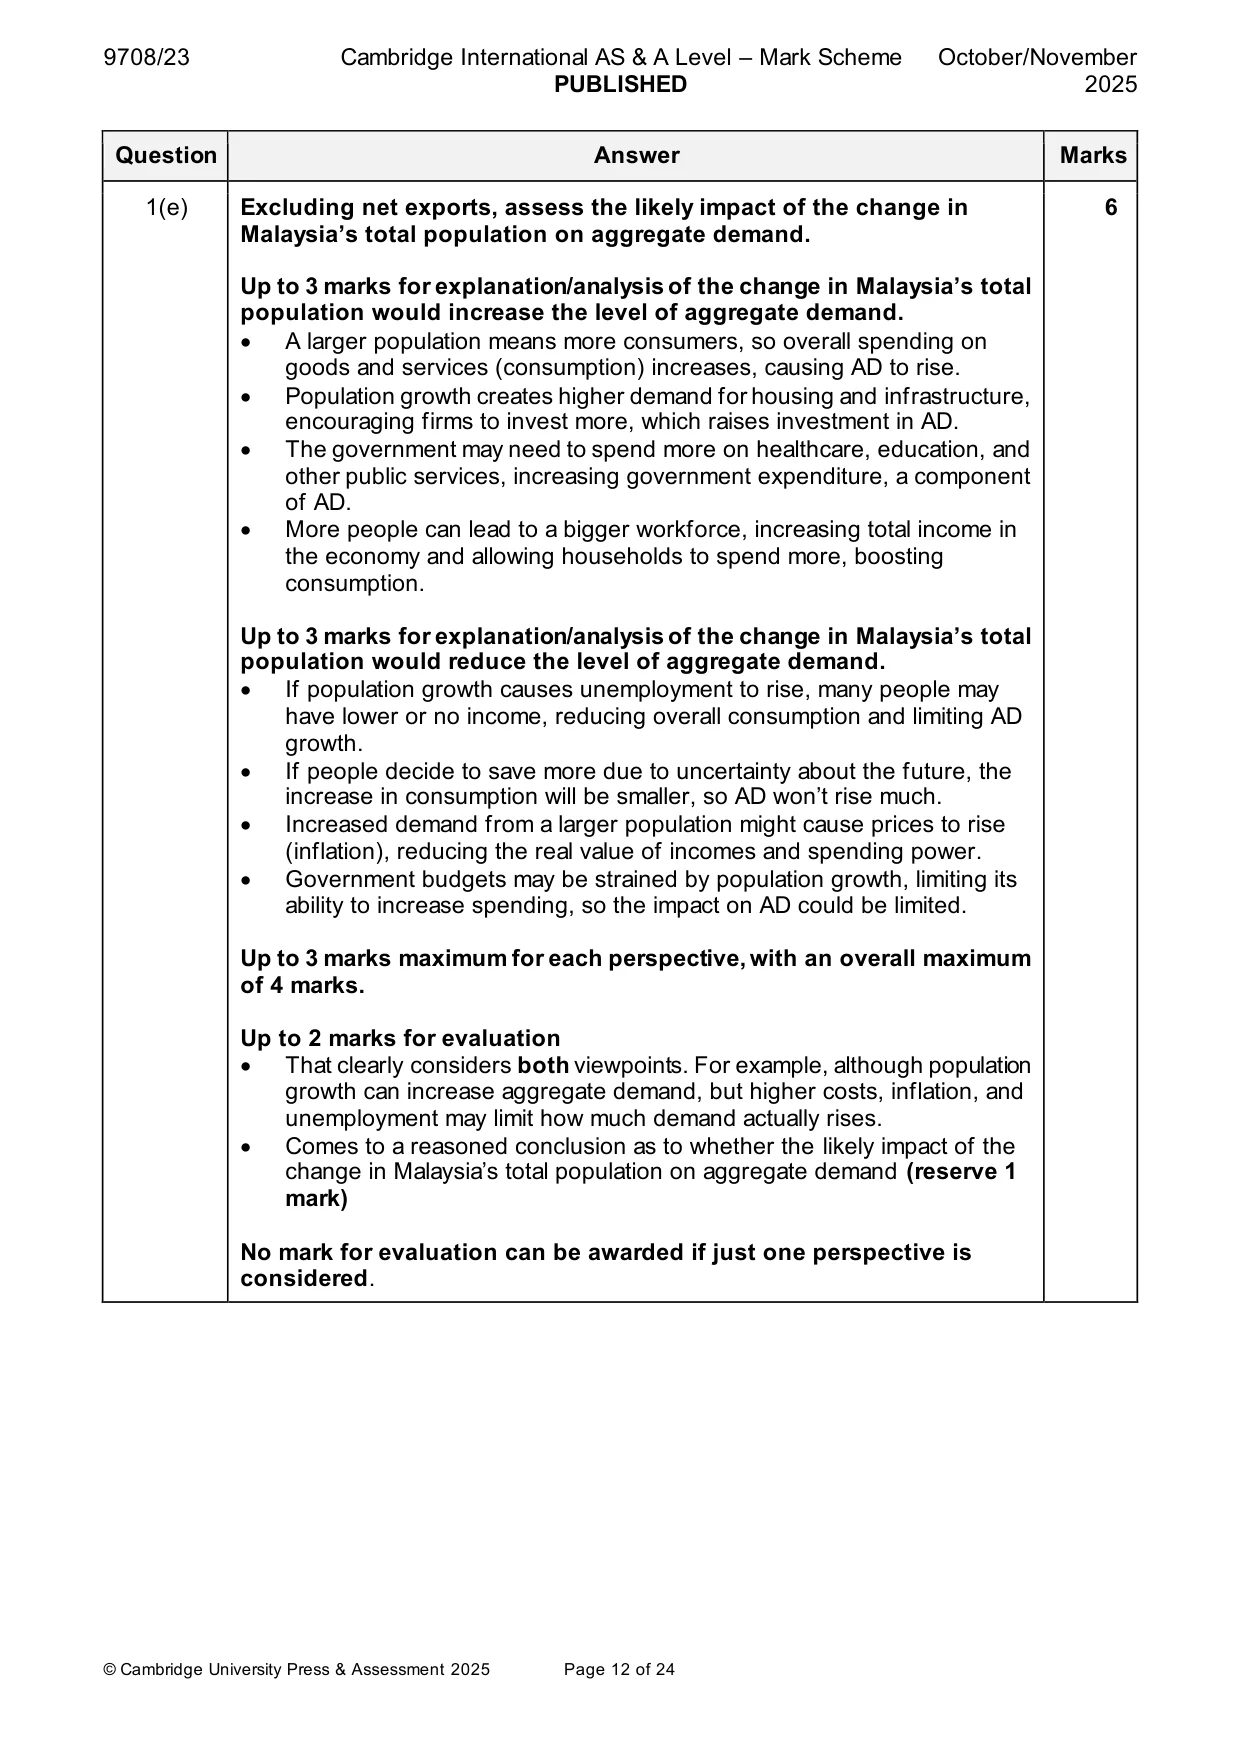
Mark scheme: Question Answer Marks Follow the point-based marking guidance at the top of this mark scheme. 1(a) Use the information in Figs. 1.1 and 1.2 to compare the change in 2 Malaysia’s total population from 2017 to 2022 with the change in its ageing population from 2017 to 2022. • Total population and ageing population have both increased (1) • The share of ageing population has been increasing at a faster rate than increase in total population (1) 1(b) Explain one example of how ‘what to produce’ in Malaysia may have to 2 change in order to meet the needs of an ageing population. • Malaysia may need to produce more healthcare and elderly care services, such as hospitals, nursing homes, and medical equipment (1). • This change is needed because an older population requires more medical attention and long-term care, moving resources away from goods for younger people/existing provision (1). 1(c) With the help of a production possibility curve (PPC) diagram, consider 4 the extent to which Malaysia’s productive capacity is likely to change with its projected change in total population. • Correctly labelled axes (both must be goods. For example, capital goods and consumer goods) (1) • PPC diagram that touches both axes. Either straight line or concave. (1) • An outwards shift of the PPC–this must touch both axes and show an increased productive potential of both goods (1). For valid evaluation • The size of the outwards shift may depend on the extent to which Malaysia improves productivity (e.g. through technology or retraining older workers) (1). • If the retirement age does not change then a larger proportion of the labour force will retire which may limit or reverse the outward shift in the PPC. (1) • Other relevant comments that focus on the extent to which Malaysia’s PPC will shift outwards or otherwise. 1(d) Assess whether the Malaysian government should provide free 6 childcare to working parents. Up to 3 marks for explanation/analysis of why the Malaysian government should provide free childcare to working parents. • Supports low-income families by reducing childcare costs, helping to reduce poverty and income inequality. • Raises overall consumption and tax revenue, supporting higher economic growth. • Reduces financial pressure on parents by removing childcare costs, allowing them to save or consume on other goods and services. • Makes it easier for both parents to work, improving household income and living standards. Up to 3 marks for explanation/analysis of why the Malaysian government should not provide free childcare to working parents. • Providing free childcare has a high opportunity cost, as government spending could be better used on healthcare, pensions, or infrastructure. • It distorts the price mechanism by making childcare artificially cheap, leading to overconsumption and inefficient use of resources. • It may reduce incentives for private childcare providers, lowering quality, efficiency, and competition in the market. • Funding it through higher taxes could discourage work and investment, reducing overall economic productivity. Up to 3 marks maximum for each perspective, with an overall maximum of 4 marks. Guidance: The assessment must clearly demonstrate economic impacts. If only the reason why or why not free childcare should be provided, then a maximum of 3 marks. Up to 2 marks for evaluation • That clearly considers both viewpoints. For example, although free childcare helps families and can increase economic growth, but the government must consider the opportunity cost and how it might distort the price mechanism. • Comes to a reasoned conclusion as to whether the government should provide free childcare to working parents (reserve 1 mark.) No mark for eval can be awarded if just one perspective is considered. 1(e) Excluding net exports, assess the likely impact of the change in 6 Malaysia’s total population on aggregate demand. Up to 3 marks for explanation/analysis of the change in Malaysia’s total population would increase the level of aggregate demand. • A larger population means more consumers, so overall spending on goods and services (consumption) increases, causing AD to rise. • Population growth creates higher demand for housing and infrastructure, encouraging firms to invest more, which raises investment in AD. • The government may need to spend more on healthcare, education, and other public services, increasing government expenditure, a component of AD. • More people can lead to a bigger workforce, increasing total income in the economy and allowing households to spend more, boosting consumption. Up to 3 marks for explanation/analysis of the change in Malaysia’s total population would reduce the level of aggregate demand. • If population growth causes unemployment to rise, many people may have lower or no income, reducing overall consumption and limiting AD growth. • If people decide to save more due to uncertainty about the future, the increase in consumption will be smaller, so AD won’t rise much. • Increased demand from a larger population might cause prices to rise (inflation), reducing the real value of incomes and spending power. • Government budgets may be strained by population growth, limiting its ability to increase spending, so the impact on AD could be limited. Up to 3 marks maximum for each perspective, with an overall maximum of 4 marks. Up to 2 marks for evaluation • That clearly considers both viewpoints. For example, although population growth can increase aggregate demand, but higher costs, inflation, and unemployment may limit how much demand actually rises. • Comes to a reasoned conclusion as to whether the likely impact of the change in Malaysia’s total population on aggregate demand (reserve 1 mark) No mark for evaluation can be awarded if just one perspective is considered. Section B
Q2 · In 2022 the supply of root ginger from Nigeria, Africa’s biggest producer, fell by 20%
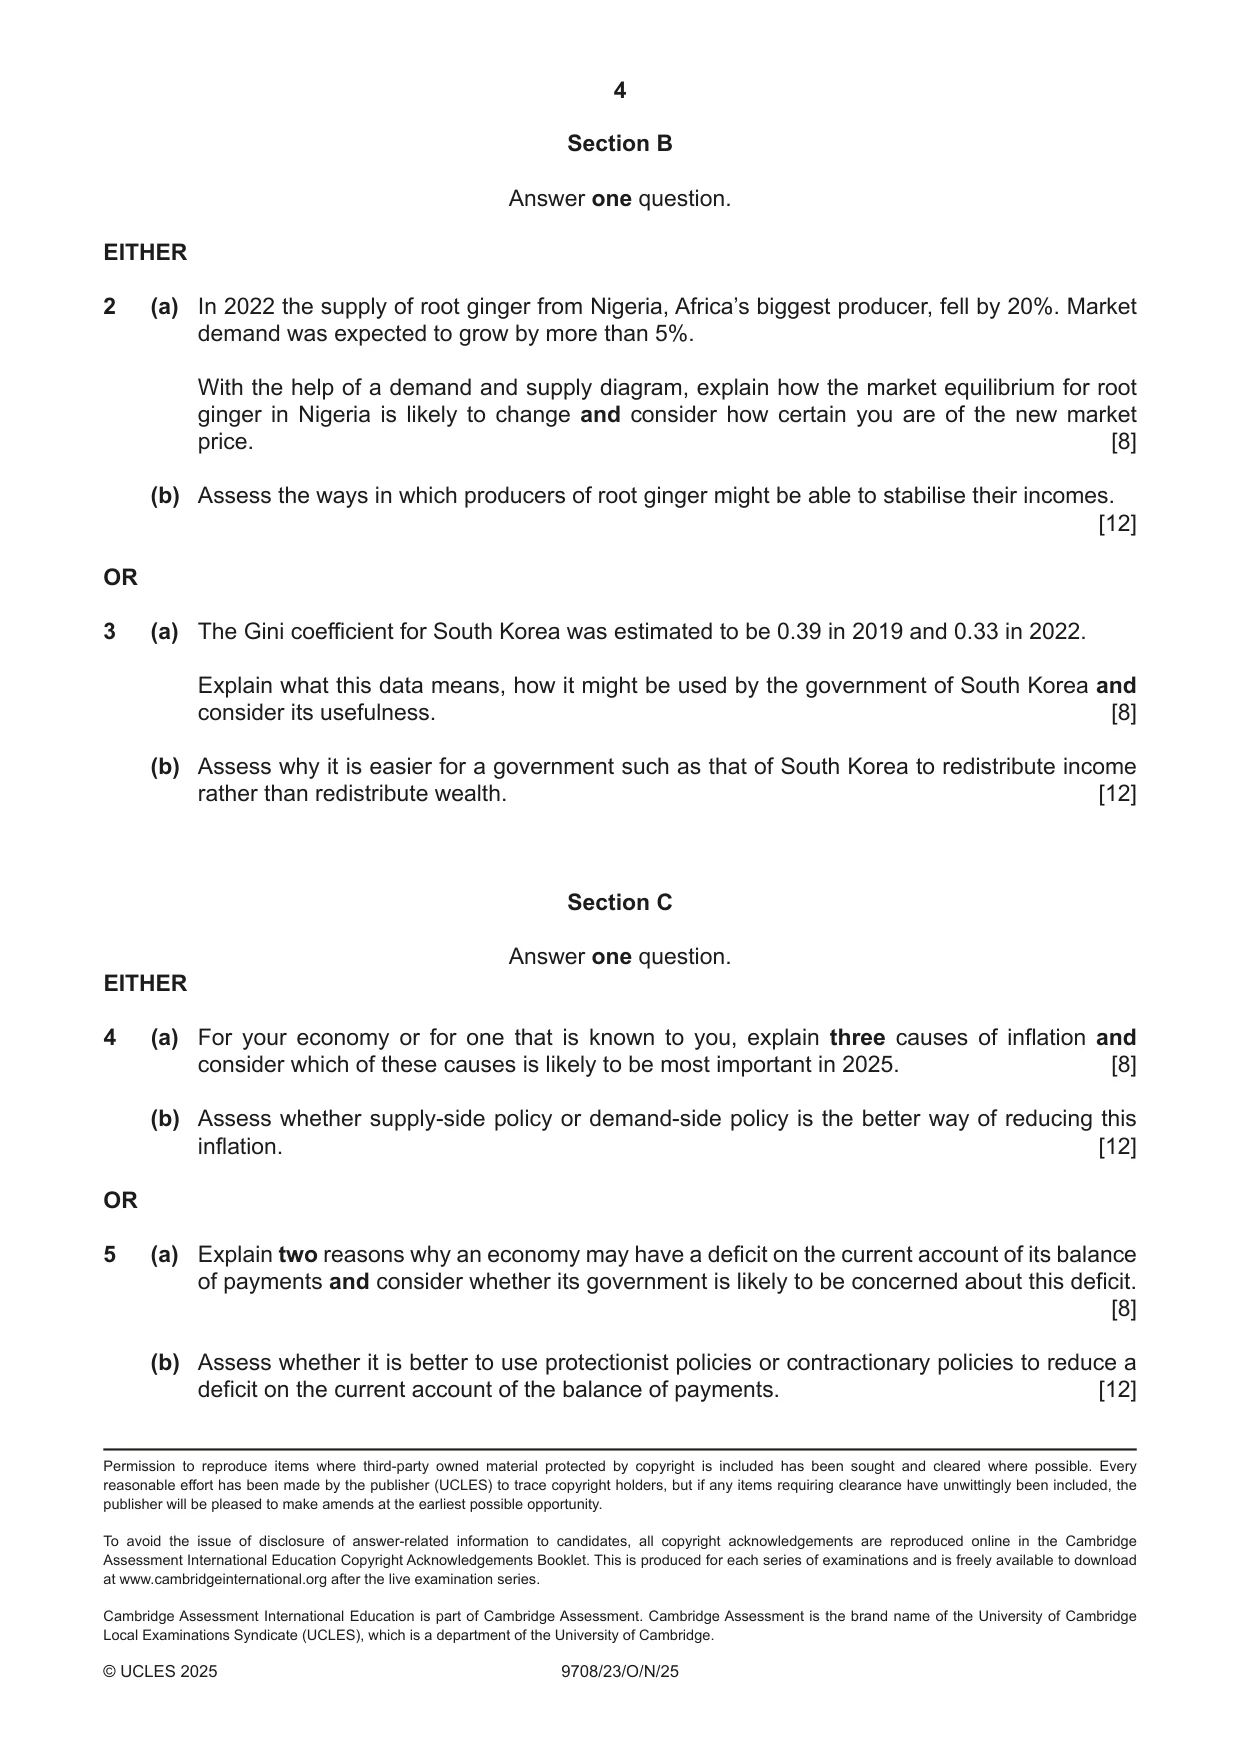
2 (a) In 2022 the supply of root ginger from Nigeria, Africa’s biggest producer, fell by 20%. Market demand was expected to grow by more than 5%. With the help of a demand and supply diagram, explain how the market equilibrium for root ginger in Nigeria is likely to change and consider how certain you are of the new market price. [8] (b) Assess the ways in which producers of root ginger might be able to stabilise their incomes. [12] OR
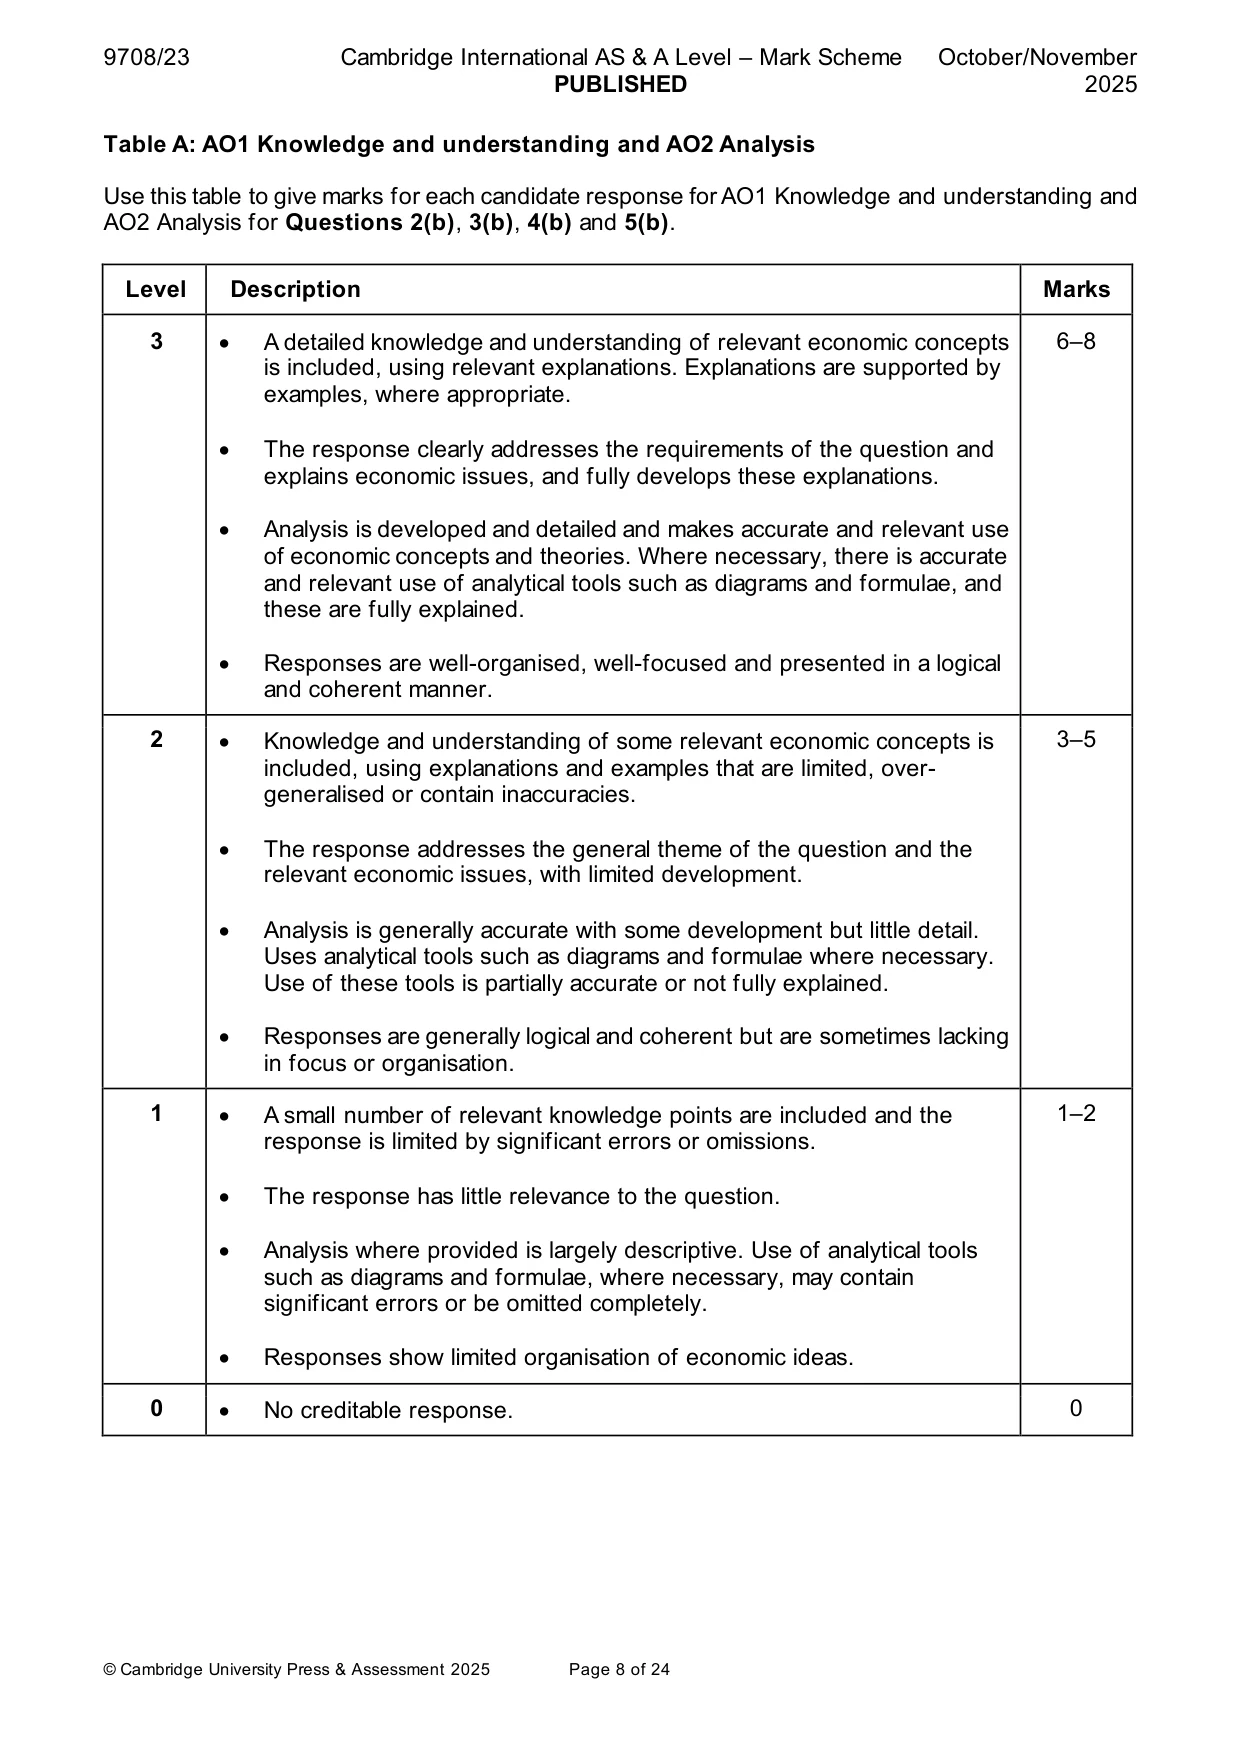
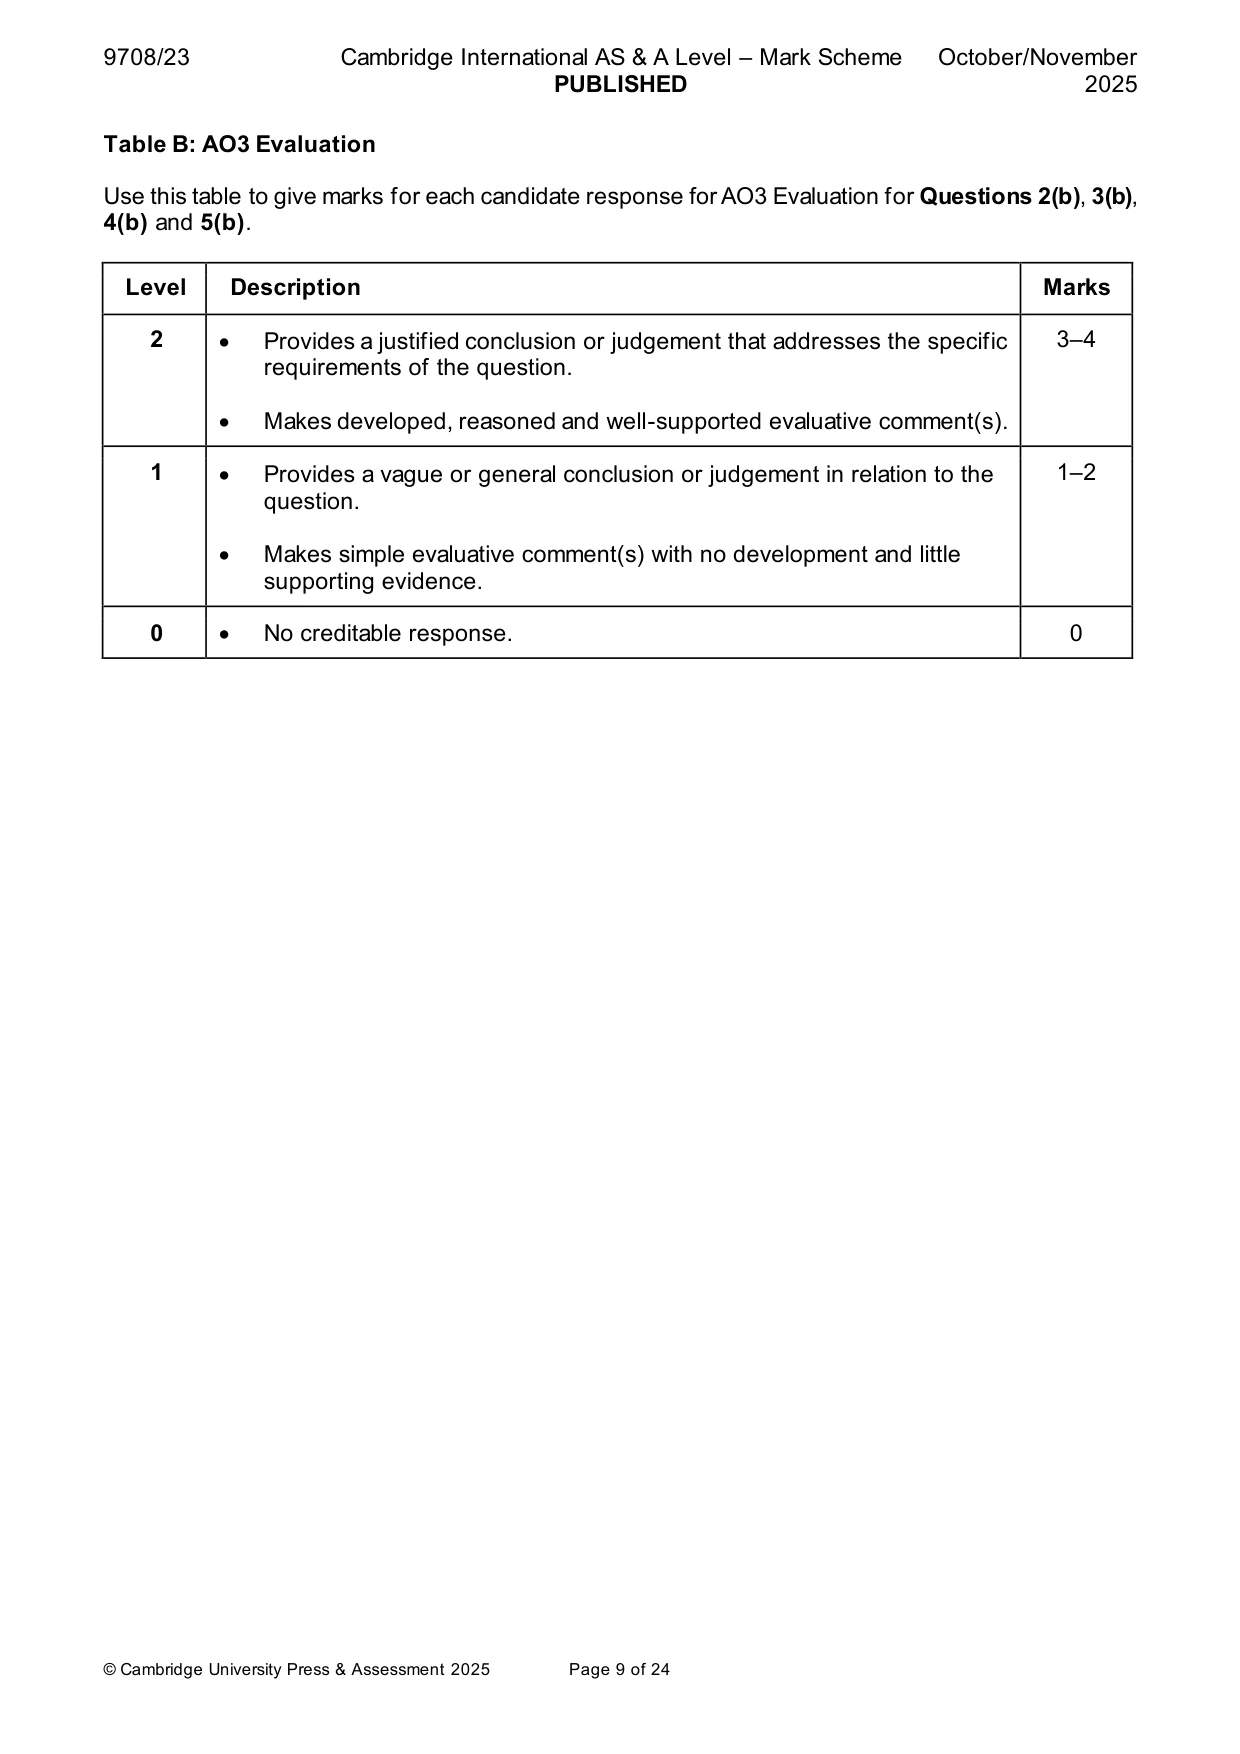
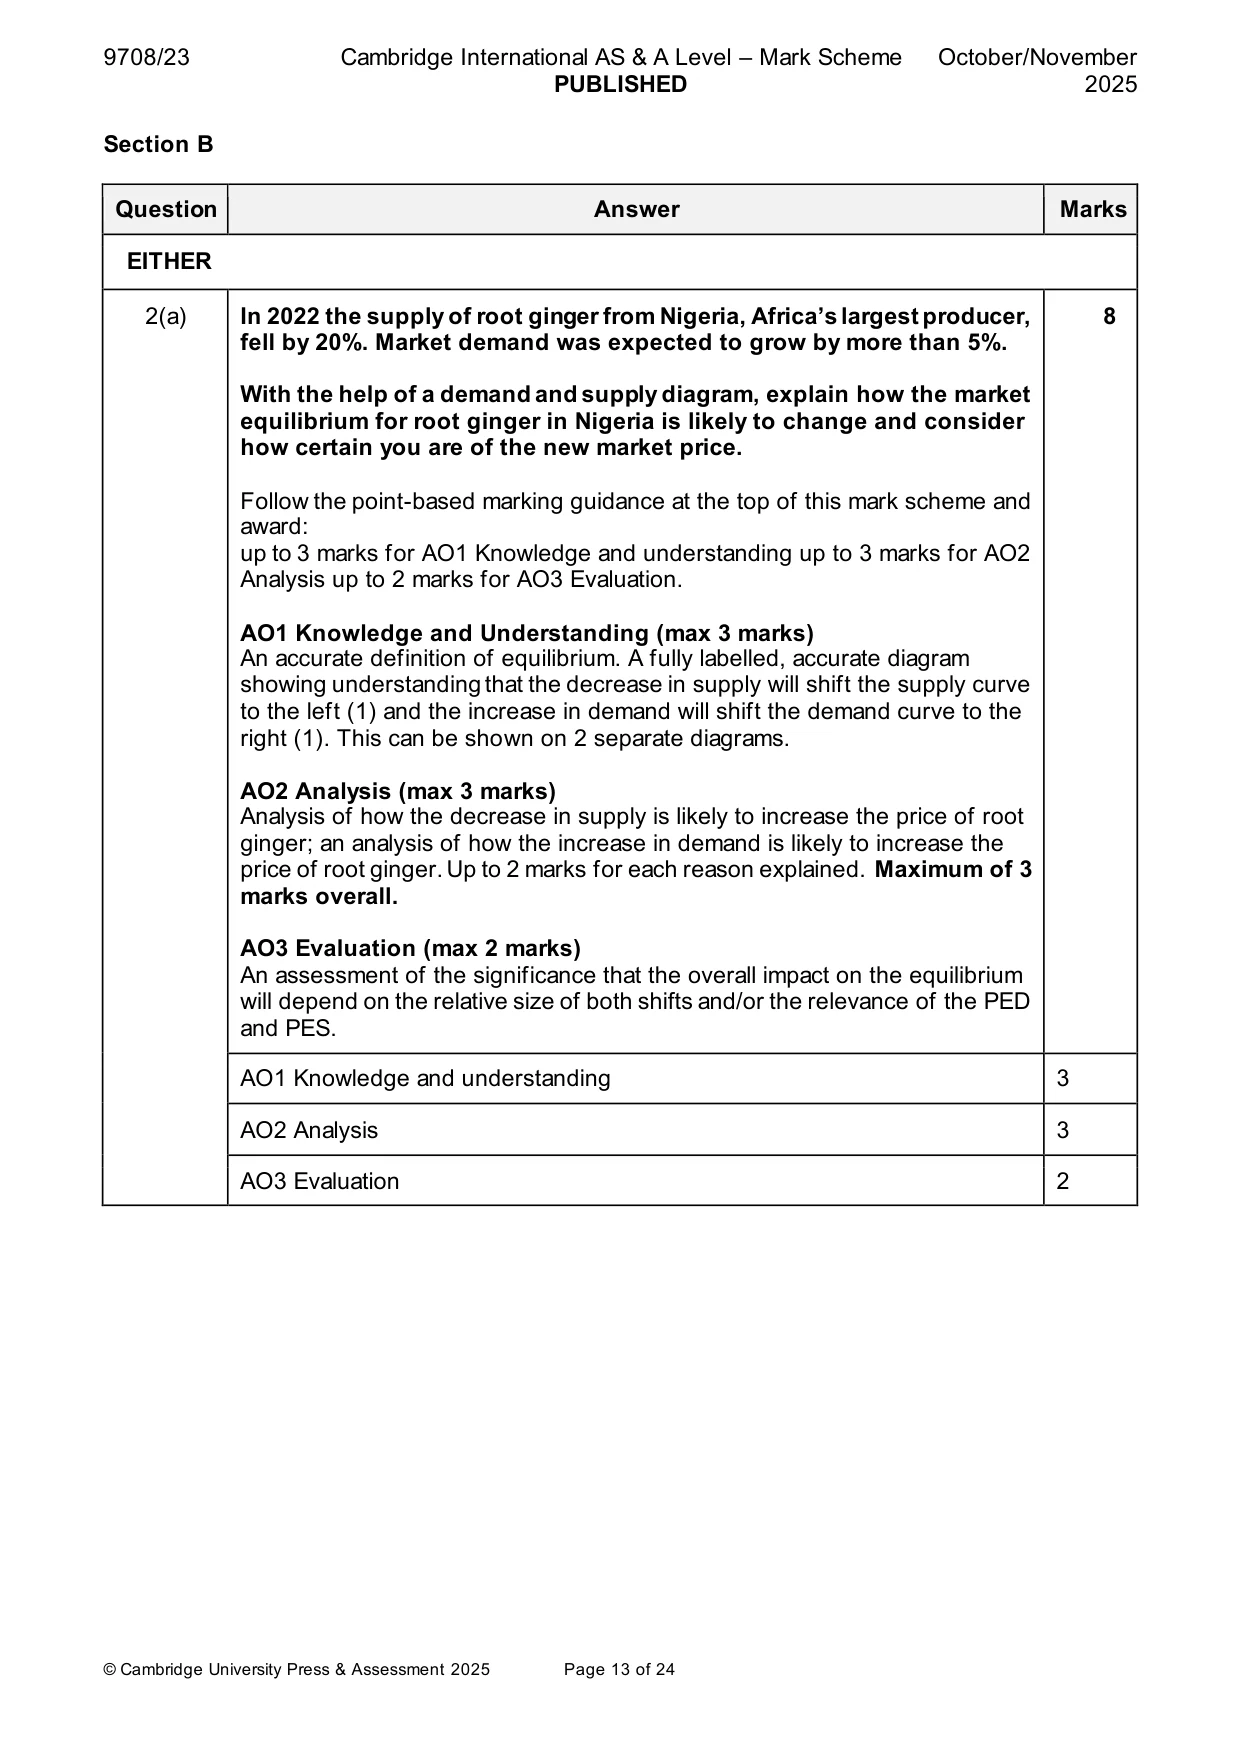
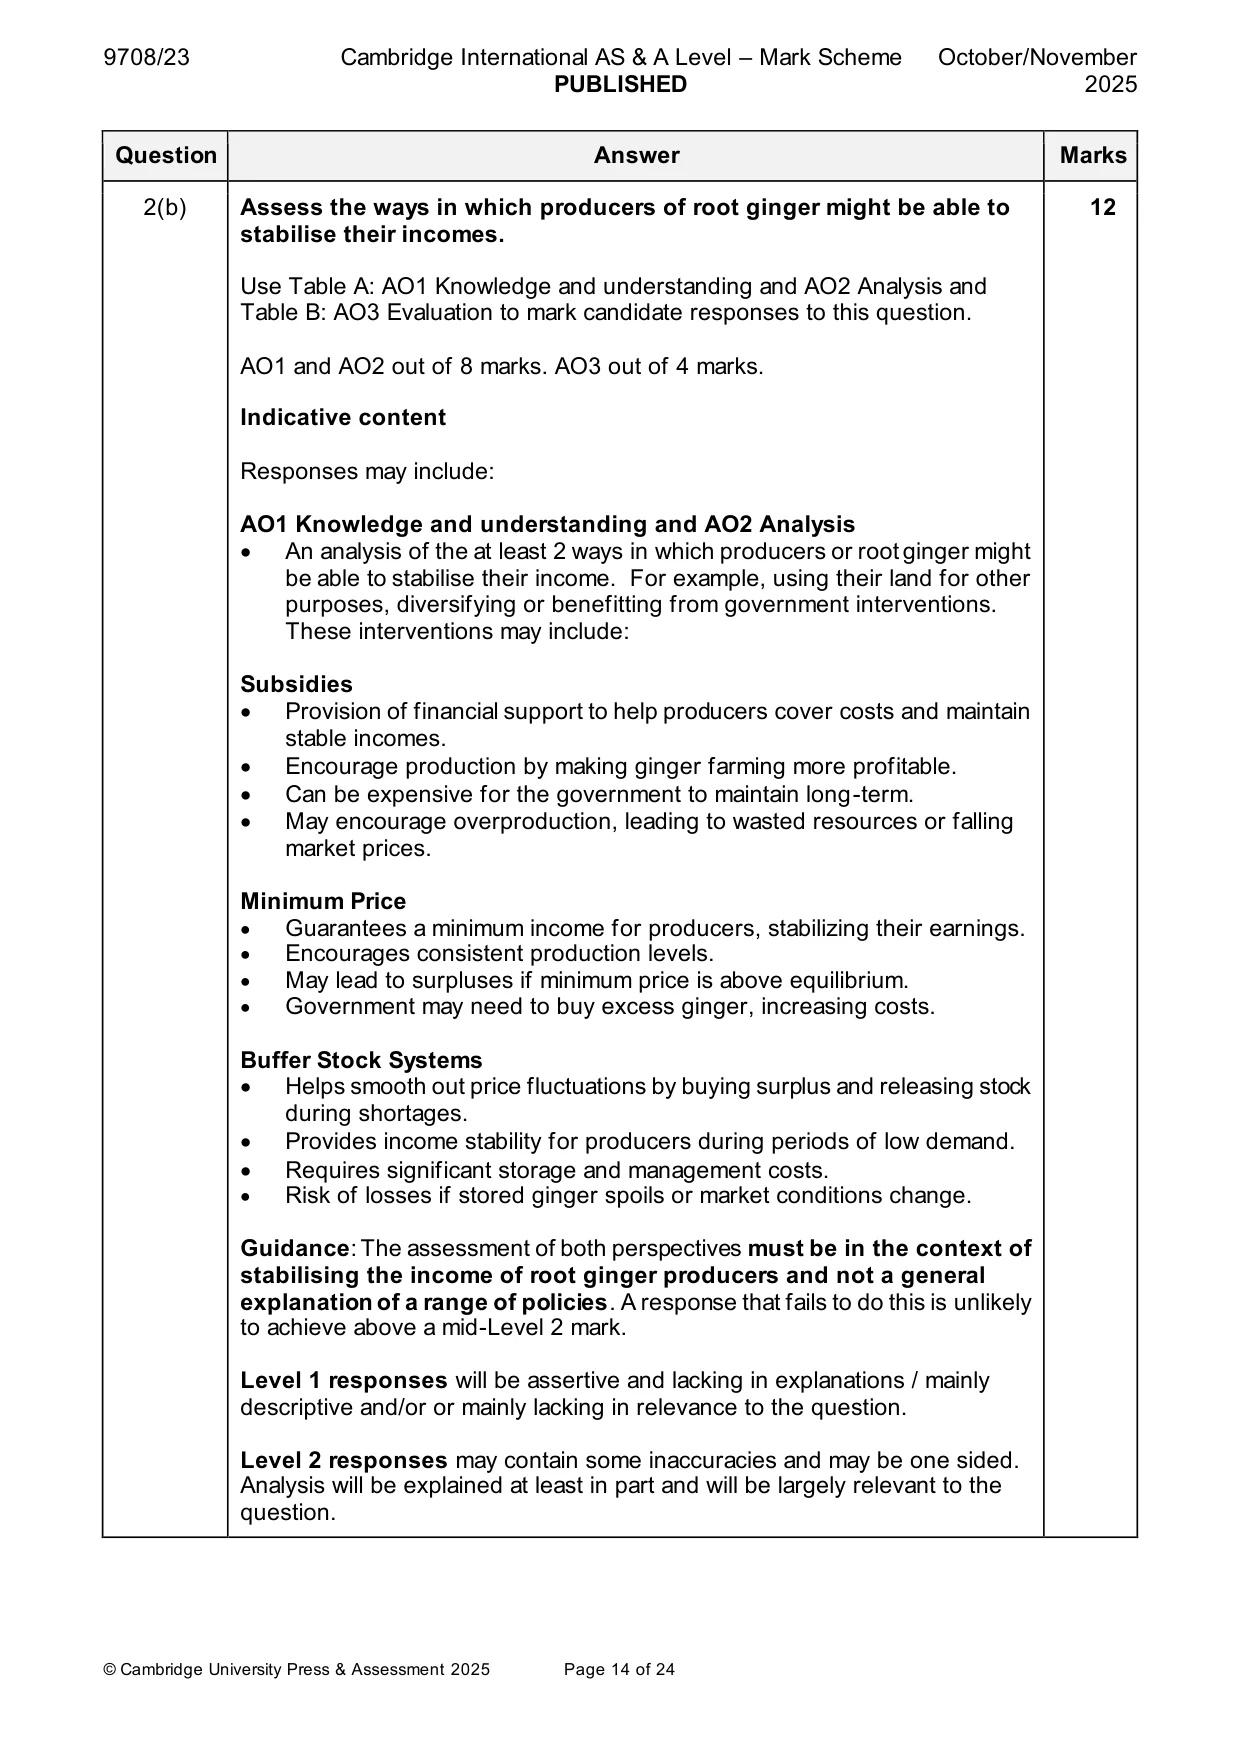
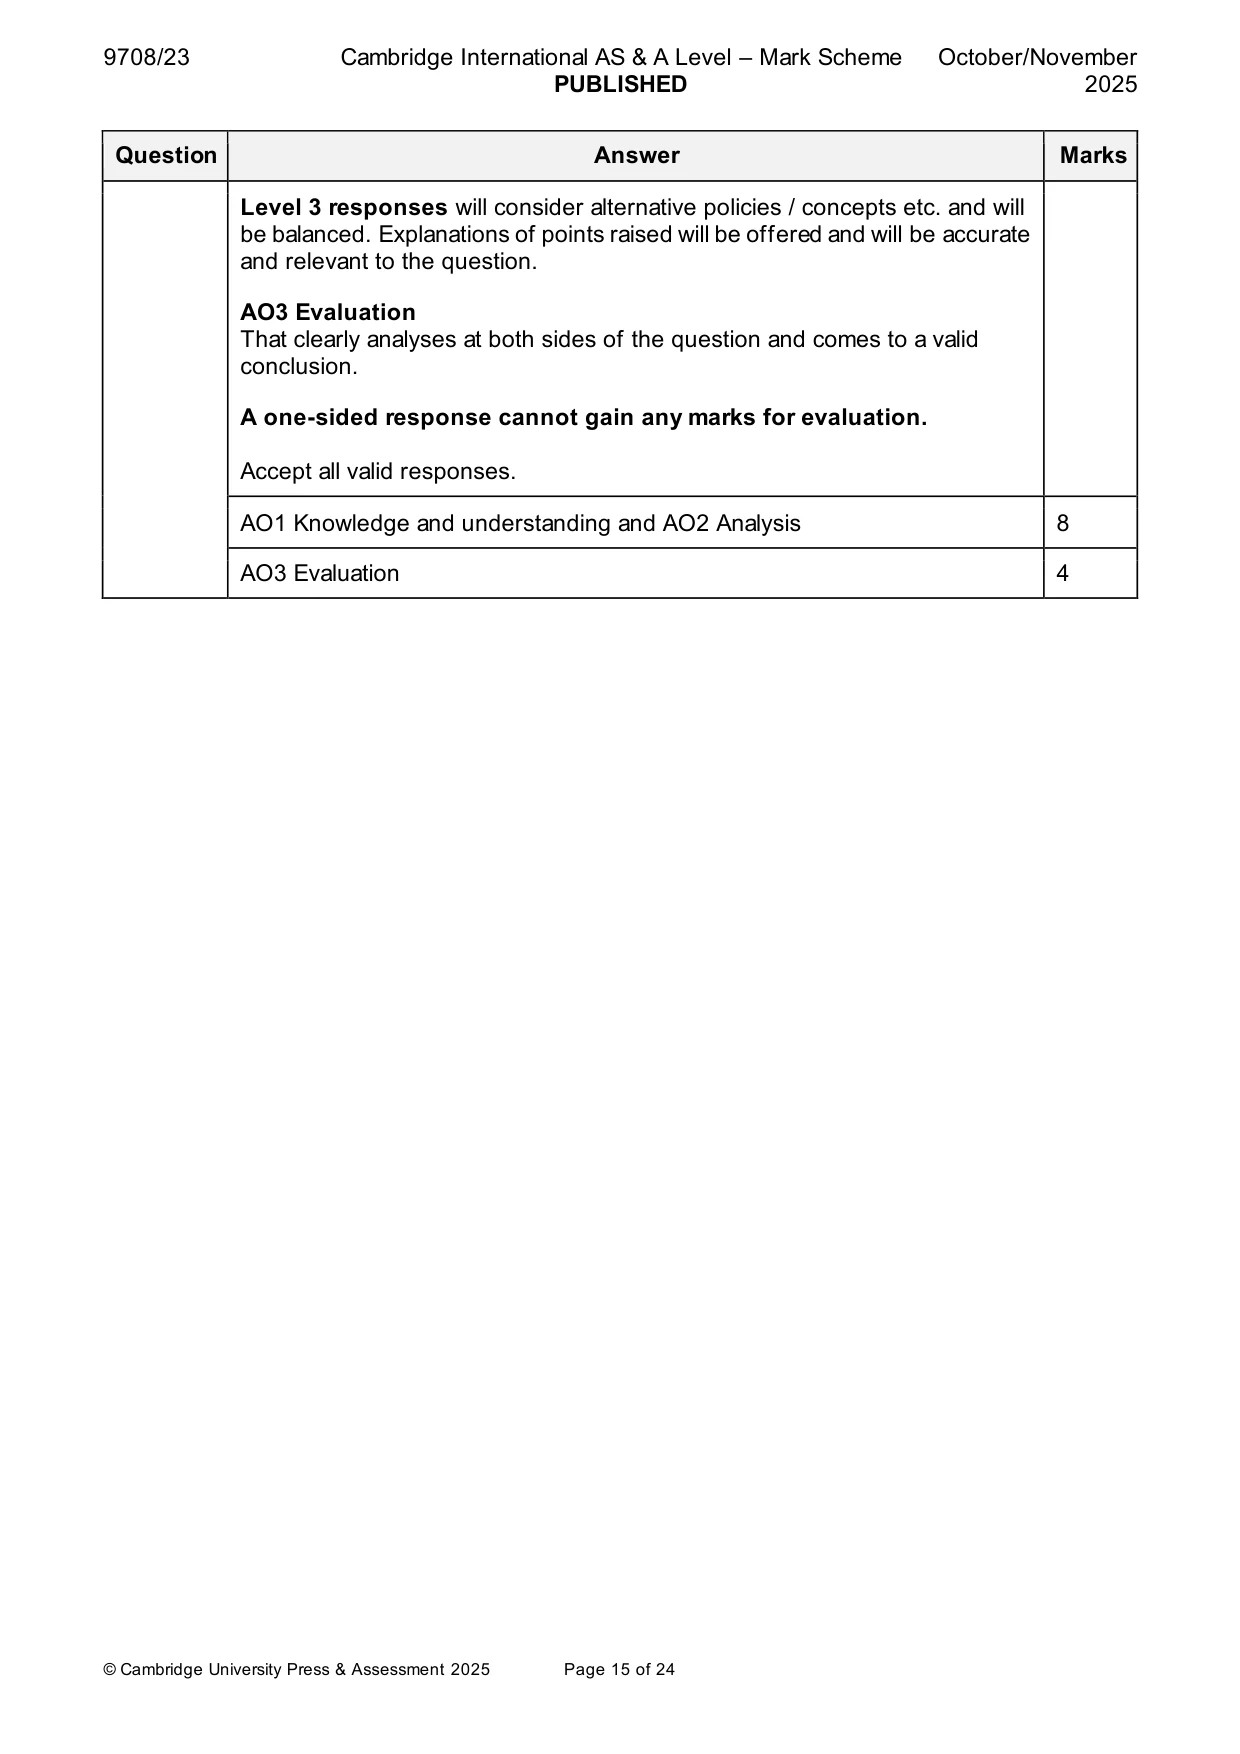
Mark scheme: 2(a) In 2022 the supply of root ginger from Nigeria, Africa’s largest producer, 8 fell by 20%. Market demand was expected to grow by more than 5%. With the help of a demand and supply diagram, explain how the market equilibrium for root ginger in Nigeria is likely to change and consider how certain you are of the new market price. Follow the point-based marking guidance at the top of this mark scheme and award: up to 3 marks for AO1 Knowledge and understanding up to 3 marks for AO2 Analysis up to 2 marks for AO3 Evaluation. AO1 Knowledge and Understanding (max 3 marks) An accurate definition of equilibrium. A fully labelled, accurate diagram showing understanding that the decrease in supply will shift the supply curve to the left (1) and the increase in demand will shift the demand curve to the right (1). This can be shown on 2 separate diagrams. AO2 Analysis (max 3 marks) Analysis of how the decrease in supply is likely to increase the price of root ginger; an analysis of how the increase in demand is likely to increase the price of root ginger. Up to 2 marks for each reason explained. Maximum of 3 marks overall. AO3 Evaluation (max 2 marks) An assessment of the significance that the overall impact on the equilibrium will depend on the relative size of both shifts and/or the relevance of the PED and PES. AO1 Knowledge and understanding 3 AO2 Analysis 3 AO3 Evaluation 2 2(b) Assess the ways in which producers of root ginger might be able to 12 stabilise their incomes. Use Table A: AO1 Knowledge and understanding and AO2 Analysis and Table B: AO3 Evaluation to mark candidate responses to this question. AO1 and AO2 out of 8 marks. AO3 out of 4 marks. Indicative content Responses may include: AO1 Knowledge and understanding and AO2 Analysis • An analysis of the at least 2 ways in which producers or root ginger might be able to stabilise their income. For example, using their land for other purposes, diversifying or benefitting from government interventions. These interventions may include: Subsidies • Provision of financial support to help producers cover costs and maintain stable incomes. • Encourage production by making ginger farming more profitable. • Can be expensive for the government to maintain long-term. • May encourage overproduction, leading to wasted resources or falling market prices. Minimum Price • Guarantees a minimum income for producers, stabilizing their earnings. • Encourages consistent production levels. • May lead to surpluses if minimum price is above equilibrium. • Government may need to buy excess ginger, increasing costs. Buffer Stock Systems • Helps smooth out price fluctuations by buying surplus and releasing stock during shortages. • Provides income stability for producers during periods of low demand. • Requires significant storage and management costs. • Risk of losses if stored ginger spoils or market conditions change. Guidance: The assessment of both perspectives must be in the context of stabilising the income of root ginger producers and not a general explanation of a range of policies. A response that fails to do this is unlikely to achieve above a mid-Level 2 mark. Level 1 responses will be assertive and lacking in explanations / mainly descriptive and/or or mainly lacking in relevance to the question. Level 2 responses may contain some inaccuracies and may be one sided. Analysis will be explained at least in part and will be largely relevant to the question. Level 3 responses will consider alternative policies / concepts etc. and will be balanced. Explanations of points raised will be offered and will be accurate and relevant to the question. AO3 Evaluation That clearly analyses at both sides of the question and comes to a valid conclusion. A one-sided response cannot gain any marks for evaluation. Accept all valid responses. AO1 Knowledge and understanding and AO2 Analysis 8 AO3 Evaluation 4
More questions on Methods and effects of government intervention in markets
Q3 · The Gini coefficient for South Korea was estimated to be 0.39 in 2019 and 0.33 in 2022
3 (a) The Gini coefficient for South Korea was estimated to be 0.39 in 2019 and 0.33 in 2022. Explain what this data means, how it might be used by the government of South Korea and consider its usefulness. [8] (b) Assess why it is easier for a government such as that of South Korea to redistribute income rather than redistribute wealth. [12] Section C Answer one question. EITHER
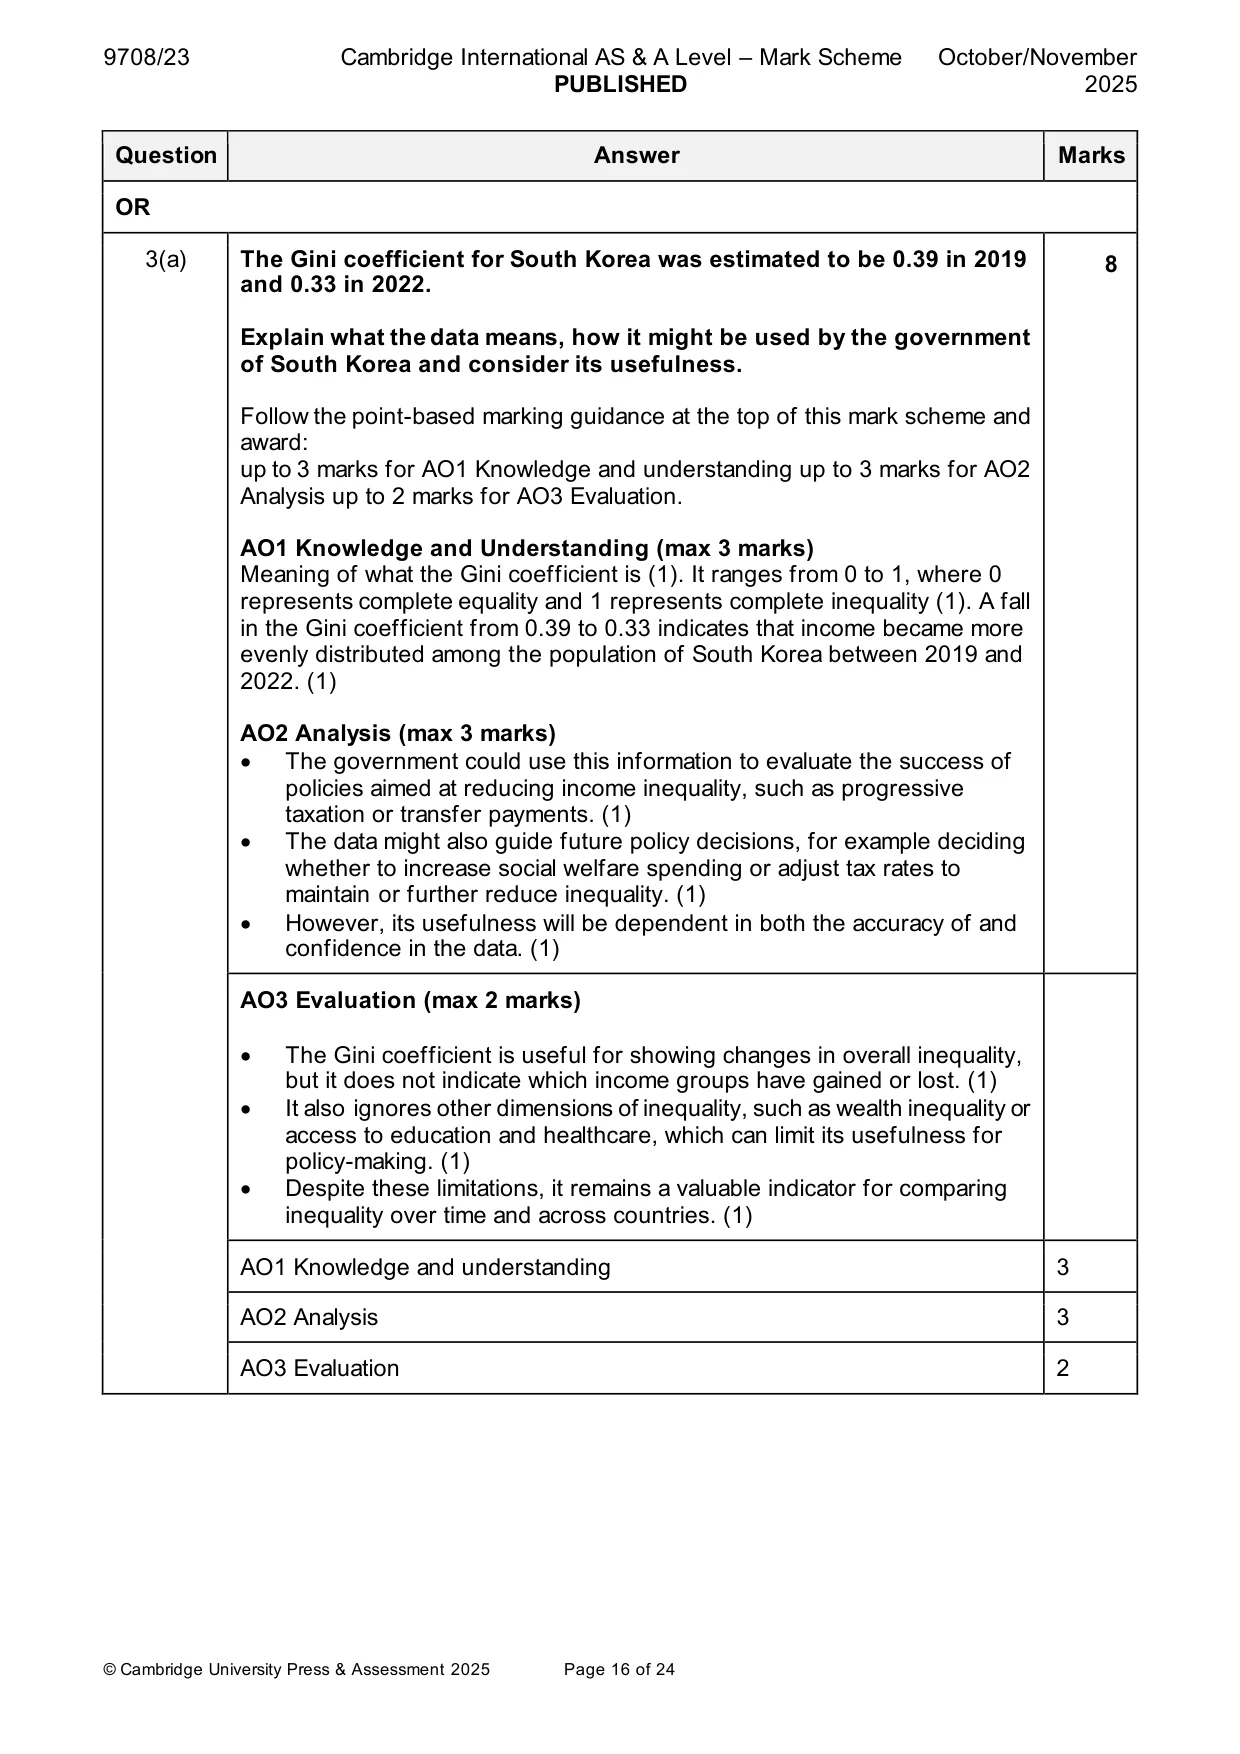
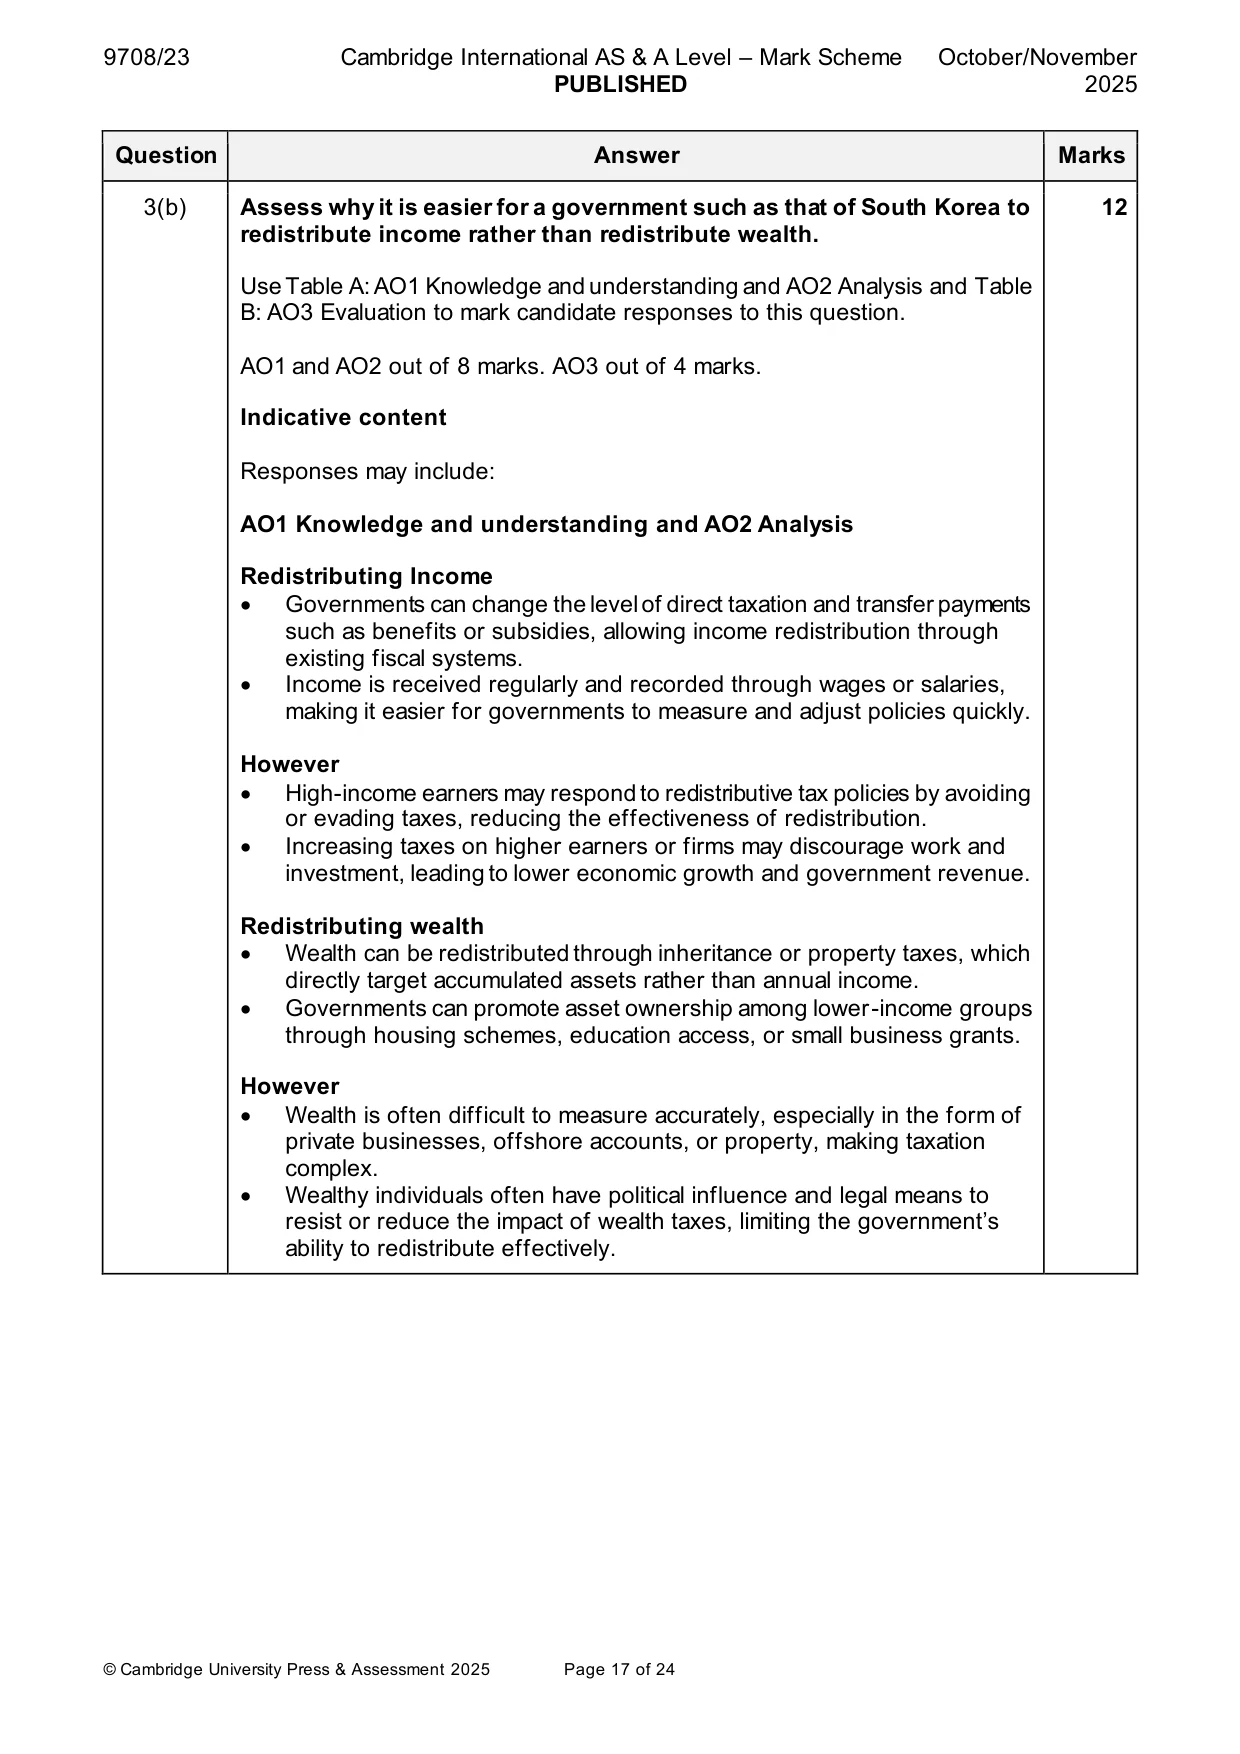
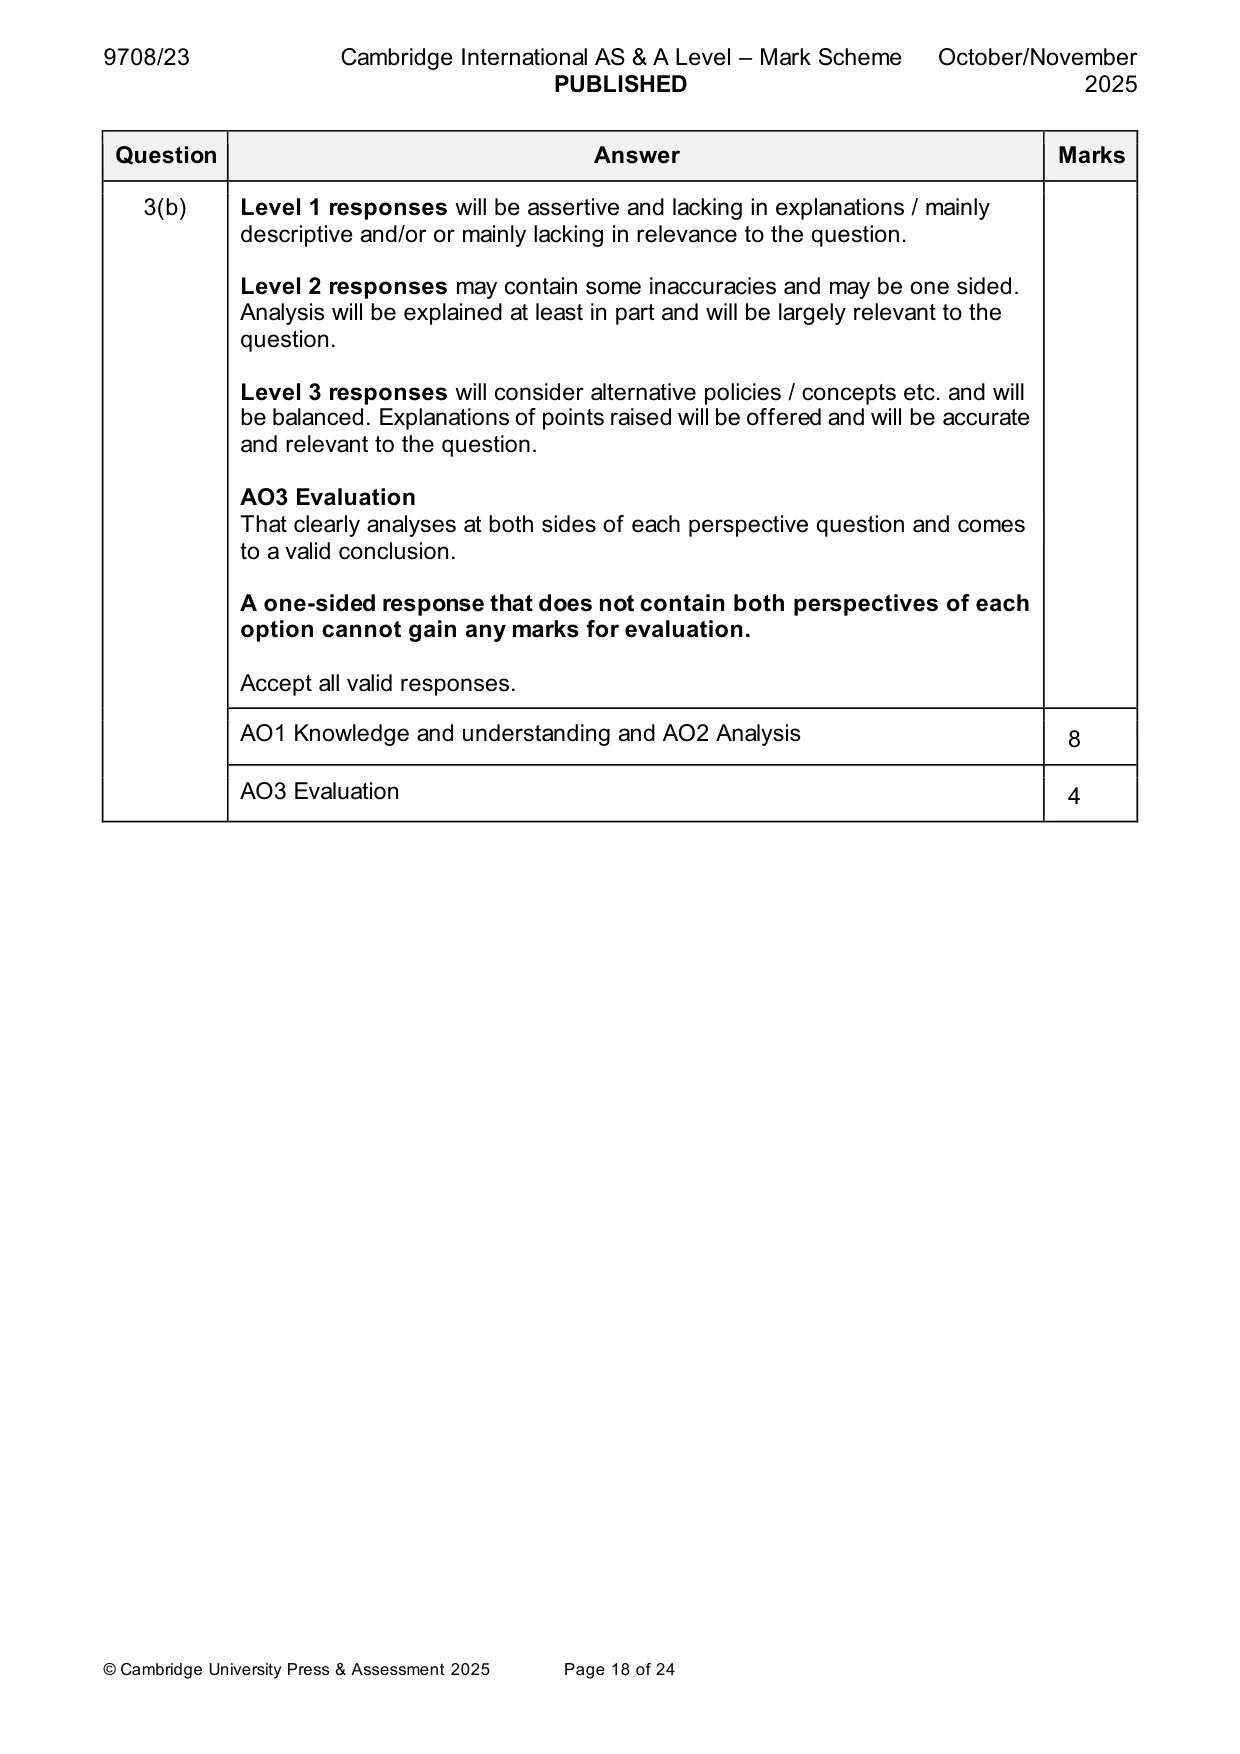
Mark scheme: 3(a) The Gini coefficient for South Korea was estimated to be 0.39 in 2019 8 and 0.33 in 2022. Explain what the data means, how it might be used by the government of South Korea and consider its usefulness. Follow the point-based marking guidance at the top of this mark scheme and award: up to 3 marks for AO1 Knowledge and understanding up to 3 marks for AO2 Analysis up to 2 marks for AO3 Evaluation. AO1 Knowledge and Understanding (max 3 marks) Meaning of what the Gini coefficient is (1). It ranges from 0 to 1, where 0 represents complete equality and 1 represents complete inequality (1). A fall in the Gini coefficient from 0.39 to 0.33 indicates that income became more evenly distributed among the population of South Korea between 2019 and 2022. (1) AO2 Analysis (max 3 marks) • The government could use this information to evaluate the success of policies aimed at reducing income inequality, such as progressive taxation or transfer payments. (1) • The data might also guide future policy decisions, for example deciding whether to increase social welfare spending or adjust tax rates to maintain or further reduce inequality. (1) • However, its usefulness will be dependent in both the accuracy of and confidence in the data. (1) AO3 Evaluation (max 2 marks) • The Gini coefficient is useful for showing changes in overall inequality, but it does not indicate which income groups have gained or lost. (1) • It also ignores other dimensions of inequality, such as wealth inequality or access to education and healthcare, which can limit its usefulness for policy-making. (1) • Despite these limitations, it remains a valuable indicator for comparing inequality over time and across countries. (1) AO1 Knowledge and understanding 3 AO2 Analysis 3 AO3 Evaluation 2 3(b) Assess why it is easier for a government such as that of South Korea to 12 redistribute income rather than redistribute wealth. Use Table A: AO1 Knowledge and understanding and AO2 Analysis and Table B: AO3 Evaluation to mark candidate responses to this question. AO1 and AO2 out of 8 marks. AO3 out of 4 marks. Indicative content Responses may include: AO1 Knowledge and understanding and AO2 Analysis Redistributing Income • Governments can change the level of direct taxation and transfer payments such as benefits or subsidies, allowing income redistribution through existing fiscal systems. • Income is received regularly and recorded through wages or salaries, making it easier for governments to measure and adjust policies quickly. However • High-income earners may respond to redistributive tax policies by avoiding or evading taxes, reducing the effectiveness of redistribution. • Increasing taxes on higher earners or firms may discourage work and investment, leading to lower economic growth and government revenue. Redistributing wealth • Wealth can be redistributed through inheritance or property taxes, which directly target accumulated assets rather than annual income. • Governments can promote asset ownership among lower-income groups through housing schemes, education access, or small business grants. However • Wealth is often difficult to measure accurately, especially in the form of private businesses, offshore accounts, or property, making taxation complex. • Wealthy individuals often have political influence and legal means to resist or reduce the impact of wealth taxes, limiting the government’s ability to redistribute effectively. 3(b) Level 1 responses will be assertive and lacking in explanations / mainly descriptive and/or or mainly lacking in relevance to the question. Level 2 responses may contain some inaccuracies and may be one sided. Analysis will be explained at least in part and will be largely relevant to the question. Level 3 responses will consider alternative policies / concepts etc. and will be balanced. Explanations of points raised will be offered and will be accurate and relevant to the question. AO3 Evaluation That clearly analyses at both sides of each perspective question and comes to a valid conclusion. A one-sided response that does not contain both perspectives of each option cannot gain any marks for evaluation. Accept all valid responses. AO1 Knowledge and understanding and AO2 Analysis 8 AO3 Evaluation 4 Section C
More questions on Equity and redistribution of income and wealth
Q4 · For your economy or for one that is known to you, explain three causes of inflation and…
4 (a) For your economy or for one that is known to you, explain three causes of inflation and consider which of these causes is likely to be most important in 2025. [8] (b) Assess whether supply-side policy or demand-side policy is the better way of reducing this inflation. [12] OR
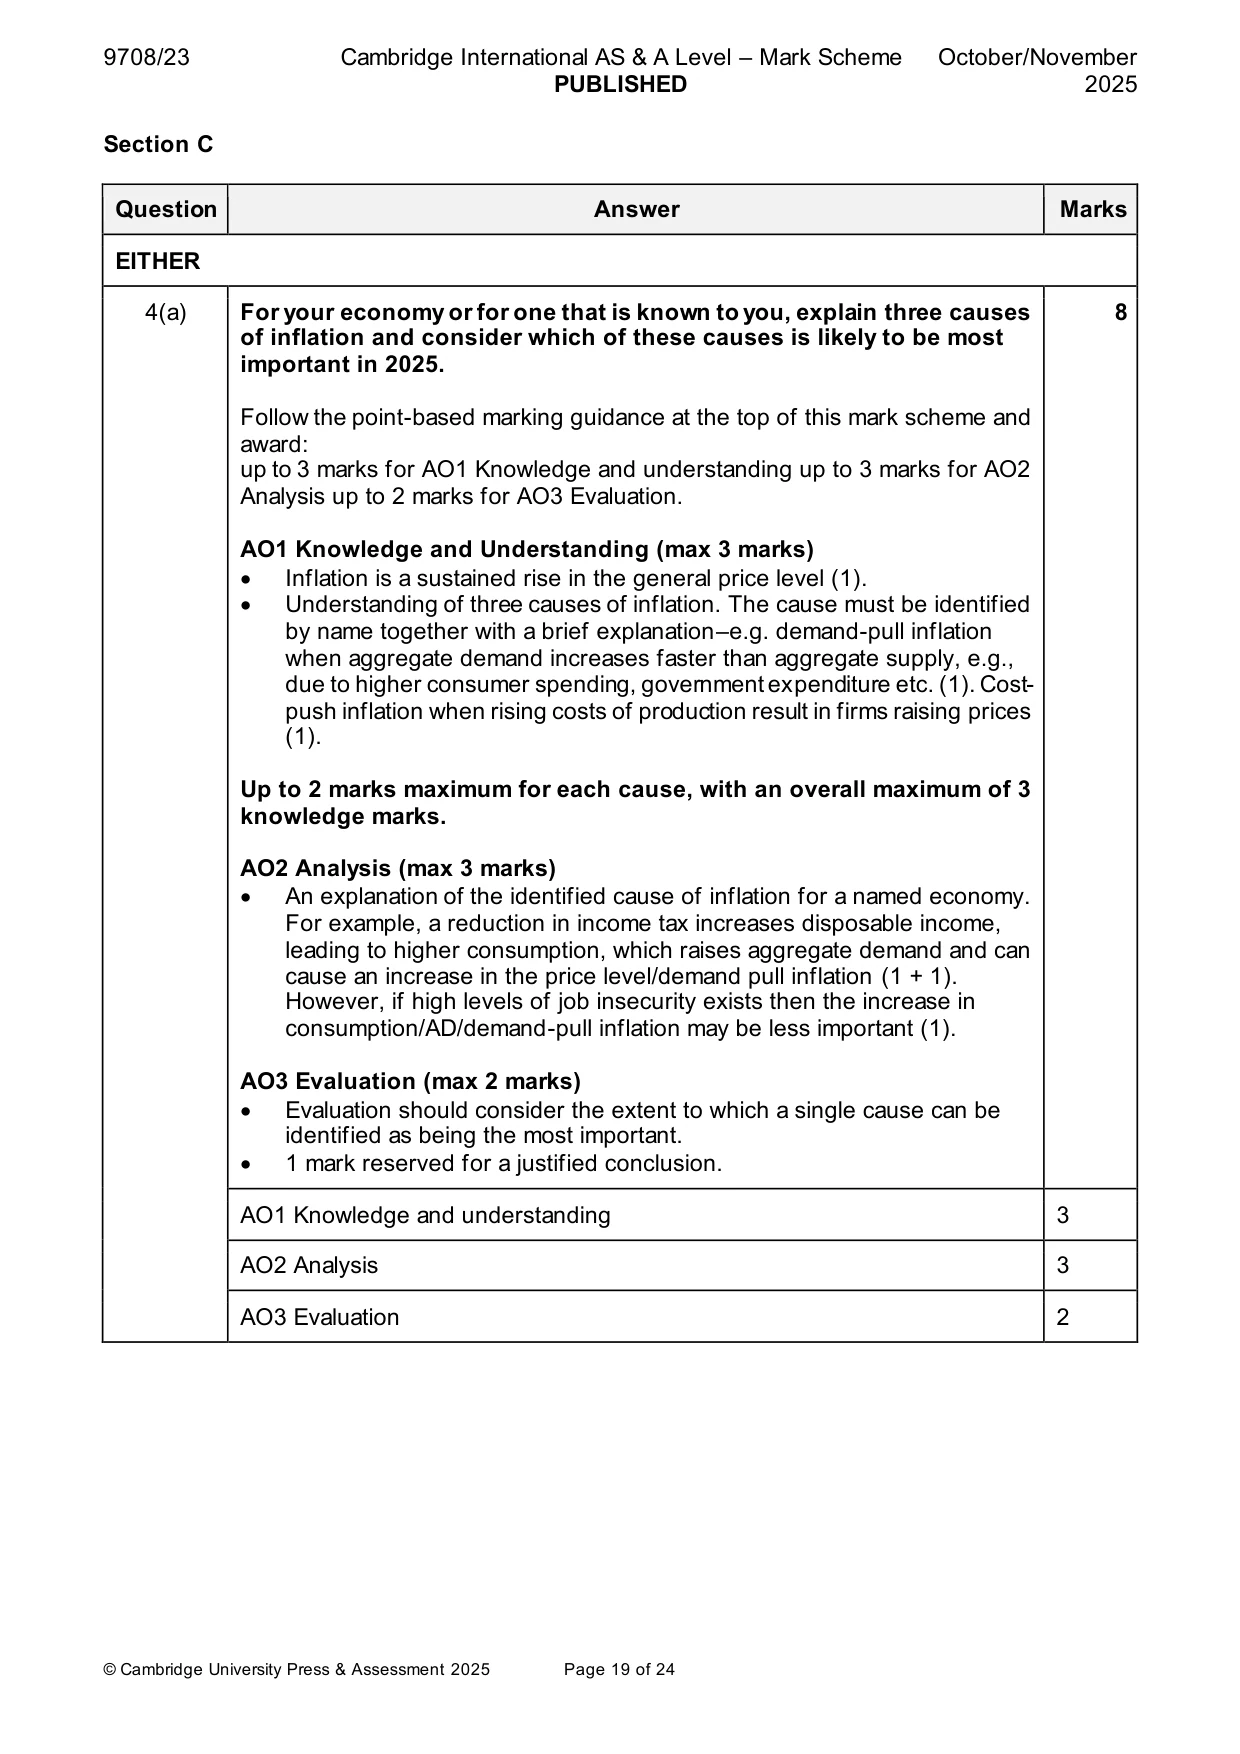
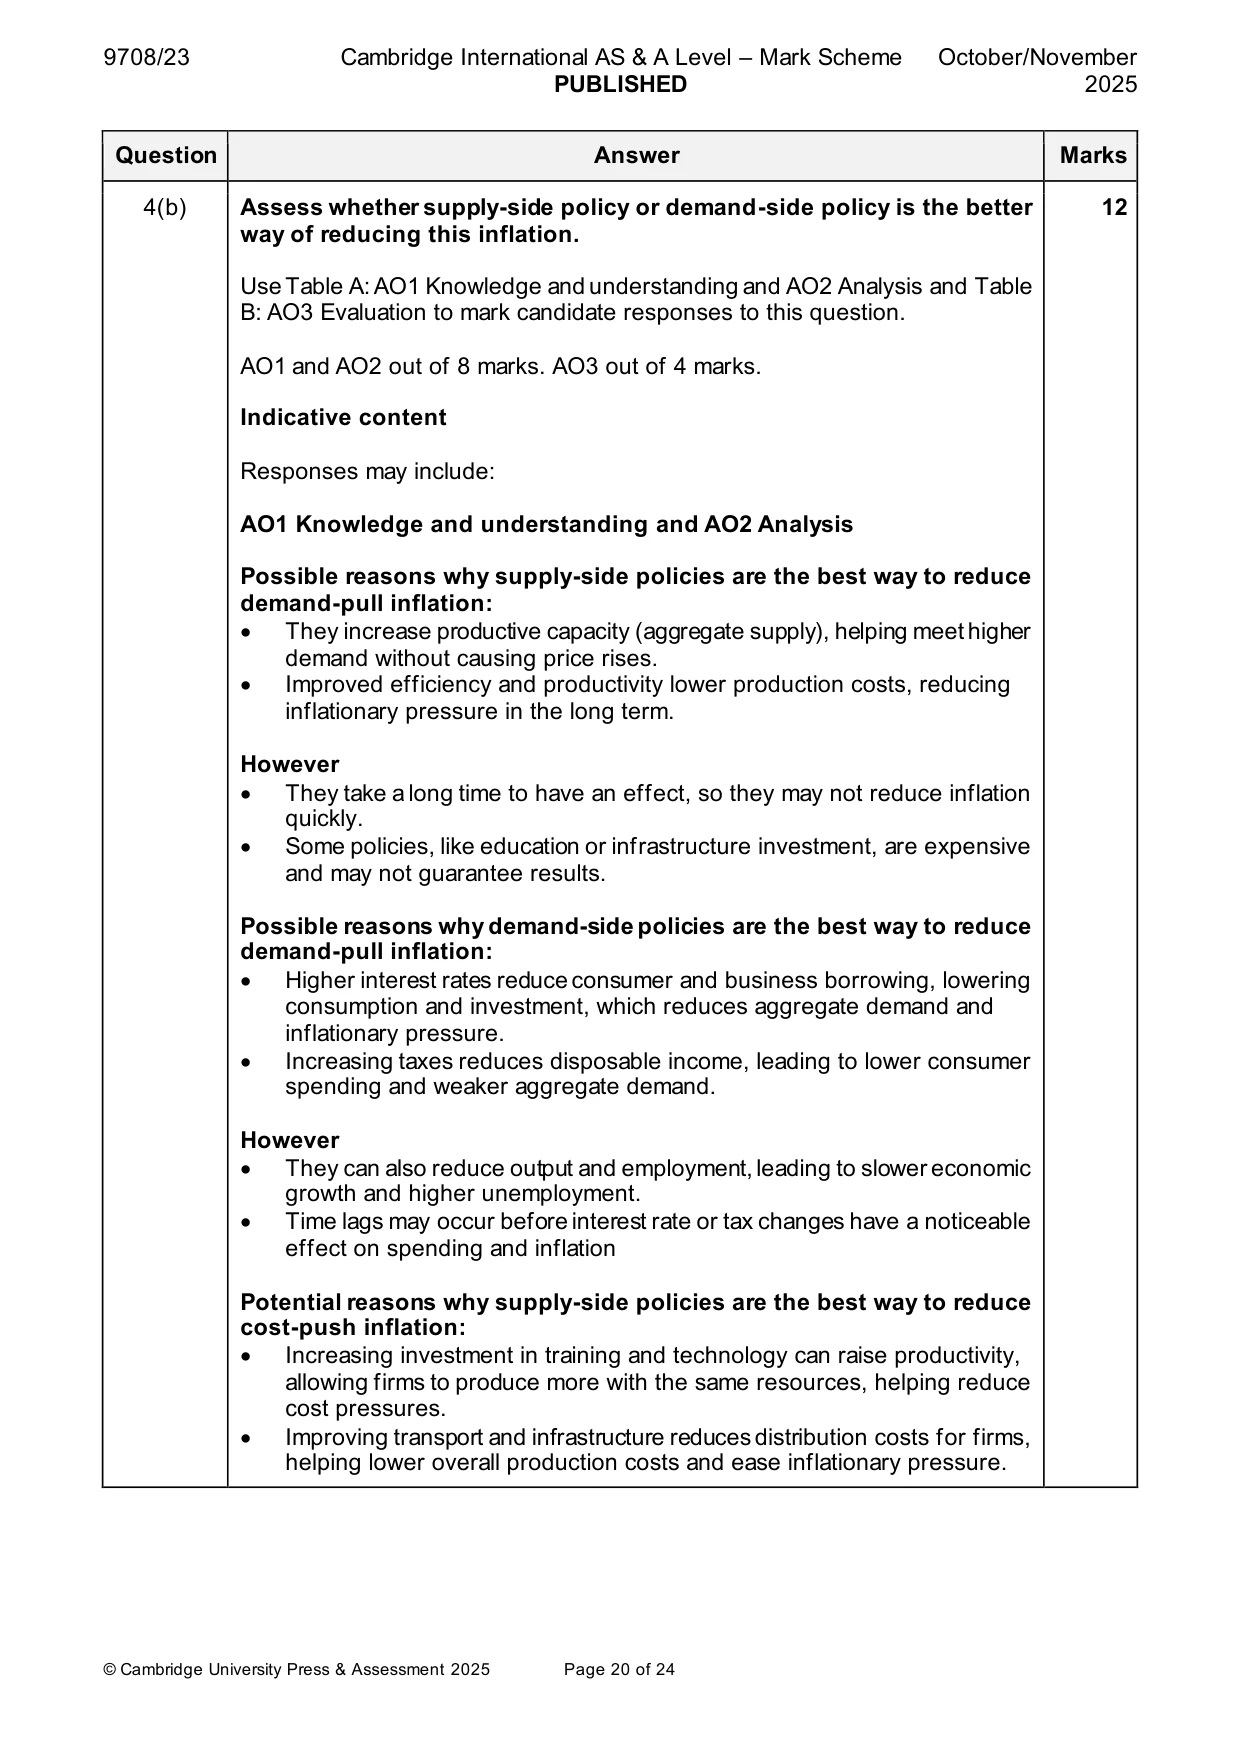
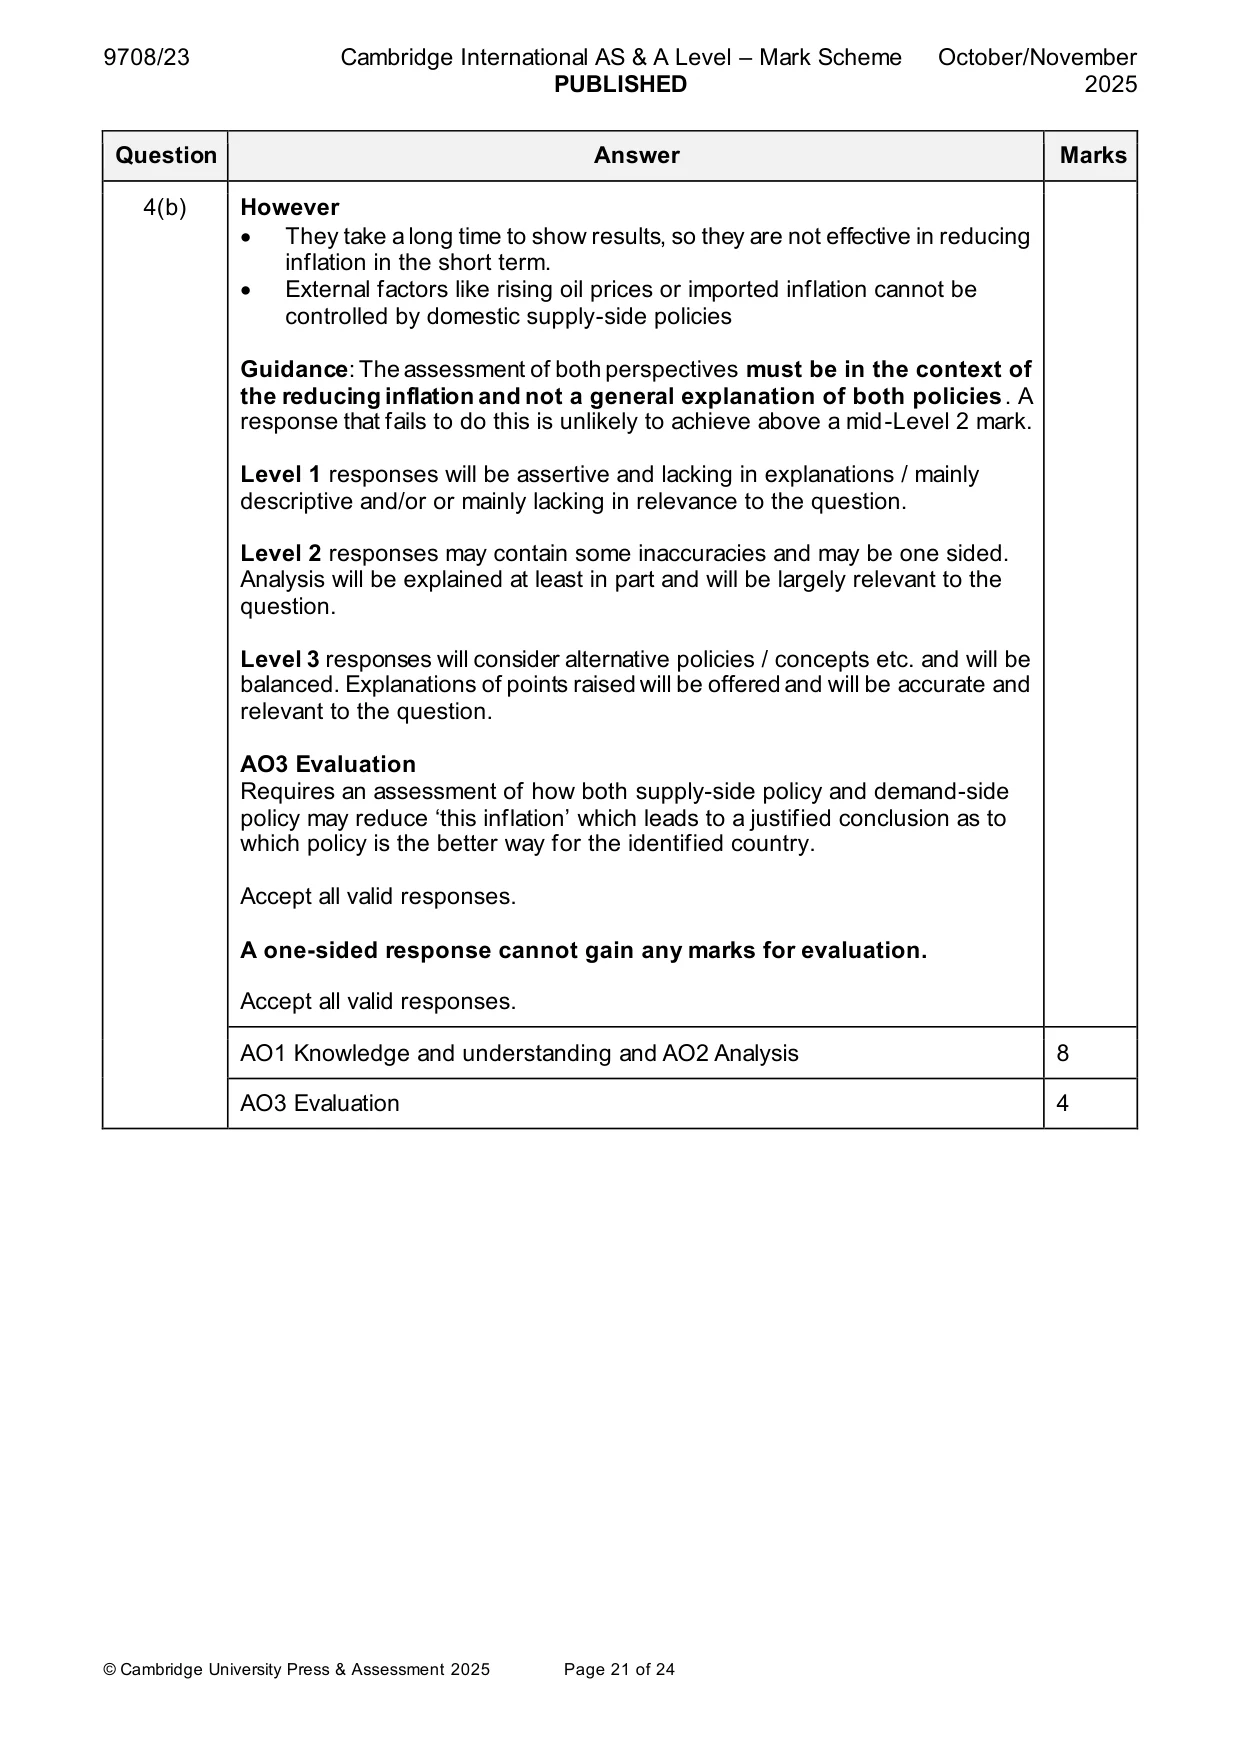
Mark scheme: 4(a) For your economy or for one that is known to you, explain three causes 8 of inflation and consider which of these causes is likely to be most important in 2025. Follow the point-based marking guidance at the top of this mark scheme and award: up to 3 marks for AO1 Knowledge and understanding up to 3 marks for AO2 Analysis up to 2 marks for AO3 Evaluation. AO1 Knowledge and Understanding (max 3 marks) • Inflation is a sustained rise in the general price level (1). • Understanding of three causes of inflation. The cause must be identified by name together with a brief explanation–e.g. demand-pull inflation when aggregate demand increases faster than aggregate supply, e.g., due to higher consumer spending, government expenditure etc. (1). Cost- push inflation when rising costs of production result in firms raising prices (1). Up to 2 marks maximum for each cause, with an overall maximum of 3 knowledge marks. AO2 Analysis (max 3 marks) • An explanation of the identified cause of inflation for a named economy. For example, a reduction in income tax increases disposable income, leading to higher consumption, which raises aggregate demand and can cause an increase in the price level/demand pull inflation (1 + 1). However, if high levels of job insecurity exists then the increase in consumption/AD/demand-pull inflation may be less important (1). AO3 Evaluation (max 2 marks) • Evaluation should consider the extent to which a single cause can be identified as being the most important. • 1 mark reserved for a justified conclusion. AO1 Knowledge and understanding 3 AO2 Analysis 3 AO3 Evaluation 2 4(b) Assess whether supply-side policy or demand-side policy is the better 12 way of reducing this inflation. Use Table A: AO1 Knowledge and understanding and AO2 Analysis and Table B: AO3 Evaluation to mark candidate responses to this question. AO1 and AO2 out of 8 marks. AO3 out of 4 marks. Indicative content Responses may include: AO1 Knowledge and understanding and AO2 Analysis Possible reasons why supply-side policies are the best way to reduce demand-pull inflation: • They increase productive capacity (aggregate supply), helping meet higher demand without causing price rises. • Improved efficiency and productivity lower production costs, reducing inflationary pressure in the long term. However • They take a long time to have an effect, so they may not reduce inflation quickly. • Some policies, like education or infrastructure investment, are expensive and may not guarantee results. Possible reasons why demand-side policies are the best way to reduce demand-pull inflation: • Higher interest rates reduce consumer and business borrowing, lowering consumption and investment, which reduces aggregate demand and inflationary pressure. • Increasing taxes reduces disposable income, leading to lower consumer spending and weaker aggregate demand. However • They can also reduce output and employment, leading to slower economic growth and higher unemployment. • Time lags may occur before interest rate or tax changes have a noticeable effect on spending and inflation Potential reasons why supply-side policies are the best way to reduce cost-push inflation: • Increasing investment in training and technology can raise productivity, allowing firms to produce more with the same resources, helping reduce cost pressures. • Improving transport and infrastructure reduces distribution costs for firms, helping lower overall production costs and ease inflationary pressure. 4(b) However • They take a long time to show results, so they are not effective in reducing inflation in the short term. • External factors like rising oil prices or imported inflation cannot be controlled by domestic supply-side policies Guidance: The assessment of both perspectives must be in the context of the reducing inflation and not a general explanation of both policies. A response that fails to do this is unlikely to achieve above a mid-Level 2 mark. Level 1 responses will be assertive and lacking in explanations / mainly descriptive and/or or mainly lacking in relevance to the question. Level 2 responses may contain some inaccuracies and may be one sided. Analysis will be explained at least in part and will be largely relevant to the question. Level 3 responses will consider alternative policies / concepts etc. and will be balanced. Explanations of points raised will be offered and will be accurate and relevant to the question. AO3 Evaluation Requires an assessment of how both supply-side policy and demand-side policy may reduce ‘this inflation’ which leads to a justified conclusion as to which policy is the better way for the identified country. Accept all valid responses. A one-sided response cannot gain any marks for evaluation. Accept all valid responses. AO1 Knowledge and understanding and AO2 Analysis 8 AO3 Evaluation 4
More questions on Effectiveness of policy options to meet all macroeconomic objectives
Q5 · Explain two reasons why an economy may have a deficit on the current account of its…
5 (a) Explain two reasons why an economy may have a deficit on the current account of its balance of payments and consider whether its government is likely to be concerned about this deficit. [8] (b) Assess whether it is better to use protectionist policies or contractionary policies to reduce a deficit on the current account of the balance of payments. [12]
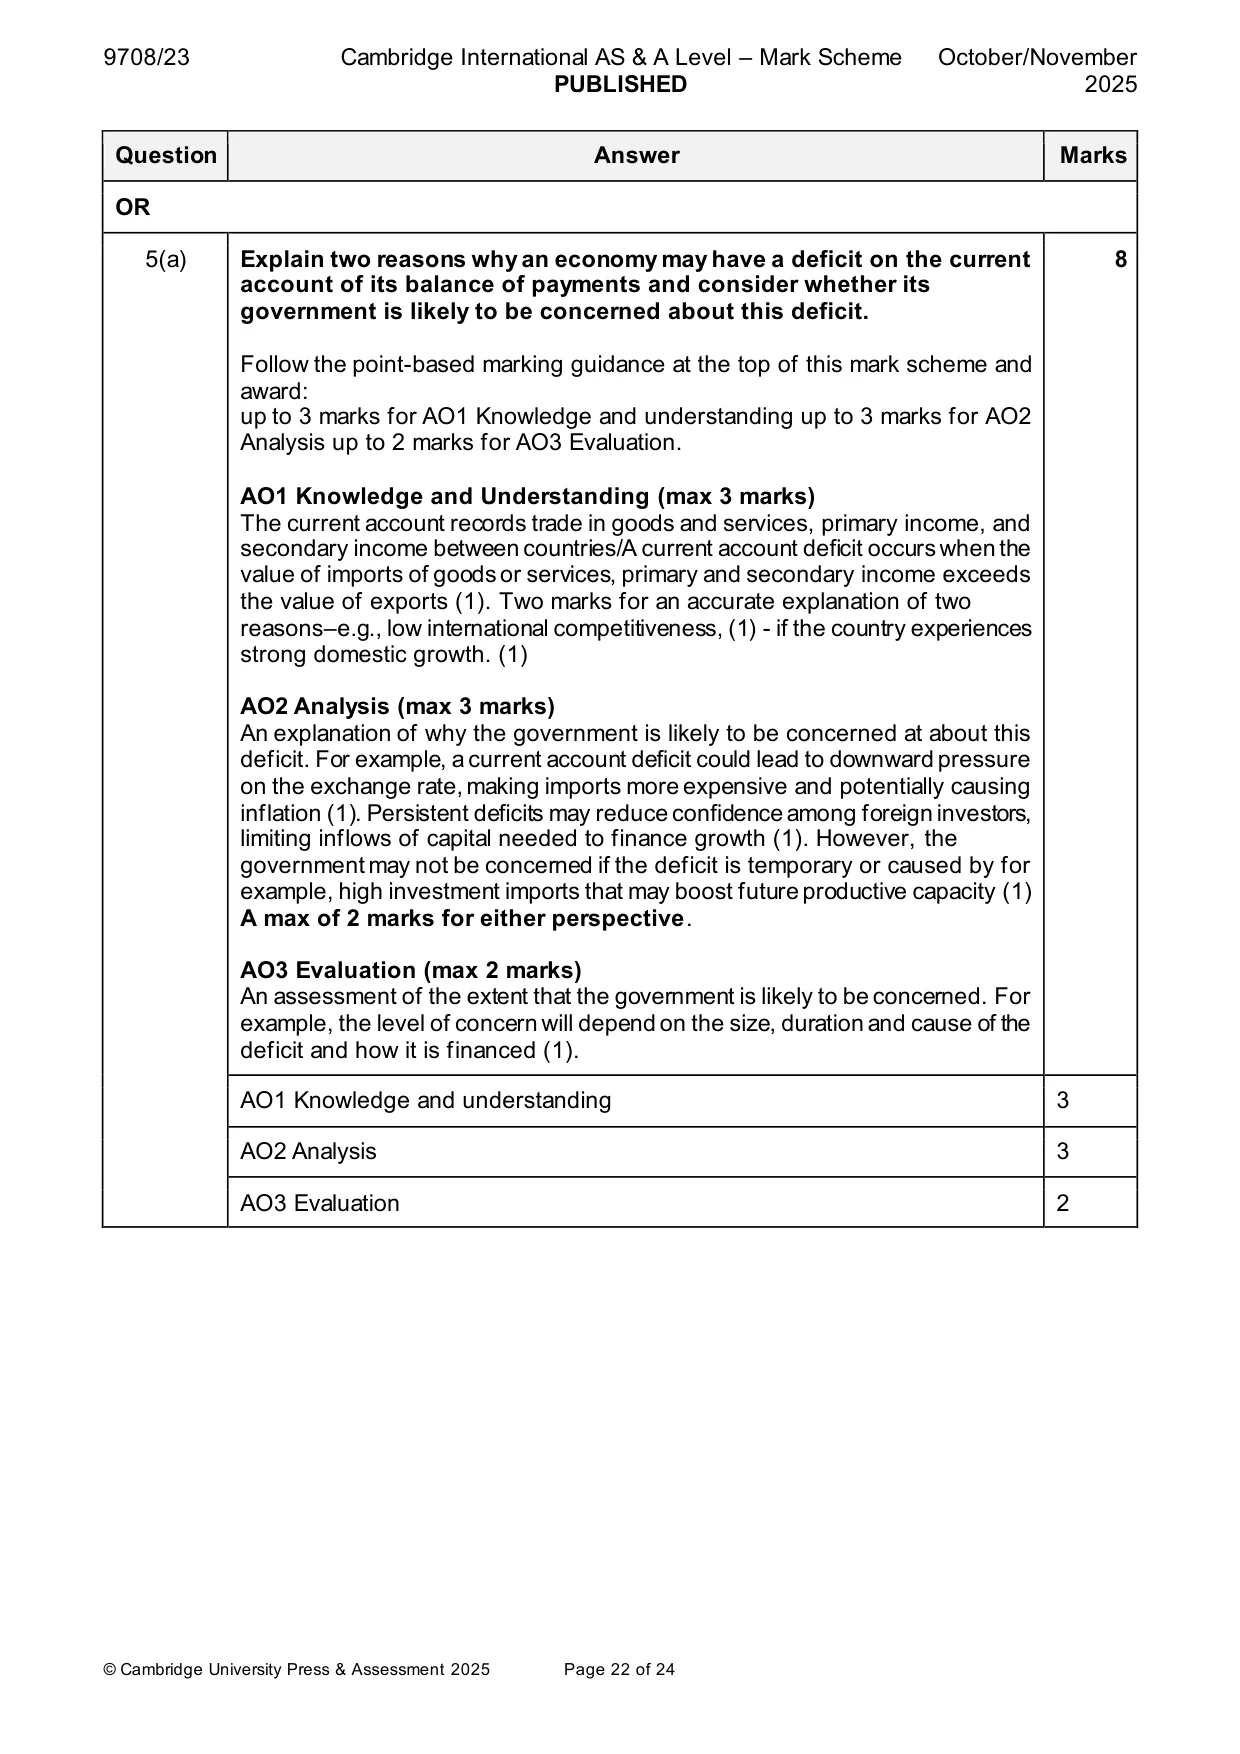
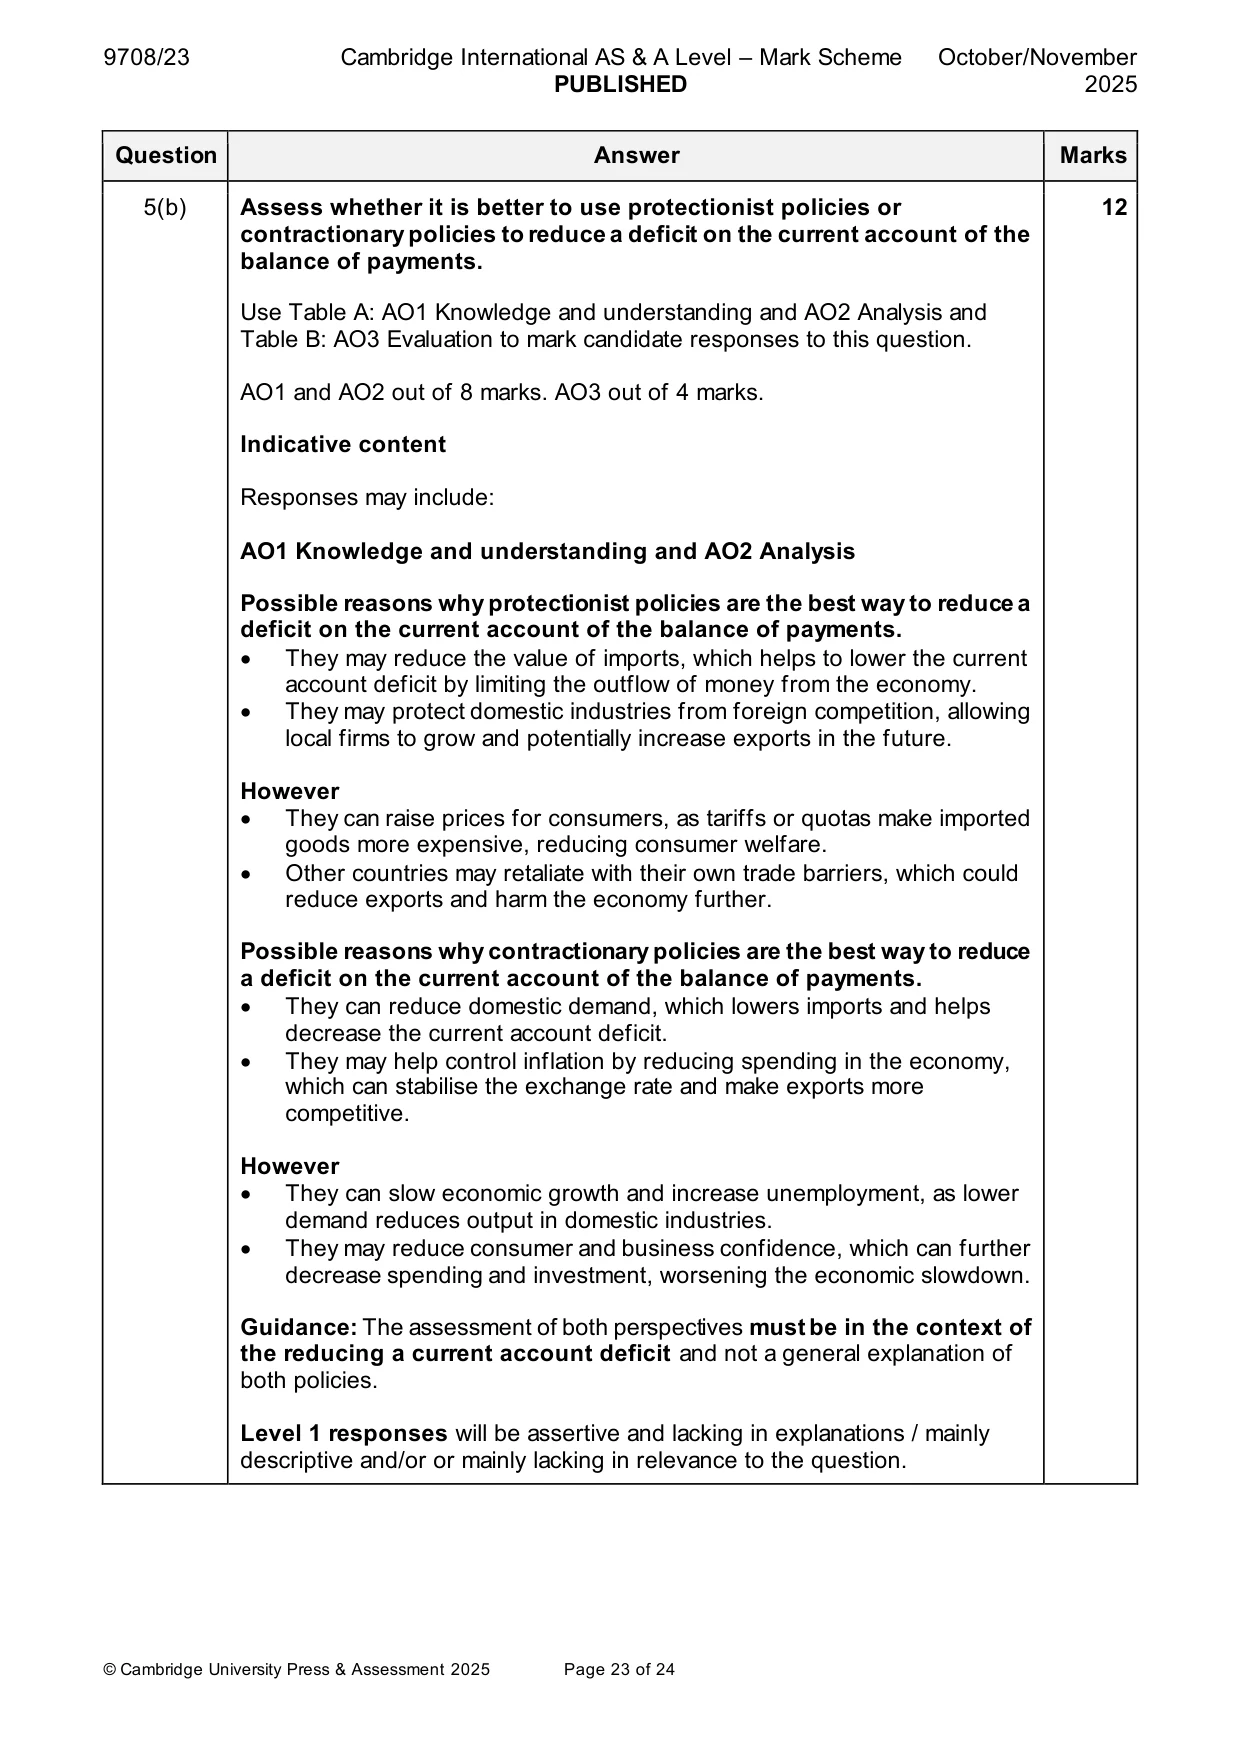
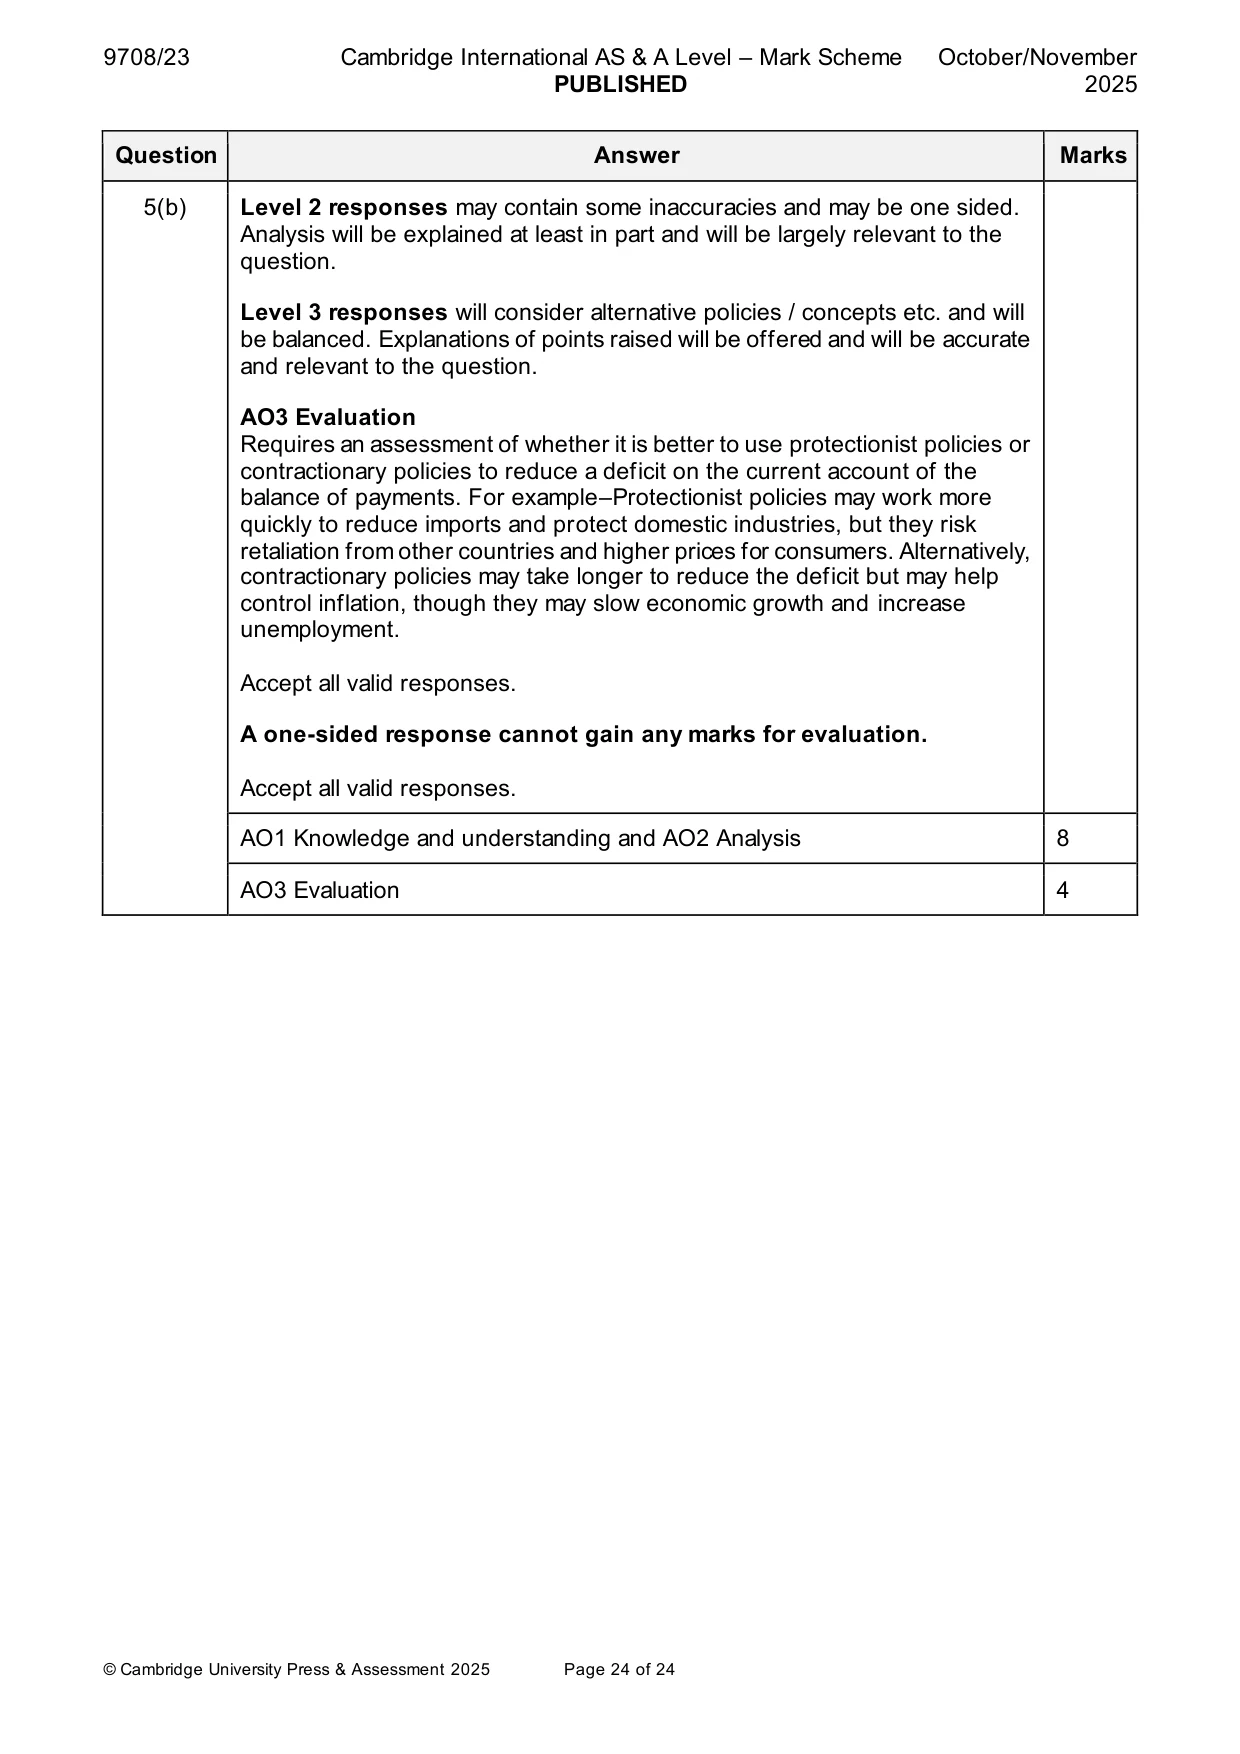
Mark scheme: 5(a) Explain two reasons why an economy may have a deficit on the current 8 account of its balance of payments and consider whether its government is likely to be concerned about this deficit. Follow the point-based marking guidance at the top of this mark scheme and award: up to 3 marks for AO1 Knowledge and understanding up to 3 marks for AO2 Analysis up to 2 marks for AO3 Evaluation. AO1 Knowledge and Understanding (max 3 marks) The current account records trade in goods and services, primary income, and secondary income between countries/A current account deficit occurs when the value of imports of goods or services, primary and secondary income exceeds the value of exports (1). Two marks for an accurate explanation of two reasons–e.g., low international competitiveness, (1) - if the country experiences strong domestic growth. (1) AO2 Analysis (max 3 marks) An explanation of why the government is likely to be concerned at about this deficit. For example, a current account deficit could lead to downward pressure on the exchange rate, making imports more expensive and potentially causing inflation (1). Persistent deficits may reduce confidence among foreign investors, limiting inflows of capital needed to finance growth (1). However, the government may not be concerned if the deficit is temporary or caused by for example, high investment imports that may boost future productive capacity (1) A max of 2 marks for either perspective. AO3 Evaluation (max 2 marks) An assessment of the extent that the government is likely to be concerned. For example, the level of concern will depend on the size, duration and cause of the deficit and how it is financed (1). AO1 Knowledge and understanding 3 AO2 Analysis 3 AO3 Evaluation 2 5(b) Assess whether it is better to use protectionist policies or 12 contractionary policies to reduce a deficit on the current account of the balance of payments. Use Table A: AO1 Knowledge and understanding and AO2 Analysis and Table B: AO3 Evaluation to mark candidate responses to this question. AO1 and AO2 out of 8 marks. AO3 out of 4 marks. Indicative content Responses may include: AO1 Knowledge and understanding and AO2 Analysis Possible reasons why protectionist policies are the best way to reduce a deficit on the current account of the balance of payments. • They may reduce the value of imports, which helps to lower the current account deficit by limiting the outflow of money from the economy. • They may protect domestic industries from foreign competition, allowing local firms to grow and potentially increase exports in the future. However • They can raise prices for consumers, as tariffs or quotas make imported goods more expensive, reducing consumer welfare. • Other countries may retaliate with their own trade barriers, which could reduce exports and harm the economy further. Possible reasons why contractionary policies are the best way to reduce a deficit on the current account of the balance of payments. • They can reduce domestic demand, which lowers imports and helps decrease the current account deficit. • They may help control inflation by reducing spending in the economy, which can stabilise the exchange rate and make exports more competitive. However • They can slow economic growth and increase unemployment, as lower demand reduces output in domestic industries. • They may reduce consumer and business confidence, which can further decrease spending and investment, worsening the economic slowdown. Guidance: The assessment of both perspectives must be in the context of the reducing a current account deficit and not a general explanation of both policies. Level 1 responses will be assertive and lacking in explanations / mainly descriptive and/or or mainly lacking in relevance to the question. 5(b) Level 2 responses may contain some inaccuracies and may be one sided. Analysis will be explained at least in part and will be largely relevant to the question. Level 3 responses will consider alternative policies / concepts etc. and will be balanced. Explanations of points raised will be offered and will be accurate and relevant to the question. AO3 Evaluation Requires an assessment of whether it is better to use protectionist policies or contractionary policies to reduce a deficit on the current account of the balance of payments. For example–Protectionist policies may work more quickly to reduce imports and protect domestic industries, but they risk retaliation from other countries and higher prices for consumers. Alternatively, contractionary policies may take longer to reduce the deficit but may help control inflation, though they may slow economic growth and increase unemployment. Accept all valid responses. A one-sided response cannot gain any marks for evaluation. Accept all valid responses. AO1 Knowledge and understanding and AO2 Analysis 8 AO3 Evaluation 4
More questions on Policies to correct imbalances in the current account of the balance of payments
What was in this paper
The subtopics covered by these 5 questions, and how many questions each got. Open one in a new tab to see every Cambridge question on it.
1Equity and redistribution of income and wealth1Government policies to achieve efficient resource allocation and correct market failure1Methods and effects of government intervention in markets1Policies to correct imbalances in the current account of the balance of payments1What you needed in this session
Cambridge’s own grade thresholds for 2025 Oct/Nov, Paper 2 · Variant 3. A higher threshold means an easier paper — the bar moves with how the cohort did.