Cambridge A Level Economics 9708 — 2025 Oct/Nov Paper 2 · Variant 2
9708/22/O/N/25 · 5 questions · 60 marks · ≈68 min
The question paper and its mark scheme, free to read here and free to download. This is Cambridge’s own paper, exactly as it was sat.
Question paper4 pages
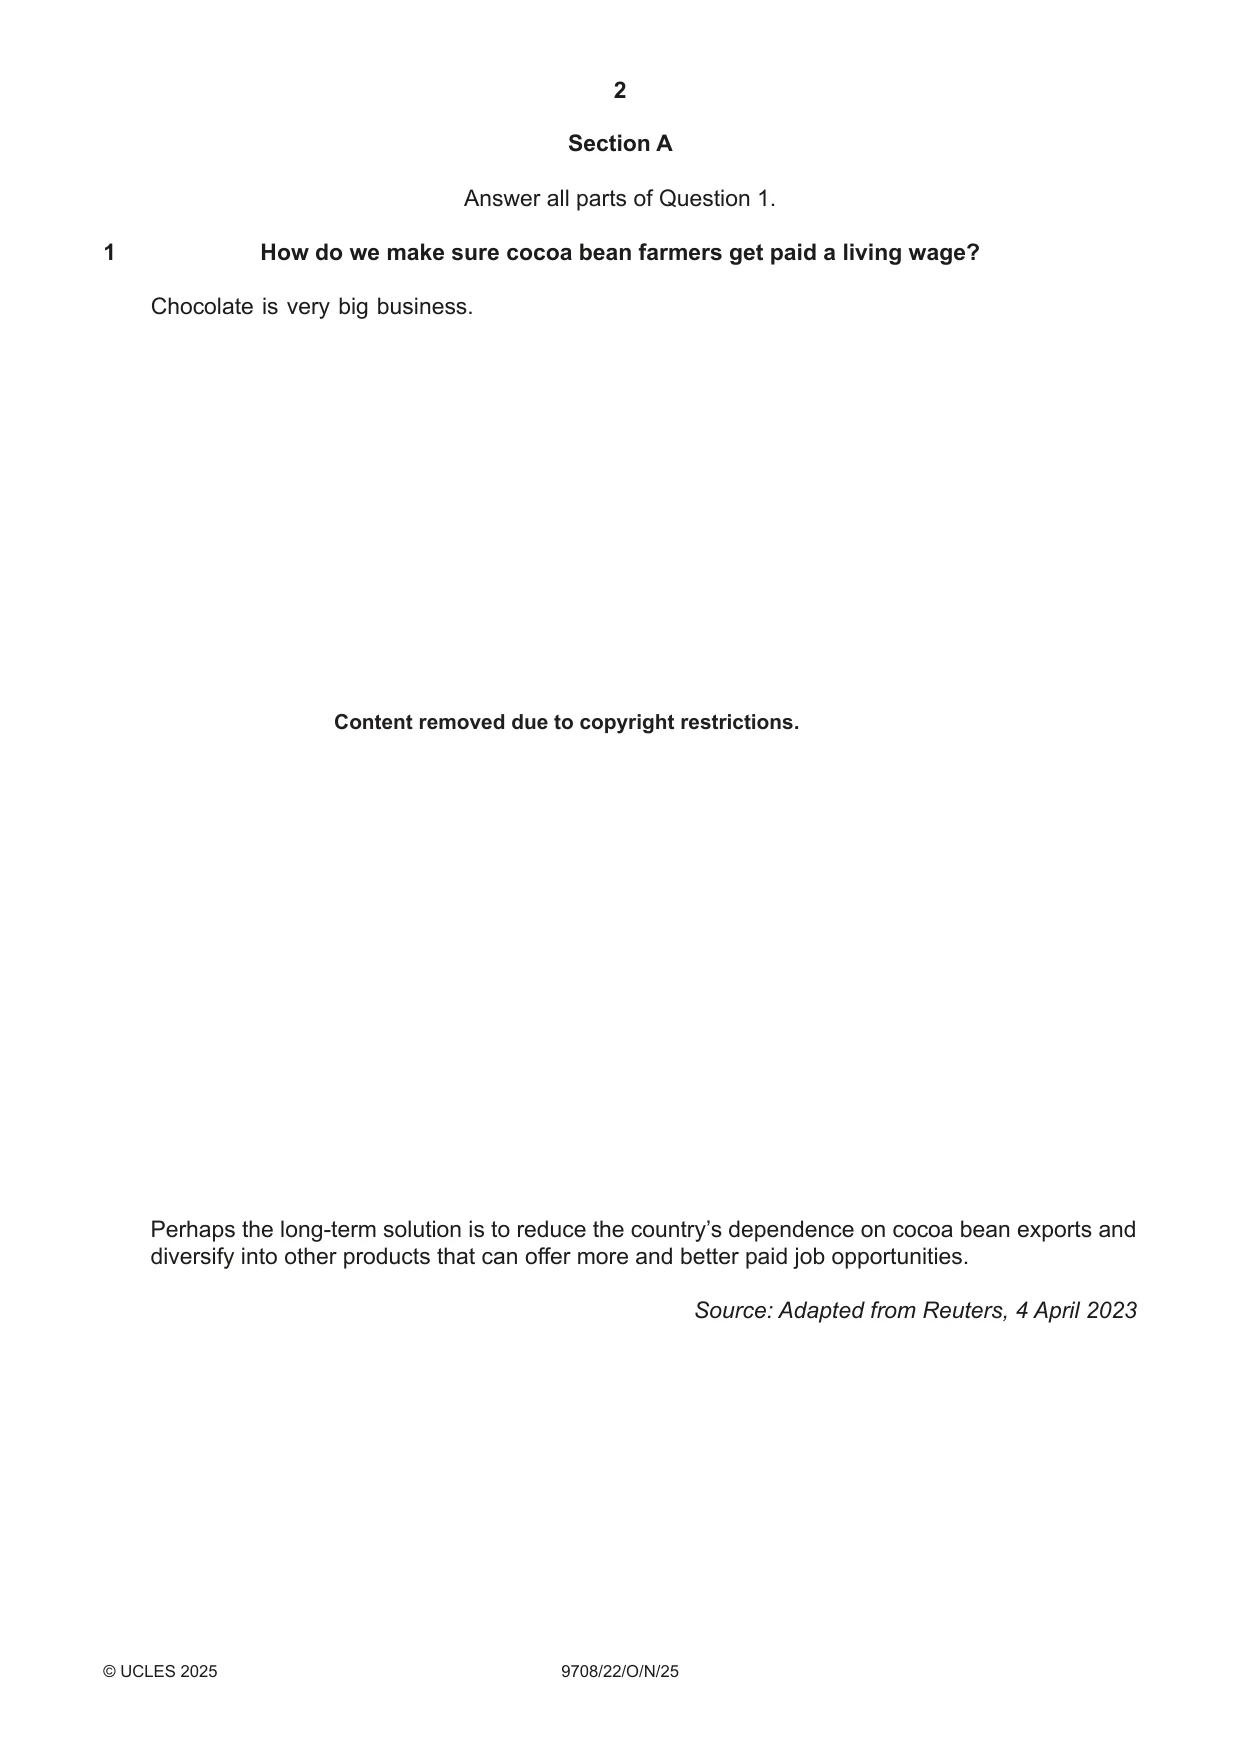
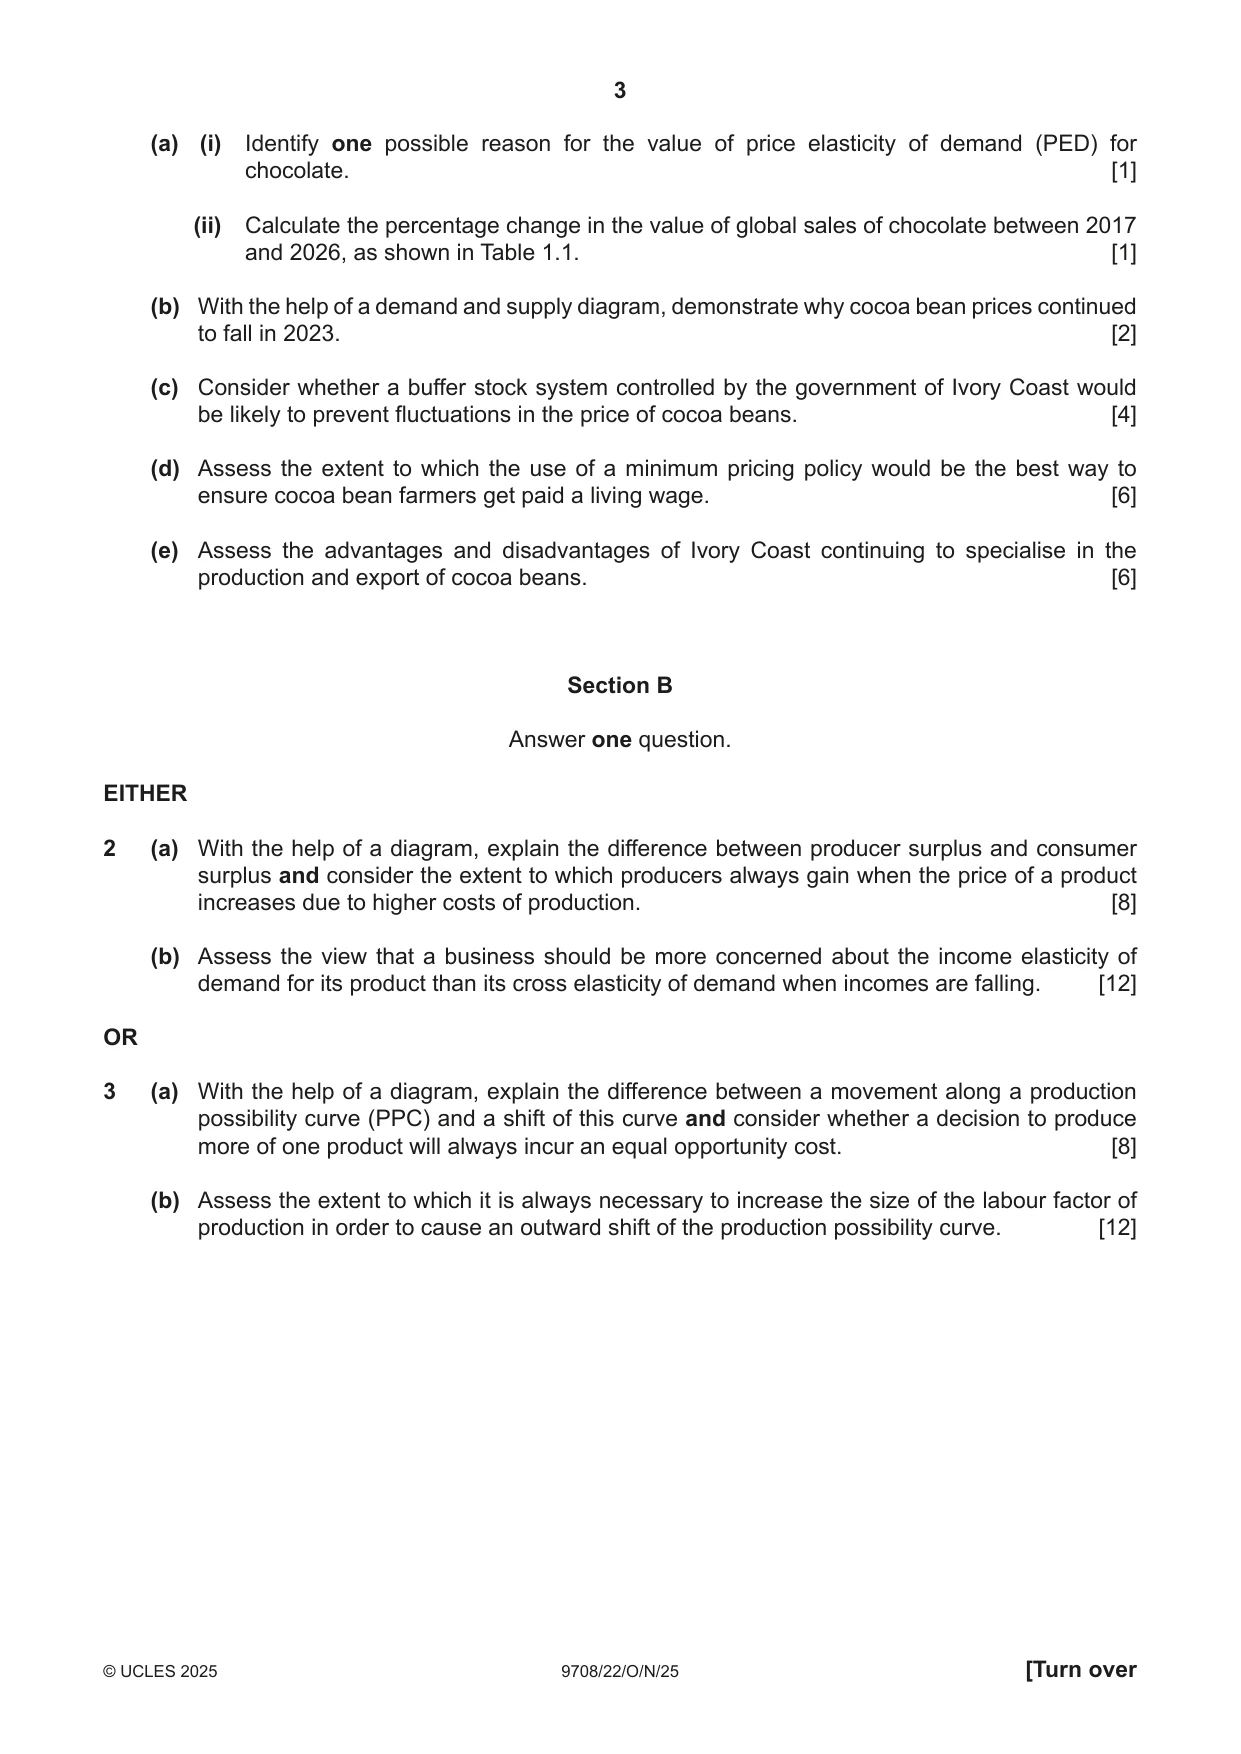
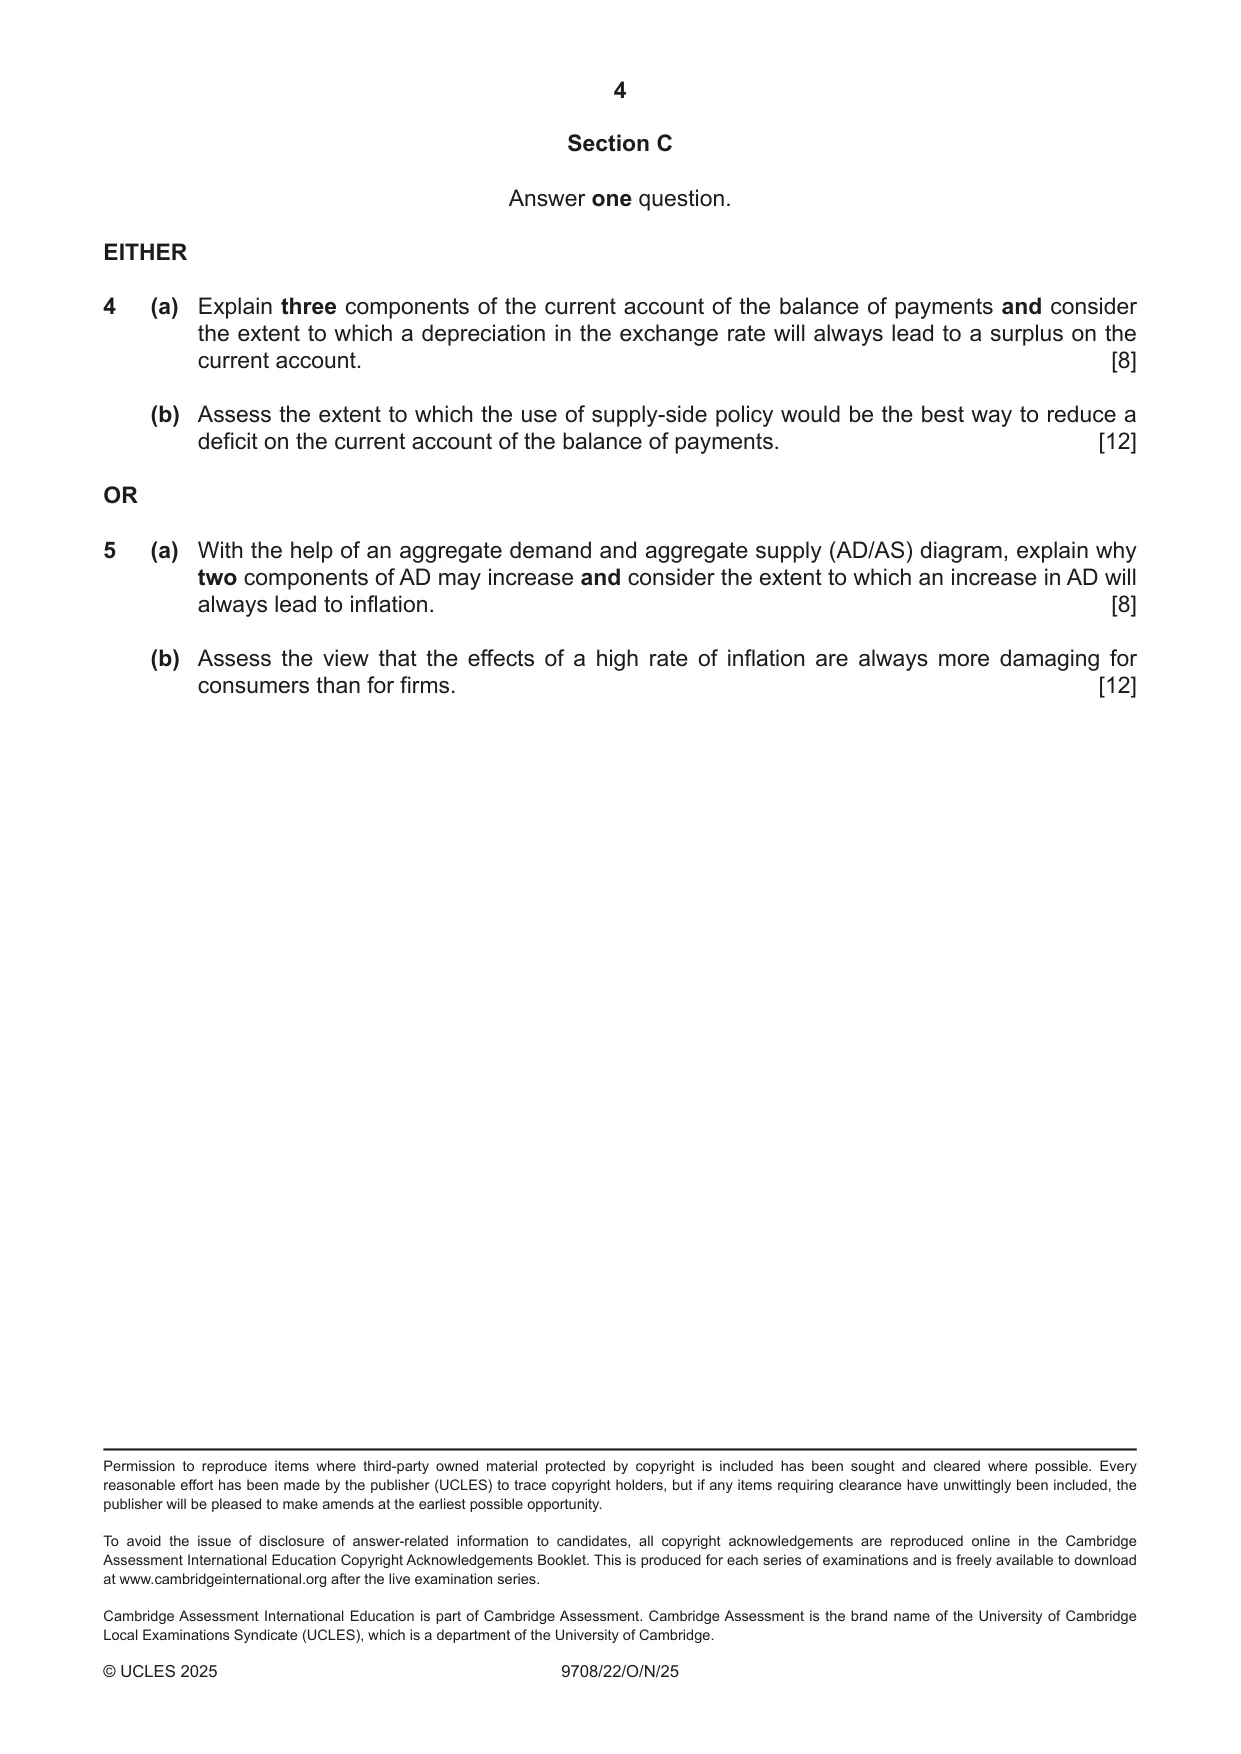
Mark scheme25 pages
Answers below. Sit the paper first if you are practising.
Questions as text
Q1 · How do we make sure cocoa bean farmers get paid a living wage?
1 How do we make sure cocoa bean farmers get paid a living wage? Chocolate is very big business. Content removed due to copyright restrictions. Perhaps the long-term solution is to reduce the country’s dependence on cocoa bean exports and diversify into other products that can offer more and better paid job opportunities. Source: Adapted from Reuters, 4 April 2023 (a) (i) Identify one possible reason for the value of price elasticity of demand (PED) for chocolate. [1] (ii) Calculate the percentage change in the value of global sales of chocolate between 2017 and 2026, as shown in Table 1.1. [1] (b) With the help of a demand and supply diagram, demonstrate why cocoa bean prices continued to fall in 2023. [2] (c) Consider whether a buffer stock system controlled by the government of Ivory Coast would be likely to prevent fluctuations in the price of cocoa beans. [4] (d) Assess the extent to which the use of a minimum pricing policy would be the best way to ensure cocoa bean farmers get paid a living wage. [6] (e) Assess the advantages and disadvantages of Ivory Coast continuing to specialise in the production and export of cocoa beans. [6]
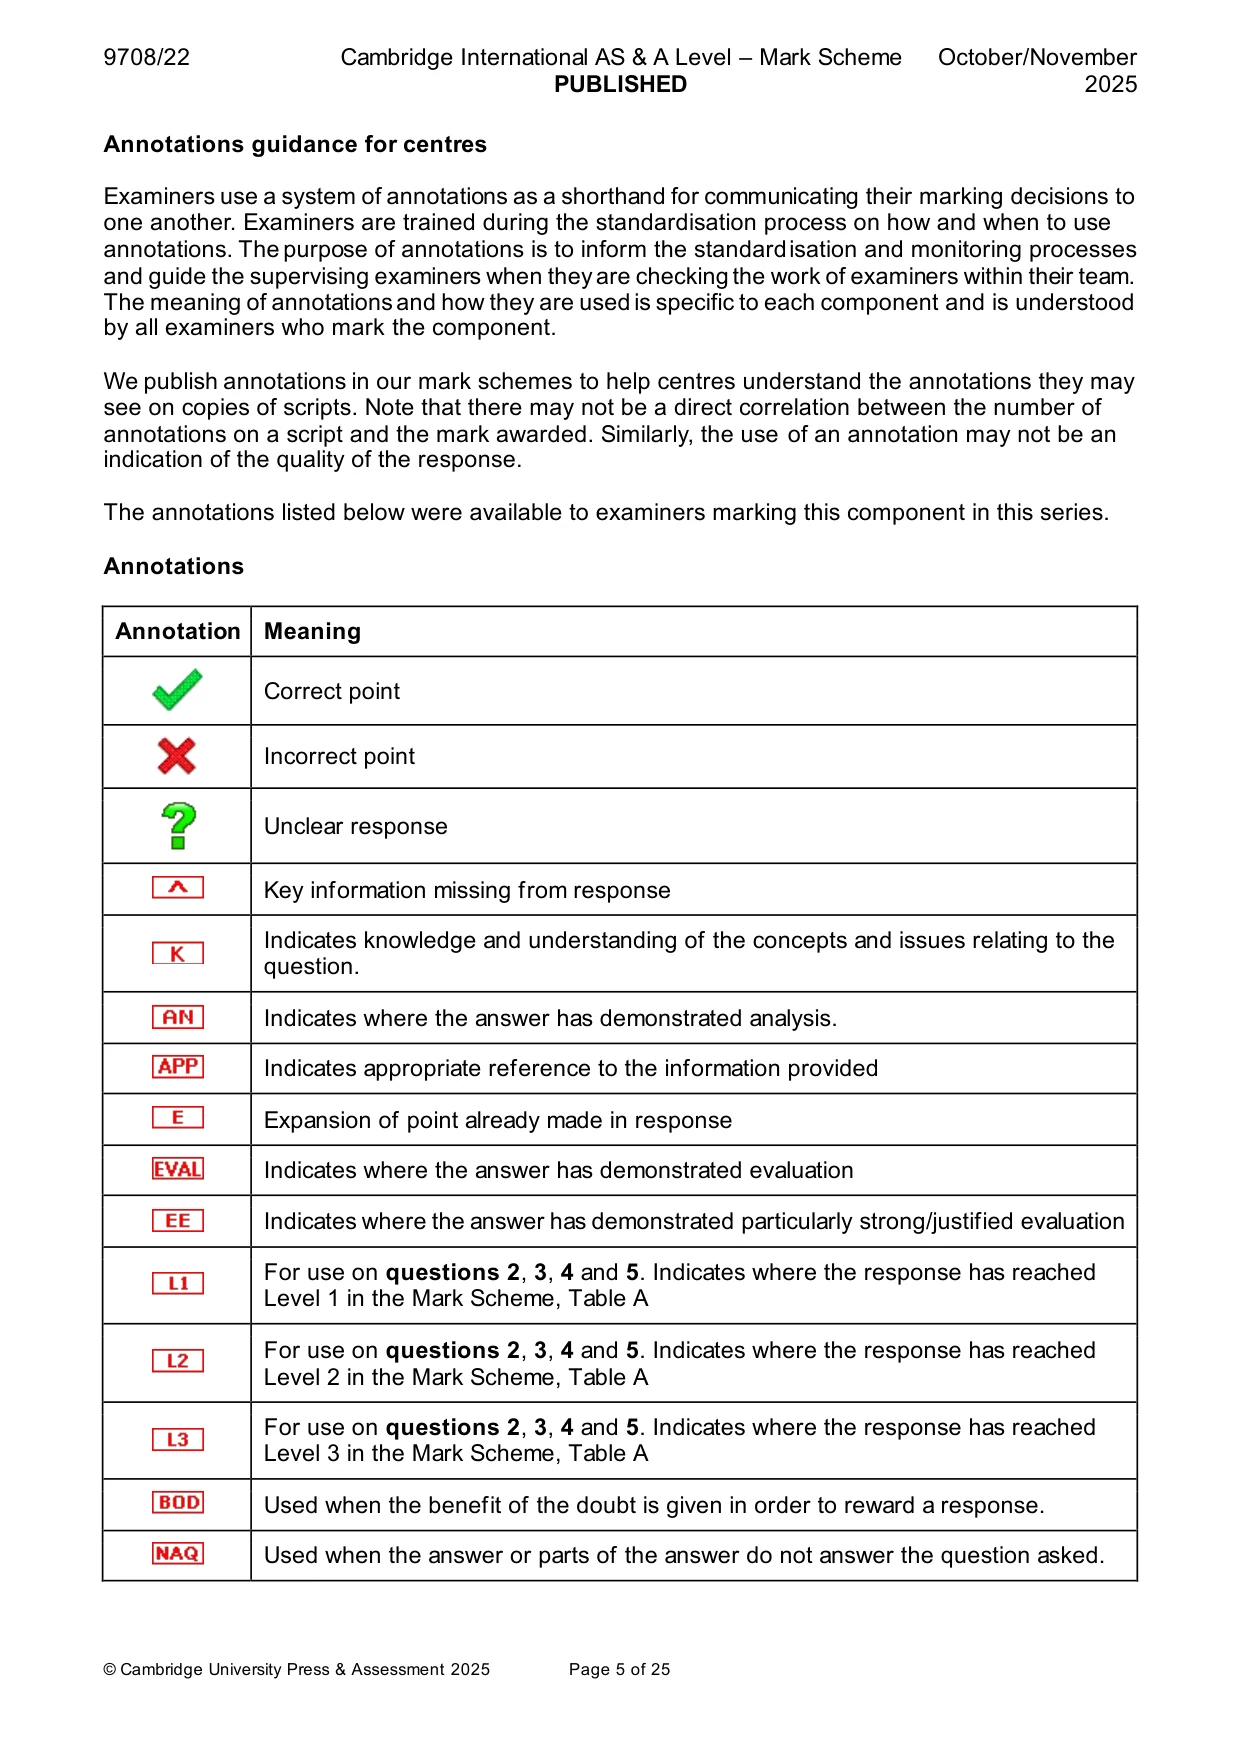
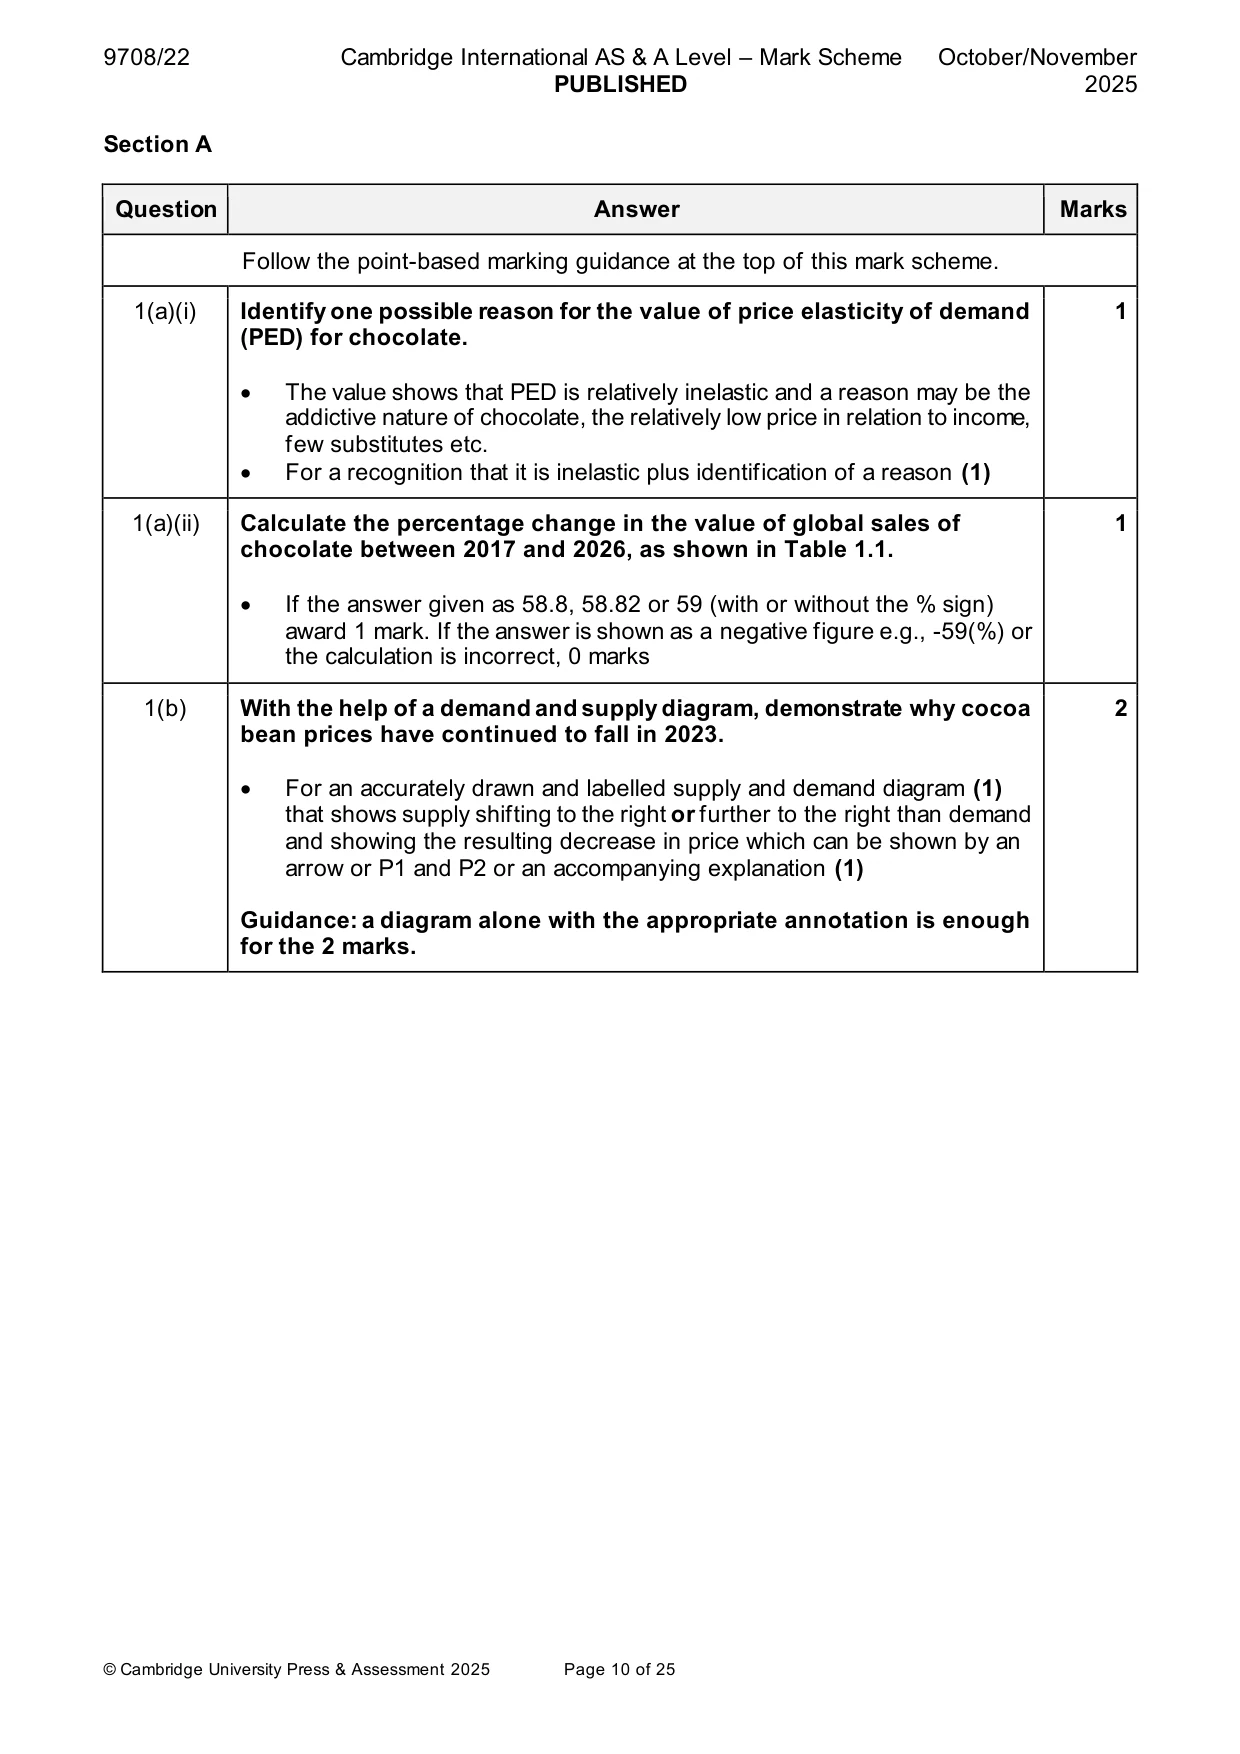
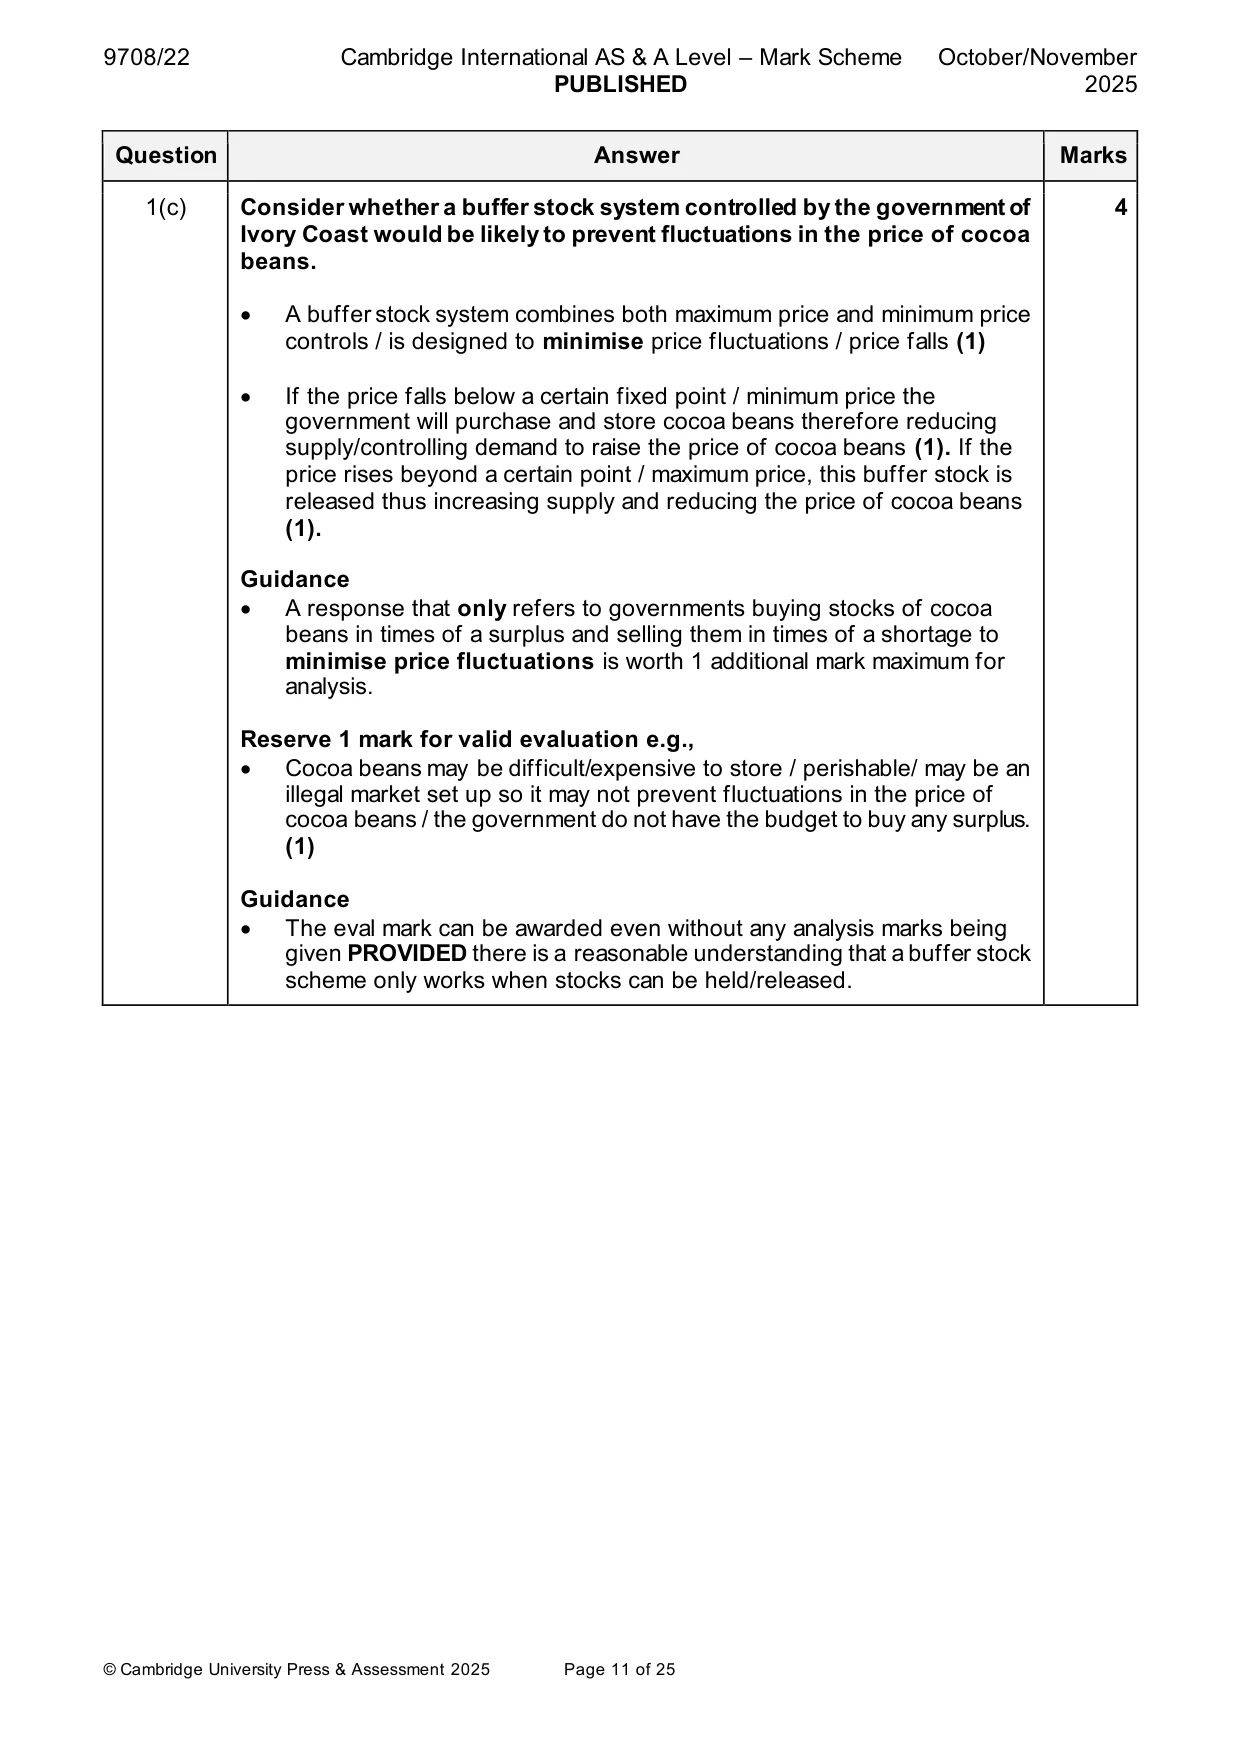
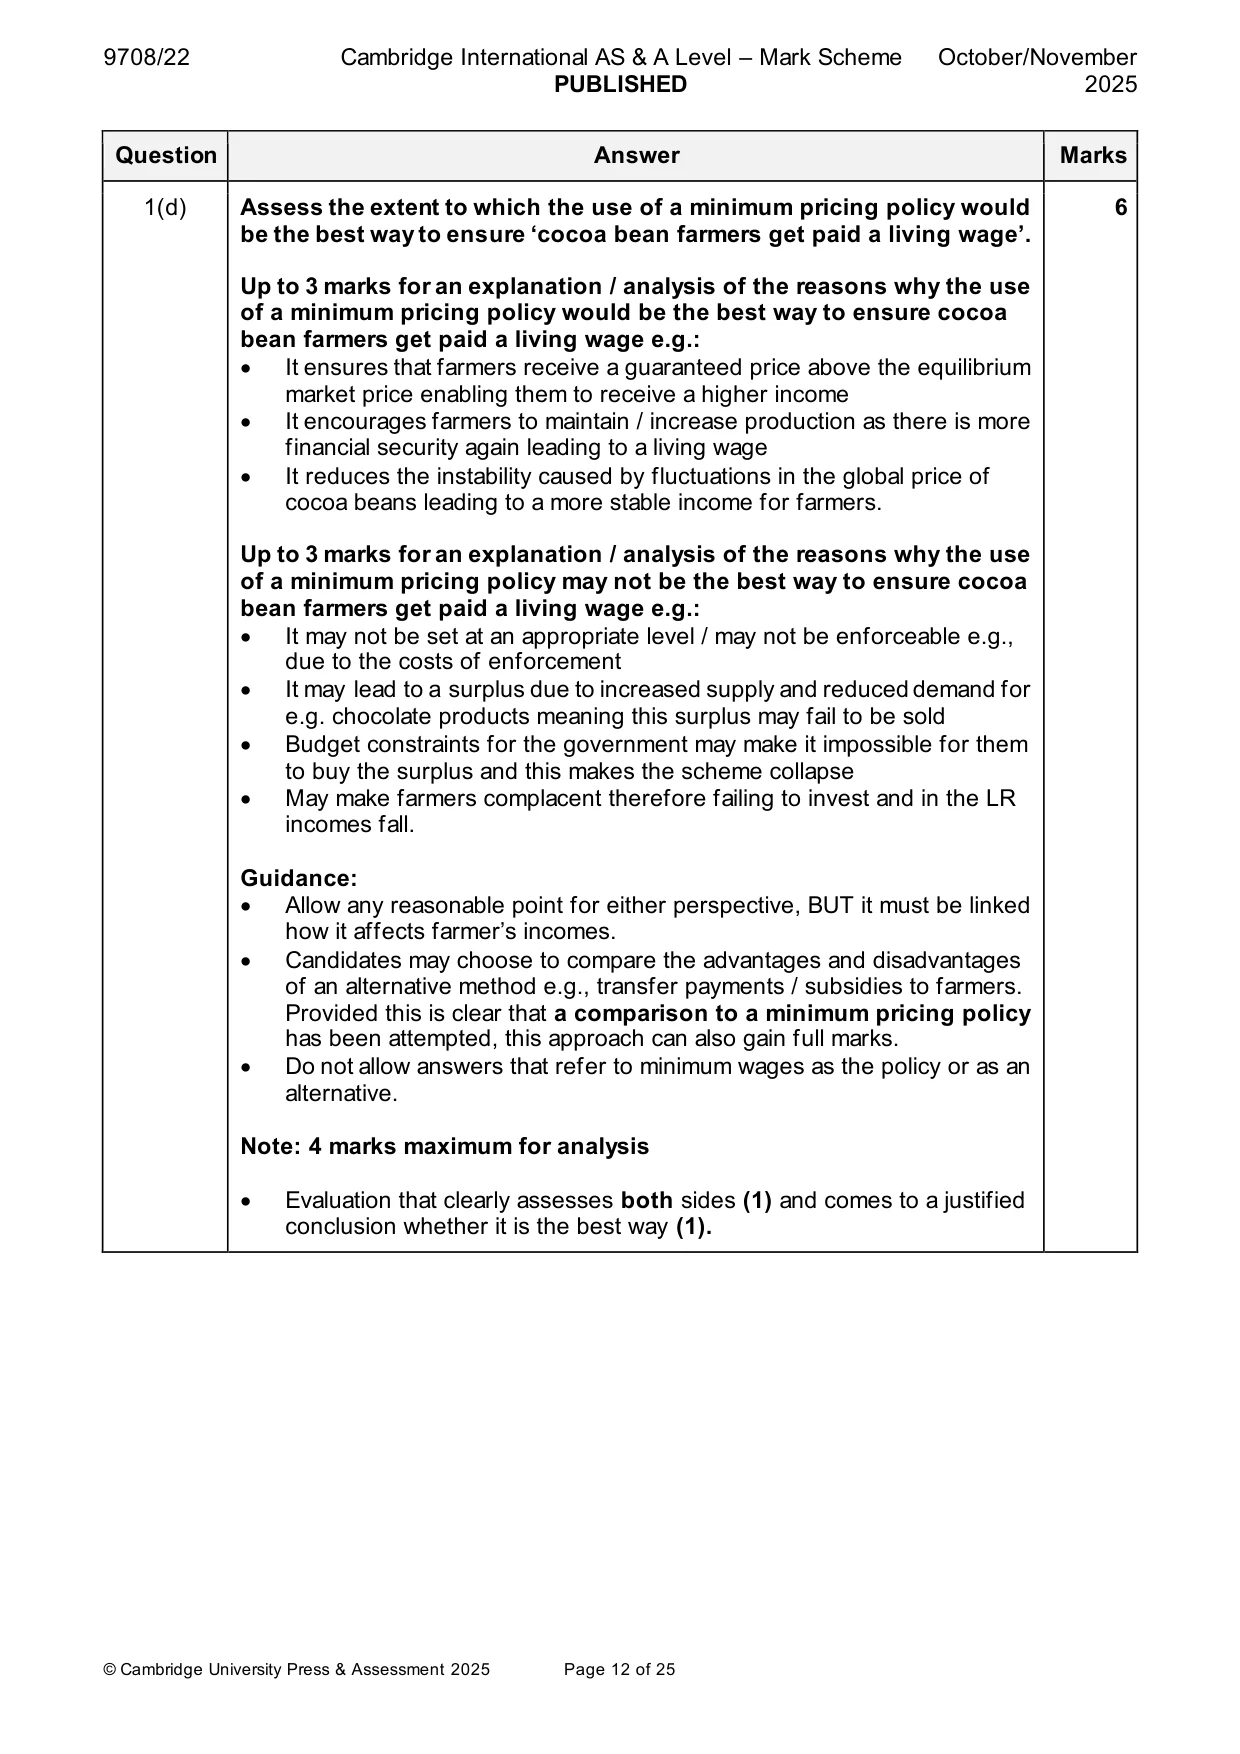
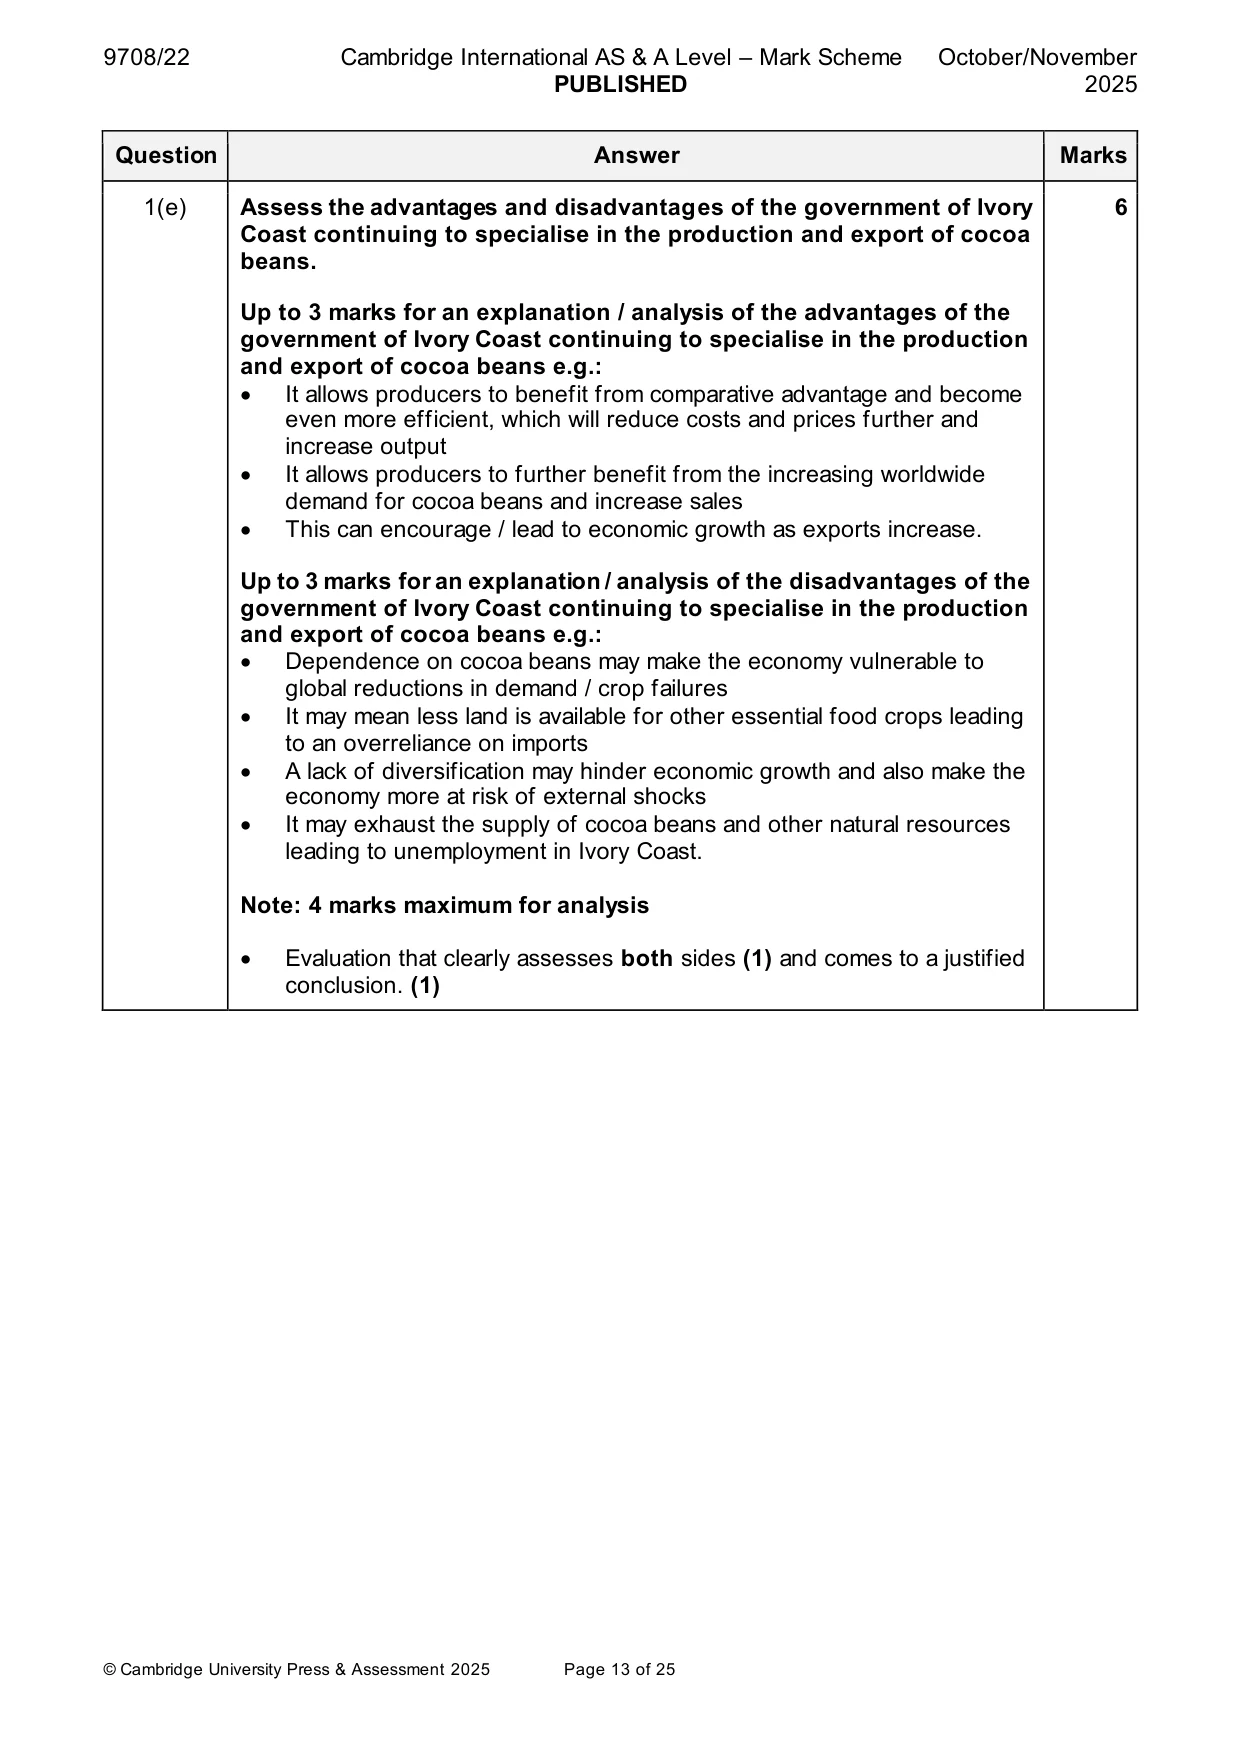
Mark scheme: Question Answer Marks Follow the point-based marking guidance at the top of this mark scheme. 1(a)(i) Identify one possible reason for the value of price elasticity of demand 1 (PED) for chocolate. • The value shows that PED is relatively inelastic and a reason may be the addictive nature of chocolate, the relatively low price in relation to income, few substitutes etc. • For a recognition that it is inelastic plus identification of a reason (1) 1(a)(ii) Calculate the percentage change in the value of global sales of 1 chocolate between 2017 and 2026, as shown in Table 1.1. • If the answer given as 58.8, 58.82 or 59 (with or without the % sign) award 1 mark. If the answer is shown as a negative figure e.g., -59(%) or the calculation is incorrect, 0 marks 1(b) With the help of a demand and supply diagram, demonstrate why cocoa 2 bean prices have continued to fall in 2023. • For an accurately drawn and labelled supply and demand diagram (1) that shows supply shifting to the right or further to the right than demand and showing the resulting decrease in price which can be shown by an arrow or P1 and P2 or an accompanying explanation (1) Guidance: a diagram alone with the appropriate annotation is enough for the 2 marks. 1(c) Consider whether a buffer stock system controlled by the government of 4 Ivory Coast would be likely to prevent fluctuations in the price of cocoa beans. • A buffer stock system combines both maximum price and minimum price controls / is designed to minimise price fluctuations / price falls (1) • If the price falls below a certain fixed point / minimum price the government will purchase and store cocoa beans therefore reducing supply/controlling demand to raise the price of cocoa beans (1). If the price rises beyond a certain point / maximum price, this buffer stock is released thus increasing supply and reducing the price of cocoa beans (1). Guidance • A response that only refers to governments buying stocks of cocoa beans in times of a surplus and selling them in times of a shortage to minimise price fluctuations is worth 1 additional mark maximum for analysis. Reserve 1 mark for valid evaluation e.g., • Cocoa beans may be difficult/expensive to store / perishable/ may be an illegal market set up so it may not prevent fluctuations in the price of cocoa beans / the government do not have the budget to buy any surplus. (1) Guidance • The eval mark can be awarded even without any analysis marks being given PROVIDED there is a reasonable understanding that a buffer stock scheme only works when stocks can be held/released. 1(d) Assess the extent to which the use of a minimum pricing policy would 6 be the best way to ensure ‘cocoa bean farmers get paid a living wage’. Up to 3 marks for an explanation / analysis of the reasons why the use of a minimum pricing policy would be the best way to ensure cocoa bean farmers get paid a living wage e.g.: • It ensures that farmers receive a guaranteed price above the equilibrium market price enabling them to receive a higher income • It encourages farmers to maintain / increase production as there is more financial security again leading to a living wage • It reduces the instability caused by fluctuations in the global price of cocoa beans leading to a more stable income for farmers. Up to 3 marks for an explanation / analysis of the reasons why the use of a minimum pricing policy may not be the best way to ensure cocoa bean farmers get paid a living wage e.g.: • It may not be set at an appropriate level / may not be enforceable e.g., due to the costs of enforcement • It may lead to a surplus due to increased supply and reduced demand for e.g. chocolate products meaning this surplus may fail to be sold • Budget constraints for the government may make it impossible for them to buy the surplus and this makes the scheme collapse • May make farmers complacent therefore failing to invest and in the LR incomes fall. Guidance: • Allow any reasonable point for either perspective, BUT it must be linked how it affects farmer’s incomes. • Candidates may choose to compare the advantages and disadvantages of an alternative method e.g., transfer payments / subsidies to farmers. Provided this is clear that a comparison to a minimum pricing policy has been attempted, this approach can also gain full marks. • Do not allow answers that refer to minimum wages as the policy or as an alternative. Note: 4 marks maximum for analysis • Evaluation that clearly assesses both sides (1) and comes to a justified conclusion whether it is the best way (1). 1(e) Assess the advantages and disadvantages of the government of Ivory 6 Coast continuing to specialise in the production and export of cocoa beans. Up to 3 marks for an explanation / analysis of the advantages of the government of Ivory Coast continuing to specialise in the production and export of cocoa beans e.g.: • It allows producers to benefit from comparative advantage and become even more efficient, which will reduce costs and prices further and increase output • It allows producers to further benefit from the increasing worldwide demand for cocoa beans and increase sales • This can encourage / lead to economic growth as exports increase. Up to 3 marks for an explanation / analysis of the disadvantages of the government of Ivory Coast continuing to specialise in the production and export of cocoa beans e.g.: • Dependence on cocoa beans may make the economy vulnerable to global reductions in demand / crop failures • It may mean less land is available for other essential food crops leading to an overreliance on imports • A lack of diversification may hinder economic growth and also make the economy more at risk of external shocks • It may exhaust the supply of cocoa beans and other natural resources leading to unemployment in Ivory Coast. Note: 4 marks maximum for analysis • Evaluation that clearly assesses both sides (1) and comes to a justified conclusion. (1) Section B
More questions on Methods and effects of government intervention in markets
Q2 · With the help of a diagram, explain the difference between producer surplus and consumer…
2 (a) With the help of a diagram, explain the difference between producer surplus and consumer surplus and consider the extent to which producers always gain when the price of a product increases due to higher costs of production. [8] (b) Assess the view that a business should be more concerned about the income elasticity of demand for its product than its cross elasticity of demand when incomes are falling. [12] OR
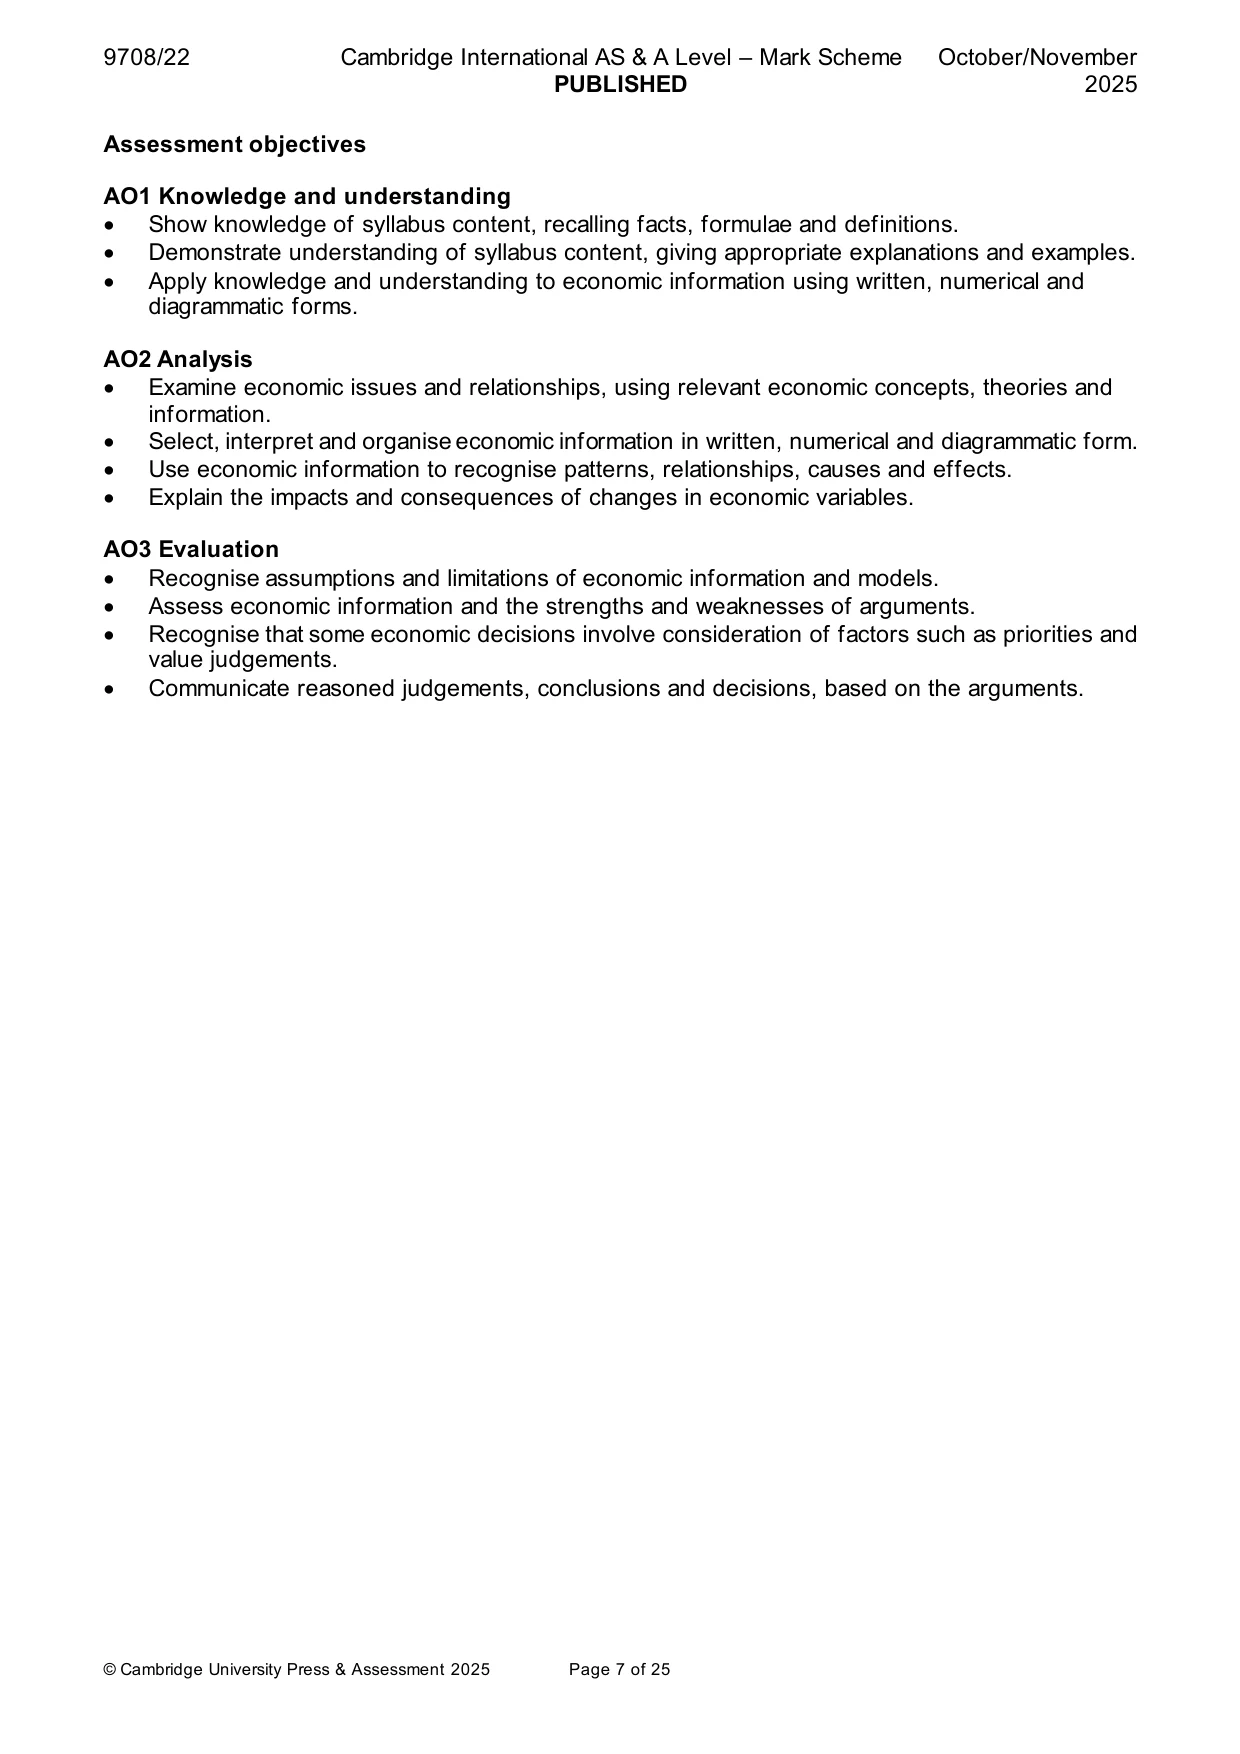
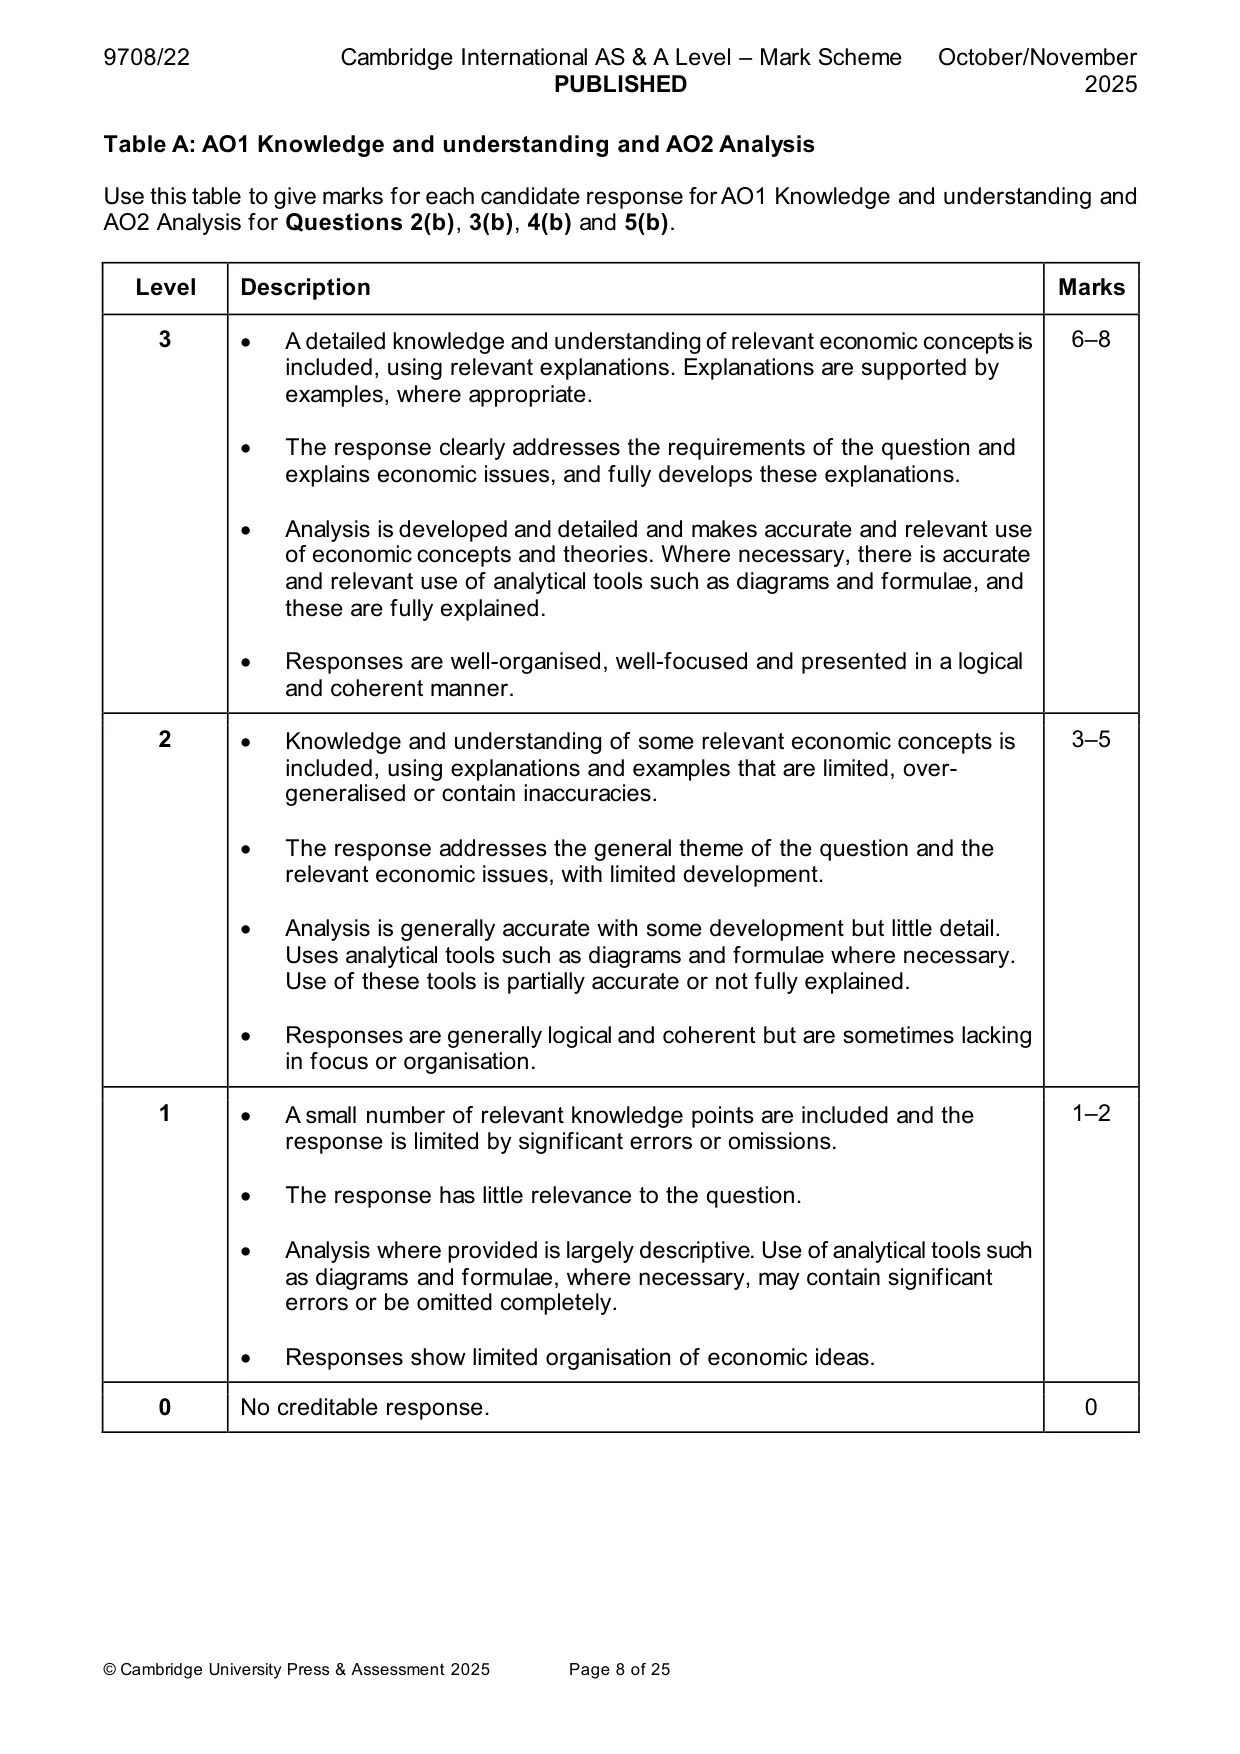
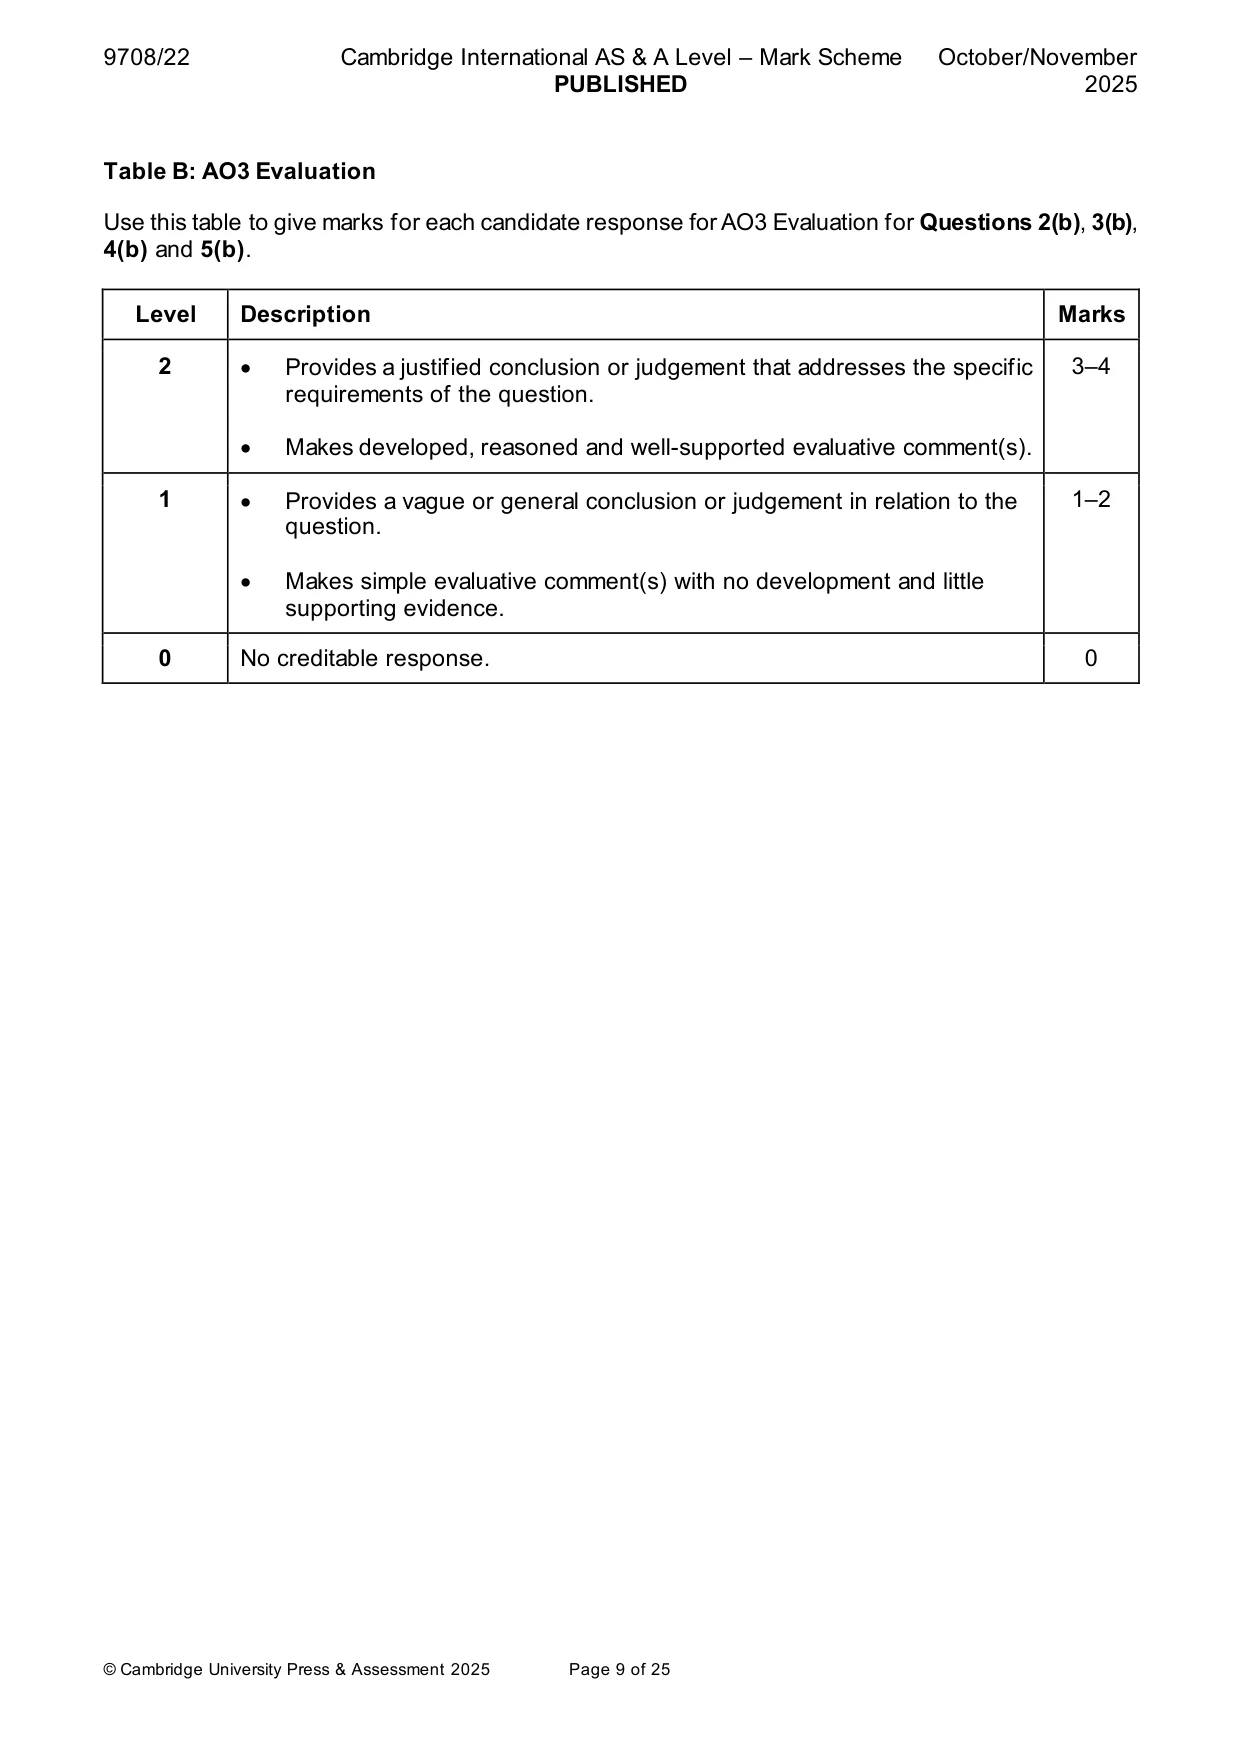
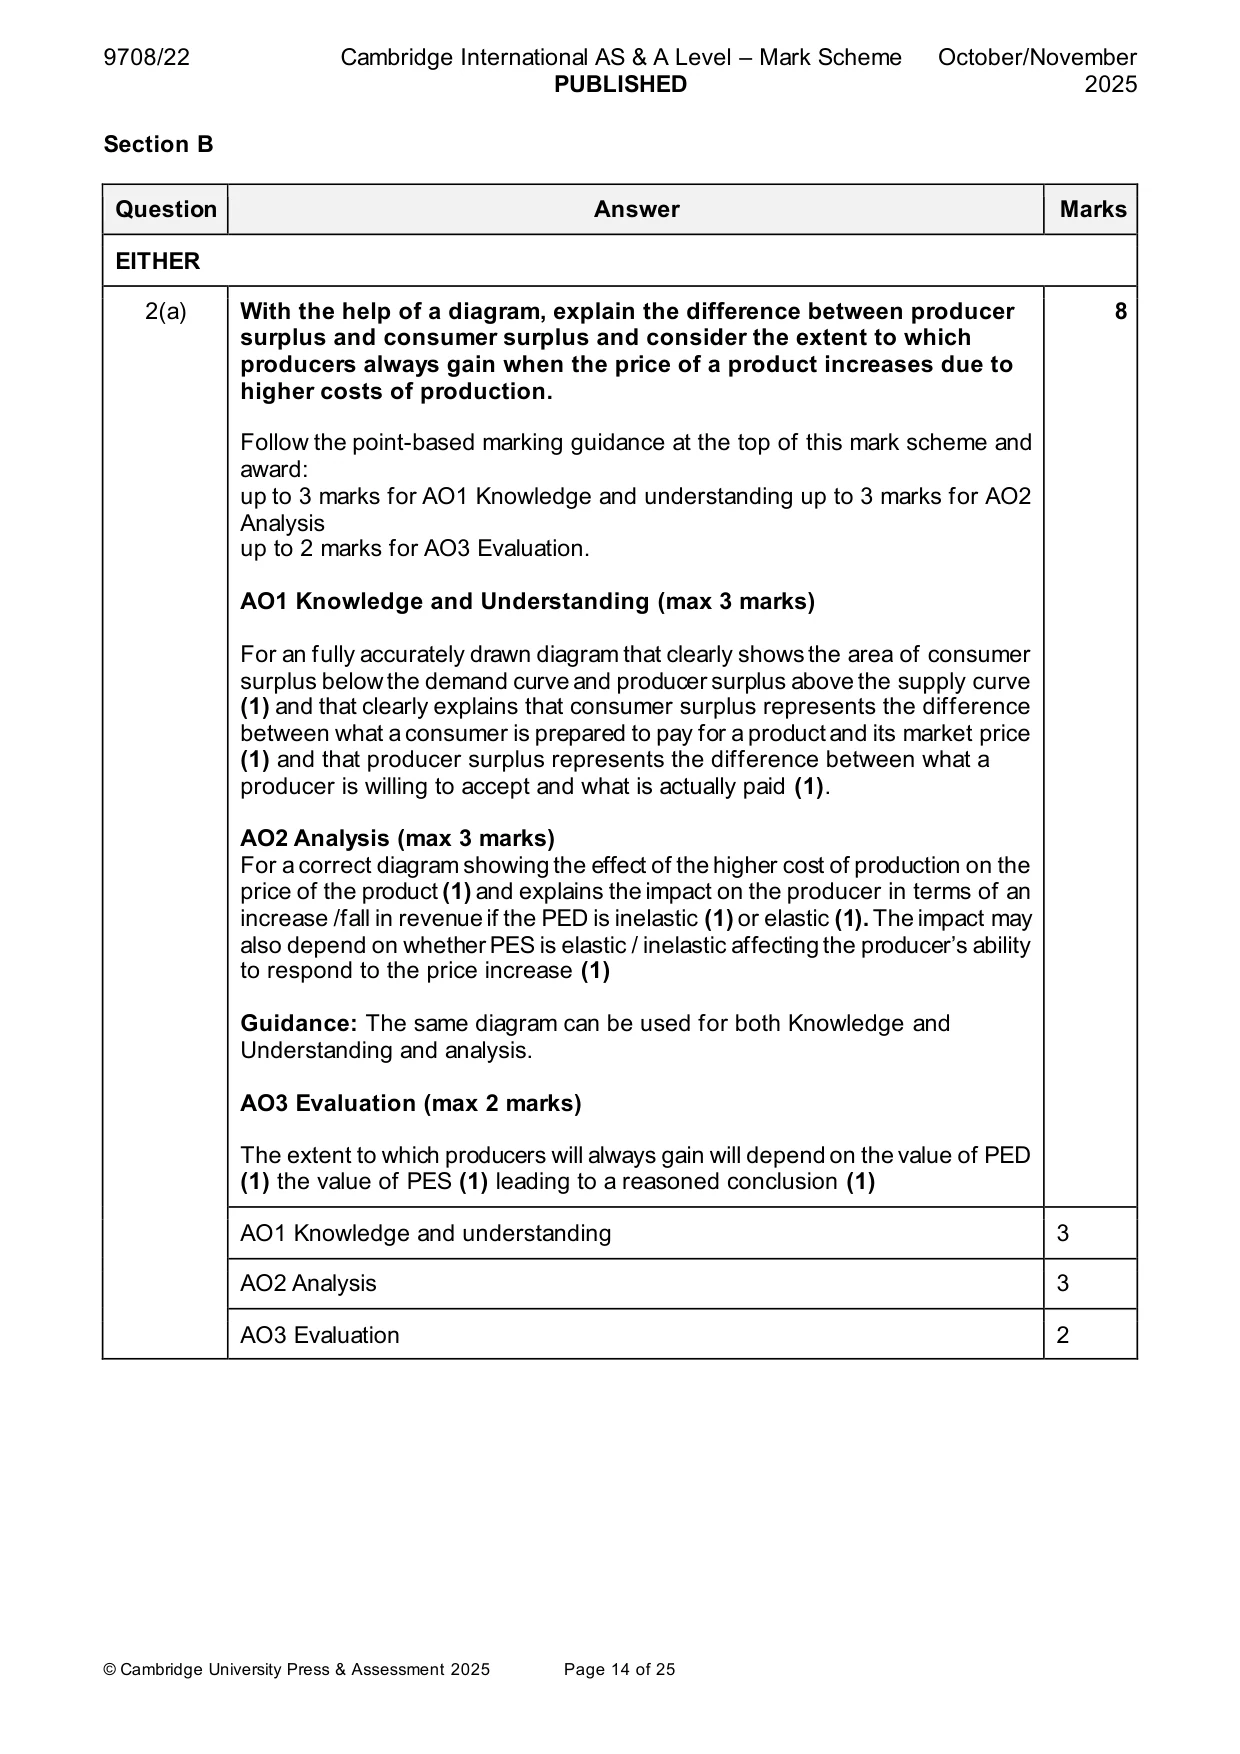
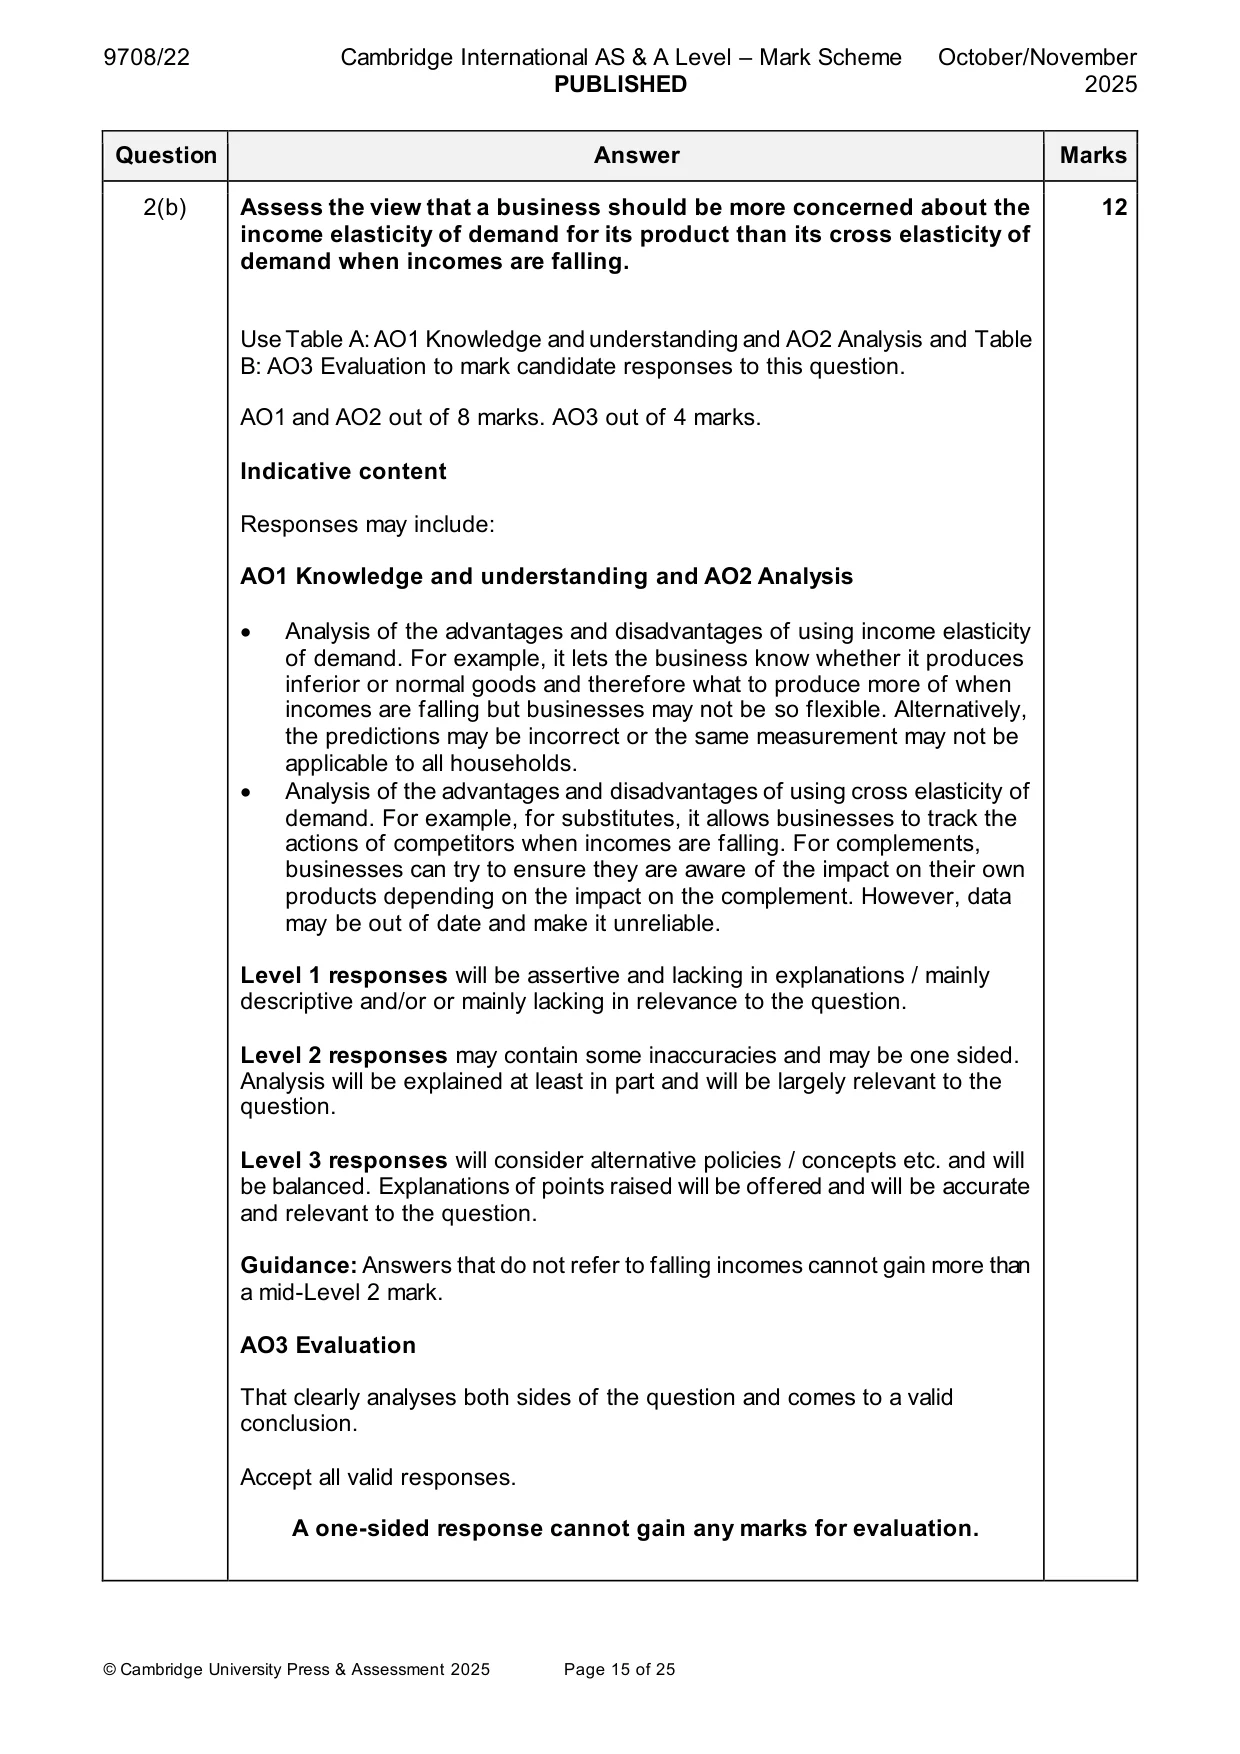
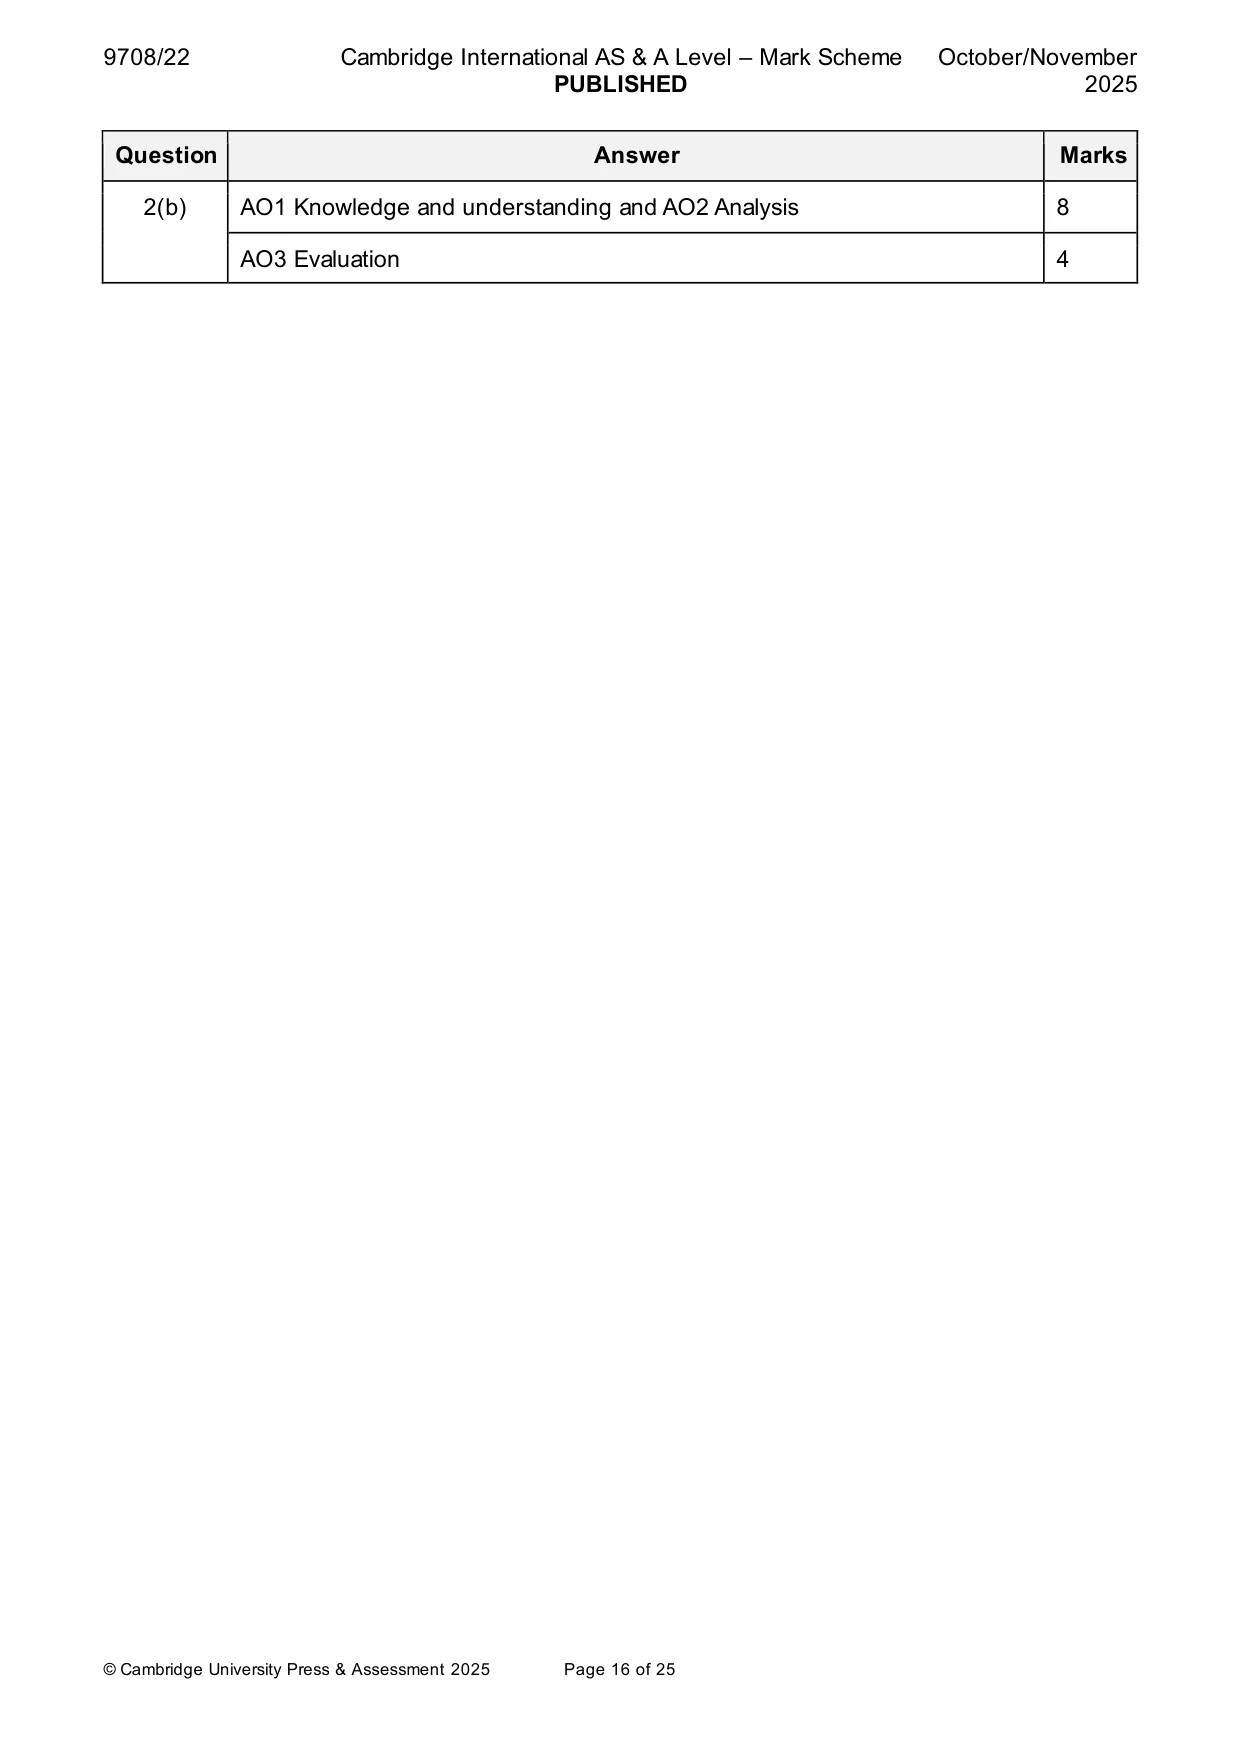
Mark scheme: 2(a) With the help of a diagram, explain the difference between producer 8 surplus and consumer surplus and consider the extent to which producers always gain when the price of a product increases due to higher costs of production. Follow the point-based marking guidance at the top of this mark scheme and award: up to 3 marks for AO1 Knowledge and understanding up to 3 marks for AO2 Analysis up to 2 marks for AO3 Evaluation. AO1 Knowledge and Understanding (max 3 marks) For an fully accurately drawn diagram that clearly shows the area of consumer surplus below the demand curve and producer surplus above the supply curve (1) and that clearly explains that consumer surplus represents the difference between what a consumer is prepared to pay for a product and its market price (1) and that producer surplus represents the difference between what a producer is willing to accept and what is actually paid (1). AO2 Analysis (max 3 marks) For a correct diagram showing the effect of the higher cost of production on the price of the product (1) and explains the impact on the producer in terms of an increase /fall in revenue if the PED is inelastic (1) or elastic (1). The impact may also depend on whether PES is elastic / inelastic affecting the producer’s ability to respond to the price increase (1) Guidance: The same diagram can be used for both Knowledge and Understanding and analysis. AO3 Evaluation (max 2 marks) The extent to which producers will always gain will depend on the value of PED (1) the value of PES (1) leading to a reasoned conclusion (1) AO1 Knowledge and understanding 3 AO2 Analysis 3 AO3 Evaluation 2 2(b) Assess the view that a business should be more concerned about the 12 income elasticity of demand for its product than its cross elasticity of demand when incomes are falling. Use Table A: AO1 Knowledge and understanding and AO2 Analysis and Table B: AO3 Evaluation to mark candidate responses to this question. AO1 and AO2 out of 8 marks. AO3 out of 4 marks. Indicative content Responses may include: AO1 Knowledge and understanding and AO2 Analysis • Analysis of the advantages and disadvantages of using income elasticity of demand. For example, it lets the business know whether it produces inferior or normal goods and therefore what to produce more of when incomes are falling but businesses may not be so flexible. Alternatively, the predictions may be incorrect or the same measurement may not be applicable to all households. • Analysis of the advantages and disadvantages of using cross elasticity of demand. For example, for substitutes, it allows businesses to track the actions of competitors when incomes are falling. For complements, businesses can try to ensure they are aware of the impact on their own products depending on the impact on the complement. However, data may be out of date and make it unreliable. Level 1 responses will be assertive and lacking in explanations / mainly descriptive and/or or mainly lacking in relevance to the question. Level 2 responses may contain some inaccuracies and may be one sided. Analysis will be explained at least in part and will be largely relevant to the question. Level 3 responses will consider alternative policies / concepts etc. and will be balanced. Explanations of points raised will be offered and will be accurate and relevant to the question. Guidance: Answers that do not refer to falling incomes cannot gain more than a mid-Level 2 mark. AO3 Evaluation That clearly analyses both sides of the question and comes to a valid conclusion. Accept all valid responses. A one-sided response cannot gain any marks for evaluation. 2(b) AO1 Knowledge and understanding and AO2 Analysis 8 AO3 Evaluation 4
More questions on Price elasticity, income elasticity and cross elasticity of demand
Q3 · With the help of a diagram, explain the difference between a movement along a production…
3 (a) With the help of a diagram, explain the difference between a movement along a production possibility curve (PPC) and a shift of this curve and consider whether a decision to produce more of one product will always incur an equal opportunity cost. [8] (b) Assess the extent to which it is always necessary to increase the size of the labour factor of production in order to cause an outward shift of the production possibility curve. [12] Section C Answer one question. EITHER
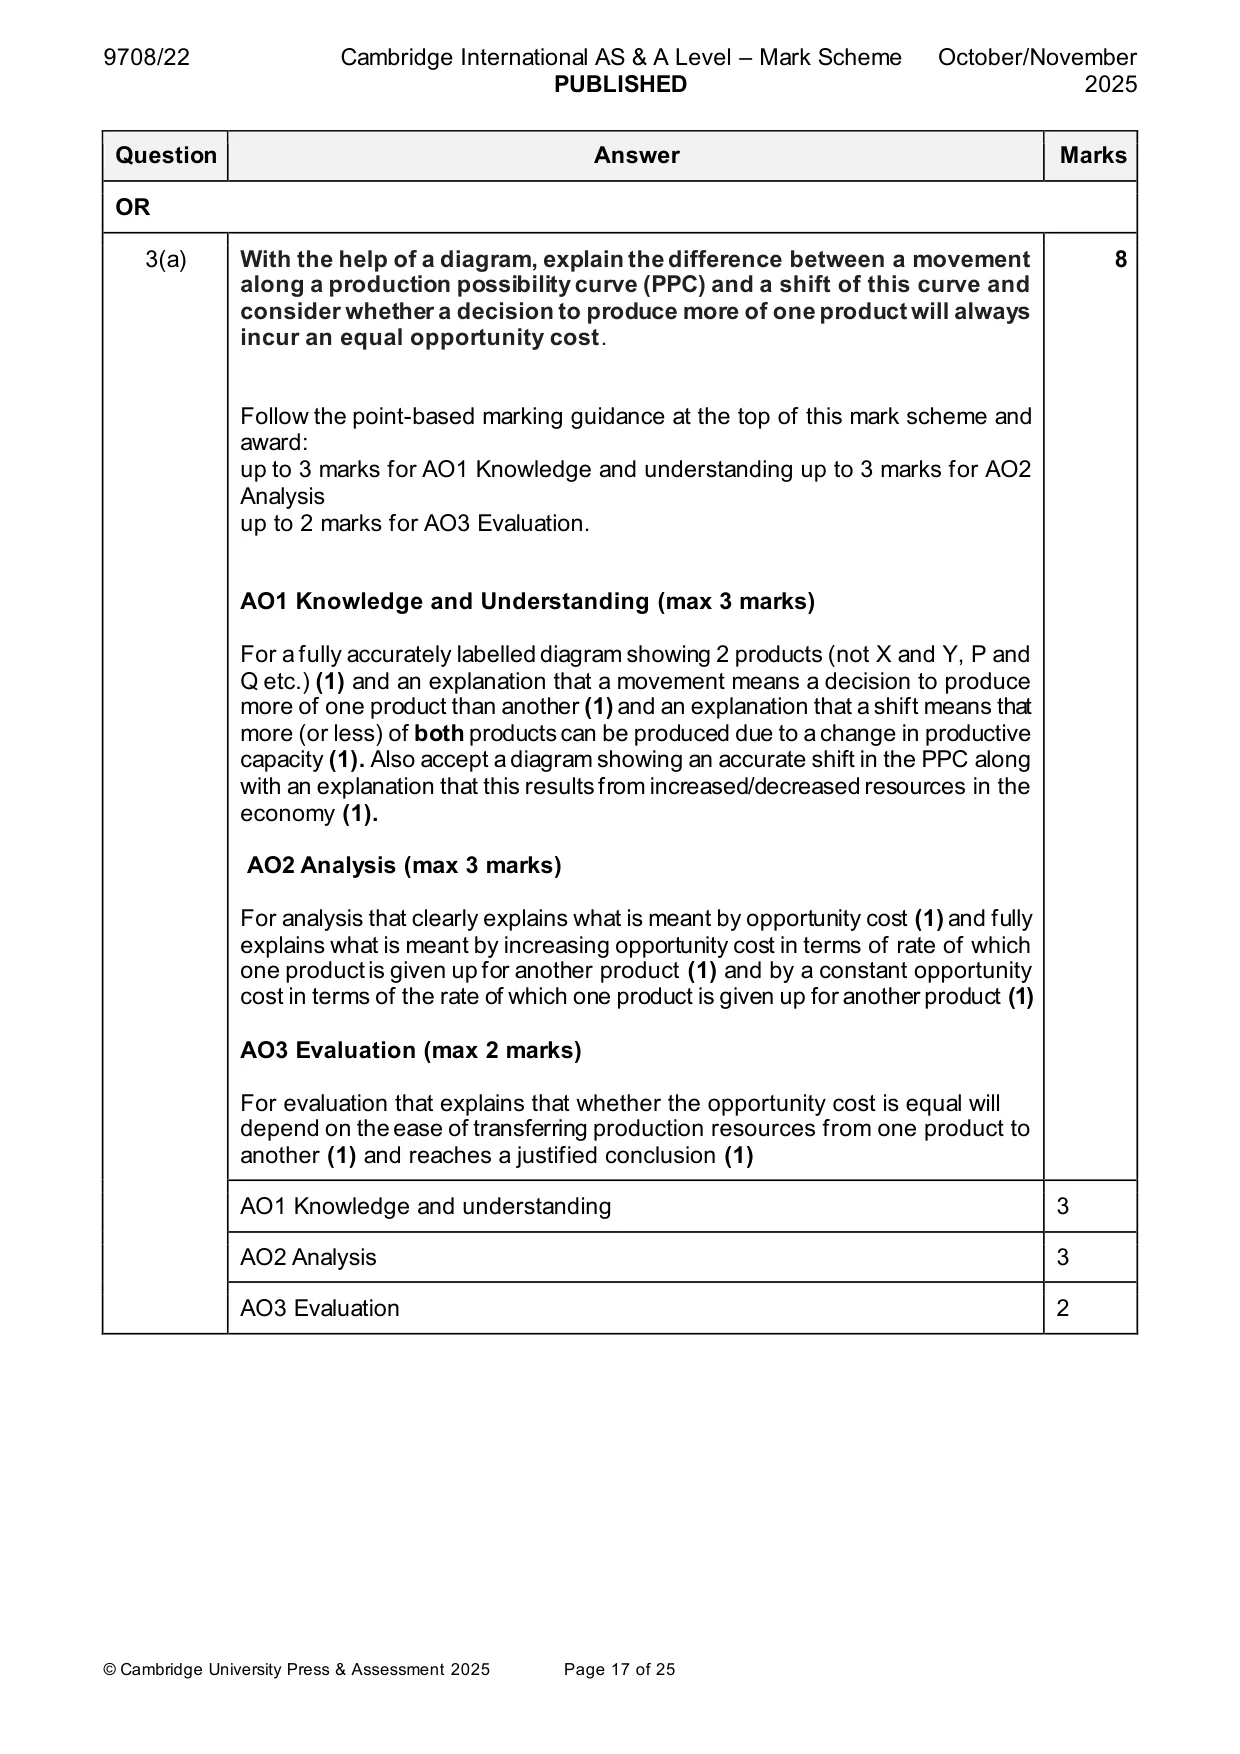
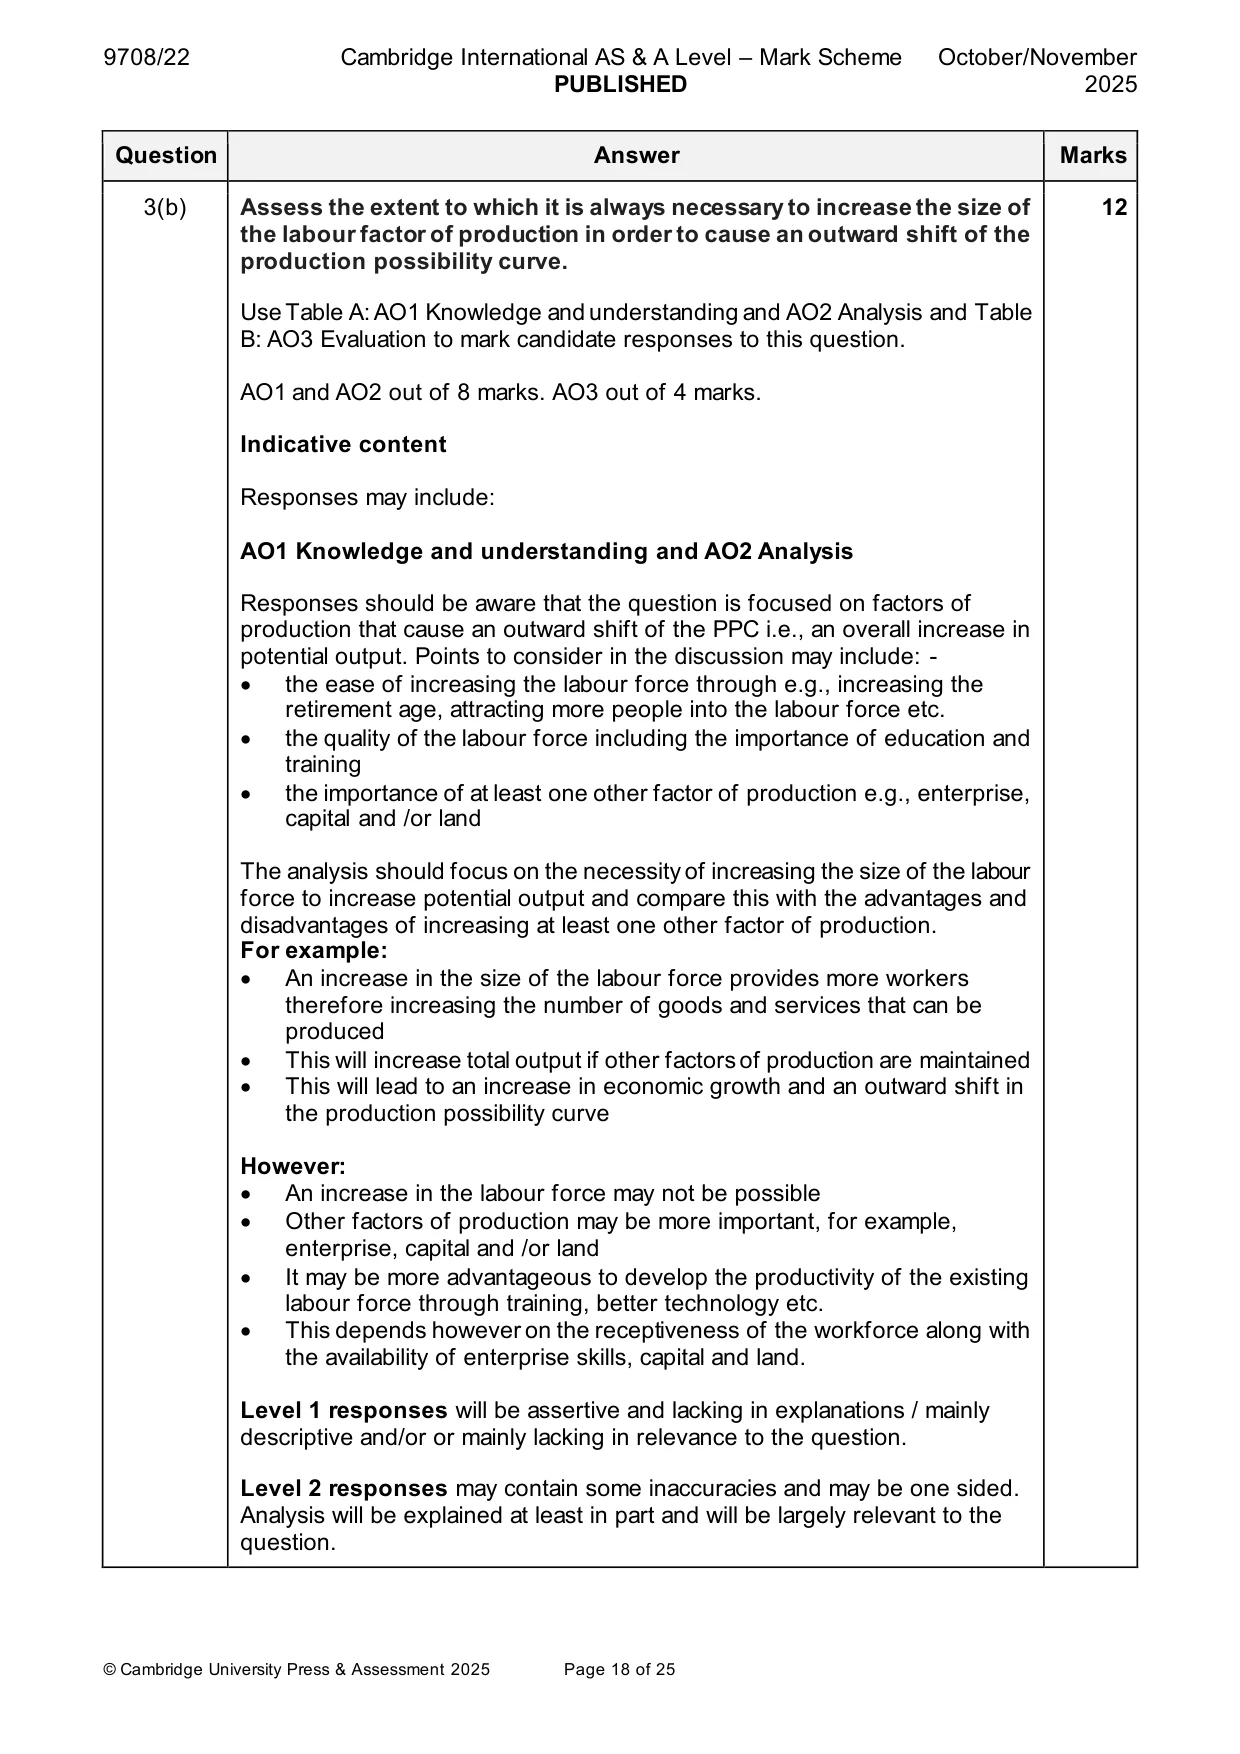
Mark scheme: 3(a) With the help of a diagram, explain the difference between a movement 8 along a production possibility curve (PPC) and a shift of this curve and consider whether a decision to produce more of one product will always incur an equal opportunity cost. Follow the point-based marking guidance at the top of this mark scheme and award: up to 3 marks for AO1 Knowledge and understanding up to 3 marks for AO2 Analysis up to 2 marks for AO3 Evaluation. AO1 Knowledge and Understanding (max 3 marks) For a fully accurately labelled diagram showing 2 products (not X and Y, P and Q etc.) (1) and an explanation that a movement means a decision to produce more of one product than another (1) and an explanation that a shift means that more (or less) of both products can be produced due to a change in productive capacity (1). Also accept a diagram showing an accurate shift in the PPC along with an explanation that this results from increased/decreased resources in the economy (1). AO2 Analysis (max 3 marks) For analysis that clearly explains what is meant by opportunity cost (1) and fully explains what is meant by increasing opportunity cost in terms of rate of which one product is given up for another product (1) and by a constant opportunity cost in terms of the rate of which one product is given up for another product (1) AO3 Evaluation (max 2 marks) For evaluation that explains that whether the opportunity cost is equal will depend on the ease of transferring production resources from one product to another (1) and reaches a justified conclusion (1) AO1 Knowledge and understanding 3 AO2 Analysis 3 AO3 Evaluation 2 3(b) Assess the extent to which it is always necessary to increase the size of 12 the labour factor of production in order to cause an outward shift of the production possibility curve. Use Table A: AO1 Knowledge and understanding and AO2 Analysis and Table B: AO3 Evaluation to mark candidate responses to this question. AO1 and AO2 out of 8 marks. AO3 out of 4 marks. Indicative content Responses may include: AO1 Knowledge and understanding and AO2 Analysis Responses should be aware that the question is focused on factors of production that cause an outward shift of the PPC i.e., an overall increase in potential output. Points to consider in the discussion may include: - • the ease of increasing the labour force through e.g., increasing the retirement age, attracting more people into the labour force etc. • the quality of the labour force including the importance of education and training • the importance of at least one other factor of production e.g., enterprise, capital and /or land The analysis should focus on the necessity of increasing the size of the labour force to increase potential output and compare this with the advantages and disadvantages of increasing at least one other factor of production. For example: • An increase in the size of the labour force provides more workers therefore increasing the number of goods and services that can be produced • This will increase total output if other factors of production are maintained • This will lead to an increase in economic growth and an outward shift in the production possibility curve However: • An increase in the labour force may not be possible • Other factors of production may be more important, for example, enterprise, capital and /or land • It may be more advantageous to develop the productivity of the existing labour force through training, better technology etc. • This depends however on the receptiveness of the workforce along with the availability of enterprise skills, capital and land. Level 1 responses will be assertive and lacking in explanations / mainly descriptive and/or or mainly lacking in relevance to the question. Level 2 responses may contain some inaccuracies and may be one sided. Analysis will be explained at least in part and will be largely relevant to the question. 3(b) Level 3 responses will consider alternative policies / concepts etc. and will be balanced. Explanations of points raised will be offered and will be accurate and relevant to the question. AO3 Evaluation That clearly analyses both sides of the question and comes to a valid conclusion. Accept all valid responses. A one-sided response cannot gain any marks for evaluation. AO1 Knowledge and understanding and AO2 Analysis 8 AO3 Evaluation 4 Section C
Q4 · Explain three components of the current account of the balance of payments and consider…
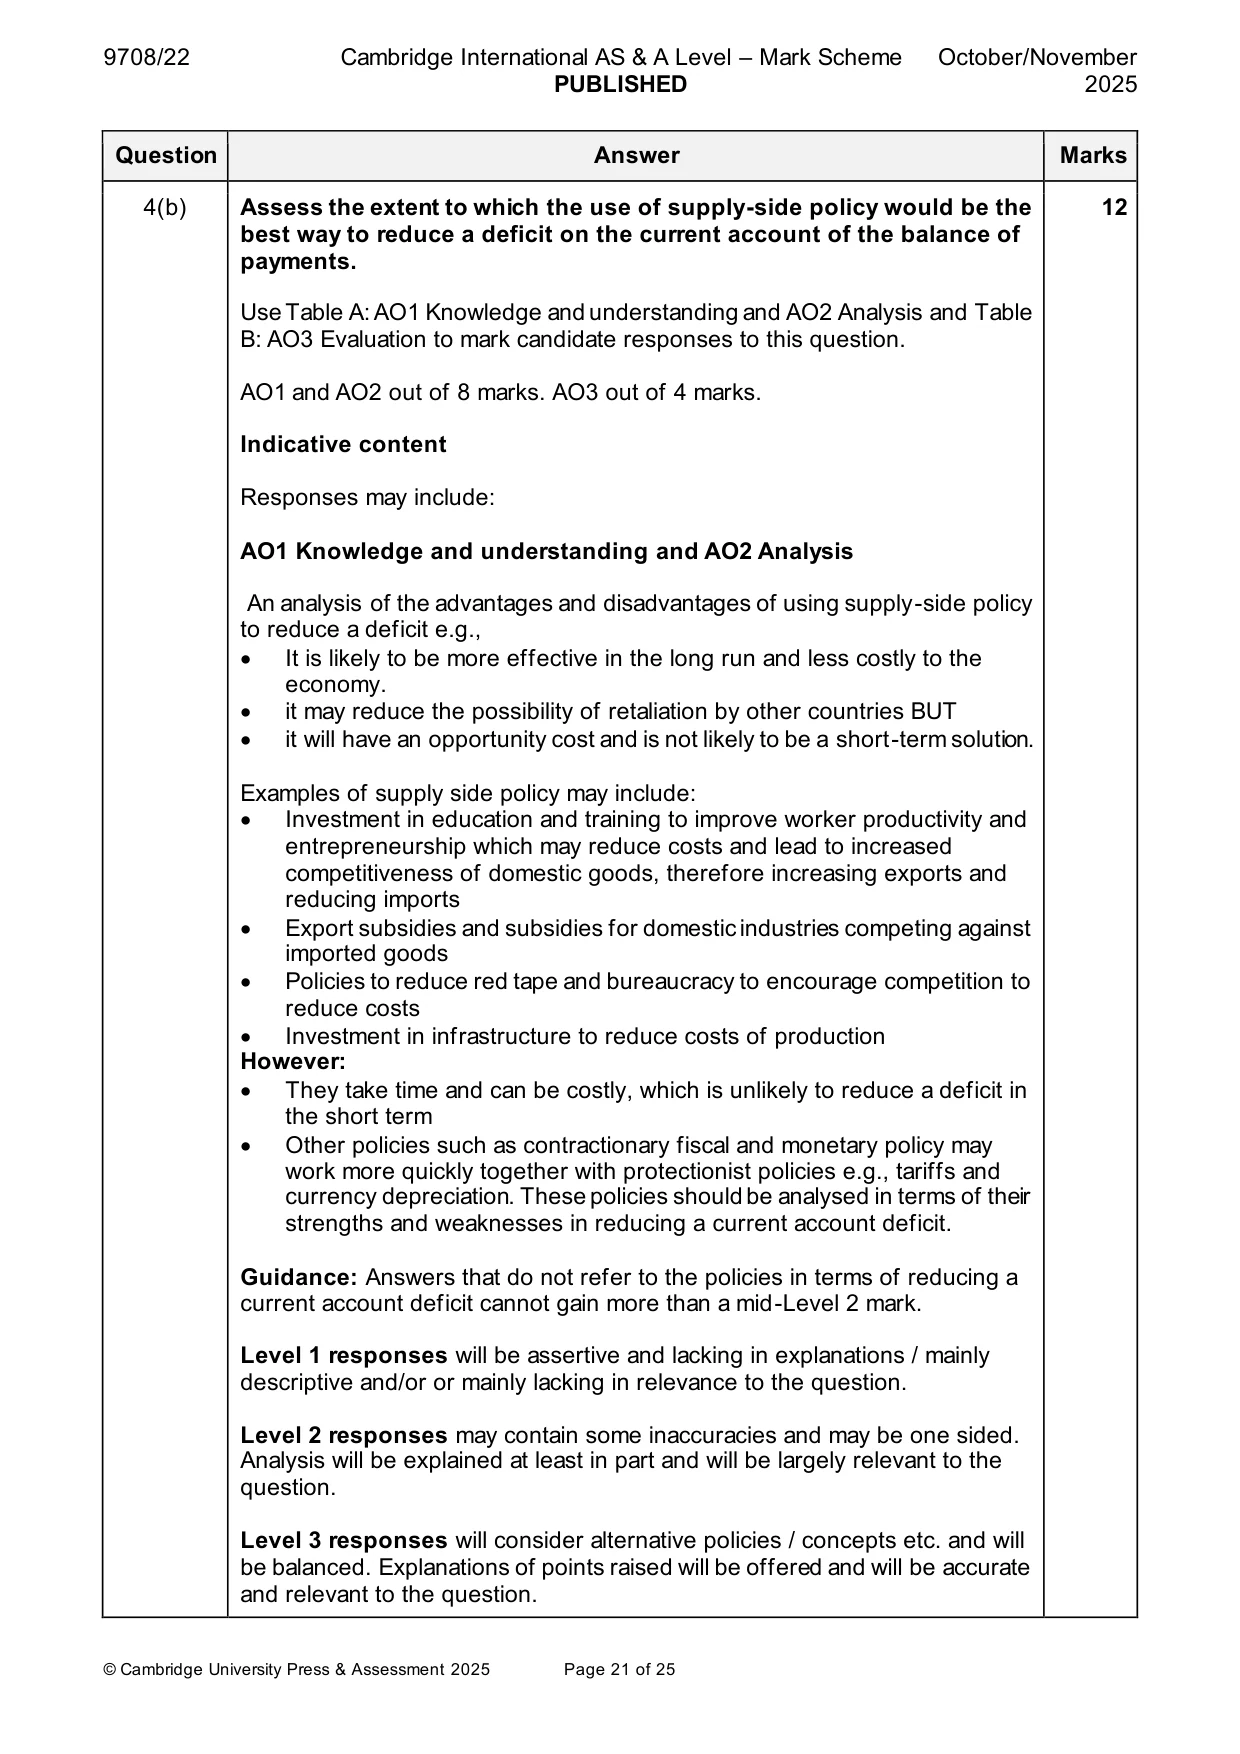
4 (a) Explain three components of the current account of the balance of payments and consider the extent to which a depreciation in the exchange rate will always lead to a surplus on the current account. [8] (b) Assess the extent to which the use of supply-side policy would be the best way to reduce a deficit on the current account of the balance of payments. [12] OR
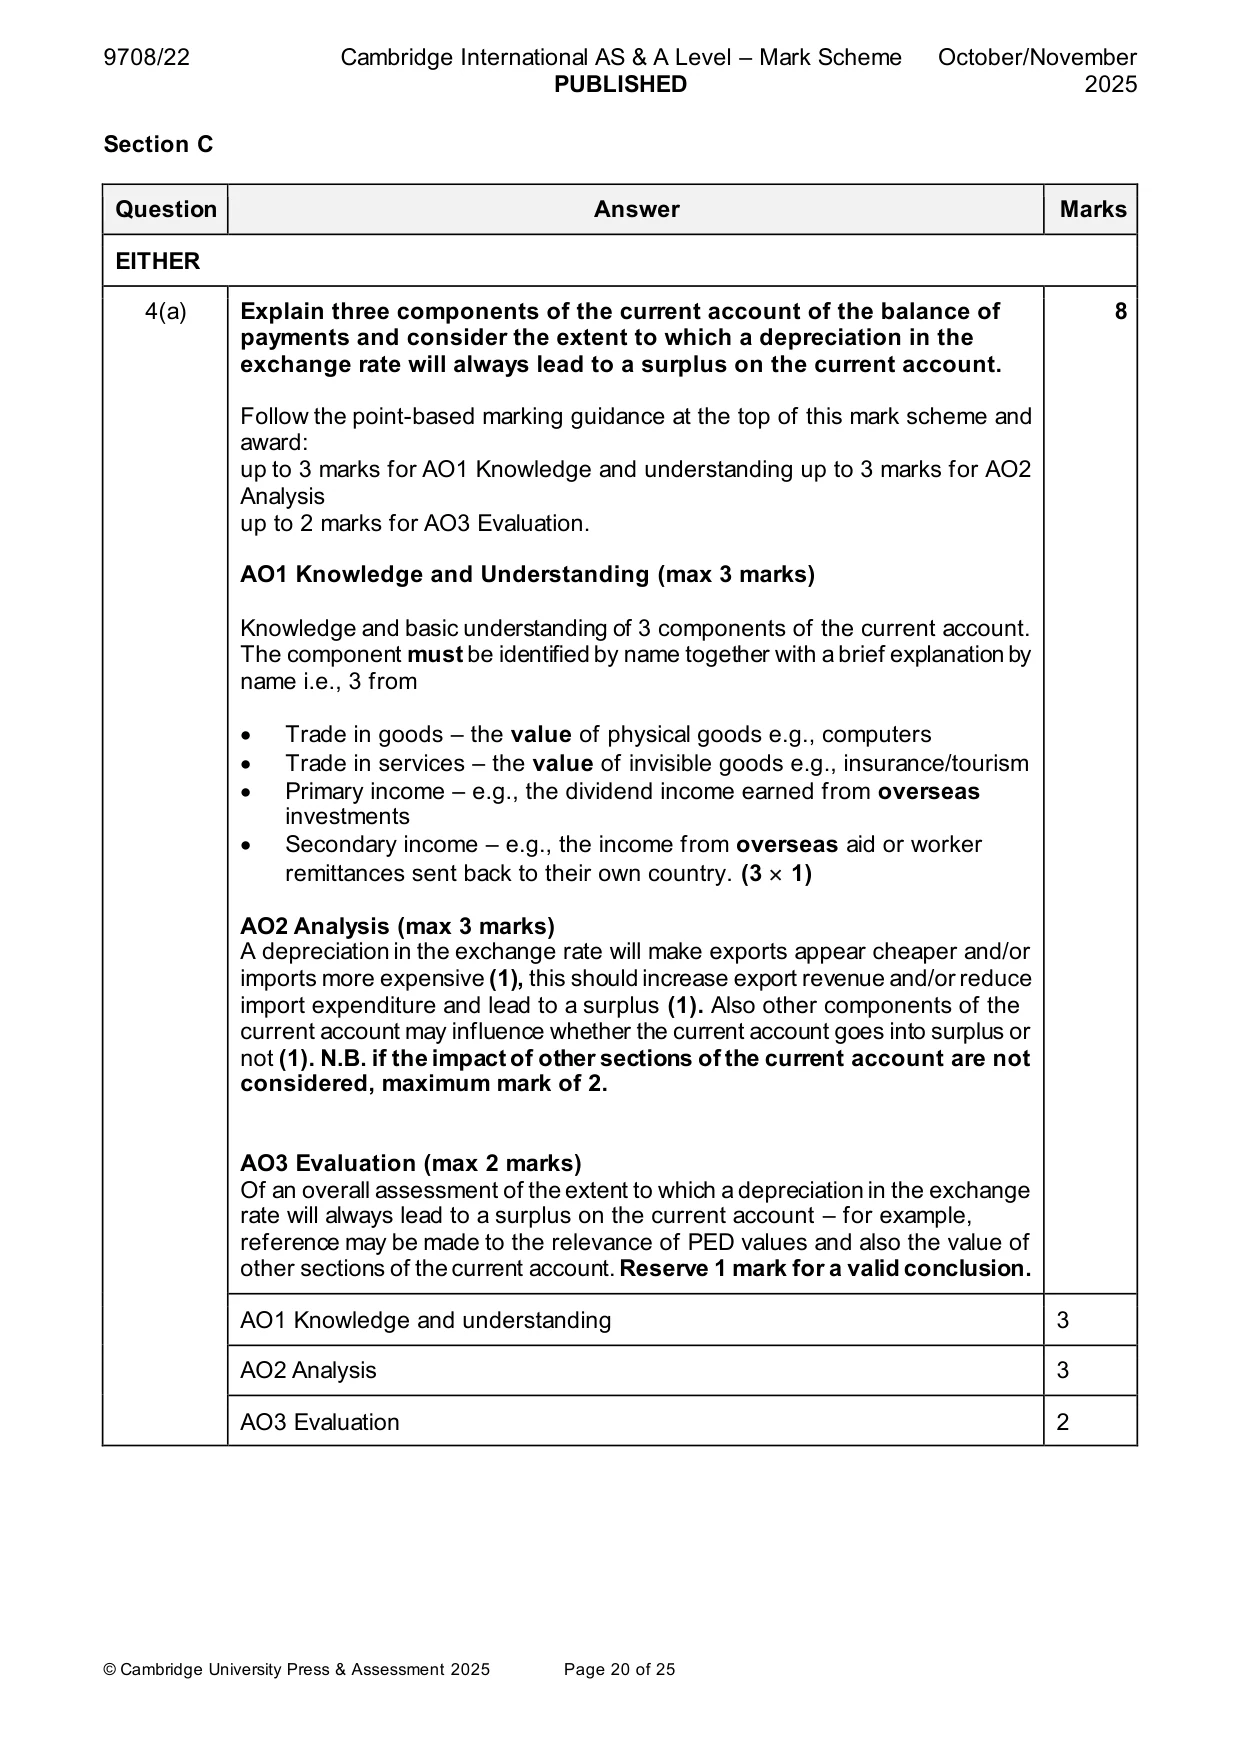
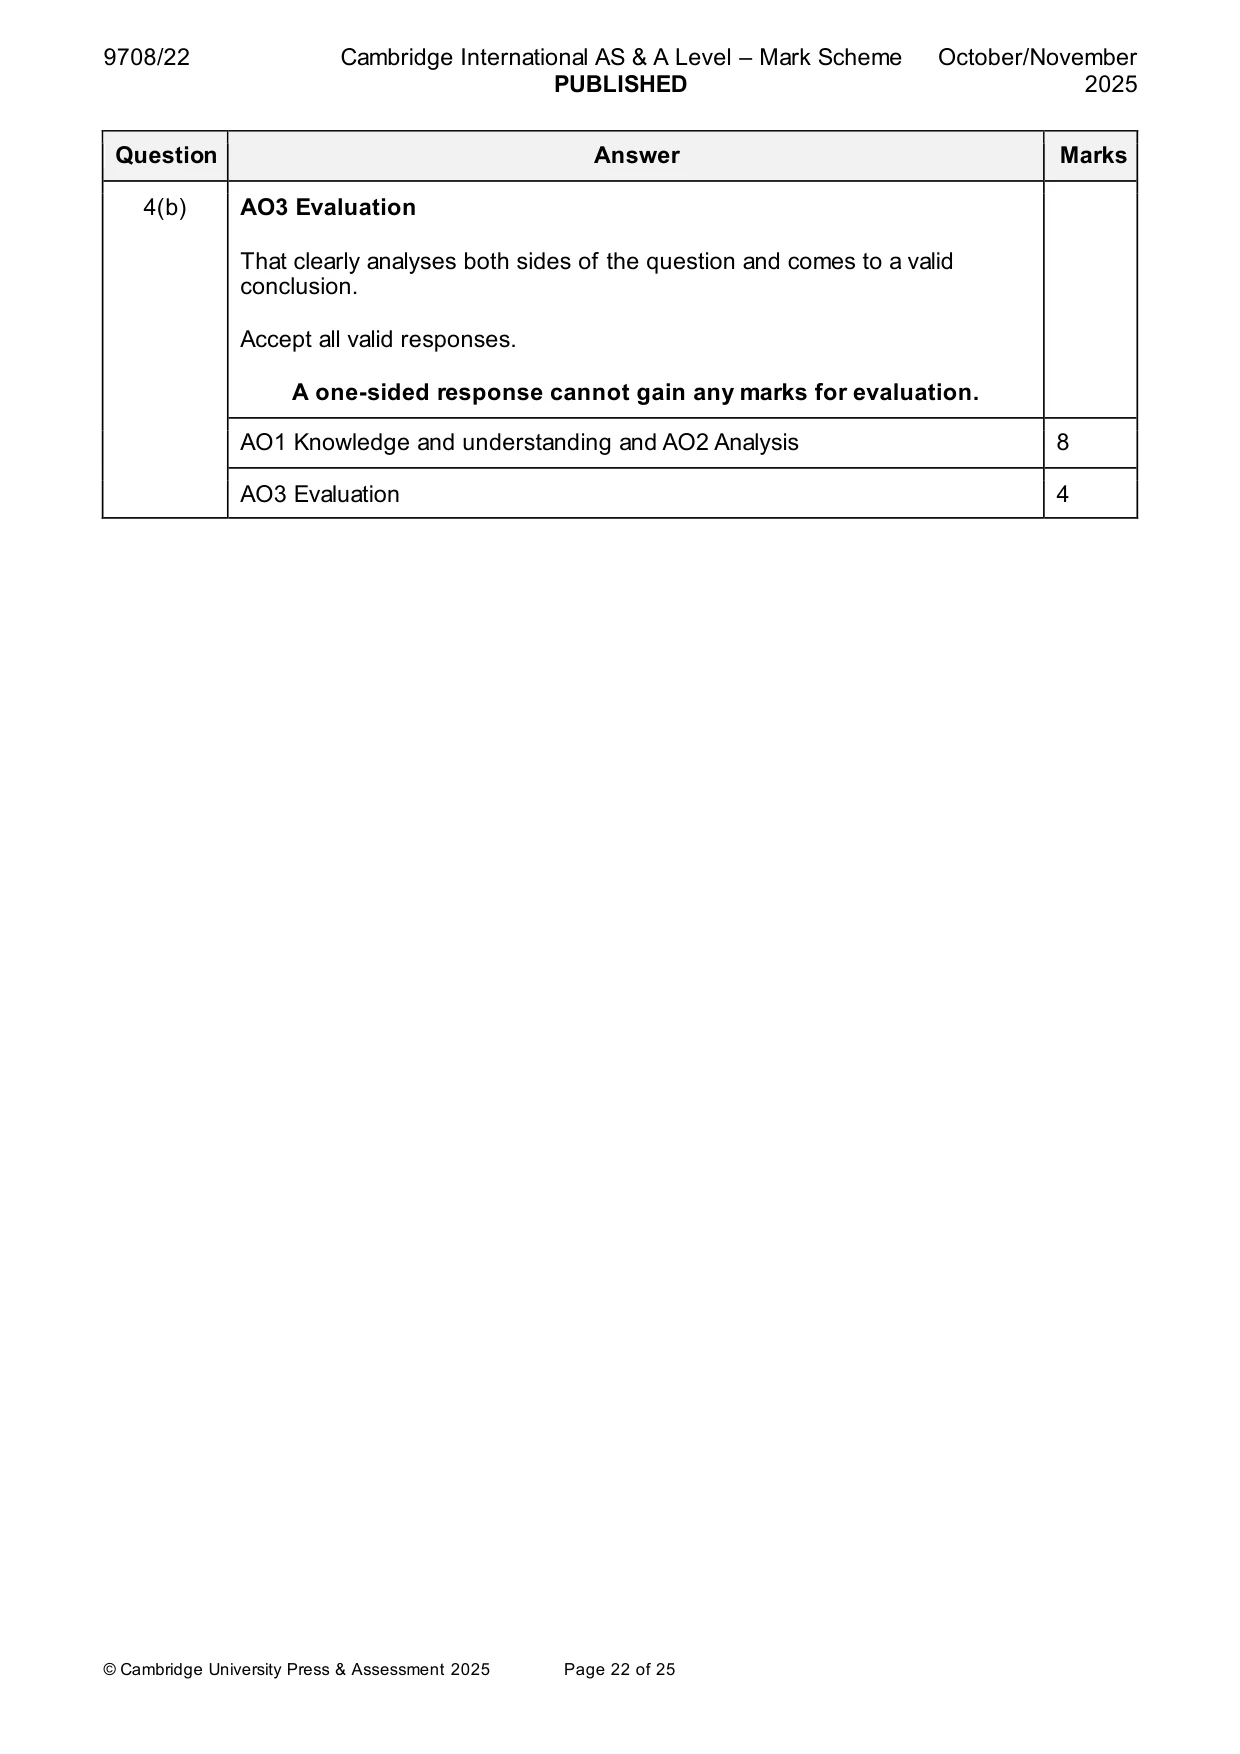
Mark scheme: 4(a) Explain three components of the current account of the balance of 8 payments and consider the extent to which a depreciation in the exchange rate will always lead to a surplus on the current account. Follow the point-based marking guidance at the top of this mark scheme and award: up to 3 marks for AO1 Knowledge and understanding up to 3 marks for AO2 Analysis up to 2 marks for AO3 Evaluation. AO1 Knowledge and Understanding (max 3 marks) Knowledge and basic understanding of 3 components of the current account. The component must be identified by name together with a brief explanation by name i.e., 3 from • Trade in goods – the value of physical goods e.g., computers • Trade in services – the value of invisible goods e.g., insurance/tourism • Primary income – e.g., the dividend income earned from overseas investments • Secondary income – e.g., the income from overseas aid or worker remittances sent back to their own country. (3 1) AO2 Analysis (max 3 marks) A depreciation in the exchange rate will make exports appear cheaper and/or imports more expensive (1), this should increase export revenue and/or reduce import expenditure and lead to a surplus (1). Also other components of the current account may influence whether the current account goes into surplus or not (1). N.B. if the impact of other sections of the current account are not considered, maximum mark of 2. AO3 Evaluation (max 2 marks) Of an overall assessment of the extent to which a depreciation in the exchange rate will always lead to a surplus on the current account – for example, reference may be made to the relevance of PED values and also the value of other sections of the current account. Reserve 1 mark for a valid conclusion. AO1 Knowledge and understanding 3 AO2 Analysis 3 AO3 Evaluation 2 4(b) Assess the extent to which the use of supply-side policy would be the 12 best way to reduce a deficit on the current account of the balance of payments. Use Table A: AO1 Knowledge and understanding and AO2 Analysis and Table B: AO3 Evaluation to mark candidate responses to this question. AO1 and AO2 out of 8 marks. AO3 out of 4 marks. Indicative content Responses may include: AO1 Knowledge and understanding and AO2 Analysis An analysis of the advantages and disadvantages of using supply-side policy to reduce a deficit e.g., • It is likely to be more effective in the long run and less costly to the economy. • it may reduce the possibility of retaliation by other countries BUT • it will have an opportunity cost and is not likely to be a short-term solution. Examples of supply side policy may include: • Investment in education and training to improve worker productivity and entrepreneurship which may reduce costs and lead to increased competitiveness of domestic goods, therefore increasing exports and reducing imports • Export subsidies and subsidies for domestic industries competing against imported goods • Policies to reduce red tape and bureaucracy to encourage competition to reduce costs • Investment in infrastructure to reduce costs of production However: • They take time and can be costly, which is unlikely to reduce a deficit in the short term • Other policies such as contractionary fiscal and monetary policy may work more quickly together with protectionist policies e.g., tariffs and currency depreciation. These policies should be analysed in terms of their strengths and weaknesses in reducing a current account deficit. Guidance: Answers that do not refer to the policies in terms of reducing a current account deficit cannot gain more than a mid-Level 2 mark. Level 1 responses will be assertive and lacking in explanations / mainly descriptive and/or or mainly lacking in relevance to the question. Level 2 responses may contain some inaccuracies and may be one sided. Analysis will be explained at least in part and will be largely relevant to the question. Level 3 responses will consider alternative policies / concepts etc. and will be balanced. Explanations of points raised will be offered and will be accurate and relevant to the question. 4(b) AO3 Evaluation That clearly analyses both sides of the question and comes to a valid conclusion. Accept all valid responses. A one-sided response cannot gain any marks for evaluation. AO1 Knowledge and understanding and AO2 Analysis 8 AO3 Evaluation 4
More questions on Policies to correct imbalances in the current account of the balance of payments
Q5 · With the help of an aggregate demand and aggregate supply (AD/AS) diagram, explain why…
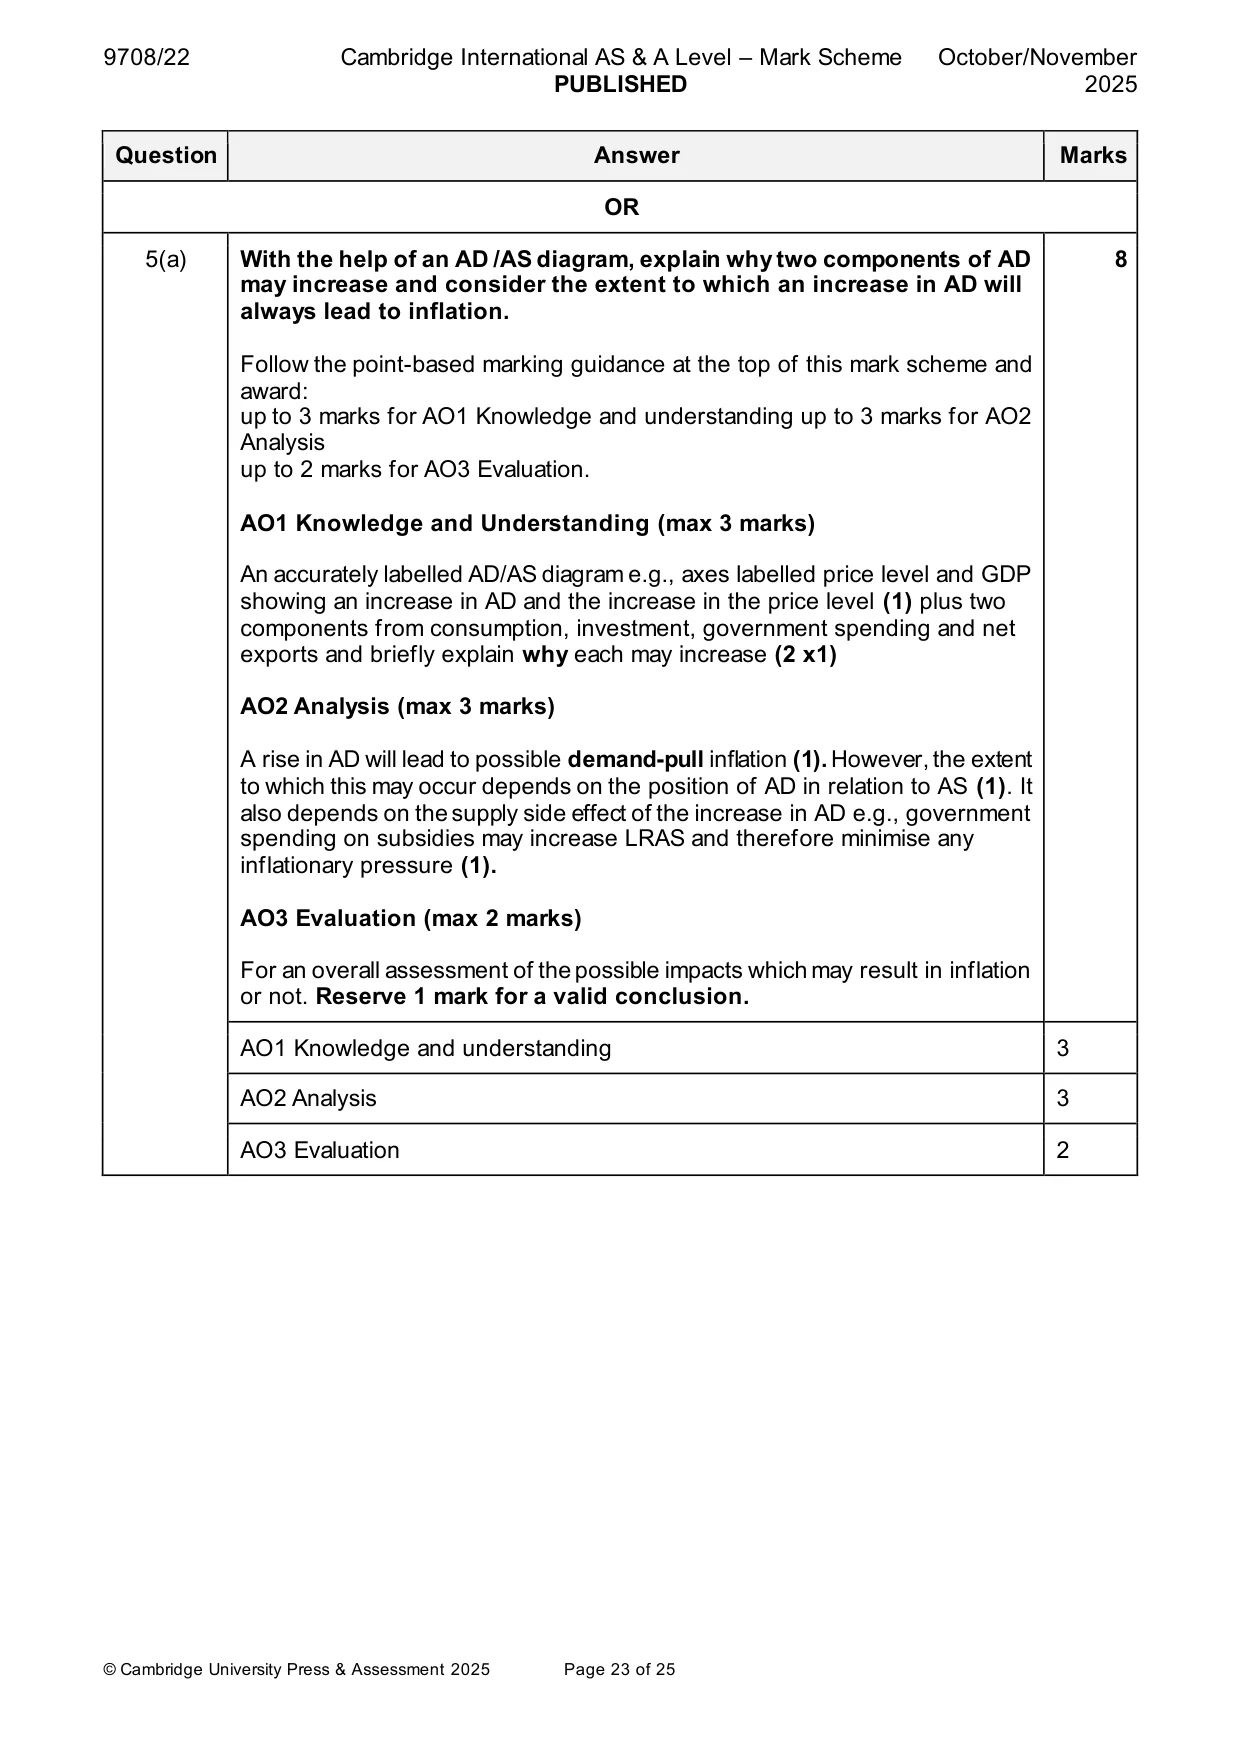
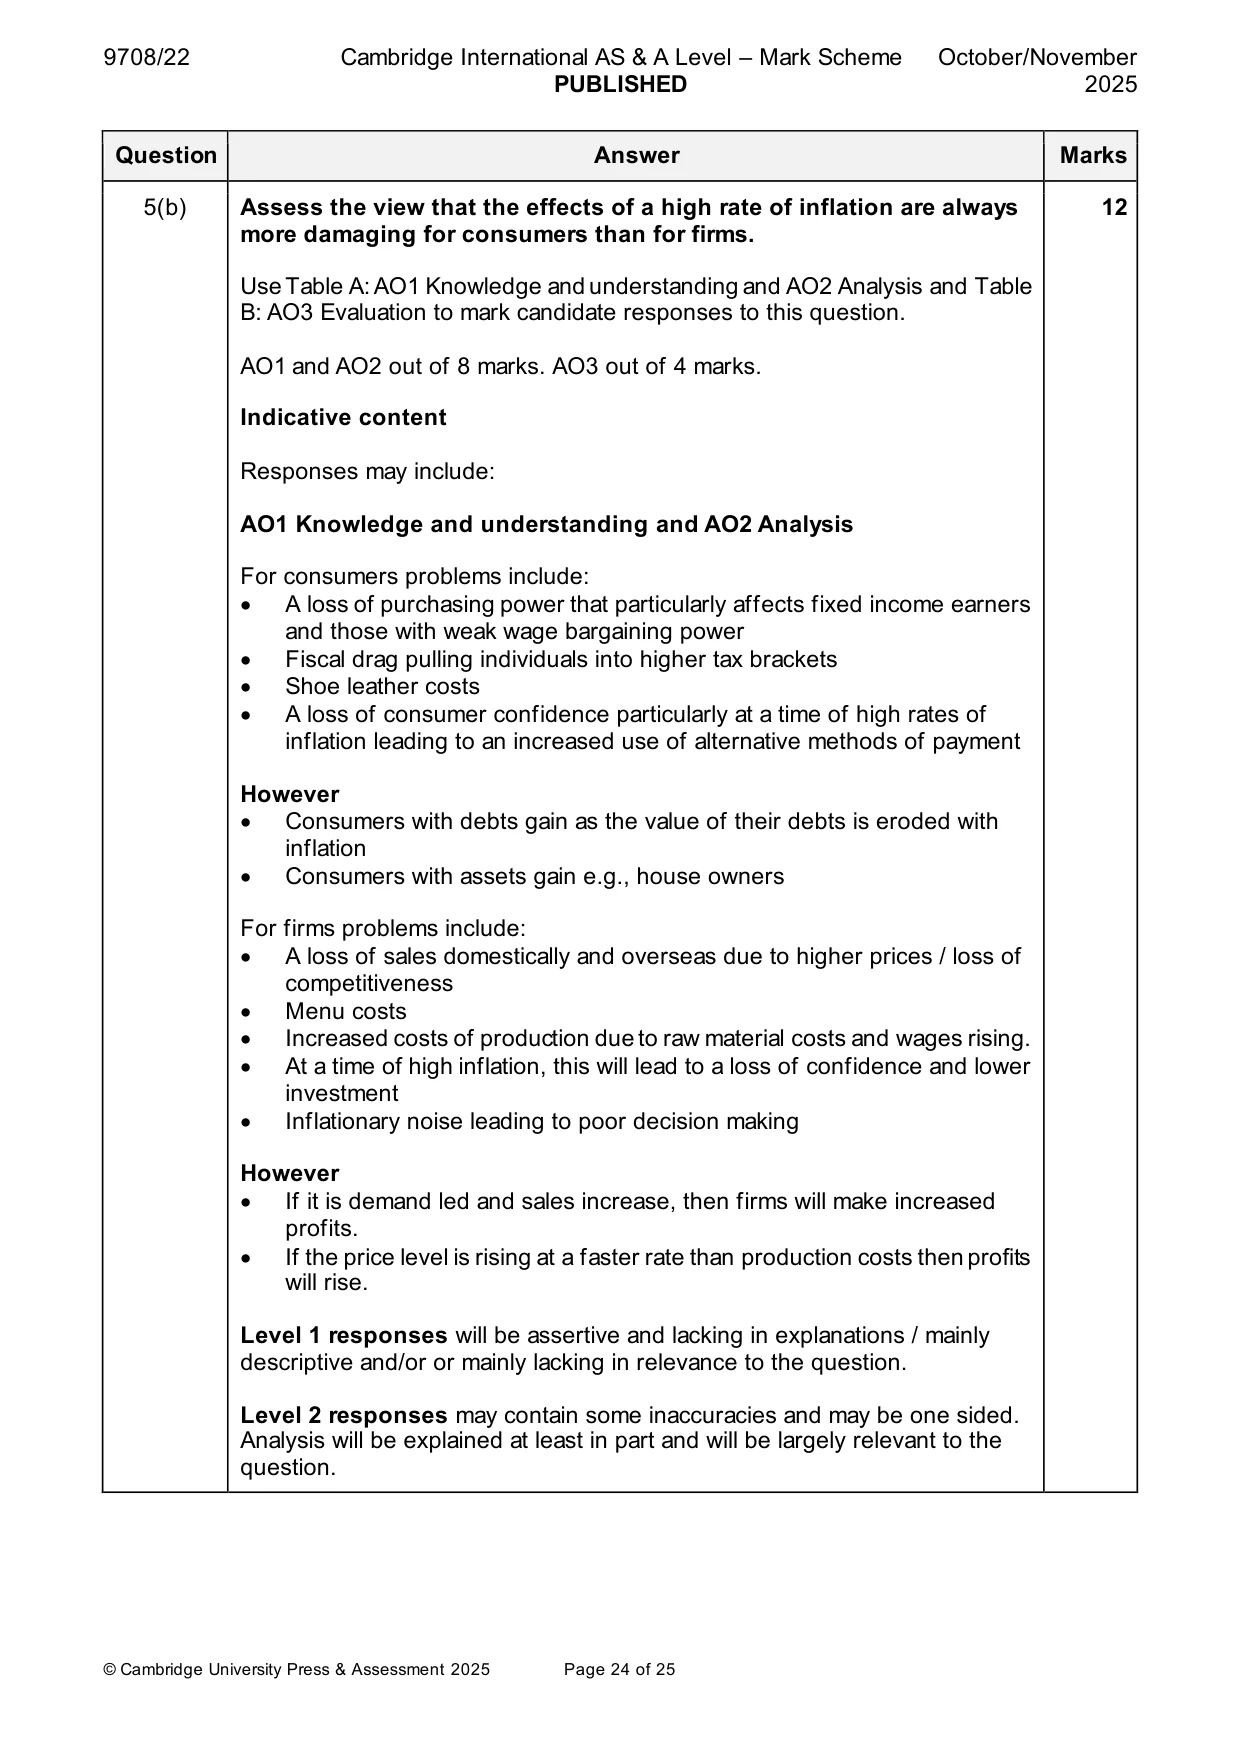
5 (a) With the help of an aggregate demand and aggregate supply (AD/AS) diagram, explain why two components of AD may increase and consider the extent to which an increase in AD will always lead to inflation. [8] (b) Assess the view that the effects of a high rate of inflation are always more damaging for consumers than for firms. [12]
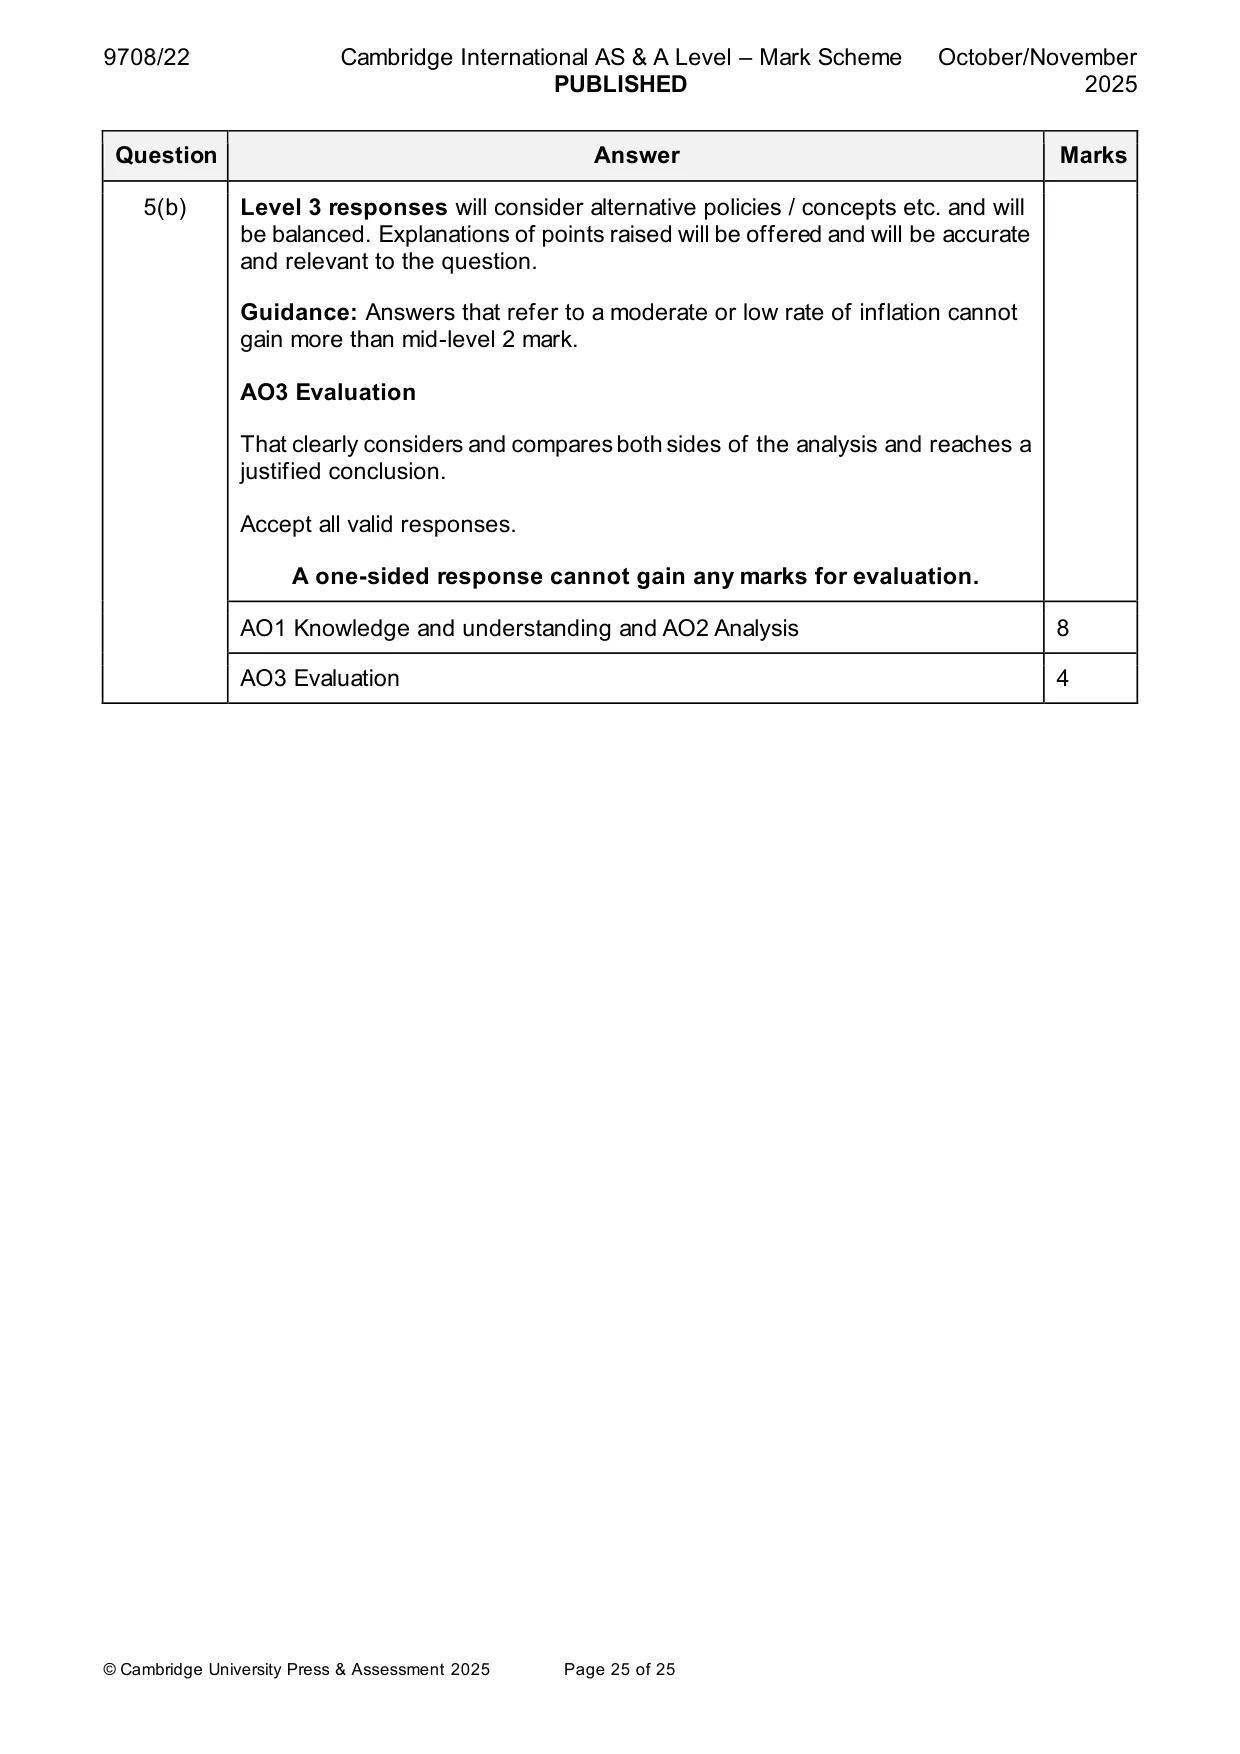
Mark scheme: 5(a) With the help of an AD /AS diagram, explain why two components of AD 8 may increase and consider the extent to which an increase in AD will always lead to inflation. Follow the point-based marking guidance at the top of this mark scheme and award: up to 3 marks for AO1 Knowledge and understanding up to 3 marks for AO2 Analysis up to 2 marks for AO3 Evaluation. AO1 Knowledge and Understanding (max 3 marks) An accurately labelled AD/AS diagram e.g., axes labelled price level and GDP showing an increase in AD and the increase in the price level (1) plus two components from consumption, investment, government spending and net exports and briefly explain why each may increase (2 x1) AO2 Analysis (max 3 marks) A rise in AD will lead to possible demand-pull inflation (1). However, the extent to which this may occur depends on the position of AD in relation to AS (1). It also depends on the supply side effect of the increase in AD e.g., government spending on subsidies may increase LRAS and therefore minimise any inflationary pressure (1). AO3 Evaluation (max 2 marks) For an overall assessment of the possible impacts which may result in inflation or not. Reserve 1 mark for a valid conclusion. AO1 Knowledge and understanding 3 AO2 Analysis 3 AO3 Evaluation 2 5(b) Assess the view that the effects of a high rate of inflation are always 12 more damaging for consumers than for firms. Use Table A: AO1 Knowledge and understanding and AO2 Analysis and Table B: AO3 Evaluation to mark candidate responses to this question. AO1 and AO2 out of 8 marks. AO3 out of 4 marks. Indicative content Responses may include: AO1 Knowledge and understanding and AO2 Analysis For consumers problems include: • A loss of purchasing power that particularly affects fixed income earners and those with weak wage bargaining power • Fiscal drag pulling individuals into higher tax brackets • Shoe leather costs • A loss of consumer confidence particularly at a time of high rates of inflation leading to an increased use of alternative methods of payment However • Consumers with debts gain as the value of their debts is eroded with inflation • Consumers with assets gain e.g., house owners For firms problems include: • A loss of sales domestically and overseas due to higher prices / loss of competitiveness • Menu costs • Increased costs of production due to raw material costs and wages rising. • At a time of high inflation, this will lead to a loss of confidence and lower investment • Inflationary noise leading to poor decision making However • If it is demand led and sales increase, then firms will make increased profits. • If the price level is rising at a faster rate than production costs then profits will rise. Level 1 responses will be assertive and lacking in explanations / mainly descriptive and/or or mainly lacking in relevance to the question. Level 2 responses may contain some inaccuracies and may be one sided. Analysis will be explained at least in part and will be largely relevant to the question. 5(b) Level 3 responses will consider alternative policies / concepts etc. and will be balanced. Explanations of points raised will be offered and will be accurate and relevant to the question. Guidance: Answers that refer to a moderate or low rate of inflation cannot gain more than mid-level 2 mark. AO3 Evaluation That clearly considers and compares both sides of the analysis and reaches a justified conclusion. Accept all valid responses. A one-sided response cannot gain any marks for evaluation. AO1 Knowledge and understanding and AO2 Analysis 8 AO3 Evaluation 4
What was in this paper
The subtopics covered by these 5 questions, and how many questions each got. Open one in a new tab to see every Cambridge question on it.
What you needed in this session
Cambridge’s own grade thresholds for 2025 Oct/Nov, Paper 2 · Variant 2. A higher threshold means an easier paper — the bar moves with how the cohort did.