Cambridge A Level Economics 9708 — 2025 Oct/Nov Paper 2 · Variant 4
9708/24/O/N/25 · 5 questions · 60 marks · ≈68 min
The question paper and its mark scheme, free to read here and free to download. This is Cambridge’s own paper, exactly as it was sat.
Question paper4 pages
Mark scheme22 pages
Answers below. Sit the paper first if you are practising.


Questions as text
Q1 · Will stronger economic growth in the United States (US) lead to high inflation?
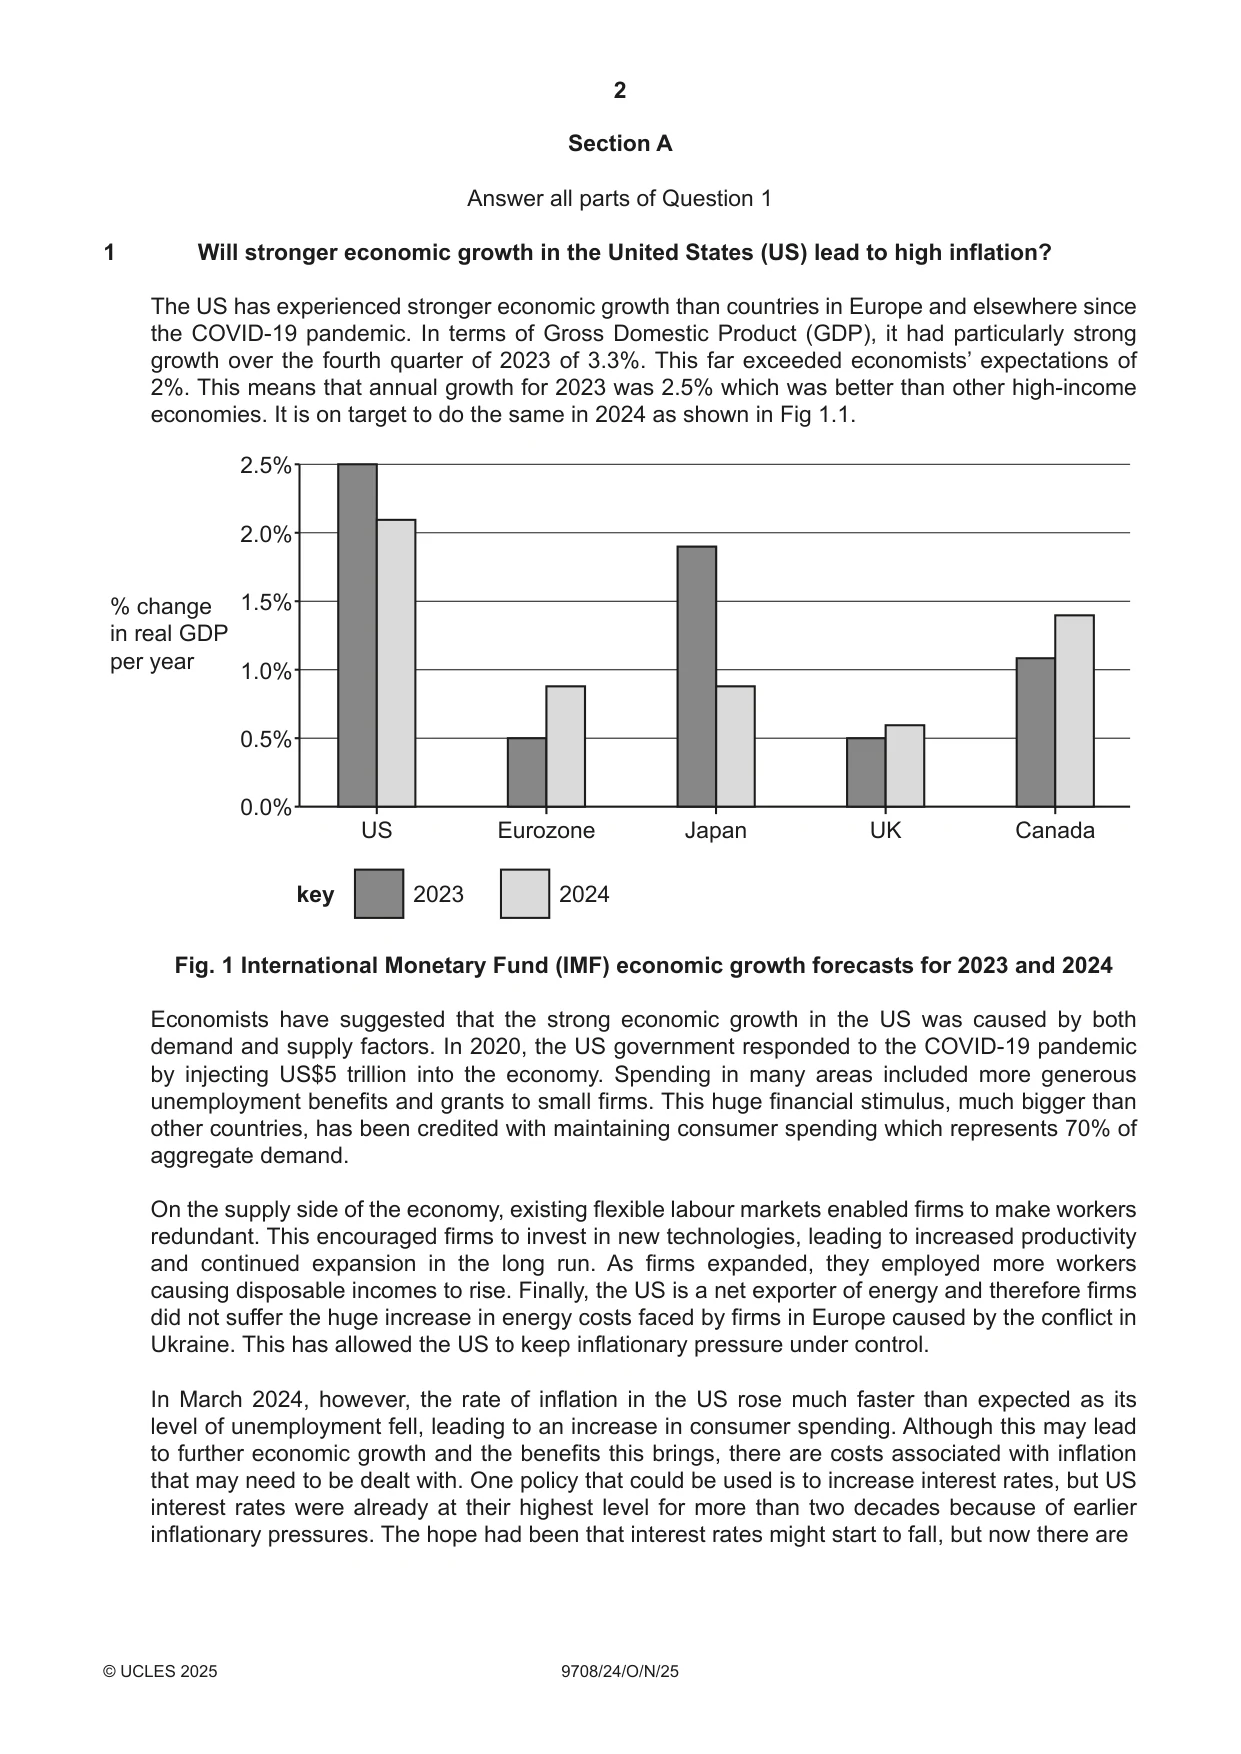
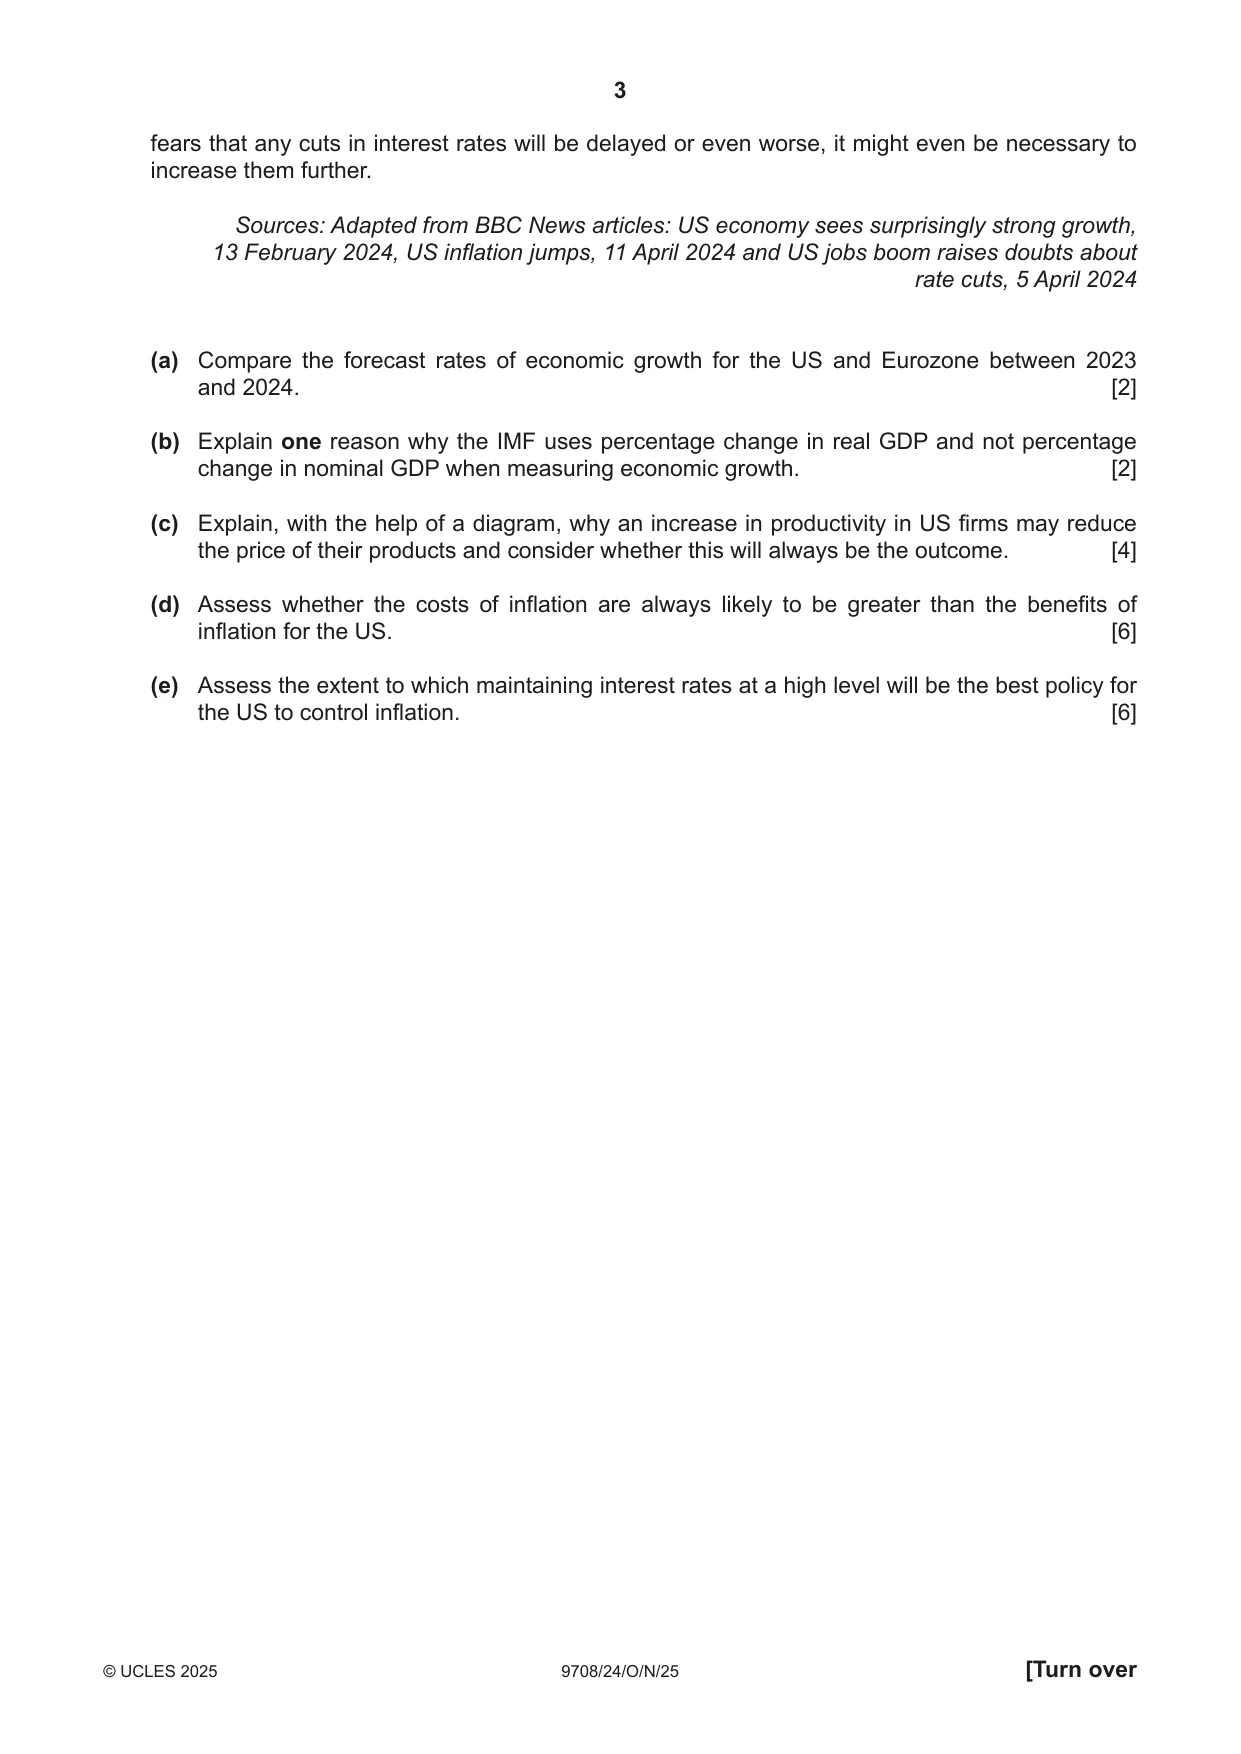
1 Will stronger economic growth in the United States (US) lead to high inflation? The US has experienced stronger economic growth than countries in Europe and elsewhere since the COVID-19 pandemic. In terms of Gross Domestic Product (GDP), it had particularly strong growth over the fourth quarter of 2023 of 3.3%. This far exceeded economists’ expectations of 2%. This means that annual growth for 2023 was 2.5% which was better than other high-income economies. It is on target to do the same in 2024 as shown in Fig 1.1. 2.5% 2.0% % change 1.5% in real GDP per year 1.0% 0.5% 0.0% US Eurozone Japan UK Canada key 2023 2024 Fig. 1 International Monetary Fund (IMF) economic growth forecasts for 2023 and 2024 Economists have suggested that the strong economic growth in the US was caused by both demand and supply factors. In 2020, the US government responded to the COVID-19 pandemic by injecting US$5 trillion into the economy. Spending in many areas included more generous unemployment benefits and grants to small firms. This huge financial stimulus, much bigger than other countries, has been credited with maintaining consumer spending which represents 70% of aggregate demand. On the supply side of the economy, existing flexible labour markets enabled firms to make workers redundant. This encouraged firms to invest in new technologies, leading to increased productivity and continued expansion in the long run. As firms expanded, they employed more workers causing disposable incomes to rise. Finally, the US is a net exporter of energy and therefore firms did not suffer the huge increase in energy costs faced by firms in Europe caused by the conflict in Ukraine. This has allowed the US to keep inflationary pressure under control. In March 2024, however, the rate of inflation in the US rose much faster than expected as its level of unemployment fell, leading to an increase in consumer spending. Although this may lead to further economic growth and the benefits this brings, there are costs associated with inflation that may need to be dealt with. One policy that could be used is to increase interest rates, but US interest rates were already at their highest level for more than two decades because of earlier inflationary pressures. The hope had been that interest rates might start to fall, but now there are fears that any cuts in interest rates will be delayed or even worse, it might even be necessary to increase them further. Sources: Adapted from BBC News articles: US economy sees surprisingly strong growth, 13 February 2024, US inflation jumps, 11 April 2024 and US jobs boom raises doubts about rate cuts, 5 April 2024 (a) Compare the forecast rates of economic growth for the US and Eurozone between 2023 and 2024. [2] (b) Explain one reason why the IMF uses percentage change in real GDP and not percentage change in nominal GDP when measuring economic growth. [2] (c) Explain, with the help of a diagram, why an increase in productivity in US firms may reduce the price of their products and consider whether this will always be the outcome. [4] (d) Assess whether the costs of inflation are always likely to be greater than the benefits of inflation for the US. [6] (e) Assess the extent to which maintaining interest rates at a high level will be the best policy for the US to control inflation. [6]
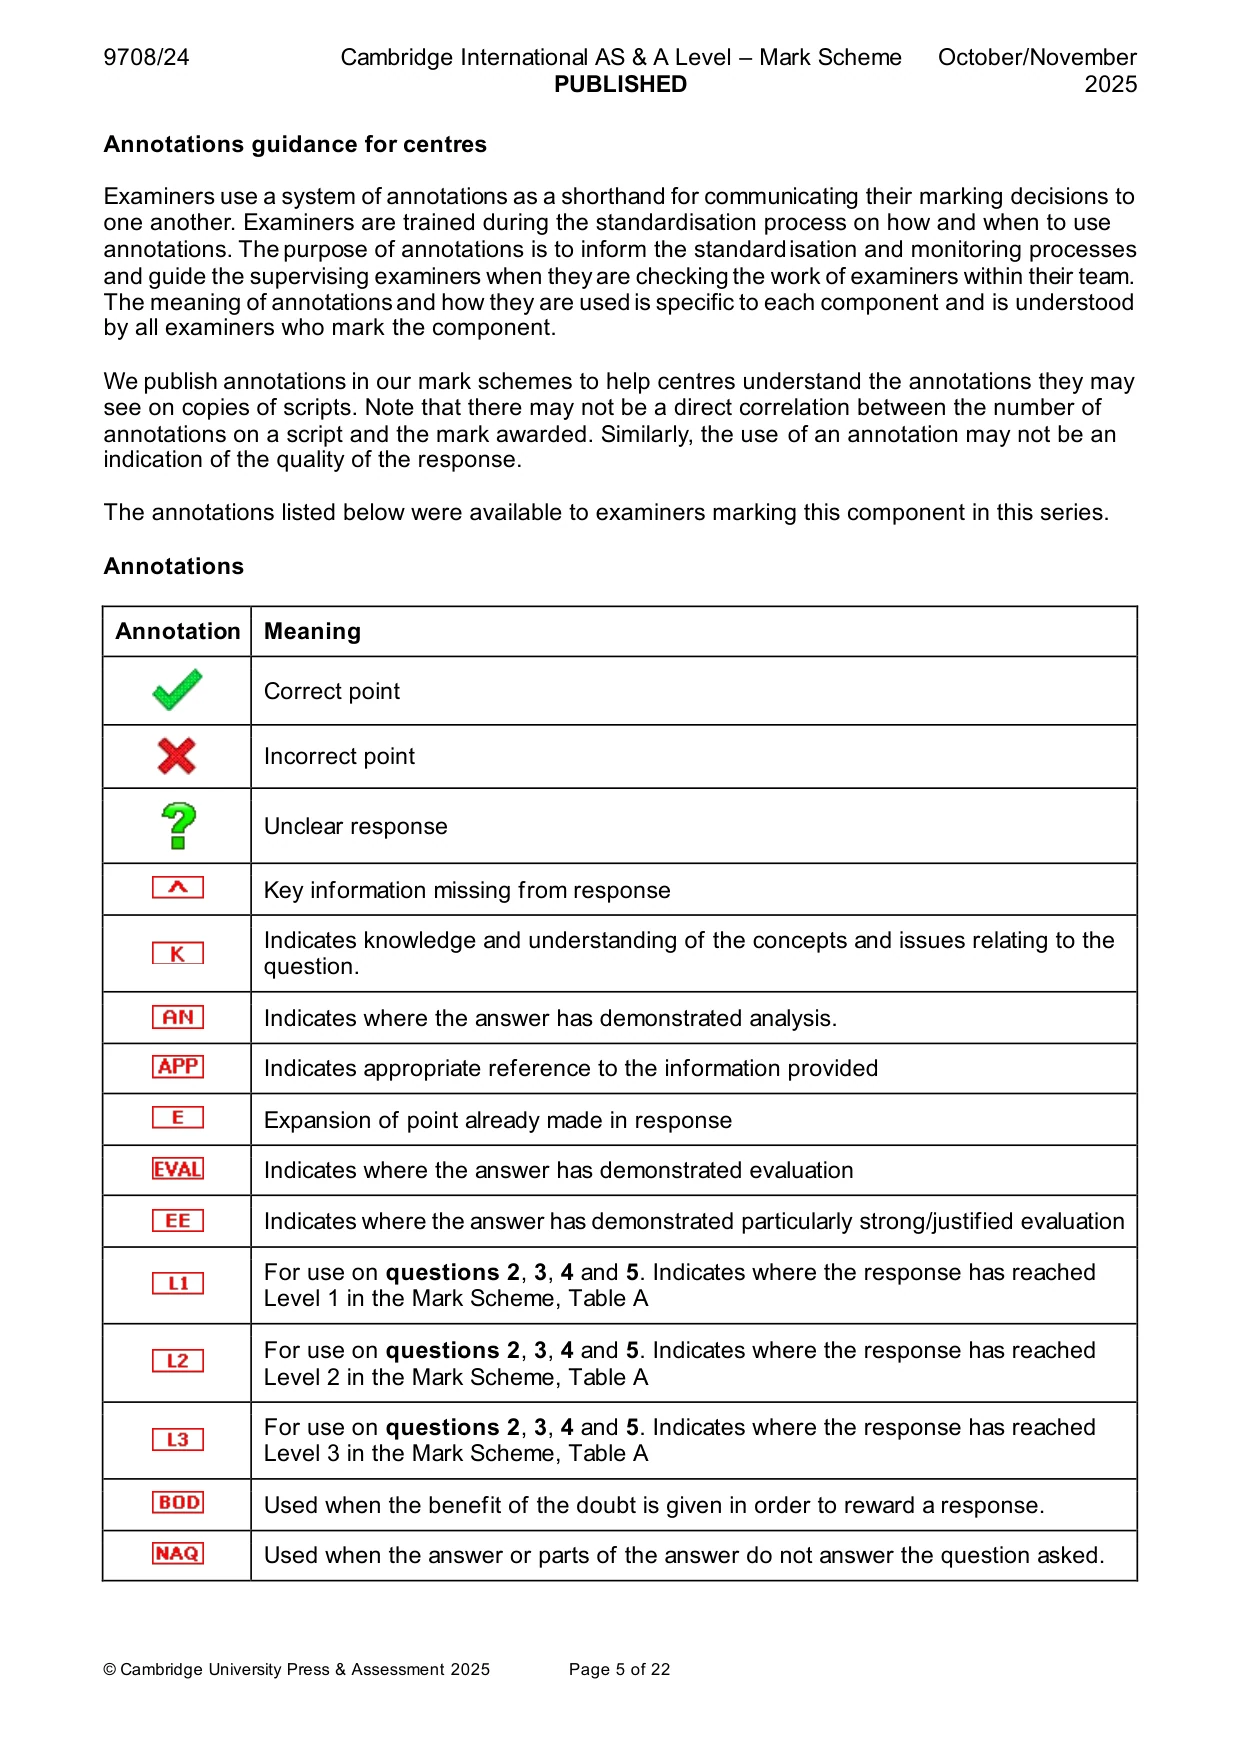
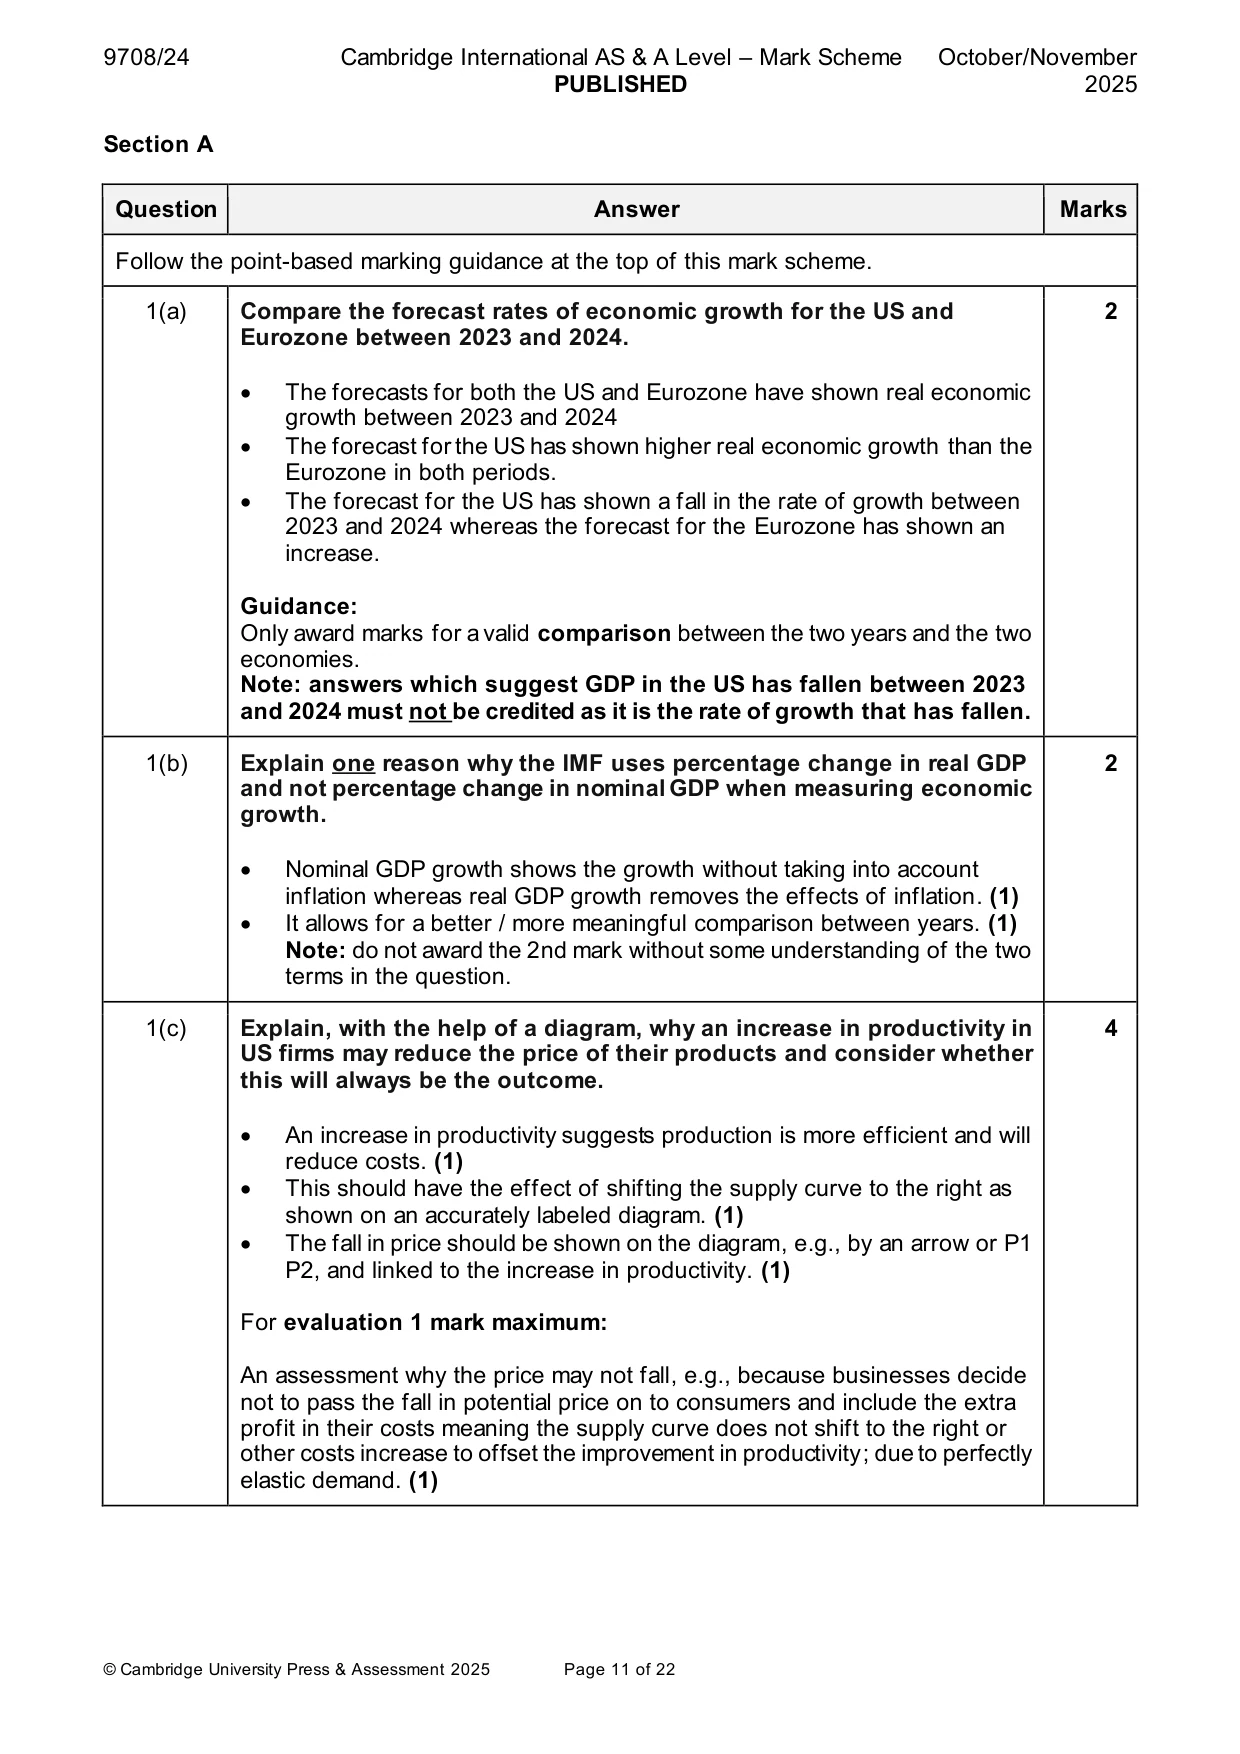
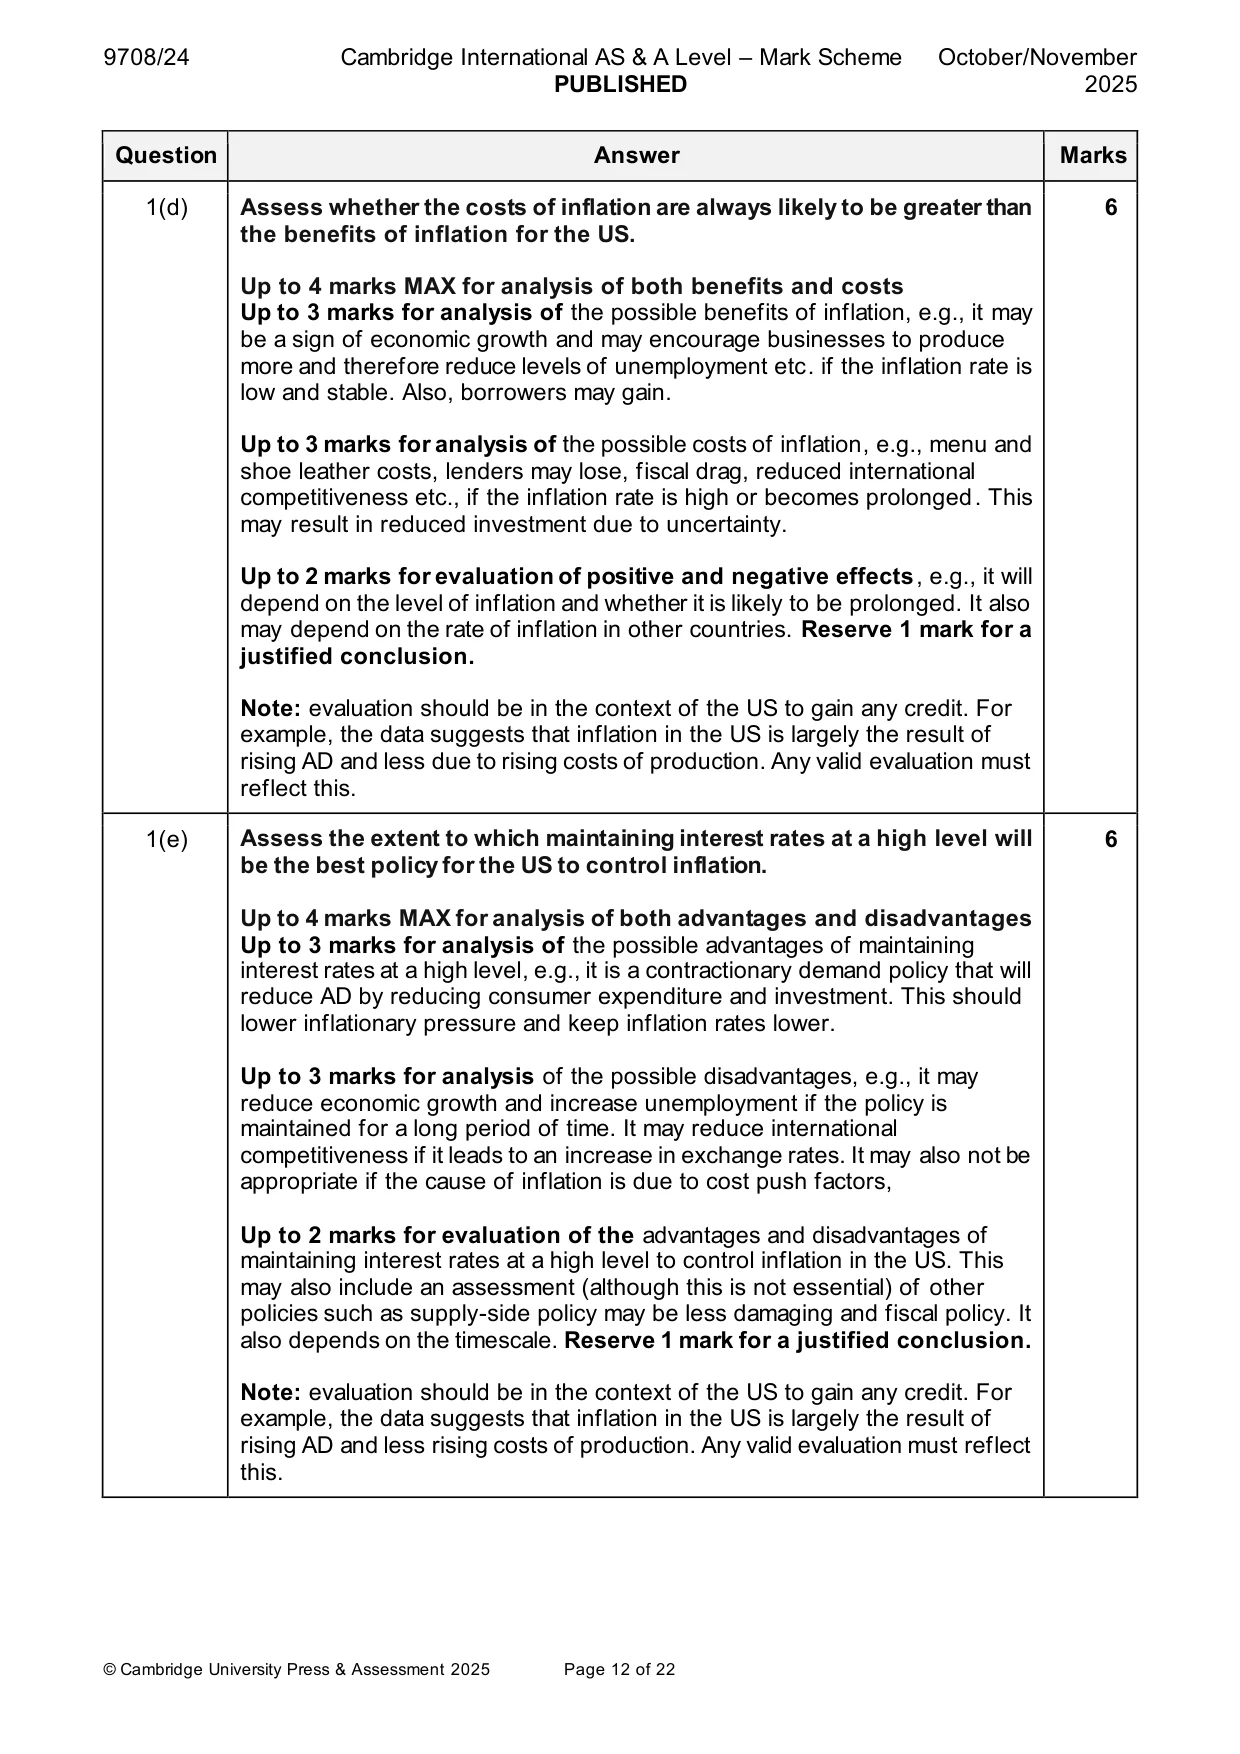
Mark scheme: Question Answer Marks Follow the point-based marking guidance at the top of this mark scheme. 1(a) Compare the forecast rates of economic growth for the US and 2 Eurozone between 2023 and 2024. • The forecasts for both the US and Eurozone have shown real economic growth between 2023 and 2024 • The forecast for the US has shown higher real economic growth than the Eurozone in both periods. • The forecast for the US has shown a fall in the rate of growth between 2023 and 2024 whereas the forecast for the Eurozone has shown an increase. Guidance: Only award marks for a valid comparison between the two years and the two economies. Note: answers which suggest GDP in the US has fallen between 2023 and 2024 must not be credited as it is the rate of growth that has fallen. 1(b) Explain one reason why the IMF uses percentage change in real GDP 2 and not percentage change in nominal GDP when measuring economic growth. • Nominal GDP growth shows the growth without taking into account inflation whereas real GDP growth removes the effects of inflation. (1) • It allows for a better / more meaningful comparison between years. (1) Note: do not award the 2nd mark without some understanding of the two terms in the question. 1(c) Explain, with the help of a diagram, why an increase in productivity in 4 US firms may reduce the price of their products and consider whether this will always be the outcome. • An increase in productivity suggests production is more efficient and will reduce costs. (1) • This should have the effect of shifting the supply curve to the right as shown on an accurately labeled diagram. (1) • The fall in price should be shown on the diagram, e.g., by an arrow or P1 P2, and linked to the increase in productivity. (1) For evaluation 1 mark maximum: An assessment why the price may not fall, e.g., because businesses decide not to pass the fall in potential price on to consumers and include the extra profit in their costs meaning the supply curve does not shift to the right or other costs increase to offset the improvement in productivity; due to perfectly elastic demand. (1) 1(d) Assess whether the costs of inflation are always likely to be greater than 6 the benefits of inflation for the US. Up to 4 marks MAX for analysis of both benefits and costs Up to 3 marks for analysis of the possible benefits of inflation, e.g., it may be a sign of economic growth and may encourage businesses to produce more and therefore reduce levels of unemployment etc. if the inflation rate is low and stable. Also, borrowers may gain. Up to 3 marks for analysis of the possible costs of inflation, e.g., menu and shoe leather costs, lenders may lose, fiscal drag, reduced international competitiveness etc., if the inflation rate is high or becomes prolonged. This may result in reduced investment due to uncertainty. Up to 2 marks for evaluation of positive and negative effects, e.g., it will depend on the level of inflation and whether it is likely to be prolonged. It also may depend on the rate of inflation in other countries. Reserve 1 mark for a justified conclusion. Note: evaluation should be in the context of the US to gain any credit. For example, the data suggests that inflation in the US is largely the result of rising AD and less due to rising costs of production. Any valid evaluation must reflect this. 1(e) Assess the extent to which maintaining interest rates at a high level will 6 be the best policy for the US to control inflation. Up to 4 marks MAX for analysis of both advantages and disadvantages Up to 3 marks for analysis of the possible advantages of maintaining interest rates at a high level, e.g., it is a contractionary demand policy that will reduce AD by reducing consumer expenditure and investment. This should lower inflationary pressure and keep inflation rates lower. Up to 3 marks for analysis of the possible disadvantages, e.g., it may reduce economic growth and increase unemployment if the policy is maintained for a long period of time. It may reduce international competitiveness if it leads to an increase in exchange rates. It may also not be appropriate if the cause of inflation is due to cost push factors, Up to 2 marks for evaluation of the advantages and disadvantages of maintaining interest rates at a high level to control inflation in the US. This may also include an assessment (although this is not essential) of other policies such as supply-side policy may be less damaging and fiscal policy. It also depends on the timescale. Reserve 1 mark for a justified conclusion. Note: evaluation should be in the context of the US to gain any credit. For example, the data suggests that inflation in the US is largely the result of rising AD and less rising costs of production. Any valid evaluation must reflect this. Section B
Q2 · Explain what is meant by the incidence of an indirect tax and consider the extent to…
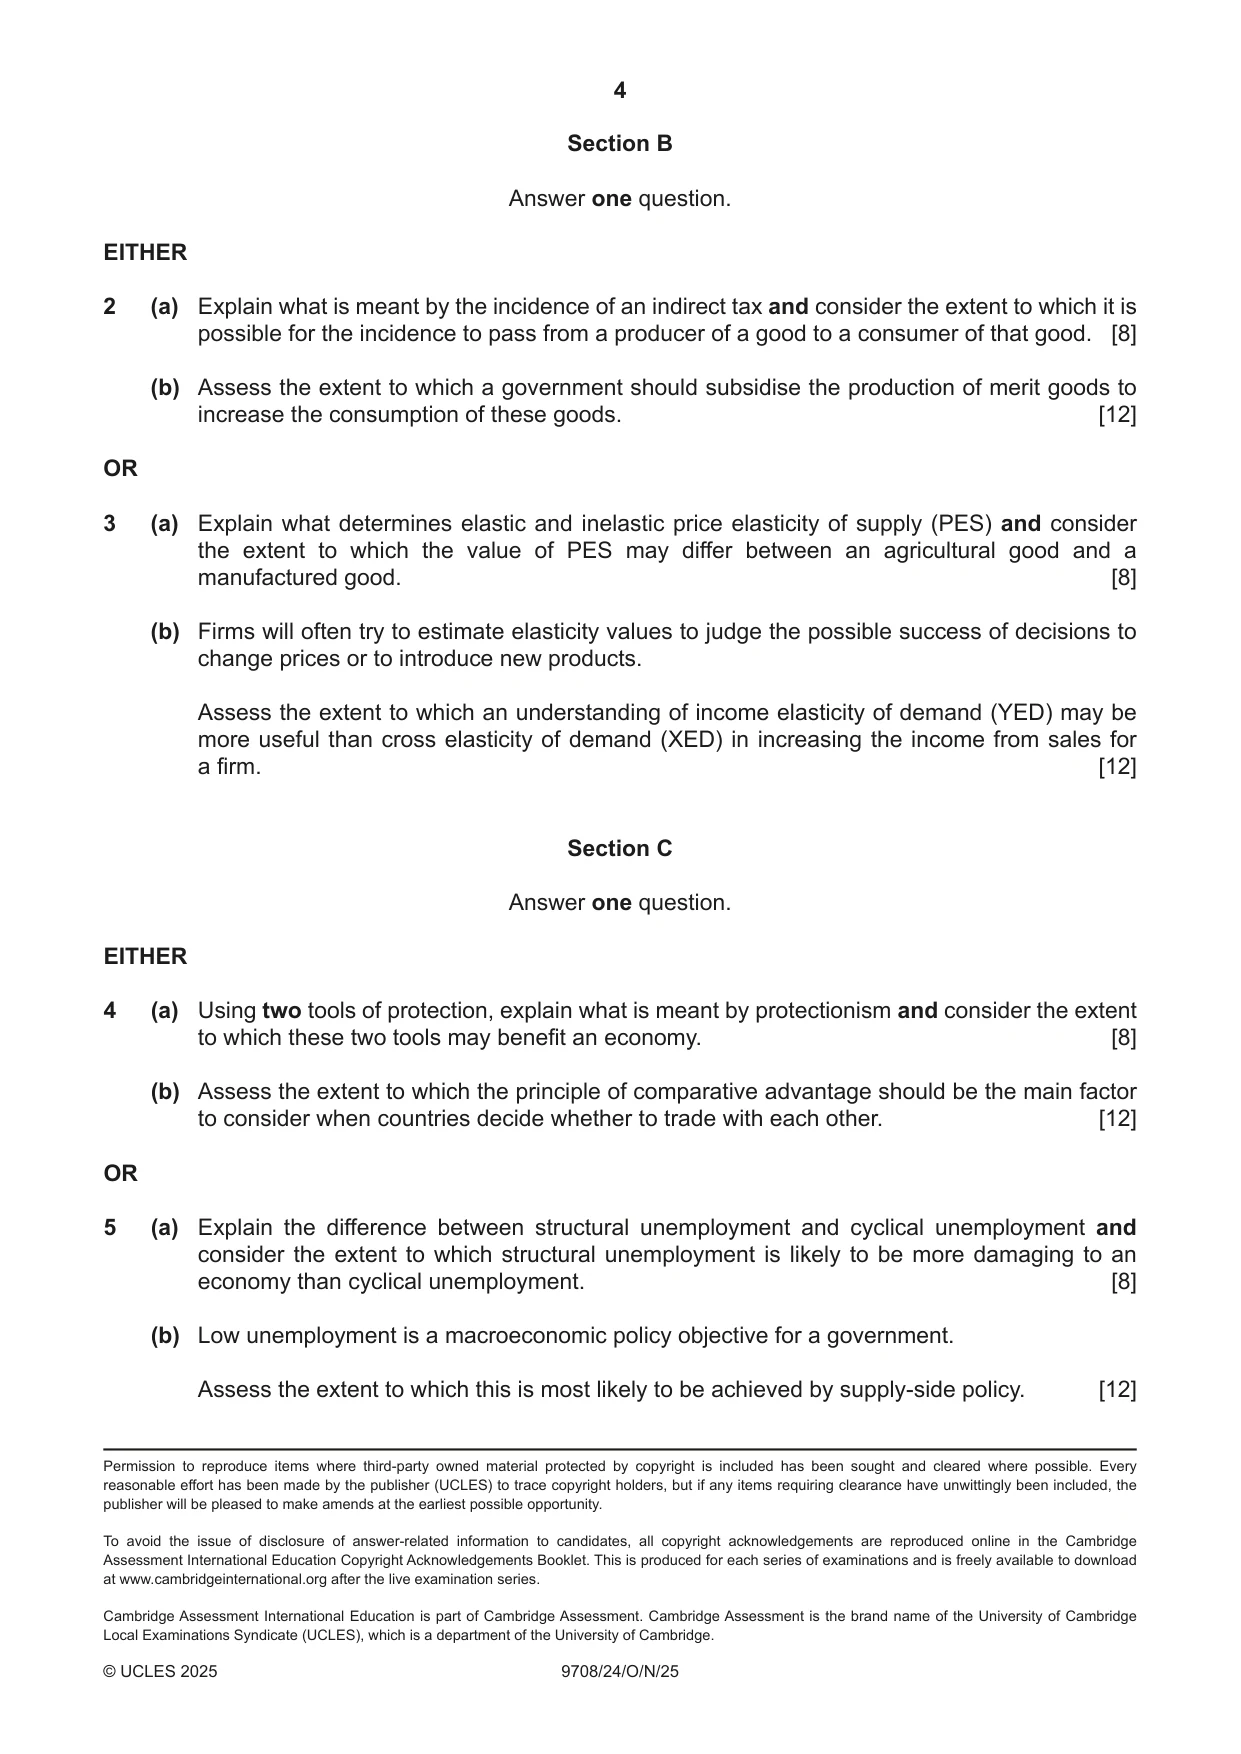
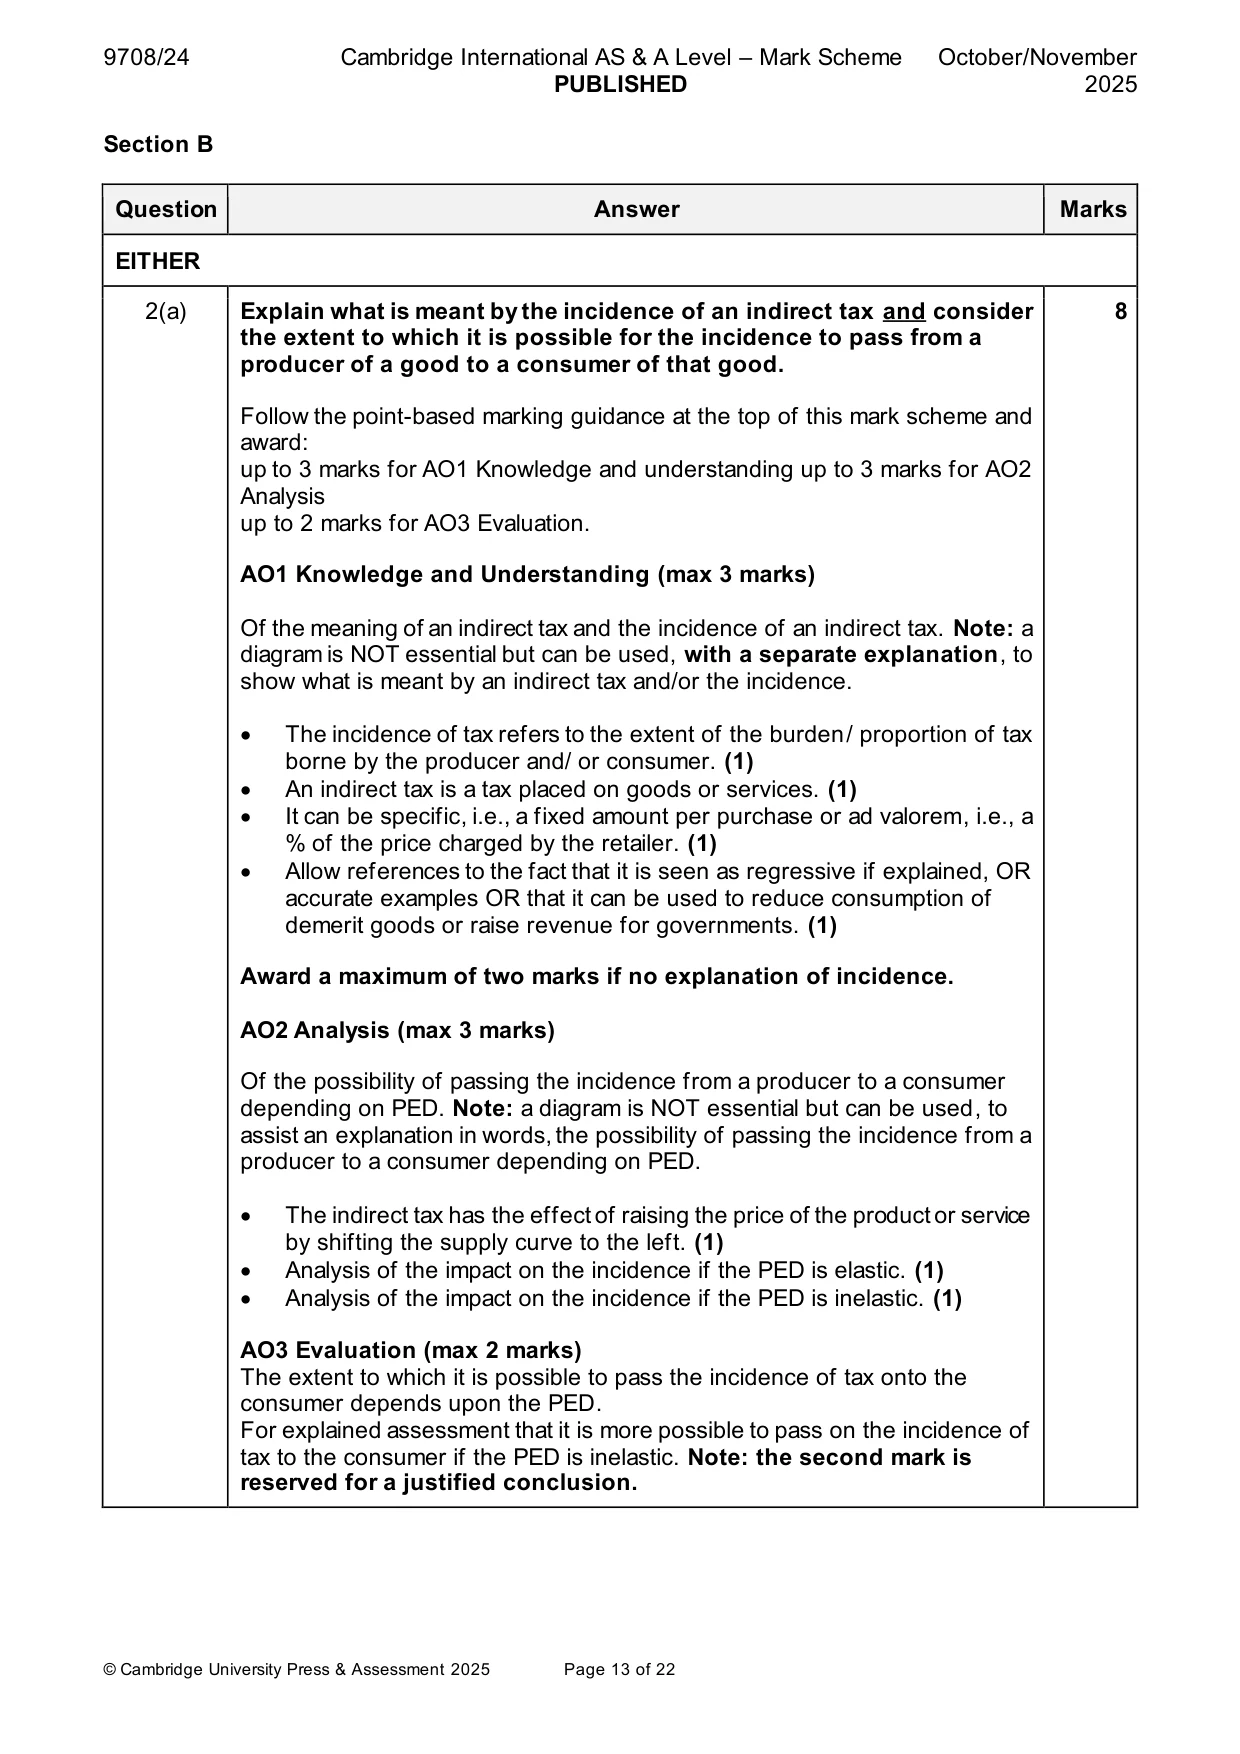
2 (a) Explain what is meant by the incidence of an indirect tax and consider the extent to which it is possible for the incidence to pass from a producer of a good to a consumer of that good. [8] (b) Assess the extent to which a government should subsidise the production of merit goods to increase the consumption of these goods. [12] OR
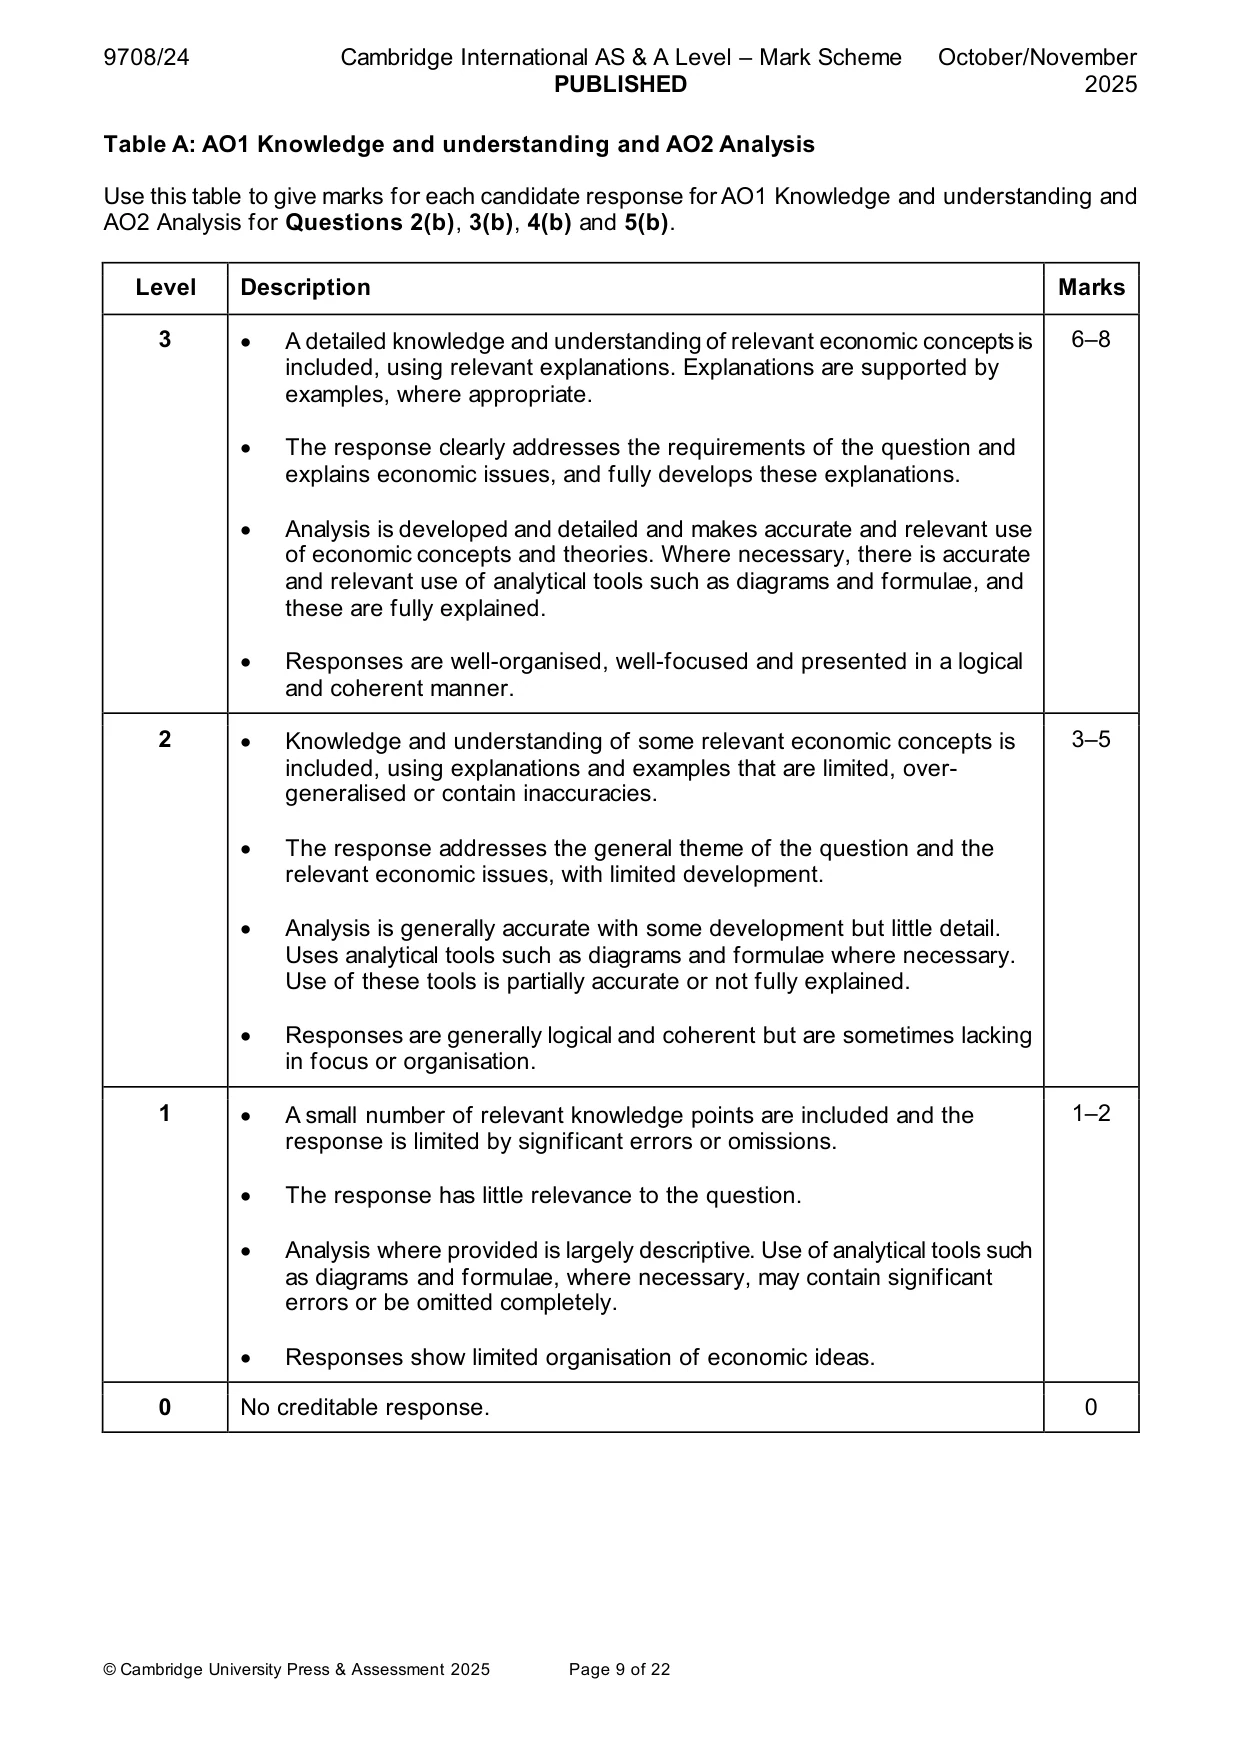
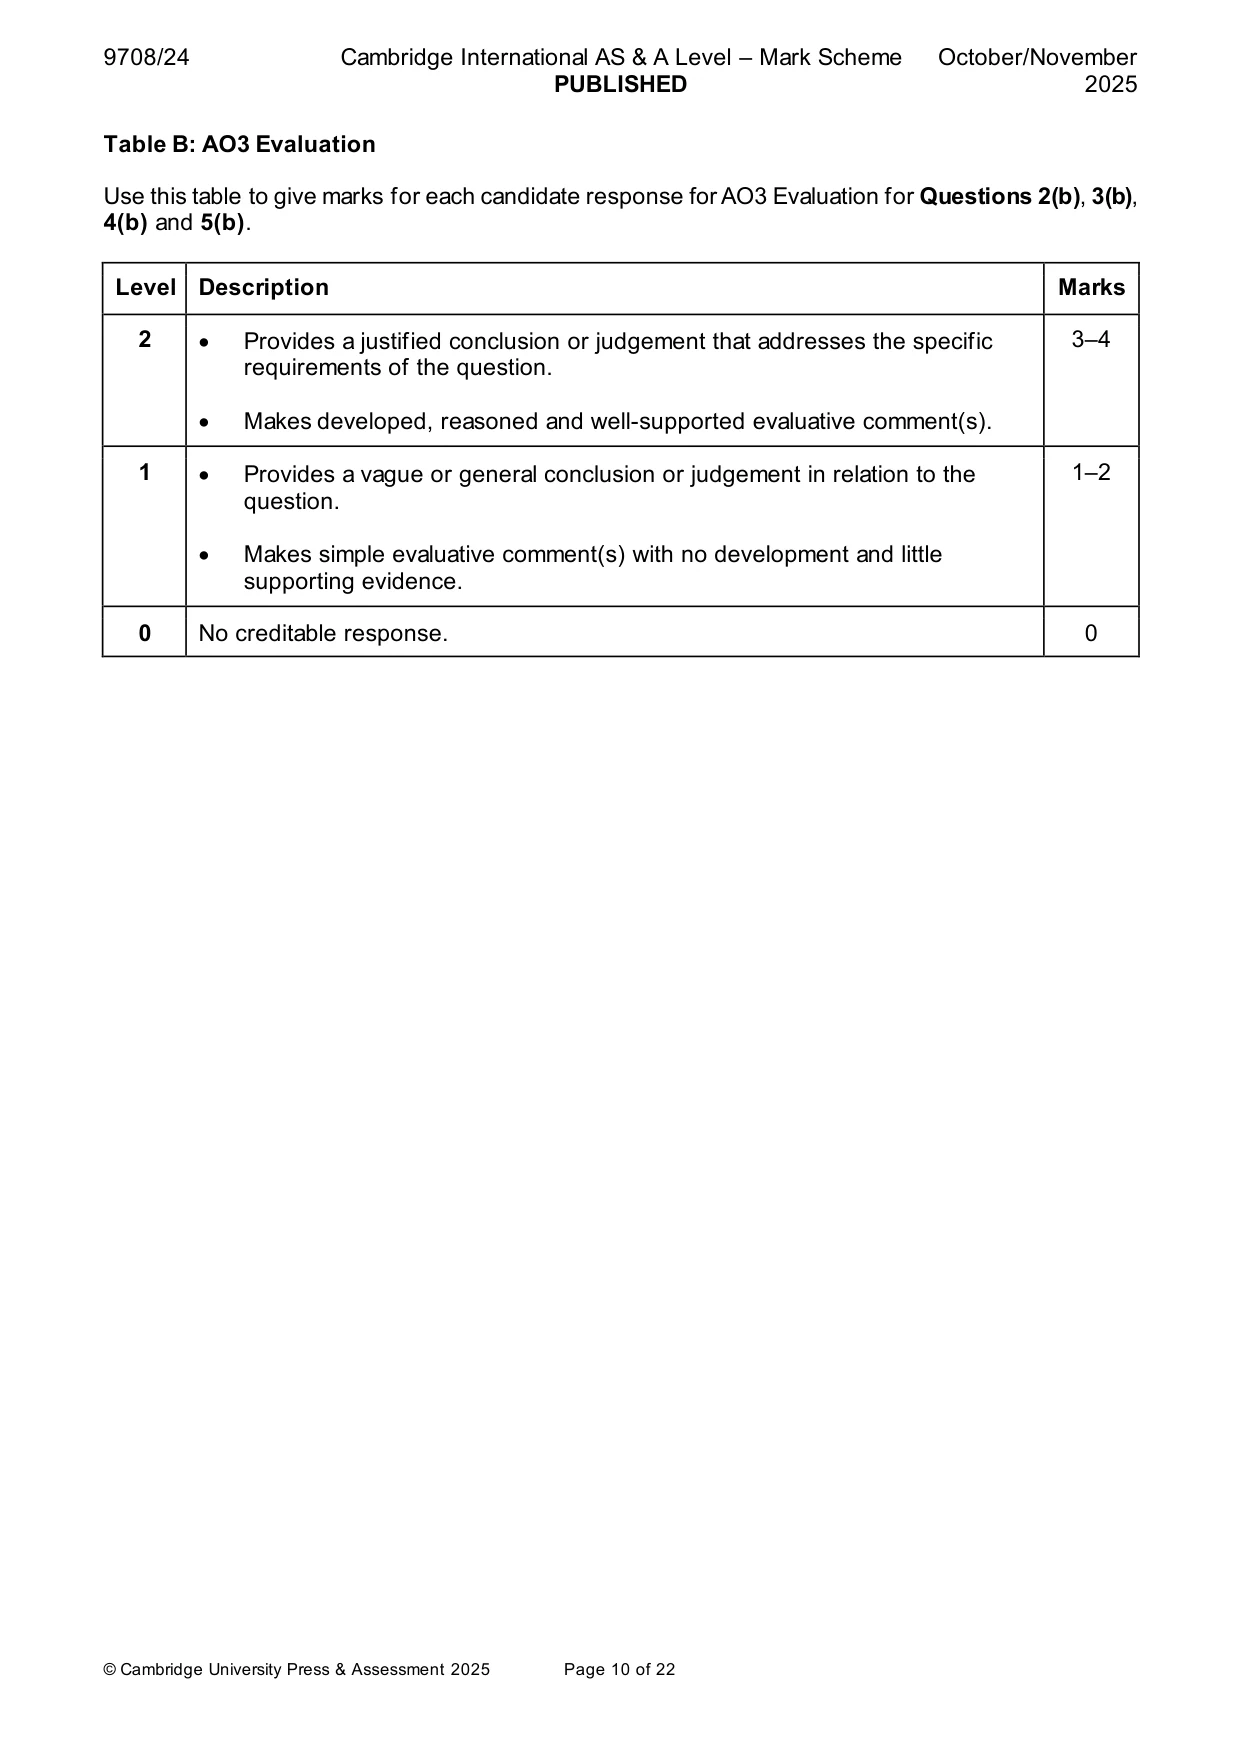
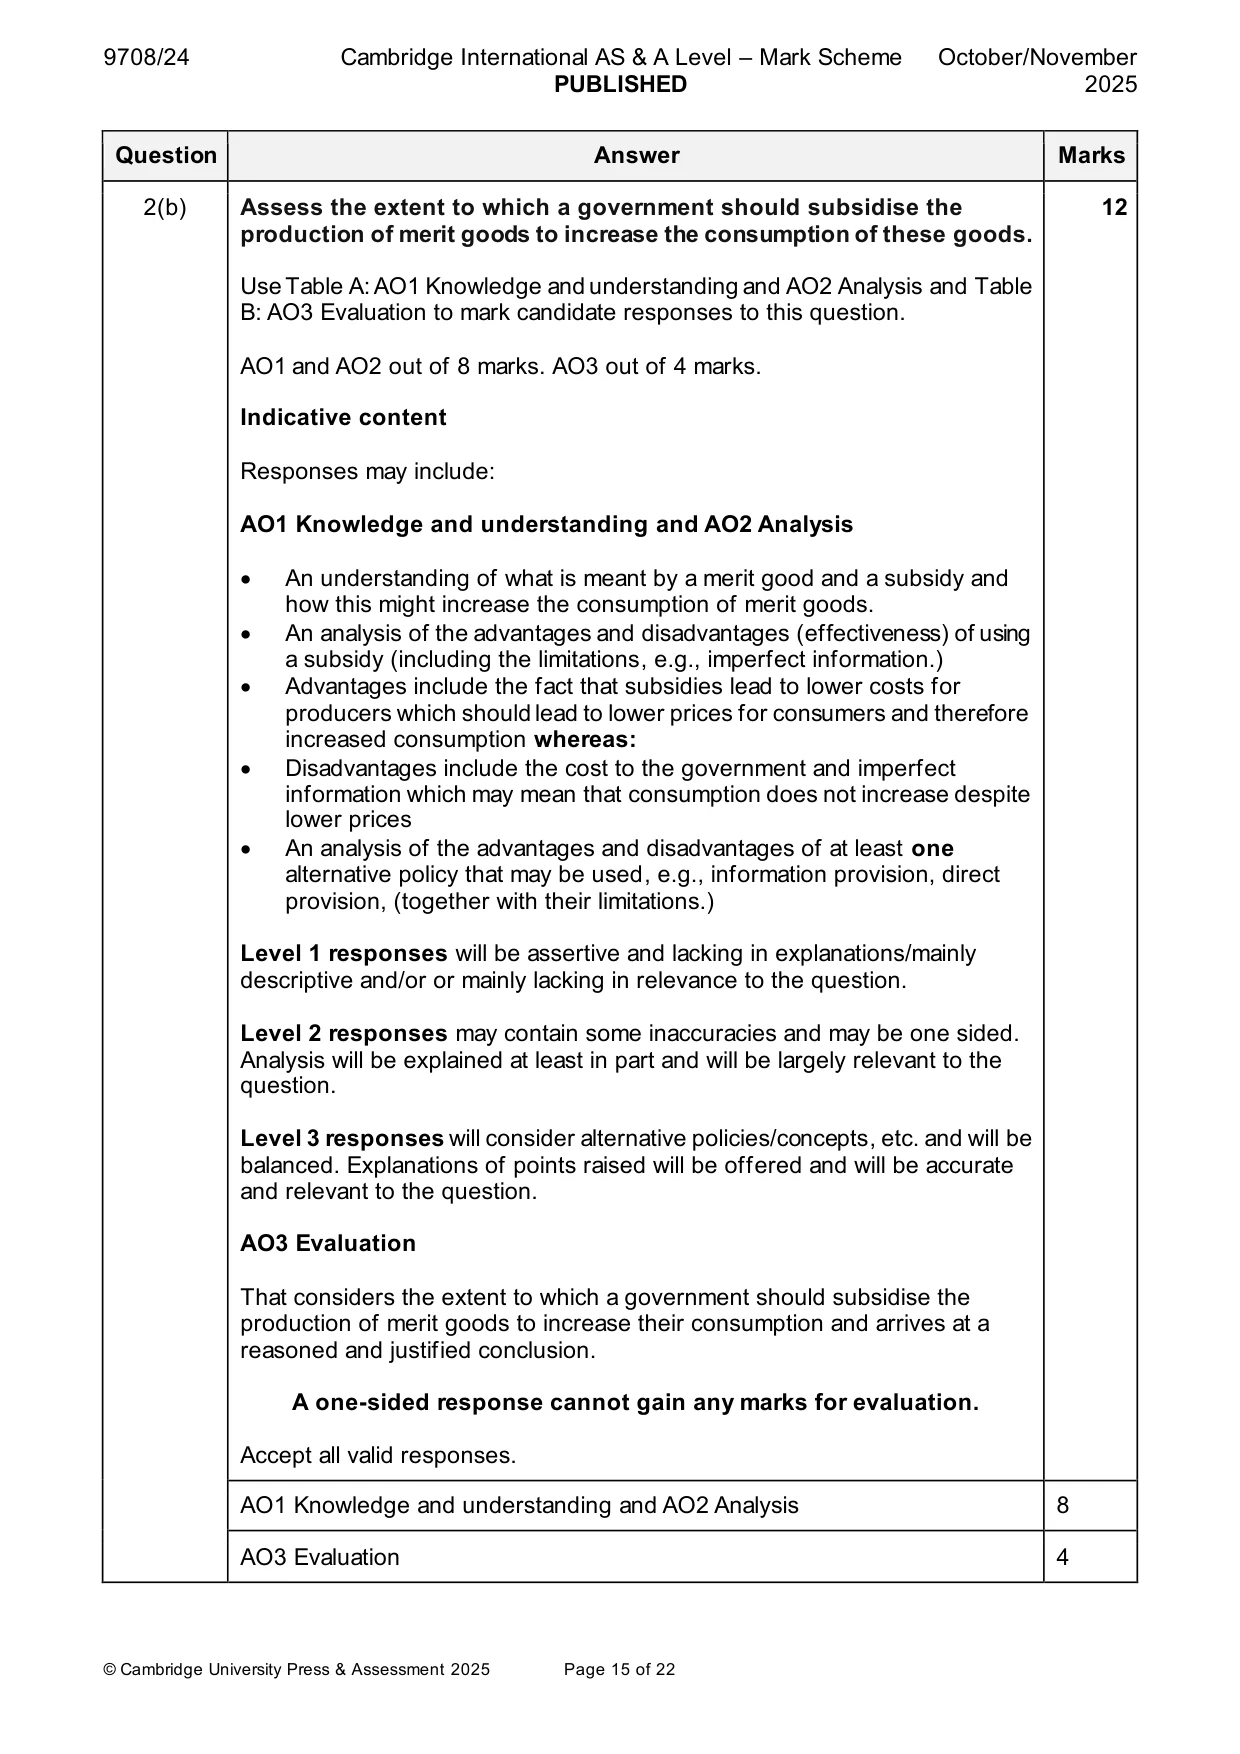
Mark scheme: 2(a) Explain what is meant by the incidence of an indirect tax and consider 8 the extent to which it is possible for the incidence to pass from a producer of a good to a consumer of that good. Follow the point-based marking guidance at the top of this mark scheme and award: up to 3 marks for AO1 Knowledge and understanding up to 3 marks for AO2 Analysis up to 2 marks for AO3 Evaluation. AO1 Knowledge and Understanding (max 3 marks) Of the meaning of an indirect tax and the incidence of an indirect tax. Note: a diagram is NOT essential but can be used, with a separate explanation, to show what is meant by an indirect tax and/or the incidence. • The incidence of tax refers to the extent of the burden/ proportion of tax borne by the producer and/ or consumer. (1) • An indirect tax is a tax placed on goods or services. (1) • It can be specific, i.e., a fixed amount per purchase or ad valorem, i.e., a % of the price charged by the retailer. (1) • Allow references to the fact that it is seen as regressive if explained, OR accurate examples OR that it can be used to reduce consumption of demerit goods or raise revenue for governments. (1) Award a maximum of two marks if no explanation of incidence. AO2 Analysis (max 3 marks) Of the possibility of passing the incidence from a producer to a consumer depending on PED. Note: a diagram is NOT essential but can be used, to assist an explanation in words, the possibility of passing the incidence from a producer to a consumer depending on PED. • The indirect tax has the effect of raising the price of the product or service by shifting the supply curve to the left. (1) • Analysis of the impact on the incidence if the PED is elastic. (1) • Analysis of the impact on the incidence if the PED is inelastic. (1) AO3 Evaluation (max 2 marks) The extent to which it is possible to pass the incidence of tax onto the consumer depends upon the PED. For explained assessment that it is more possible to pass on the incidence of tax to the consumer if the PED is inelastic. Note: the second mark is reserved for a justified conclusion. 2(a) AO1 Knowledge and understanding 3 AO2 Analysis 3 AO3 Evaluation 2 2(b) Assess the extent to which a government should subsidise the 12 production of merit goods to increase the consumption of these goods. Use Table A: AO1 Knowledge and understanding and AO2 Analysis and Table B: AO3 Evaluation to mark candidate responses to this question. AO1 and AO2 out of 8 marks. AO3 out of 4 marks. Indicative content Responses may include: AO1 Knowledge and understanding and AO2 Analysis • An understanding of what is meant by a merit good and a subsidy and how this might increase the consumption of merit goods. • An analysis of the advantages and disadvantages (effectiveness) of using a subsidy (including the limitations, e.g., imperfect information.) • Advantages include the fact that subsidies lead to lower costs for producers which should lead to lower prices for consumers and therefore increased consumption whereas: • Disadvantages include the cost to the government and imperfect information which may mean that consumption does not increase despite lower prices • An analysis of the advantages and disadvantages of at least one alternative policy that may be used, e.g., information provision, direct provision, (together with their limitations.) Level 1 responses will be assertive and lacking in explanations/mainly descriptive and/or or mainly lacking in relevance to the question. Level 2 responses may contain some inaccuracies and may be one sided. Analysis will be explained at least in part and will be largely relevant to the question. Level 3 responses will consider alternative policies/concepts, etc. and will be balanced. Explanations of points raised will be offered and will be accurate and relevant to the question. AO3 Evaluation That considers the extent to which a government should subsidise the production of merit goods to increase their consumption and arrives at a reasoned and justified conclusion. A one-sided response cannot gain any marks for evaluation. Accept all valid responses. AO1 Knowledge and understanding and AO2 Analysis 8 AO3 Evaluation 4
Q3 · Explain what determines elastic and inelastic price elasticity of supply (PES) and…
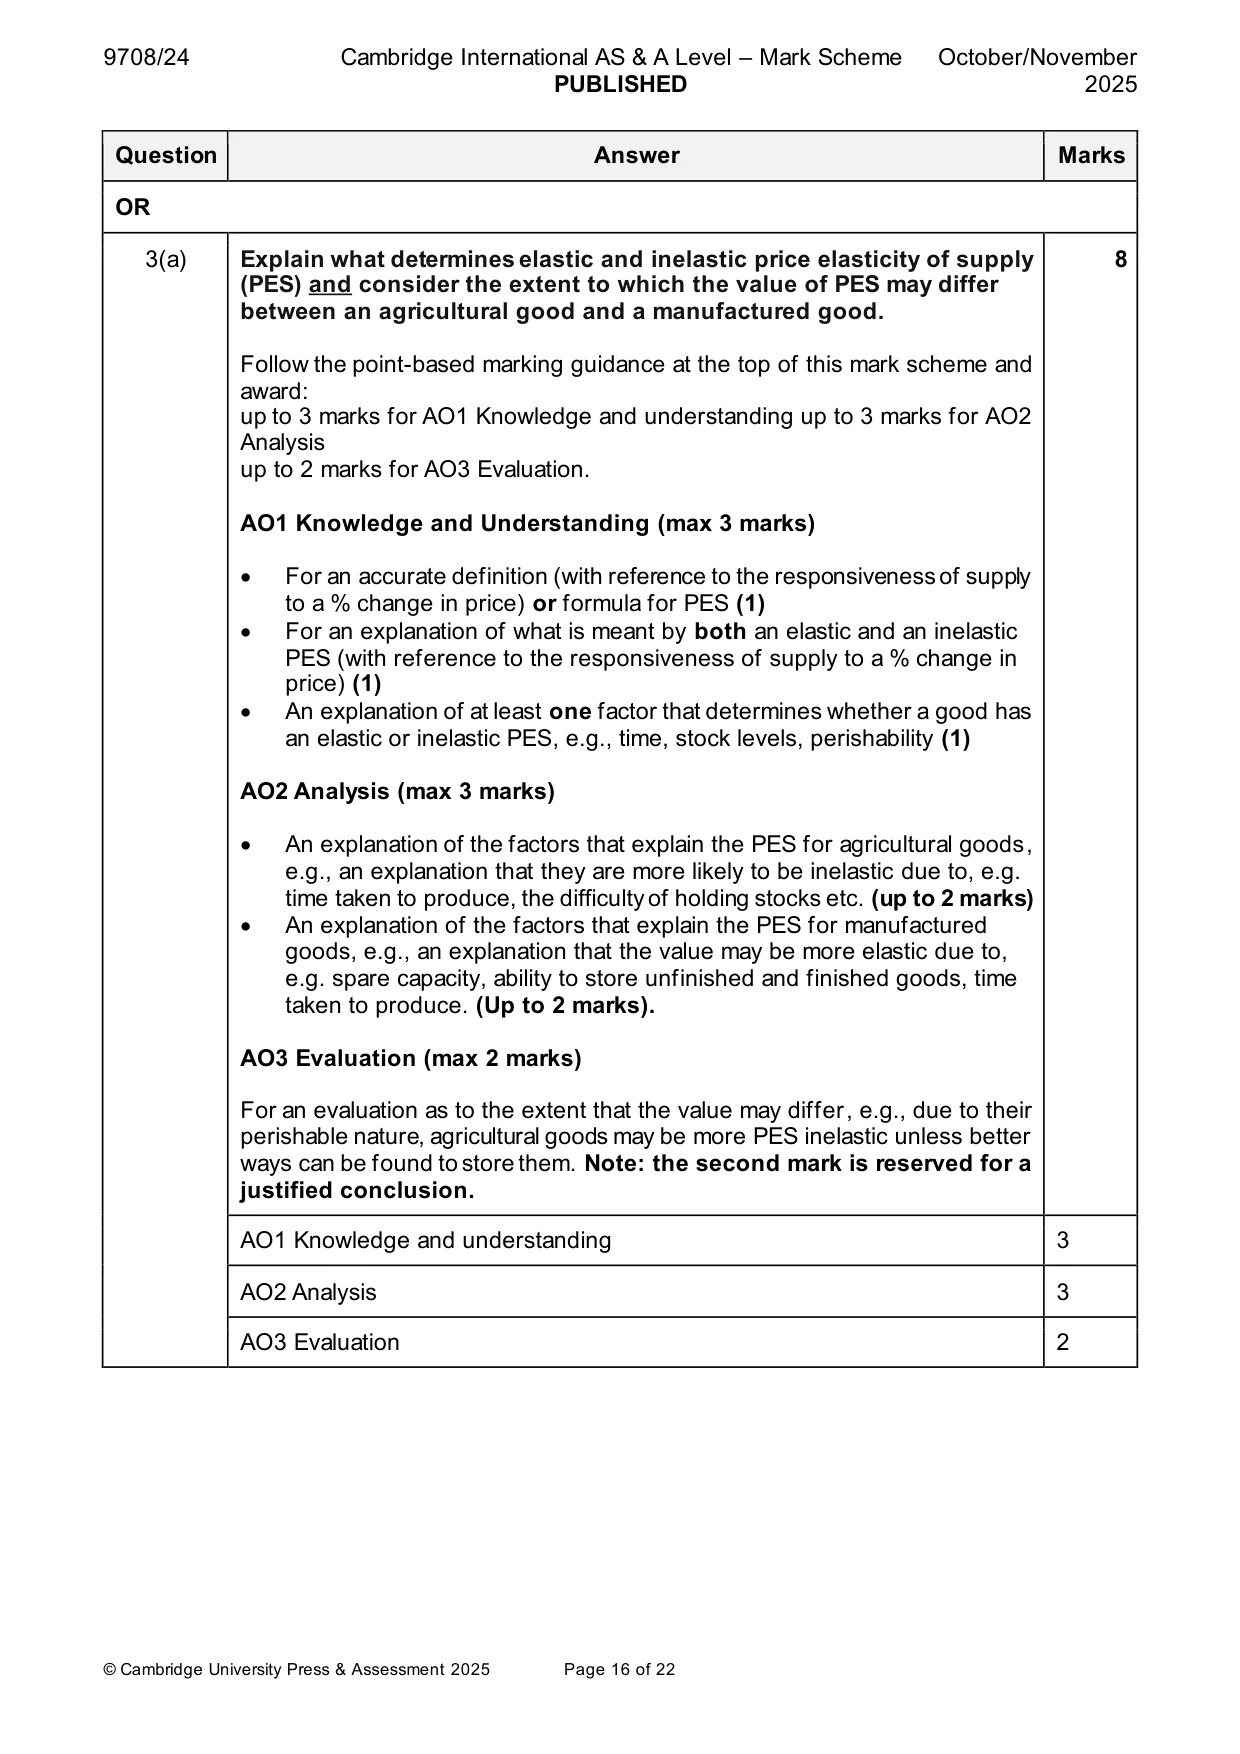
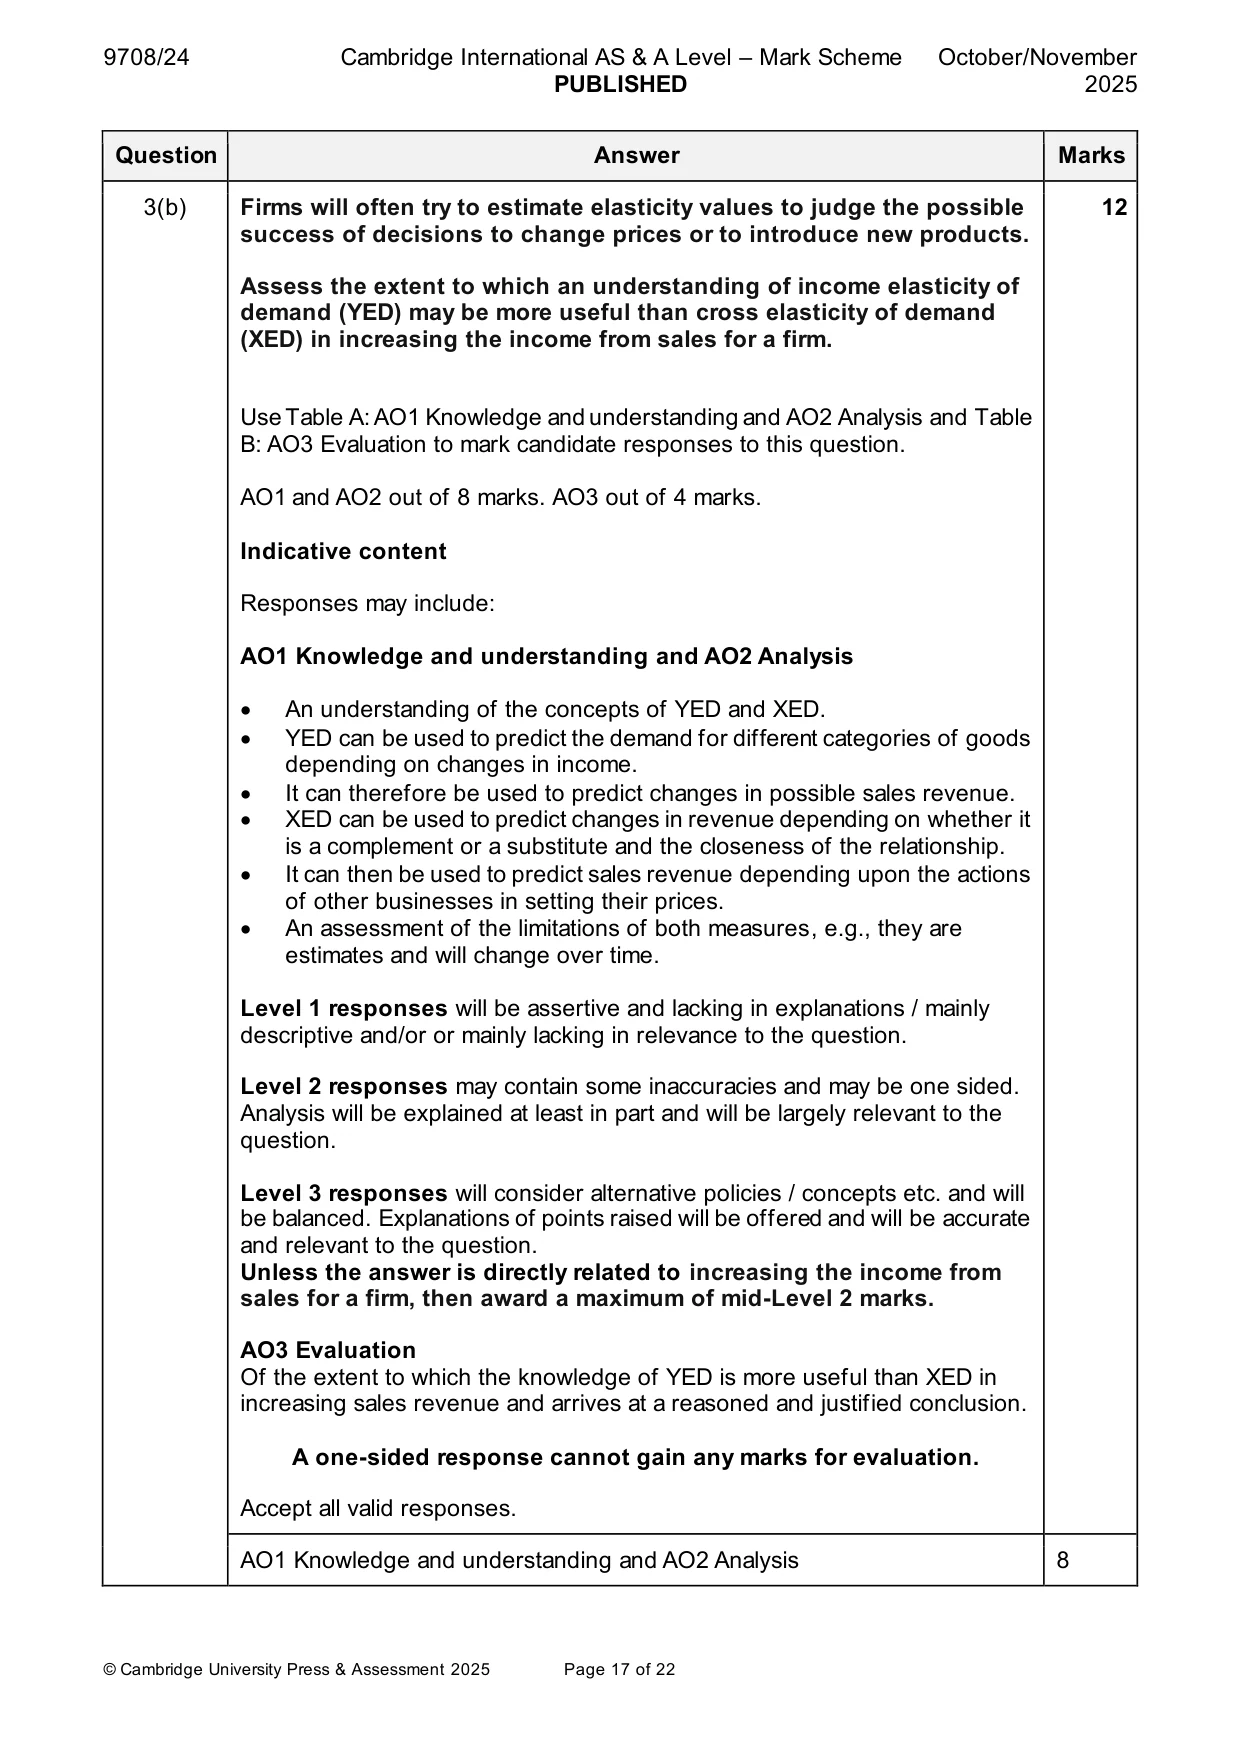
3 (a) Explain what determines elastic and inelastic price elasticity of supply (PES) and consider the extent to which the value of PES may differ between an agricultural good and a manufactured good. [8] (b) Firms will often try to estimate elasticity values to judge the possible success of decisions to change prices or to introduce new products. Assess the extent to which an understanding of income elasticity of demand (YED) may be more useful than cross elasticity of demand (XED) in increasing the income from sales for a firm. [12] Section C Answer one question. EITHER
Mark scheme: 3(a) Explain what determines elastic and inelastic price elasticity of supply 8 (PES) and consider the extent to which the value of PES may differ between an agricultural good and a manufactured good. Follow the point-based marking guidance at the top of this mark scheme and award: up to 3 marks for AO1 Knowledge and understanding up to 3 marks for AO2 Analysis up to 2 marks for AO3 Evaluation. AO1 Knowledge and Understanding (max 3 marks) • For an accurate definition (with reference to the responsiveness of supply to a % change in price) or formula for PES (1) • For an explanation of what is meant by both an elastic and an inelastic PES (with reference to the responsiveness of supply to a % change in price) (1) • An explanation of at least one factor that determines whether a good has an elastic or inelastic PES, e.g., time, stock levels, perishability (1) AO2 Analysis (max 3 marks) • An explanation of the factors that explain the PES for agricultural goods, e.g., an explanation that they are more likely to be inelastic due to, e.g. time taken to produce, the difficulty of holding stocks etc. (up to 2 marks) • An explanation of the factors that explain the PES for manufactured goods, e.g., an explanation that the value may be more elastic due to, e.g. spare capacity, ability to store unfinished and finished goods, time taken to produce. (Up to 2 marks). AO3 Evaluation (max 2 marks) For an evaluation as to the extent that the value may differ, e.g., due to their perishable nature, agricultural goods may be more PES inelastic unless better ways can be found to store them. Note: the second mark is reserved for a justified conclusion. AO1 Knowledge and understanding 3 AO2 Analysis 3 AO3 Evaluation 2 3(b) Firms will often try to estimate elasticity values to judge the possible 12 success of decisions to change prices or to introduce new products. Assess the extent to which an understanding of income elasticity of demand (YED) may be more useful than cross elasticity of demand (XED) in increasing the income from sales for a firm. Use Table A: AO1 Knowledge and understanding and AO2 Analysis and Table B: AO3 Evaluation to mark candidate responses to this question. AO1 and AO2 out of 8 marks. AO3 out of 4 marks. Indicative content Responses may include: AO1 Knowledge and understanding and AO2 Analysis • An understanding of the concepts of YED and XED. • YED can be used to predict the demand for different categories of goods depending on changes in income. • It can therefore be used to predict changes in possible sales revenue. • XED can be used to predict changes in revenue depending on whether it is a complement or a substitute and the closeness of the relationship. • It can then be used to predict sales revenue depending upon the actions of other businesses in setting their prices. • An assessment of the limitations of both measures, e.g., they are estimates and will change over time. Level 1 responses will be assertive and lacking in explanations / mainly descriptive and/or or mainly lacking in relevance to the question. Level 2 responses may contain some inaccuracies and may be one sided. Analysis will be explained at least in part and will be largely relevant to the question. Level 3 responses will consider alternative policies / concepts etc. and will be balanced. Explanations of points raised will be offered and will be accurate and relevant to the question. Unless the answer is directly related to increasing the income from sales for a firm, then award a maximum of mid-Level 2 marks. AO3 Evaluation Of the extent to which the knowledge of YED is more useful than XED in increasing sales revenue and arrives at a reasoned and justified conclusion. A one-sided response cannot gain any marks for evaluation. Accept all valid responses. AO1 Knowledge and understanding and AO2 Analysis 8 3(b) AO3 Evaluation 4 Section C
More questions on Price elasticity, income elasticity and cross elasticity of demand
Q4 · Using two tools of protection, explain what is meant by protectionism and consider the…
4 (a) Using two tools of protection, explain what is meant by protectionism and consider the extent to which these two tools may benefit an economy. [8] (b) Assess the extent to which the principle of comparative advantage should be the main factor to consider when countries decide whether to trade with each other. [12] OR
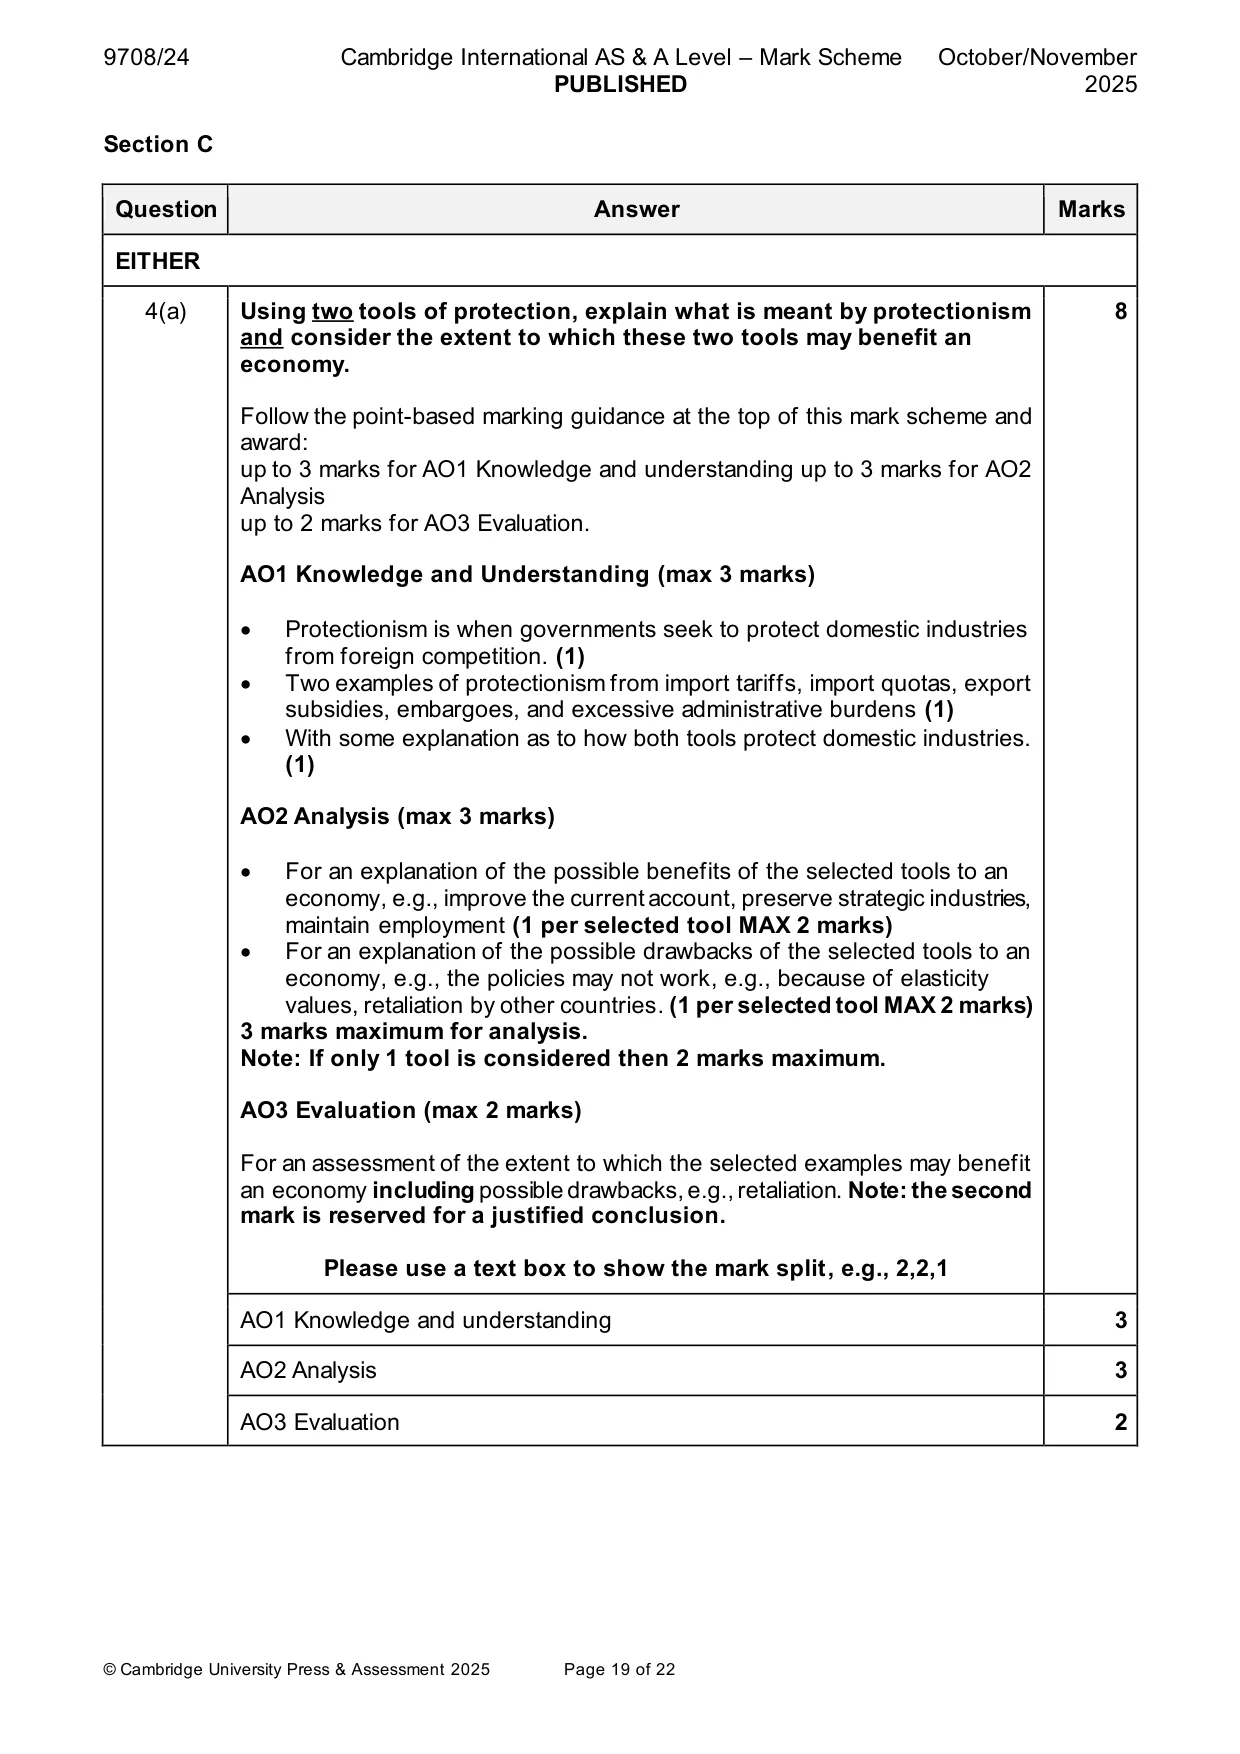
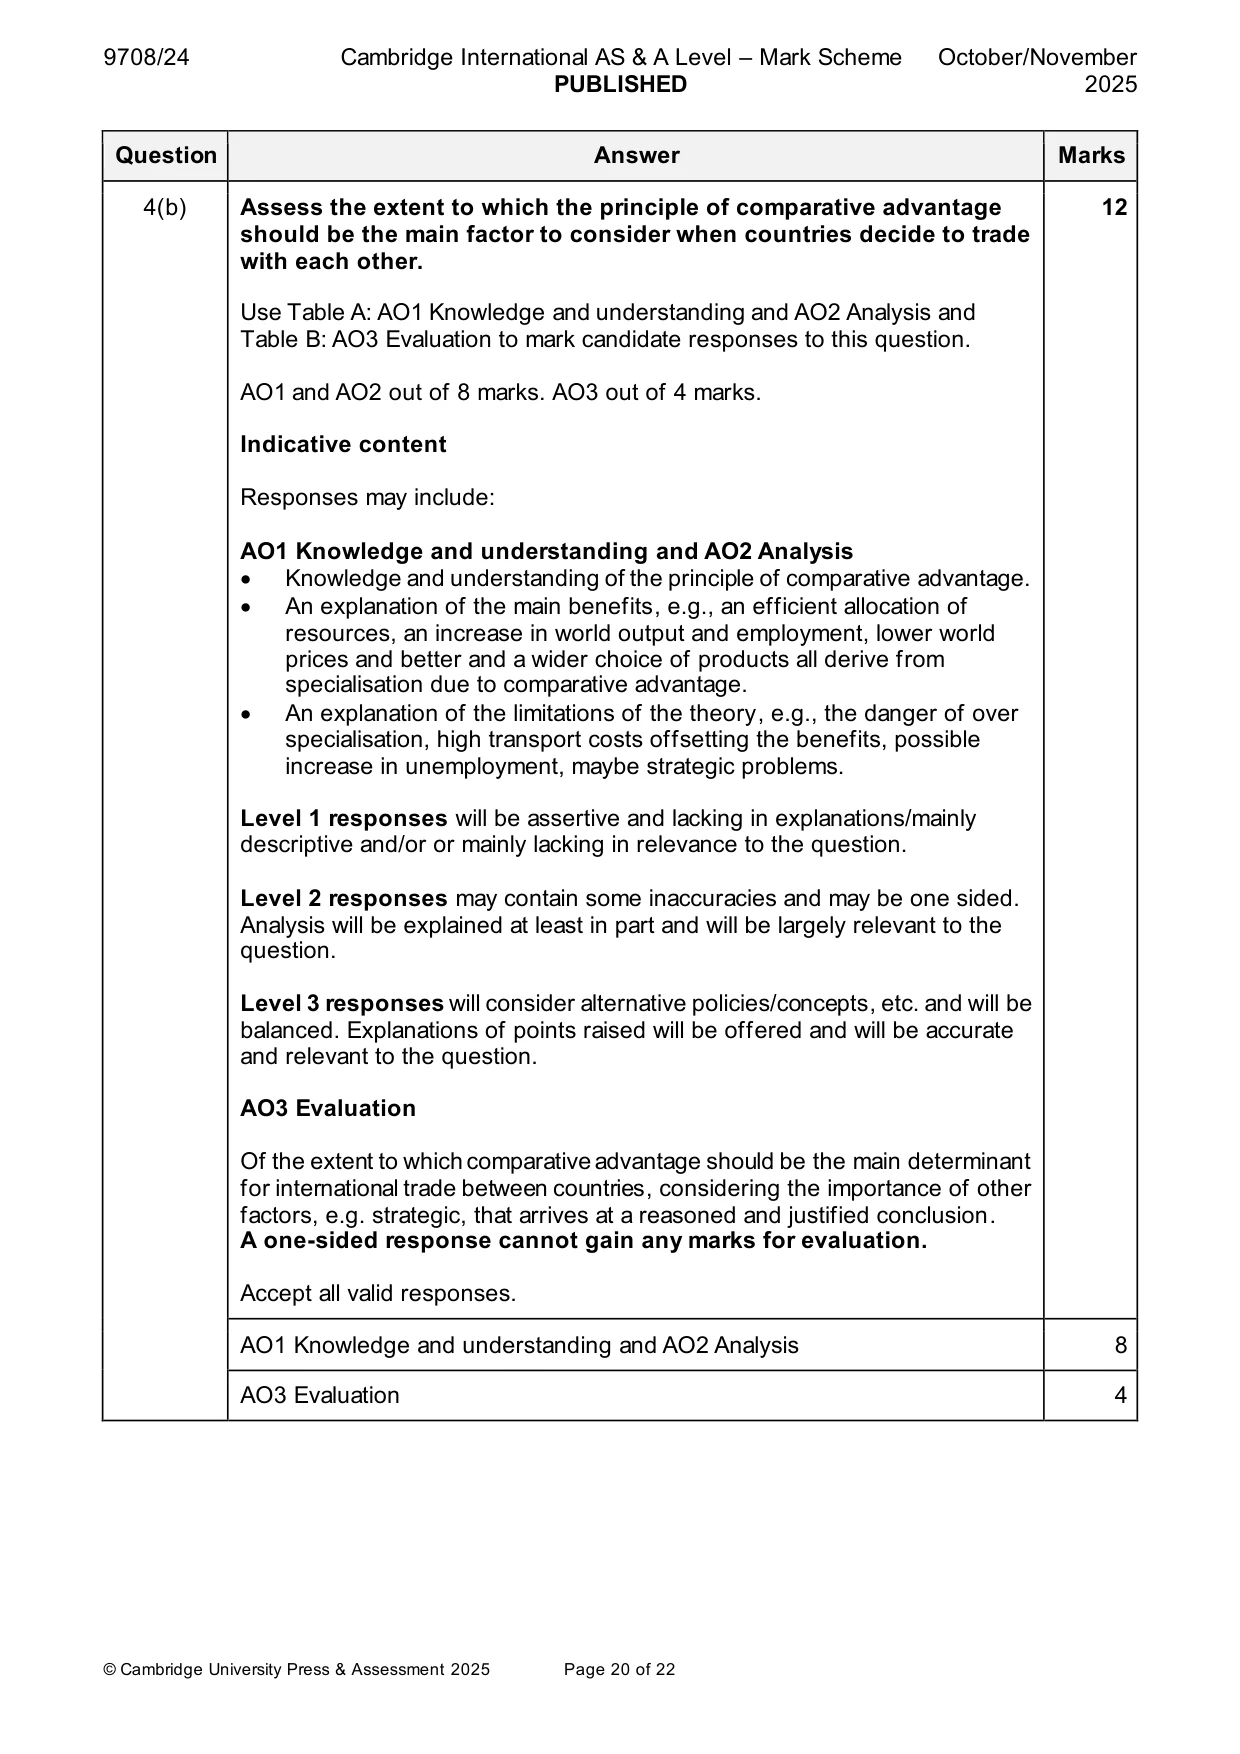
Mark scheme: 4(a) Using two tools of protection, explain what is meant by protectionism 8 and consider the extent to which these two tools may benefit an economy. Follow the point-based marking guidance at the top of this mark scheme and award: up to 3 marks for AO1 Knowledge and understanding up to 3 marks for AO2 Analysis up to 2 marks for AO3 Evaluation. AO1 Knowledge and Understanding (max 3 marks) • Protectionism is when governments seek to protect domestic industries from foreign competition. (1) • Two examples of protectionism from import tariffs, import quotas, export subsidies, embargoes, and excessive administrative burdens (1) • With some explanation as to how both tools protect domestic industries. (1) AO2 Analysis (max 3 marks) • For an explanation of the possible benefits of the selected tools to an economy, e.g., improve the current account, preserve strategic industries, maintain employment (1 per selected tool MAX 2 marks) • For an explanation of the possible drawbacks of the selected tools to an economy, e.g., the policies may not work, e.g., because of elasticity values, retaliation by other countries. (1 per selected tool MAX 2 marks) 3 marks maximum for analysis. Note: If only 1 tool is considered then 2 marks maximum. AO3 Evaluation (max 2 marks) For an assessment of the extent to which the selected examples may benefit an economy including possible drawbacks, e.g., retaliation. Note: the second mark is reserved for a justified conclusion. Please use a text box to show the mark split, e.g., 2,2,1 AO1 Knowledge and understanding 3 AO2 Analysis 3 AO3 Evaluation 2 4(b) Assess the extent to which the principle of comparative advantage 12 should be the main factor to consider when countries decide to trade with each other. Use Table A: AO1 Knowledge and understanding and AO2 Analysis and Table B: AO3 Evaluation to mark candidate responses to this question. AO1 and AO2 out of 8 marks. AO3 out of 4 marks. Indicative content Responses may include: AO1 Knowledge and understanding and AO2 Analysis • Knowledge and understanding of the principle of comparative advantage. • An explanation of the main benefits, e.g., an efficient allocation of resources, an increase in world output and employment, lower world prices and better and a wider choice of products all derive from specialisation due to comparative advantage. • An explanation of the limitations of the theory, e.g., the danger of over specialisation, high transport costs offsetting the benefits, possible increase in unemployment, maybe strategic problems. Level 1 responses will be assertive and lacking in explanations/mainly descriptive and/or or mainly lacking in relevance to the question. Level 2 responses may contain some inaccuracies and may be one sided. Analysis will be explained at least in part and will be largely relevant to the question. Level 3 responses will consider alternative policies/concepts, etc. and will be balanced. Explanations of points raised will be offered and will be accurate and relevant to the question. AO3 Evaluation Of the extent to which comparative advantage should be the main determinant for international trade between countries, considering the importance of other factors, e.g. strategic, that arrives at a reasoned and justified conclusion. A one-sided response cannot gain any marks for evaluation. Accept all valid responses. AO1 Knowledge and understanding and AO2 Analysis 8 AO3 Evaluation 4
Q5 · Explain the difference between structural unemployment and cyclical unemployment and…
5 (a) Explain the difference between structural unemployment and cyclical unemployment and consider the extent to which structural unemployment is likely to be more damaging to an economy than cyclical unemployment. [8] (b) Low unemployment is a macroeconomic policy objective for a government. Assess the extent to which this is most likely to be achieved by supply-side policy. [12]
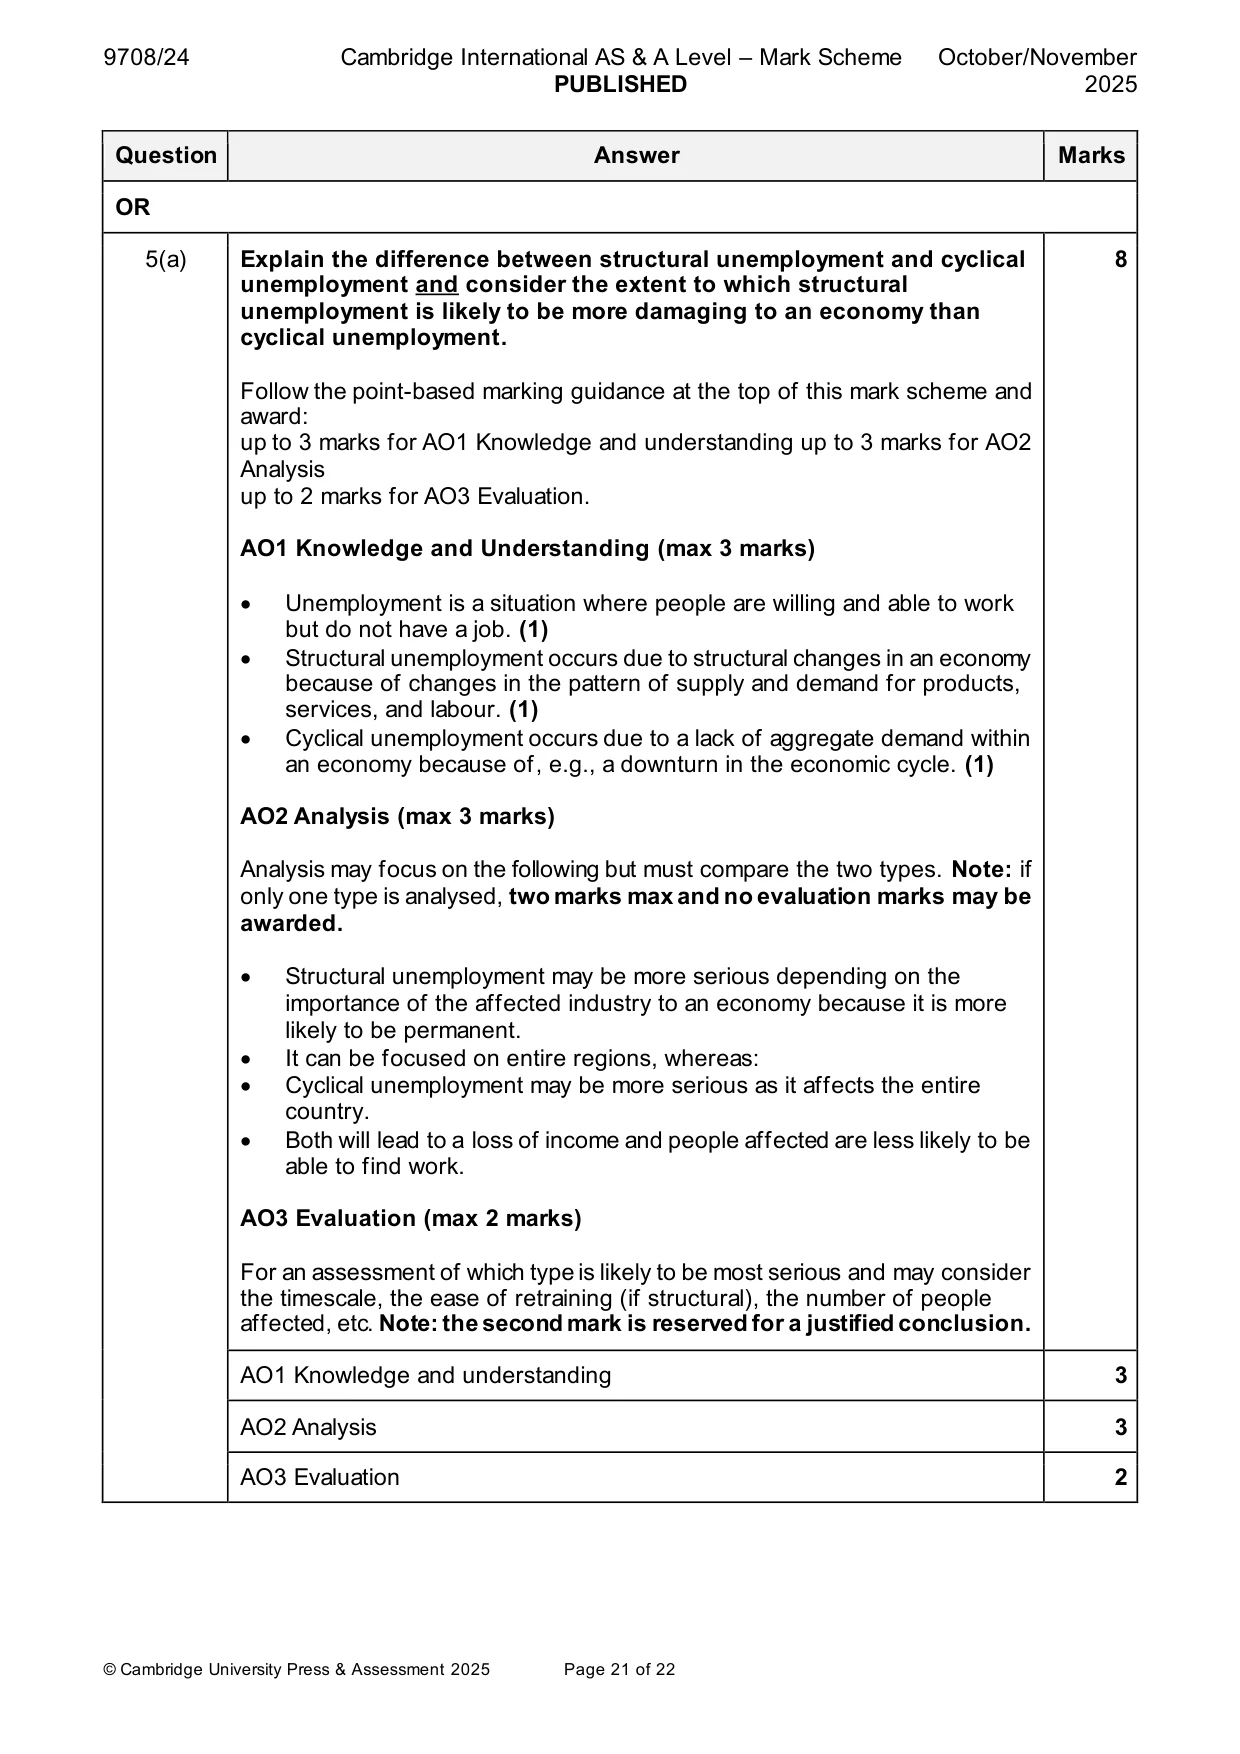
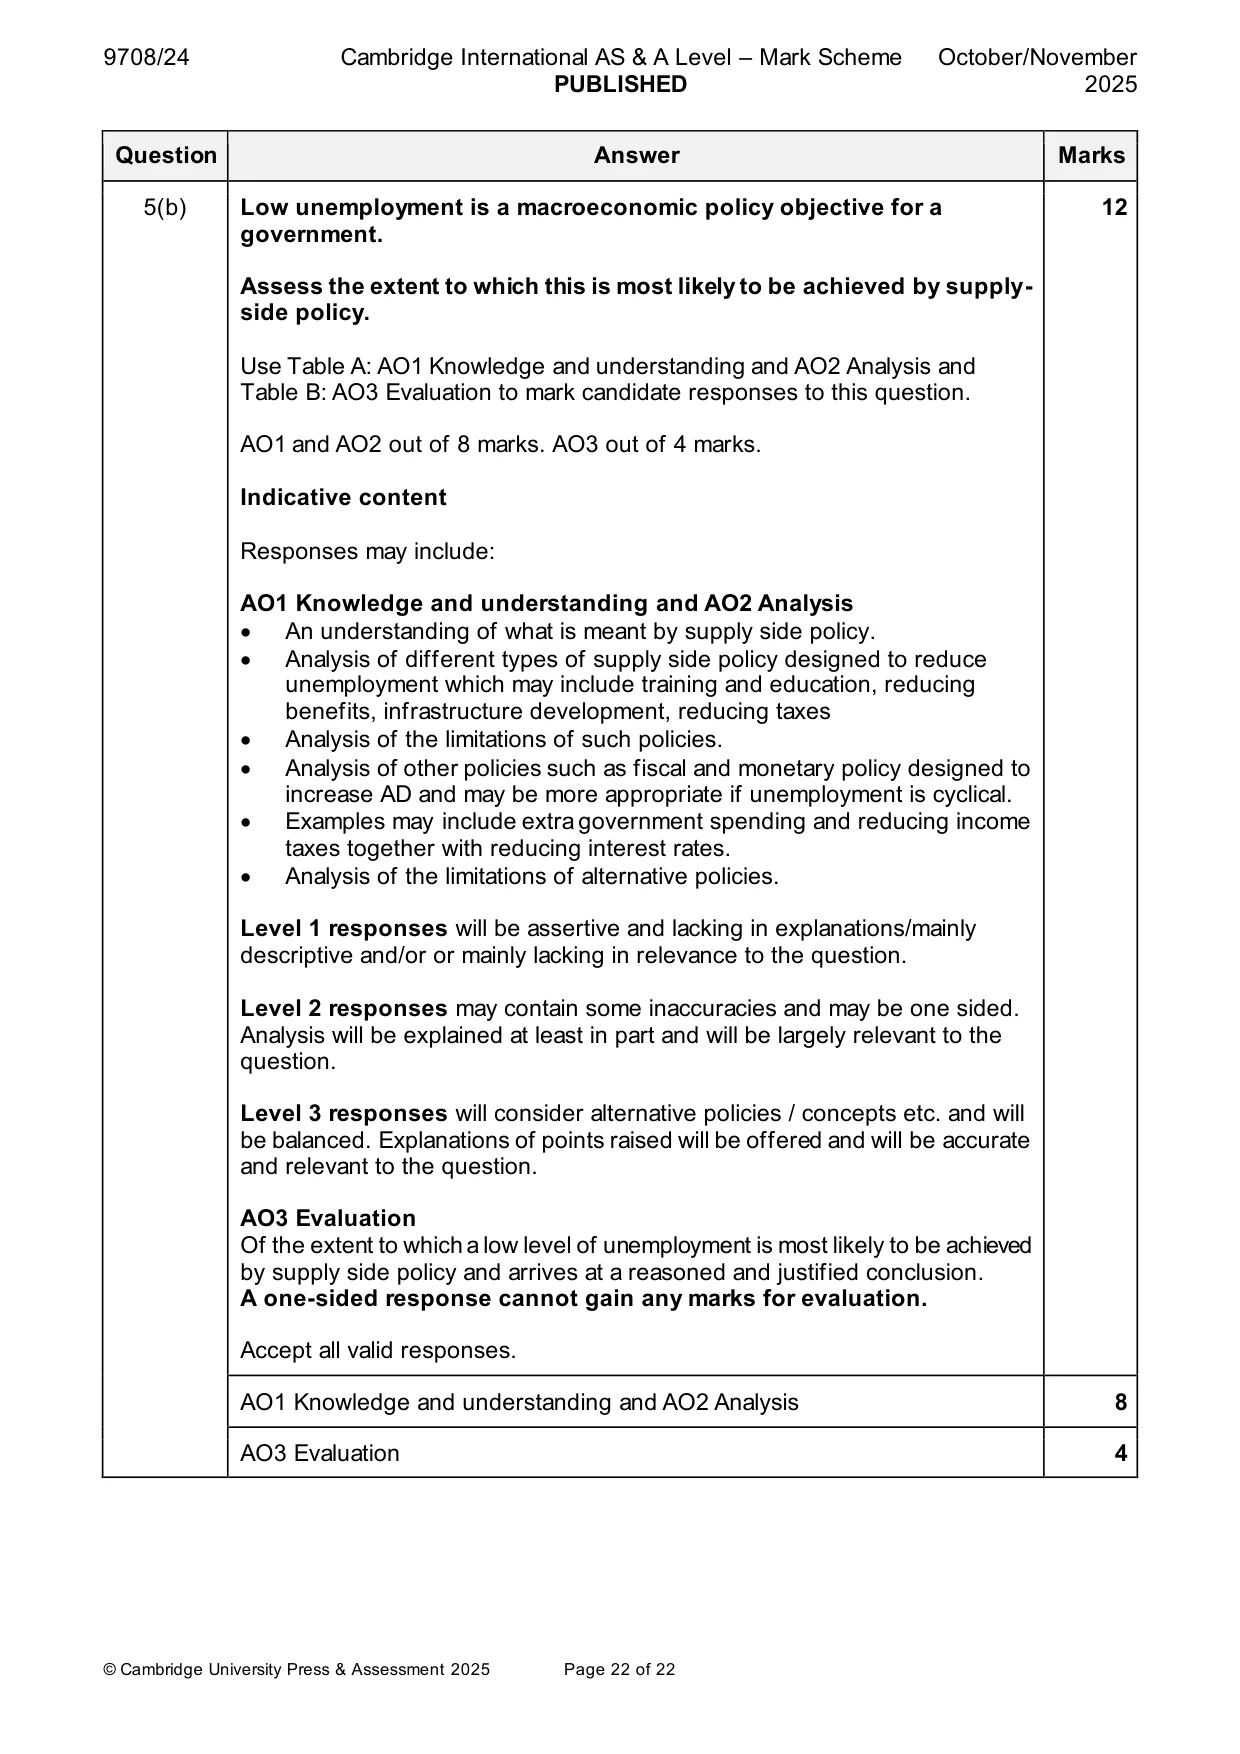
Mark scheme: 5(a) Explain the difference between structural unemployment and cyclical 8 unemployment and consider the extent to which structural unemployment is likely to be more damaging to an economy than cyclical unemployment. Follow the point-based marking guidance at the top of this mark scheme and award: up to 3 marks for AO1 Knowledge and understanding up to 3 marks for AO2 Analysis up to 2 marks for AO3 Evaluation. AO1 Knowledge and Understanding (max 3 marks) • Unemployment is a situation where people are willing and able to work but do not have a job. (1) • Structural unemployment occurs due to structural changes in an economy because of changes in the pattern of supply and demand for products, services, and labour. (1) • Cyclical unemployment occurs due to a lack of aggregate demand within an economy because of, e.g., a downturn in the economic cycle. (1) AO2 Analysis (max 3 marks) Analysis may focus on the following but must compare the two types. Note: if only one type is analysed, two marks max and no evaluation marks may be awarded. • Structural unemployment may be more serious depending on the importance of the affected industry to an economy because it is more likely to be permanent. • It can be focused on entire regions, whereas: • Cyclical unemployment may be more serious as it affects the entire country. • Both will lead to a loss of income and people affected are less likely to be able to find work. AO3 Evaluation (max 2 marks) For an assessment of which type is likely to be most serious and may consider the timescale, the ease of retraining (if structural), the number of people affected, etc. Note: the second mark is reserved for a justified conclusion. AO1 Knowledge and understanding 3 AO2 Analysis 3 AO3 Evaluation 2 5(b) Low unemployment is a macroeconomic policy objective for a 12 government. Assess the extent to which this is most likely to be achieved by supply- side policy. Use Table A: AO1 Knowledge and understanding and AO2 Analysis and Table B: AO3 Evaluation to mark candidate responses to this question. AO1 and AO2 out of 8 marks. AO3 out of 4 marks. Indicative content Responses may include: AO1 Knowledge and understanding and AO2 Analysis • An understanding of what is meant by supply side policy. • Analysis of different types of supply side policy designed to reduce unemployment which may include training and education, reducing benefits, infrastructure development, reducing taxes • Analysis of the limitations of such policies. • Analysis of other policies such as fiscal and monetary policy designed to increase AD and may be more appropriate if unemployment is cyclical. • Examples may include extra government spending and reducing income taxes together with reducing interest rates. • Analysis of the limitations of alternative policies. Level 1 responses will be assertive and lacking in explanations/mainly descriptive and/or or mainly lacking in relevance to the question. Level 2 responses may contain some inaccuracies and may be one sided. Analysis will be explained at least in part and will be largely relevant to the question. Level 3 responses will consider alternative policies / concepts etc. and will be balanced. Explanations of points raised will be offered and will be accurate and relevant to the question. AO3 Evaluation Of the extent to which a low level of unemployment is most likely to be achieved by supply side policy and arrives at a reasoned and justified conclusion. A one-sided response cannot gain any marks for evaluation. Accept all valid responses. AO1 Knowledge and understanding and AO2 Analysis 8 AO3 Evaluation 4
What was in this paper
The subtopics covered by these 5 questions, and how many questions each got. Open one in a new tab to see every Cambridge question on it.
What you needed in this session
Cambridge’s own grade thresholds for 2025 Oct/Nov, Paper 2 · Variant 4. A higher threshold means an easier paper — the bar moves with how the cohort did.