Cambridge A Level Economics 9708 — 2024 May/June Paper 2 · Variant 3
9708/23/M/J/24 · 5 questions · 60 marks · ≈68 min
The question paper and its mark scheme, free to read here and free to download. This is Cambridge’s own paper, exactly as it was sat.
Question paper4 pages
Mark scheme16 pages
Answers below. Sit the paper first if you are practising.

Questions as text
Q1 · Turkey’s unconventional way of managing its economy The relationship between interest…
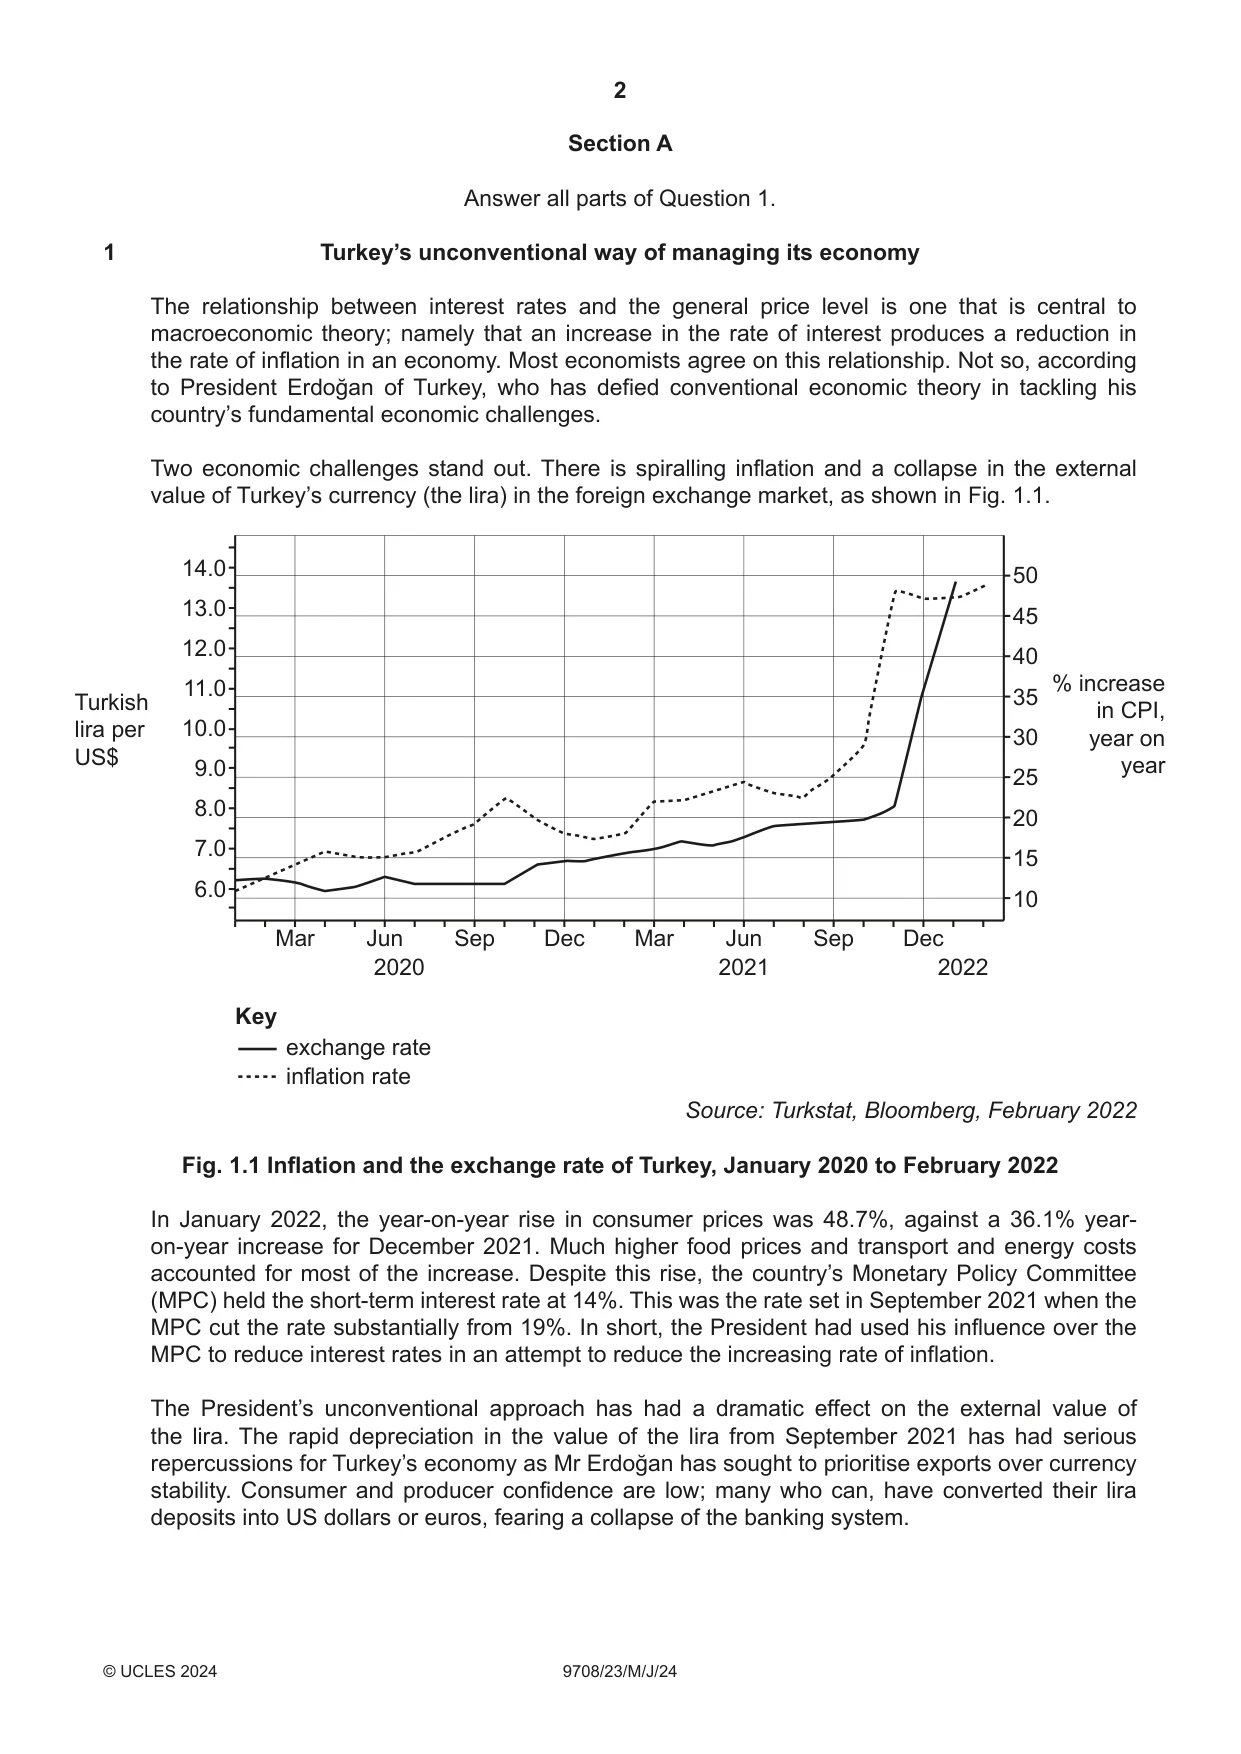
1 Turkey’s unconventional way of managing its economy The relationship between interest rates and the general price level is one that is central to macroeconomic theory; namely that an increase in the rate of interest produces a reduction in the rate of inflation in an economy. Most economists agree on this relationship. Not so, according to President Erdoğan of Turkey, who has defied conventional economic theory in tackling his country’s fundamental economic challenges. Two economic challenges stand out. There is spiralling inflation and a collapse in the external value of Turkey’s currency (the lira) in the foreign exchange market, as shown in Fig. 1.1. 14.0 50 13.0 45 12.0 40 11.0 % increaseTurkish 35 in CPI, lira per 10.0 30 year on US$ 9.0 year 25 8.0 20 7.0 15 6.0 10 Mar Jun Sep Dec Mar Jun Sep Dec 2020 2021 2022 Key exchange rate inflation rate Source: Turkstat, Bloomberg, February 2022 Fig. 1.1 Inflation and the exchange rate of Turkey, January 2020 to February 2022 In January 2022, the year-on-year rise in consumer prices was 48.7%, against a 36.1% year- on-year increase for December 2021. Much higher food prices and transport and energy costs accounted for most of the increase. Despite this rise, the country’s Monetary Policy Committee (MPC) held the short-term interest rate at 14%. This was the rate set in September 2021 when the MPC cut the rate substantially from 19%. In short, the President had used his influence over the MPC to reduce interest rates in an attempt to reduce the increasing rate of inflation. The President’s unconventional approach has had a dramatic effect on the external value of the lira. The rapid depreciation in the value of the lira from September 2021 has had serious repercussions for Turkey’s economy as Mr Erdoğan has sought to prioritise exports over currency stability. Consumer and producer confidence are low; many who can, have converted their lira deposits into US dollars or euros, fearing a collapse of the banking system. Despite these problems, the President remains adamant that his economics is right for Turkey. Moreover, he is convinced that when exports increase and international tourists return after the COVID-19 pandemic, employment will increase and the current account deficit on the balance of payments will be reduced. If true, this unconventional approach to Turkey’s economic problems will be proved to be a success. (a) Use the information provided to calculate the real interest rate for Turkey in January 2022. [2] (b) (i) Explain why the Turkish lira depreciated from September 2021. [2] (ii) Consider the extent to which producers in Turkey are likely to have been affected by the depreciation of the lira on the foreign exchange market from September 2021. [4] (c) Assess whether Mr Erdoğan’s economic policies have had a beneficial impact on Turkey’s economy since 2020. [6] (d) Excluding interest rate changes, assess what alternative policies might be used to reduce Turkey’s rate of inflation. [6]
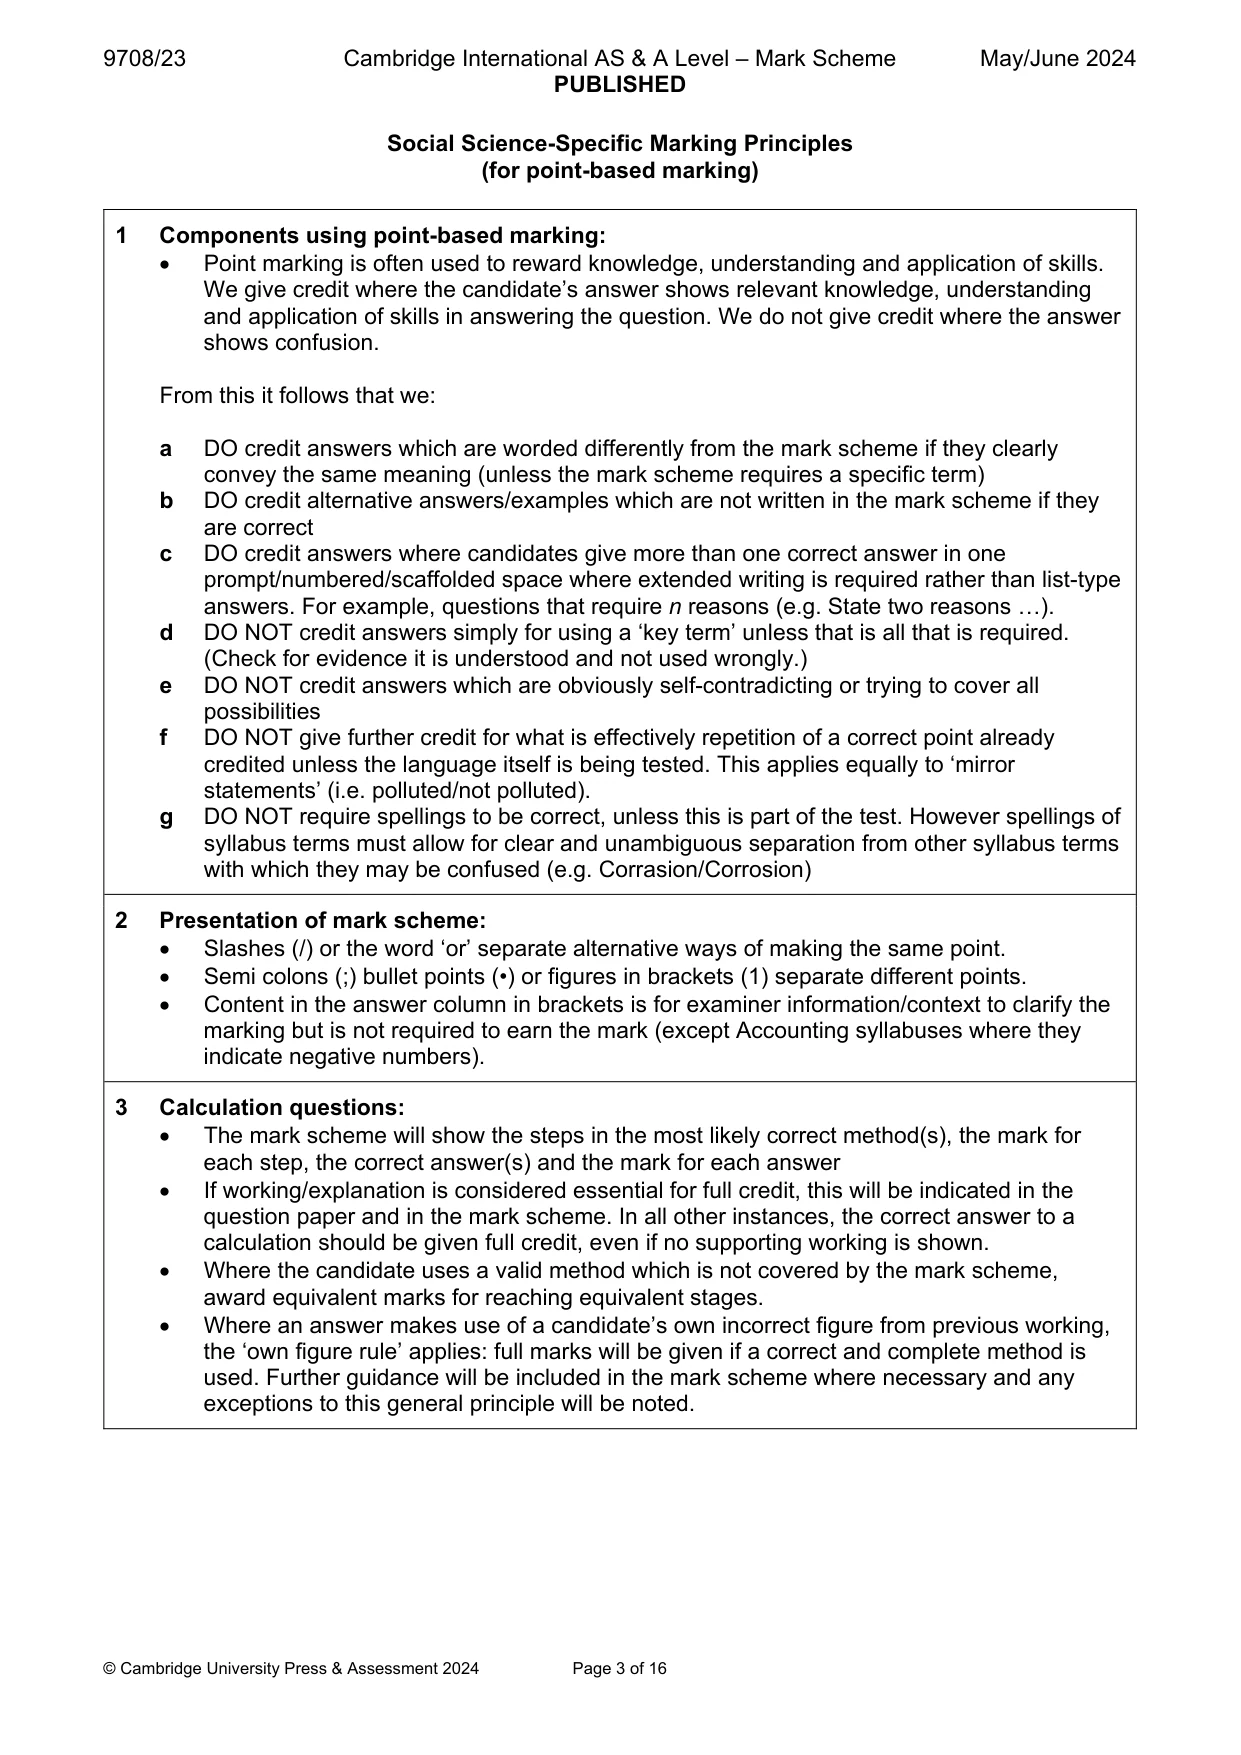
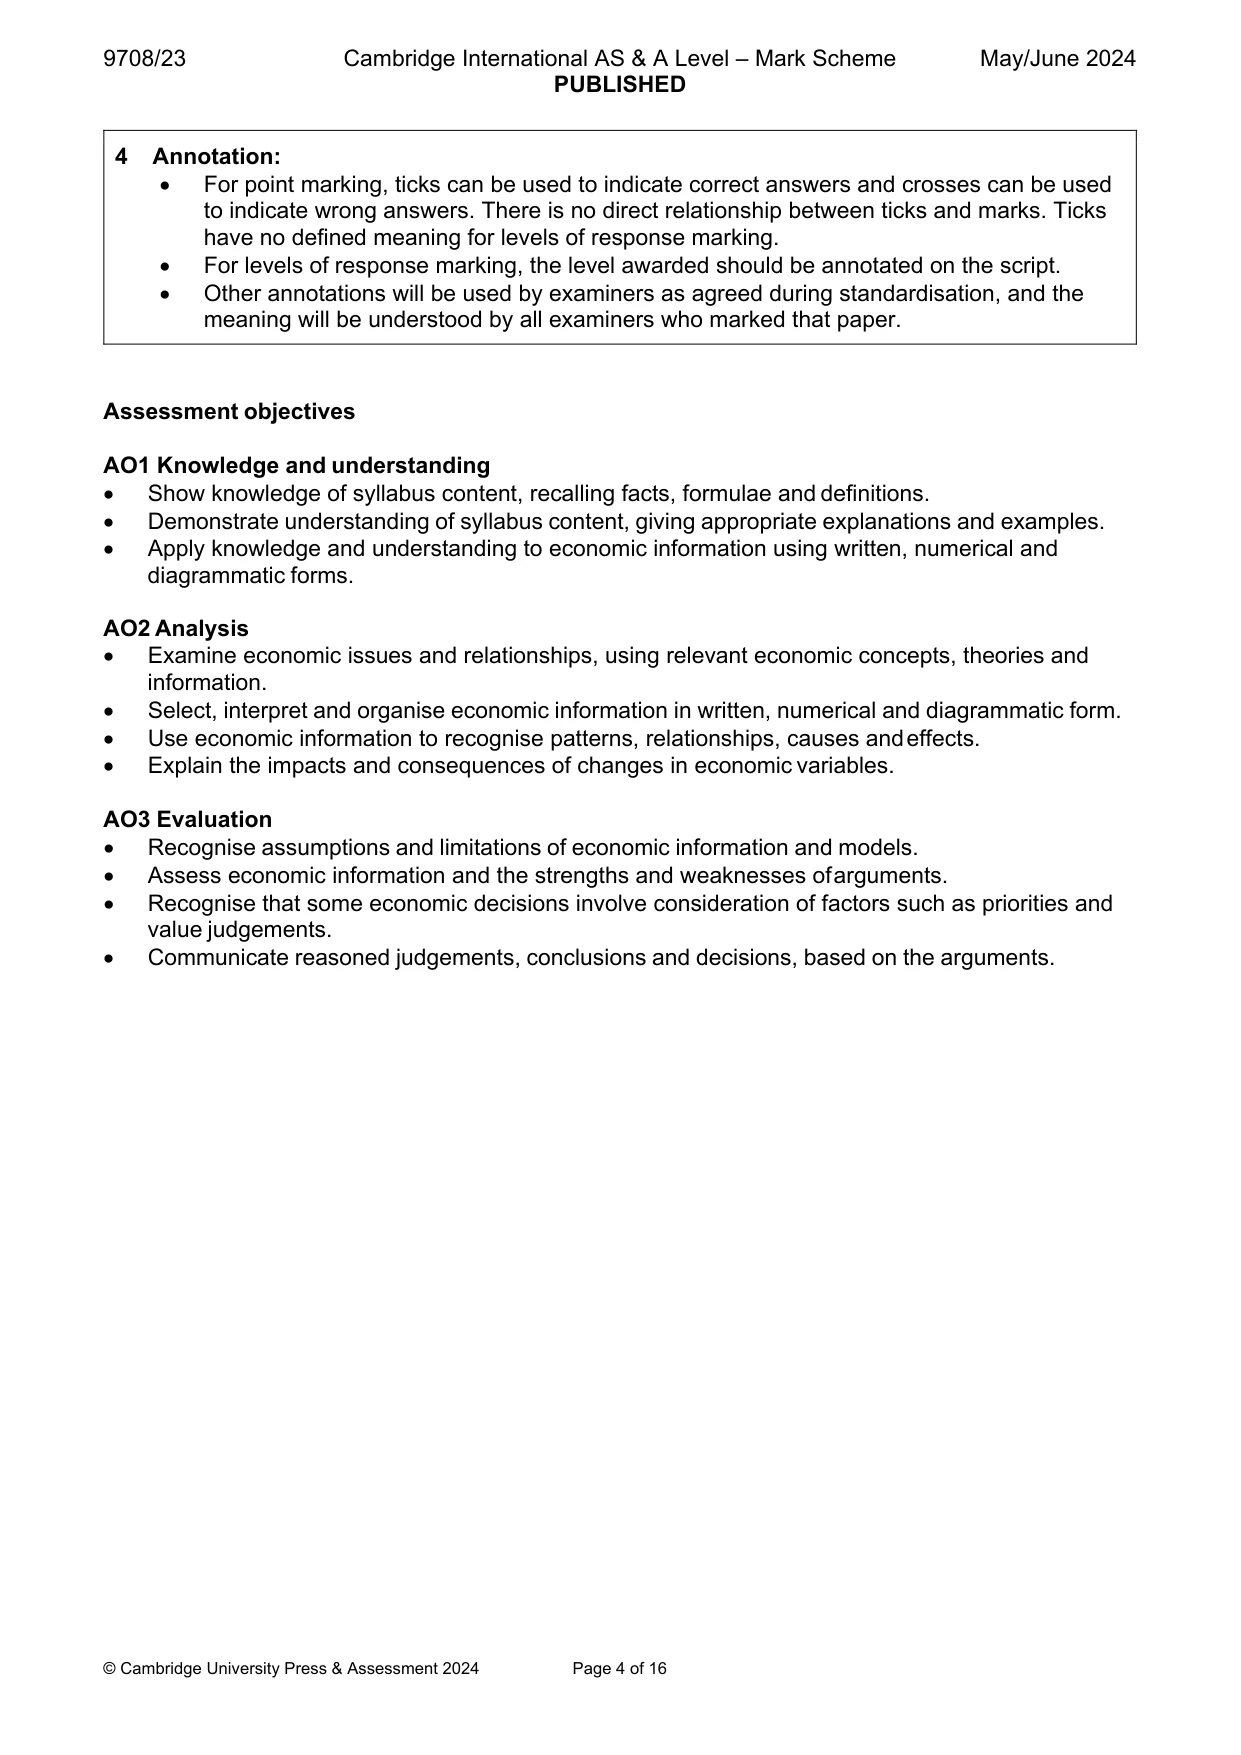
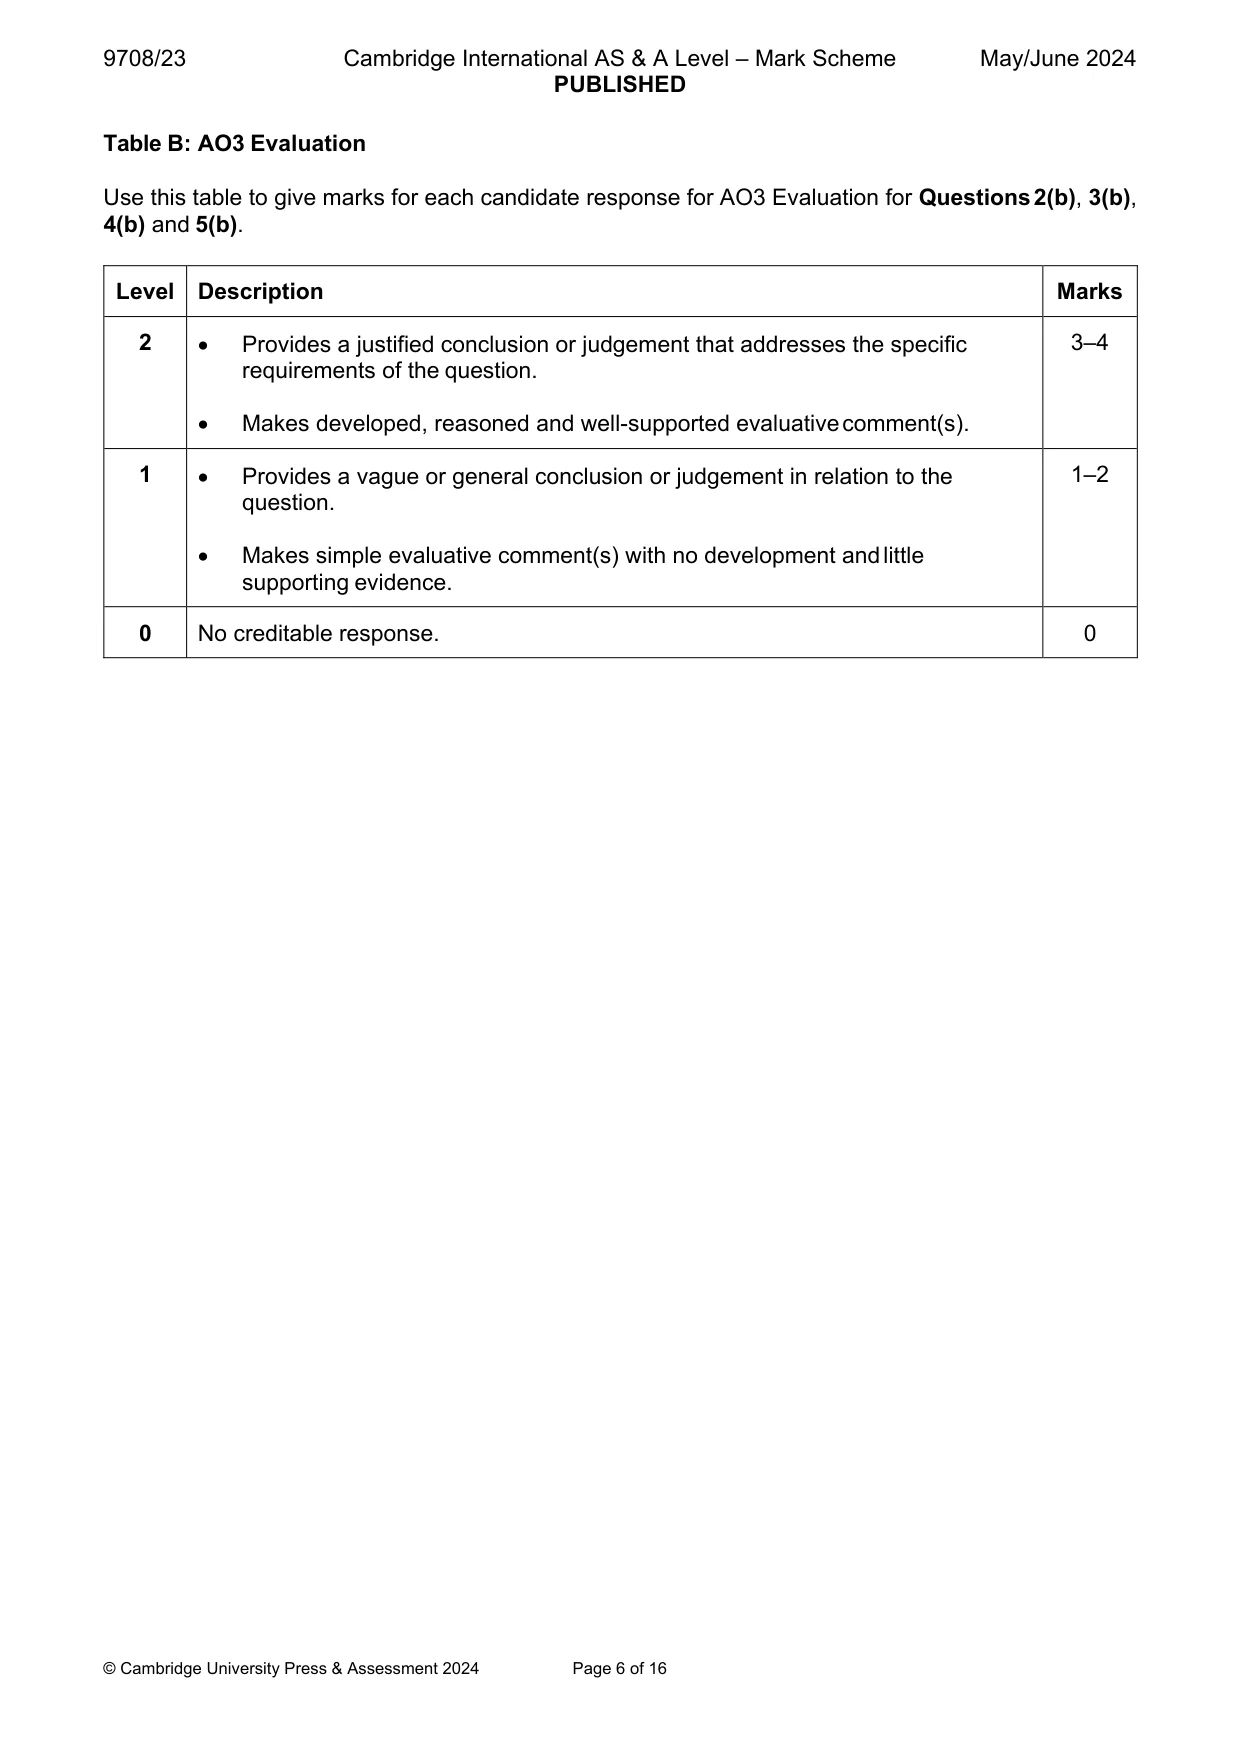
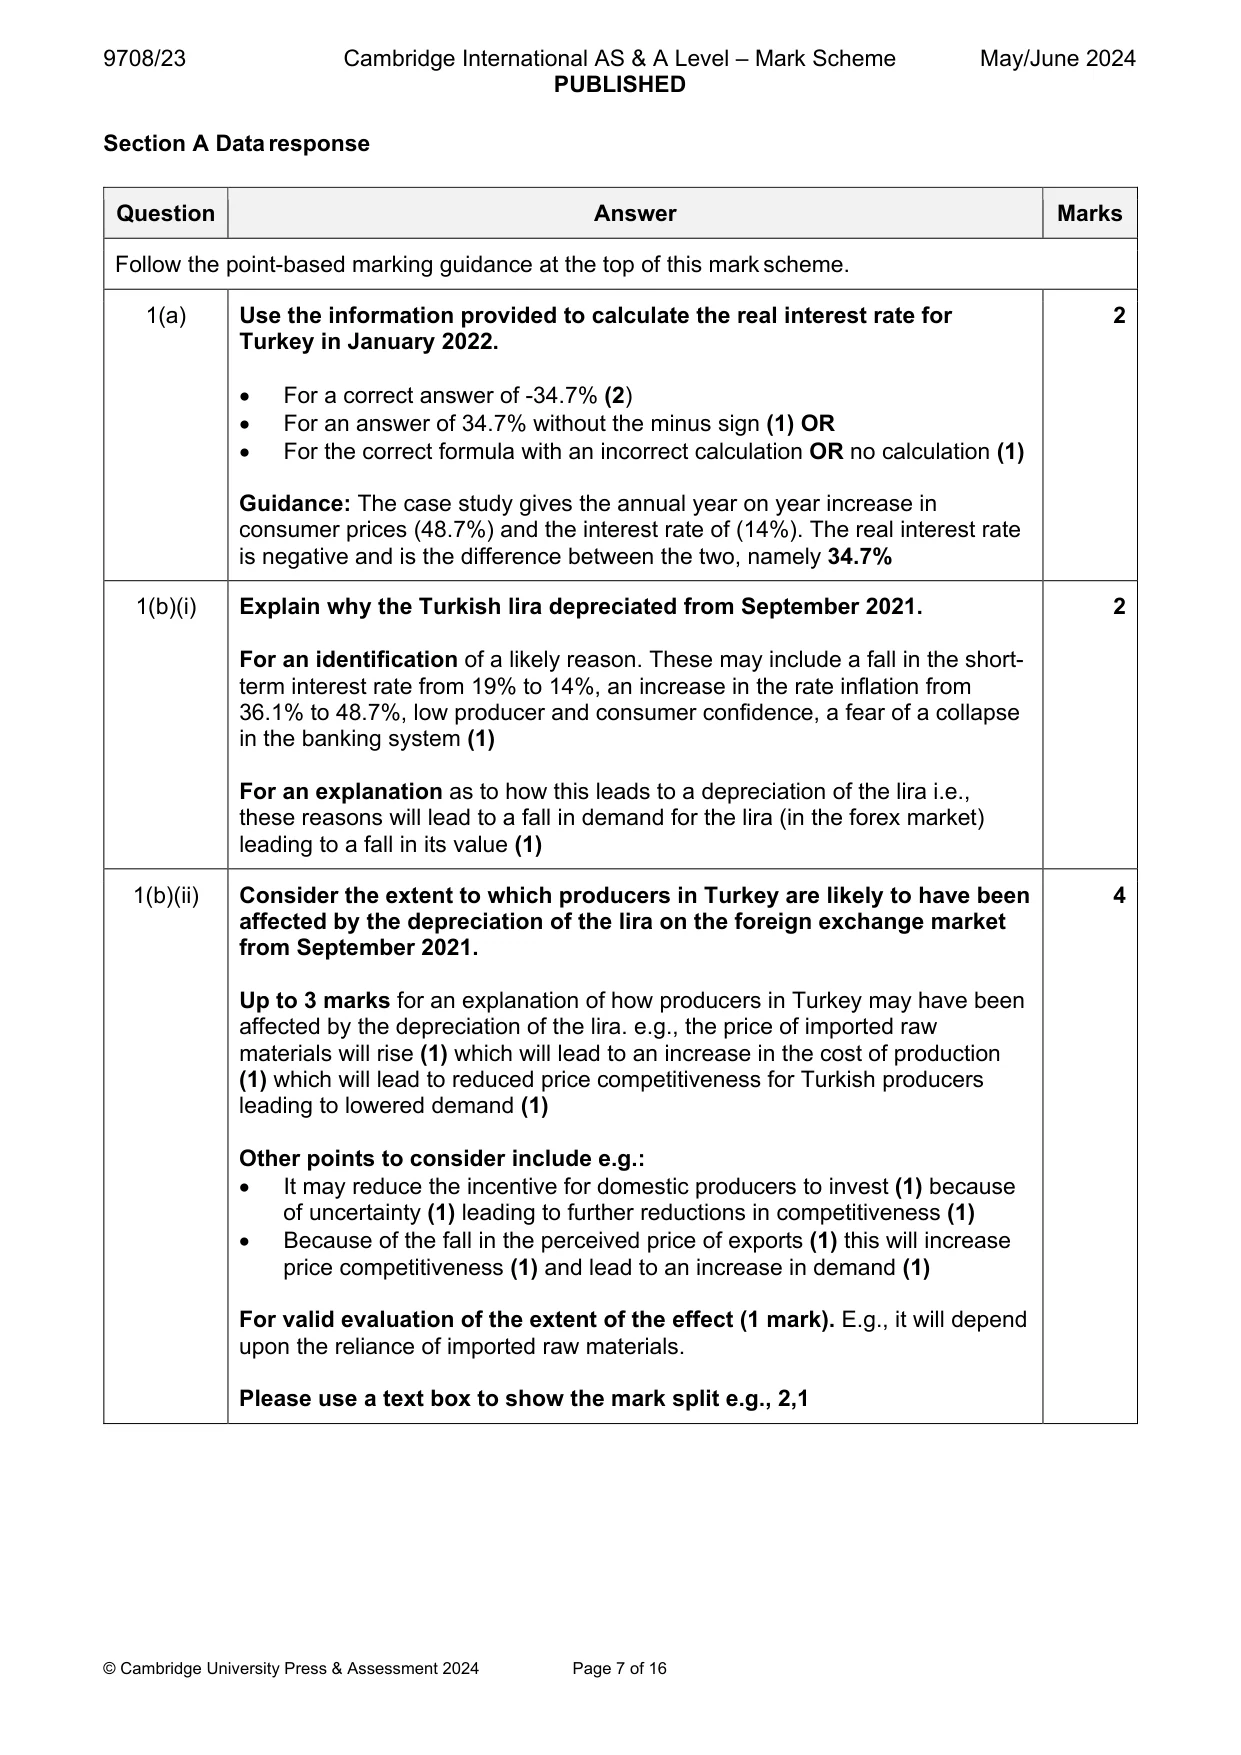
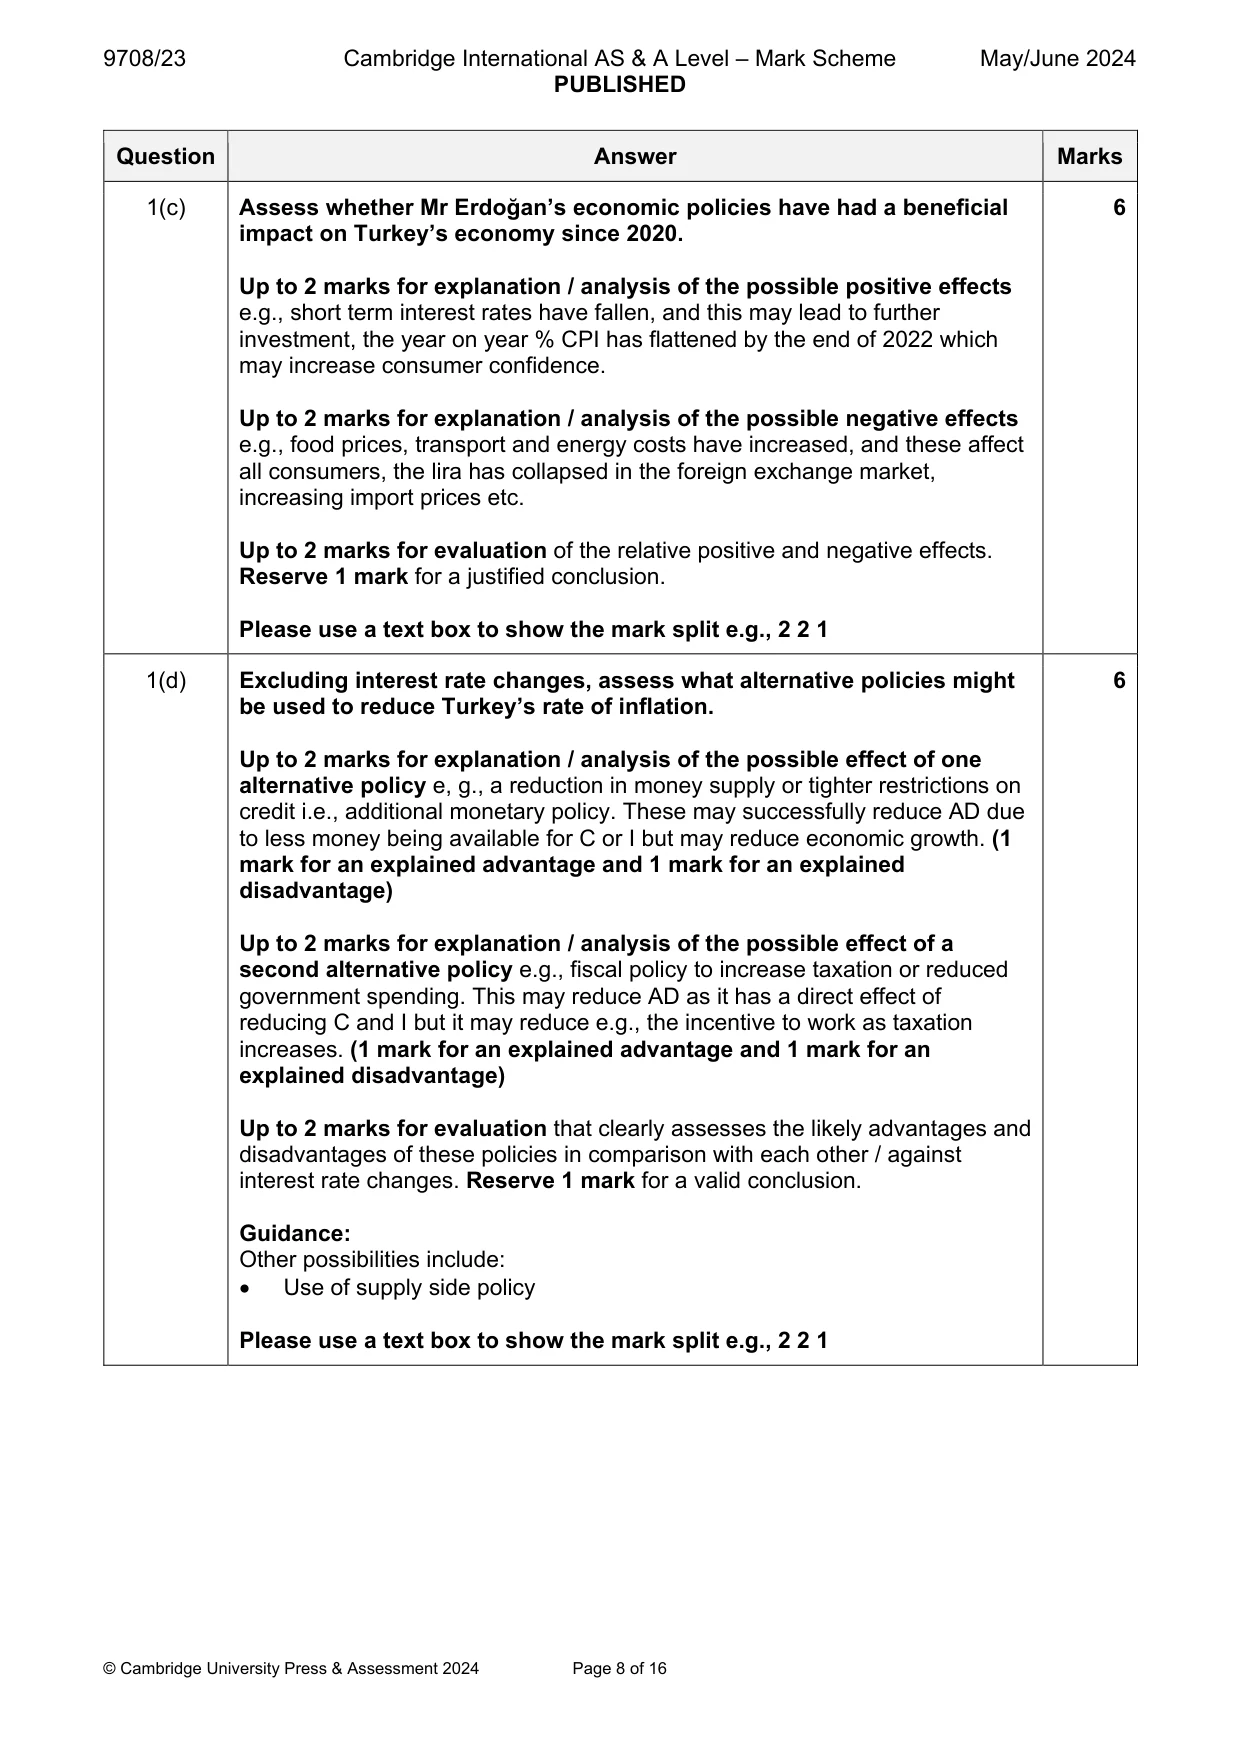
Mark scheme: Question Answer Marks Follow the point-based marking guidance at the top of this mark scheme. 1(a) Use the information provided to calculate the real interest rate for 2 Turkey in January 2022. For a correct answer of -34.7% (2) For an answer of 34.7% without the minus sign (1) OR For the correct formula with an incorrect calculation OR no calculation (1) Guidance: The case study gives the annual year on year increase in consumer prices (48.7%) and the interest rate of (14%). The real interest rate is negative and is the difference between the two, namely 34.7% 1(b)(i) Explain why the Turkish lira depreciated from September 2021. 2 For an identification of a likely reason. These may include a fall in the short- term interest rate from 19% to 14%, an increase in the rate inflation from 36.1% to 48.7%, low producer and consumer confidence, a fear of a collapse in the banking system (1) For an explanation as to how this leads to a depreciation of the lira i.e., these reasons will lead to a fall in demand for the lira (in the forex market) leading to a fall in its value (1) 1(b)(ii) Consider the extent to which producers in Turkey are likely to have been 4 affected by the depreciation of the lira on the foreign exchange market from September 2021. Up to 3 marks for an explanation of how producers in Turkey may have been affected by the depreciation of the lira. e.g., the price of imported raw materials will rise (1) which will lead to an increase in the cost of production (1) which will lead to reduced price competitiveness for Turkish producers leading to lowered demand (1) Other points to consider include e.g.: It may reduce the incentive for domestic producers to invest (1) because of uncertainty (1) leading to further reductions in competitiveness (1) Because of the fall in the perceived price of exports (1) this will increase price competitiveness (1) and lead to an increase in demand (1) For valid evaluation of the extent of the effect (1 mark). E.g., it will depend upon the reliance of imported raw materials. Please use a text box to show the mark split e.g., 2,1 1(c) Assess whether Mr Erdoğan’s economic policies have had a beneficial 6 impact on Turkey’s economy since 2020. Up to 2 marks for explanation / analysis of the possible positive effects e.g., short term interest rates have fallen, and this may lead to further investment, the year on year % CPI has flattened by the end of 2022 which may increase consumer confidence. Up to 2 marks for explanation / analysis of the possible negative effects e.g., food prices, transport and energy costs have increased, and these affect all consumers, the lira has collapsed in the foreign exchange market, increasing import prices etc. Up to 2 marks for evaluation of the relative positive and negative effects. Reserve 1 mark for a justified conclusion. Please use a text box to show the mark split e.g., 2 2 1 1(d) Excluding interest rate changes, assess what alternative policies might 6 be used to reduce Turkey’s rate of inflation. Up to 2 marks for explanation / analysis of the possible effect of one alternative policy e, g., a reduction in money supply or tighter restrictions on credit i.e., additional monetary policy. These may successfully reduce AD due to less money being available for C or I but may reduce economic growth. (1 mark for an explained advantage and 1 mark for an explained disadvantage) Up to 2 marks for explanation / analysis of the possible effect of a second alternative policy e.g., fiscal policy to increase taxation or reduced government spending. This may reduce AD as it has a direct effect of reducing C and I but it may reduce e.g., the incentive to work as taxation increases. (1 mark for an explained advantage and 1 mark for an explained disadvantage) Up to 2 marks for evaluation that clearly assesses the likely advantages and disadvantages of these policies in comparison with each other / against interest rate changes. Reserve 1 mark for a valid conclusion. Guidance: Other possibilities include: Use of supply side policy Please use a text box to show the mark split e.g., 2 2 1 Section B Microeconomics essay
Q2 · From 2030, most new car production in the United Kingdom (UK) will be of electric cars
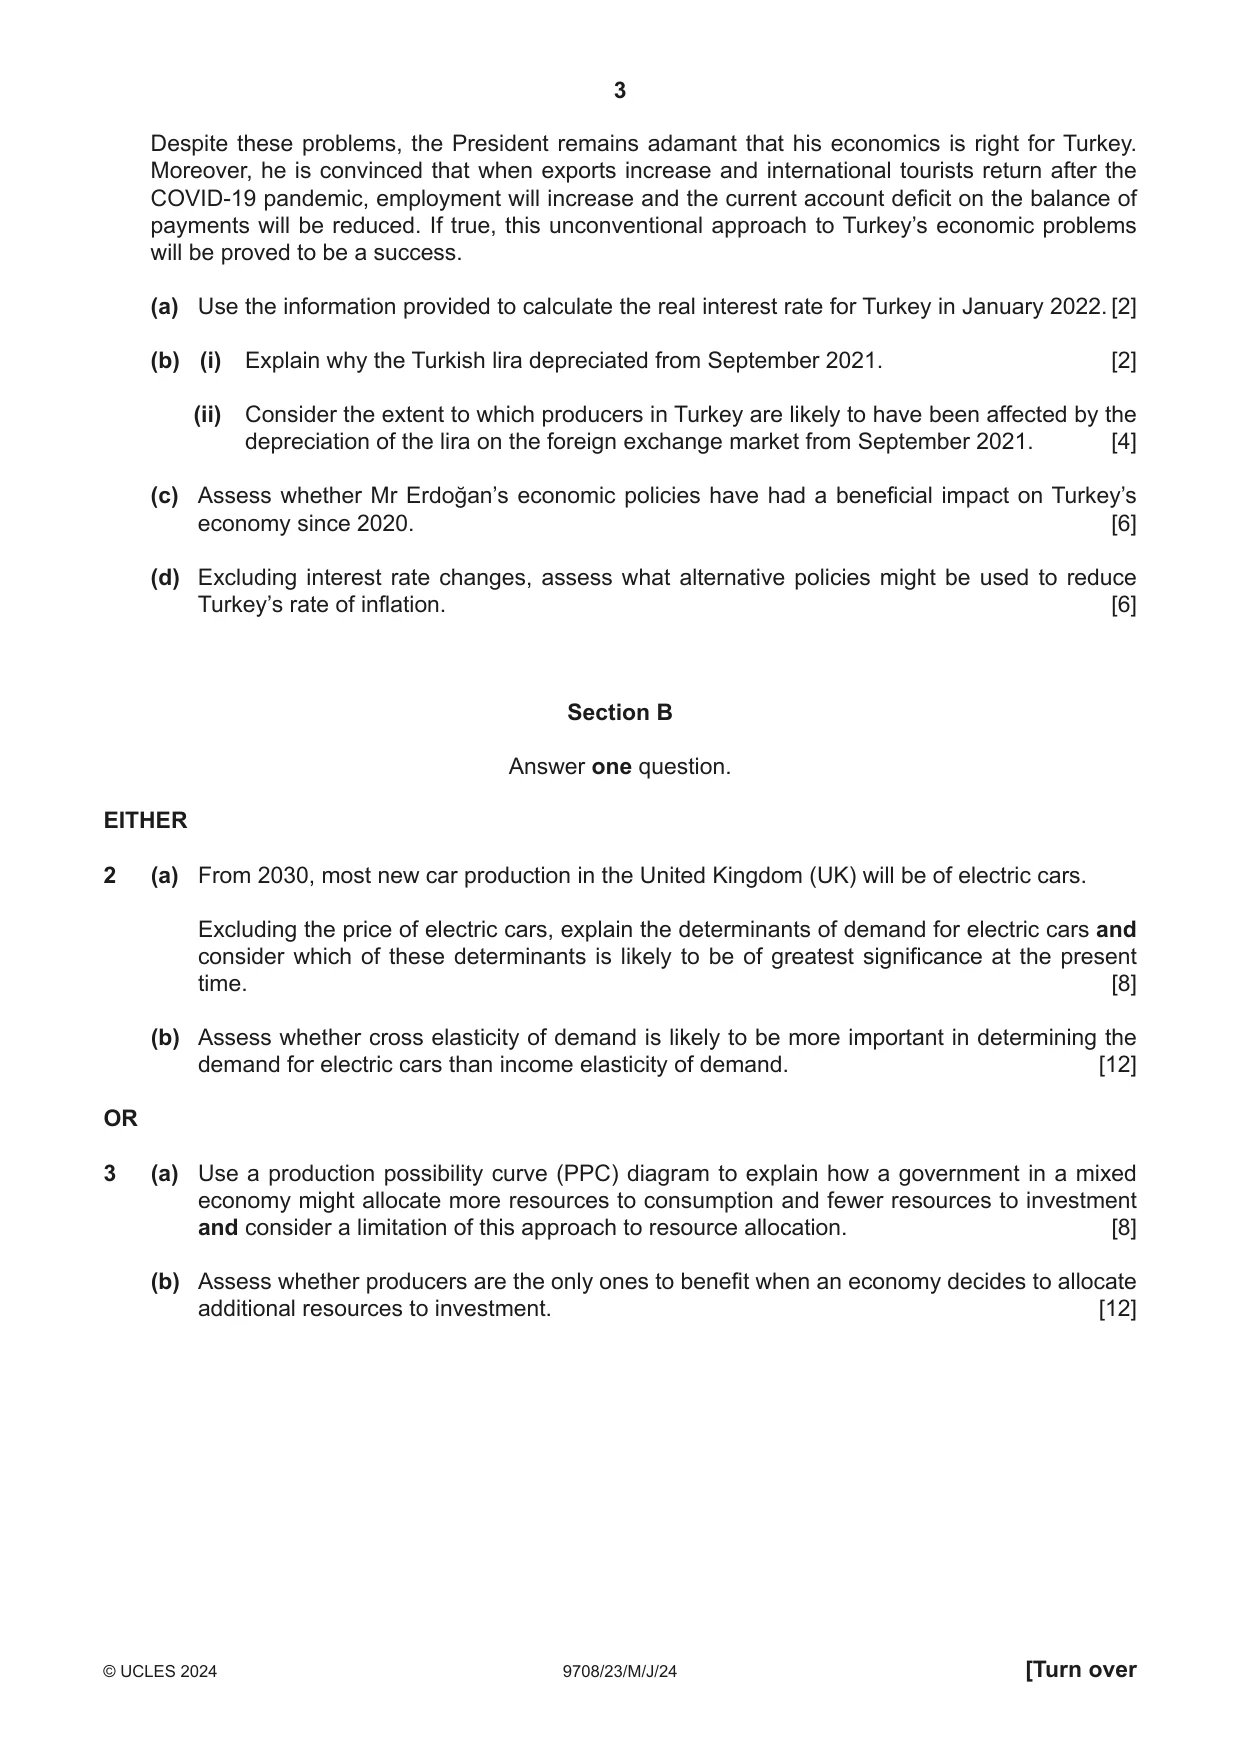
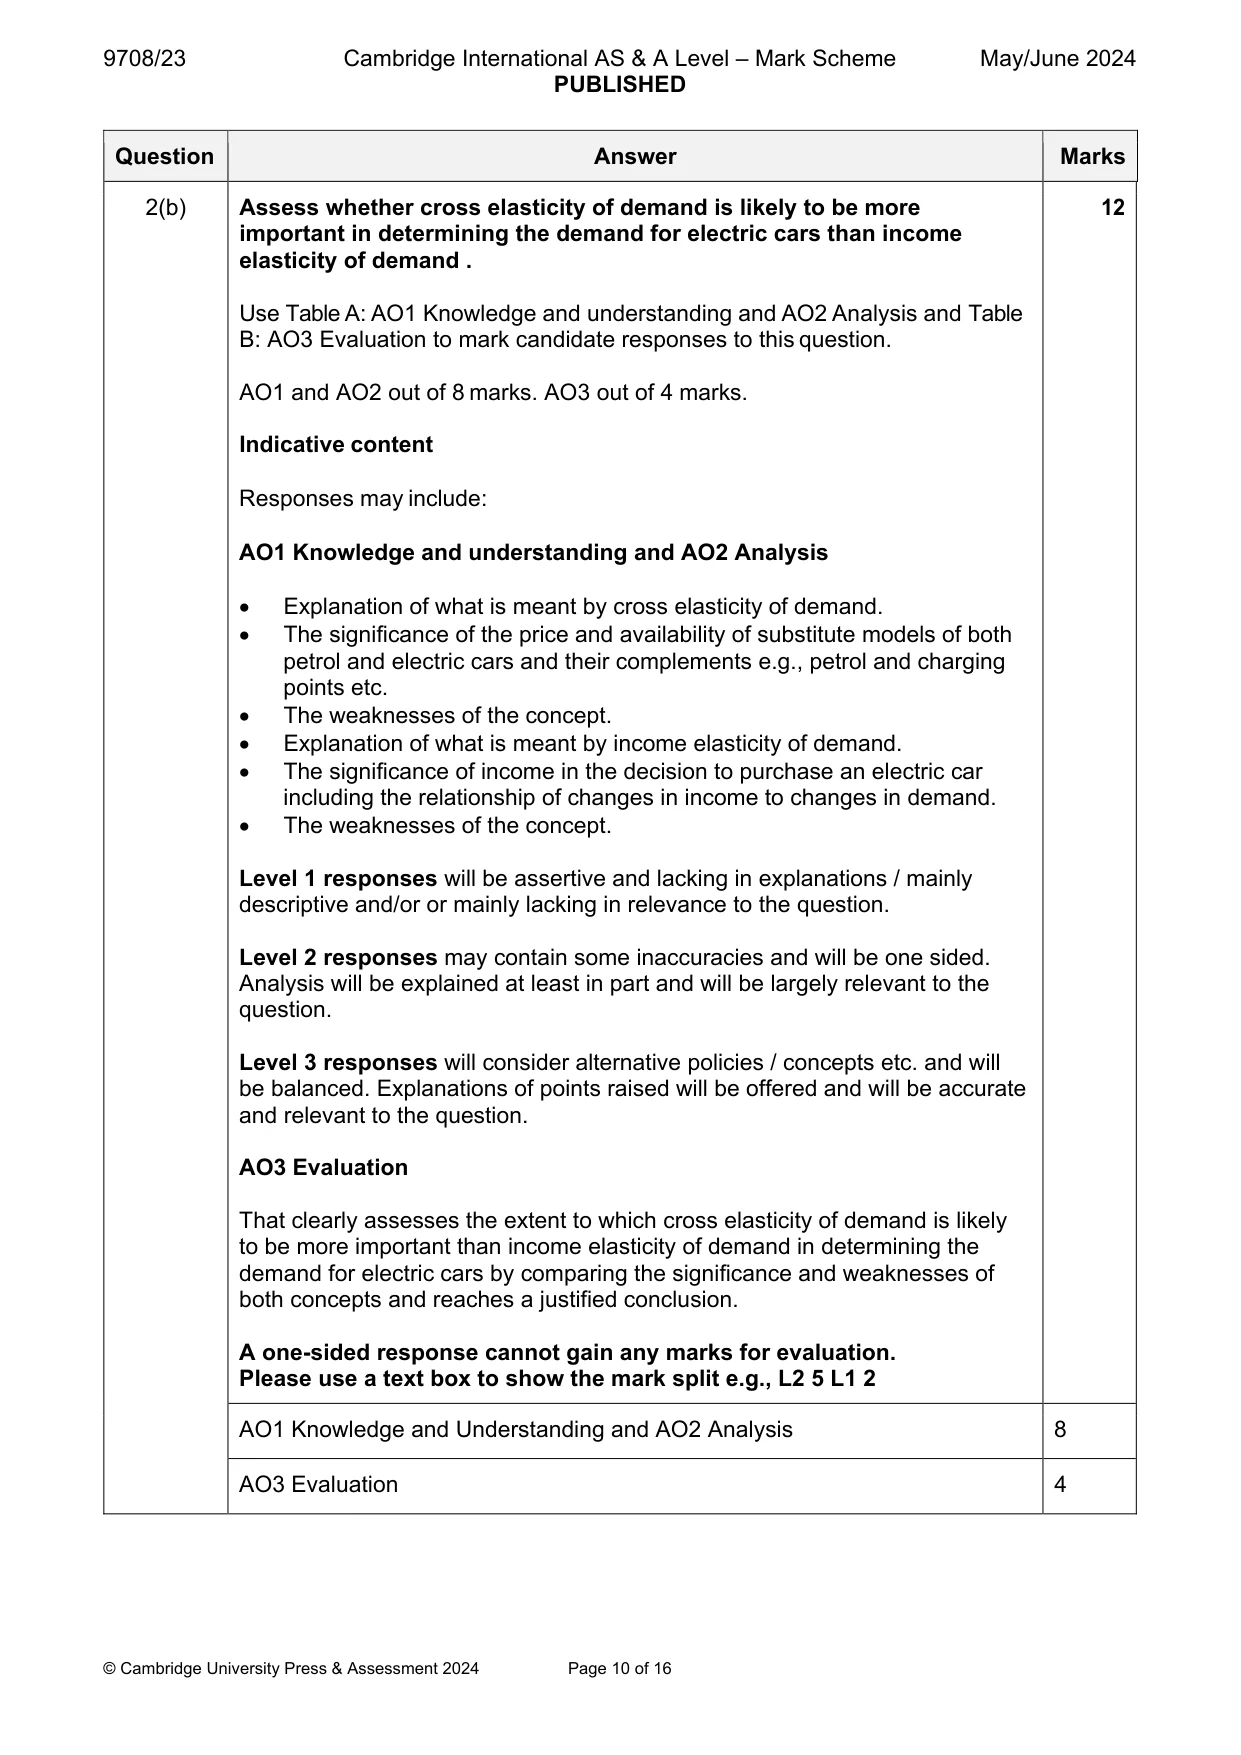
2 (a) From 2030, most new car production in the United Kingdom (UK) will be of electric cars. Excluding the price of electric cars, explain the determinants of demand for electric cars and consider which of these determinants is likely to be of greatest significance at the present time. [8] (b) Assess whether cross elasticity of demand is likely to be more important in determining the demand for electric cars than income elasticity of demand. [12] OR
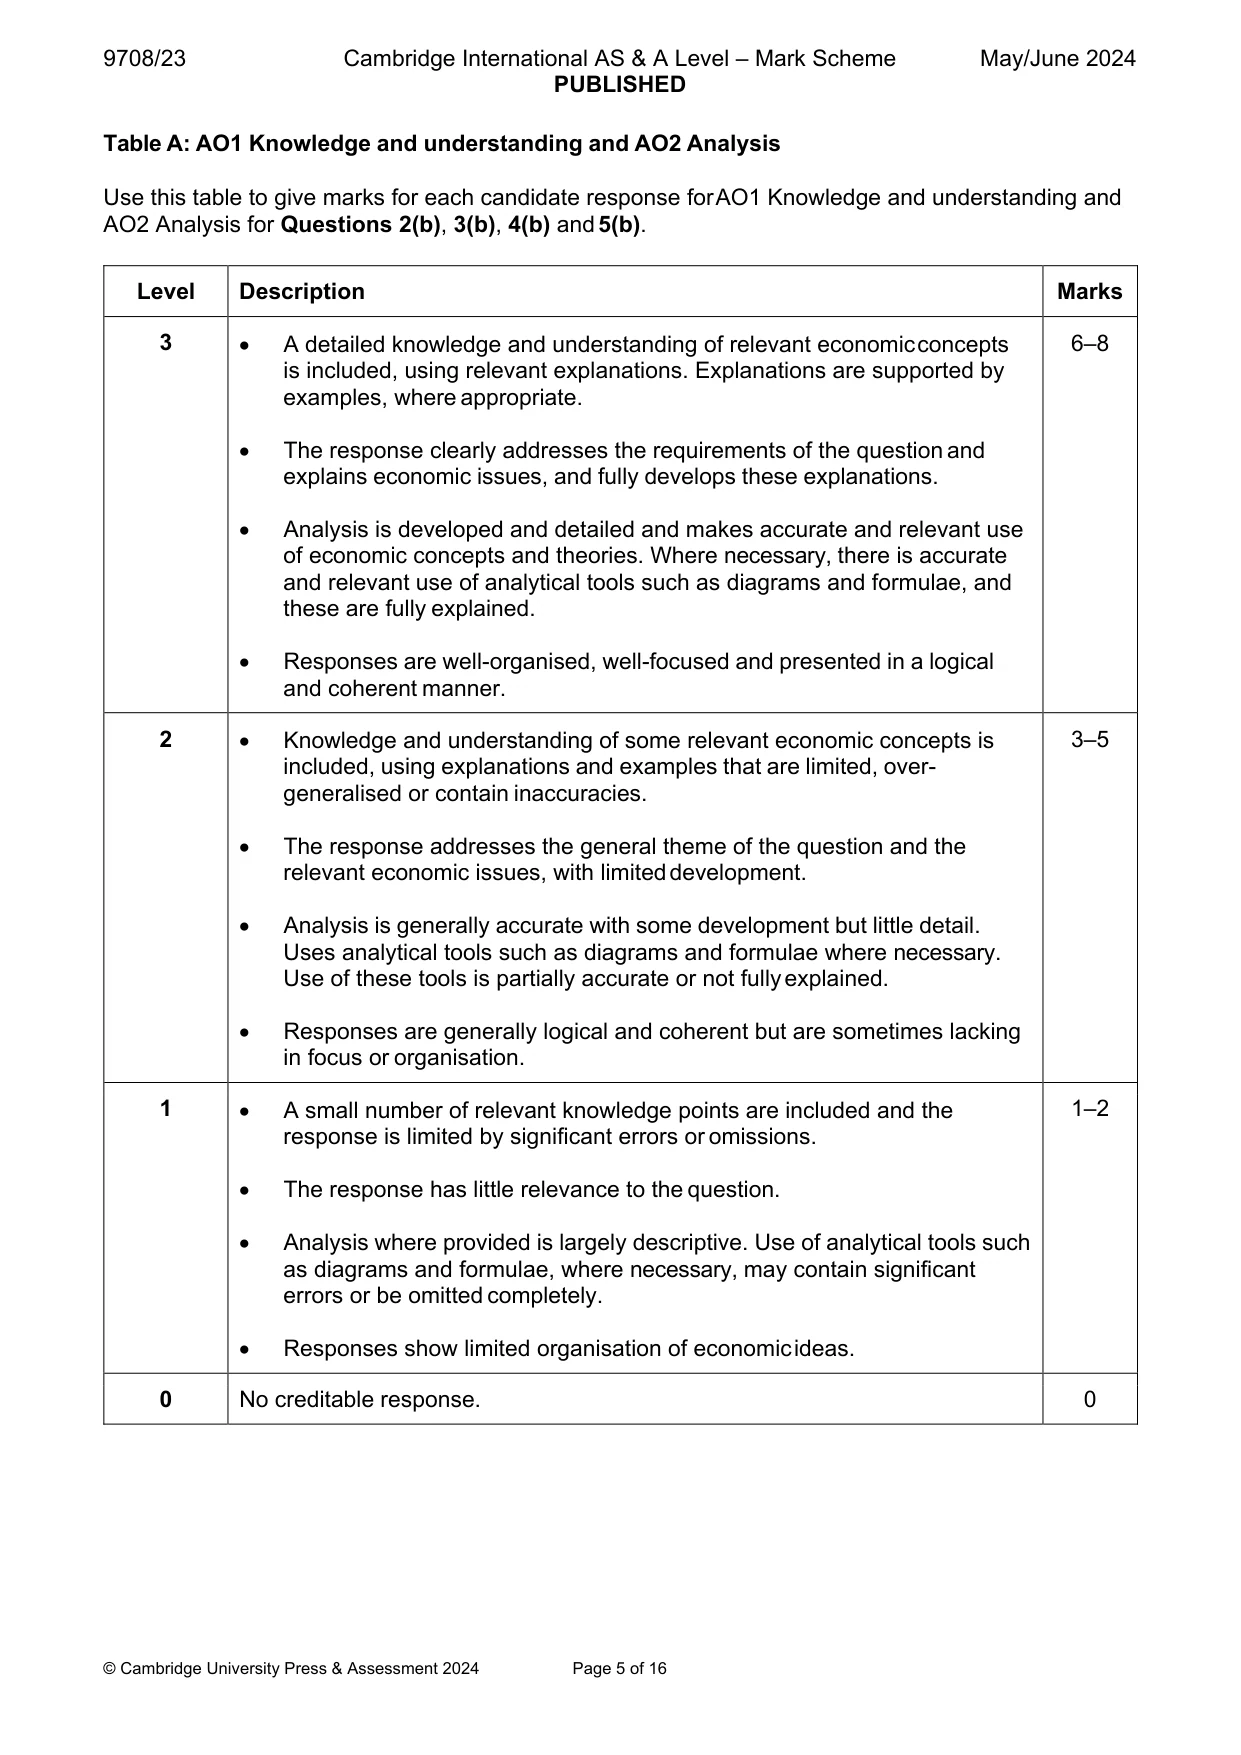
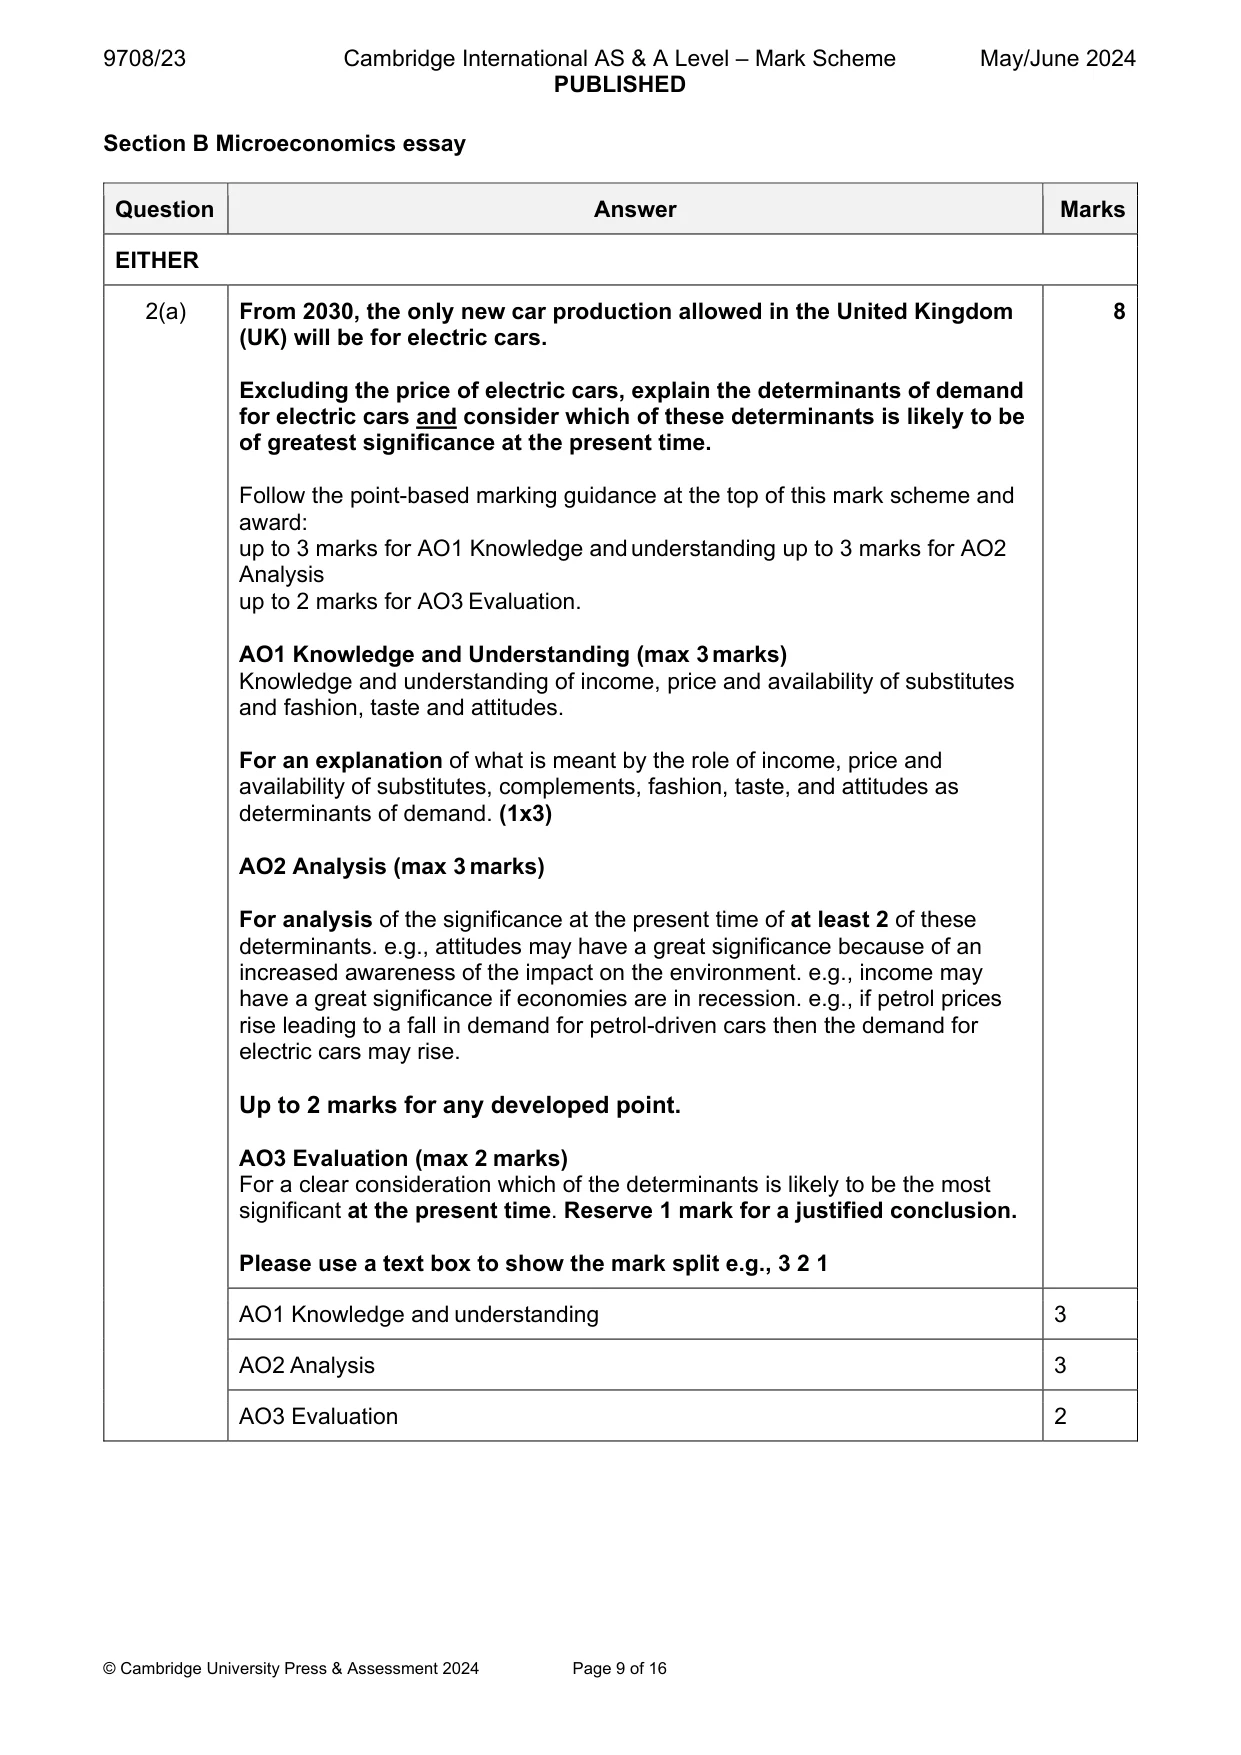
Mark scheme: 2(a) From 2030, the only new car production allowed in the United Kingdom 8 (UK) will be for electric cars. Excluding the price of electric cars, explain the determinants of demand for electric cars and consider which of these determinants is likely to be of greatest significance at the present time. Follow the point-based marking guidance at the top of this mark scheme and award: up to 3 marks for AO1 Knowledge and understanding up to 3 marks for AO2 Analysis up to 2 marks for AO3 Evaluation. AO1 Knowledge and Understanding (max 3 marks) Knowledge and understanding of income, price and availability of substitutes and fashion, taste and attitudes. For an explanation of what is meant by the role of income, price and availability of substitutes, complements, fashion, taste, and attitudes as determinants of demand. (1x3) AO2 Analysis (max 3 marks) For analysis of the significance at the present time of at least 2 of these determinants. e.g., attitudes may have a great significance because of an increased awareness of the impact on the environment. e.g., income may have a great significance if economies are in recession. e.g., if petrol prices rise leading to a fall in demand for petrol-driven cars then the demand for electric cars may rise. Up to 2 marks for any developed point. AO3 Evaluation (max 2 marks) For a clear consideration which of the determinants is likely to be the most significant at the present time. Reserve 1 mark for a justified conclusion. Please use a text box to show the mark split e.g., 3 2 1 AO1 Knowledge and understanding 3 AO2 Analysis 3 AO3 Evaluation 2 2(b) Assess whether cross elasticity of demand is likely to be more 12 important in determining the demand for electric cars than income elasticity of demand . Use Table A: AO1 Knowledge and understanding and AO2 Analysis and Table B: AO3 Evaluation to mark candidate responses to this question. AO1 and AO2 out of 8 marks. AO3 out of 4 marks. Indicative content Responses may include: AO1 Knowledge and understanding and AO2 Analysis Explanation of what is meant by cross elasticity of demand. The significance of the price and availability of substitute models of both petrol and electric cars and their complements e.g., petrol and charging points etc. The weaknesses of the concept. Explanation of what is meant by income elasticity of demand. The significance of income in the decision to purchase an electric car including the relationship of changes in income to changes in demand. The weaknesses of the concept. Level 1 responses will be assertive and lacking in explanations / mainly descriptive and/or or mainly lacking in relevance to the question. Level 2 responses may contain some inaccuracies and will be one sided. Analysis will be explained at least in part and will be largely relevant to the question. Level 3 responses will consider alternative policies / concepts etc. and will be balanced. Explanations of points raised will be offered and will be accurate and relevant to the question. AO3 Evaluation That clearly assesses the extent to which cross elasticity of demand is likely to be more important than income elasticity of demand in determining the demand for electric cars by comparing the significance and weaknesses of both concepts and reaches a justified conclusion. A one-sided response cannot gain any marks for evaluation. Please use a text box to show the mark split e.g., L2 5 L1 2 AO1 Knowledge and Understanding and AO2 Analysis 8 AO3 Evaluation 4
More questions on Price elasticity, income elasticity and cross elasticity of demand
Q3 · Use a production possibility curve (PPC) diagram to explain how a government in a mixed…
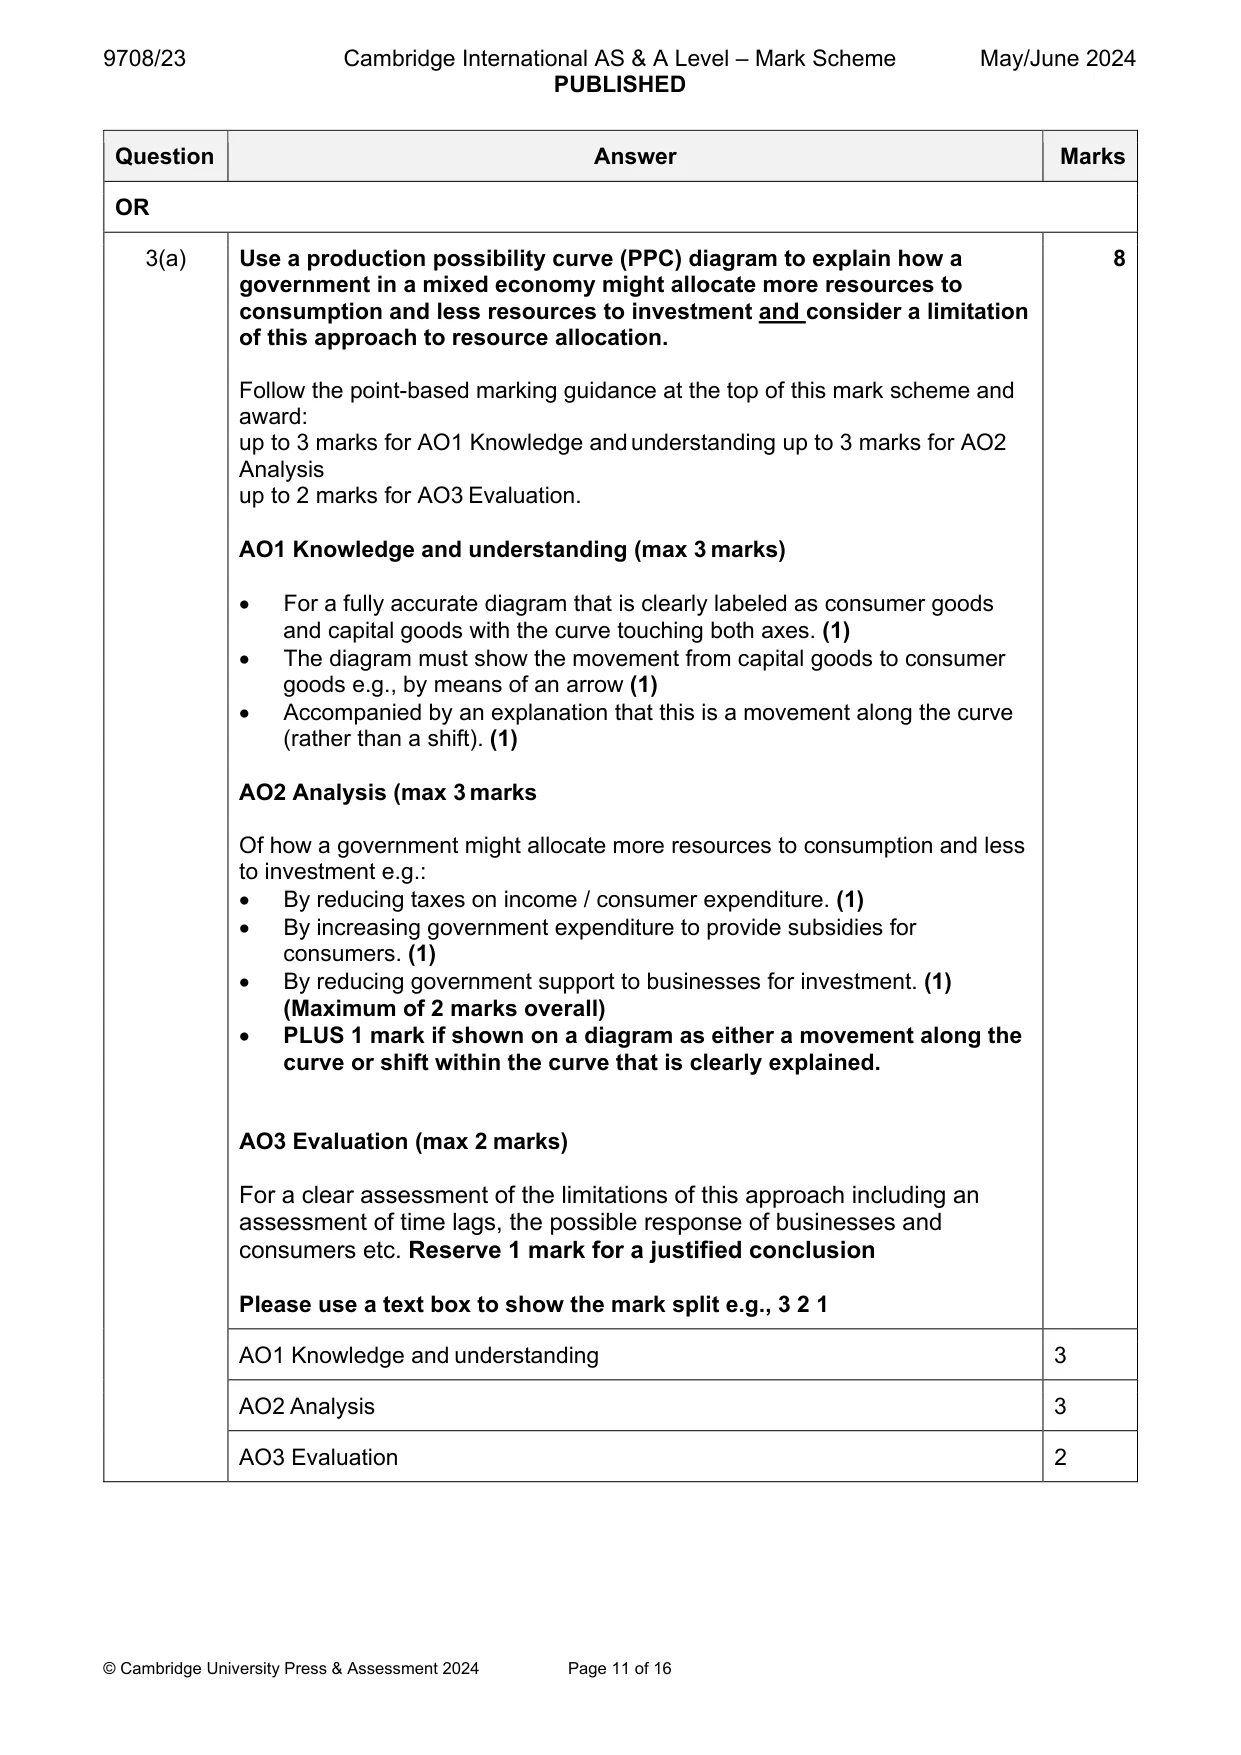
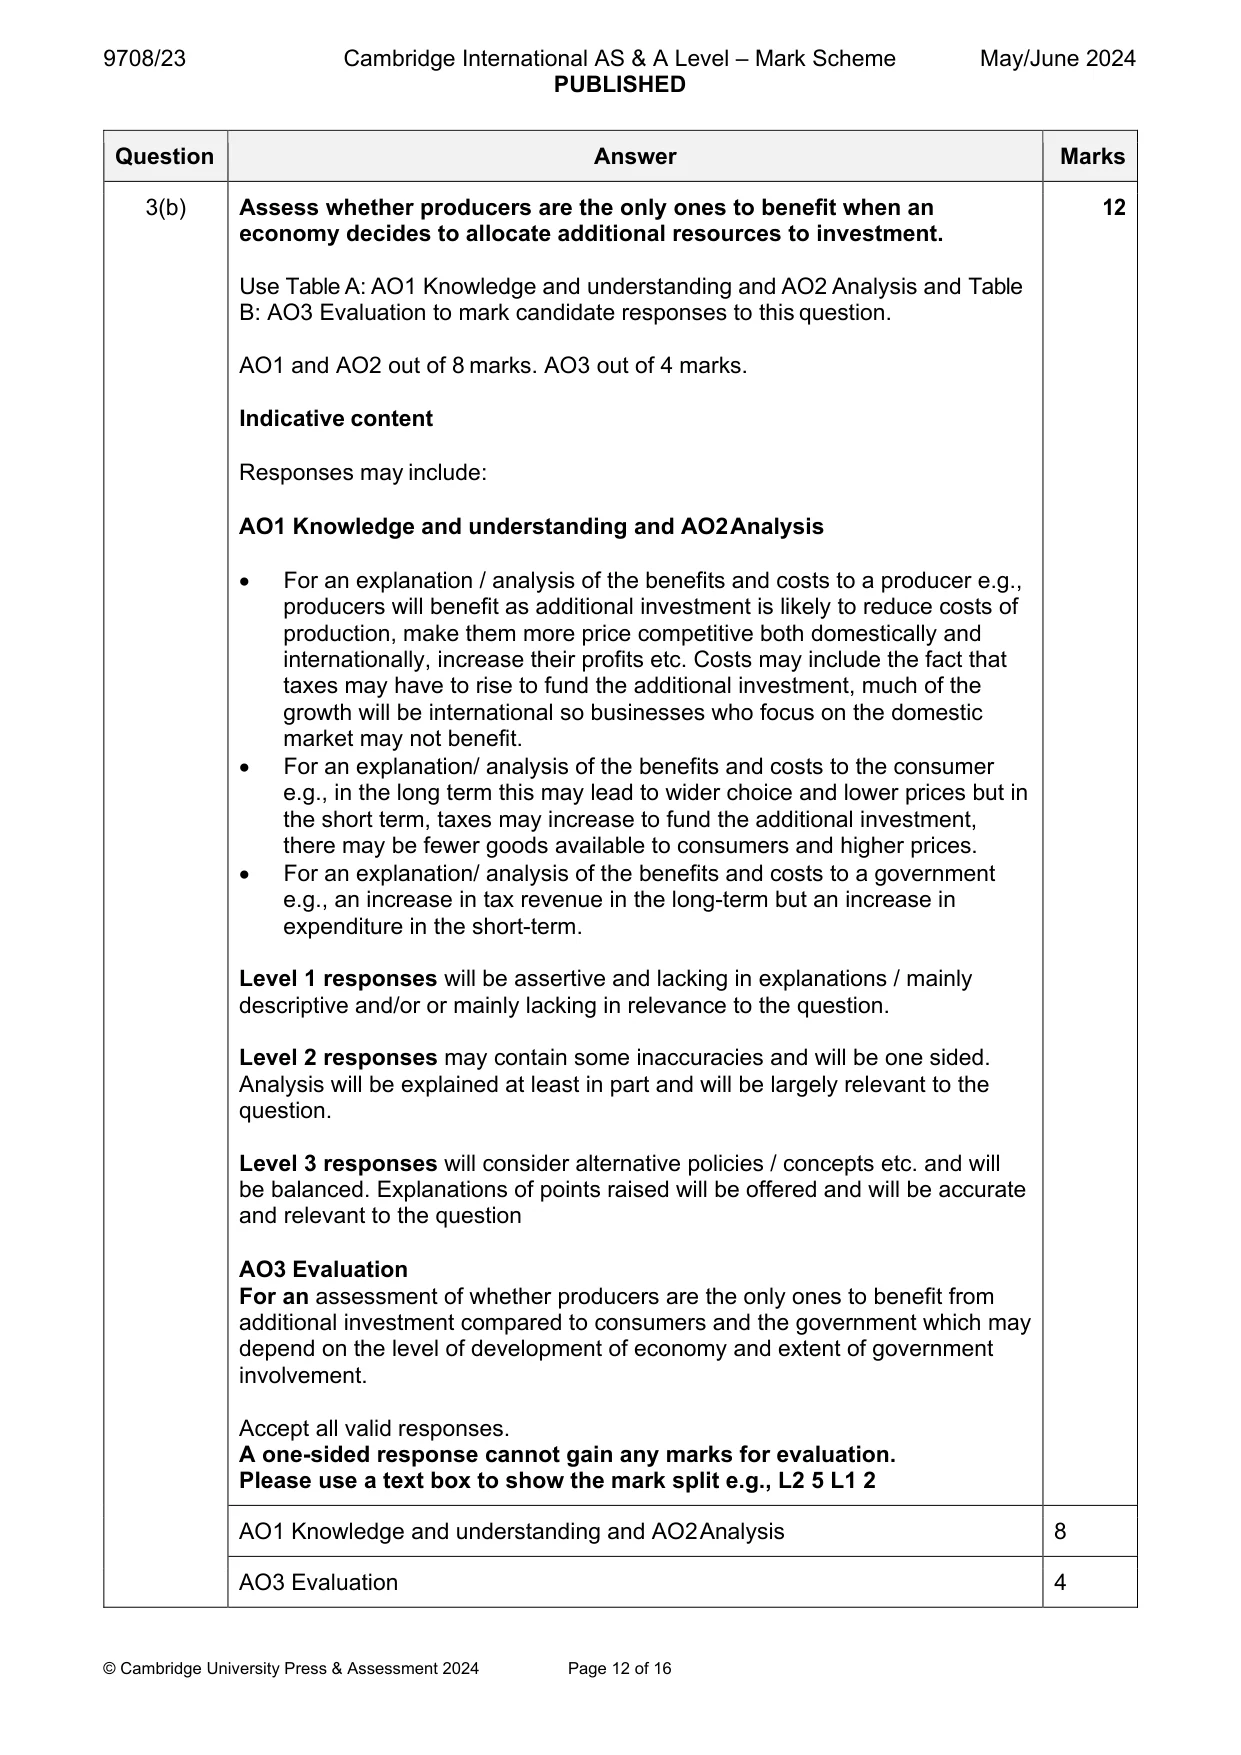
3 (a) Use a production possibility curve (PPC) diagram to explain how a government in a mixed economy might allocate more resources to consumption and fewer resources to investment and consider a limitation of this approach to resource allocation. [8] (b) Assess whether producers are the only ones to benefit when an economy decides to allocate additional resources to investment. [12] Section C Answer one question. EITHER
Mark scheme: 3(a) Use a production possibility curve (PPC) diagram to explain how a 8 government in a mixed economy might allocate more resources to consumption and less resources to investment and consider a limitation of this approach to resource allocation. Follow the point-based marking guidance at the top of this mark scheme and award: up to 3 marks for AO1 Knowledge and understanding up to 3 marks for AO2 Analysis up to 2 marks for AO3 Evaluation. AO1 Knowledge and understanding (max 3 marks) For a fully accurate diagram that is clearly labeled as consumer goods and capital goods with the curve touching both axes. (1) The diagram must show the movement from capital goods to consumer goods e.g., by means of an arrow (1) Accompanied by an explanation that this is a movement along the curve (rather than a shift). (1) AO2 Analysis (max 3 marks Of how a government might allocate more resources to consumption and less to investment e.g.: By reducing taxes on income / consumer expenditure. (1) By increasing government expenditure to provide subsidies for consumers. (1) By reducing government support to businesses for investment. (1) (Maximum of 2 marks overall) PLUS 1 mark if shown on a diagram as either a movement along the curve or shift within the curve that is clearly explained. AO3 Evaluation (max 2 marks) For a clear assessment of the limitations of this approach including an assessment of time lags, the possible response of businesses and consumers etc. Reserve 1 mark for a justified conclusion Please use a text box to show the mark split e.g., 3 2 1 AO1 Knowledge and understanding 3 AO2 Analysis 3 AO3 Evaluation 2 3(b) Assess whether producers are the only ones to benefit when an 12 economy decides to allocate additional resources to investment. Use Table A: AO1 Knowledge and understanding and AO2 Analysis and Table B: AO3 Evaluation to mark candidate responses to this question. AO1 and AO2 out of 8 marks. AO3 out of 4 marks. Indicative content Responses may include: AO1 Knowledge and understanding and AO2 Analysis For an explanation / analysis of the benefits and costs to a producer e.g., producers will benefit as additional investment is likely to reduce costs of production, make them more price competitive both domestically and internationally, increase their profits etc. Costs may include the fact that taxes may have to rise to fund the additional investment, much of the growth will be international so businesses who focus on the domestic market may not benefit. For an explanation/ analysis of the benefits and costs to the consumer e.g., in the long term this may lead to wider choice and lower prices but in the short term, taxes may increase to fund the additional investment, there may be fewer goods available to consumers and higher prices. For an explanation/ analysis of the benefits and costs to a government e.g., an increase in tax revenue in the long-term but an increase in expenditure in the short-term. Level 1 responses will be assertive and lacking in explanations / mainly descriptive and/or or mainly lacking in relevance to the question. Level 2 responses may contain some inaccuracies and will be one sided. Analysis will be explained at least in part and will be largely relevant to the question. Level 3 responses will consider alternative policies / concepts etc. and will be balanced. Explanations of points raised will be offered and will be accurate and relevant to the question AO3 Evaluation For an assessment of whether producers are the only ones to benefit from additional investment compared to consumers and the government which may depend on the level of development of economy and extent of government involvement. Accept all valid responses. A one-sided response cannot gain any marks for evaluation. Please use a text box to show the mark split e.g., L2 5 L1 2 AO1 Knowledge and understanding and AO2 Analysis 8 AO3 Evaluation 4 Section C Macroeconomics essay
Q4 · With the help of a diagram, explain how increases in aggregate demand affect the level of…
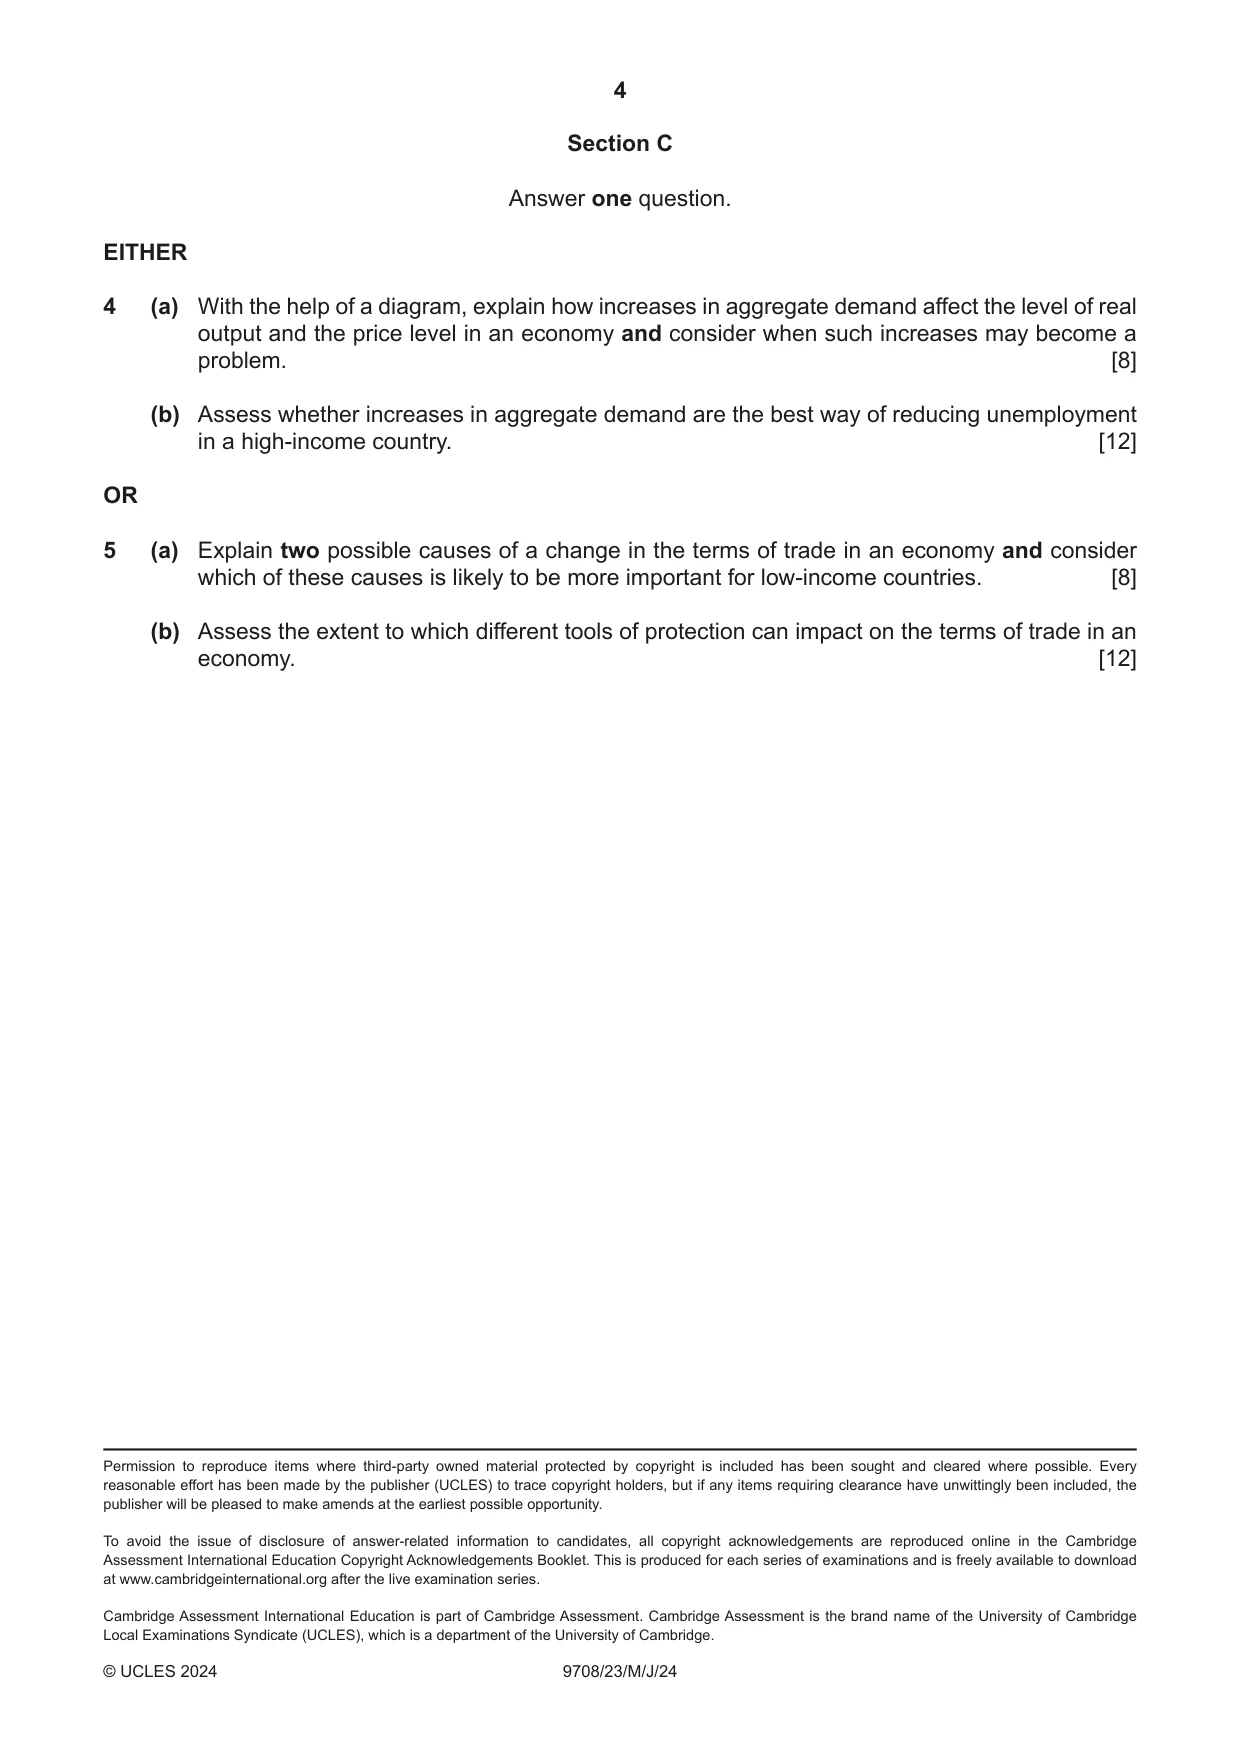
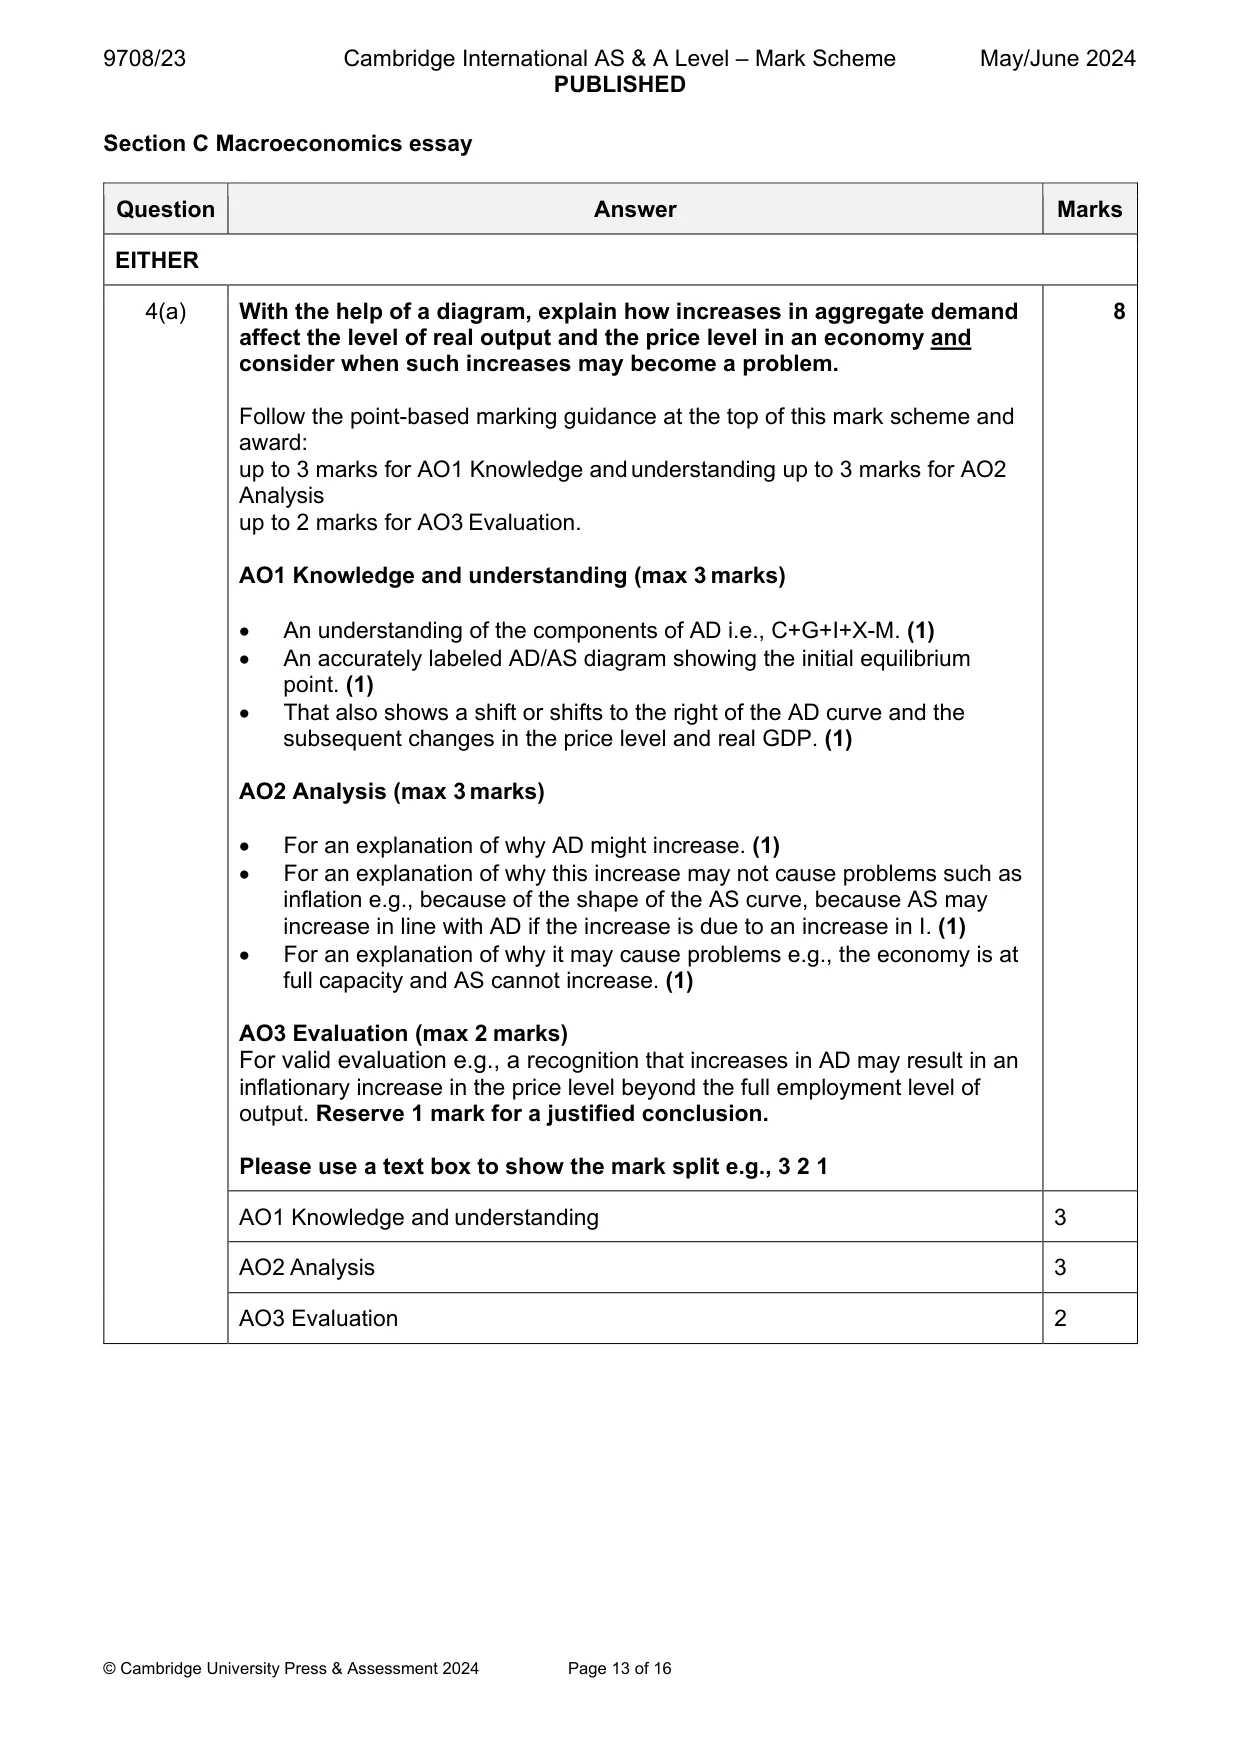
4 (a) With the help of a diagram, explain how increases in aggregate demand affect the level of real output and the price level in an economy and consider when such increases may become a problem. [8] (b) Assess whether increases in aggregate demand are the best way of reducing unemployment in a high-income country. [12] OR
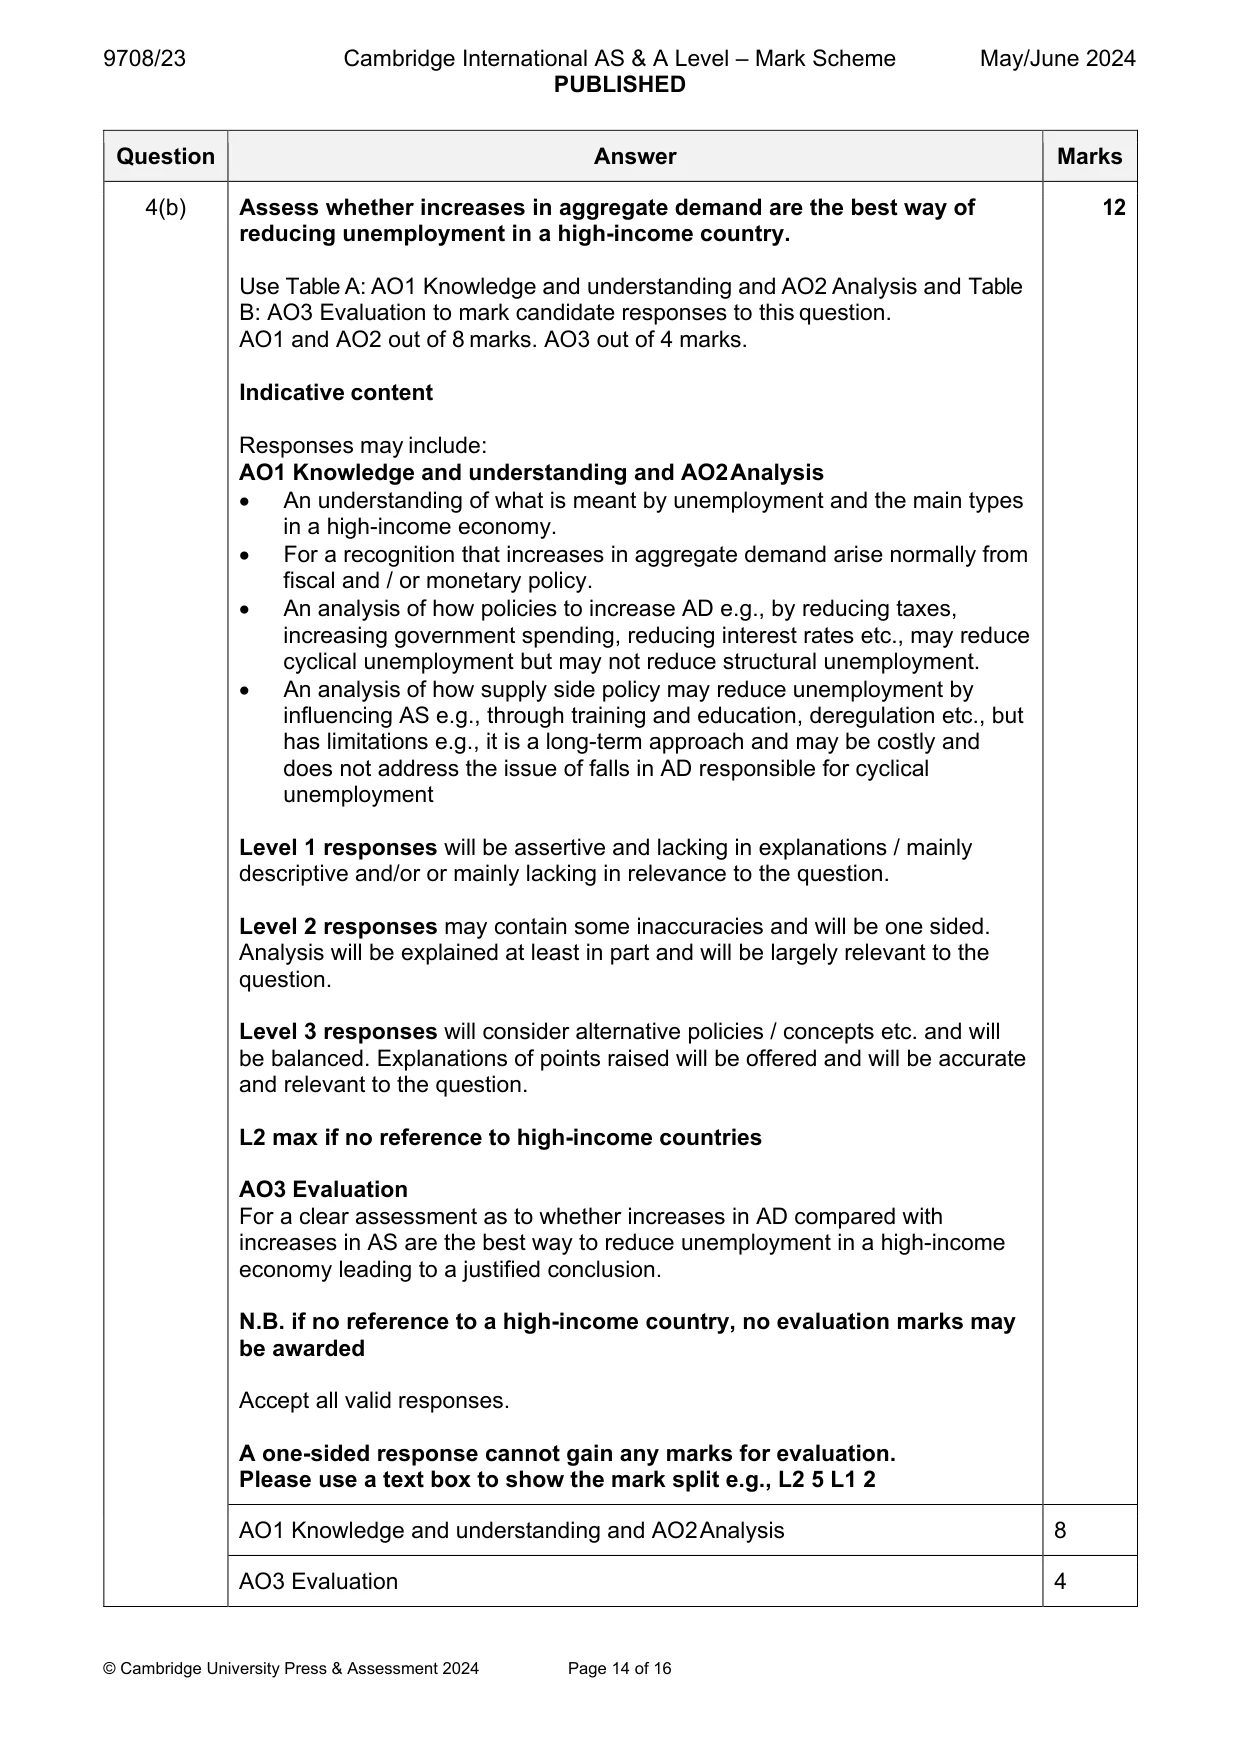
Mark scheme: 4(a) With the help of a diagram, explain how increases in aggregate demand 8 affect the level of real output and the price level in an economy and consider when such increases may become a problem. Follow the point-based marking guidance at the top of this mark scheme and award: up to 3 marks for AO1 Knowledge and understanding up to 3 marks for AO2 Analysis up to 2 marks for AO3 Evaluation. AO1 Knowledge and understanding (max 3 marks) An understanding of the components of AD i.e., C+G+I+X-M. (1) An accurately labeled AD/AS diagram showing the initial equilibrium point. (1) That also shows a shift or shifts to the right of the AD curve and the subsequent changes in the price level and real GDP. (1) AO2 Analysis (max 3 marks) For an explanation of why AD might increase. (1) For an explanation of why this increase may not cause problems such as inflation e.g., because of the shape of the AS curve, because AS may increase in line with AD if the increase is due to an increase in I. (1) For an explanation of why it may cause problems e.g., the economy is at full capacity and AS cannot increase. (1) AO3 Evaluation (max 2 marks) For valid evaluation e.g., a recognition that increases in AD may result in an inflationary increase in the price level beyond the full employment level of output. Reserve 1 mark for a justified conclusion. Please use a text box to show the mark split e.g., 3 2 1 AO1 Knowledge and understanding 3 AO2 Analysis 3 AO3 Evaluation 2 4(b) Assess whether increases in aggregate demand are the best way of 12 reducing unemployment in a high-income country. Use Table A: AO1 Knowledge and understanding and AO2 Analysis and Table B: AO3 Evaluation to mark candidate responses to this question. AO1 and AO2 out of 8 marks. AO3 out of 4 marks. Indicative content Responses may include: AO1 Knowledge and understanding and AO2 Analysis An understanding of what is meant by unemployment and the main types in a high-income economy. For a recognition that increases in aggregate demand arise normally from fiscal and / or monetary policy. An analysis of how policies to increase AD e.g., by reducing taxes, increasing government spending, reducing interest rates etc., may reduce cyclical unemployment but may not reduce structural unemployment. An analysis of how supply side policy may reduce unemployment by influencing AS e.g., through training and education, deregulation etc., but has limitations e.g., it is a long-term approach and may be costly and does not address the issue of falls in AD responsible for cyclical unemployment Level 1 responses will be assertive and lacking in explanations / mainly descriptive and/or or mainly lacking in relevance to the question. Level 2 responses may contain some inaccuracies and will be one sided. Analysis will be explained at least in part and will be largely relevant to the question. Level 3 responses will consider alternative policies / concepts etc. and will be balanced. Explanations of points raised will be offered and will be accurate and relevant to the question. L2 max if no reference to high-income countries AO3 Evaluation For a clear assessment as to whether increases in AD compared with increases in AS are the best way to reduce unemployment in a high-income economy leading to a justified conclusion. N.B. if no reference to a high-income country, no evaluation marks may be awarded Accept all valid responses. A one-sided response cannot gain any marks for evaluation. Please use a text box to show the mark split e.g., L2 5 L1 2 AO1 Knowledge and understanding and AO2 Analysis 8 AO3 Evaluation 4
Q5 · Explain two possible causes of a change in the terms of trade in an economy and consider…
5 (a) Explain two possible causes of a change in the terms of trade in an economy and consider which of these causes is likely to be more important for low-income countries. [8] (b) Assess the extent to which different tools of protection can impact on the terms of trade in an economy. [12]
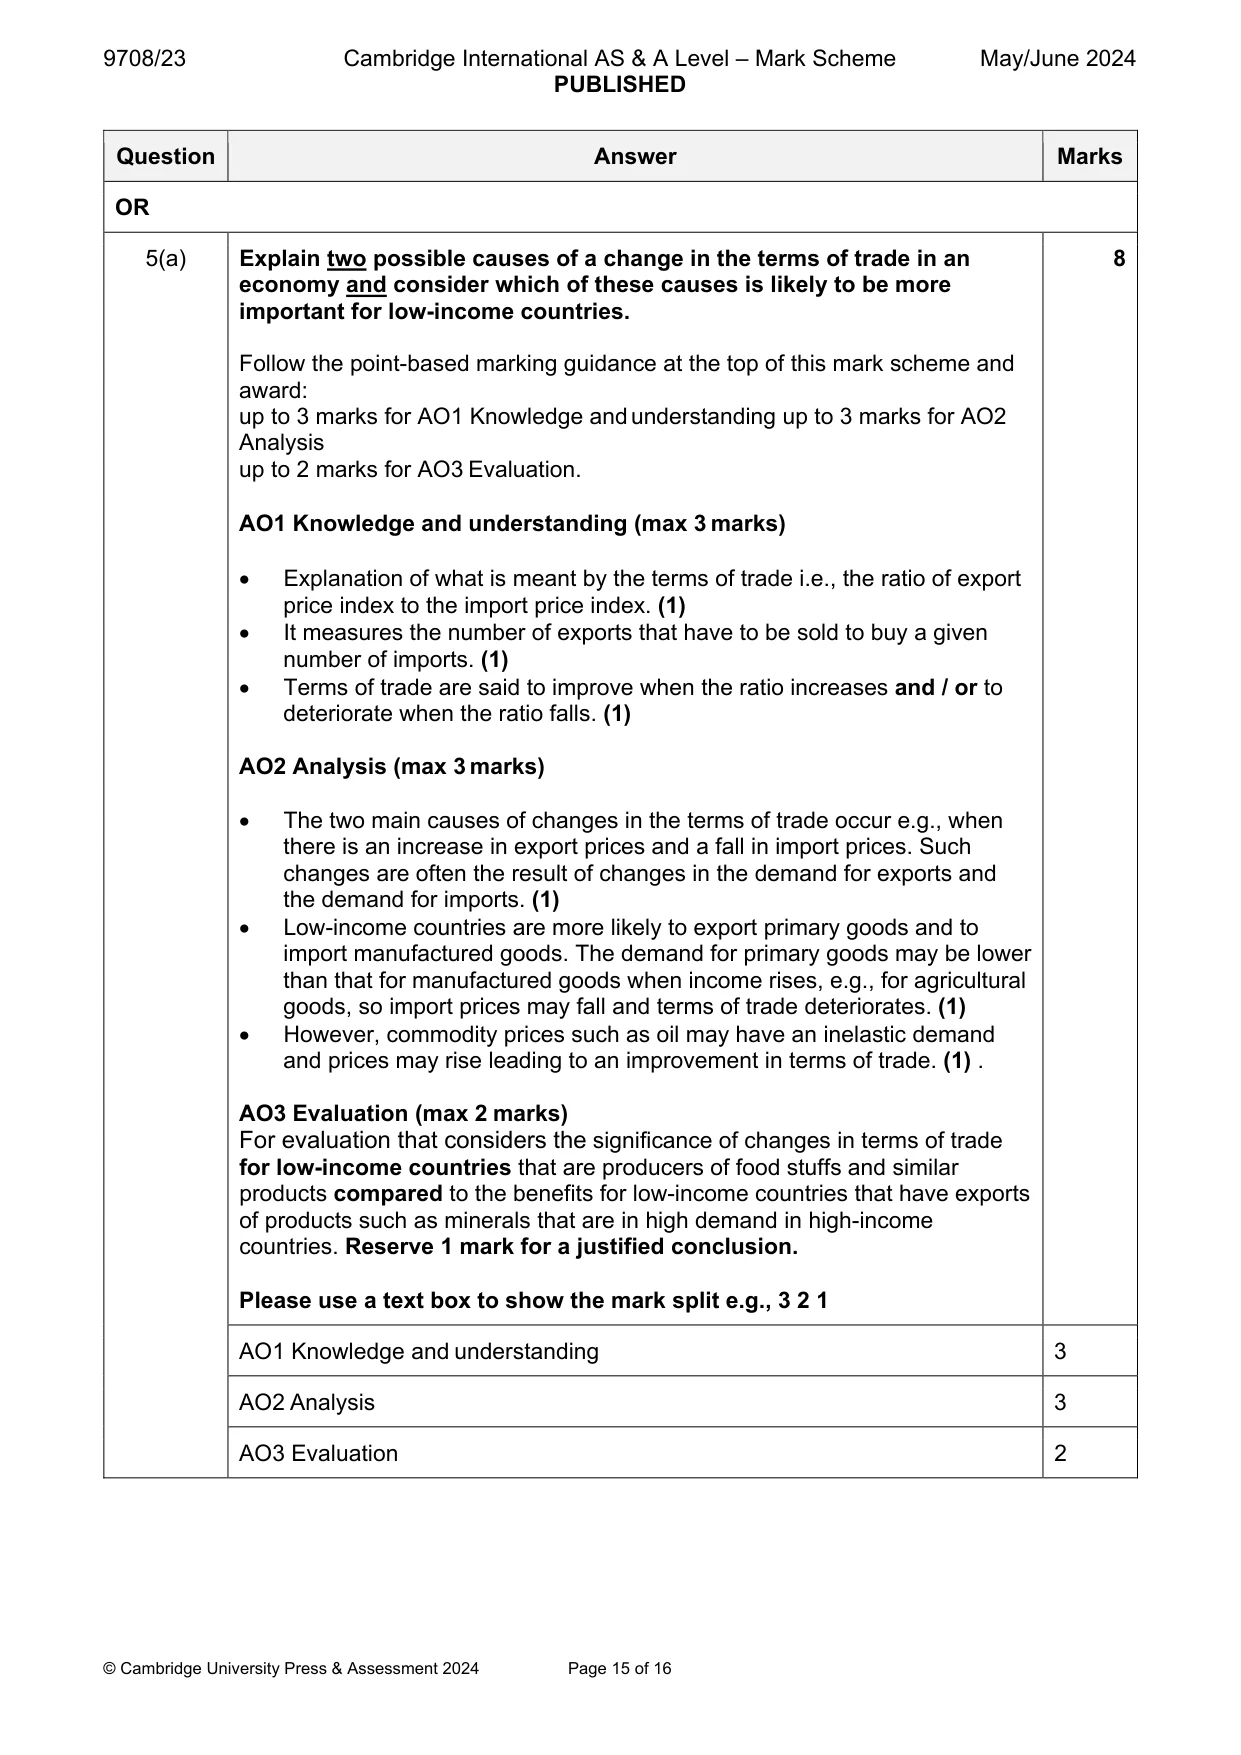
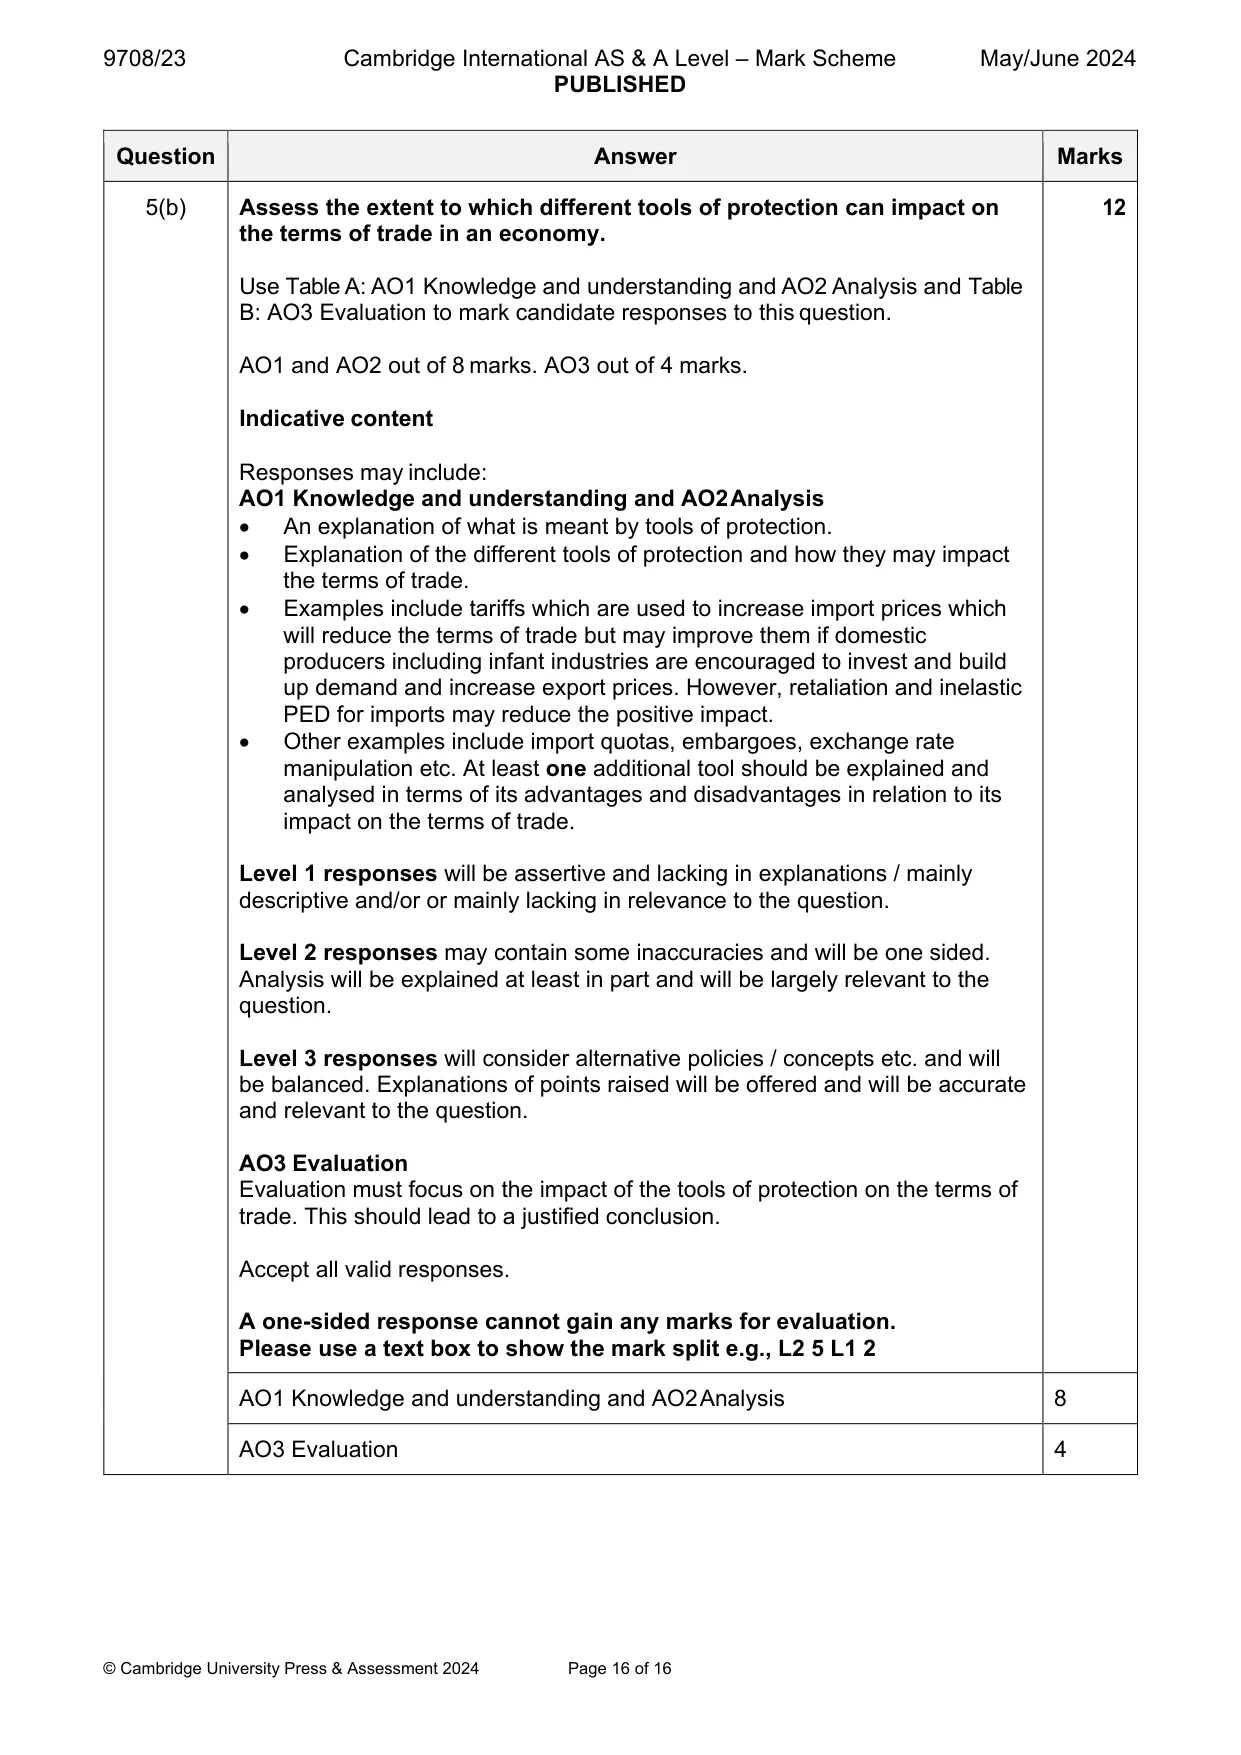
Mark scheme: 5(a) Explain two possible causes of a change in the terms of trade in an 8 economy and consider which of these causes is likely to be more important for low-income countries. Follow the point-based marking guidance at the top of this mark scheme and award: up to 3 marks for AO1 Knowledge and understanding up to 3 marks for AO2 Analysis up to 2 marks for AO3 Evaluation. AO1 Knowledge and understanding (max 3 marks) Explanation of what is meant by the terms of trade i.e., the ratio of export price index to the import price index. (1) It measures the number of exports that have to be sold to buy a given number of imports. (1) Terms of trade are said to improve when the ratio increases and / or to deteriorate when the ratio falls. (1) AO2 Analysis (max 3 marks) The two main causes of changes in the terms of trade occur e.g., when there is an increase in export prices and a fall in import prices. Such changes are often the result of changes in the demand for exports and the demand for imports. (1) Low-income countries are more likely to export primary goods and to import manufactured goods. The demand for primary goods may be lower than that for manufactured goods when income rises, e.g., for agricultural goods, so import prices may fall and terms of trade deteriorates. (1) However, commodity prices such as oil may have an inelastic demand and prices may rise leading to an improvement in terms of trade. (1) . AO3 Evaluation (max 2 marks) For evaluation that considers the significance of changes in terms of trade for low-income countries that are producers of food stuffs and similar products compared to the benefits for low-income countries that have exports of products such as minerals that are in high demand in high-income countries. Reserve 1 mark for a justified conclusion. Please use a text box to show the mark split e.g., 3 2 1 AO1 Knowledge and understanding 3 AO2 Analysis 3 AO3 Evaluation 2 5(b) Assess the extent to which different tools of protection can impact on 12 the terms of trade in an economy. Use Table A: AO1 Knowledge and understanding and AO2 Analysis and Table B: AO3 Evaluation to mark candidate responses to this question. AO1 and AO2 out of 8 marks. AO3 out of 4 marks. Indicative content Responses may include: AO1 Knowledge and understanding and AO2 Analysis An explanation of what is meant by tools of protection. Explanation of the different tools of protection and how they may impact the terms of trade. Examples include tariffs which are used to increase import prices which will reduce the terms of trade but may improve them if domestic producers including infant industries are encouraged to invest and build up demand and increase export prices. However, retaliation and inelastic PED for imports may reduce the positive impact. Other examples include import quotas, embargoes, exchange rate manipulation etc. At least one additional tool should be explained and analysed in terms of its advantages and disadvantages in relation to its impact on the terms of trade. Level 1 responses will be assertive and lacking in explanations / mainly descriptive and/or or mainly lacking in relevance to the question. Level 2 responses may contain some inaccuracies and will be one sided. Analysis will be explained at least in part and will be largely relevant to the question. Level 3 responses will consider alternative policies / concepts etc. and will be balanced. Explanations of points raised will be offered and will be accurate and relevant to the question. AO3 Evaluation Evaluation must focus on the impact of the tools of protection on the terms of trade. This should lead to a justified conclusion. Accept all valid responses. A one-sided response cannot gain any marks for evaluation. Please use a text box to show the mark split e.g., L2 5 L1 2 AO1 Knowledge and understanding and AO2 Analysis 8 AO3 Evaluation 4
What was in this paper
The subtopics covered by these 5 questions, and how many questions each got. Open one in a new tab to see every Cambridge question on it.
What you needed in this session
Cambridge’s own grade thresholds for 2024 May/June, Paper 2 · Variant 3. A higher threshold means an easier paper — the bar moves with how the cohort did.