Cambridge A Level Economics 9708 — 2025 May/June Paper 2 · Variant 3
9708/23/M/J/25 · 5 questions · 60 marks · ≈68 min
The question paper and its mark scheme, free to read here and free to download. This is Cambridge’s own paper, exactly as it was sat.
Question paper4 pages
Mark scheme23 pages
Answers below. Sit the paper first if you are practising.


Questions as text
Q1 · How onions became a luxury good in the Philippines Global inflation is putting a strain…
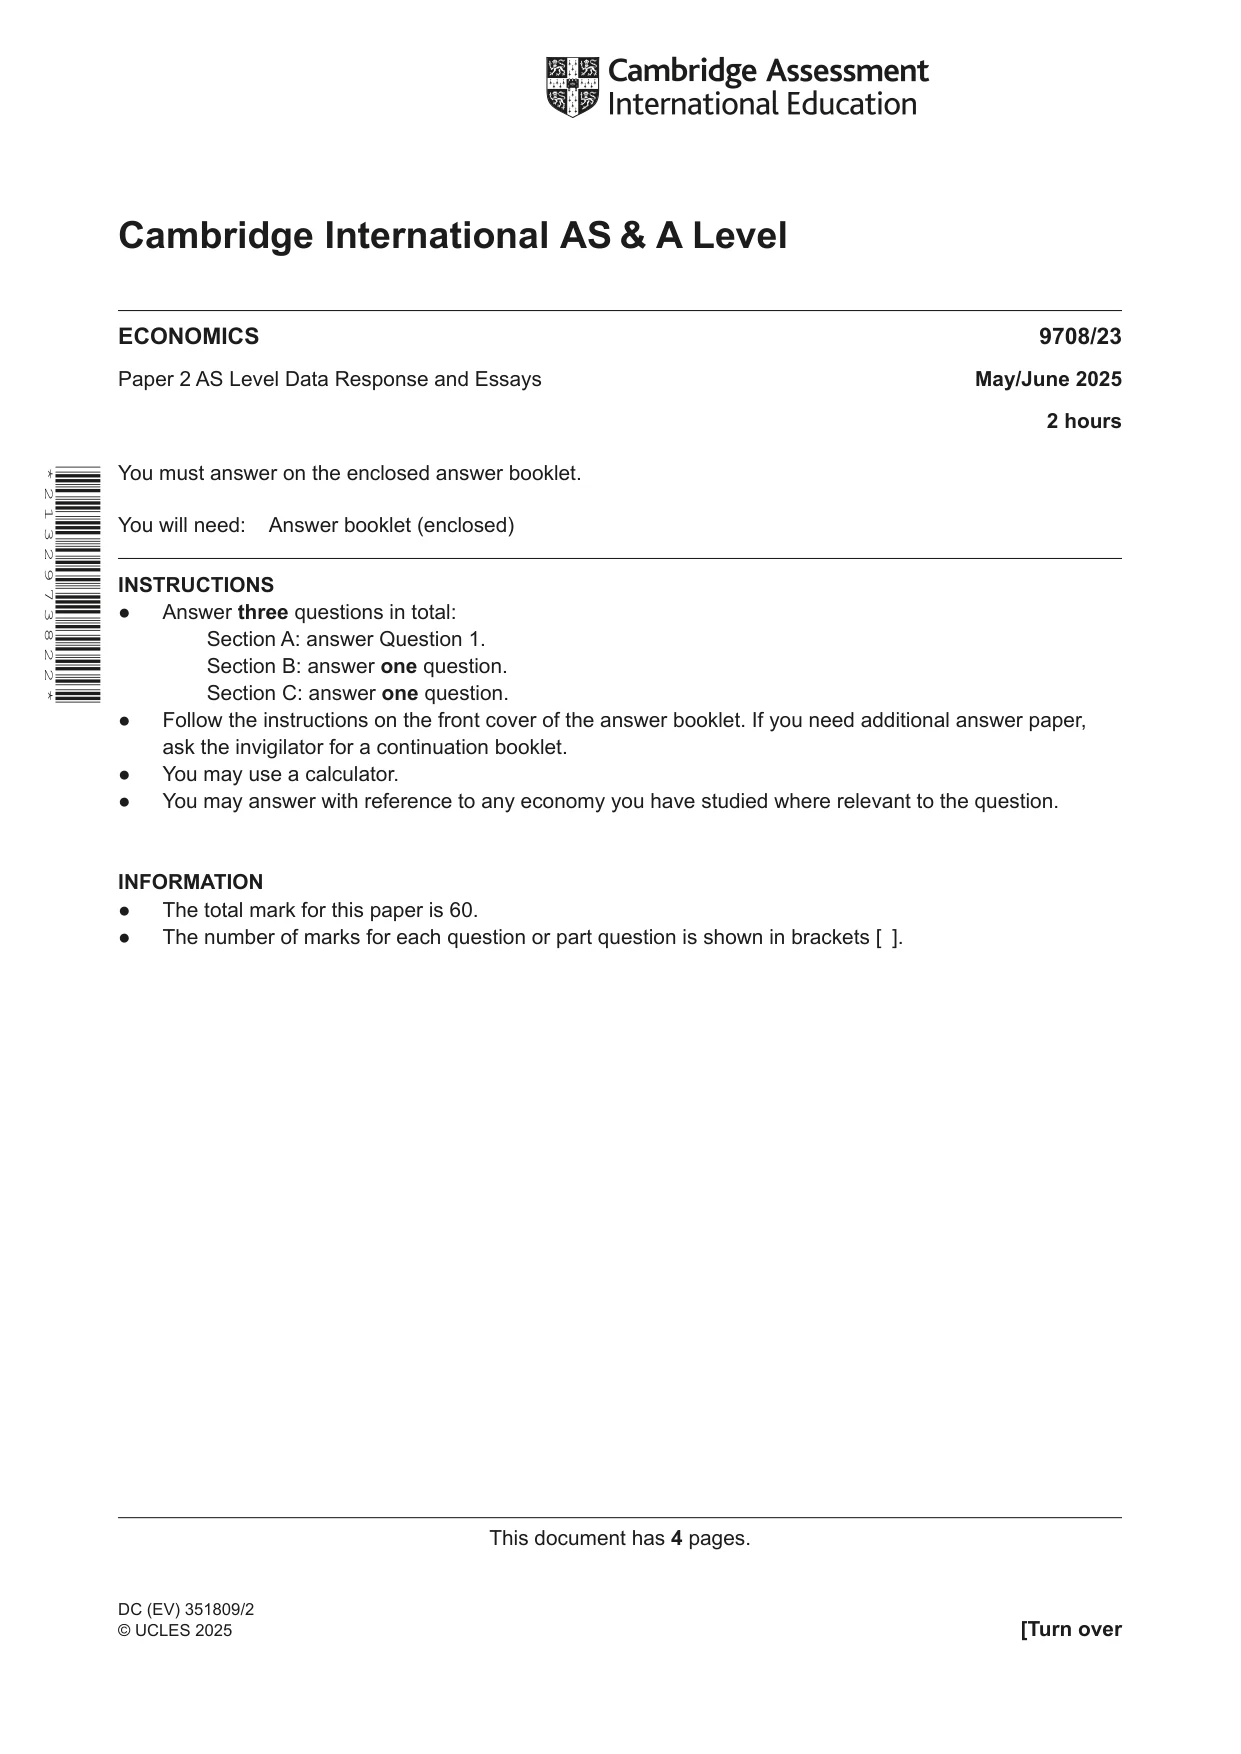
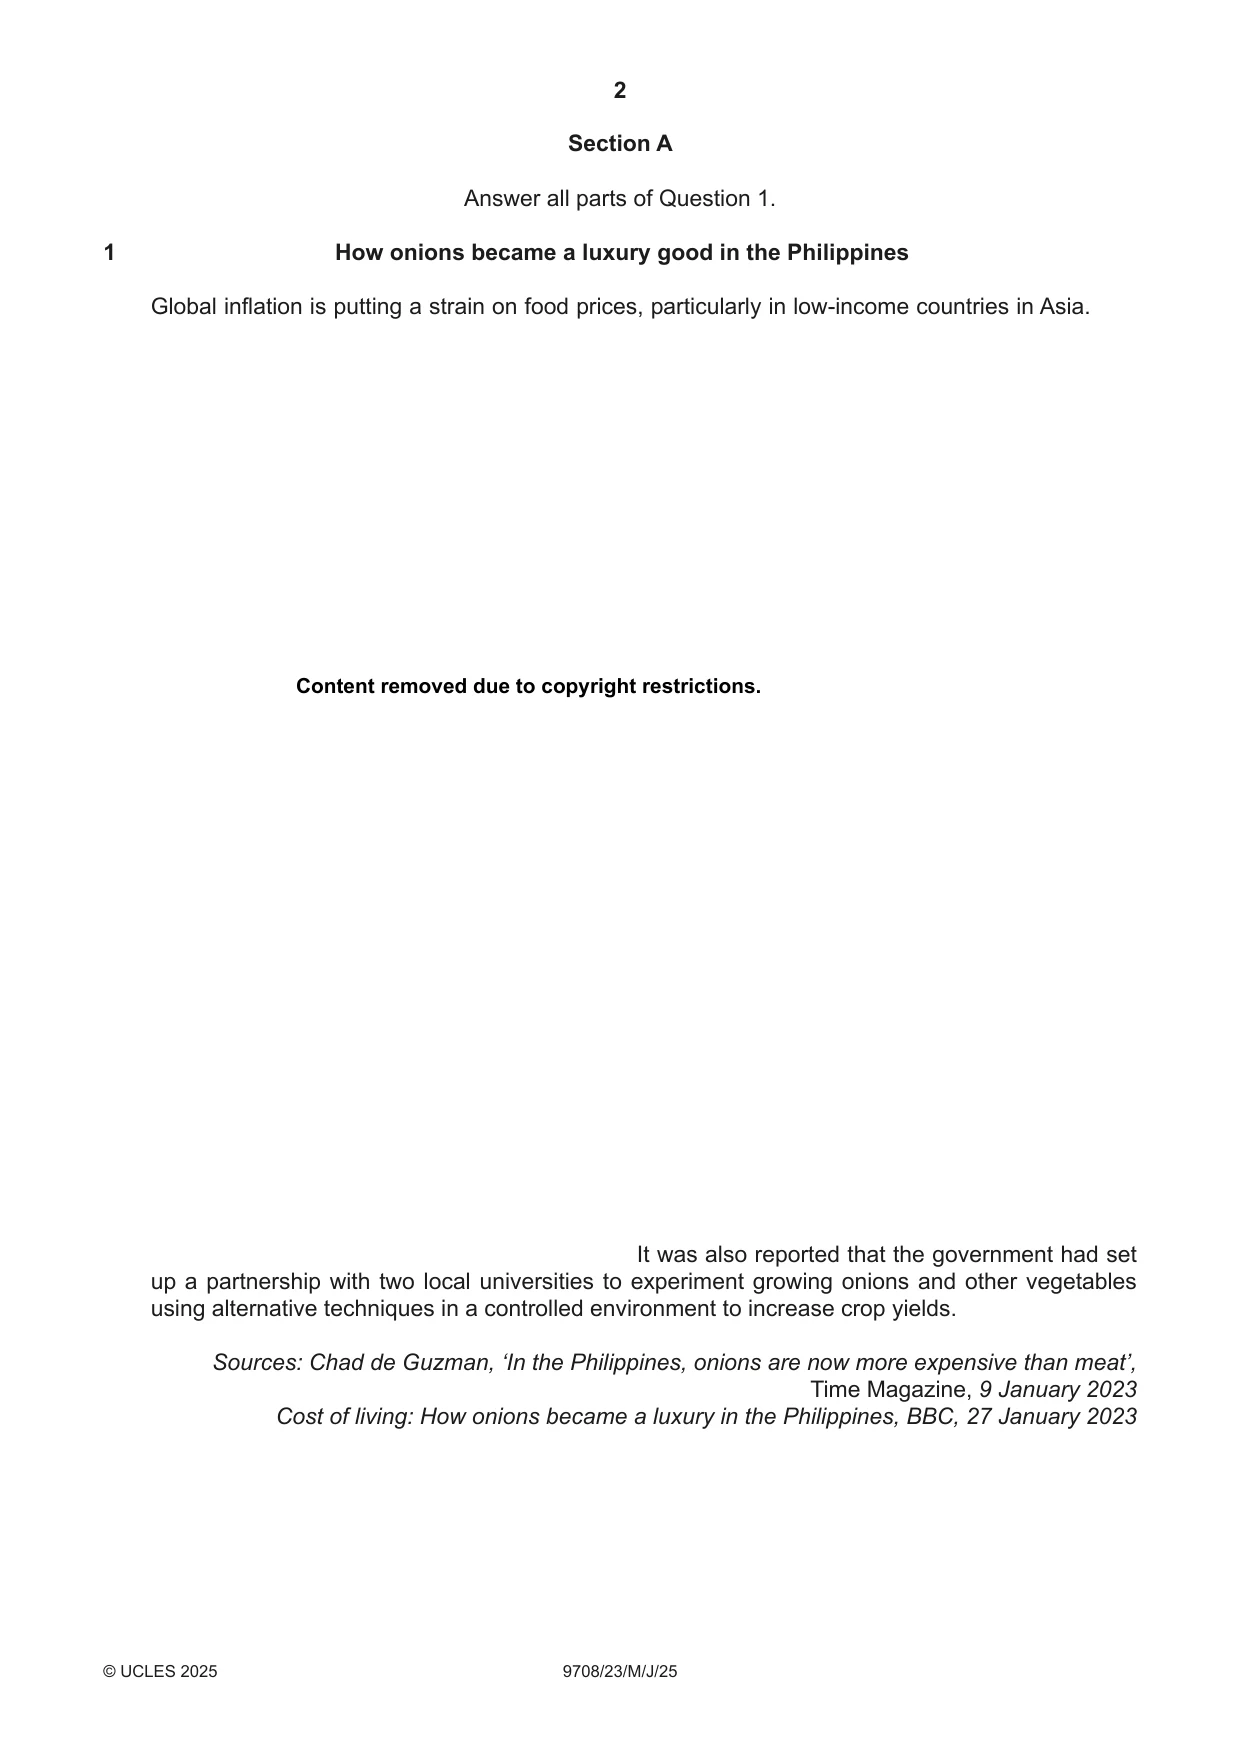
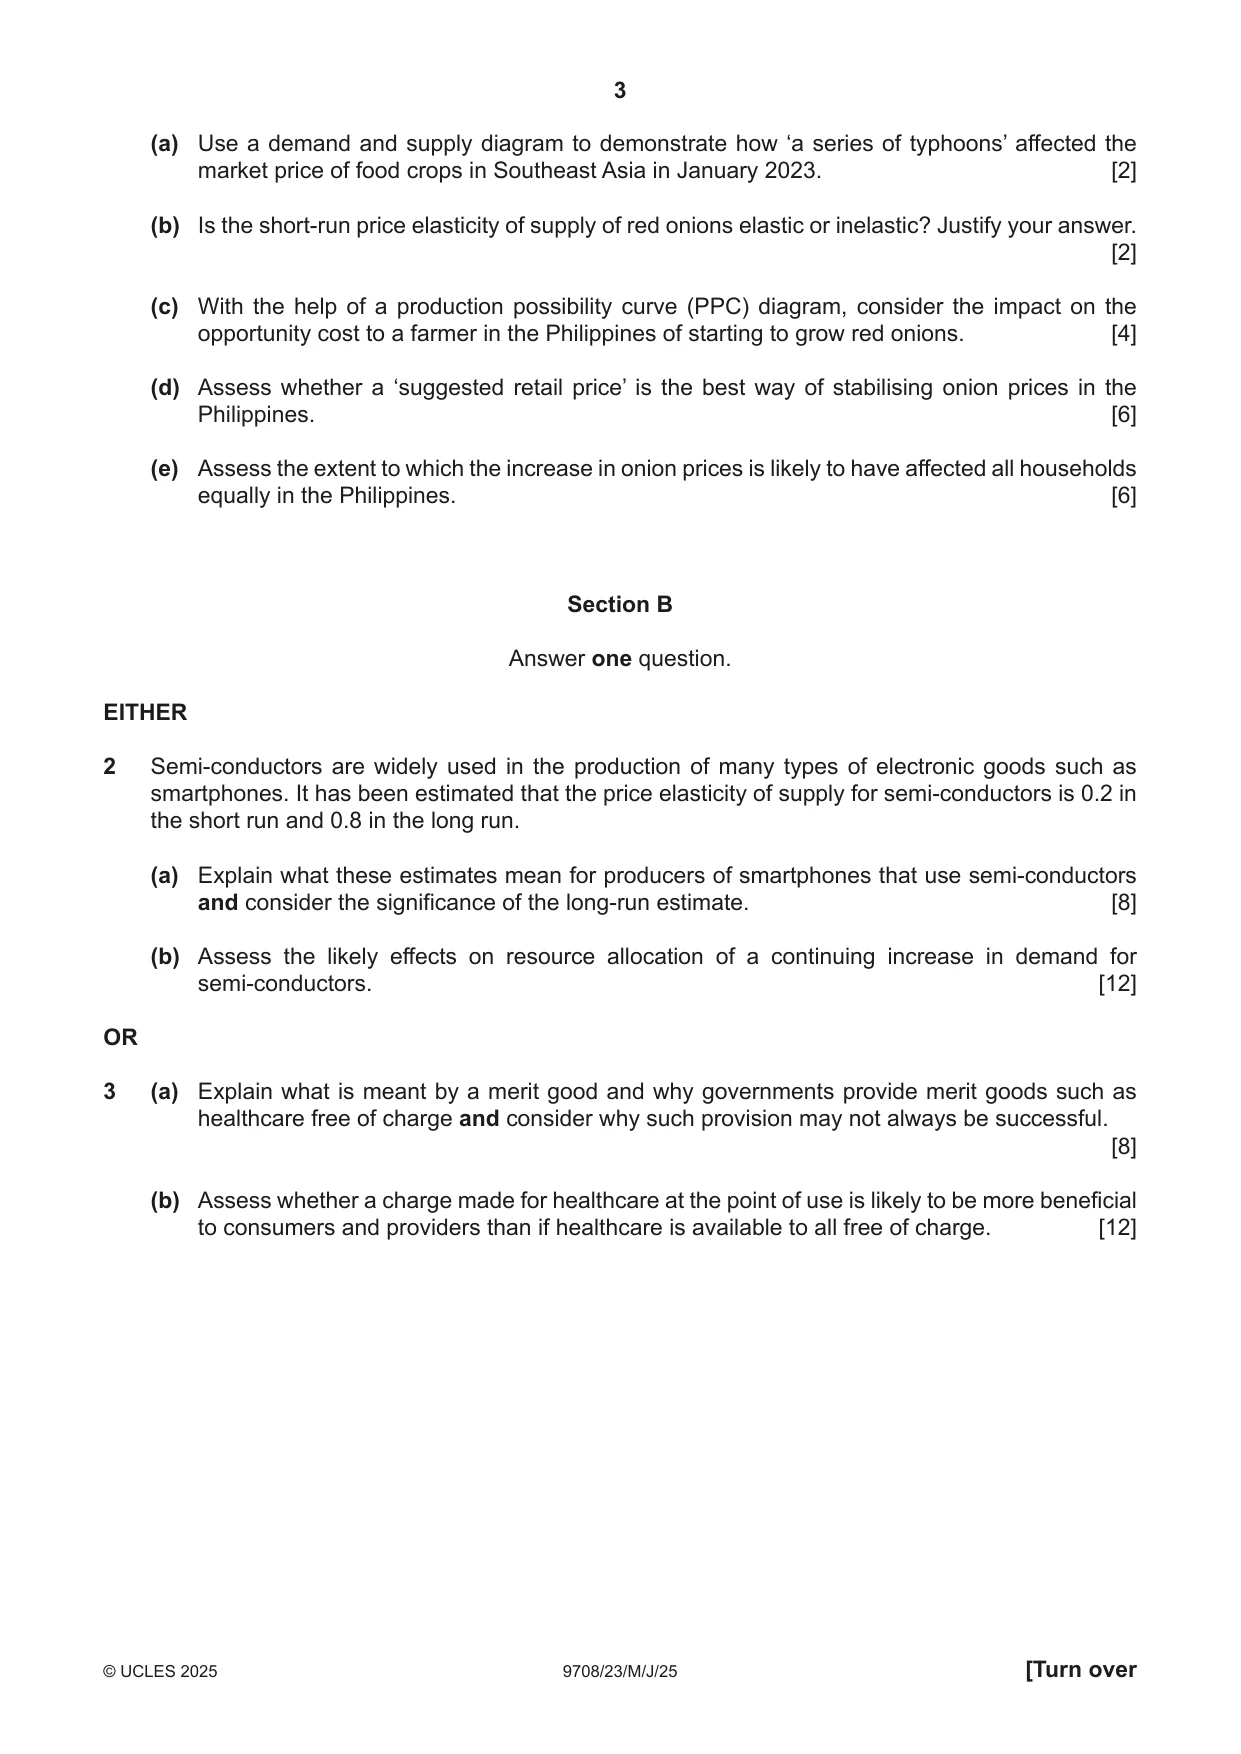
1 How onions became a luxury good in the Philippines Global inflation is putting a strain on food prices, particularly in low-income countries in Asia. Content removed due to copyright restrictions. It was also reported that the government had set up a partnership with two local universities to experiment growing onions and other vegetables using alternative techniques in a controlled environment to increase crop yields. Sources: Chad de Guzman, ‘In the Philippines, onions are now more expensive than meat’, Time Magazine, 9 January 2023 Cost of living: How onions became a luxury in the Philippines, BBC, 27 January 2023 (a) Use a demand and supply diagram to demonstrate how ‘a series of typhoons’ affected the market price of food crops in Southeast Asia in January 2023. [2] (b) Is the short-run price elasticity of supply of red onions elastic or inelastic? Justify your answer. [2] (c) With the help of a production possibility curve (PPC) diagram, consider the impact on the opportunity cost to a farmer in the Philippines of starting to grow red onions. [4] (d) Assess whether a ‘suggested retail price’ is the best way of stabilising onion prices in the Philippines. [6] (e) Assess the extent to which the increase in onion prices is likely to have affected all households equally in the Philippines. [6]
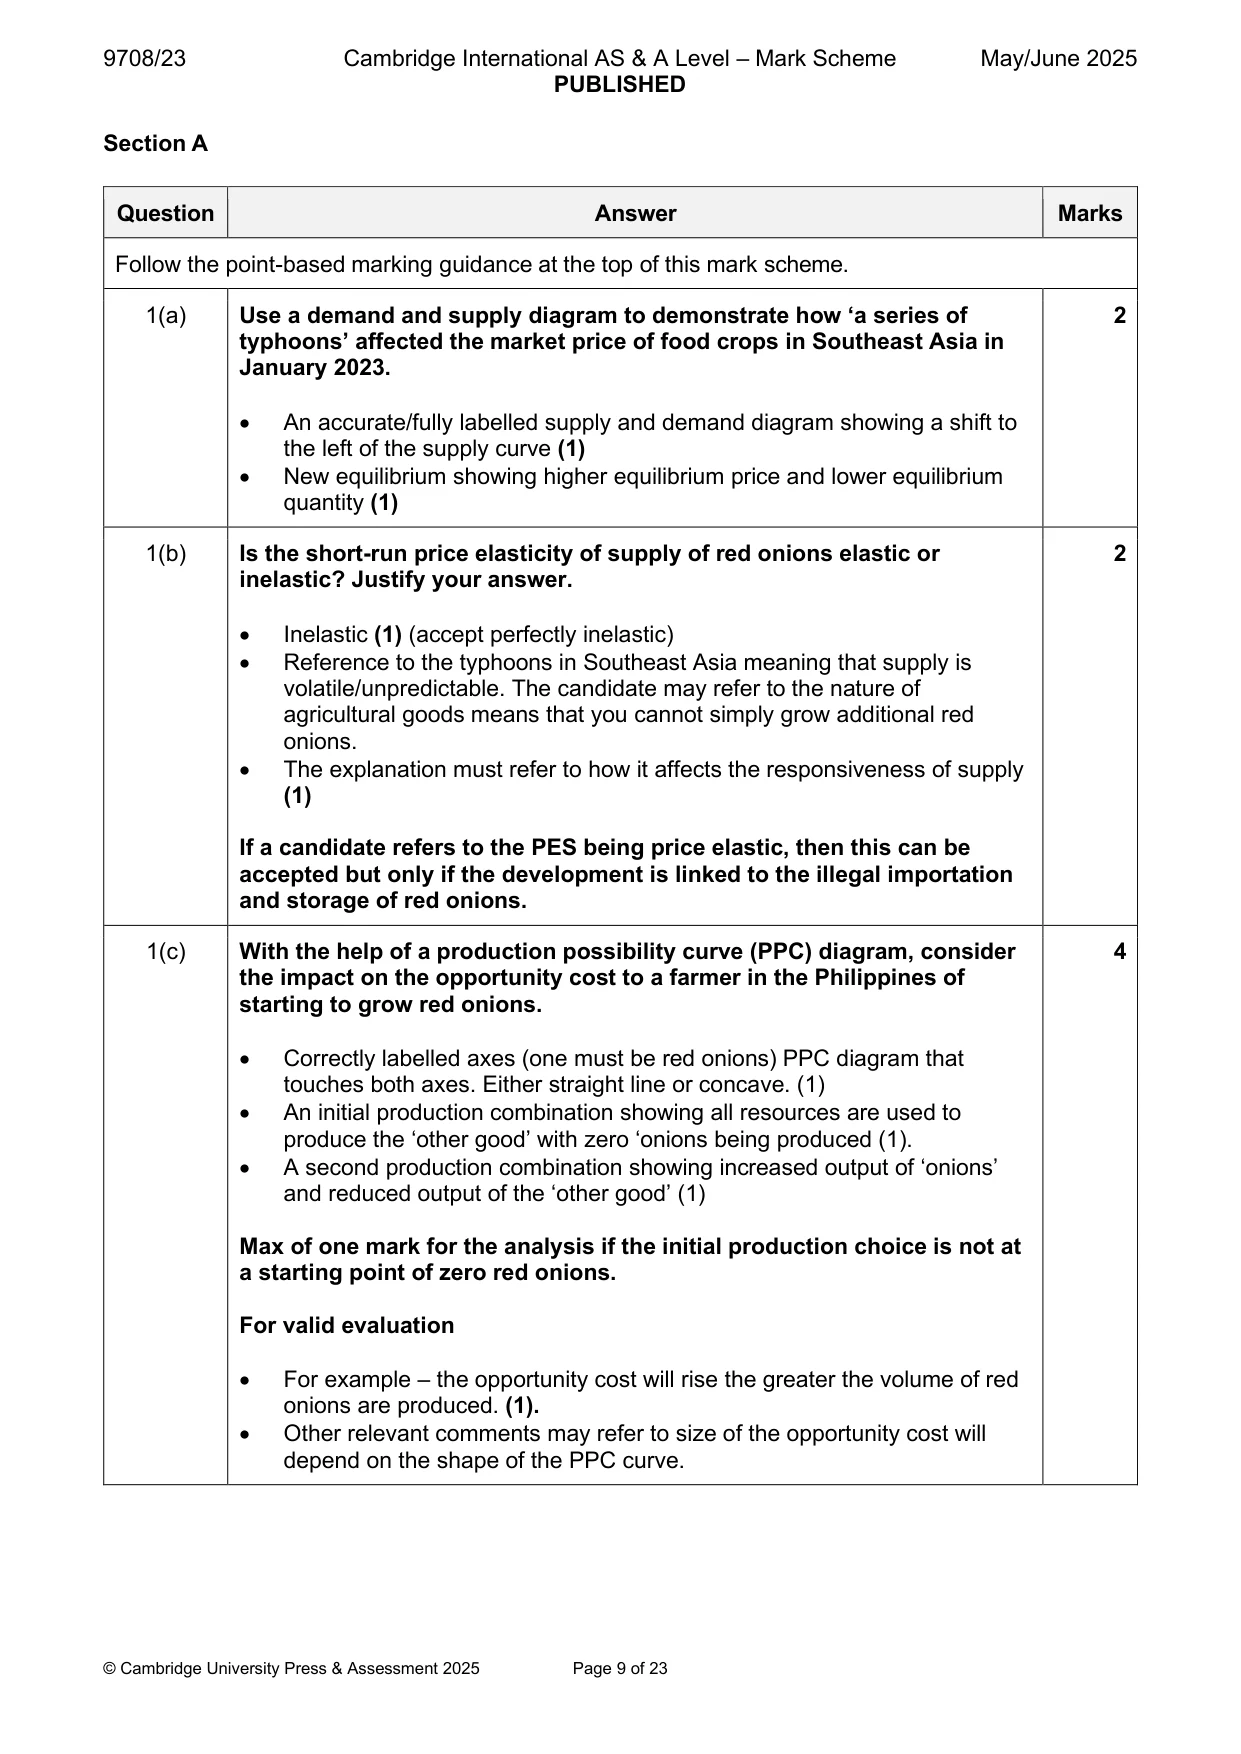
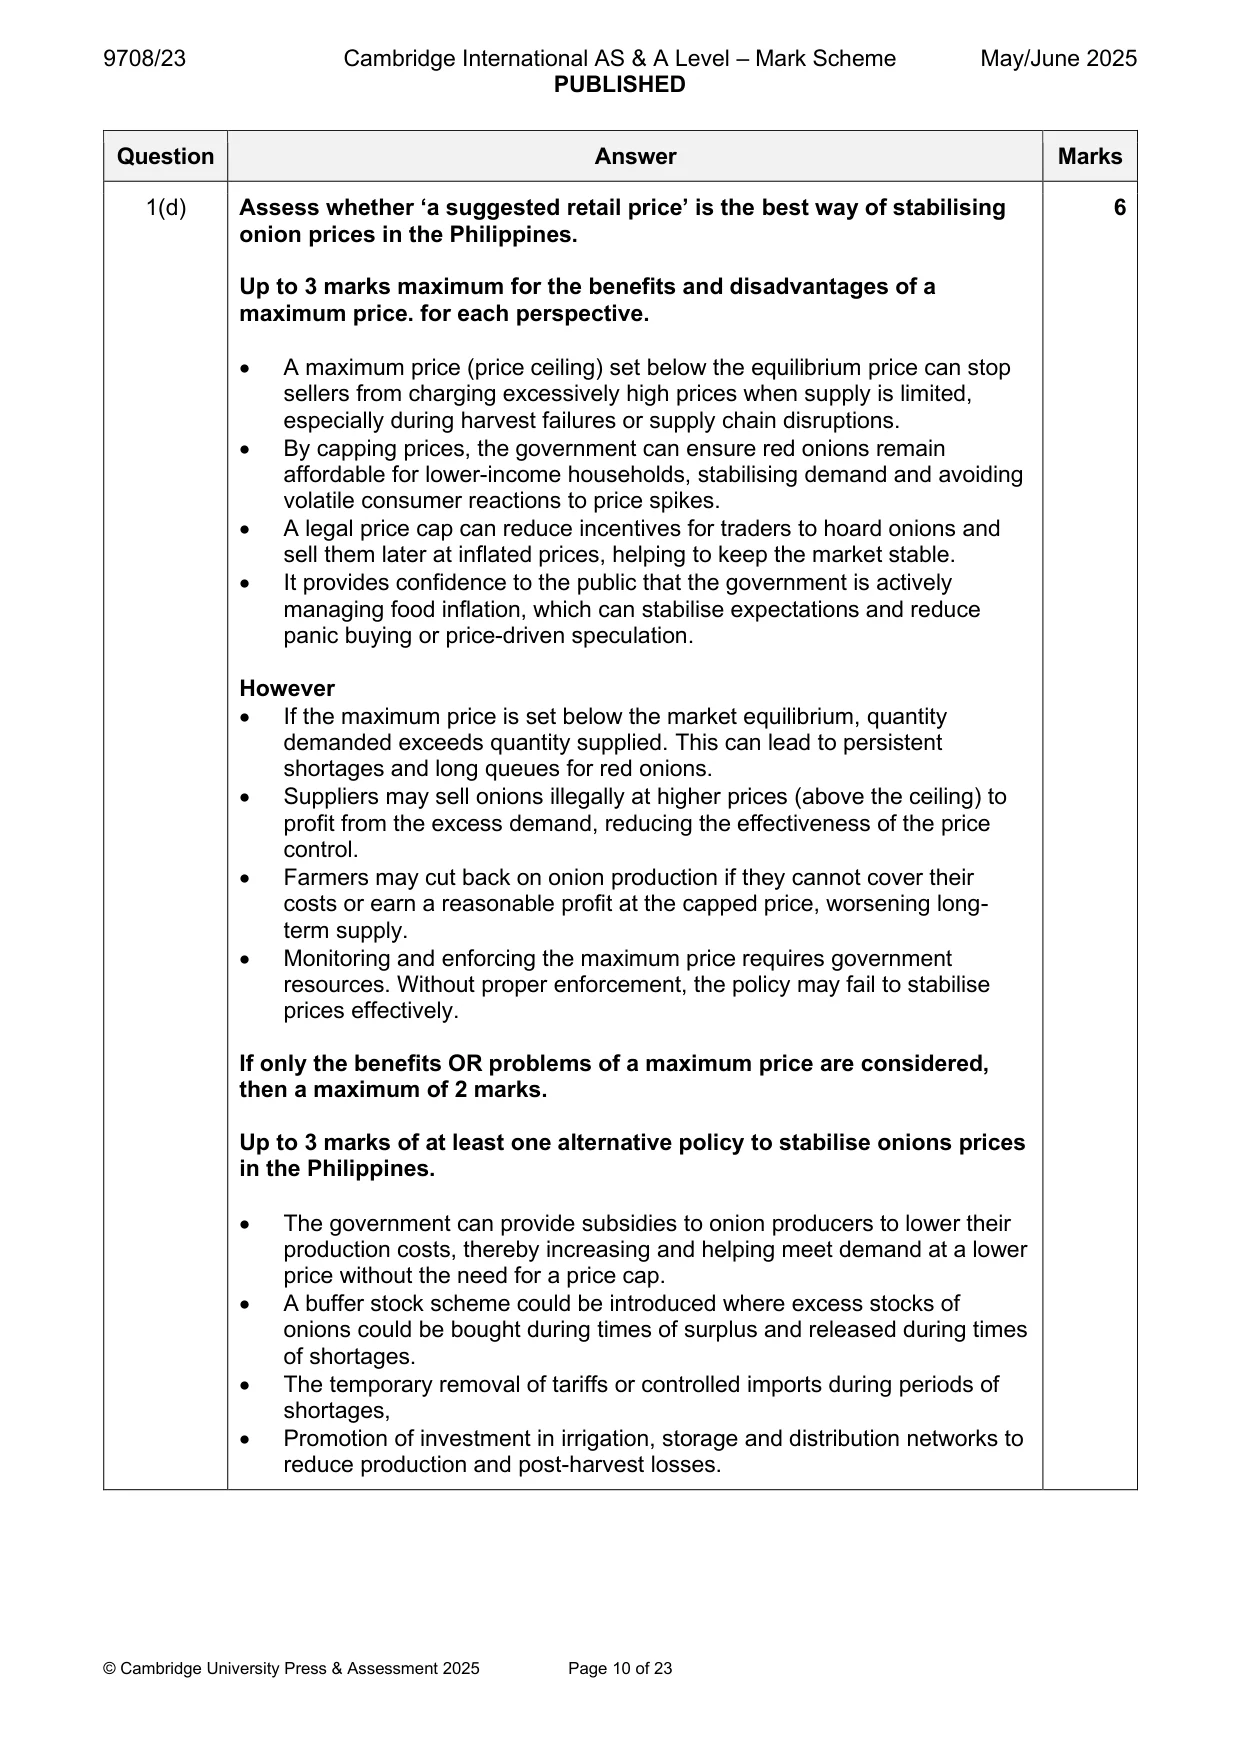
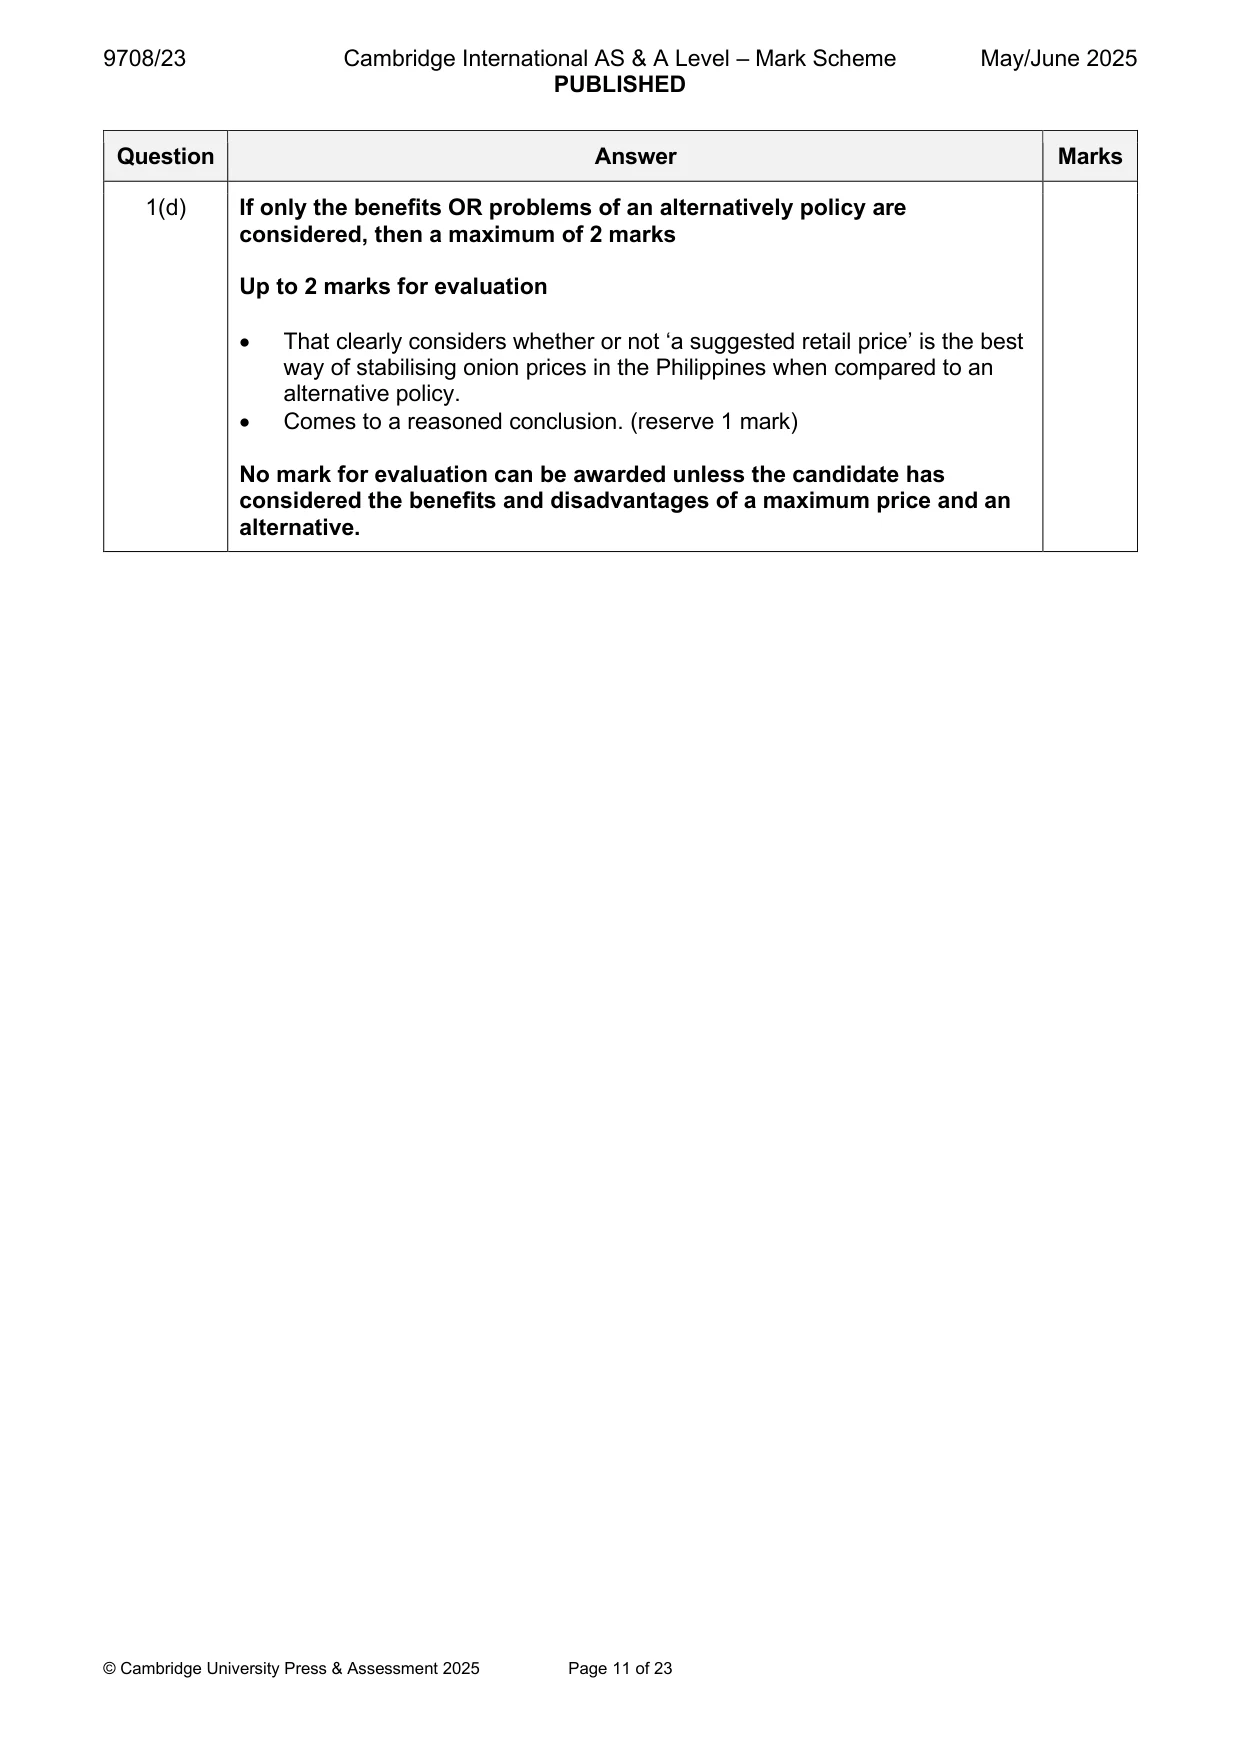
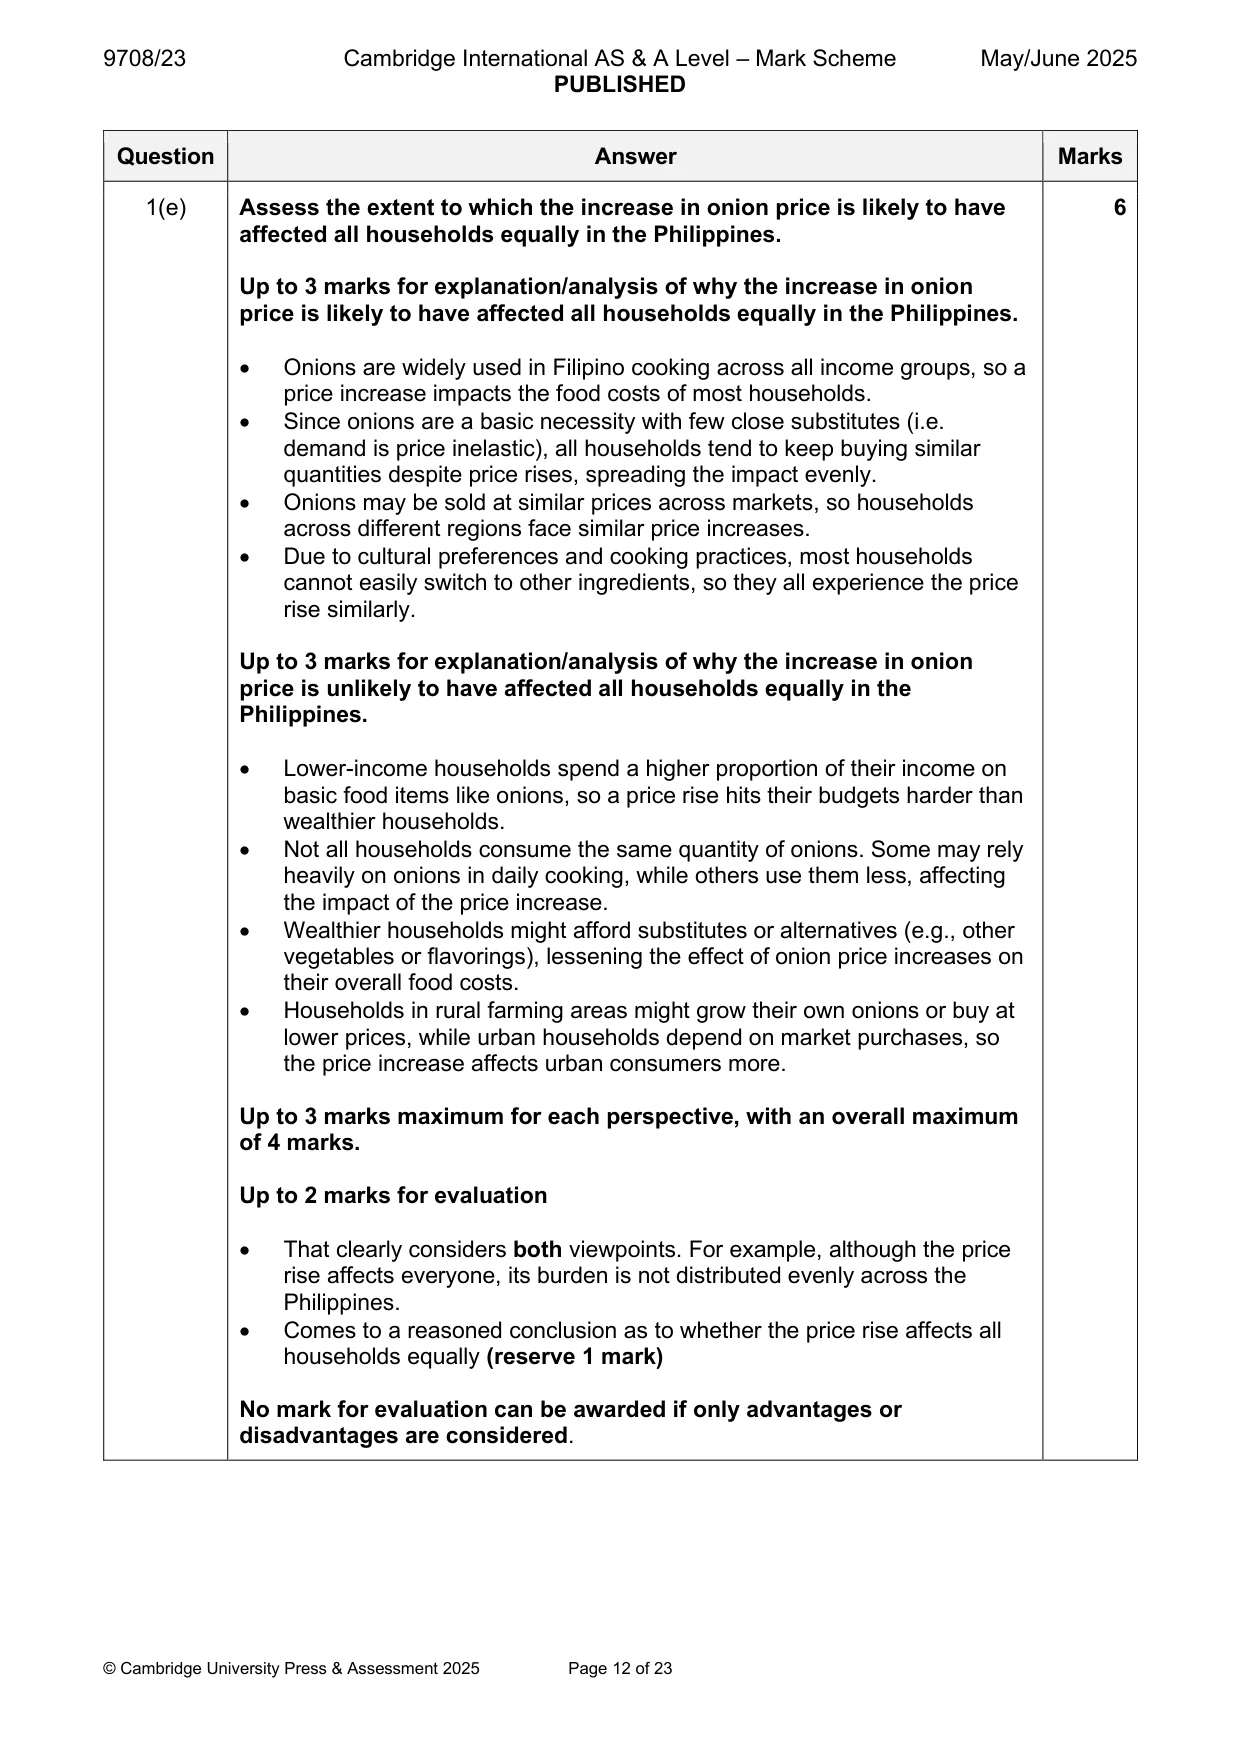
Mark scheme: Question Answer Marks Follow the point-based marking guidance at the top of this mark scheme. 1(a) Use a demand and supply diagram to demonstrate how ‘a series of 2 typhoons’ affected the market price of food crops in Southeast Asia in January 2023. • An accurate/fully labelled supply and demand diagram showing a shift to the left of the supply curve (1) • New equilibrium showing higher equilibrium price and lower equilibrium quantity (1) 1(b) Is the short-run price elasticity of supply of red onions elastic or 2 inelastic? Justify your answer. • Inelastic (1) (accept perfectly inelastic) • Reference to the typhoons in Southeast Asia meaning that supply is volatile/unpredictable. The candidate may refer to the nature of agricultural goods means that you cannot simply grow additional red onions. • The explanation must refer to how it affects the responsiveness of supply (1) If a candidate refers to the PES being price elastic, then this can be accepted but only if the development is linked to the illegal importation and storage of red onions. 1(c) With the help of a production possibility curve (PPC) diagram, consider 4 the impact on the opportunity cost to a farmer in the Philippines of starting to grow red onions. • Correctly labelled axes (one must be red onions) PPC diagram that touches both axes. Either straight line or concave. (1) • An initial production combination showing all resources are used to produce the ‘other good’ with zero ‘onions being produced (1). • A second production combination showing increased output of ‘onions’ and reduced output of the ‘other good’ (1) Max of one mark for the analysis if the initial production choice is not at a starting point of zero red onions. For valid evaluation • For example – the opportunity cost will rise the greater the volume of red onions are produced. (1). • Other relevant comments may refer to size of the opportunity cost will depend on the shape of the PPC curve. 1(d) Assess whether ‘a suggested retail price’ is the best way of stabilising 6 onion prices in the Philippines. Up to 3 marks maximum for the benefits and disadvantages of a maximum price. for each perspective. • A maximum price (price ceiling) set below the equilibrium price can stop sellers from charging excessively high prices when supply is limited, especially during harvest failures or supply chain disruptions. • By capping prices, the government can ensure red onions remain affordable for lower-income households, stabilising demand and avoiding volatile consumer reactions to price spikes. • A legal price cap can reduce incentives for traders to hoard onions and sell them later at inflated prices, helping to keep the market stable. • It provides confidence to the public that the government is actively managing food inflation, which can stabilise expectations and reduce panic buying or price-driven speculation. However • If the maximum price is set below the market equilibrium, quantity demanded exceeds quantity supplied. This can lead to persistent shortages and long queues for red onions. • Suppliers may sell onions illegally at higher prices (above the ceiling) to profit from the excess demand, reducing the effectiveness of the price control. • Farmers may cut back on onion production if they cannot cover their costs or earn a reasonable profit at the capped price, worsening long- term supply. • Monitoring and enforcing the maximum price requires government resources. Without proper enforcement, the policy may fail to stabilise prices effectively. If only the benefits OR problems of a maximum price are considered, then a maximum of 2 marks. Up to 3 marks of at least one alternative policy to stabilise onions prices in the Philippines. • The government can provide subsidies to onion producers to lower their production costs, thereby increasing and helping meet demand at a lower price without the need for a price cap. • A buffer stock scheme could be introduced where excess stocks of onions could be bought during times of surplus and released during times of shortages. • The temporary removal of tariffs or controlled imports during periods of shortages, • Promotion of investment in irrigation, storage and distribution networks to reduce production and post-harvest losses. 1(d) If only the benefits OR problems of an alternatively policy are considered, then a maximum of 2 marks Up to 2 marks for evaluation • That clearly considers whether or not ‘a suggested retail price’ is the best way of stabilising onion prices in the Philippines when compared to an alternative policy. • Comes to a reasoned conclusion. (reserve 1 mark) No mark for evaluation can be awarded unless the candidate has considered the benefits and disadvantages of a maximum price and an alternative. 1(e) Assess the extent to which the increase in onion price is likely to have 6 affected all households equally in the Philippines. Up to 3 marks for explanation/analysis of why the increase in onion price is likely to have affected all households equally in the Philippines. • Onions are widely used in Filipino cooking across all income groups, so a price increase impacts the food costs of most households. • Since onions are a basic necessity with few close substitutes (i.e. demand is price inelastic), all households tend to keep buying similar quantities despite price rises, spreading the impact evenly. • Onions may be sold at similar prices across markets, so households across different regions face similar price increases. • Due to cultural preferences and cooking practices, most households cannot easily switch to other ingredients, so they all experience the price rise similarly. Up to 3 marks for explanation/analysis of why the increase in onion price is unlikely to have affected all households equally in the Philippines. • Lower-income households spend a higher proportion of their income on basic food items like onions, so a price rise hits their budgets harder than wealthier households. • Not all households consume the same quantity of onions. Some may rely heavily on onions in daily cooking, while others use them less, affecting the impact of the price increase. • Wealthier households might afford substitutes or alternatives (e.g., other vegetables or flavorings), lessening the effect of onion price increases on their overall food costs. • Households in rural farming areas might grow their own onions or buy at lower prices, while urban households depend on market purchases, so the price increase affects urban consumers more. Up to 3 marks maximum for each perspective, with an overall maximum of 4 marks. Up to 2 marks for evaluation • That clearly considers both viewpoints. For example, although the price rise affects everyone, its burden is not distributed evenly across the Philippines. • Comes to a reasoned conclusion as to whether the price rise affects all households equally (reserve 1 mark) No mark for evaluation can be awarded if only advantages or disadvantages are considered. Section B
More questions on Methods and effects of government intervention in markets
Q2 · Semi-conductors are widely used in the production of many types of electronic goods such…
2 Semi-conductors are widely used in the production of many types of electronic goods such as smartphones. It has been estimated that the price elasticity of supply for semi-conductors is 0.2 in the short run and 0.8 in the long run. (a) Explain what these estimates mean for producers of smartphones that use semi-conductors and consider the significance of the long-run estimate. [8] (b) Assess the likely effects on resource allocation of a continuing increase in demand for semi-conductors. [12] OR
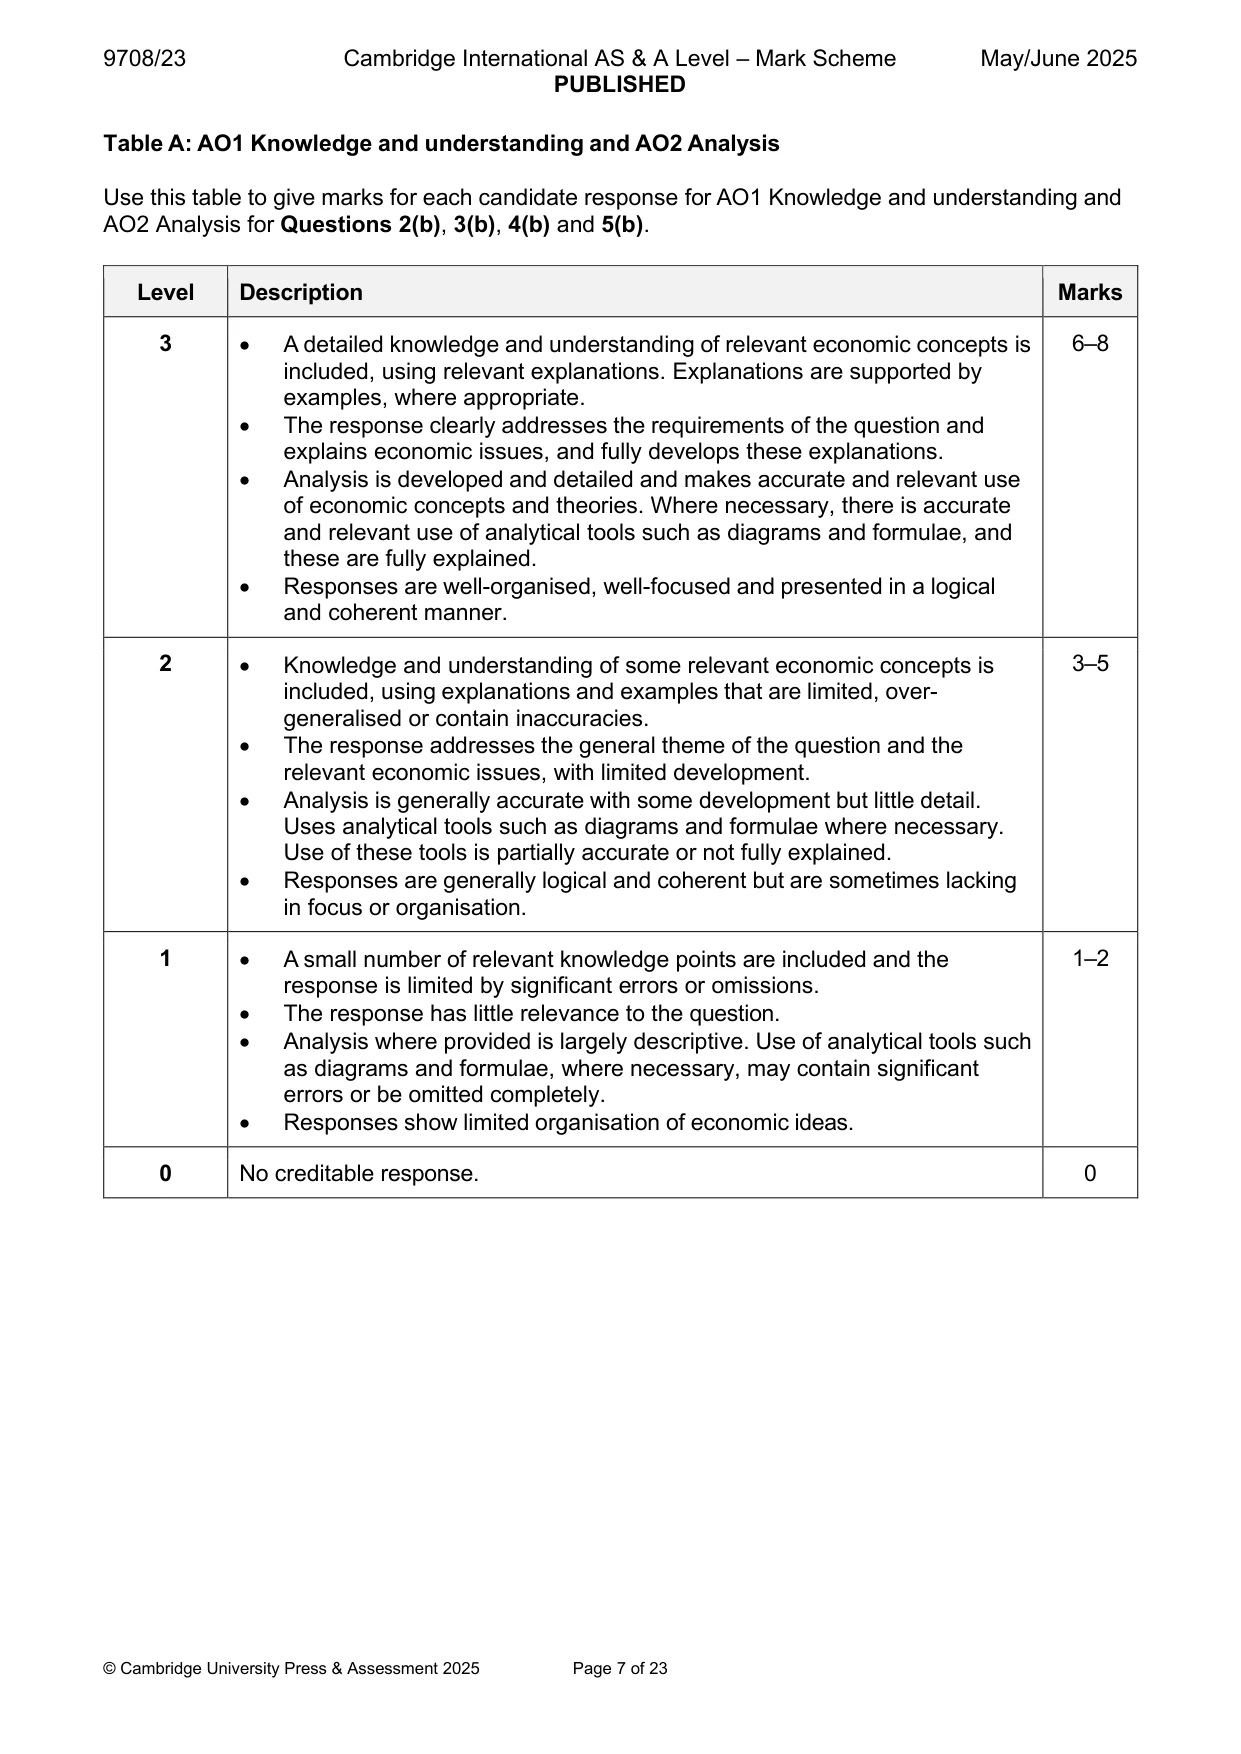
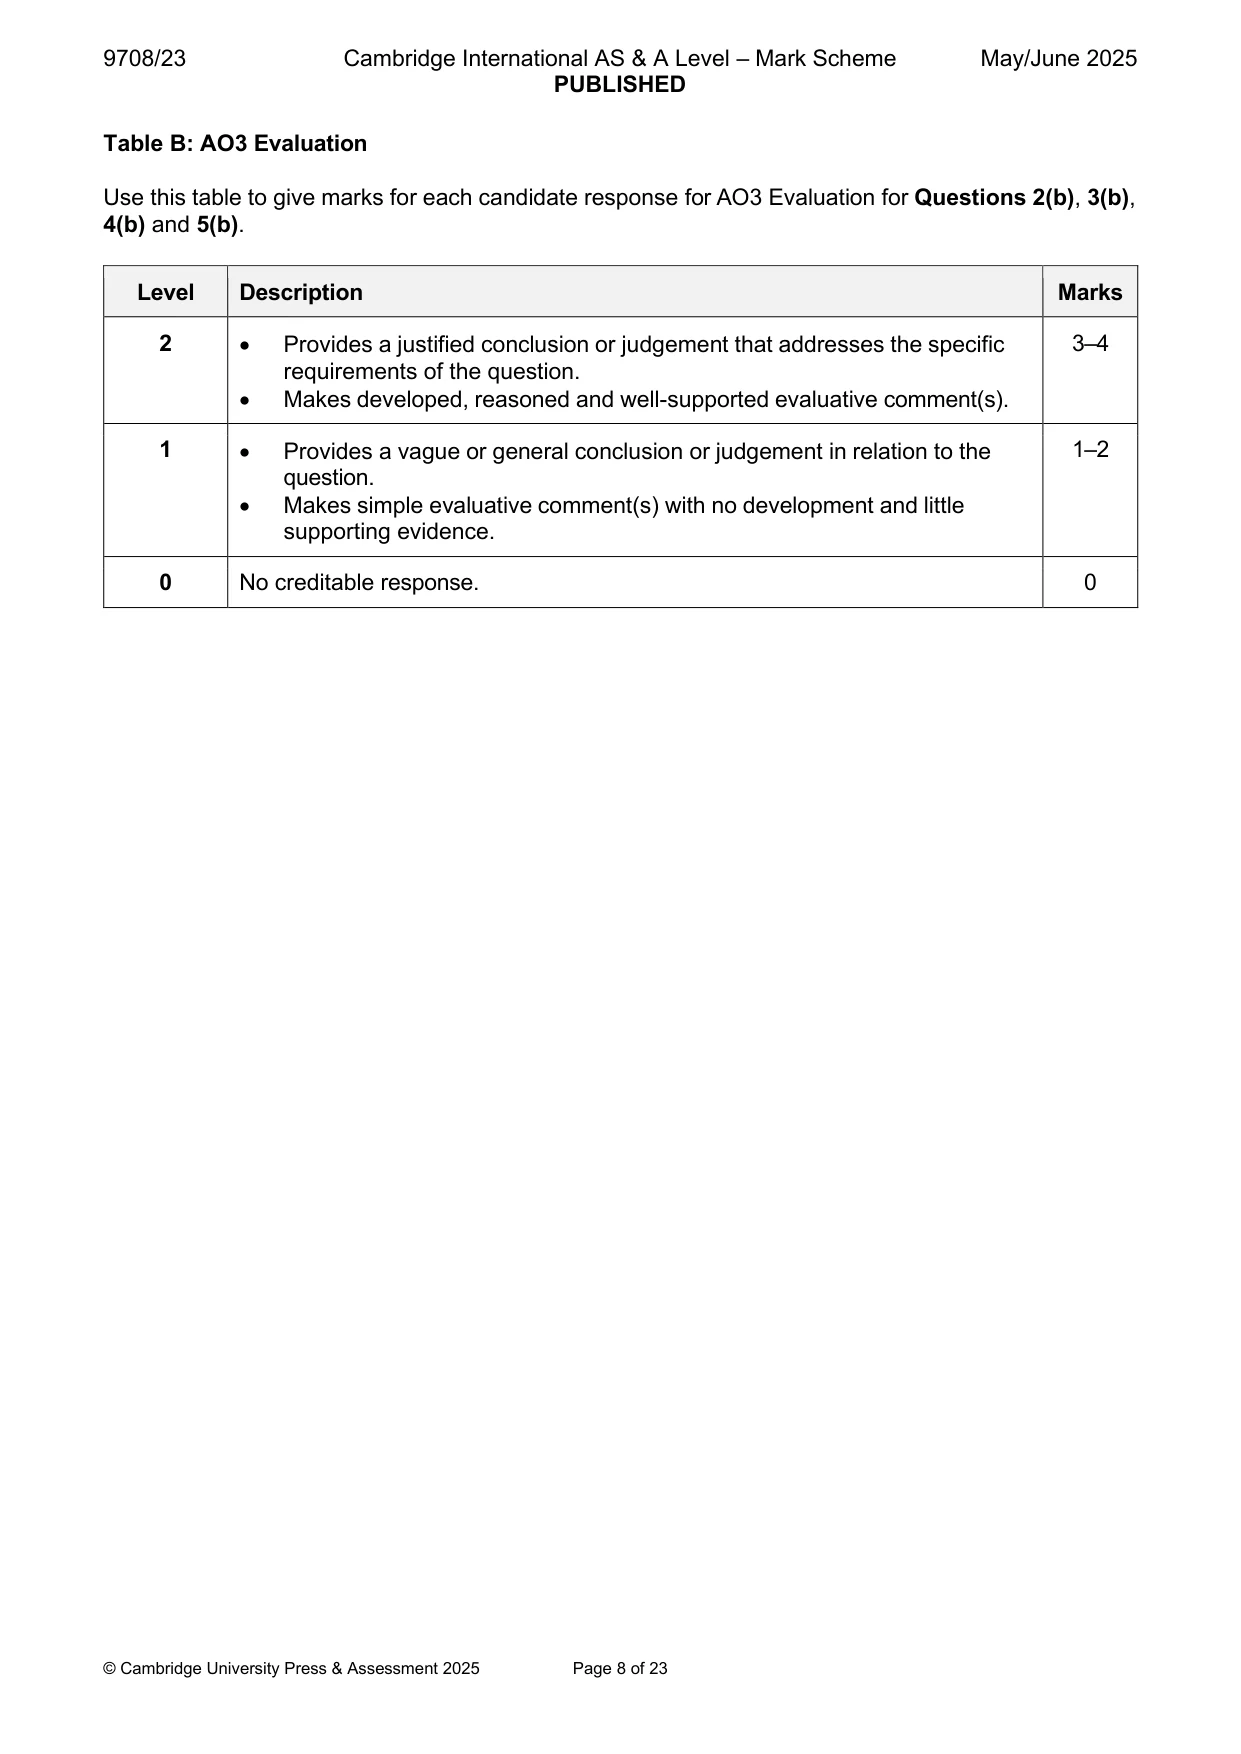
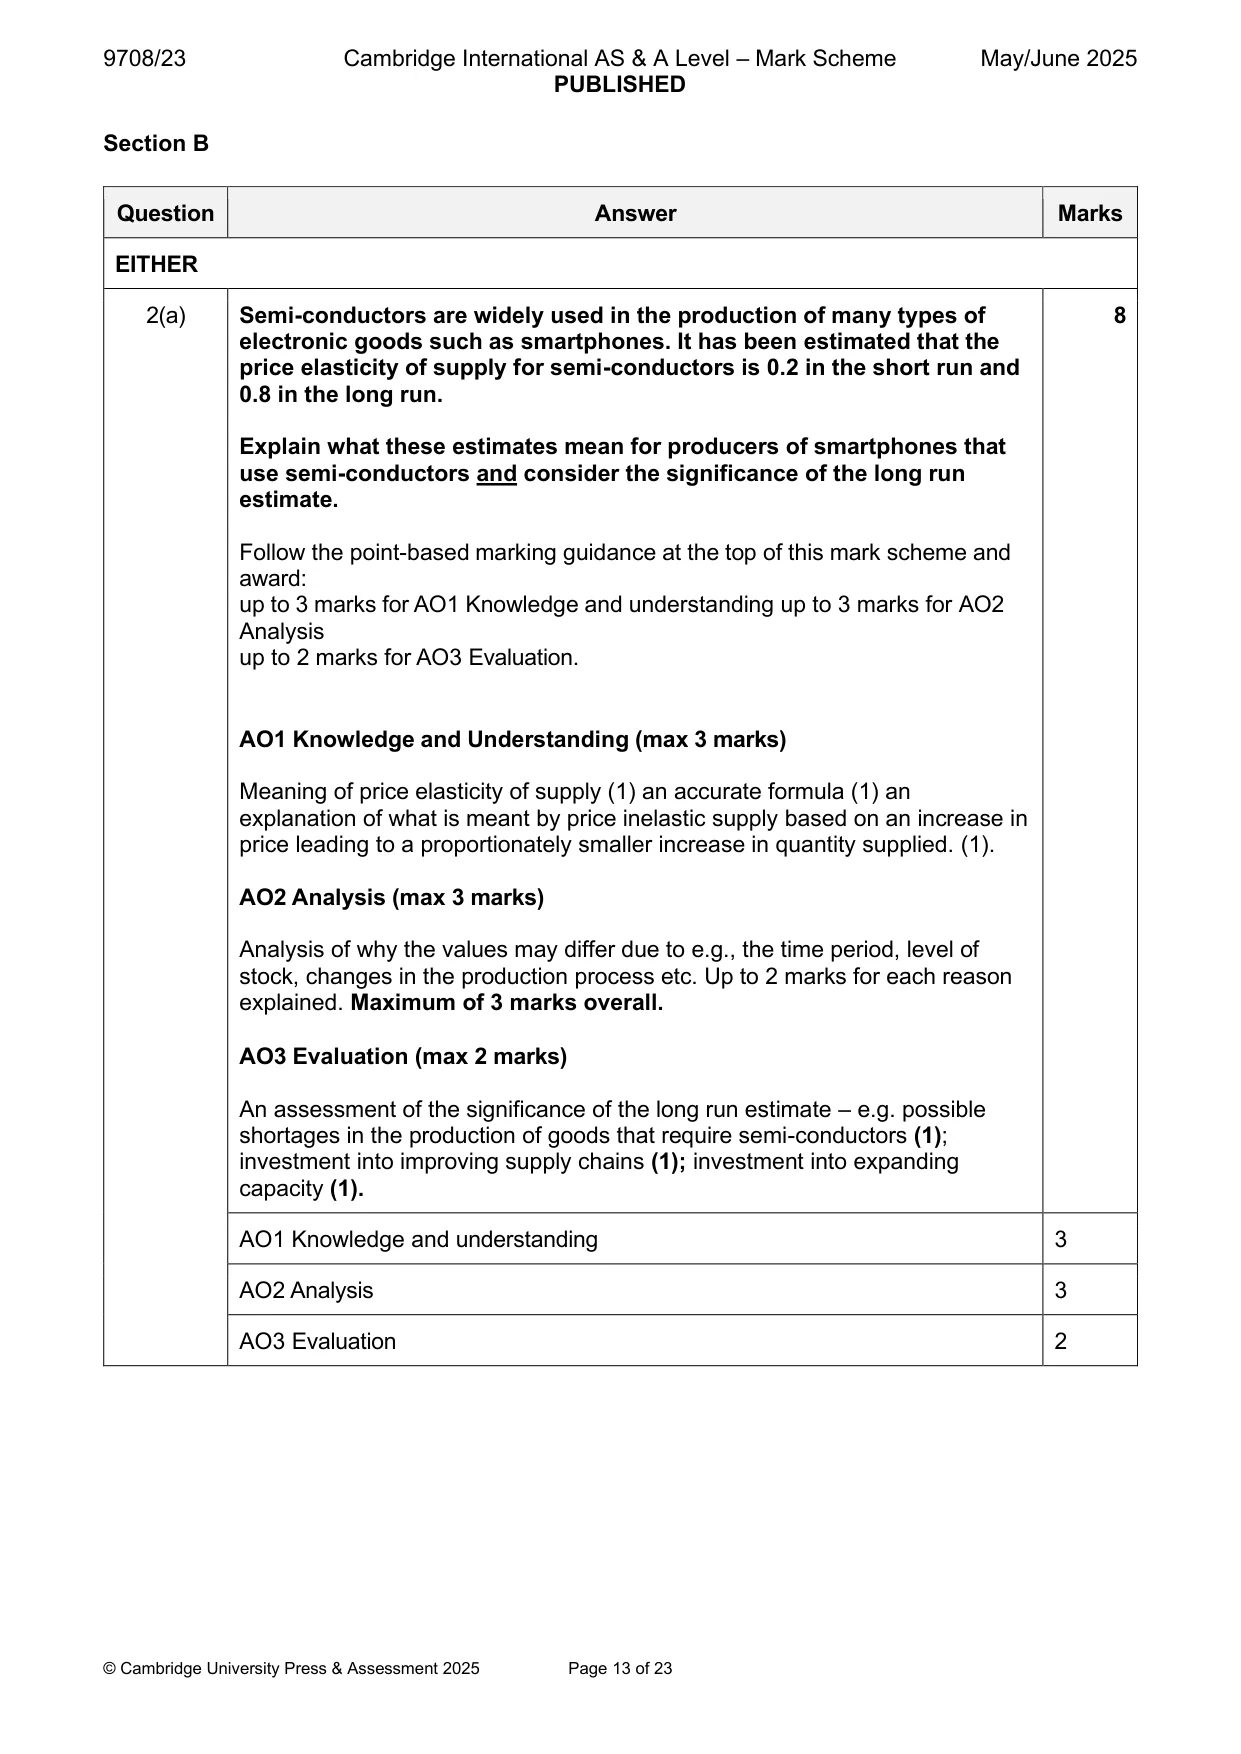
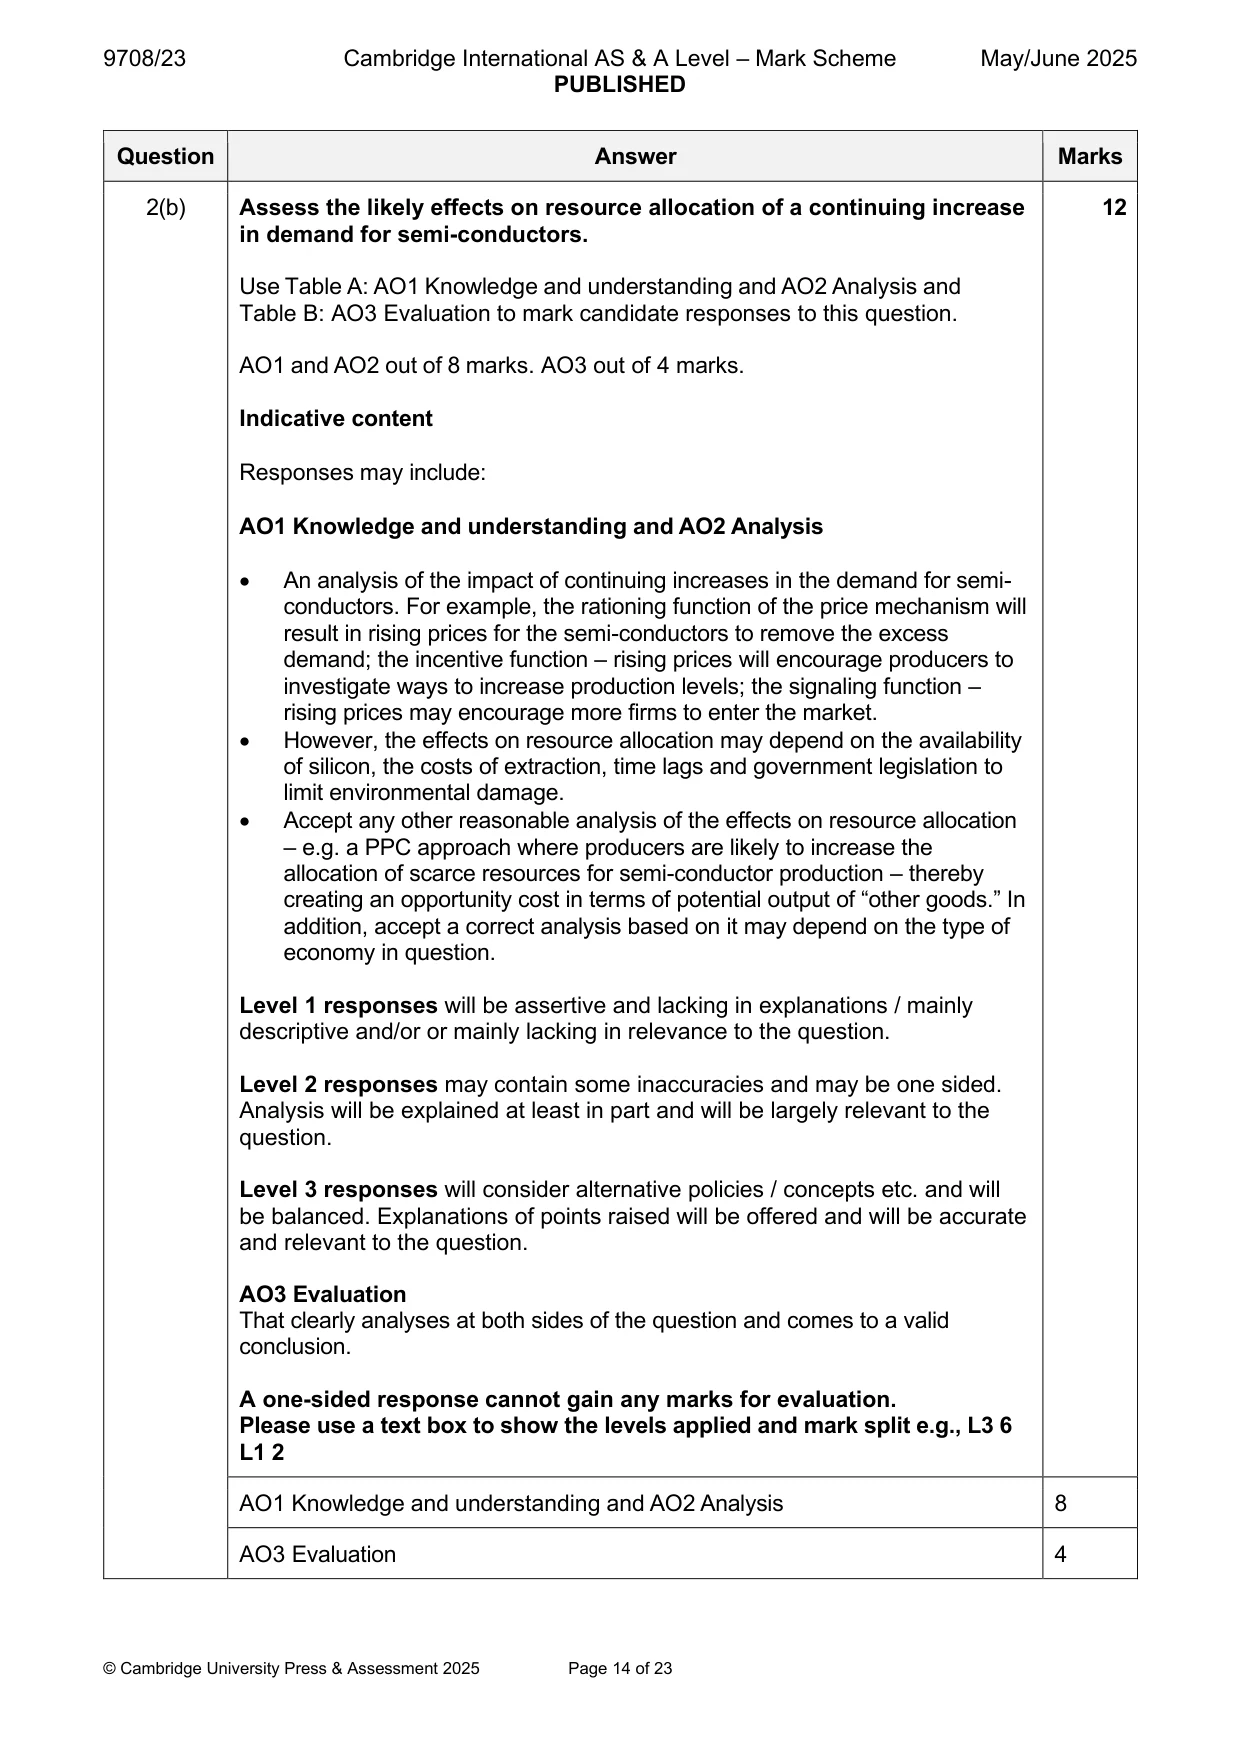
Mark scheme: 2(a) Semi-conductors are widely used in the production of many types of 8 electronic goods such as smartphones. It has been estimated that the price elasticity of supply for semi-conductors is 0.2 in the short run and 0.8 in the long run. Explain what these estimates mean for producers of smartphones that use semi-conductors and consider the significance of the long run estimate. Follow the point-based marking guidance at the top of this mark scheme and award: up to 3 marks for AO1 Knowledge and understanding up to 3 marks for AO2 Analysis up to 2 marks for AO3 Evaluation. AO1 Knowledge and Understanding (max 3 marks) Meaning of price elasticity of supply (1) an accurate formula (1) an explanation of what is meant by price inelastic supply based on an increase in price leading to a proportionately smaller increase in quantity supplied. (1). AO2 Analysis (max 3 marks) Analysis of why the values may differ due to e.g., the time period, level of stock, changes in the production process etc. Up to 2 marks for each reason explained. Maximum of 3 marks overall. AO3 Evaluation (max 2 marks) An assessment of the significance of the long run estimate – e.g. possible shortages in the production of goods that require semi-conductors (1); investment into improving supply chains (1); investment into expanding capacity (1). AO1 Knowledge and understanding 3 AO2 Analysis 3 AO3 Evaluation 2 2(b) Assess the likely effects on resource allocation of a continuing increase 12 in demand for semi-conductors. Use Table A: AO1 Knowledge and understanding and AO2 Analysis and Table B: AO3 Evaluation to mark candidate responses to this question. AO1 and AO2 out of 8 marks. AO3 out of 4 marks. Indicative content Responses may include: AO1 Knowledge and understanding and AO2 Analysis • An analysis of the impact of continuing increases in the demand for semi- conductors. For example, the rationing function of the price mechanism will result in rising prices for the semi-conductors to remove the excess demand; the incentive function – rising prices will encourage producers to investigate ways to increase production levels; the signaling function – rising prices may encourage more firms to enter the market. • However, the effects on resource allocation may depend on the availability of silicon, the costs of extraction, time lags and government legislation to limit environmental damage. • Accept any other reasonable analysis of the effects on resource allocation – e.g. a PPC approach where producers are likely to increase the allocation of scarce resources for semi-conductor production – thereby creating an opportunity cost in terms of potential output of “other goods.” In addition, accept a correct analysis based on it may depend on the type of economy in question. Level 1 responses will be assertive and lacking in explanations / mainly descriptive and/or or mainly lacking in relevance to the question. Level 2 responses may contain some inaccuracies and may be one sided. Analysis will be explained at least in part and will be largely relevant to the question. Level 3 responses will consider alternative policies / concepts etc. and will be balanced. Explanations of points raised will be offered and will be accurate and relevant to the question. AO3 Evaluation That clearly analyses at both sides of the question and comes to a valid conclusion. A one-sided response cannot gain any marks for evaluation. Please use a text box to show the levels applied and mark split e.g., L3 6 L1 2 AO1 Knowledge and understanding and AO2 Analysis 8 AO3 Evaluation 4
More questions on Resource allocation in different economic systems
Q3 · Explain what is meant by a merit good and why governments provide merit goods such as…
3 (a) Explain what is meant by a merit good and why governments provide merit goods such as healthcare free of charge and consider why such provision may not always be successful. [8] (b) Assess whether a charge made for healthcare at the point of use is likely to be more beneficial to consumers and providers than if healthcare is available to all free of charge. [12] Section C Answer one question. EITHER
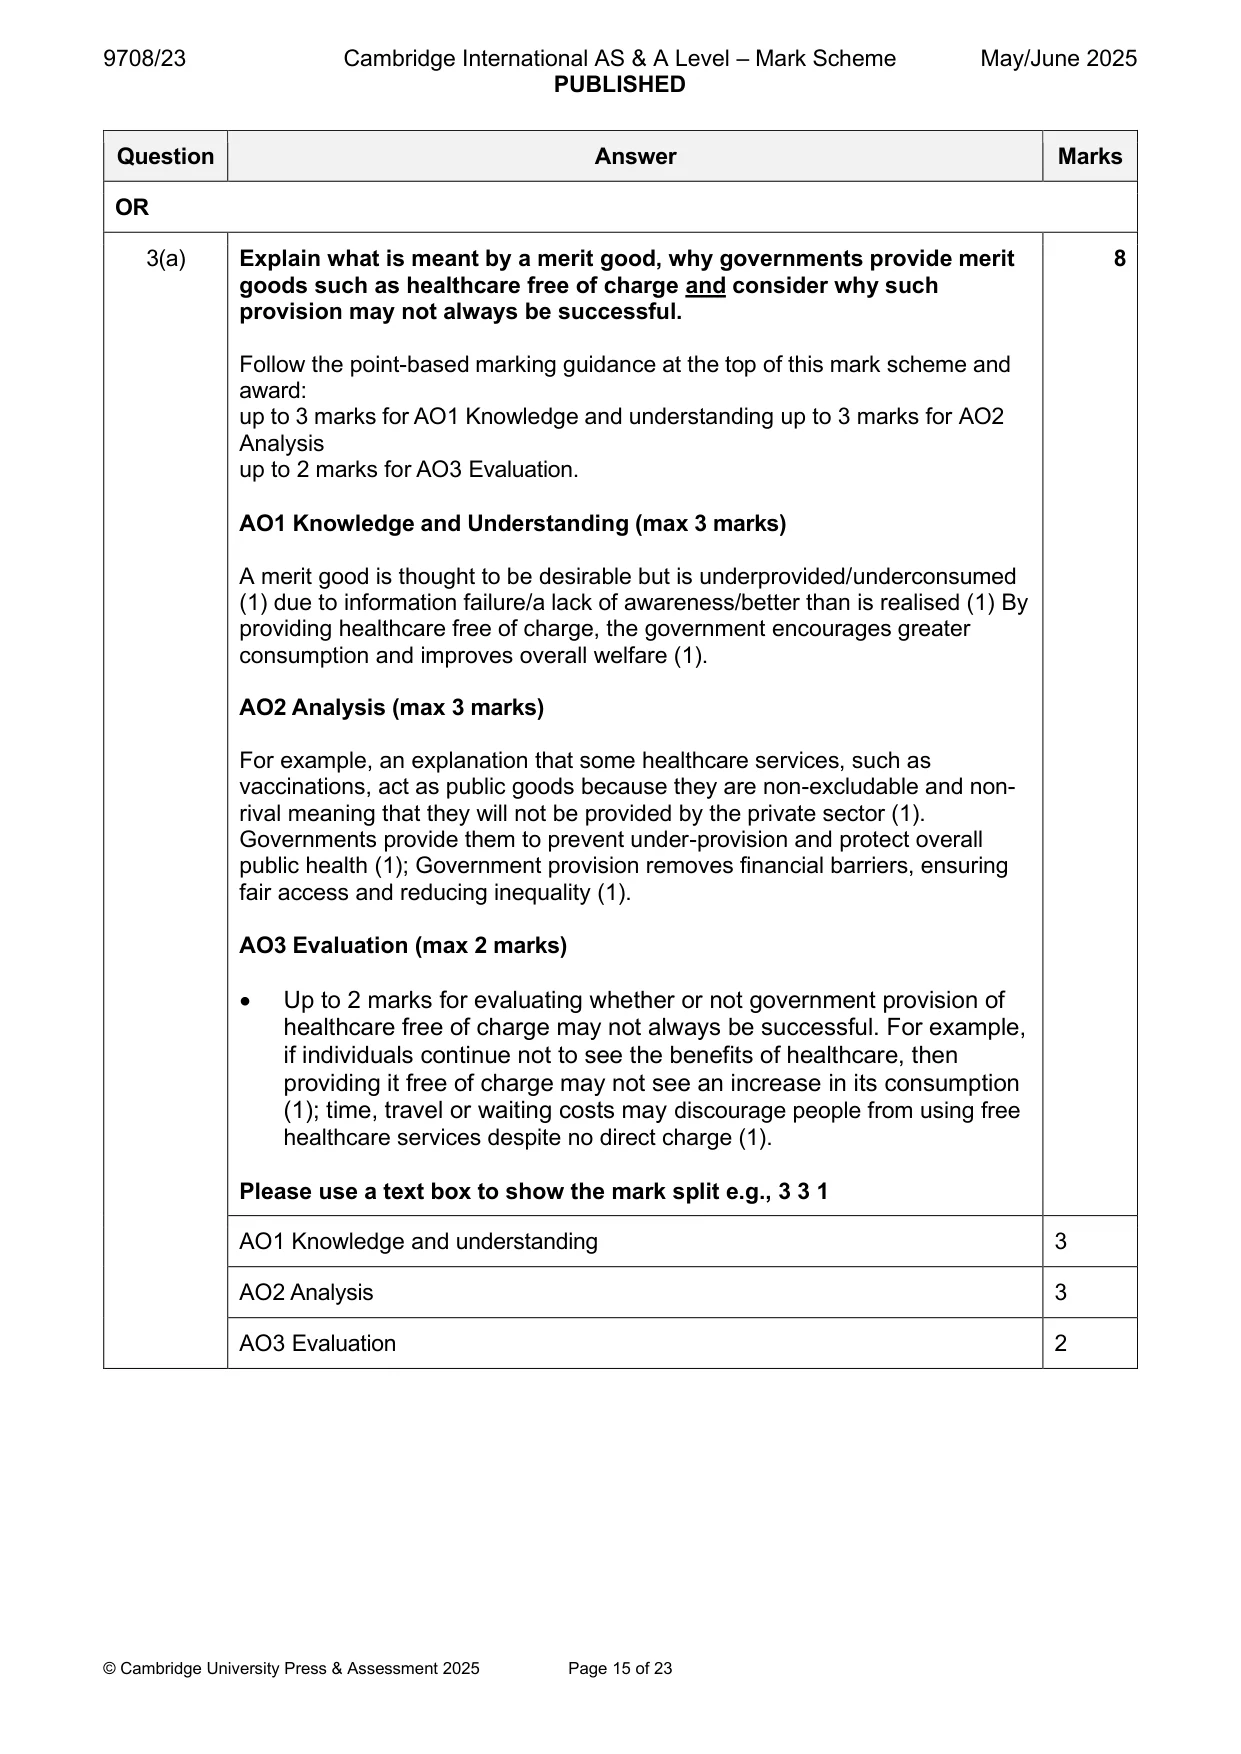
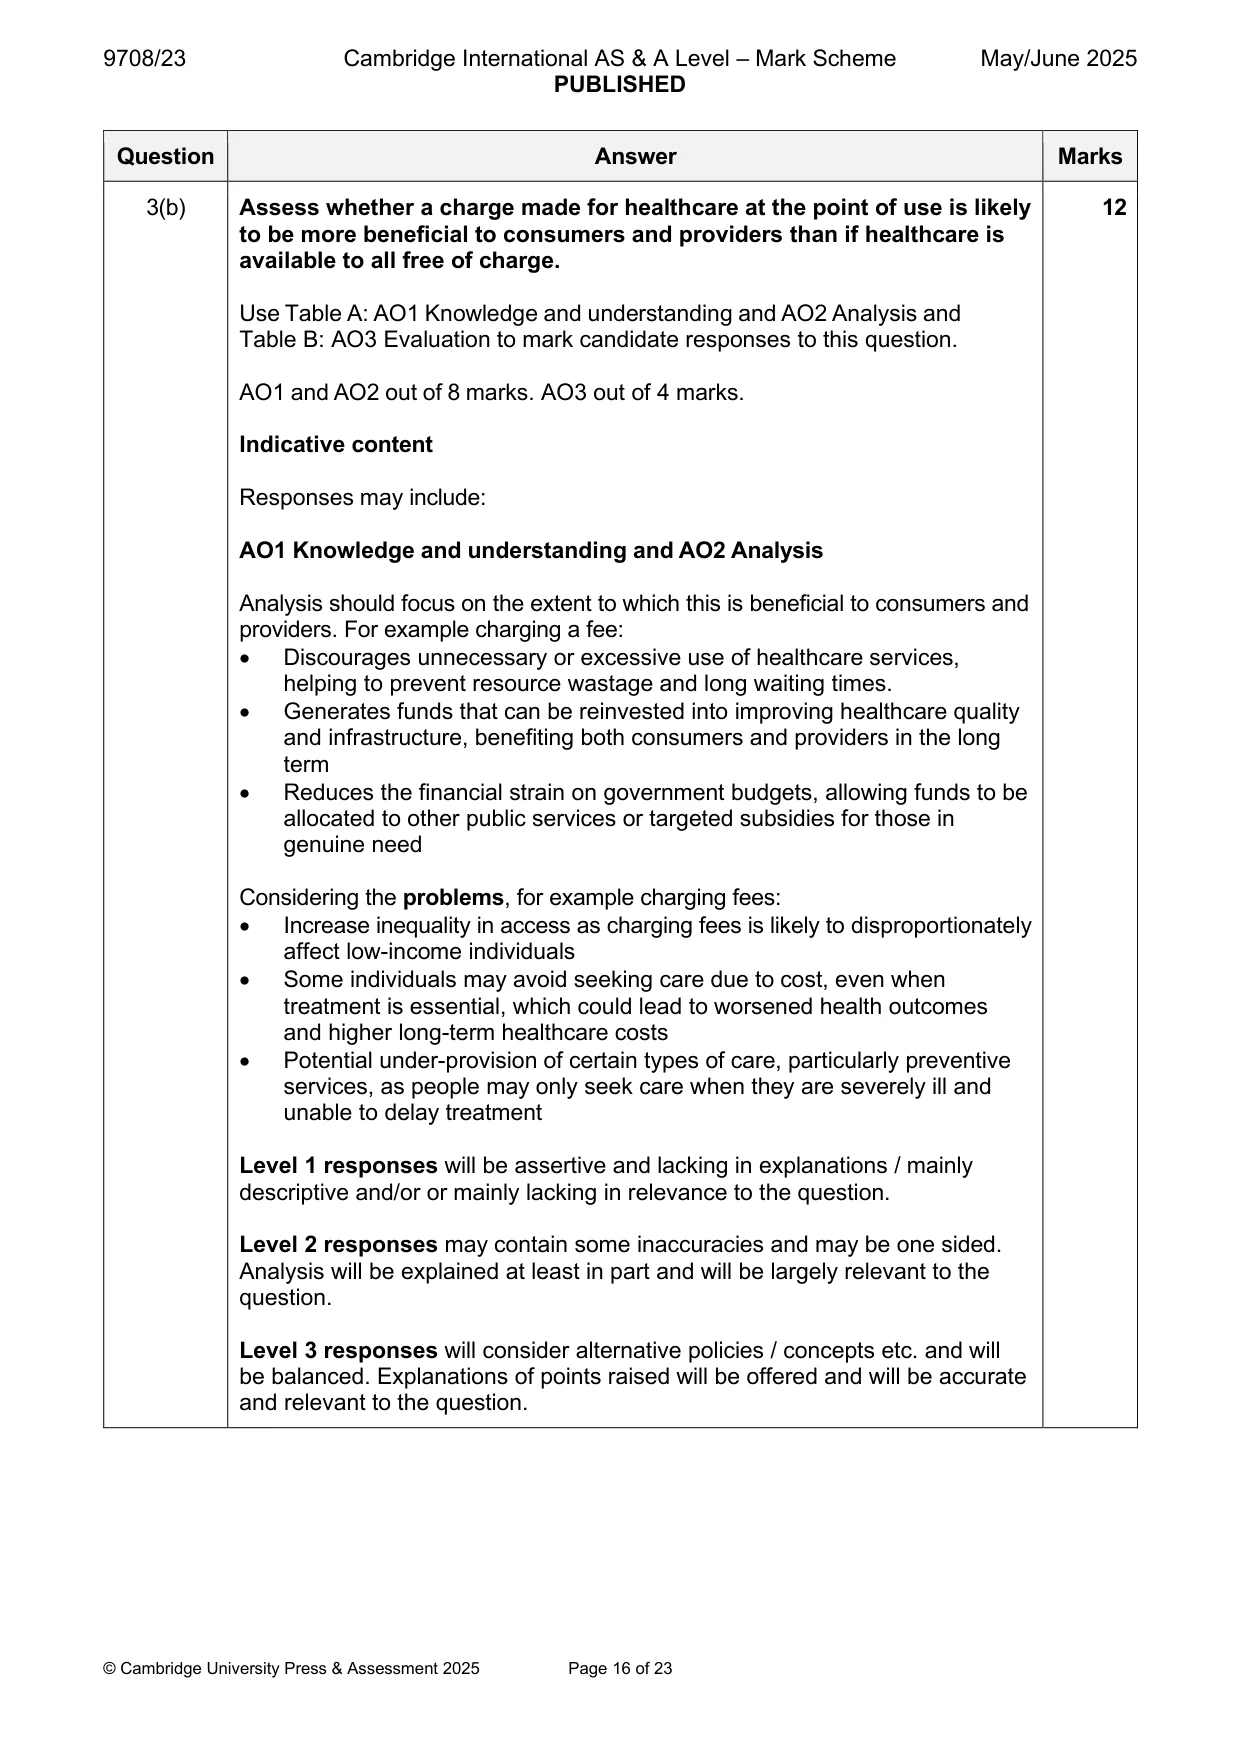
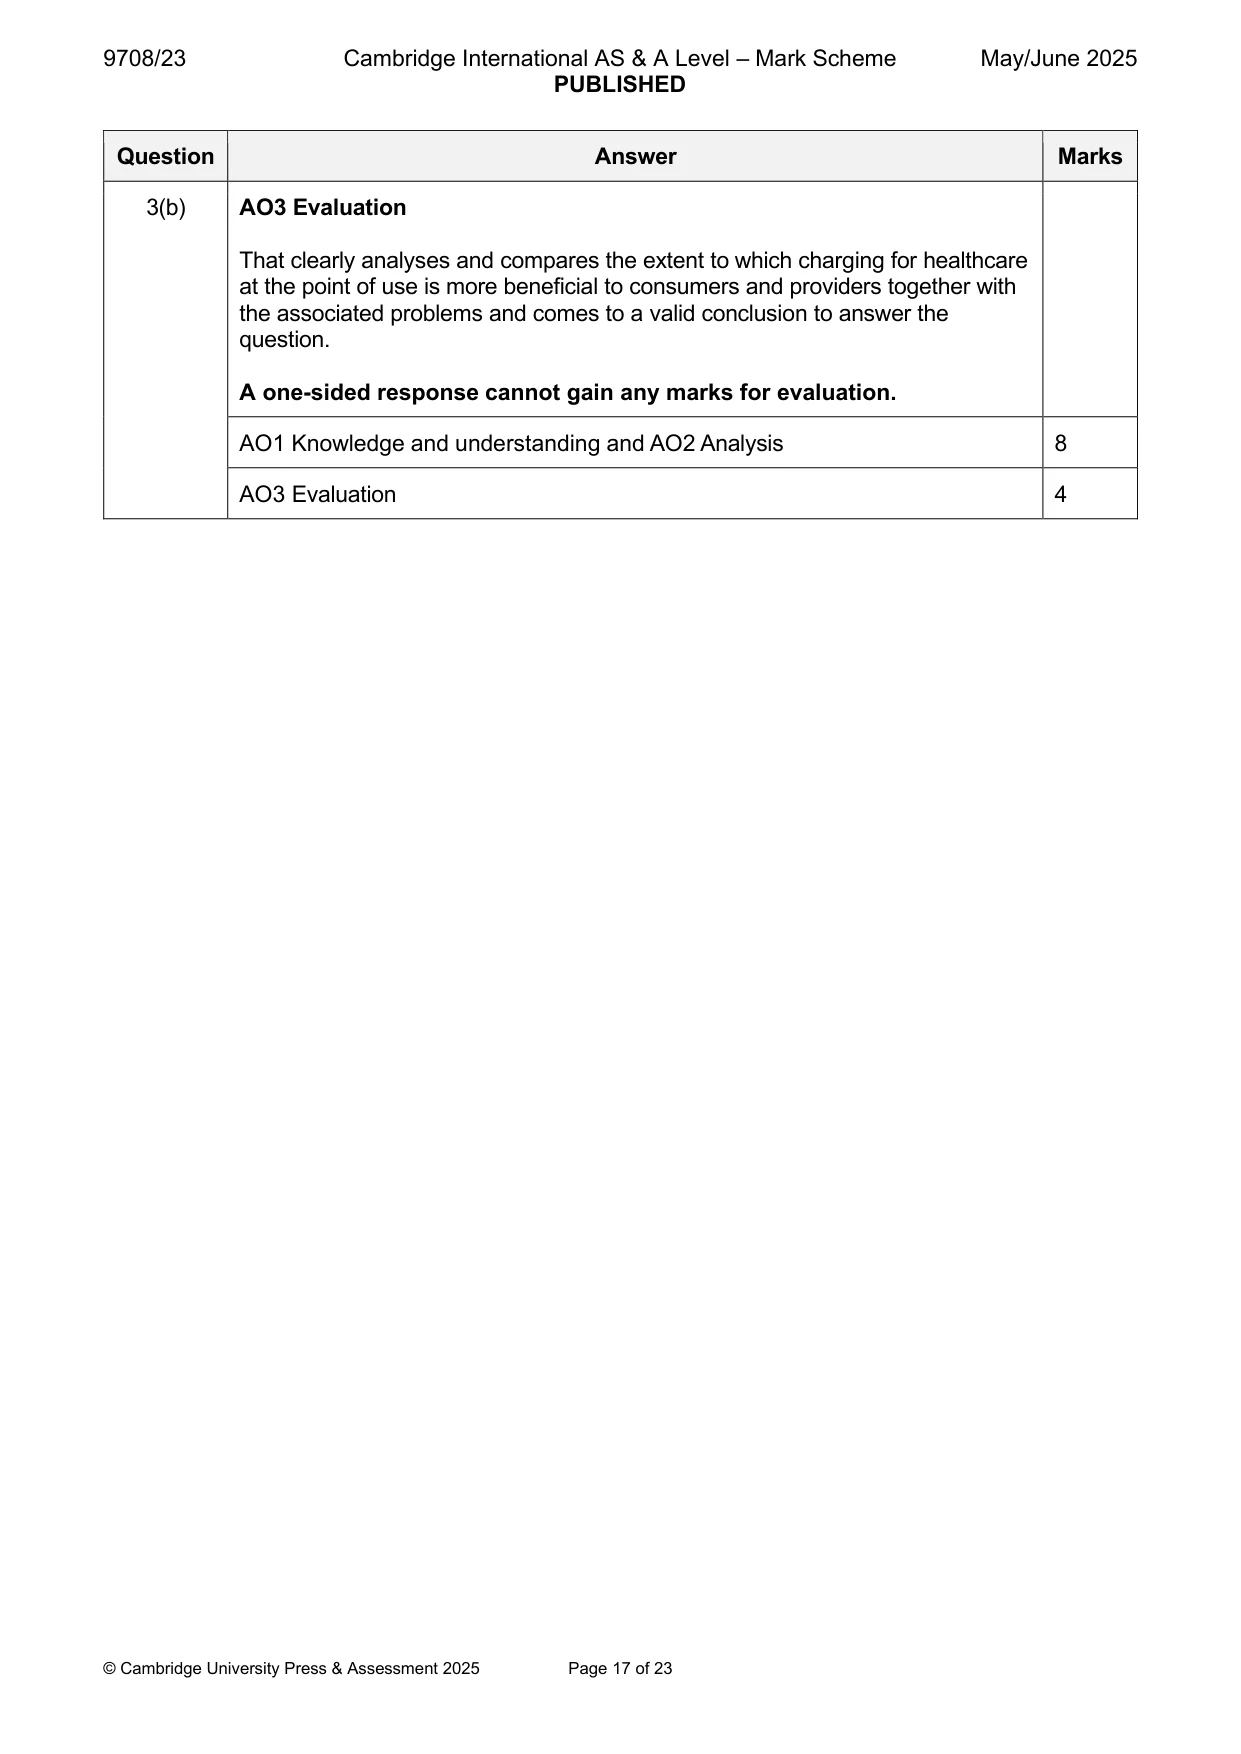
Mark scheme: 3(a) Explain what is meant by a merit good, why governments provide merit 8 goods such as healthcare free of charge and consider why such provision may not always be successful. Follow the point-based marking guidance at the top of this mark scheme and award: up to 3 marks for AO1 Knowledge and understanding up to 3 marks for AO2 Analysis up to 2 marks for AO3 Evaluation. AO1 Knowledge and Understanding (max 3 marks) A merit good is thought to be desirable but is underprovided/underconsumed (1) due to information failure/a lack of awareness/better than is realised (1) By providing healthcare free of charge, the government encourages greater consumption and improves overall welfare (1). AO2 Analysis (max 3 marks) For example, an explanation that some healthcare services, such as vaccinations, act as public goods because they are non-excludable and non- rival meaning that they will not be provided by the private sector (1). Governments provide them to prevent under-provision and protect overall public health (1); Government provision removes financial barriers, ensuring fair access and reducing inequality (1). AO3 Evaluation (max 2 marks) • Up to 2 marks for evaluating whether or not government provision of healthcare free of charge may not always be successful. For example, if individuals continue not to see the benefits of healthcare, then providing it free of charge may not see an increase in its consumption (1); time, travel or waiting costs may discourage people from using free healthcare services despite no direct charge (1). Please use a text box to show the mark split e.g., 3 3 1 AO1 Knowledge and understanding 3 AO2 Analysis 3 AO3 Evaluation 2 3(b) Assess whether a charge made for healthcare at the point of use is likely 12 to be more beneficial to consumers and providers than if healthcare is available to all free of charge. Use Table A: AO1 Knowledge and understanding and AO2 Analysis and Table B: AO3 Evaluation to mark candidate responses to this question. AO1 and AO2 out of 8 marks. AO3 out of 4 marks. Indicative content Responses may include: AO1 Knowledge and understanding and AO2 Analysis Analysis should focus on the extent to which this is beneficial to consumers and providers. For example charging a fee: • Discourages unnecessary or excessive use of healthcare services, helping to prevent resource wastage and long waiting times. • Generates funds that can be reinvested into improving healthcare quality and infrastructure, benefiting both consumers and providers in the long term • Reduces the financial strain on government budgets, allowing funds to be allocated to other public services or targeted subsidies for those in genuine need Considering the problems, for example charging fees: • Increase inequality in access as charging fees is likely to disproportionately affect low-income individuals • Some individuals may avoid seeking care due to cost, even when treatment is essential, which could lead to worsened health outcomes and higher long-term healthcare costs • Potential under-provision of certain types of care, particularly preventive services, as people may only seek care when they are severely ill and unable to delay treatment Level 1 responses will be assertive and lacking in explanations / mainly descriptive and/or or mainly lacking in relevance to the question. Level 2 responses may contain some inaccuracies and may be one sided. Analysis will be explained at least in part and will be largely relevant to the question. Level 3 responses will consider alternative policies / concepts etc. and will be balanced. Explanations of points raised will be offered and will be accurate and relevant to the question. 3(b) AO3 Evaluation That clearly analyses and compares the extent to which charging for healthcare at the point of use is more beneficial to consumers and providers together with the associated problems and comes to a valid conclusion to answer the question. A one-sided response cannot gain any marks for evaluation. AO1 Knowledge and understanding and AO2 Analysis 8 AO3 Evaluation 4 Section C
More questions on Methods and effects of government intervention in markets
Q4 · Explain two causes of economic growth and consider the extent to which their impact can…
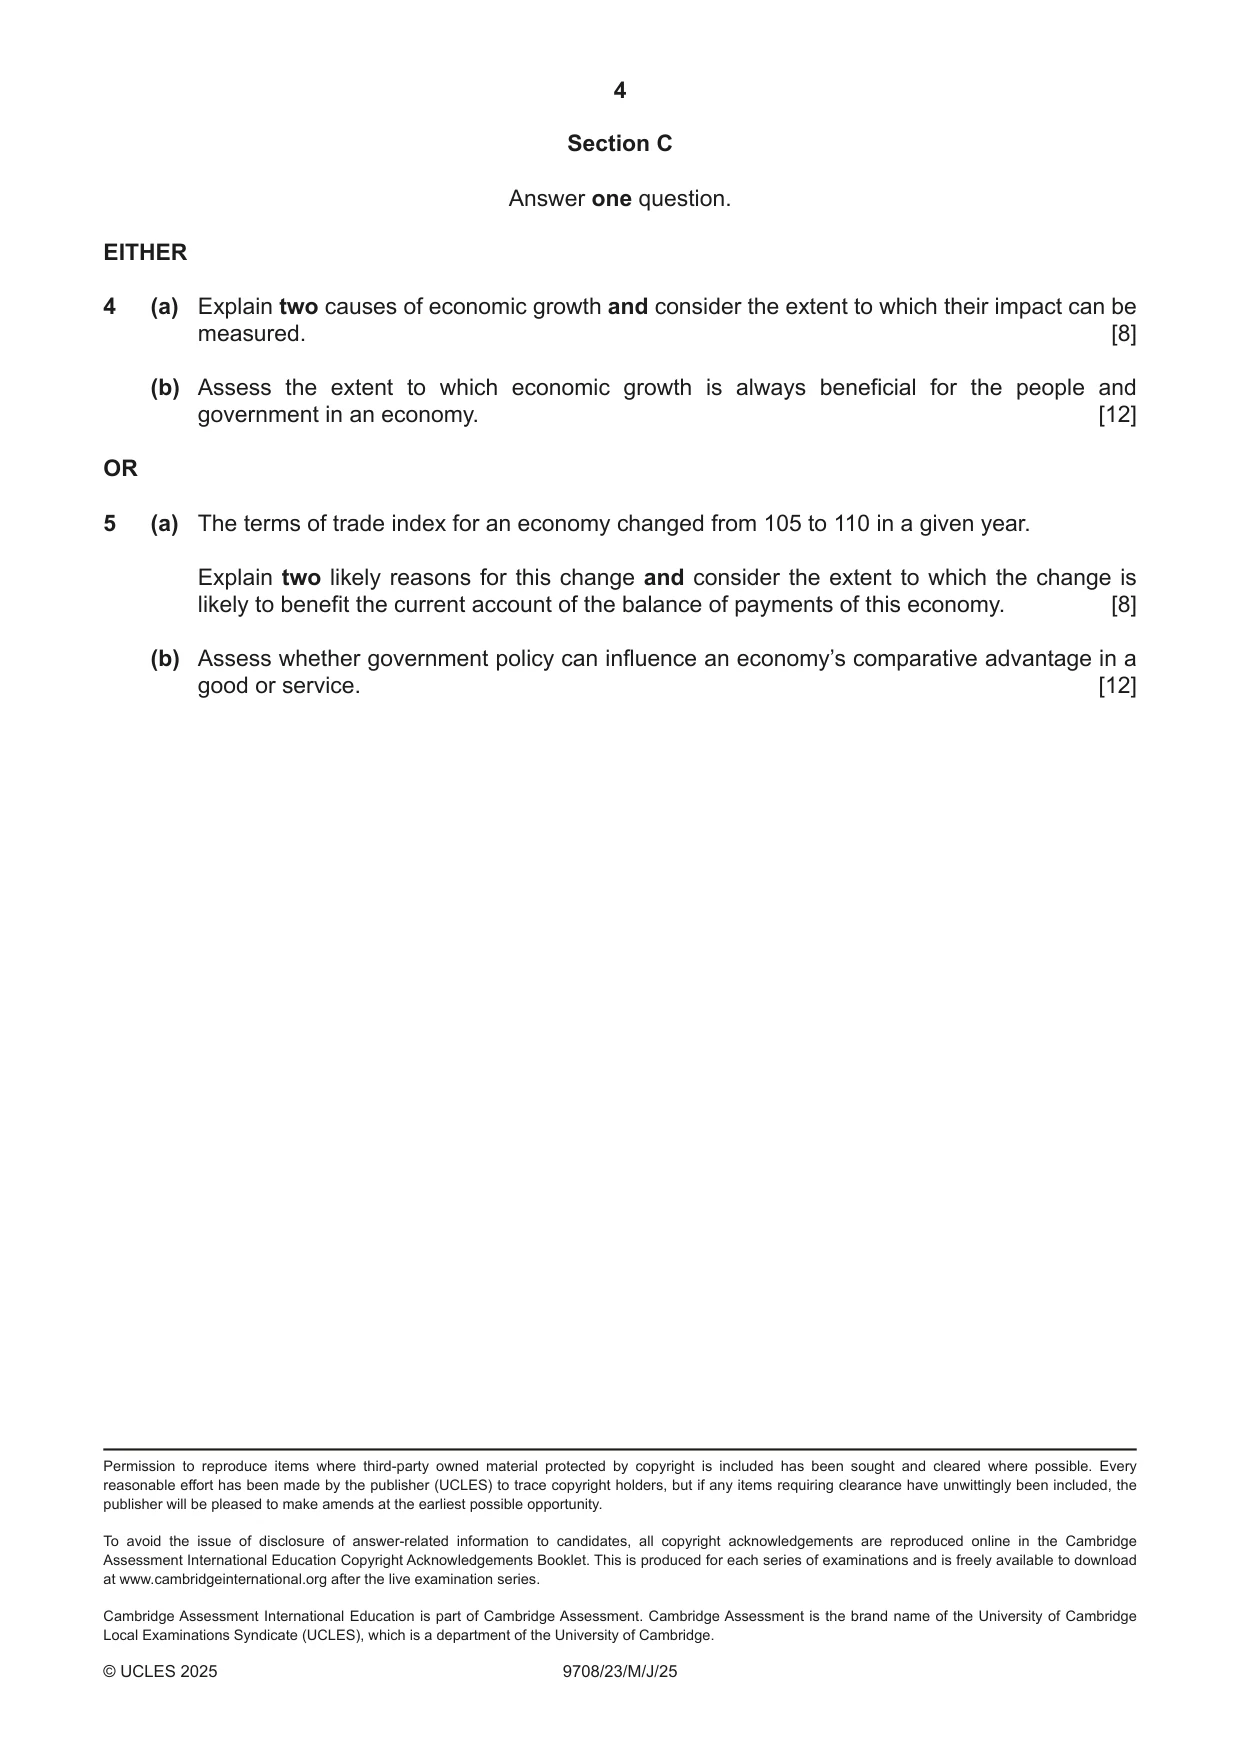
4 (a) Explain two causes of economic growth and consider the extent to which their impact can be measured. [8] (b) Assess the extent to which economic growth is always beneficial for the people and government in an economy. [12] OR
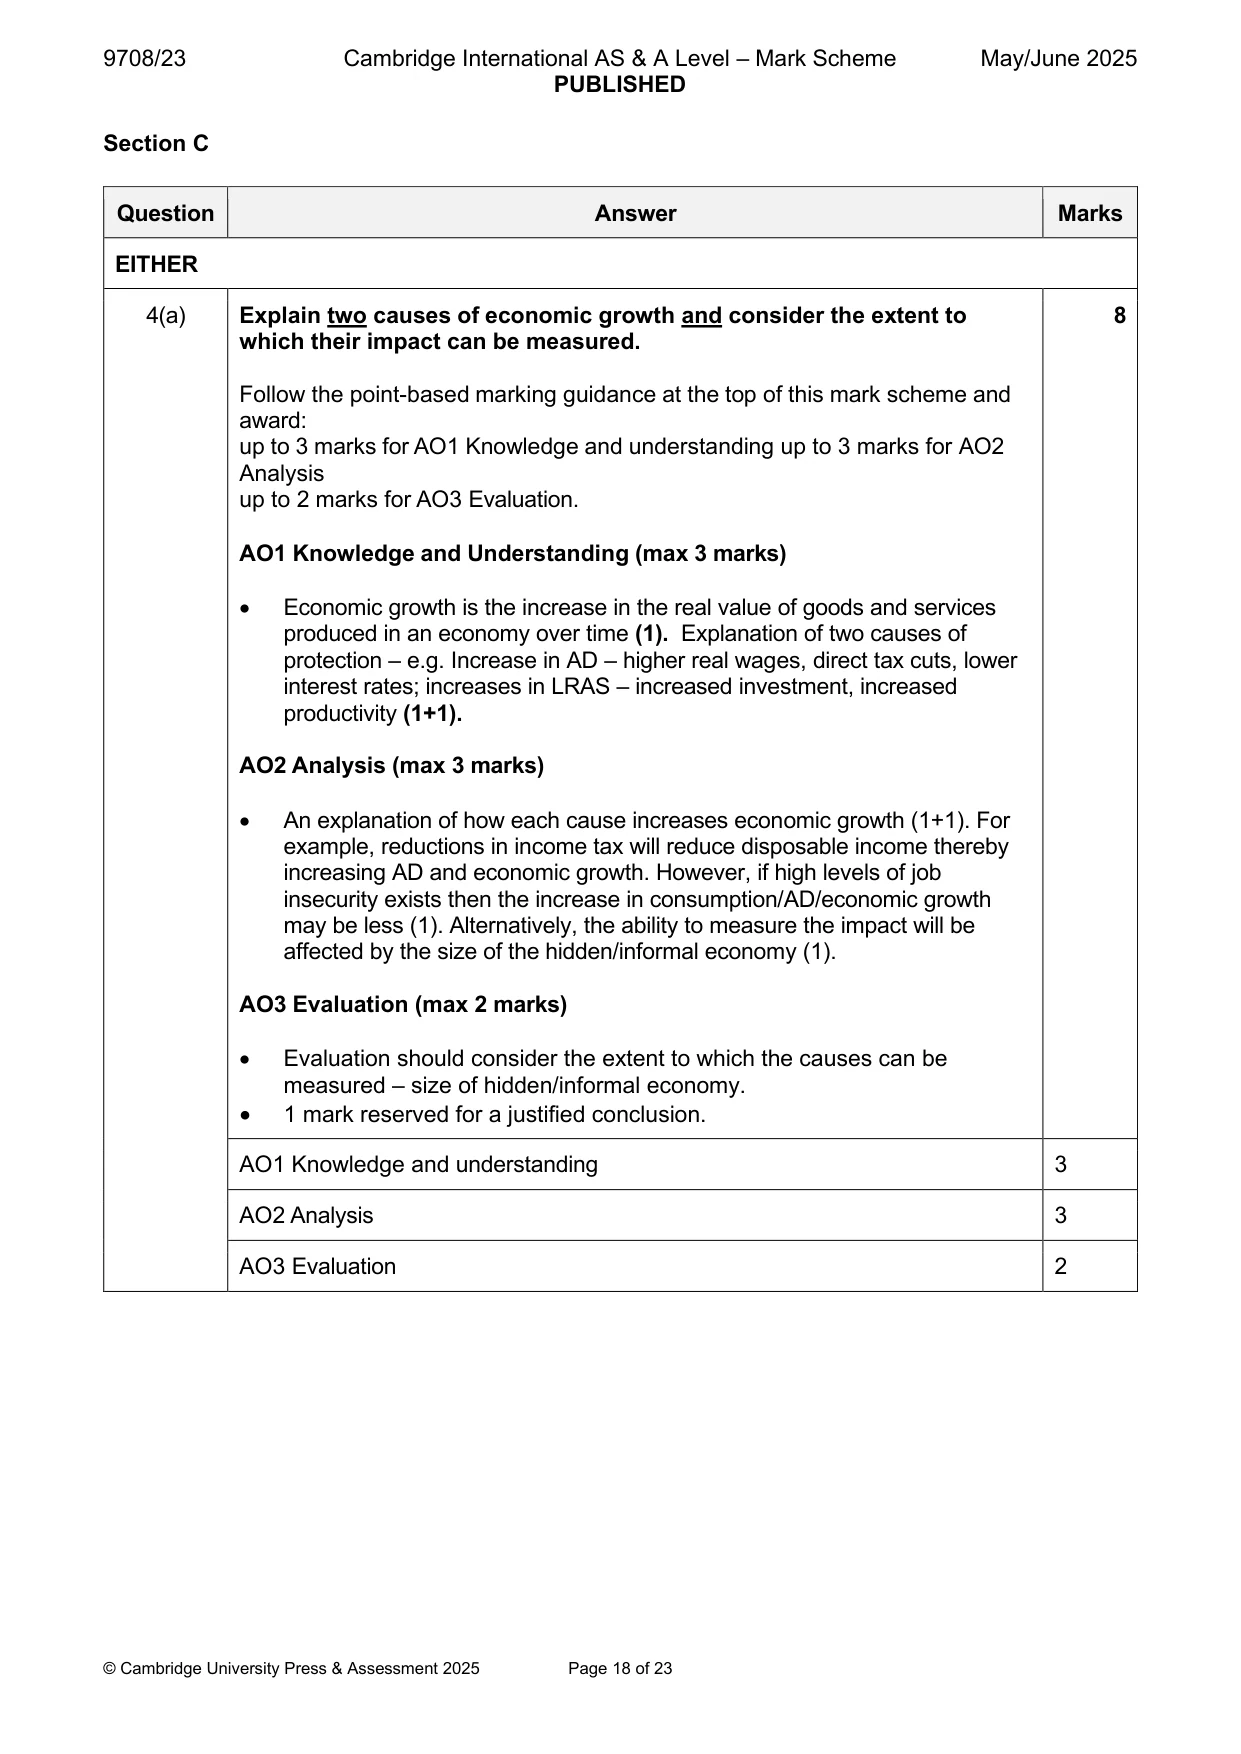
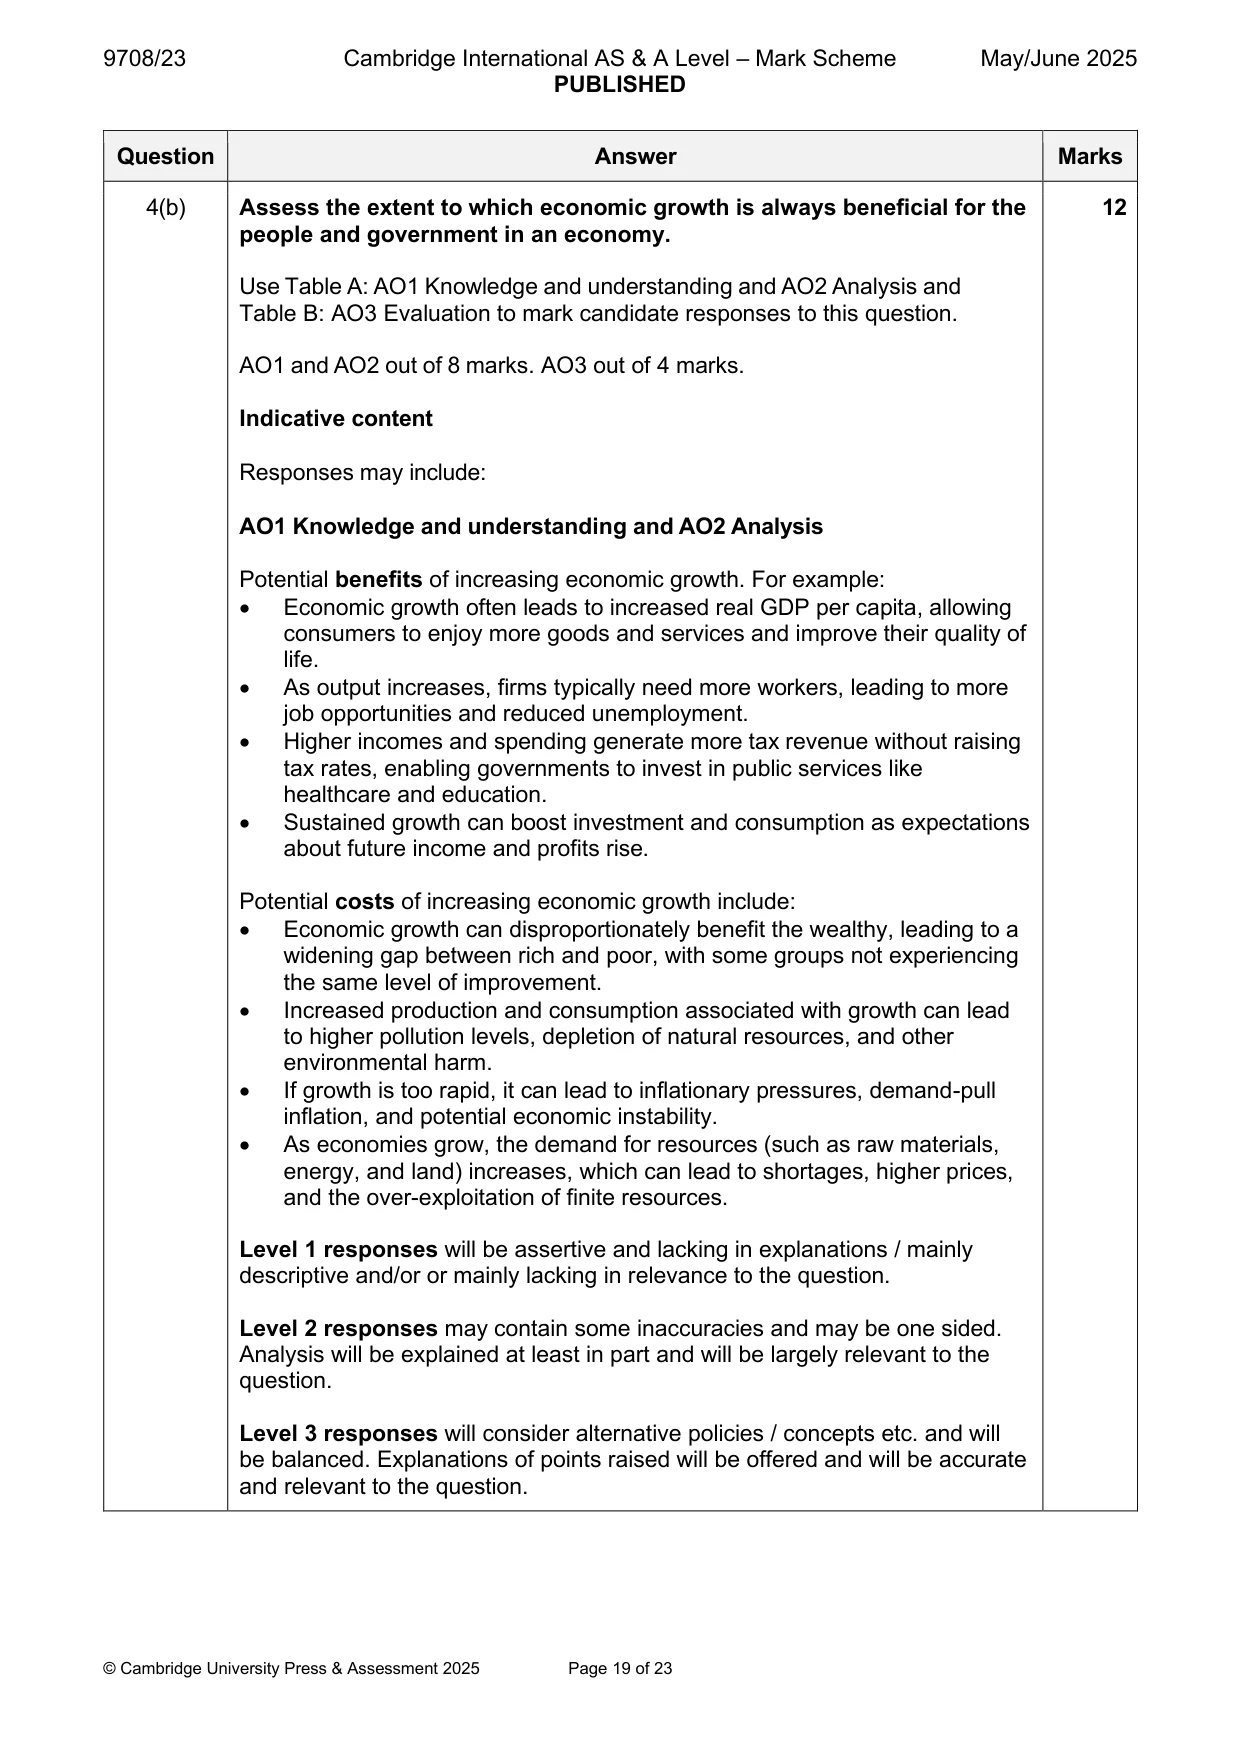
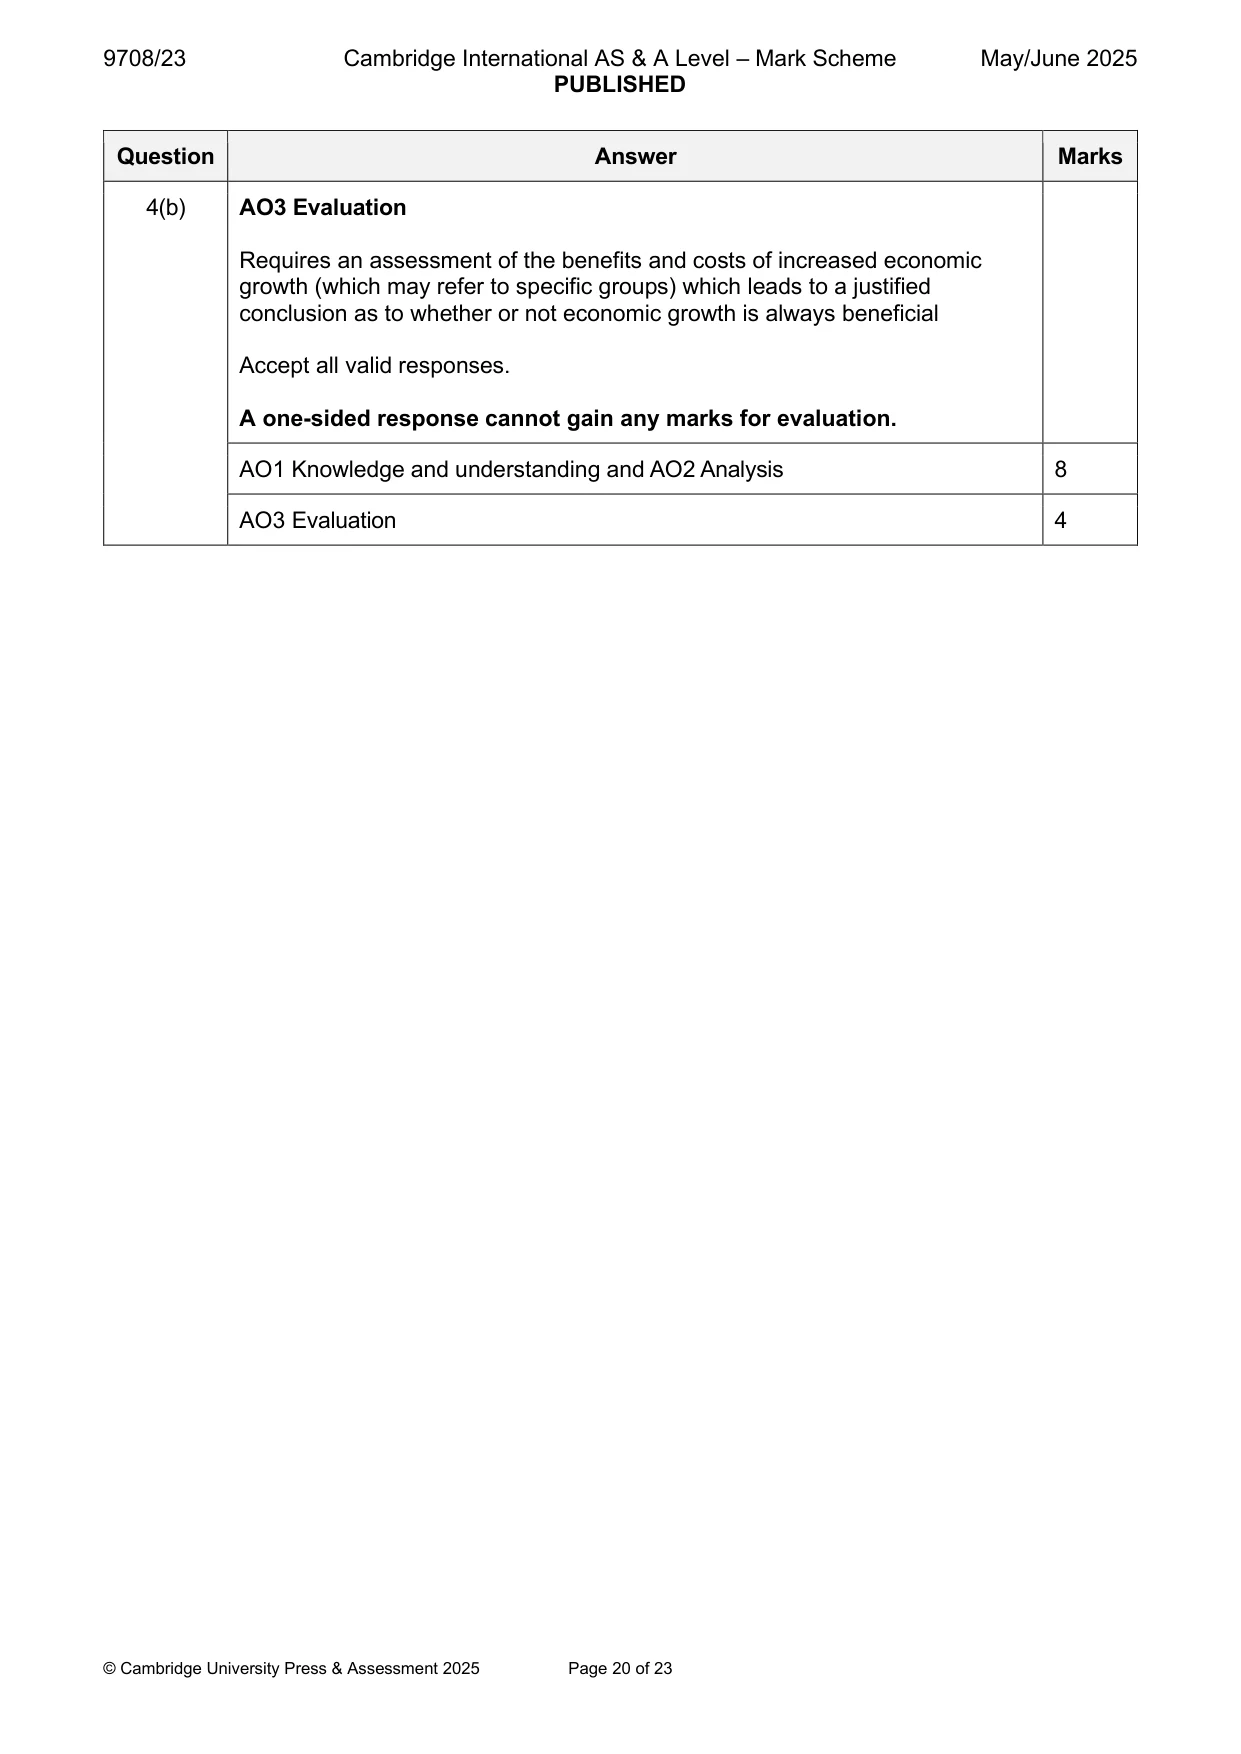
Mark scheme: 4(a) Explain two causes of economic growth and consider the extent to 8 which their impact can be measured. Follow the point-based marking guidance at the top of this mark scheme and award: up to 3 marks for AO1 Knowledge and understanding up to 3 marks for AO2 Analysis up to 2 marks for AO3 Evaluation. AO1 Knowledge and Understanding (max 3 marks) • Economic growth is the increase in the real value of goods and services produced in an economy over time (1). Explanation of two causes of protection – e.g. Increase in AD – higher real wages, direct tax cuts, lower interest rates; increases in LRAS – increased investment, increased productivity (1+1). AO2 Analysis (max 3 marks) • An explanation of how each cause increases economic growth (1+1). For example, reductions in income tax will reduce disposable income thereby increasing AD and economic growth. However, if high levels of job insecurity exists then the increase in consumption/AD/economic growth may be less (1). Alternatively, the ability to measure the impact will be affected by the size of the hidden/informal economy (1). AO3 Evaluation (max 2 marks) • Evaluation should consider the extent to which the causes can be measured – size of hidden/informal economy. • 1 mark reserved for a justified conclusion. AO1 Knowledge and understanding 3 AO2 Analysis 3 AO3 Evaluation 2 4(b) Assess the extent to which economic growth is always beneficial for the 12 people and government in an economy. Use Table A: AO1 Knowledge and understanding and AO2 Analysis and Table B: AO3 Evaluation to mark candidate responses to this question. AO1 and AO2 out of 8 marks. AO3 out of 4 marks. Indicative content Responses may include: AO1 Knowledge and understanding and AO2 Analysis Potential benefits of increasing economic growth. For example: • Economic growth often leads to increased real GDP per capita, allowing consumers to enjoy more goods and services and improve their quality of life. • As output increases, firms typically need more workers, leading to more job opportunities and reduced unemployment. • Higher incomes and spending generate more tax revenue without raising tax rates, enabling governments to invest in public services like healthcare and education. • Sustained growth can boost investment and consumption as expectations about future income and profits rise. Potential costs of increasing economic growth include: • Economic growth can disproportionately benefit the wealthy, leading to a widening gap between rich and poor, with some groups not experiencing the same level of improvement. • Increased production and consumption associated with growth can lead to higher pollution levels, depletion of natural resources, and other environmental harm. • If growth is too rapid, it can lead to inflationary pressures, demand-pull inflation, and potential economic instability. • As economies grow, the demand for resources (such as raw materials, energy, and land) increases, which can lead to shortages, higher prices, and the over-exploitation of finite resources. Level 1 responses will be assertive and lacking in explanations / mainly descriptive and/or or mainly lacking in relevance to the question. Level 2 responses may contain some inaccuracies and may be one sided. Analysis will be explained at least in part and will be largely relevant to the question. Level 3 responses will consider alternative policies / concepts etc. and will be balanced. Explanations of points raised will be offered and will be accurate and relevant to the question. 4(b) AO3 Evaluation Requires an assessment of the benefits and costs of increased economic growth (which may refer to specific groups) which leads to a justified conclusion as to whether or not economic growth is always beneficial Accept all valid responses. A one-sided response cannot gain any marks for evaluation. AO1 Knowledge and understanding and AO2 Analysis 8 AO3 Evaluation 4
Q5 · The terms of trade index for an economy changed from 105 to 110 in a given year
5 (a) The terms of trade index for an economy changed from 105 to 110 in a given year. Explain two likely reasons for this change and consider the extent to which the change is likely to benefit the current account of the balance of payments of this economy. [8] (b) Assess whether government policy can influence an economy’s comparative advantage in a good or service. [12]
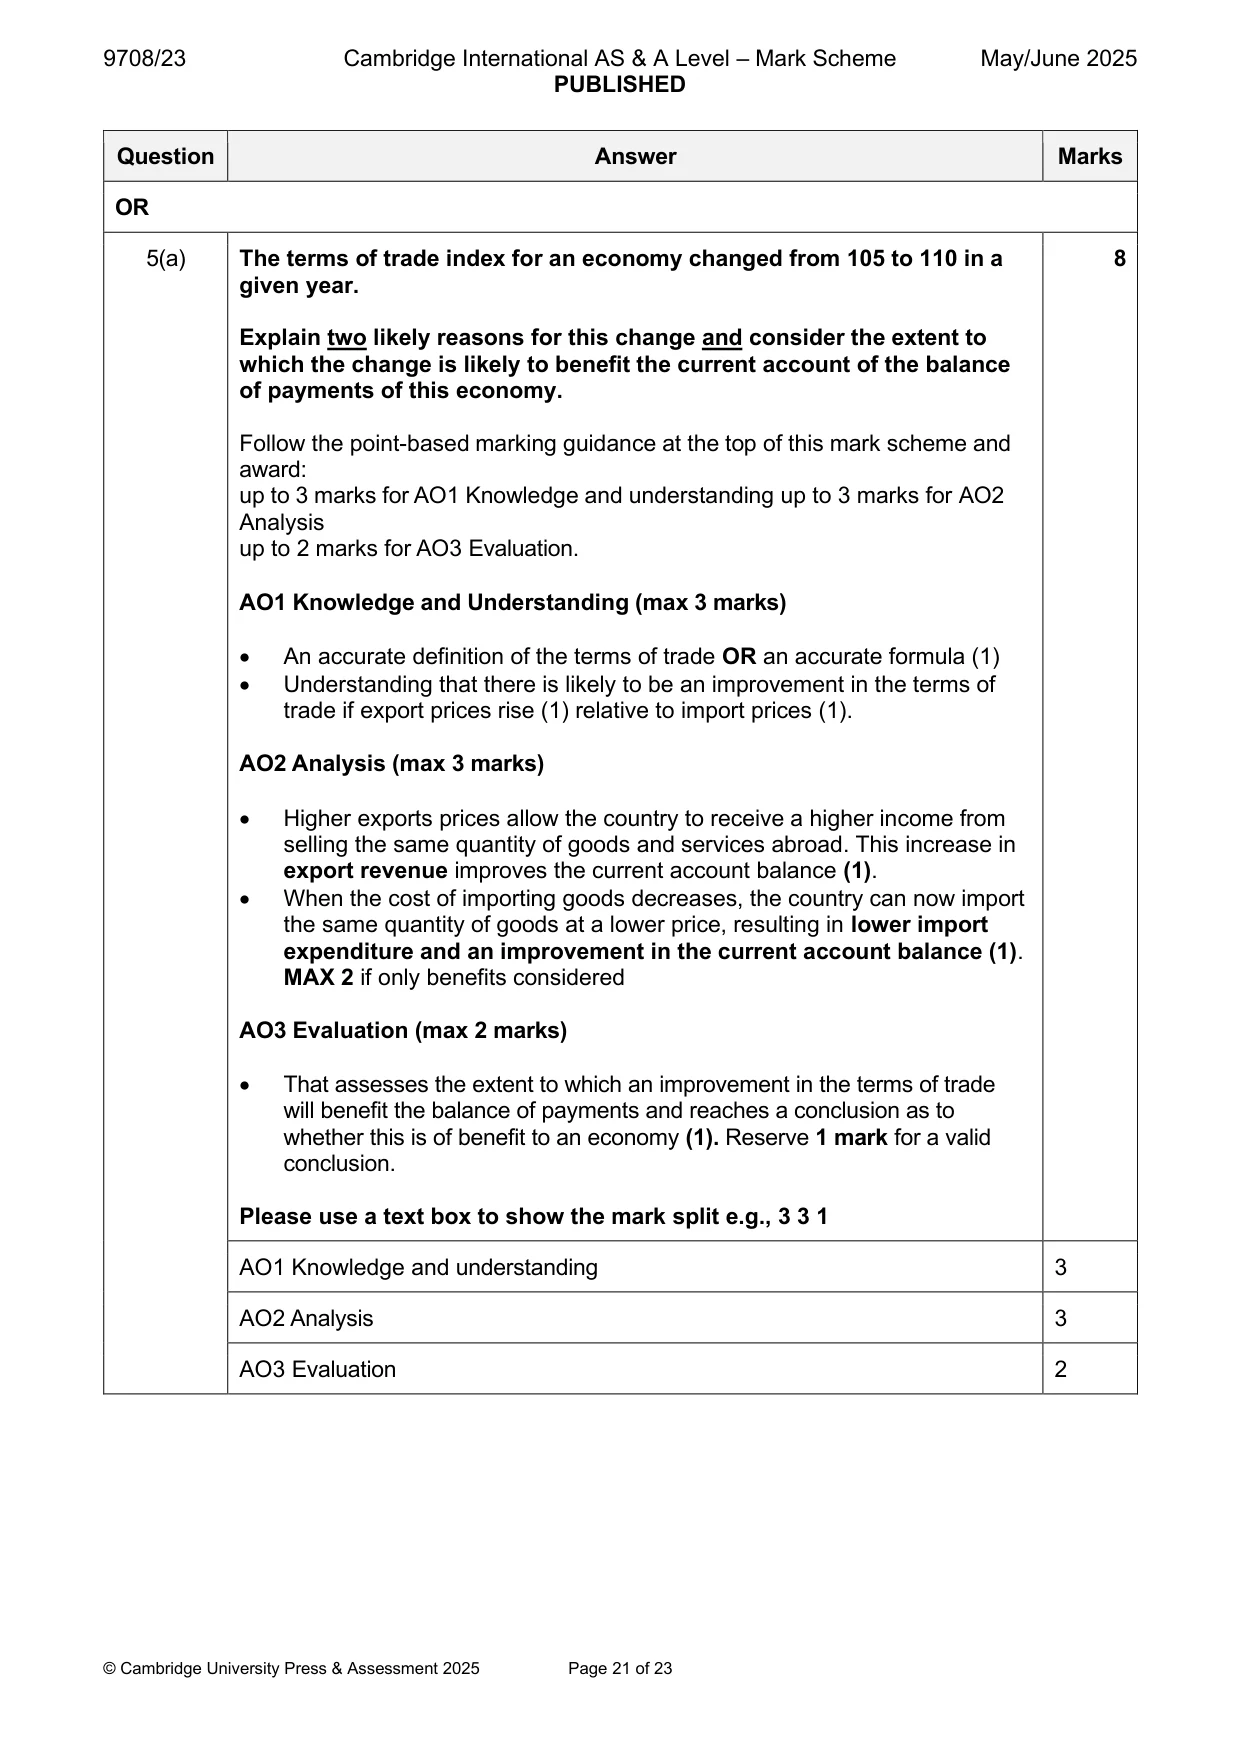
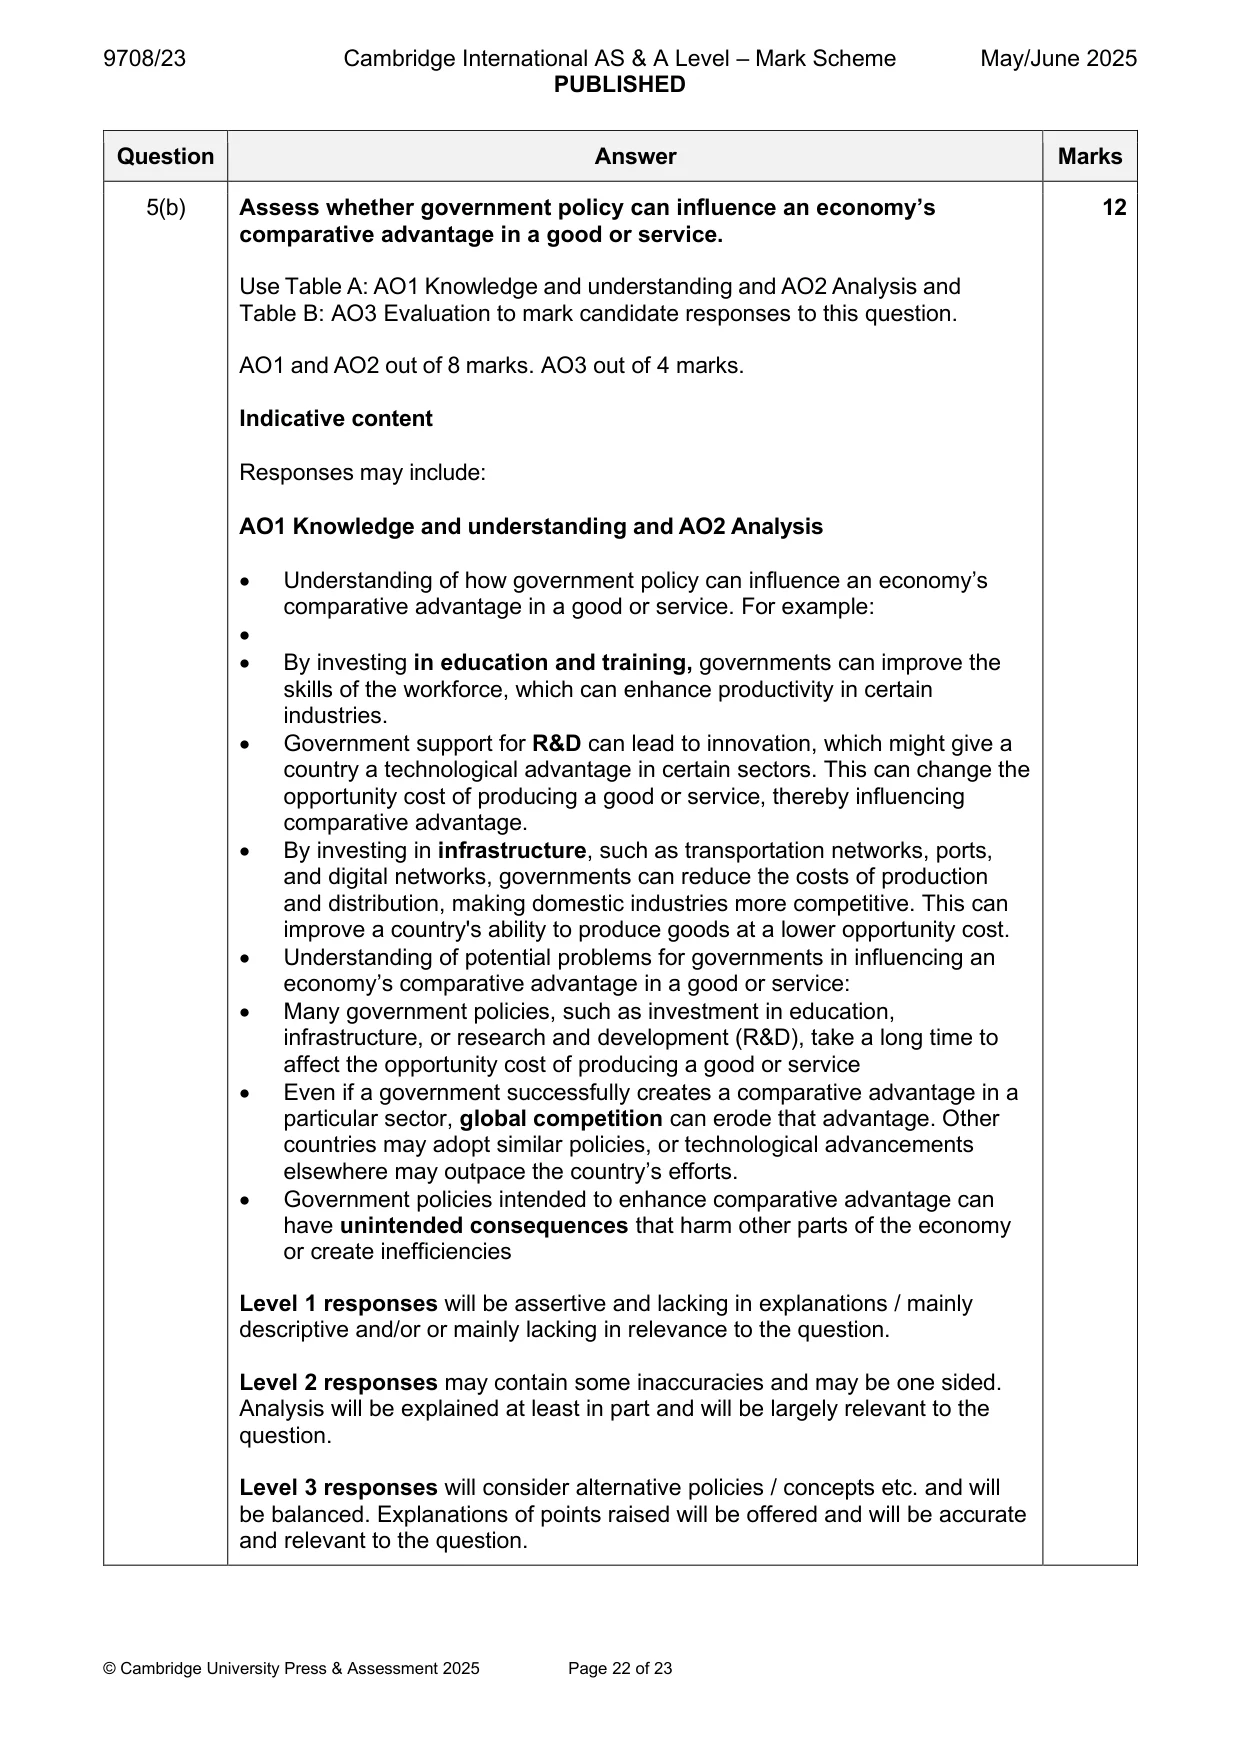
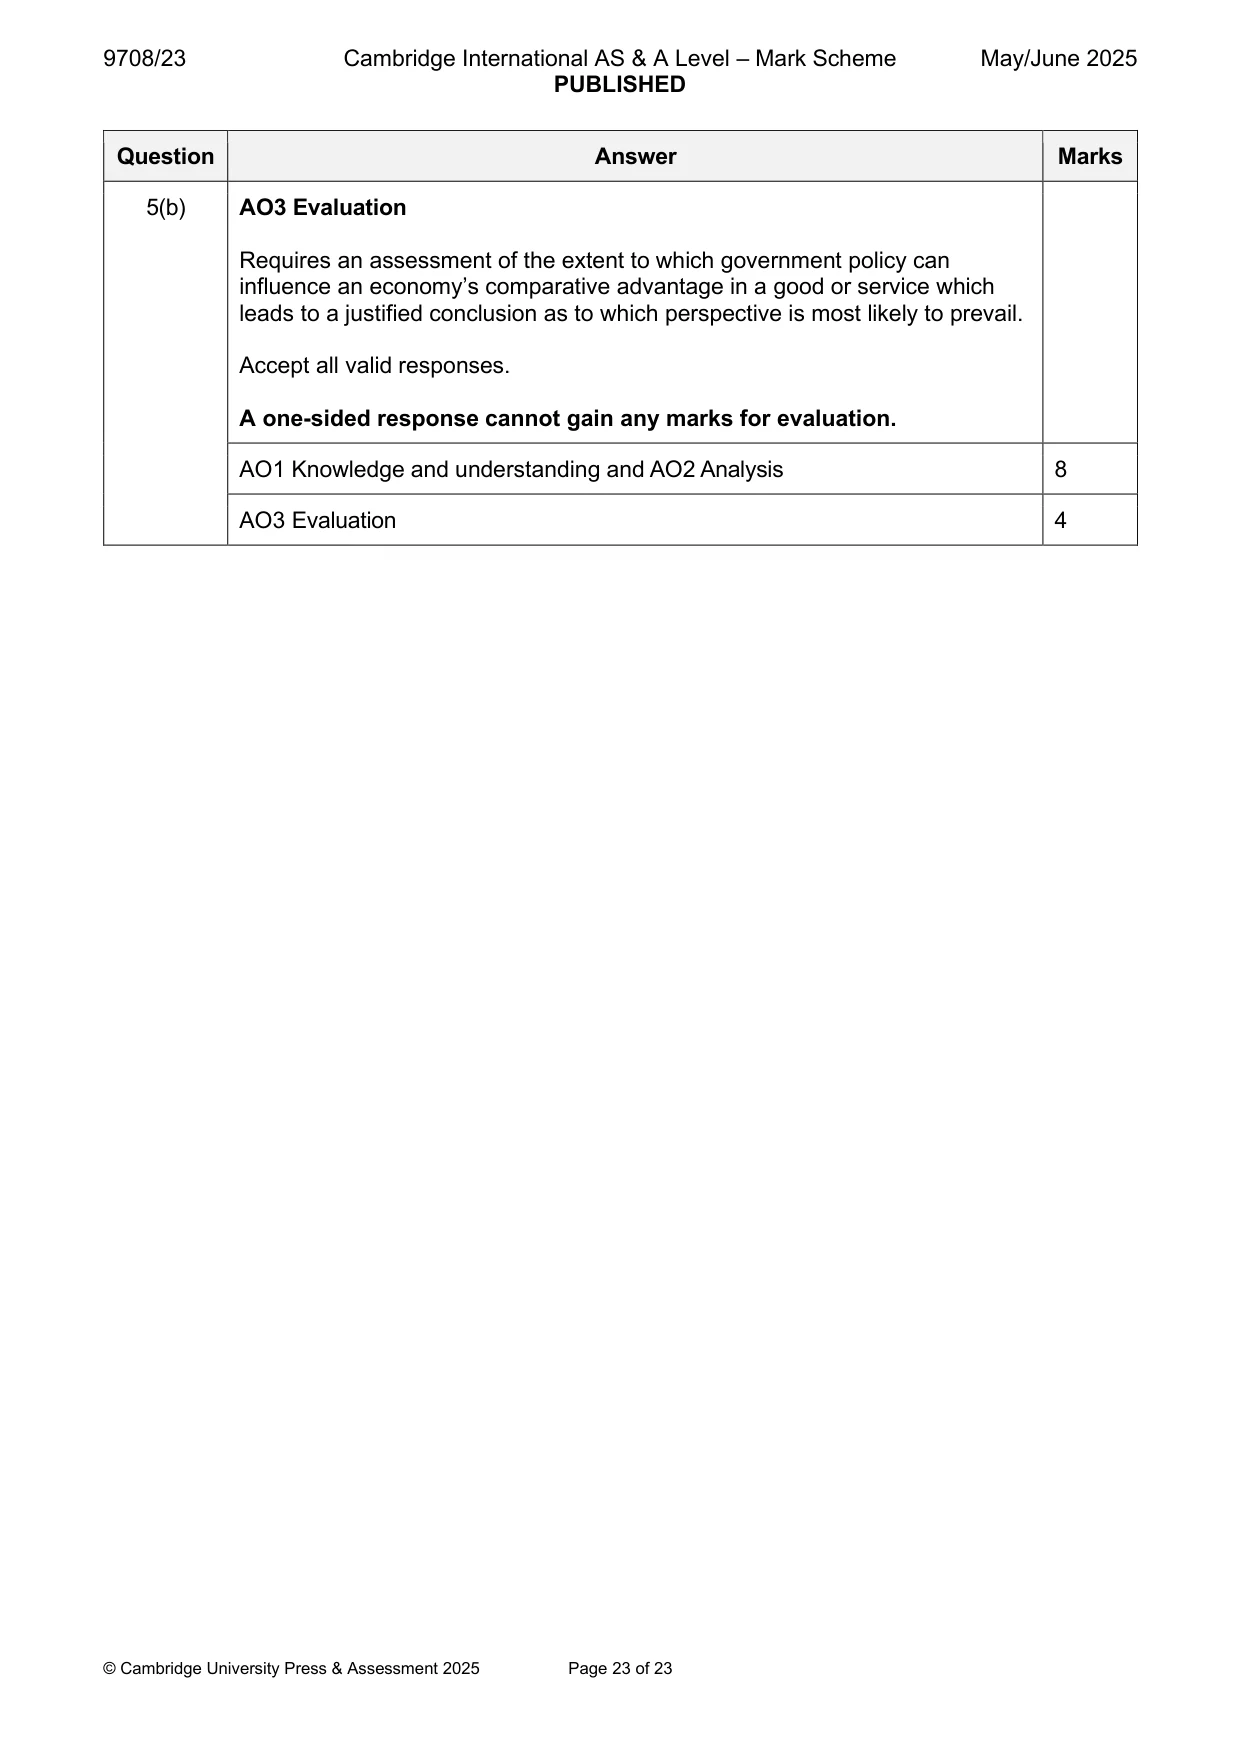
Mark scheme: 5(a) The terms of trade index for an economy changed from 105 to 110 in a 8 given year. Explain two likely reasons for this change and consider the extent to which the change is likely to benefit the current account of the balance of payments of this economy. Follow the point-based marking guidance at the top of this mark scheme and award: up to 3 marks for AO1 Knowledge and understanding up to 3 marks for AO2 Analysis up to 2 marks for AO3 Evaluation. AO1 Knowledge and Understanding (max 3 marks) • An accurate definition of the terms of trade OR an accurate formula (1) • Understanding that there is likely to be an improvement in the terms of trade if export prices rise (1) relative to import prices (1). AO2 Analysis (max 3 marks) • Higher exports prices allow the country to receive a higher income from selling the same quantity of goods and services abroad. This increase in export revenue improves the current account balance (1). • When the cost of importing goods decreases, the country can now import the same quantity of goods at a lower price, resulting in lower import expenditure and an improvement in the current account balance (1). MAX 2 if only benefits considered AO3 Evaluation (max 2 marks) • That assesses the extent to which an improvement in the terms of trade will benefit the balance of payments and reaches a conclusion as to whether this is of benefit to an economy (1). Reserve 1 mark for a valid conclusion. Please use a text box to show the mark split e.g., 3 3 1 AO1 Knowledge and understanding 3 AO2 Analysis 3 AO3 Evaluation 2 5(b) Assess whether government policy can influence an economy’s 12 comparative advantage in a good or service. Use Table A: AO1 Knowledge and understanding and AO2 Analysis and Table B: AO3 Evaluation to mark candidate responses to this question. AO1 and AO2 out of 8 marks. AO3 out of 4 marks. Indicative content Responses may include: AO1 Knowledge and understanding and AO2 Analysis • Understanding of how government policy can influence an economy’s comparative advantage in a good or service. For example: • • By investing in education and training, governments can improve the skills of the workforce, which can enhance productivity in certain industries. • Government support for R&D can lead to innovation, which might give a country a technological advantage in certain sectors. This can change the opportunity cost of producing a good or service, thereby influencing comparative advantage. • By investing in infrastructure, such as transportation networks, ports, and digital networks, governments can reduce the costs of production and distribution, making domestic industries more competitive. This can improve a country's ability to produce goods at a lower opportunity cost. • Understanding of potential problems for governments in influencing an economy’s comparative advantage in a good or service: • Many government policies, such as investment in education, infrastructure, or research and development (R&D), take a long time to affect the opportunity cost of producing a good or service • Even if a government successfully creates a comparative advantage in a particular sector, global competition can erode that advantage. Other countries may adopt similar policies, or technological advancements elsewhere may outpace the country’s efforts. • Government policies intended to enhance comparative advantage can have unintended consequences that harm other parts of the economy or create inefficiencies Level 1 responses will be assertive and lacking in explanations / mainly descriptive and/or or mainly lacking in relevance to the question. Level 2 responses may contain some inaccuracies and may be one sided. Analysis will be explained at least in part and will be largely relevant to the question. Level 3 responses will consider alternative policies / concepts etc. and will be balanced. Explanations of points raised will be offered and will be accurate and relevant to the question. 5(b) AO3 Evaluation Requires an assessment of the extent to which government policy can influence an economy’s comparative advantage in a good or service which leads to a justified conclusion as to which perspective is most likely to prevail. Accept all valid responses. A one-sided response cannot gain any marks for evaluation. AO1 Knowledge and understanding and AO2 Analysis 8 AO3 Evaluation 4
What was in this paper
The subtopics covered by these 5 questions, and how many questions each got. Open one in a new tab to see every Cambridge question on it.
What you needed in this session
Cambridge’s own grade thresholds for 2025 May/June, Paper 2 · Variant 3. A higher threshold means an easier paper — the bar moves with how the cohort did.