Cambridge A Level Economics 9708 — 2024 Oct/Nov Paper 2 · Variant 2
9708/22/O/N/24 · 5 questions · 60 marks · ≈68 min
The question paper and its mark scheme, free to read here and free to download. This is Cambridge’s own paper, exactly as it was sat.
Question paper4 pages
Mark scheme22 pages
Answers below. Sit the paper first if you are practising.



Questions as text
Q1 · Can economic growth in Chile reduce income and wealth inequality?
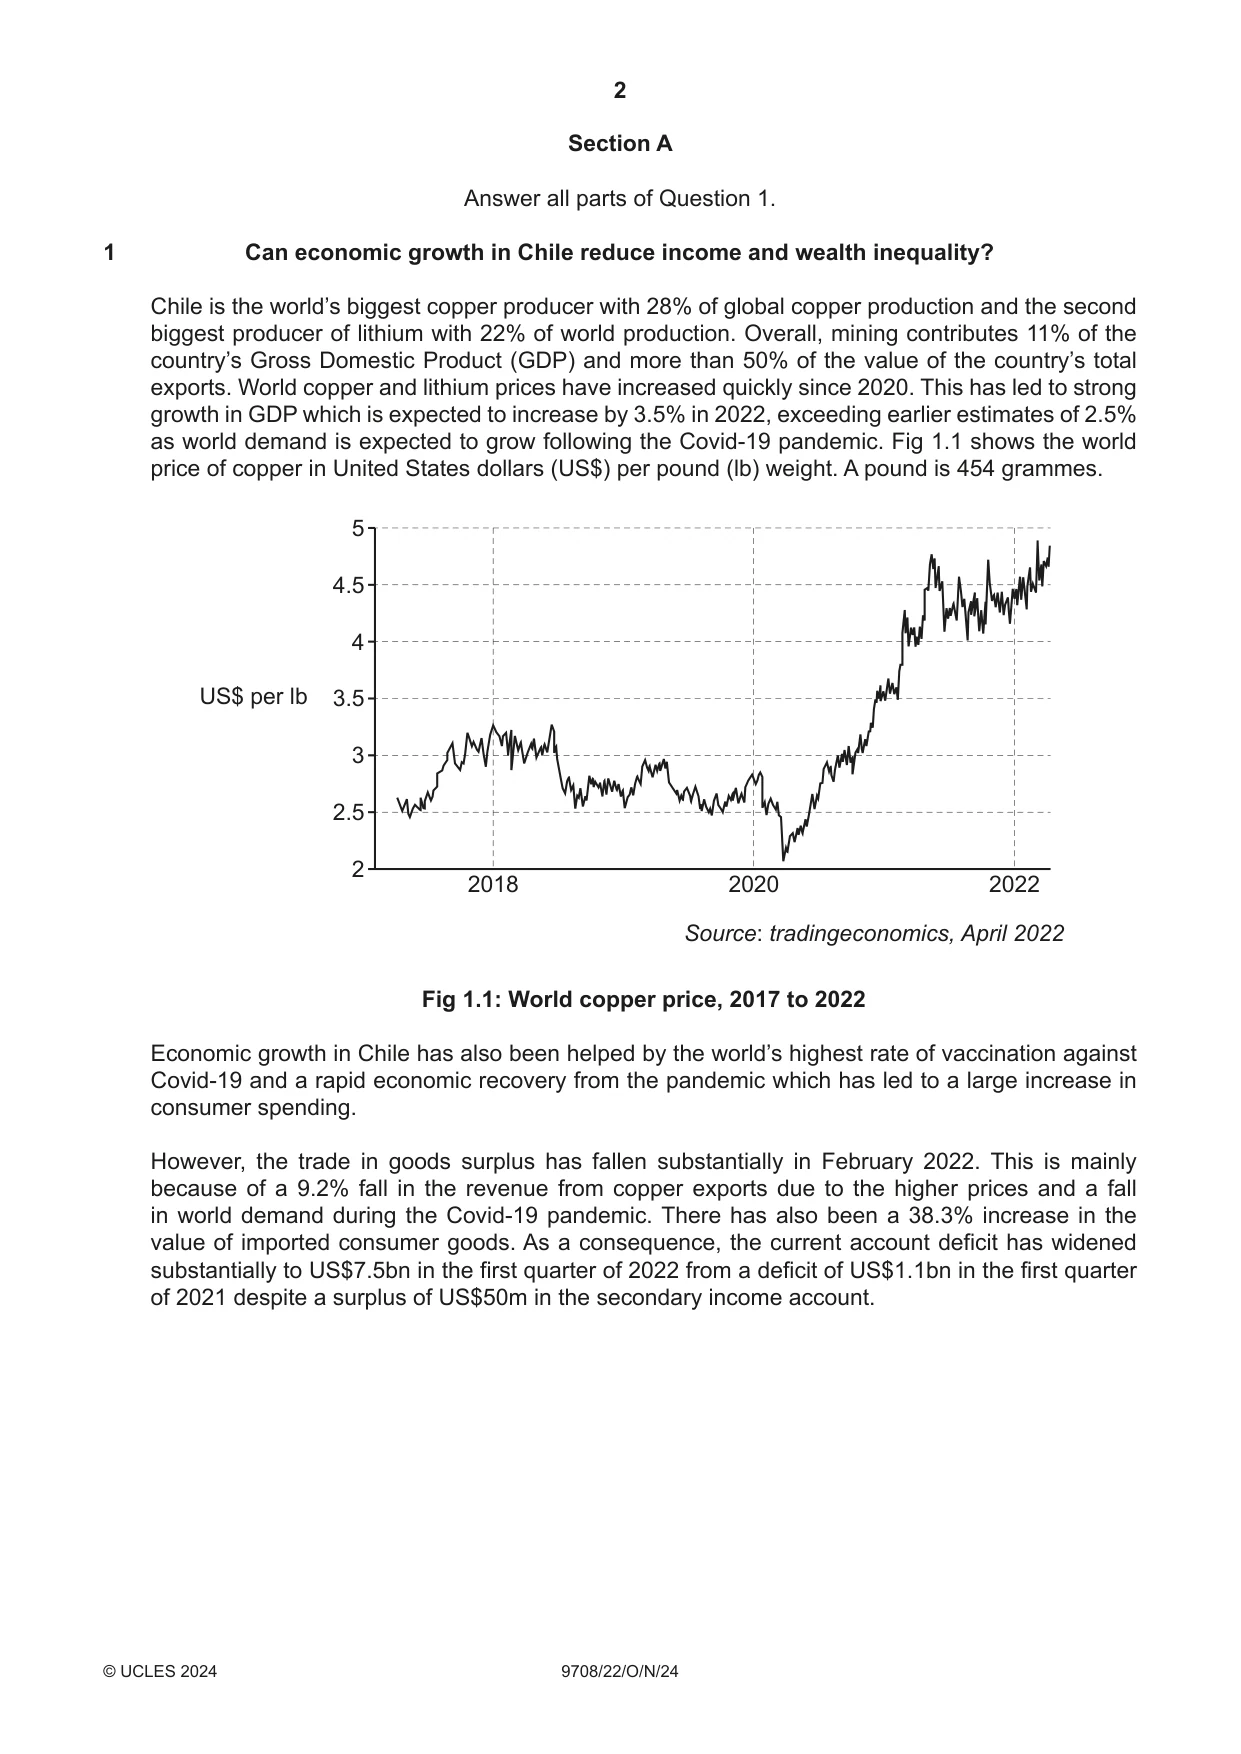
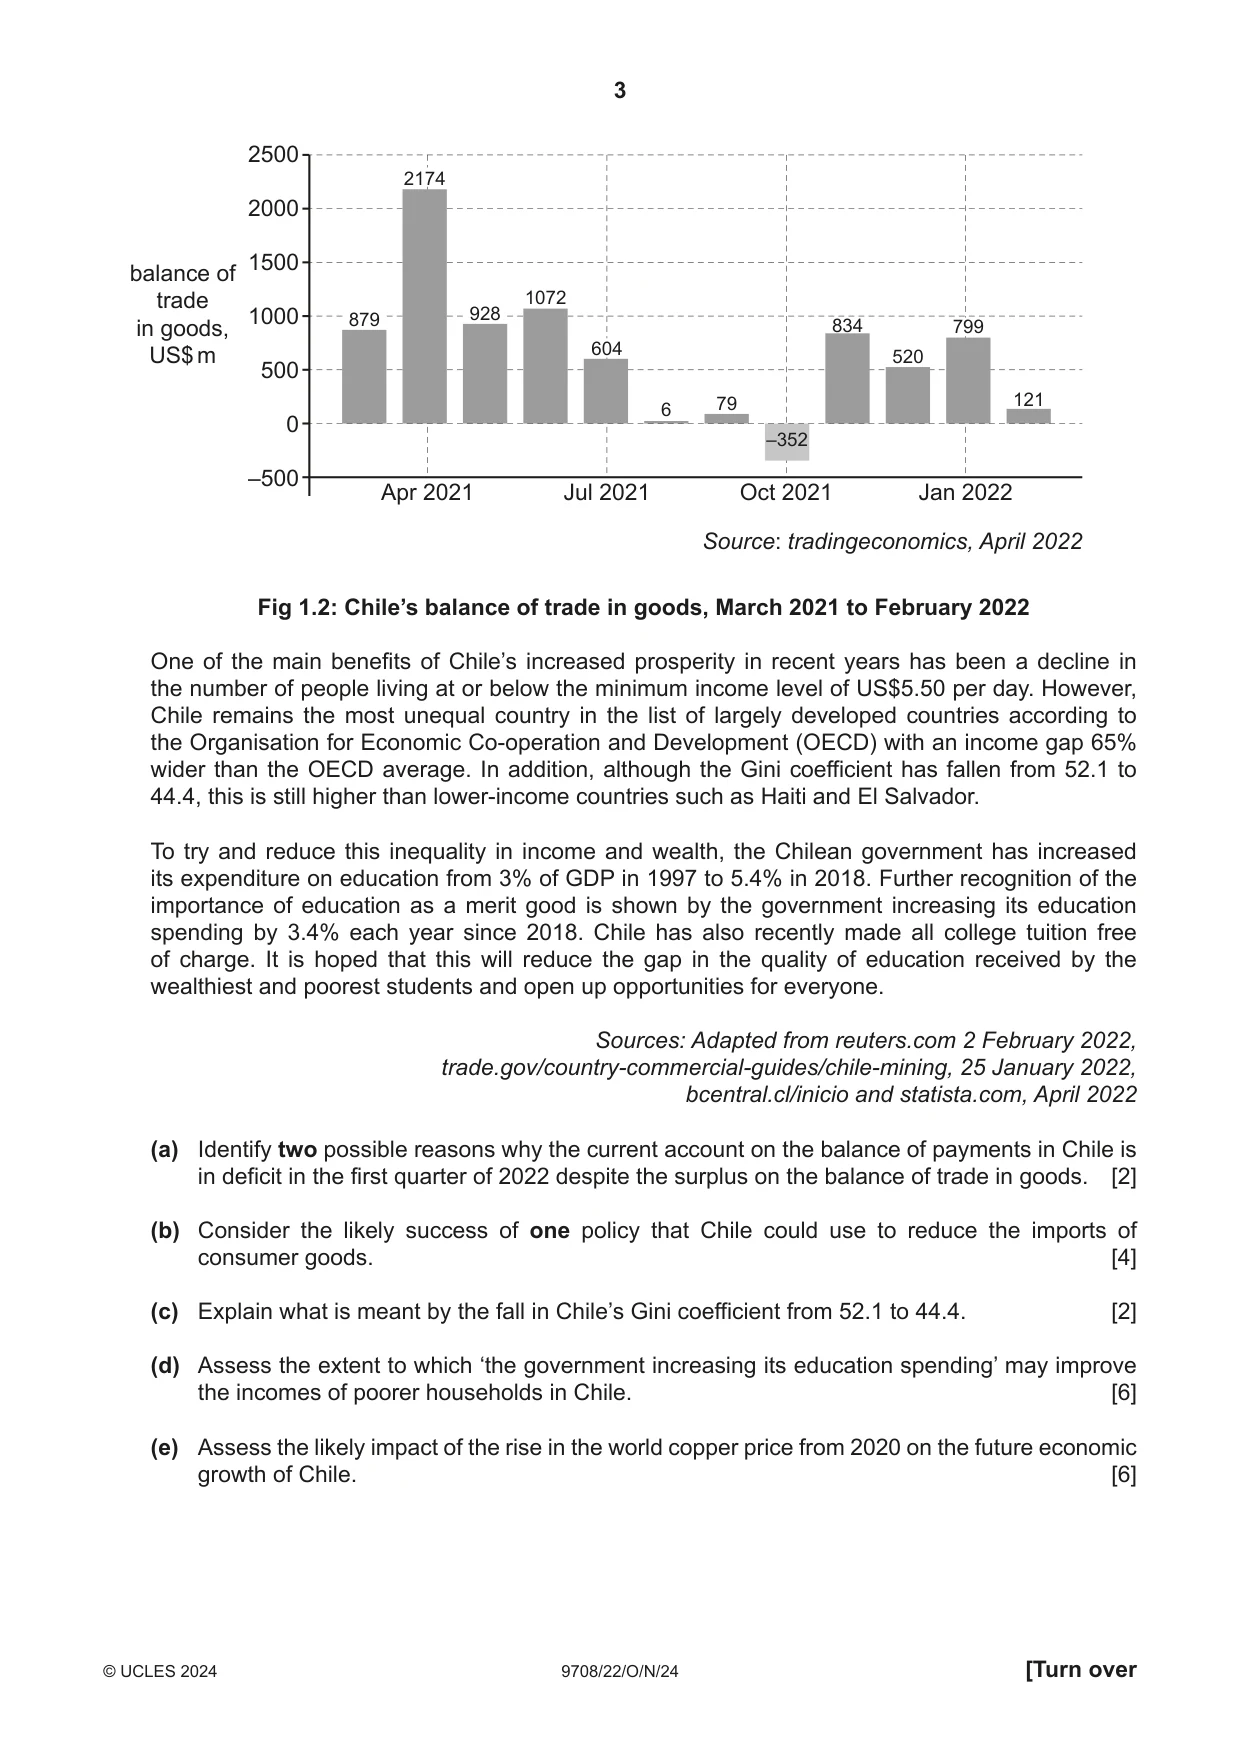
1 Can economic growth in Chile reduce income and wealth inequality? Chile is the world’s biggest copper producer with 28% of global copper production and the second biggest producer of lithium with 22% of world production. Overall, mining contributes 11% of the country’s Gross Domestic Product (GDP) and more than 50% of the value of the country’s total exports. World copper and lithium prices have increased quickly since 2020. This has led to strong growth in GDP which is expected to increase by 3.5% in 2022, exceeding earlier estimates of 2.5% as world demand is expected to grow following the Covid-19 pandemic. Fig 1.1 shows the world price of copper in United States dollars (US$) per pound (lb) weight. A pound is 454 grammes. 5 4.5 4 US$ per lb 3.5 3 2.5 2 2018 2020 2022 Source: tradingeconomics, April 2022 Fig 1.1: World copper price, 2017 to 2022 Economic growth in Chile has also been helped by the world’s highest rate of vaccination against Covid-19 and a rapid economic recovery from the pandemic which has led to a large increase in consumer spending. However, the trade in goods surplus has fallen substantially in February 2022. This is mainly because of a 9.2% fall in the revenue from copper exports due to the higher prices and a fall in world demand during the Covid-19 pandemic. There has also been a 38.3% increase in the value of imported consumer goods. As a consequence, the current account deficit has widened substantially to US$7.5bn in the first quarter of 2022 from a deficit of US$1.1bn in the first quarter of 2021 despite a surplus of US$50m in the secondary income account. 2500 2174 2000 1500balance of trade 1072 1000 879 928 834 799 in goods, US$ m 604 520 500 6 79 121 0 –352 –500 Apr 2021 Jul 2021 Oct 2021 Jan 2022 Source: tradingeconomics, April 2022 Fig 1.2: Chile’s balance of trade in goods, March 2021 to February 2022 One of the main benefits of Chile’s increased prosperity in recent years has been a decline in the number of people living at or below the minimum income level of US$5.50 per day. However, Chile remains the most unequal country in the list of largely developed countries according to the Organisation for Economic Co-operation and Development (OECD) with an income gap 65% wider than the OECD average. In addition, although the Gini coefficient has fallen from 52.1 to 44.4, this is still higher than lower-income countries such as Haiti and El Salvador. To try and reduce this inequality in income and wealth, the Chilean government has increased its expenditure on education from 3% of GDP in 1997 to 5.4% in 2018. Further recognition of the importance of education as a merit good is shown by the government increasing its education spending by 3.4% each year since 2018. Chile has also recently made all college tuition free of charge. It is hoped that this will reduce the gap in the quality of education received by the wealthiest and poorest students and open up opportunities for everyone. Sources: Adapted from reuters.com 2 February 2022, trade.gov/country-commercial-guides/chile-mining, 25 January 2022, bcentral.cl/inicio and statista.com, April 2022 (a) Identify two possible reasons why the current account on the balance of payments in Chile is in deficit in the first quarter of 2022 despite the surplus on the balance of trade in goods. [2] (b) Consider the likely success of one policy that Chile could use to reduce the imports of consumer goods. [4] (c) Explain what is meant by the fall in Chile’s Gini coefficient from 52.1 to 44.4. [2] (d) Assess the extent to which ‘the government increasing its education spending’ may improve the incomes of poorer households in Chile. [6] (e) Assess the likely impact of the rise in the world copper price from 2020 on the future economic growth of Chile. [6]
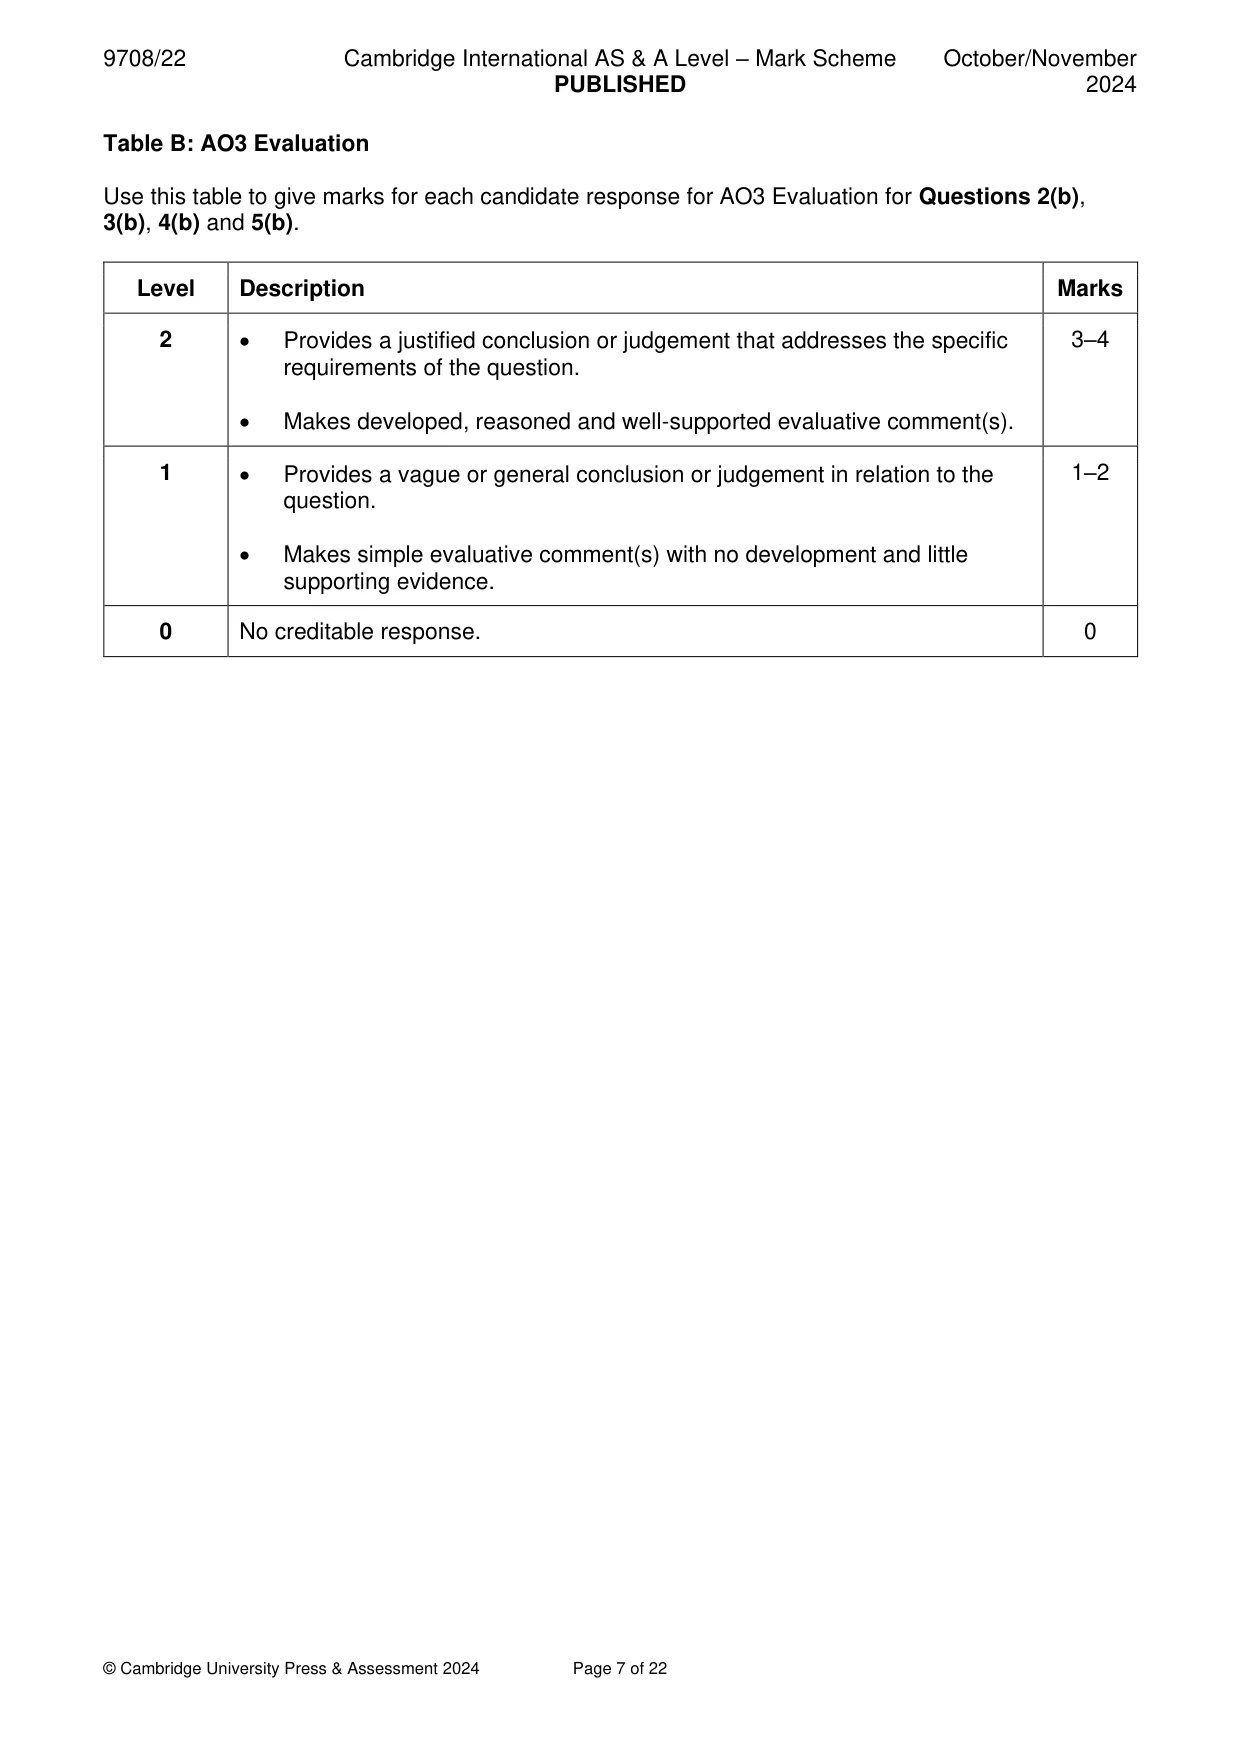
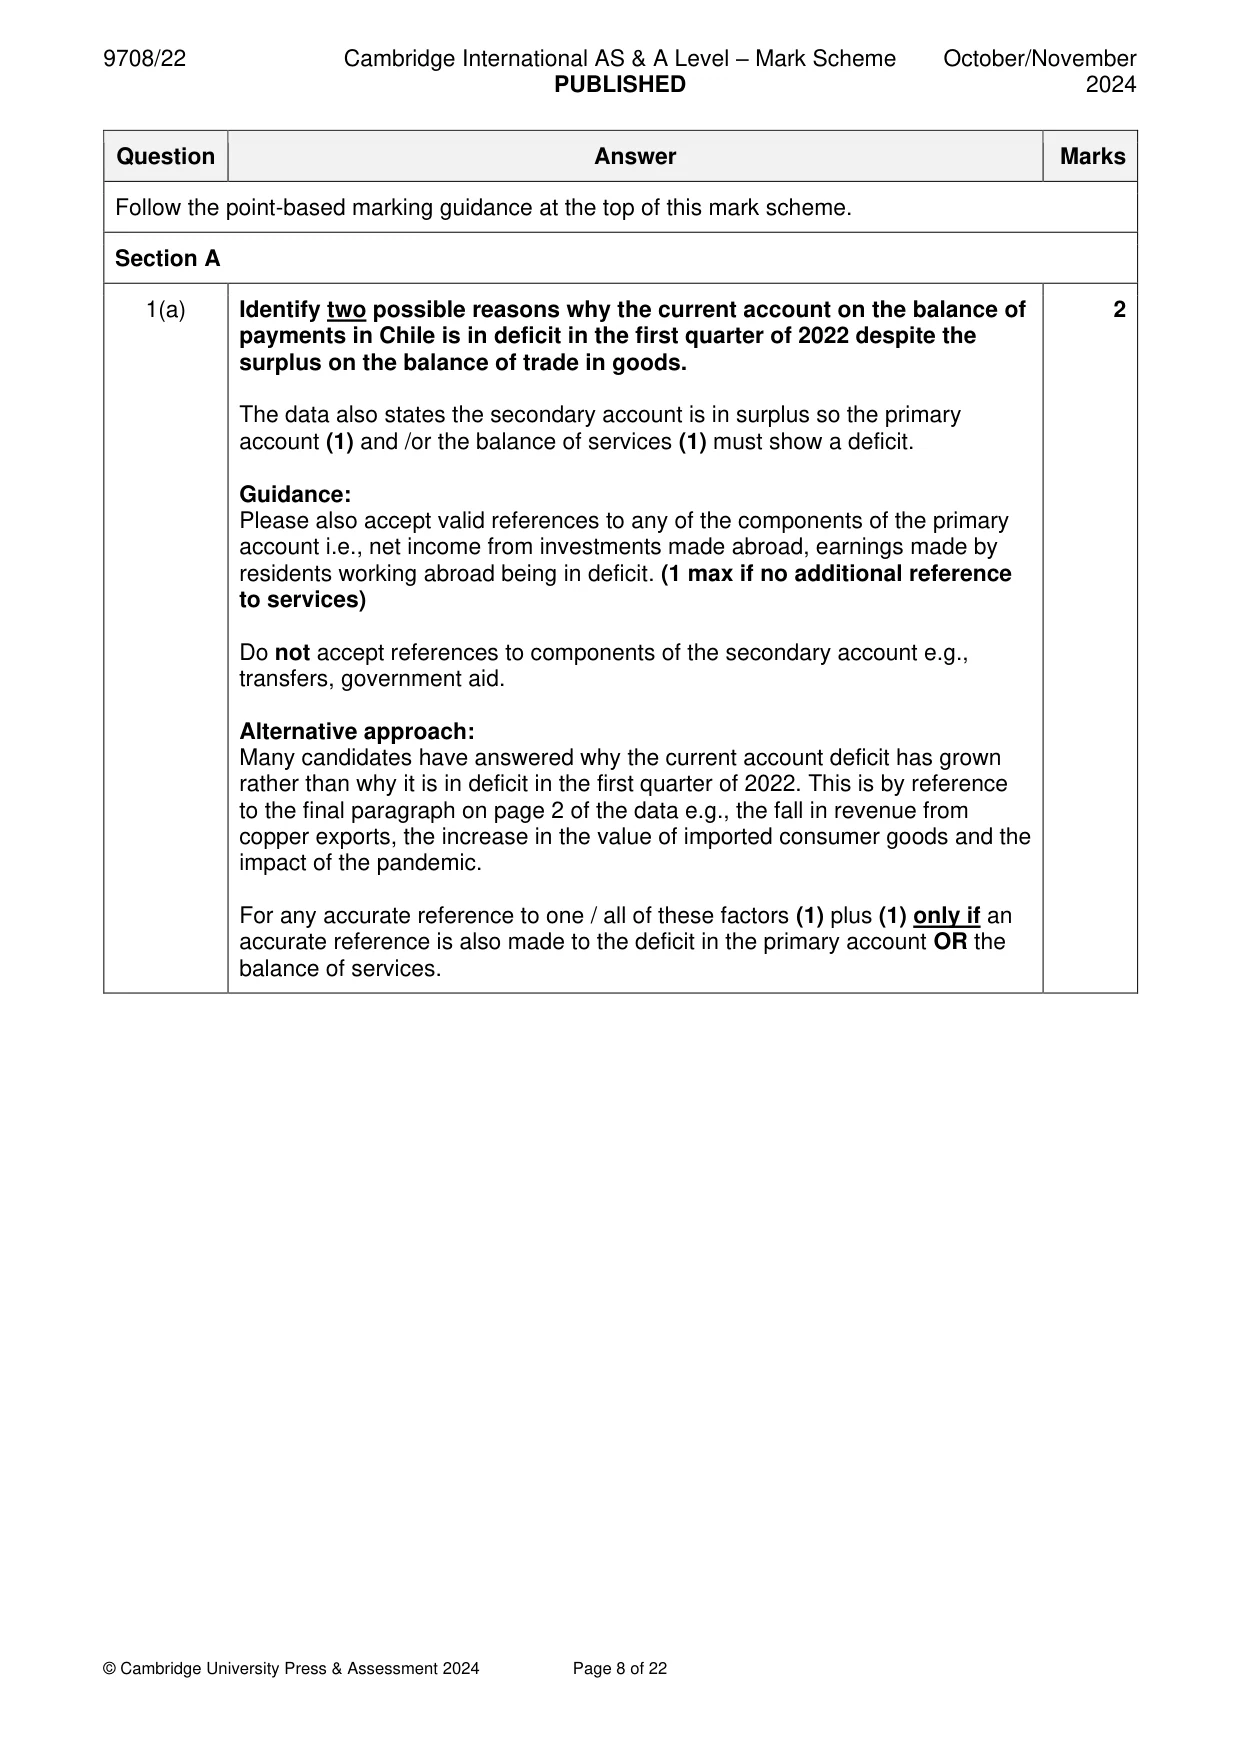
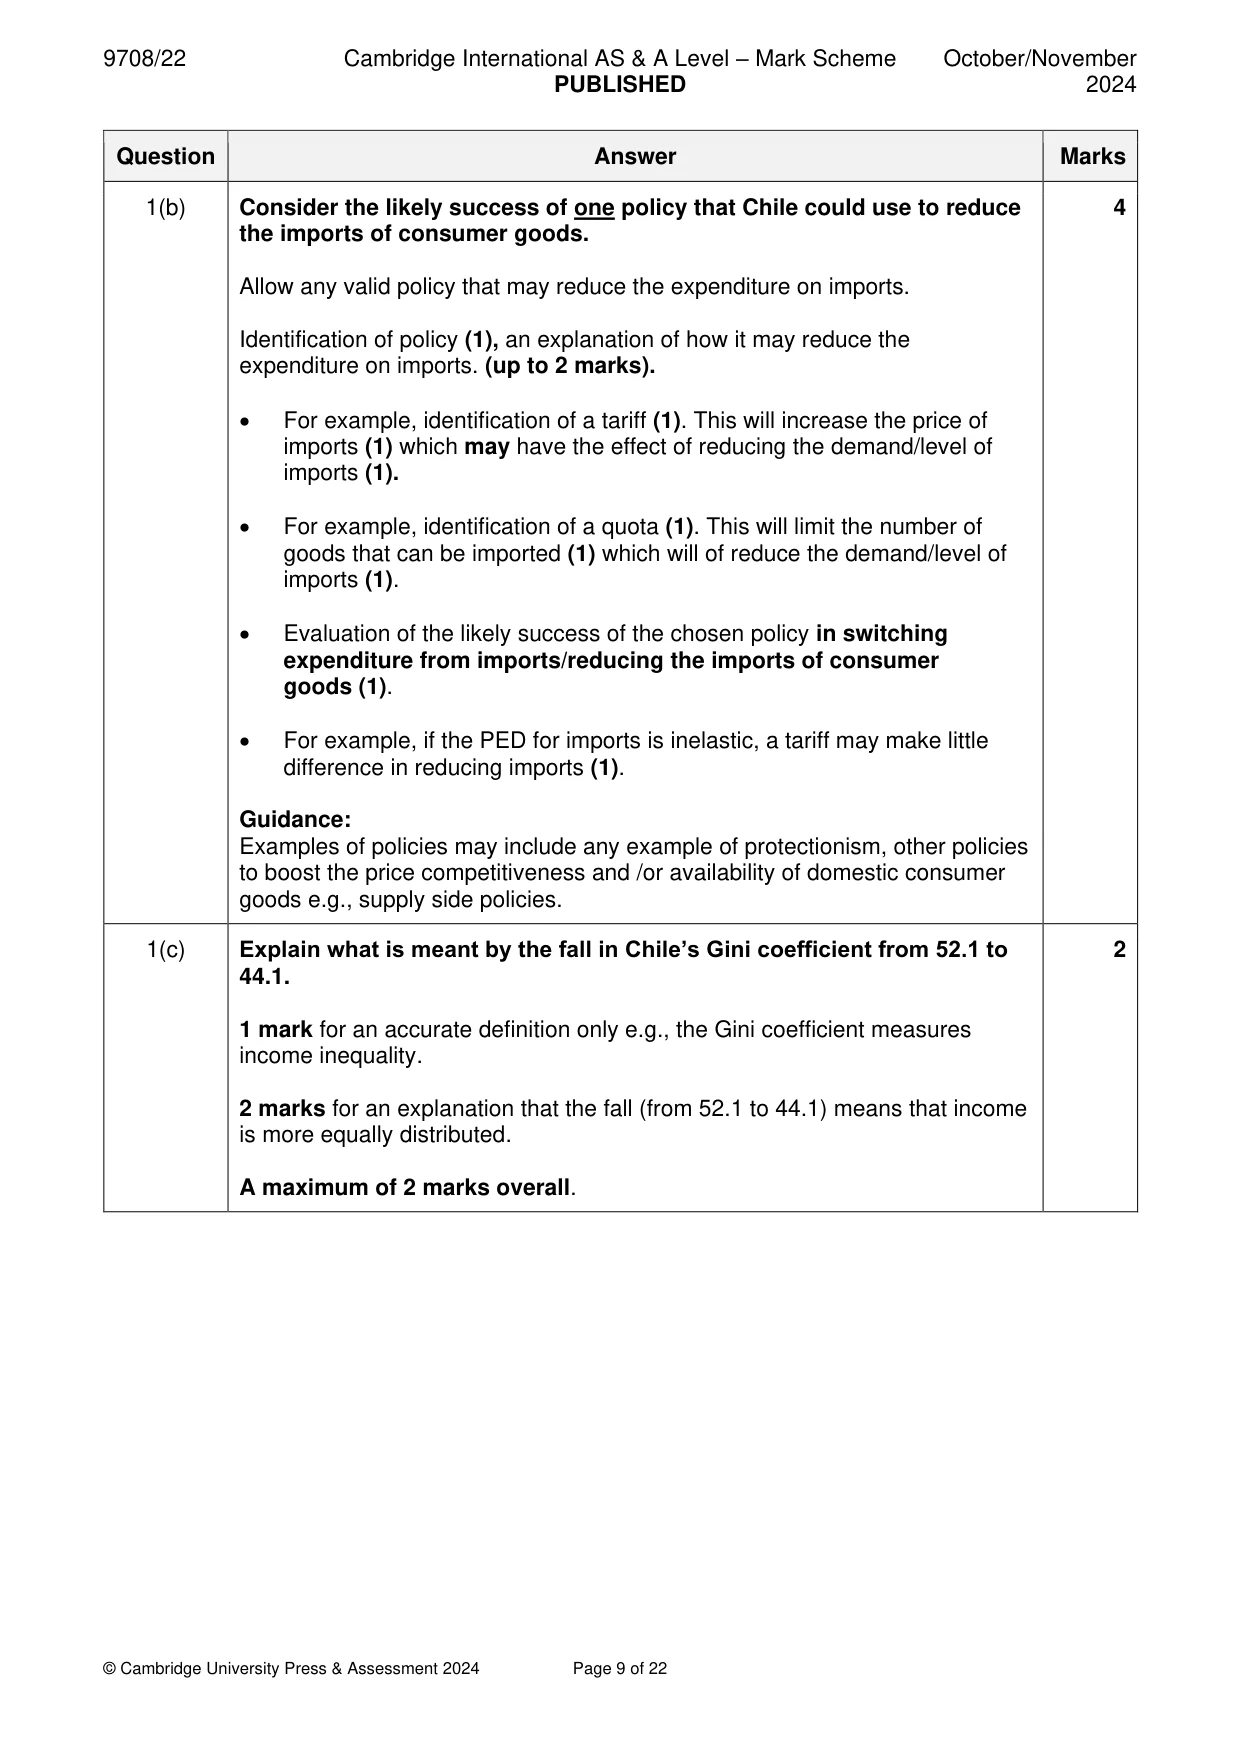
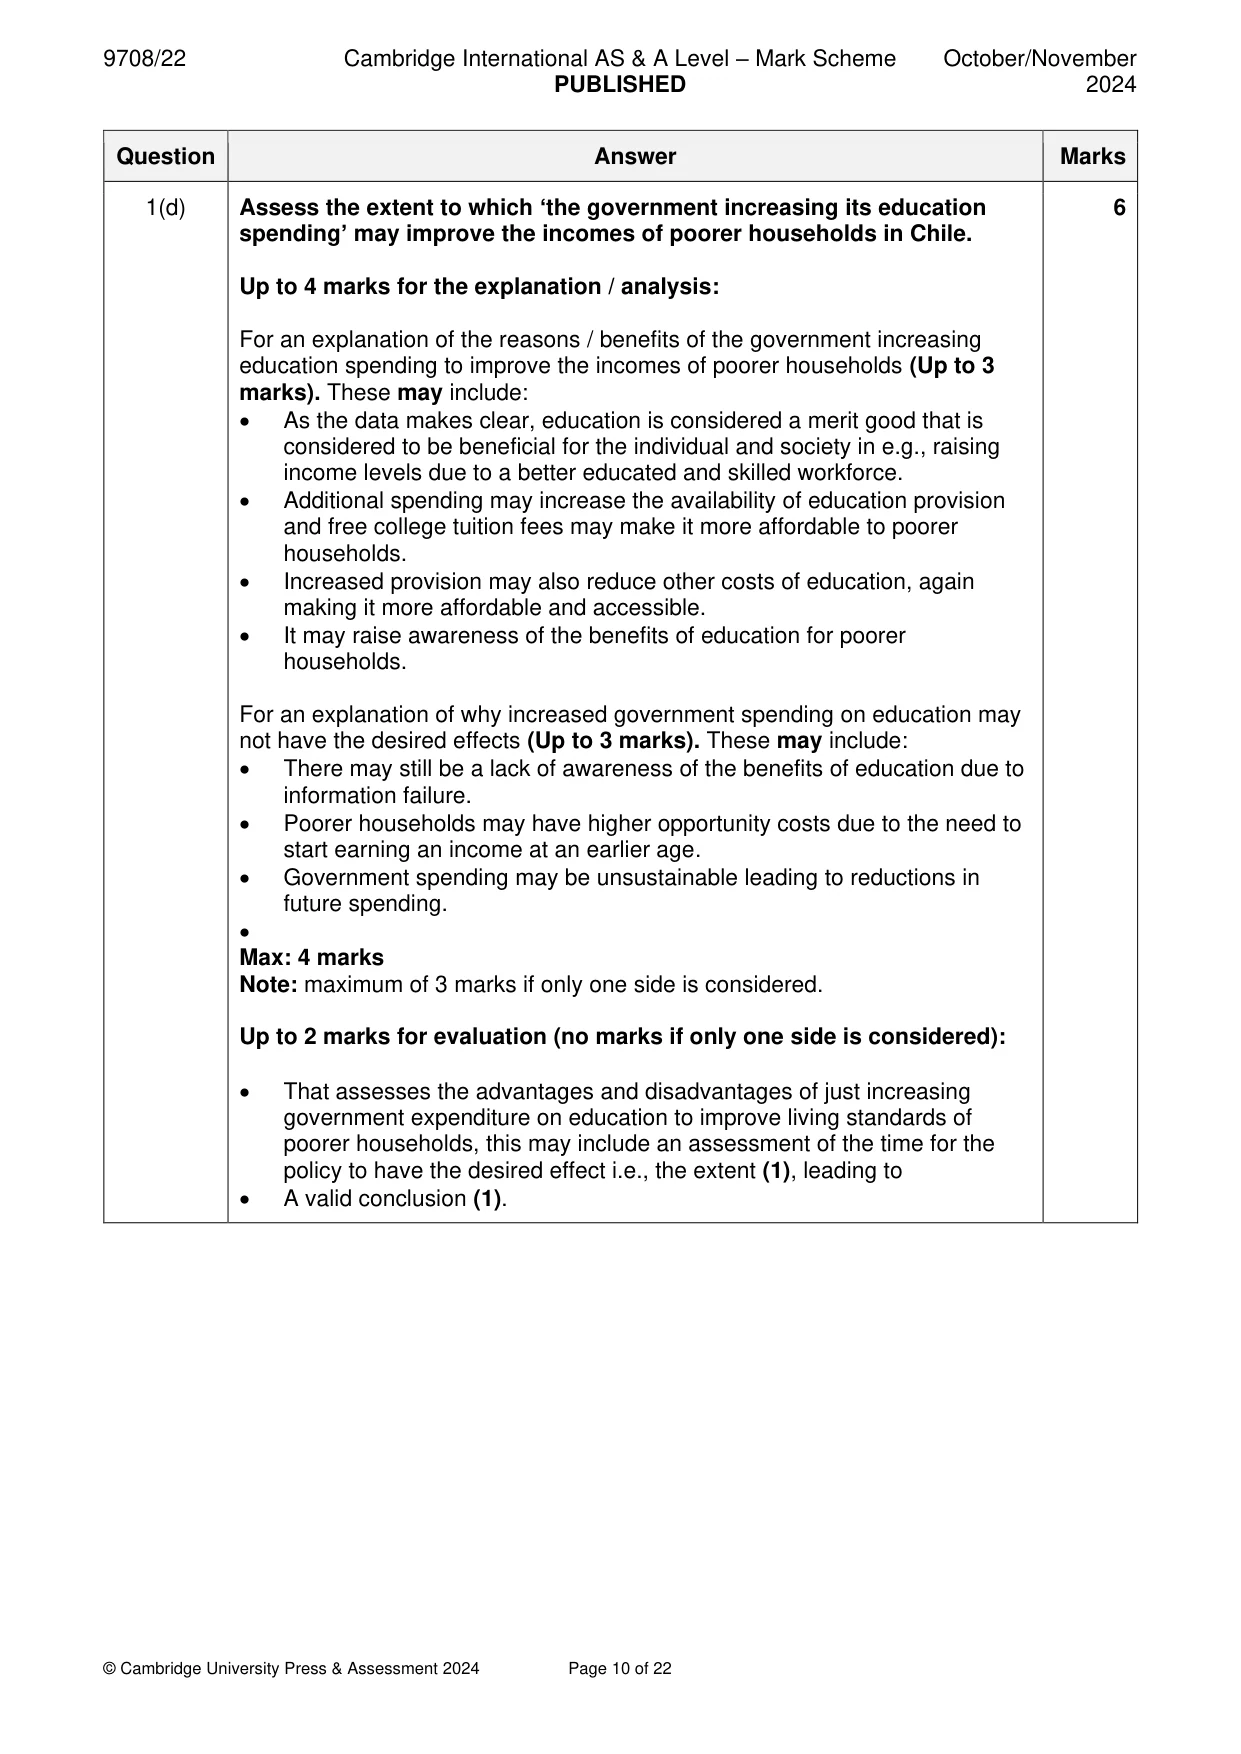
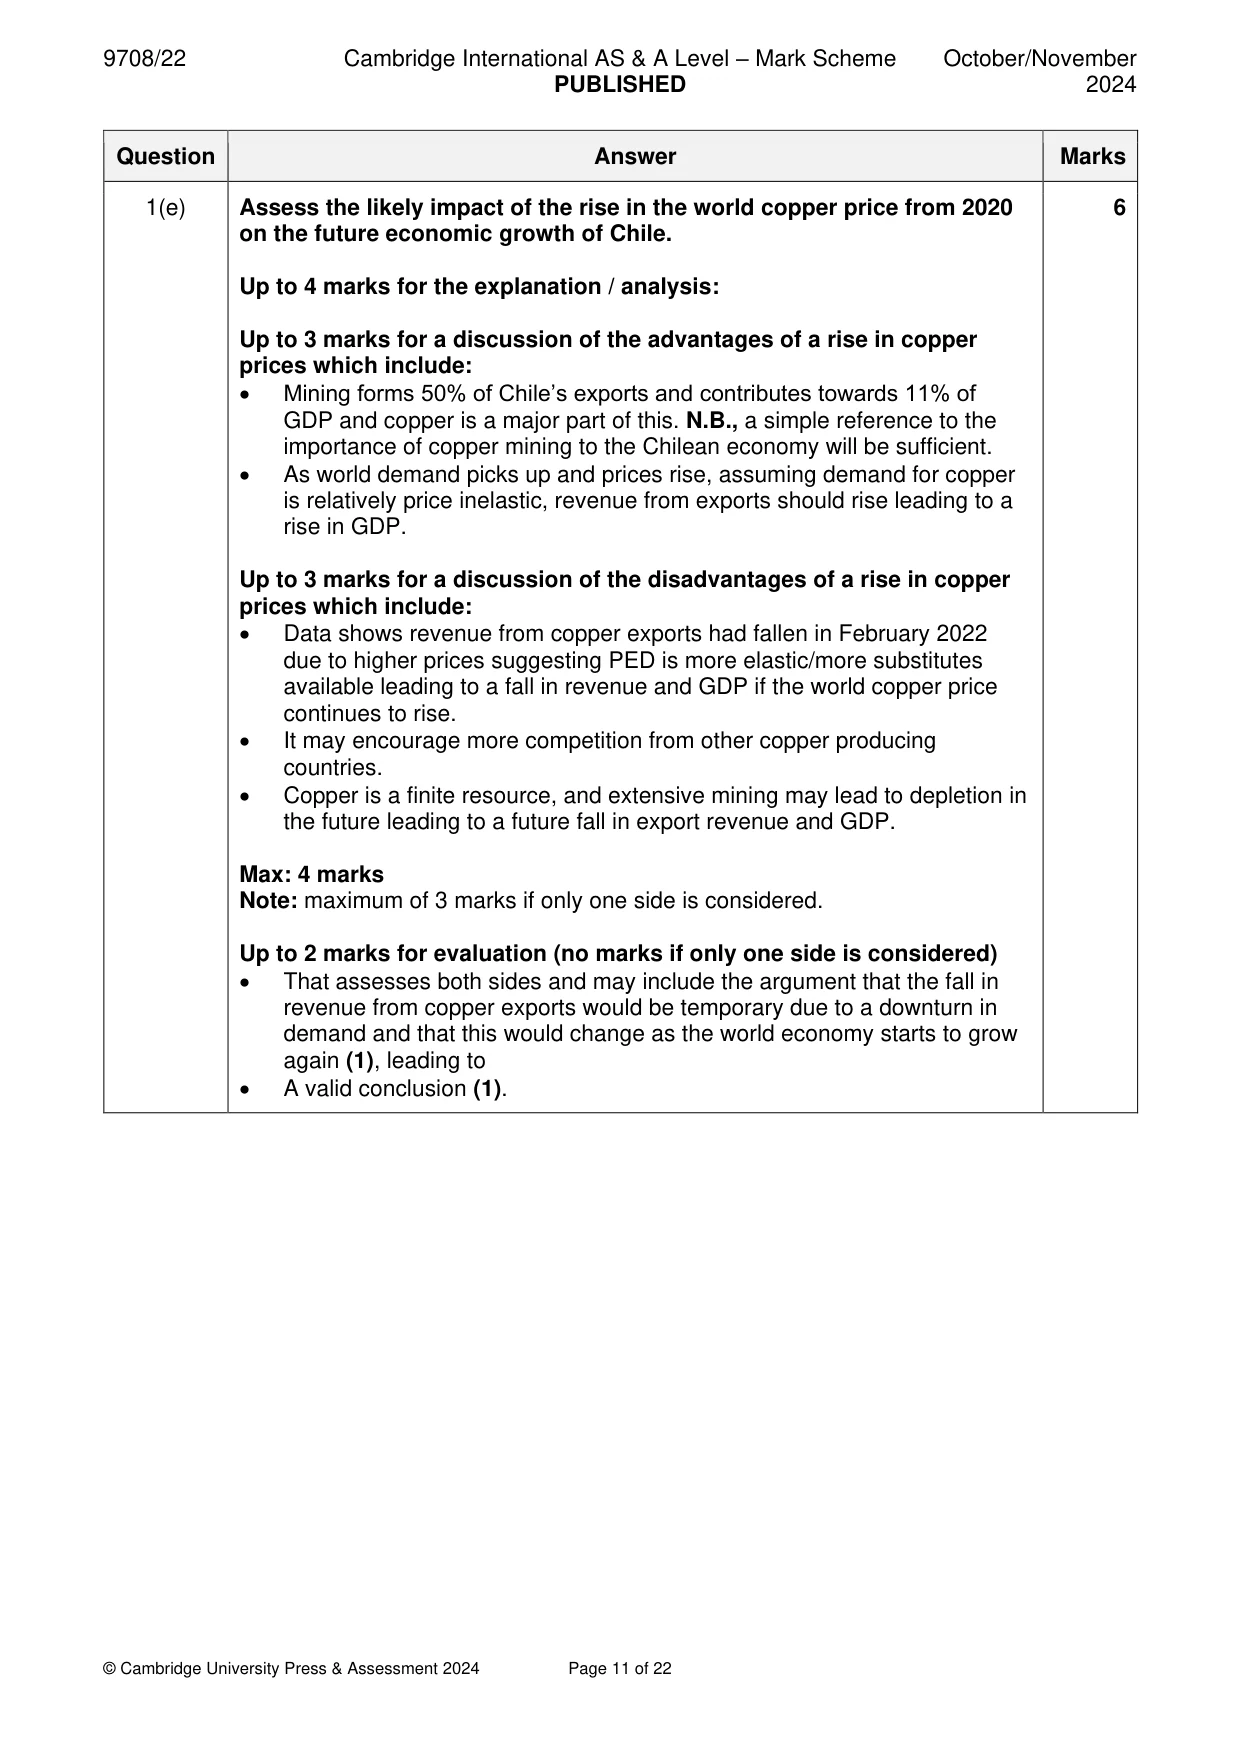
Mark scheme: Section A 1(a) Identify two possible reasons why the current account on the balance of 2 payments in Chile is in deficit in the first quarter of 2022 despite the surplus on the balance of trade in goods. The data also states the secondary account is in surplus so the primary account (1) and /or the balance of services (1) must show a deficit. Guidance: Please also accept valid references to any of the components of the primary account i.e., net income from investments made abroad, earnings made by residents working abroad being in deficit. (1 max if no additional reference to services) Do not accept references to components of the secondary account e.g., transfers, government aid. Alternative approach: Many candidates have answered why the current account deficit has grown rather than why it is in deficit in the first quarter of 2022. This is by reference to the final paragraph on page 2 of the data e.g., the fall in revenue from copper exports, the increase in the value of imported consumer goods and the impact of the pandemic. For any accurate reference to one / all of these factors (1) plus (1) only if an accurate reference is also made to the deficit in the primary account OR the balance of services. 1(b) Consider the likely success of one policy that Chile could use to reduce 4 the imports of consumer goods. Allow any valid policy that may reduce the expenditure on imports. Identification of policy (1), an explanation of how it may reduce the expenditure on imports. (up to 2 marks). • For example, identification of a tariff (1). This will increase the price of imports (1) which may have the effect of reducing the demand/level of imports (1). • For example, identification of a quota (1). This will limit the number of goods that can be imported (1) which will of reduce the demand/level of imports (1). • Evaluation of the likely success of the chosen policy in switching expenditure from imports/reducing the imports of consumer goods (1). • For example, if the PED for imports is inelastic, a tariff may make little difference in reducing imports (1). Guidance: Examples of policies may include any example of protectionism, other policies to boost the price competitiveness and /or availability of domestic consumer goods e.g., supply side policies. 1(c) Explain what is meant by the fall in Chile’s Gini coefficient from 52.1 to 2 44.1. 1 mark for an accurate definition only e.g., the Gini coefficient measures income inequality. 2 marks for an explanation that the fall (from 52.1 to 44.1) means that income is more equally distributed. A maximum of 2 marks overall. 1(d) Assess the extent to which ‘the government increasing its education 6 spending’ may improve the incomes of poorer households in Chile. Up to 4 marks for the explanation / analysis: For an explanation of the reasons / benefits of the government increasing education spending to improve the incomes of poorer households (Up to 3 marks). These may include: • As the data makes clear, education is considered a merit good that is considered to be beneficial for the individual and society in e.g., raising income levels due to a better educated and skilled workforce. • Additional spending may increase the availability of education provision and free college tuition fees may make it more affordable to poorer households. • Increased provision may also reduce other costs of education, again making it more affordable and accessible. • It may raise awareness of the benefits of education for poorer households. For an explanation of why increased government spending on education may not have the desired effects (Up to 3 marks). These may include: • There may still be a lack of awareness of the benefits of education due to information failure. • Poorer households may have higher opportunity costs due to the need to start earning an income at an earlier age. • Government spending may be unsustainable leading to reductions in future spending. • Max: 4 marks Note: maximum of 3 marks if only one side is considered. Up to 2 marks for evaluation (no marks if only one side is considered): • That assesses the advantages and disadvantages of just increasing government expenditure on education to improve living standards of poorer households, this may include an assessment of the time for the policy to have the desired effect i.e., the extent (1), leading to • A valid conclusion (1). 1(e) Assess the likely impact of the rise in the world copper price from 2020 6 on the future economic growth of Chile. Up to 4 marks for the explanation / analysis: Up to 3 marks for a discussion of the advantages of a rise in copper prices which include: • Mining forms 50% of Chile’s exports and contributes towards 11% of GDP and copper is a major part of this. N.B., a simple reference to the importance of copper mining to the Chilean economy will be sufficient. • As world demand picks up and prices rise, assuming demand for copper is relatively price inelastic, revenue from exports should rise leading to a rise in GDP. Up to 3 marks for a discussion of the disadvantages of a rise in copper prices which include: • Data shows revenue from copper exports had fallen in February 2022 due to higher prices suggesting PED is more elastic/more substitutes available leading to a fall in revenue and GDP if the world copper price continues to rise. • It may encourage more competition from other copper producing countries. • Copper is a finite resource, and extensive mining may lead to depletion in the future leading to a future fall in export revenue and GDP. Max: 4 marks Note: maximum of 3 marks if only one side is considered. Up to 2 marks for evaluation (no marks if only one side is considered) • That assesses both sides and may include the argument that the fall in revenue from copper exports would be temporary due to a downturn in demand and that this would change as the world economy starts to grow again (1), leading to • A valid conclusion (1).
More questions on Equity and redistribution of income and wealth
Q2 · With the help of a diagram(s), briefly explain how the cause of a movement along the…
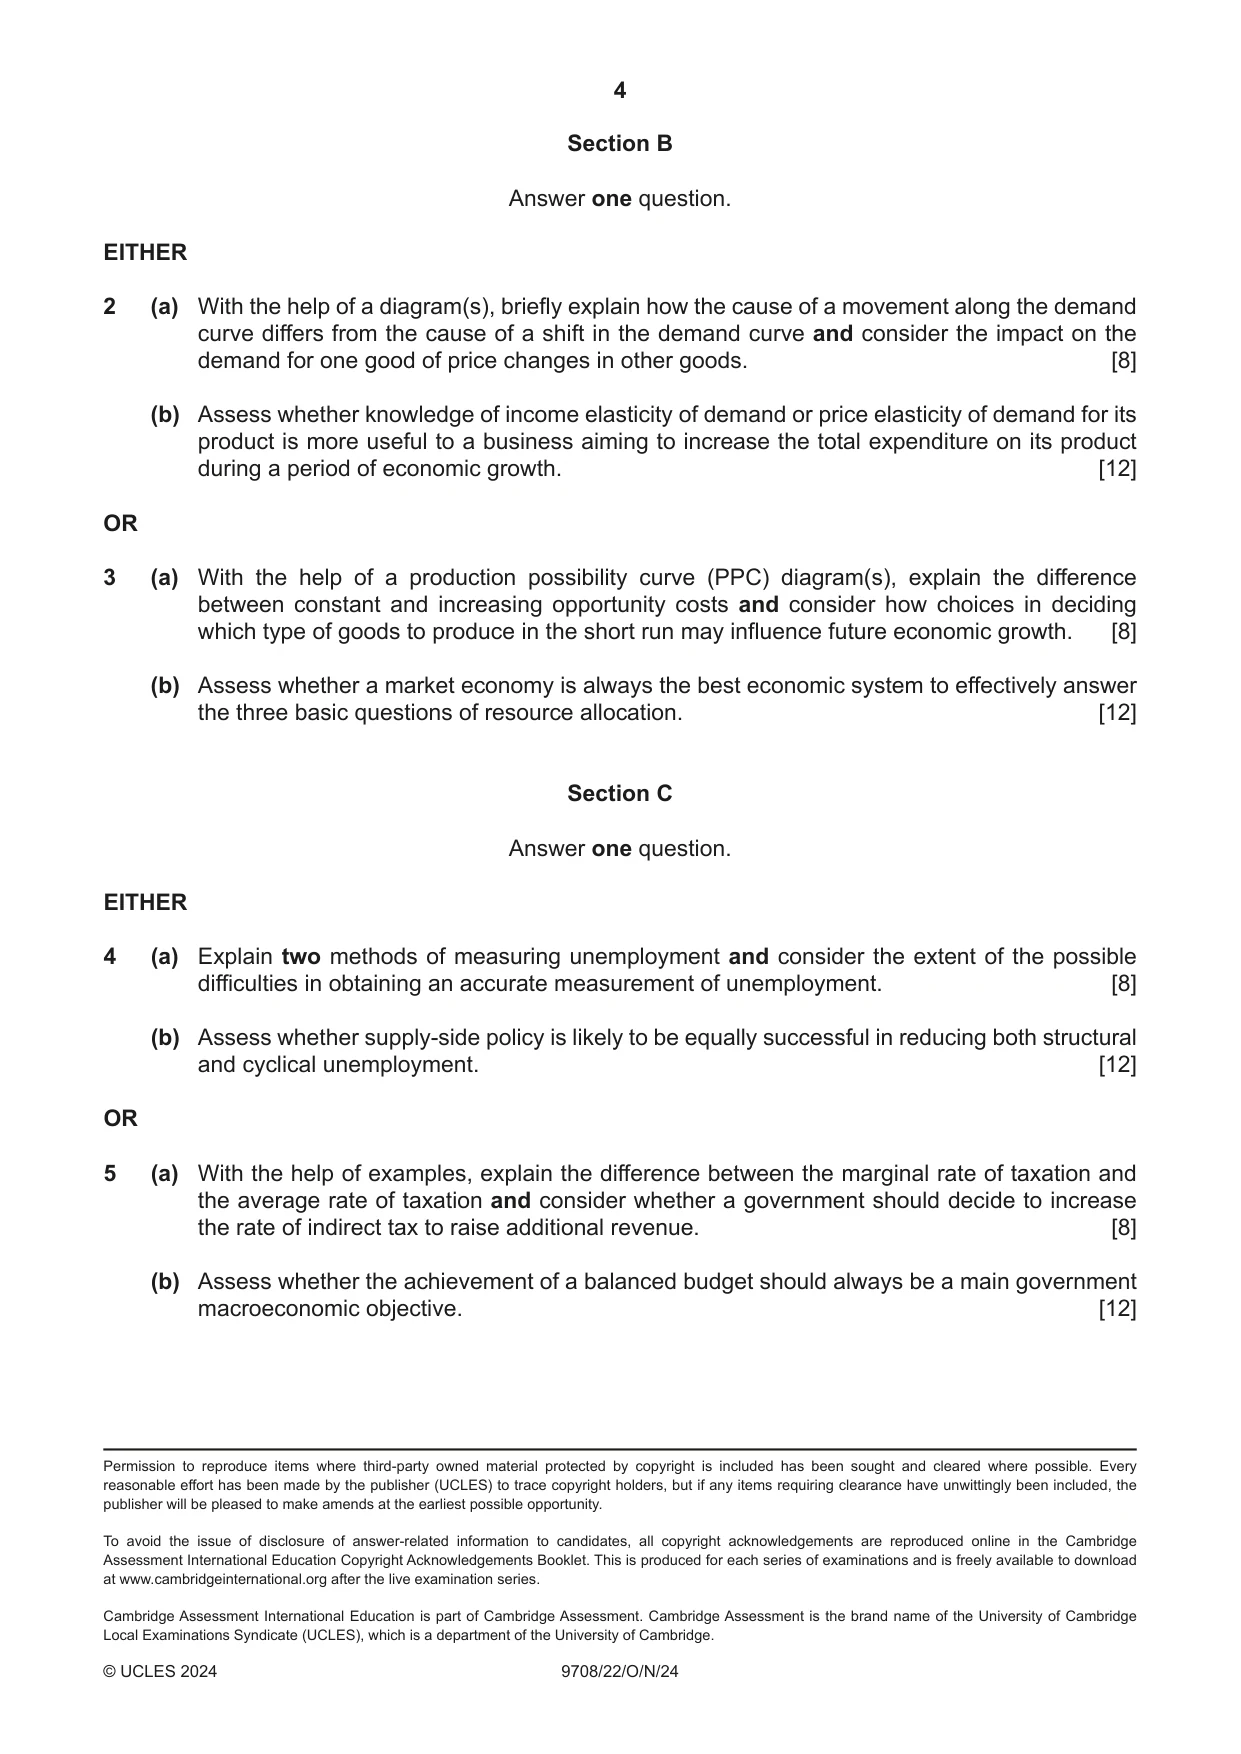
2 (a) With the help of a diagram(s), briefly explain how the cause of a movement along the demand curve differs from the cause of a shift in the demand curve and consider the impact on the demand for one good of price changes in other goods. [8] (b) Assess whether knowledge of income elasticity of demand or price elasticity of demand for its product is more useful to a business aiming to increase the total expenditure on its product during a period of economic growth. [12] OR
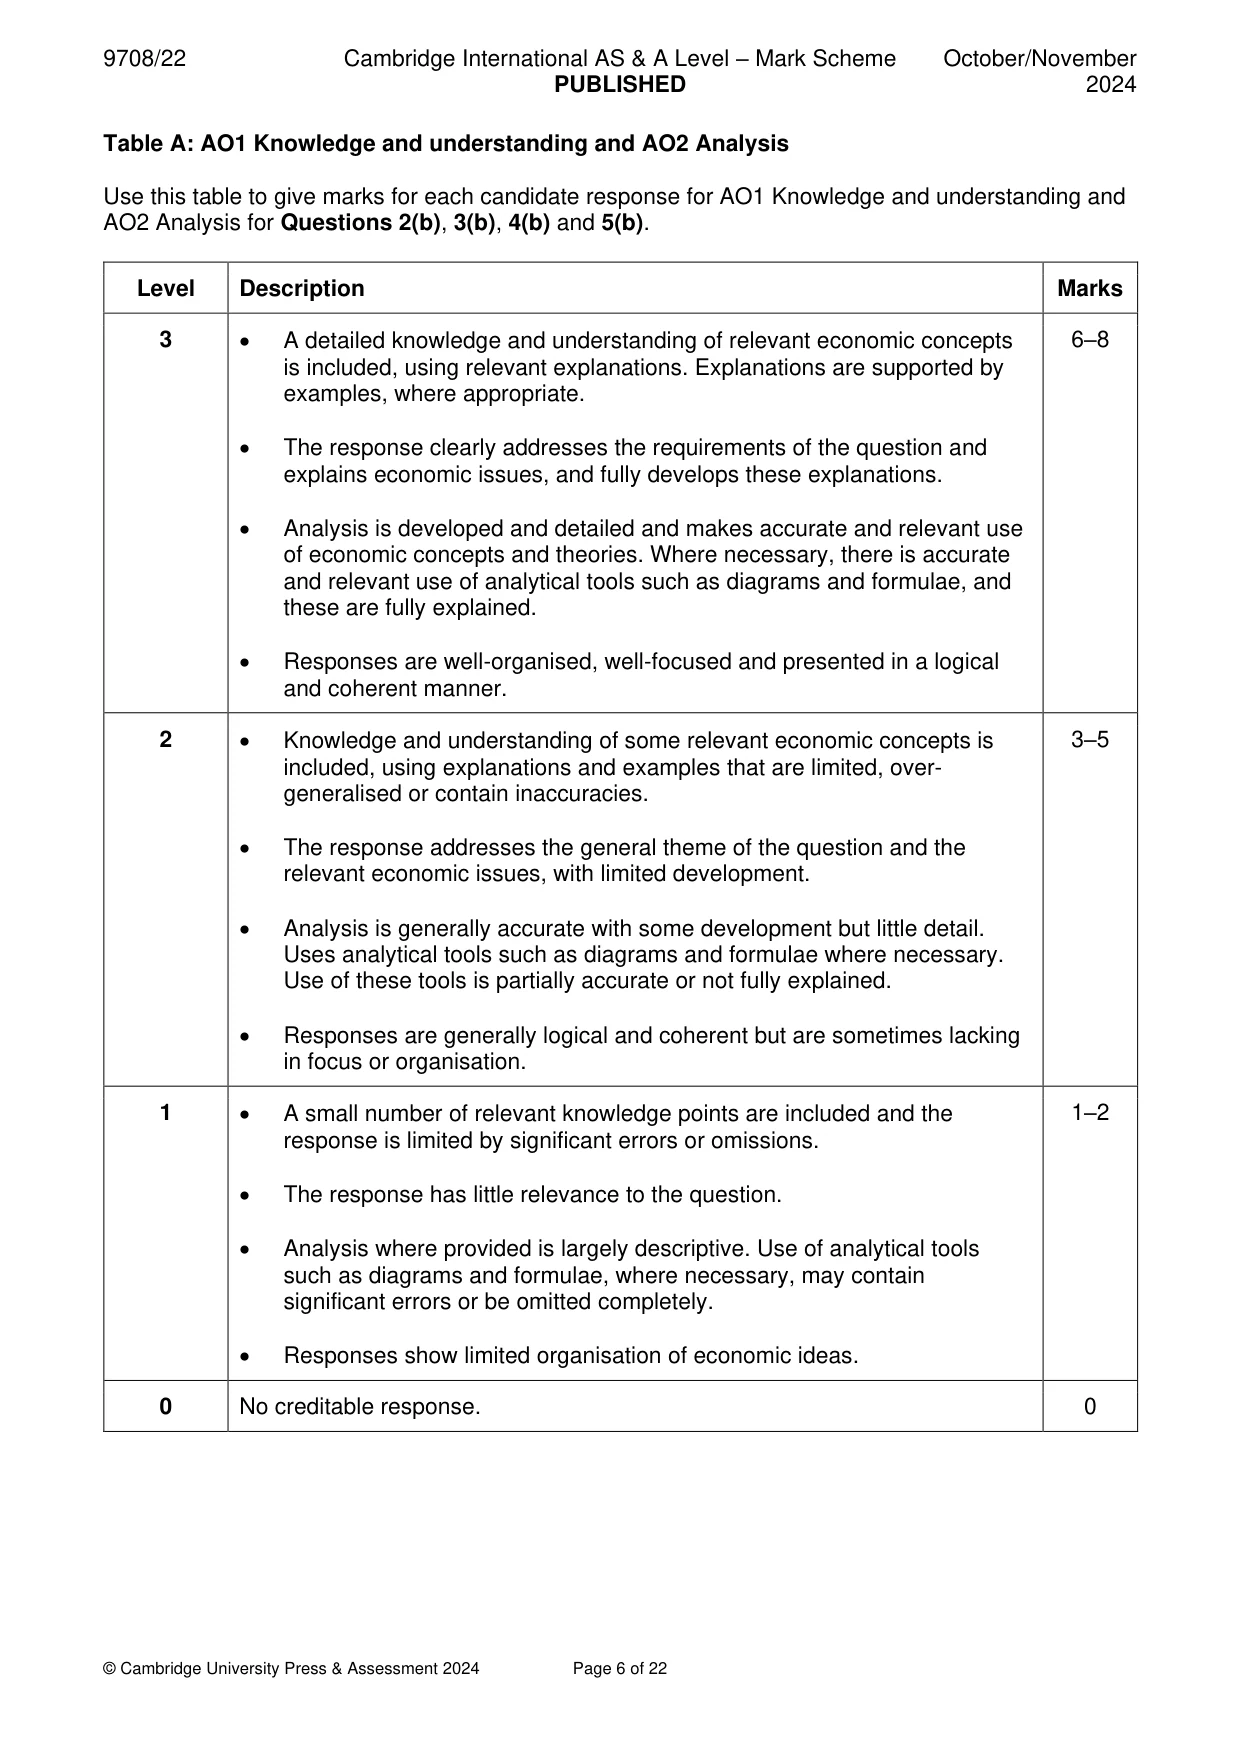
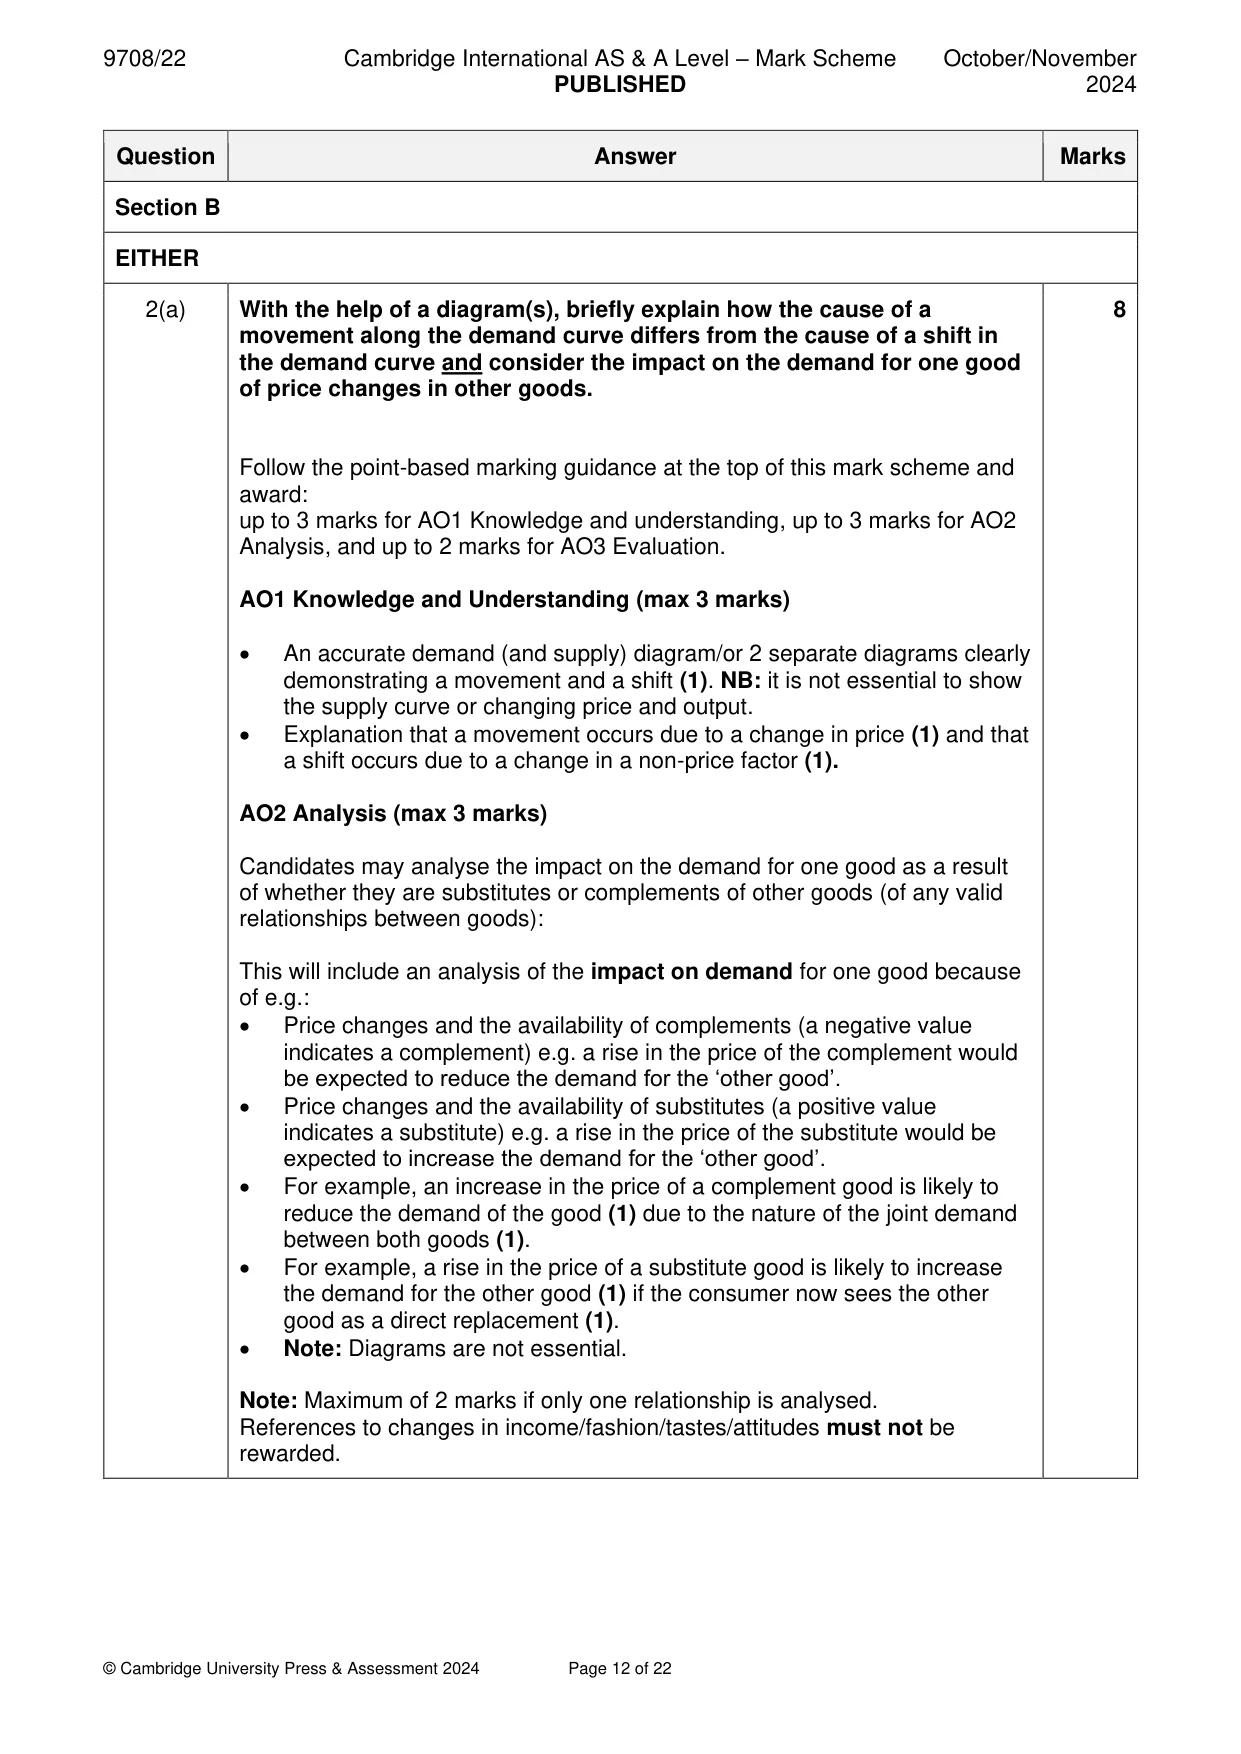
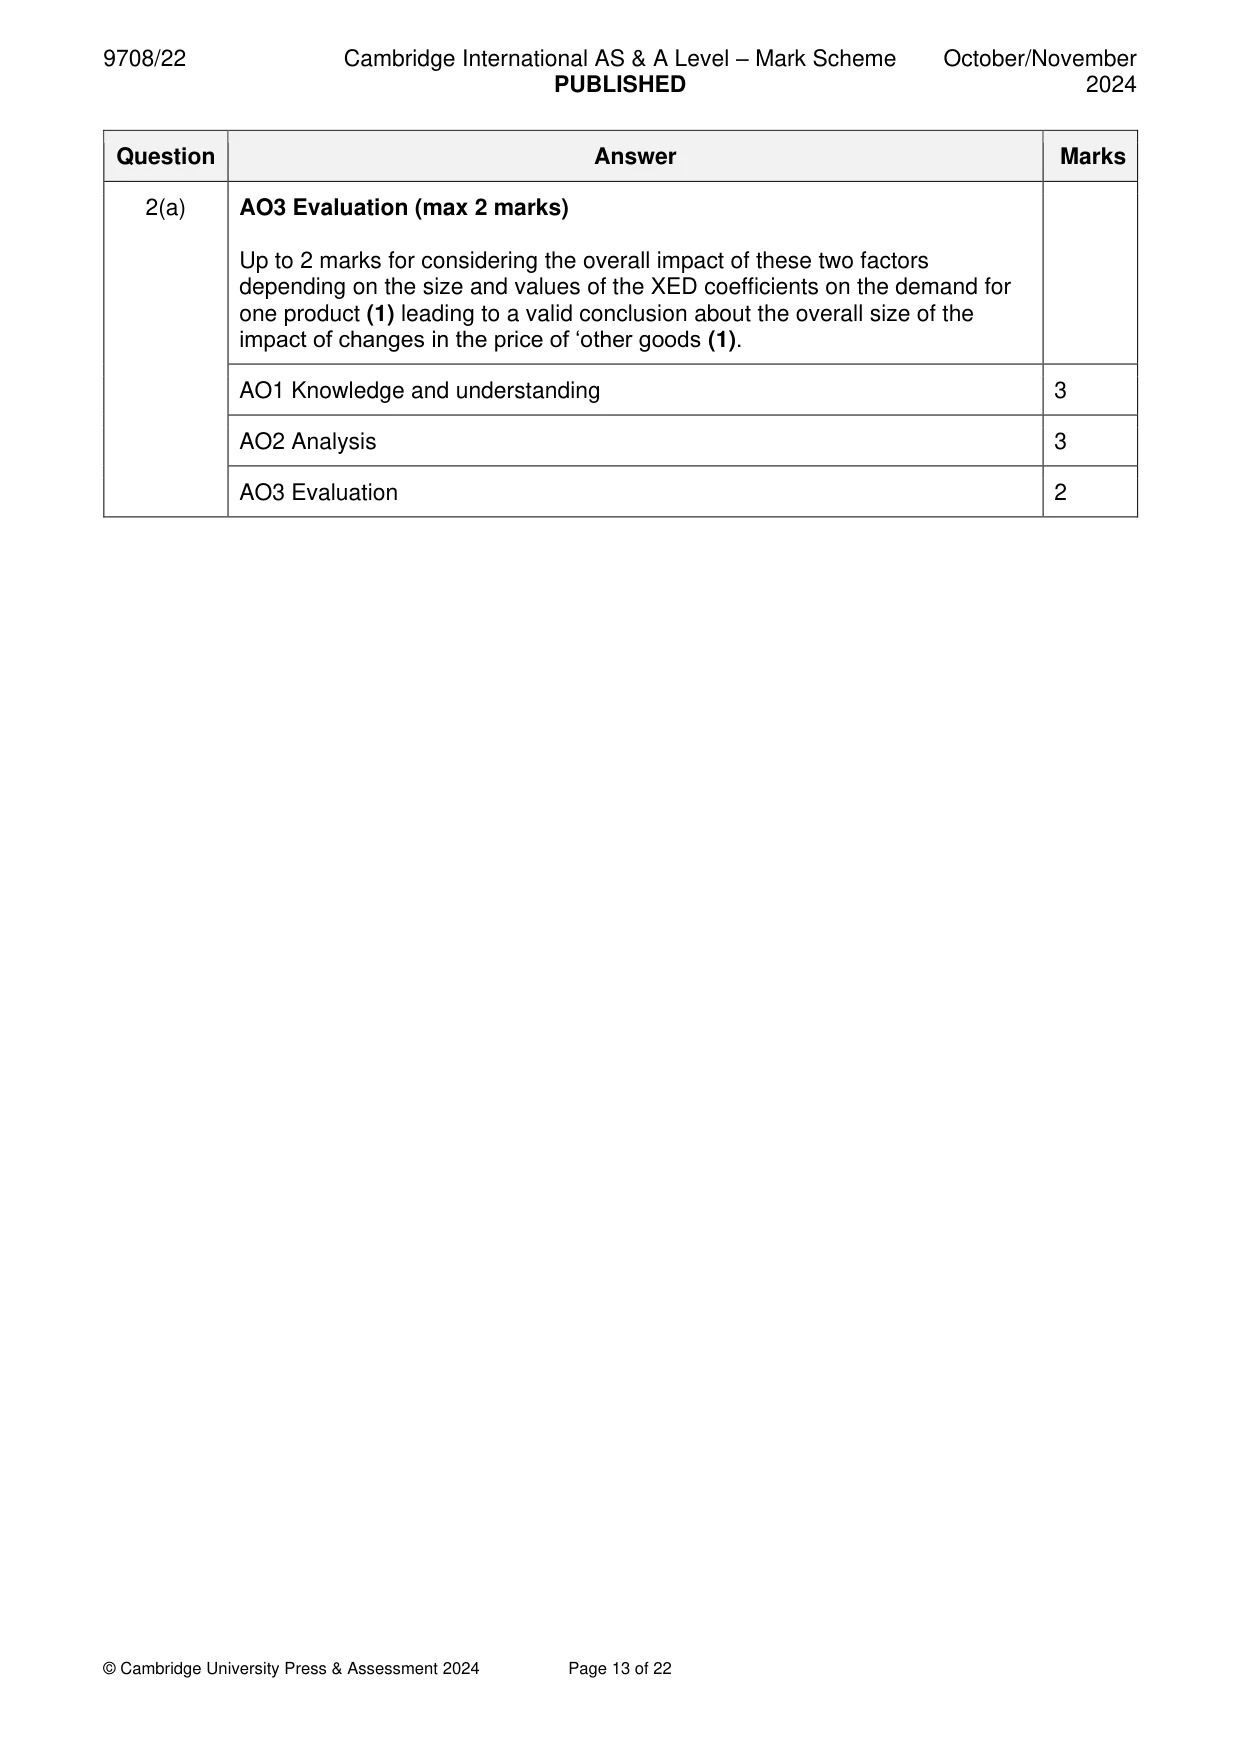
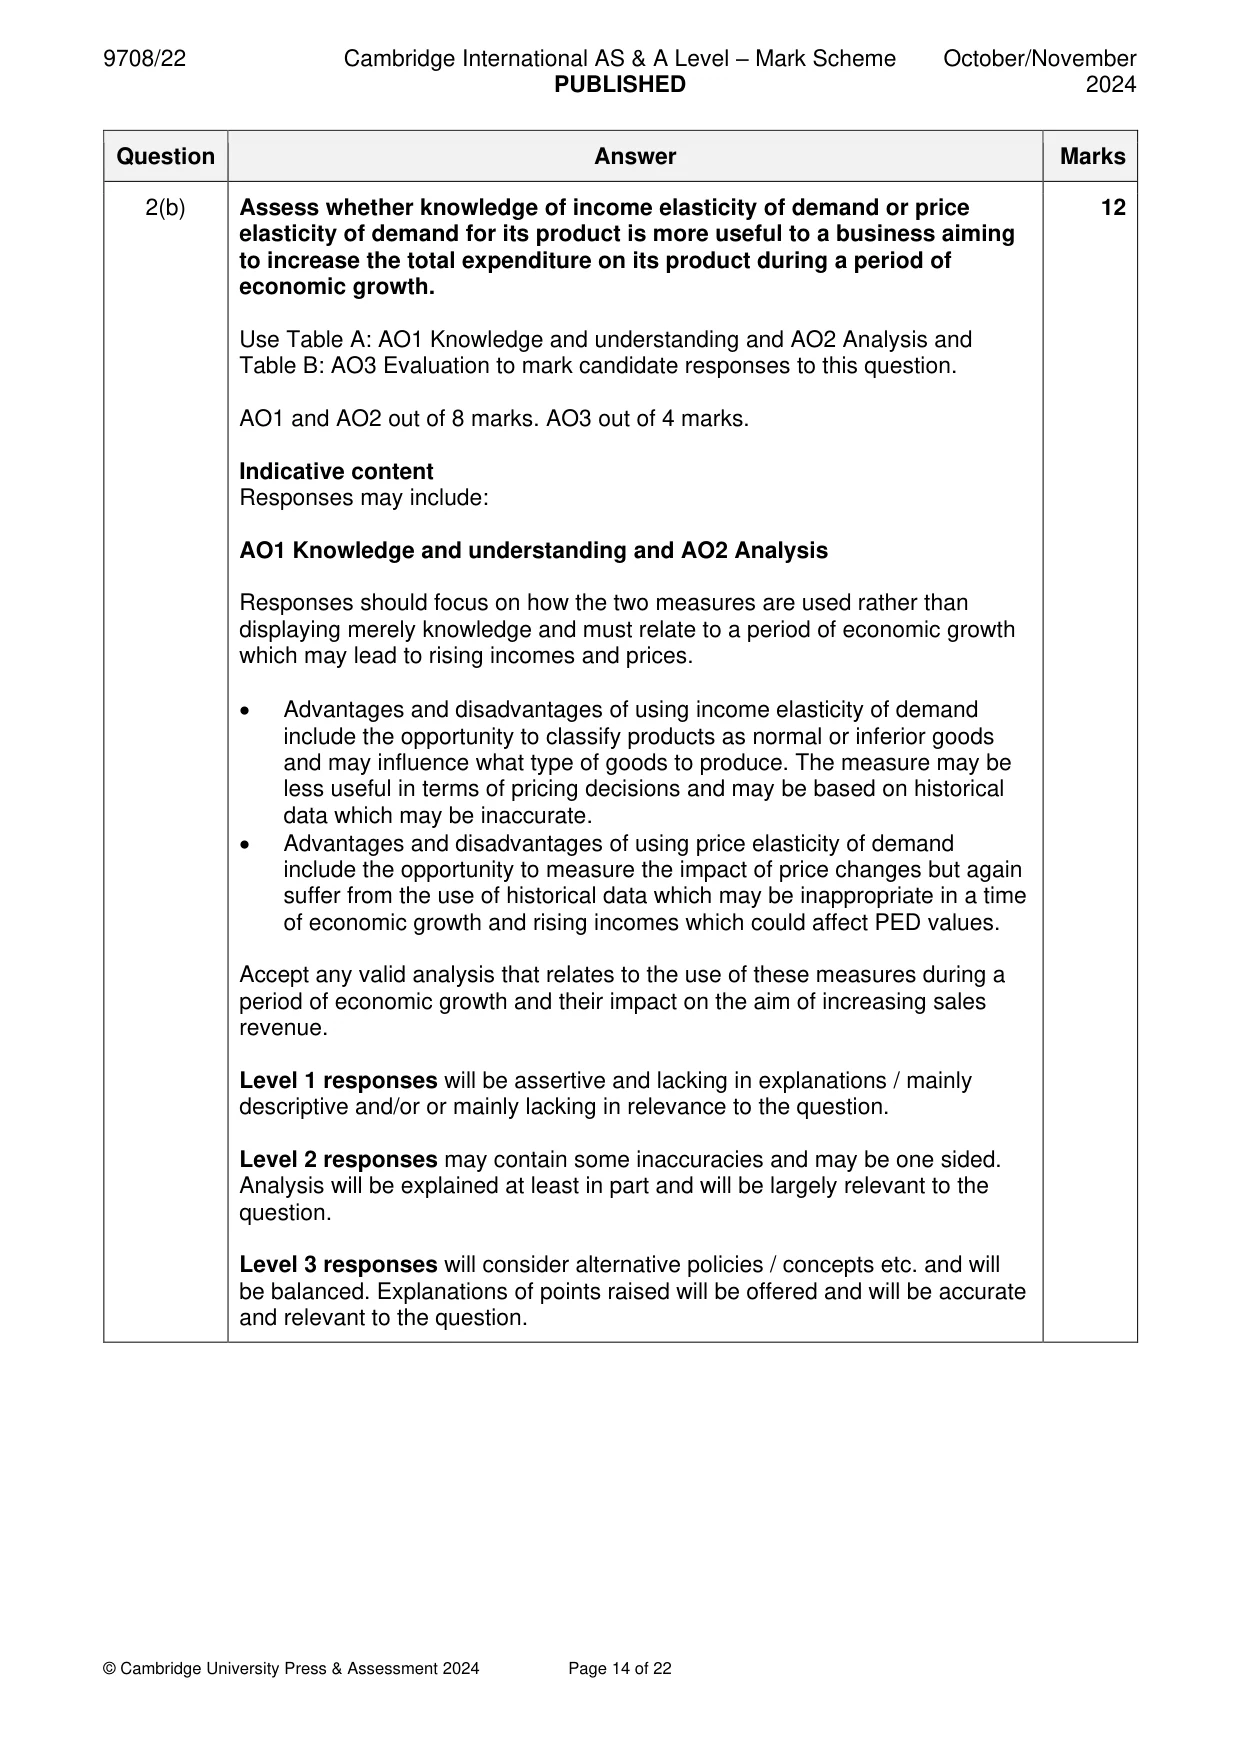
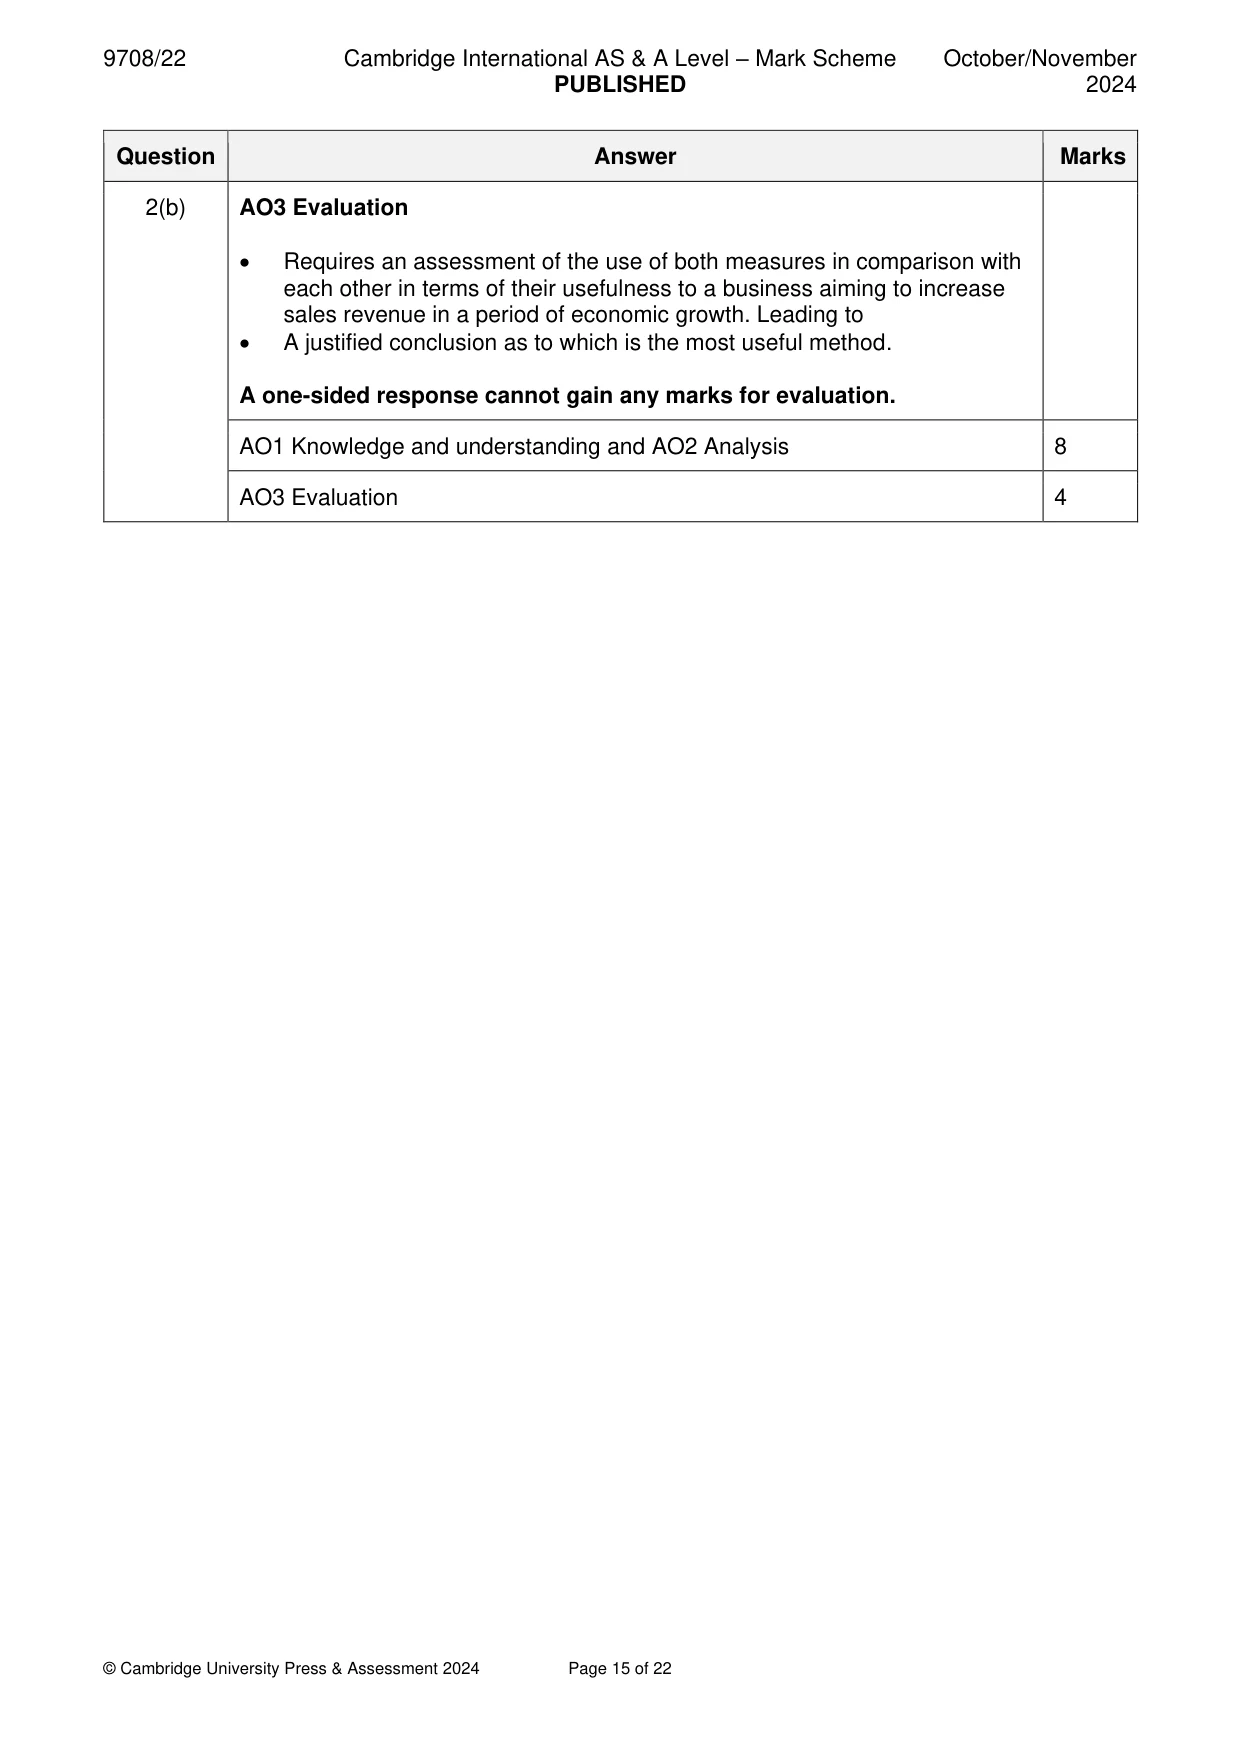
Mark scheme: 2(a) With the help of a diagram(s), briefly explain how the cause of a 8 movement along the demand curve differs from the cause of a shift in the demand curve and consider the impact on the demand for one good of price changes in other goods. Follow the point-based marking guidance at the top of this mark scheme and award: up to 3 marks for AO1 Knowledge and understanding, up to 3 marks for AO2 Analysis, and up to 2 marks for AO3 Evaluation. AO1 Knowledge and Understanding (max 3 marks) • An accurate demand (and supply) diagram/or 2 separate diagrams clearly demonstrating a movement and a shift (1). NB: it is not essential to show the supply curve or changing price and output. • Explanation that a movement occurs due to a change in price (1) and that a shift occurs due to a change in a non-price factor (1). AO2 Analysis (max 3 marks) Candidates may analyse the impact on the demand for one good as a result of whether they are substitutes or complements of other goods (of any valid relationships between goods): This will include an analysis of the impact on demand for one good because of e.g.: • Price changes and the availability of complements (a negative value indicates a complement) e.g. a rise in the price of the complement would be expected to reduce the demand for the ‘other good’. • Price changes and the availability of substitutes (a positive value indicates a substitute) e.g. a rise in the price of the substitute would be expected to increase the demand for the ‘other good’. • For example, an increase in the price of a complement good is likely to reduce the demand of the good (1) due to the nature of the joint demand between both goods (1). • For example, a rise in the price of a substitute good is likely to increase the demand for the other good (1) if the consumer now sees the other good as a direct replacement (1). • Note: Diagrams are not essential. Note: Maximum of 2 marks if only one relationship is analysed. References to changes in income/fashion/tastes/attitudes must not be rewarded. 2(a) AO3 Evaluation (max 2 marks) Up to 2 marks for considering the overall impact of these two factors depending on the size and values of the XED coefficients on the demand for one product (1) leading to a valid conclusion about the overall size of the impact of changes in the price of ‘other goods (1). AO1 Knowledge and understanding 3 AO2 Analysis 3 AO3 Evaluation 2 2(b) Assess whether knowledge of income elasticity of demand or price 12 elasticity of demand for its product is more useful to a business aiming to increase the total expenditure on its product during a period of economic growth. Use Table A: AO1 Knowledge and understanding and AO2 Analysis and Table B: AO3 Evaluation to mark candidate responses to this question. AO1 and AO2 out of 8 marks. AO3 out of 4 marks. Indicative content Responses may include: AO1 Knowledge and understanding and AO2 Analysis Responses should focus on how the two measures are used rather than displaying merely knowledge and must relate to a period of economic growth which may lead to rising incomes and prices. • Advantages and disadvantages of using income elasticity of demand include the opportunity to classify products as normal or inferior goods and may influence what type of goods to produce. The measure may be less useful in terms of pricing decisions and may be based on historical data which may be inaccurate. • Advantages and disadvantages of using price elasticity of demand include the opportunity to measure the impact of price changes but again suffer from the use of historical data which may be inappropriate in a time of economic growth and rising incomes which could affect PED values. Accept any valid analysis that relates to the use of these measures during a period of economic growth and their impact on the aim of increasing sales revenue. Level 1 responses will be assertive and lacking in explanations / mainly descriptive and/or or mainly lacking in relevance to the question. Level 2 responses may contain some inaccuracies and may be one sided. Analysis will be explained at least in part and will be largely relevant to the question. Level 3 responses will consider alternative policies / concepts etc. and will be balanced. Explanations of points raised will be offered and will be accurate and relevant to the question. 2(b) AO3 Evaluation • Requires an assessment of the use of both measures in comparison with each other in terms of their usefulness to a business aiming to increase sales revenue in a period of economic growth. Leading to • A justified conclusion as to which is the most useful method. A one-sided response cannot gain any marks for evaluation. AO1 Knowledge and understanding and AO2 Analysis 8 AO3 Evaluation 4
More questions on Price elasticity, income elasticity and cross elasticity of demand
Q3 · With the help of a production possibility curve (PPC) diagram(s), explain the difference…
3 (a) With the help of a production possibility curve (PPC) diagram(s), explain the difference between constant and increasing opportunity costs and consider how choices in deciding which type of goods to produce in the short run may influence future economic growth. [8] (b) Assess whether a market economy is always the best economic system to effectively answer the three basic questions of resource allocation. [12] Section C Answer one question. EITHER
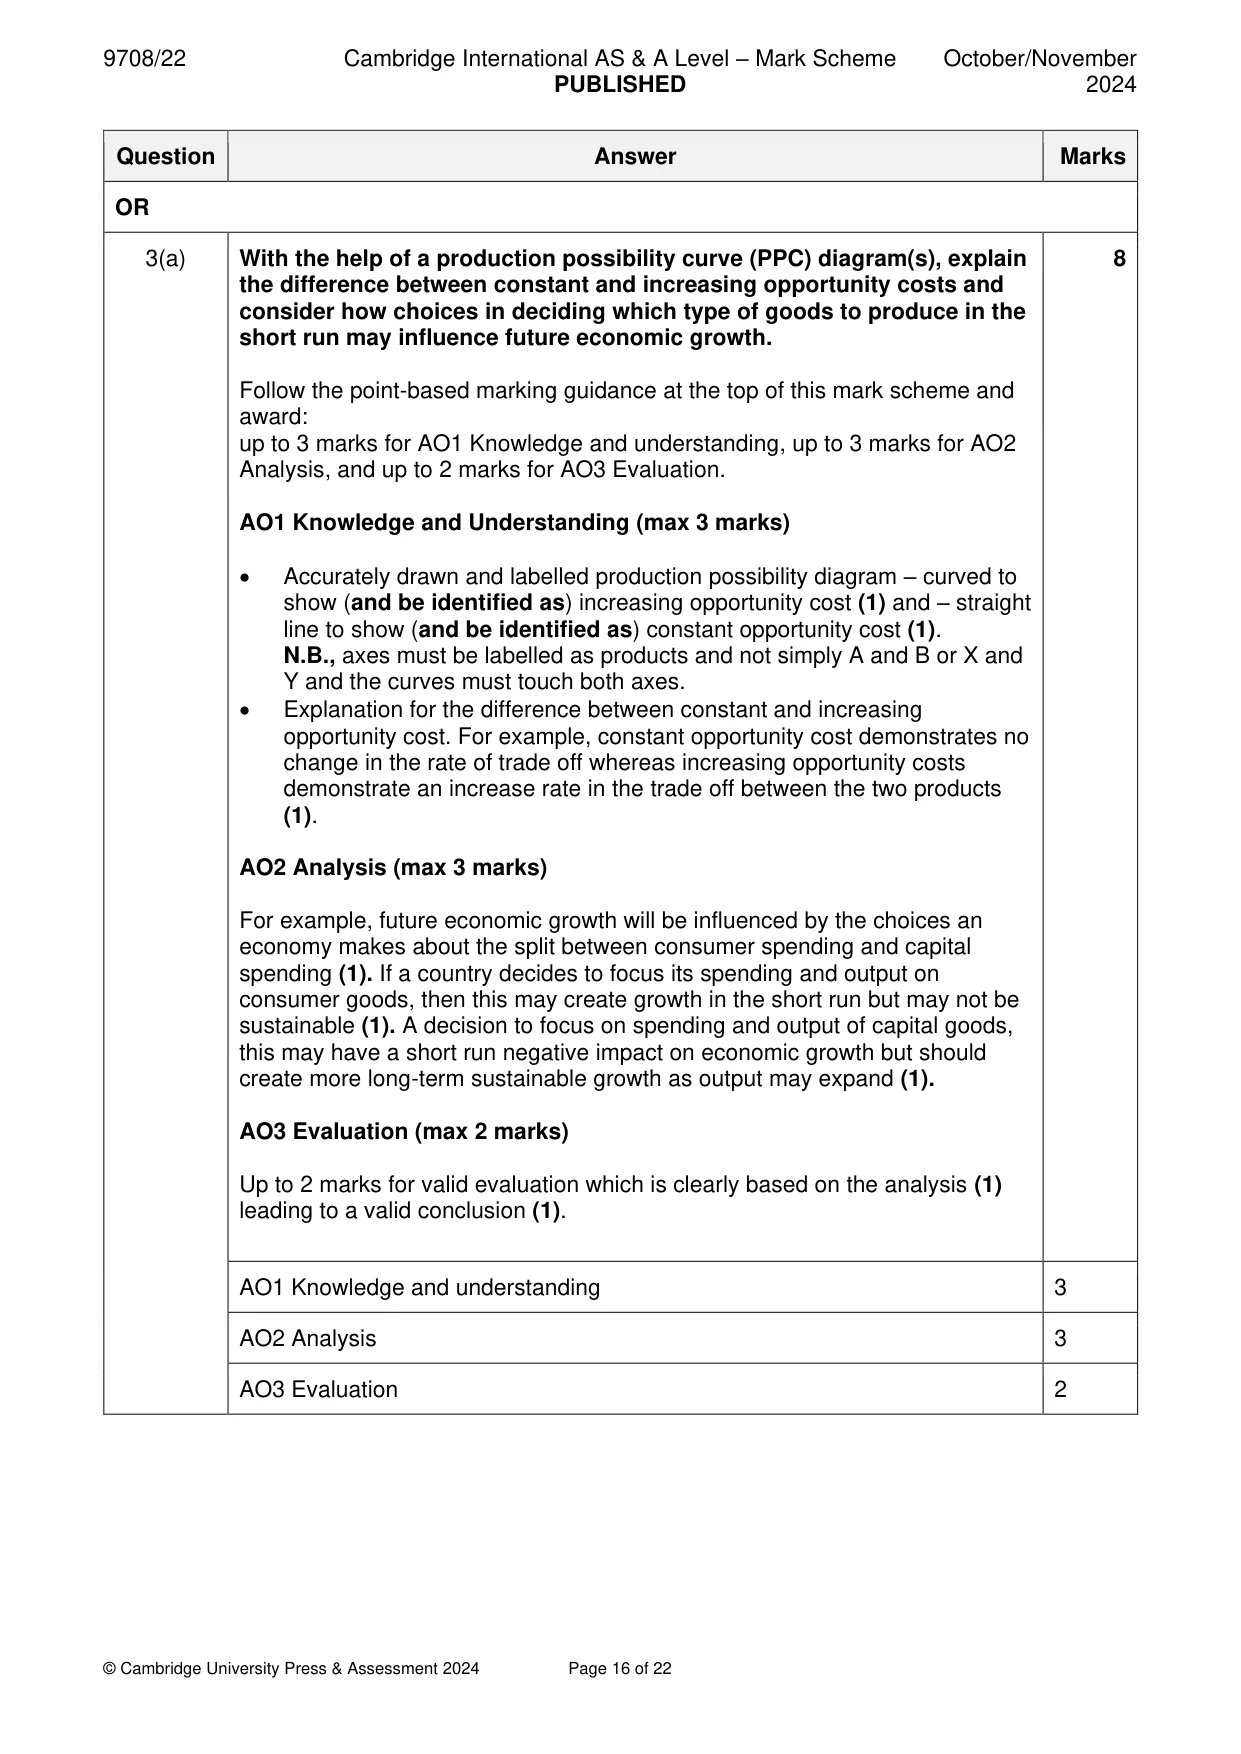
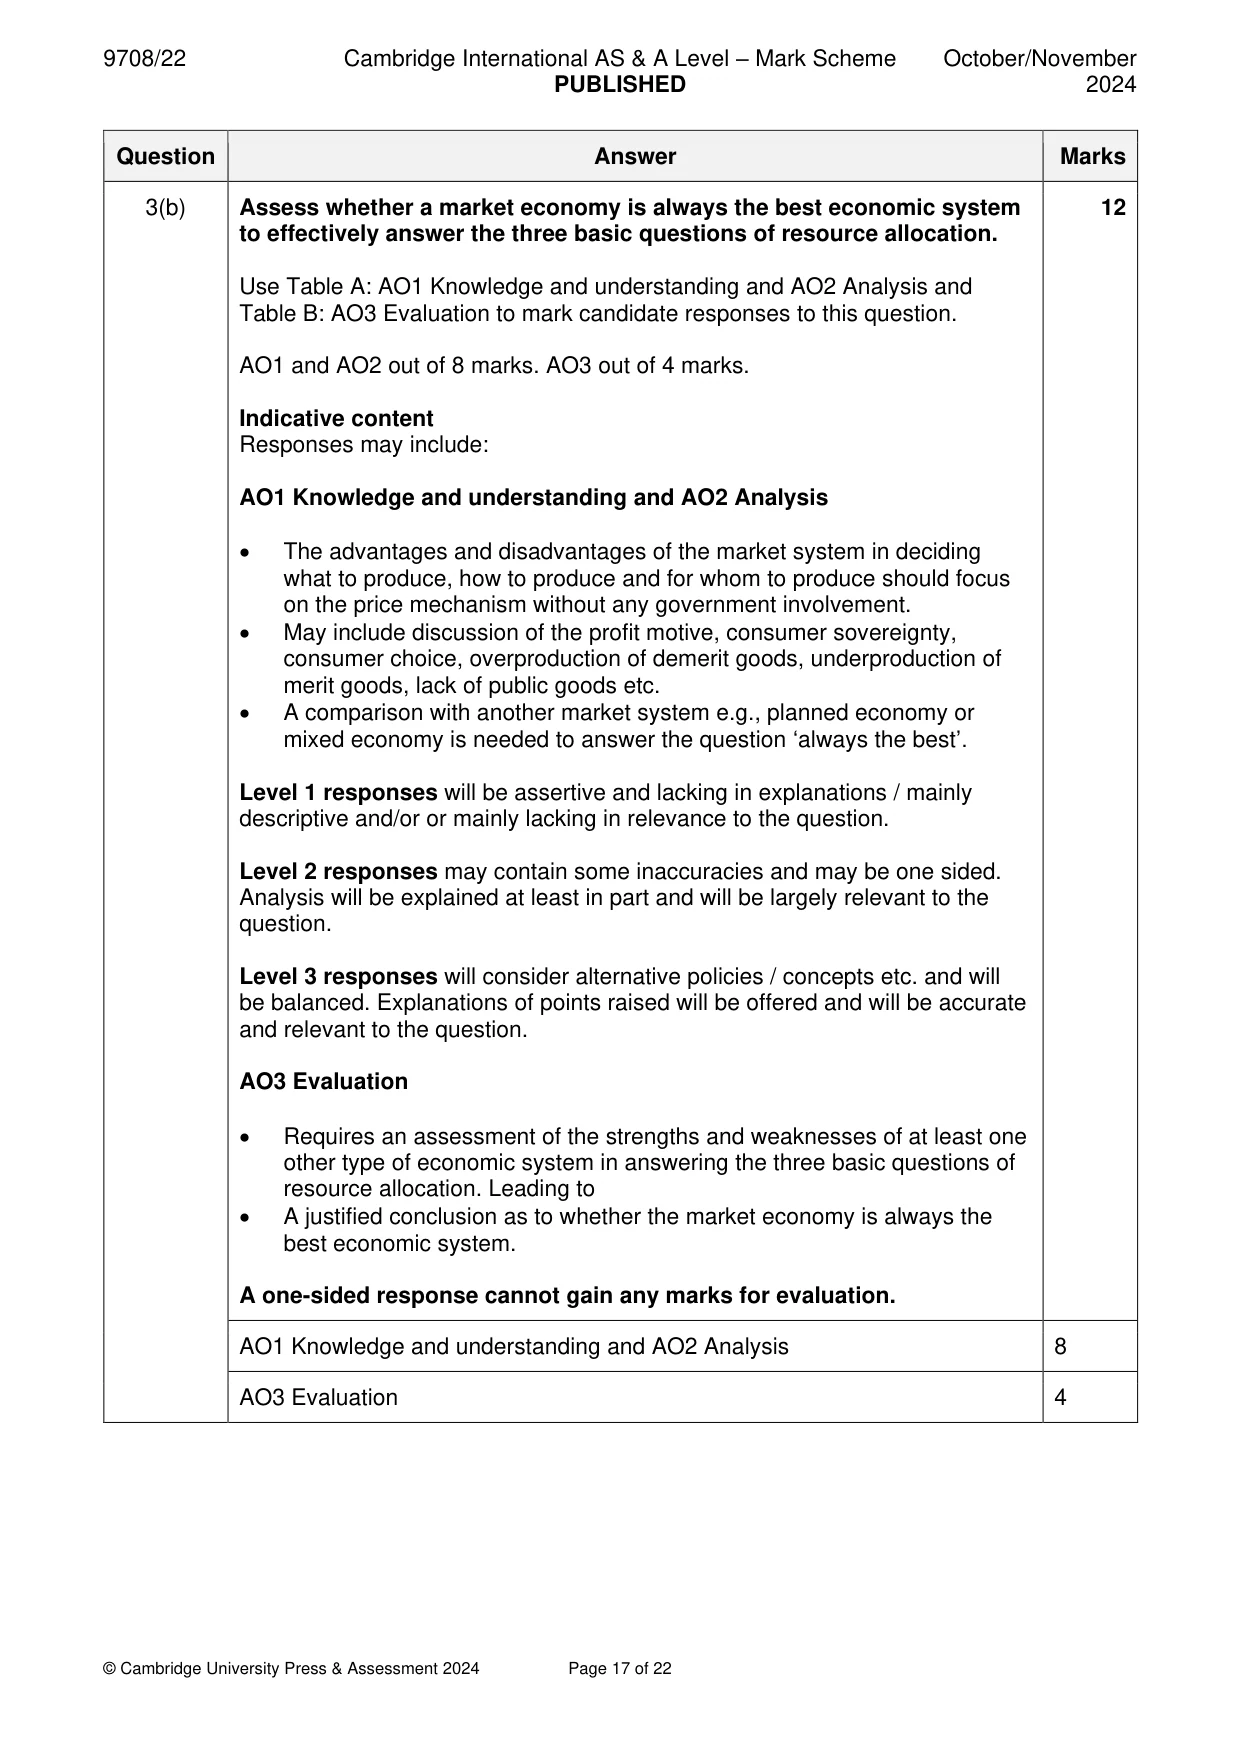
Mark scheme: 3(a) With the help of a production possibility curve (PPC) diagram(s), explain 8 the difference between constant and increasing opportunity costs and consider how choices in deciding which type of goods to produce in the short run may influence future economic growth. Follow the point-based marking guidance at the top of this mark scheme and award: up to 3 marks for AO1 Knowledge and understanding, up to 3 marks for AO2 Analysis, and up to 2 marks for AO3 Evaluation. AO1 Knowledge and Understanding (max 3 marks) • Accurately drawn and labelled production possibility diagram – curved to show (and be identified as) increasing opportunity cost (1) and – straight line to show (and be identified as) constant opportunity cost (1). N.B., axes must be labelled as products and not simply A and B or X and Y and the curves must touch both axes. • Explanation for the difference between constant and increasing opportunity cost. For example, constant opportunity cost demonstrates no change in the rate of trade off whereas increasing opportunity costs demonstrate an increase rate in the trade off between the two products (1). AO2 Analysis (max 3 marks) For example, future economic growth will be influenced by the choices an economy makes about the split between consumer spending and capital spending (1). If a country decides to focus its spending and output on consumer goods, then this may create growth in the short run but may not be sustainable (1). A decision to focus on spending and output of capital goods, this may have a short run negative impact on economic growth but should create more long-term sustainable growth as output may expand (1). AO3 Evaluation (max 2 marks) Up to 2 marks for valid evaluation which is clearly based on the analysis (1) leading to a valid conclusion (1). AO1 Knowledge and understanding 3 AO2 Analysis 3 AO3 Evaluation 2 3(b) Assess whether a market economy is always the best economic system 12 to effectively answer the three basic questions of resource allocation. Use Table A: AO1 Knowledge and understanding and AO2 Analysis and Table B: AO3 Evaluation to mark candidate responses to this question. AO1 and AO2 out of 8 marks. AO3 out of 4 marks. Indicative content Responses may include: AO1 Knowledge and understanding and AO2 Analysis • The advantages and disadvantages of the market system in deciding what to produce, how to produce and for whom to produce should focus on the price mechanism without any government involvement. • May include discussion of the profit motive, consumer sovereignty, consumer choice, overproduction of demerit goods, underproduction of merit goods, lack of public goods etc. • A comparison with another market system e.g., planned economy or mixed economy is needed to answer the question ‘always the best’. Level 1 responses will be assertive and lacking in explanations / mainly descriptive and/or or mainly lacking in relevance to the question. Level 2 responses may contain some inaccuracies and may be one sided. Analysis will be explained at least in part and will be largely relevant to the question. Level 3 responses will consider alternative policies / concepts etc. and will be balanced. Explanations of points raised will be offered and will be accurate and relevant to the question. AO3 Evaluation • Requires an assessment of the strengths and weaknesses of at least one other type of economic system in answering the three basic questions of resource allocation. Leading to • A justified conclusion as to whether the market economy is always the best economic system. A one-sided response cannot gain any marks for evaluation. AO1 Knowledge and understanding and AO2 Analysis 8 AO3 Evaluation 4
More questions on Resource allocation in different economic systems
Q4 · Explain two methods of measuring unemployment and consider the extent of the possible…
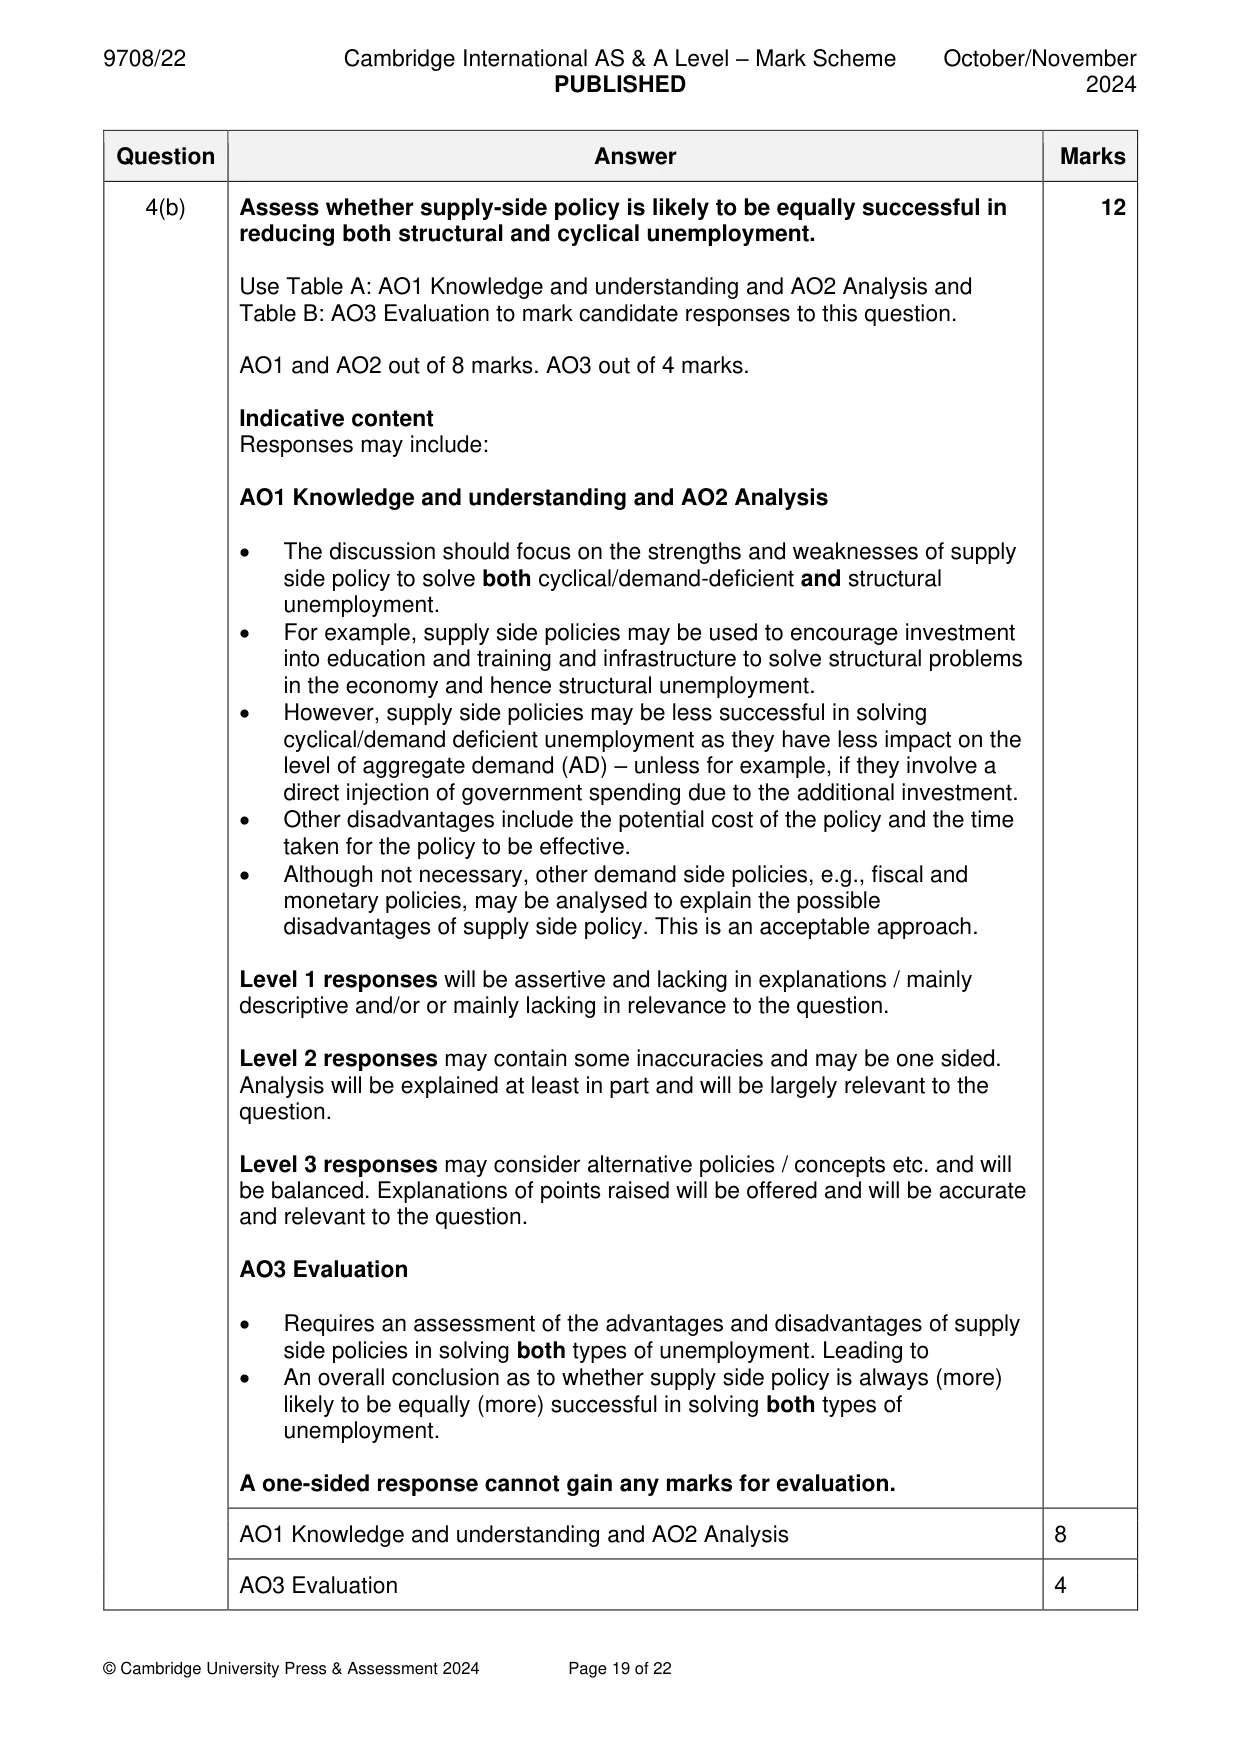
4 (a) Explain two methods of measuring unemployment and consider the extent of the possible difficulties in obtaining an accurate measurement of unemployment. [8] (b) Assess whether supply-side policy is likely to be equally successful in reducing both structural and cyclical unemployment. [12] OR
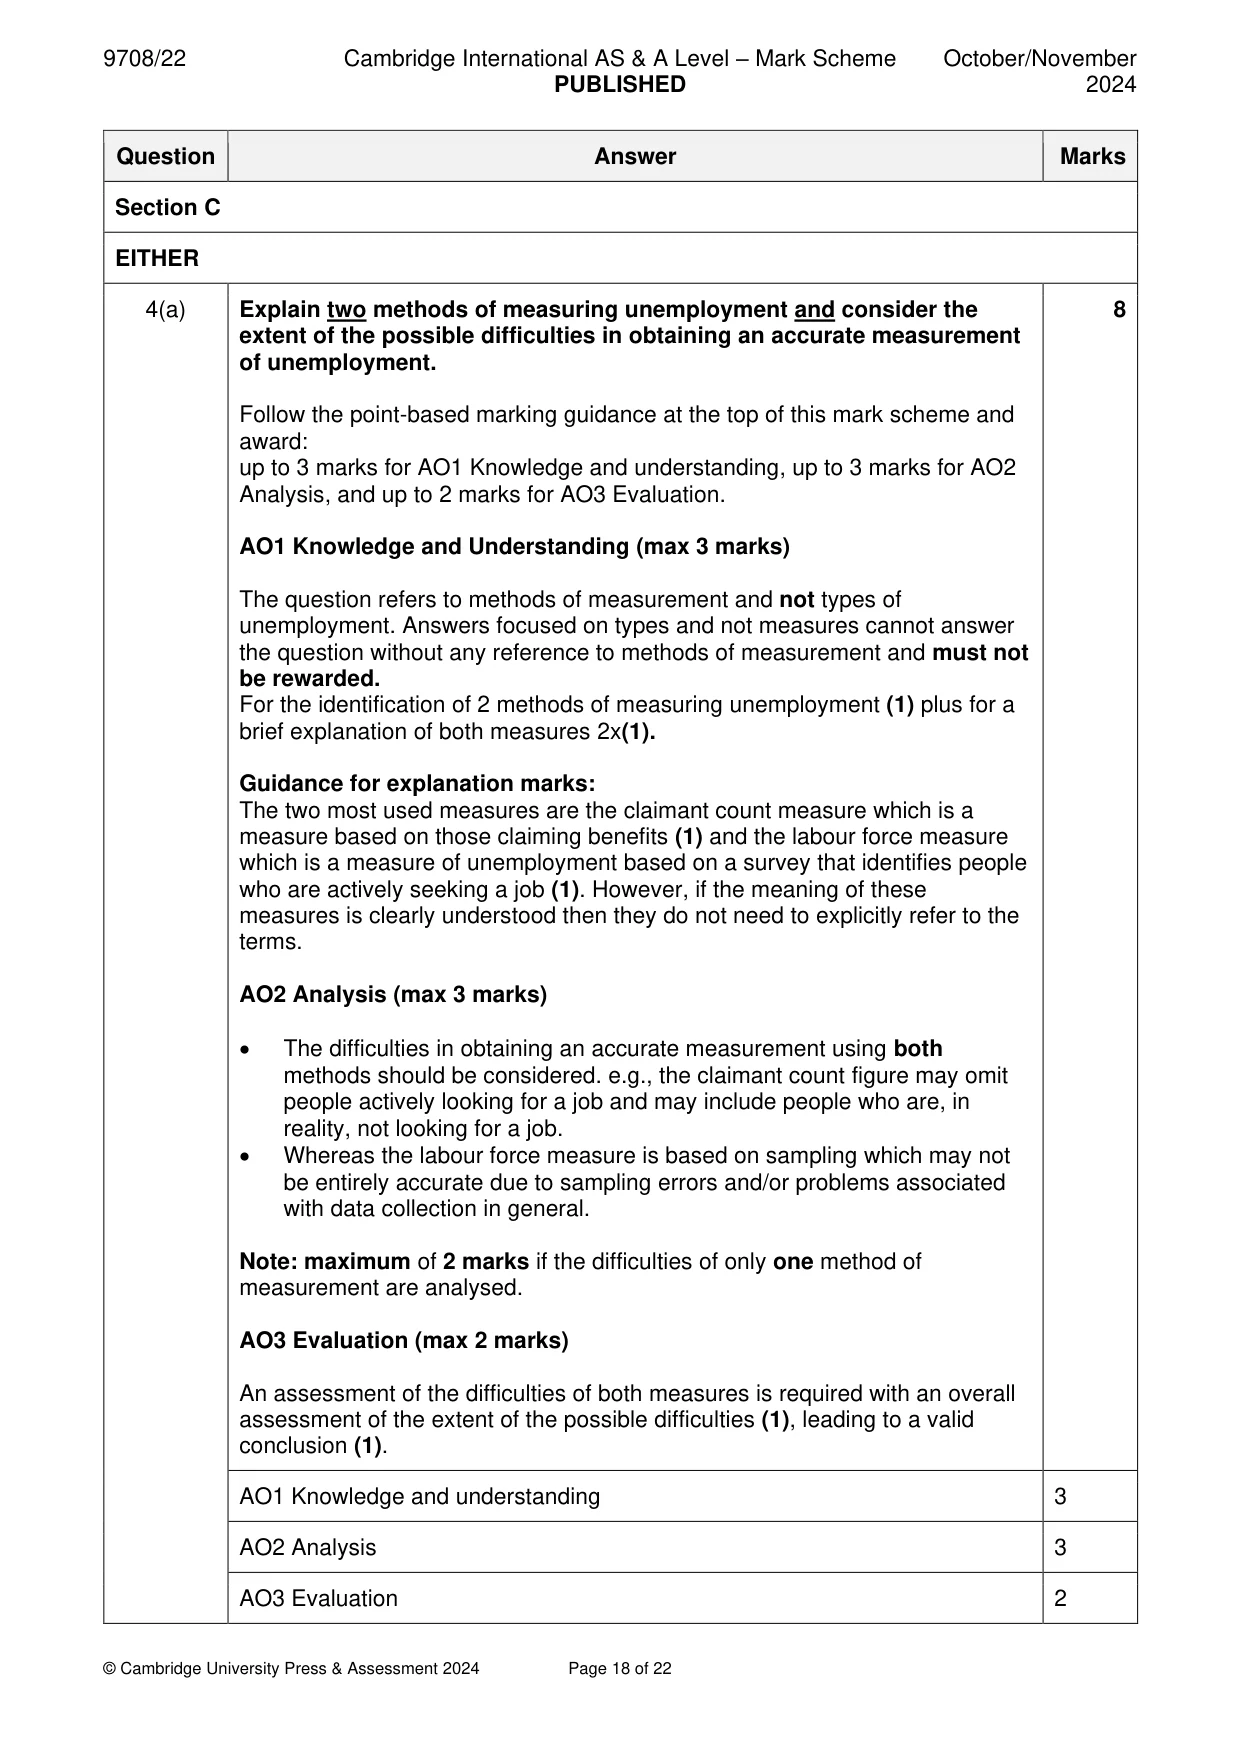
Mark scheme: 4(a) Explain two methods of measuring unemployment and consider the 8 extent of the possible difficulties in obtaining an accurate measurement of unemployment. Follow the point-based marking guidance at the top of this mark scheme and award: up to 3 marks for AO1 Knowledge and understanding, up to 3 marks for AO2 Analysis, and up to 2 marks for AO3 Evaluation. AO1 Knowledge and Understanding (max 3 marks) The question refers to methods of measurement and not types of unemployment. Answers focused on types and not measures cannot answer the question without any reference to methods of measurement and must not be rewarded. For the identification of 2 methods of measuring unemployment (1) plus for a brief explanation of both measures 2x(1). Guidance for explanation marks: The two most used measures are the claimant count measure which is a measure based on those claiming benefits (1) and the labour force measure which is a measure of unemployment based on a survey that identifies people who are actively seeking a job (1). However, if the meaning of these measures is clearly understood then they do not need to explicitly refer to the terms. AO2 Analysis (max 3 marks) • The difficulties in obtaining an accurate measurement using both methods should be considered. e.g., the claimant count figure may omit people actively looking for a job and may include people who are, in reality, not looking for a job. • Whereas the labour force measure is based on sampling which may not be entirely accurate due to sampling errors and/or problems associated with data collection in general. Note: maximum of 2 marks if the difficulties of only one method of measurement are analysed. AO3 Evaluation (max 2 marks) An assessment of the difficulties of both measures is required with an overall assessment of the extent of the possible difficulties (1), leading to a valid conclusion (1). AO1 Knowledge and understanding 3 AO2 Analysis 3 AO3 Evaluation 2 4(b) Assess whether supply-side policy is likely to be equally successful in 12 reducing both structural and cyclical unemployment. Use Table A: AO1 Knowledge and understanding and AO2 Analysis and Table B: AO3 Evaluation to mark candidate responses to this question. AO1 and AO2 out of 8 marks. AO3 out of 4 marks. Indicative content Responses may include: AO1 Knowledge and understanding and AO2 Analysis • The discussion should focus on the strengths and weaknesses of supply side policy to solve both cyclical/demand-deficient and structural unemployment. • For example, supply side policies may be used to encourage investment into education and training and infrastructure to solve structural problems in the economy and hence structural unemployment. • However, supply side policies may be less successful in solving cyclical/demand deficient unemployment as they have less impact on the level of aggregate demand (AD) – unless for example, if they involve a direct injection of government spending due to the additional investment. • Other disadvantages include the potential cost of the policy and the time taken for the policy to be effective. • Although not necessary, other demand side policies, e.g., fiscal and monetary policies, may be analysed to explain the possible disadvantages of supply side policy. This is an acceptable approach. Level 1 responses will be assertive and lacking in explanations / mainly descriptive and/or or mainly lacking in relevance to the question. Level 2 responses may contain some inaccuracies and may be one sided. Analysis will be explained at least in part and will be largely relevant to the question. Level 3 responses may consider alternative policies / concepts etc. and will be balanced. Explanations of points raised will be offered and will be accurate and relevant to the question. AO3 Evaluation • Requires an assessment of the advantages and disadvantages of supply side policies in solving both types of unemployment. Leading to • An overall conclusion as to whether supply side policy is always (more) likely to be equally (more) successful in solving both types of unemployment. A one-sided response cannot gain any marks for evaluation. AO1 Knowledge and understanding and AO2 Analysis 8 AO3 Evaluation 4
Q5 · With the help of examples, explain the difference between the marginal rate of taxation…
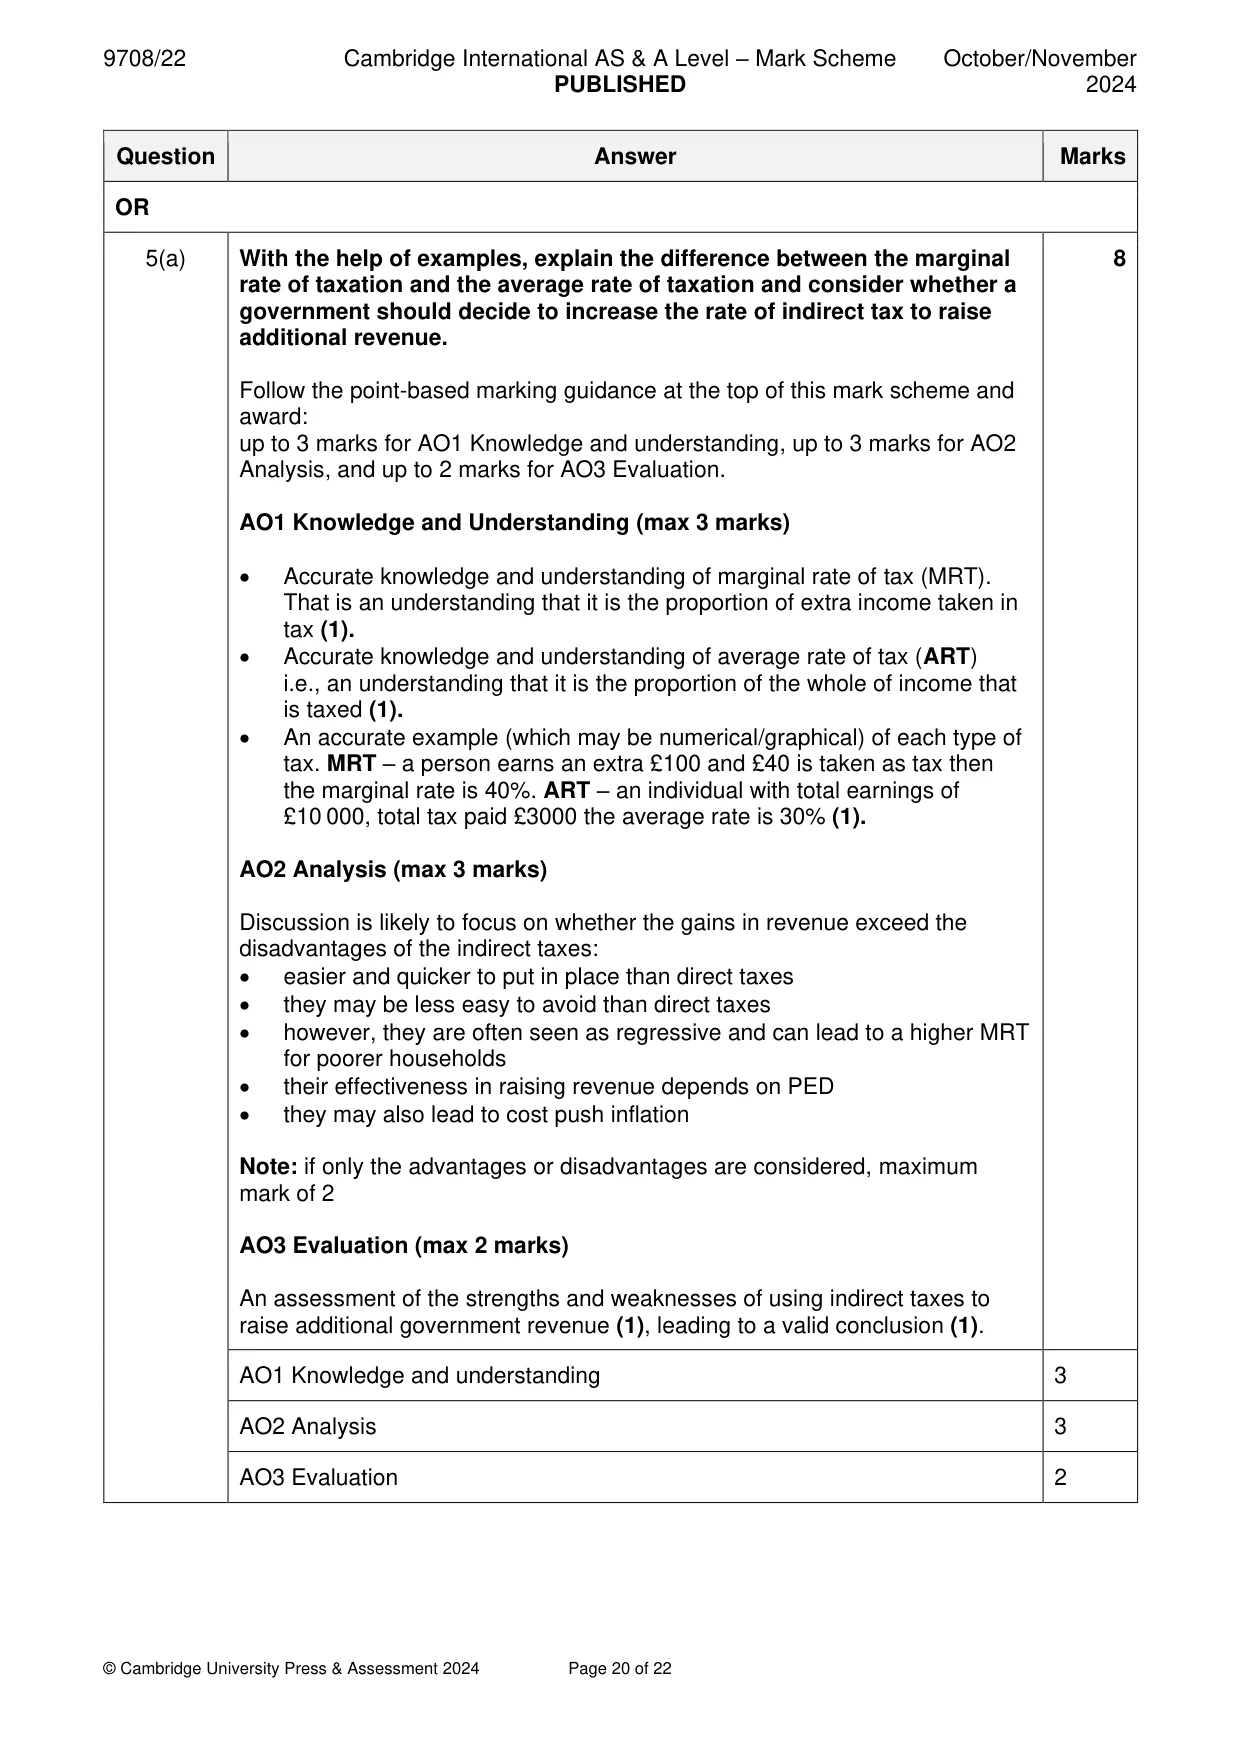
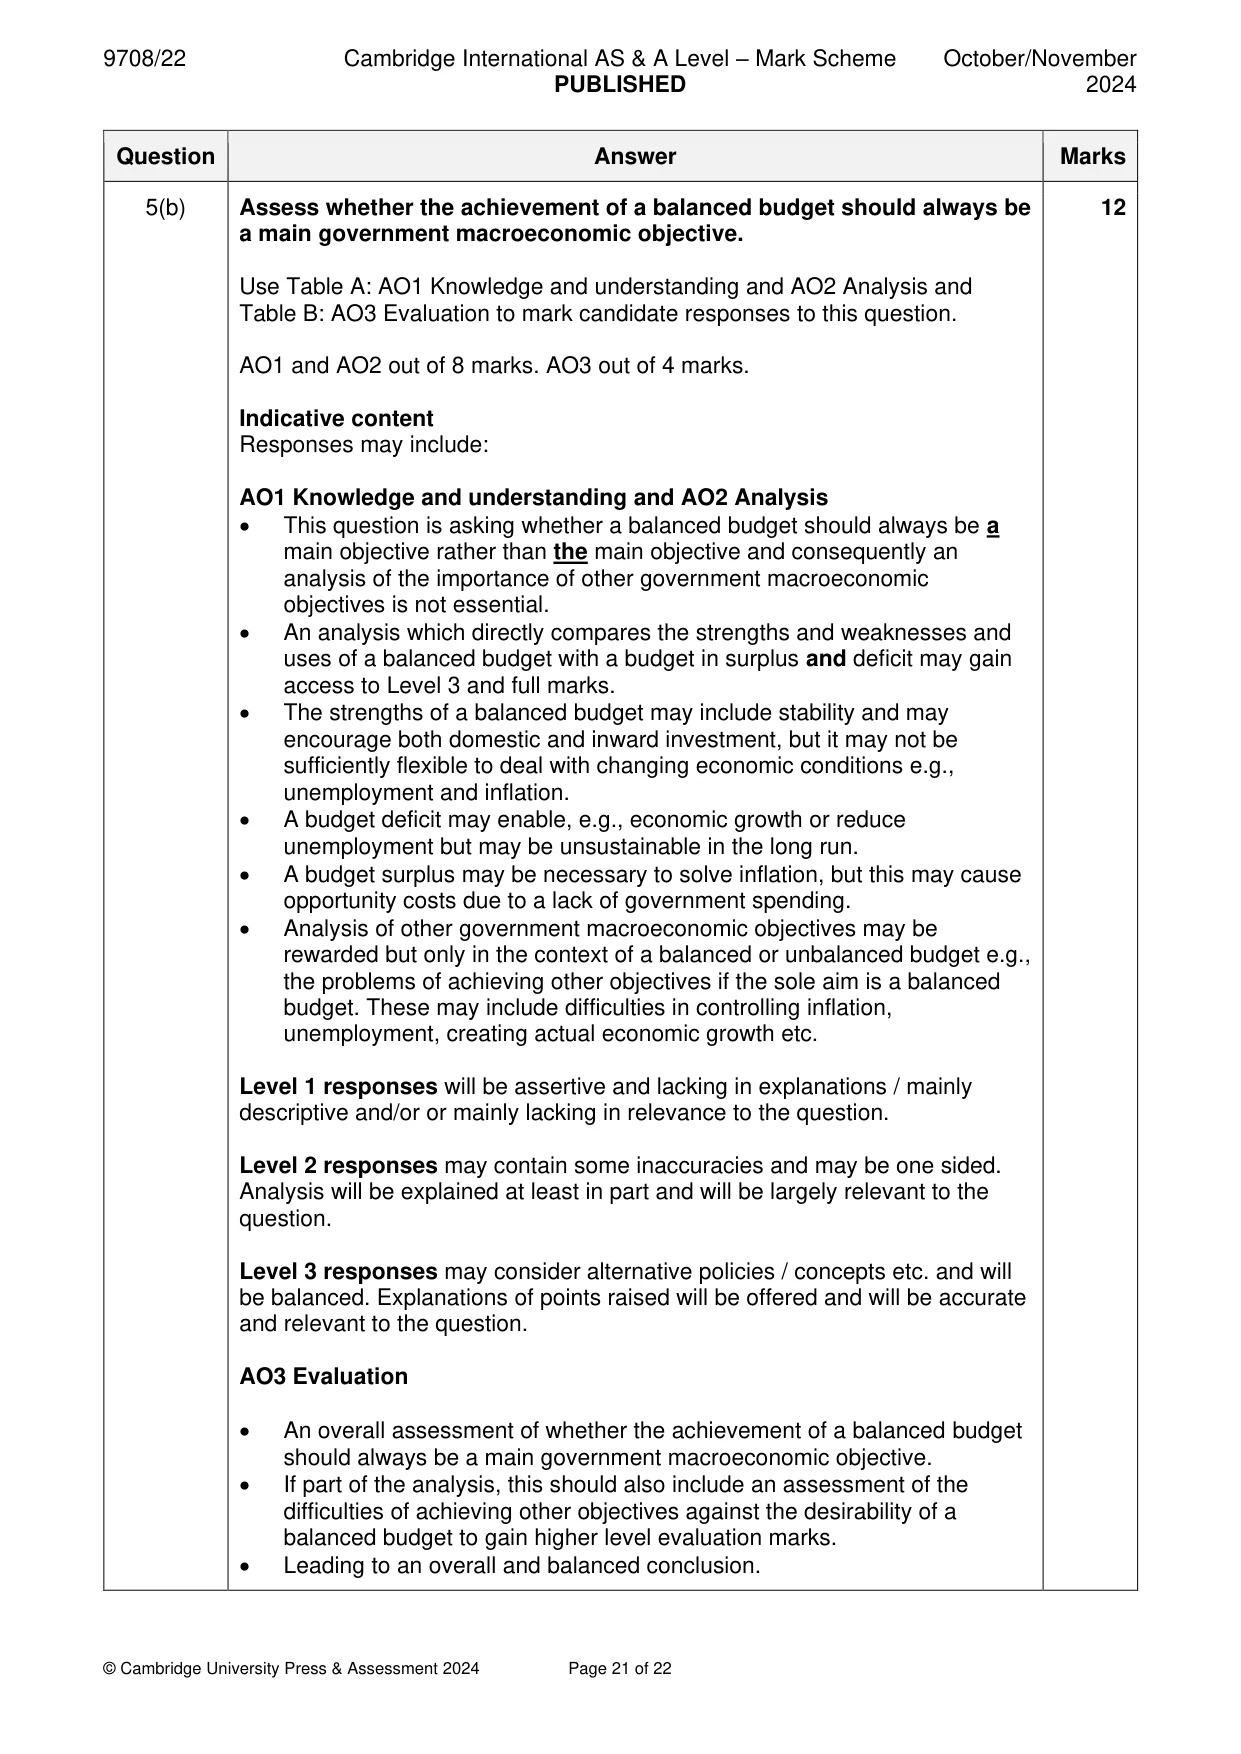
5 (a) With the help of examples, explain the difference between the marginal rate of taxation and the average rate of taxation and consider whether a government should decide to increase the rate of indirect tax to raise additional revenue. [8] (b) Assess whether the achievement of a balanced budget should always be a main government macroeconomic objective. [12]
Mark scheme: 5(a) With the help of examples, explain the difference between the marginal 8 rate of taxation and the average rate of taxation and consider whether a government should decide to increase the rate of indirect tax to raise additional revenue. Follow the point-based marking guidance at the top of this mark scheme and award: up to 3 marks for AO1 Knowledge and understanding, up to 3 marks for AO2 Analysis, and up to 2 marks for AO3 Evaluation. AO1 Knowledge and Understanding (max 3 marks) • Accurate knowledge and understanding of marginal rate of tax (MRT). That is an understanding that it is the proportion of extra income taken in tax (1). • Accurate knowledge and understanding of average rate of tax (ART) i.e., an understanding that it is the proportion of the whole of income that is taxed (1). • An accurate example (which may be numerical/graphical) of each type of tax. MRT – a person earns an extra £100 and £40 is taken as tax then the marginal rate is 40%. ART – an individual with total earnings of £10 000, total tax paid £3000 the average rate is 30% (1). AO2 Analysis (max 3 marks) Discussion is likely to focus on whether the gains in revenue exceed the disadvantages of the indirect taxes: • easier and quicker to put in place than direct taxes • they may be less easy to avoid than direct taxes • however, they are often seen as regressive and can lead to a higher MRT for poorer households • their effectiveness in raising revenue depends on PED • they may also lead to cost push inflation Note: if only the advantages or disadvantages are considered, maximum mark of 2 AO3 Evaluation (max 2 marks) An assessment of the strengths and weaknesses of using indirect taxes to raise additional government revenue (1), leading to a valid conclusion (1). AO1 Knowledge and understanding 3 AO2 Analysis 3 AO3 Evaluation 2 5(b) Assess whether the achievement of a balanced budget should always be 12 a main government macroeconomic objective. Use Table A: AO1 Knowledge and understanding and AO2 Analysis and Table B: AO3 Evaluation to mark candidate responses to this question. AO1 and AO2 out of 8 marks. AO3 out of 4 marks. Indicative content Responses may include: AO1 Knowledge and understanding and AO2 Analysis • This question is asking whether a balanced budget should always be a main objective rather than the main objective and consequently an analysis of the importance of other government macroeconomic objectives is not essential. • An analysis which directly compares the strengths and weaknesses and uses of a balanced budget with a budget in surplus and deficit may gain access to Level 3 and full marks. • The strengths of a balanced budget may include stability and may encourage both domestic and inward investment, but it may not be sufficiently flexible to deal with changing economic conditions e.g., unemployment and inflation. • A budget deficit may enable, e.g., economic growth or reduce unemployment but may be unsustainable in the long run. • A budget surplus may be necessary to solve inflation, but this may cause opportunity costs due to a lack of government spending. • Analysis of other government macroeconomic objectives may be rewarded but only in the context of a balanced or unbalanced budget e.g., the problems of achieving other objectives if the sole aim is a balanced budget. These may include difficulties in controlling inflation, unemployment, creating actual economic growth etc. Level 1 responses will be assertive and lacking in explanations / mainly descriptive and/or or mainly lacking in relevance to the question. Level 2 responses may contain some inaccuracies and may be one sided. Analysis will be explained at least in part and will be largely relevant to the question. Level 3 responses may consider alternative policies / concepts etc. and will be balanced. Explanations of points raised will be offered and will be accurate and relevant to the question. AO3 Evaluation • An overall assessment of whether the achievement of a balanced budget should always be a main government macroeconomic objective. • If part of the analysis, this should also include an assessment of the difficulties of achieving other objectives against the desirability of a balanced budget to gain higher level evaluation marks. • Leading to an overall and balanced conclusion. 5(b) A one-sided response cannot gain any marks for evaluation. AO1 Knowledge and understanding and AO2 Analysis 8 AO3 Evaluation 4
More questions on Government macroeconomic policy objectives
What was in this paper
The subtopics covered by these 5 questions, and how many questions each got. Open one in a new tab to see every Cambridge question on it.
What you needed in this session
Cambridge’s own grade thresholds for 2024 Oct/Nov, Paper 2 · Variant 2. A higher threshold means an easier paper — the bar moves with how the cohort did.