Cambridge A Level Economics 9708 — 2025 May/June Paper 2 · Variant 2
9708/22/M/J/25 · 5 questions · 60 marks · ≈68 min
The question paper and its mark scheme, free to read here and free to download. This is Cambridge’s own paper, exactly as it was sat.
Question paper4 pages
Mark scheme21 pages
Answers below. Sit the paper first if you are practising.

Questions as text
Q1 · Can South Africa escape from its economic difficulties?
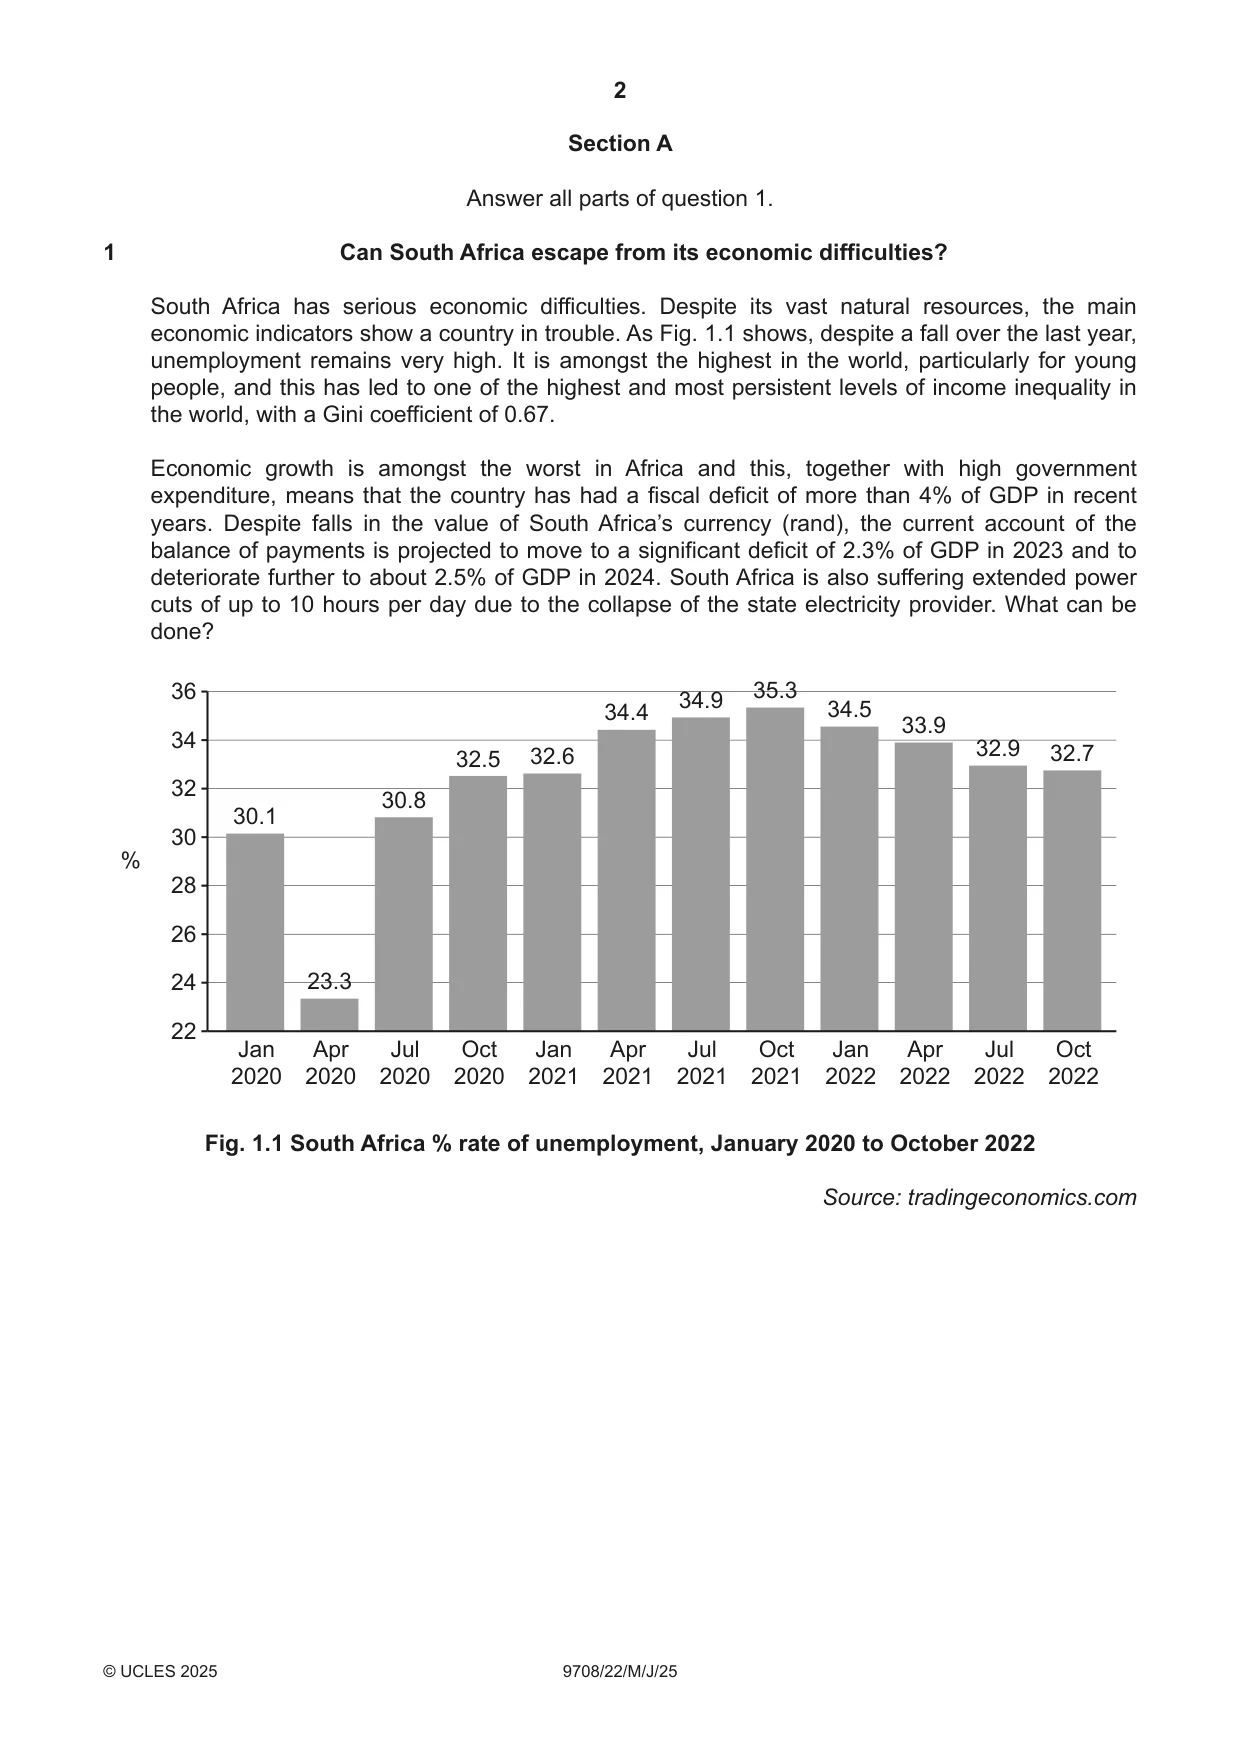
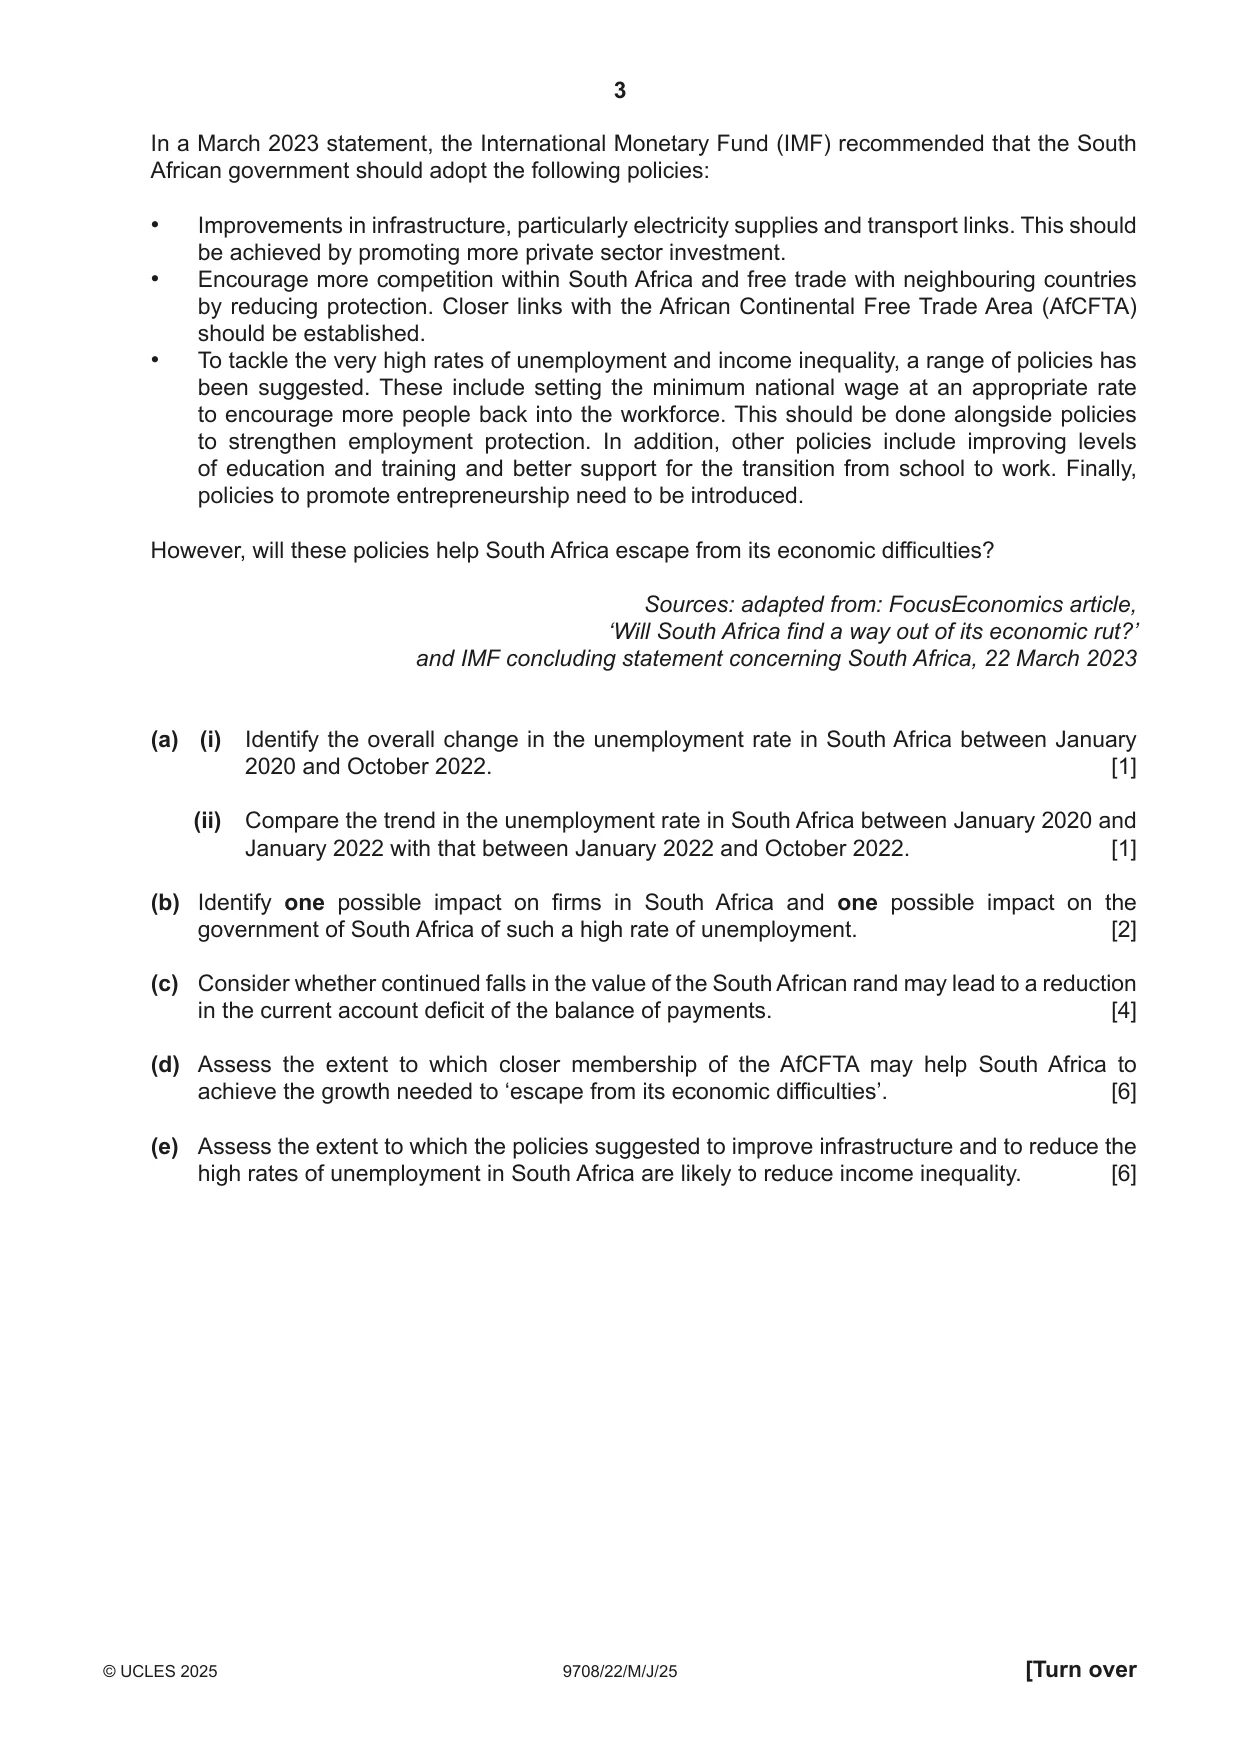
1 Can South Africa escape from its economic difficulties? South Africa has serious economic difficulties. Despite its vast natural resources, the main economic indicators show a country in trouble. As Fig. 1.1 shows, despite a fall over the last year, unemployment remains very high. It is amongst the highest in the world, particularly for young people, and this has led to one of the highest and most persistent levels of income inequality in the world, with a Gini coefficient of 0.67. Economic growth is amongst the worst in Africa and this, together with high government expenditure, means that the country has had a fiscal deficit of more than 4% of GDP in recent years. Despite falls in the value of South Africa’s currency (rand), the current account of the balance of payments is projected to move to a significant deficit of 2.3% of GDP in 2023 and to deteriorate further to about 2.5% of GDP in 2024. South Africa is also suffering extended power cuts of up to 10 hours per day due to the collapse of the state electricity provider. What can be done? 36 35.3 34.9 34.4 34.5 33.9 34 32.9 32.7 32.5 32.6 32 30.8 30.1 30 % 28 26 24 23.3 22 Jan Apr Jul Oct Jan Apr Jul Oct Jan Apr Jul Oct 2020 2020 2020 2020 2021 2021 2021 2021 2022 2022 2022 2022 Fig. 1.1 South Africa % rate of unemployment, January 2020 to October 2022 Source: tradingeconomics.com In a March 2023 statement, the International Monetary Fund (IMF) recommended that the South African government should adopt the following policies: • Improvements in infrastructure, particularly electricity supplies and transport links. This should be achieved by promoting more private sector investment. • Encourage more competition within South Africa and free trade with neighbouring countries by reducing protection. Closer links with the African Continental Free Trade Area (AfCFTA) should be established. • To tackle the very high rates of unemployment and income inequality, a range of policies has been suggested. These include setting the minimum national wage at an appropriate rate to encourage more people back into the workforce. This should be done alongside policies to strengthen employment protection. In addition, other policies include improving levels of education and training and better support for the transition from school to work. Finally, policies to promote entrepreneurship need to be introduced. However, will these policies help South Africa escape from its economic difficulties? Sources: adapted from: FocusEconomics article, ‘Will South Africa find a way out of its economic rut?’ and IMF concluding statement concerning South Africa, 22 March 2023 (a) (i) Identify the overall change in the unemployment rate in South Africa between January 2020 and October 2022. [1] (ii) Compare the trend in the unemployment rate in South Africa between January 2020 and January 2022 with that between January 2022 and October 2022. [1] (b) Identify one possible impact on firms in South Africa and one possible impact on the government of South Africa of such a high rate of unemployment. [2] (c) Consider whether continued falls in the value of the South African rand may lead to a reduction in the current account deficit of the balance of payments. [4] (d) Assess the extent to which closer membership of the AfCFTA may help South Africa to achieve the growth needed to ‘escape from its economic difficulties’. [6] (e) Assess the extent to which the policies suggested to improve infrastructure and to reduce the high rates of unemployment in South Africa are likely to reduce income inequality. [6]
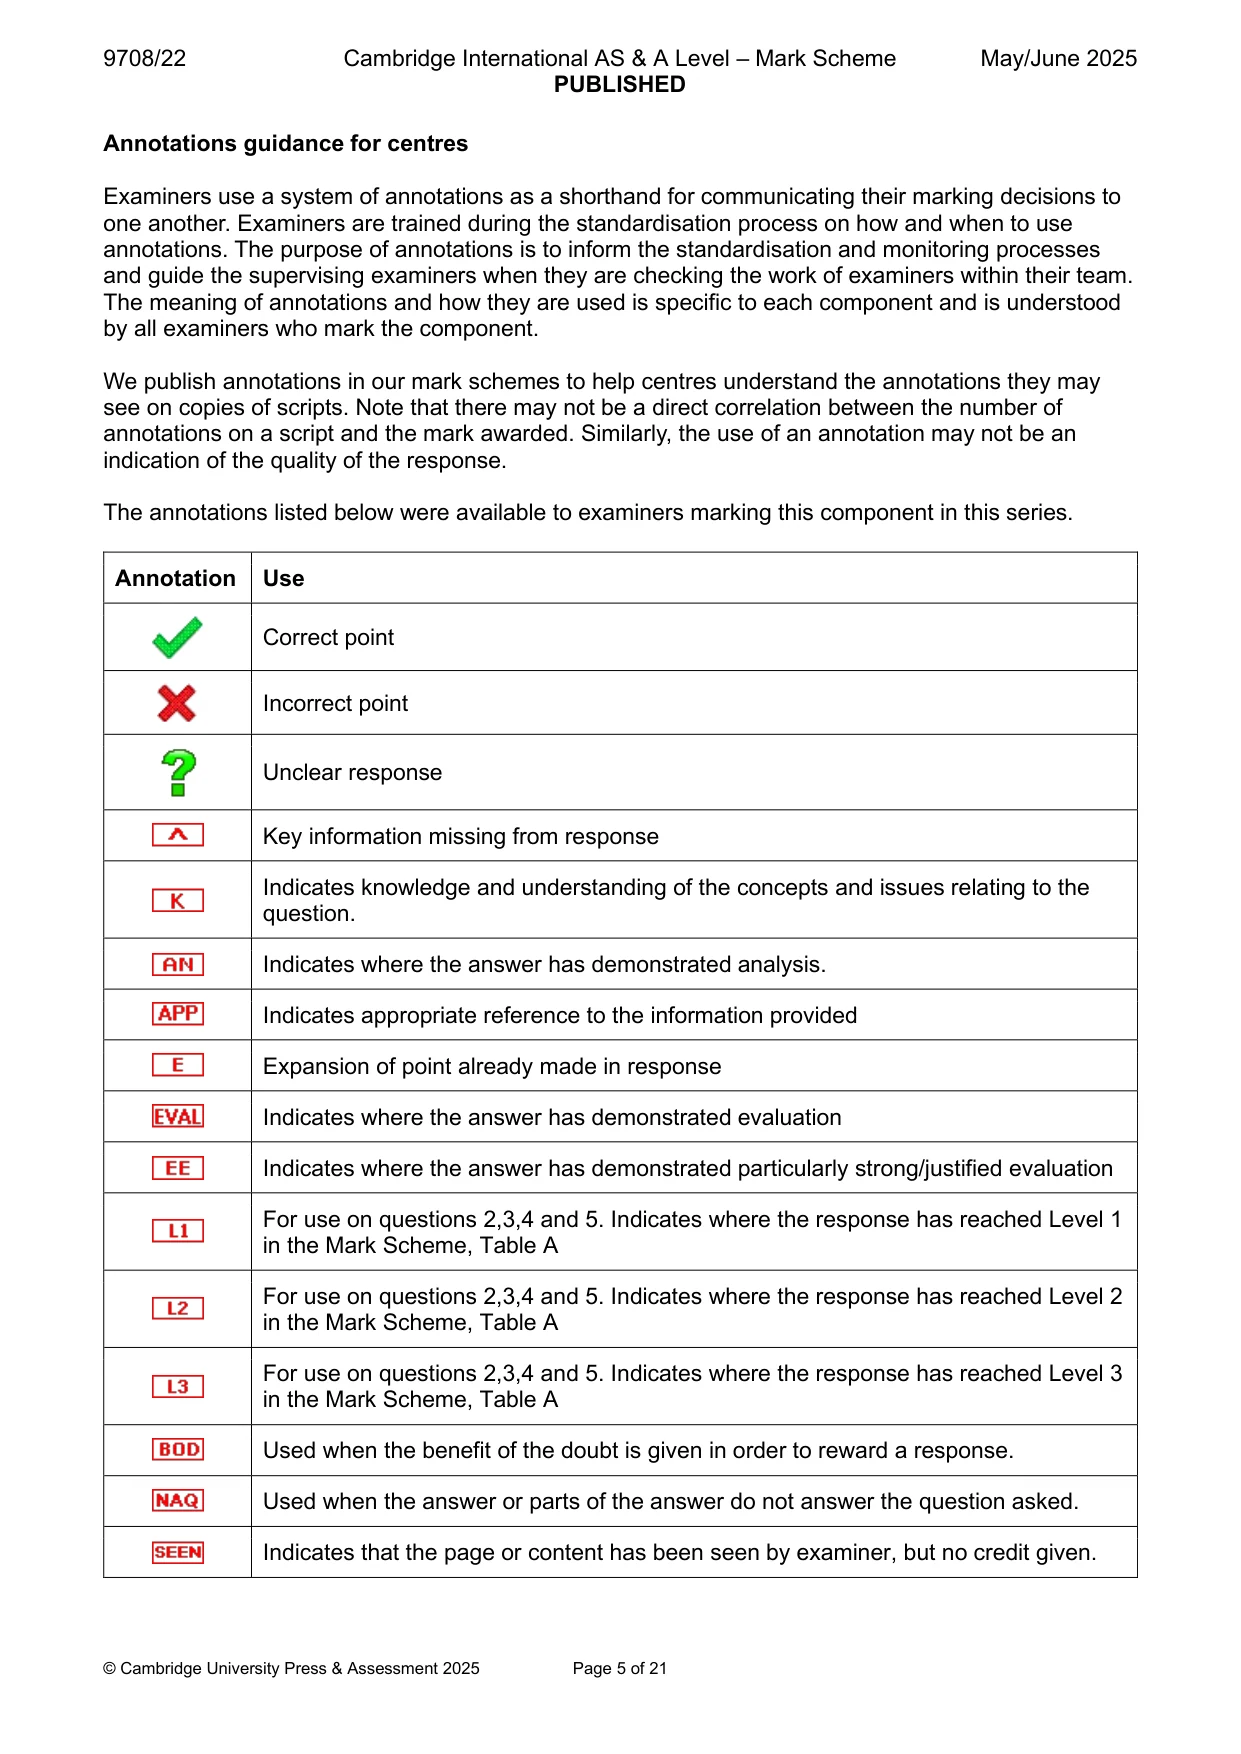
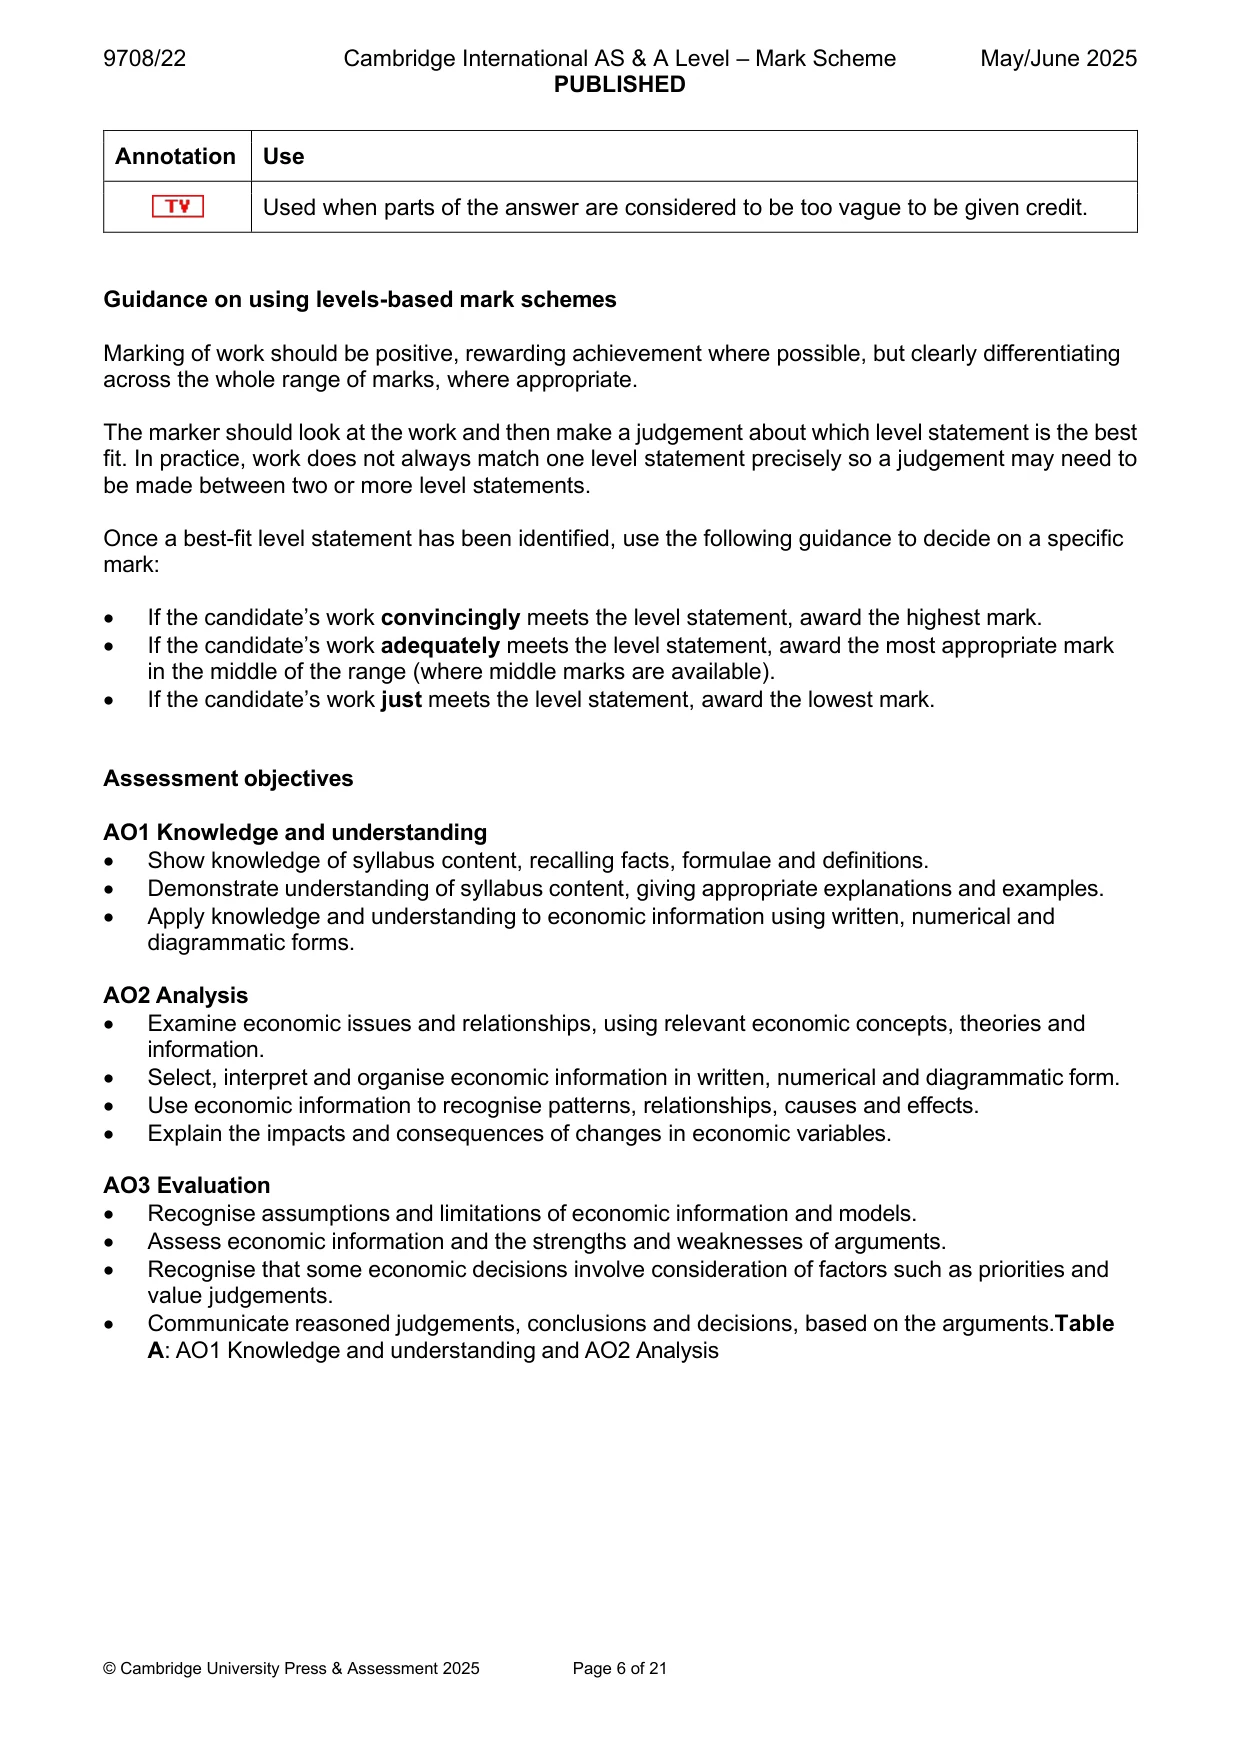
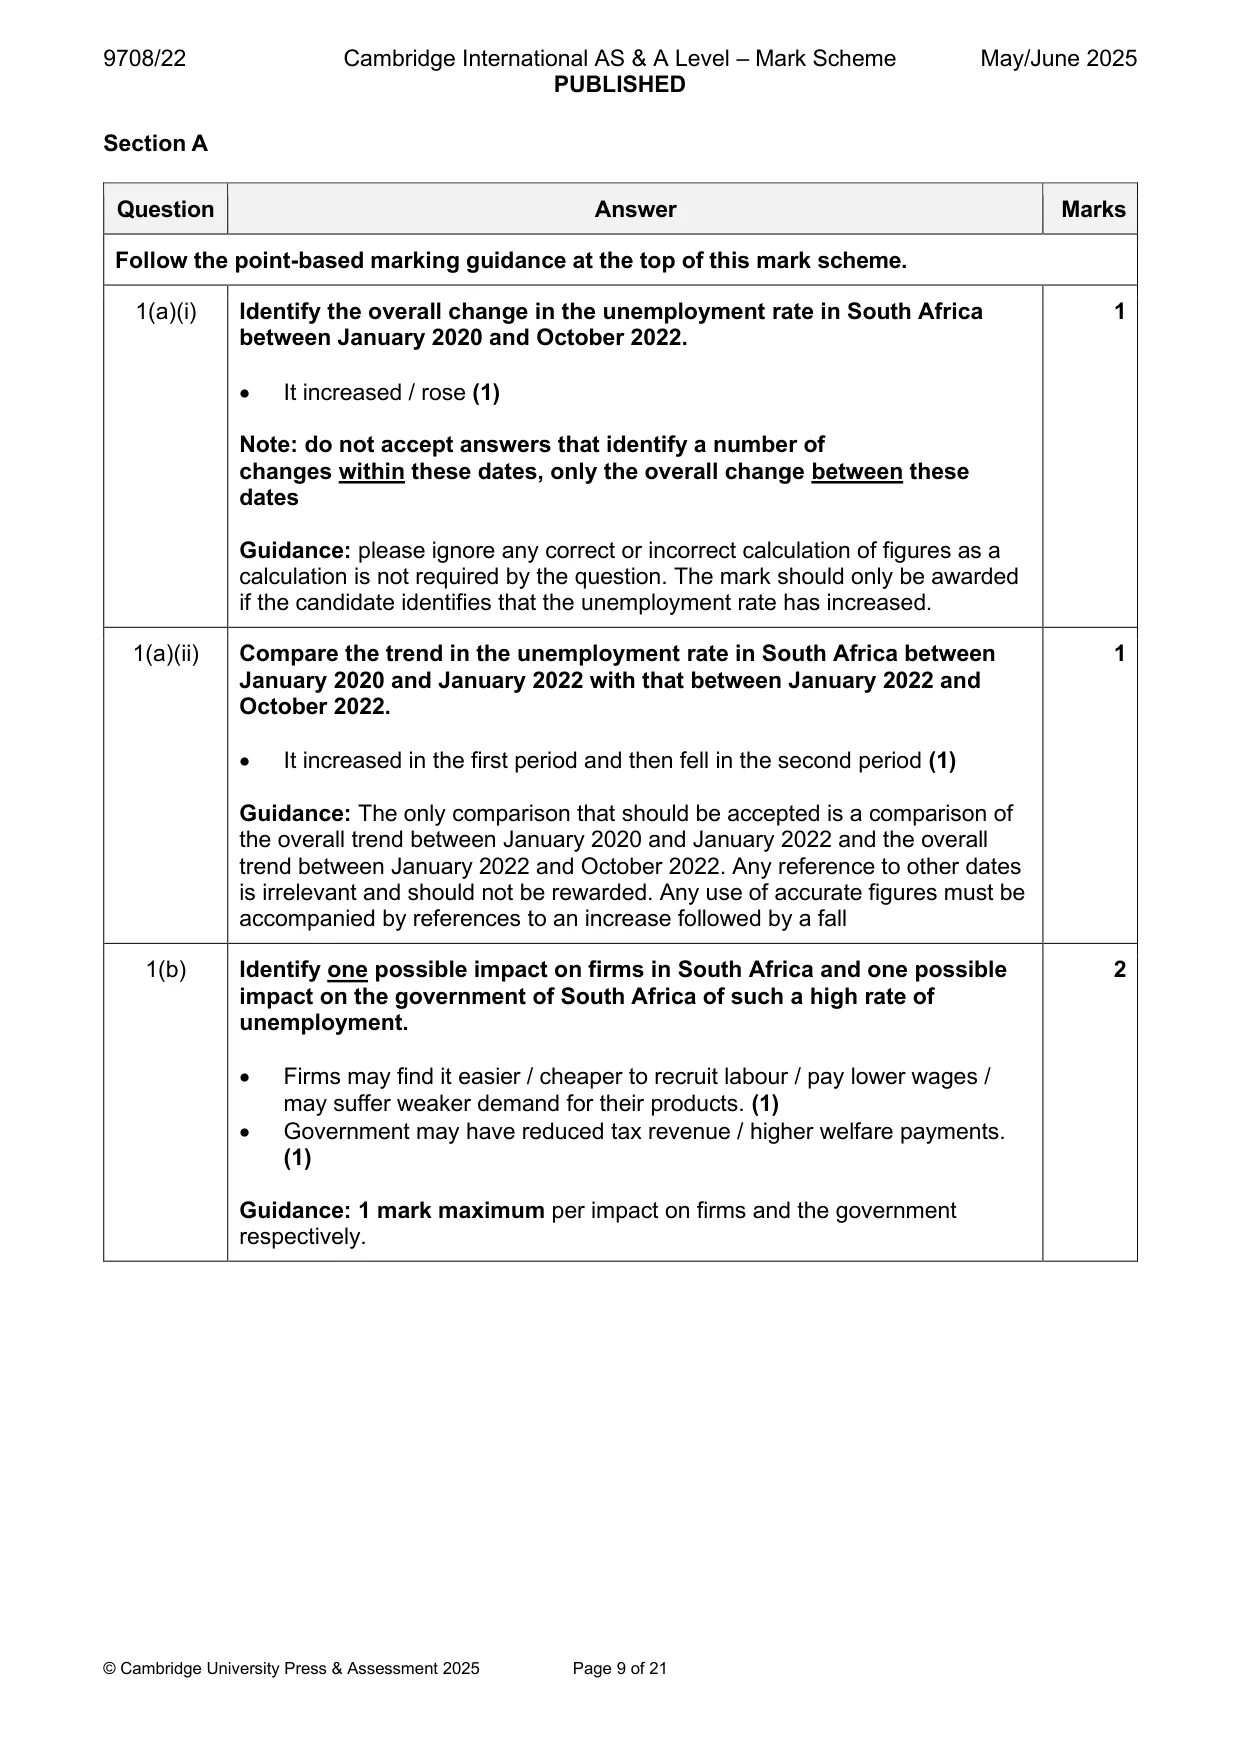
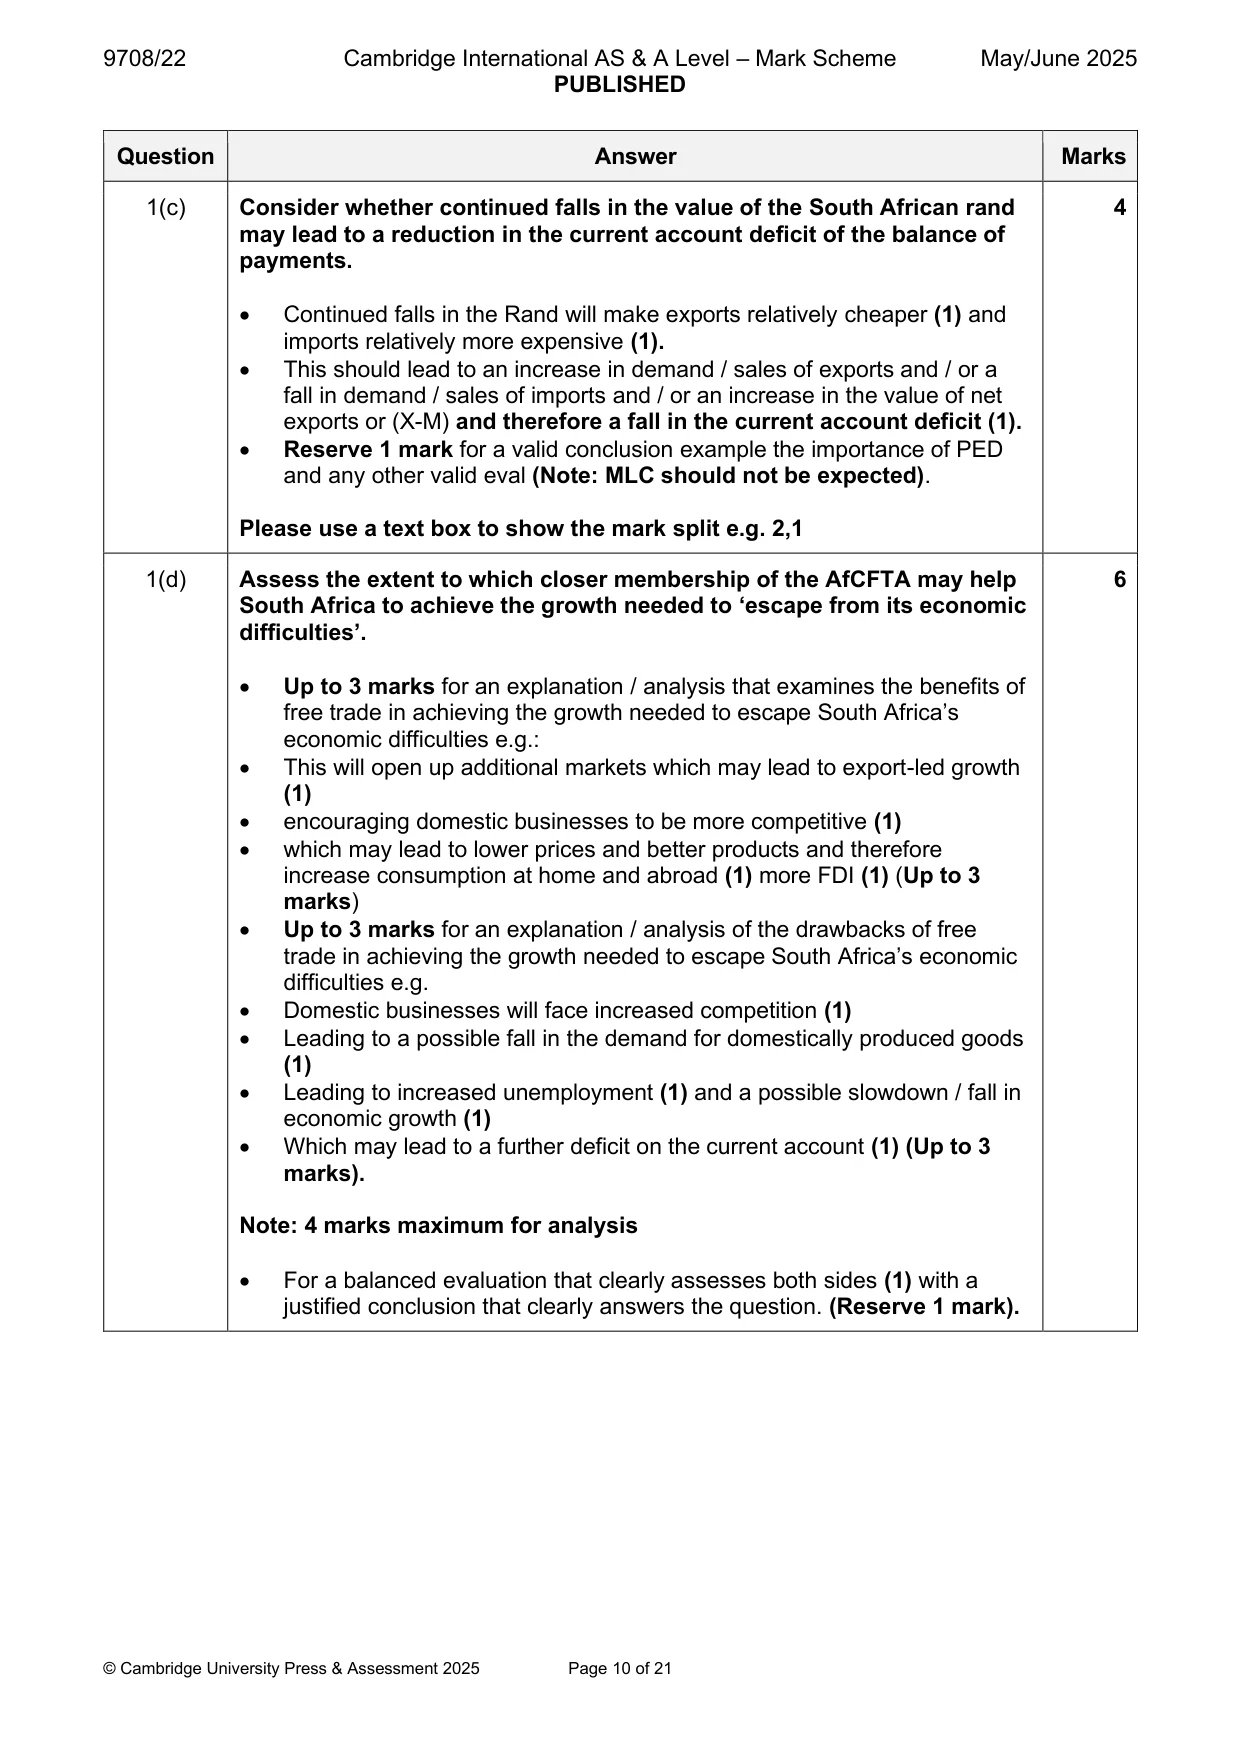
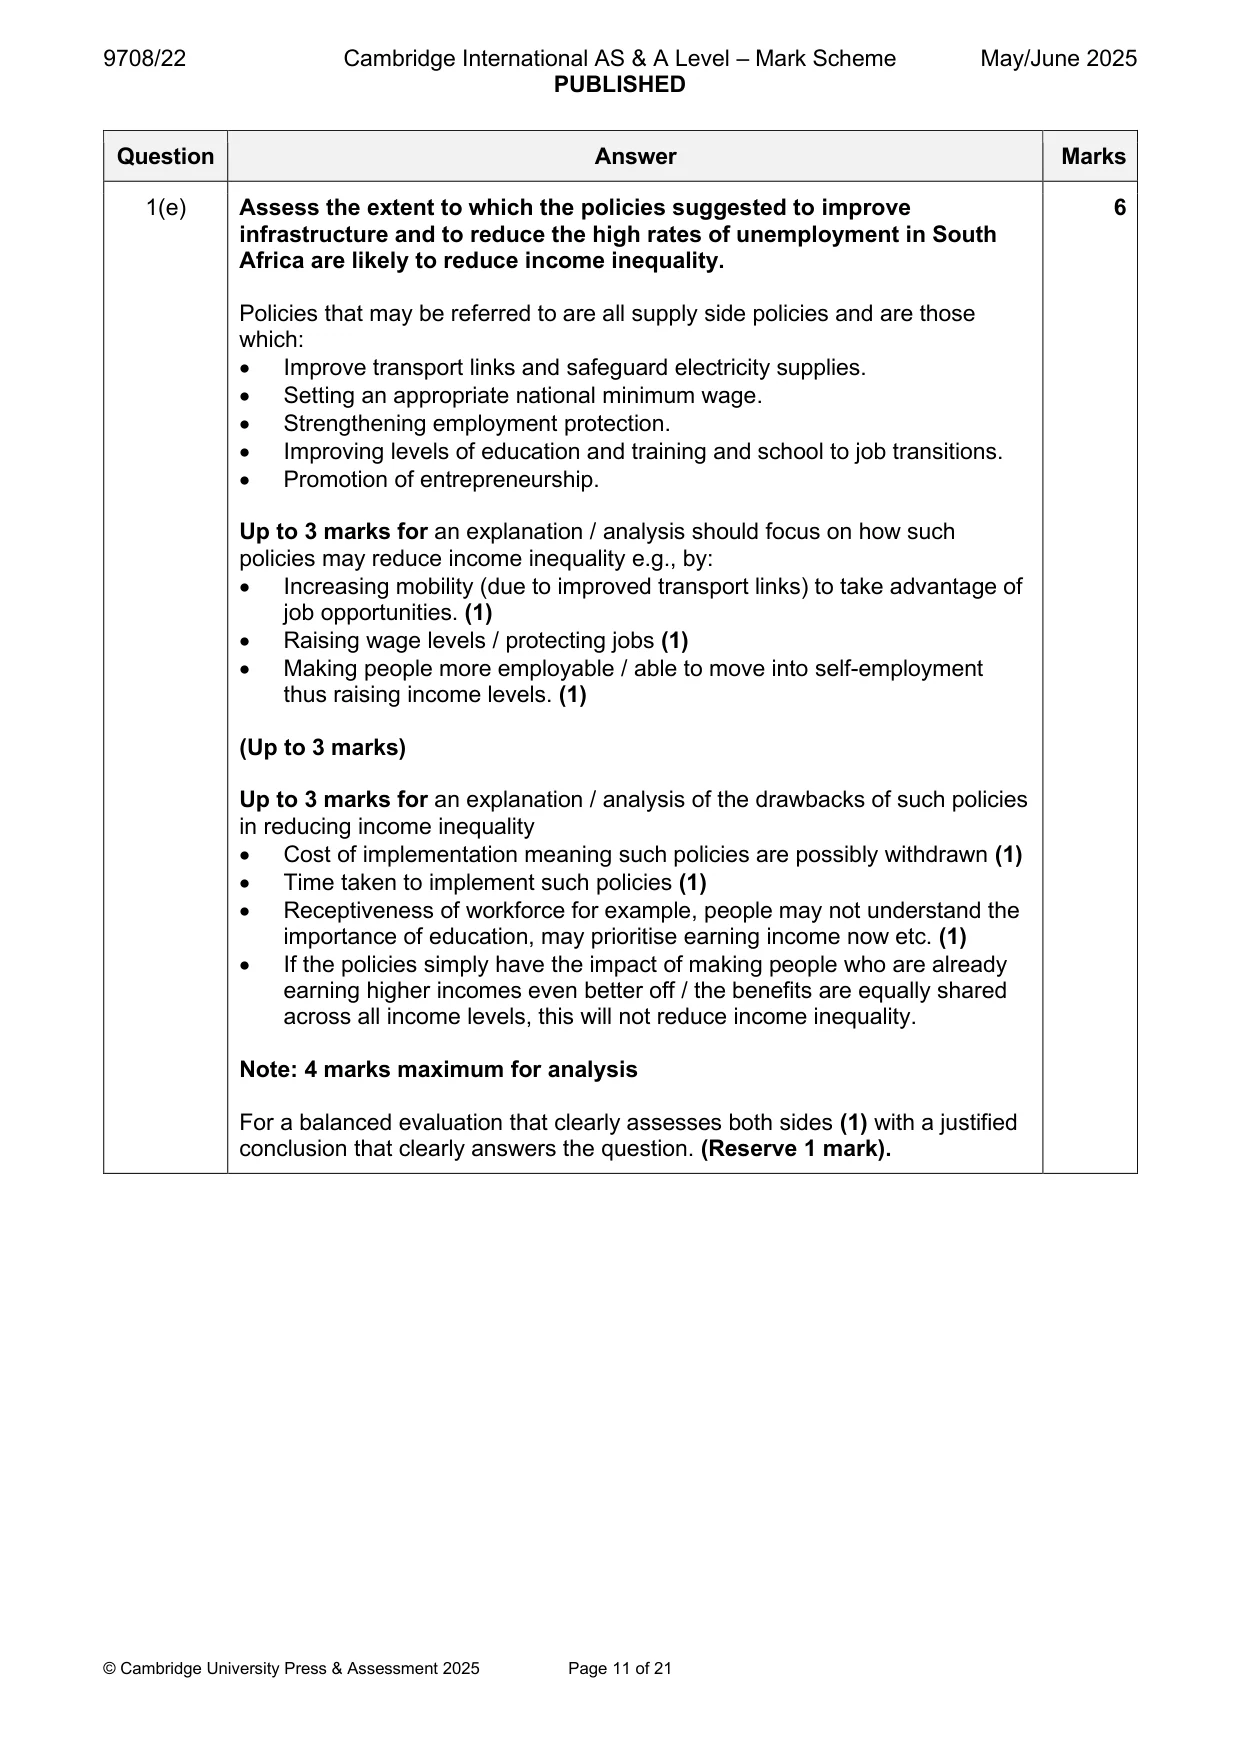
Mark scheme: Question Answer Marks Follow the point-based marking guidance at the top of this mark scheme. 1(a)(i) Identify the overall change in the unemployment rate in South Africa 1 between January 2020 and October 2022. • It increased / rose (1) Note: do not accept answers that identify a number of changes within these dates, only the overall change between these dates Guidance: please ignore any correct or incorrect calculation of figures as a calculation is not required by the question. The mark should only be awarded if the candidate identifies that the unemployment rate has increased. 1(a)(ii) Compare the trend in the unemployment rate in South Africa between 1 January 2020 and January 2022 with that between January 2022 and October 2022. • It increased in the first period and then fell in the second period (1) Guidance: The only comparison that should be accepted is a comparison of the overall trend between January 2020 and January 2022 and the overall trend between January 2022 and October 2022. Any reference to other dates is irrelevant and should not be rewarded. Any use of accurate figures must be accompanied by references to an increase followed by a fall 1(b) Identify one possible impact on firms in South Africa and one possible 2 impact on the government of South Africa of such a high rate of unemployment. • Firms may find it easier / cheaper to recruit labour / pay lower wages / may suffer weaker demand for their products. (1) • Government may have reduced tax revenue / higher welfare payments. (1) Guidance: 1 mark maximum per impact on firms and the government respectively. 1(c) Consider whether continued falls in the value of the South African rand 4 may lead to a reduction in the current account deficit of the balance of payments. • Continued falls in the Rand will make exports relatively cheaper (1) and imports relatively more expensive (1). • This should lead to an increase in demand / sales of exports and / or a fall in demand / sales of imports and / or an increase in the value of net exports or (X-M) and therefore a fall in the current account deficit (1). • Reserve 1 mark for a valid conclusion example the importance of PED and any other valid eval (Note: MLC should not be expected). Please use a text box to show the mark split e.g. 2,1 1(d) Assess the extent to which closer membership of the AfCFTA may help 6 South Africa to achieve the growth needed to ‘escape from its economic difficulties’. • Up to 3 marks for an explanation / analysis that examines the benefits of free trade in achieving the growth needed to escape South Africa’s economic difficulties e.g.: • This will open up additional markets which may lead to export-led growth (1) • encouraging domestic businesses to be more competitive (1) • which may lead to lower prices and better products and therefore increase consumption at home and abroad (1) more FDI (1) (Up to 3 marks) • Up to 3 marks for an explanation / analysis of the drawbacks of free trade in achieving the growth needed to escape South Africa’s economic difficulties e.g. • Domestic businesses will face increased competition (1) • Leading to a possible fall in the demand for domestically produced goods (1) • Leading to increased unemployment (1) and a possible slowdown / fall in economic growth (1) • Which may lead to a further deficit on the current account (1) (Up to 3 marks). Note: 4 marks maximum for analysis • For a balanced evaluation that clearly assesses both sides (1) with a justified conclusion that clearly answers the question. (Reserve 1 mark). 1(e) Assess the extent to which the policies suggested to improve 6 infrastructure and to reduce the high rates of unemployment in South Africa are likely to reduce income inequality. Policies that may be referred to are all supply side policies and are those which: • Improve transport links and safeguard electricity supplies. • Setting an appropriate national minimum wage. • Strengthening employment protection. • Improving levels of education and training and school to job transitions. • Promotion of entrepreneurship. Up to 3 marks for an explanation / analysis should focus on how such policies may reduce income inequality e.g., by: • Increasing mobility (due to improved transport links) to take advantage of job opportunities. (1) • Raising wage levels / protecting jobs (1) • Making people more employable / able to move into self-employment thus raising income levels. (1) (Up to 3 marks) Up to 3 marks for an explanation / analysis of the drawbacks of such policies in reducing income inequality • Cost of implementation meaning such policies are possibly withdrawn (1) • Time taken to implement such policies (1) • Receptiveness of workforce for example, people may not understand the importance of education, may prioritise earning income now etc. (1) • If the policies simply have the impact of making people who are already earning higher incomes even better off / the benefits are equally shared across all income levels, this will not reduce income inequality. Note: 4 marks maximum for analysis For a balanced evaluation that clearly assesses both sides (1) with a justified conclusion that clearly answers the question. (Reserve 1 mark). Section B
Q2 · With the help of examples, explain the difference between public goods and free goods and…
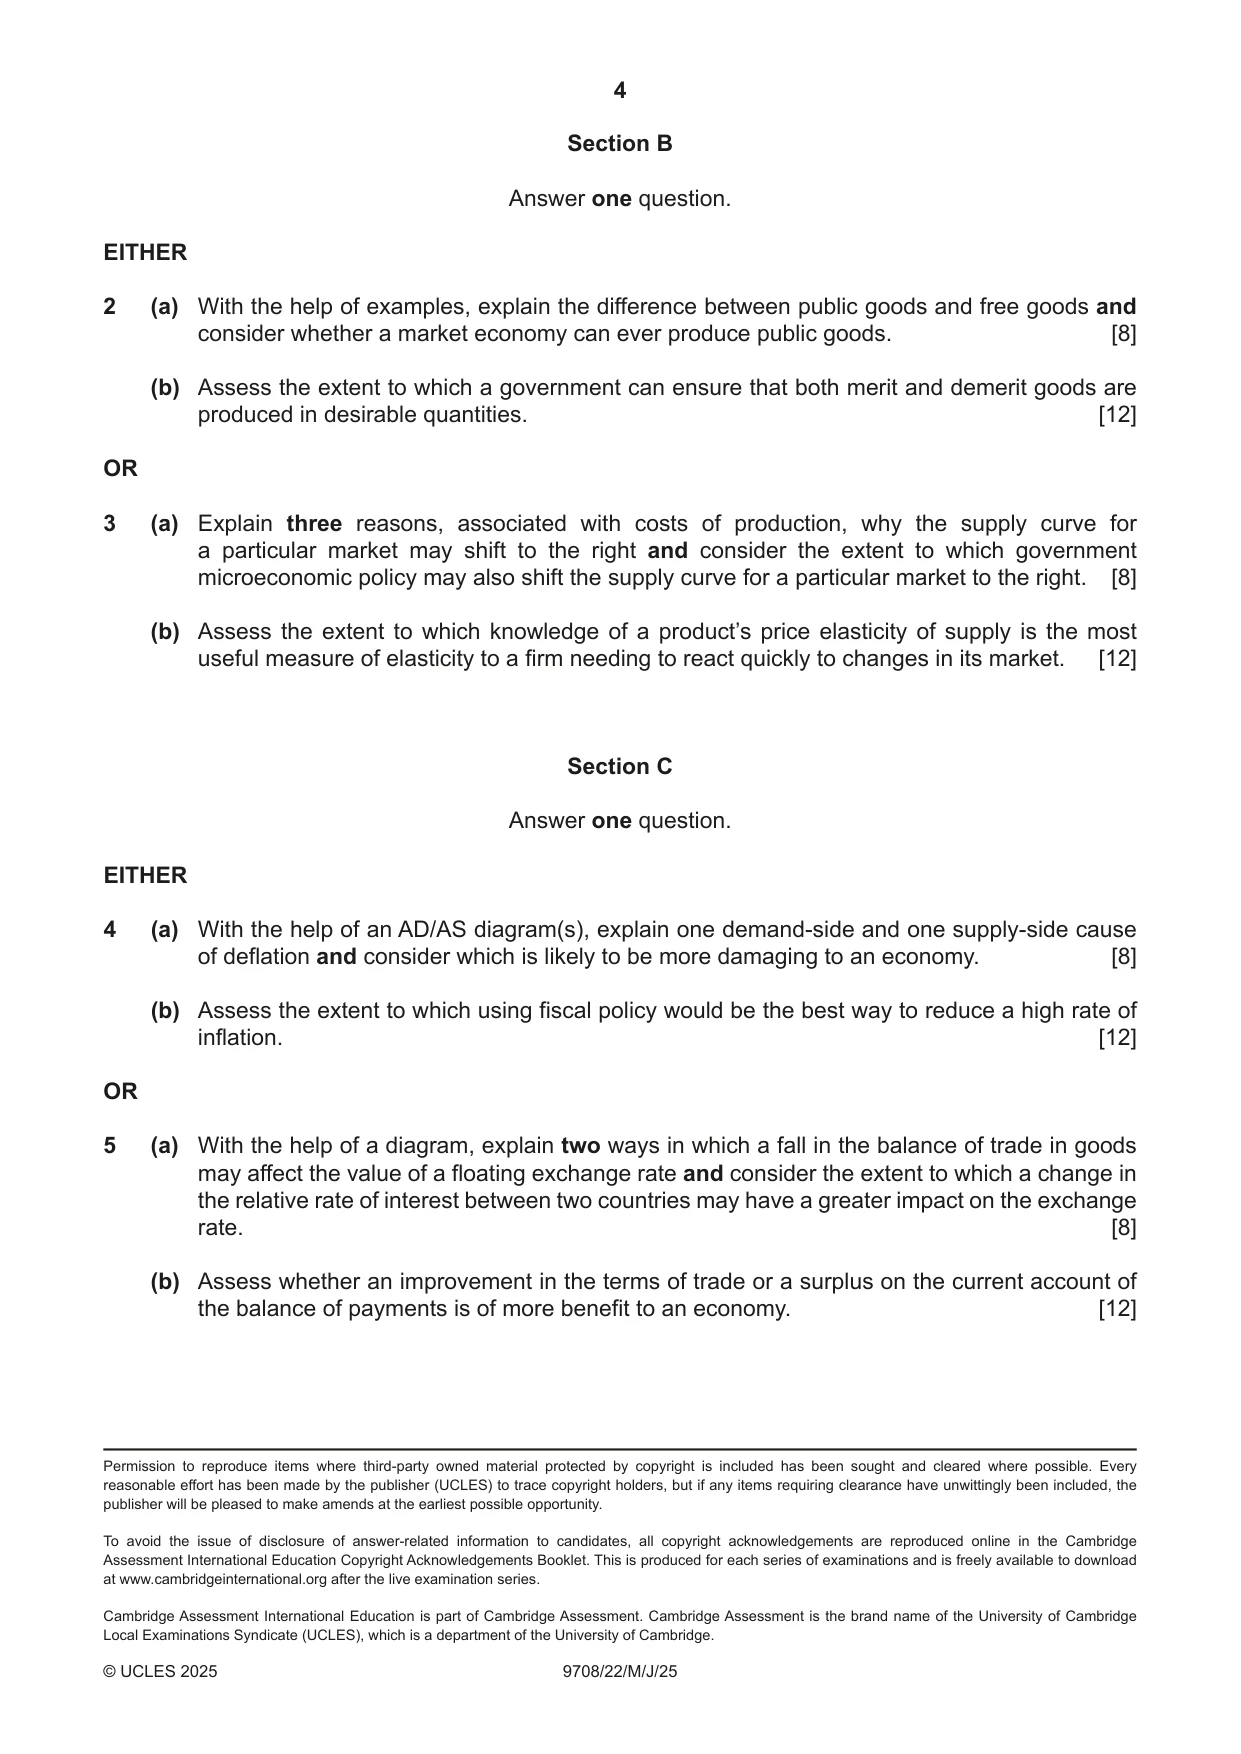
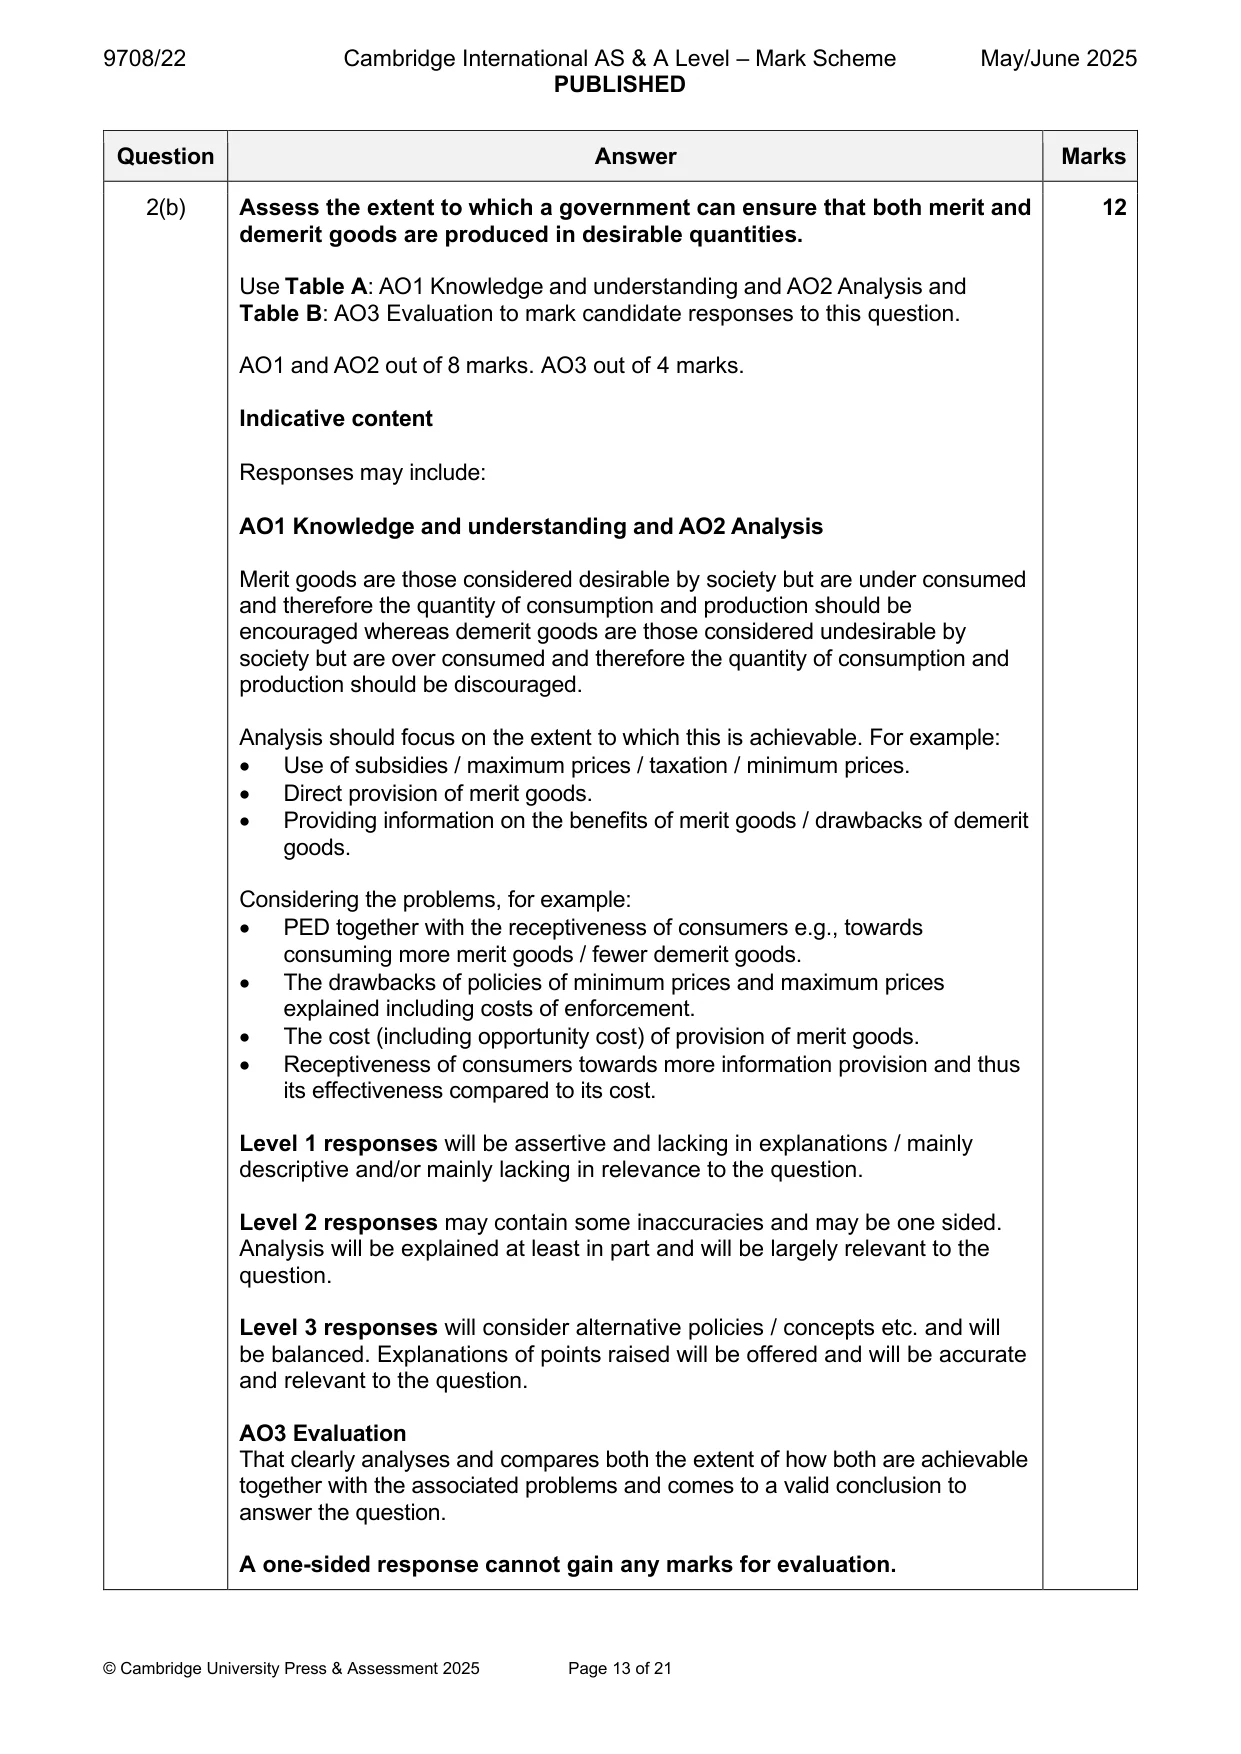
2 (a) With the help of examples, explain the difference between public goods and free goods and consider whether a market economy can ever produce public goods. [8] (b) Assess the extent to which a government can ensure that both merit and demerit goods are produced in desirable quantities. [12] OR
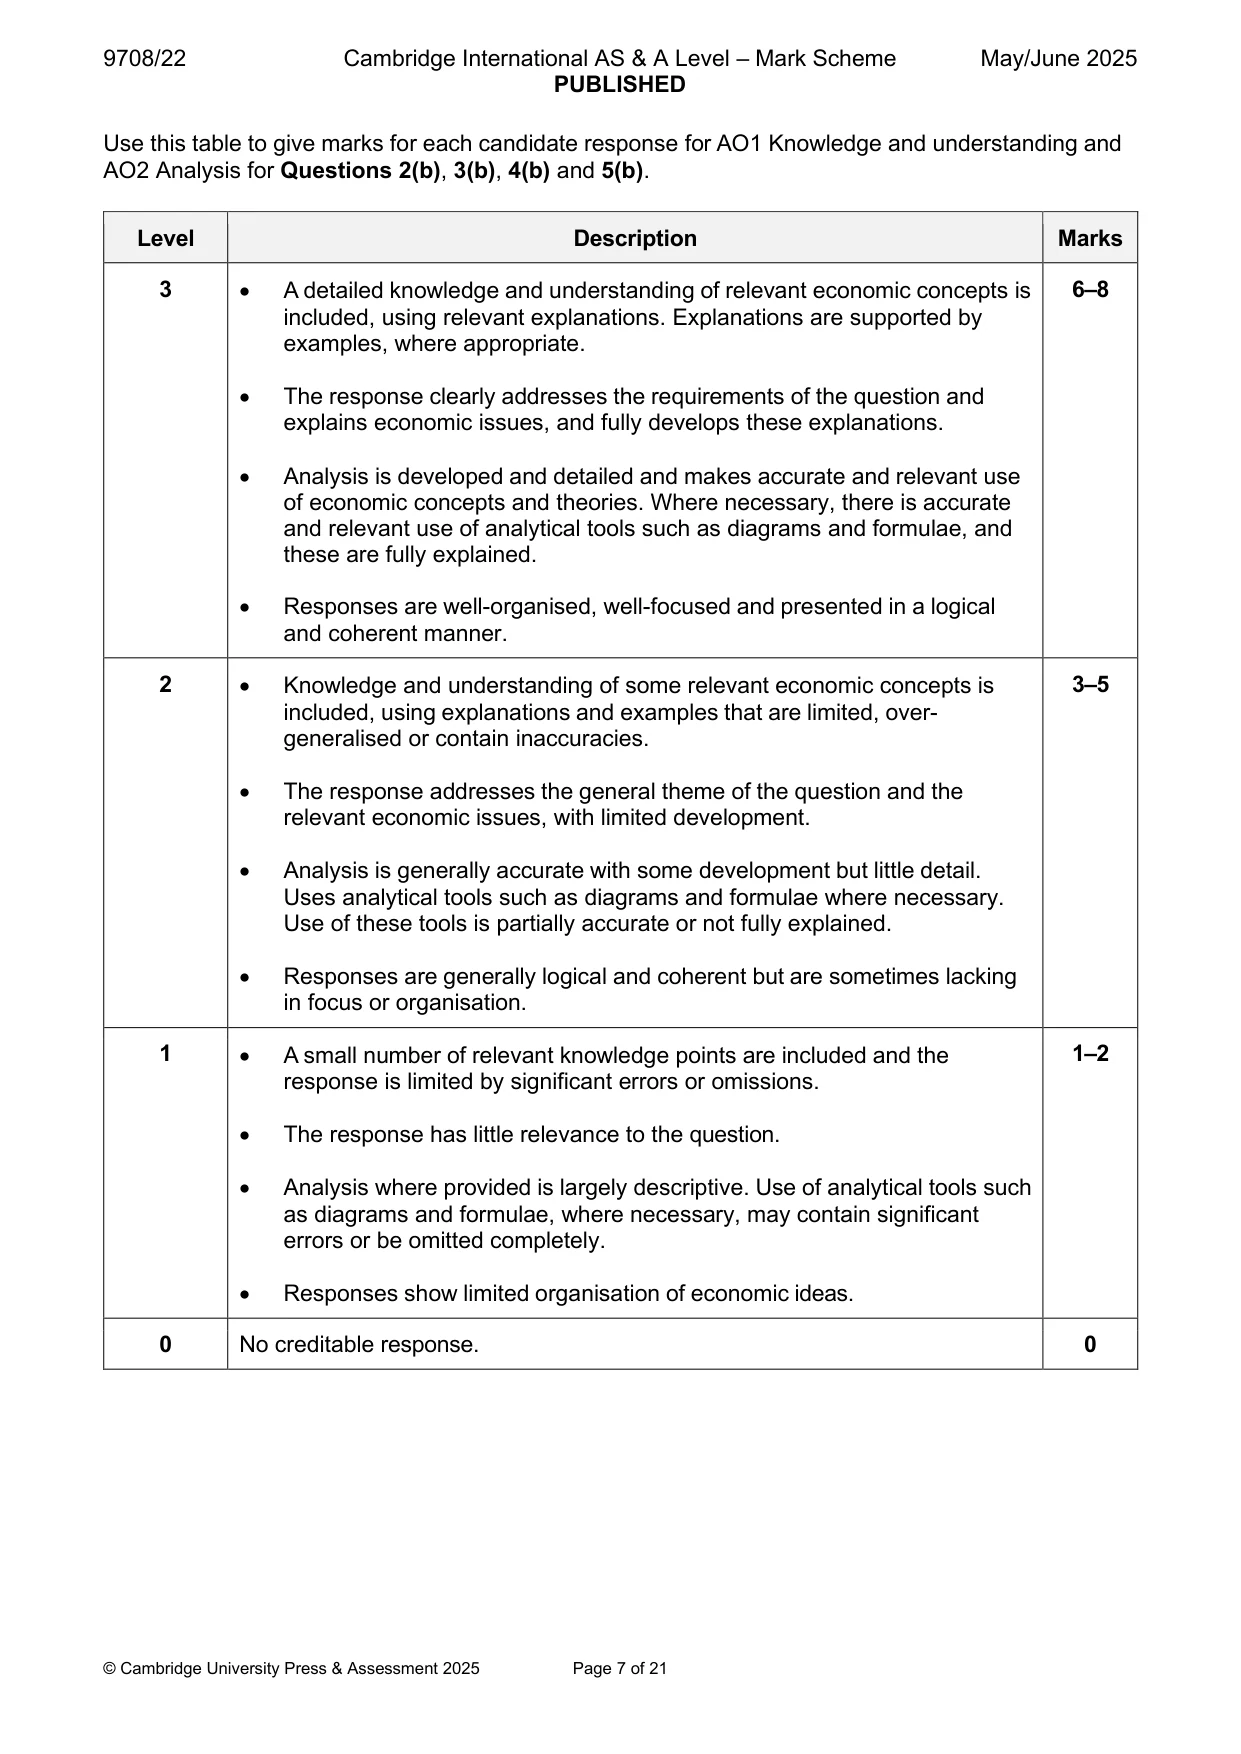
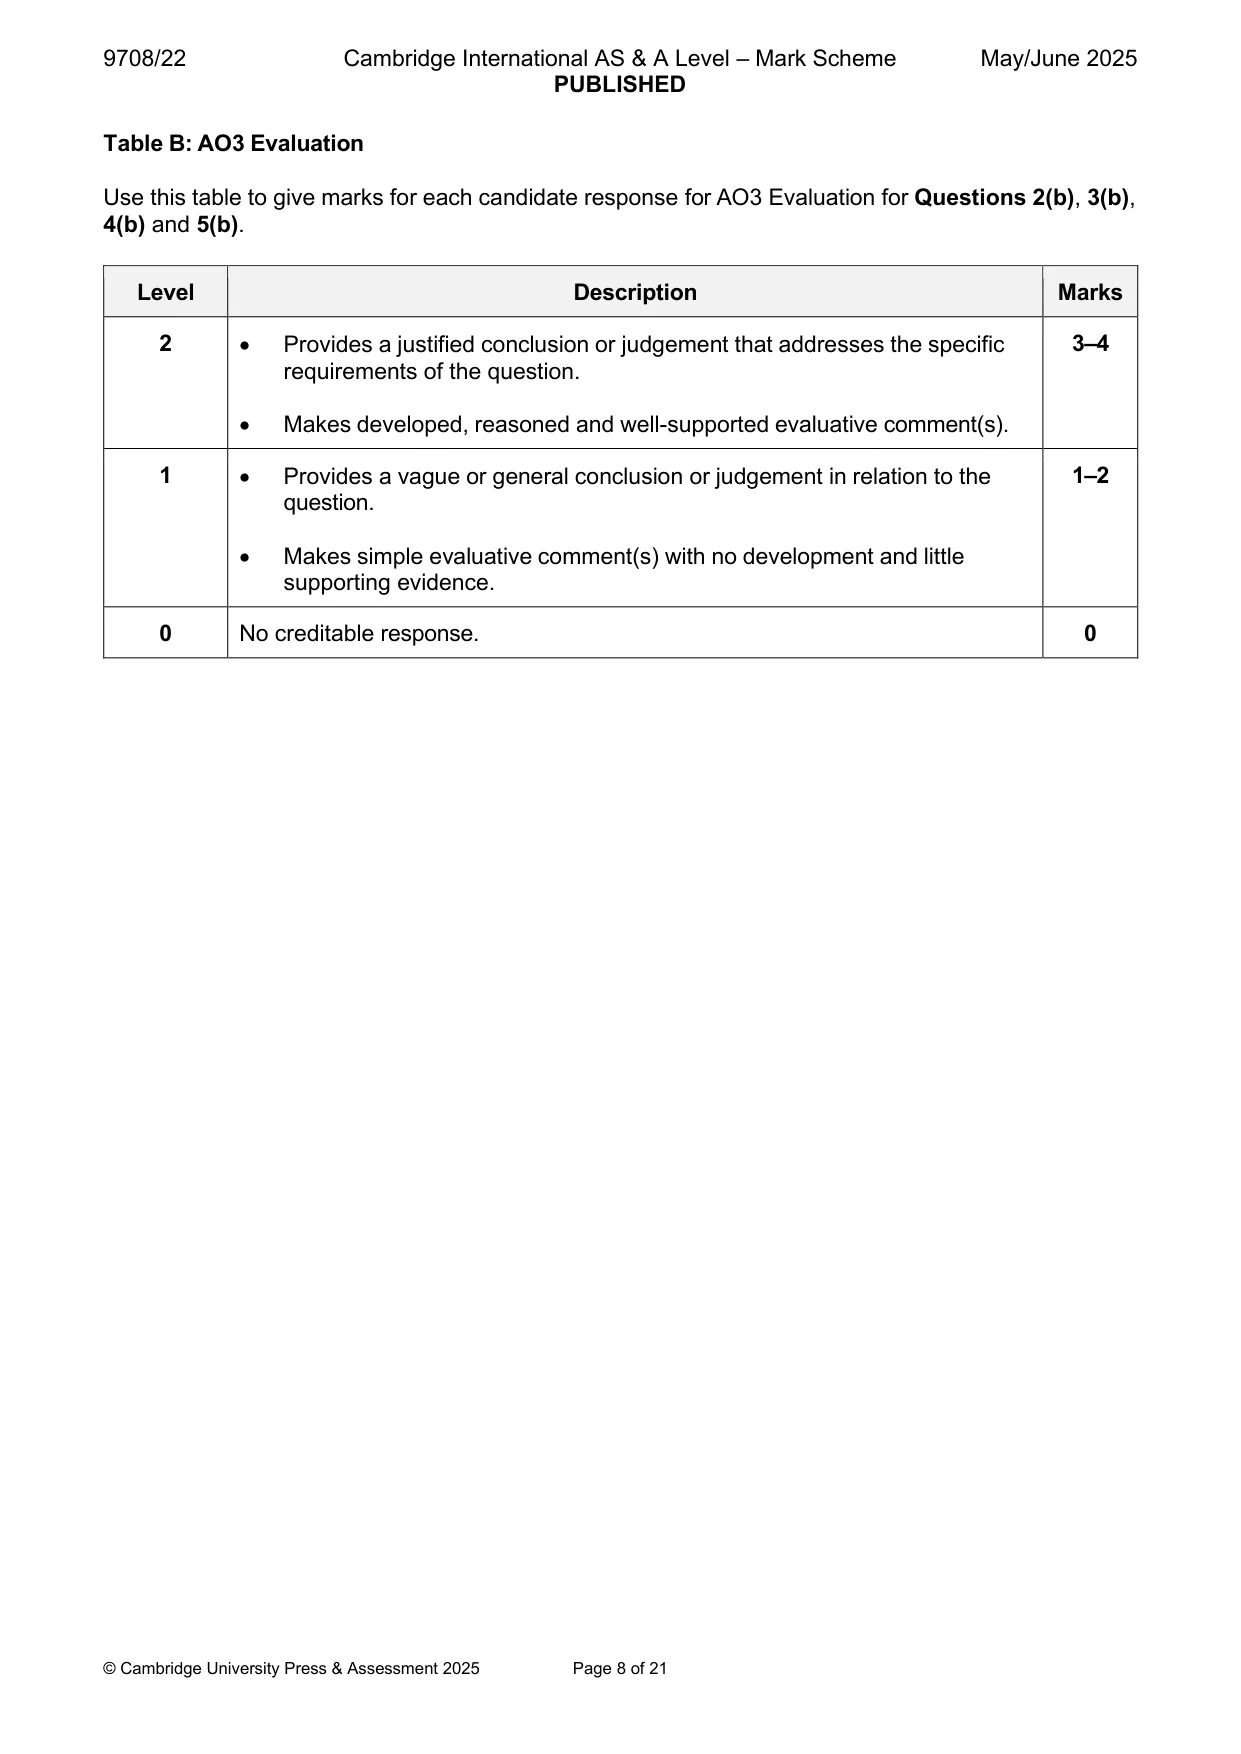
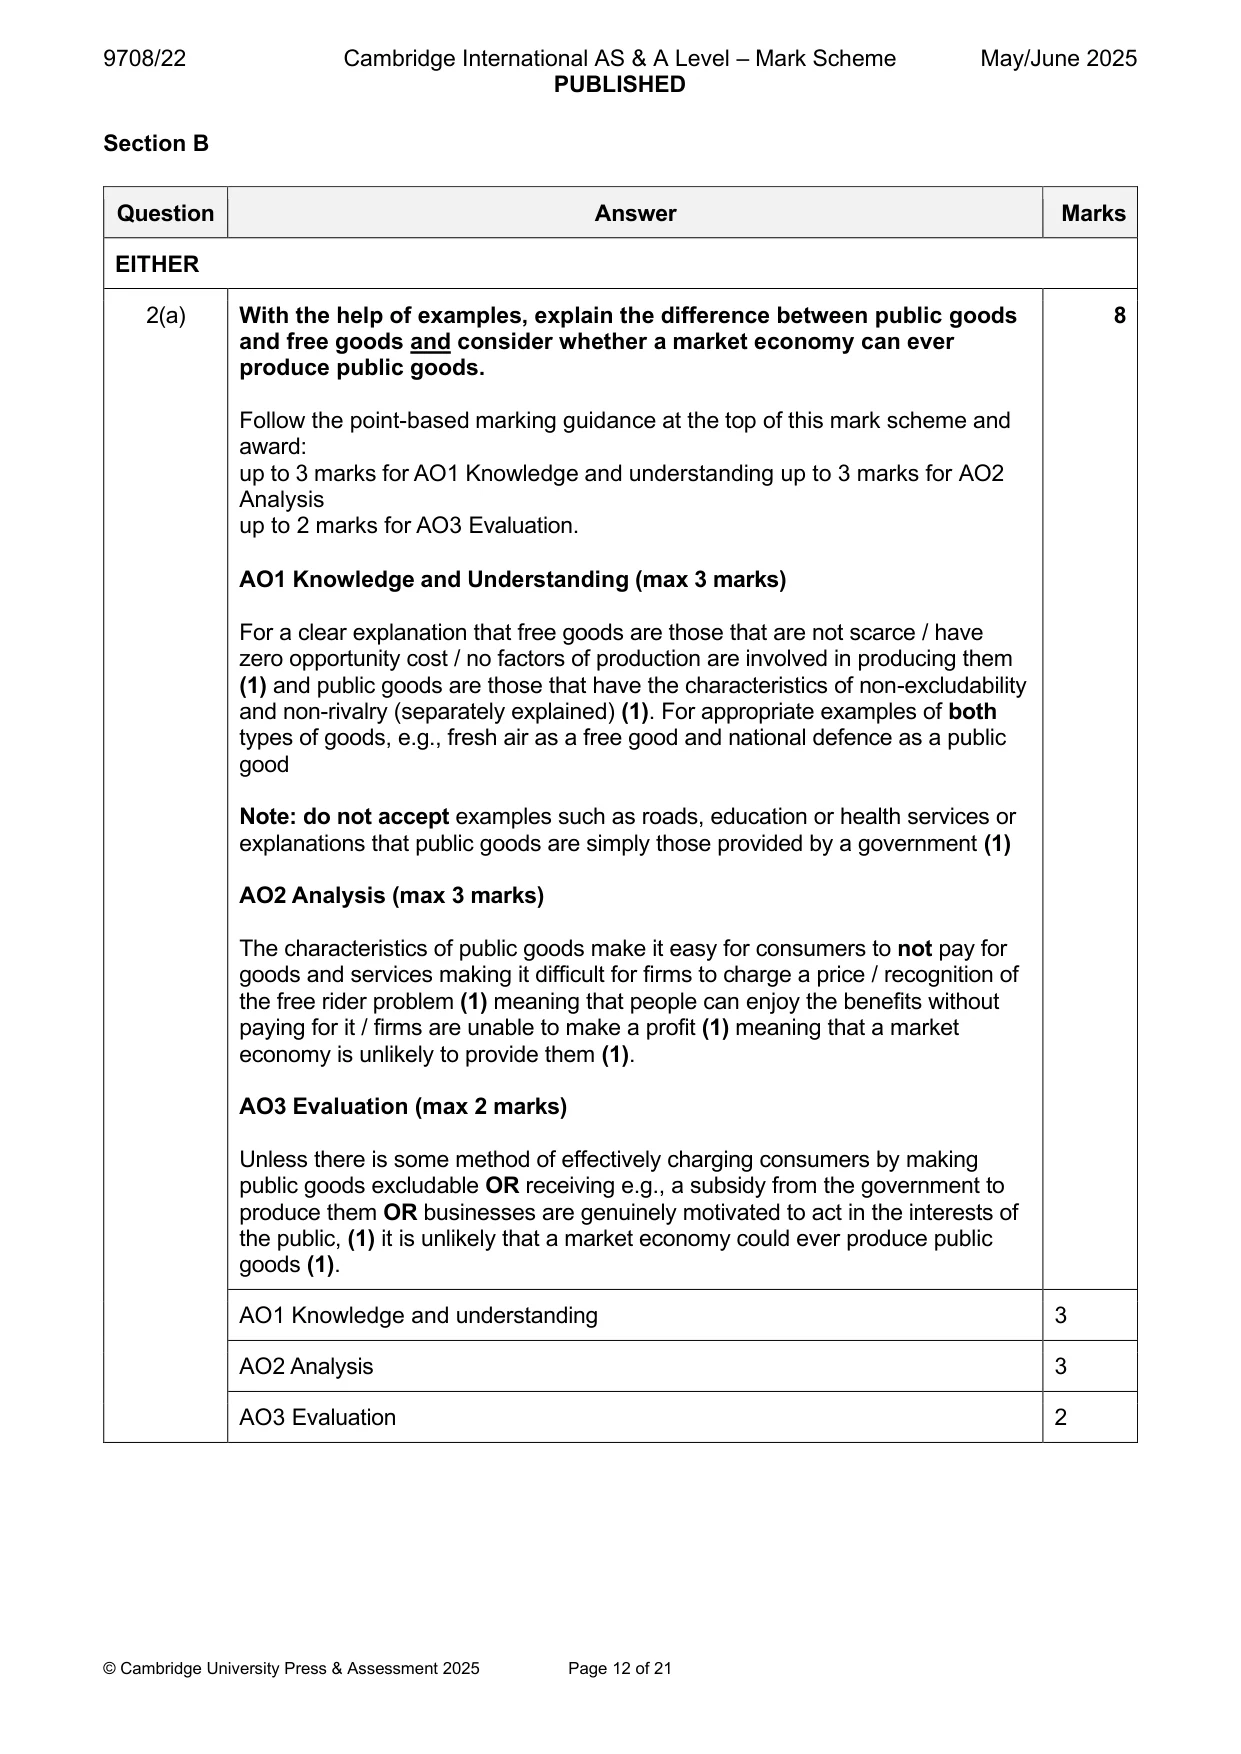
Mark scheme: 2(a) With the help of examples, explain the difference between public goods 8 and free goods and consider whether a market economy can ever produce public goods. Follow the point-based marking guidance at the top of this mark scheme and award: up to 3 marks for AO1 Knowledge and understanding up to 3 marks for AO2 Analysis up to 2 marks for AO3 Evaluation. AO1 Knowledge and Understanding (max 3 marks) For a clear explanation that free goods are those that are not scarce / have zero opportunity cost / no factors of production are involved in producing them (1) and public goods are those that have the characteristics of non-excludability and non-rivalry (separately explained) (1). For appropriate examples of both types of goods, e.g., fresh air as a free good and national defence as a public good Note: do not accept examples such as roads, education or health services or explanations that public goods are simply those provided by a government (1) AO2 Analysis (max 3 marks) The characteristics of public goods make it easy for consumers to not pay for goods and services making it difficult for firms to charge a price / recognition of the free rider problem (1) meaning that people can enjoy the benefits without paying for it / firms are unable to make a profit (1) meaning that a market economy is unlikely to provide them (1). AO3 Evaluation (max 2 marks) Unless there is some method of effectively charging consumers by making public goods excludable OR receiving e.g., a subsidy from the government to produce them OR businesses are genuinely motivated to act in the interests of the public, (1) it is unlikely that a market economy could ever produce public goods (1). AO1 Knowledge and understanding 3 AO2 Analysis 3 AO3 Evaluation 2 2(b) Assess the extent to which a government can ensure that both merit and 12 demerit goods are produced in desirable quantities. Use Table A: AO1 Knowledge and understanding and AO2 Analysis and Table B: AO3 Evaluation to mark candidate responses to this question. AO1 and AO2 out of 8 marks. AO3 out of 4 marks. Indicative content Responses may include: AO1 Knowledge and understanding and AO2 Analysis Merit goods are those considered desirable by society but are under consumed and therefore the quantity of consumption and production should be encouraged whereas demerit goods are those considered undesirable by society but are over consumed and therefore the quantity of consumption and production should be discouraged. Analysis should focus on the extent to which this is achievable. For example: • Use of subsidies / maximum prices / taxation / minimum prices. • Direct provision of merit goods. • Providing information on the benefits of merit goods / drawbacks of demerit goods. Considering the problems, for example: • PED together with the receptiveness of consumers e.g., towards consuming more merit goods / fewer demerit goods. • The drawbacks of policies of minimum prices and maximum prices explained including costs of enforcement. • The cost (including opportunity cost) of provision of merit goods. • Receptiveness of consumers towards more information provision and thus its effectiveness compared to its cost. Level 1 responses will be assertive and lacking in explanations / mainly descriptive and/or mainly lacking in relevance to the question. Level 2 responses may contain some inaccuracies and may be one sided. Analysis will be explained at least in part and will be largely relevant to the question. Level 3 responses will consider alternative policies / concepts etc. and will be balanced. Explanations of points raised will be offered and will be accurate and relevant to the question. AO3 Evaluation That clearly analyses and compares both the extent of how both are achievable together with the associated problems and comes to a valid conclusion to answer the question. A one-sided response cannot gain any marks for evaluation. 2(b) AO1 Knowledge and understanding and AO2 Analysis 8 AO3 Evaluation 4
Q3 · Explain three reasons, associated with costs of production, why the supply curve for a…
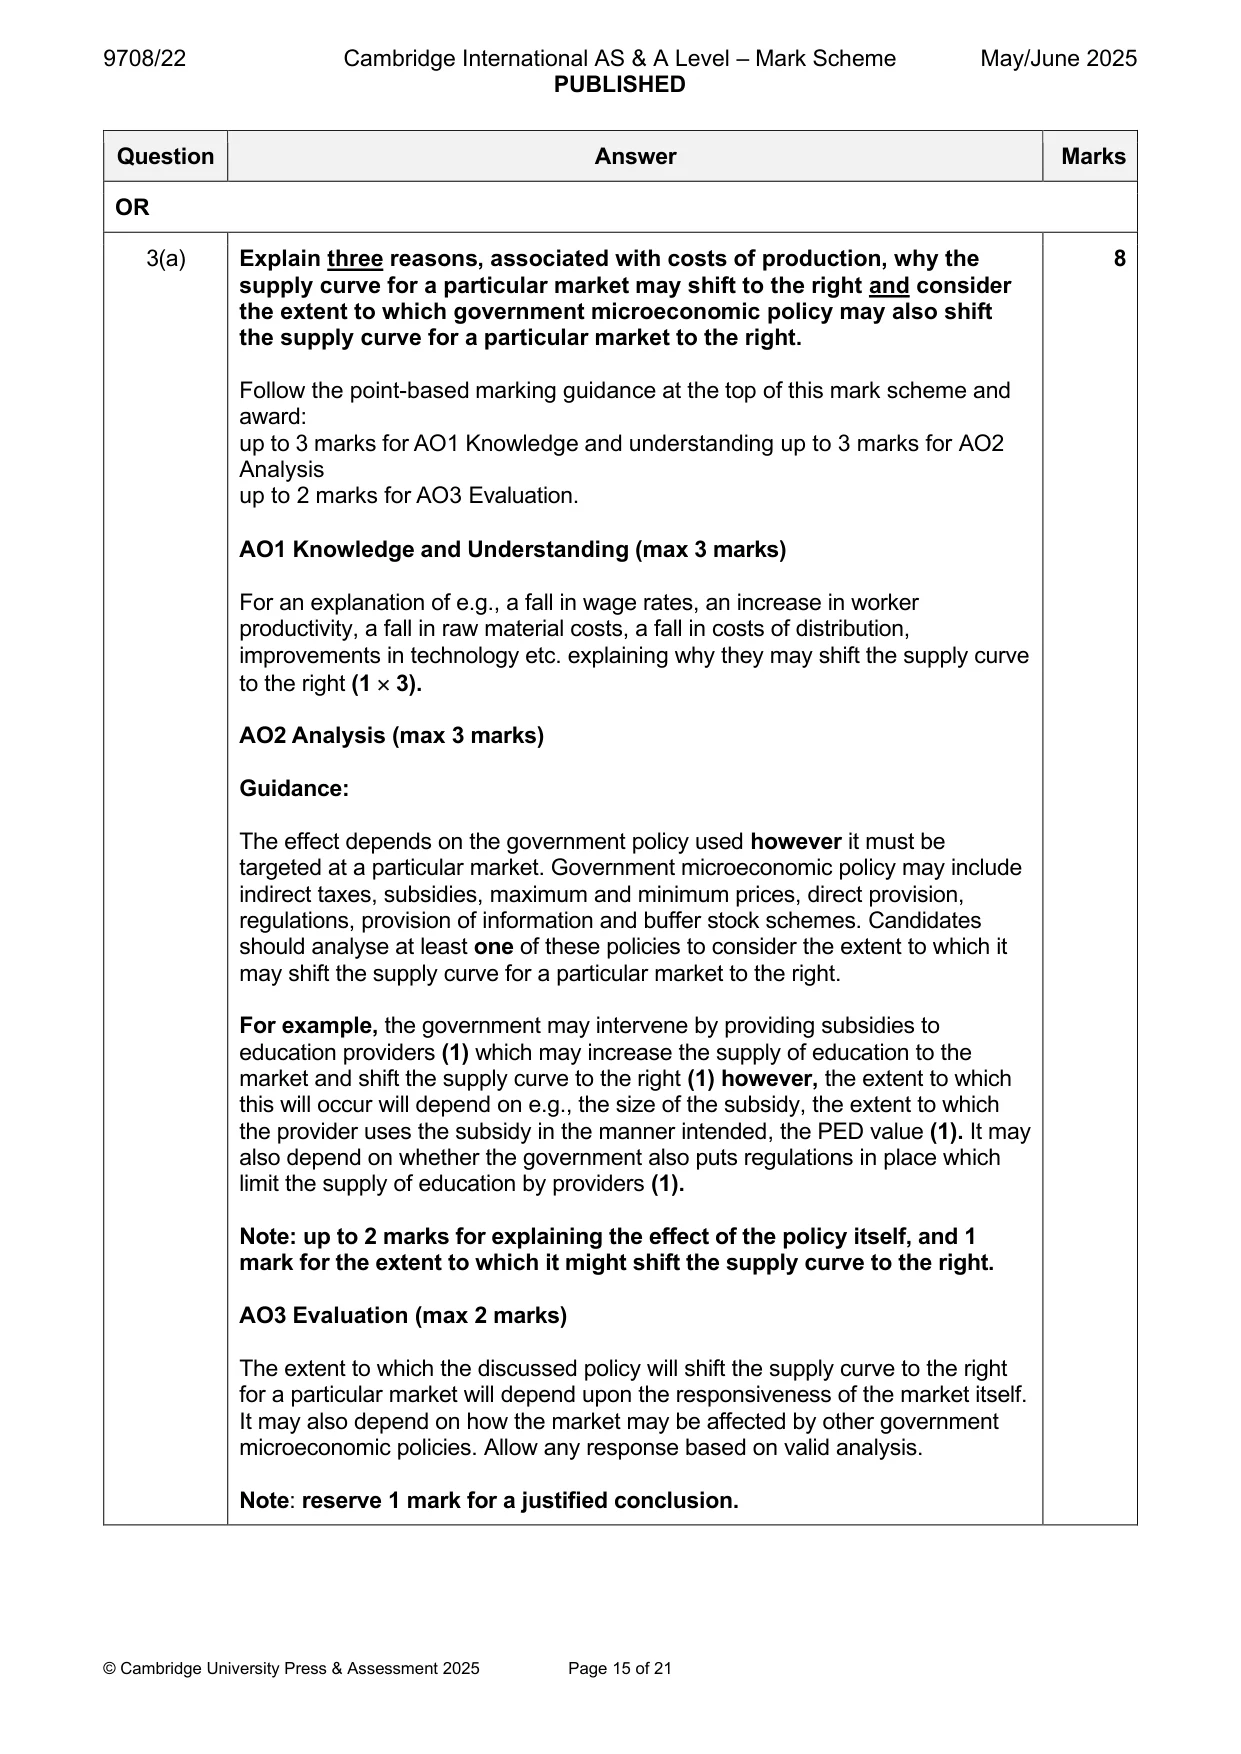
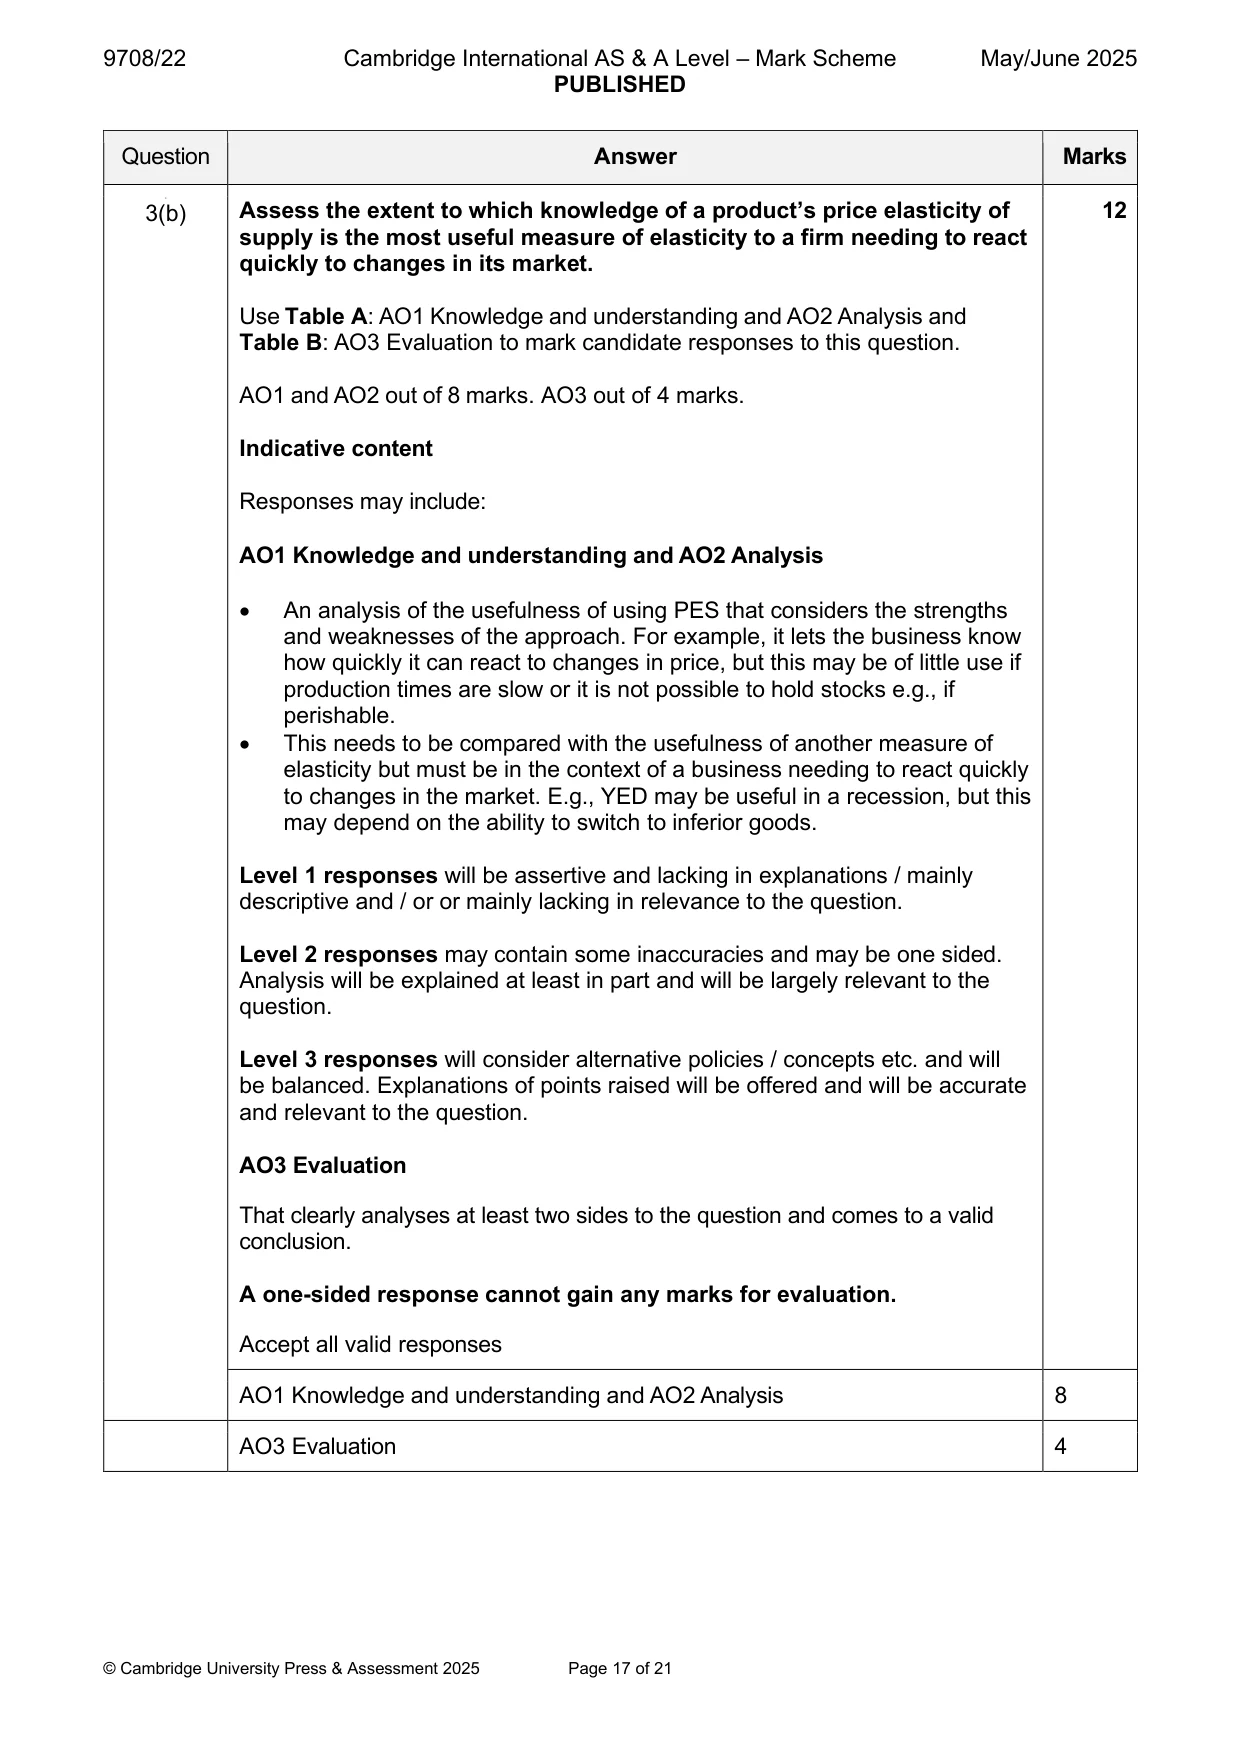
3 (a) Explain three reasons, associated with costs of production, why the supply curve for a particular market may shift to the right and consider the extent to which government microeconomic policy may also shift the supply curve for a particular market to the right. [8] (b) Assess the extent to which knowledge of a product’s price elasticity of supply is the most useful measure of elasticity to a firm needing to react quickly to changes in its market. [12] Section C Answer one question. EITHER
Mark scheme: 3(a) Explain three reasons, associated with costs of production, why the 8 supply curve for a particular market may shift to the right and consider the extent to which government microeconomic policy may also shift the supply curve for a particular market to the right. Follow the point-based marking guidance at the top of this mark scheme and award: up to 3 marks for AO1 Knowledge and understanding up to 3 marks for AO2 Analysis up to 2 marks for AO3 Evaluation. AO1 Knowledge and Understanding (max 3 marks) For an explanation of e.g., a fall in wage rates, an increase in worker productivity, a fall in raw material costs, a fall in costs of distribution, improvements in technology etc. explaining why they may shift the supply curve to the right (1 3). AO2 Analysis (max 3 marks) Guidance: The effect depends on the government policy used however it must be targeted at a particular market. Government microeconomic policy may include indirect taxes, subsidies, maximum and minimum prices, direct provision, regulations, provision of information and buffer stock schemes. Candidates should analyse at least one of these policies to consider the extent to which it may shift the supply curve for a particular market to the right. For example, the government may intervene by providing subsidies to education providers (1) which may increase the supply of education to the market and shift the supply curve to the right (1) however, the extent to which this will occur will depend on e.g., the size of the subsidy, the extent to which the provider uses the subsidy in the manner intended, the PED value (1). It may also depend on whether the government also puts regulations in place which limit the supply of education by providers (1). Note: up to 2 marks for explaining the effect of the policy itself, and 1 mark for the extent to which it might shift the supply curve to the right. AO3 Evaluation (max 2 marks) The extent to which the discussed policy will shift the supply curve to the right for a particular market will depend upon the responsiveness of the market itself. It may also depend on how the market may be affected by other government microeconomic policies. Allow any response based on valid analysis. Note: reserve 1 mark for a justified conclusion. 3(a) AO1 Knowledge and understanding 3 AO2 Analysis 3 AO3 Evaluation 2 3(b)3( Assess the extent to which knowledge of a product’s price elasticity of 12 supply is the most useful measure of elasticity to a firm needing to react quickly to changes in its market. Use Table A: AO1 Knowledge and understanding and AO2 Analysis and Table B: AO3 Evaluation to mark candidate responses to this question. AO1 and AO2 out of 8 marks. AO3 out of 4 marks. Indicative content Responses may include: AO1 Knowledge and understanding and AO2 Analysis • An analysis of the usefulness of using PES that considers the strengths and weaknesses of the approach. For example, it lets the business know how quickly it can react to changes in price, but this may be of little use if production times are slow or it is not possible to hold stocks e.g., if perishable. • This needs to be compared with the usefulness of another measure of elasticity but must be in the context of a business needing to react quickly to changes in the market. E.g., YED may be useful in a recession, but this may depend on the ability to switch to inferior goods. Level 1 responses will be assertive and lacking in explanations / mainly descriptive and / or or mainly lacking in relevance to the question. Level 2 responses may contain some inaccuracies and may be one sided. Analysis will be explained at least in part and will be largely relevant to the question. Level 3 responses will consider alternative policies / concepts etc. and will be balanced. Explanations of points raised will be offered and will be accurate and relevant to the question. AO3 Evaluation That clearly analyses at least two sides to the question and comes to a valid conclusion. A one-sided response cannot gain any marks for evaluation. Accept all valid responses AO1 Knowledge and understanding and AO2 Analysis 8 AO3 Evaluation 4 Section C
Q4 · With the help of an AD/AS diagram(s), explain one demand-side and one supply-side cause…
4 (a) With the help of an AD/AS diagram(s), explain one demand-side and one supply-side cause of deflation and consider which is likely to be more damaging to an economy. [8] (b) Assess the extent to which using fiscal policy would be the best way to reduce a high rate of inflation. [12] OR
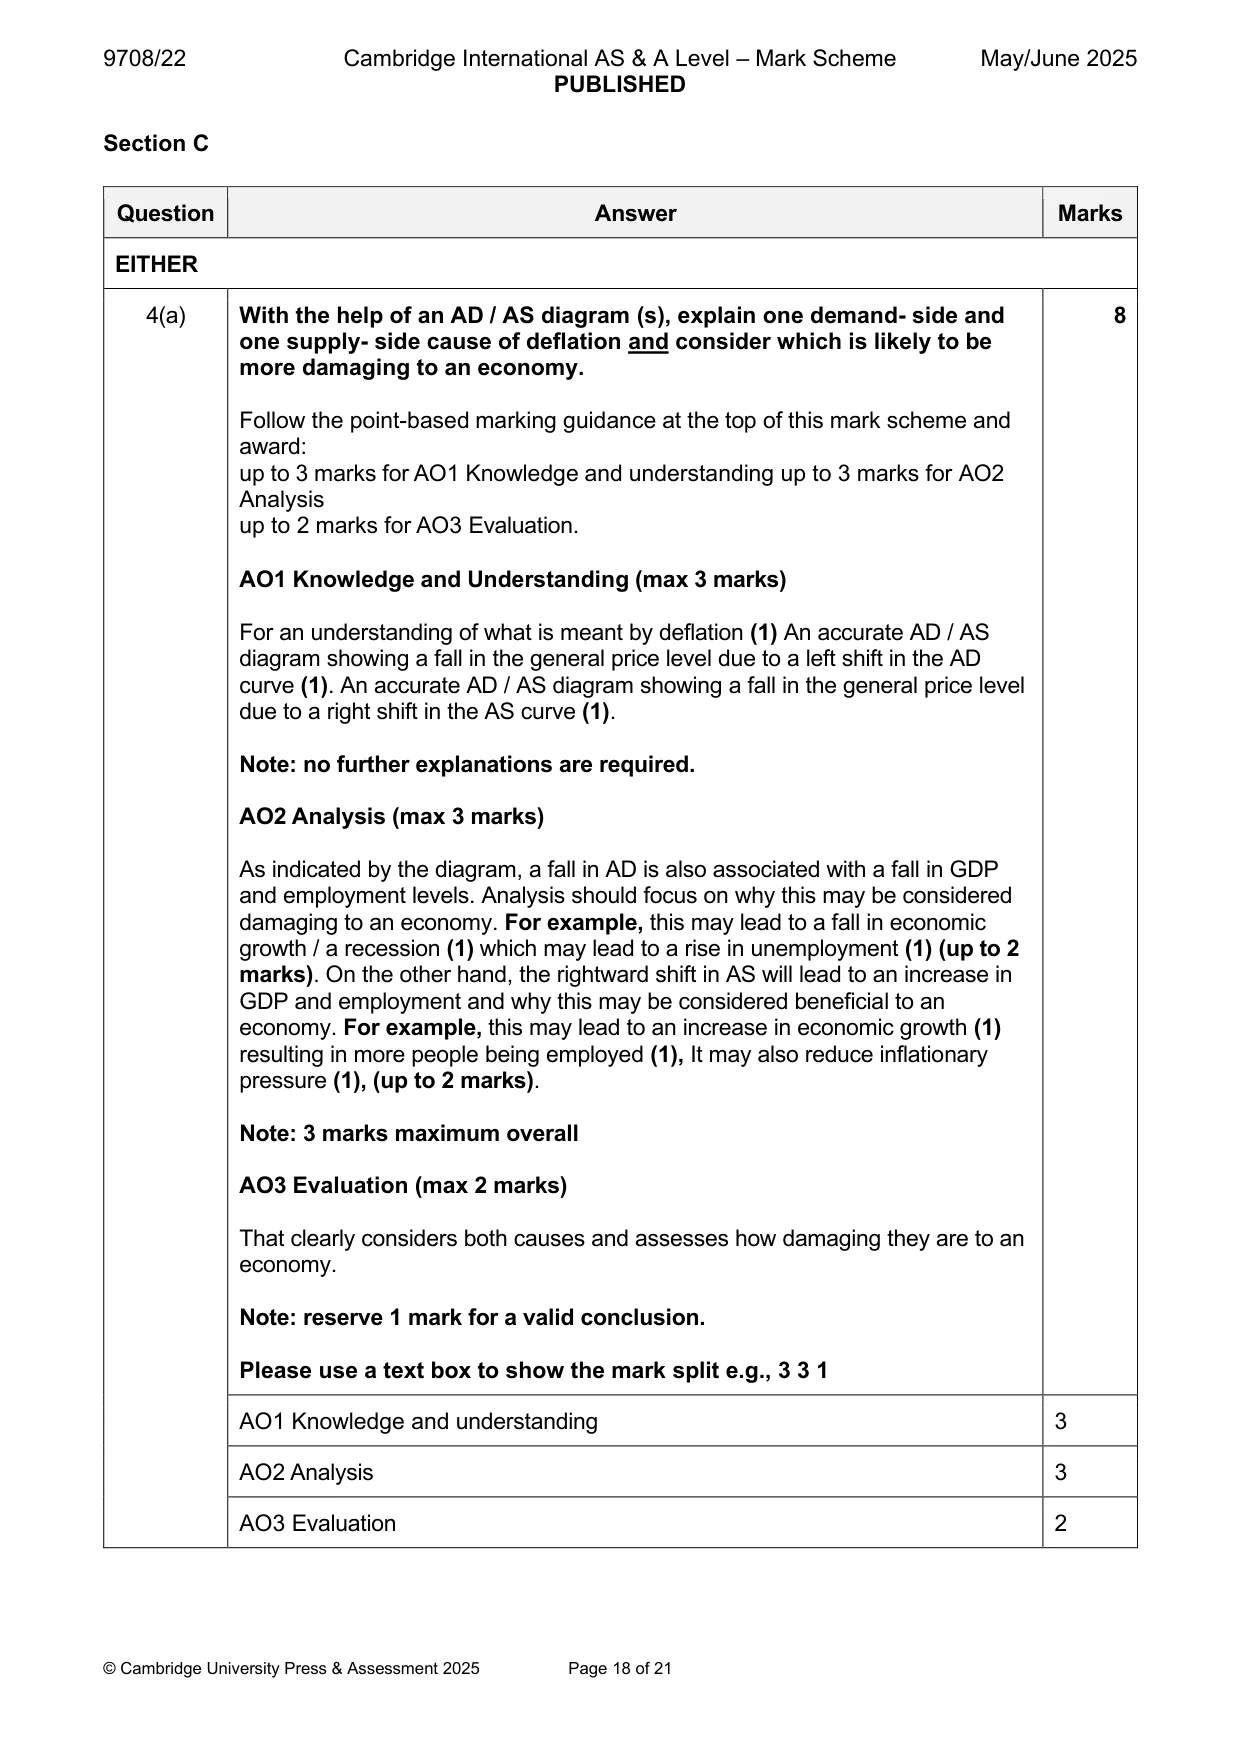
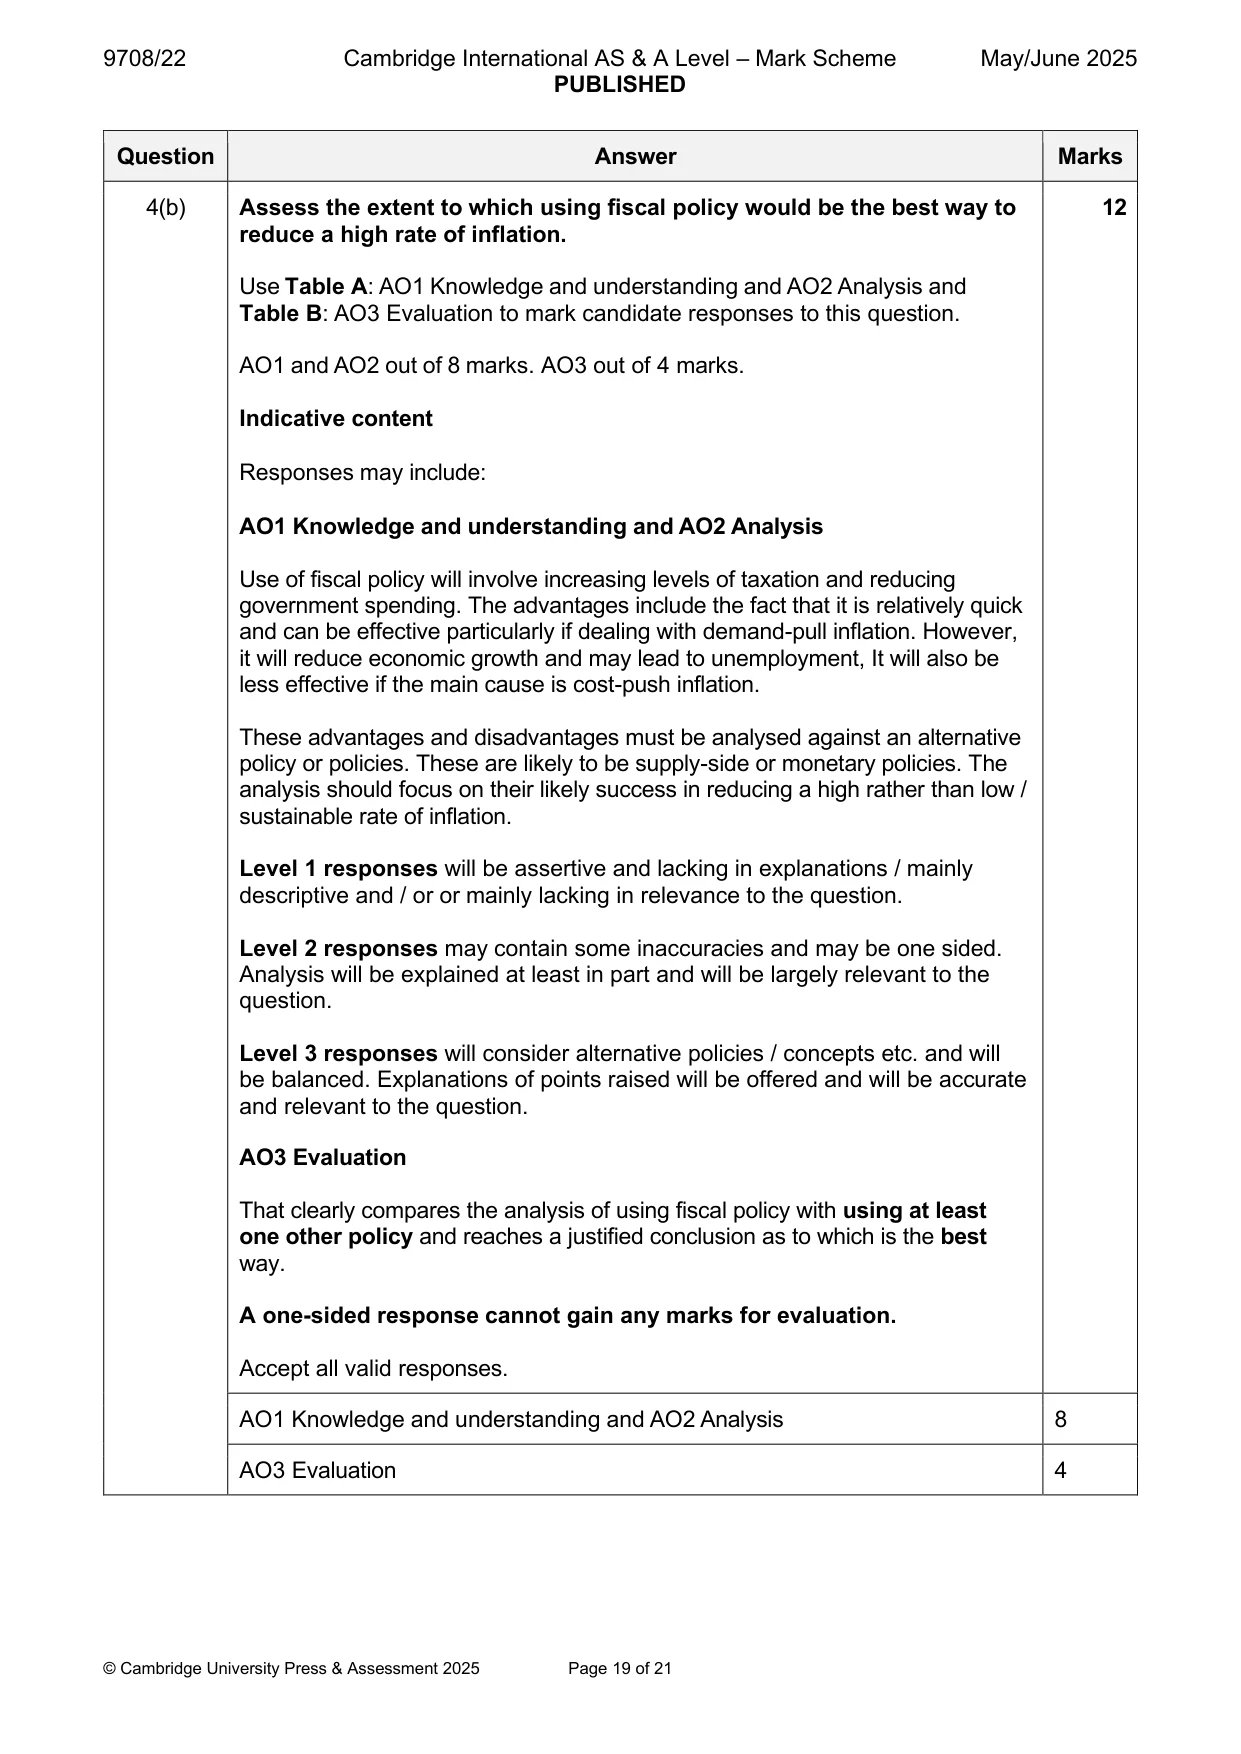
Mark scheme: 4(a) With the help of an AD / AS diagram (s), explain one demand- side and 8 one supply- side cause of deflation and consider which is likely to be more damaging to an economy. Follow the point-based marking guidance at the top of this mark scheme and award: up to 3 marks for AO1 Knowledge and understanding up to 3 marks for AO2 Analysis up to 2 marks for AO3 Evaluation. AO1 Knowledge and Understanding (max 3 marks) For an understanding of what is meant by deflation (1) An accurate AD / AS diagram showing a fall in the general price level due to a left shift in the AD curve (1). An accurate AD / AS diagram showing a fall in the general price level due to a right shift in the AS curve (1). Note: no further explanations are required. AO2 Analysis (max 3 marks) As indicated by the diagram, a fall in AD is also associated with a fall in GDP and employment levels. Analysis should focus on why this may be considered damaging to an economy. For example, this may lead to a fall in economic growth / a recession (1) which may lead to a rise in unemployment (1) (up to 2 marks). On the other hand, the rightward shift in AS will lead to an increase in GDP and employment and why this may be considered beneficial to an economy. For example, this may lead to an increase in economic growth (1) resulting in more people being employed (1), It may also reduce inflationary pressure (1), (up to 2 marks). Note: 3 marks maximum overall AO3 Evaluation (max 2 marks) That clearly considers both causes and assesses how damaging they are to an economy. Note: reserve 1 mark for a valid conclusion. Please use a text box to show the mark split e.g., 3 3 1 AO1 Knowledge and understanding 3 AO2 Analysis 3 AO3 Evaluation 2 4(b) Assess the extent to which using fiscal policy would be the best way to 12 reduce a high rate of inflation. Use Table A: AO1 Knowledge and understanding and AO2 Analysis and Table B: AO3 Evaluation to mark candidate responses to this question. AO1 and AO2 out of 8 marks. AO3 out of 4 marks. Indicative content Responses may include: AO1 Knowledge and understanding and AO2 Analysis Use of fiscal policy will involve increasing levels of taxation and reducing government spending. The advantages include the fact that it is relatively quick and can be effective particularly if dealing with demand-pull inflation. However, it will reduce economic growth and may lead to unemployment, It will also be less effective if the main cause is cost-push inflation. These advantages and disadvantages must be analysed against an alternative policy or policies. These are likely to be supply-side or monetary policies. The analysis should focus on their likely success in reducing a high rather than low / sustainable rate of inflation. Level 1 responses will be assertive and lacking in explanations / mainly descriptive and / or or mainly lacking in relevance to the question. Level 2 responses may contain some inaccuracies and may be one sided. Analysis will be explained at least in part and will be largely relevant to the question. Level 3 responses will consider alternative policies / concepts etc. and will be balanced. Explanations of points raised will be offered and will be accurate and relevant to the question. AO3 Evaluation That clearly compares the analysis of using fiscal policy with using at least one other policy and reaches a justified conclusion as to which is the best way. A one-sided response cannot gain any marks for evaluation. Accept all valid responses. AO1 Knowledge and understanding and AO2 Analysis 8 AO3 Evaluation 4
Q5 · With the help of a diagram, explain two ways in which a fall in the balance of trade in…
5 (a) With the help of a diagram, explain two ways in which a fall in the balance of trade in goods may affect the value of a floating exchange rate and consider the extent to which a change in the relative rate of interest between two countries may have a greater impact on the exchange rate. [8] (b) Assess whether an improvement in the terms of trade or a surplus on the current account of the balance of payments is of more benefit to an economy. [12]
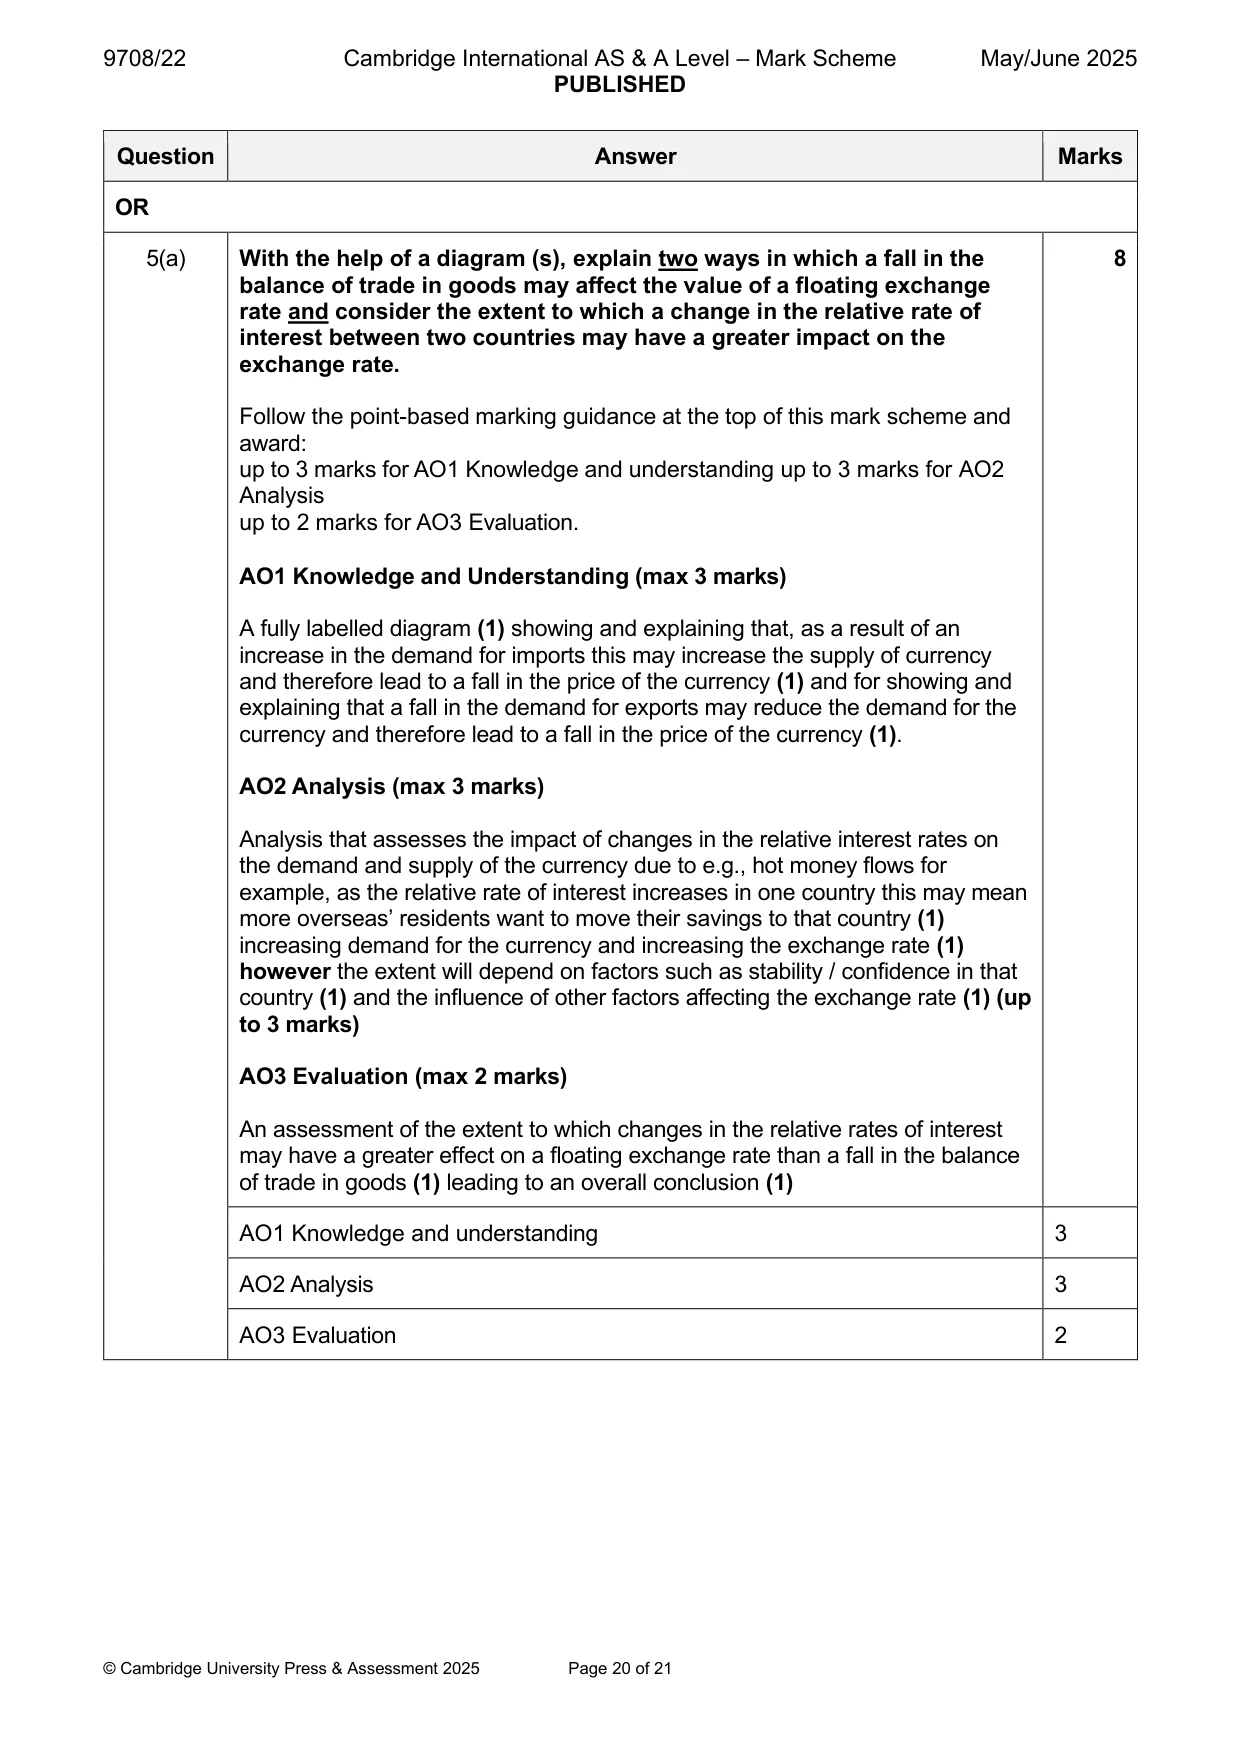
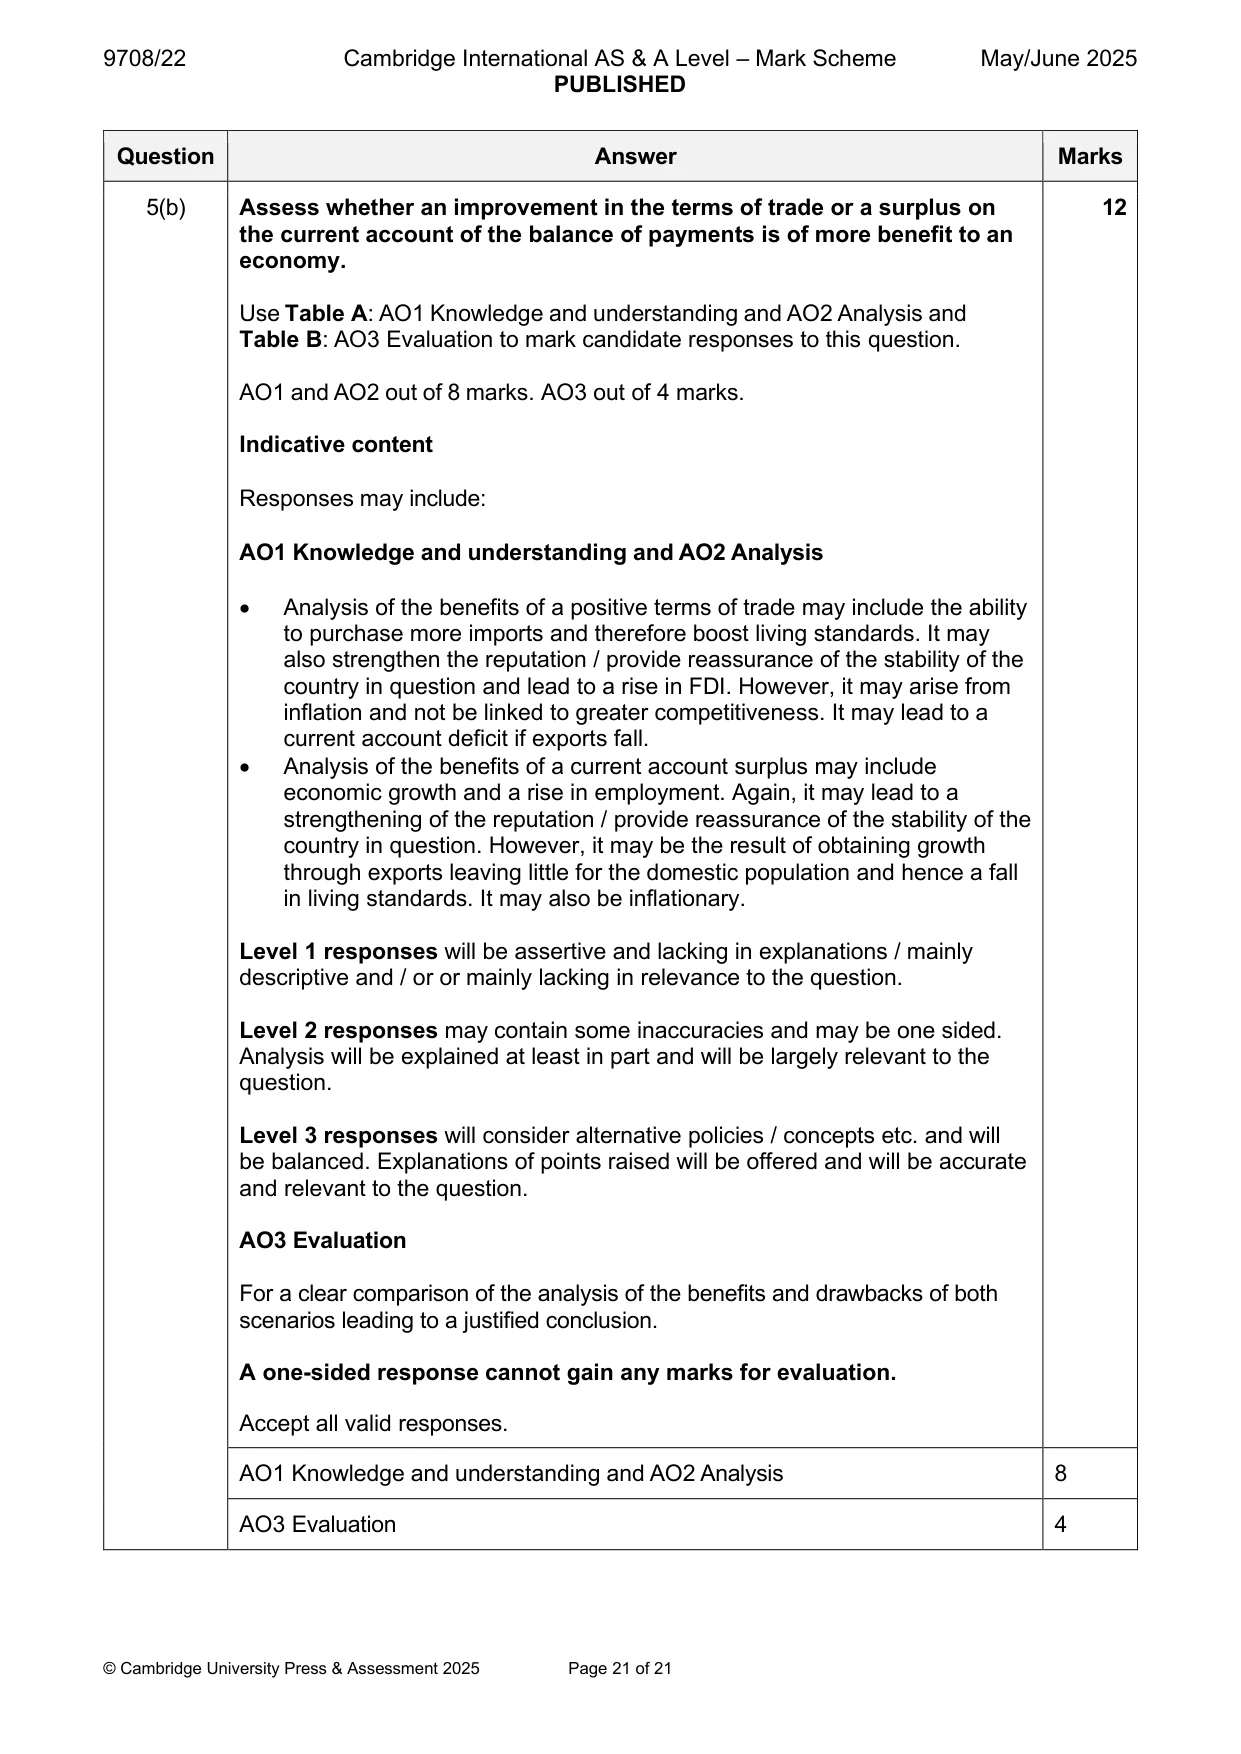
Mark scheme: 5(a) With the help of a diagram (s), explain two ways in which a fall in the 8 balance of trade in goods may affect the value of a floating exchange rate and consider the extent to which a change in the relative rate of interest between two countries may have a greater impact on the exchange rate. Follow the point-based marking guidance at the top of this mark scheme and award: up to 3 marks for AO1 Knowledge and understanding up to 3 marks for AO2 Analysis up to 2 marks for AO3 Evaluation. AO1 Knowledge and Understanding (max 3 marks) A fully labelled diagram (1) showing and explaining that, as a result of an increase in the demand for imports this may increase the supply of currency and therefore lead to a fall in the price of the currency (1) and for showing and explaining that a fall in the demand for exports may reduce the demand for the currency and therefore lead to a fall in the price of the currency (1). AO2 Analysis (max 3 marks) Analysis that assesses the impact of changes in the relative interest rates on the demand and supply of the currency due to e.g., hot money flows for example, as the relative rate of interest increases in one country this may mean more overseas’ residents want to move their savings to that country (1) increasing demand for the currency and increasing the exchange rate (1) however the extent will depend on factors such as stability / confidence in that country (1) and the influence of other factors affecting the exchange rate (1) (up to 3 marks) AO3 Evaluation (max 2 marks) An assessment of the extent to which changes in the relative rates of interest may have a greater effect on a floating exchange rate than a fall in the balance of trade in goods (1) leading to an overall conclusion (1) AO1 Knowledge and understanding 3 AO2 Analysis 3 AO3 Evaluation 2 5(b) Assess whether an improvement in the terms of trade or a surplus on 12 the current account of the balance of payments is of more benefit to an economy. Use Table A: AO1 Knowledge and understanding and AO2 Analysis and Table B: AO3 Evaluation to mark candidate responses to this question. AO1 and AO2 out of 8 marks. AO3 out of 4 marks. Indicative content Responses may include: AO1 Knowledge and understanding and AO2 Analysis • Analysis of the benefits of a positive terms of trade may include the ability to purchase more imports and therefore boost living standards. It may also strengthen the reputation / provide reassurance of the stability of the country in question and lead to a rise in FDI. However, it may arise from inflation and not be linked to greater competitiveness. It may lead to a current account deficit if exports fall. • Analysis of the benefits of a current account surplus may include economic growth and a rise in employment. Again, it may lead to a strengthening of the reputation / provide reassurance of the stability of the country in question. However, it may be the result of obtaining growth through exports leaving little for the domestic population and hence a fall in living standards. It may also be inflationary. Level 1 responses will be assertive and lacking in explanations / mainly descriptive and / or or mainly lacking in relevance to the question. Level 2 responses may contain some inaccuracies and may be one sided. Analysis will be explained at least in part and will be largely relevant to the question. Level 3 responses will consider alternative policies / concepts etc. and will be balanced. Explanations of points raised will be offered and will be accurate and relevant to the question. AO3 Evaluation For a clear comparison of the analysis of the benefits and drawbacks of both scenarios leading to a justified conclusion. A one-sided response cannot gain any marks for evaluation. Accept all valid responses. AO1 Knowledge and understanding and AO2 Analysis 8 AO3 Evaluation 4
More questions on Current account of the balance of payments
What was in this paper
The subtopics covered by these 5 questions, and how many questions each got. Open one in a new tab to see every Cambridge question on it.
What you needed in this session
Cambridge’s own grade thresholds for 2025 May/June, Paper 2 · Variant 2. A higher threshold means an easier paper — the bar moves with how the cohort did.