Cambridge A Level Economics 9708 — 2024 Feb/March Paper 2 · Variant 2
9708/22/F/M/24 · 5 questions · 60 marks · ≈68 min
The question paper and its mark scheme, free to read here and free to download. This is Cambridge’s own paper, exactly as it was sat.
Question paper4 pages
Mark scheme17 pages
Answers below. Sit the paper first if you are practising.
Questions as text
Q1 · Artificial Intelligence Artificial Intelligence (AI) is a form of technological progress
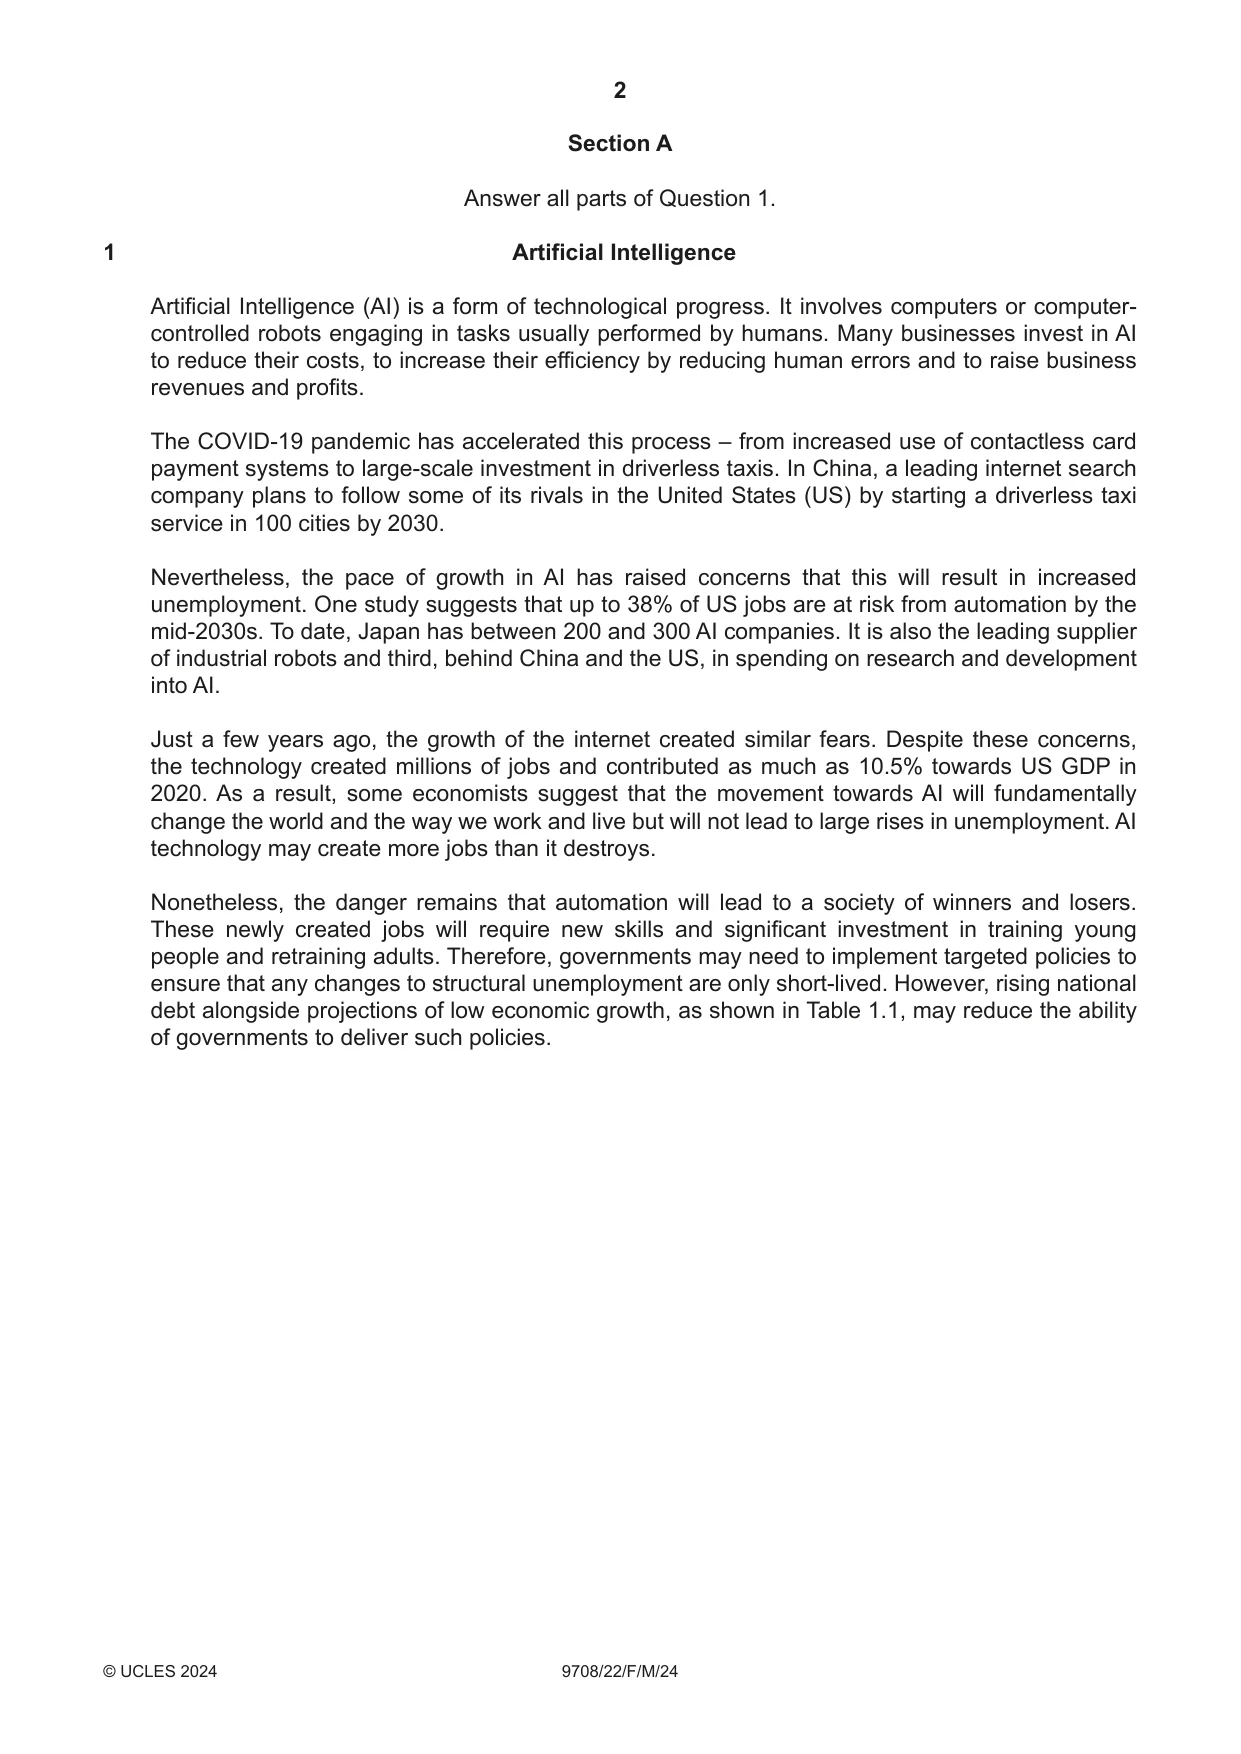
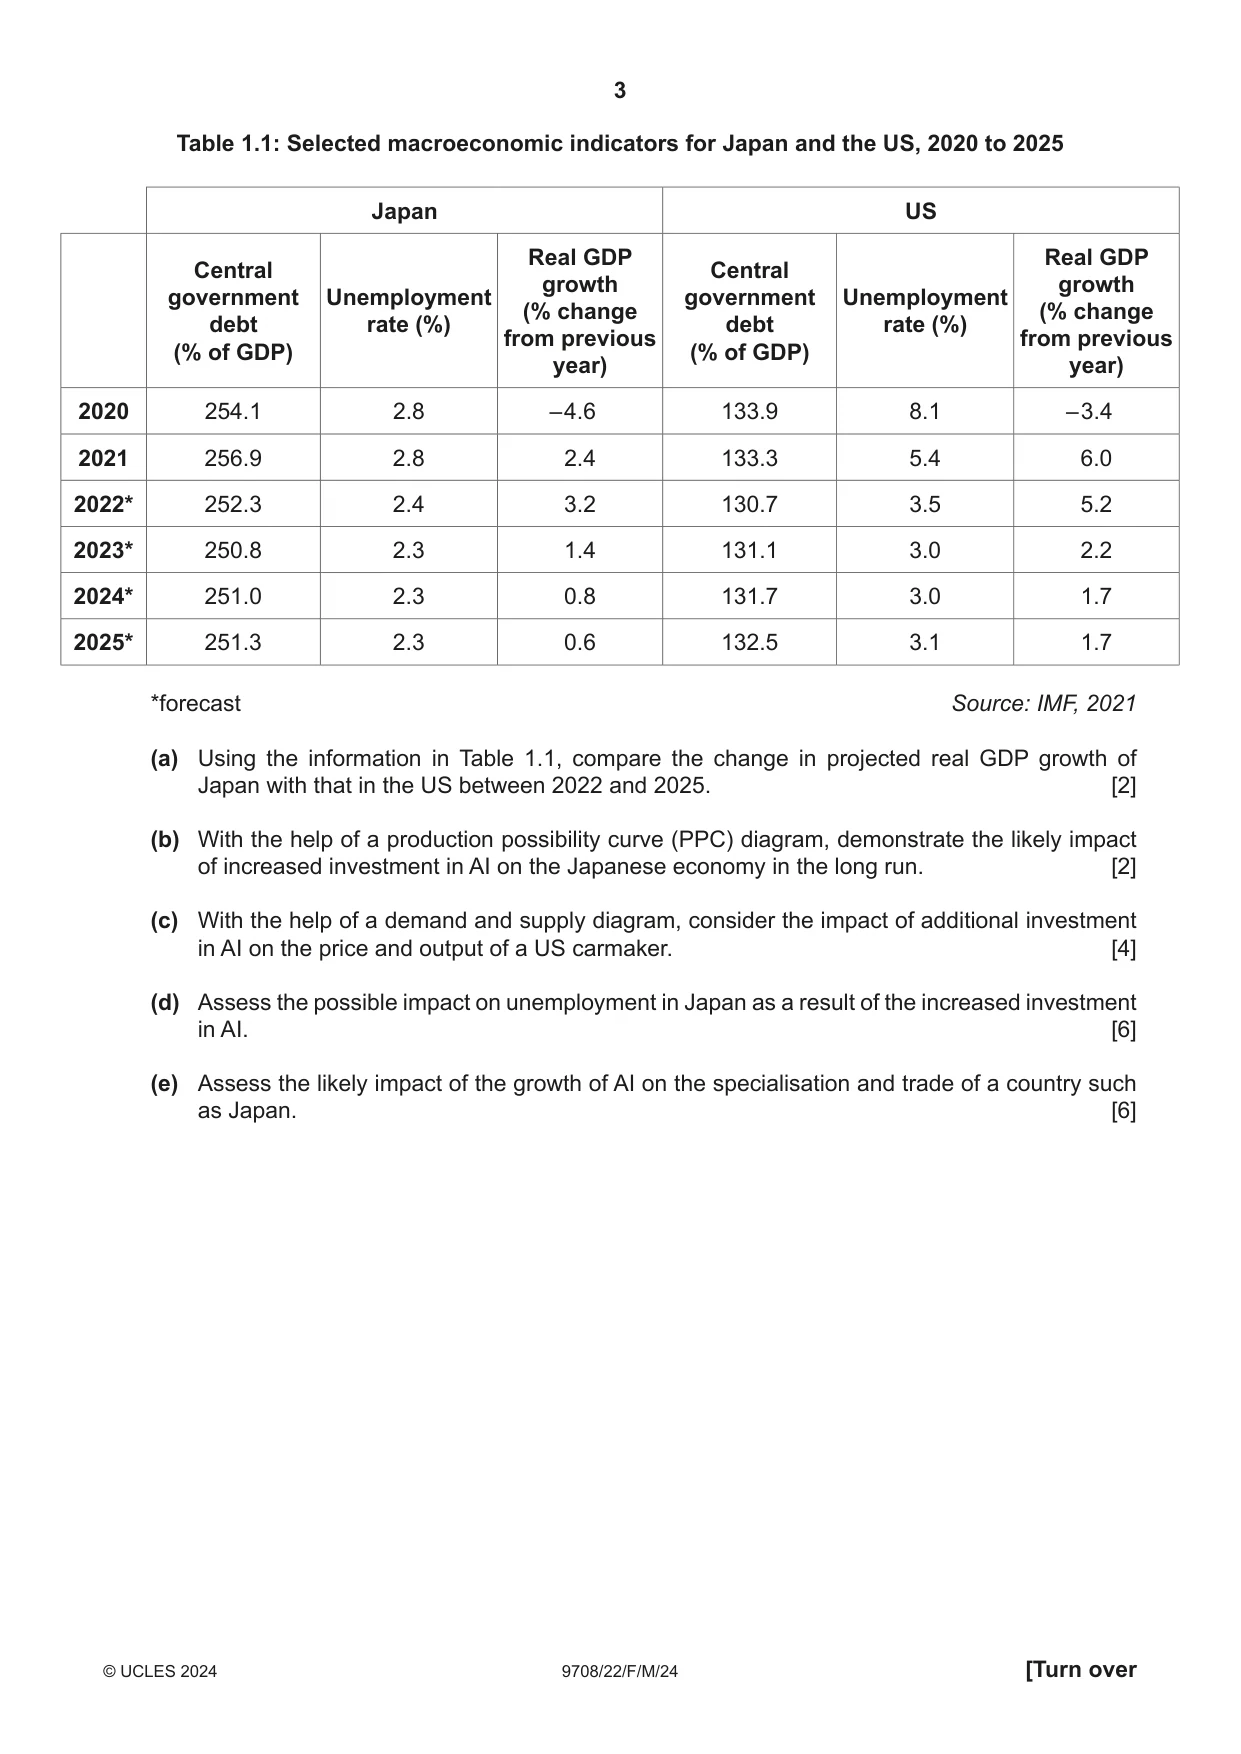
1 Artificial Intelligence Artificial Intelligence (AI) is a form of technological progress. It involves computers or computer- controlled robots engaging in tasks usually performed by humans. Many businesses invest in AI to reduce their costs, to increase their efficiency by reducing human errors and to raise business revenues and profits. The COVID-19 pandemic has accelerated this process – from increased use of contactless card payment systems to large-scale investment in driverless taxis. In China, a leading internet search company plans to follow some of its rivals in the United States (US) by starting a driverless taxi service in 100 cities by 2030. Nevertheless, the pace of growth in AI has raised concerns that this will result in increased unemployment. One study suggests that up to 38% of US jobs are at risk from automation by the mid-2030s. To date, Japan has between 200 and 300 AI companies. It is also the leading supplier of industrial robots and third, behind China and the US, in spending on research and development into AI. Just a few years ago, the growth of the internet created similar fears. Despite these concerns, the technology created millions of jobs and contributed as much as 10.5% towards US GDP in 2020. As a result, some economists suggest that the movement towards AI will fundamentally change the world and the way we work and live but will not lead to large rises in unemployment. AI technology may create more jobs than it destroys. Nonetheless, the danger remains that automation will lead to a society of winners and losers. These newly created jobs will require new skills and significant investment in training young people and retraining adults. Therefore, governments may need to implement targeted policies to ensure that any changes to structural unemployment are only short-lived. However, rising national debt alongside projections of low economic growth, as shown in Table 1.1, may reduce the ability of governments to deliver such policies. Table 1.1: Selected macroeconomic indicators for Japan and the US, 2020 to 2025 Japan US Real GDP Real GDP Central Central growth growth government Unemployment government Unemployment (% change (% change debt rate (%) debt rate (%) from previous from previous (% of GDP) (% of GDP) year) year) 2020 254.1 2.8 – 4.6 133.9 8.1 – 3.4 2021 256.9 2.8 2.4 133.3 5.4 6.0 2022* 252.3 2.4 3.2 130.7 3.5 5.2 2023* 250.8 2.3 1.4 131.1 3.0 2.2 2024* 251.0 2.3 0.8 131.7 3.0 1.7 2025* 251.3 2.3 0.6 132.5 3.1 1.7 *forecast Source: IMF, 2021 (a) Using the information in Table 1.1, compare the change in projected real GDP growth of Japan with that in the US between 2022 and 2025. [2] (b) With the help of a production possibility curve (PPC) diagram, demonstrate the likely impact of increased investment in AI on the Japanese economy in the long run. [2] (c) With the help of a demand and supply diagram, consider the impact of additional investment in AI on the price and output of a US carmaker. [4] (d) Assess the possible impact on unemployment in Japan as a result of the increased investment in AI. [6] (e) Assess the likely impact of the growth of AI on the specialisation and trade of a country such as Japan. [6]
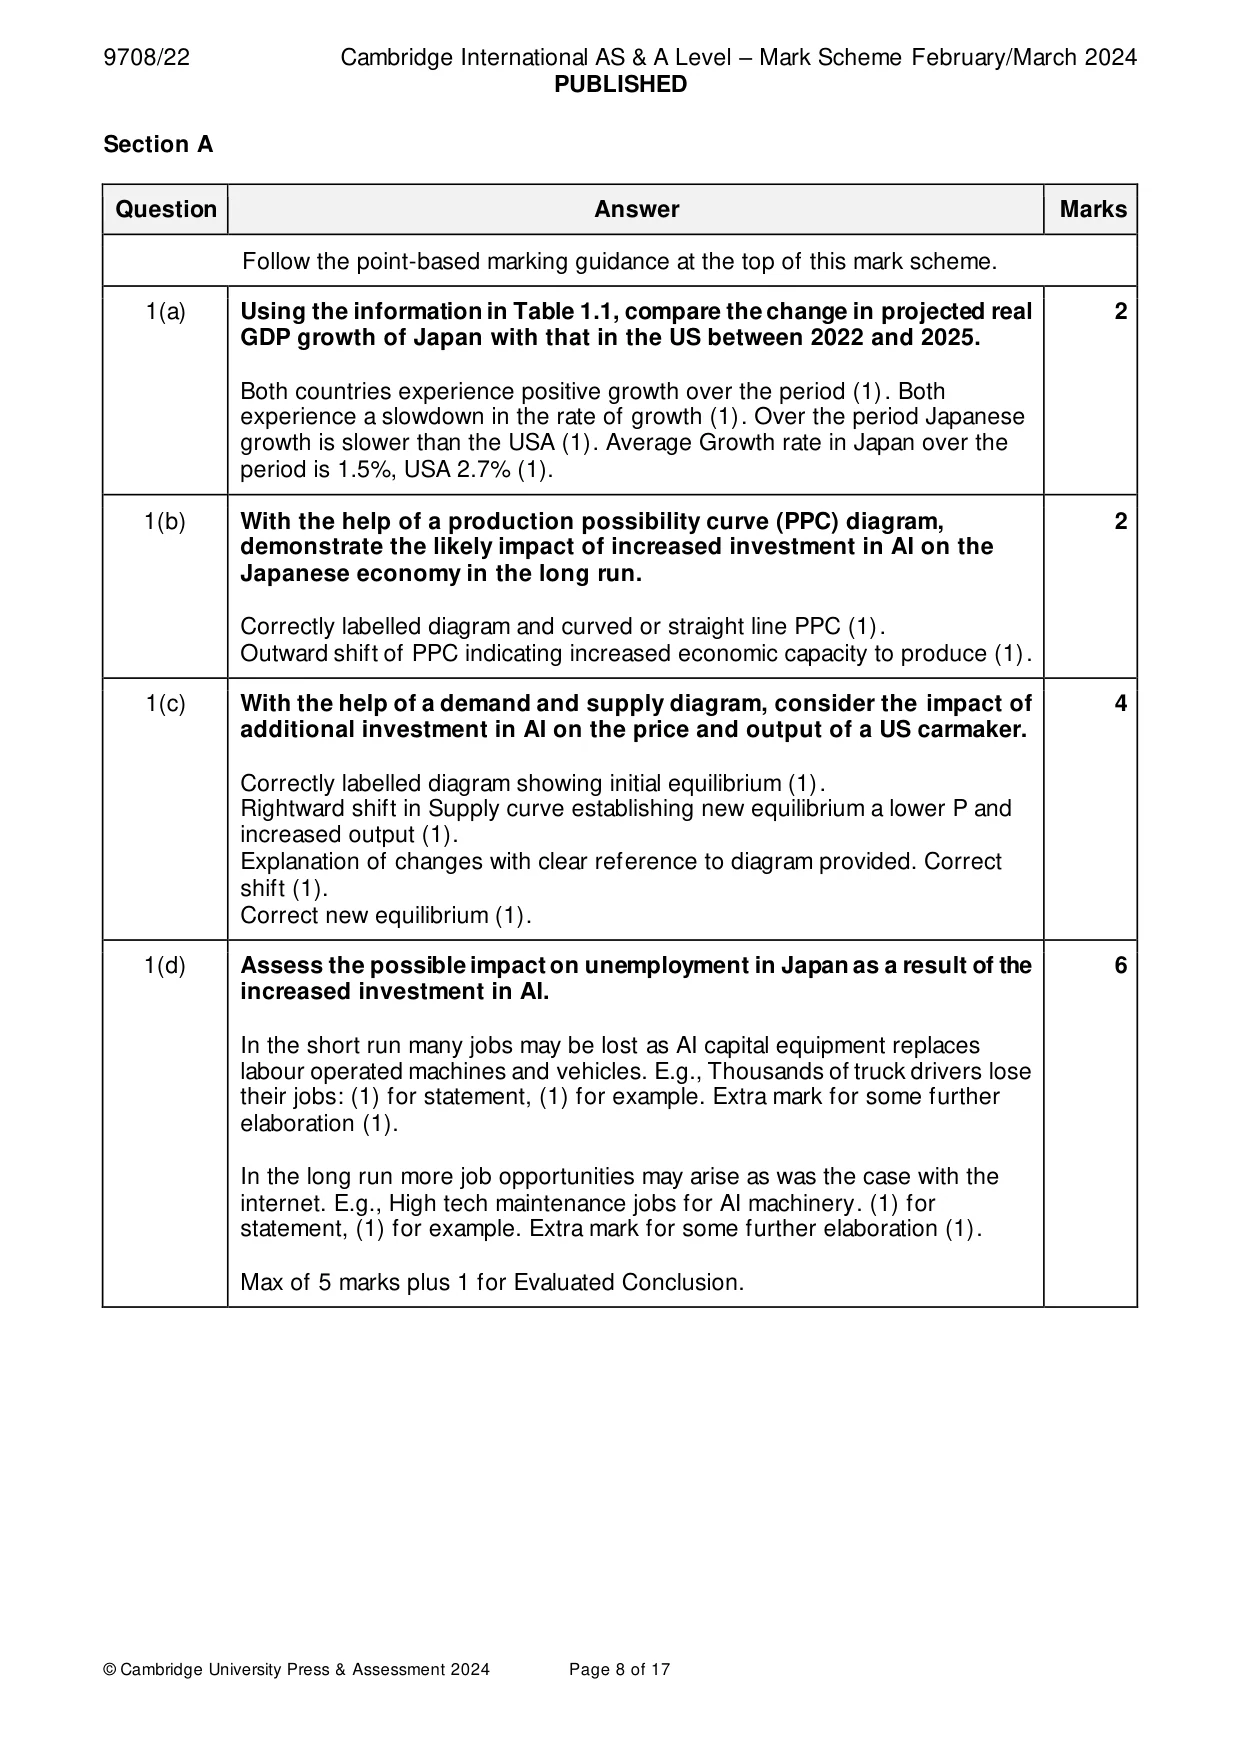
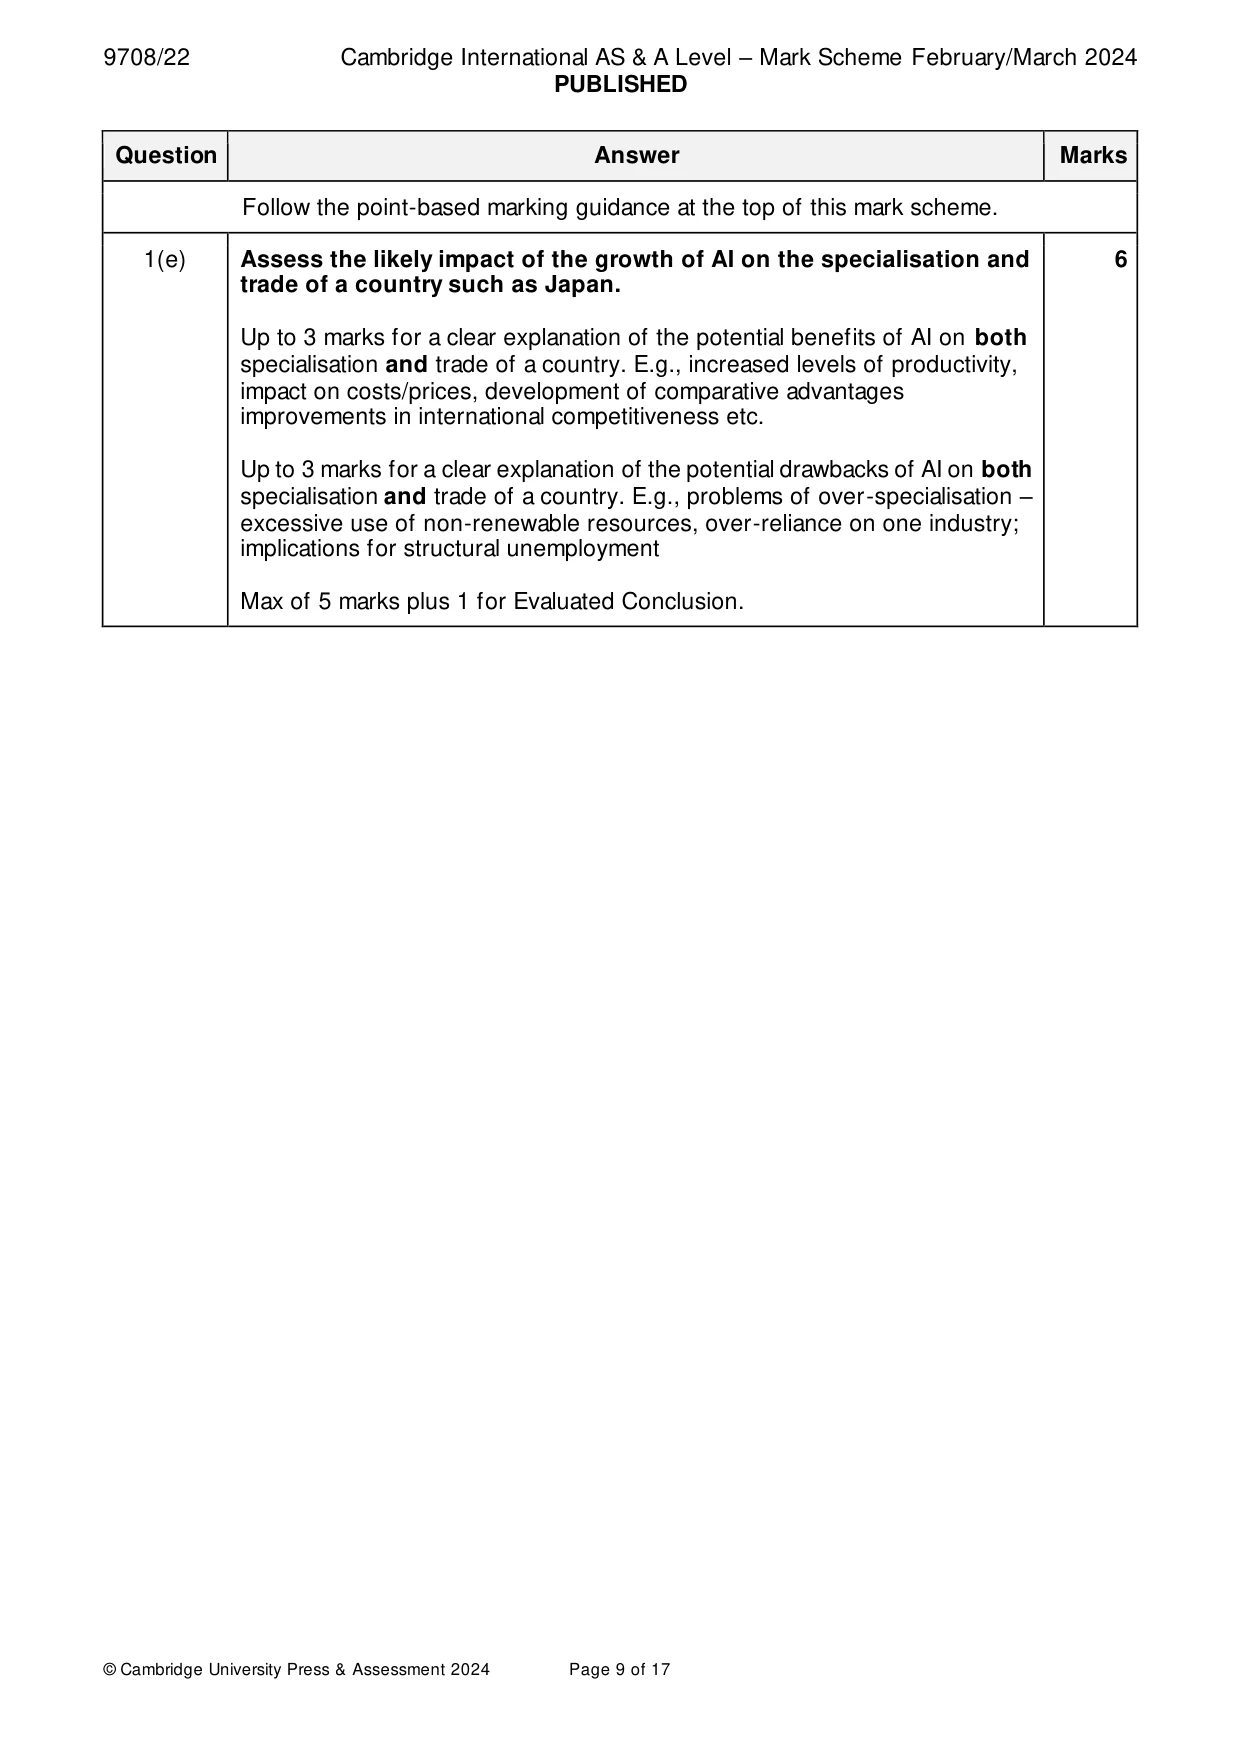
Mark scheme: Question Answer Marks Follow the point-based marking guidance at the top of this mark scheme. 1(a) Using the information in Table 1.1, compare the change in projected real 2 GDP growth of Japan with that in the US between 2022 and 2025. Both countries experience positive growth over the period (1). Both experience a slowdown in the rate of growth (1). Over the period Japanese growth is slower than the USA (1). Average Growth rate in Japan over the period is 1.5%, USA 2.7% (1). 1(b) With the help of a production possibility curve (PPC) diagram, 2 demonstrate the likely impact of increased investment in AI on the Japanese economy in the long run. Correctly labelled diagram and curved or straight line PPC (1). Outward shift of PPC indicating increased economic capacity to produce (1). 1(c) With the help of a demand and supply diagram, consider the impact of 4 additional investment in AI on the price and output of a US carmaker. Correctly labelled diagram showing initial equilibrium (1). Rightward shift in Supply curve establishing new equilibrium a lower P and increased output (1). Explanation of changes with clear reference to diagram provided. Correct shift (1). Correct new equilibrium (1). 1(d) Assess the possible impact on unemployment in Japan as a result of the 6 increased investment in AI. In the short run many jobs may be lost as AI capital equipment replaces labour operated machines and vehicles. E.g., Thousands of truck drivers lose their jobs: (1) for statement, (1) for example. Extra mark for some further elaboration (1). In the long run more job opportunities may arise as was the case with the internet. E.g., High tech maintenance jobs for AI machinery. (1) for statement, (1) for example. Extra mark for some further elaboration (1). Max of 5 marks plus 1 for Evaluated Conclusion. 1(e) Assess the likely impact of the growth of AI on the specialisation and 6 trade of a country such as Japan. Up to 3 marks for a clear explanation of the potential benefits of AI on both specialisation and trade of a country. E.g., increased levels of productivity, impact on costs/prices, development of comparative advantages improvements in international competitiveness etc. Up to 3 marks for a clear explanation of the potential drawbacks of AI on both specialisation and trade of a country. E.g., problems of over-specialisation – excessive use of non-renewable resources, over-reliance on one industry; implications for structural unemployment Max of 5 marks plus 1 for Evaluated Conclusion. Section B
Q2 · With the help of a demand and supply diagram, explain how the introduction of an indirect…
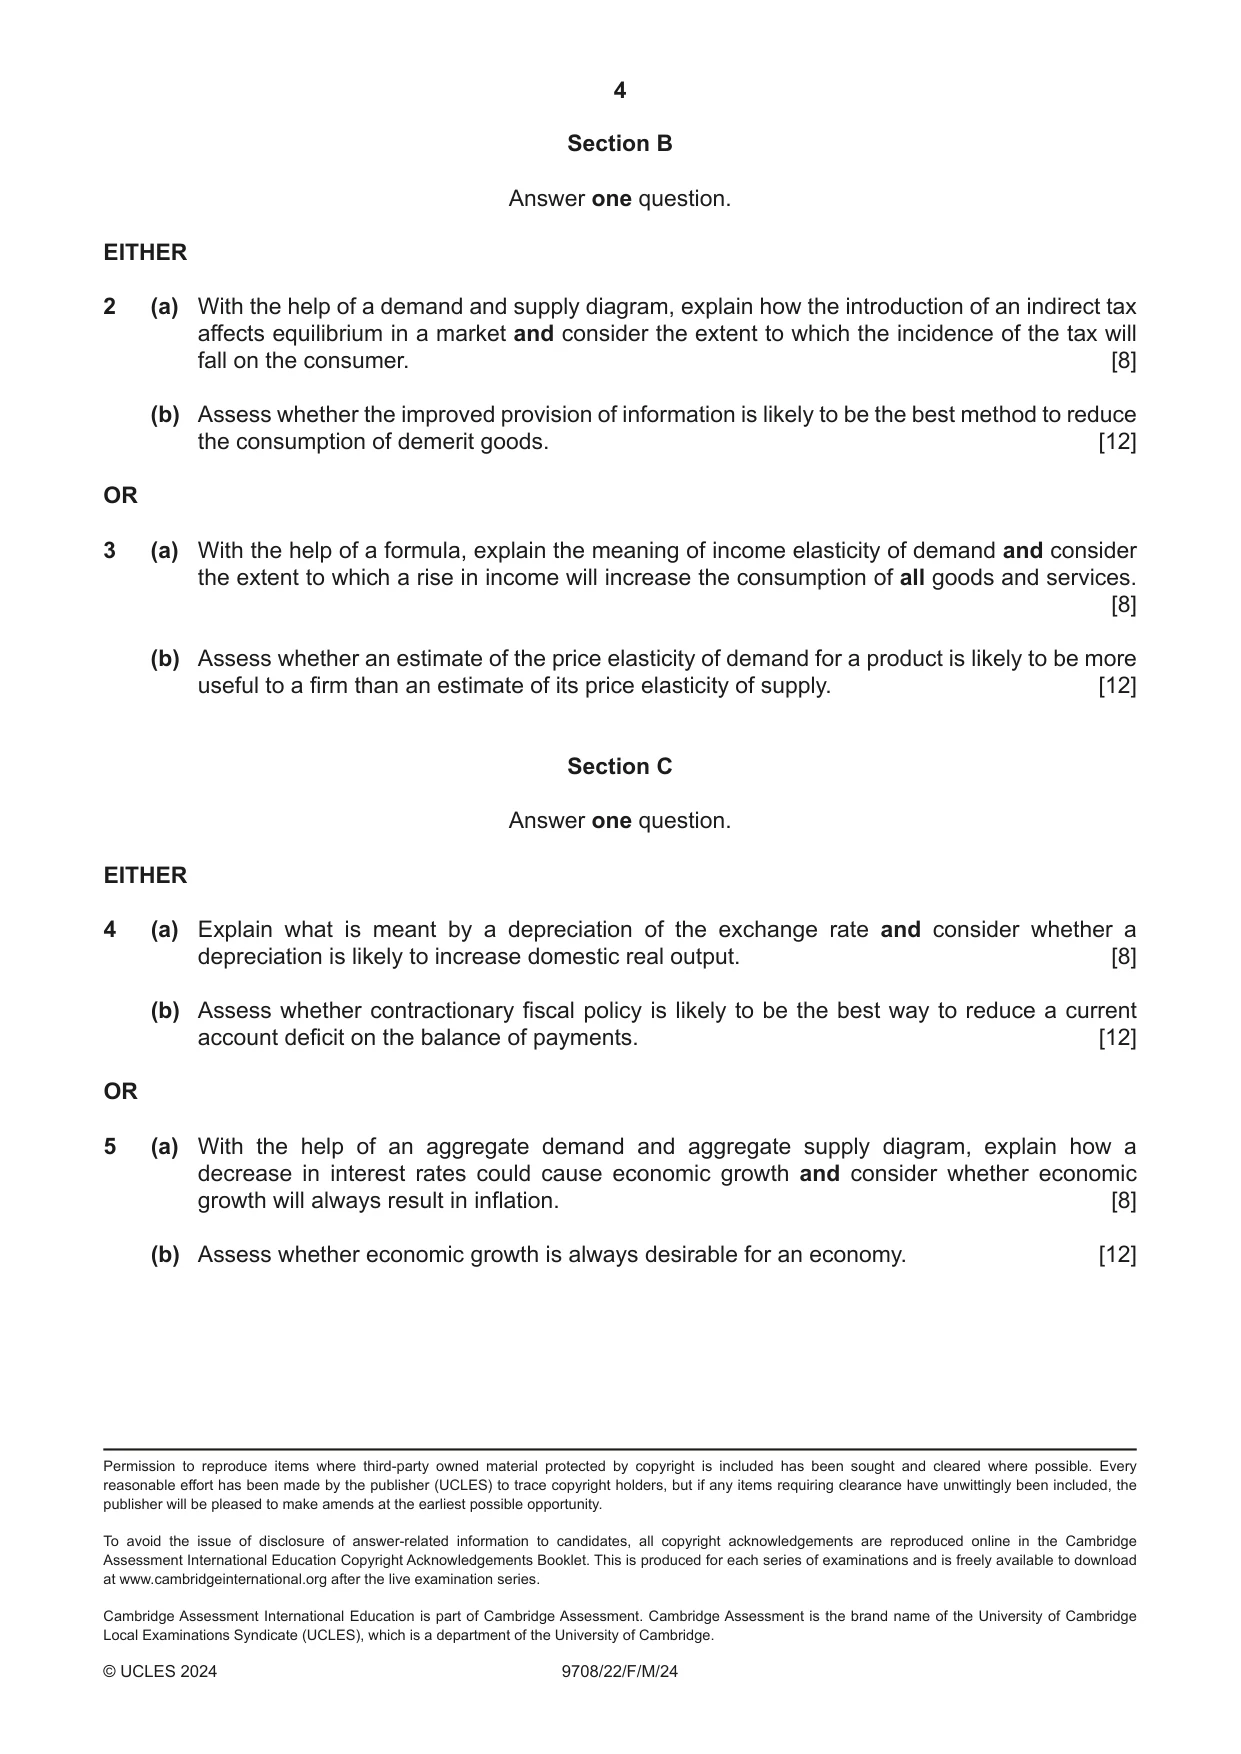
2 (a) With the help of a demand and supply diagram, explain how the introduction of an indirect tax affects equilibrium in a market and consider the extent to which the incidence of the tax will fall on the consumer. [8] (b) Assess whether the improved provision of information is likely to be the best method to reduce the consumption of demerit goods. [12] OR
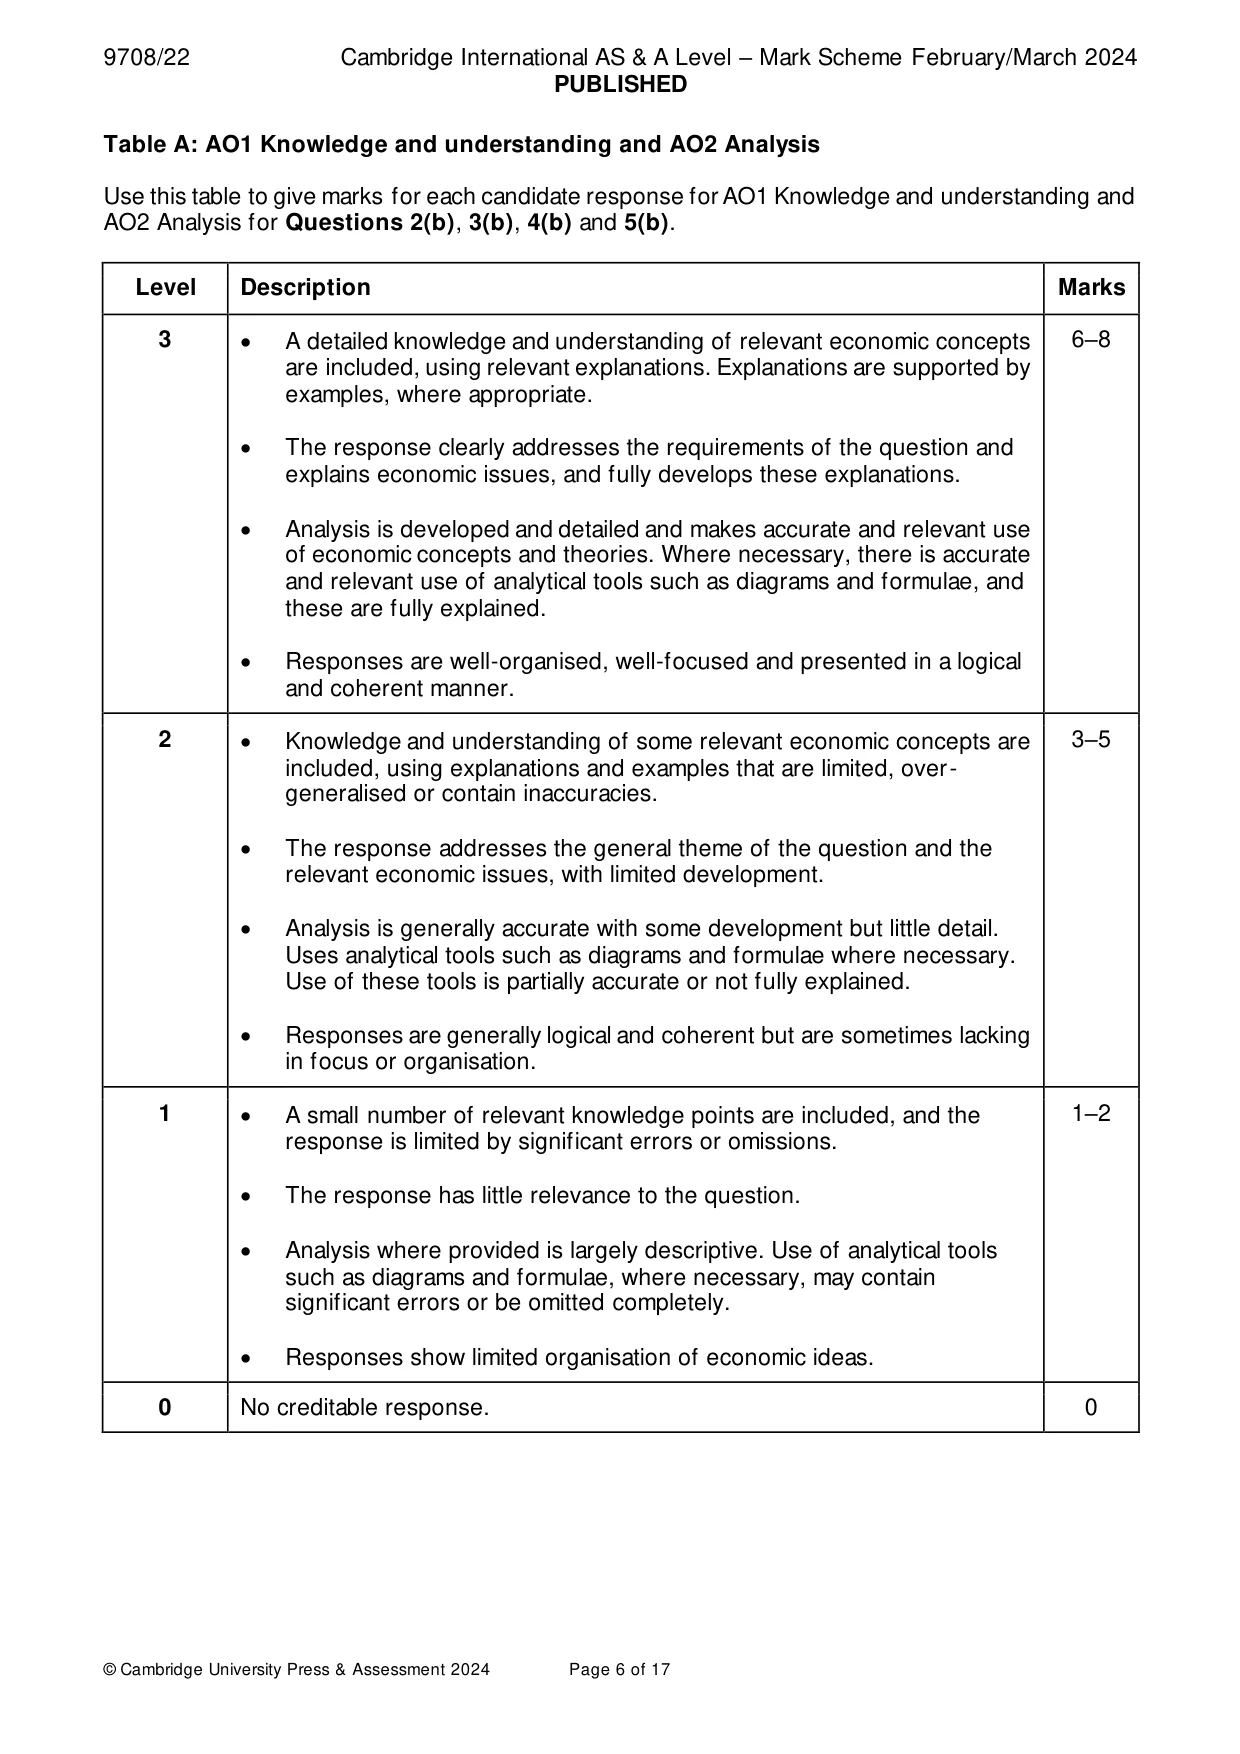
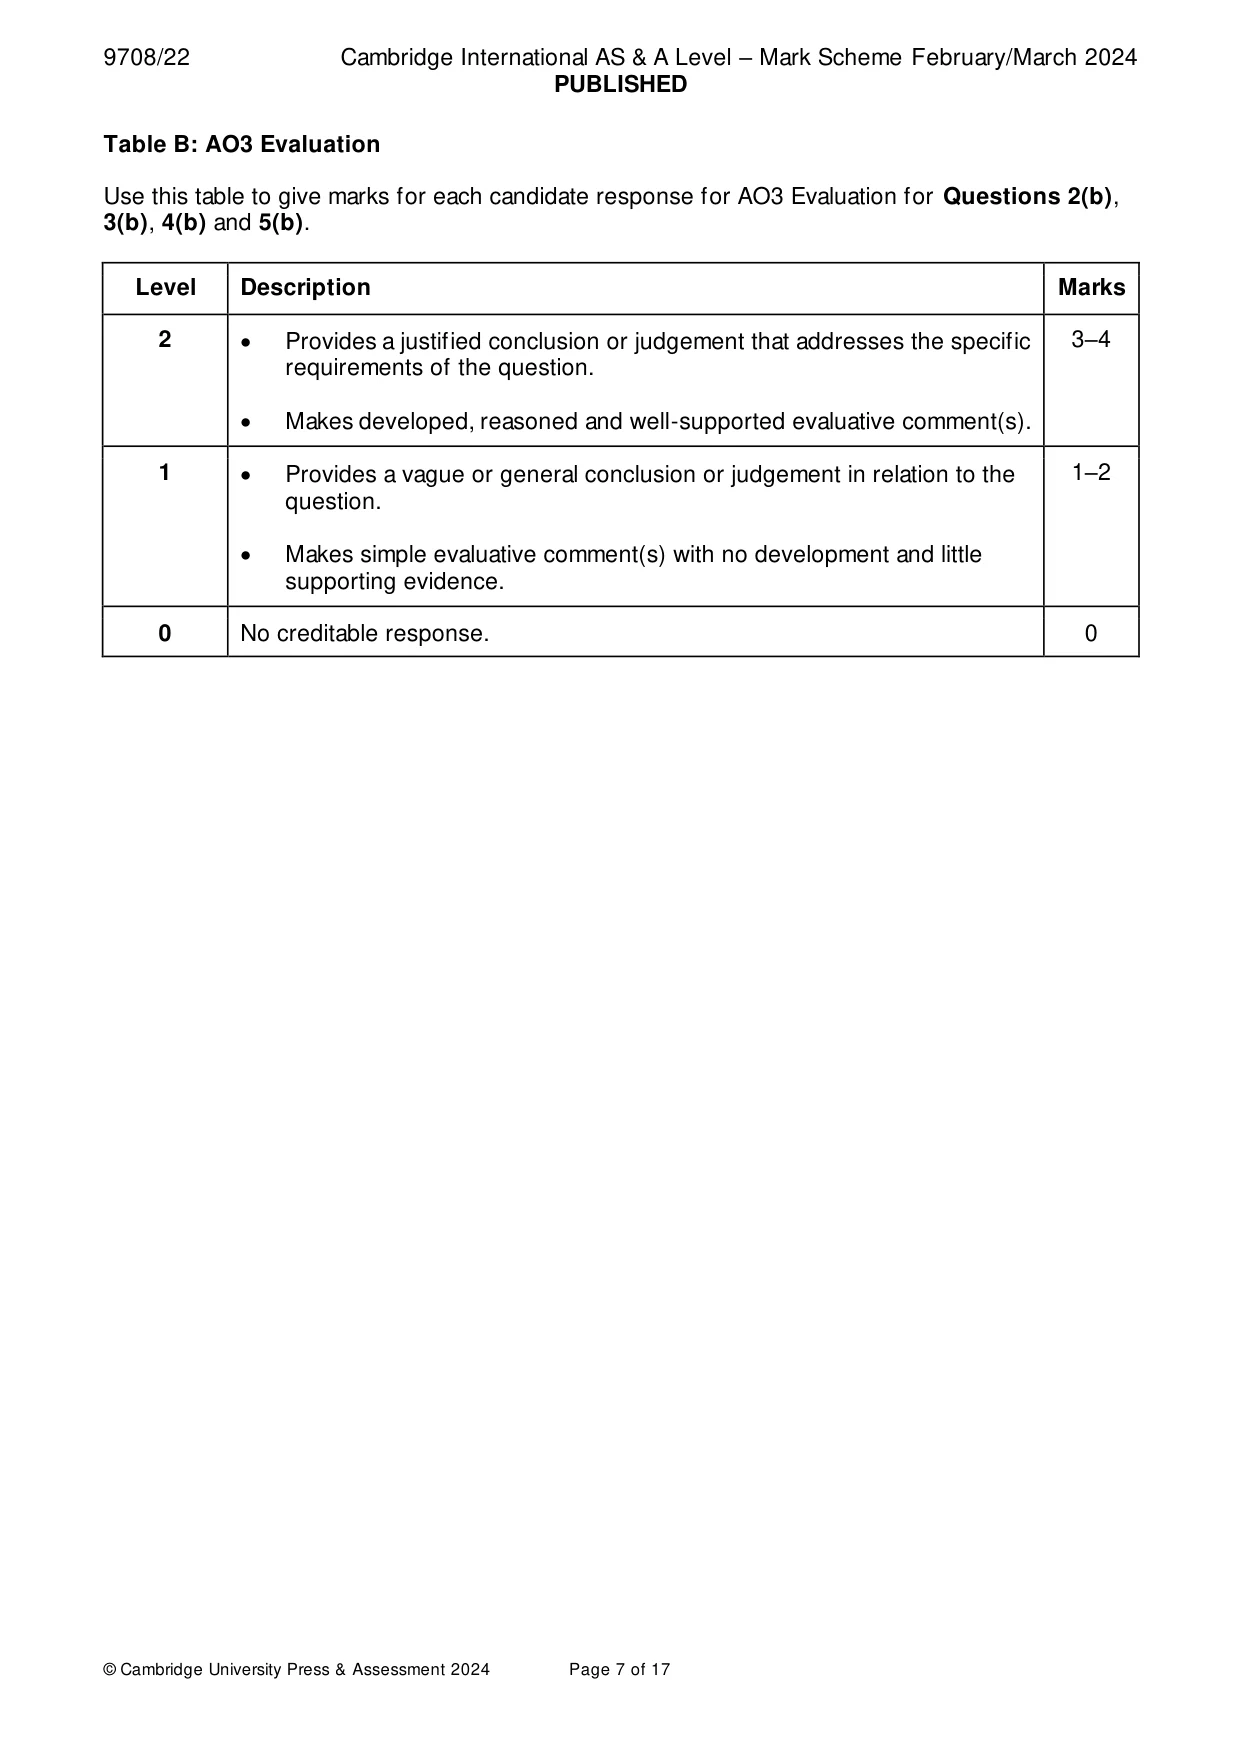
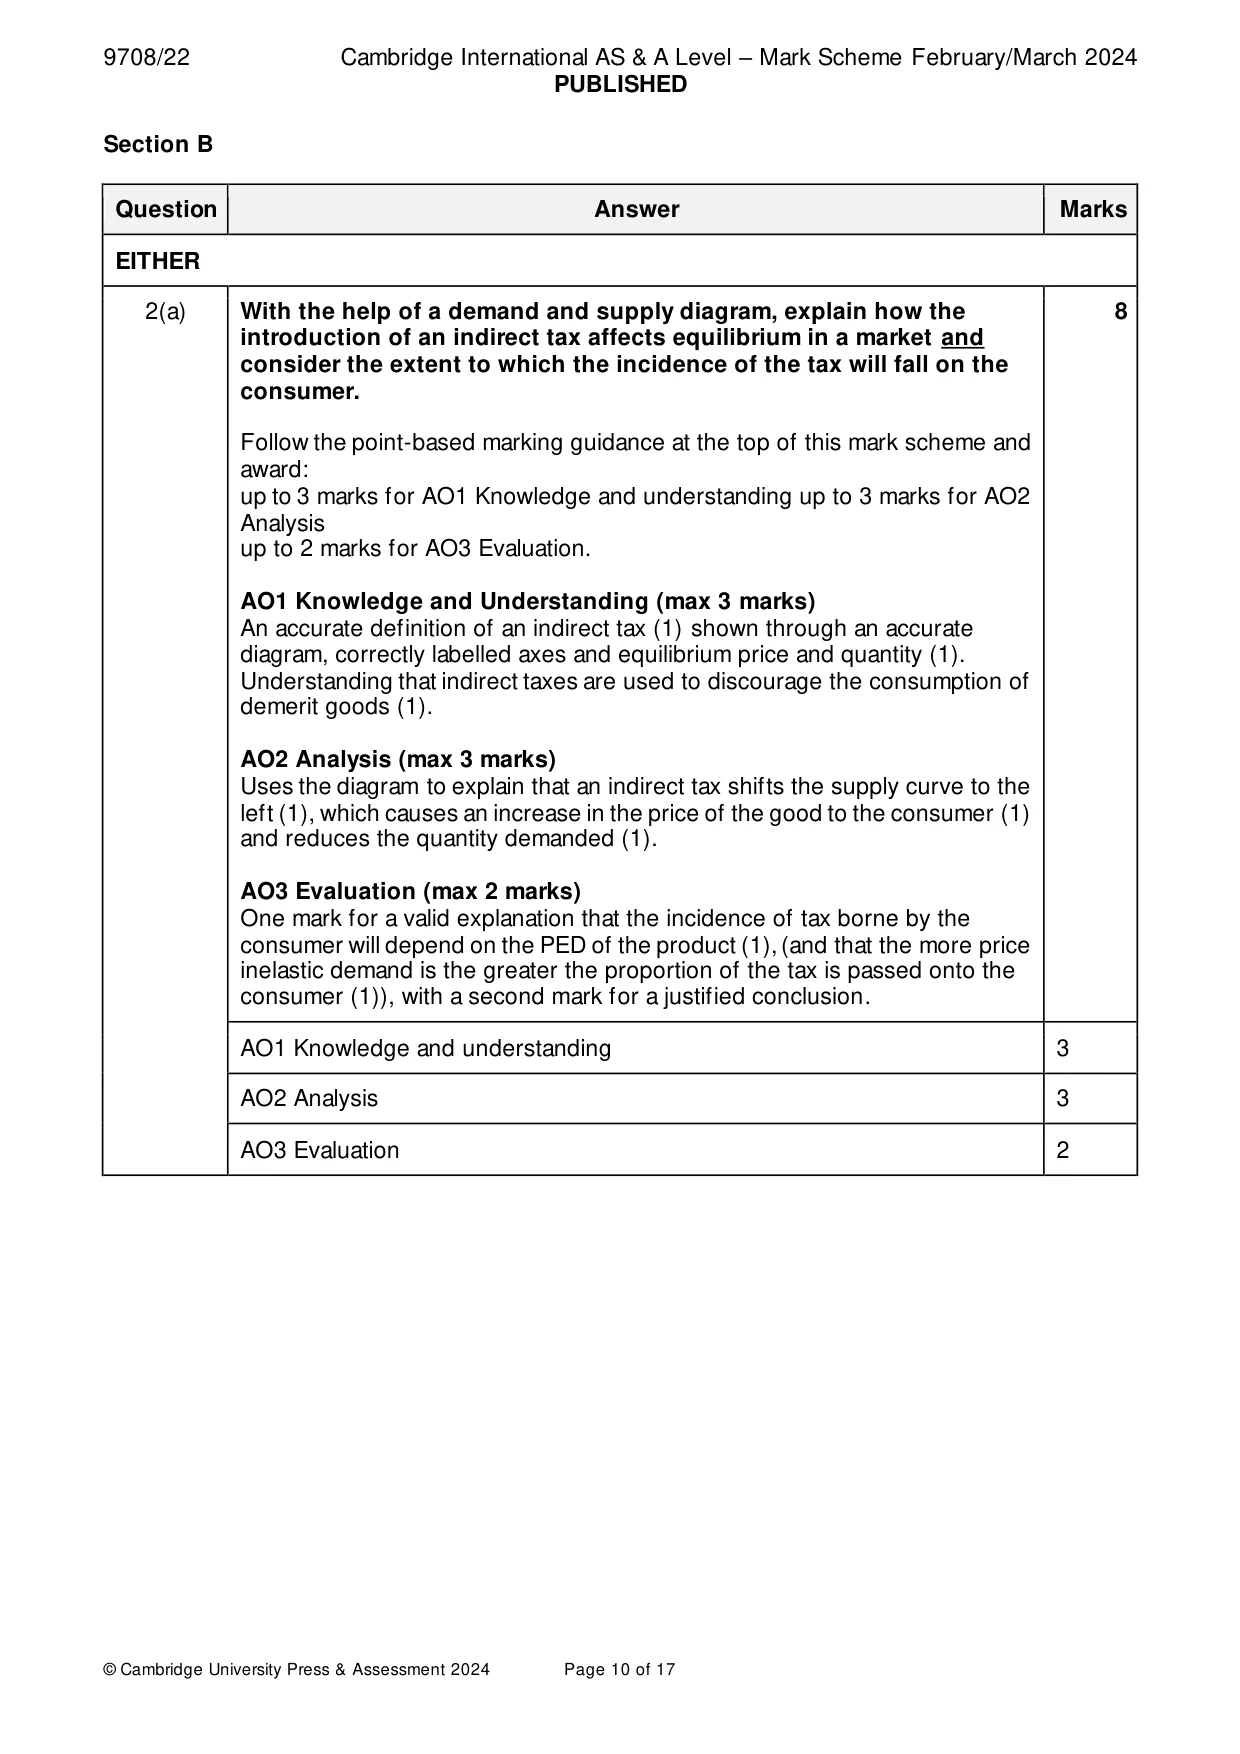
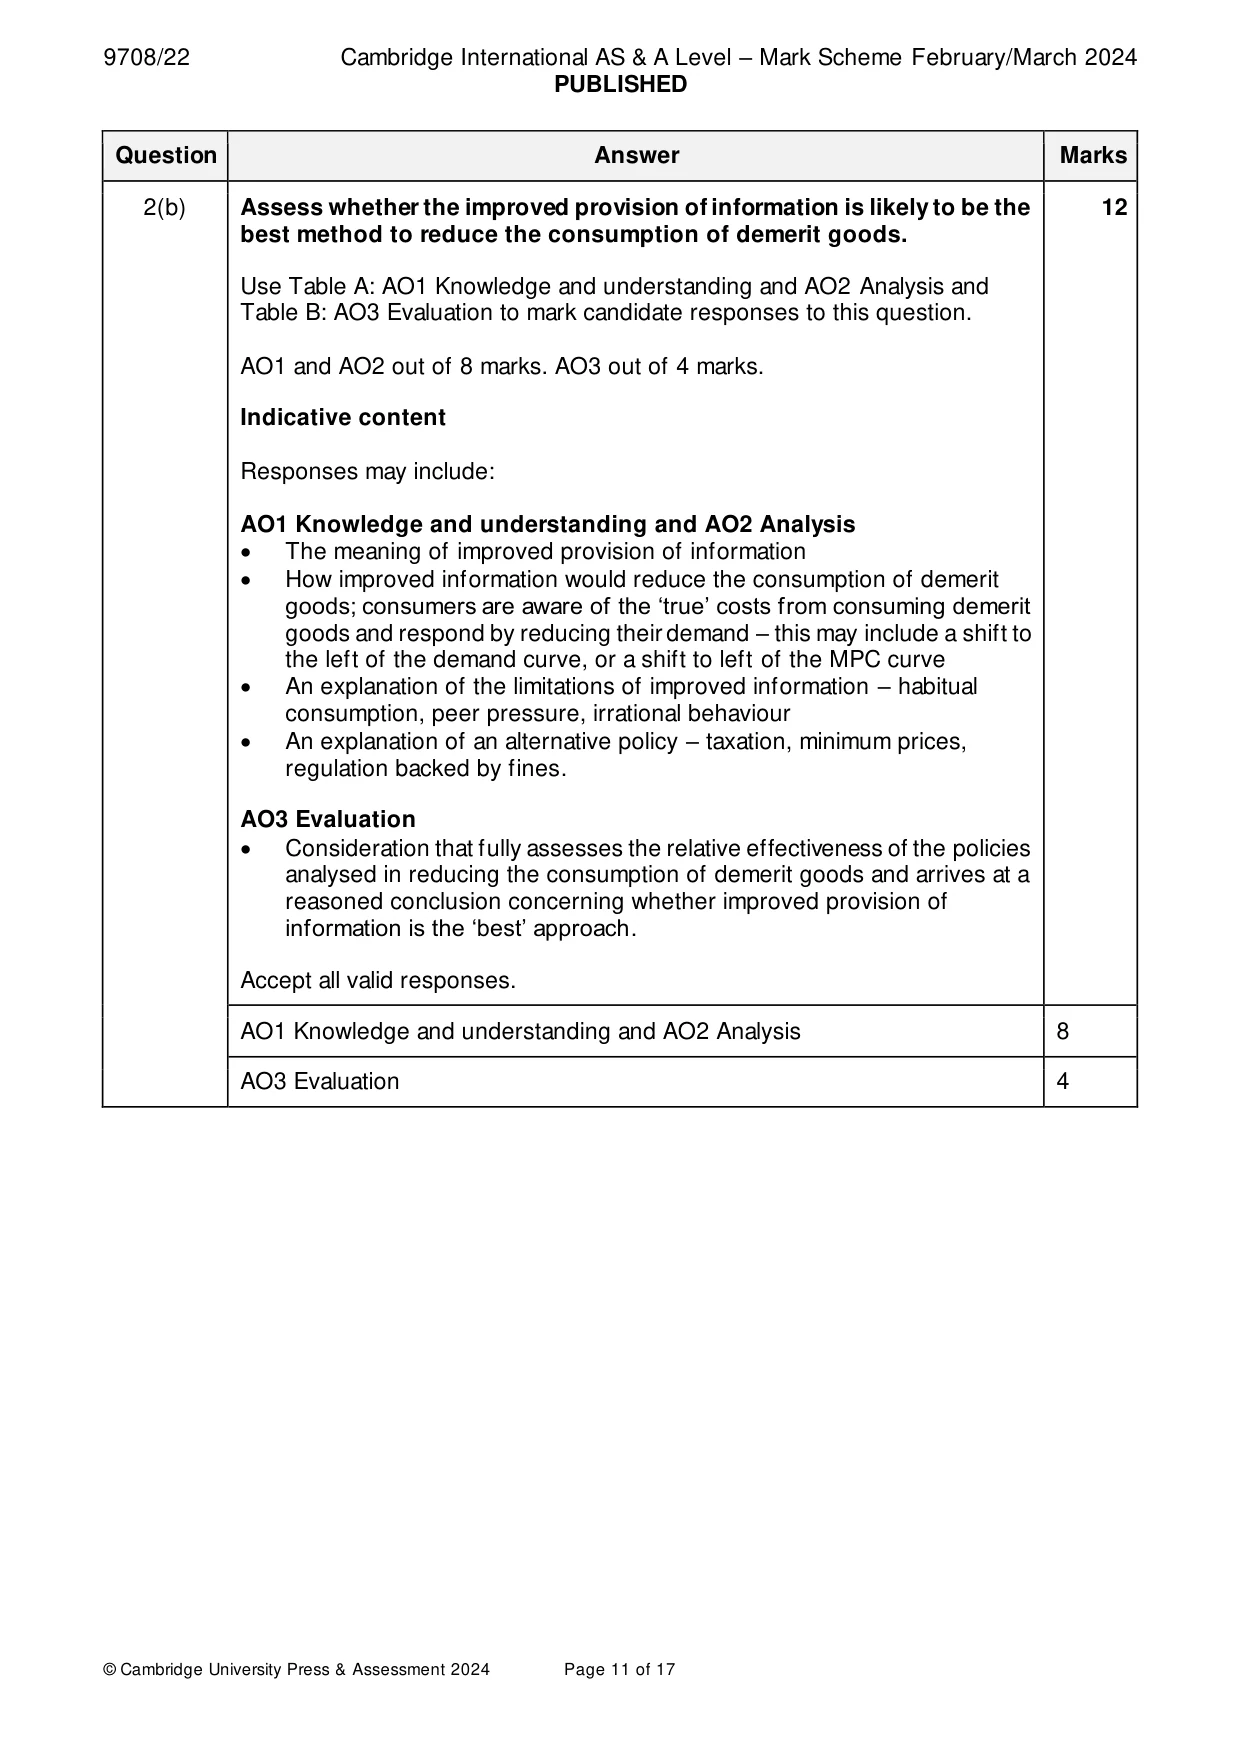
Mark scheme: 2(a) With the help of a demand and supply diagram, explain how the 8 introduction of an indirect tax affects equilibrium in a market and consider the extent to which the incidence of the tax will fall on the consumer. Follow the point-based marking guidance at the top of this mark scheme and award: up to 3 marks for AO1 Knowledge and understanding up to 3 marks for AO2 Analysis up to 2 marks for AO3 Evaluation. AO1 Knowledge and Understanding (max 3 marks) An accurate definition of an indirect tax (1) shown through an accurate diagram, correctly labelled axes and equilibrium price and quantity (1). Understanding that indirect taxes are used to discourage the consumption of demerit goods (1). AO2 Analysis (max 3 marks) Uses the diagram to explain that an indirect tax shifts the supply curve to the left (1), which causes an increase in the price of the good to the consumer (1) and reduces the quantity demanded (1). AO3 Evaluation (max 2 marks) One mark for a valid explanation that the incidence of tax borne by the consumer will depend on the PED of the product (1), (and that the more price inelastic demand is the greater the proportion of the tax is passed onto the consumer (1)), with a second mark for a justified conclusion. AO1 Knowledge and understanding 3 AO2 Analysis 3 AO3 Evaluation 2 2(b) Assess whether the improved provision of information is likely to be the 12 best method to reduce the consumption of demerit goods. Use Table A: AO1 Knowledge and understanding and AO2 Analysis and Table B: AO3 Evaluation to mark candidate responses to this question. AO1 and AO2 out of 8 marks. AO3 out of 4 marks. Indicative content Responses may include: AO1 Knowledge and understanding and AO2 Analysis • The meaning of improved provision of information • How improved information would reduce the consumption of demerit goods; consumers are aware of the ‘true’ costs from consuming demerit goods and respond by reducing their demand – this may include a shift to the left of the demand curve, or a shift to left of the MPC curve • An explanation of the limitations of improved information – habitual consumption, peer pressure, irrational behaviour • An explanation of an alternative policy – taxation, minimum prices, regulation backed by fines. AO3 Evaluation • Consideration that fully assesses the relative effectiveness of the policies analysed in reducing the consumption of demerit goods and arrives at a reasoned conclusion concerning whether improved provision of information is the ‘best’ approach. Accept all valid responses. AO1 Knowledge and understanding and AO2 Analysis 8 AO3 Evaluation 4
Q3 · With the help of a formula, explain the meaning of income elasticity of demand and…
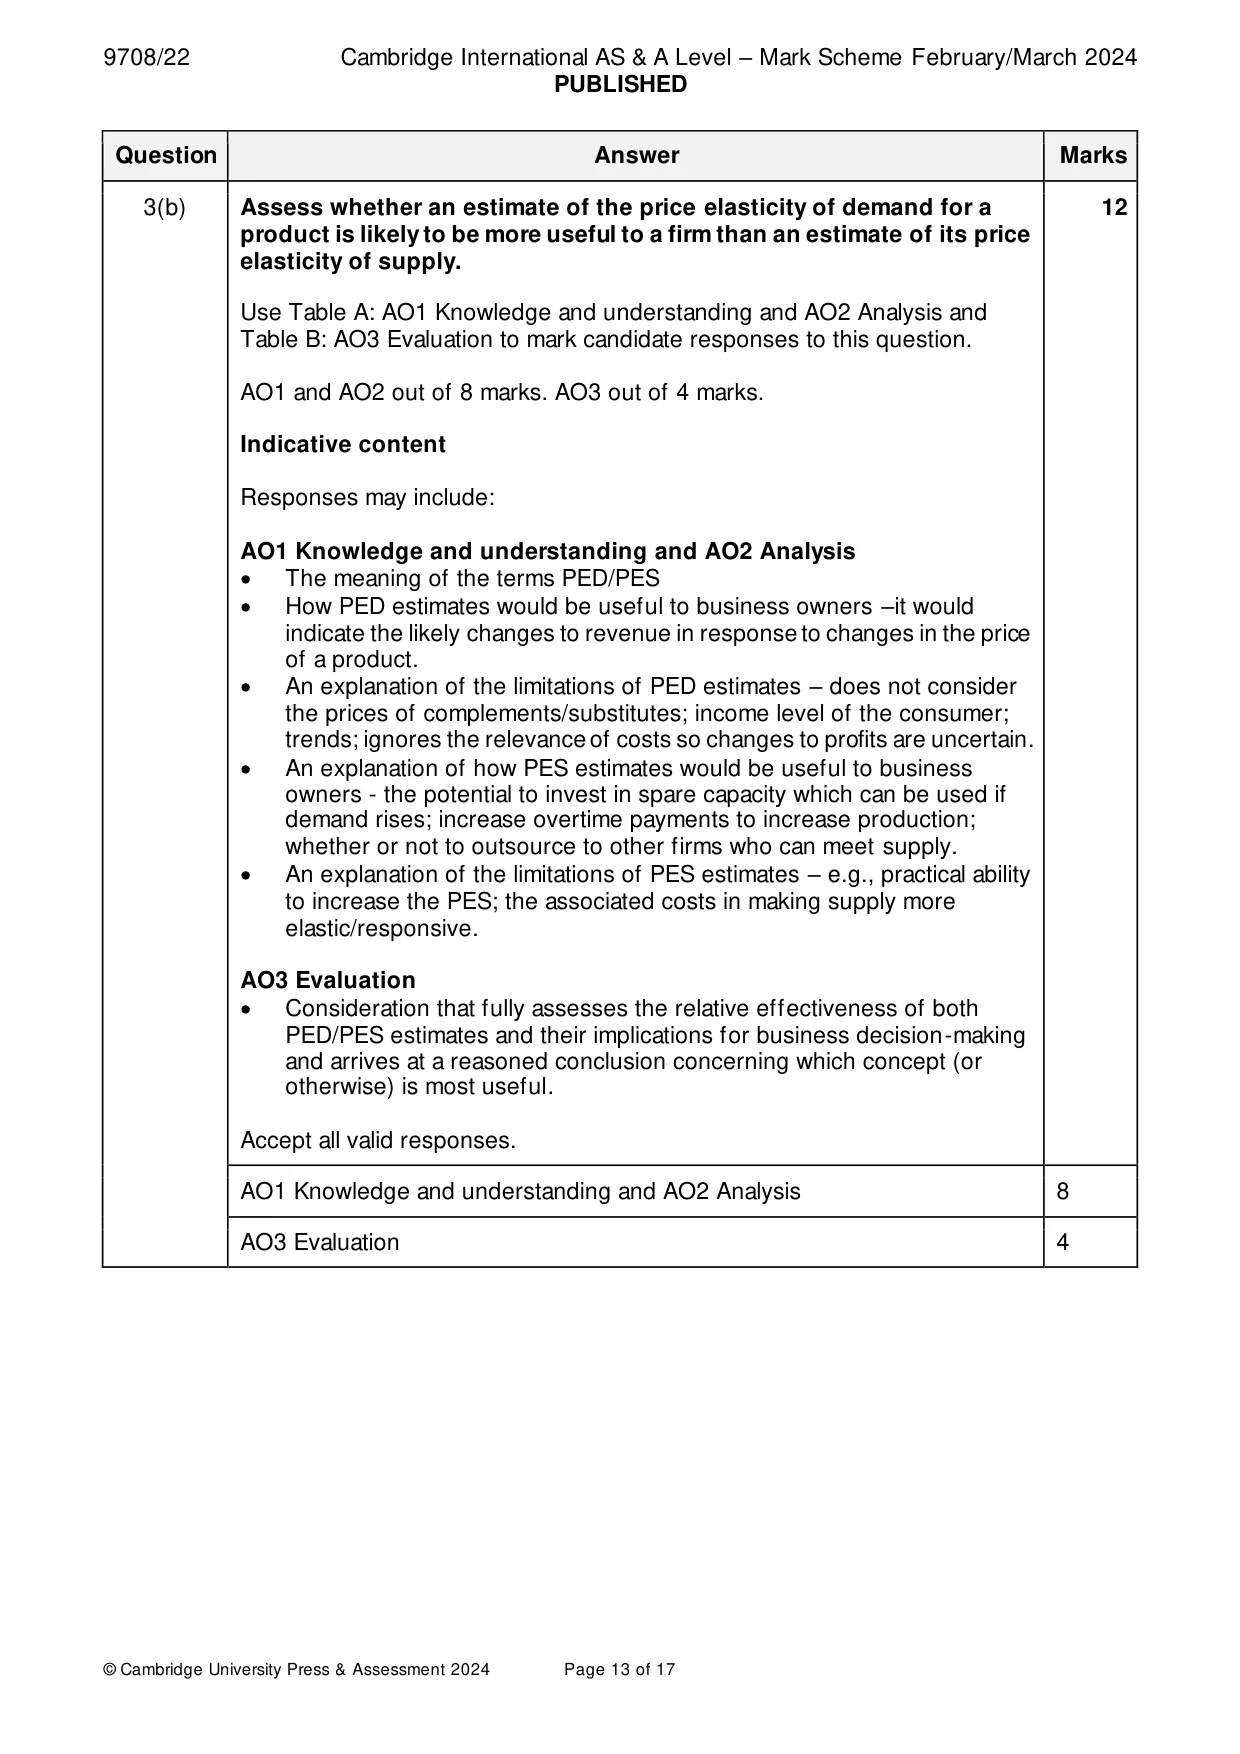
3 (a) With the help of a formula, explain the meaning of income elasticity of demand and consider the extent to which a rise in income will increase the consumption of all goods and services. [8] (b) Assess whether an estimate of the price elasticity of demand for a product is likely to be more useful to a firm than an estimate of its price elasticity of supply. [12] Section C Answer one question. EITHER
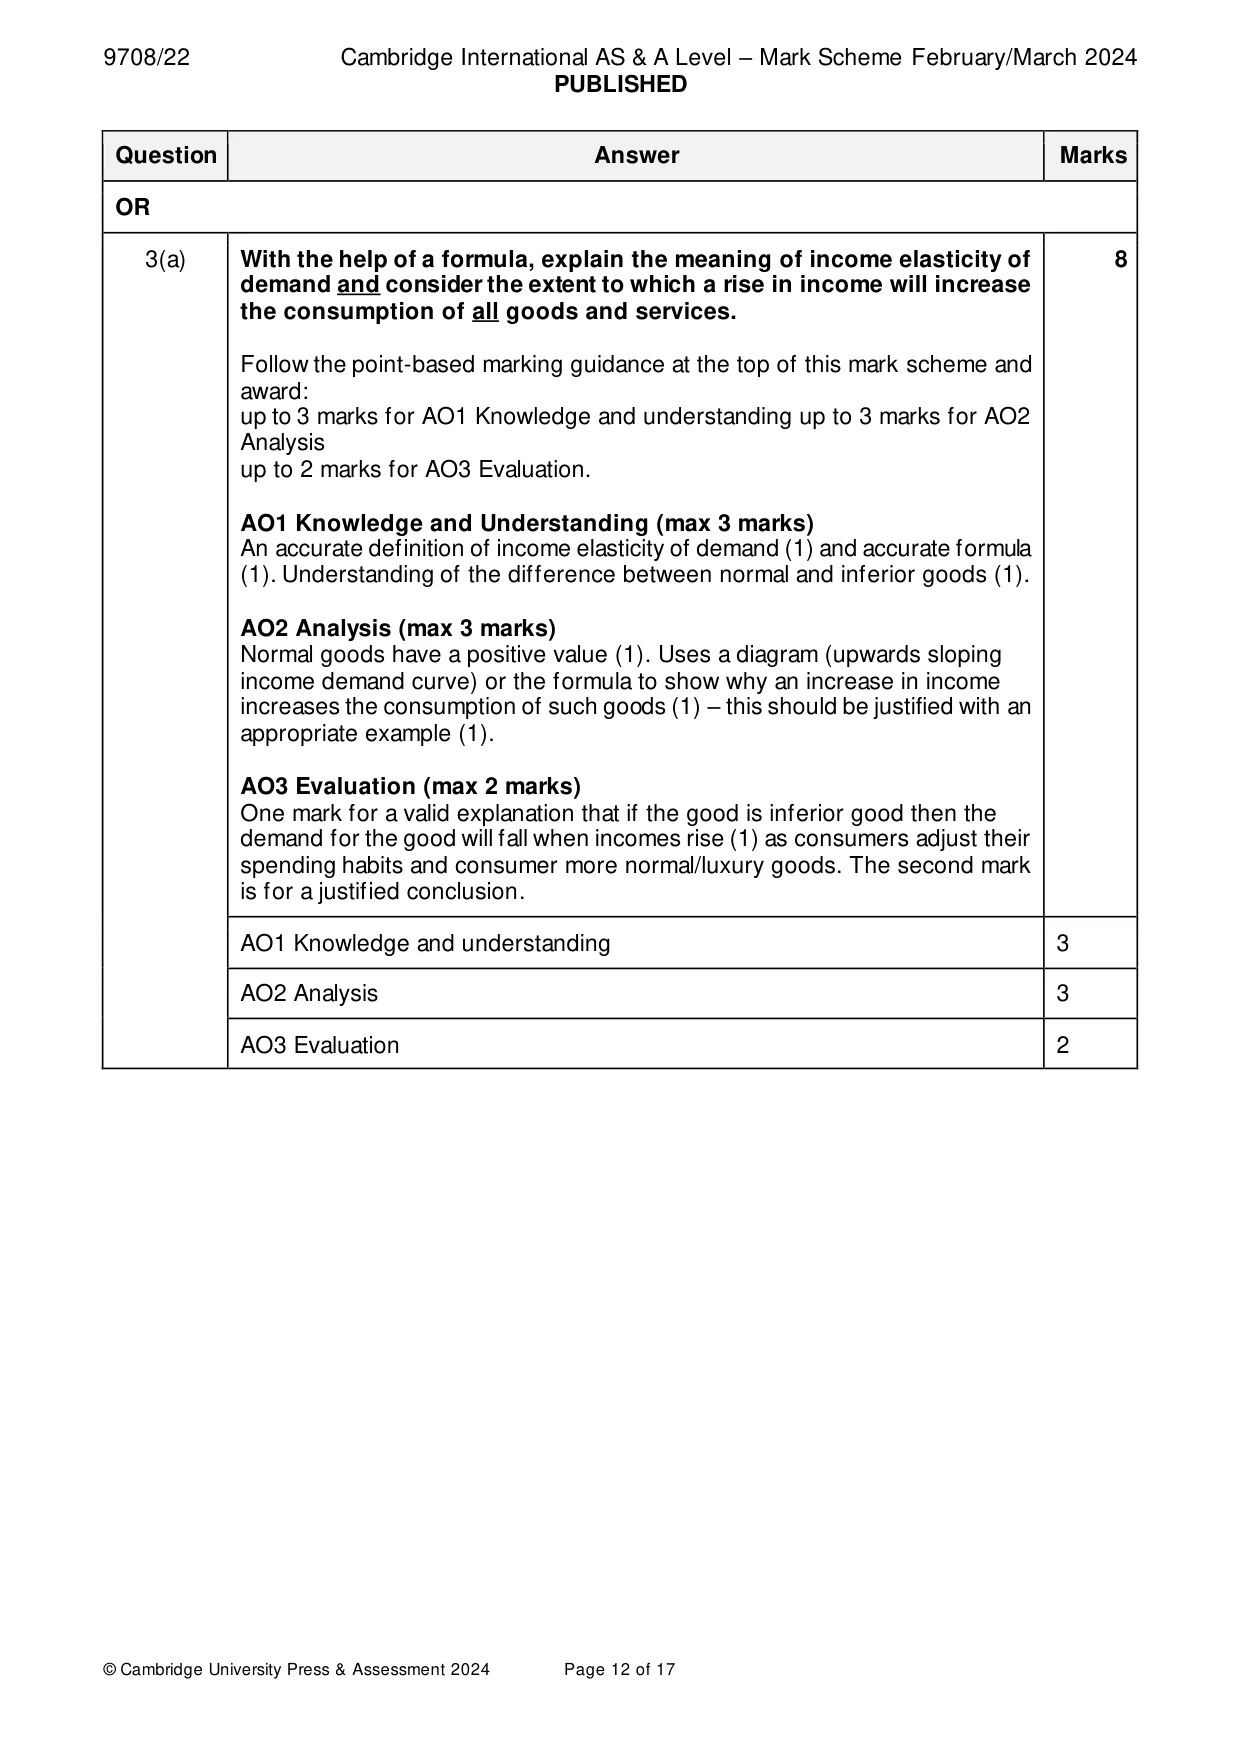
Mark scheme: 3(a) With the help of a formula, explain the meaning of income elasticity of 8 demand and consider the extent to which a rise in income will increase the consumption of all goods and services. Follow the point-based marking guidance at the top of this mark scheme and award: up to 3 marks for AO1 Knowledge and understanding up to 3 marks for AO2 Analysis up to 2 marks for AO3 Evaluation. AO1 Knowledge and Understanding (max 3 marks) An accurate definition of income elasticity of demand (1) and accurate formula (1). Understanding of the difference between normal and inferior goods (1). AO2 Analysis (max 3 marks) Normal goods have a positive value (1). Uses a diagram (upwards sloping income demand curve) or the formula to show why an increase in income increases the consumption of such goods (1) – this should be justified with an appropriate example (1). AO3 Evaluation (max 2 marks) One mark for a valid explanation that if the good is inferior good then the demand for the good will fall when incomes rise (1) as consumers adjust their spending habits and consumer more normal/luxury goods. The second mark is for a justified conclusion. AO1 Knowledge and understanding 3 AO2 Analysis 3 AO3 Evaluation 2 3(b) Assess whether an estimate of the price elasticity of demand for a 12 product is likely to be more useful to a firm than an estimate of its price elasticity of supply. Use Table A: AO1 Knowledge and understanding and AO2 Analysis and Table B: AO3 Evaluation to mark candidate responses to this question. AO1 and AO2 out of 8 marks. AO3 out of 4 marks. Indicative content Responses may include: AO1 Knowledge and understanding and AO2 Analysis • The meaning of the terms PED/PES • How PED estimates would be useful to business owners –it would indicate the likely changes to revenue in response to changes in the price of a product. • An explanation of the limitations of PED estimates – does not consider the prices of complements/substitutes; income level of the consumer; trends; ignores the relevance of costs so changes to profits are uncertain. • An explanation of how PES estimates would be useful to business owners - the potential to invest in spare capacity which can be used if demand rises; increase overtime payments to increase production; whether or not to outsource to other firms who can meet supply. • An explanation of the limitations of PES estimates – e.g., practical ability to increase the PES; the associated costs in making supply more elastic/responsive. AO3 Evaluation • Consideration that fully assesses the relative effectiveness of both PED/PES estimates and their implications for business decision-making and arrives at a reasoned conclusion concerning which concept (or otherwise) is most useful. Accept all valid responses. AO1 Knowledge and understanding and AO2 Analysis 8 AO3 Evaluation 4 Section C
More questions on Price elasticity, income elasticity and cross elasticity of demand
Q4 · Explain what is meant by a depreciation of the exchange rate and consider whether a…
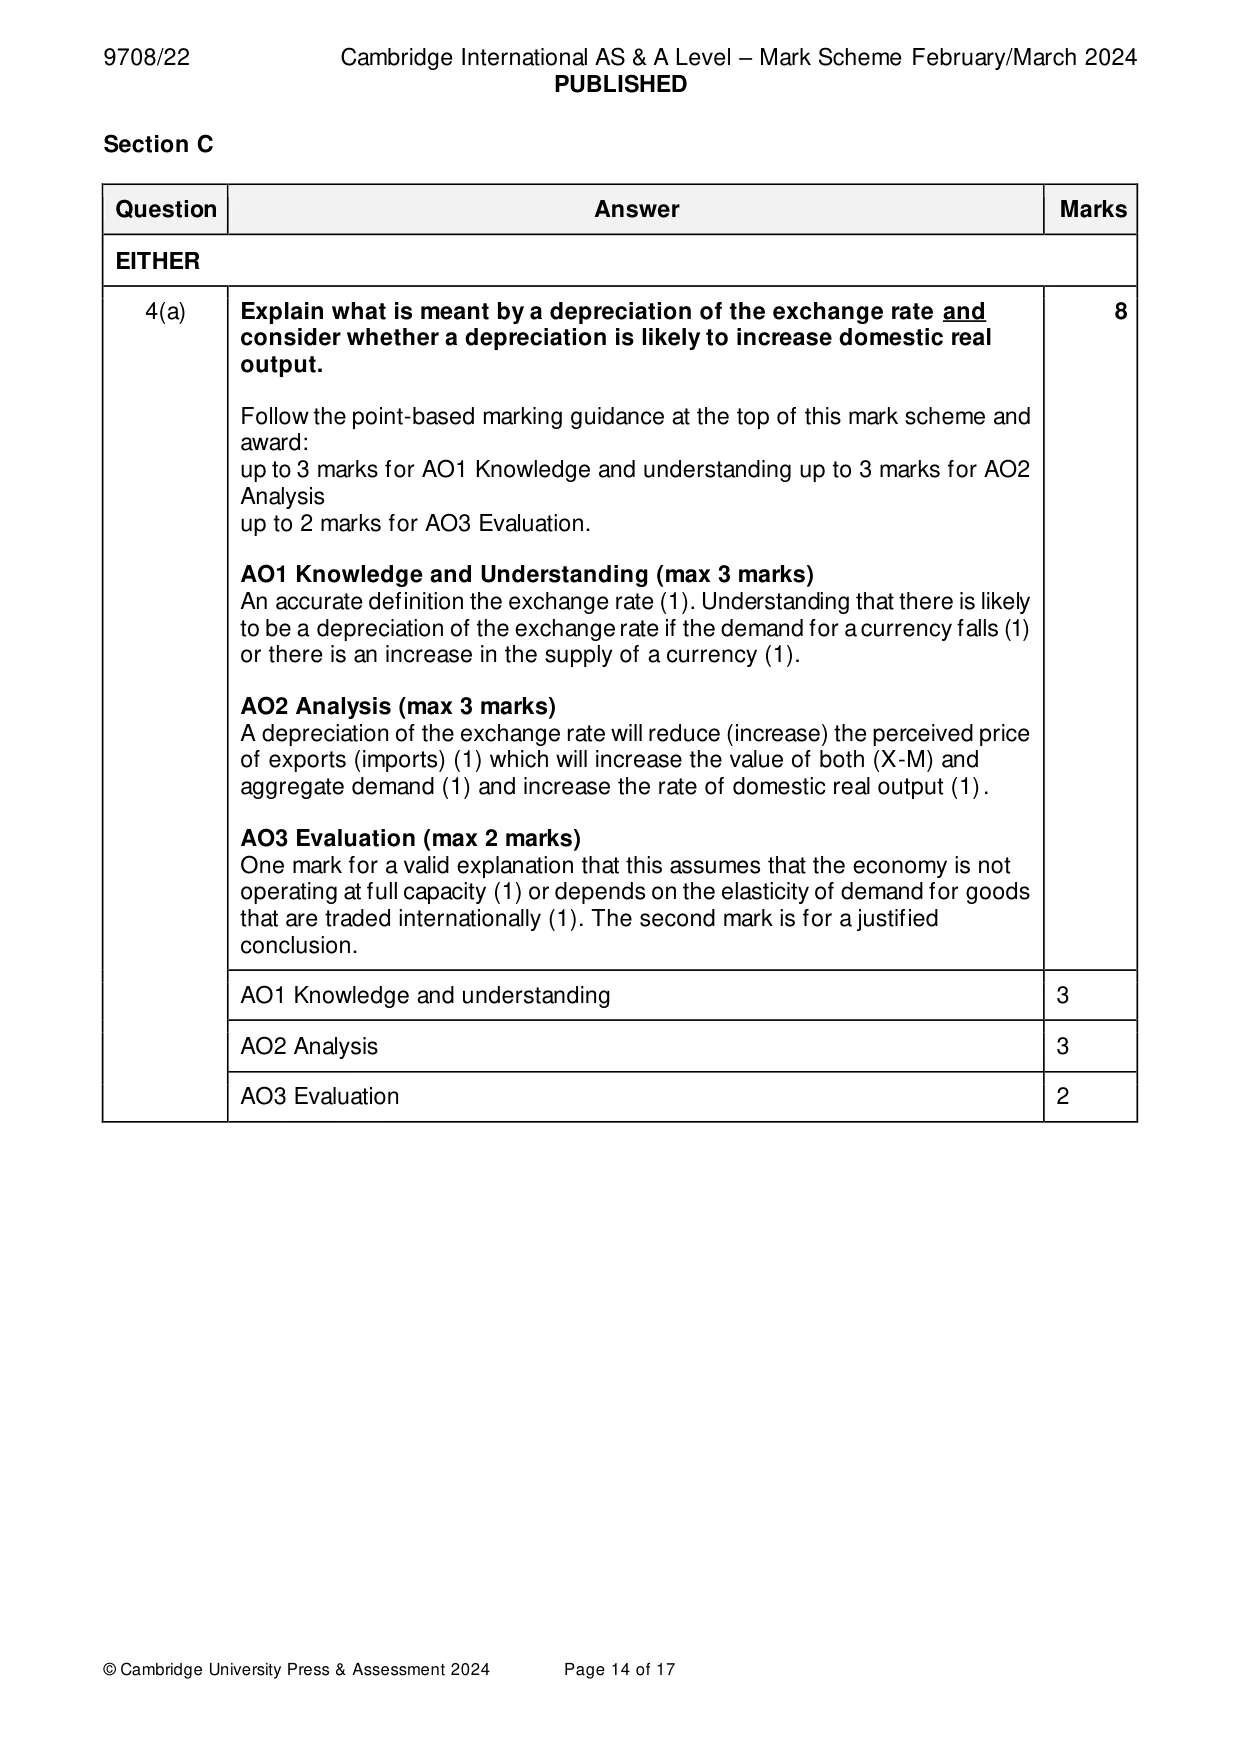
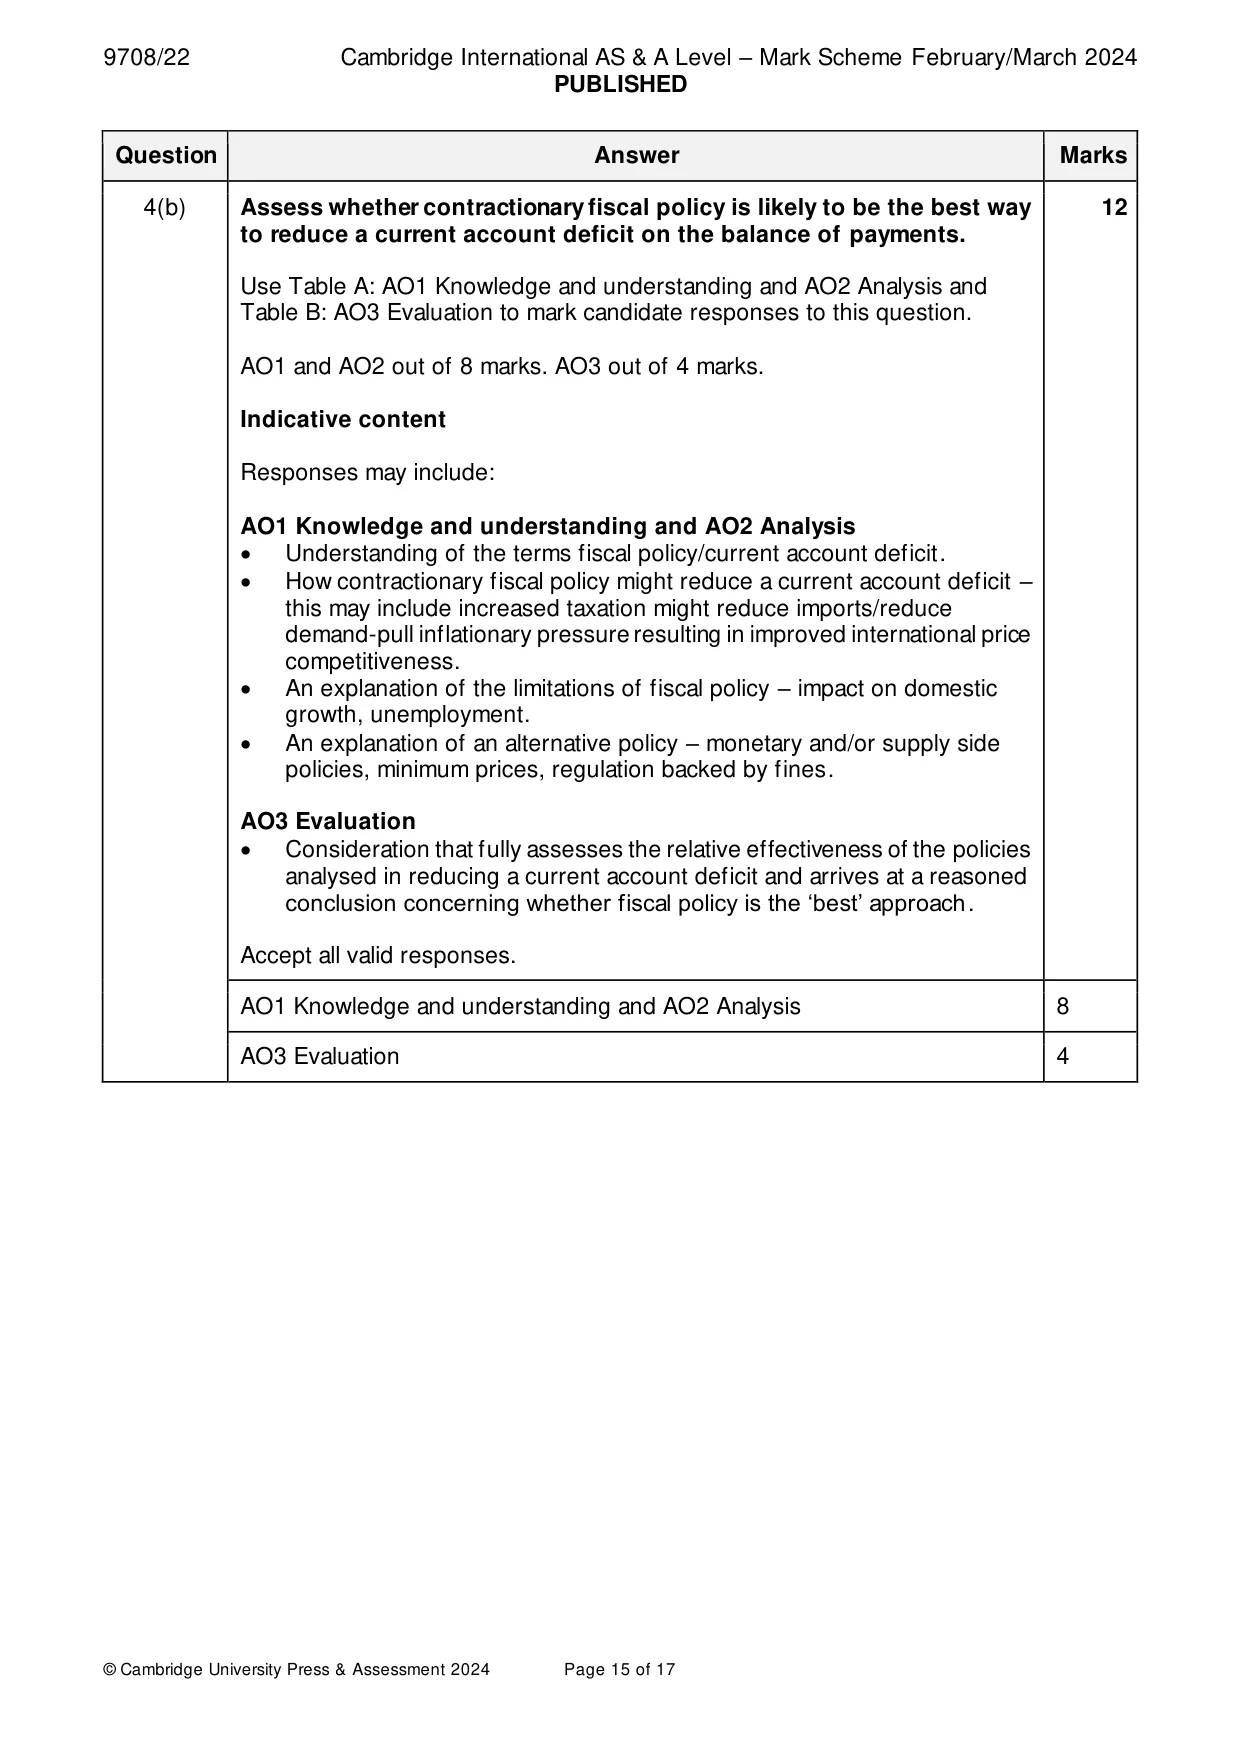
4 (a) Explain what is meant by a depreciation of the exchange rate and consider whether a depreciation is likely to increase domestic real output. [8] (b) Assess whether contractionary fiscal policy is likely to be the best way to reduce a current account deficit on the balance of payments. [12] OR
Mark scheme: 4(a) Explain what is meant by a depreciation of the exchange rate and 8 consider whether a depreciation is likely to increase domestic real output. Follow the point-based marking guidance at the top of this mark scheme and award: up to 3 marks for AO1 Knowledge and understanding up to 3 marks for AO2 Analysis up to 2 marks for AO3 Evaluation. AO1 Knowledge and Understanding (max 3 marks) An accurate definition the exchange rate (1). Understanding that there is likely to be a depreciation of the exchange rate if the demand for a currency falls (1) or there is an increase in the supply of a currency (1). AO2 Analysis (max 3 marks) A depreciation of the exchange rate will reduce (increase) the perceived price of exports (imports) (1) which will increase the value of both (X-M) and aggregate demand (1) and increase the rate of domestic real output (1). AO3 Evaluation (max 2 marks) One mark for a valid explanation that this assumes that the economy is not operating at full capacity (1) or depends on the elasticity of demand for goods that are traded internationally (1). The second mark is for a justified conclusion. AO1 Knowledge and understanding 3 AO2 Analysis 3 AO3 Evaluation 2 4(b) Assess whether contractionary fiscal policy is likely to be the best way 12 to reduce a current account deficit on the balance of payments. Use Table A: AO1 Knowledge and understanding and AO2 Analysis and Table B: AO3 Evaluation to mark candidate responses to this question. AO1 and AO2 out of 8 marks. AO3 out of 4 marks. Indicative content Responses may include: AO1 Knowledge and understanding and AO2 Analysis • Understanding of the terms fiscal policy/current account deficit. • How contractionary fiscal policy might reduce a current account deficit – this may include increased taxation might reduce imports/reduce demand-pull inflationary pressure resulting in improved international price competitiveness. • An explanation of the limitations of fiscal policy – impact on domestic growth, unemployment. • An explanation of an alternative policy – monetary and/or supply side policies, minimum prices, regulation backed by fines. AO3 Evaluation • Consideration that fully assesses the relative effectiveness of the policies analysed in reducing a current account deficit and arrives at a reasoned conclusion concerning whether fiscal policy is the ‘best’ approach. Accept all valid responses. AO1 Knowledge and understanding and AO2 Analysis 8 AO3 Evaluation 4
More questions on Policies to correct imbalances in the current account of the balance of payments
Q5 · With the help of an aggregate demand and aggregate supply diagram, explain how a decrease…
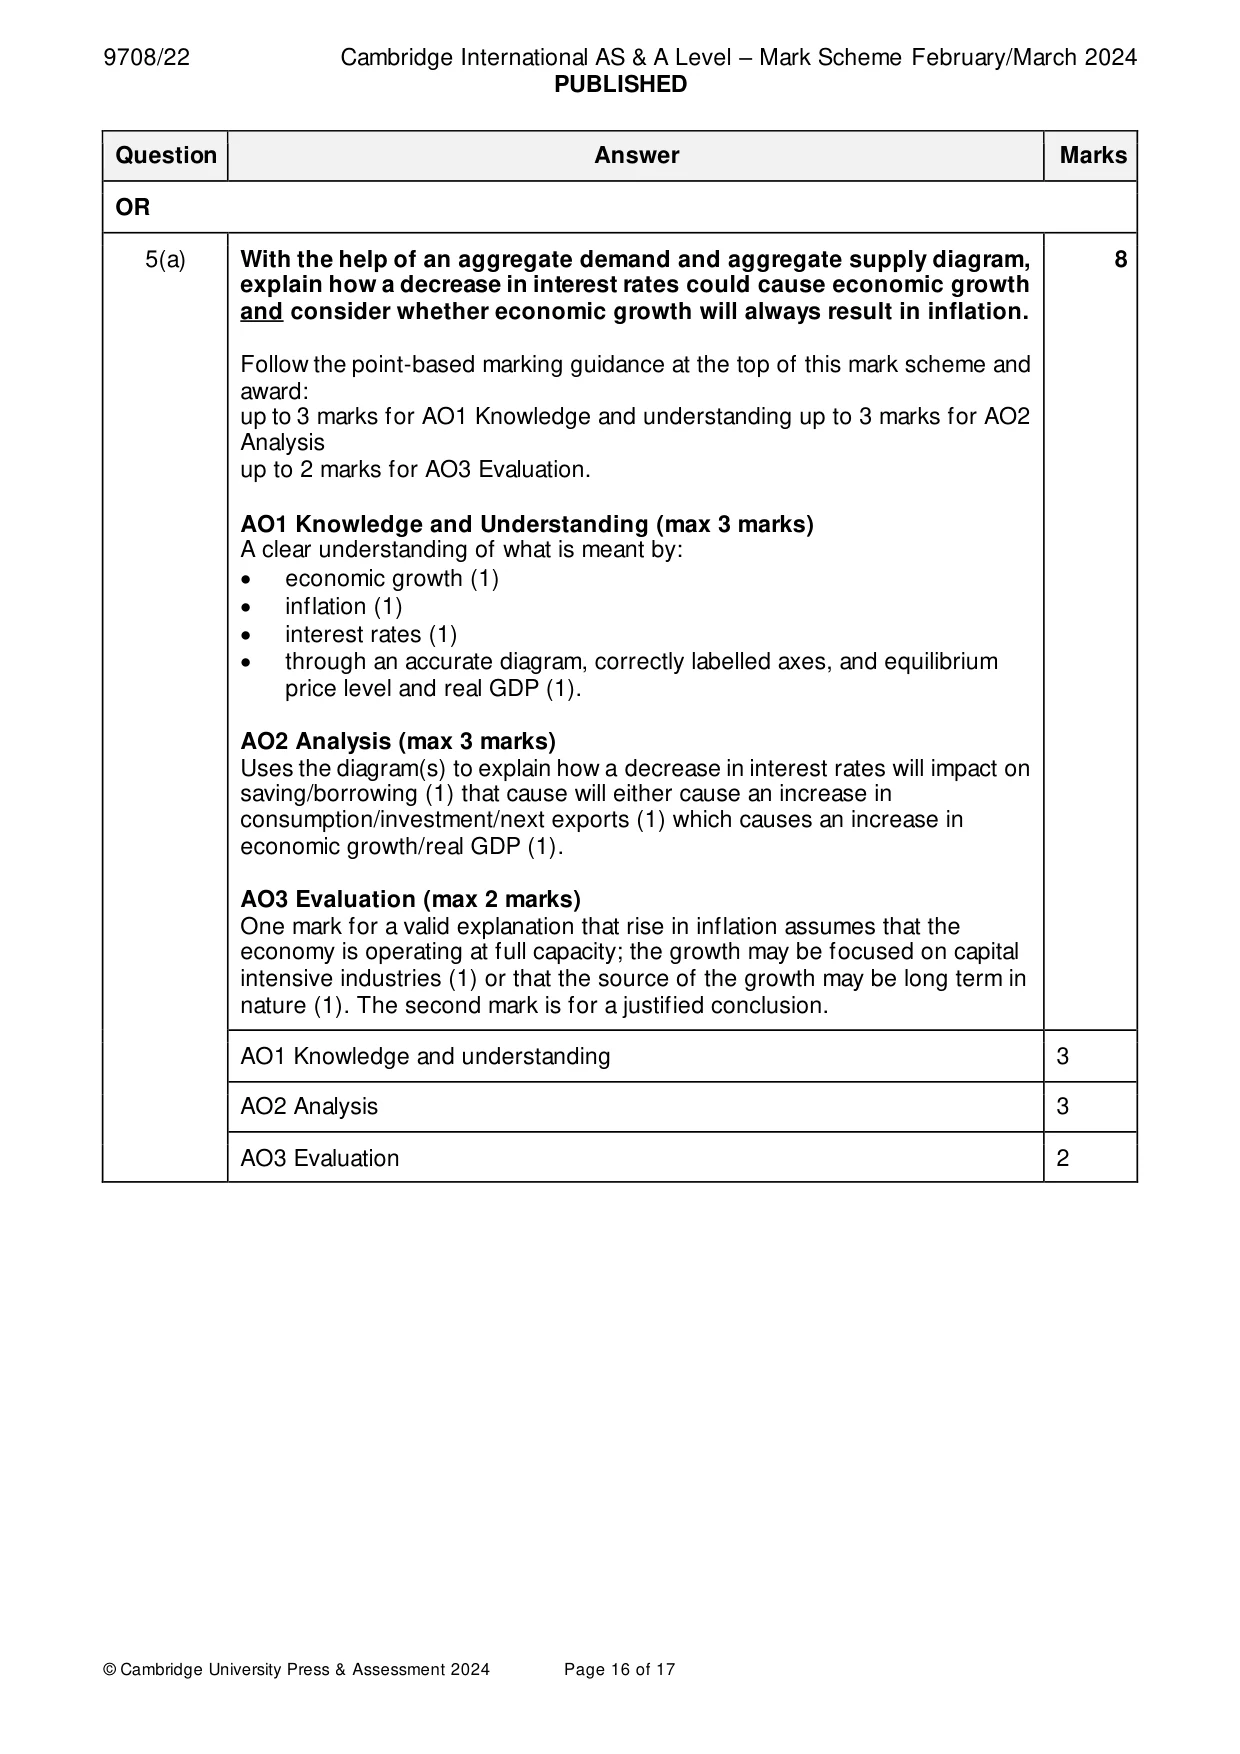
5 (a) With the help of an aggregate demand and aggregate supply diagram, explain how a decrease in interest rates could cause economic growth and consider whether economic growth will always result in inflation. [8] (b) Assess whether economic growth is always desirable for an economy. [12]
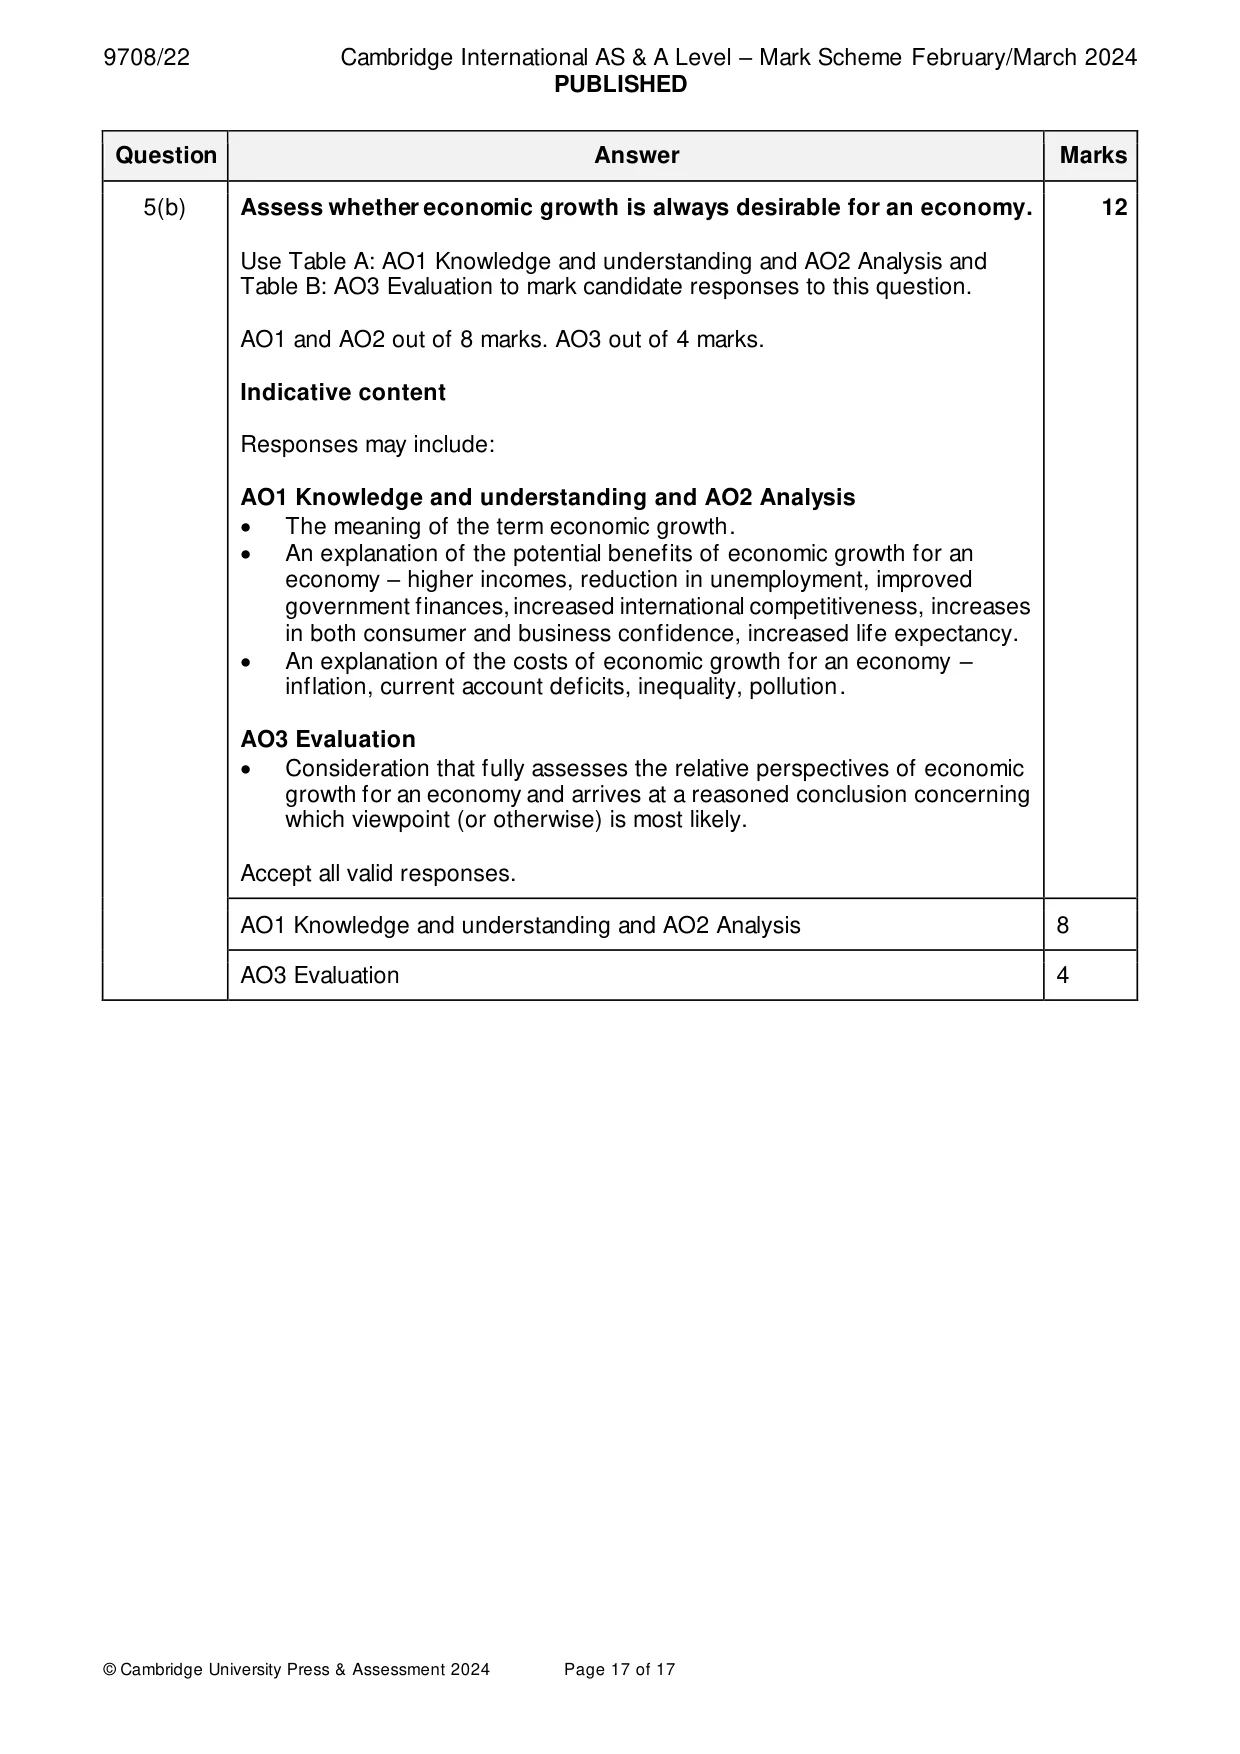
Mark scheme: 5(a) With the help of an aggregate demand and aggregate supply diagram, 8 explain how a decrease in interest rates could cause economic growth and consider whether economic growth will always result in inflation. Follow the point-based marking guidance at the top of this mark scheme and award: up to 3 marks for AO1 Knowledge and understanding up to 3 marks for AO2 Analysis up to 2 marks for AO3 Evaluation. AO1 Knowledge and Understanding (max 3 marks) A clear understanding of what is meant by: • economic growth (1) • inflation (1) • interest rates (1) • through an accurate diagram, correctly labelled axes, and equilibrium price level and real GDP (1). AO2 Analysis (max 3 marks) Uses the diagram(s) to explain how a decrease in interest rates will impact on saving/borrowing (1) that cause will either cause an increase in consumption/investment/next exports (1) which causes an increase in economic growth/real GDP (1). AO3 Evaluation (max 2 marks) One mark for a valid explanation that rise in inflation assumes that the economy is operating at full capacity; the growth may be focused on capital intensive industries (1) or that the source of the growth may be long term in nature (1). The second mark is for a justified conclusion. AO1 Knowledge and understanding 3 AO2 Analysis 3 AO3 Evaluation 2 5(b) Assess whether economic growth is always desirable for an economy. 12 Use Table A: AO1 Knowledge and understanding and AO2 Analysis and Table B: AO3 Evaluation to mark candidate responses to this question. AO1 and AO2 out of 8 marks. AO3 out of 4 marks. Indicative content Responses may include: AO1 Knowledge and understanding and AO2 Analysis • The meaning of the term economic growth. • An explanation of the potential benefits of economic growth for an economy – higher incomes, reduction in unemployment, improved government finances, increased international competitiveness, increases in both consumer and business confidence, increased life expectancy. • An explanation of the costs of economic growth for an economy – inflation, current account deficits, inequality, pollution. AO3 Evaluation • Consideration that fully assesses the relative perspectives of economic growth for an economy and arrives at a reasoned conclusion concerning which viewpoint (or otherwise) is most likely. Accept all valid responses. AO1 Knowledge and understanding and AO2 Analysis 8 AO3 Evaluation 4
What was in this paper
The subtopics covered by these 5 questions, and how many questions each got. Open one in a new tab to see every Cambridge question on it.
What you needed in this session
Cambridge’s own grade thresholds for 2024 Feb/March, Paper 2 · Variant 2. A higher threshold means an easier paper — the bar moves with how the cohort did.