Cambridge A Level Economics 9708 — 2024 May/June Paper 2 · Variant 2
9708/22/M/J/24 · 5 questions · 60 marks · ≈68 min
The question paper and its mark scheme, free to read here and free to download. This is Cambridge’s own paper, exactly as it was sat.
Question paper4 pages
Mark scheme21 pages
Answers below. Sit the paper first if you are practising.
Questions as text
Q1 · Dilemma for the European Central Bank (ECB) The Eurozone consists of 19 European Union…
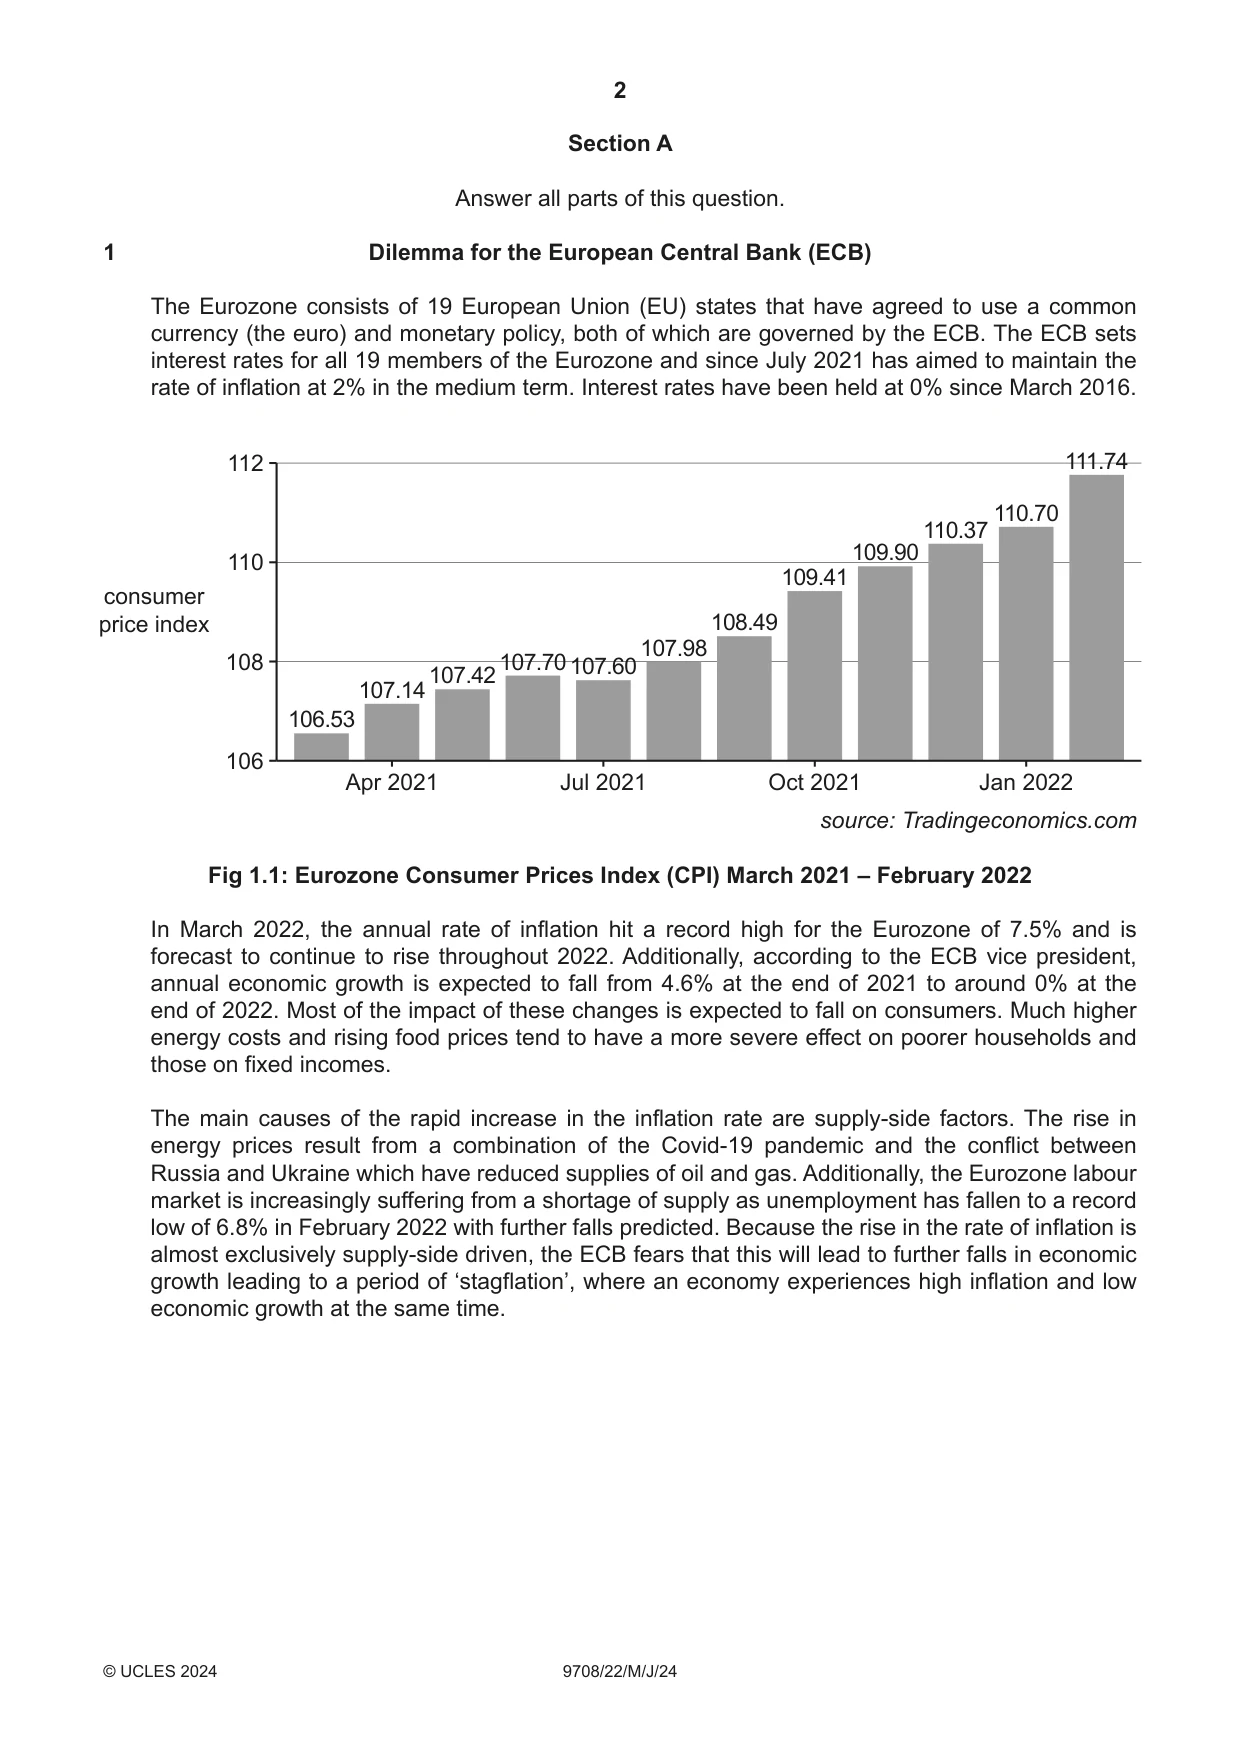
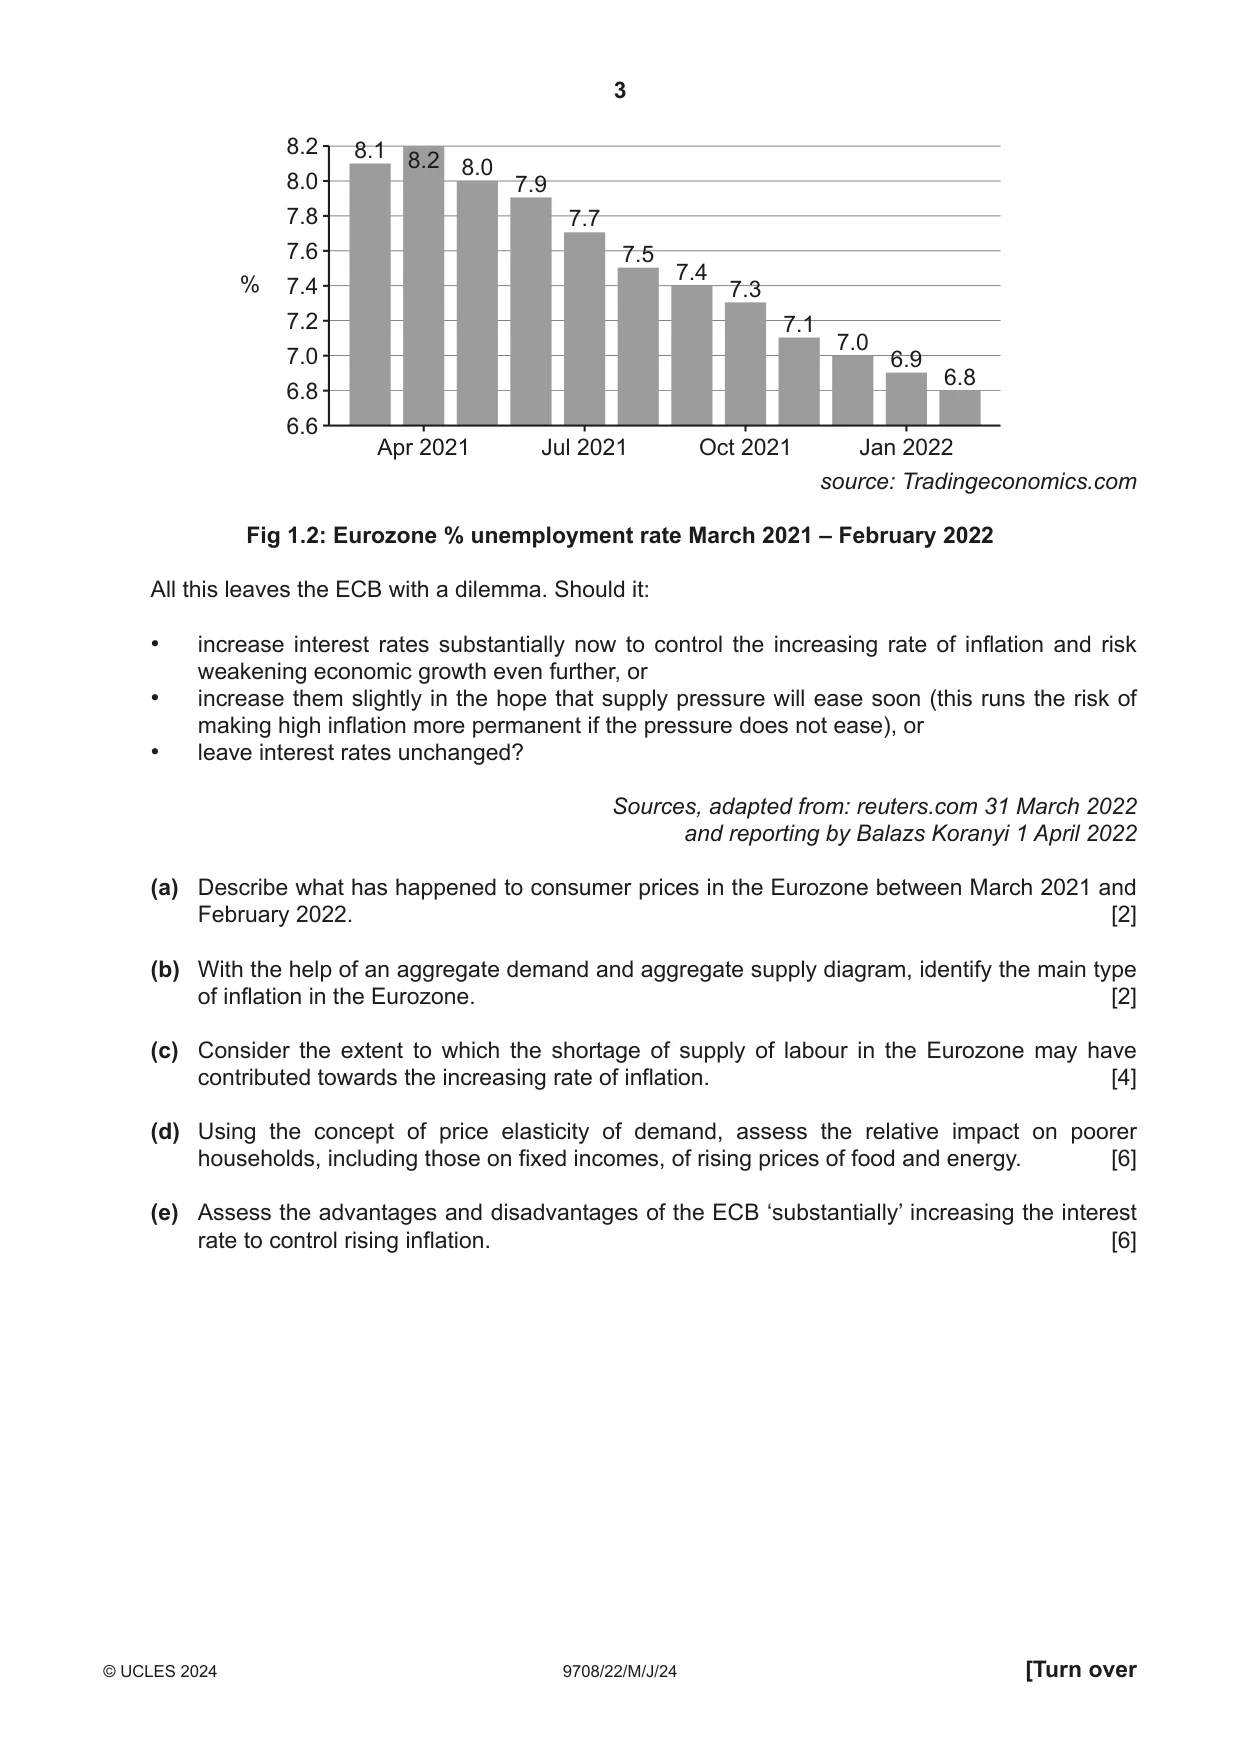
1 Dilemma for the European Central Bank (ECB) The Eurozone consists of 19 European Union (EU) states that have agreed to use a common currency (the euro) and monetary policy, both of which are governed by the ECB. The ECB sets interest rates for all 19 members of the Eurozone and since July 2021 has aimed to maintain the rate of inflation at 2% in the medium term. Interest rates have been held at 0% since March 2016. 112 111.74 110.70 110.37 109.90 110 109.41 consumer price index 108.49 107.98 108 107.14107.42107.70107.60 106.53 106 Apr 2021 Jul 2021 Oct 2021 Jan 2022 source: Tradingeconomics.com Fig 1.1: Eurozone Consumer Prices Index (CPI) March 2021 – February 2022 In March 2022, the annual rate of inflation hit a record high for the Eurozone of 7.5% and is forecast to continue to rise throughout 2022. Additionally, according to the ECB vice president, annual economic growth is expected to fall from 4.6% at the end of 2021 to around 0% at the end of 2022. Most of the impact of these changes is expected to fall on consumers. Much higher energy costs and rising food prices tend to have a more severe effect on poorer households and those on fixed incomes. The main causes of the rapid increase in the inflation rate are supply-side factors. The rise in energy prices result from a combination of the Covid-19 pandemic and the conflict between Russia and Ukraine which have reduced supplies of oil and gas. Additionally, the Eurozone labour market is increasingly suffering from a shortage of supply as unemployment has fallen to a record low of 6.8% in February 2022 with further falls predicted. Because the rise in the rate of inflation is almost exclusively supply-side driven, the ECB fears that this will lead to further falls in economic growth leading to a period of ‘stagflation’, where an economy experiences high inflation and low economic growth at the same time. 8.2 8.1 8.2 8.0 8.0 7.9 7.8 7.7 7.6 7.5 7.4 % 7.4 7.3 7.2 7.1 7.0 7.0 6.9 6.8 6.8 6.6 Apr 2021 Jul 2021 Oct 2021 Jan 2022 source: Tradingeconomics.com Fig 1.2: Eurozone % unemployment rate March 2021 – February 2022 All this leaves the ECB with a dilemma. Should it: • increase interest rates substantially now to control the increasing rate of inflation and risk weakening economic growth even further, or • increase them slightly in the hope that supply pressure will ease soon (this runs the risk of making high inflation more permanent if the pressure does not ease), or • leave interest rates unchanged? Sources, adapted from: reuters.com 31 March 2022 and reporting by Balazs Koranyi 1 April 2022 (a) Describe what has happened to consumer prices in the Eurozone between March 2021 and February 2022. [2] (b) With the help of an aggregate demand and aggregate supply diagram, identify the main type of inflation in the Eurozone. [2] (c) Consider the extent to which the shortage of supply of labour in the Eurozone may have contributed towards the increasing rate of inflation. [4] (d) Using the concept of price elasticity of demand, assess the relative impact on poorer households, including those on fixed incomes, of rising prices of food and energy. [6] (e) Assess the advantages and disadvantages of the ECB ‘substantially’ increasing the interest rate to control rising inflation. [6]
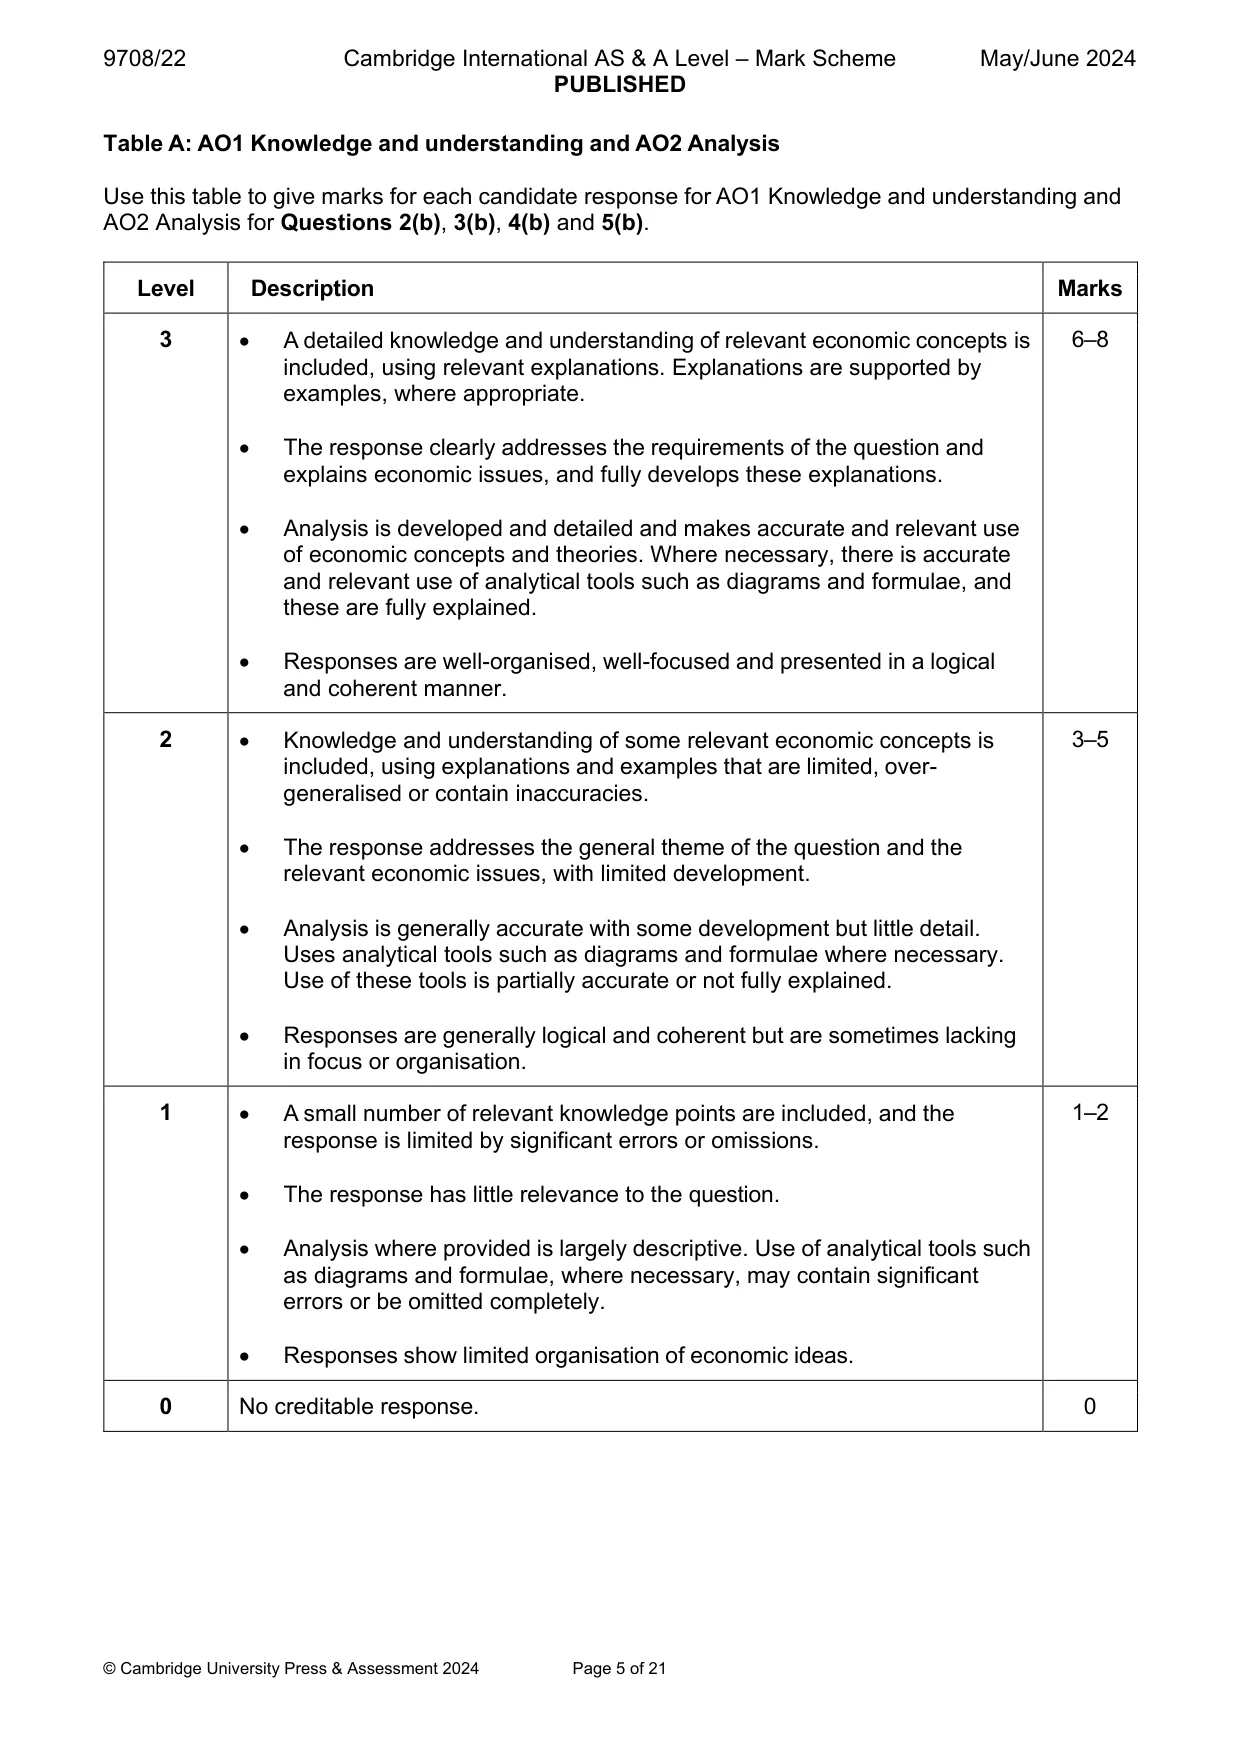
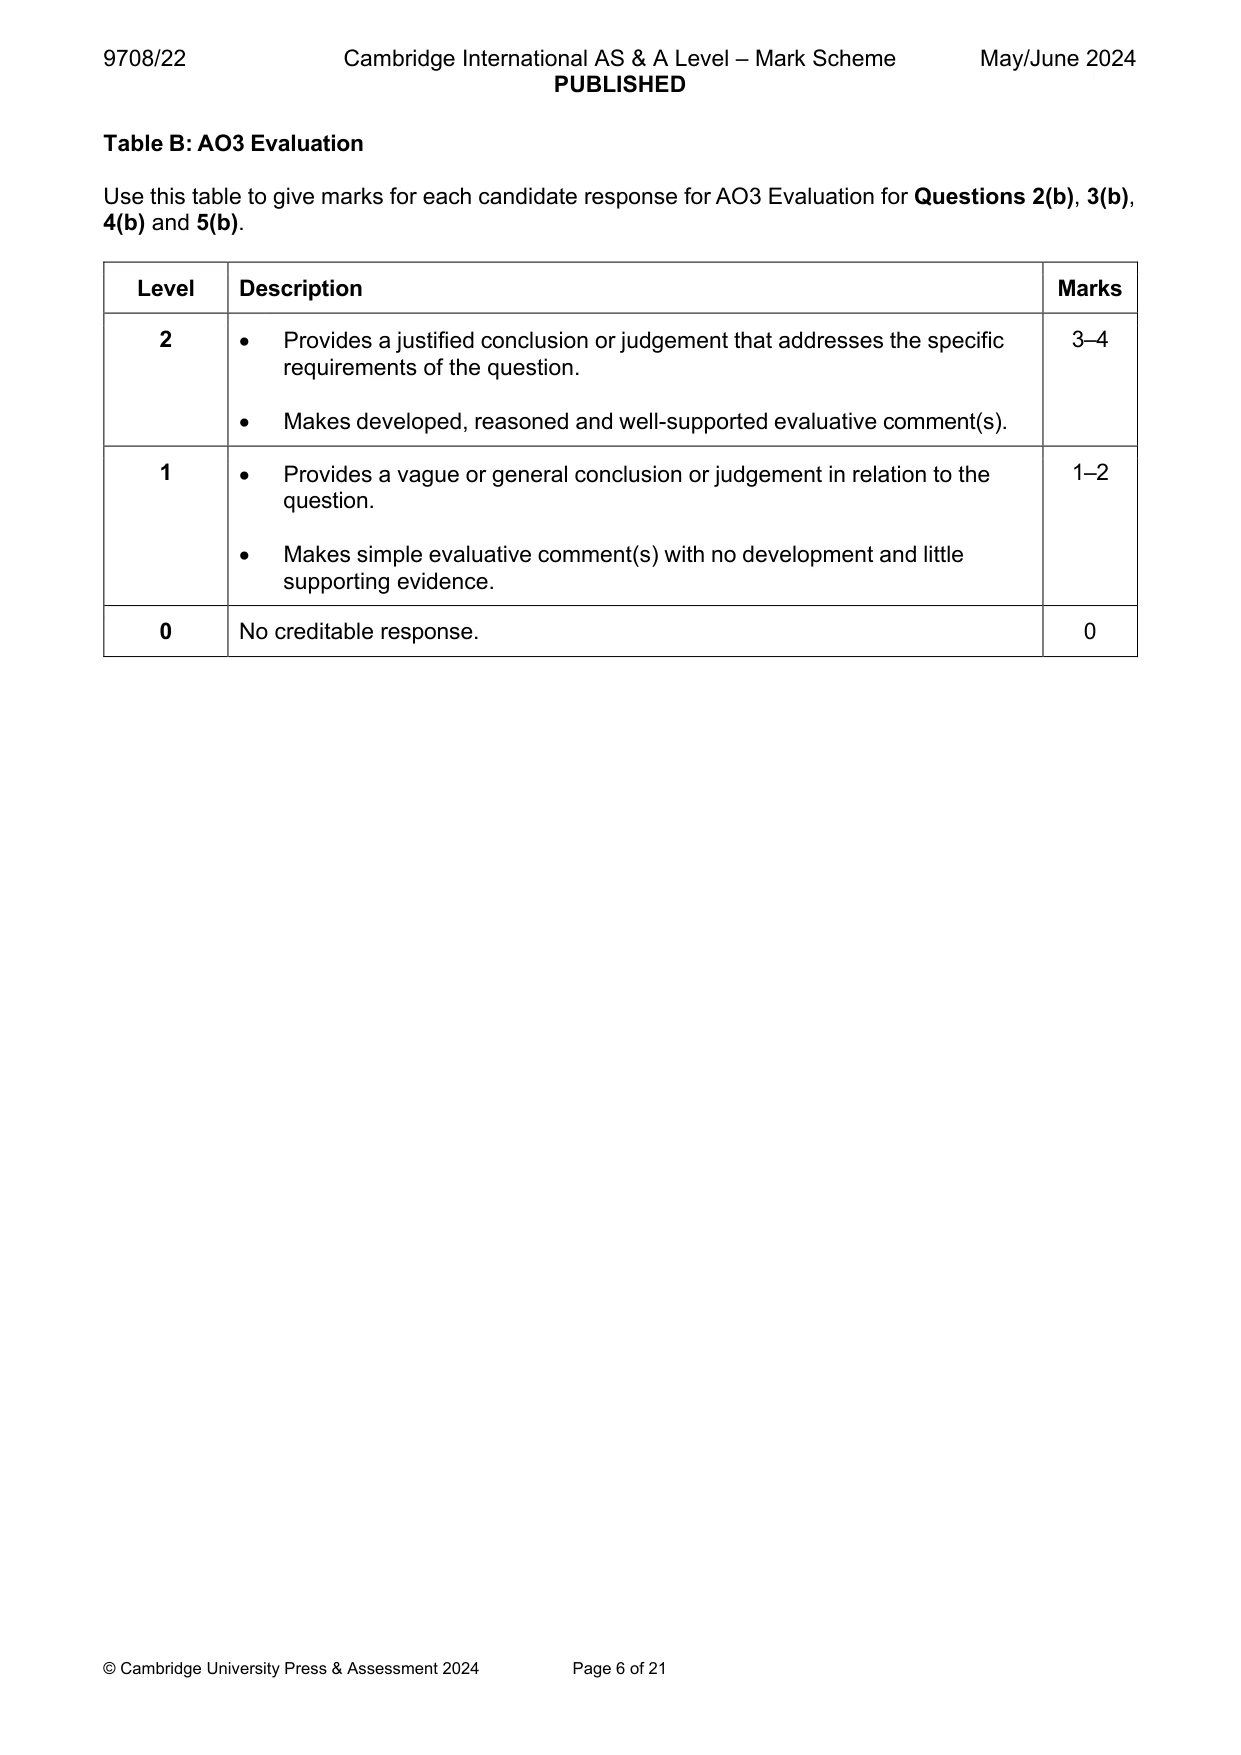
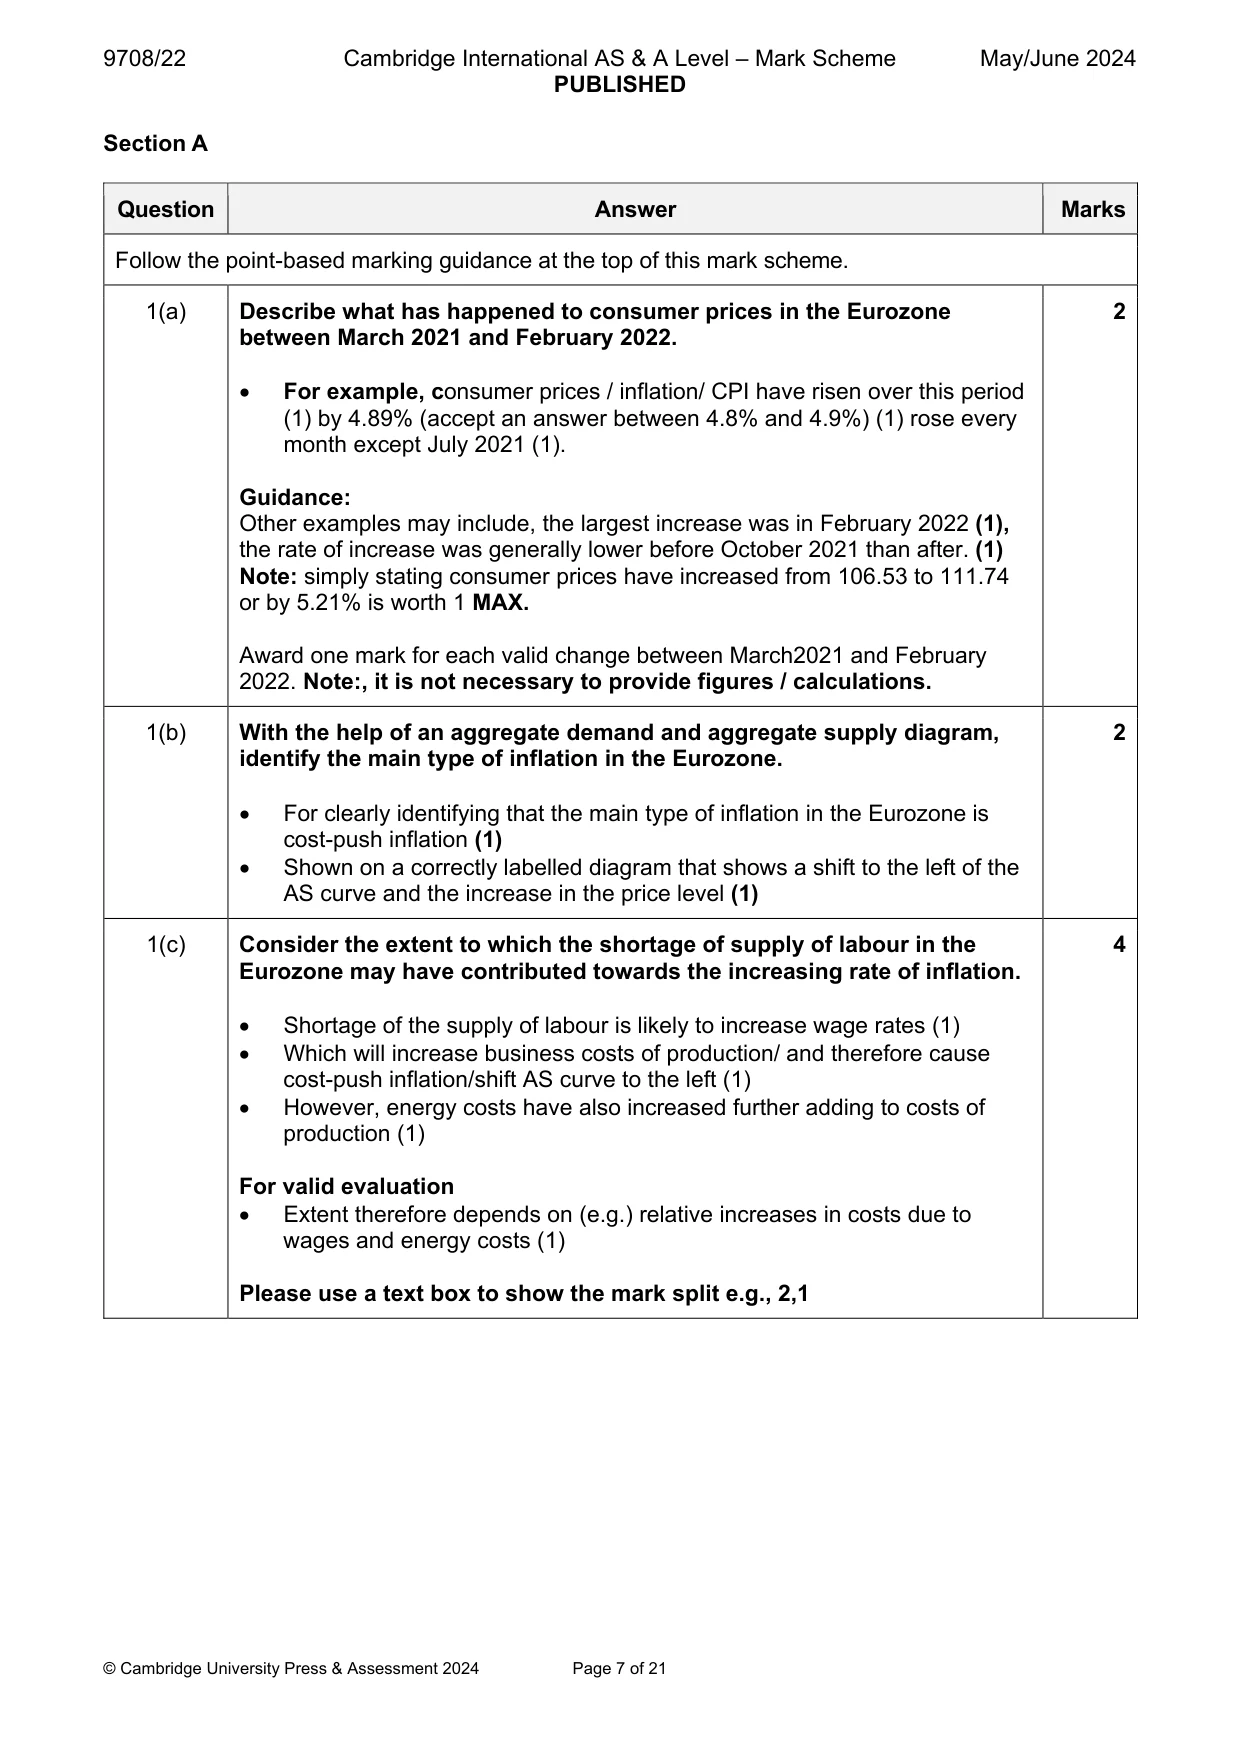
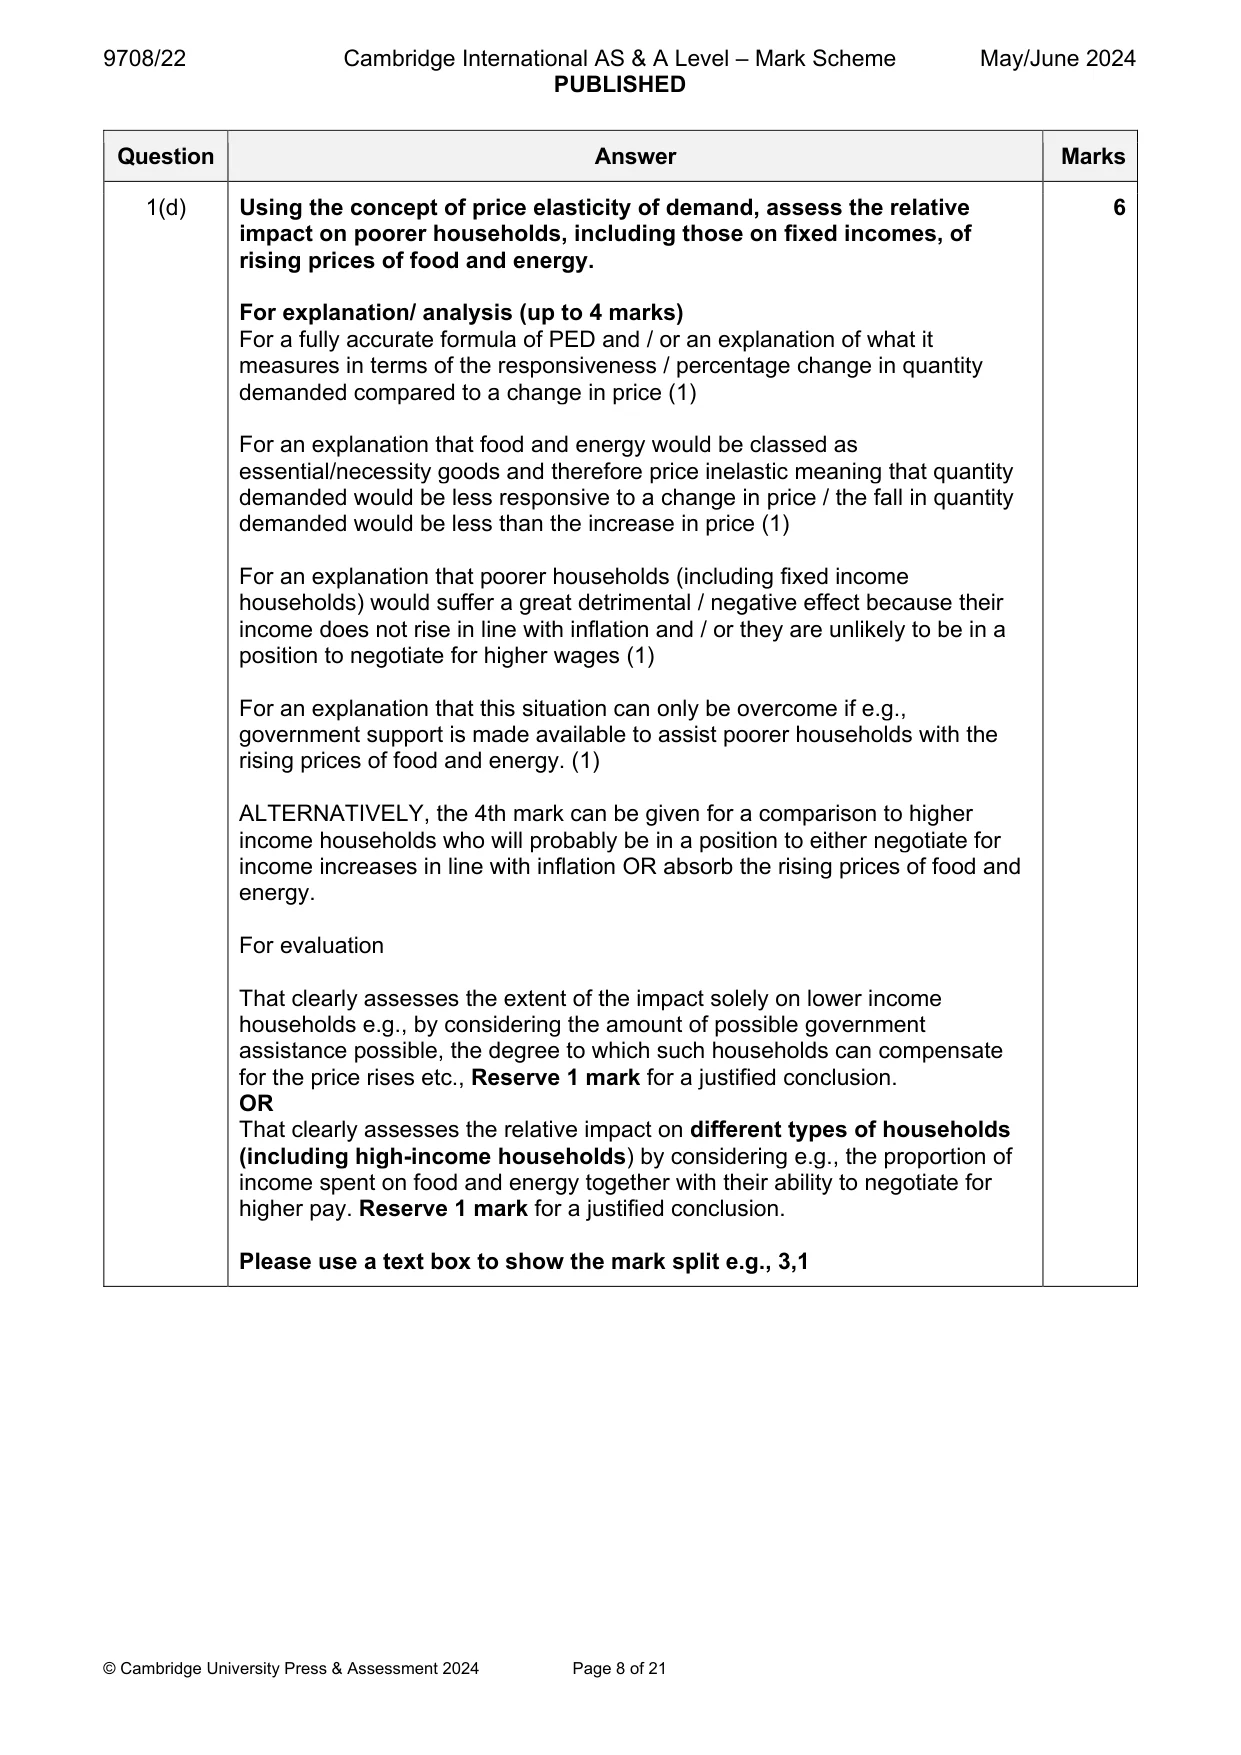
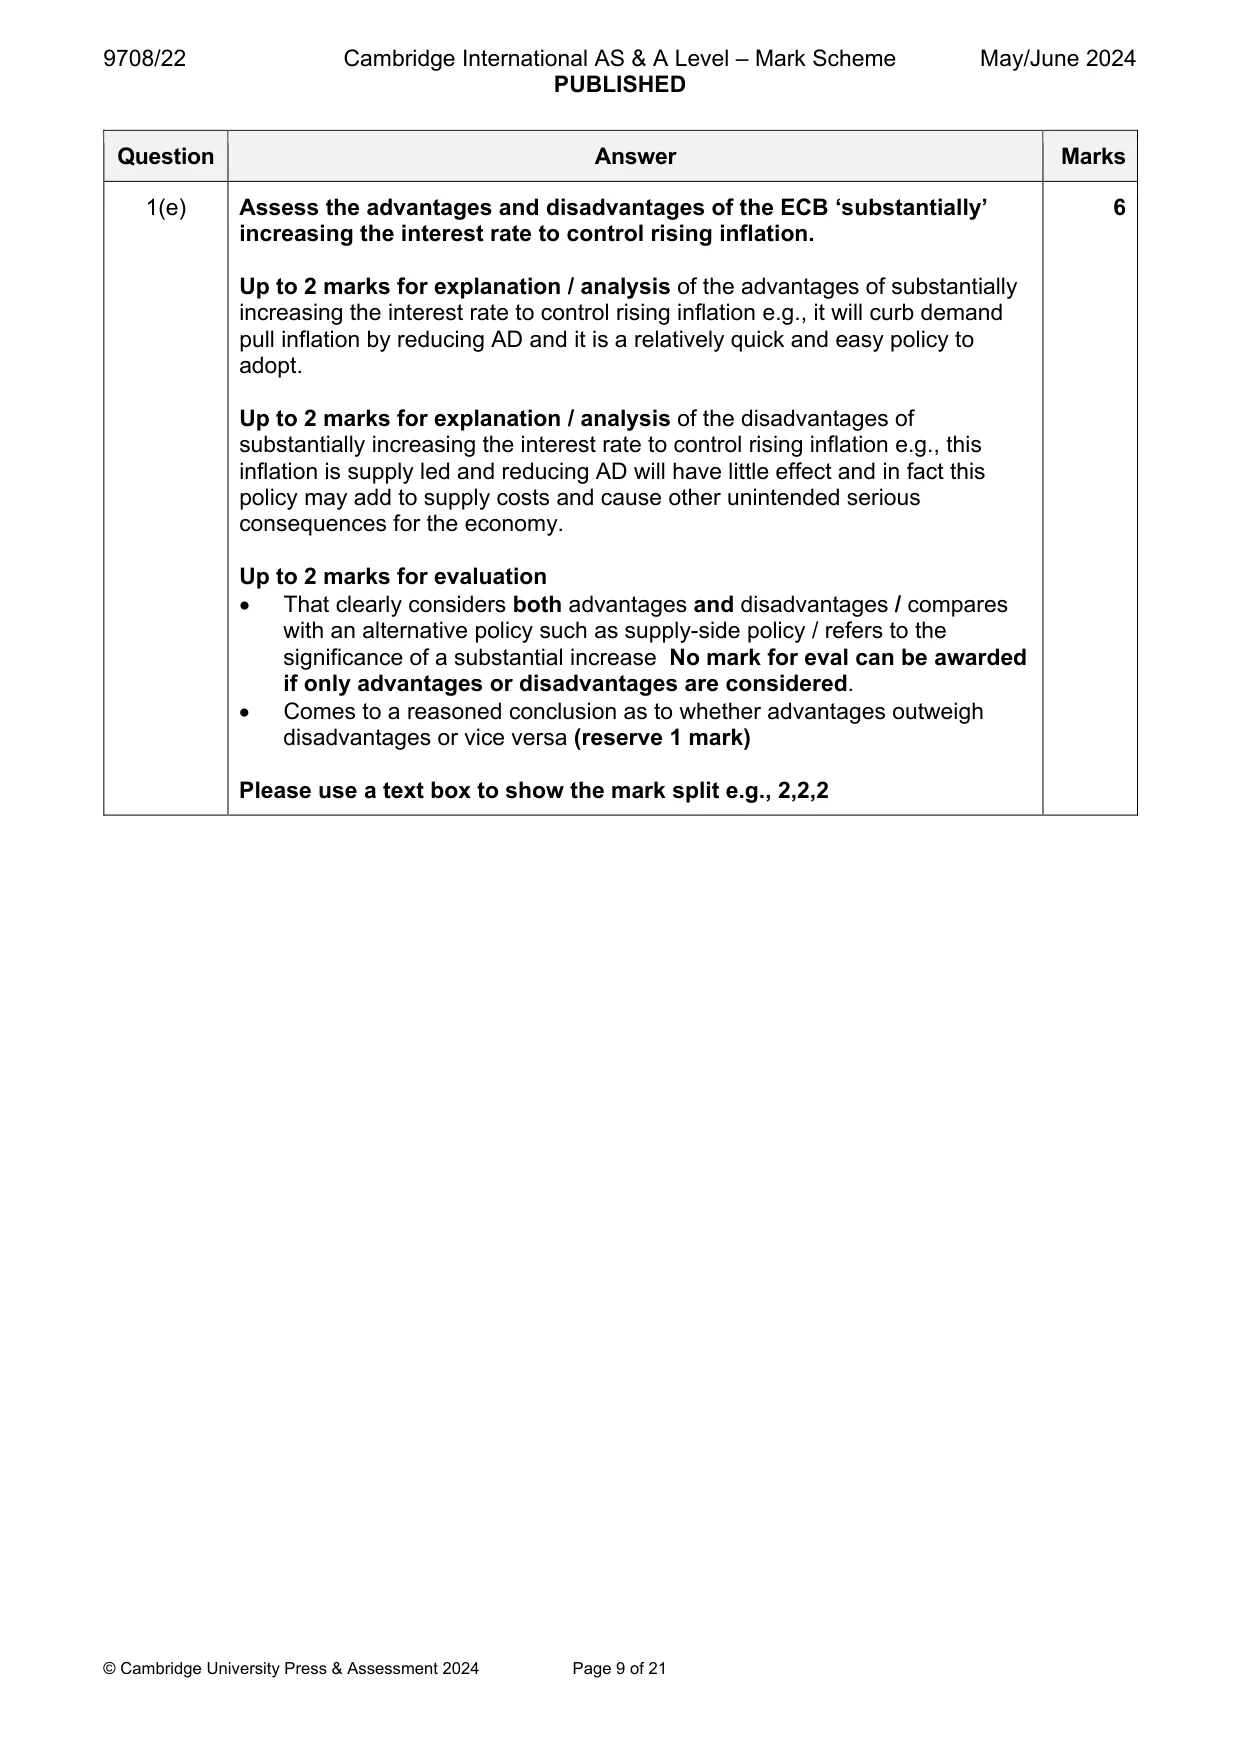
Mark scheme: Question Answer Marks Follow the point-based marking guidance at the top of this mark scheme. 1(a) Describe what has happened to consumer prices in the Eurozone 2 between March 2021 and February 2022. For example, consumer prices / inflation/ CPI have risen over this period (1) by 4.89% (accept an answer between 4.8% and 4.9%) (1) rose every month except July 2021 (1). Guidance: Other examples may include, the largest increase was in February 2022 (1), the rate of increase was generally lower before October 2021 than after. (1) Note: simply stating consumer prices have increased from 106.53 to 111.74 or by 5.21% is worth 1 MAX. Award one mark for each valid change between March2021 and February 2022. Note:, it is not necessary to provide figures / calculations. 1(b) With the help of an aggregate demand and aggregate supply diagram, 2 identify the main type of inflation in the Eurozone. For clearly identifying that the main type of inflation in the Eurozone is cost-push inflation (1) Shown on a correctly labelled diagram that shows a shift to the left of the AS curve and the increase in the price level (1) 1(c) Consider the extent to which the shortage of supply of labour in the 4 Eurozone may have contributed towards the increasing rate of inflation. Shortage of the supply of labour is likely to increase wage rates (1) Which will increase business costs of production/ and therefore cause cost-push inflation/shift AS curve to the left (1) However, energy costs have also increased further adding to costs of production (1) For valid evaluation Extent therefore depends on (e.g.) relative increases in costs due to wages and energy costs (1) Please use a text box to show the mark split e.g., 2,1 1(d) Using the concept of price elasticity of demand, assess the relative 6 impact on poorer households, including those on fixed incomes, of rising prices of food and energy. For explanation/ analysis (up to 4 marks) For a fully accurate formula of PED and / or an explanation of what it measures in terms of the responsiveness / percentage change in quantity demanded compared to a change in price (1) For an explanation that food and energy would be classed as essential/necessity goods and therefore price inelastic meaning that quantity demanded would be less responsive to a change in price / the fall in quantity demanded would be less than the increase in price (1) For an explanation that poorer households (including fixed income households) would suffer a great detrimental / negative effect because their income does not rise in line with inflation and / or they are unlikely to be in a position to negotiate for higher wages (1) For an explanation that this situation can only be overcome if e.g., government support is made available to assist poorer households with the rising prices of food and energy. (1) ALTERNATIVELY, the 4th mark can be given for a comparison to higher income households who will probably be in a position to either negotiate for income increases in line with inflation OR absorb the rising prices of food and energy. For evaluation That clearly assesses the extent of the impact solely on lower income households e.g., by considering the amount of possible government assistance possible, the degree to which such households can compensate for the price rises etc., Reserve 1 mark for a justified conclusion. OR That clearly assesses the relative impact on different types of households (including high-income households) by considering e.g., the proportion of income spent on food and energy together with their ability to negotiate for higher pay. Reserve 1 mark for a justified conclusion. Please use a text box to show the mark split e.g., 3,1 1(e) Assess the advantages and disadvantages of the ECB ‘substantially’ 6 increasing the interest rate to control rising inflation. Up to 2 marks for explanation / analysis of the advantages of substantially increasing the interest rate to control rising inflation e.g., it will curb demand pull inflation by reducing AD and it is a relatively quick and easy policy to adopt. Up to 2 marks for explanation / analysis of the disadvantages of substantially increasing the interest rate to control rising inflation e.g., this inflation is supply led and reducing AD will have little effect and in fact this policy may add to supply costs and cause other unintended serious consequences for the economy. Up to 2 marks for evaluation That clearly considers both advantages and disadvantages / compares with an alternative policy such as supply-side policy / refers to the significance of a substantial increase No mark for eval can be awarded if only advantages or disadvantages are considered. Comes to a reasoned conclusion as to whether advantages outweigh disadvantages or vice versa (reserve 1 mark) Please use a text box to show the mark split e.g., 2,2,2 Section B
More questions on Aggregate Demand and Aggregate Supply analysis
Q2 · Explain how the Gini coefficient is used to measure income inequality and consider the…
2 (a) Explain how the Gini coefficient is used to measure income inequality and consider the relative strength of two economic reasons suggested for such inequality in a low-income country. [8] (b) Assess the extent to which government policies to redistribute income and wealth are likely to be successful. [12] OR
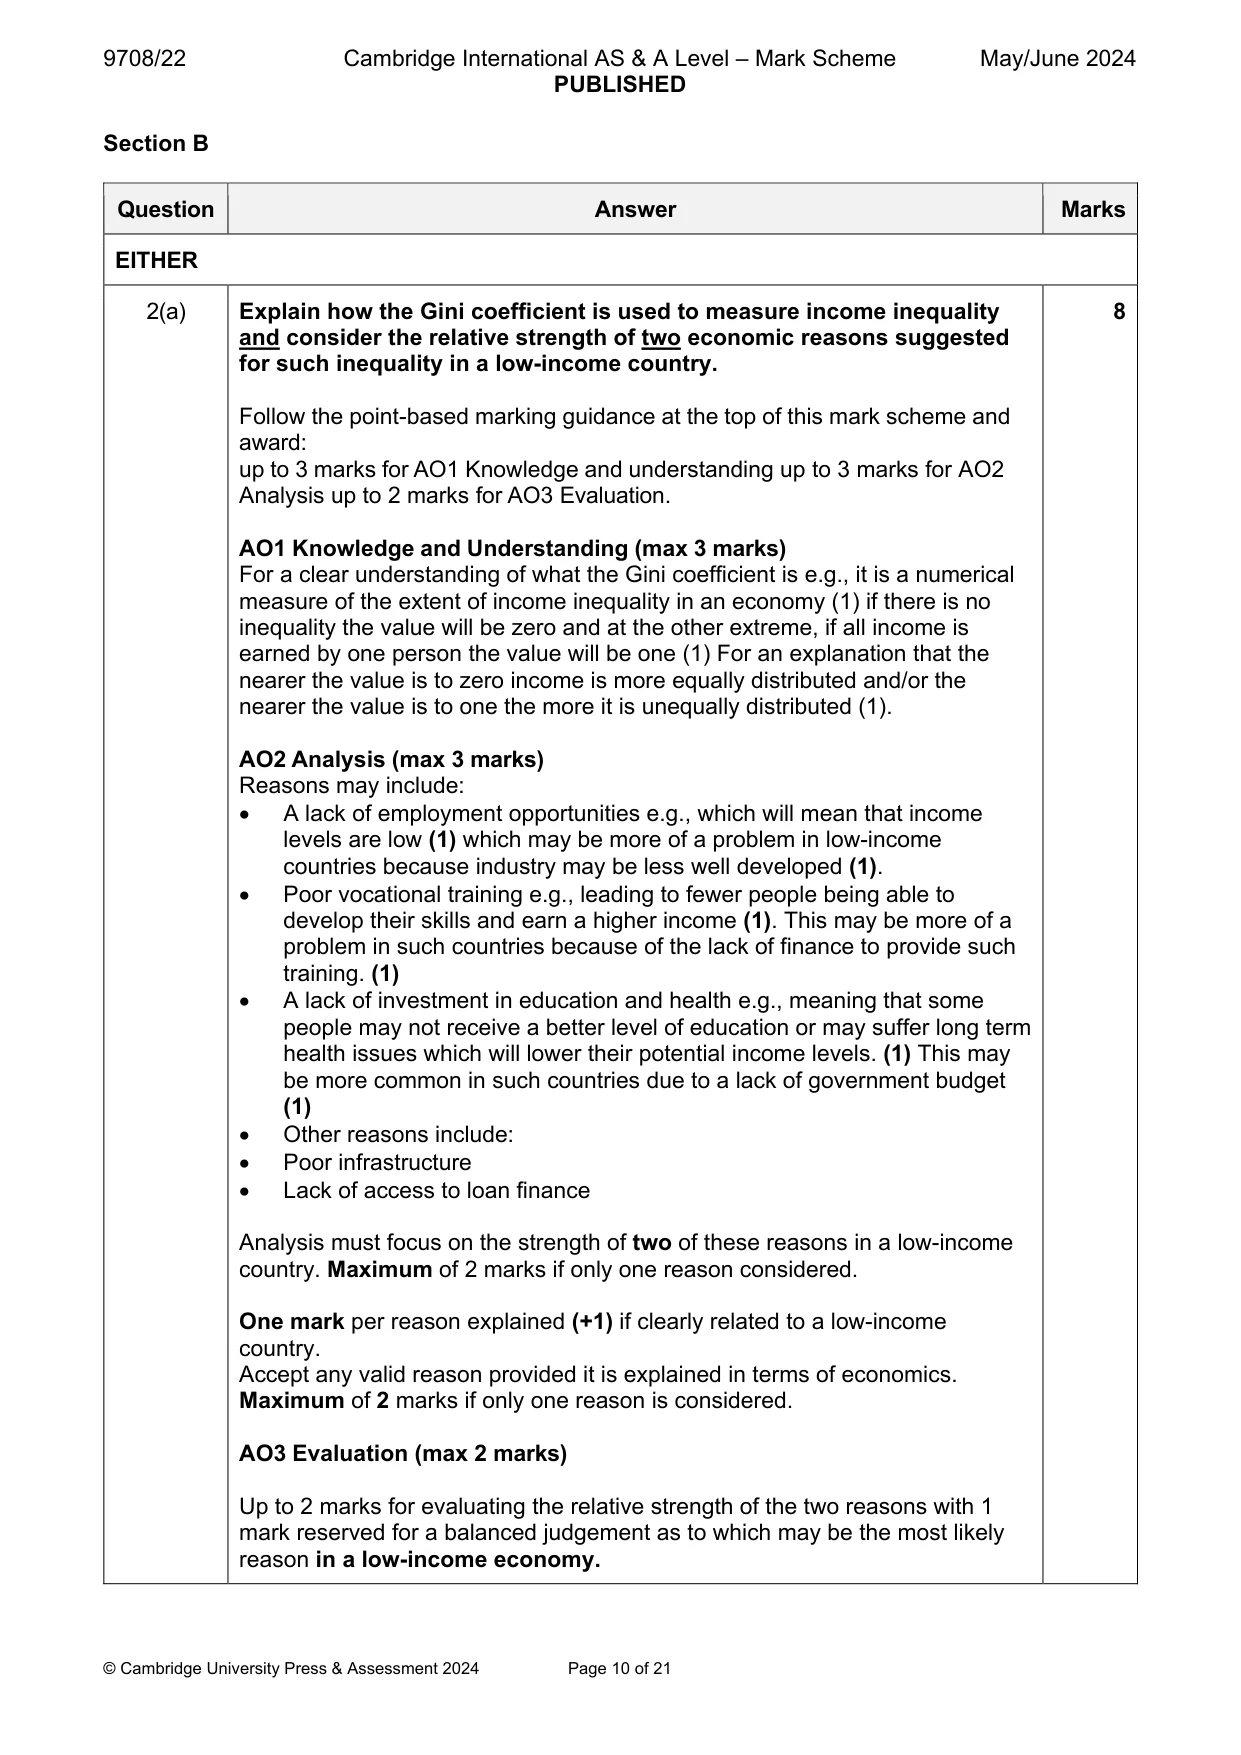
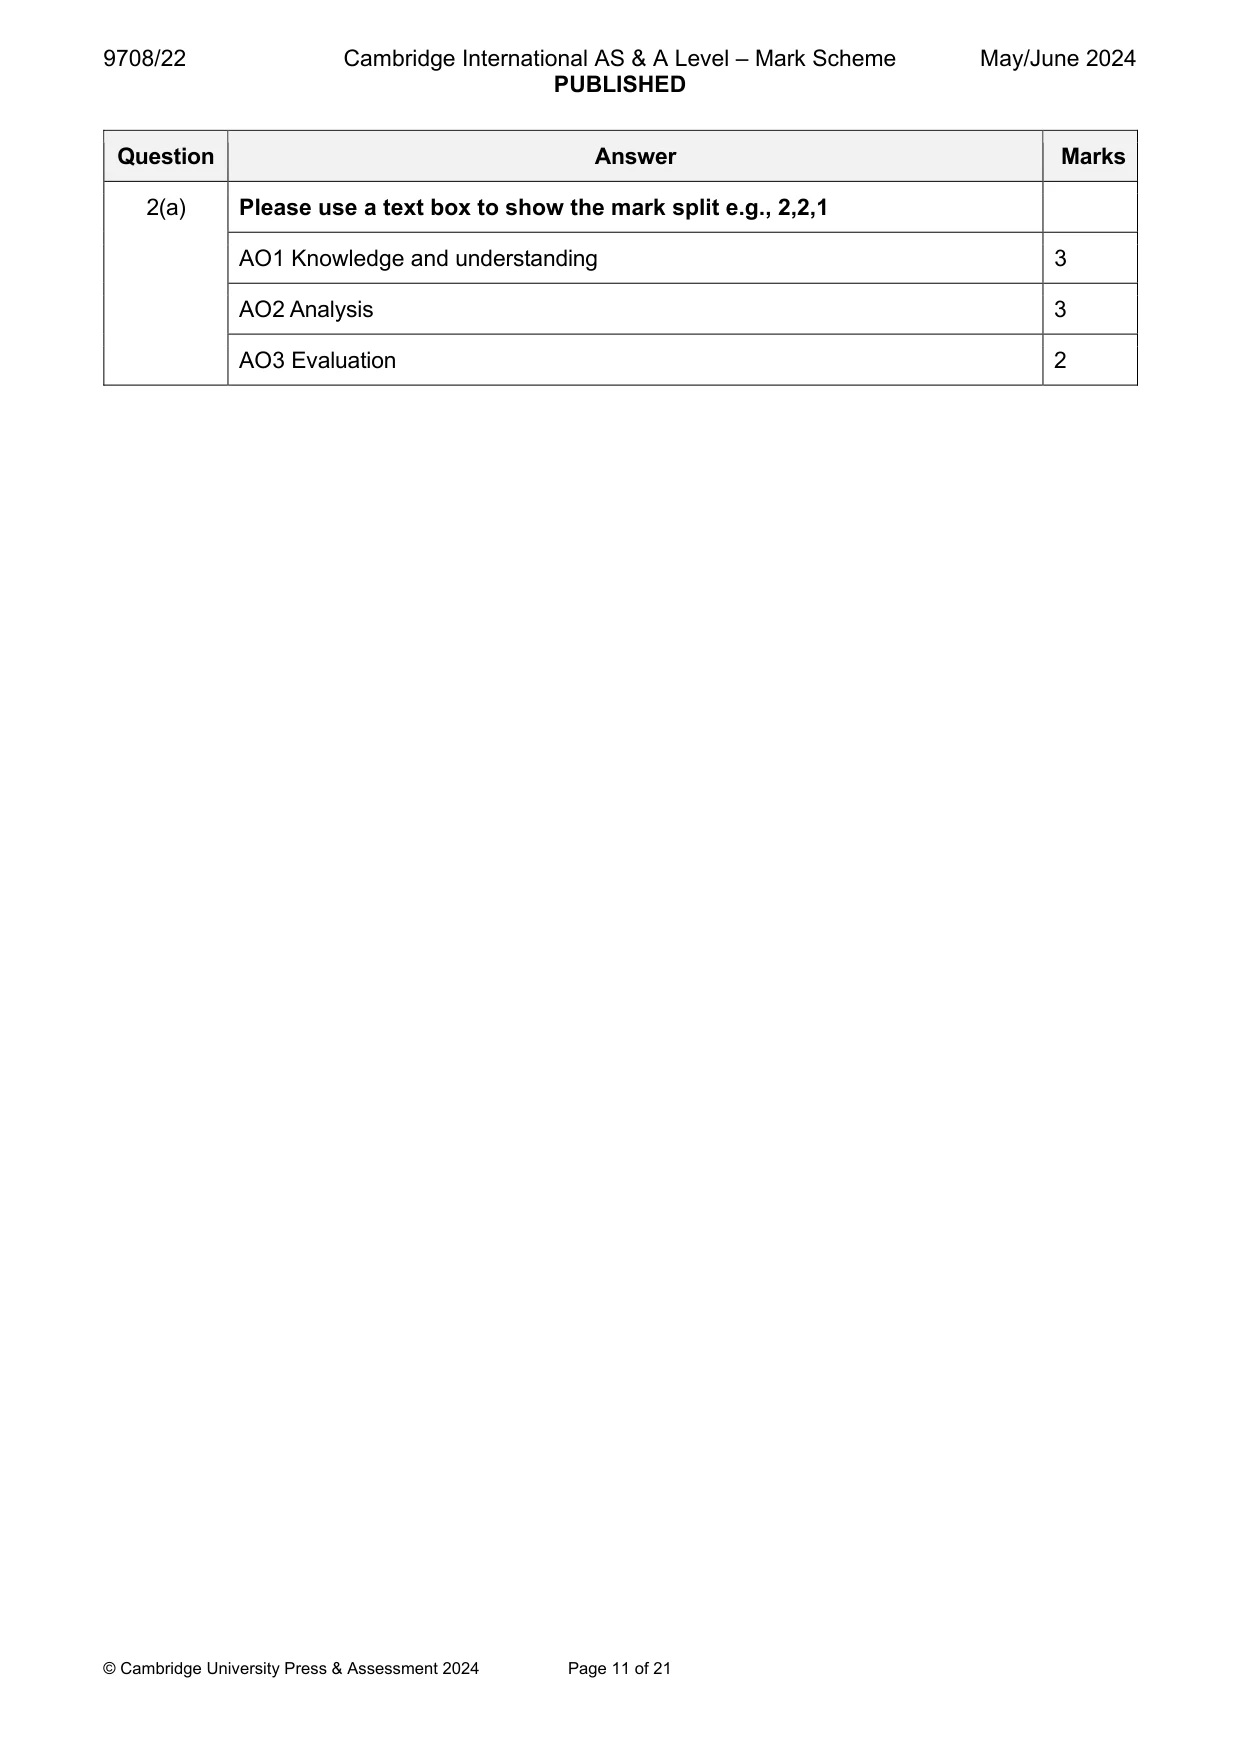
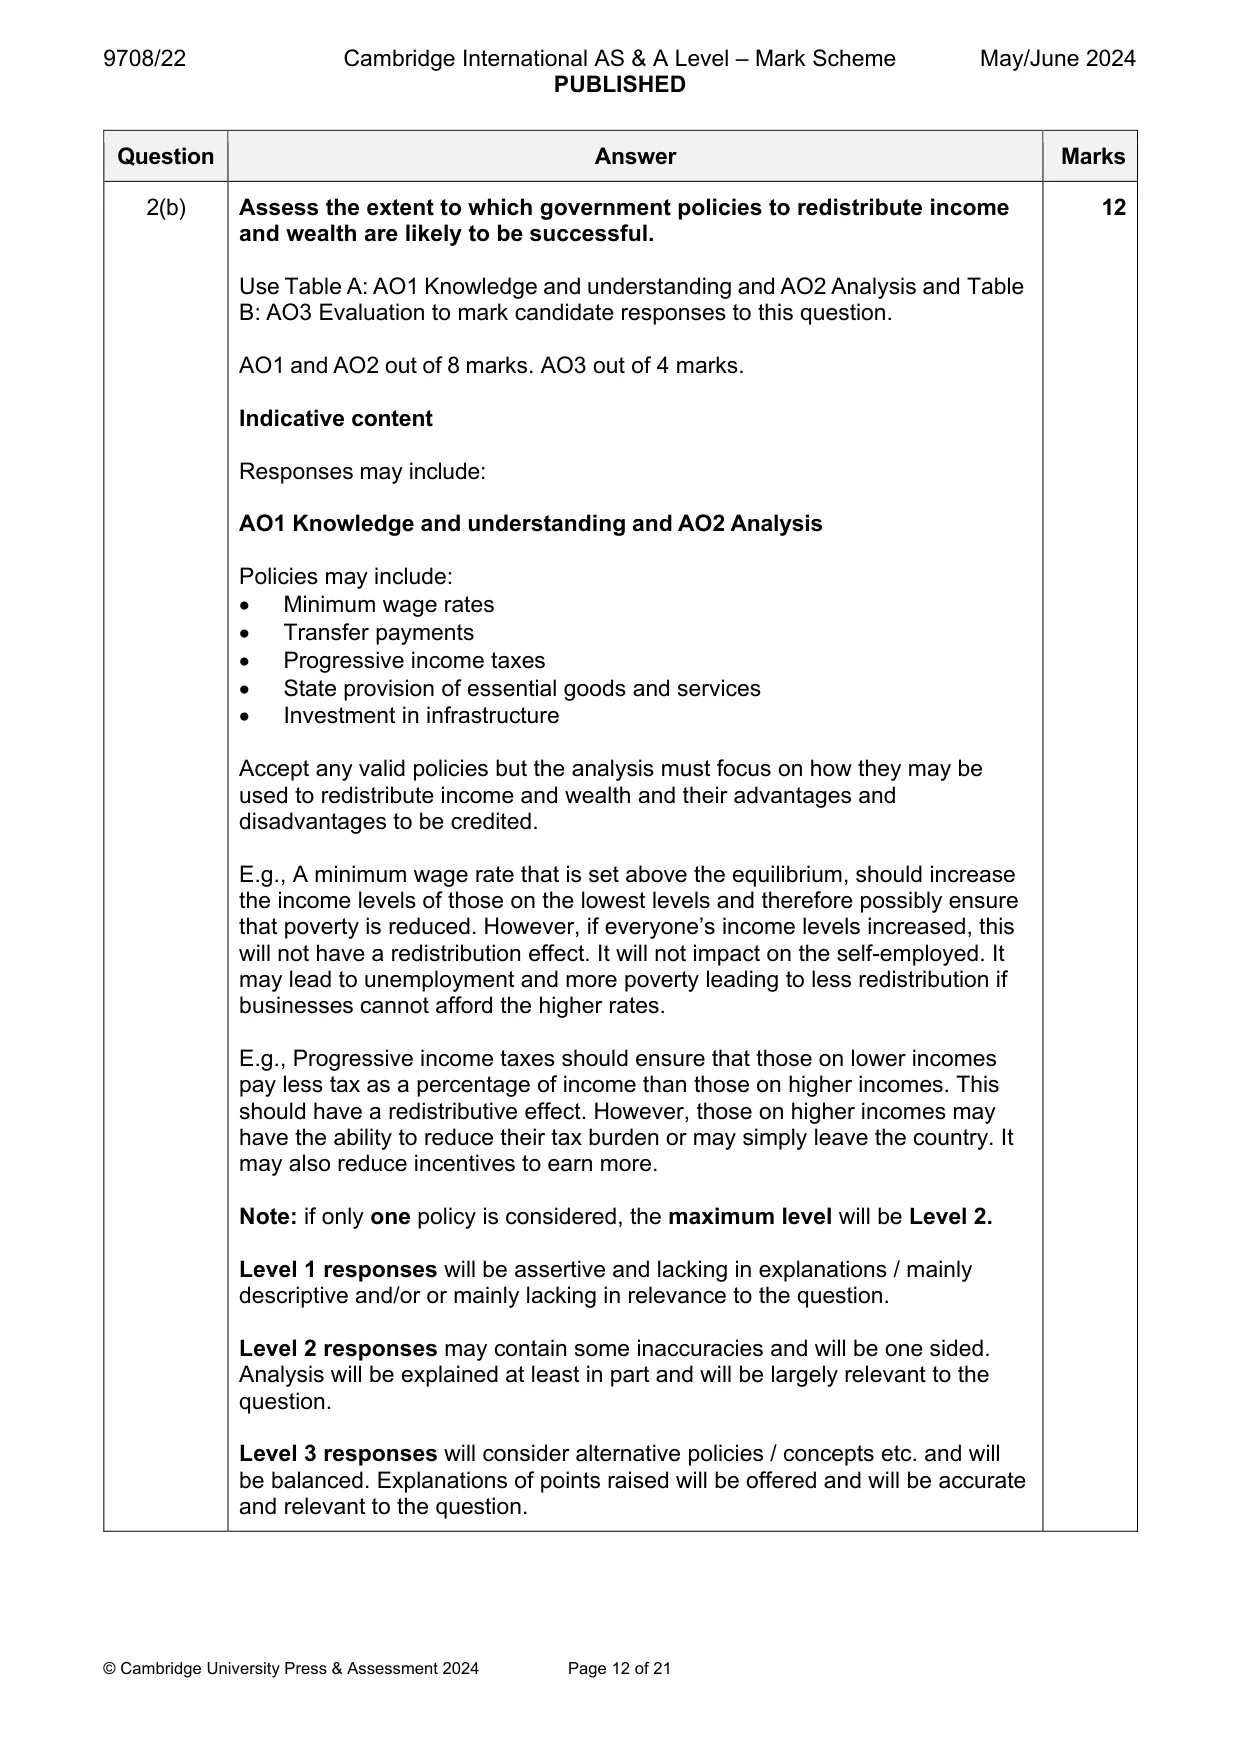
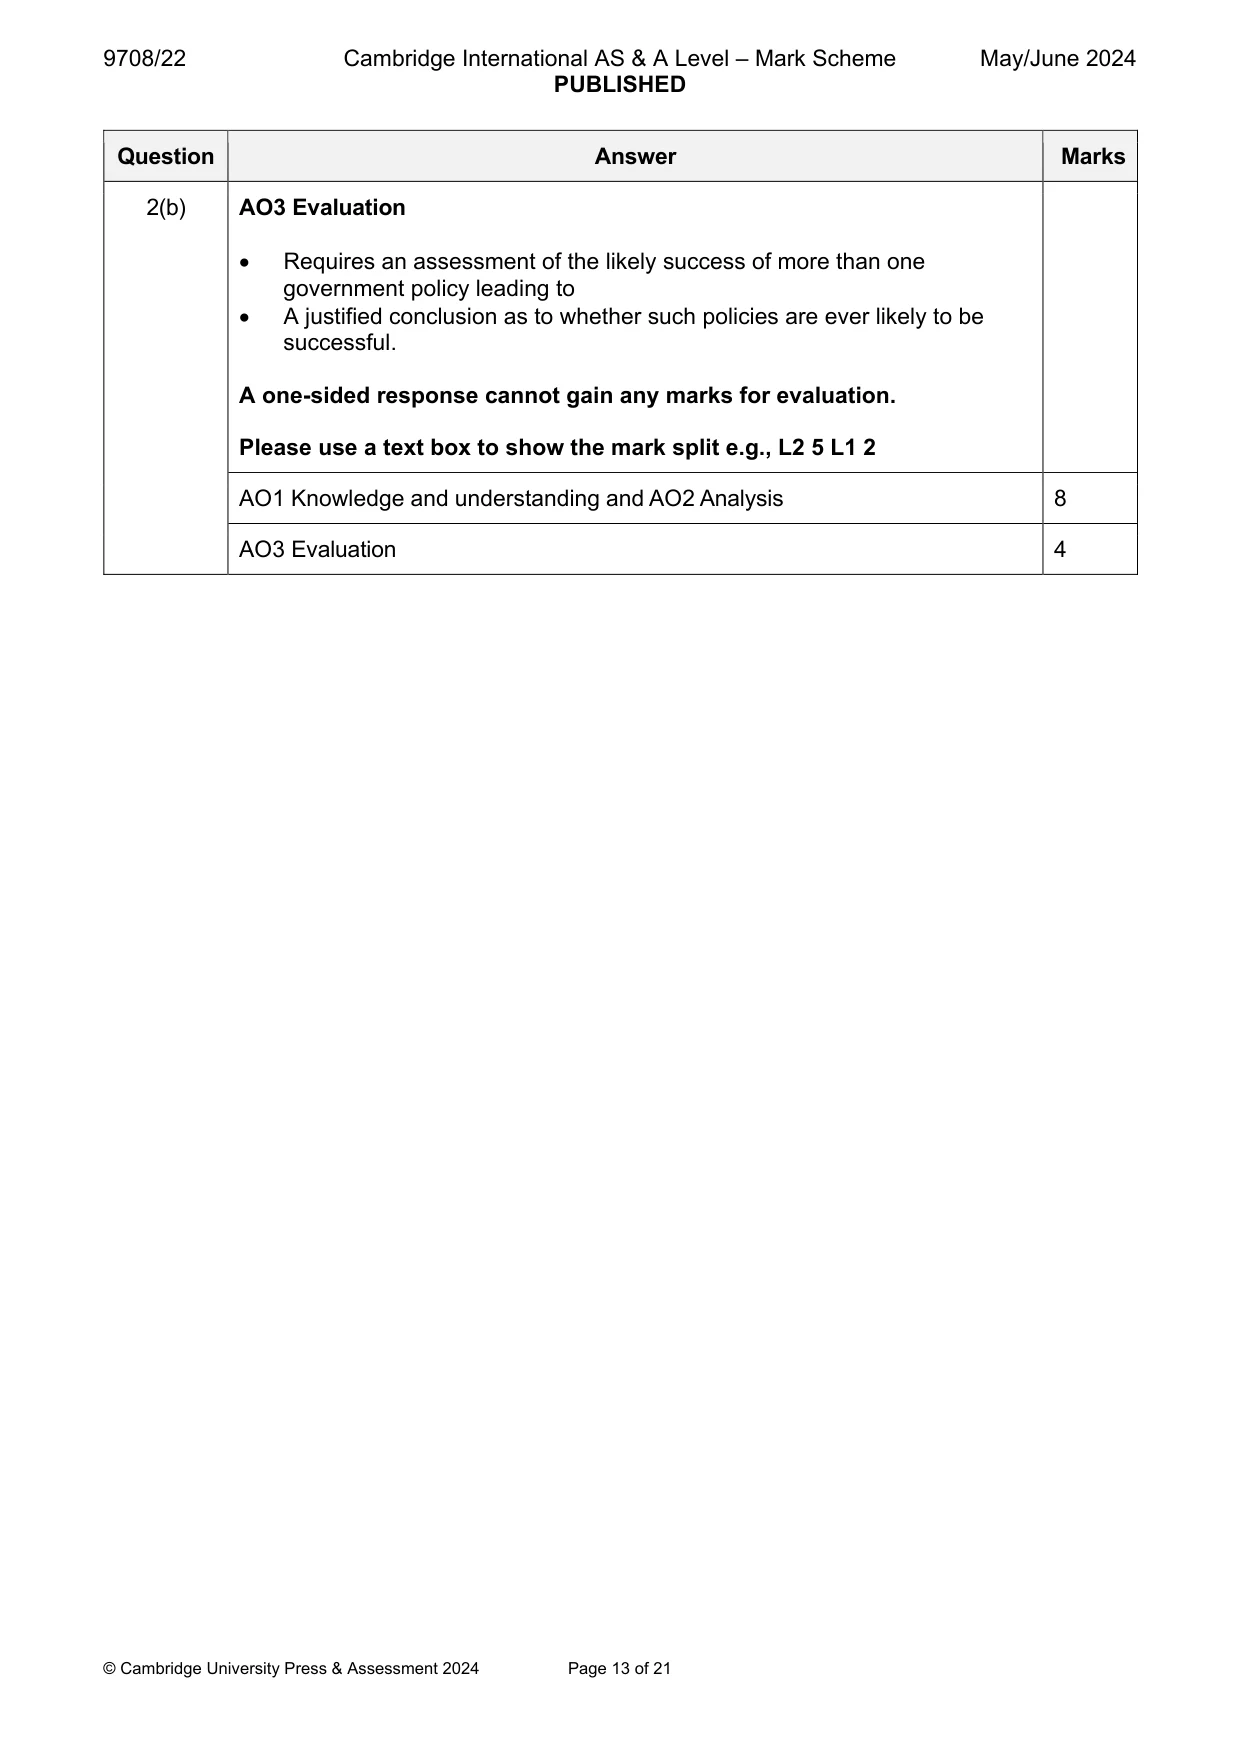
Mark scheme: 2(a) Explain how the Gini coefficient is used to measure income inequality 8 and consider the relative strength of two economic reasons suggested for such inequality in a low-income country. Follow the point-based marking guidance at the top of this mark scheme and award: up to 3 marks for AO1 Knowledge and understanding up to 3 marks for AO2 Analysis up to 2 marks for AO3 Evaluation. AO1 Knowledge and Understanding (max 3 marks) For a clear understanding of what the Gini coefficient is e.g., it is a numerical measure of the extent of income inequality in an economy (1) if there is no inequality the value will be zero and at the other extreme, if all income is earned by one person the value will be one (1) For an explanation that the nearer the value is to zero income is more equally distributed and/or the nearer the value is to one the more it is unequally distributed (1). AO2 Analysis (max 3 marks) Reasons may include: A lack of employment opportunities e.g., which will mean that income levels are low (1) which may be more of a problem in low-income countries because industry may be less well developed (1). Poor vocational training e.g., leading to fewer people being able to develop their skills and earn a higher income (1). This may be more of a problem in such countries because of the lack of finance to provide such training. (1) A lack of investment in education and health e.g., meaning that some people may not receive a better level of education or may suffer long term health issues which will lower their potential income levels. (1) This may be more common in such countries due to a lack of government budget (1) Other reasons include: Poor infrastructure Lack of access to loan finance Analysis must focus on the strength of two of these reasons in a low-income country. Maximum of 2 marks if only one reason considered. One mark per reason explained (+1) if clearly related to a low-income country. Accept any valid reason provided it is explained in terms of economics. Maximum of 2 marks if only one reason is considered. AO3 Evaluation (max 2 marks) Up to 2 marks for evaluating the relative strength of the two reasons with 1 mark reserved for a balanced judgement as to which may be the most likely reason in a low-income economy. 2(a) Please use a text box to show the mark split e.g., 2,2,1 AO1 Knowledge and understanding 3 AO2 Analysis 3 AO3 Evaluation 2 2(b) Assess the extent to which government policies to redistribute income 12 and wealth are likely to be successful. Use Table A: AO1 Knowledge and understanding and AO2 Analysis and Table B: AO3 Evaluation to mark candidate responses to this question. AO1 and AO2 out of 8 marks. AO3 out of 4 marks. Indicative content Responses may include: AO1 Knowledge and understanding and AO2 Analysis Policies may include: Minimum wage rates Transfer payments Progressive income taxes State provision of essential goods and services Investment in infrastructure Accept any valid policies but the analysis must focus on how they may be used to redistribute income and wealth and their advantages and disadvantages to be credited. E.g., A minimum wage rate that is set above the equilibrium, should increase the income levels of those on the lowest levels and therefore possibly ensure that poverty is reduced. However, if everyone’s income levels increased, this will not have a redistribution effect. It will not impact on the self-employed. It may lead to unemployment and more poverty leading to less redistribution if businesses cannot afford the higher rates. E.g., Progressive income taxes should ensure that those on lower incomes pay less tax as a percentage of income than those on higher incomes. This should have a redistributive effect. However, those on higher incomes may have the ability to reduce their tax burden or may simply leave the country. It may also reduce incentives to earn more. Note: if only one policy is considered, the maximum level will be Level 2. Level 1 responses will be assertive and lacking in explanations / mainly descriptive and/or or mainly lacking in relevance to the question. Level 2 responses may contain some inaccuracies and will be one sided. Analysis will be explained at least in part and will be largely relevant to the question. Level 3 responses will consider alternative policies / concepts etc. and will be balanced. Explanations of points raised will be offered and will be accurate and relevant to the question. 2(b) AO3 Evaluation Requires an assessment of the likely success of more than one government policy leading to A justified conclusion as to whether such policies are ever likely to be successful. A one-sided response cannot gain any marks for evaluation. Please use a text box to show the mark split e.g., L2 5 L1 2 AO1 Knowledge and understanding and AO2 Analysis 8 AO3 Evaluation 4
More questions on Equity and redistribution of income and wealth
Q3 · With the help of an example of each, explain the difference between a merit good and a…
3 (a) With the help of an example of each, explain the difference between a merit good and a demerit good and consider whether a subsidy given to a merit good will always be effective in increasing its consumption. [8] (b) Assess whether fixing a minimum price is likely to be the best policy to reduce the consumption of a demerit good. [12] Section C Answer one question. EITHER
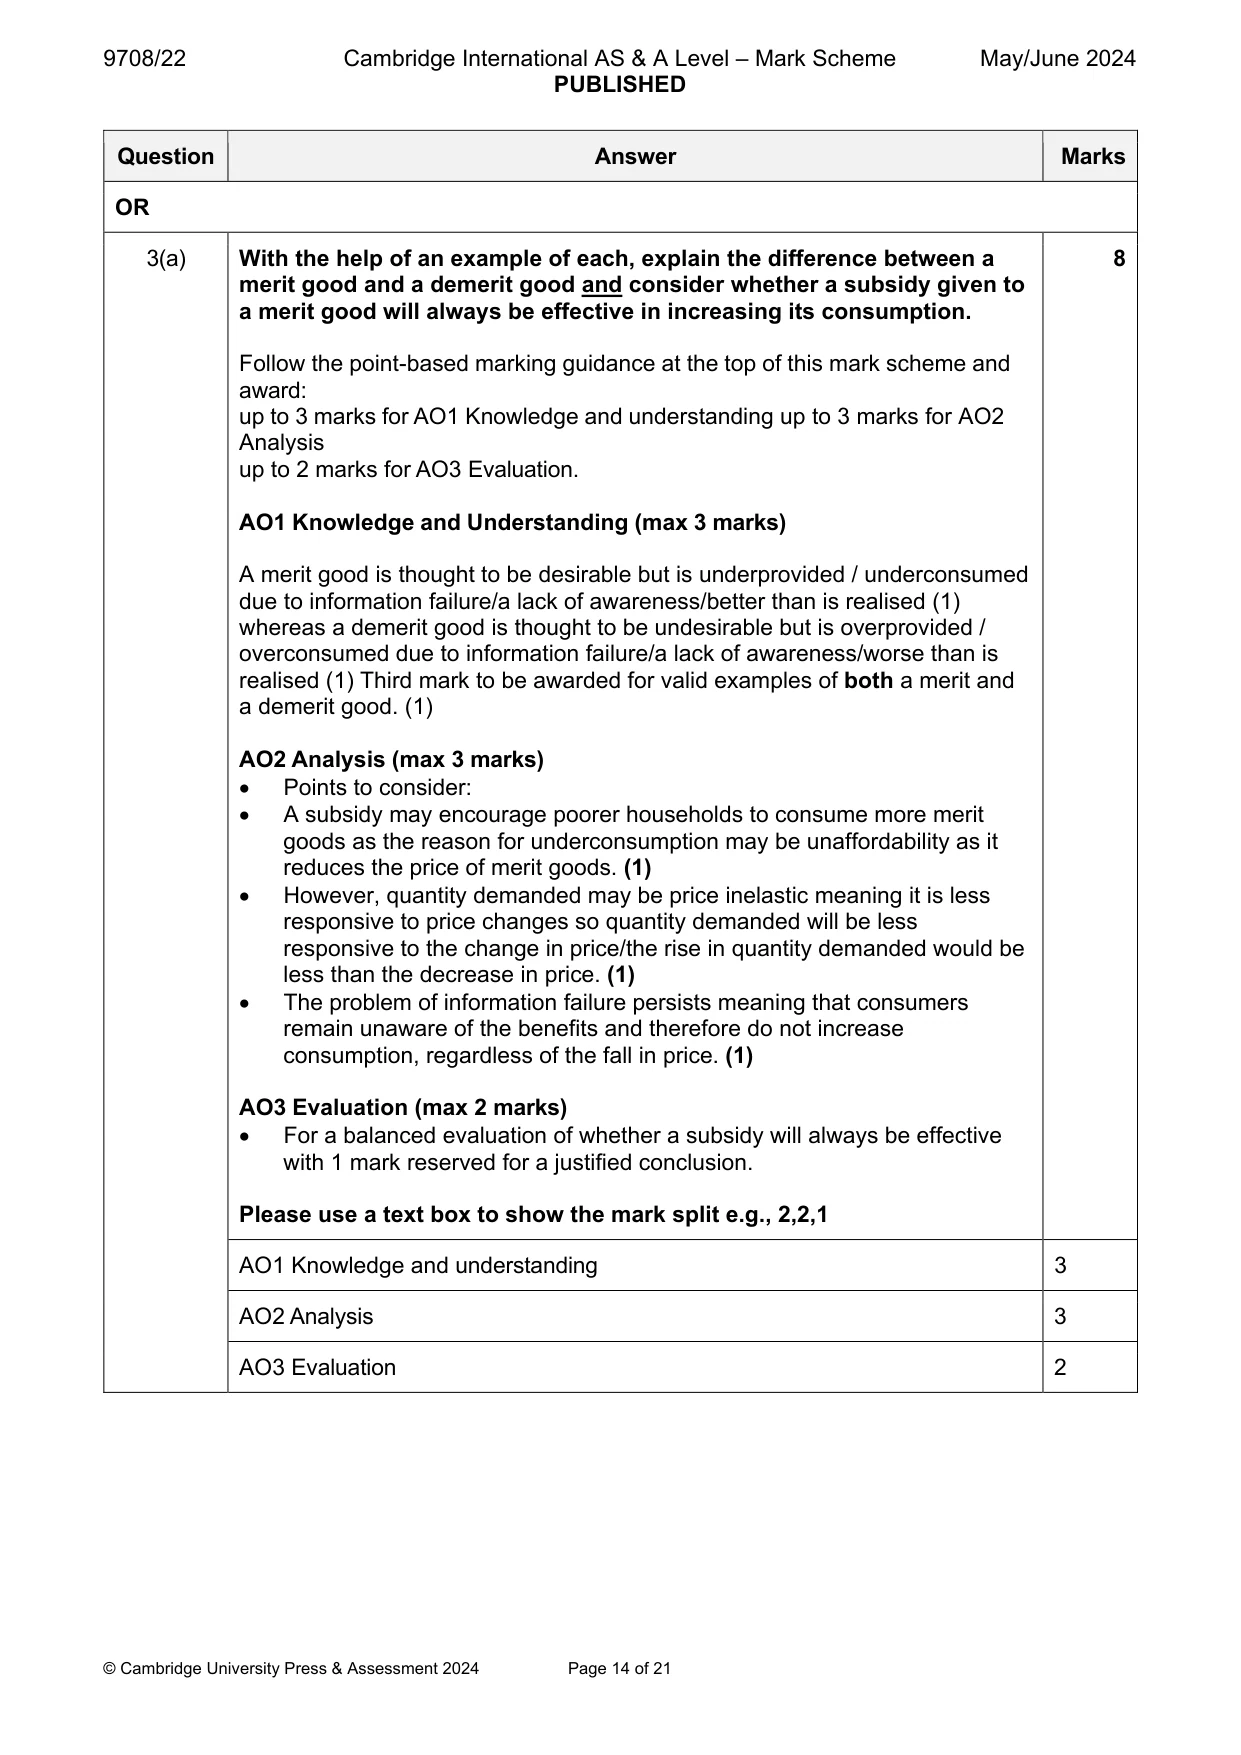
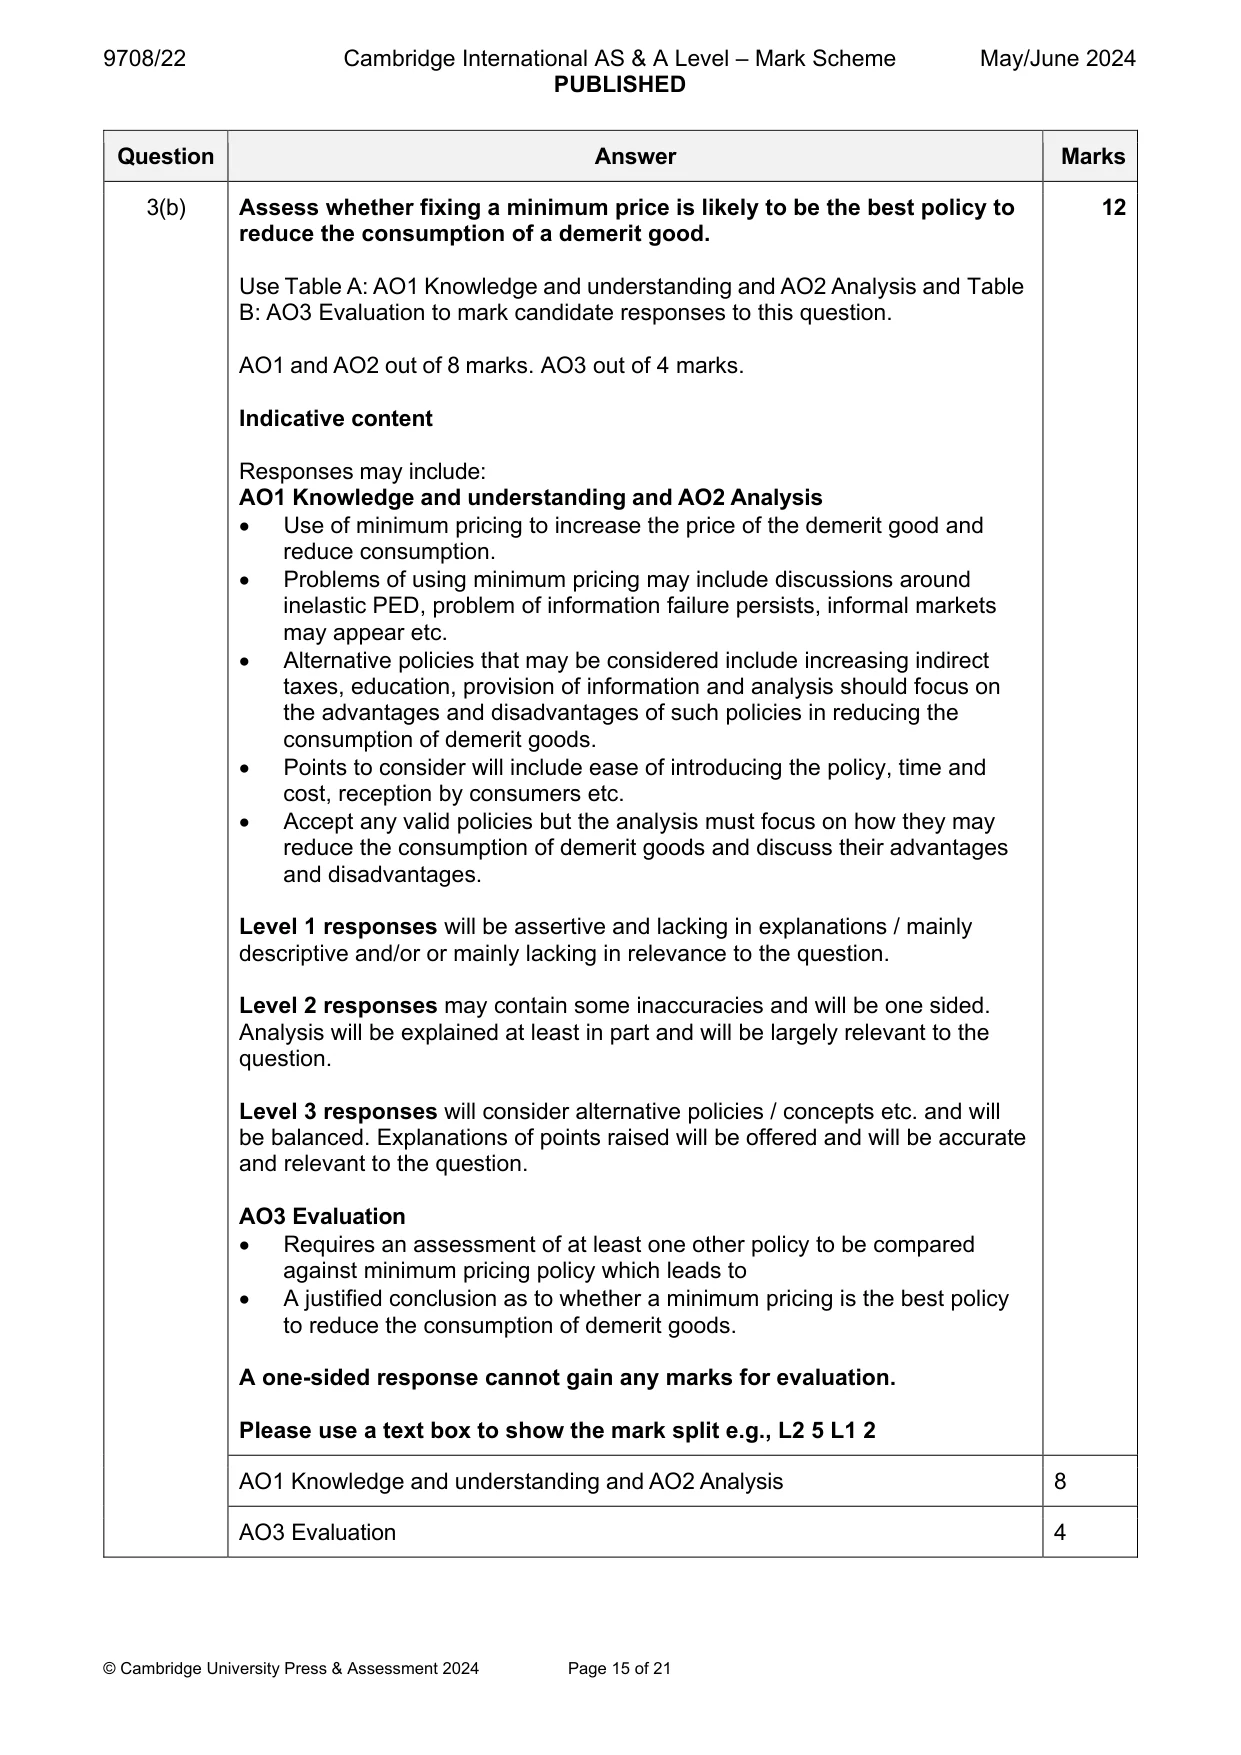
Mark scheme: 3(a) With the help of an example of each, explain the difference between a 8 merit good and a demerit good and consider whether a subsidy given to a merit good will always be effective in increasing its consumption. Follow the point-based marking guidance at the top of this mark scheme and award: up to 3 marks for AO1 Knowledge and understanding up to 3 marks for AO2 Analysis up to 2 marks for AO3 Evaluation. AO1 Knowledge and Understanding (max 3 marks) A merit good is thought to be desirable but is underprovided / underconsumed due to information failure/a lack of awareness/better than is realised (1) whereas a demerit good is thought to be undesirable but is overprovided / overconsumed due to information failure/a lack of awareness/worse than is realised (1) Third mark to be awarded for valid examples of both a merit and a demerit good. (1) AO2 Analysis (max 3 marks) Points to consider: A subsidy may encourage poorer households to consume more merit goods as the reason for underconsumption may be unaffordability as it reduces the price of merit goods. (1) However, quantity demanded may be price inelastic meaning it is less responsive to price changes so quantity demanded will be less responsive to the change in price/the rise in quantity demanded would be less than the decrease in price. (1) The problem of information failure persists meaning that consumers remain unaware of the benefits and therefore do not increase consumption, regardless of the fall in price. (1) AO3 Evaluation (max 2 marks) For a balanced evaluation of whether a subsidy will always be effective with 1 mark reserved for a justified conclusion. Please use a text box to show the mark split e.g., 2,2,1 AO1 Knowledge and understanding 3 AO2 Analysis 3 AO3 Evaluation 2 3(b) Assess whether fixing a minimum price is likely to be the best policy to 12 reduce the consumption of a demerit good. Use Table A: AO1 Knowledge and understanding and AO2 Analysis and Table B: AO3 Evaluation to mark candidate responses to this question. AO1 and AO2 out of 8 marks. AO3 out of 4 marks. Indicative content Responses may include: AO1 Knowledge and understanding and AO2 Analysis Use of minimum pricing to increase the price of the demerit good and reduce consumption. Problems of using minimum pricing may include discussions around inelastic PED, problem of information failure persists, informal markets may appear etc. Alternative policies that may be considered include increasing indirect taxes, education, provision of information and analysis should focus on the advantages and disadvantages of such policies in reducing the consumption of demerit goods. Points to consider will include ease of introducing the policy, time and cost, reception by consumers etc. Accept any valid policies but the analysis must focus on how they may reduce the consumption of demerit goods and discuss their advantages and disadvantages. Level 1 responses will be assertive and lacking in explanations / mainly descriptive and/or or mainly lacking in relevance to the question. Level 2 responses may contain some inaccuracies and will be one sided. Analysis will be explained at least in part and will be largely relevant to the question. Level 3 responses will consider alternative policies / concepts etc. and will be balanced. Explanations of points raised will be offered and will be accurate and relevant to the question. AO3 Evaluation Requires an assessment of at least one other policy to be compared against minimum pricing policy which leads to A justified conclusion as to whether a minimum pricing is the best policy to reduce the consumption of demerit goods. A one-sided response cannot gain any marks for evaluation. Please use a text box to show the mark split e.g., L2 5 L1 2 AO1 Knowledge and understanding and AO2 Analysis 8 AO3 Evaluation 4 Section C
More questions on Methods and effects of government intervention in markets
Q4 · With the help of a diagram, explain what is meant by the circular flow of income in an…
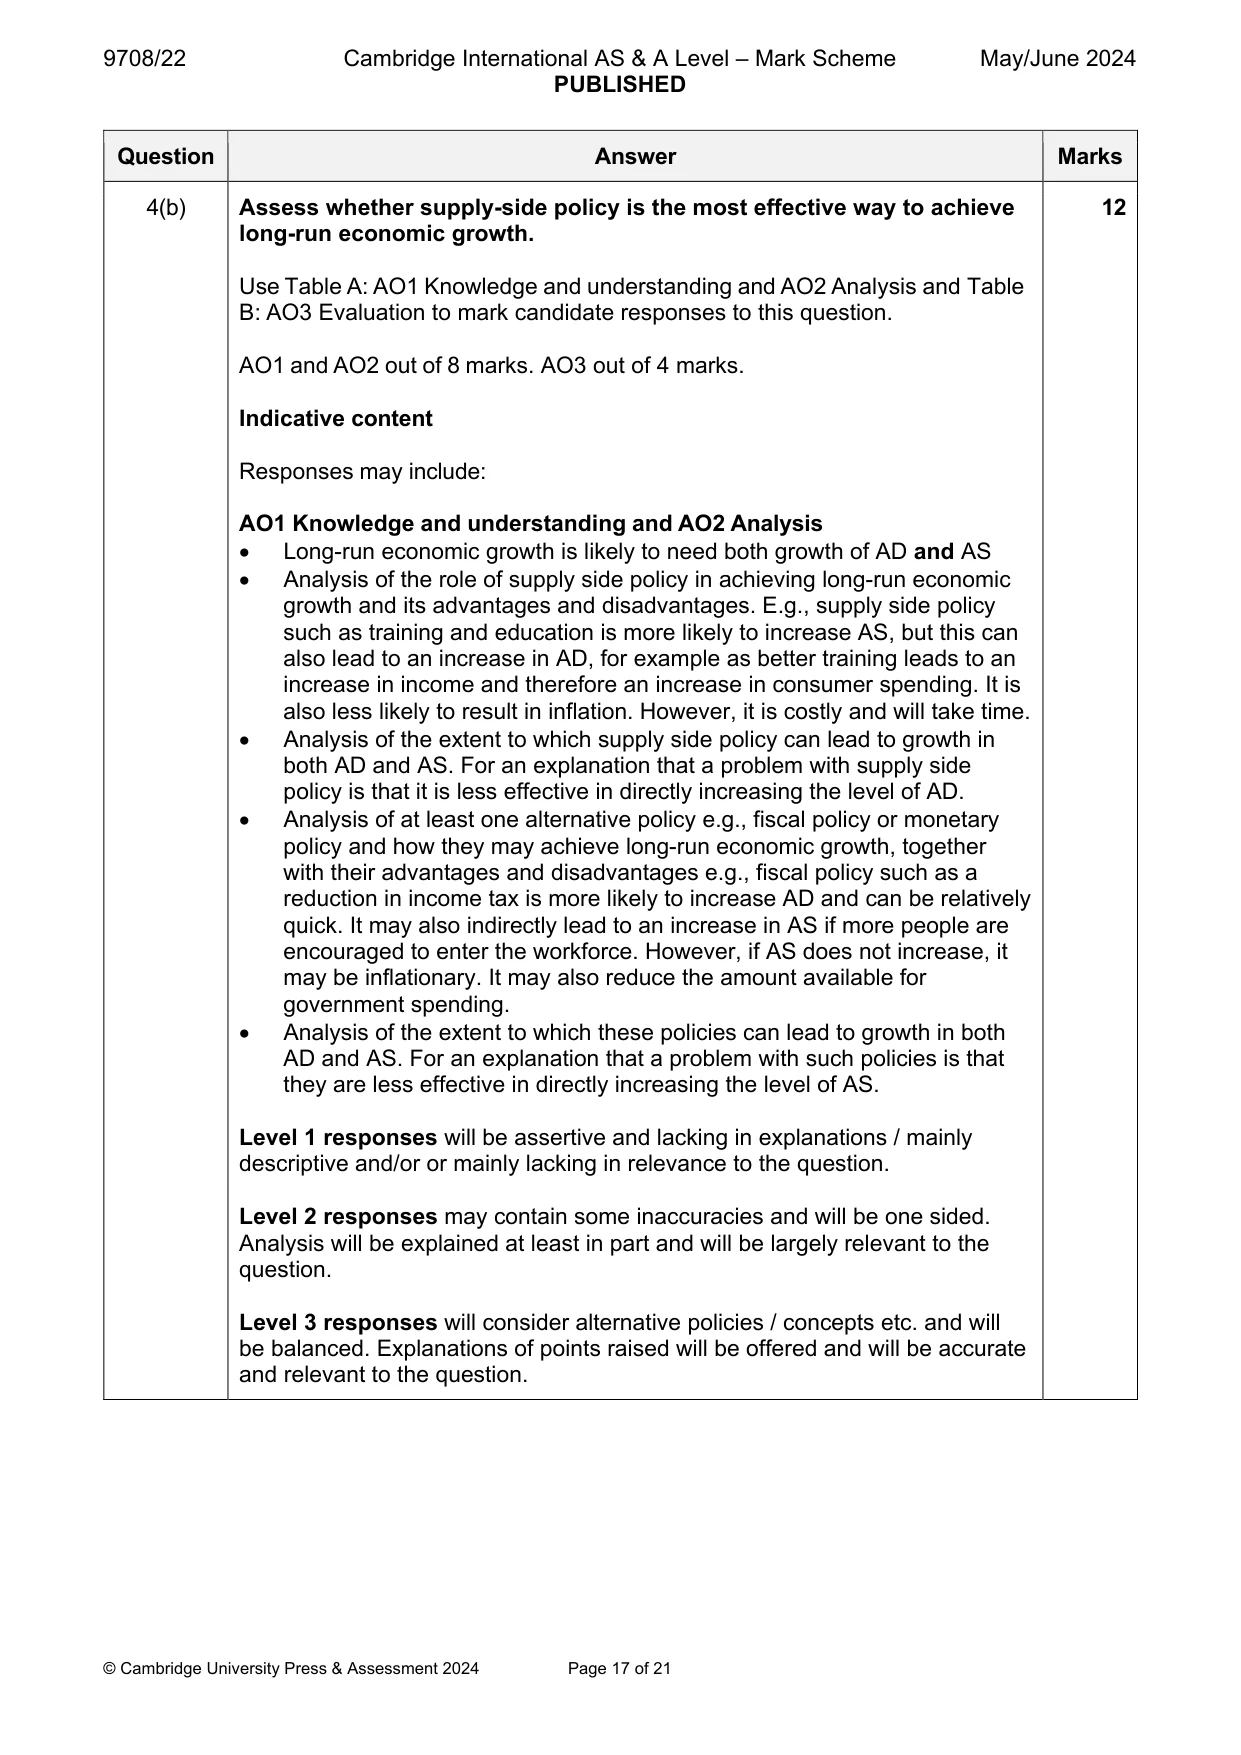
4 (a) With the help of a diagram, explain what is meant by the circular flow of income in an open economy and consider the extent to which it can explain economic growth in such an economy. [8] (b) Assess whether supply-side policy is the most effective way to achieve long-run economic growth. [12] OR
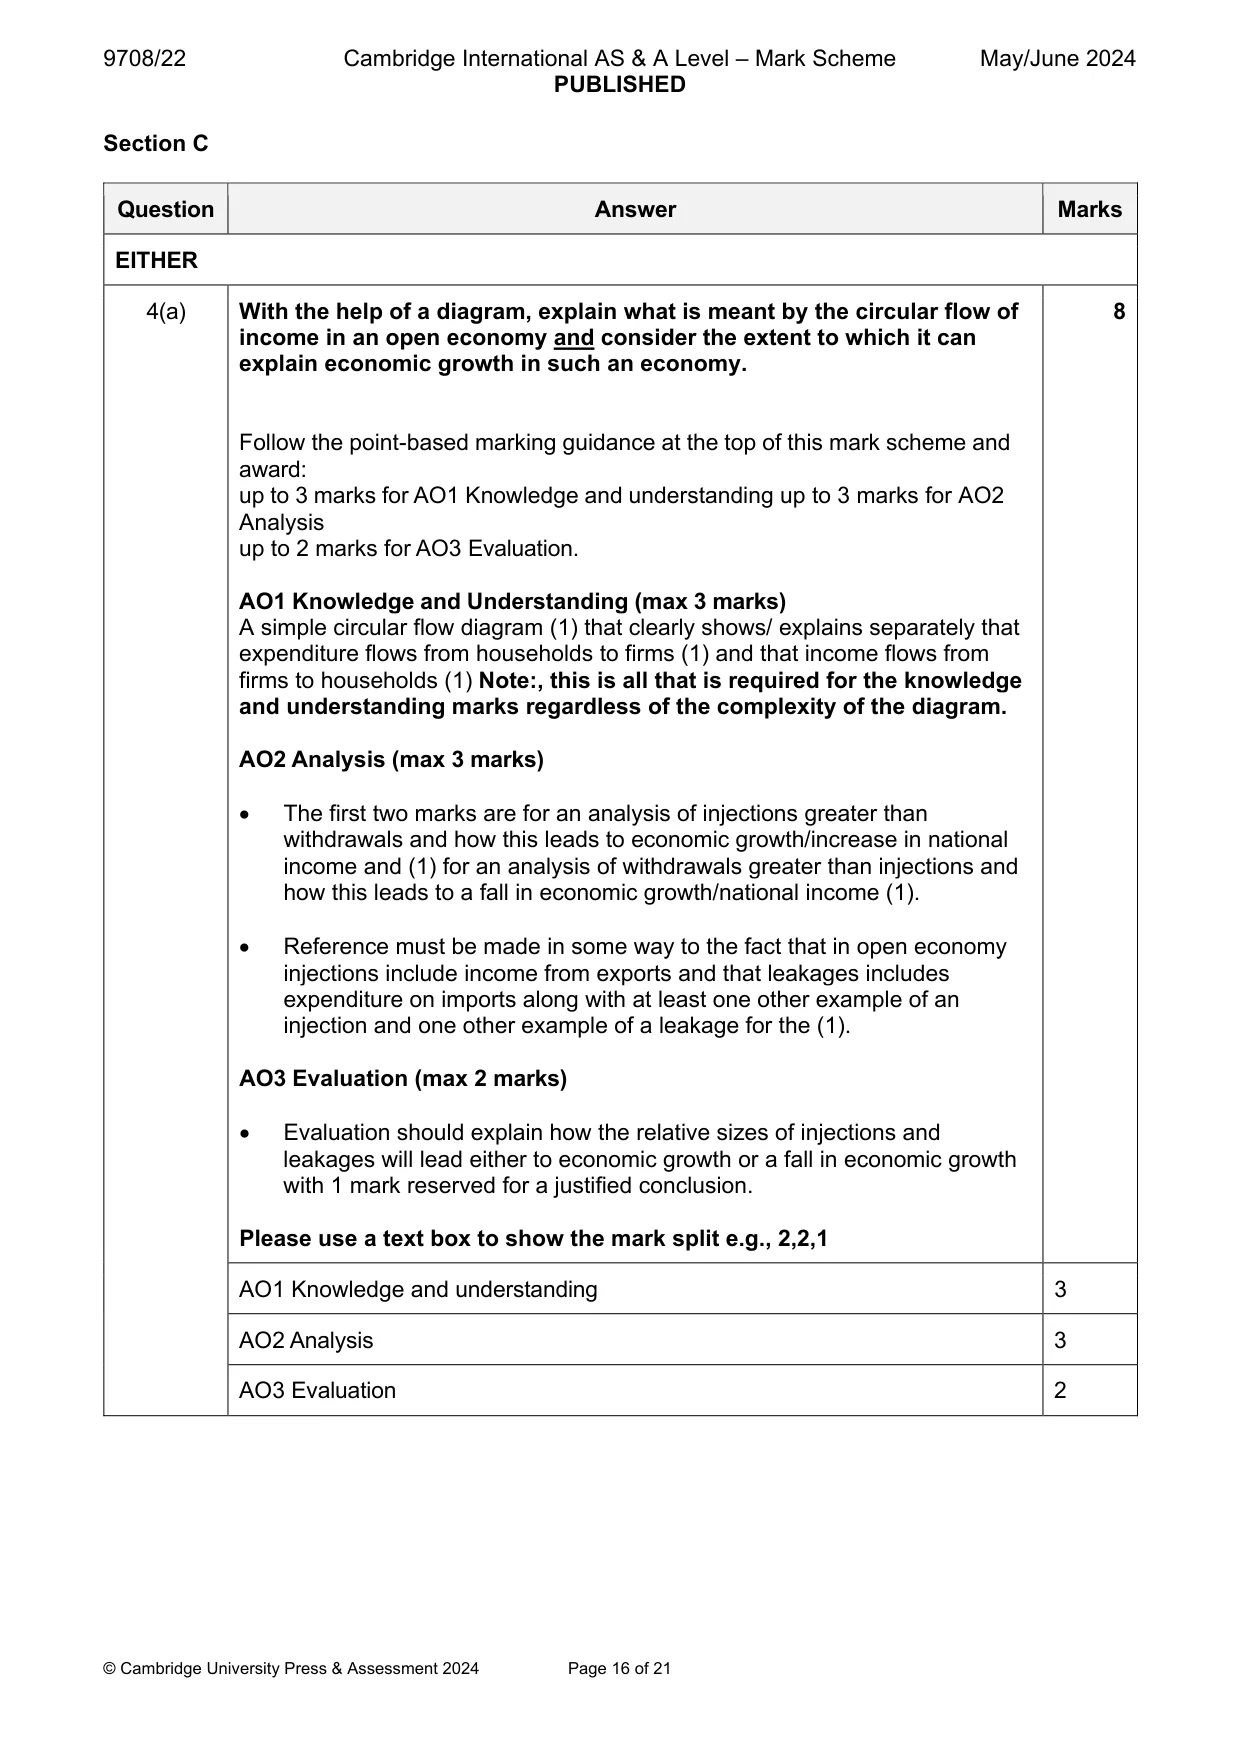
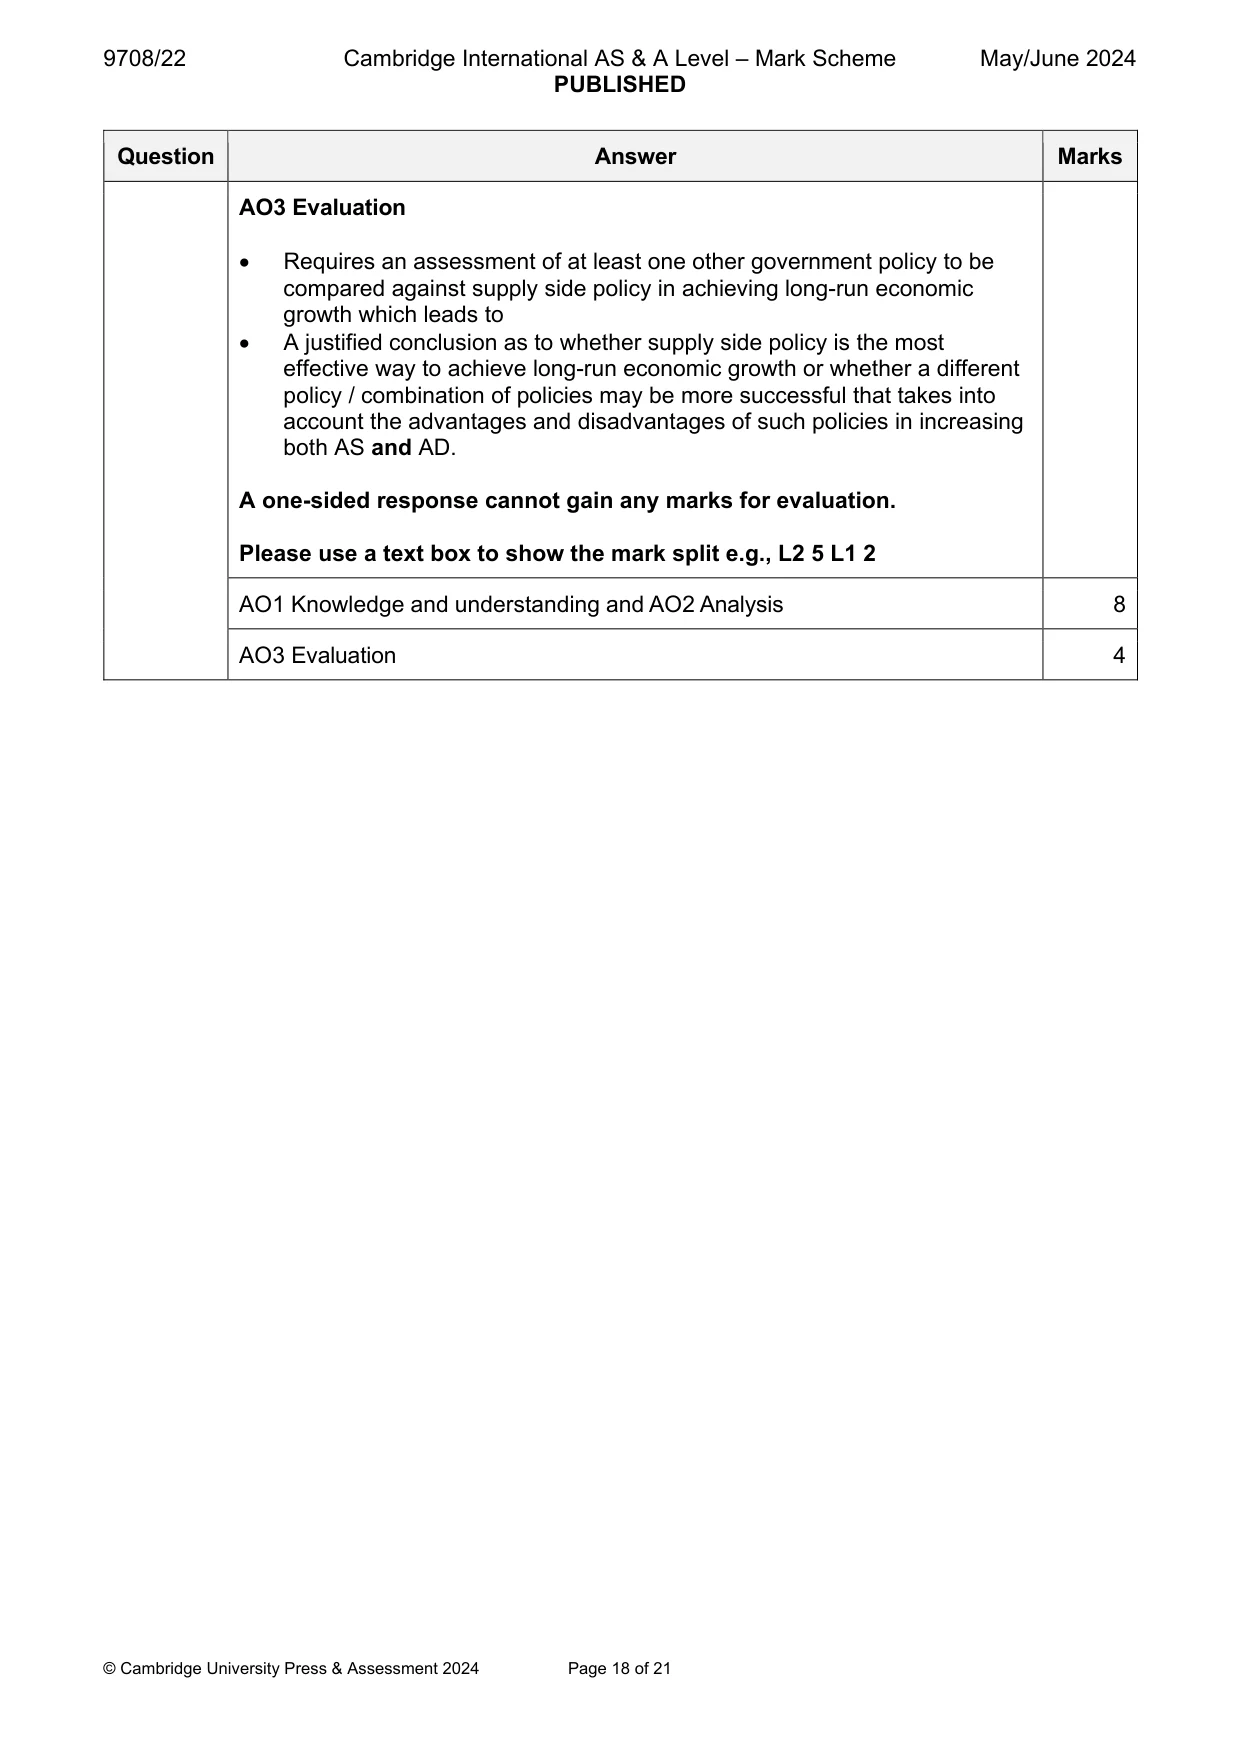
Mark scheme: 4(a) With the help of a diagram, explain what is meant by the circular flow of 8 income in an open economy and consider the extent to which it can explain economic growth in such an economy. Follow the point-based marking guidance at the top of this mark scheme and award: up to 3 marks for AO1 Knowledge and understanding up to 3 marks for AO2 Analysis up to 2 marks for AO3 Evaluation. AO1 Knowledge and Understanding (max 3 marks) A simple circular flow diagram (1) that clearly shows/ explains separately that expenditure flows from households to firms (1) and that income flows from firms to households (1) Note:, this is all that is required for the knowledge and understanding marks regardless of the complexity of the diagram. AO2 Analysis (max 3 marks) The first two marks are for an analysis of injections greater than withdrawals and how this leads to economic growth/increase in national income and (1) for an analysis of withdrawals greater than injections and how this leads to a fall in economic growth/national income (1). Reference must be made in some way to the fact that in open economy injections include income from exports and that leakages includes expenditure on imports along with at least one other example of an injection and one other example of a leakage for the (1). AO3 Evaluation (max 2 marks) Evaluation should explain how the relative sizes of injections and leakages will lead either to economic growth or a fall in economic growth with 1 mark reserved for a justified conclusion. Please use a text box to show the mark split e.g., 2,2,1 AO1 Knowledge and understanding 3 AO2 Analysis 3 AO3 Evaluation 2 4(b) Assess whether supply-side policy is the most effective way to achieve 12 long-run economic growth. Use Table A: AO1 Knowledge and understanding and AO2 Analysis and Table B: AO3 Evaluation to mark candidate responses to this question. AO1 and AO2 out of 8 marks. AO3 out of 4 marks. Indicative content Responses may include: AO1 Knowledge and understanding and AO2 Analysis Long-run economic growth is likely to need both growth of AD and AS Analysis of the role of supply side policy in achieving long-run economic growth and its advantages and disadvantages. E.g., supply side policy such as training and education is more likely to increase AS, but this can also lead to an increase in AD, for example as better training leads to an increase in income and therefore an increase in consumer spending. It is also less likely to result in inflation. However, it is costly and will take time. Analysis of the extent to which supply side policy can lead to growth in both AD and AS. For an explanation that a problem with supply side policy is that it is less effective in directly increasing the level of AD. Analysis of at least one alternative policy e.g., fiscal policy or monetary policy and how they may achieve long-run economic growth, together with their advantages and disadvantages e.g., fiscal policy such as a reduction in income tax is more likely to increase AD and can be relatively quick. It may also indirectly lead to an increase in AS if more people are encouraged to enter the workforce. However, if AS does not increase, it may be inflationary. It may also reduce the amount available for government spending. Analysis of the extent to which these policies can lead to growth in both AD and AS. For an explanation that a problem with such policies is that they are less effective in directly increasing the level of AS. Level 1 responses will be assertive and lacking in explanations / mainly descriptive and/or or mainly lacking in relevance to the question. Level 2 responses may contain some inaccuracies and will be one sided. Analysis will be explained at least in part and will be largely relevant to the question. Level 3 responses will consider alternative policies / concepts etc. and will be balanced. Explanations of points raised will be offered and will be accurate and relevant to the question. AO3 Evaluation Requires an assessment of at least one other government policy to be compared against supply side policy in achieving long-run economic growth which leads to A justified conclusion as to whether supply side policy is the most effective way to achieve long-run economic growth or whether a different policy / combination of policies may be more successful that takes into account the advantages and disadvantages of such policies in increasing both AS and AD. A one-sided response cannot gain any marks for evaluation. Please use a text box to show the mark split e.g., L2 5 L1 2 AO1 Knowledge and understanding and AO2 Analysis 8 AO3 Evaluation 4
Q5 · Explain what is meant by protectionism and consider the effectiveness of using tariffs as…
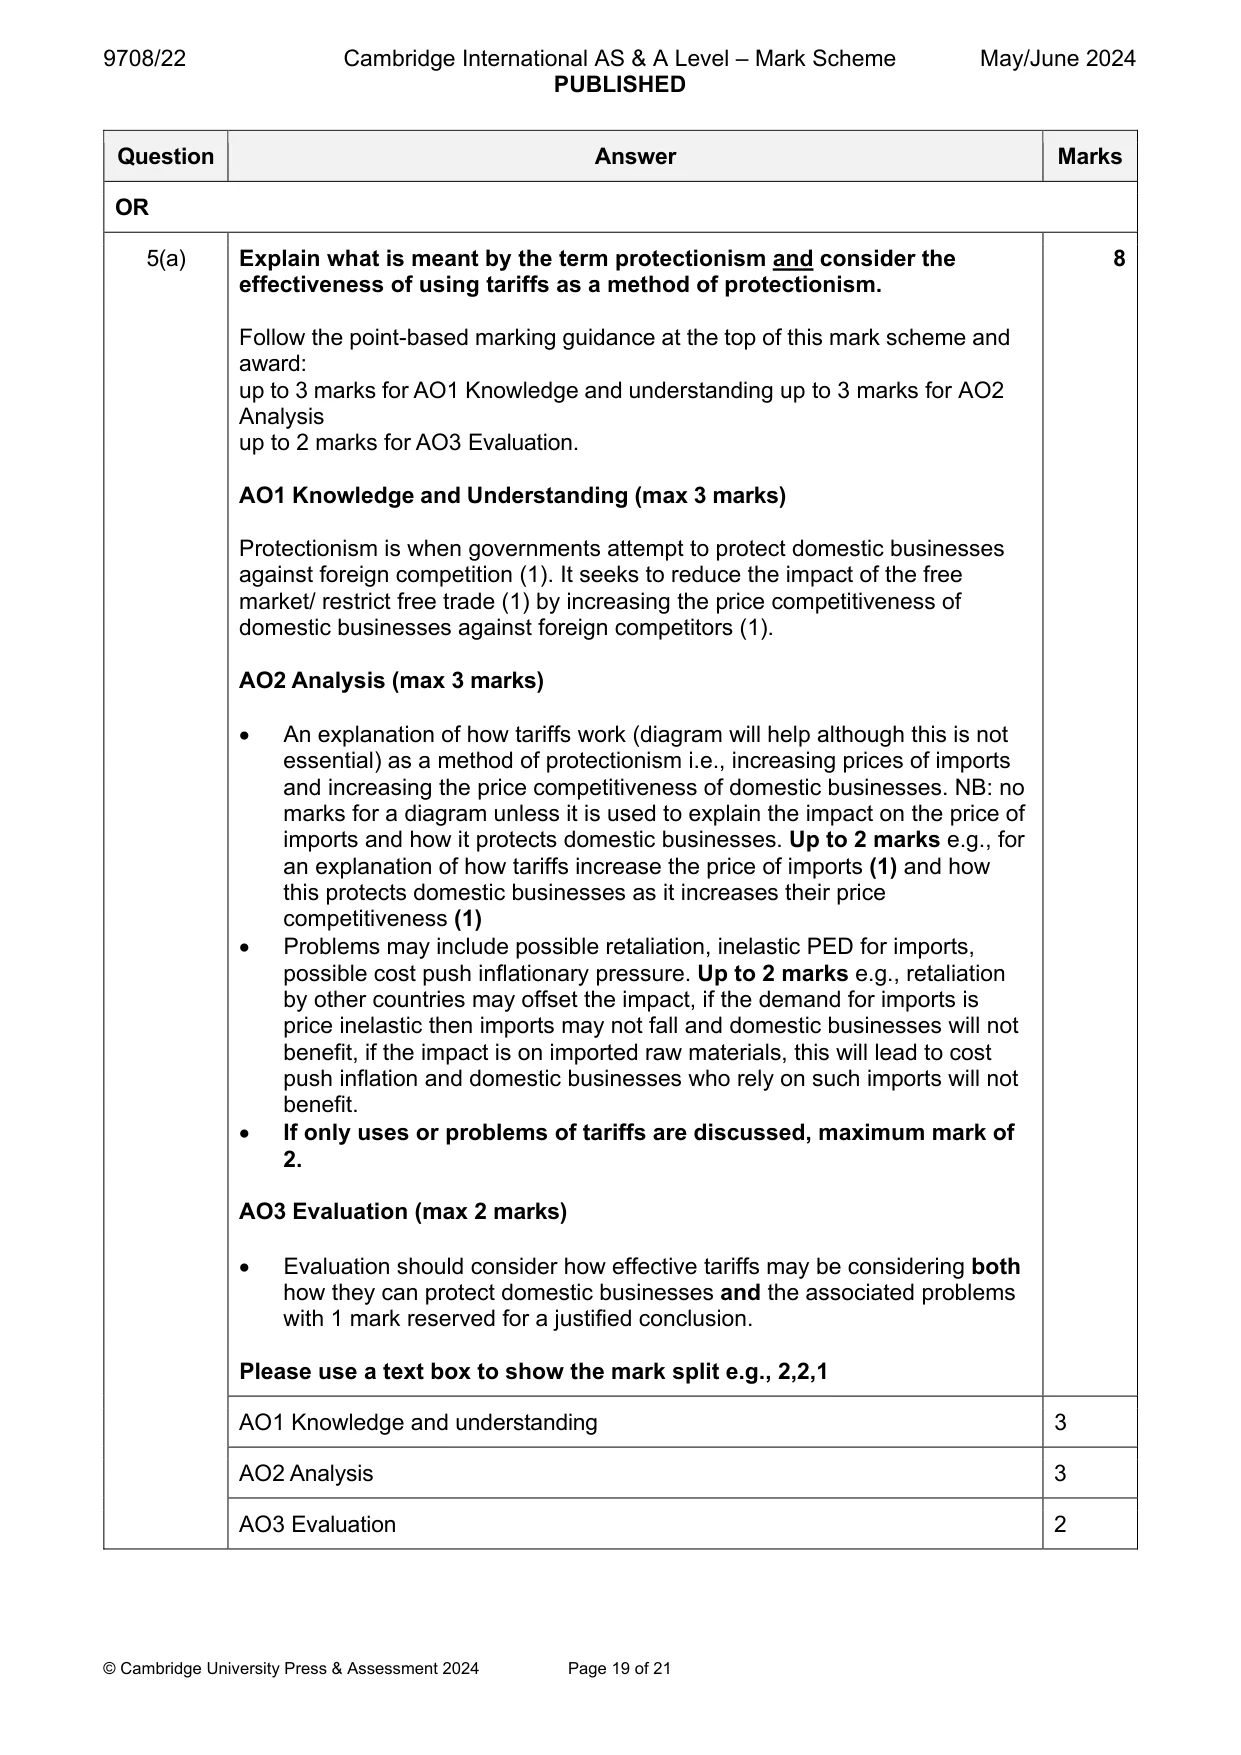
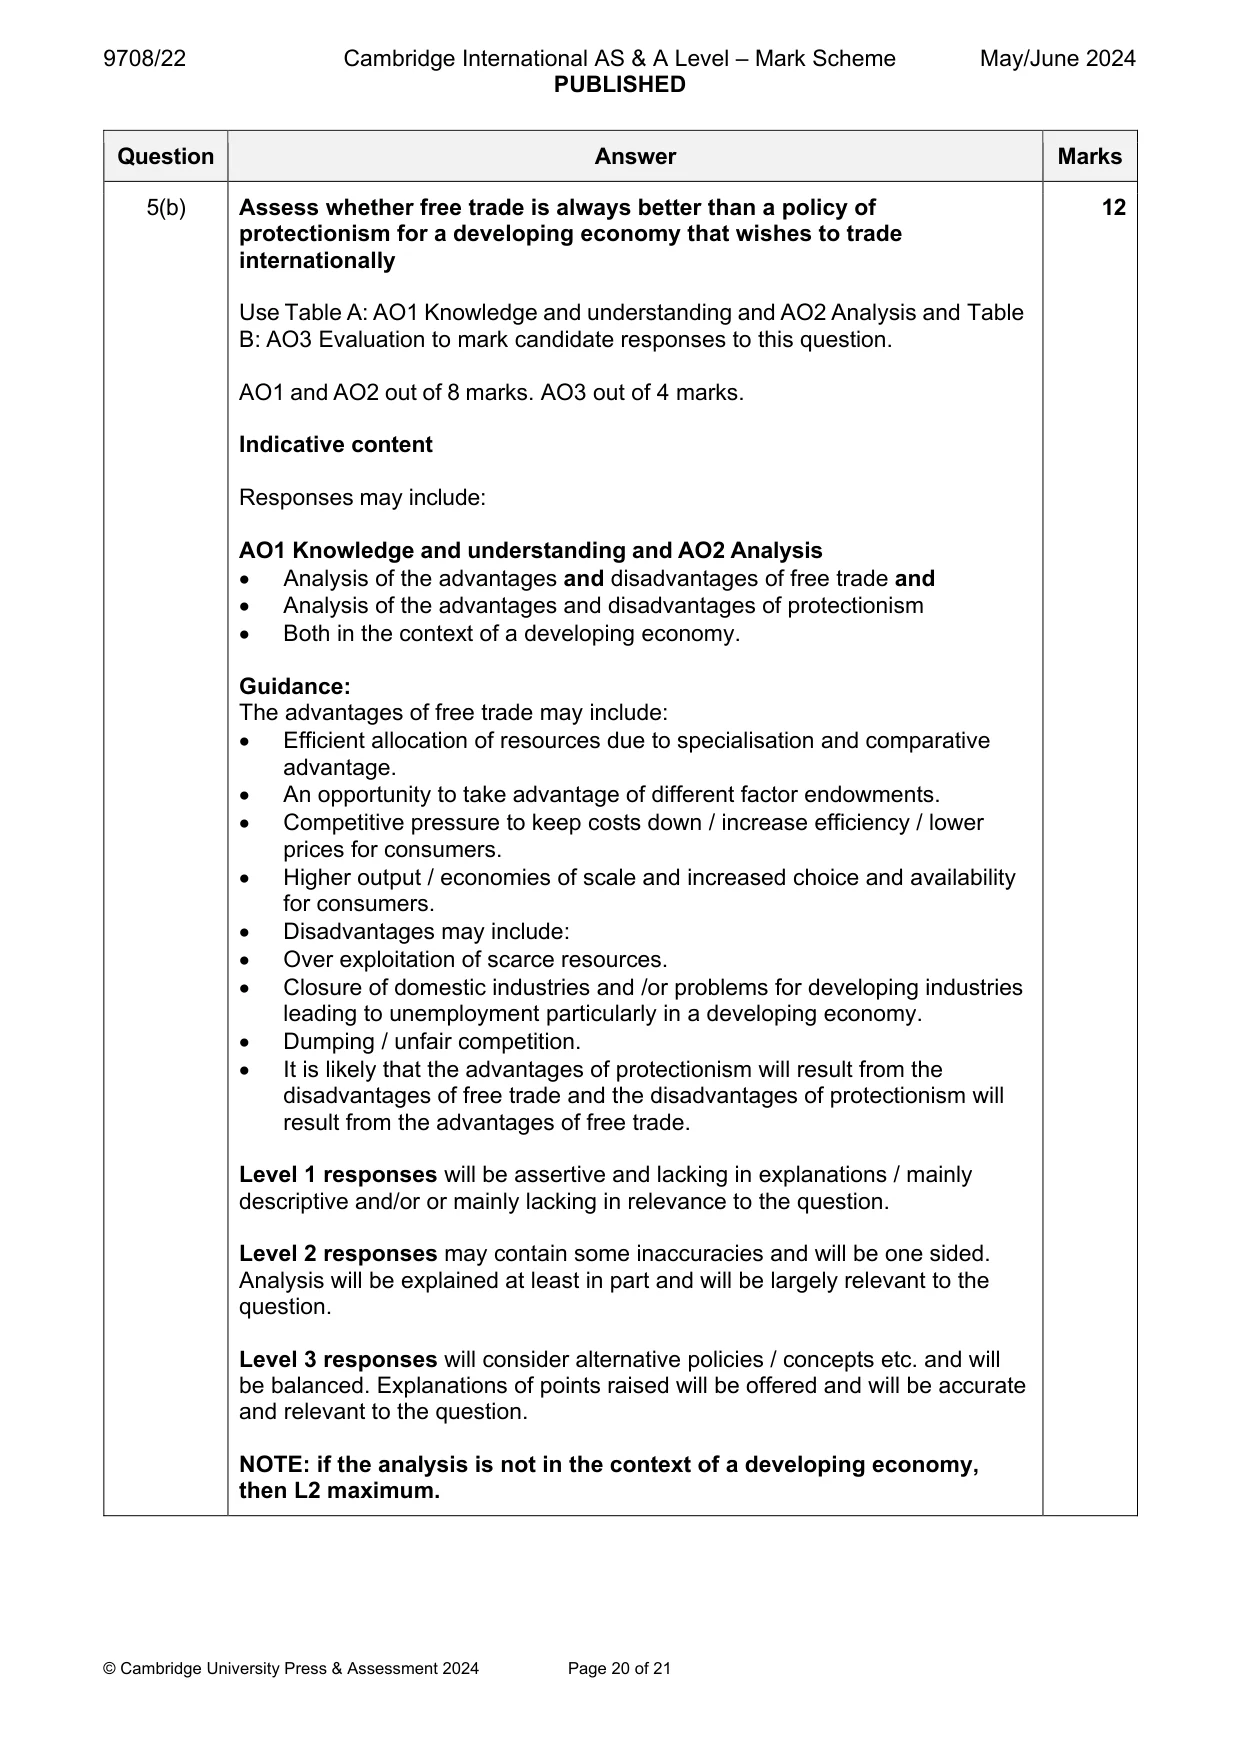
5 (a) Explain what is meant by protectionism and consider the effectiveness of using tariffs as a method of protectionism. [8] (b) Assess whether free trade is always better than a policy of protectionism for a developing economy that wishes to trade internationally. [12]
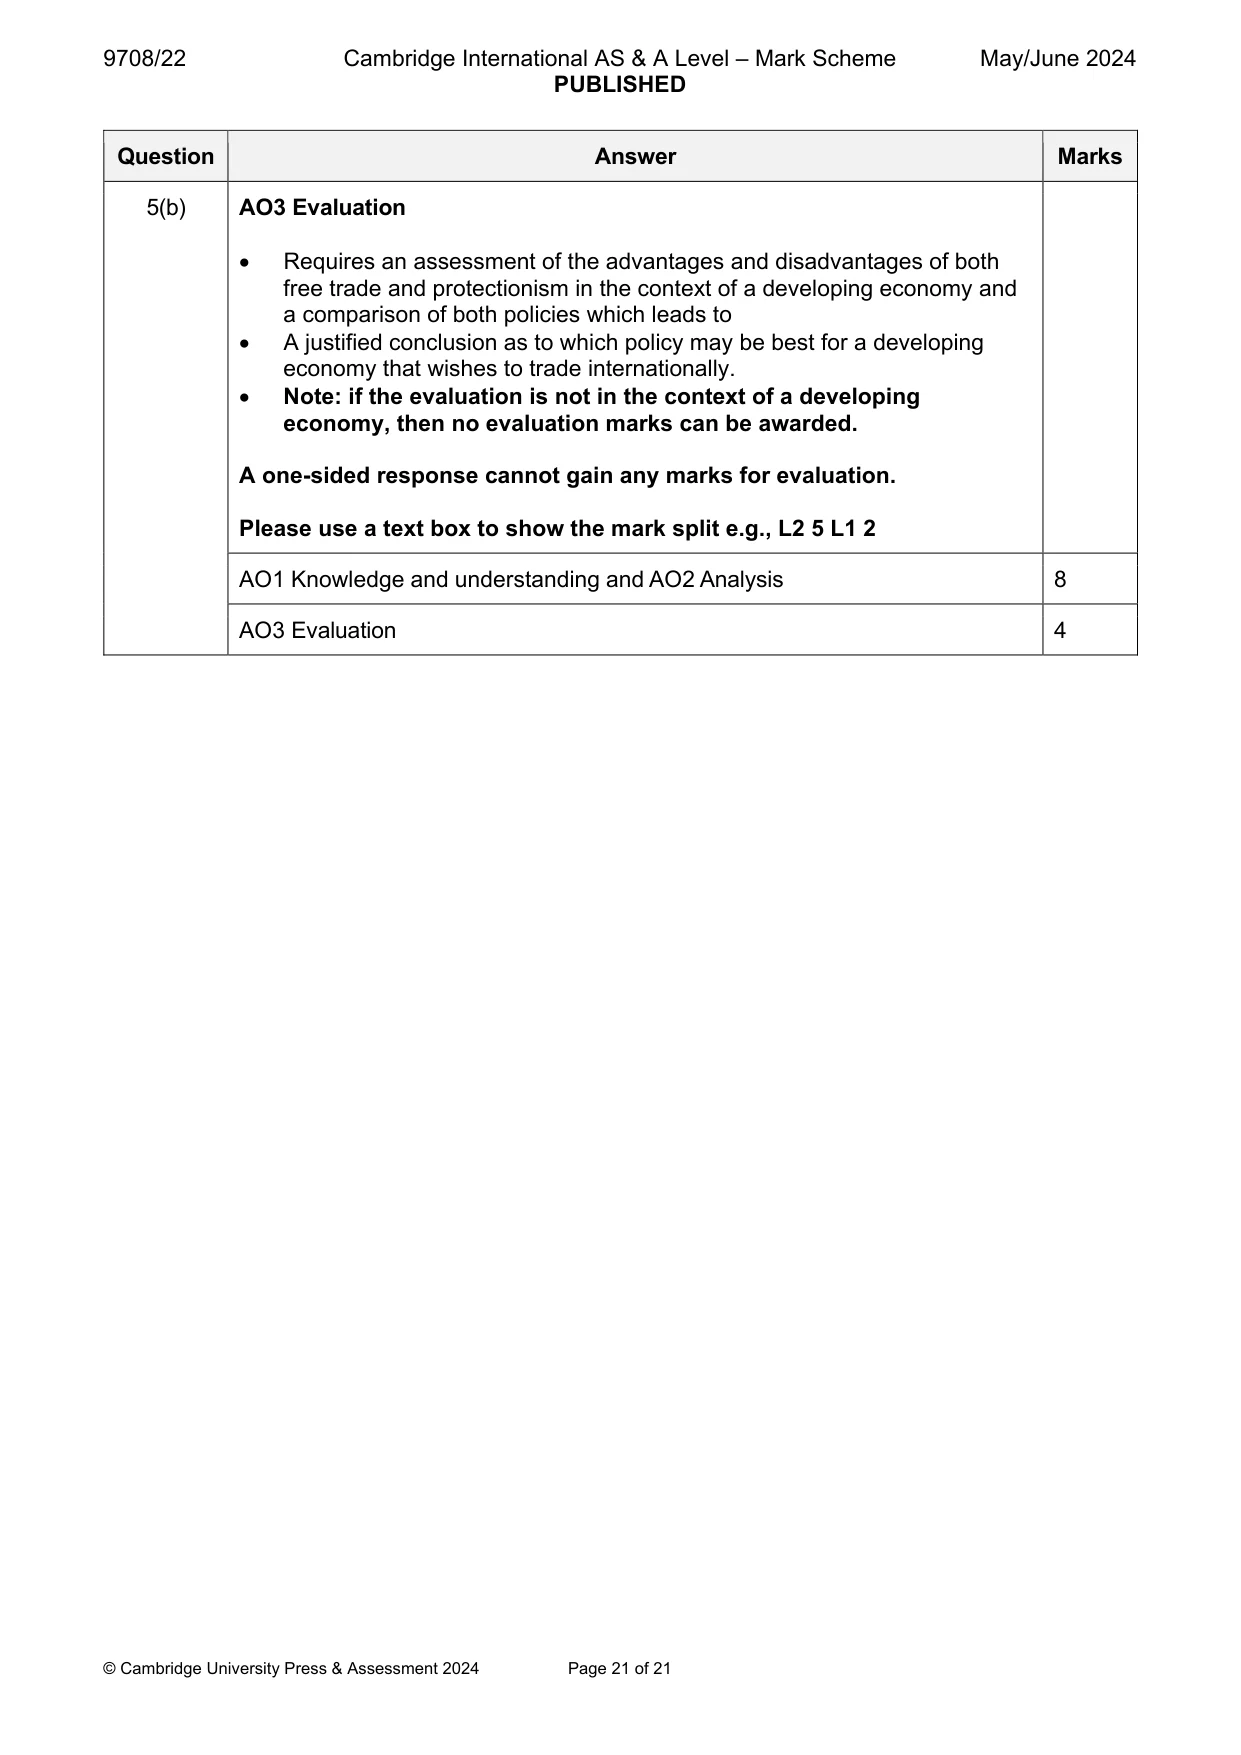
Mark scheme: 5(a) Explain what is meant by the term protectionism and consider the 8 effectiveness of using tariffs as a method of protectionism. Follow the point-based marking guidance at the top of this mark scheme and award: up to 3 marks for AO1 Knowledge and understanding up to 3 marks for AO2 Analysis up to 2 marks for AO3 Evaluation. AO1 Knowledge and Understanding (max 3 marks) Protectionism is when governments attempt to protect domestic businesses against foreign competition (1). It seeks to reduce the impact of the free market/ restrict free trade (1) by increasing the price competitiveness of domestic businesses against foreign competitors (1). AO2 Analysis (max 3 marks) An explanation of how tariffs work (diagram will help although this is not essential) as a method of protectionism i.e., increasing prices of imports and increasing the price competitiveness of domestic businesses. NB: no marks for a diagram unless it is used to explain the impact on the price of imports and how it protects domestic businesses. Up to 2 marks e.g., for an explanation of how tariffs increase the price of imports (1) and how this protects domestic businesses as it increases their price competitiveness (1) Problems may include possible retaliation, inelastic PED for imports, possible cost push inflationary pressure. Up to 2 marks e.g., retaliation by other countries may offset the impact, if the demand for imports is price inelastic then imports may not fall and domestic businesses will not benefit, if the impact is on imported raw materials, this will lead to cost push inflation and domestic businesses who rely on such imports will not benefit. If only uses or problems of tariffs are discussed, maximum mark of 2. AO3 Evaluation (max 2 marks) Evaluation should consider how effective tariffs may be considering both how they can protect domestic businesses and the associated problems with 1 mark reserved for a justified conclusion. Please use a text box to show the mark split e.g., 2,2,1 AO1 Knowledge and understanding 3 AO2 Analysis 3 AO3 Evaluation 2 5(b) Assess whether free trade is always better than a policy of 12 protectionism for a developing economy that wishes to trade internationally Use Table A: AO1 Knowledge and understanding and AO2 Analysis and Table B: AO3 Evaluation to mark candidate responses to this question. AO1 and AO2 out of 8 marks. AO3 out of 4 marks. Indicative content Responses may include: AO1 Knowledge and understanding and AO2 Analysis Analysis of the advantages and disadvantages of free trade and Analysis of the advantages and disadvantages of protectionism Both in the context of a developing economy. Guidance: The advantages of free trade may include: Efficient allocation of resources due to specialisation and comparative advantage. An opportunity to take advantage of different factor endowments. Competitive pressure to keep costs down / increase efficiency / lower prices for consumers. Higher output / economies of scale and increased choice and availability for consumers. Disadvantages may include: Over exploitation of scarce resources. Closure of domestic industries and /or problems for developing industries leading to unemployment particularly in a developing economy. Dumping / unfair competition. It is likely that the advantages of protectionism will result from the disadvantages of free trade and the disadvantages of protectionism will result from the advantages of free trade. Level 1 responses will be assertive and lacking in explanations / mainly descriptive and/or or mainly lacking in relevance to the question. Level 2 responses may contain some inaccuracies and will be one sided. Analysis will be explained at least in part and will be largely relevant to the question. Level 3 responses will consider alternative policies / concepts etc. and will be balanced. Explanations of points raised will be offered and will be accurate and relevant to the question. NOTE: if the analysis is not in the context of a developing economy, then L2 maximum. 5(b) AO3 Evaluation Requires an assessment of the advantages and disadvantages of both free trade and protectionism in the context of a developing economy and a comparison of both policies which leads to A justified conclusion as to which policy may be best for a developing economy that wishes to trade internationally. Note: if the evaluation is not in the context of a developing economy, then no evaluation marks can be awarded. A one-sided response cannot gain any marks for evaluation. Please use a text box to show the mark split e.g., L2 5 L1 2 AO1 Knowledge and understanding and AO2 Analysis 8 AO3 Evaluation 4
What was in this paper
The subtopics covered by these 5 questions, and how many questions each got. Open one in a new tab to see every Cambridge question on it.
What you needed in this session
Cambridge’s own grade thresholds for 2024 May/June, Paper 2 · Variant 2. A higher threshold means an easier paper — the bar moves with how the cohort did.