Cambridge A Level Economics 9708 — 2025 Feb/March Paper 2 · Variant 2
9708/22/F/M/25 · 5 questions · 60 marks · ≈68 min
The question paper and its mark scheme, free to read here and free to download. This is Cambridge’s own paper, exactly as it was sat.
Question paper4 pages
Mark scheme19 pages
Answers below. Sit the paper first if you are practising.
Questions as text
Q1 · A global olive oil shortage Almost every kitchen in the United States (US) will pay the…
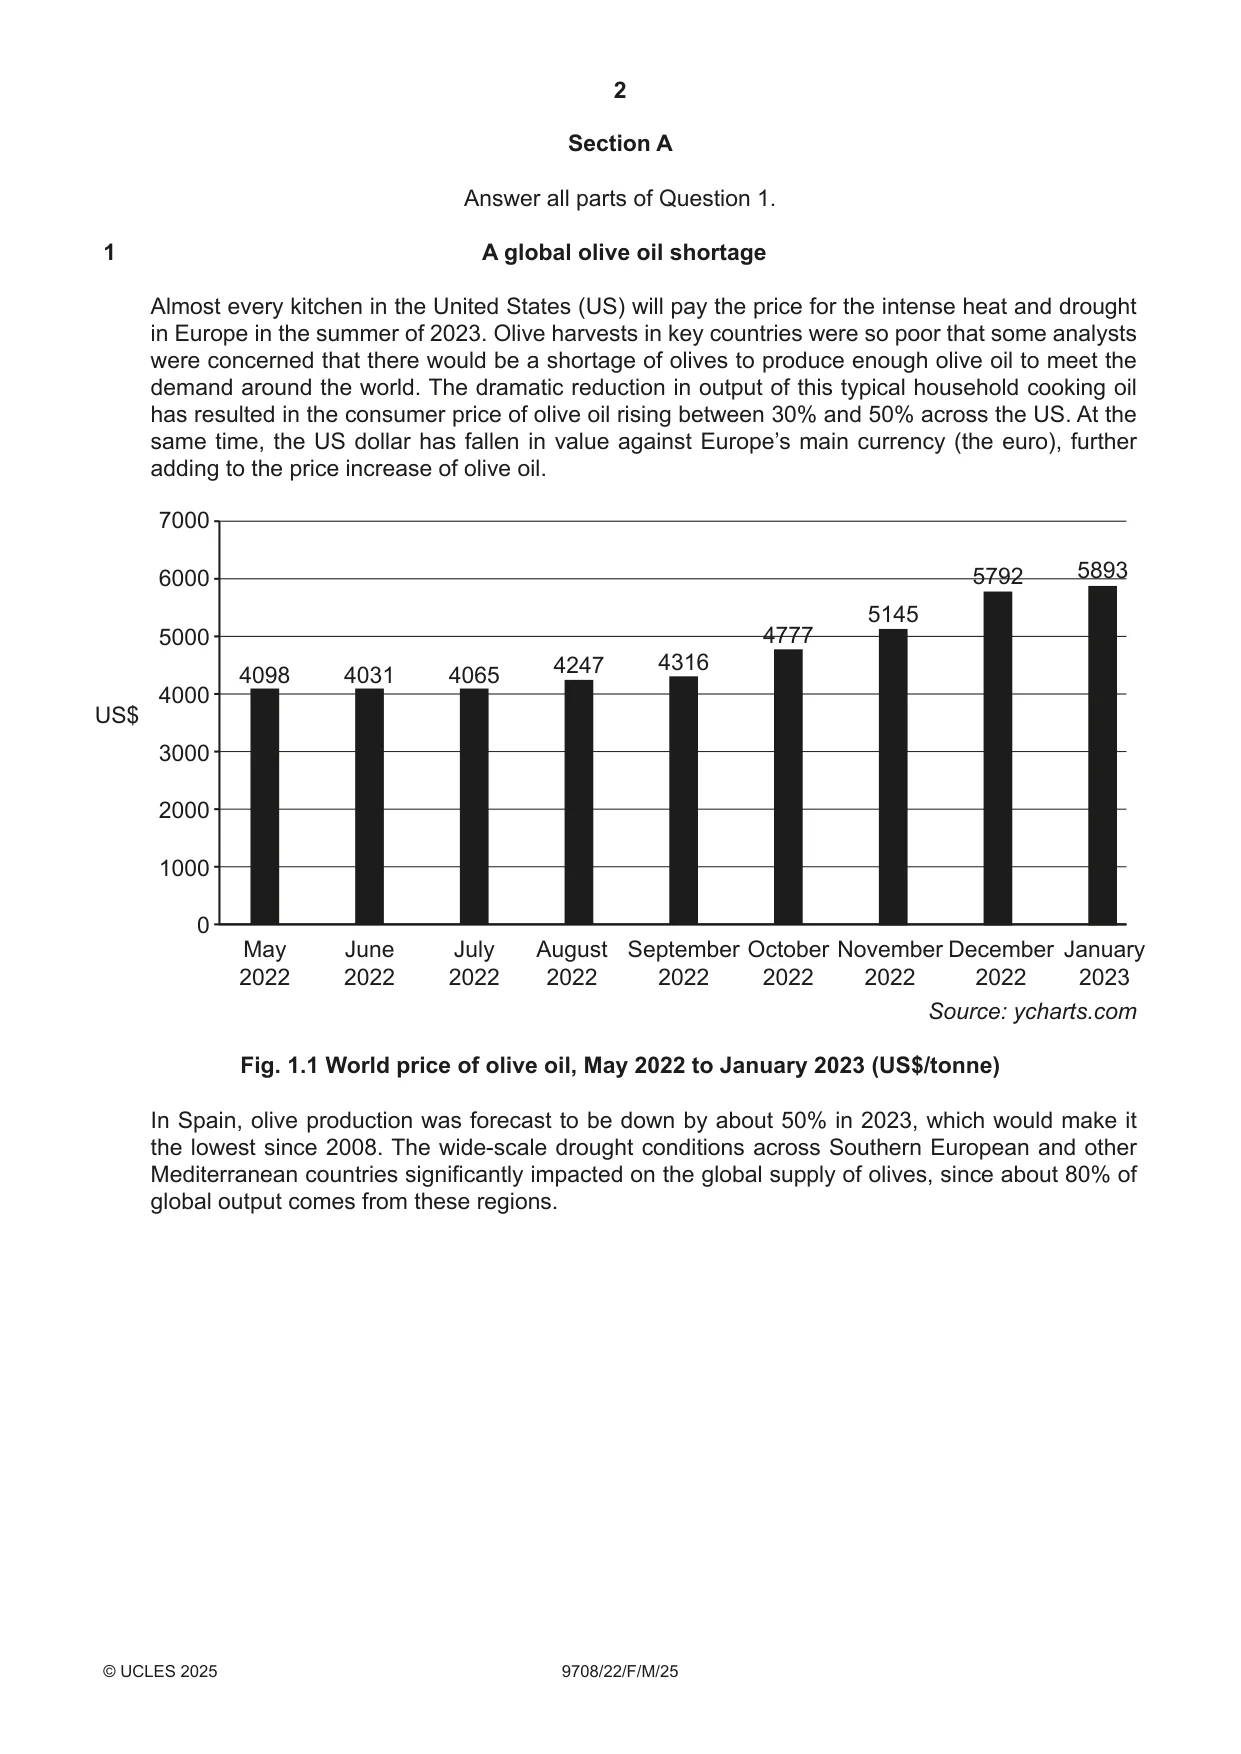
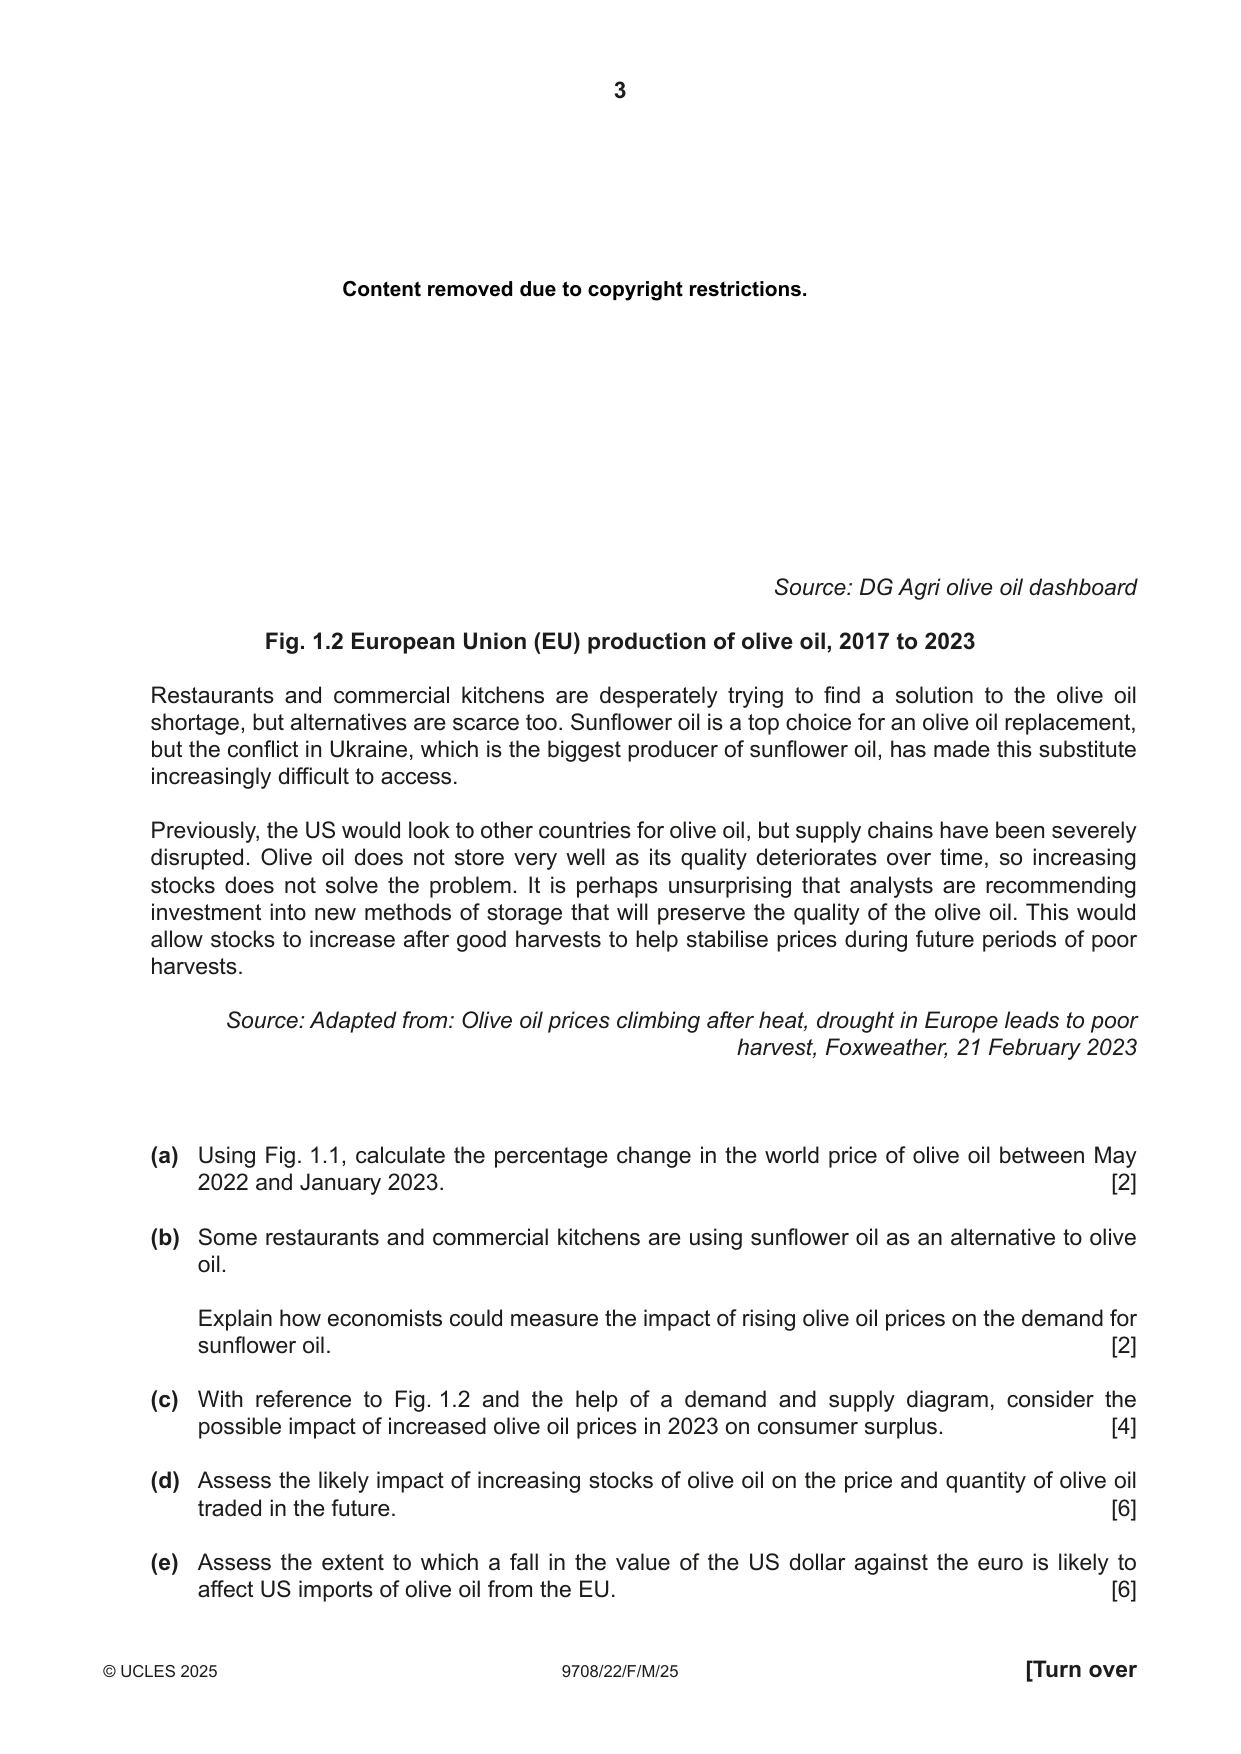
1 A global olive oil shortage Almost every kitchen in the United States (US) will pay the price for the intense heat and drought in Europe in the summer of 2023. Olive harvests in key countries were so poor that some analysts were concerned that there would be a shortage of olives to produce enough olive oil to meet the demand around the world. The dramatic reduction in output of this typical household cooking oil has resulted in the consumer price of olive oil rising between 30% and 50% across the US. At the same time, the US dollar has fallen in value against Europe’s main currency (the euro), further adding to the price increase of olive oil. 7000 5893 6000 5792 5145 5000 4777 4247 4316 4098 4031 4065 4000 US$ 3000 2000 1000 0 May June July August September October November December January 2022 2022 2022 2022 2022 2022 2022 2022 2023 Source: ycharts.com Fig. 1.1 World price of olive oil, May 2022 to January 2023 (US$/tonne) In Spain, olive production was forecast to be down by about 50% in 2023, which would make it the lowest since 2008. The wide-scale drought conditions across Southern European and other Mediterranean countries significantly impacted on the global supply of olives, since about 80% of global output comes from these regions. Content removed due to copyright restrictions. Source: DG Agri olive oil dashboard Fig. 1.2 European Union (EU) production of olive oil, 2017 to 2023 Restaurants and commercial kitchens are desperately trying to find a solution to the olive oil shortage, but alternatives are scarce too. Sunflower oil is a top choice for an olive oil replacement, but the conflict in Ukraine, which is the biggest producer of sunflower oil, has made this substitute increasingly difficult to access. Previously, the US would look to other countries for olive oil, but supply chains have been severely disrupted. Olive oil does not store very well as its quality deteriorates over time, so increasing stocks does not solve the problem. It is perhaps unsurprising that analysts are recommending investment into new methods of storage that will preserve the quality of the olive oil. This would allow stocks to increase after good harvests to help stabilise prices during future periods of poor harvests. Source: Adapted from: Olive oil prices climbing after heat, drought in Europe leads to poor harvest, Foxweather, 21 February 2023 (a) Using Fig. 1.1, calculate the percentage change in the world price of olive oil between May 2022 and January 2023. [2] (b) Some restaurants and commercial kitchens are using sunflower oil as an alternative to olive oil. Explain how economists could measure the impact of rising olive oil prices on the demand for sunflower oil. [2] (c) With reference to Fig. 1.2 and the help of a demand and supply diagram, consider the possible impact of increased olive oil prices in 2023 on consumer surplus. [4] (d) Assess the likely impact of increasing stocks of olive oil on the price and quantity of olive oil traded in the future. [6] (e) Assess the extent to which a fall in the value of the US dollar against the euro is likely to affect US imports of olive oil from the EU. [6]
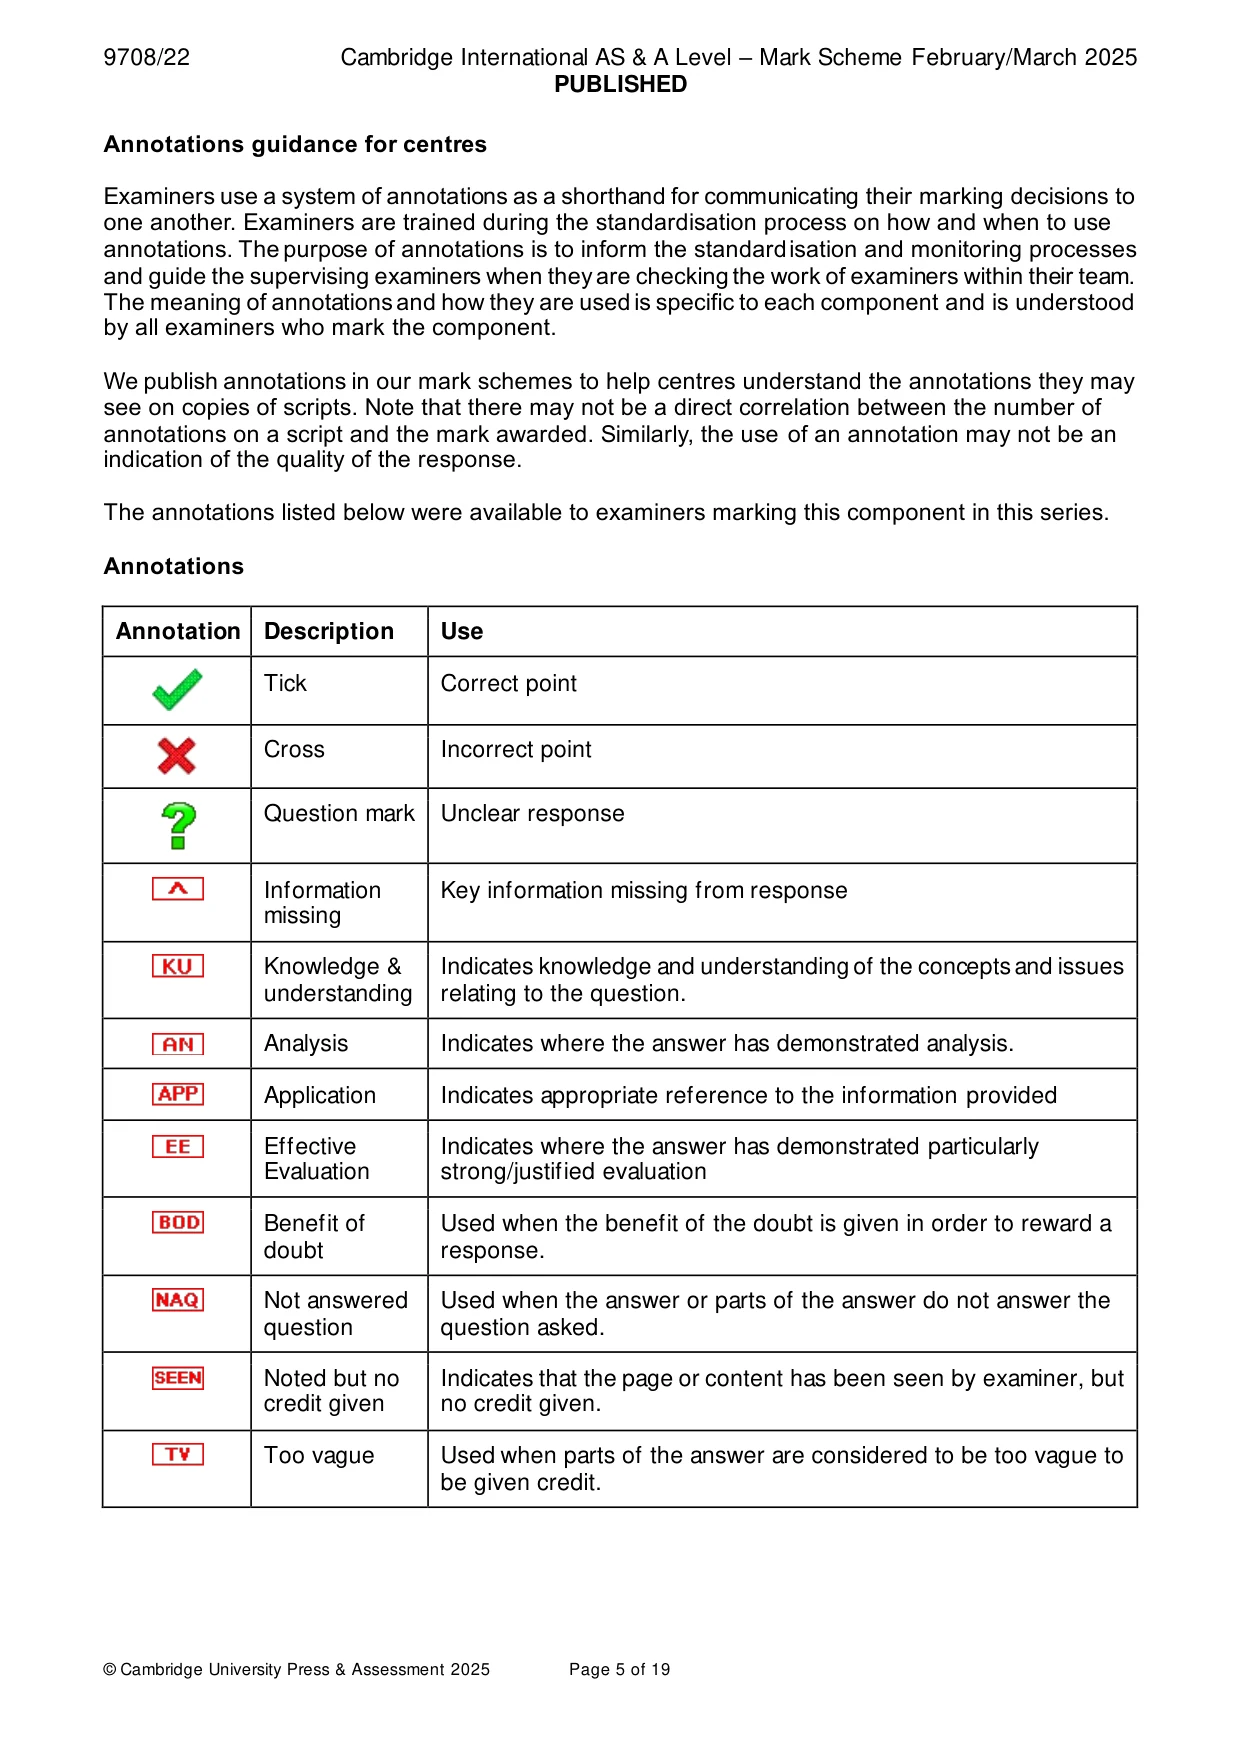
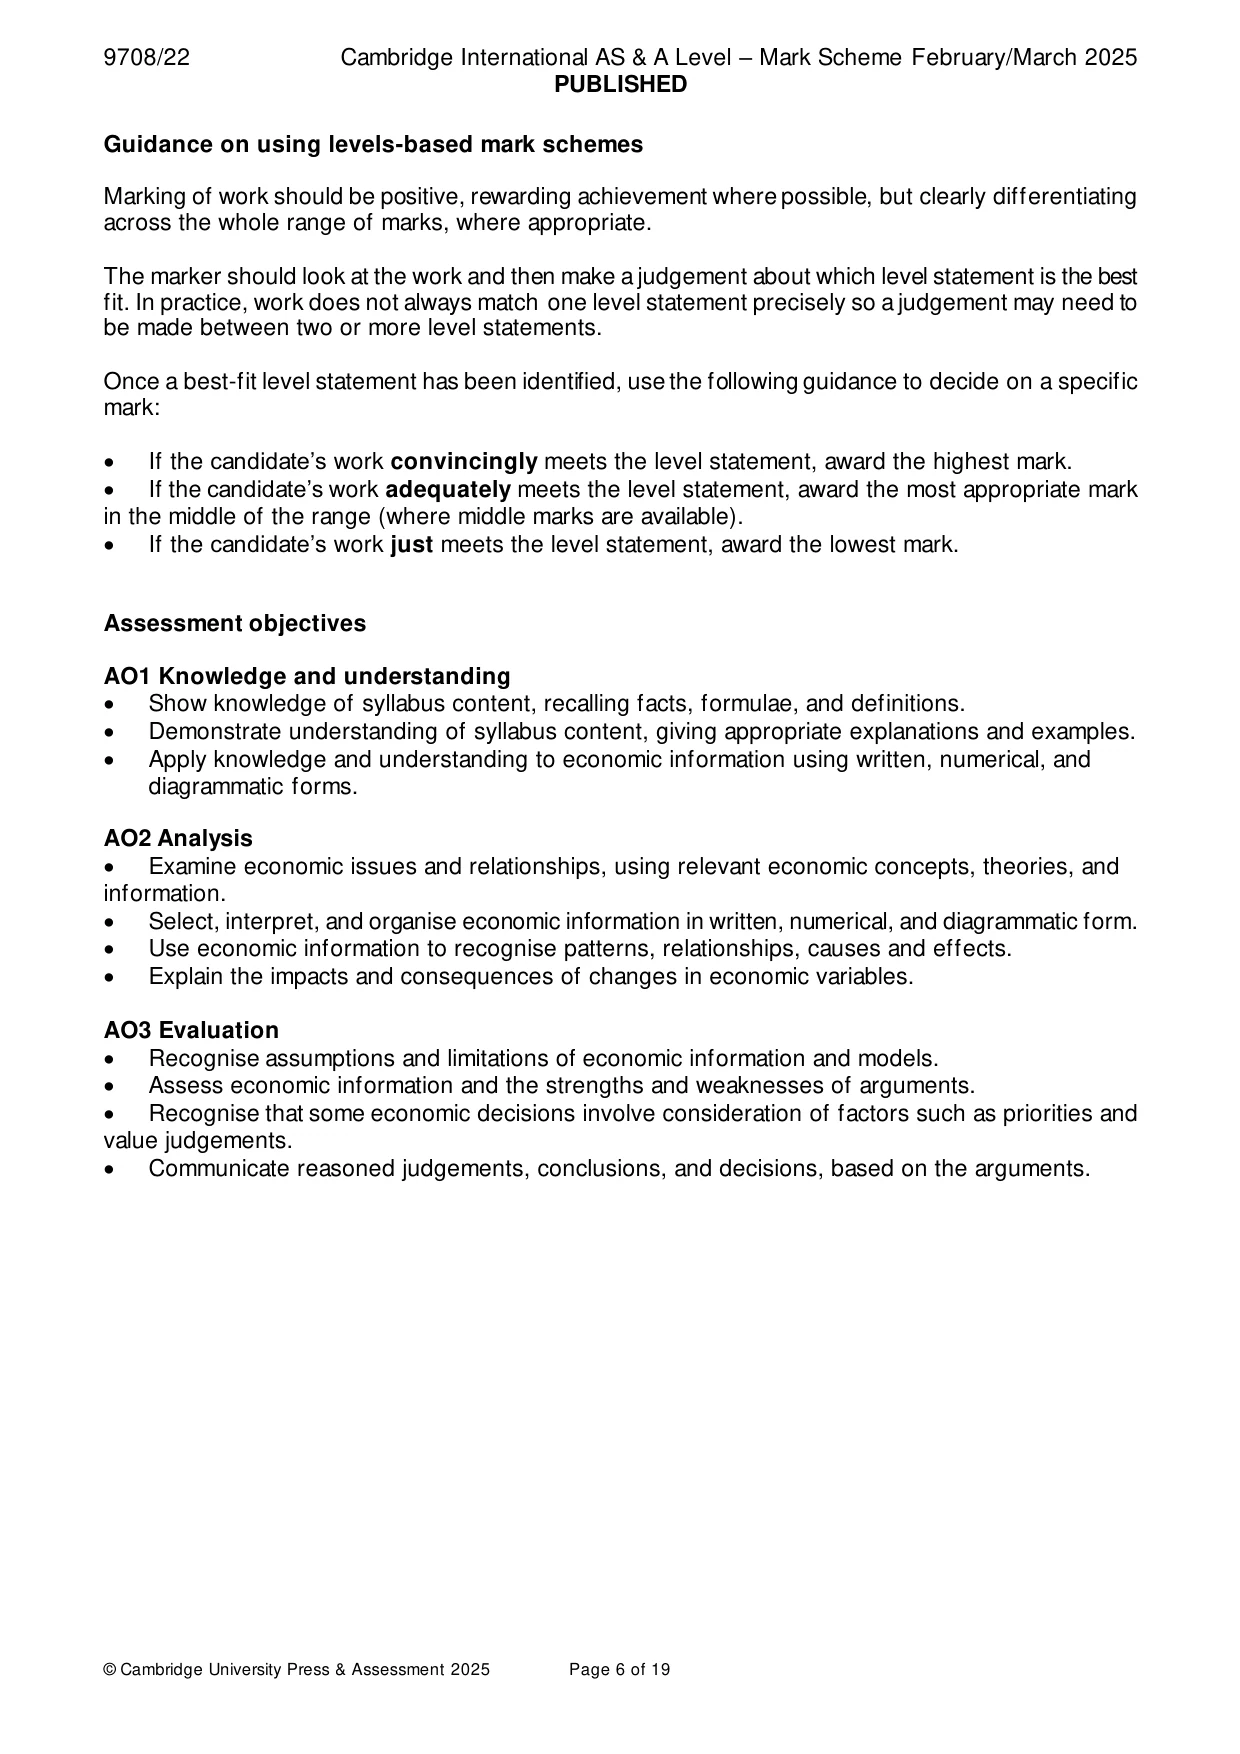
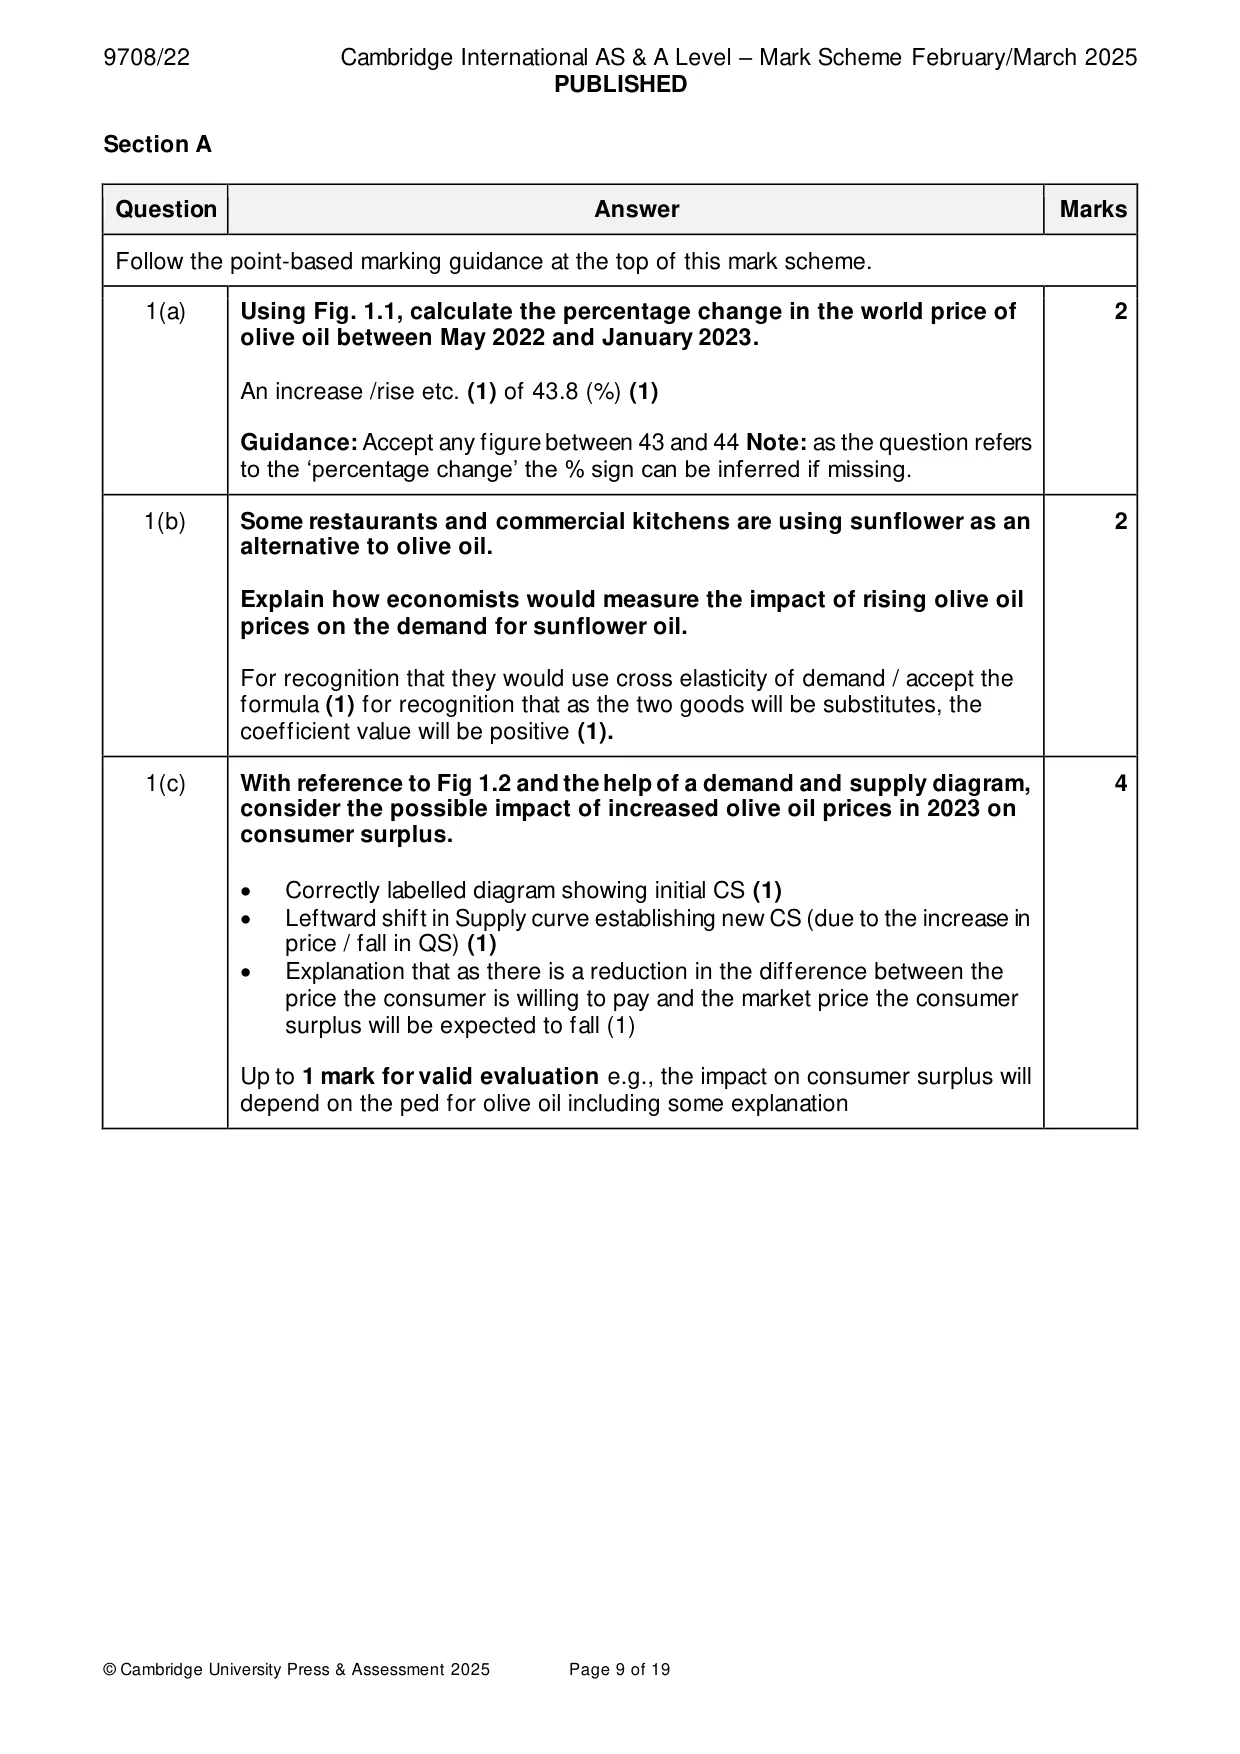
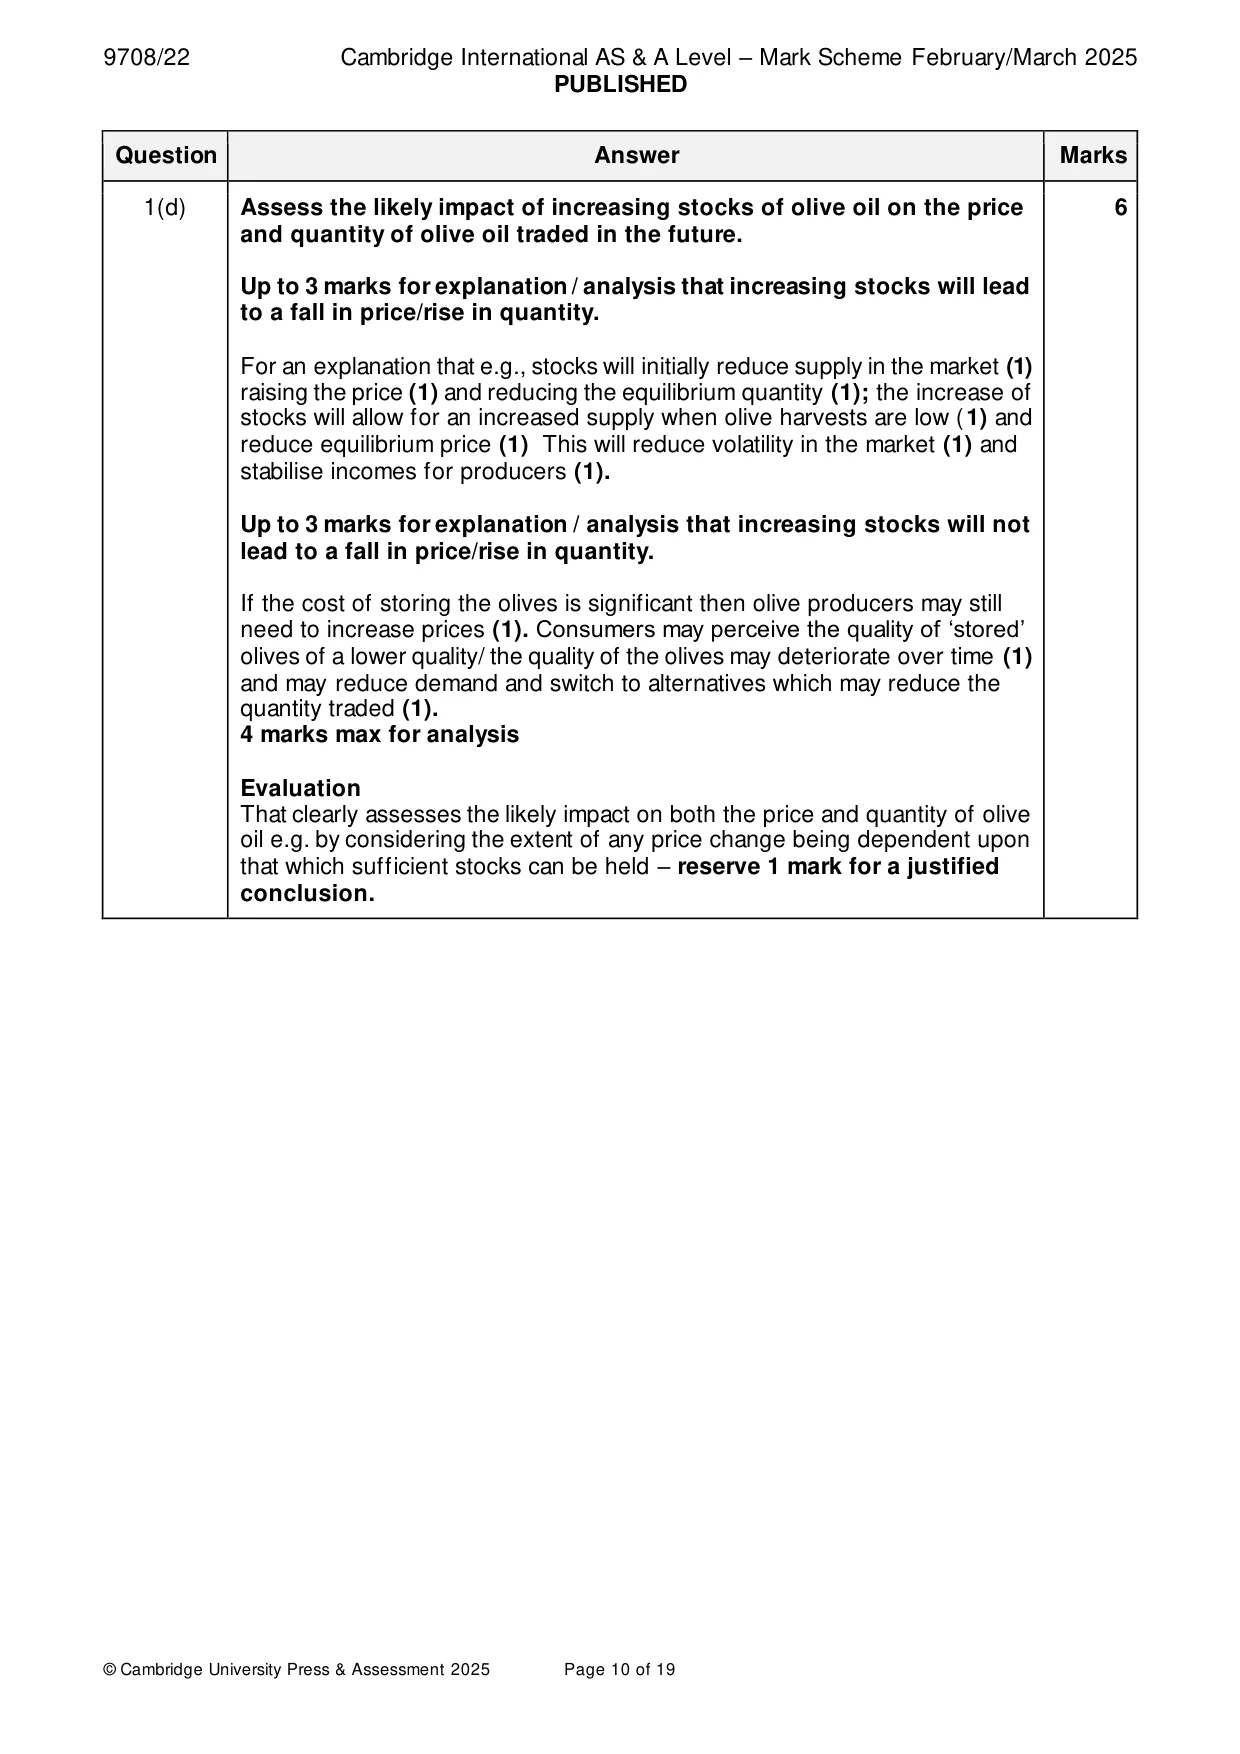
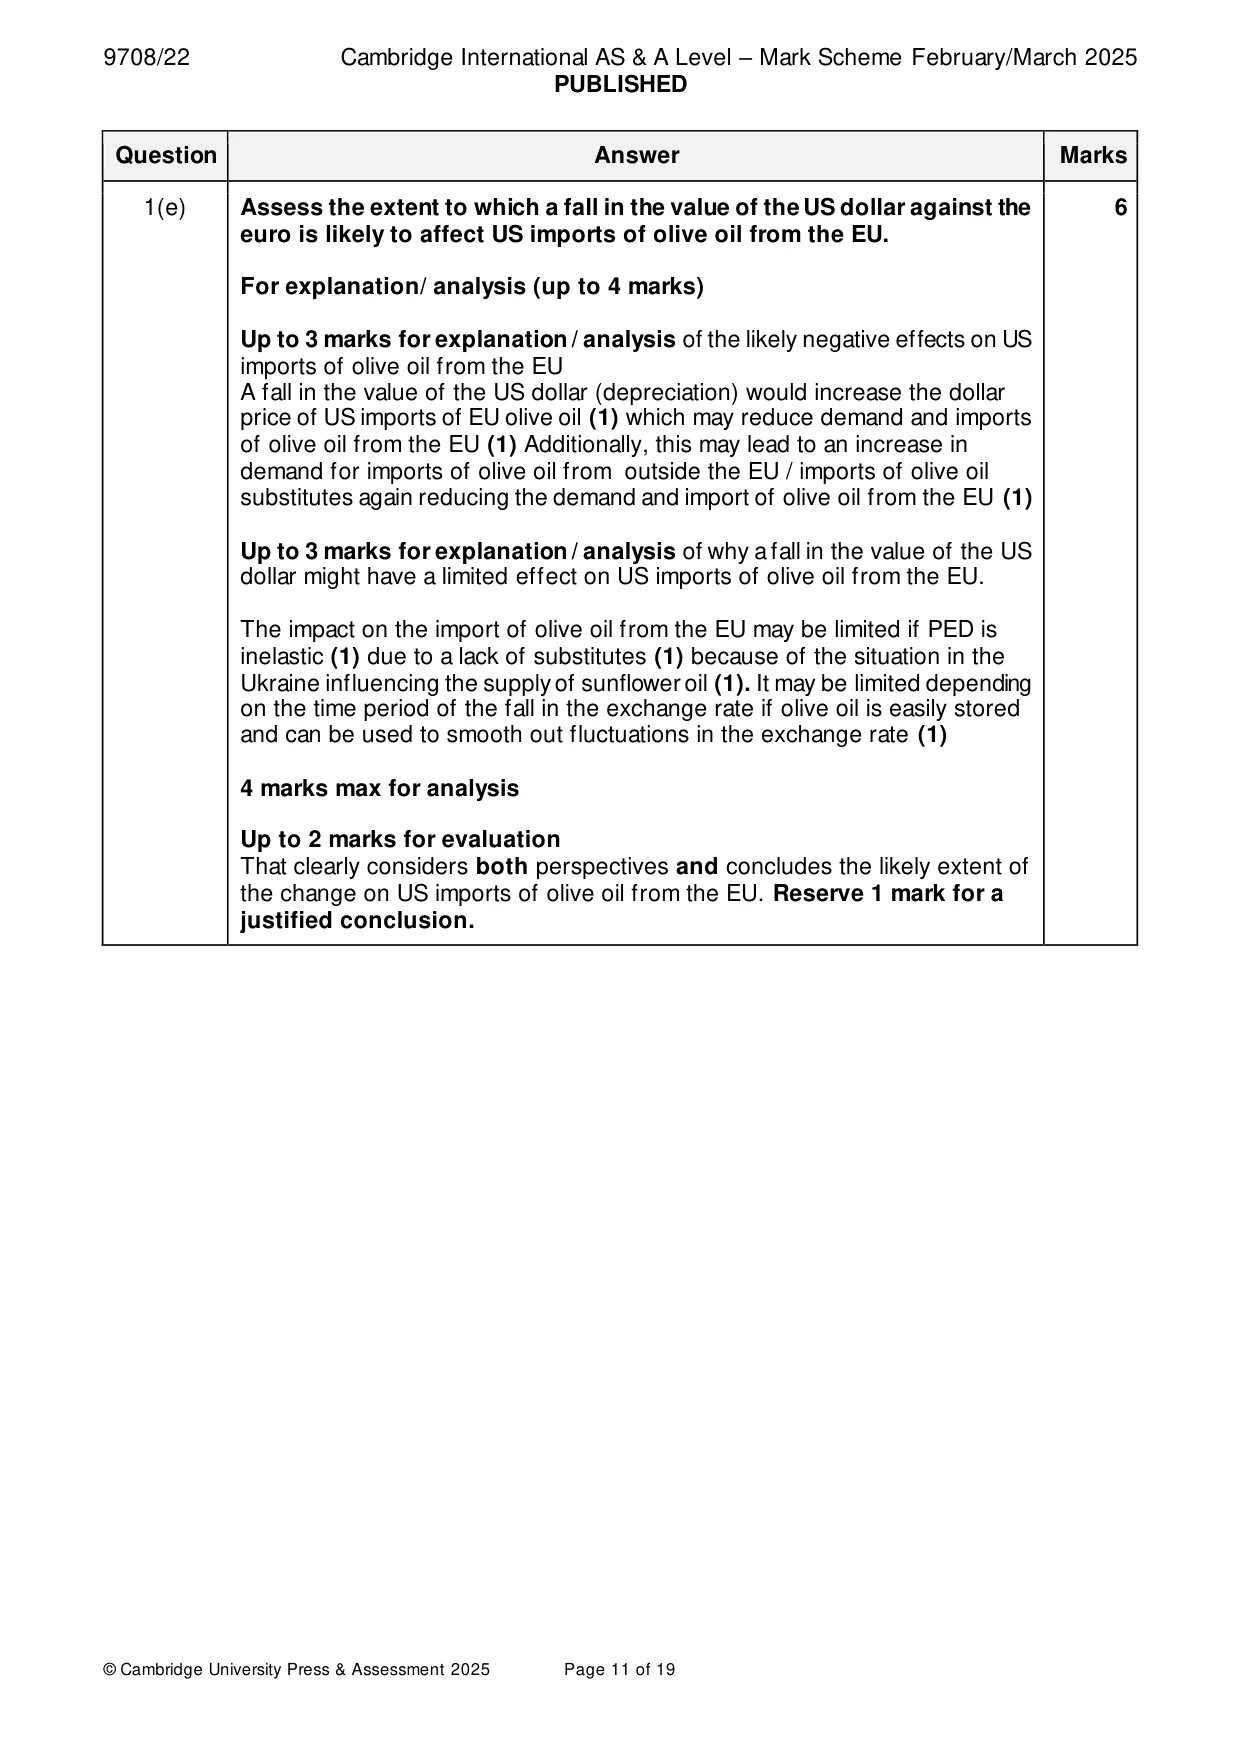
Mark scheme: Question Answer Marks Follow the point-based marking guidance at the top of this mark scheme. 1(a) Using Fig. 1.1, calculate the percentage change in the world price of 2 olive oil between May 2022 and January 2023. An increase /rise etc. (1) of 43.8 (%) (1) Guidance: Accept any figure between 43 and 44 Note: as the question refers to the ‘percentage change’ the % sign can be inferred if missing. 1(b) Some restaurants and commercial kitchens are using sunflower as an 2 alternative to olive oil. Explain how economists would measure the impact of rising olive oil prices on the demand for sunflower oil. For recognition that they would use cross elasticity of demand / accept the formula (1) for recognition that as the two goods will be substitutes, the coefficient value will be positive (1). 1(c) With reference to Fig 1.2 and the help of a demand and supply diagram, 4 consider the possible impact of increased olive oil prices in 2023 on consumer surplus. • Correctly labelled diagram showing initial CS (1) • Leftward shift in Supply curve establishing new CS (due to the increase in price / fall in QS) (1) • Explanation that as there is a reduction in the difference between the price the consumer is willing to pay and the market price the consumer surplus will be expected to fall (1) Up to 1 mark for valid evaluation e.g., the impact on consumer surplus will depend on the ped for olive oil including some explanation 1(d) Assess the likely impact of increasing stocks of olive oil on the price 6 and quantity of olive oil traded in the future. Up to 3 marks for explanation / analysis that increasing stocks will lead to a fall in price/rise in quantity. For an explanation that e.g., stocks will initially reduce supply in the market (1) raising the price (1) and reducing the equilibrium quantity (1); the increase of stocks will allow for an increased supply when olive harvests are low (1) and reduce equilibrium price (1) This will reduce volatility in the market (1) and stabilise incomes for producers (1). Up to 3 marks for explanation / analysis that increasing stocks will not lead to a fall in price/rise in quantity. If the cost of storing the olives is significant then olive producers may still need to increase prices (1). Consumers may perceive the quality of ‘stored’ olives of a lower quality/ the quality of the olives may deteriorate over time (1) and may reduce demand and switch to alternatives which may reduce the quantity traded (1). 4 marks max for analysis Evaluation That clearly assesses the likely impact on both the price and quantity of olive oil e.g. by considering the extent of any price change being dependent upon that which sufficient stocks can be held – reserve 1 mark for a justified conclusion. 1(e) Assess the extent to which a fall in the value of the US dollar against the 6 euro is likely to affect US imports of olive oil from the EU. For explanation/ analysis (up to 4 marks) Up to 3 marks for explanation / analysis of the likely negative effects on US imports of olive oil from the EU A fall in the value of the US dollar (depreciation) would increase the dollar price of US imports of EU olive oil (1) which may reduce demand and imports of olive oil from the EU (1) Additionally, this may lead to an increase in demand for imports of olive oil from outside the EU / imports of olive oil substitutes again reducing the demand and import of olive oil from the EU (1) Up to 3 marks for explanation / analysis of why a fall in the value of the US dollar might have a limited effect on US imports of olive oil from the EU. The impact on the import of olive oil from the EU may be limited if PED is inelastic (1) due to a lack of substitutes (1) because of the situation in the Ukraine influencing the supply of sunflower oil (1). It may be limited depending on the time period of the fall in the exchange rate if olive oil is easily stored and can be used to smooth out fluctuations in the exchange rate (1) 4 marks max for analysis Up to 2 marks for evaluation That clearly considers both perspectives and concludes the likely extent of the change on US imports of olive oil from the EU. Reserve 1 mark for a justified conclusion. Section B
Q2 · With the help of a production possibility curve (PPC) diagram, explain the terms scarcity…
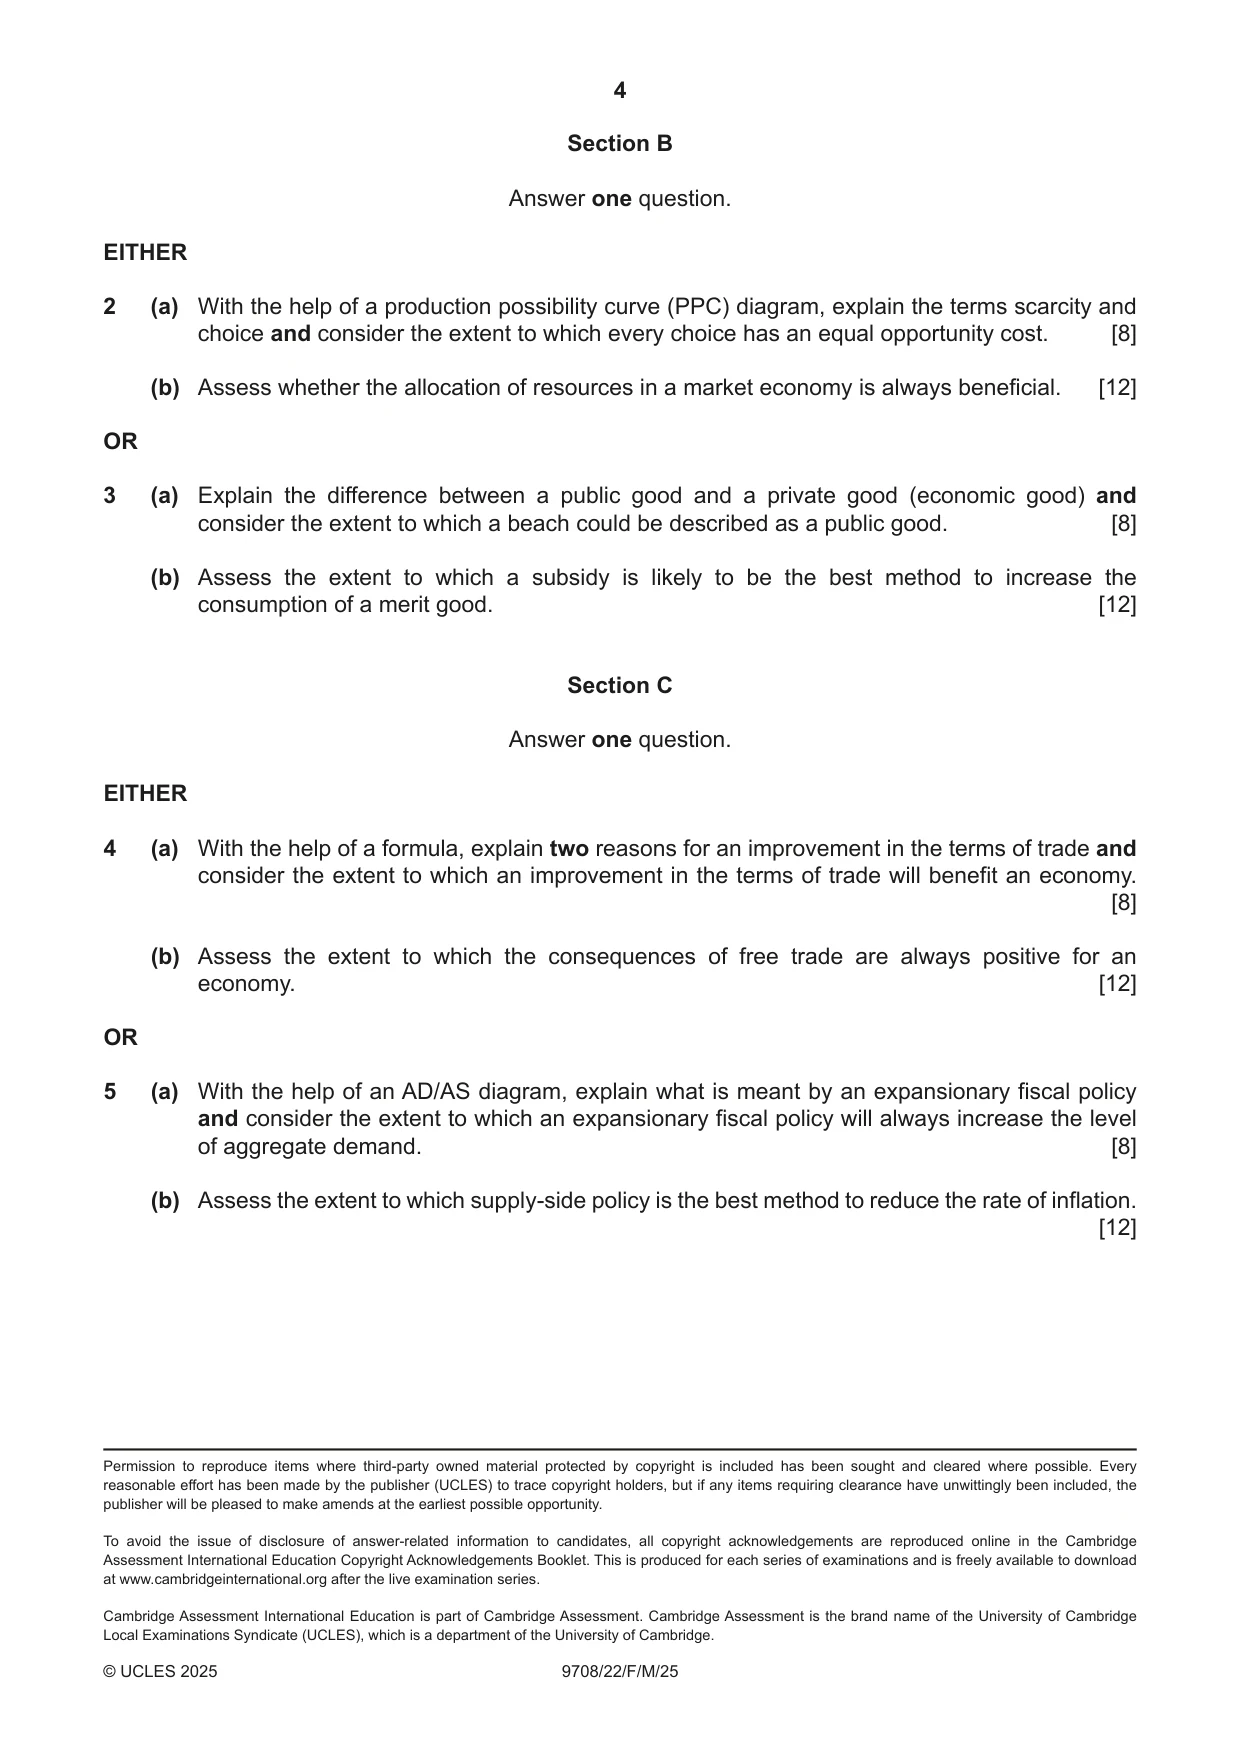
2 (a) With the help of a production possibility curve (PPC) diagram, explain the terms scarcity and choice and consider the extent to which every choice has an equal opportunity cost. [8] (b) Assess whether the allocation of resources in a market economy is always beneficial. [12] OR
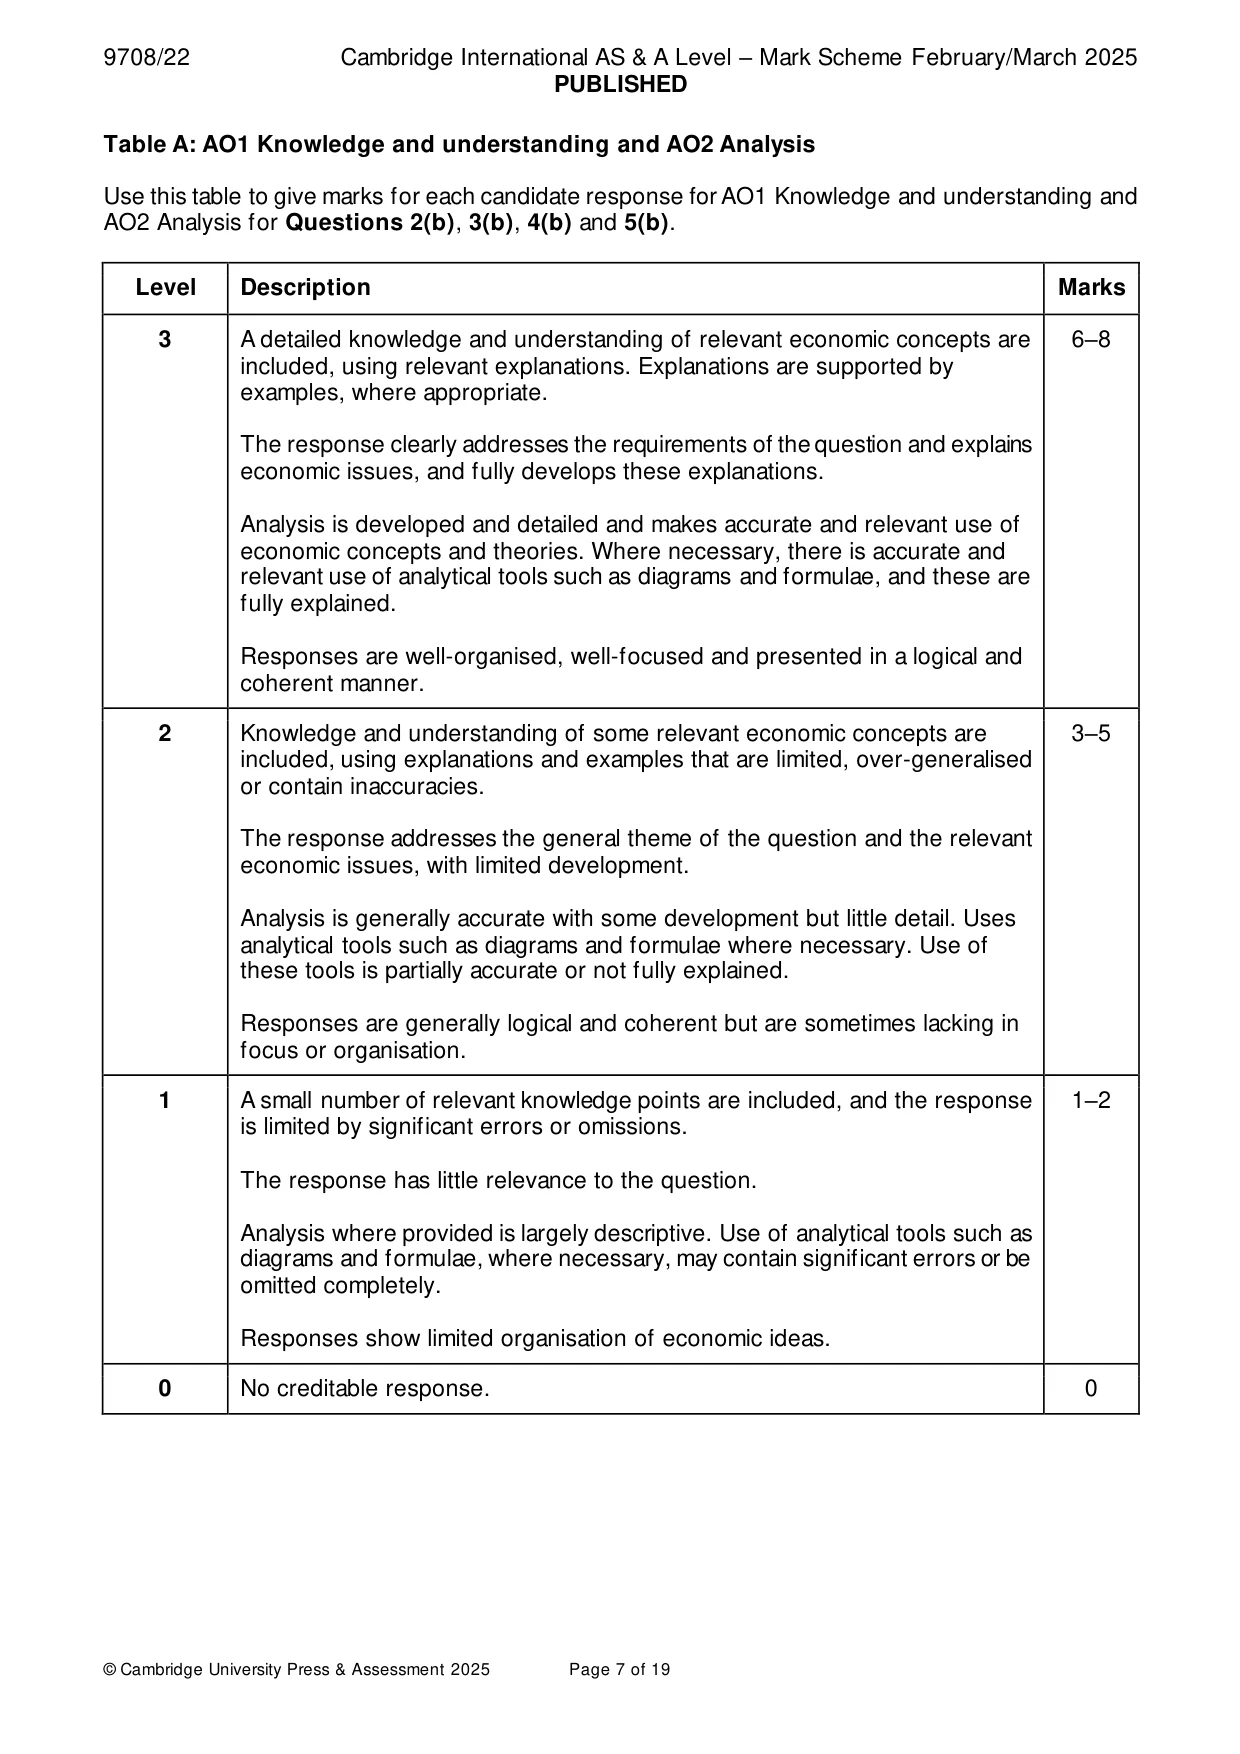
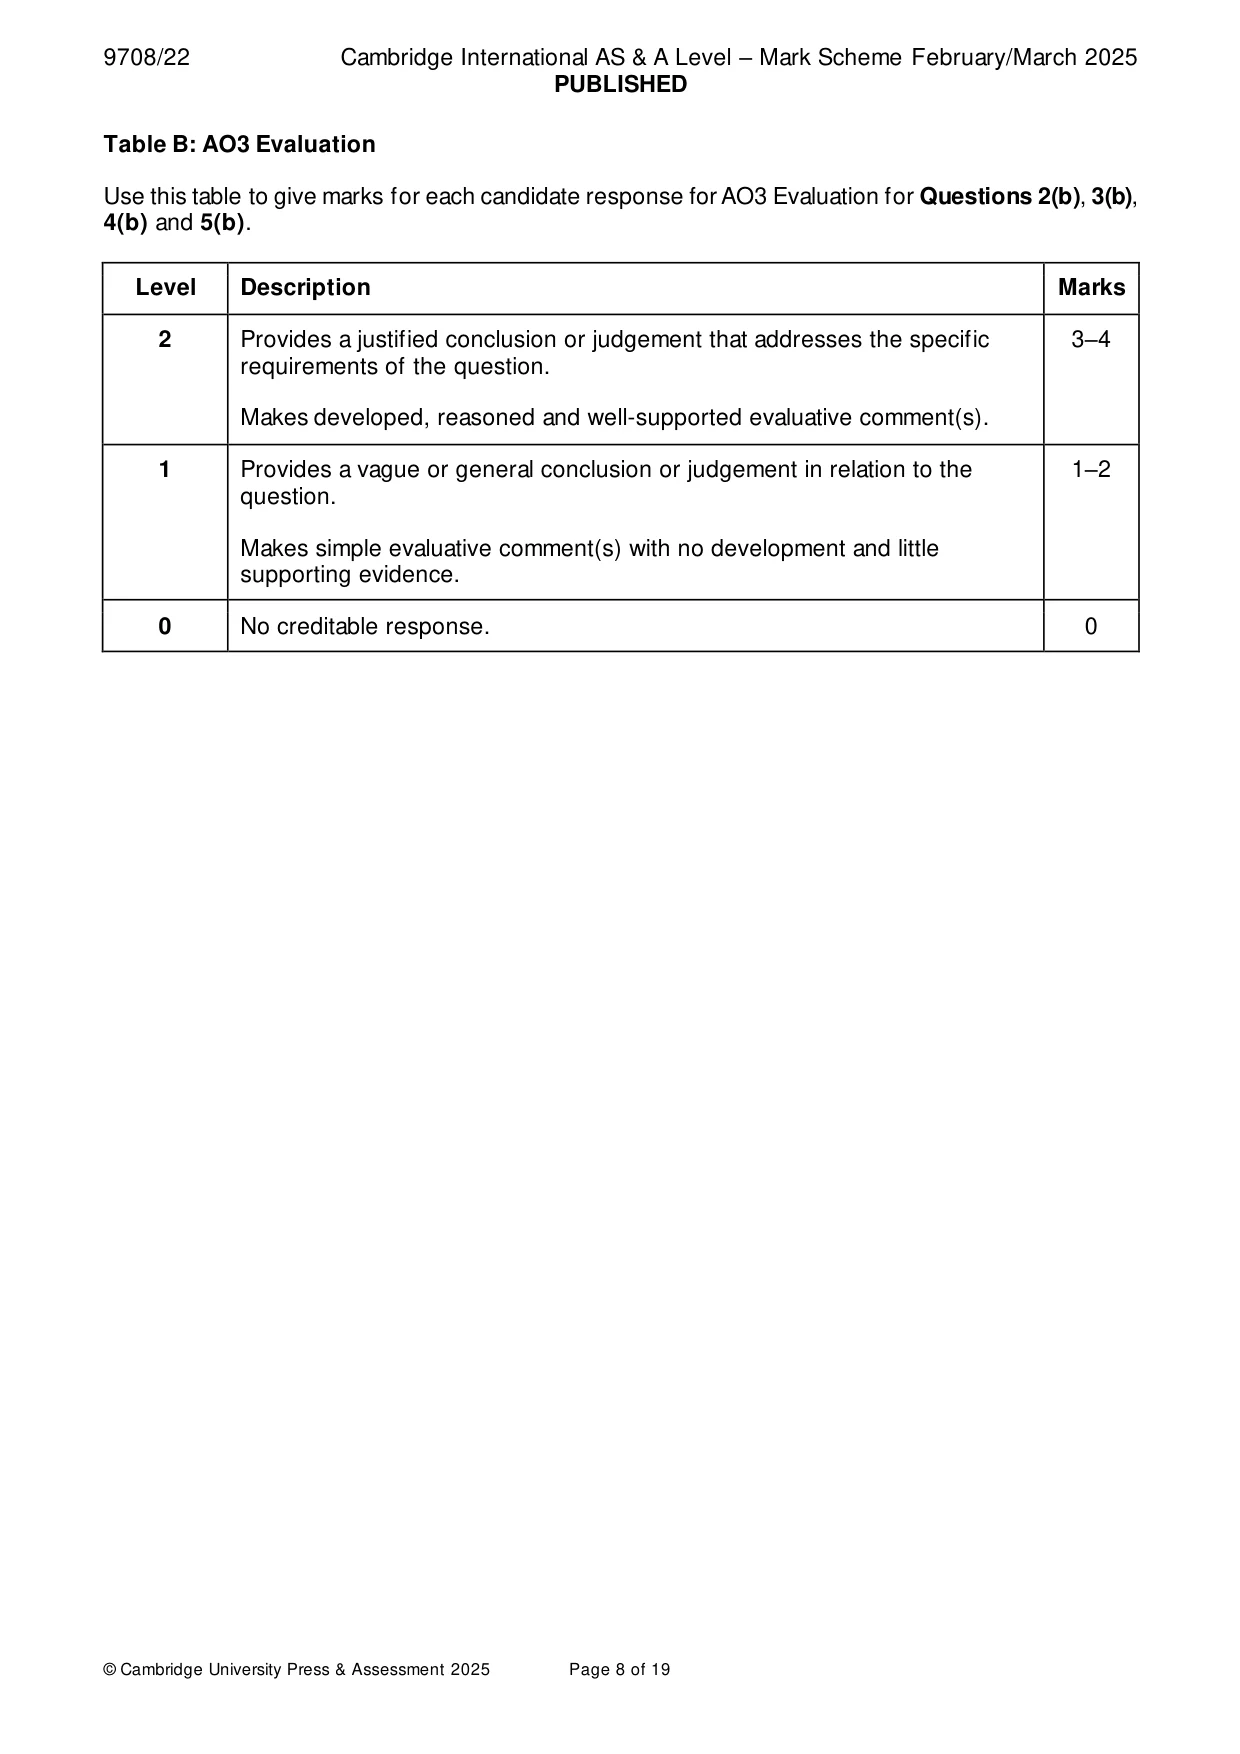
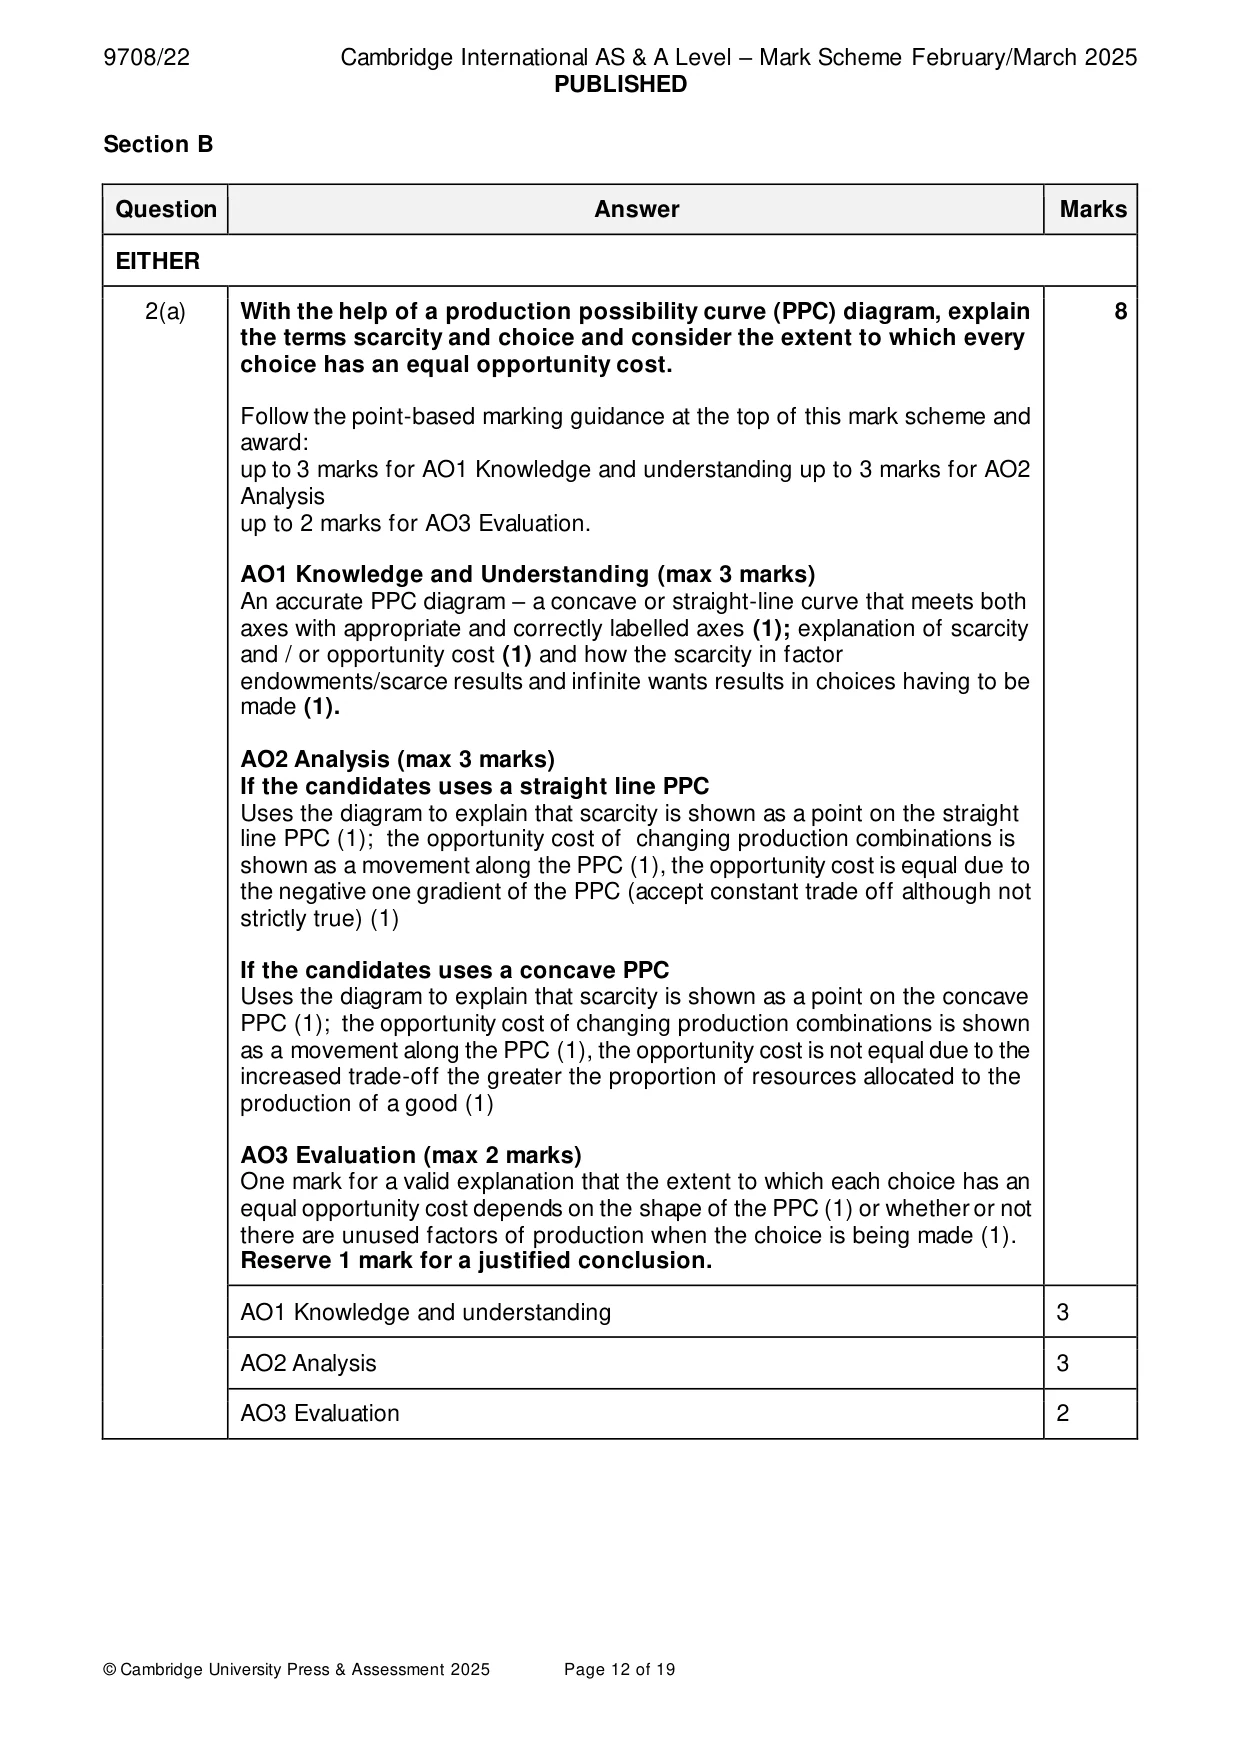
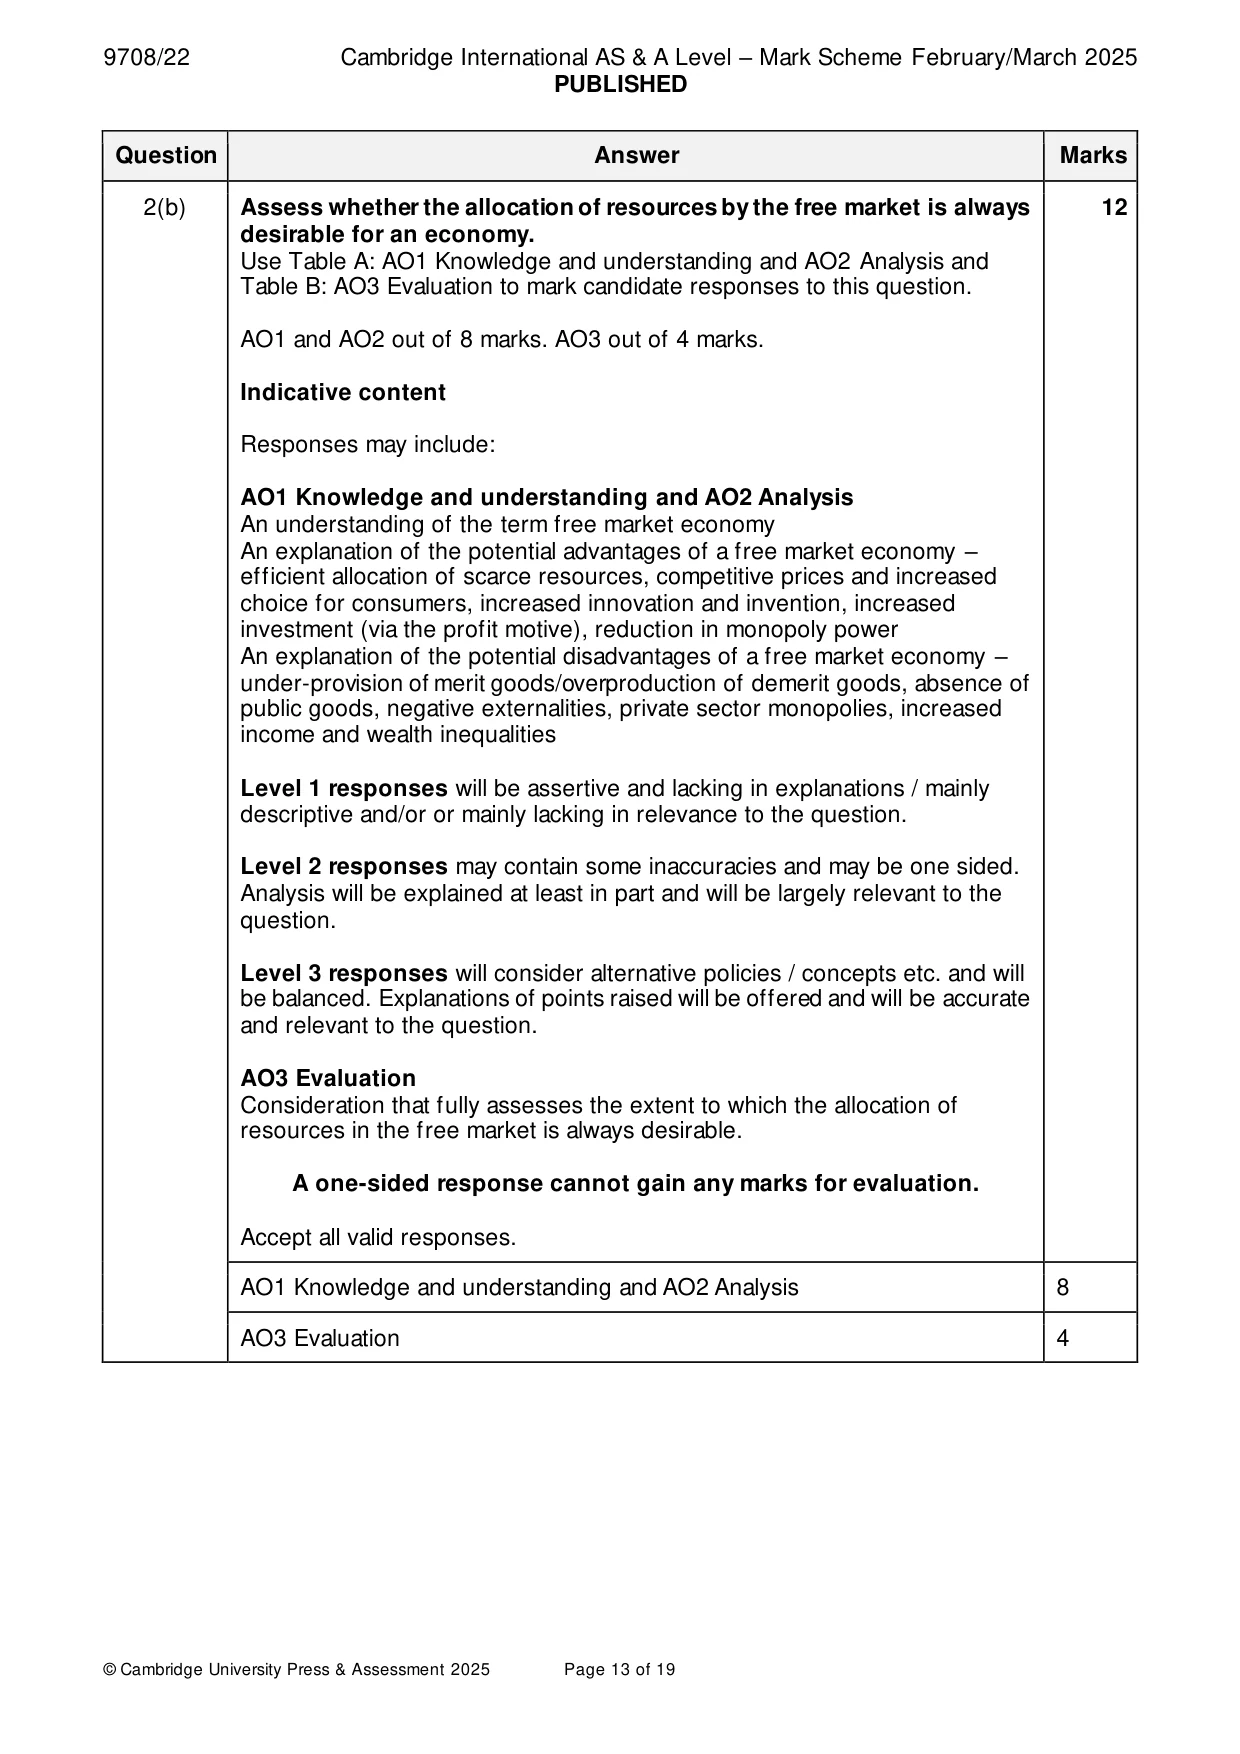
Mark scheme: 2(a) With the help of a production possibility curve (PPC) diagram, explain 8 the terms scarcity and choice and consider the extent to which every choice has an equal opportunity cost. Follow the point-based marking guidance at the top of this mark scheme and award: up to 3 marks for AO1 Knowledge and understanding up to 3 marks for AO2 Analysis up to 2 marks for AO3 Evaluation. AO1 Knowledge and Understanding (max 3 marks) An accurate PPC diagram – a concave or straight-line curve that meets both axes with appropriate and correctly labelled axes (1); explanation of scarcity and / or opportunity cost (1) and how the scarcity in factor endowments/scarce results and infinite wants results in choices having to be made (1). AO2 Analysis (max 3 marks) If the candidates uses a straight line PPC Uses the diagram to explain that scarcity is shown as a point on the straight line PPC (1); the opportunity cost of changing production combinations is shown as a movement along the PPC (1), the opportunity cost is equal due to the negative one gradient of the PPC (accept constant trade off although not strictly true) (1) If the candidates uses a concave PPC Uses the diagram to explain that scarcity is shown as a point on the concave PPC (1); the opportunity cost of changing production combinations is shown as a movement along the PPC (1), the opportunity cost is not equal due to the increased trade-off the greater the proportion of resources allocated to the production of a good (1) AO3 Evaluation (max 2 marks) One mark for a valid explanation that the extent to which each choice has an equal opportunity cost depends on the shape of the PPC (1) or whether or not there are unused factors of production when the choice is being made (1). Reserve 1 mark for a justified conclusion. AO1 Knowledge and understanding 3 AO2 Analysis 3 AO3 Evaluation 2 2(b) Assess whether the allocation of resources by the free market is always 12 desirable for an economy. Use Table A: AO1 Knowledge and understanding and AO2 Analysis and Table B: AO3 Evaluation to mark candidate responses to this question. AO1 and AO2 out of 8 marks. AO3 out of 4 marks. Indicative content Responses may include: AO1 Knowledge and understanding and AO2 Analysis An understanding of the term free market economy An explanation of the potential advantages of a free market economy – efficient allocation of scarce resources, competitive prices and increased choice for consumers, increased innovation and invention, increased investment (via the profit motive), reduction in monopoly power An explanation of the potential disadvantages of a free market economy – under-provision of merit goods/overproduction of demerit goods, absence of public goods, negative externalities, private sector monopolies, increased income and wealth inequalities Level 1 responses will be assertive and lacking in explanations / mainly descriptive and/or or mainly lacking in relevance to the question. Level 2 responses may contain some inaccuracies and may be one sided. Analysis will be explained at least in part and will be largely relevant to the question. Level 3 responses will consider alternative policies / concepts etc. and will be balanced. Explanations of points raised will be offered and will be accurate and relevant to the question. AO3 Evaluation Consideration that fully assesses the extent to which the allocation of resources in the free market is always desirable. A one-sided response cannot gain any marks for evaluation. Accept all valid responses. AO1 Knowledge and understanding and AO2 Analysis 8 AO3 Evaluation 4
Q3 · Explain the difference between a public good and a private good (economic good) and…
3 (a) Explain the difference between a public good and a private good (economic good) and consider the extent to which a beach could be described as a public good. [8] (b) Assess the extent to which a subsidy is likely to be the best method to increase the consumption of a merit good. [12] Section C Answer one question. EITHER
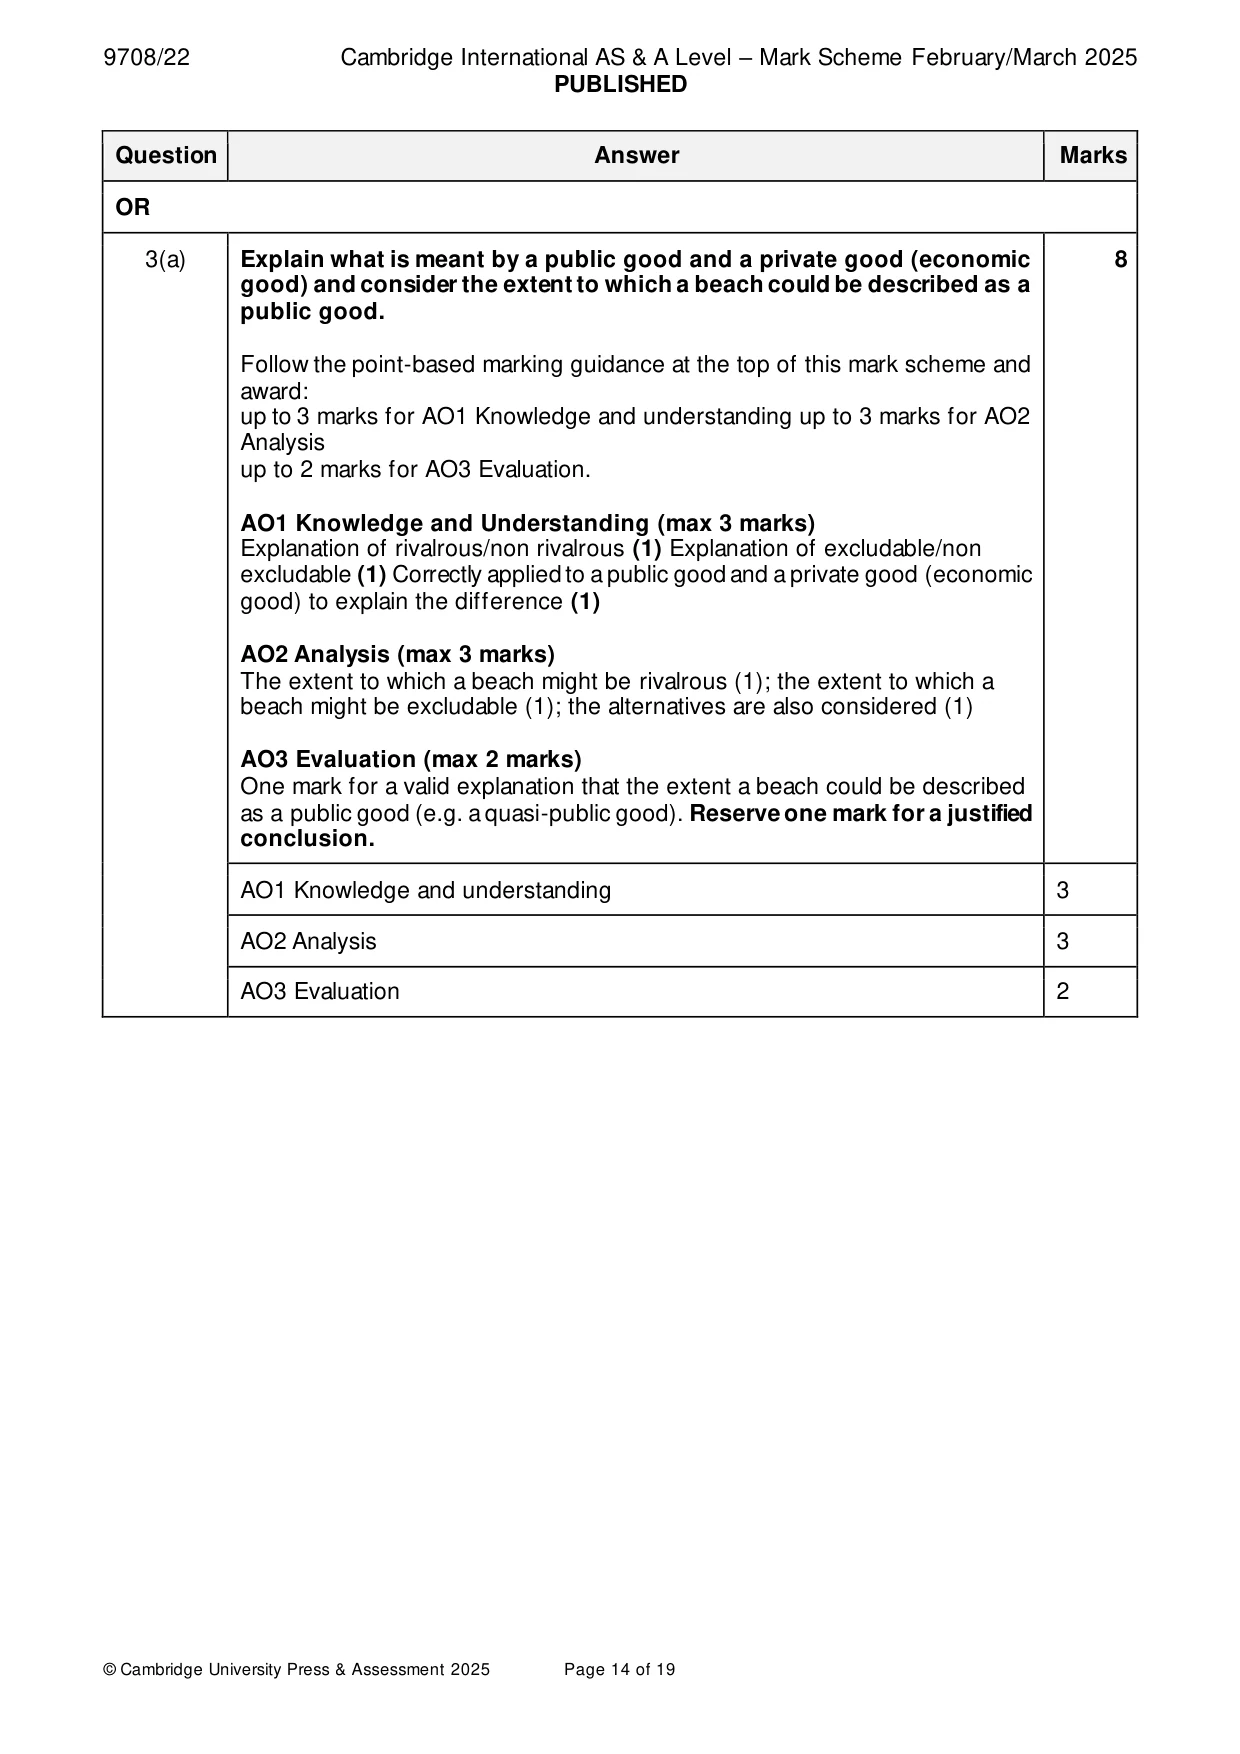
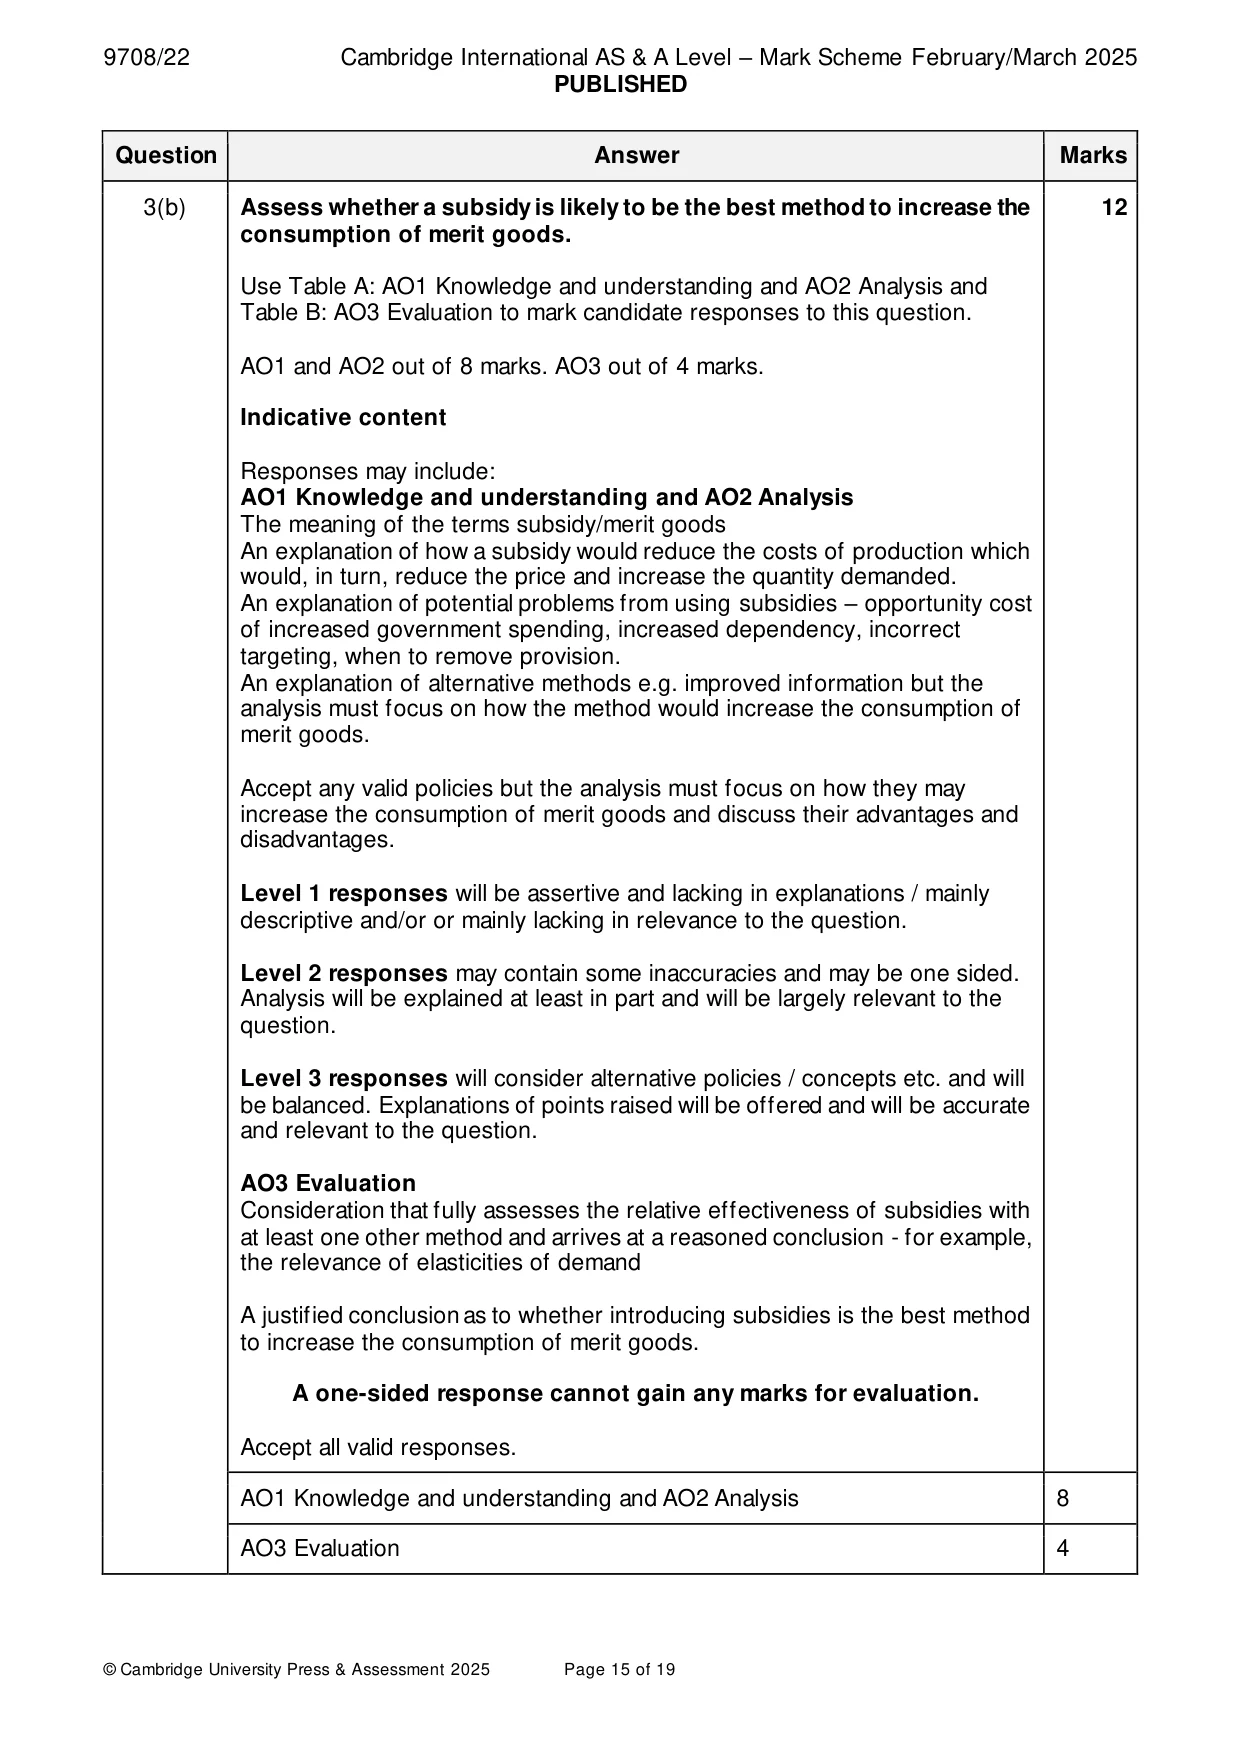
Mark scheme: 3(a) Explain what is meant by a public good and a private good (economic 8 good) and consider the extent to which a beach could be described as a public good. Follow the point-based marking guidance at the top of this mark scheme and award: up to 3 marks for AO1 Knowledge and understanding up to 3 marks for AO2 Analysis up to 2 marks for AO3 Evaluation. AO1 Knowledge and Understanding (max 3 marks) Explanation of rivalrous/non rivalrous (1) Explanation of excludable/non excludable (1) Correctly applied to a public good and a private good (economic good) to explain the difference (1) AO2 Analysis (max 3 marks) The extent to which a beach might be rivalrous (1); the extent to which a beach might be excludable (1); the alternatives are also considered (1) AO3 Evaluation (max 2 marks) One mark for a valid explanation that the extent a beach could be described as a public good (e.g. a quasi-public good). Reserve one mark for a justified conclusion. AO1 Knowledge and understanding 3 AO2 Analysis 3 AO3 Evaluation 2 3(b) Assess whether a subsidy is likely to be the best method to increase the 12 consumption of merit goods. Use Table A: AO1 Knowledge and understanding and AO2 Analysis and Table B: AO3 Evaluation to mark candidate responses to this question. AO1 and AO2 out of 8 marks. AO3 out of 4 marks. Indicative content Responses may include: AO1 Knowledge and understanding and AO2 Analysis The meaning of the terms subsidy/merit goods An explanation of how a subsidy would reduce the costs of production which would, in turn, reduce the price and increase the quantity demanded. An explanation of potential problems from using subsidies – opportunity cost of increased government spending, increased dependency, incorrect targeting, when to remove provision. An explanation of alternative methods e.g. improved information but the analysis must focus on how the method would increase the consumption of merit goods. Accept any valid policies but the analysis must focus on how they may increase the consumption of merit goods and discuss their advantages and disadvantages. Level 1 responses will be assertive and lacking in explanations / mainly descriptive and/or or mainly lacking in relevance to the question. Level 2 responses may contain some inaccuracies and may be one sided. Analysis will be explained at least in part and will be largely relevant to the question. Level 3 responses will consider alternative policies / concepts etc. and will be balanced. Explanations of points raised will be offered and will be accurate and relevant to the question. AO3 Evaluation Consideration that fully assesses the relative effectiveness of subsidies with at least one other method and arrives at a reasoned conclusion - for example, the relevance of elasticities of demand A justified conclusion as to whether introducing subsidies is the best method to increase the consumption of merit goods. A one-sided response cannot gain any marks for evaluation. Accept all valid responses. AO1 Knowledge and understanding and AO2 Analysis 8 AO3 Evaluation 4 Section C
More questions on Methods and effects of government intervention in markets
Q4 · With the help of a formula, explain two reasons for an improvement in the terms of trade…
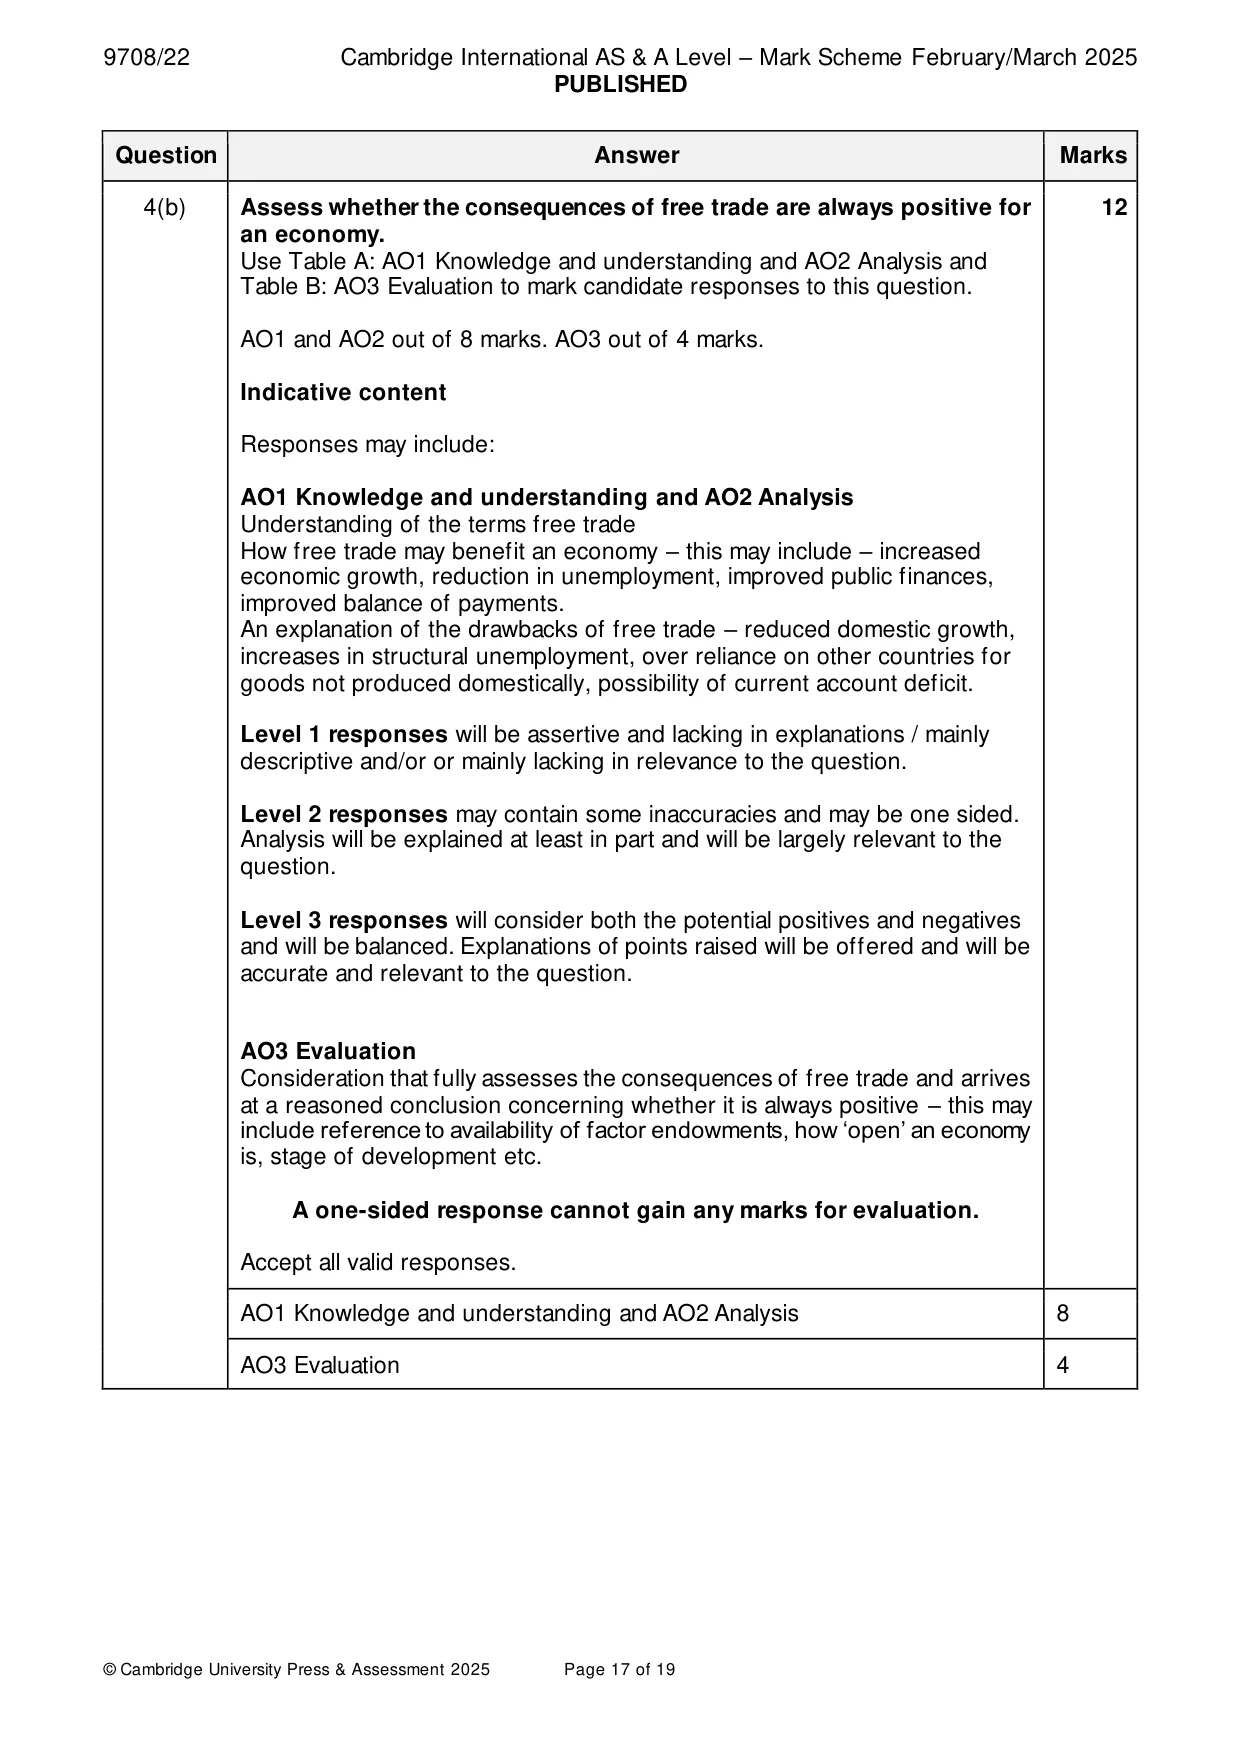
4 (a) With the help of a formula, explain two reasons for an improvement in the terms of trade and consider the extent to which an improvement in the terms of trade will benefit an economy. [8] (b) Assess the extent to which the consequences of free trade are always positive for an economy. [12] OR
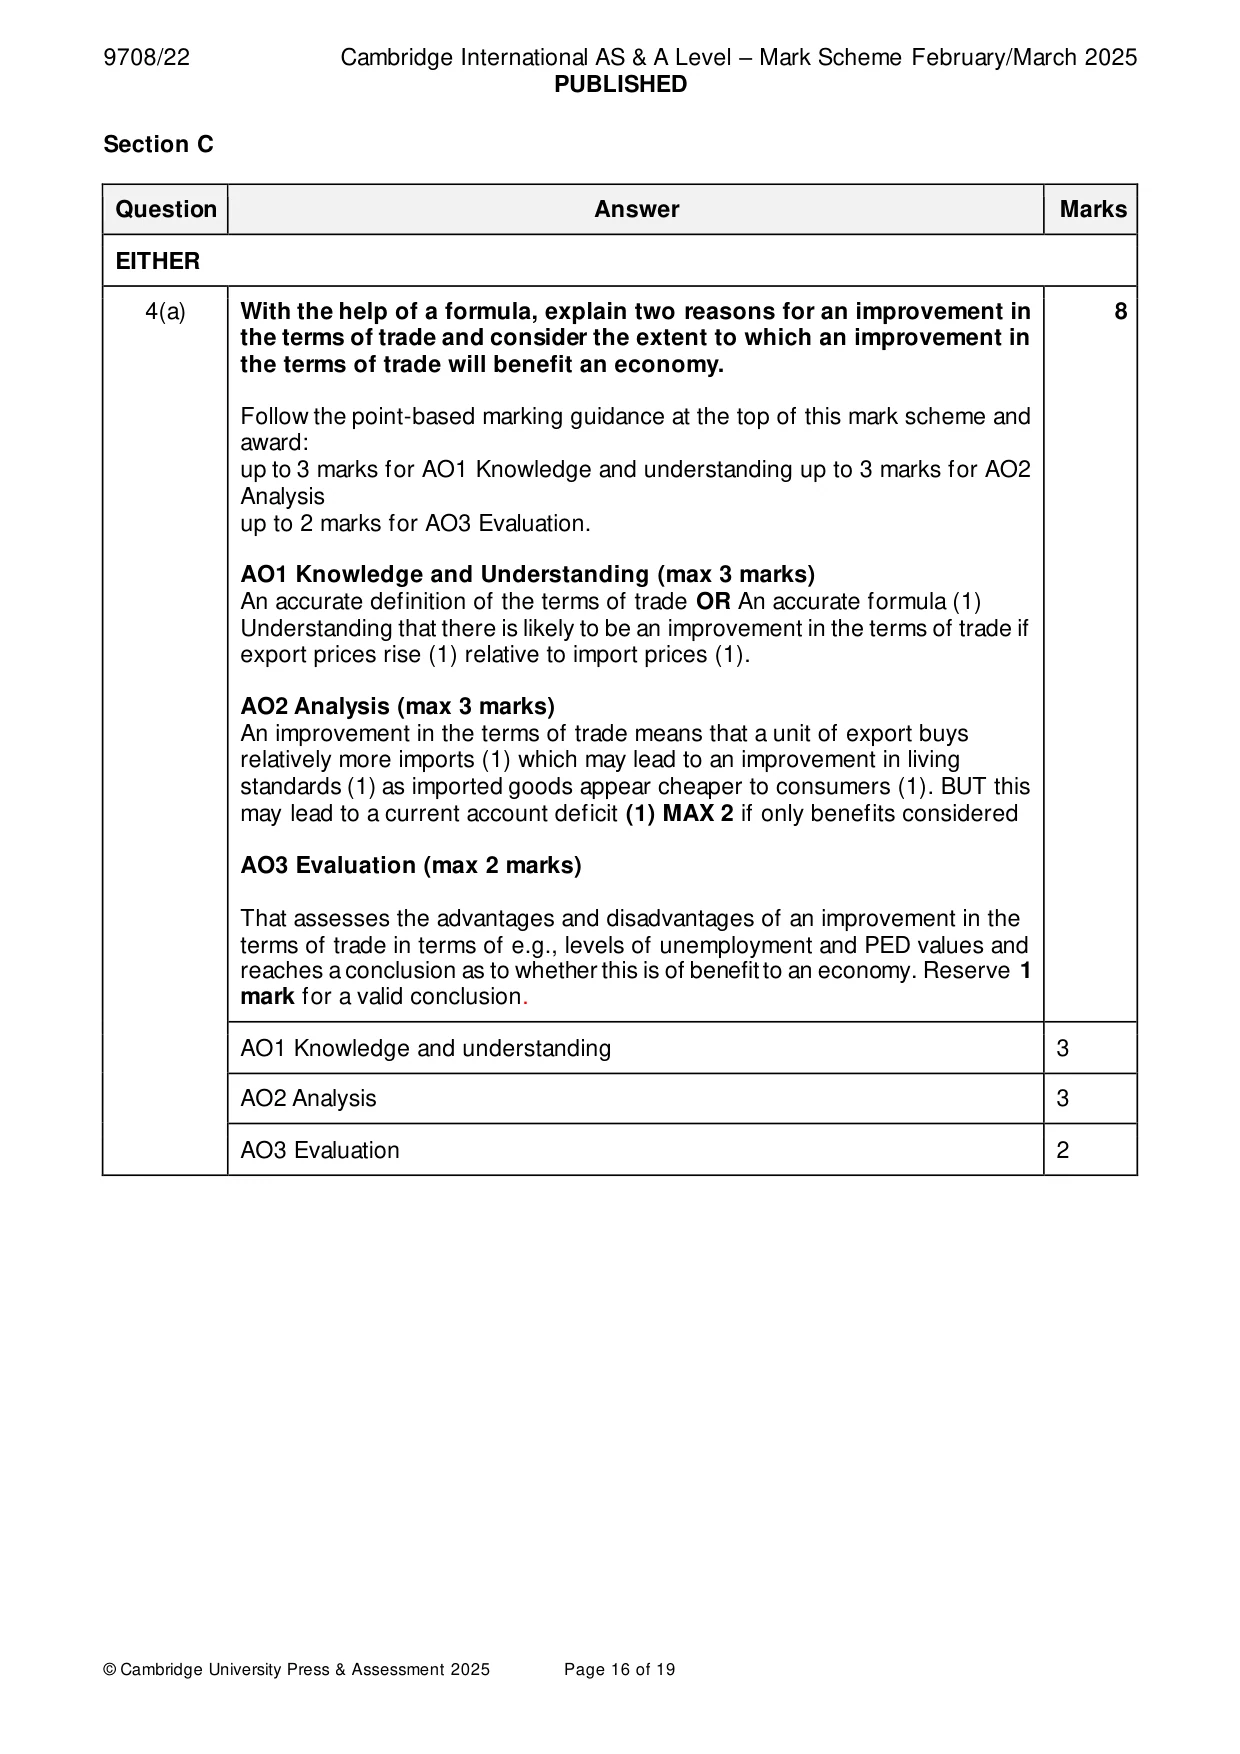
Mark scheme: 4(a) With the help of a formula, explain two reasons for an improvement in 8 the terms of trade and consider the extent to which an improvement in the terms of trade will benefit an economy. Follow the point-based marking guidance at the top of this mark scheme and award: up to 3 marks for AO1 Knowledge and understanding up to 3 marks for AO2 Analysis up to 2 marks for AO3 Evaluation. AO1 Knowledge and Understanding (max 3 marks) An accurate definition of the terms of trade OR An accurate formula (1) Understanding that there is likely to be an improvement in the terms of trade if export prices rise (1) relative to import prices (1). AO2 Analysis (max 3 marks) An improvement in the terms of trade means that a unit of export buys relatively more imports (1) which may lead to an improvement in living standards (1) as imported goods appear cheaper to consumers (1). BUT this may lead to a current account deficit (1) MAX 2 if only benefits considered AO3 Evaluation (max 2 marks) That assesses the advantages and disadvantages of an improvement in the terms of trade in terms of e.g., levels of unemployment and PED values and reaches a conclusion as to whether this is of benefit to an economy. Reserve 1 mark for a valid conclusion. AO1 Knowledge and understanding 3 AO2 Analysis 3 AO3 Evaluation 2 4(b) Assess whether the consequences of free trade are always positive for 12 an economy. Use Table A: AO1 Knowledge and understanding and AO2 Analysis and Table B: AO3 Evaluation to mark candidate responses to this question. AO1 and AO2 out of 8 marks. AO3 out of 4 marks. Indicative content Responses may include: AO1 Knowledge and understanding and AO2 Analysis Understanding of the terms free trade How free trade may benefit an economy – this may include – increased economic growth, reduction in unemployment, improved public finances, improved balance of payments. An explanation of the drawbacks of free trade – reduced domestic growth, increases in structural unemployment, over reliance on other countries for goods not produced domestically, possibility of current account deficit. Level 1 responses will be assertive and lacking in explanations / mainly descriptive and/or or mainly lacking in relevance to the question. Level 2 responses may contain some inaccuracies and may be one sided. Analysis will be explained at least in part and will be largely relevant to the question. Level 3 responses will consider both the potential positives and negatives and will be balanced. Explanations of points raised will be offered and will be accurate and relevant to the question. AO3 Evaluation Consideration that fully assesses the consequences of free trade and arrives at a reasoned conclusion concerning whether it is always positive – this may include reference to availability of factor endowments, how ‘open’ an economy is, stage of development etc. A one-sided response cannot gain any marks for evaluation. Accept all valid responses. AO1 Knowledge and understanding and AO2 Analysis 8 AO3 Evaluation 4
Q5 · With the help of an AD/AS diagram, explain what is meant by an expansionary fiscal policy…
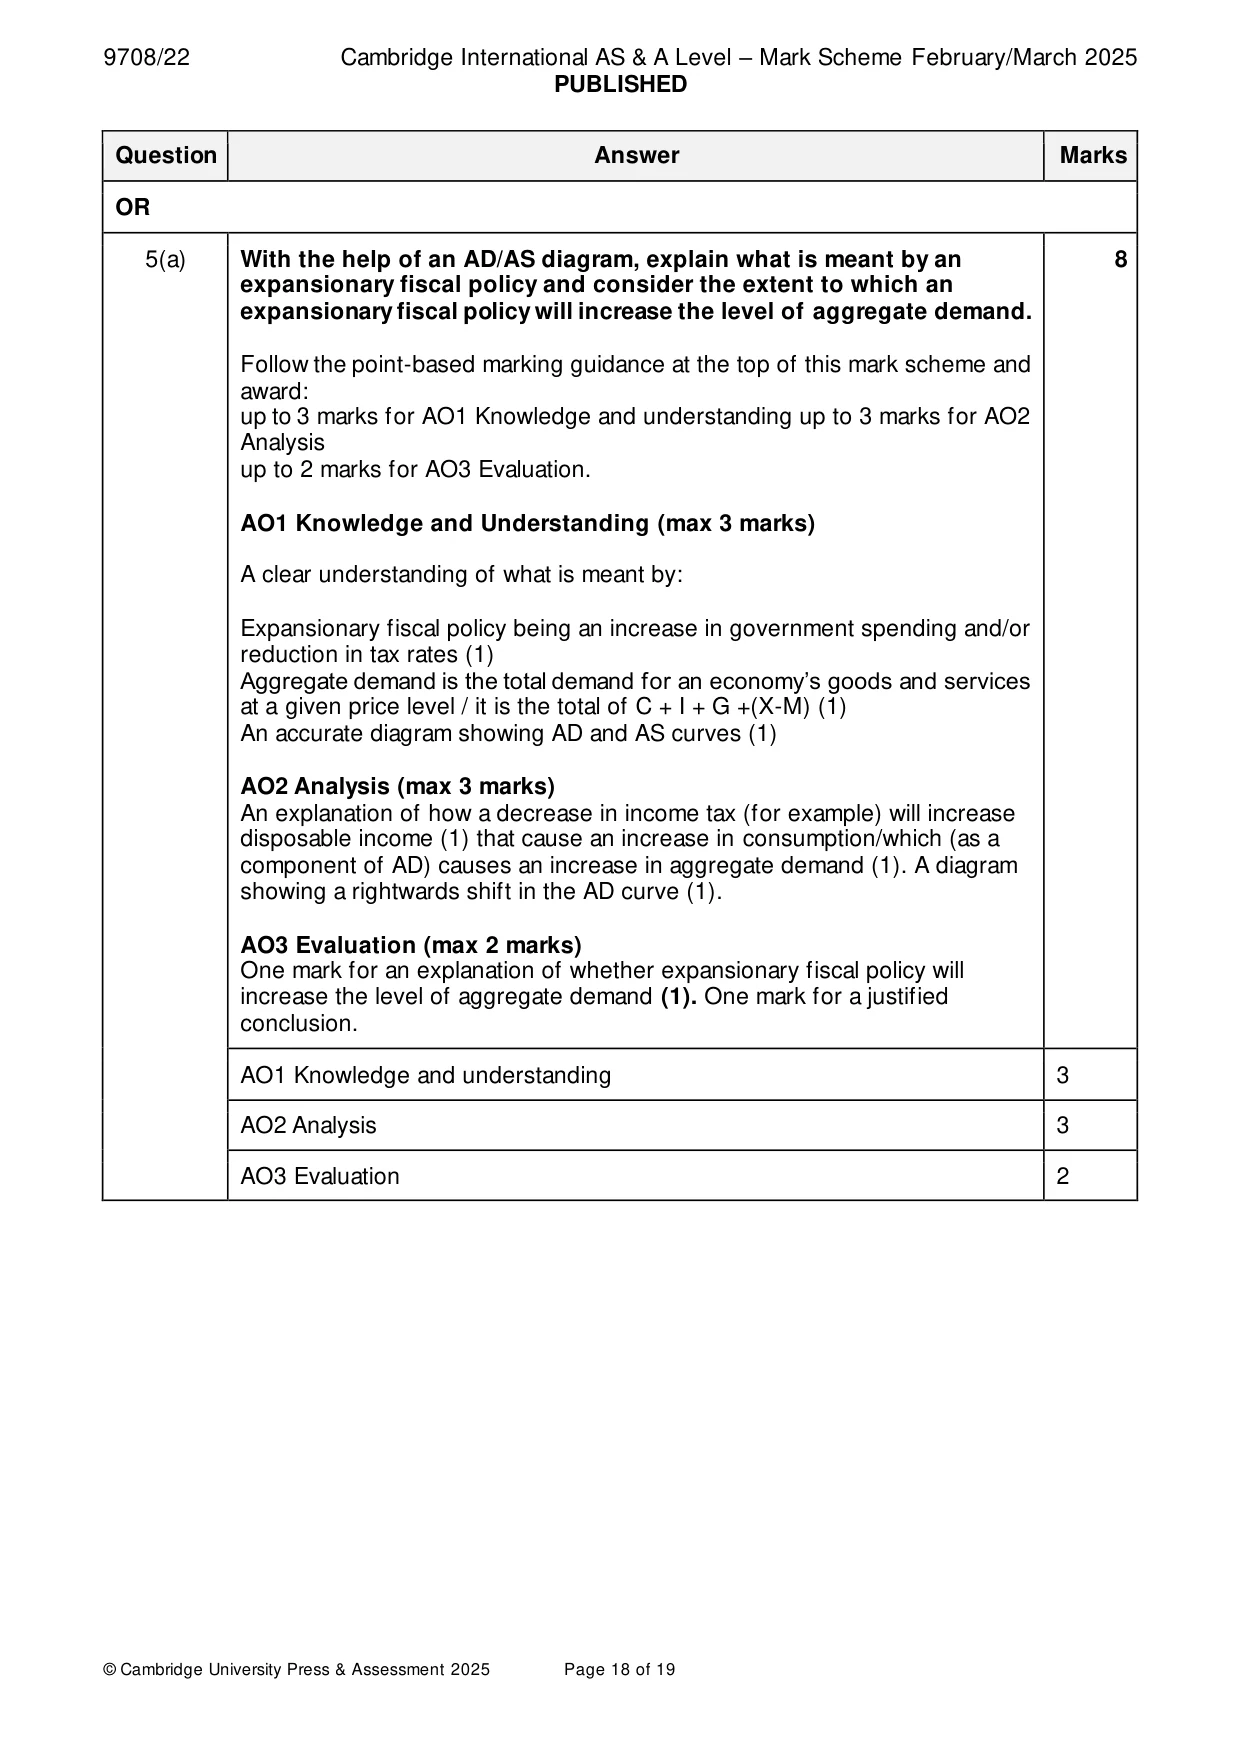
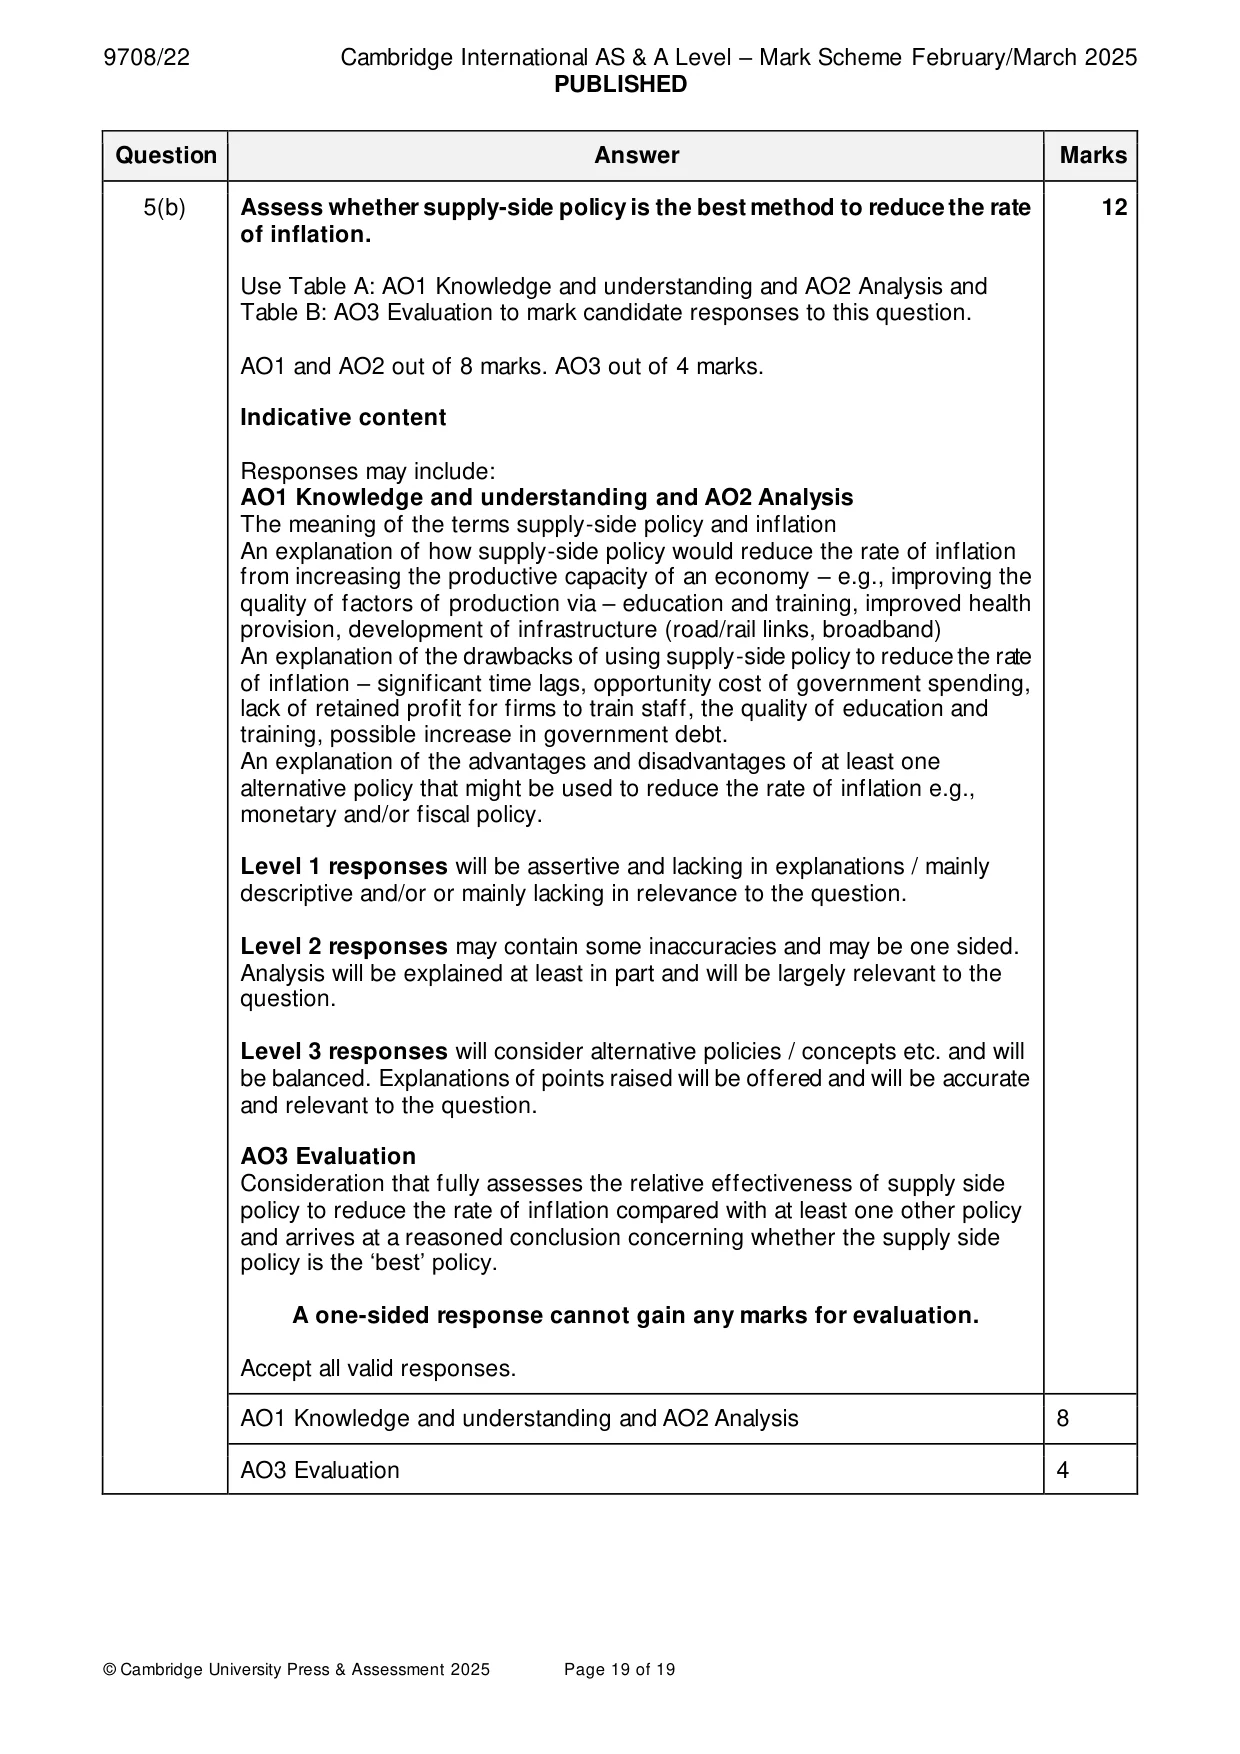
5 (a) With the help of an AD/AS diagram, explain what is meant by an expansionary fiscal policy and consider the extent to which an expansionary fiscal policy will always increase the level of aggregate demand. [8] (b) Assess the extent to which supply-side policy is the best method to reduce the rate of inflation. [12]
Mark scheme: 5(a) With the help of an AD/AS diagram, explain what is meant by an 8 expansionary fiscal policy and consider the extent to which an expansionary fiscal policy will increase the level of aggregate demand. Follow the point-based marking guidance at the top of this mark scheme and award: up to 3 marks for AO1 Knowledge and understanding up to 3 marks for AO2 Analysis up to 2 marks for AO3 Evaluation. AO1 Knowledge and Understanding (max 3 marks) A clear understanding of what is meant by: Expansionary fiscal policy being an increase in government spending and/or reduction in tax rates (1) Aggregate demand is the total demand for an economy’s goods and services at a given price level / it is the total of C + I + G +(X-M) (1) An accurate diagram showing AD and AS curves (1) AO2 Analysis (max 3 marks) An explanation of how a decrease in income tax (for example) will increase disposable income (1) that cause an increase in consumption/which (as a component of AD) causes an increase in aggregate demand (1). A diagram showing a rightwards shift in the AD curve (1). AO3 Evaluation (max 2 marks) One mark for an explanation of whether expansionary fiscal policy will increase the level of aggregate demand (1). One mark for a justified conclusion. AO1 Knowledge and understanding 3 AO2 Analysis 3 AO3 Evaluation 2 5(b) Assess whether supply-side policy is the best method to reduce the rate 12 of inflation. Use Table A: AO1 Knowledge and understanding and AO2 Analysis and Table B: AO3 Evaluation to mark candidate responses to this question. AO1 and AO2 out of 8 marks. AO3 out of 4 marks. Indicative content Responses may include: AO1 Knowledge and understanding and AO2 Analysis The meaning of the terms supply-side policy and inflation An explanation of how supply-side policy would reduce the rate of inflation from increasing the productive capacity of an economy – e.g., improving the quality of factors of production via – education and training, improved health provision, development of infrastructure (road/rail links, broadband) An explanation of the drawbacks of using supply-side policy to reduce the rate of inflation – significant time lags, opportunity cost of government spending, lack of retained profit for firms to train staff, the quality of education and training, possible increase in government debt. An explanation of the advantages and disadvantages of at least one alternative policy that might be used to reduce the rate of inflation e.g., monetary and/or fiscal policy. Level 1 responses will be assertive and lacking in explanations / mainly descriptive and/or or mainly lacking in relevance to the question. Level 2 responses may contain some inaccuracies and may be one sided. Analysis will be explained at least in part and will be largely relevant to the question. Level 3 responses will consider alternative policies / concepts etc. and will be balanced. Explanations of points raised will be offered and will be accurate and relevant to the question. AO3 Evaluation Consideration that fully assesses the relative effectiveness of supply side policy to reduce the rate of inflation compared with at least one other policy and arrives at a reasoned conclusion concerning whether the supply side policy is the ‘best’ policy. A one-sided response cannot gain any marks for evaluation. Accept all valid responses. AO1 Knowledge and understanding and AO2 Analysis 8 AO3 Evaluation 4
What was in this paper
The subtopics covered by these 5 questions, and how many questions each got. Open one in a new tab to see every Cambridge question on it.
What you needed in this session
Cambridge’s own grade thresholds for 2025 Feb/March, Paper 2 · Variant 2. A higher threshold means an easier paper — the bar moves with how the cohort did.