Cambridge A Level Biology 9700 — 2025 May/June Paper 2 · Variant 1
9700/21/M/J/25 · 6 questions · 60 marks · 75 min
The question paper and its mark scheme, free to read here and free to download. This is Cambridge’s own paper, exactly as it was sat.
Question paper20 pages


Mark scheme16 pages
Answers below. Sit the paper first if you are practising.
Questions as text
Q1 · Amylose and the triglyceride stearin are macromolecules
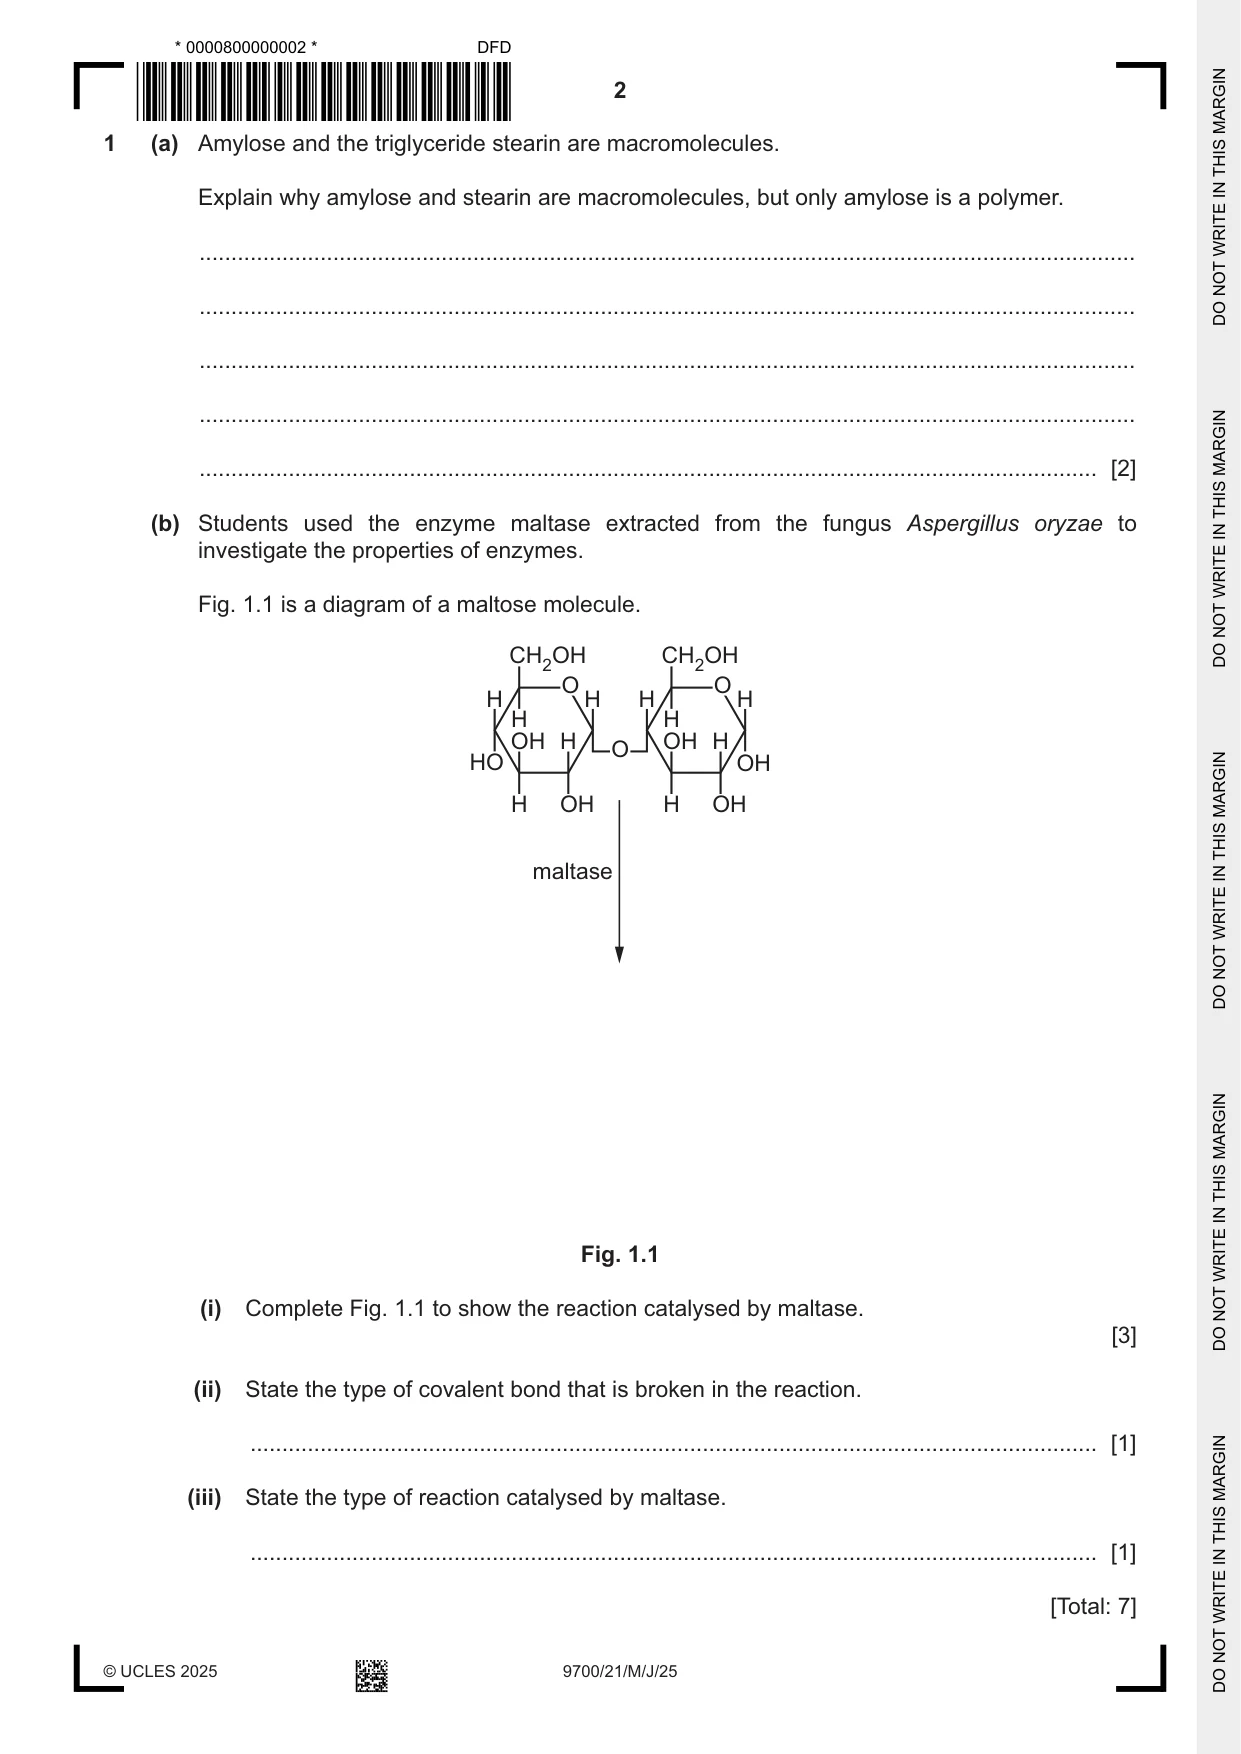
1 (a) Amylose and the triglyceride stearin are macromolecules. Explain why amylose and stearin are macromolecules, but only amylose is a polymer. ................................................................................................................................................... ................................................................................................................................................... ................................................................................................................................................... ................................................................................................................................................... ............................................................................................................................................. [2] (b) Students used the enzyme maltase extracted from the fungus Aspergillus oryzae to investigate the properties of enzymes. Fig. 1.1 is a diagram of a maltose molecule. CH2OH CH2OH O O H H H H H H OH H OH H O HO OH H OH H OH maltase Fig. 1.1 (i) Complete Fig. 1.1 to show the reaction catalysed by maltase. [3] (ii) State the type of covalent bond that is broken in the reaction. ..................................................................................................................................... [1] (iii) State the type of reaction catalysed by maltase. ..................................................................................................................................... [1] [Total: 7] Question 2 starts on page 4.
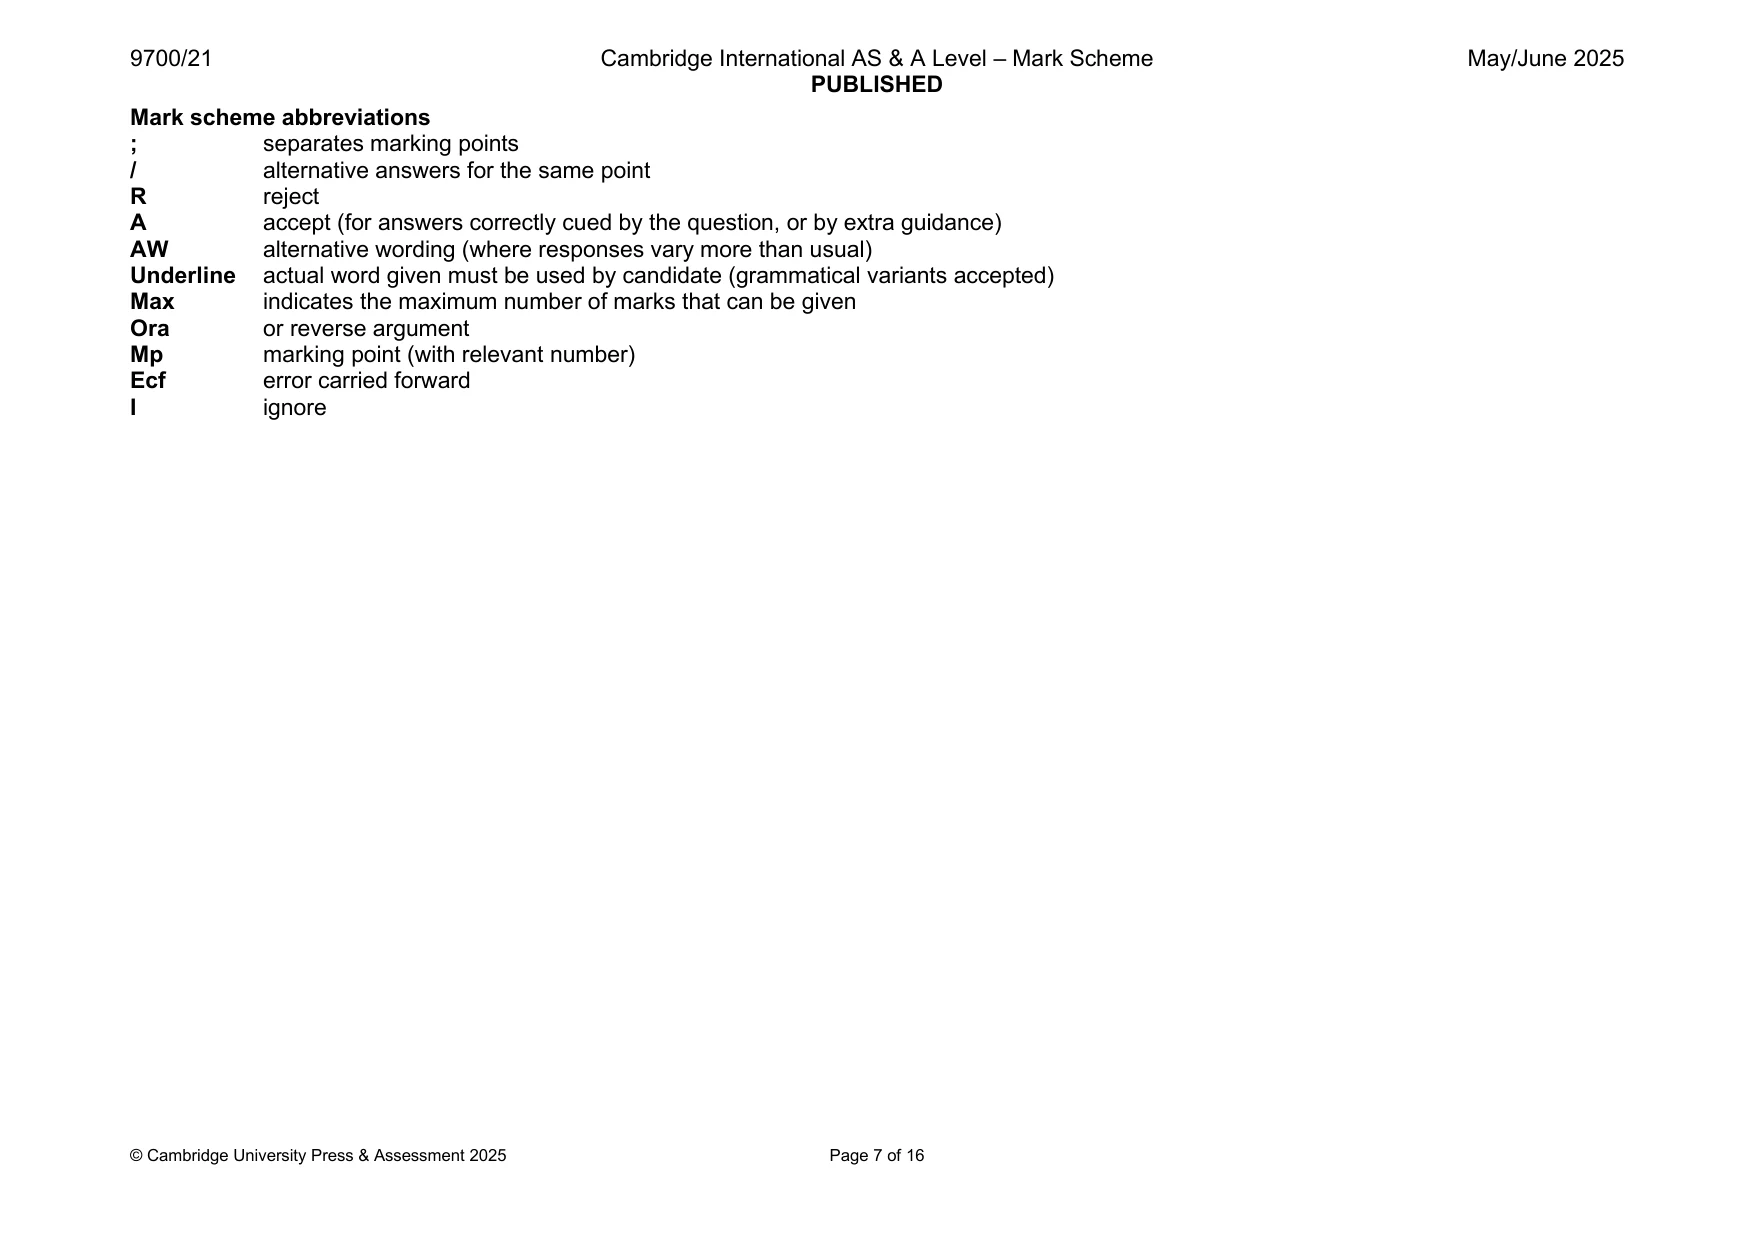
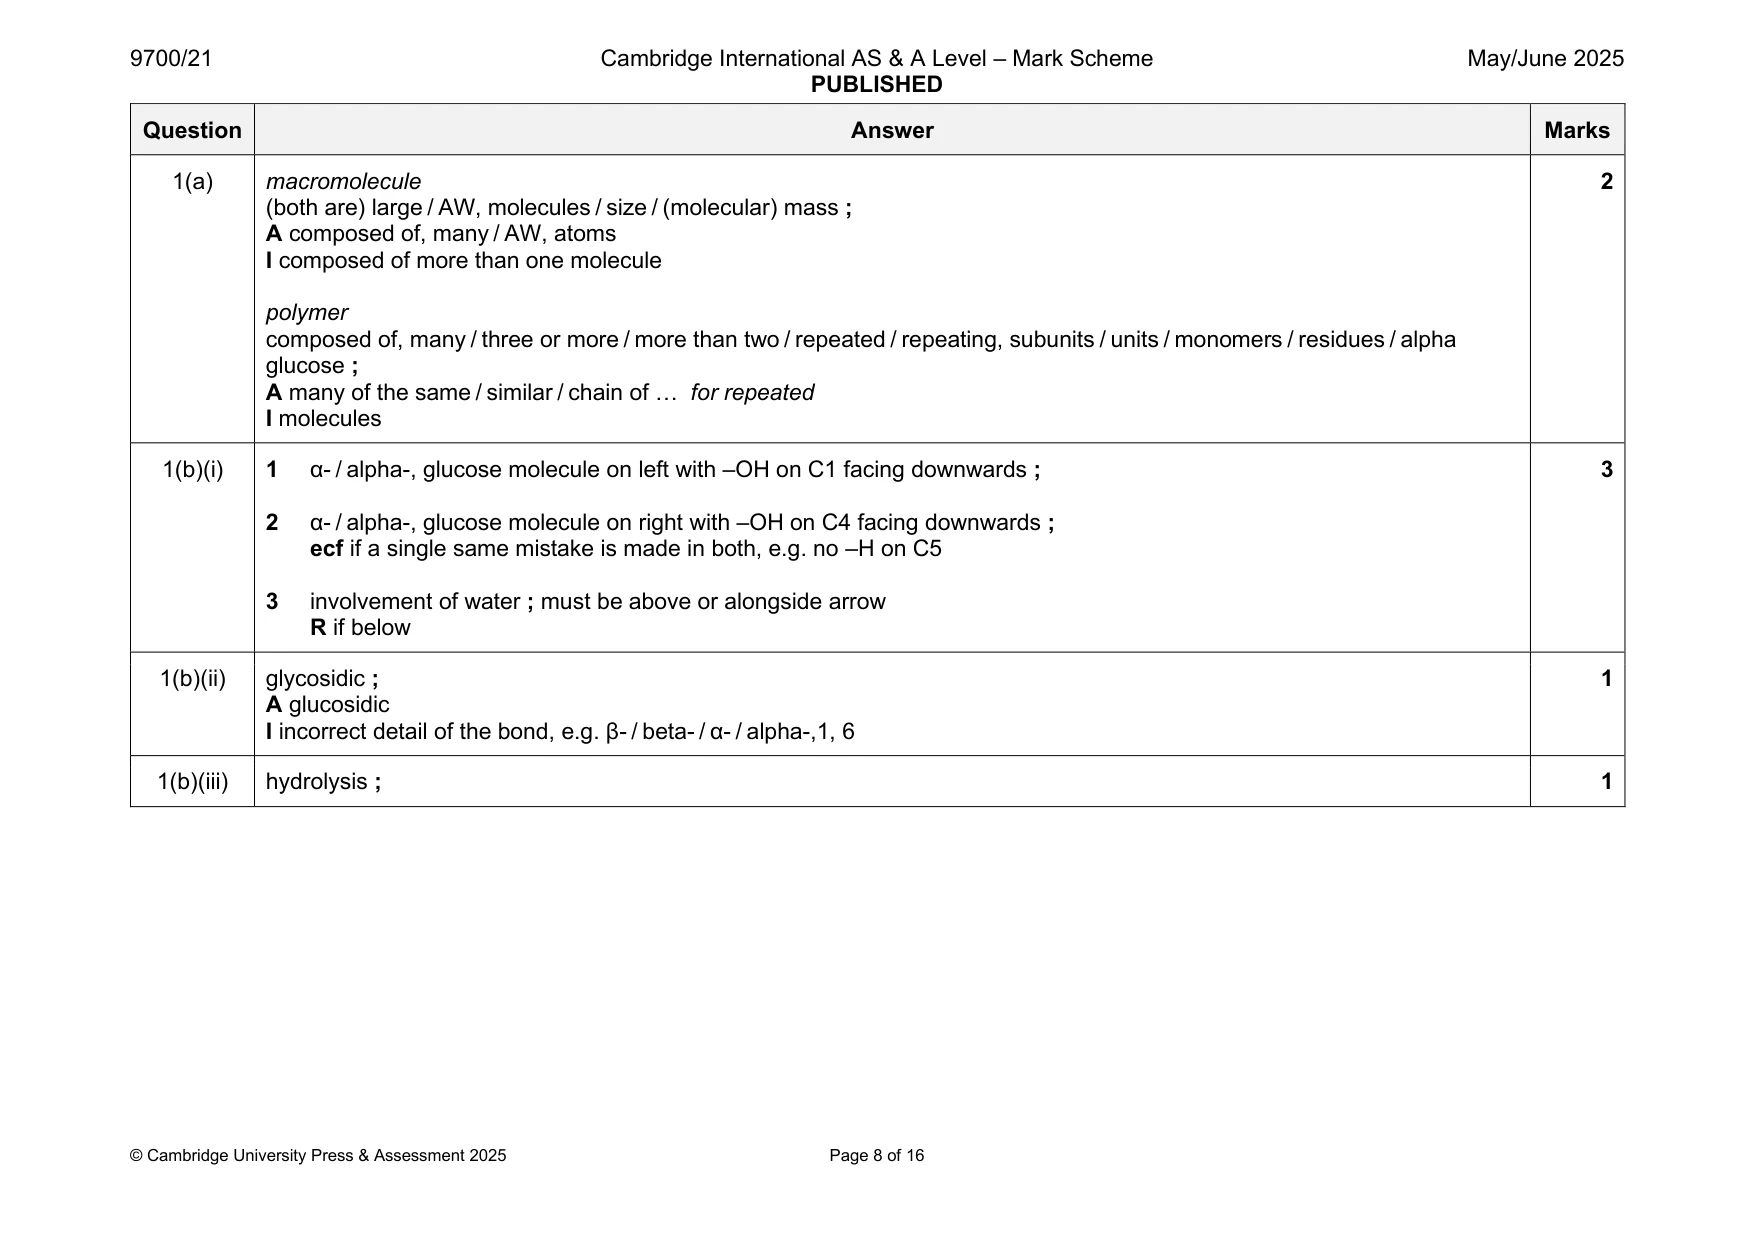
Mark scheme: Question Answer Marks 1(a) macromolecule 2 (both are) large / AW, molecules / size / (molecular) mass ; A composed of, many / AW, atoms I composed of more than one molecule polymer composed of, many / three or more / more than two / repeated / repeating, subunits / units / monomers / residues / alpha glucose ; A many of the same / similar / chain of … for repeated I molecules 1(b)(i) 1 α- / alpha-, glucose molecule on left with –OH on C1 facing downwards ; 3 2 α- / alpha-, glucose molecule on right with –OH on C4 facing downwards ; ecf if a single same mistake is made in both, e.g. no –H on C5 3 involvement of water ; must be above or alongside arrow R if below 1(b)(ii) glycosidic ; 1 A glucosidic I incorrect detail of the bond, e.g. β- / beta- / α- / alpha-,1, 6 1(b)(iii) hydrolysis ; 1
Q2 · In mammals, the small intestine is the main site of absorption of the products of…
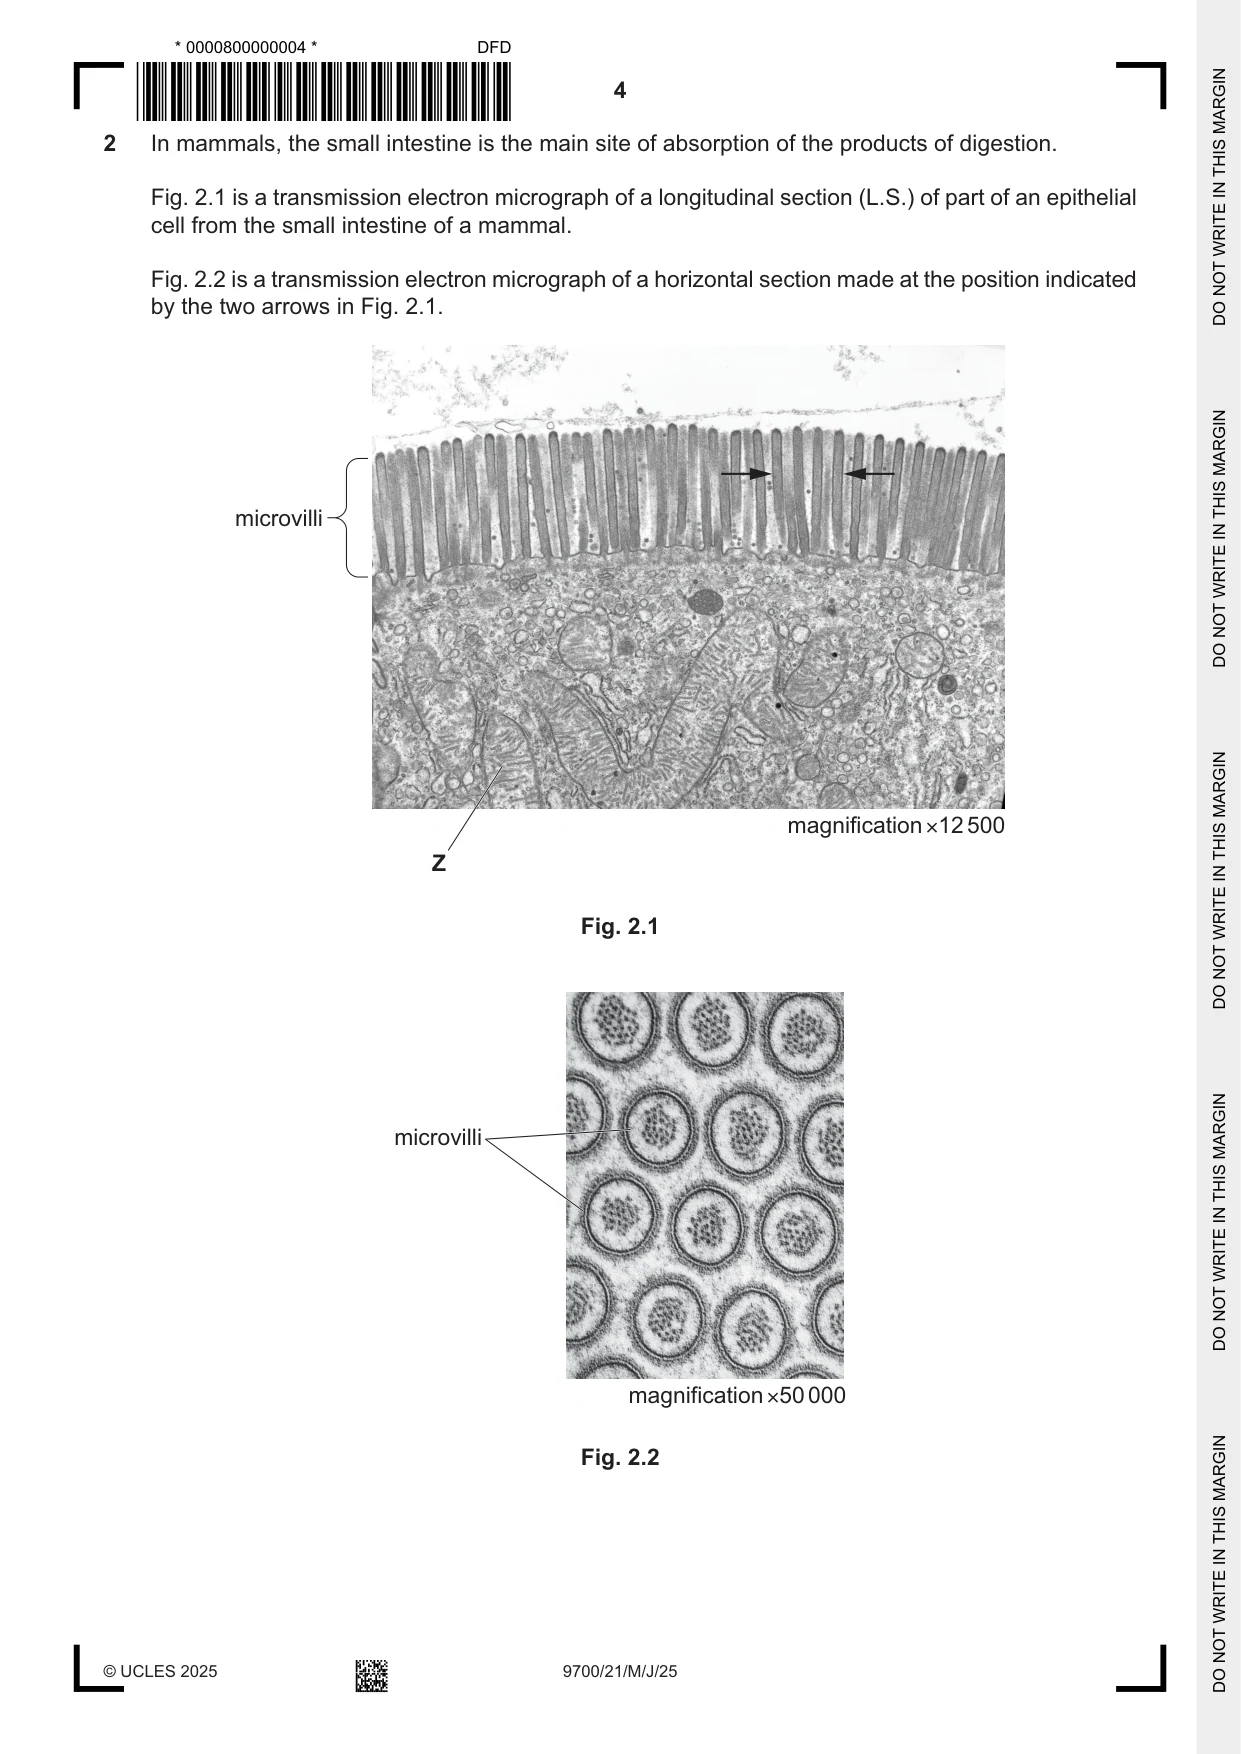
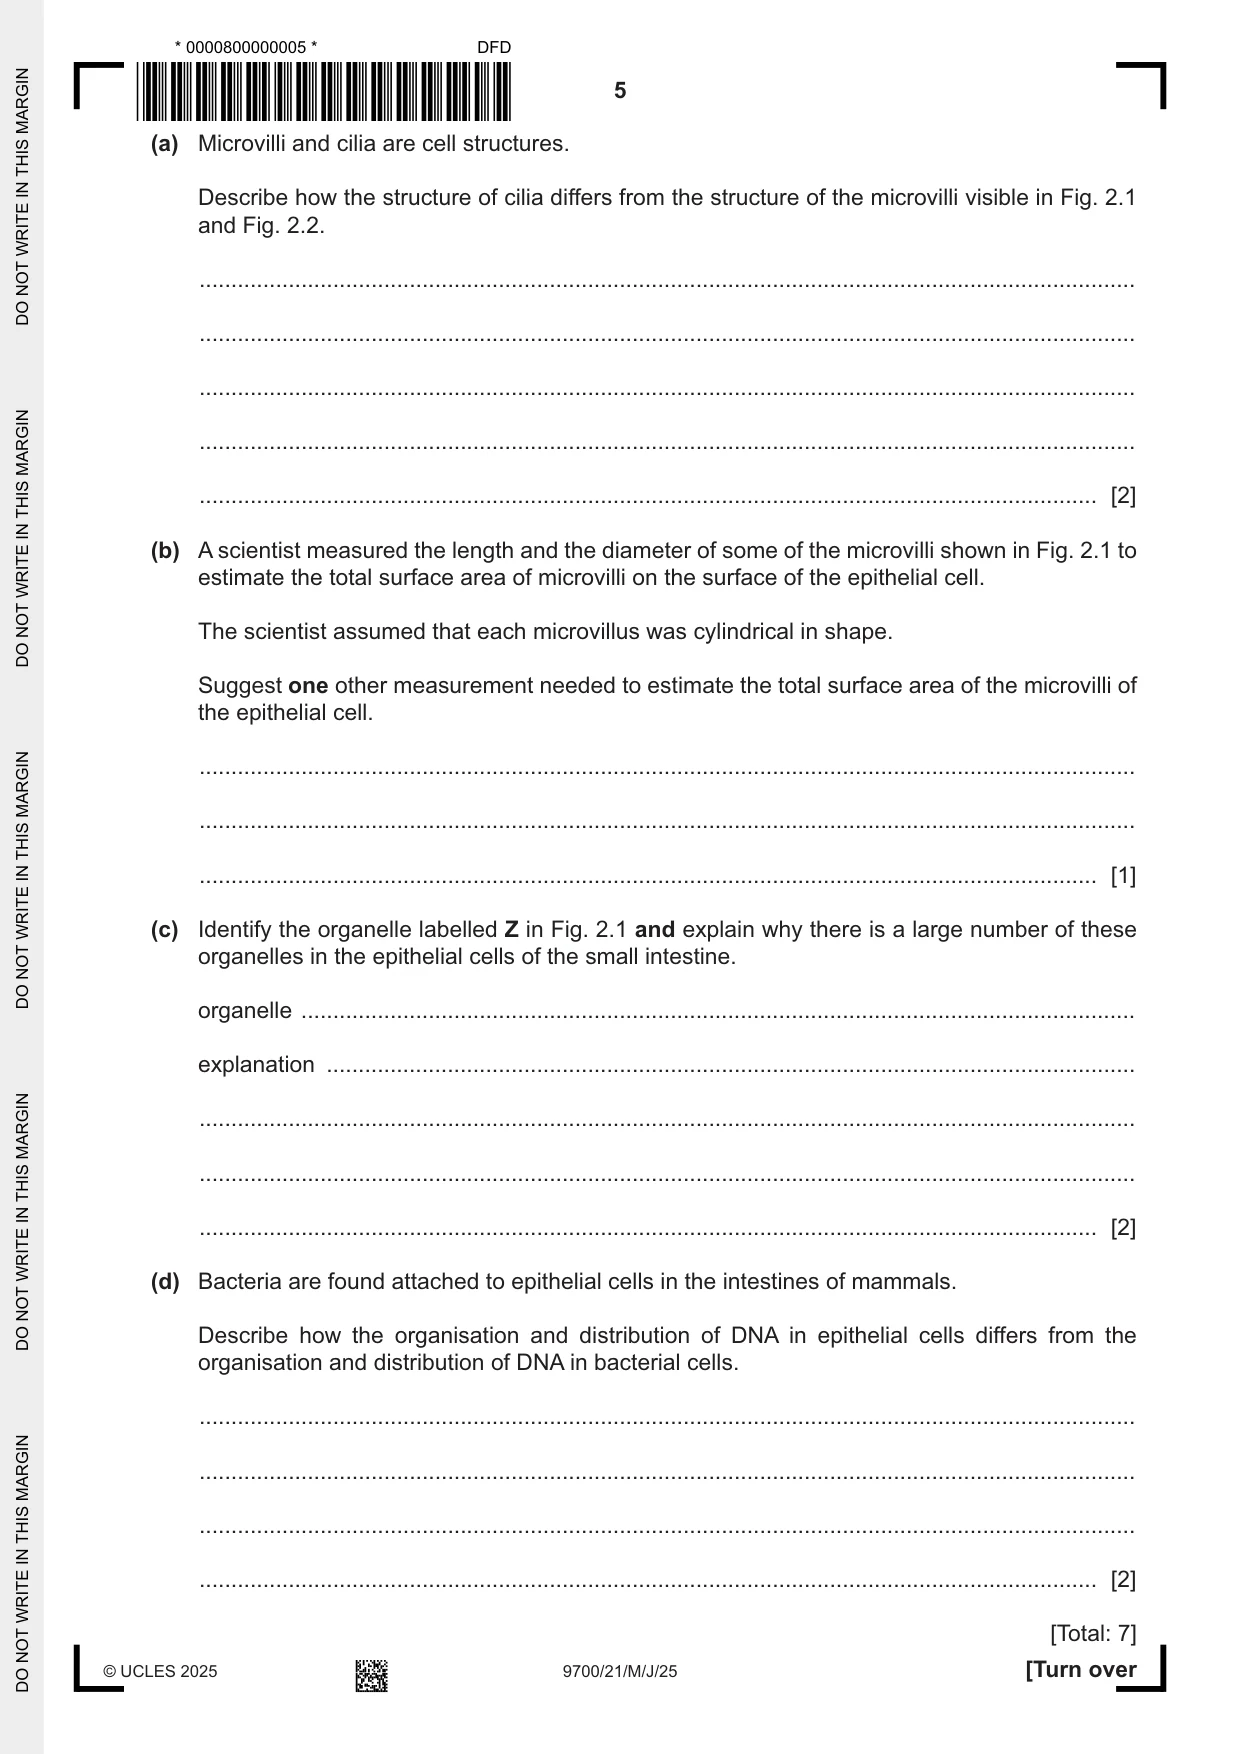
2 In mammals, the small intestine is the main site of absorption of the products of digestion. Fig. 2.1 is a transmission electron micrograph of a longitudinal section (L.S.) of part of an epithelial cell from the small intestine of a mammal. Fig. 2.2 is a transmission electron micrograph of a horizontal section made at the position indicated by the two arrows in Fig. 2.1. microvilli magnification ×12 500 Z Fig. 2.1 microvilli magnification ×50 000 Fig. 2.2 (a) Microvilli and cilia are cell structures. Describe how the structure of cilia differs from the structure of the microvilli visible in Fig. 2.1 and Fig. 2.2. ................................................................................................................................................... ................................................................................................................................................... ................................................................................................................................................... ................................................................................................................................................... ............................................................................................................................................. [2] (b) A scientist measured the length and the diameter of some of the microvilli shown in Fig. 2.1 to estimate the total surface area of microvilli on the surface of the epithelial cell. The scientist assumed that each microvillus was cylindrical in shape. Suggest one other measurement needed to estimate the total surface area of the microvilli of the epithelial cell. ................................................................................................................................................... ................................................................................................................................................... ............................................................................................................................................. [1] (c) Identify the organelle labelled Z in Fig. 2.1 and explain why there is a large number of these organelles in the epithelial cells of the small intestine. organelle ................................................................................................................................... explanation ............................................................................................................................... ................................................................................................................................................... ................................................................................................................................................... ............................................................................................................................................. [2] (d) Bacteria are found attached to epithelial cells in the intestines of mammals. Describe how the organisation and distribution of DNA in epithelial cells differs from the organisation and distribution of DNA in bacterial cells. ................................................................................................................................................... ................................................................................................................................................... ................................................................................................................................................... ............................................................................................................................................. [2] [Total: 7]
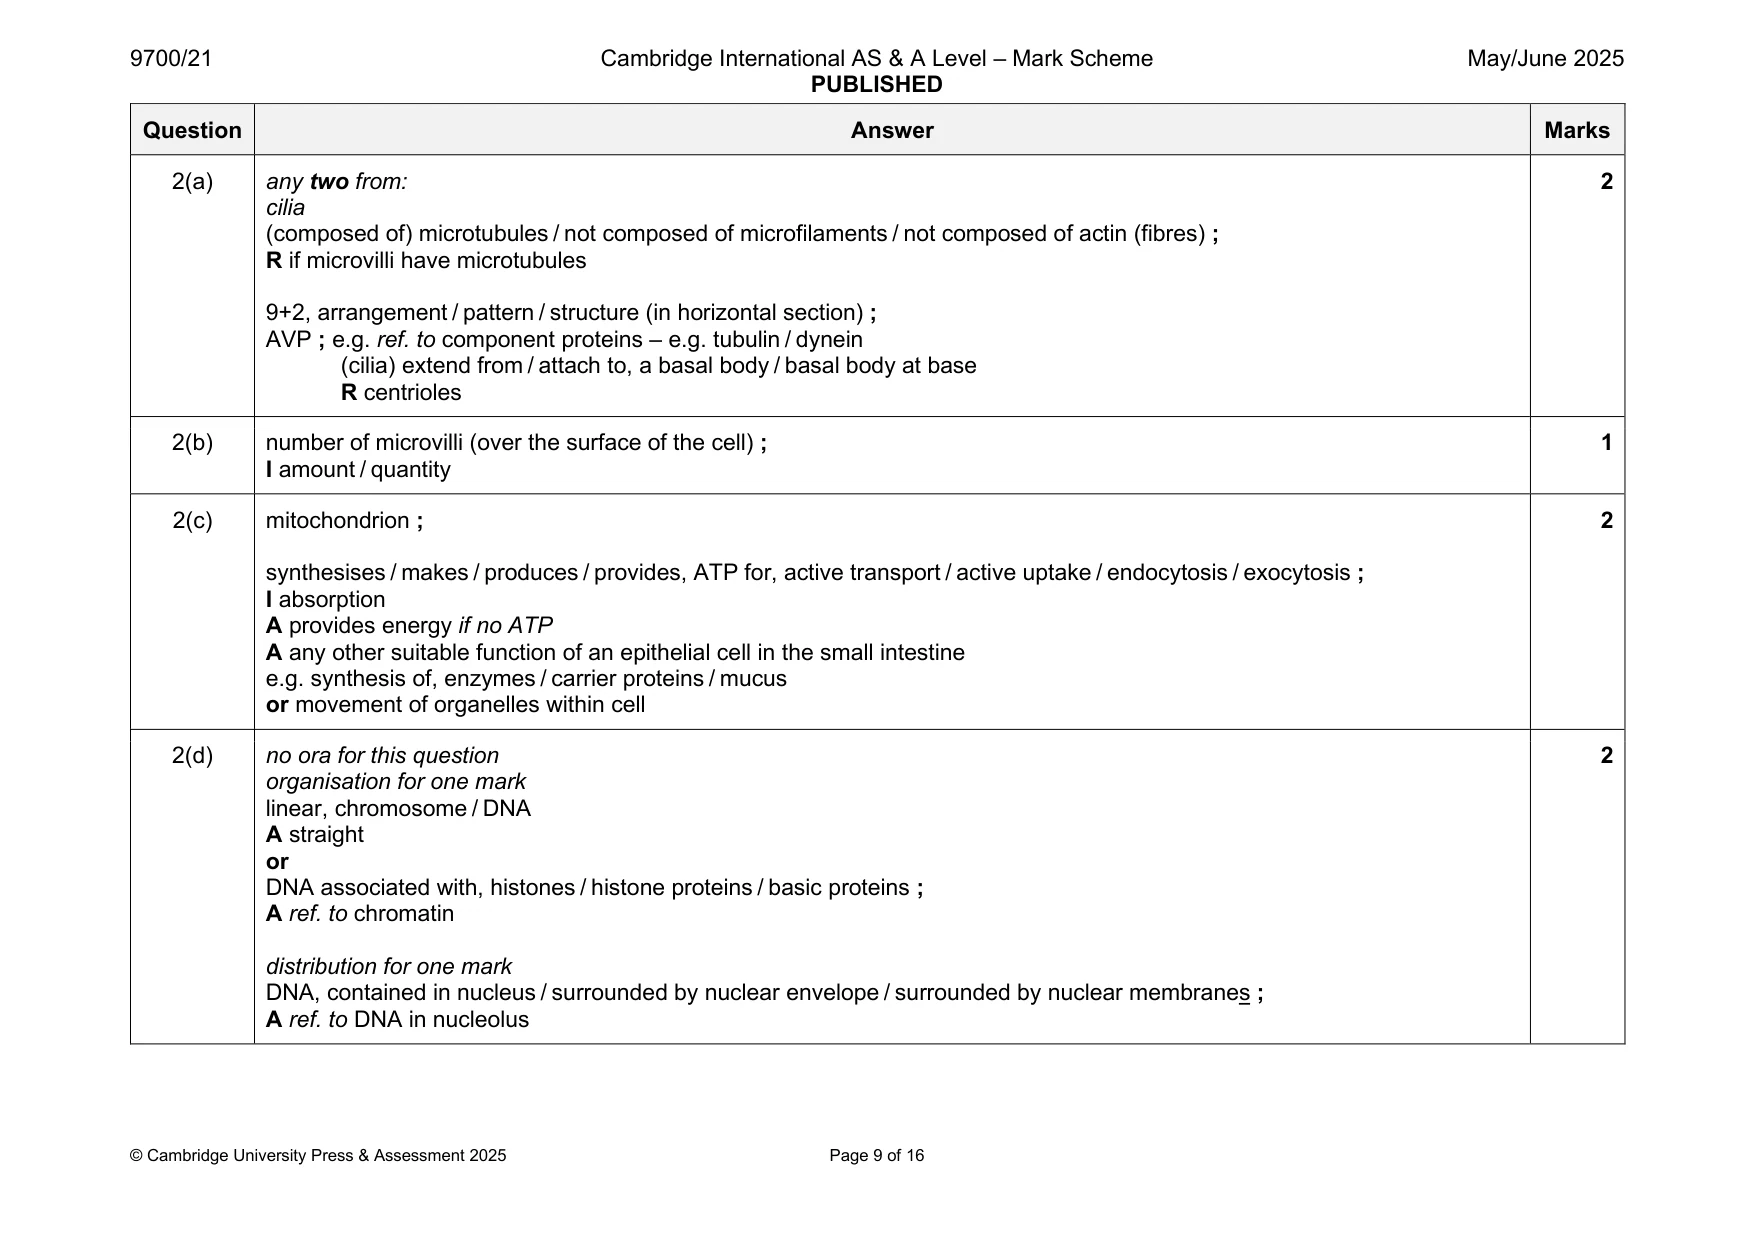
Mark scheme: 2(a) any two from: 2 cilia (composed of) microtubules / not composed of microfilaments / not composed of actin (fibres) ; R if microvilli have microtubules 9+2, arrangement / pattern / structure (in horizontal section) ; AVP ; e.g. ref. to component proteins – e.g. tubulin / dynein (cilia) extend from / attach to, a basal body / basal body at base R centrioles 2(b) number of microvilli (over the surface of the cell) ; 1 I amount / quantity 2(c) mitochondrion ; 2 synthesises / makes / produces / provides, ATP for, active transport / active uptake / endocytosis / exocytosis ; I absorption A provides energy if no ATP A any other suitable function of an epithelial cell in the small intestine e.g. synthesis of, enzymes / carrier proteins / mucus or movement of organelles within cell 2(d) no ora for this question 2 organisation for one mark linear, chromosome / DNA A straight or DNA associated with, histones / histone proteins / basic proteins ; A ref. to chromatin distribution for one mark DNA, contained in nucleus / surrounded by nuclear envelope / surrounded by nuclear membranes ; A ref. to DNA in nucleolus
More questions on Cells as the basic units of living organisms
Q3 · Scientists investigated the progress of reactions catalysed by two enzymes: dopa oxidase…
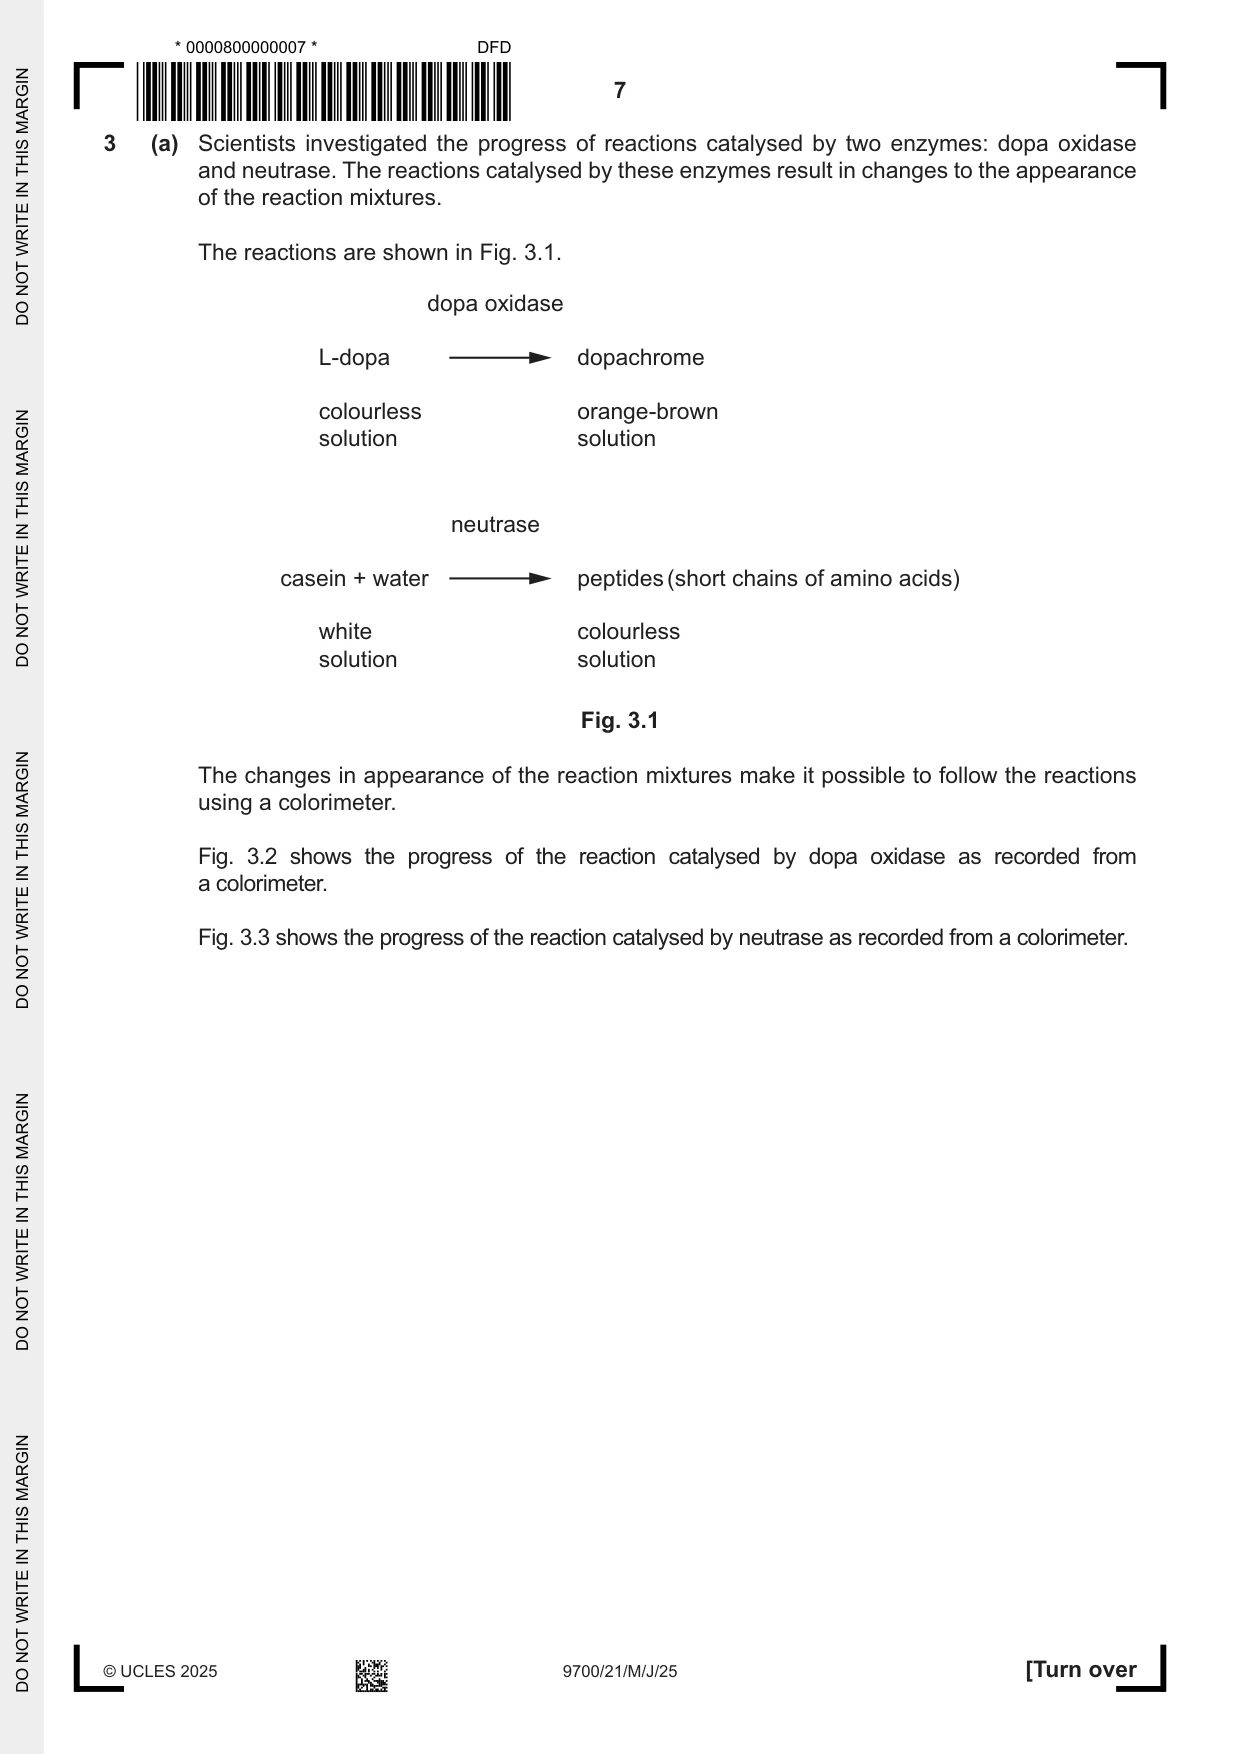
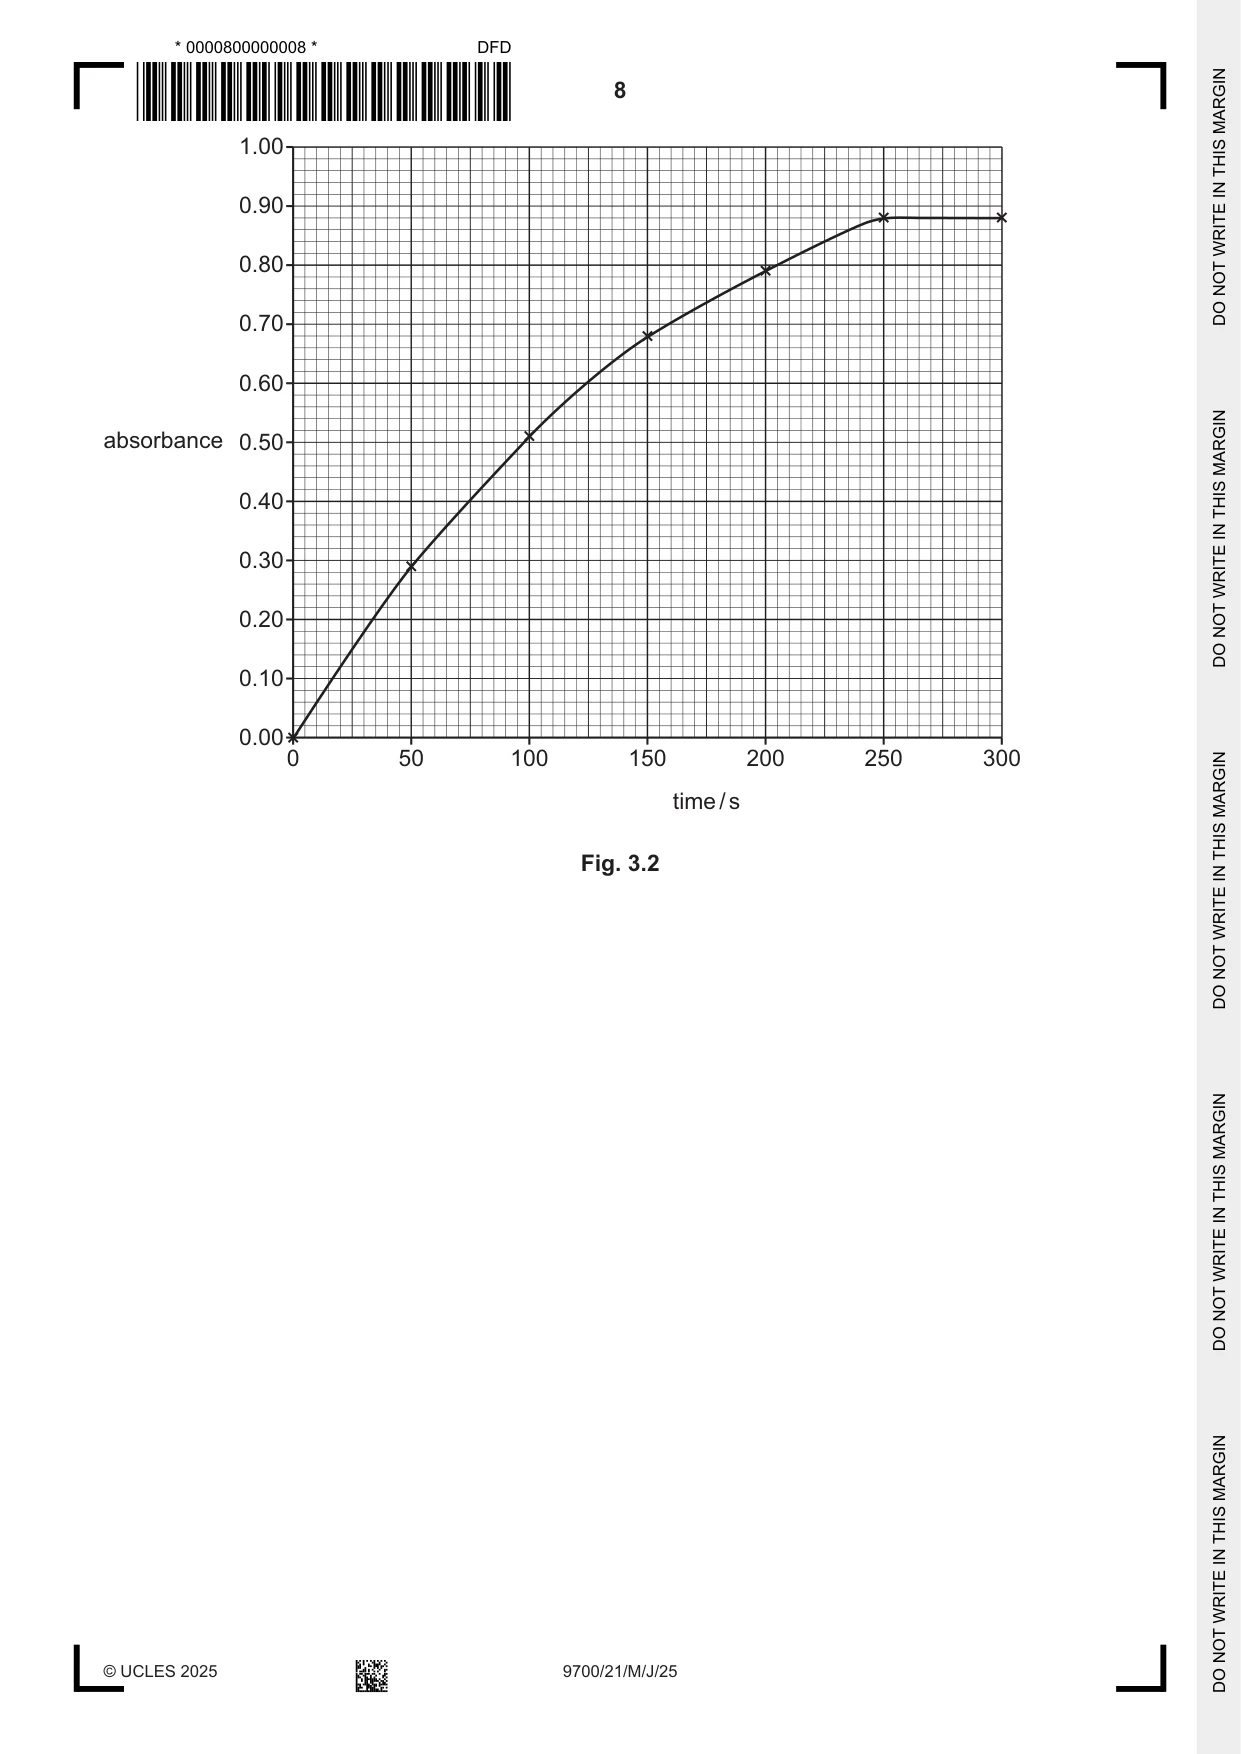
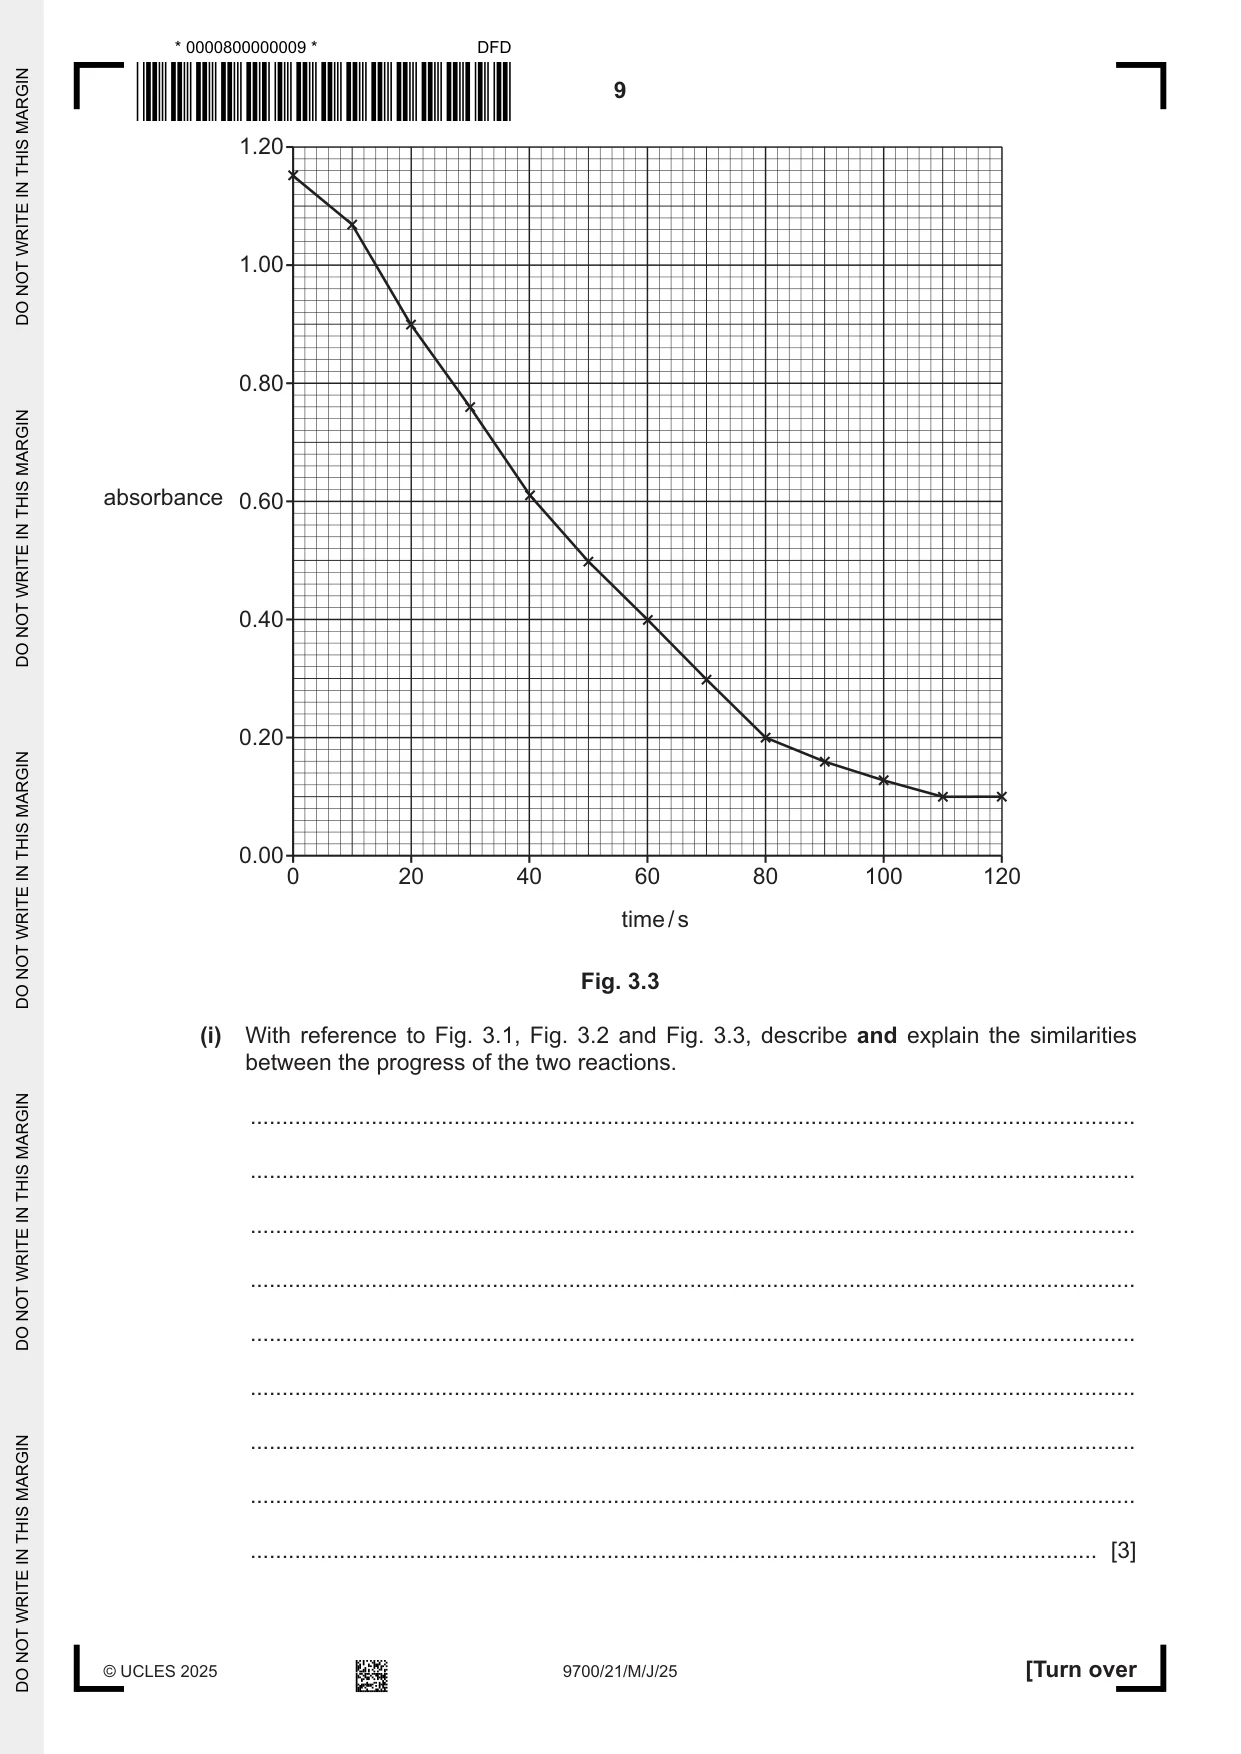
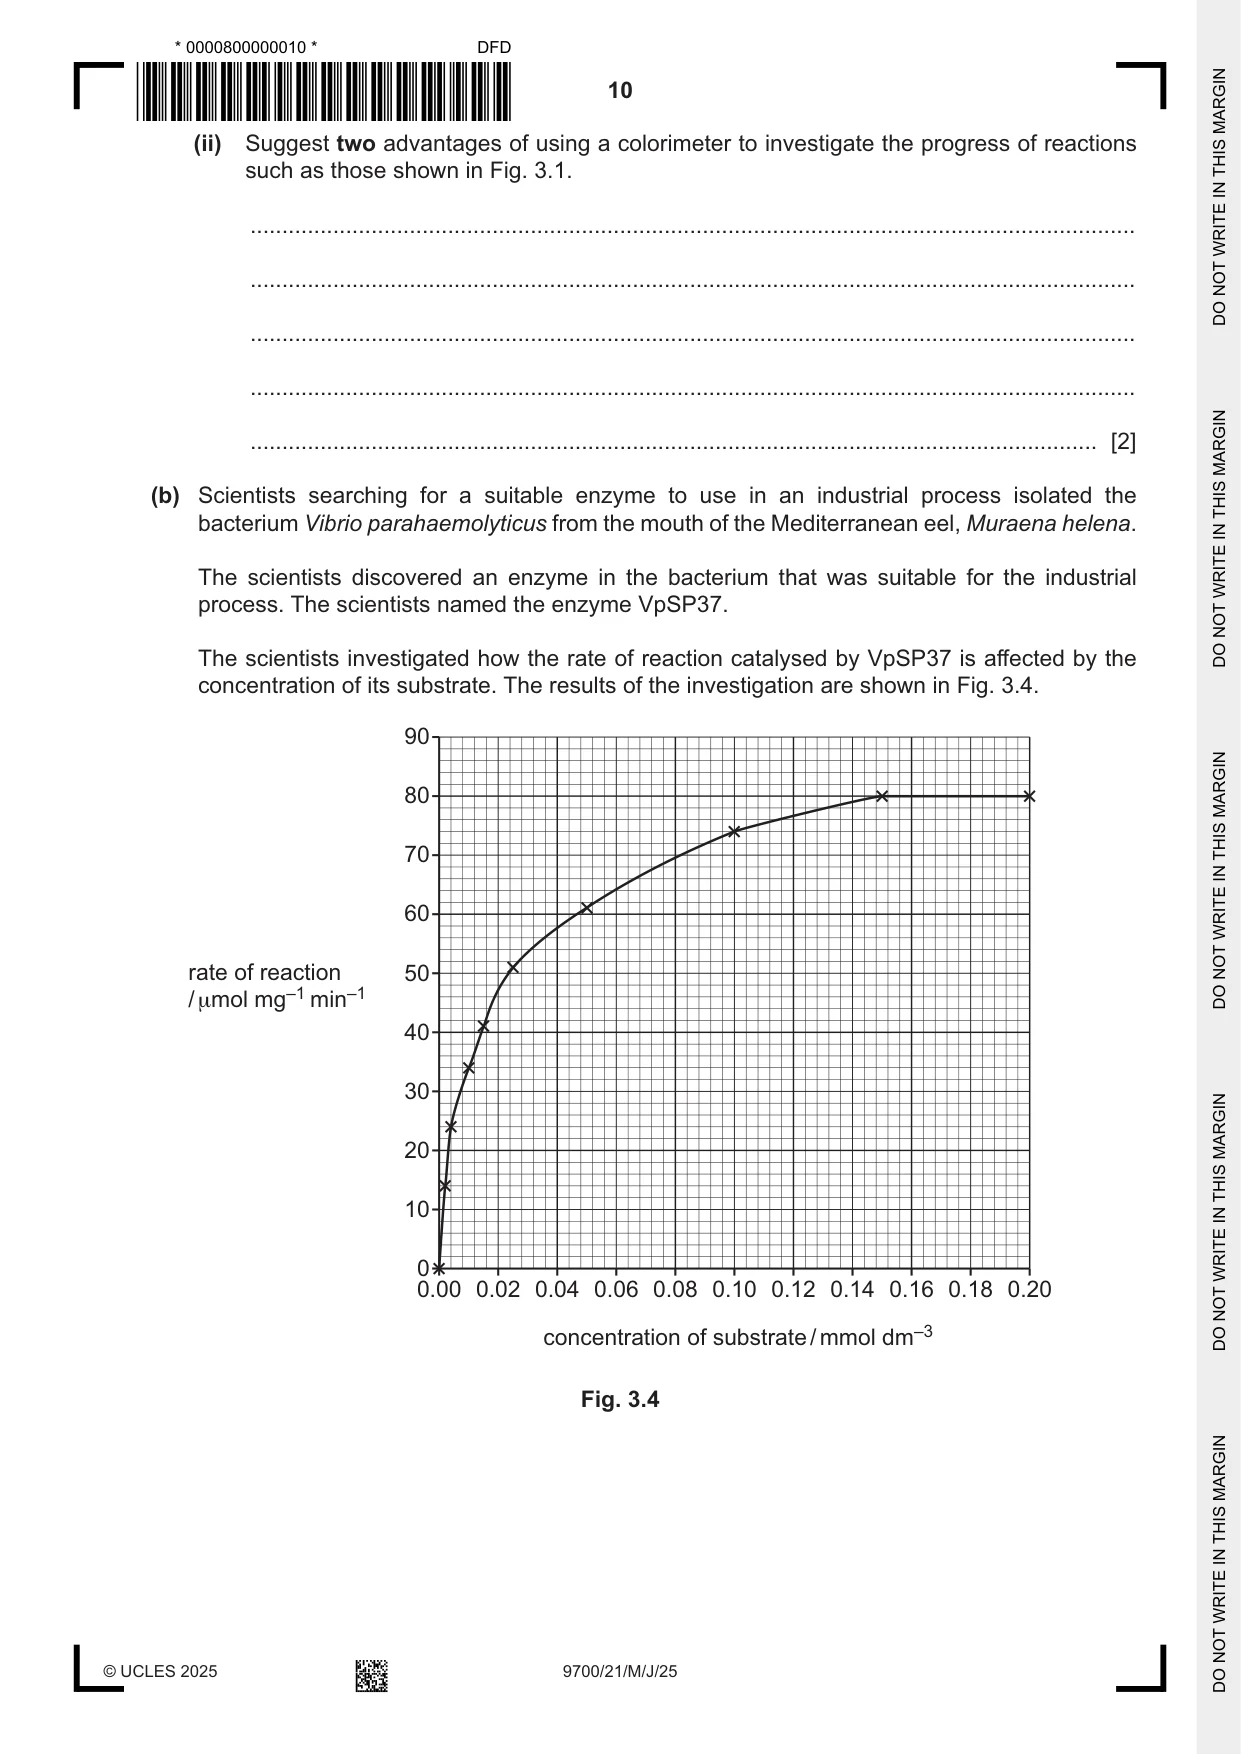
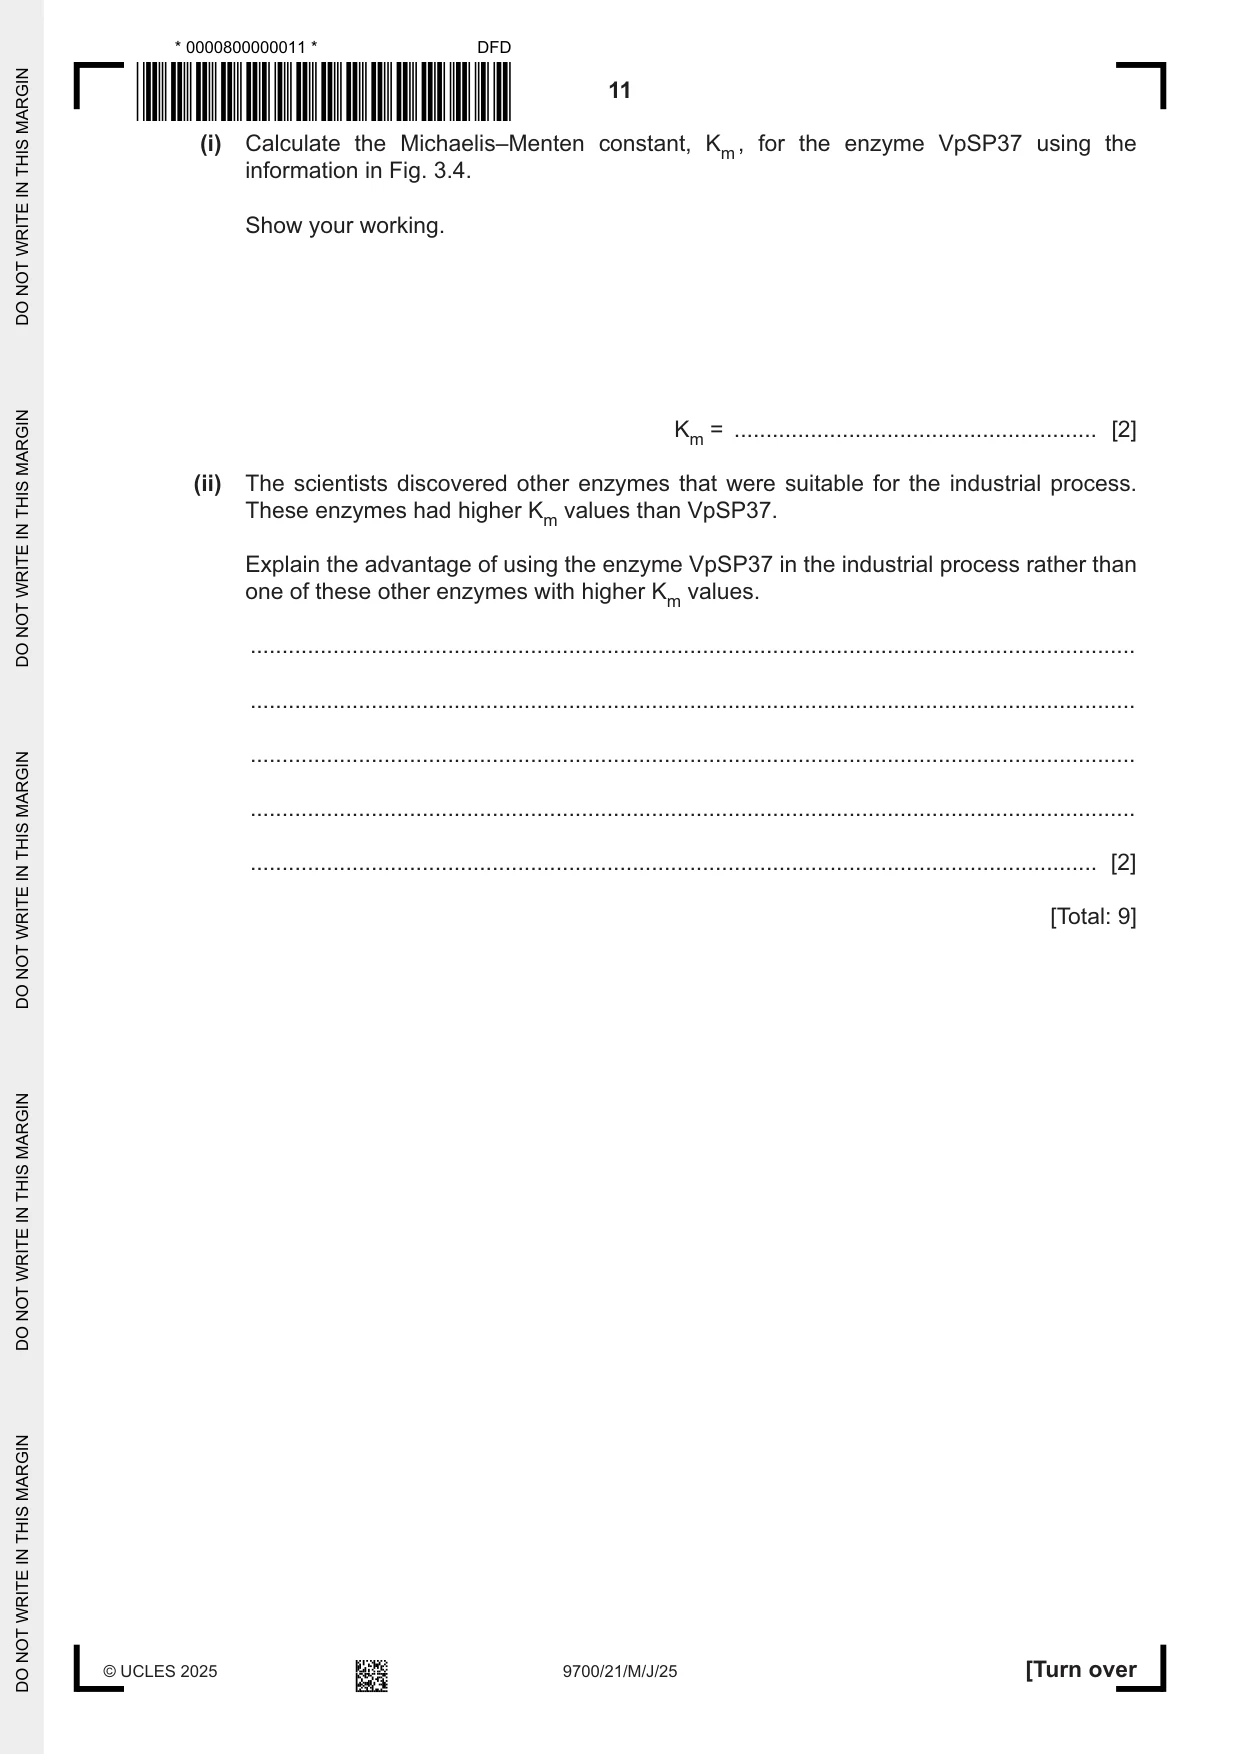
3 (a) Scientists investigated the progress of reactions catalysed by two enzymes: dopa oxidase and neutrase. The reactions catalysed by these enzymes result in changes to the appearance of the reaction mixtures. The reactions are shown in Fig. 3.1. dopa oxidase L-dopa dopachrome colourless orange-brown solution solution neutrase casein + water peptides (short chains of amino acids) white colourless solution solution Fig. 3.1 The changes in appearance of the reaction mixtures make it possible to follow the reactions using a colorimeter. Fig. 3.2 shows the progress of the reaction catalysed by dopa oxidase as recorded from a colorimeter. Fig. 3.3 shows the progress of the reaction catalysed by neutrase as recorded from a colorimeter. 1.00 0.90 0.80 0.70 0.60 absorbance 0.50 0.40 0.30 0.20 0.10 0.00 0 50 100 150 200 250 300 time / s Fig. 3.2 1.20 1.00 0.80 absorbance 0.60 0.40 0.20 0.00 0 20 40 60 80 100 120 time / s Fig. 3.3 (i) With reference to Fig. 3.1, Fig. 3.2 and Fig. 3.3, describe and explain the similarities between the progress of the two reactions. ........................................................................................................................................... ........................................................................................................................................... ........................................................................................................................................... ........................................................................................................................................... ........................................................................................................................................... ........................................................................................................................................... ........................................................................................................................................... ........................................................................................................................................... ..................................................................................................................................... [3] (ii) Suggest two advantages of using a colorimeter to investigate the progress of reactions such as those shown in Fig. 3.1. ........................................................................................................................................... ........................................................................................................................................... ........................................................................................................................................... ........................................................................................................................................... ..................................................................................................................................... [2] (b) Scientists searching for a suitable enzyme to use in an industrial process isolated the bacterium Vibrio parahaemolyticus from the mouth of the Mediterranean eel, Muraena helena. The scientists discovered an enzyme in the bacterium that was suitable for the industrial process. The scientists named the enzyme VpSP37. The scientists investigated how the rate of reaction catalysed by VpSP37 is affected by the concentration of its substrate. The results of the investigation are shown in Fig. 3.4. 90 80 70 60 rate of reaction 50 / μmol mg–1 min–1 40 30 20 10 0 0.00 0.02 0.04 0.06 0.08 0.10 0.12 0.14 0.16 0.18 0.20 concentration of substrate / mmol dm–3 Fig. 3.4 (i) Calculate the Michaelis–Menten constant, Km , for the enzyme VpSP37 using the information in Fig. 3.4. Show your working. Km = ......................................................... [2] (ii) The scientists discovered other enzymes that were suitable for the industrial process. These enzymes had higher Km values than VpSP37. Explain the advantage of using the enzyme VpSP37 in the industrial process rather than one of these other enzymes with higher Km values. ........................................................................................................................................... ........................................................................................................................................... ........................................................................................................................................... ........................................................................................................................................... ..................................................................................................................................... [2] [Total: 9]
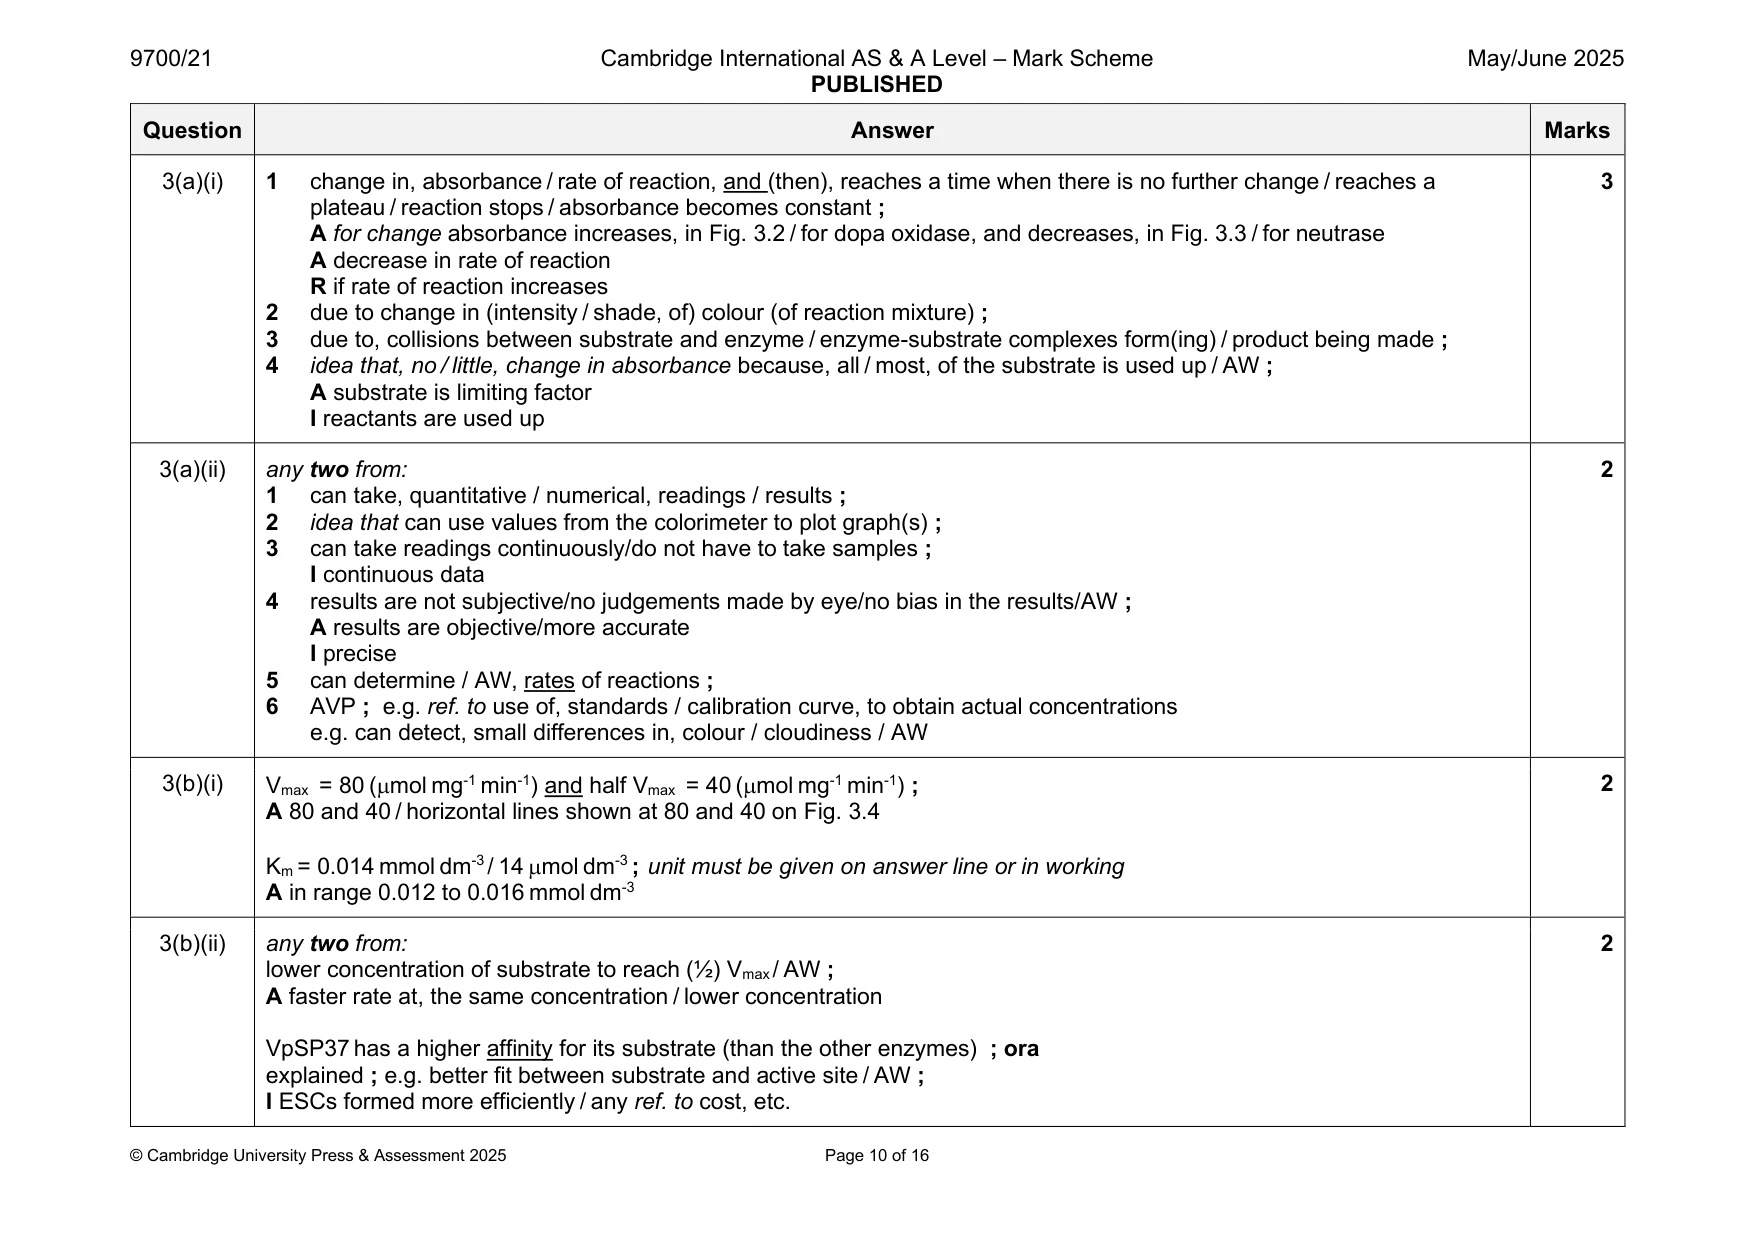
Mark scheme: 3(a)(i) 1 change in, absorbance / rate of reaction, and (then), reaches a time when there is no further change / reaches a 3 plateau / reaction stops / absorbance becomes constant ; A for change absorbance increases, in Fig. 3.2 / for dopa oxidase, and decreases, in Fig. 3.3 / for neutrase A decrease in rate of reaction R if rate of reaction increases 2 due to change in (intensity / shade, of) colour (of reaction mixture) ; 3 due to, collisions between substrate and enzyme / enzyme-substrate complexes form(ing) / product being made ; 4 idea that, no / little, change in absorbance because, all / most, of the substrate is used up / AW ; A substrate is limiting factor I reactants are used up 3(a)(ii) any two from: 2 1 can take, quantitative / numerical, readings / results ; 2 idea that can use values from the colorimeter to plot graph(s) ; 3 can take readings continuously/do not have to take samples ; I continuous data 4 results are not subjective/no judgements made by eye/no bias in the results/AW ; A results are objective/more accurate I precise 5 can determine / AW, rates of reactions ; 6 AVP ; e.g. ref. to use of, standards / calibration curve, to obtain actual concentrations e.g. can detect, small differences in, colour / cloudiness / AW 3(b)(i) Vmax = 80 (mol mg-1 min-1) and half Vmax = 40 (mol mg-1 min-1) ; 2 A 80 and 40 / horizontal lines shown at 80 and 40 on Fig. 3.4 Km = 0.014 mmol dm-3 / 14 mol dm-3 ; unit must be given on answer line or in working A in range 0.012 to 0.016 mmol dm-3 3(b)(ii) any two from: 2 lower concentration of substrate to reach (½) Vmax / AW ; A faster rate at, the same concentration / lower concentration VpSP37 has a higher affinity for its substrate (than the other enzymes) ; ora explained ; e.g. better fit between substrate and active site / AW ; I ESCs formed more efficiently / any ref. to cost, etc.
Q4 · Cells of the immune system have cell surface receptors that detect molecules made by…
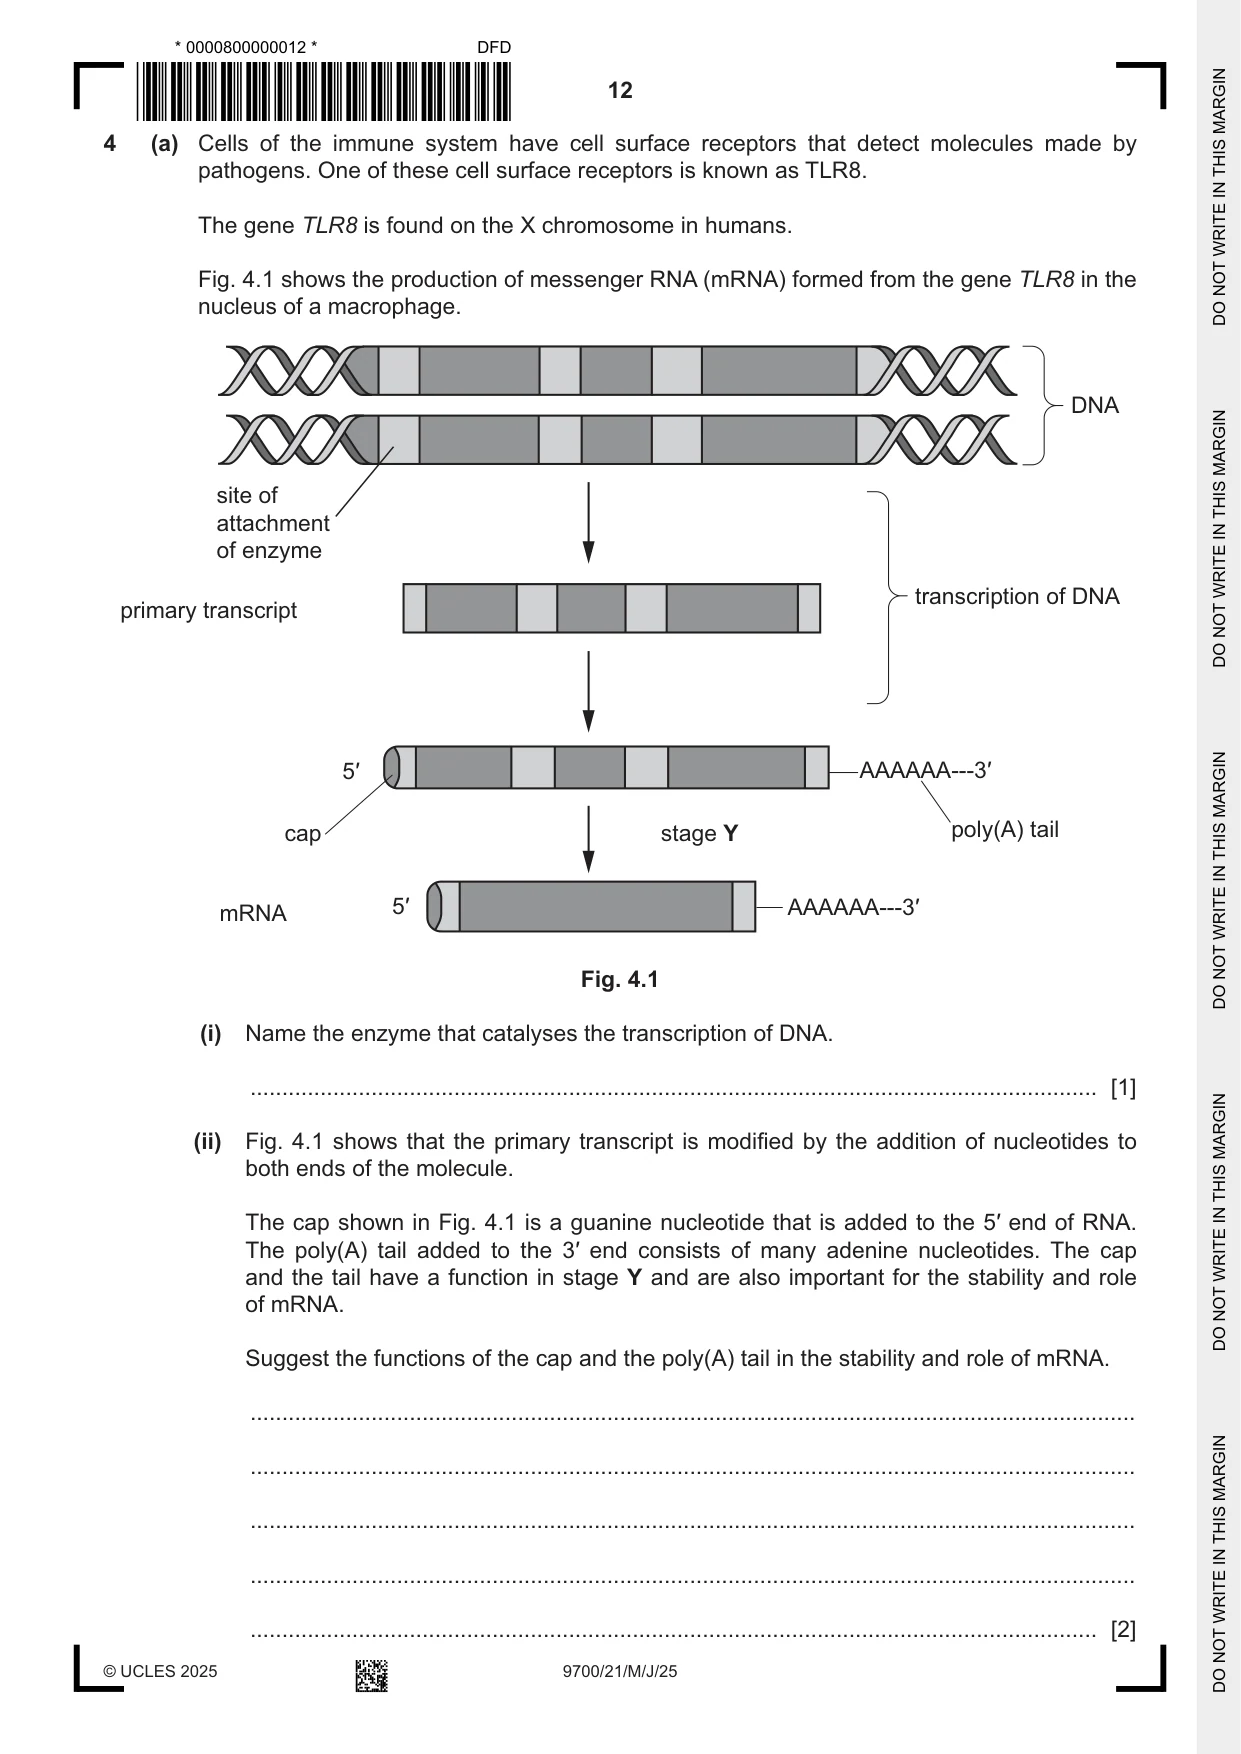
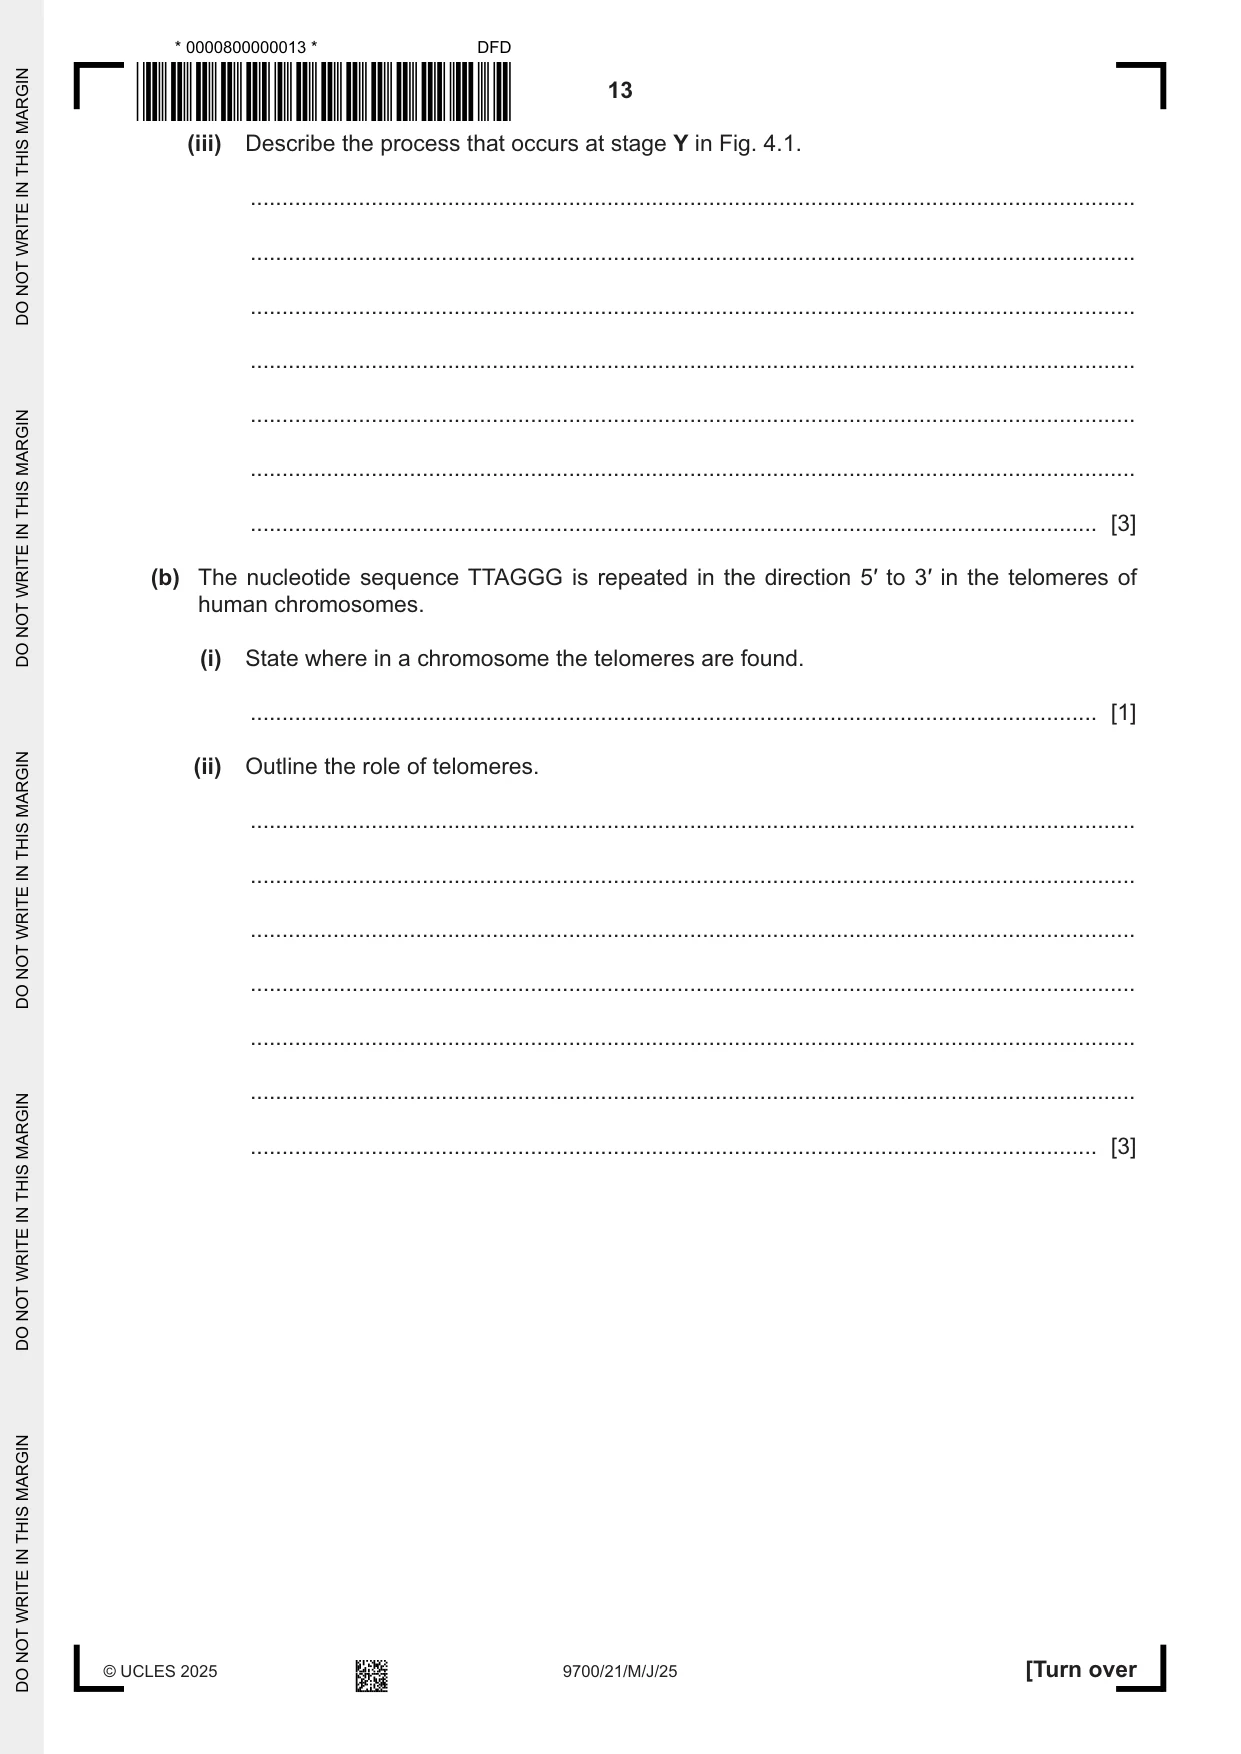
4 (a) Cells of the immune system have cell surface receptors that detect molecules made by pathogens. One of these cell surface receptors is known as TLR8. The gene TLR8 is found on the X chromosome in humans. Fig. 4.1 shows the production of messenger RNA (mRNA) formed from the gene TLR8 in the nucleus of a macrophage. DNA site of attachment of enzyme transcription of DNA primary transcript 5′ AAAAAA---3′ cap stage Y poly(A) tail 5′ AAAAAA---3′ mRNA Fig. 4.1 (i) Name the enzyme that catalyses the transcription of DNA. ..................................................................................................................................... [1] (ii) Fig. 4.1 shows that the primary transcript is modified by the addition of nucleotides to both ends of the molecule. The cap shown in Fig. 4.1 is a guanine nucleotide that is added to the 5′ end of RNA. The poly(A) tail added to the 3′ end consists of many adenine nucleotides. The cap and the tail have a function in stage Y and are also important for the stability and role of mRNA. Suggest the functions of the cap and the poly(A) tail in the stability and role of mRNA. ........................................................................................................................................... ........................................................................................................................................... ........................................................................................................................................... ........................................................................................................................................... ..................................................................................................................................... [2] (iii) Describe the process that occurs at stage Y in Fig. 4.1. ........................................................................................................................................... ........................................................................................................................................... ........................................................................................................................................... ........................................................................................................................................... ........................................................................................................................................... ........................................................................................................................................... ..................................................................................................................................... [3] (b) The nucleotide sequence TTAGGG is repeated in the direction 5′ to 3′ in the telomeres of human chromosomes. (i) State where in a chromosome the telomeres are found. ..................................................................................................................................... [1] (ii) Outline the role of telomeres. ........................................................................................................................................... ........................................................................................................................................... ........................................................................................................................................... ........................................................................................................................................... ........................................................................................................................................... ........................................................................................................................................... ..................................................................................................................................... [3] (c) Melanoma is a type of tumour that develops from pigment-producing skin cells known as melanocytes. Outline how a tumour may form from a melanocyte. ................................................................................................................................................... ................................................................................................................................................... ................................................................................................................................................... ................................................................................................................................................... ................................................................................................................................................... ................................................................................................................................................... ................................................................................................................................................... ................................................................................................................................................... ............................................................................................................................................. [4] (d) A melanoma tumour is cancerous and may spread to other parts of the body. T-vec is a new drug that has been developed to treat melanoma that has spread to other parts of the body, including lymph nodes. T-vec contains a virus that infects some of the melanoma cells, causing the cells to burst and release their contents. Some of the contents of the melanoma cells act as cytokines and others act as antigens. Explain the effects of the cytokines and antigens released from melanoma cells in stimulating the immune system to destroy the cancerous cells. ................................................................................................................................................... ................................................................................................................................................... ................................................................................................................................................... ................................................................................................................................................... ................................................................................................................................................... ................................................................................................................................................... ................................................................................................................................................... ................................................................................................................................................... ................................................................................................................................................... ................................................................................................................................................... ............................................................................................................................................. [5] [Total: 19] Question 5 starts on page 16.
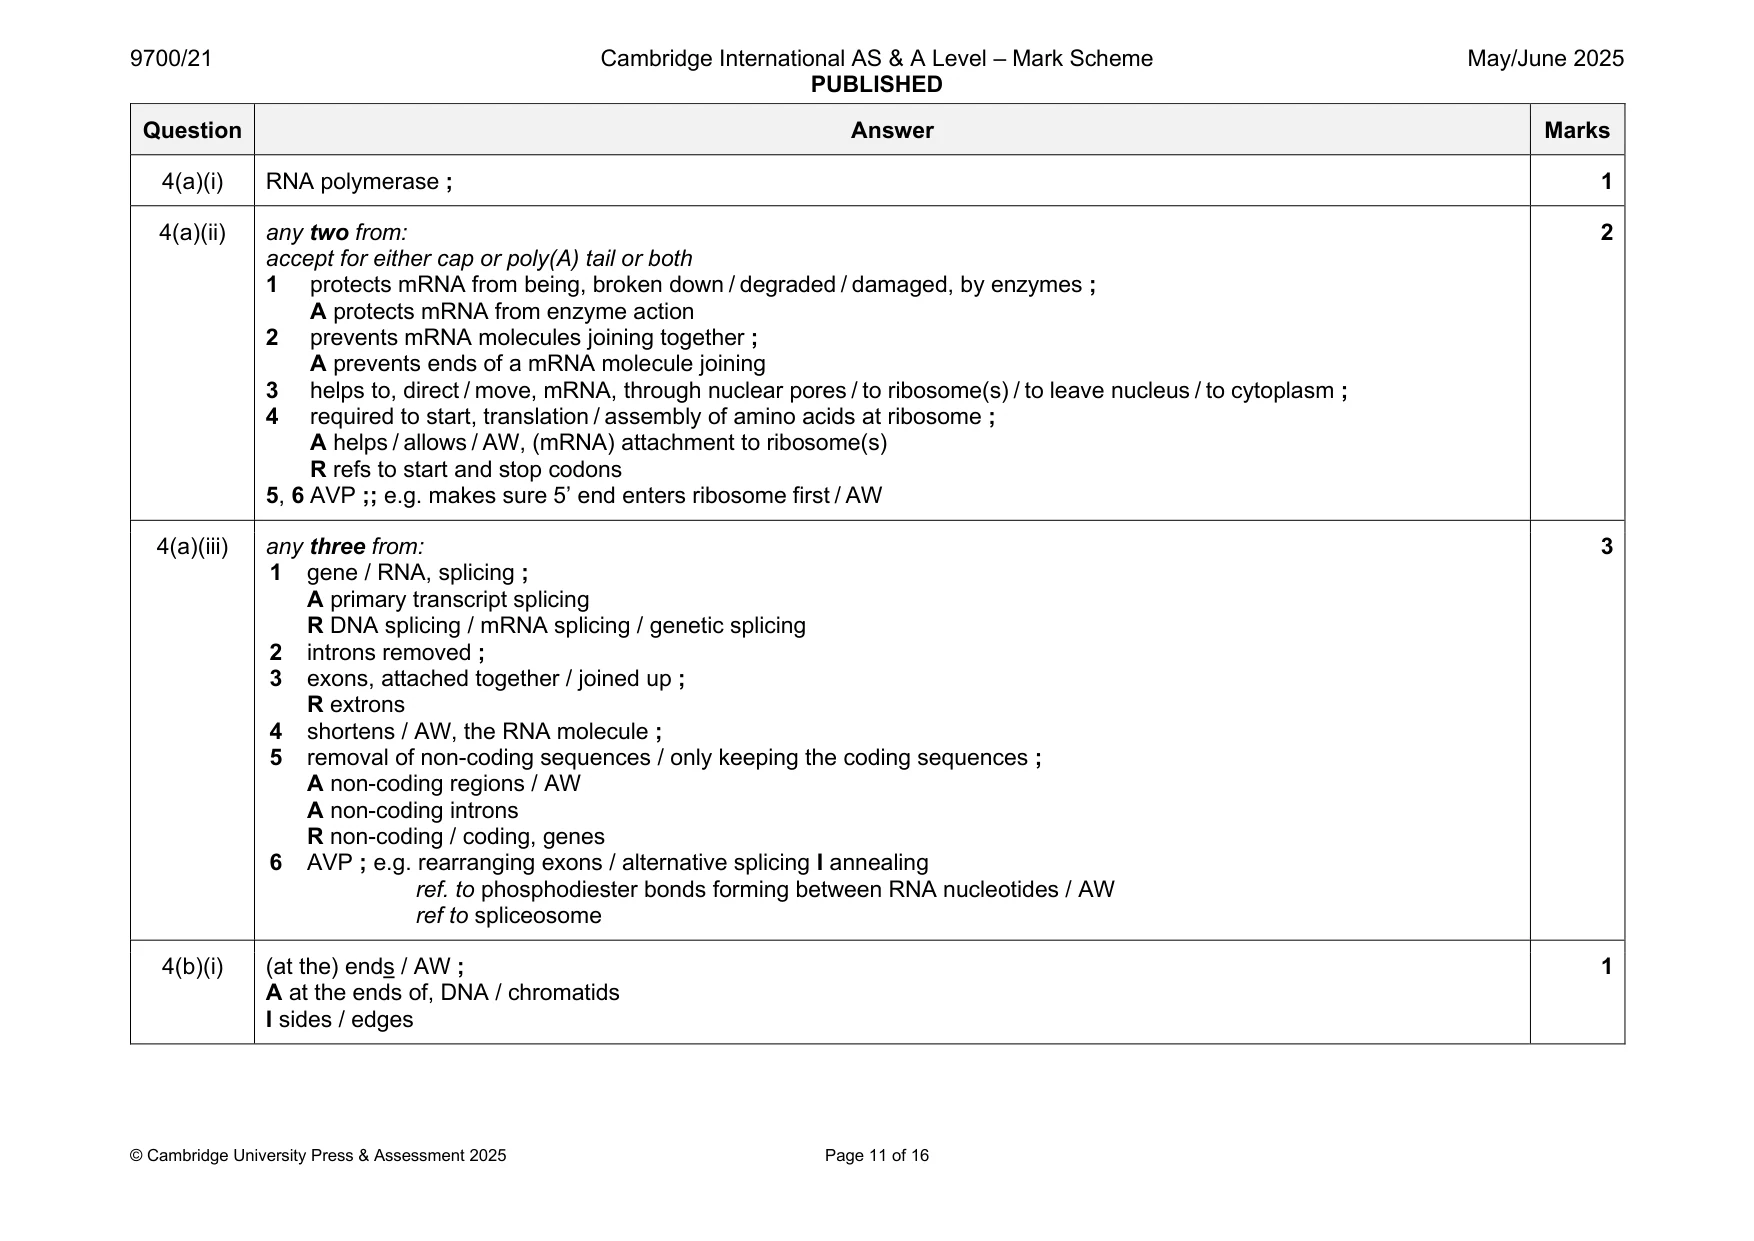
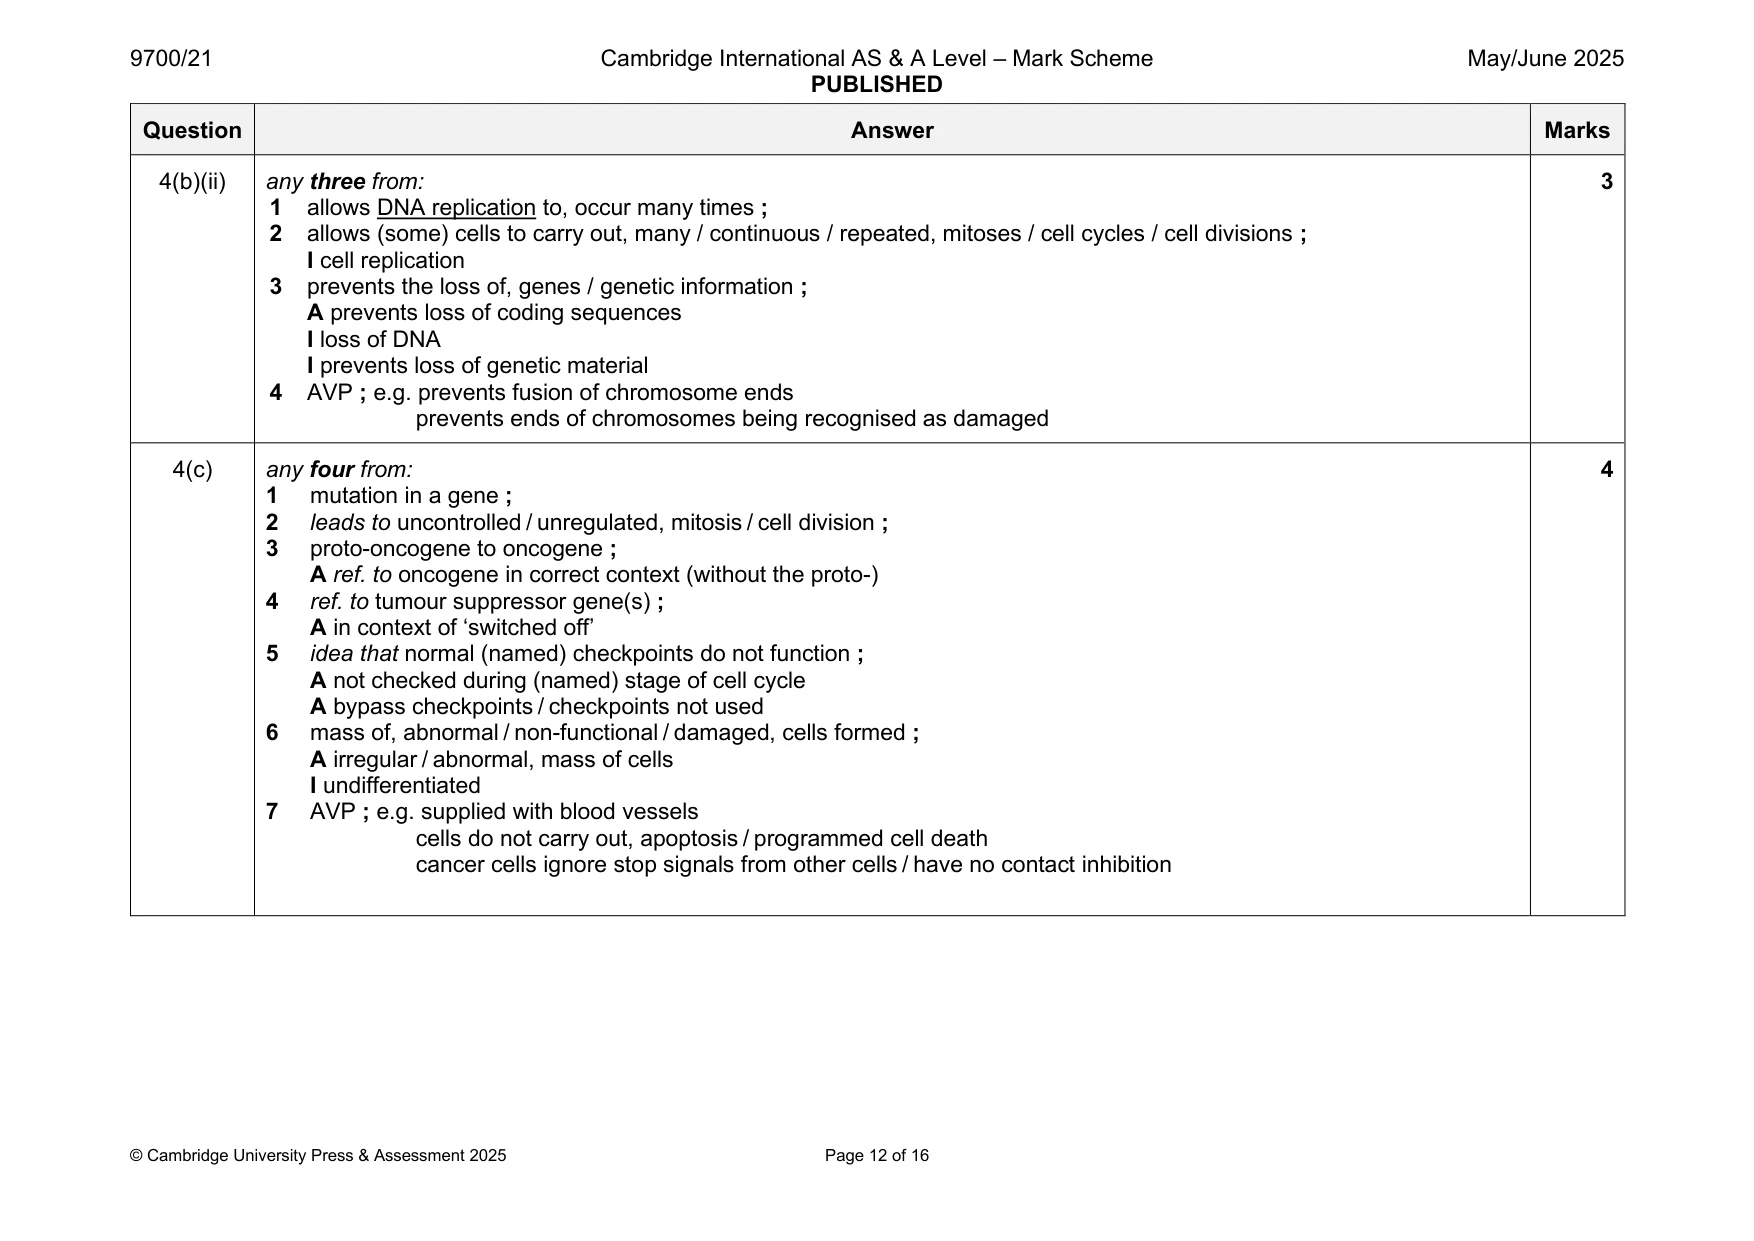
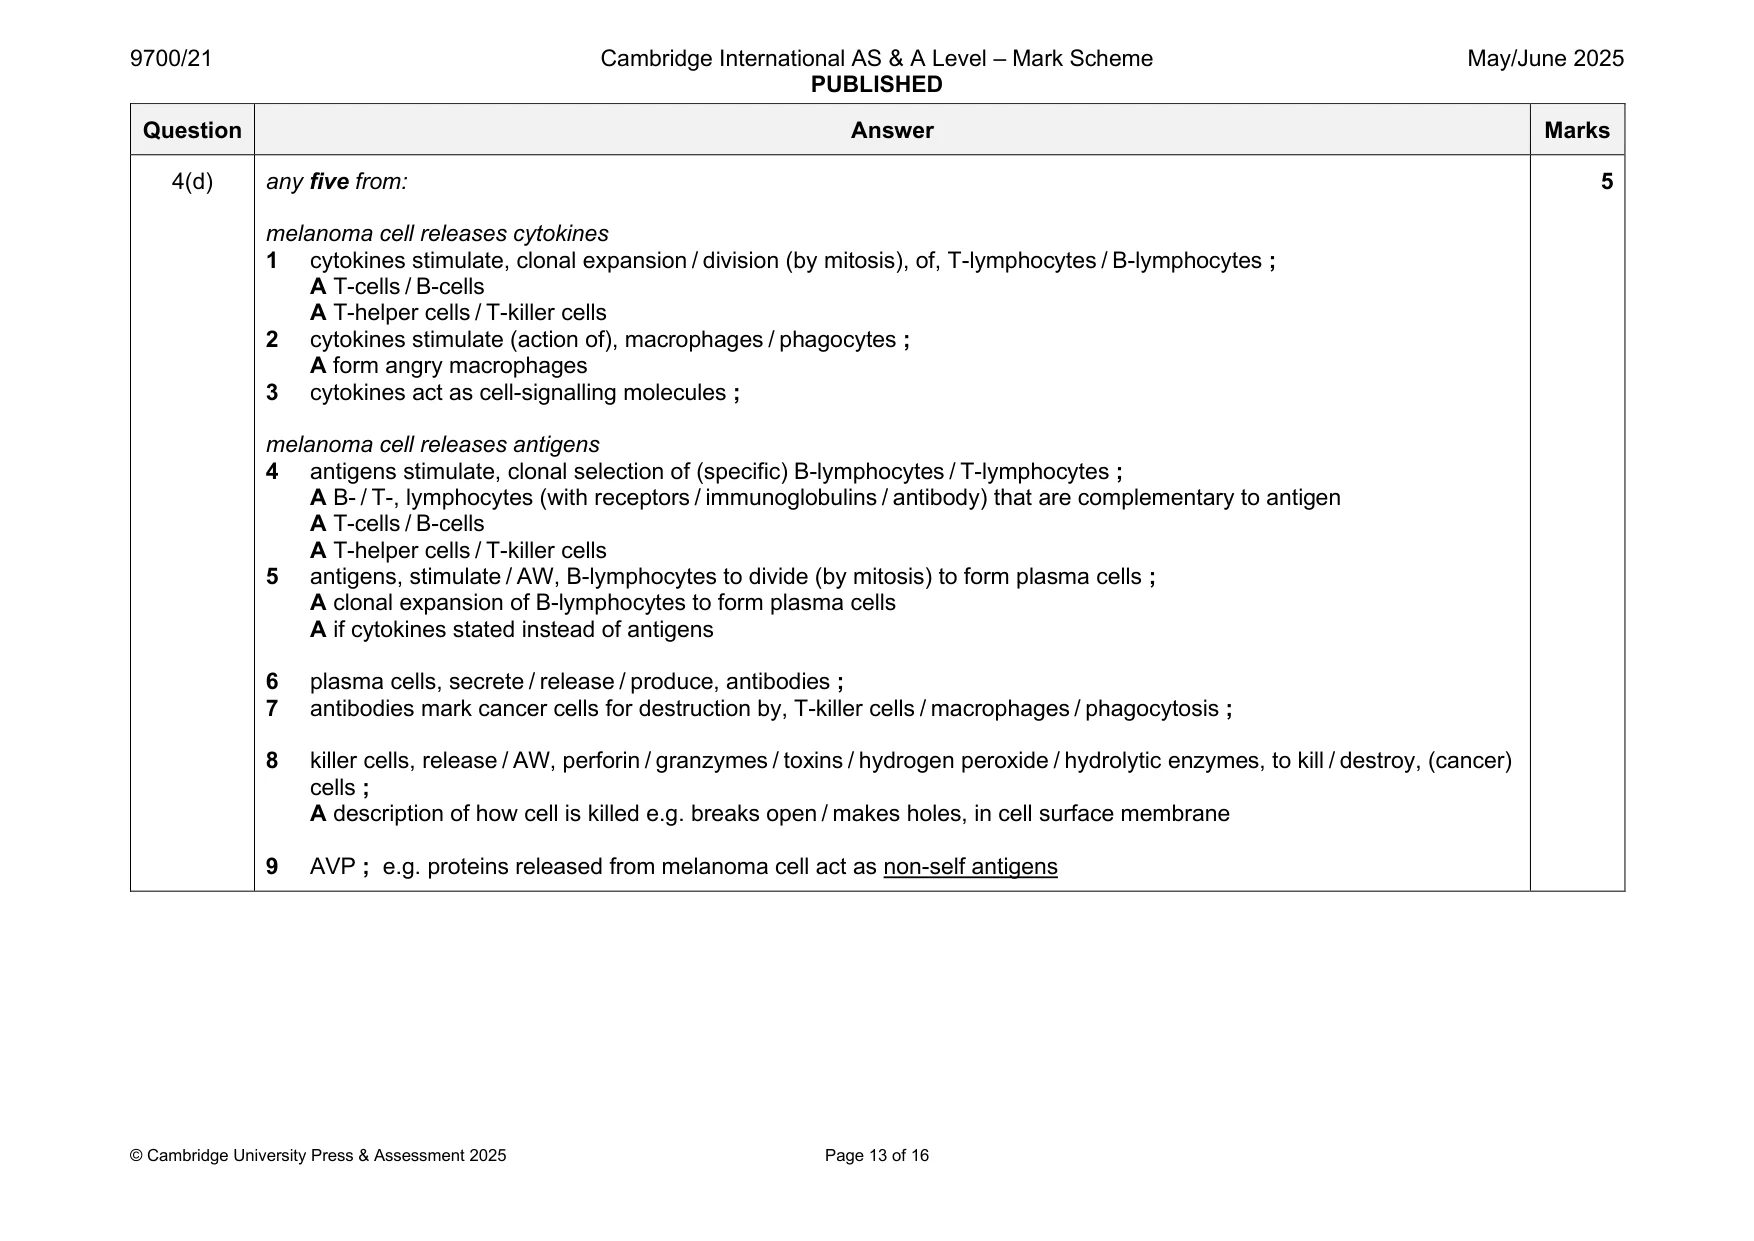
Mark scheme: 4(a)(i) RNA polymerase ; 1 4(a)(ii) any two from: 2 accept for either cap or poly(A) tail or both 1 protects mRNA from being, broken down / degraded / damaged, by enzymes ; A protects mRNA from enzyme action 2 prevents mRNA molecules joining together ; A prevents ends of a mRNA molecule joining 3 helps to, direct / move, mRNA, through nuclear pores / to ribosome(s) / to leave nucleus / to cytoplasm ; 4 required to start, translation / assembly of amino acids at ribosome ; A helps / allows / AW, (mRNA) attachment to ribosome(s) R refs to start and stop codons 5, 6 AVP ;; e.g. makes sure 5’ end enters ribosome first / AW 4(a)(iii) any three from: 3 1 gene / RNA, splicing ; A primary transcript splicing R DNA splicing / mRNA splicing / genetic splicing 2 introns removed ; 3 exons, attached together / joined up ; R extrons 4 shortens / AW, the RNA molecule ; 5 removal of non-coding sequences / only keeping the coding sequences ; A non-coding regions / AW A non-coding introns R non-coding / coding, genes 6 AVP ; e.g. rearranging exons / alternative splicing I annealing ref. to phosphodiester bonds forming between RNA nucleotides / AW ref to spliceosome 4(b)(i) (at the) ends / AW ; 1 A at the ends of, DNA / chromatids I sides / edges 4(b)(ii) any three from: 3 1 allows DNA replication to, occur many times ; 2 allows (some) cells to carry out, many / continuous / repeated, mitoses / cell cycles / cell divisions ; I cell replication 3 prevents the loss of, genes / genetic information ; A prevents loss of coding sequences I loss of DNA I prevents loss of genetic material 4 AVP ; e.g. prevents fusion of chromosome ends prevents ends of chromosomes being recognised as damaged 4(c) any four from: 4 1 mutation in a gene ; 2 leads to uncontrolled / unregulated, mitosis / cell division ; 3 proto-oncogene to oncogene ; A ref. to oncogene in correct context (without the proto-) 4 ref. to tumour suppressor gene(s) ; A in context of ‘switched off’ 5 idea that normal (named) checkpoints do not function ; A not checked during (named) stage of cell cycle A bypass checkpoints / checkpoints not used 6 mass of, abnormal / non-functional / damaged, cells formed ; A irregular / abnormal, mass of cells I undifferentiated 7 AVP ; e.g. supplied with blood vessels cells do not carry out, apoptosis / programmed cell death cancer cells ignore stop signals from other cells / have no contact inhibition 4(d) any five from: 5 melanoma cell releases cytokines 1 cytokines stimulate, clonal expansion / division (by mitosis), of, T-lymphocytes / B-lymphocytes ; A T-cells / B-cells A T-helper cells / T-killer cells 2 cytokines stimulate (action of), macrophages / phagocytes ; A form angry macrophages 3 cytokines act as cell-signalling molecules ; melanoma cell releases antigens 4 antigens stimulate, clonal selection of (specific) B-lymphocytes / T-lymphocytes ; A B- / T-, lymphocytes (with receptors / immunoglobulins / antibody) that are complementary to antigen A T-cells / B-cells A T-helper cells / T-killer cells 5 antigens, stimulate / AW, B-lymphocytes to divide (by mitosis) to form plasma cells ; A clonal expansion of B-lymphocytes to form plasma cells A if cytokines stated instead of antigens 6 plasma cells, secrete / release / produce, antibodies ; 7 antibodies mark cancer cells for destruction by, T-killer cells / macrophages / phagocytosis ; 8 killer cells, release / AW, perforin / granzymes / toxins / hydrogen peroxide / hydrolytic enzymes, to kill / destroy, (cancer) cells ; A description of how cell is killed e.g. breaks open / makes holes, in cell surface membrane 9 AVP ; e.g. proteins released from melanoma cell act as non-self antigens
More questions on Structure of nucleic acids and replication of DNA
Q5 · Phosphate ions are absorbed from the soil solution by roots and are needed for cellular…
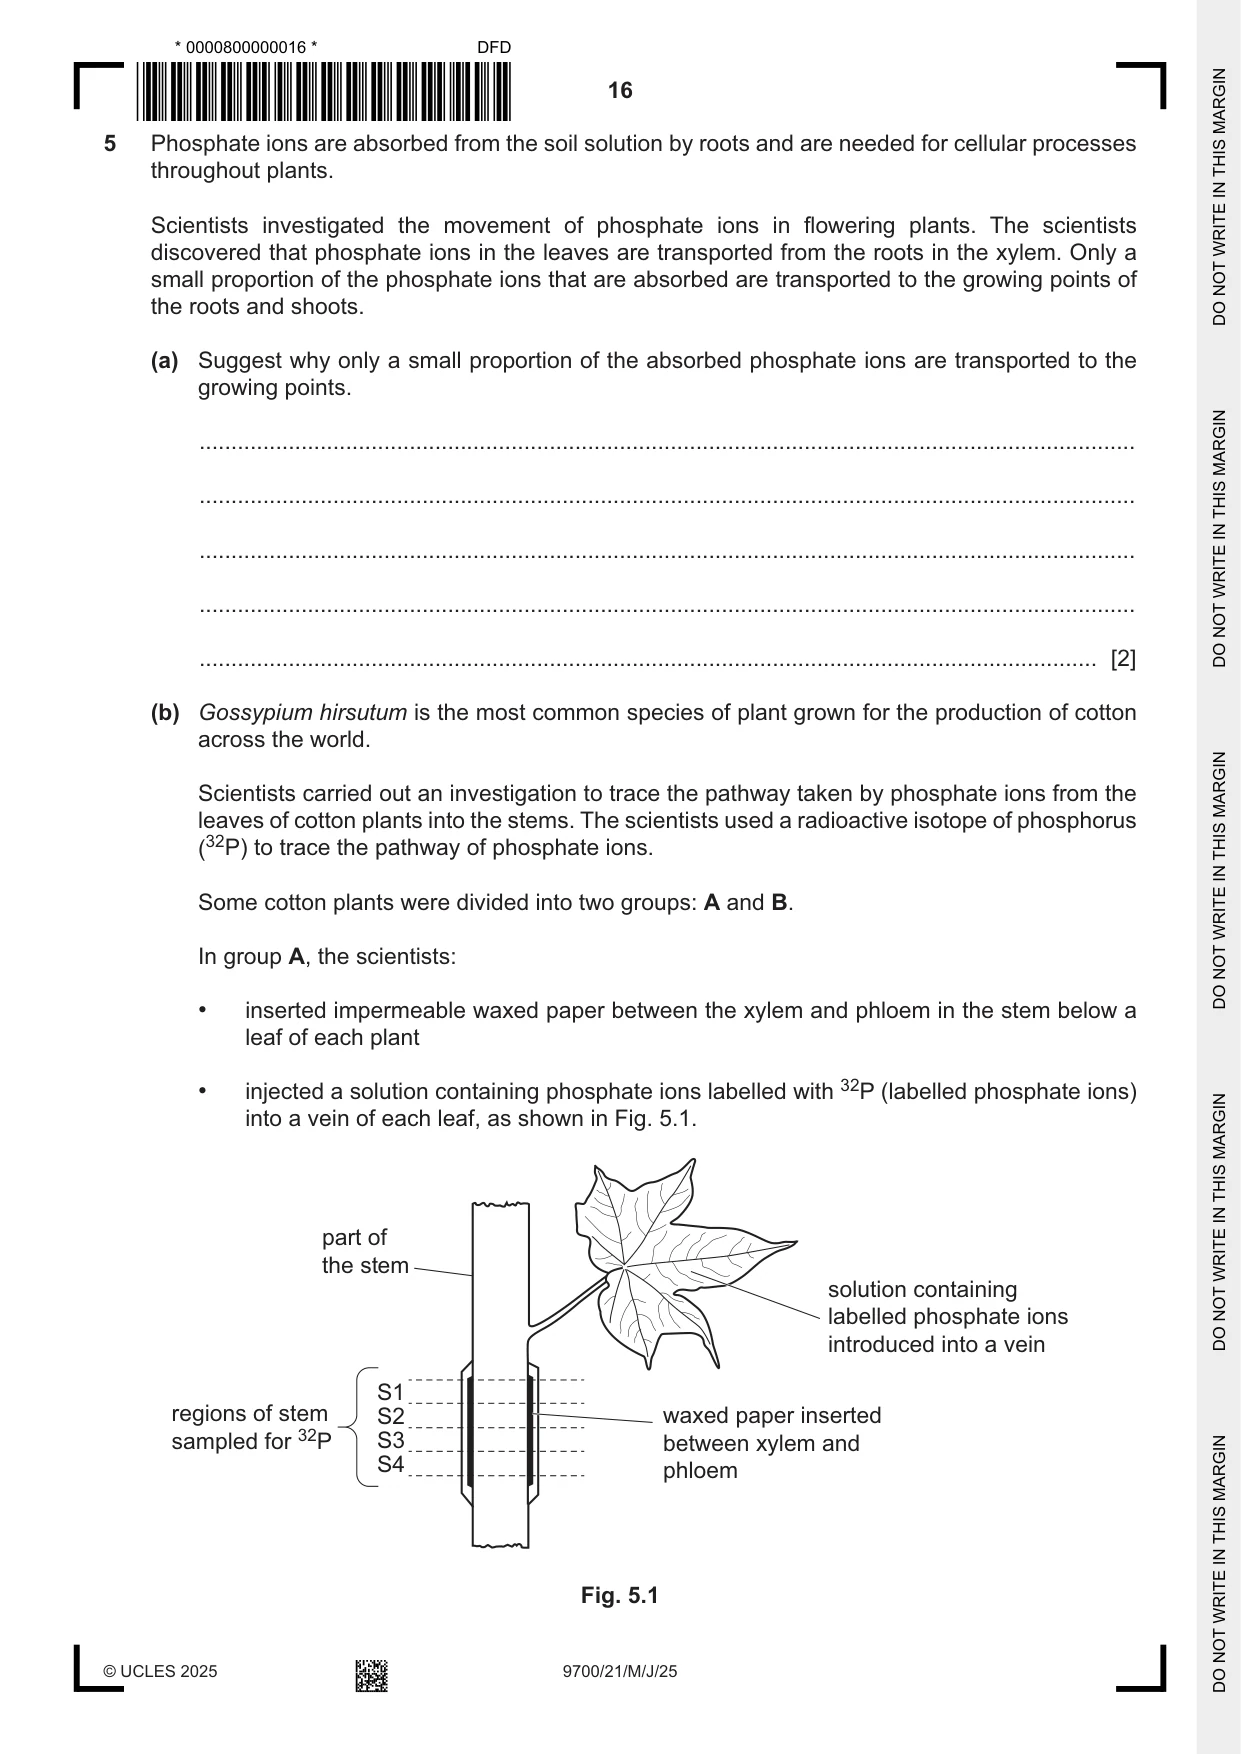
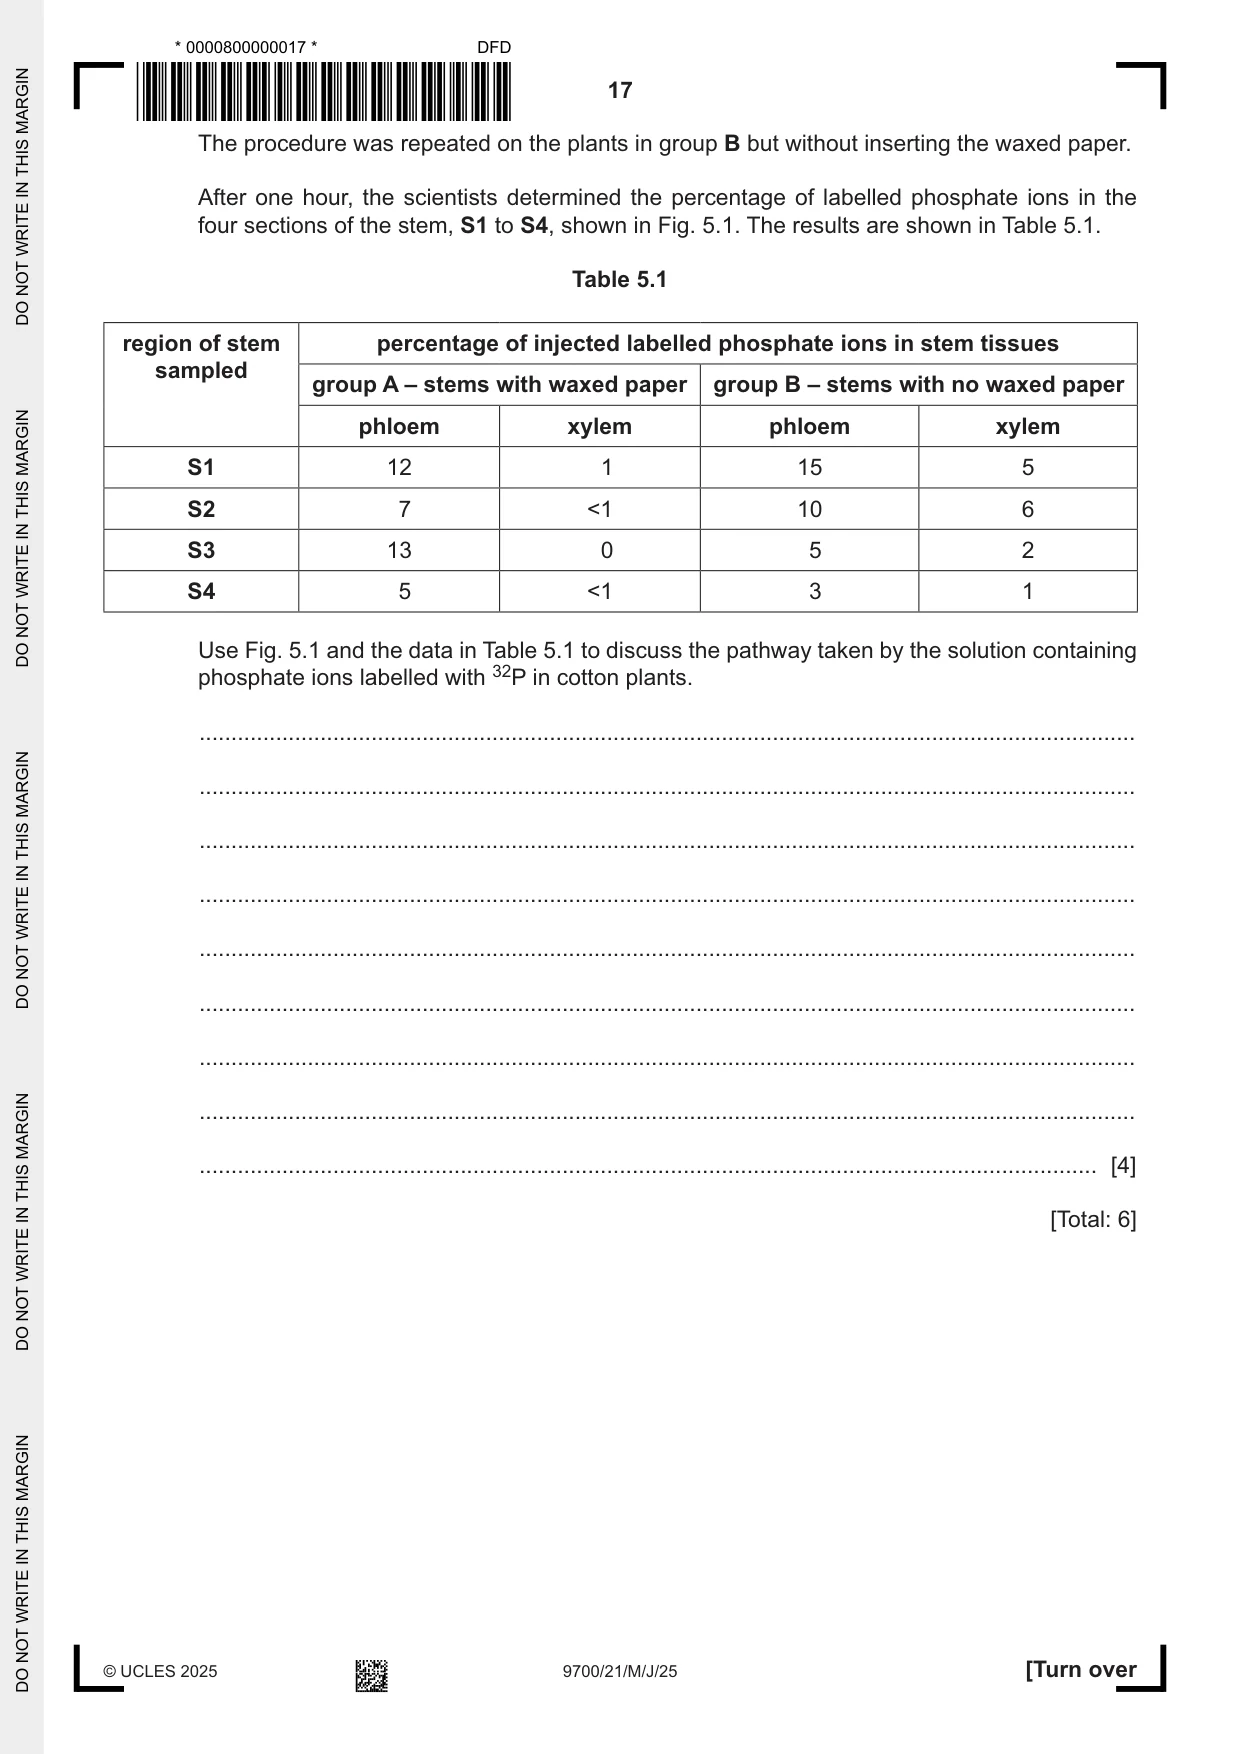
5 Phosphate ions are absorbed from the soil solution by roots and are needed for cellular processes throughout plants. Scientists investigated the movement of phosphate ions in flowering plants. The scientists discovered that phosphate ions in the leaves are transported from the roots in the xylem. Only a small proportion of the phosphate ions that are absorbed are transported to the growing points of the roots and shoots. (a) Suggest why only a small proportion of the absorbed phosphate ions are transported to the growing points. ................................................................................................................................................... ................................................................................................................................................... ................................................................................................................................................... ................................................................................................................................................... ............................................................................................................................................. [2] (b) Gossypium hirsutum is the most common species of plant grown for the production of cotton across the world. Scientists carried out an investigation to trace the pathway taken by phosphate ions from the leaves of cotton plants into the stems. The scientists used a radioactive isotope of phosphorus (32P) to trace the pathway of phosphate ions. Some cotton plants were divided into two groups: A and B. In group A, the scientists: • inserted impermeable waxed paper between the xylem and phloem in the stem below a leaf of each plant • injected a solution containing phosphate ions labelled with 32P (labelled phosphate ions) into a vein of each leaf, as shown in Fig. 5.1. part of the stem solution containing labelled phosphate ions introduced into a vein S1 regions of stem S2 waxed paper inserted sampled for 32P S3 between xylem and S4 phloem Fig. 5.1 The procedure was repeated on the plants in group B but without inserting the waxed paper. After one hour, the scientists determined the percentage of labelled phosphate ions in the four sections of the stem, S1 to S4, shown in Fig. 5.1. The results are shown in Table 5.1. Table 5.1 region of stem percentage of injected labelled phosphate ions in stem tissues sampled group A – stems with waxed paper group B – stems with no waxed paper phloem xylem phloem xylem S1 12 1 15 5 S2 7 <1 10 6 S3 13 0 5 2 S4 5 <1 3 1 Use Fig. 5.1 and the data in Table 5.1 to discuss the pathway taken by the solution containing phosphate ions labelled with 32P in cotton plants. ................................................................................................................................................... ................................................................................................................................................... ................................................................................................................................................... ................................................................................................................................................... ................................................................................................................................................... ................................................................................................................................................... ................................................................................................................................................... ................................................................................................................................................... ............................................................................................................................................. [4] [Total: 6]
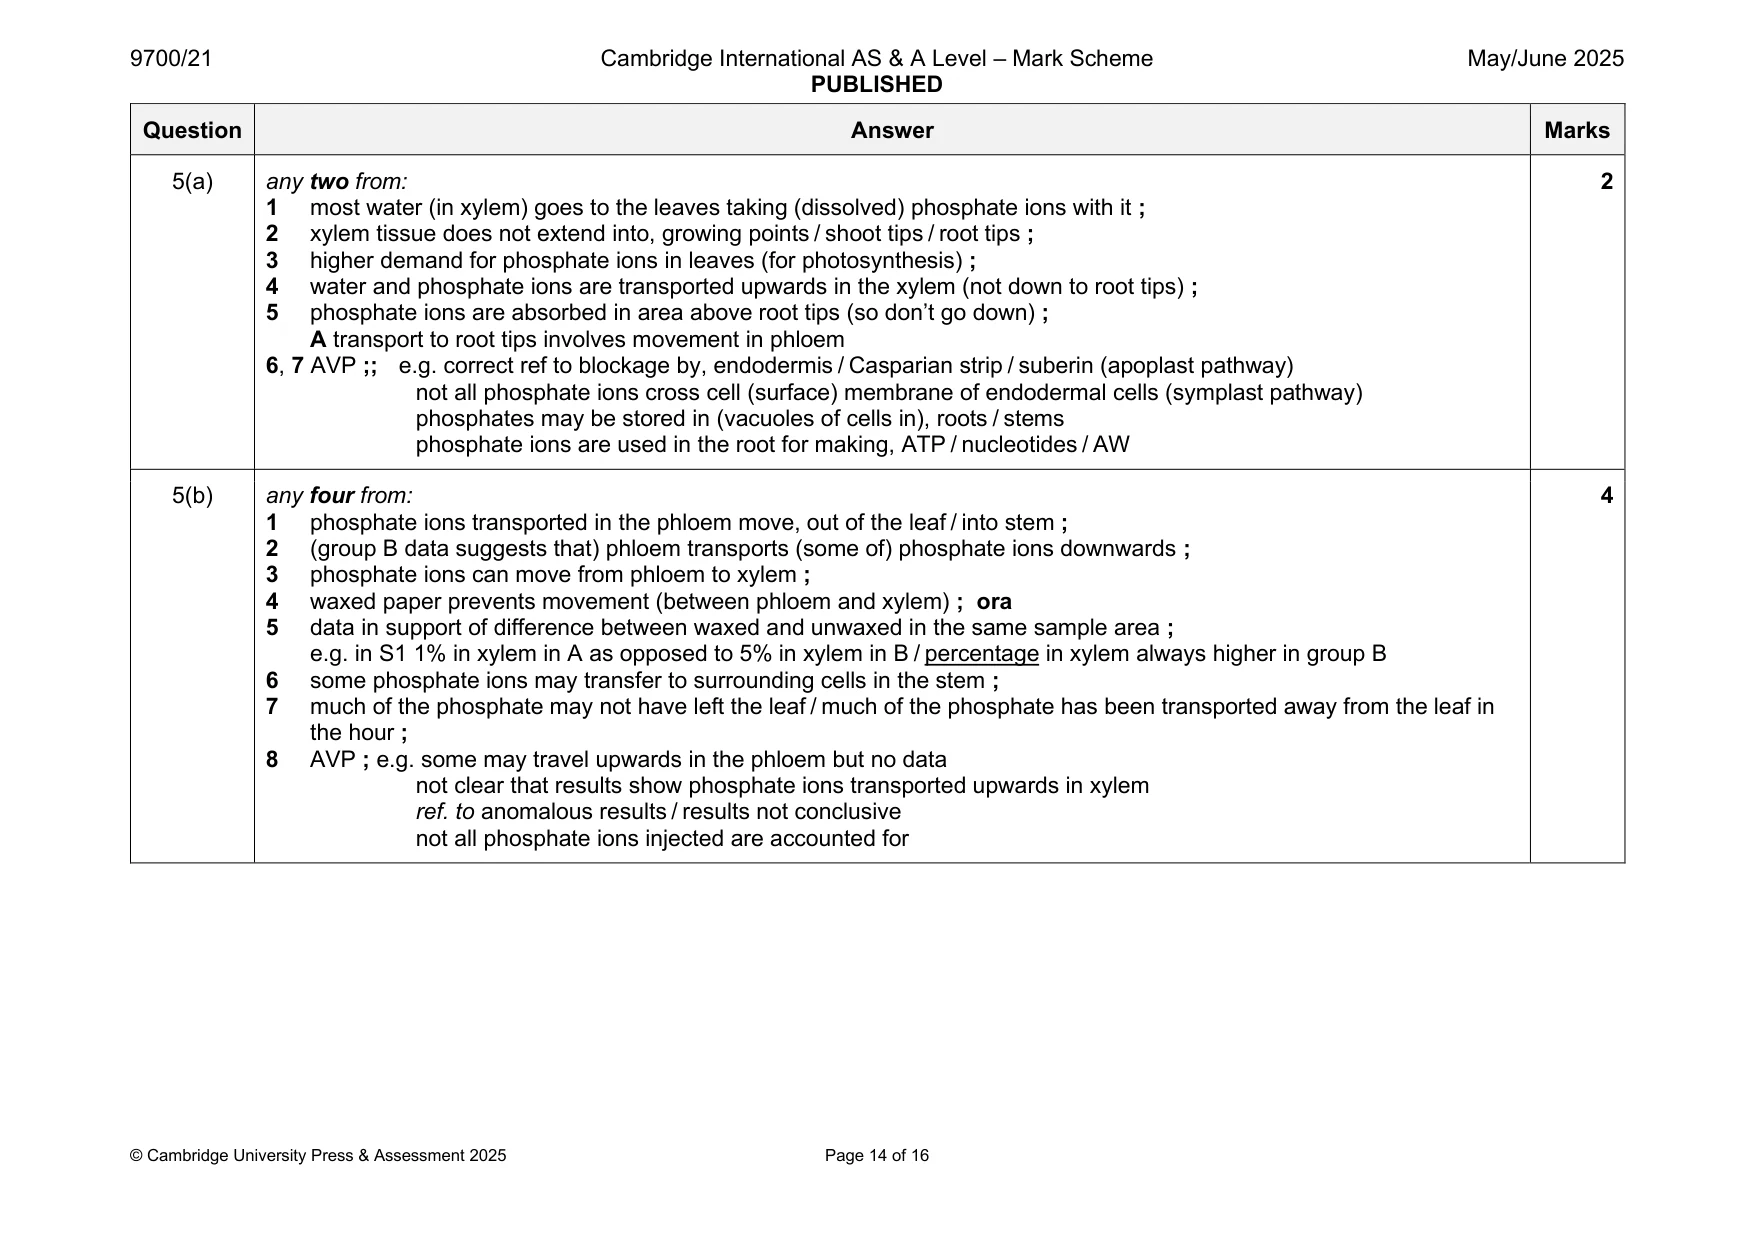
Mark scheme: 5(a) any two from: 2 1 most water (in xylem) goes to the leaves taking (dissolved) phosphate ions with it ; 2 xylem tissue does not extend into, growing points / shoot tips / root tips ; 3 higher demand for phosphate ions in leaves (for photosynthesis) ; 4 water and phosphate ions are transported upwards in the xylem (not down to root tips) ; 5 phosphate ions are absorbed in area above root tips (so don’t go down) ; A transport to root tips involves movement in phloem 6, 7 AVP ;; e.g. correct ref to blockage by, endodermis / Casparian strip / suberin (apoplast pathway) not all phosphate ions cross cell (surface) membrane of endodermal cells (symplast pathway) phosphates may be stored in (vacuoles of cells in), roots / stems phosphate ions are used in the root for making, ATP / nucleotides / AW 5(b) any four from: 4 1 phosphate ions transported in the phloem move, out of the leaf / into stem ; 2 (group B data suggests that) phloem transports (some of) phosphate ions downwards ; 3 phosphate ions can move from phloem to xylem ; 4 waxed paper prevents movement (between phloem and xylem) ; ora 5 data in support of difference between waxed and unwaxed in the same sample area ; e.g. in S1 1% in xylem in A as opposed to 5% in xylem in B / percentage in xylem always higher in group B 6 some phosphate ions may transfer to surrounding cells in the stem ; 7 much of the phosphate may not have left the leaf / much of the phosphate has been transported away from the leaf in the hour ; 8 AVP ; e.g. some may travel upwards in the phloem but no data not clear that results show phosphate ions transported upwards in xylem ref. to anomalous results / results not conclusive not all phosphate ions injected are accounted for
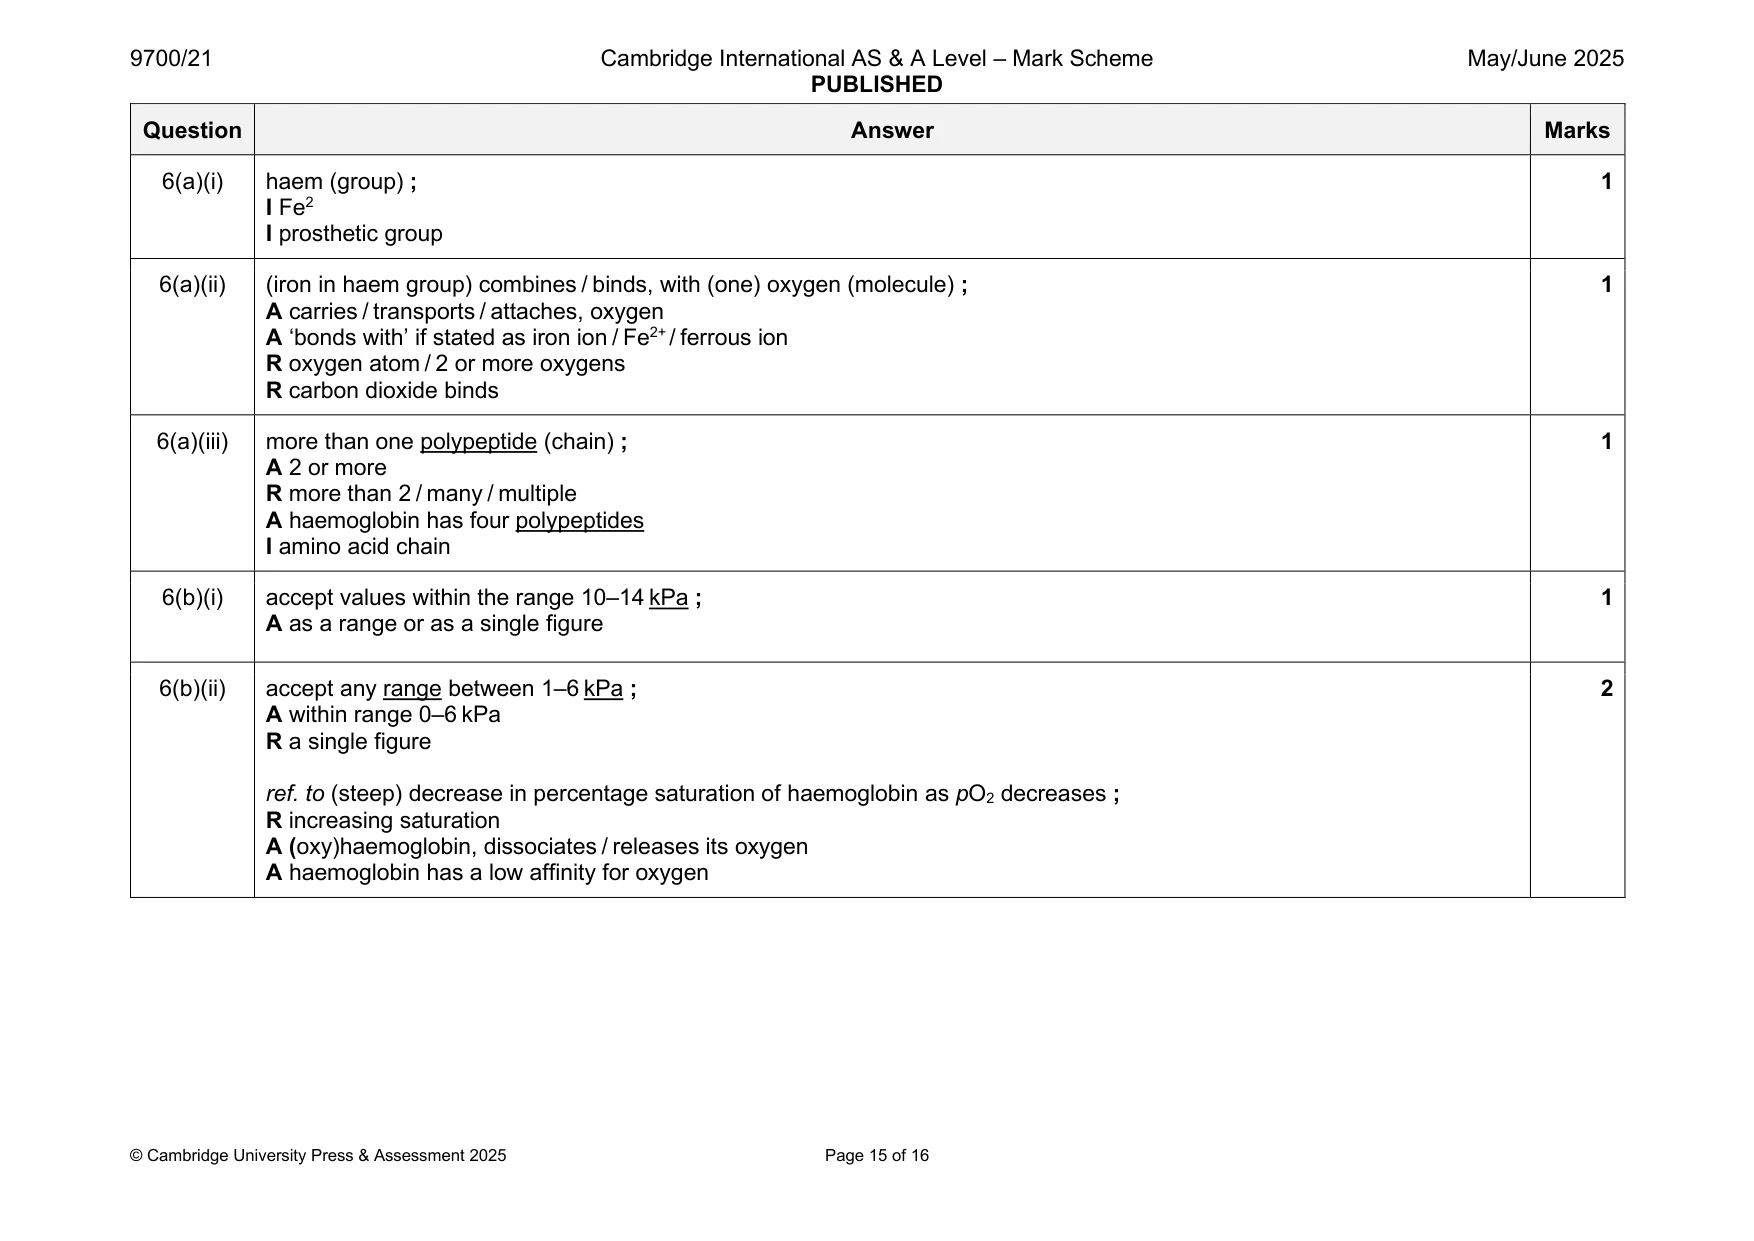
Q6 · A ribbon model of a molecule of haemoglobin
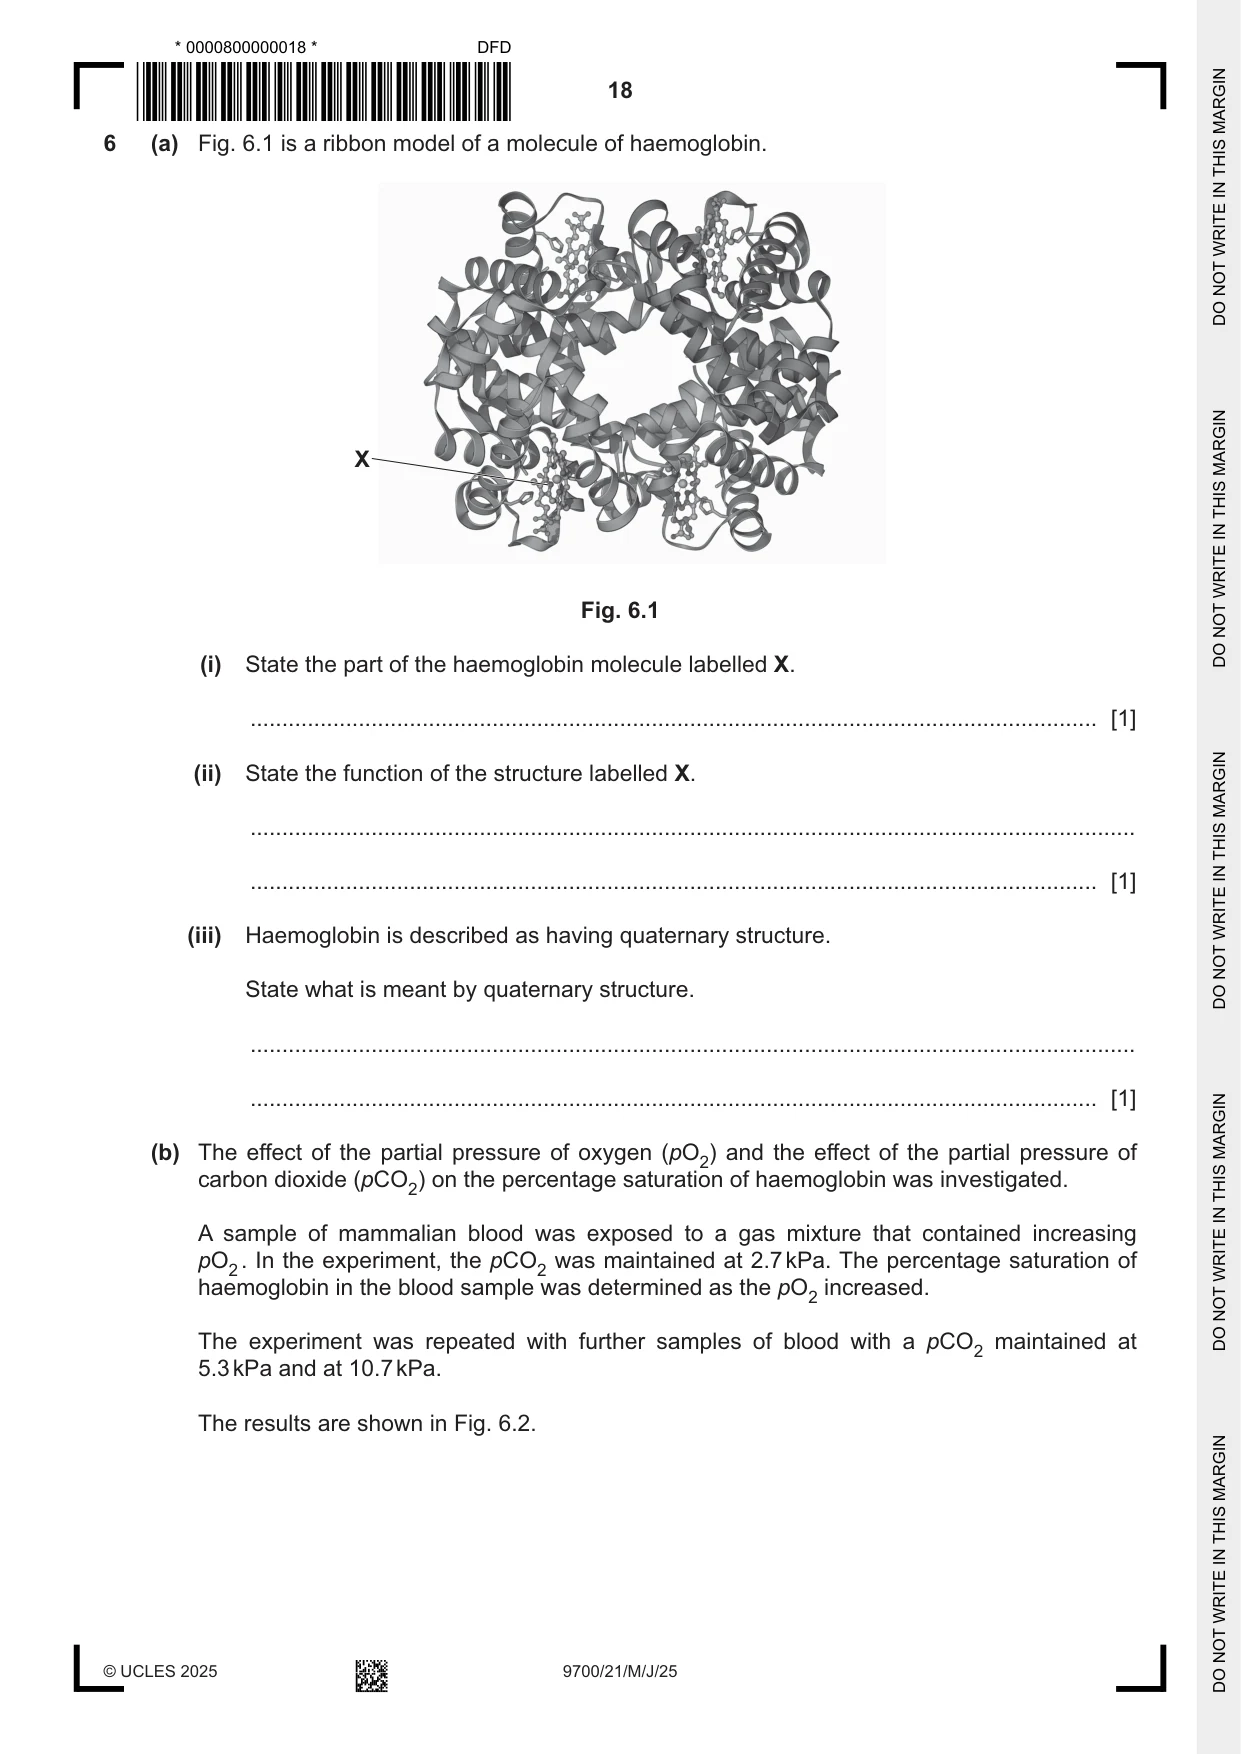
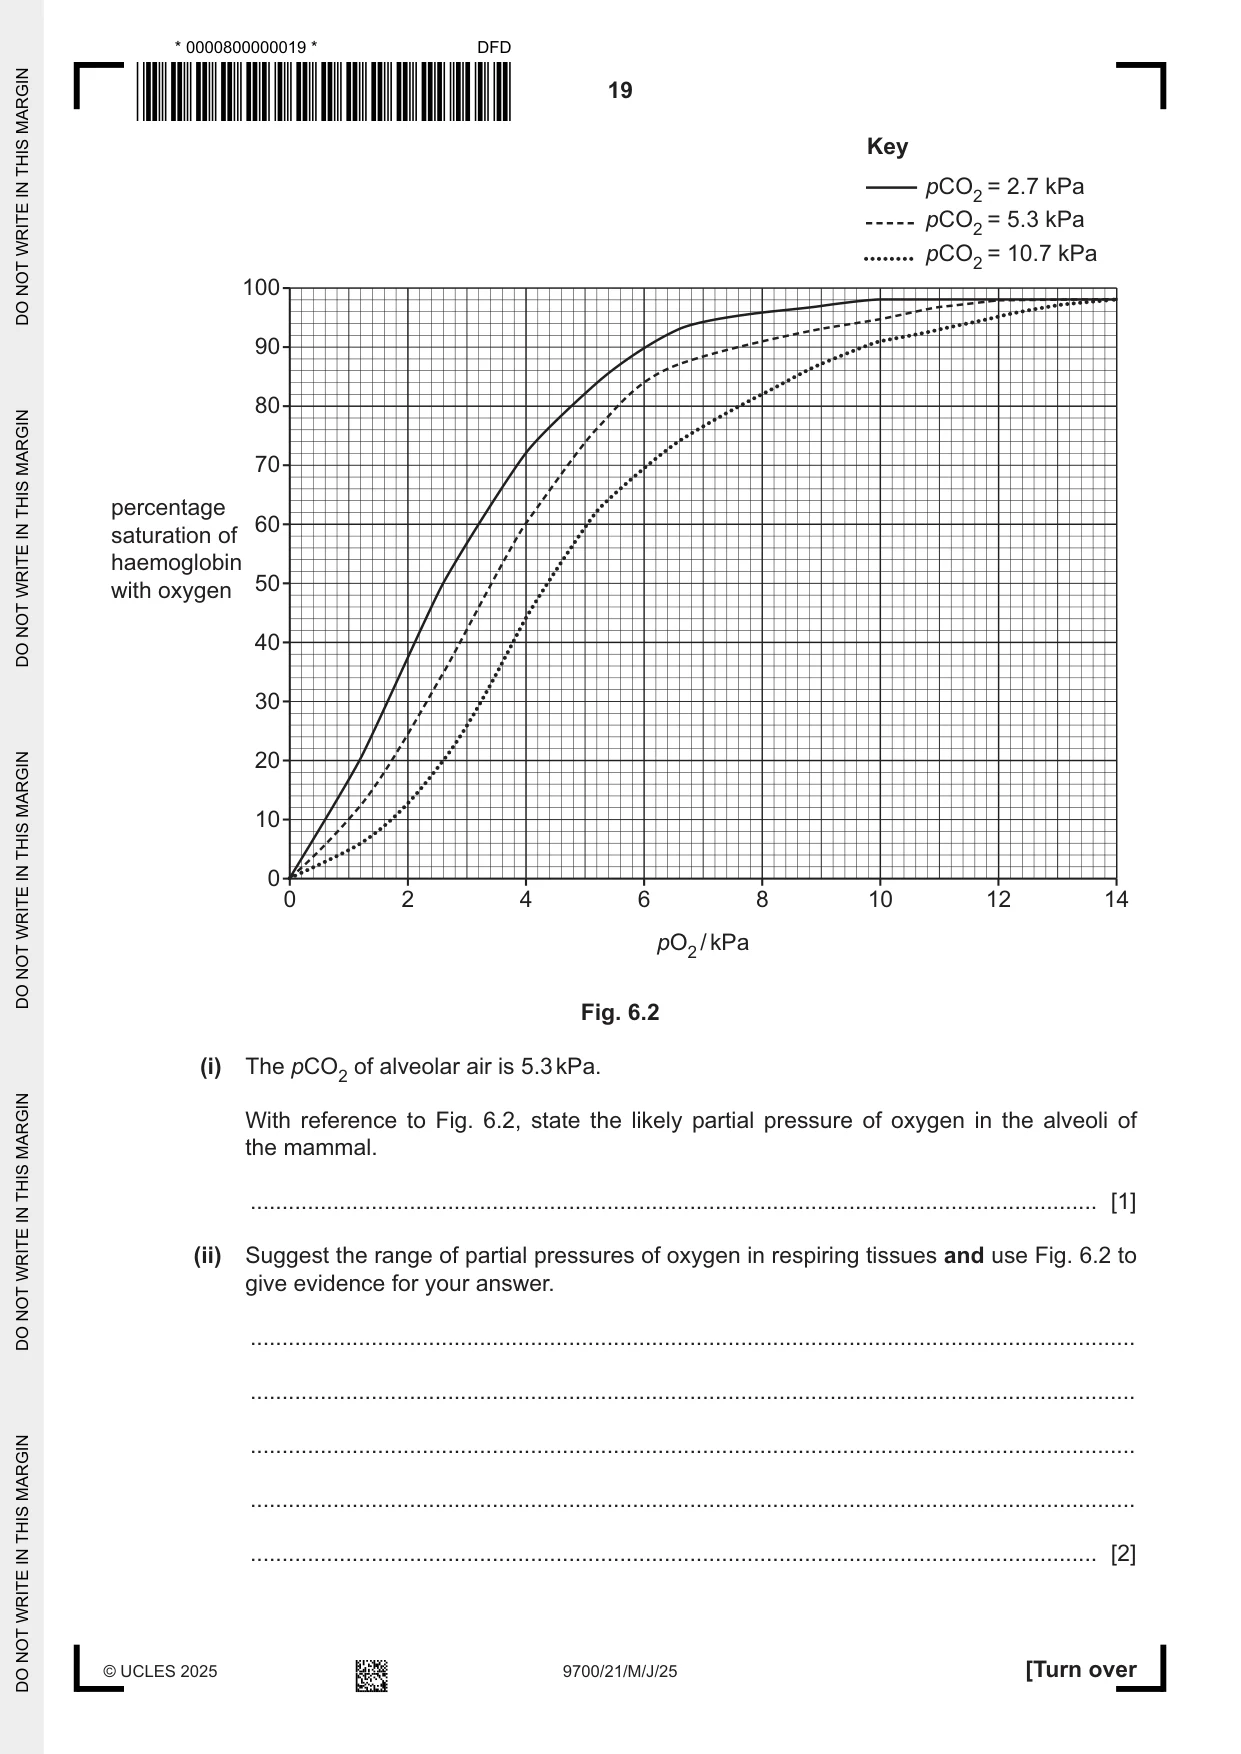
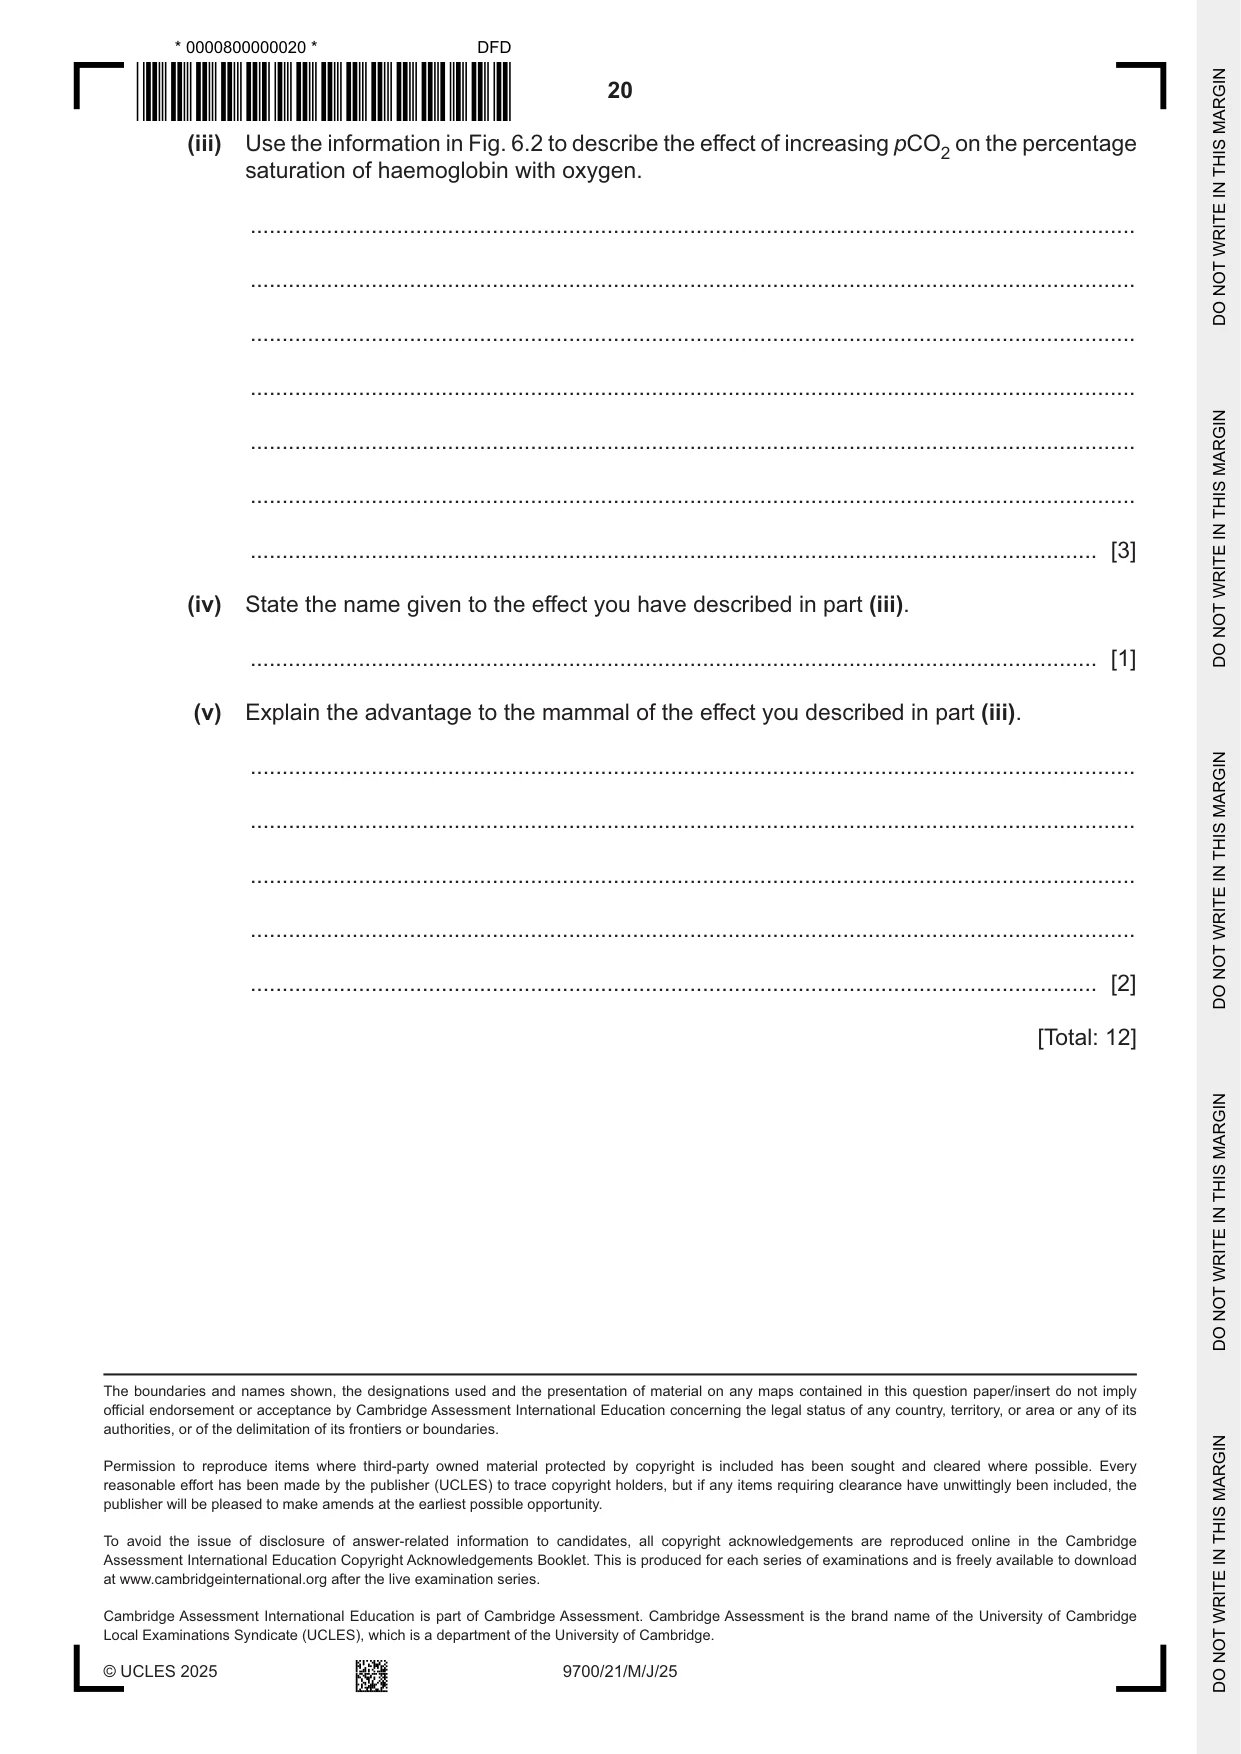
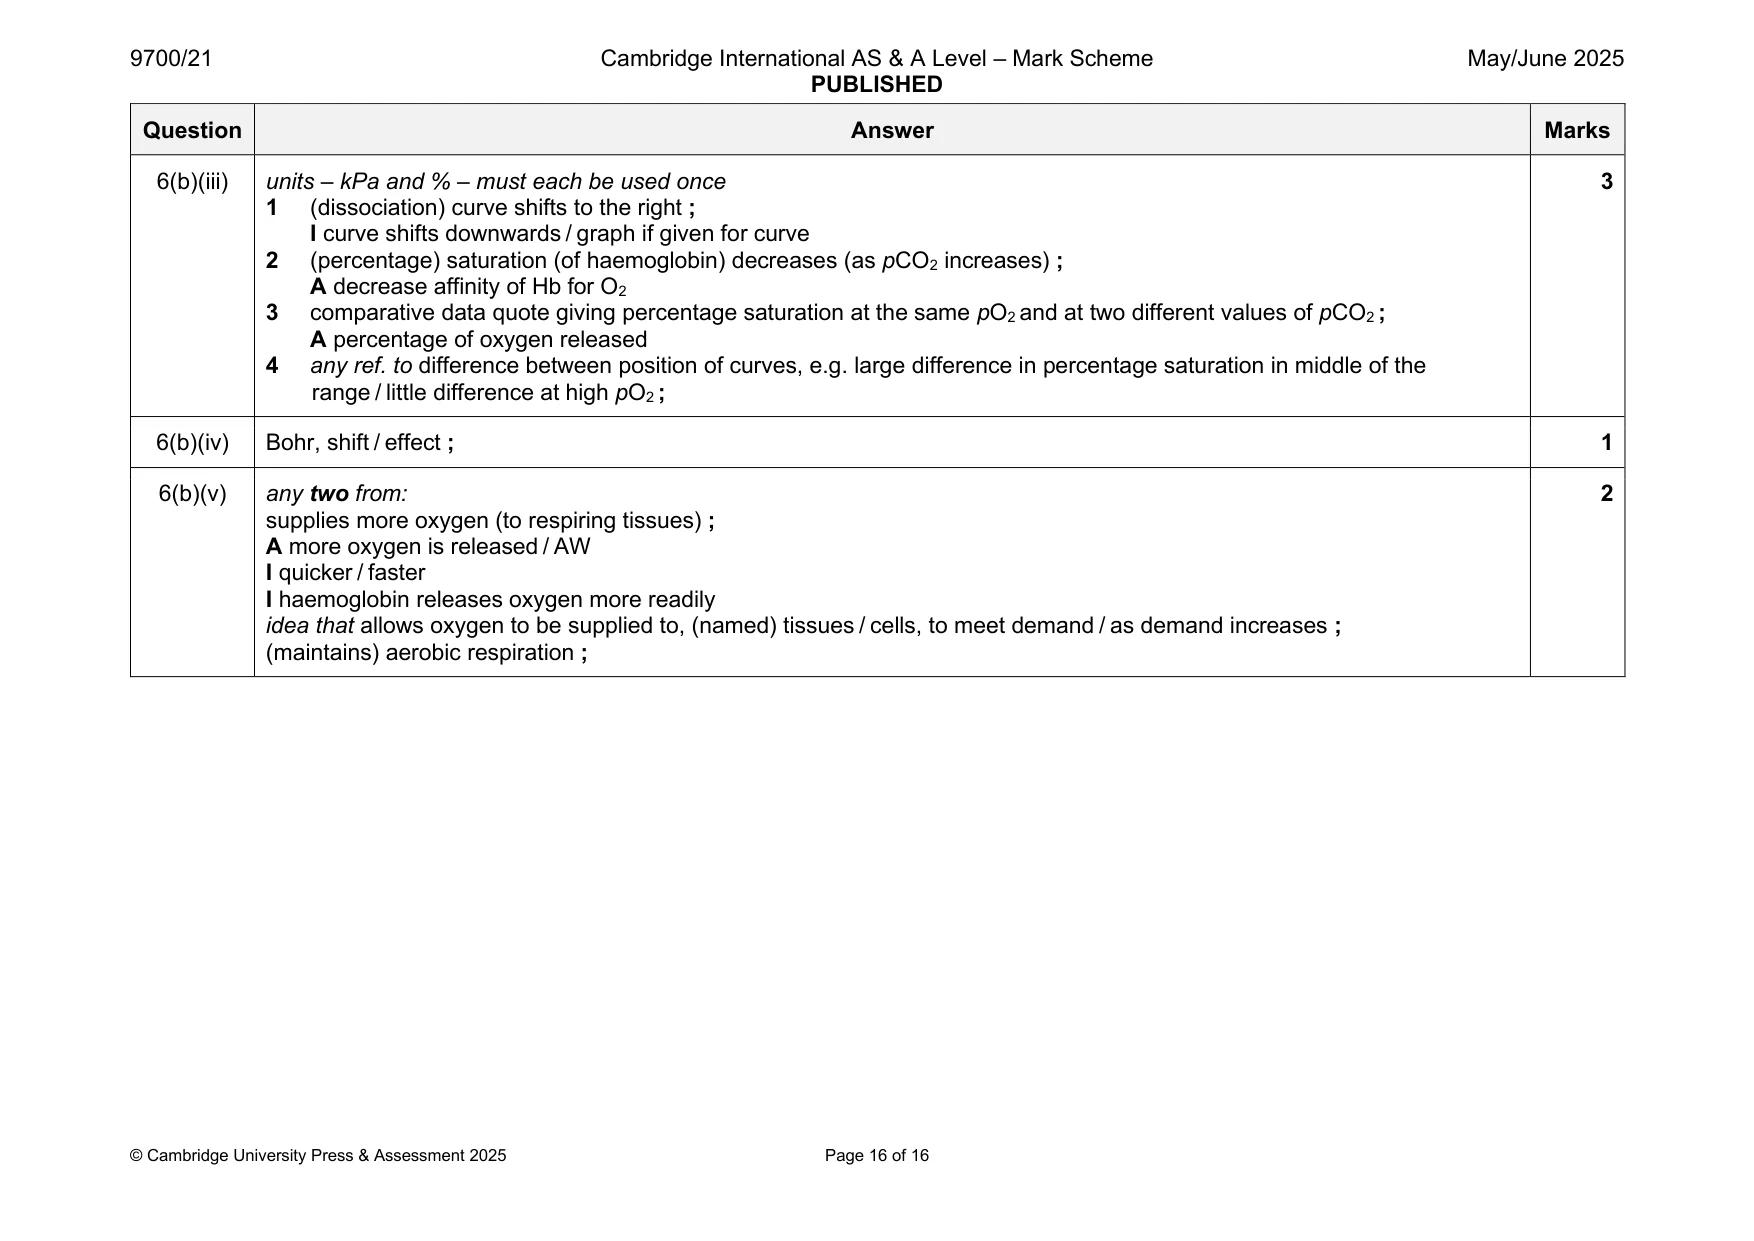
6 (a) Fig. 6.1 is a ribbon model of a molecule of haemoglobin. X Fig. 6.1 (i) State the part of the haemoglobin molecule labelled X. ..................................................................................................................................... [1] (ii) State the function of the structure labelled X. ........................................................................................................................................... ..................................................................................................................................... [1] (iii) Haemoglobin is described as having quaternary structure. State what is meant by quaternary structure. ........................................................................................................................................... ..................................................................................................................................... [1] (b) The effect of the partial pressure of oxygen (pO2) and the effect of the partial pressure of carbon dioxide (pCO2) on the percentage saturation of haemoglobin was investigated. A sample of mammalian blood was exposed to a gas mixture that contained increasing pO2 . In the experiment, the pCO2 was maintained at 2.7 kPa. The percentage saturation of haemoglobin in the blood sample was determined as the pO2 increased. The experiment was repeated with further samples of blood with a pCO2 maintained at 5.3 kPa and at 10.7 kPa. The results are shown in Fig. 6.2. Key pCO2 = 2.7 kPa pCO2 = 5.3 kPa pCO2 = 10.7 kPa 100 90 80 70 percentage 60saturation of haemoglobin 50with oxygen 40 30 20 10 0 0 2 4 6 8 10 12 14 pO2 / kPa Fig. 6.2 (i) The pCO2 of alveolar air is 5.3 kPa. With reference to Fig. 6.2, state the likely partial pressure of oxygen in the alveoli of the mammal. ..................................................................................................................................... [1] (ii) Suggest the range of partial pressures of oxygen in respiring tissues and use Fig. 6.2 to give evidence for your answer. ........................................................................................................................................... ........................................................................................................................................... ........................................................................................................................................... ........................................................................................................................................... ..................................................................................................................................... [2] (iii) Use the information in Fig. 6.2 to describe the effect of increasing pCO2 on the percentage saturation of haemoglobin with oxygen. ........................................................................................................................................... ........................................................................................................................................... ........................................................................................................................................... ........................................................................................................................................... ........................................................................................................................................... ........................................................................................................................................... ..................................................................................................................................... [3] (iv) State the name given to the effect you have described in part (iii). ..................................................................................................................................... [1] (v) Explain the advantage to the mammal of the effect you described in part (iii). ........................................................................................................................................... ........................................................................................................................................... ........................................................................................................................................... ........................................................................................................................................... ..................................................................................................................................... [2] [Total: 12] The boundaries and names shown, the designations used and the presentation of material on any maps contained in this question paper/insert do not imply official endorsement or acceptance by Cambridge Assessment International Education concerning the legal status of any country, territory, or area or any of its authorities, or of the delimitation of its frontiers or boundaries.
Mark scheme: 6(a)(i) haem (group) ; 1 I Fe2 I prosthetic group 6(a)(ii) (iron in haem group) combines / binds, with (one) oxygen (molecule) ; 1 A carries / transports / attaches, oxygen A ‘bonds with’ if stated as iron ion / Fe2+ / ferrous ion R oxygen atom / 2 or more oxygens R carbon dioxide binds 6(a)(iii) more than one polypeptide (chain) ; 1 A 2 or more R more than 2 / many / multiple A haemoglobin has four polypeptides I amino acid chain 6(b)(i) accept values within the range 10–14 kPa ; 1 A as a range or as a single figure 6(b)(ii) accept any range between 1–6 kPa ; 2 A within range 0–6 kPa R a single figure ref. to (steep) decrease in percentage saturation of haemoglobin as pO2 decreases ; R increasing saturation A (oxy)haemoglobin, dissociates / releases its oxygen A haemoglobin has a low affinity for oxygen 6(b)(iii) units – kPa and % – must each be used once 3 1 (dissociation) curve shifts to the right ; I curve shifts downwards / graph if given for curve 2 (percentage) saturation (of haemoglobin) decreases (as pCO2 increases) ; A decrease affinity of Hb for O2 3 comparative data quote giving percentage saturation at the same pO2 and at two different values of pCO2 ; A percentage of oxygen released 4 any ref. to difference between position of curves, e.g. large difference in percentage saturation in middle of the range / little difference at high pO2 ; 6(b)(iv) Bohr, shift / effect ; 1 6(b)(v) any two from: 2 supplies more oxygen (to respiring tissues) ; A more oxygen is released / AW I quicker / faster I haemoglobin releases oxygen more readily idea that allows oxygen to be supplied to, (named) tissues / cells, to meet demand / as demand increases ; (maintains) aerobic respiration ;
What was in this paper
The subtopics covered by these 6 questions, and how many questions each got. Open one in a new tab to see every Cambridge question on it.
What you needed in this session
Cambridge’s own grade thresholds for 2025 May/June, Paper 2 · Variant 1. A higher threshold means an easier paper — the bar moves with how the cohort did.