Cambridge IGCSE Science - Combined 0653 — 2025 Oct/Nov Paper 6 · Variant 3
0653/63/O/N/25 · 4 questions · 40 marks · 60 min
The question paper and its mark scheme, free to read here and free to download. This is Cambridge’s own paper, exactly as it was sat.
Question paper20 pages





Mark scheme10 pages
Answers below. Sit the paper first if you are practising.
Questions as text
Q1 · A student investigates the effect of exercise on heart rate
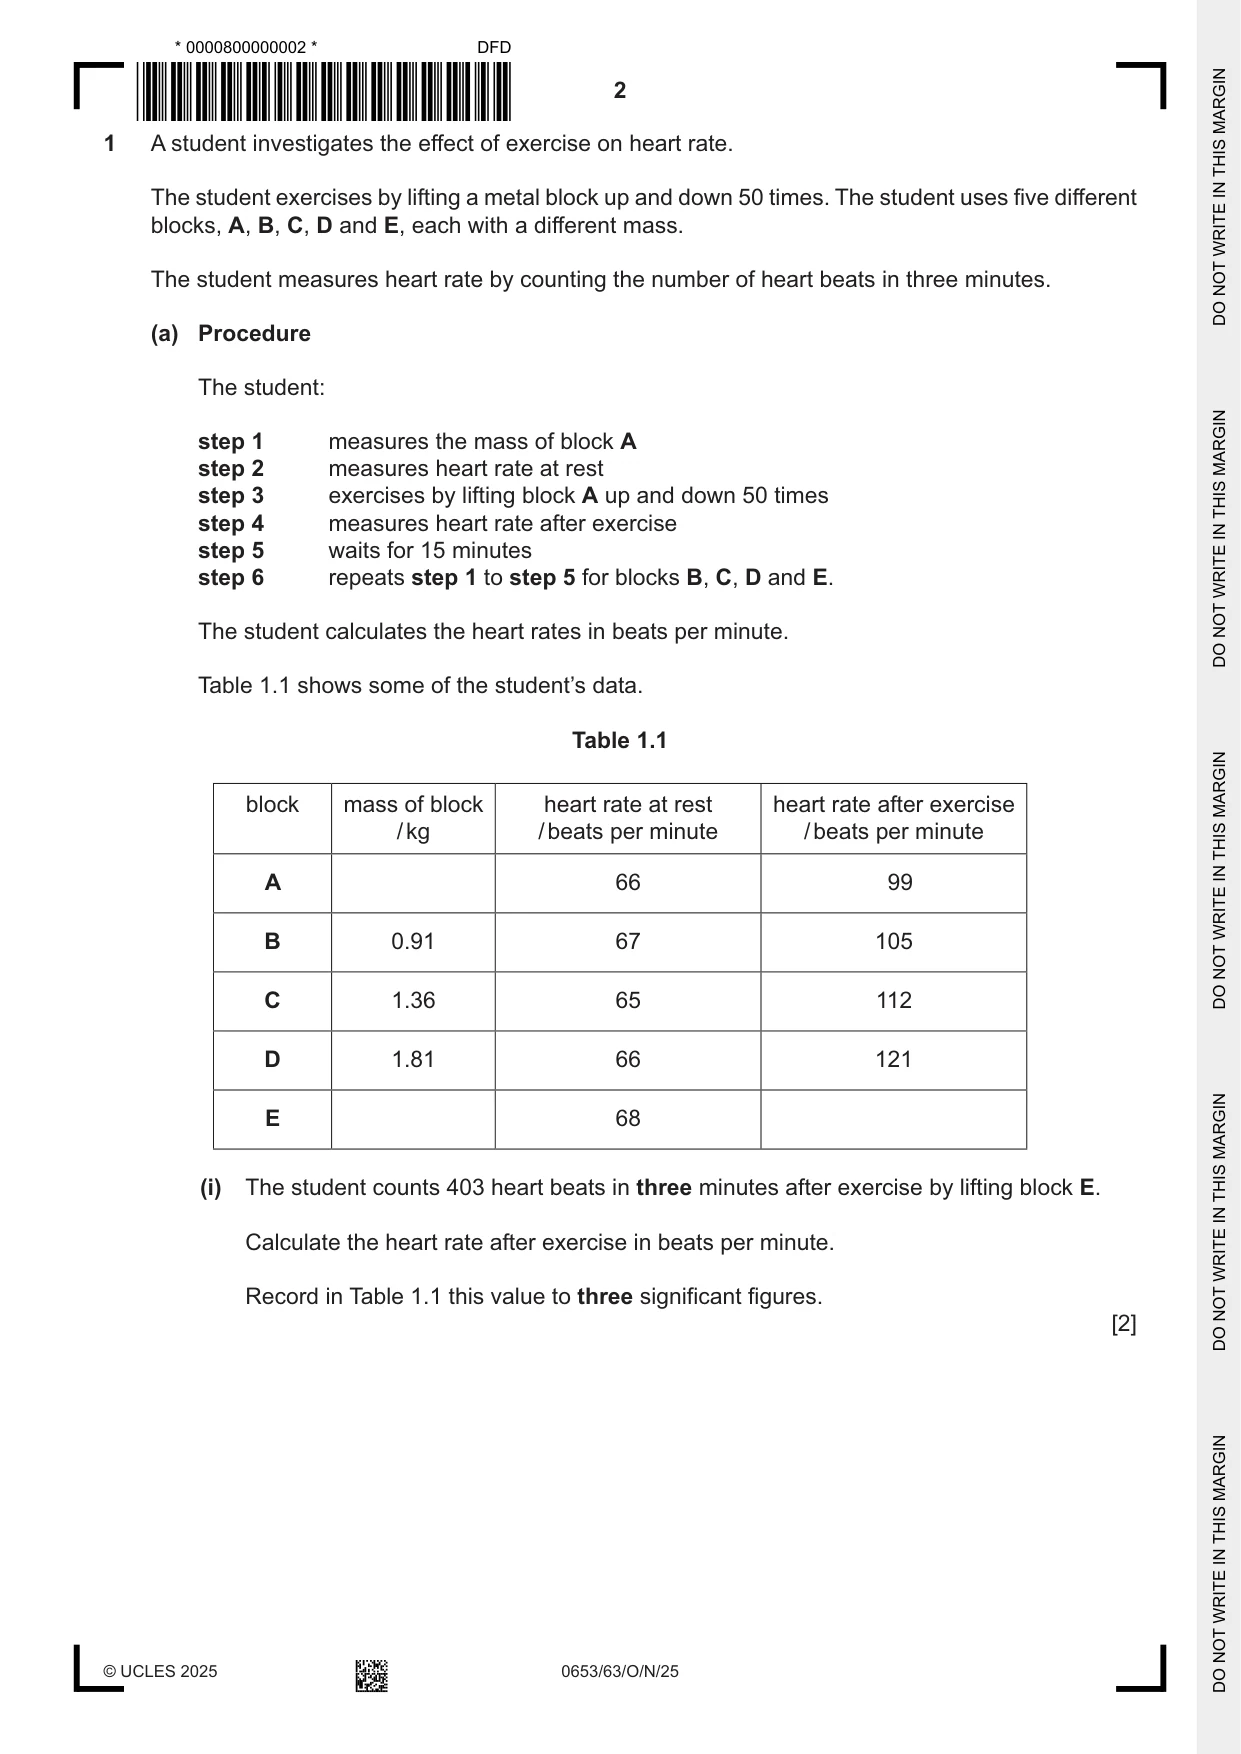
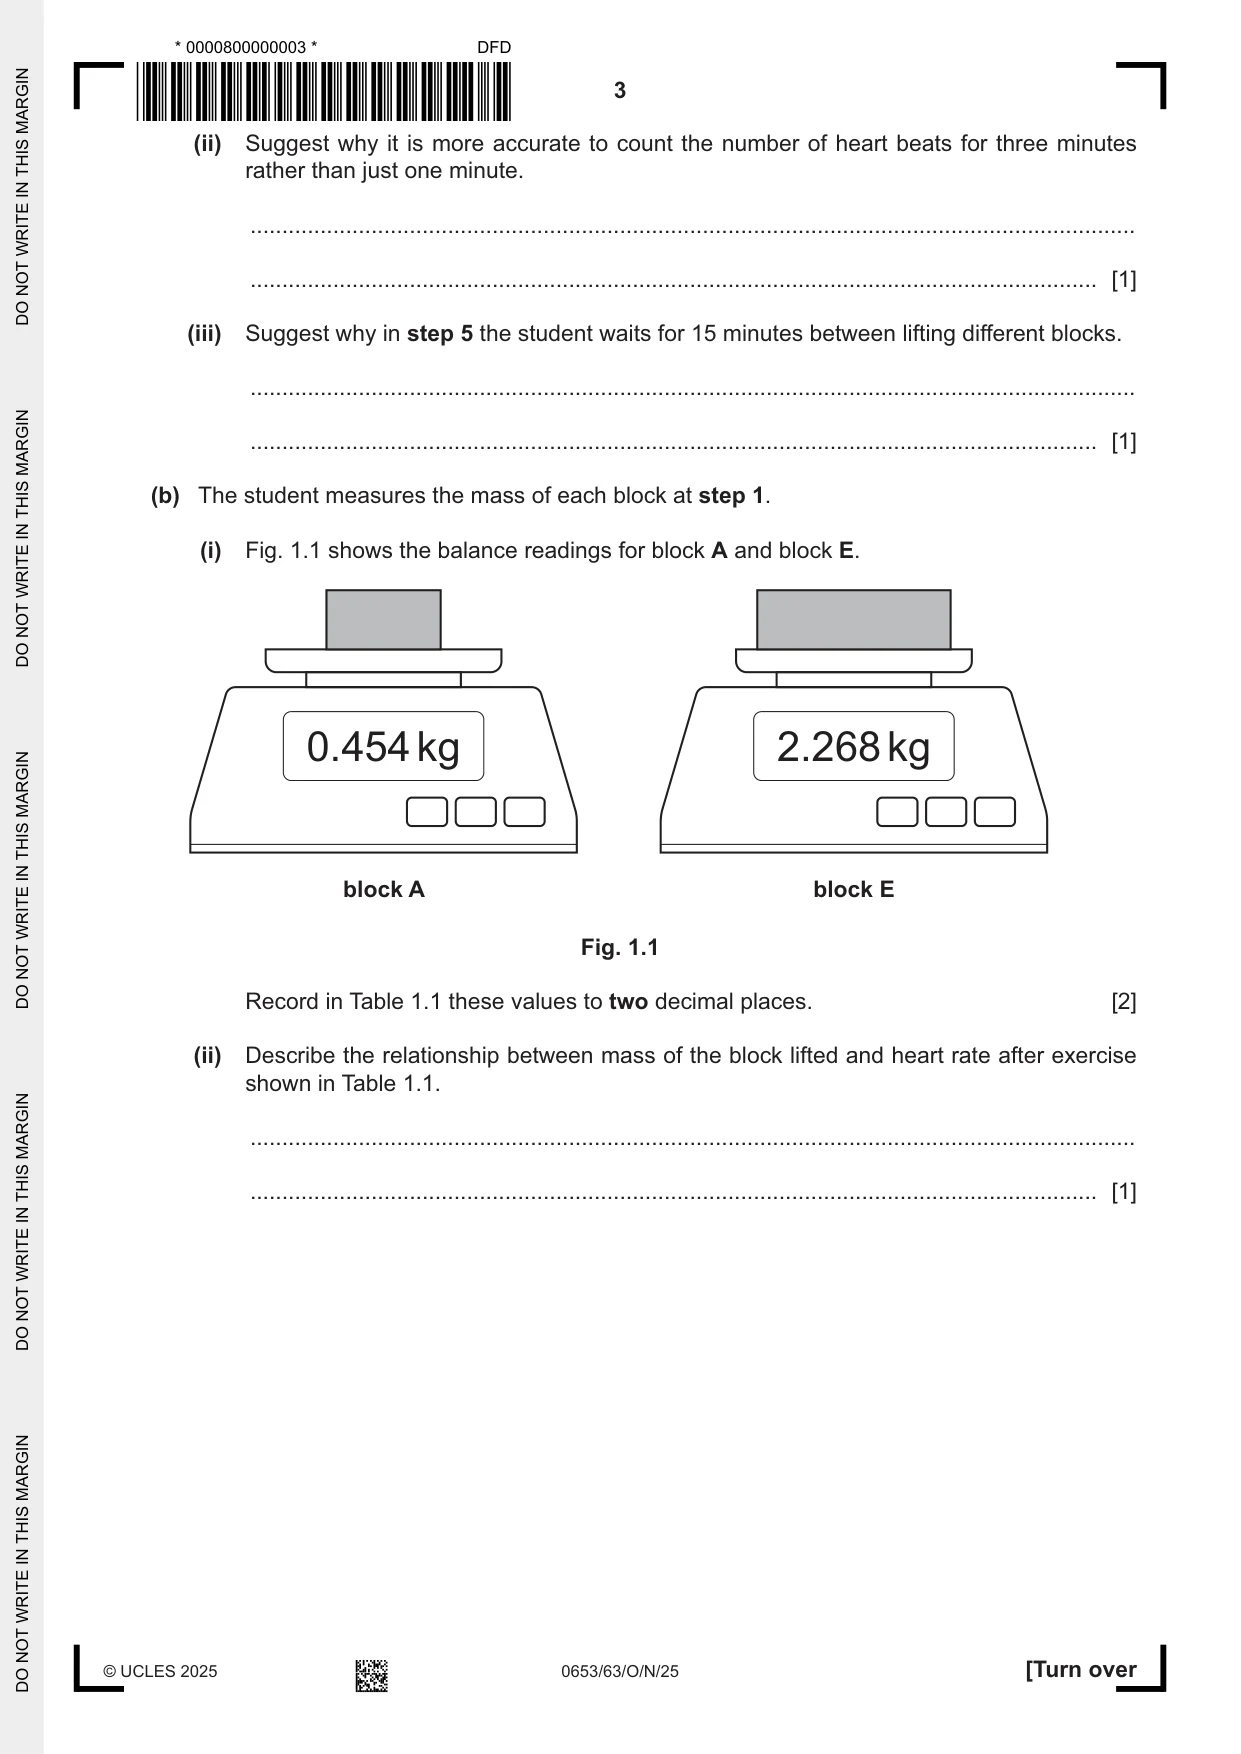
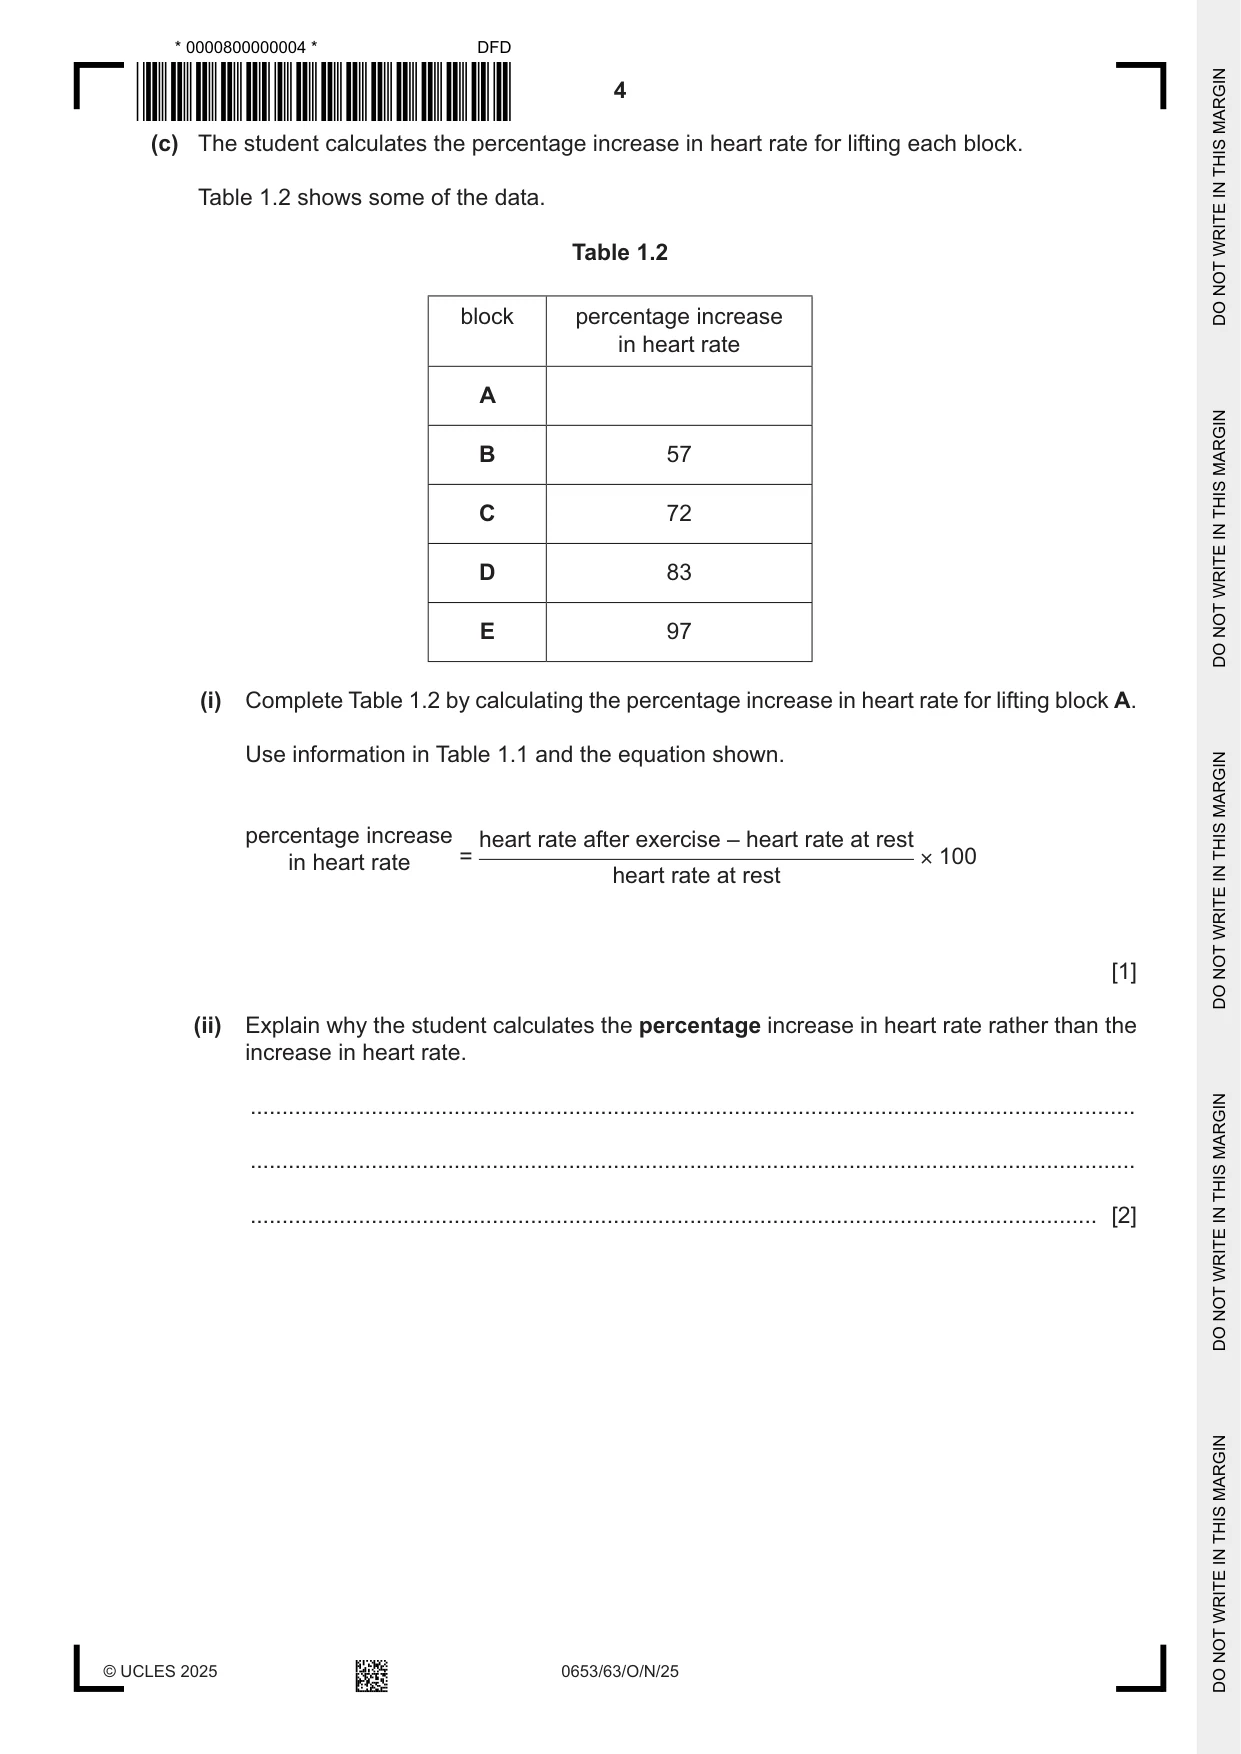
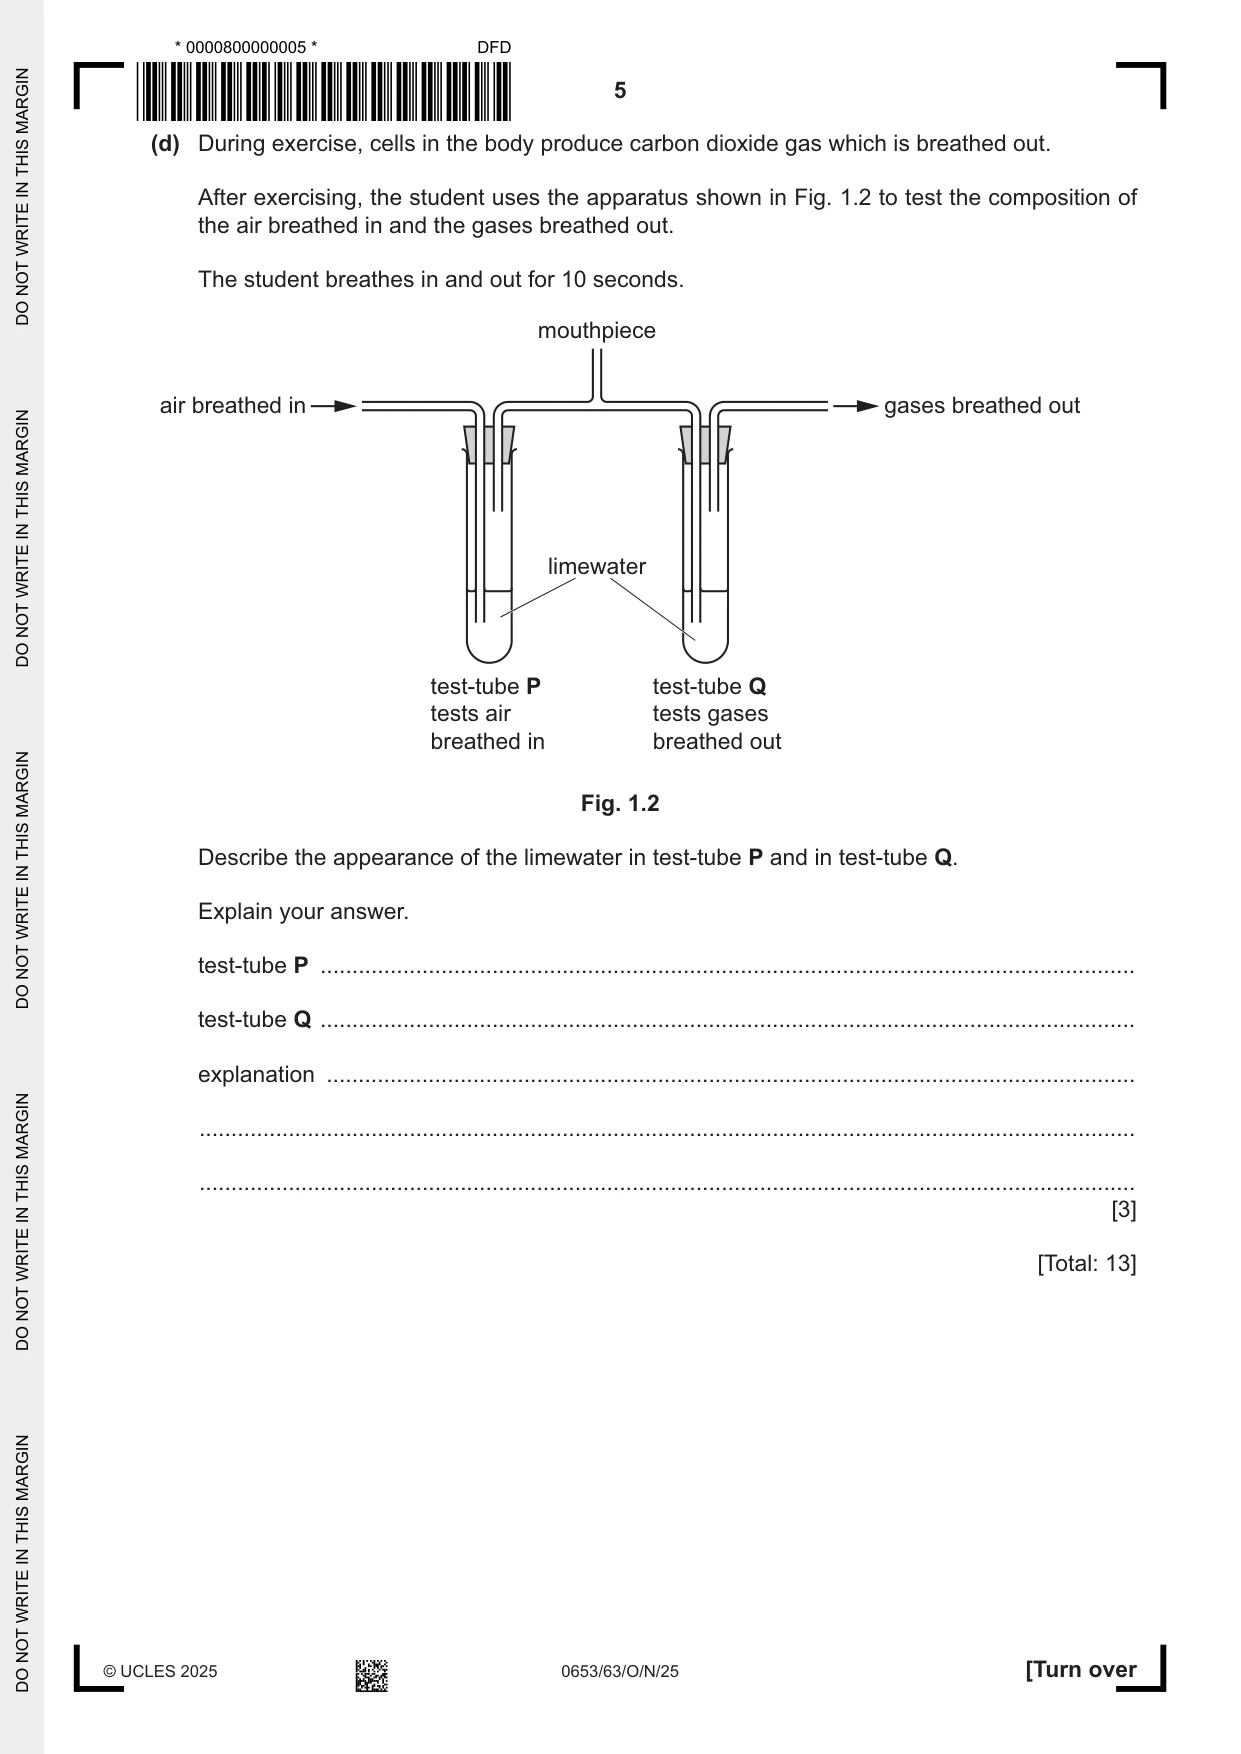
1 A student investigates the effect of exercise on heart rate. The student exercises by lifting a metal block up and down 50 times. The student uses five different blocks, A, B, C, D and E, each with a different mass. The student measures heart rate by counting the number of heart beats in three minutes. (a) Procedure The student: step 1 measures the mass of block A step 2 measures heart rate at rest step 3 exercises by lifting block A up and down 50 times step 4 measures heart rate after exercise step 5 waits for 15 minutes step 6 repeats step 1 to step 5 for blocks B, C, D and E. The student calculates the heart rates in beats per minute. Table 1.1 shows some of the student’s data. Table 1.1 block mass of block heart rate at rest heart rate after exercise / kg / beats per minute / beats per minute A 66 99 B 0.91 67 105 C 1.36 65 112 D 1.81 66 121 E 68 (i) The student counts 403 heart beats in three minutes after exercise by lifting block E. Calculate the heart rate after exercise in beats per minute. Record in Table 1.1 this value to three significant figures. [2] (ii) Suggest why it is more accurate to count the number of heart beats for three minutes rather than just one minute. ........................................................................................................................................... ..................................................................................................................................... [1] (iii) Suggest why in step 5 the student waits for 15 minutes between lifting different blocks. ........................................................................................................................................... ..................................................................................................................................... [1] (b) The student measures the mass of each block at step 1. (i) Fig. 1.1 shows the balance readings for block A and block E. 0.454 kg 2.268 kg block A block E Fig. 1.1 Record in Table 1.1 these values to two decimal places. [2] (ii) Describe the relationship between mass of the block lifted and heart rate after exercise shown in Table 1.1. ........................................................................................................................................... ..................................................................................................................................... [1] (c) The student calculates the percentage increase in heart rate for lifting each block. Table 1.2 shows some of the data. Table 1.2 block percentage increase in heart rate A B 57 C 72 D 83 E 97 (i) Complete Table 1.2 by calculating the percentage increase in heart rate for lifting block A. Use information in Table 1.1 and the equation shown. percentage increase heart rate after exercise – heart rate at rest in heart rate = × 100 heart rate at rest [1] (ii) Explain why the student calculates the percentage increase in heart rate rather than the increase in heart rate. ........................................................................................................................................... ........................................................................................................................................... ..................................................................................................................................... [2] (d) During exercise, cells in the body produce carbon dioxide gas which is breathed out. After exercising, the student uses the apparatus shown in Fig. 1.2 to test the composition of the air breathed in and the gases breathed out. The student breathes in and out for 10 seconds. mouthpiece air breathed in gases breathed out limewater test-tube P test-tube Q tests air tests gases breathed in breathed out Fig. 1.2 Describe the appearance of the limewater in test-tube P and in test-tube Q. Explain your answer. test-tube P ................................................................................................................................ test-tube Q ................................................................................................................................ explanation ............................................................................................................................... ................................................................................................................................................... ................................................................................................................................................... [3] [Total: 13]
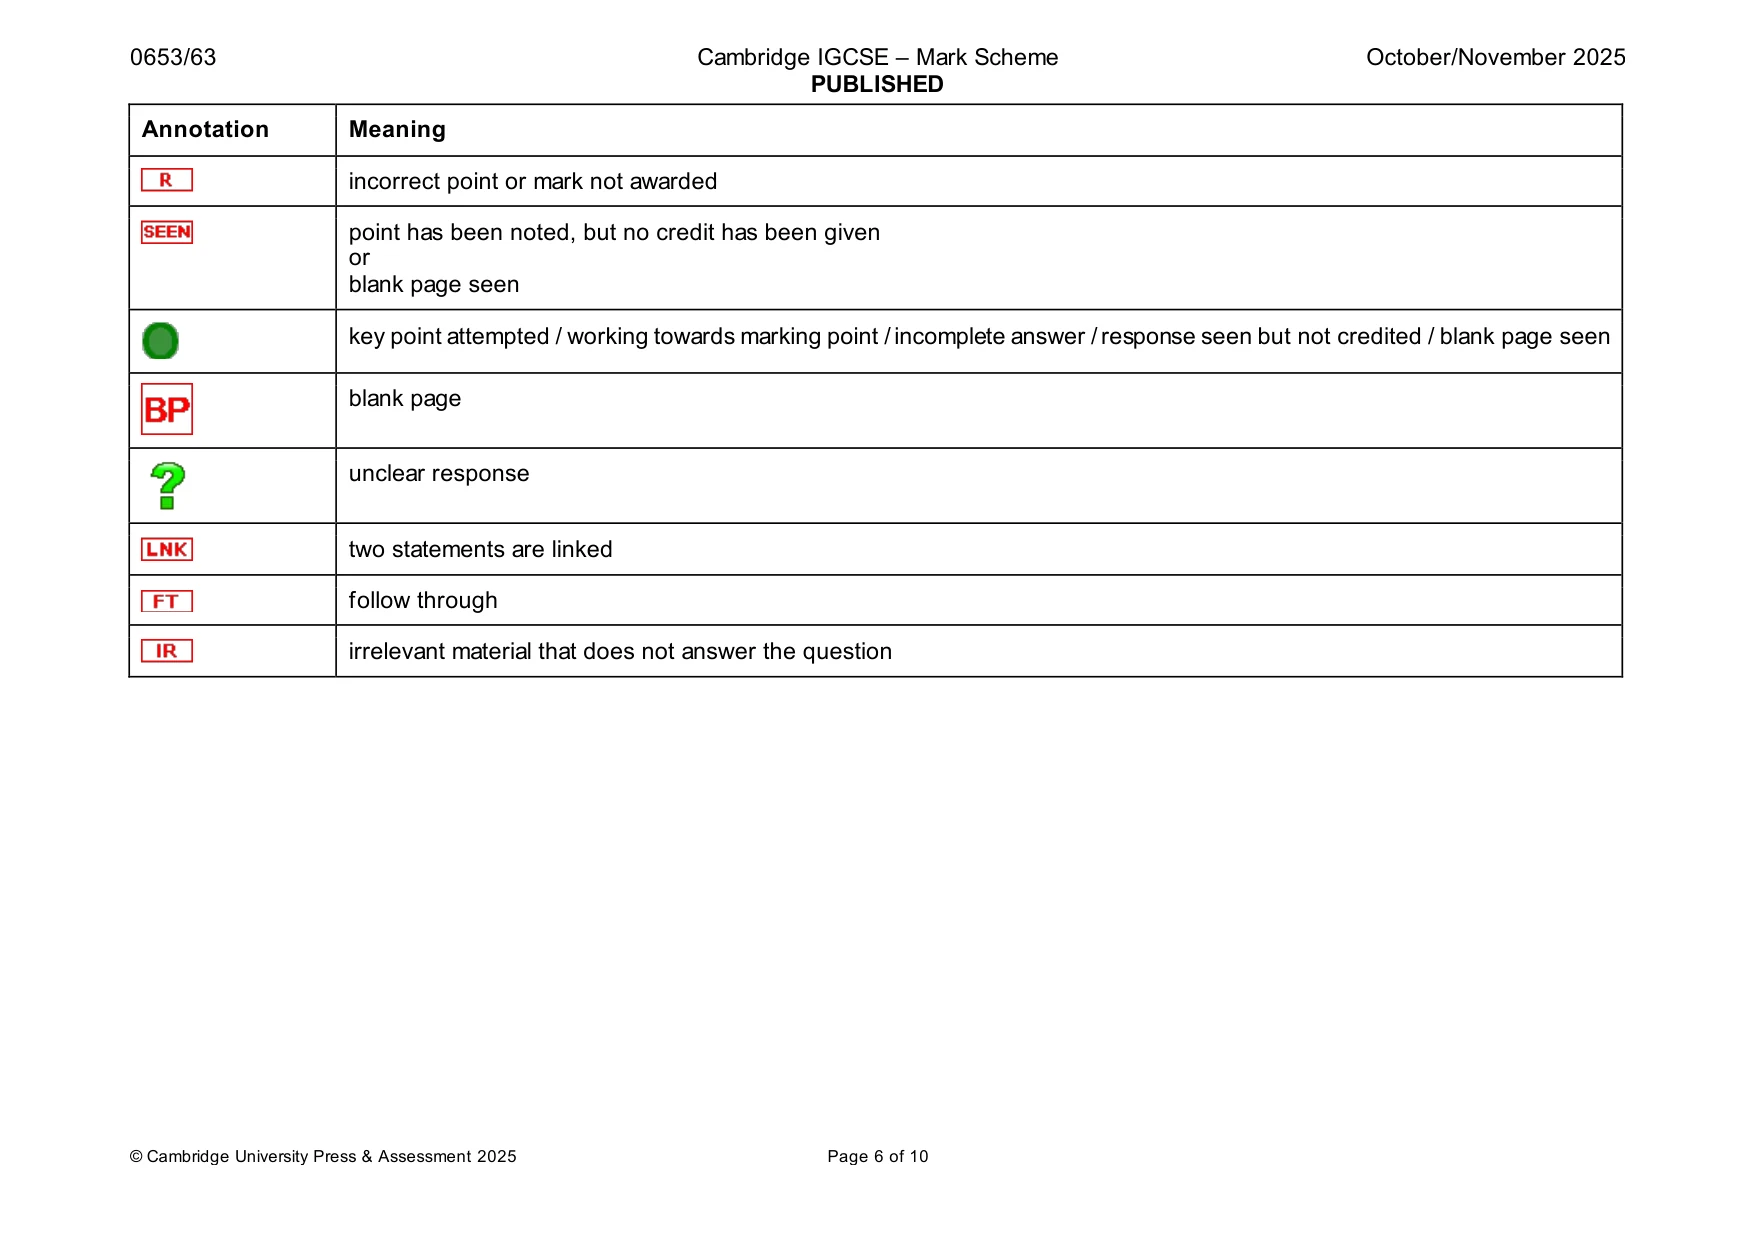
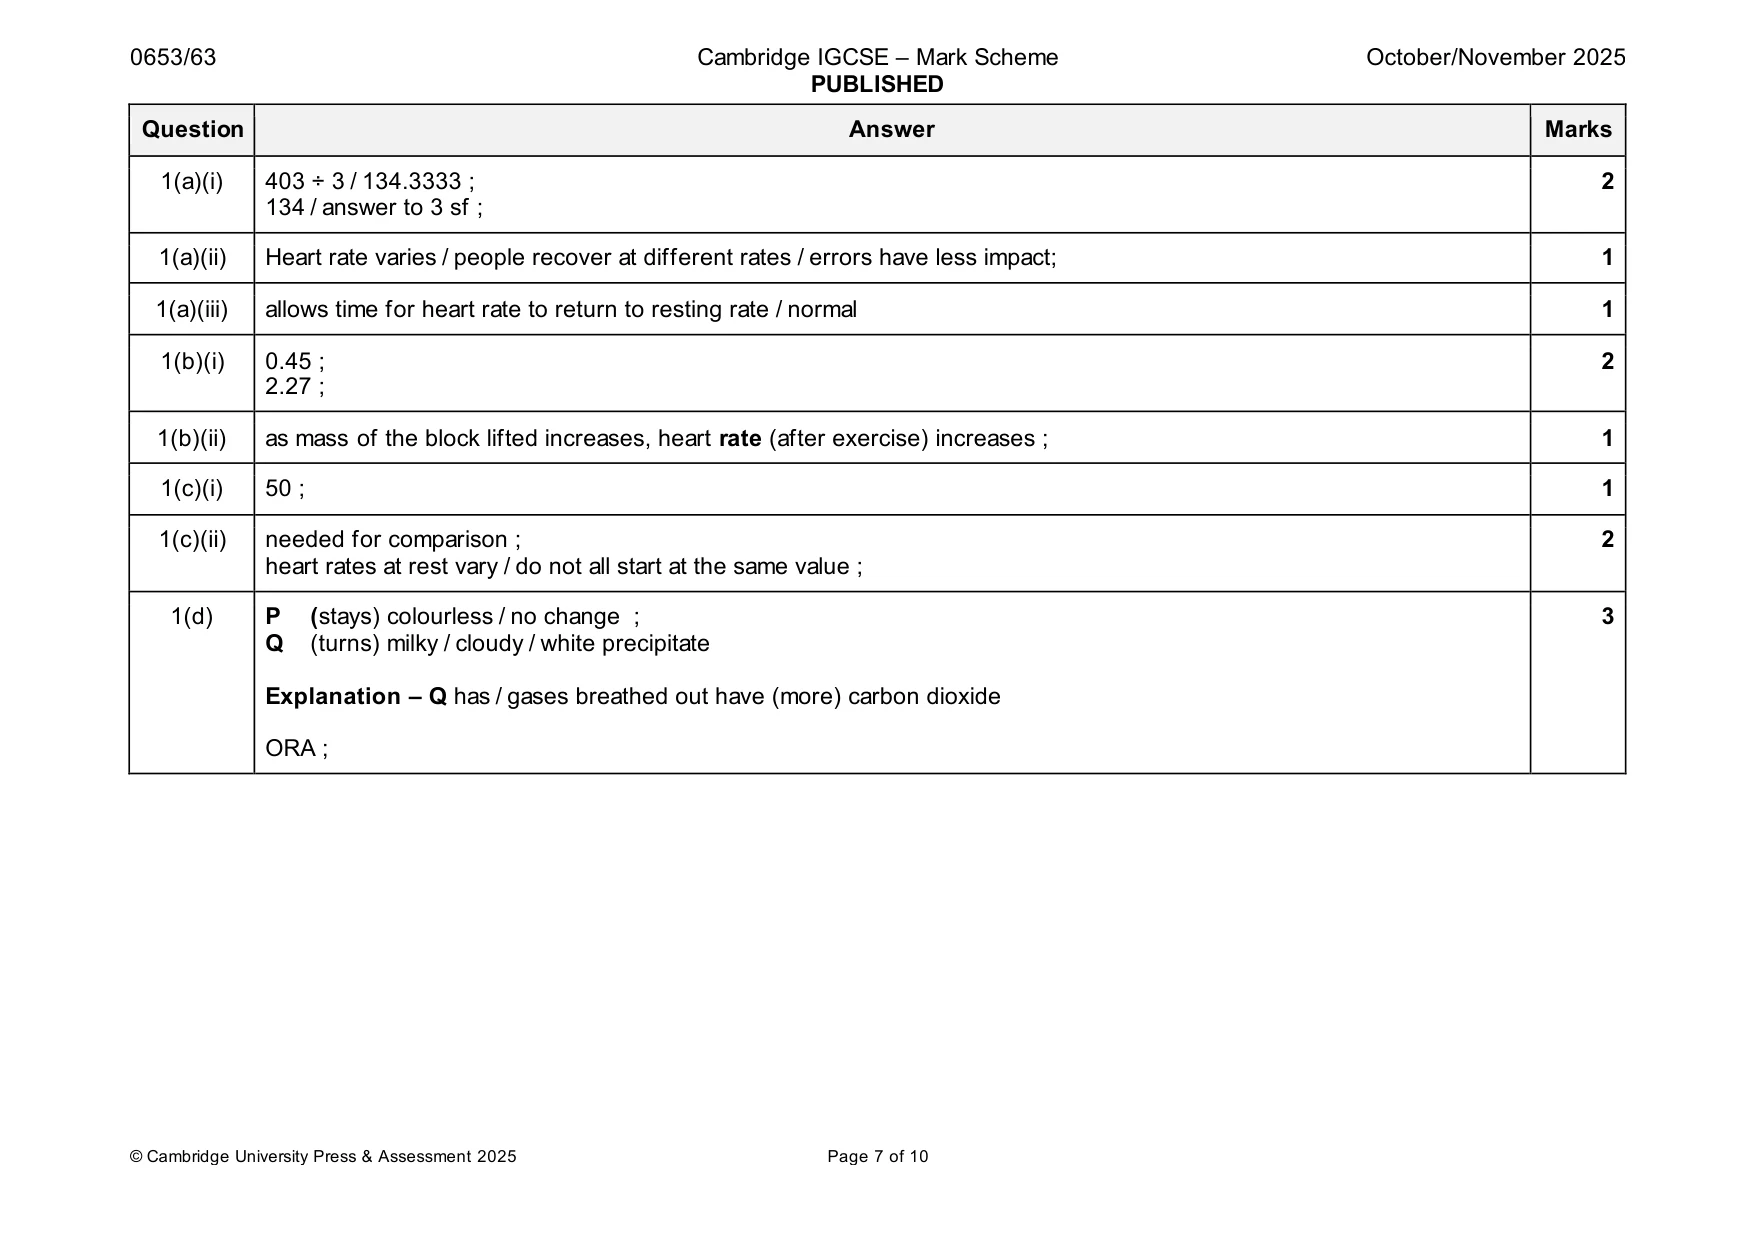
Mark scheme: Question Answer Marks 1(a)(i) 403 ÷ 3 / 134.3333 ; 2 134 / answer to 3 sf ; 1(a)(ii) Heart rate varies / people recover at different rates / errors have less impact; 1 1(a)(iii) allows time for heart rate to return to resting rate / normal 1 1(b)(i) 0.45 ; 2 2.27 ; 1(b)(ii) as mass of the block lifted increases, heart rate (after exercise) increases ; 1 1(c)(i) 50 ; 1 1(c)(ii) needed for comparison ; 2 heart rates at rest vary / do not all start at the same value ; 1(d) P (stays) colourless / no change ; 3 Q (turns) milky / cloudy / white precipitate Explanation – Q has / gases breathed out have (more) carbon dioxide ORA ;
Q2 · A student investigates the effect on the boiling point of water of dissolving solid H in…
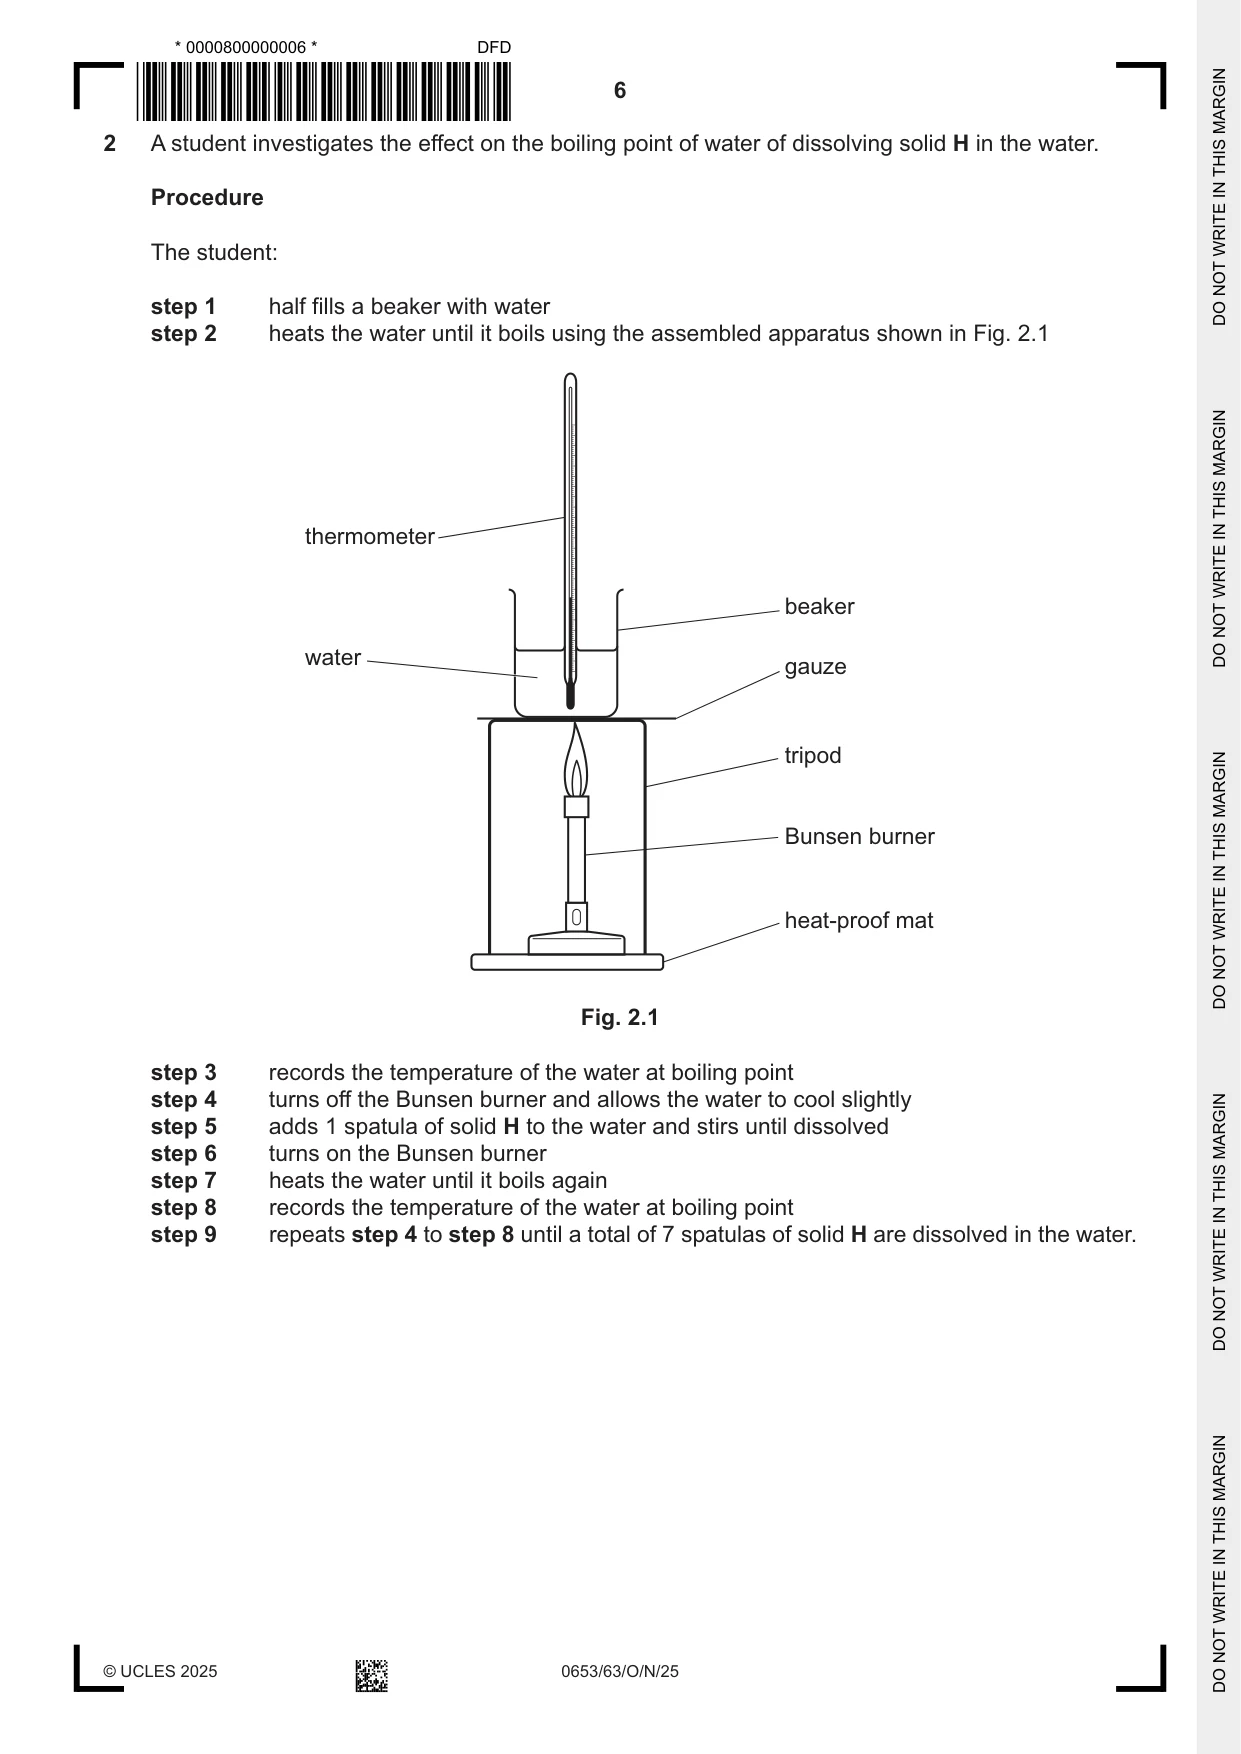
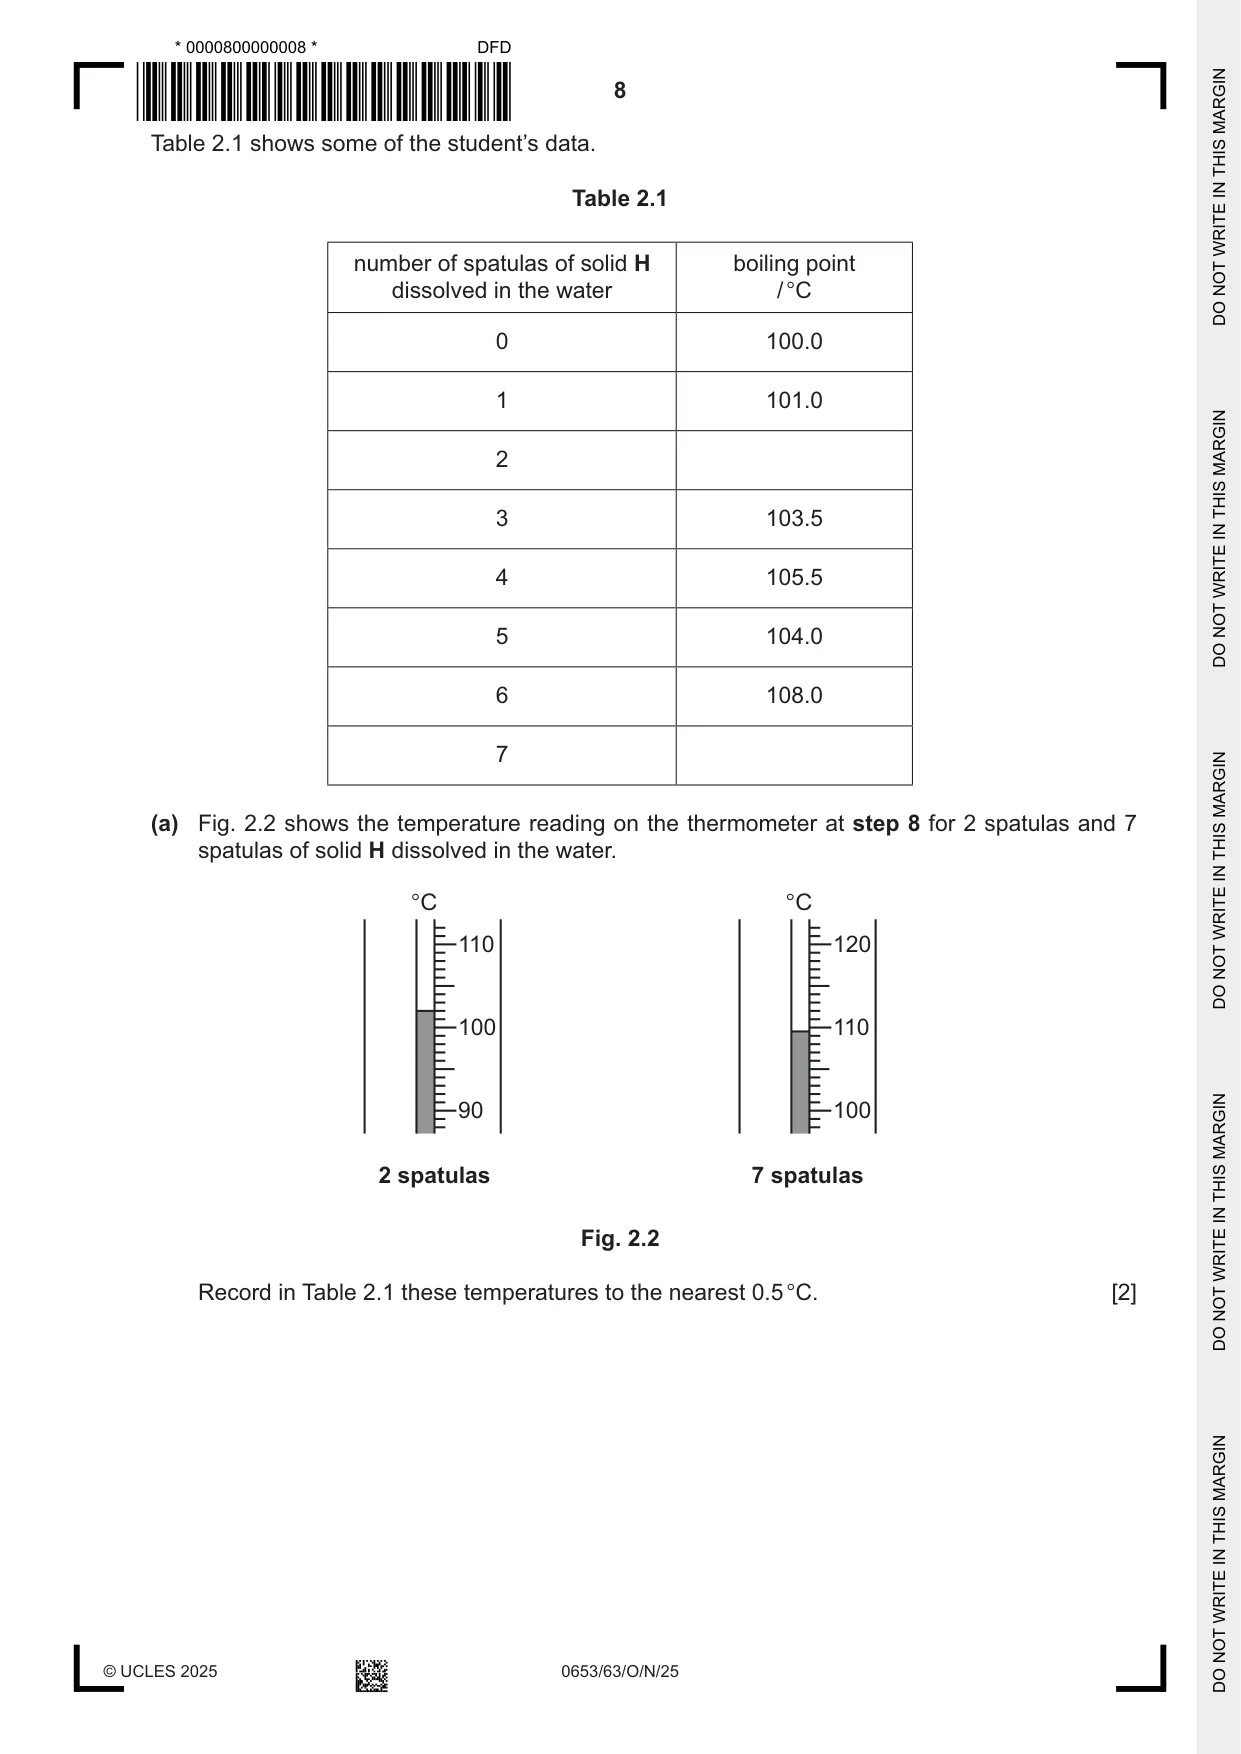
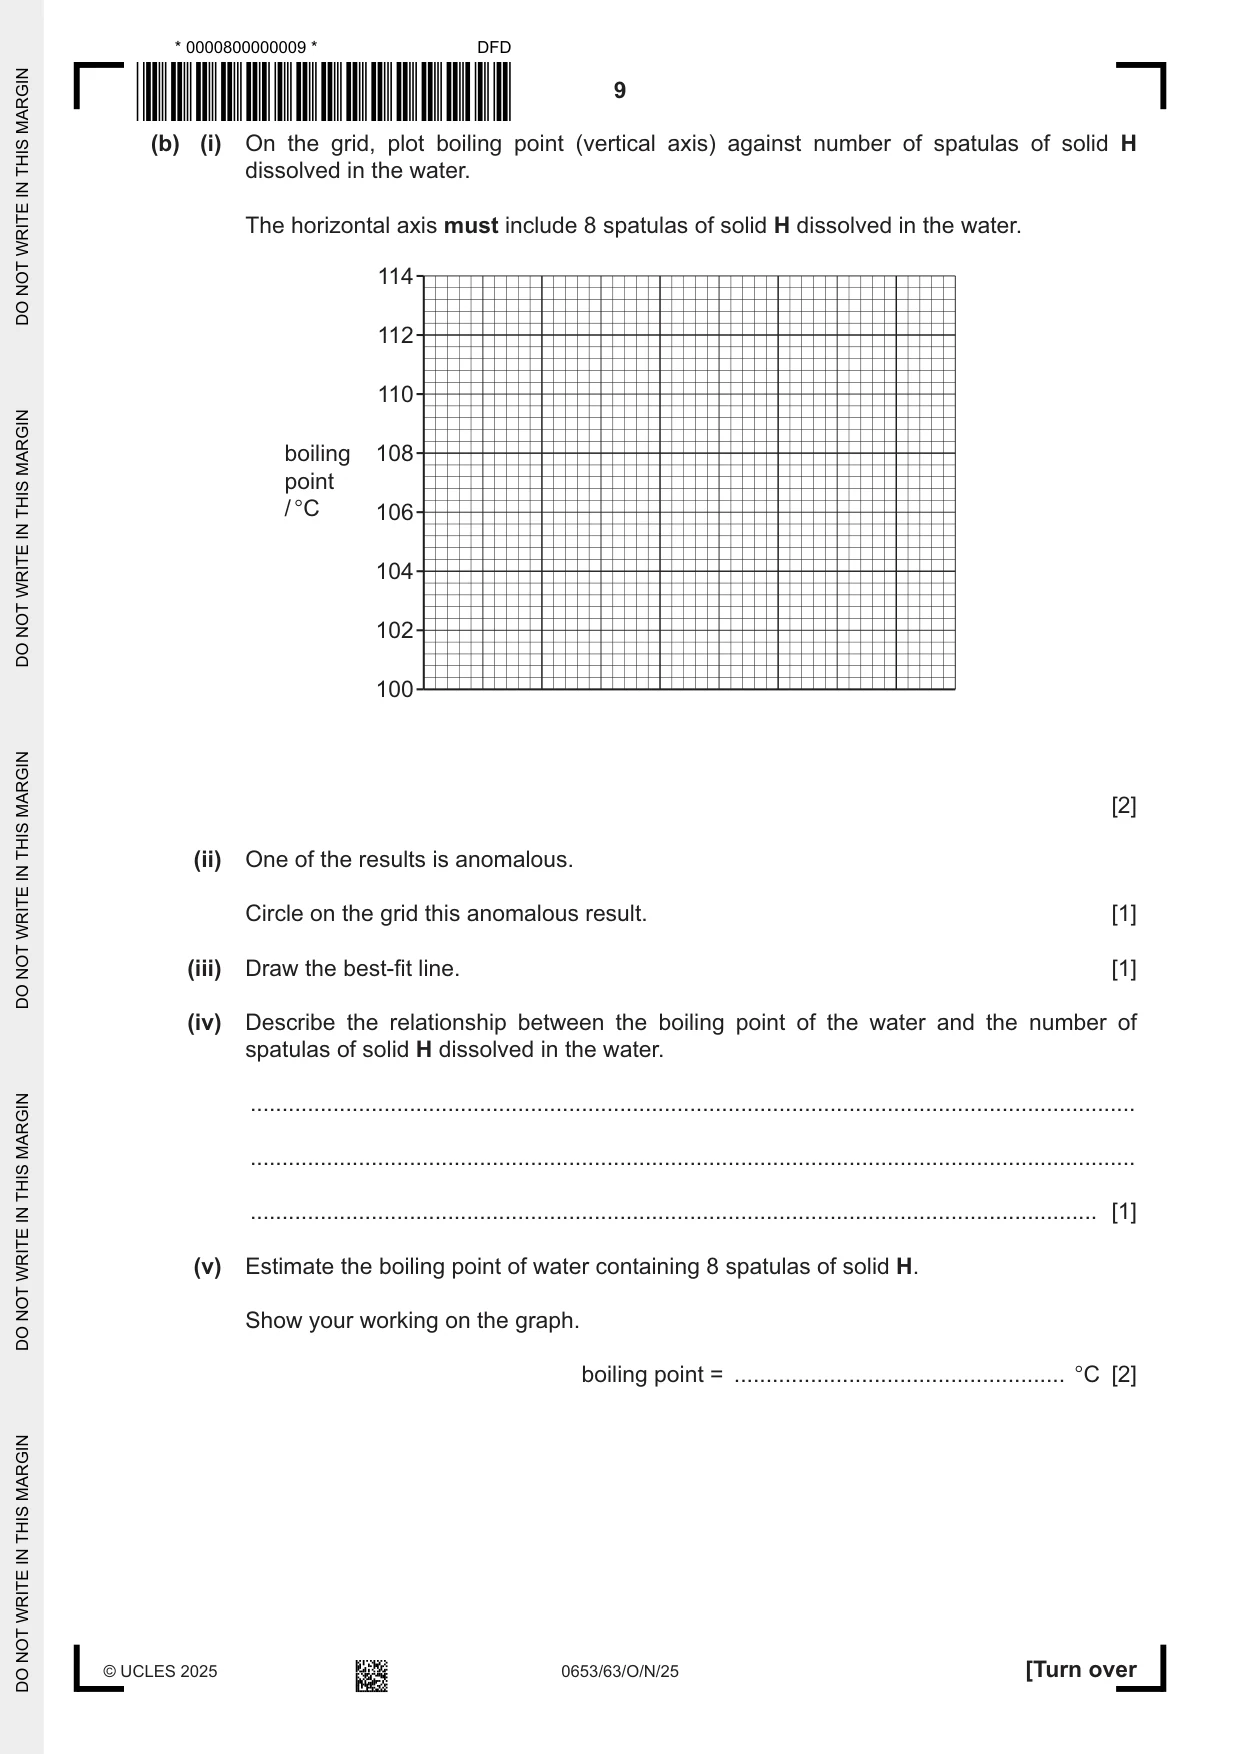
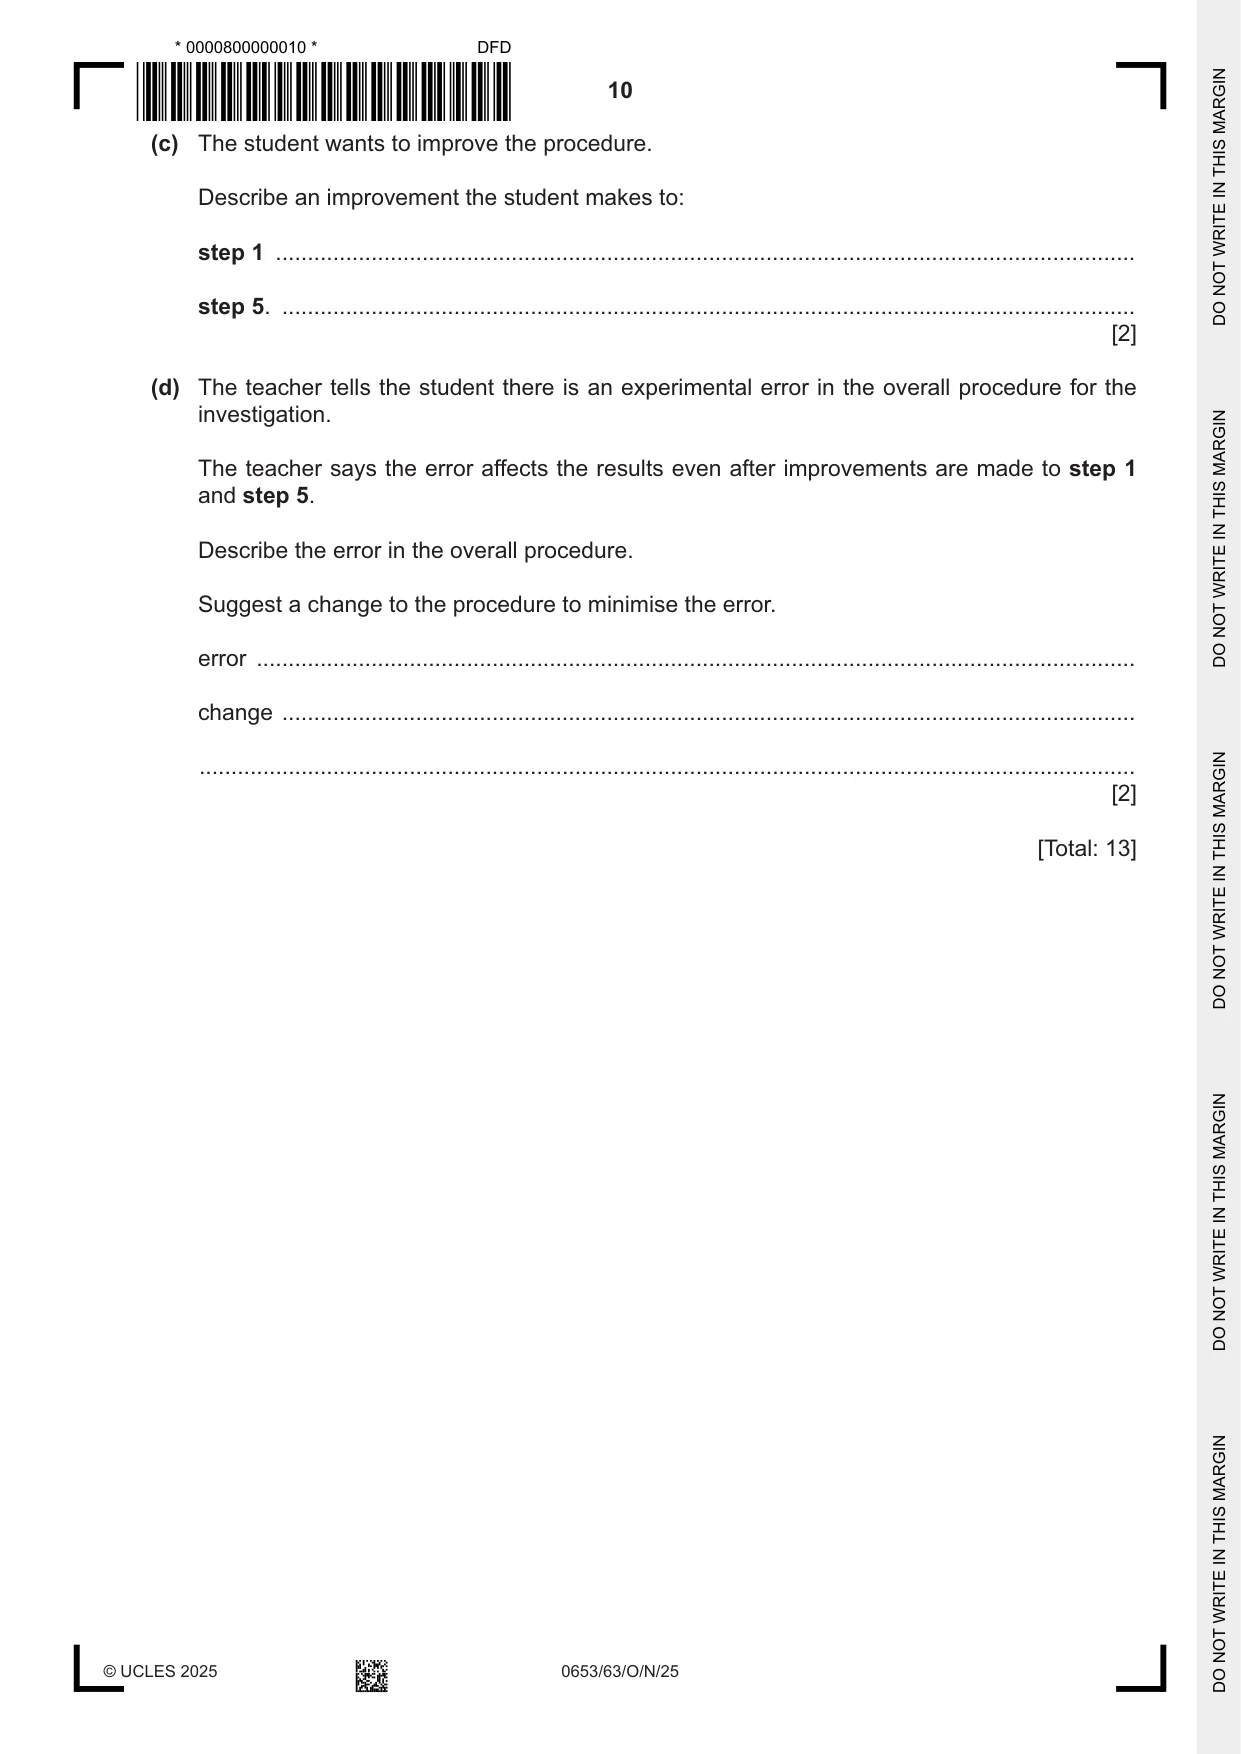
2 A student investigates the effect on the boiling point of water of dissolving solid H in the water. Procedure The student: step 1 half fills a beaker with water step 2 heats the water until it boils using the assembled apparatus shown in Fig. 2.1 thermometer beaker water gauze tripod Bunsen burner heat-proof mat Fig. 2.1 step 3 records the temperature of the water at boiling point step 4 turns off the Bunsen burner and allows the water to cool slightly step 5 adds 1 spatula of solid H to the water and stirs until dissolved step 6 turns on the Bunsen burner step 7 heats the water until it boils again step 8 records the temperature of the water at boiling point step 9 repeats step 4 to step 8 until a total of 7 spatulas of solid H are dissolved in the water. Table 2.1 shows some of the student’s data. Table 2.1 number of spatulas of solid H boiling point dissolved in the water / °C 0 100.0 1 101.0 2 3 103.5 4 105.5 5 104.0 6 108.0 7 (a) Fig. 2.2 shows the temperature reading on the thermometer at step 8 for 2 spatulas and 7 spatulas of solid H dissolved in the water. °C °C 110 120 100 110 90 100 2 spatulas 7 spatulas Fig. 2.2 Record in Table 2.1 these temperatures to the nearest 0.5 °C. [2] (b) (i) On the grid, plot boiling point (vertical axis) against number of spatulas of solid H dissolved in the water. The horizontal axis must include 8 spatulas of solid H dissolved in the water. 114 112 110 boiling 108 point / °C 106 104 102 100 [2] (ii) One of the results is anomalous. Circle on the grid this anomalous result. [1] (iii) Draw the best-fit line. [1] (iv) Describe the relationship between the boiling point of the water and the number of spatulas of solid H dissolved in the water. ........................................................................................................................................... ........................................................................................................................................... ..................................................................................................................................... [1] (v) Estimate the boiling point of water containing 8 spatulas of solid H. Show your working on the graph. boiling point = .................................................... °C [2] (c) The student wants to improve the procedure. Describe an improvement the student makes to: step 1 ....................................................................................................................................... step 5. ...................................................................................................................................... [2] (d) The teacher tells the student there is an experimental error in the overall procedure for the investigation. The teacher says the error affects the results even after improvements are made to step 1 and step 5. Describe the error in the overall procedure. Suggest a change to the procedure to minimise the error. error .......................................................................................................................................... change ...................................................................................................................................... ................................................................................................................................................... [2] [Total: 13]
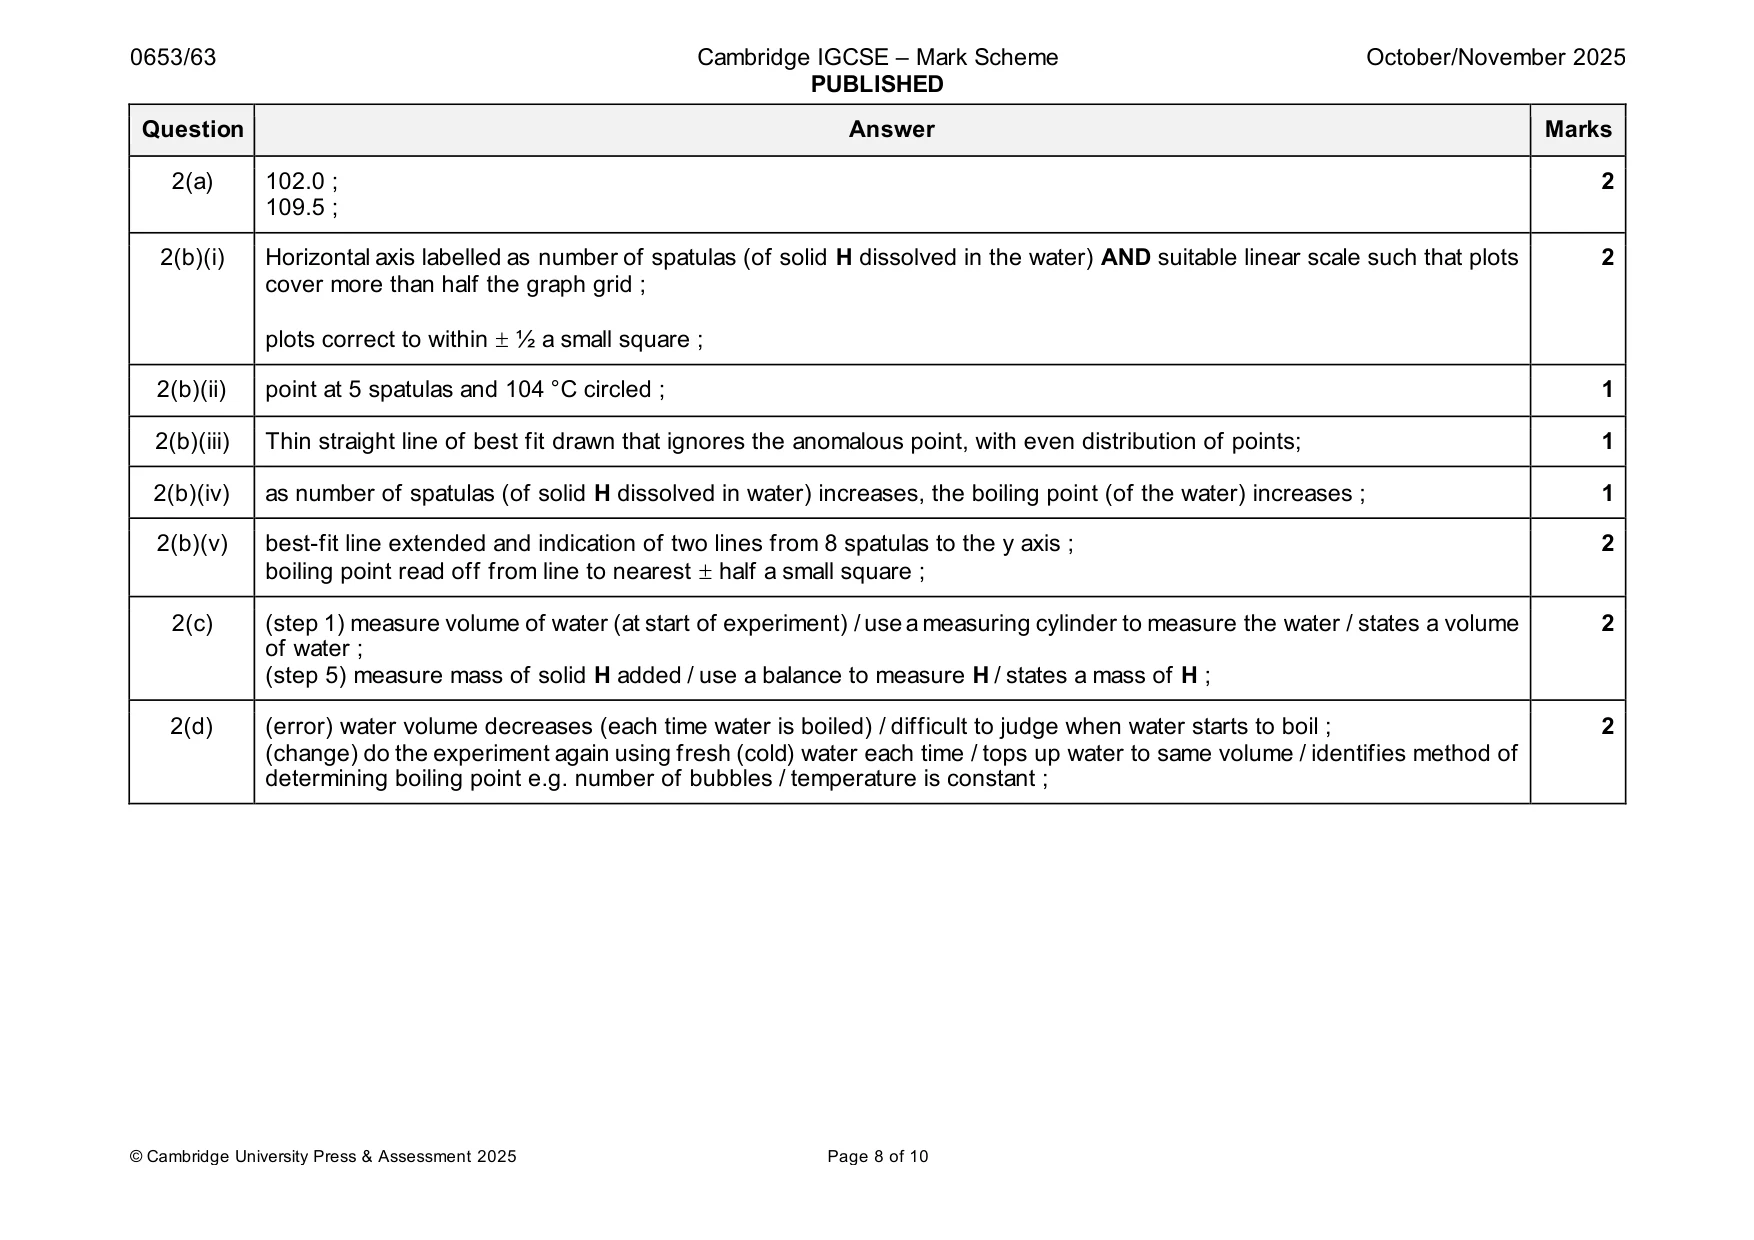
Mark scheme: 2(a) 102.0 ; 2 109.5 ; 2(b)(i) Horizontal axis labelled as number of spatulas (of solid H dissolved in the water) AND suitable linear scale such that plots 2 cover more than half the graph grid ; plots correct to within ½ a small square ; 2(b)(ii) point at 5 spatulas and 104 °C circled ; 1 2(b)(iii) Thin straight line of best fit drawn that ignores the anomalous point, with even distribution of points; 1 2(b)(iv) as number of spatulas (of solid H dissolved in water) increases, the boiling point (of the water) increases ; 1 2(b)(v) best-fit line extended and indication of two lines from 8 spatulas to the y axis ; 2 boiling point read off from line to nearest half a small square ; 2(c) (step 1) measure volume of water (at start of experiment) / use a measuring cylinder to measure the water / states a volume 2 of water ; (step 5) measure mass of solid H added / use a balance to measure H / states a mass of H ; 2(d) (error) water volume decreases (each time water is boiled) / difficult to judge when water starts to boil ; 2 (change) do the experiment again using fresh (cold) water each time / tops up water to same volume / identifies method of determining boiling point e.g. number of bubbles / temperature is constant ;
Q3 · A student investigates the resistance X of a fixed resistor using: • a cell of voltage V…
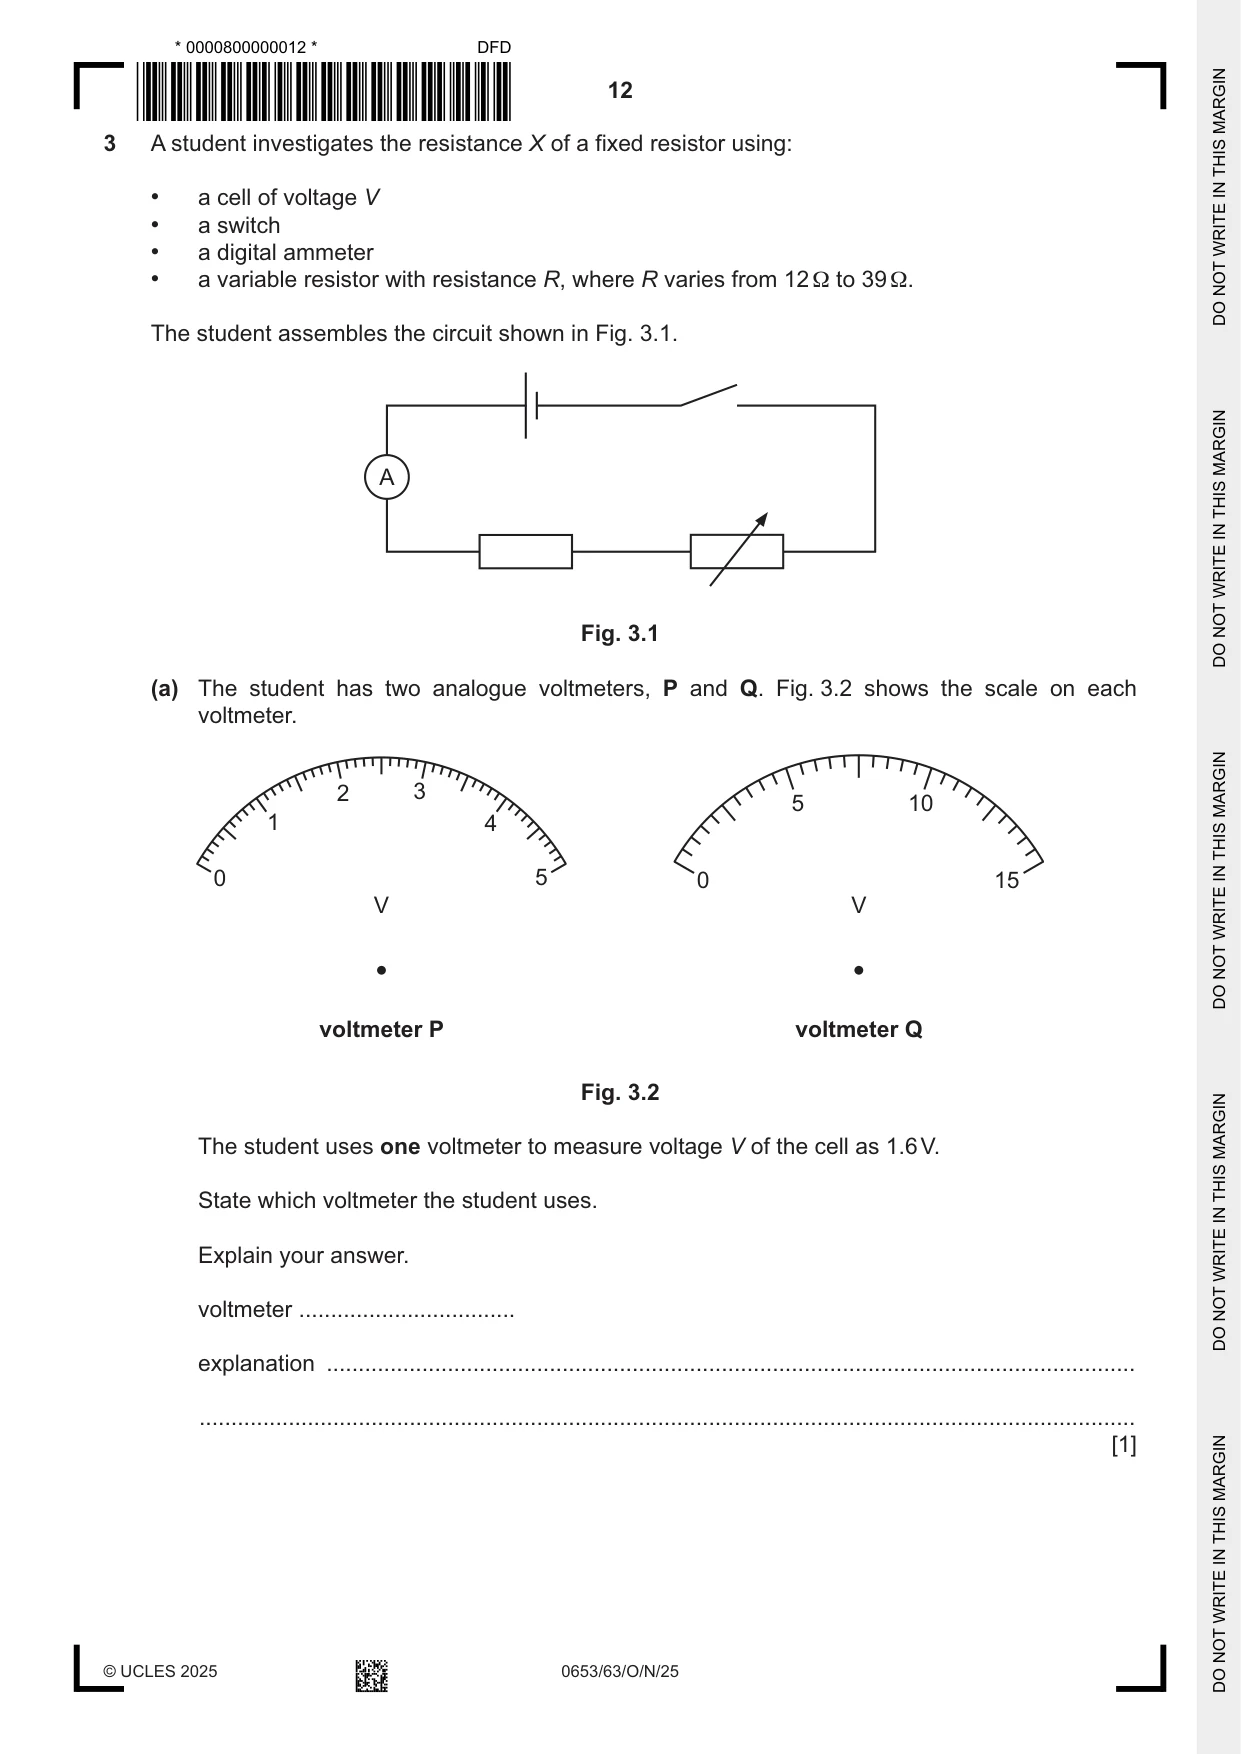
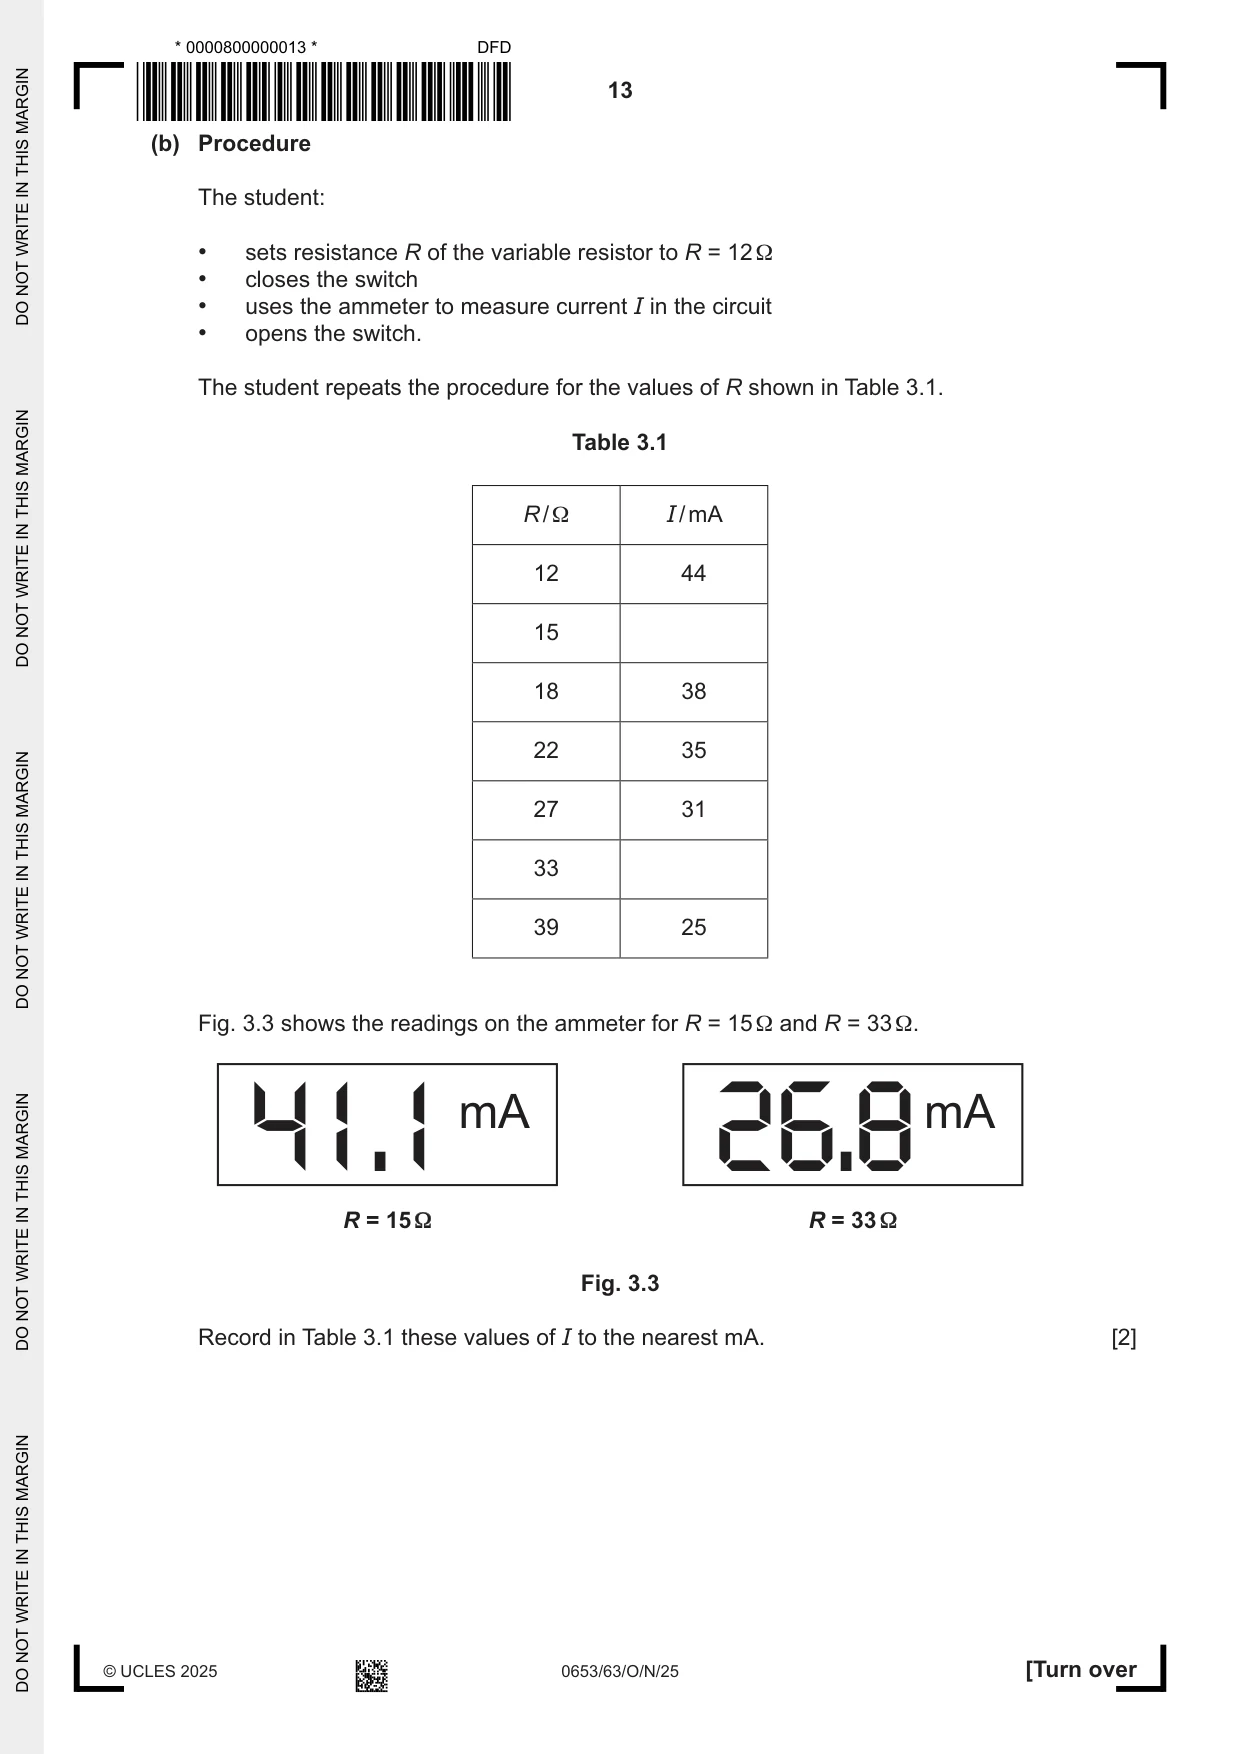
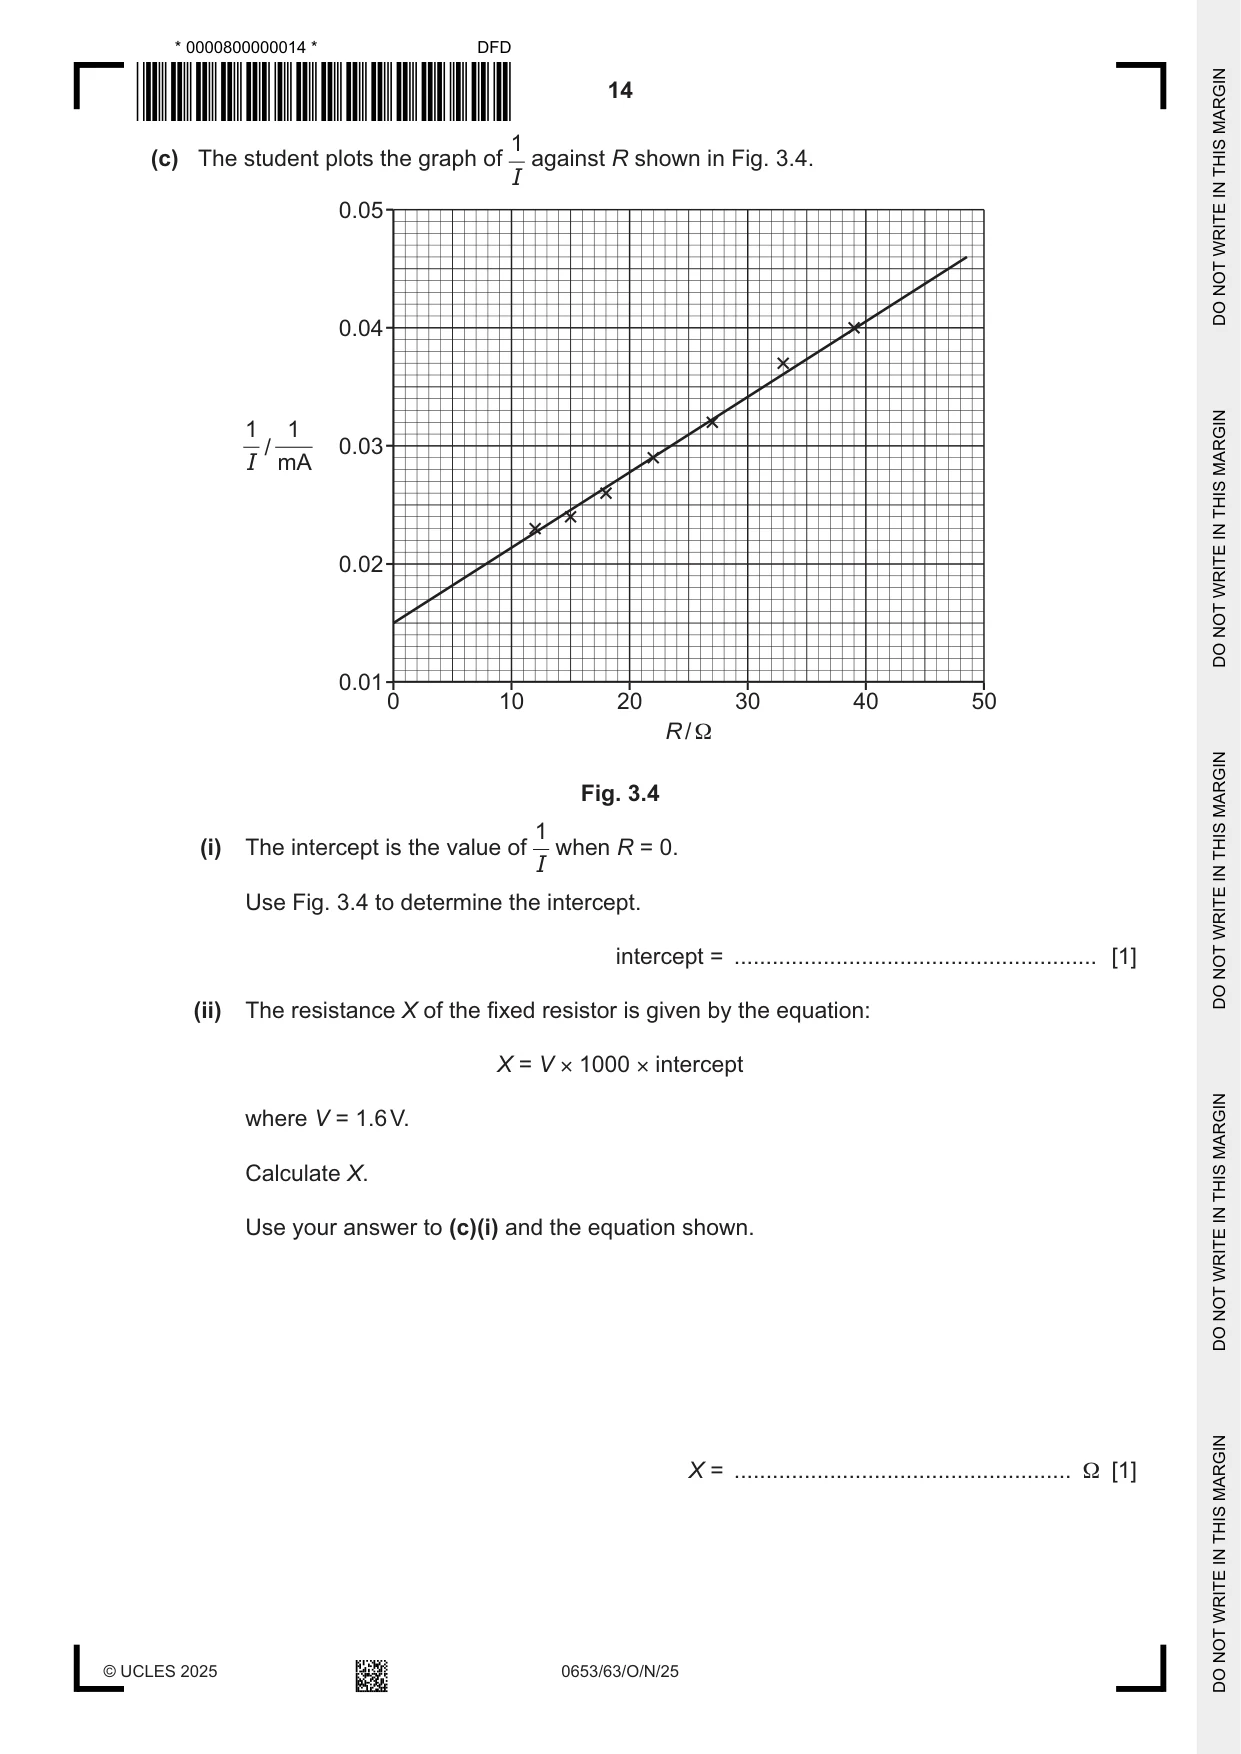
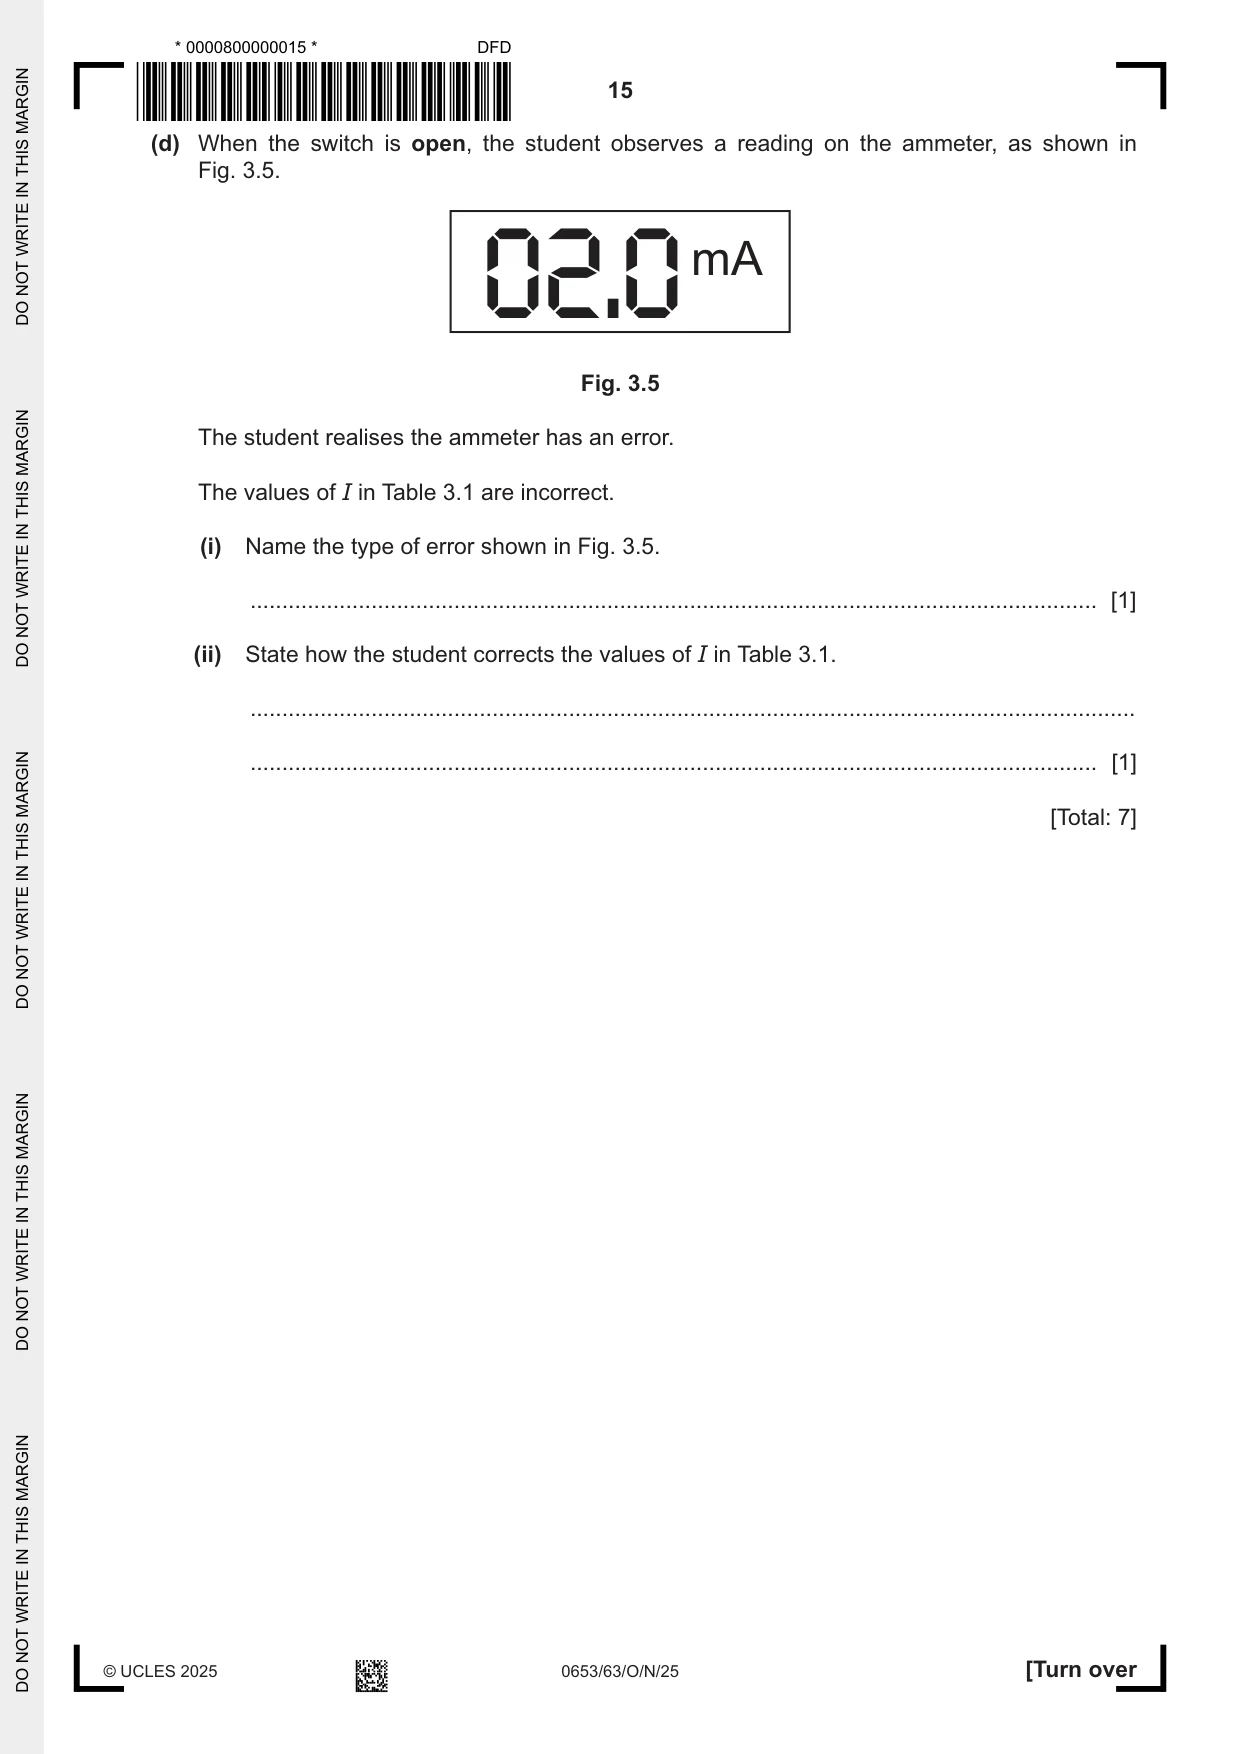
3 A student investigates the resistance X of a fixed resistor using: • a cell of voltage V • a switch • a digital ammeter • a variable resistor with resistance R, where R varies from 12 Ω to 39 Ω. The student assembles the circuit shown in Fig. 3.1. A Fig. 3.1 (a) The student has two analogue voltmeters, P and Q. Fig. 3.2 shows the scale on each voltmeter. 2 3 5 10 1 4 0 5 0 15 V V voltmeter P voltmeter Q Fig. 3.2 The student uses one voltmeter to measure voltage V of the cell as 1.6 V. State which voltmeter the student uses. Explain your answer. voltmeter .................................. explanation ............................................................................................................................... ................................................................................................................................................... [1] (b) Procedure The student: • sets resistance R of the variable resistor to R = 12 Ω • closes the switch • uses the ammeter to measure current I in the circuit • opens the switch. The student repeats the procedure for the values of R shown in Table 3.1. Table 3.1 R / Ω I / mA 12 44 15 18 38 22 35 27 31 33 39 25 Fig. 3.3 shows the readings on the ammeter for R = 15 Ω and R = 33 Ω. mA mA 41.1 26.8 R = 15 Ω R = 33 Ω Fig. 3.3 Record in Table 3.1 these values of I to the nearest mA. [2] 1 (c) The student plots the graph of against R shown in Fig. 3.4. I 0.05 0.04 1 1 / 0.03 I mA 0.02 0.01 0 10 20 30 40 50 R / Ω Fig. 3.4 1 (i) The intercept is the value of when R = 0. I Use Fig. 3.4 to determine the intercept. intercept = ......................................................... [1] (ii) The resistance X of the fixed resistor is given by the equation: X = V × 1000 × intercept where V = 1.6 V. Calculate X. Use your answer to (c)(i) and the equation shown. X = ..................................................... Ω [1] (d) When the switch is open, the student observes a reading on the ammeter, as shown in Fig. 3.5. mA 02.0 Fig. 3.5 The student realises the ammeter has an error. The values of I in Table 3.1 are incorrect. (i) Name the type of error shown in Fig. 3.5. ..................................................................................................................................... [1] (ii) State how the student corrects the values of I in Table 3.1. ........................................................................................................................................... ..................................................................................................................................... [1] [Total: 7]
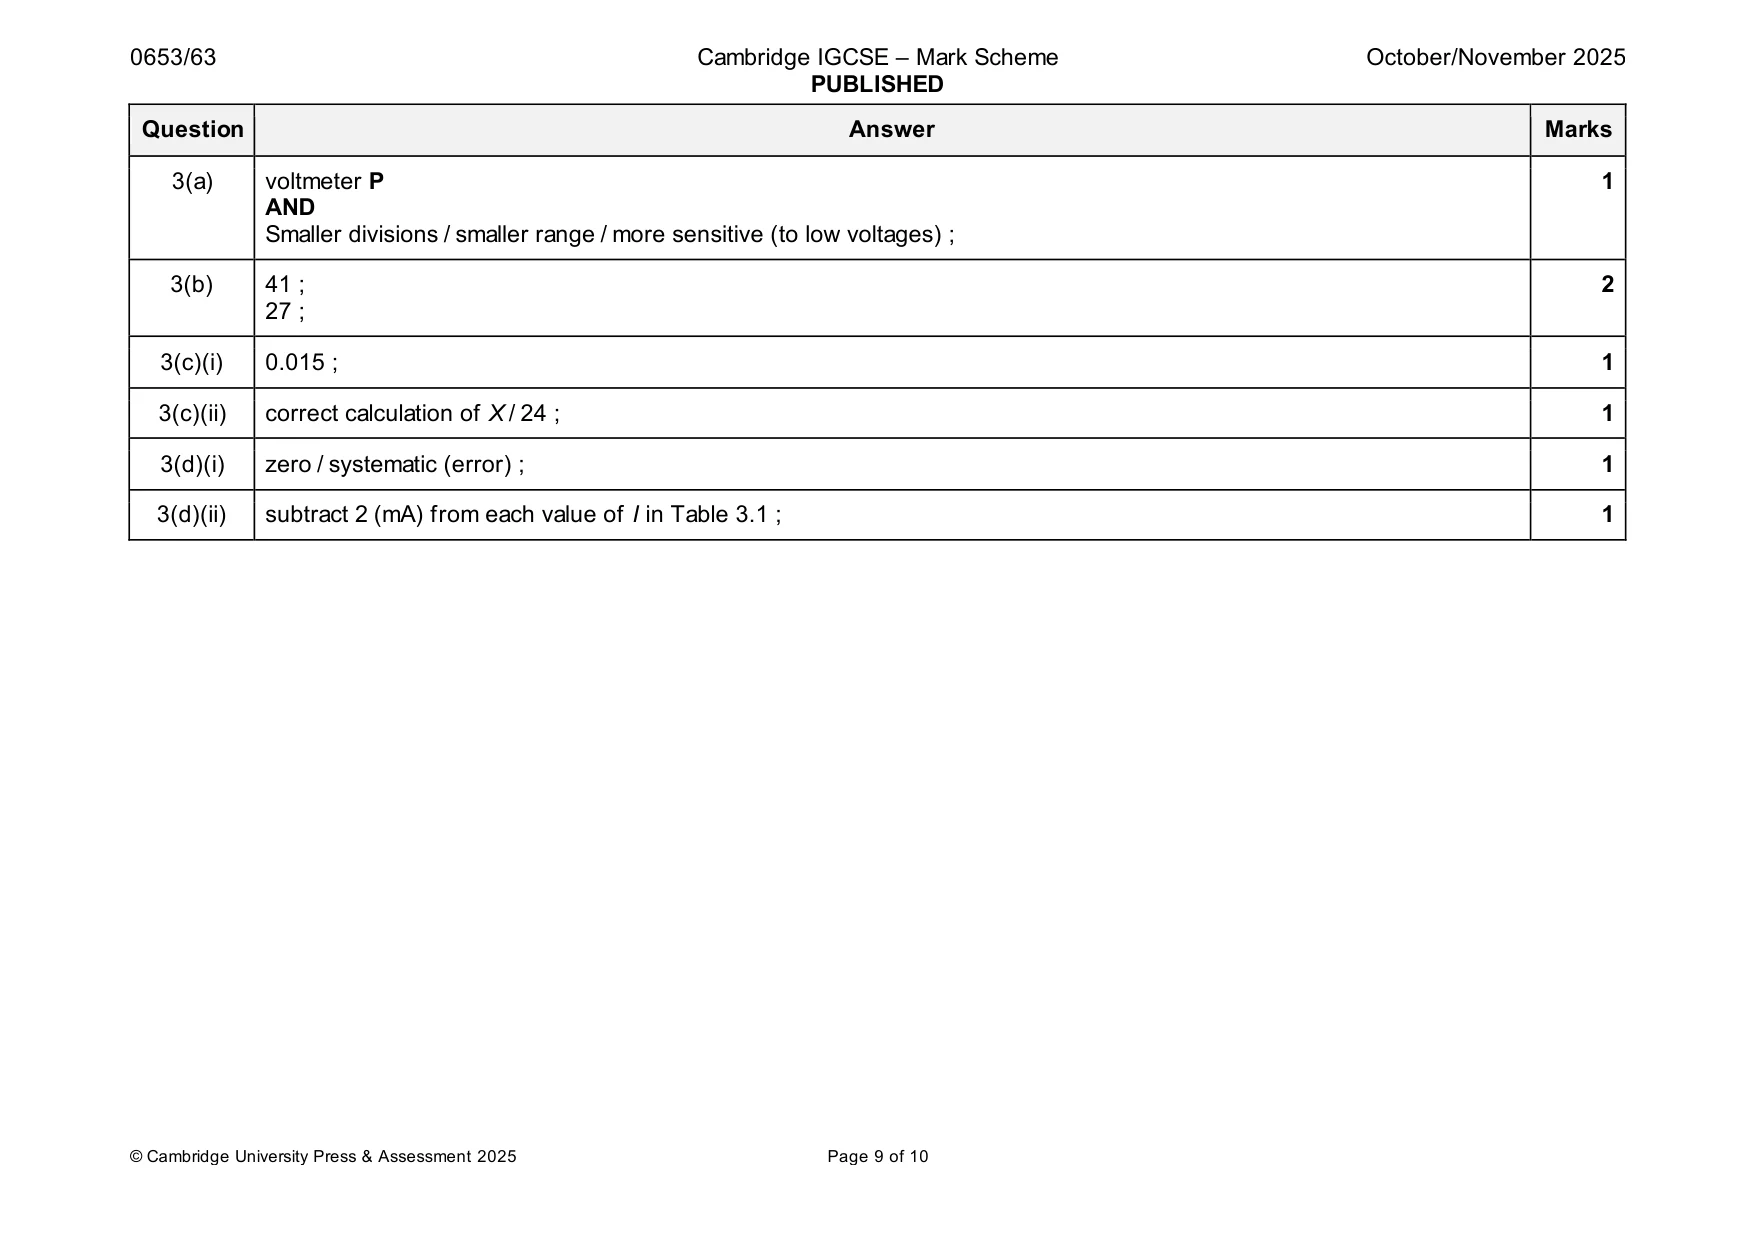
Mark scheme: 3(a) voltmeter P 1 AND Smaller divisions / smaller range / more sensitive (to low voltages) ; 3(b) 41 ; 2 27 ; 3(c)(i) 0.015 ; 1 3(c)(ii) correct calculation of X / 24 ; 1 3(d)(i) zero / systematic (error) ; 1 3(d)(ii) subtract 2 (mA) from each value of I in Table 3.1 ; 1
Q4 · A wooden beam of length l and width w
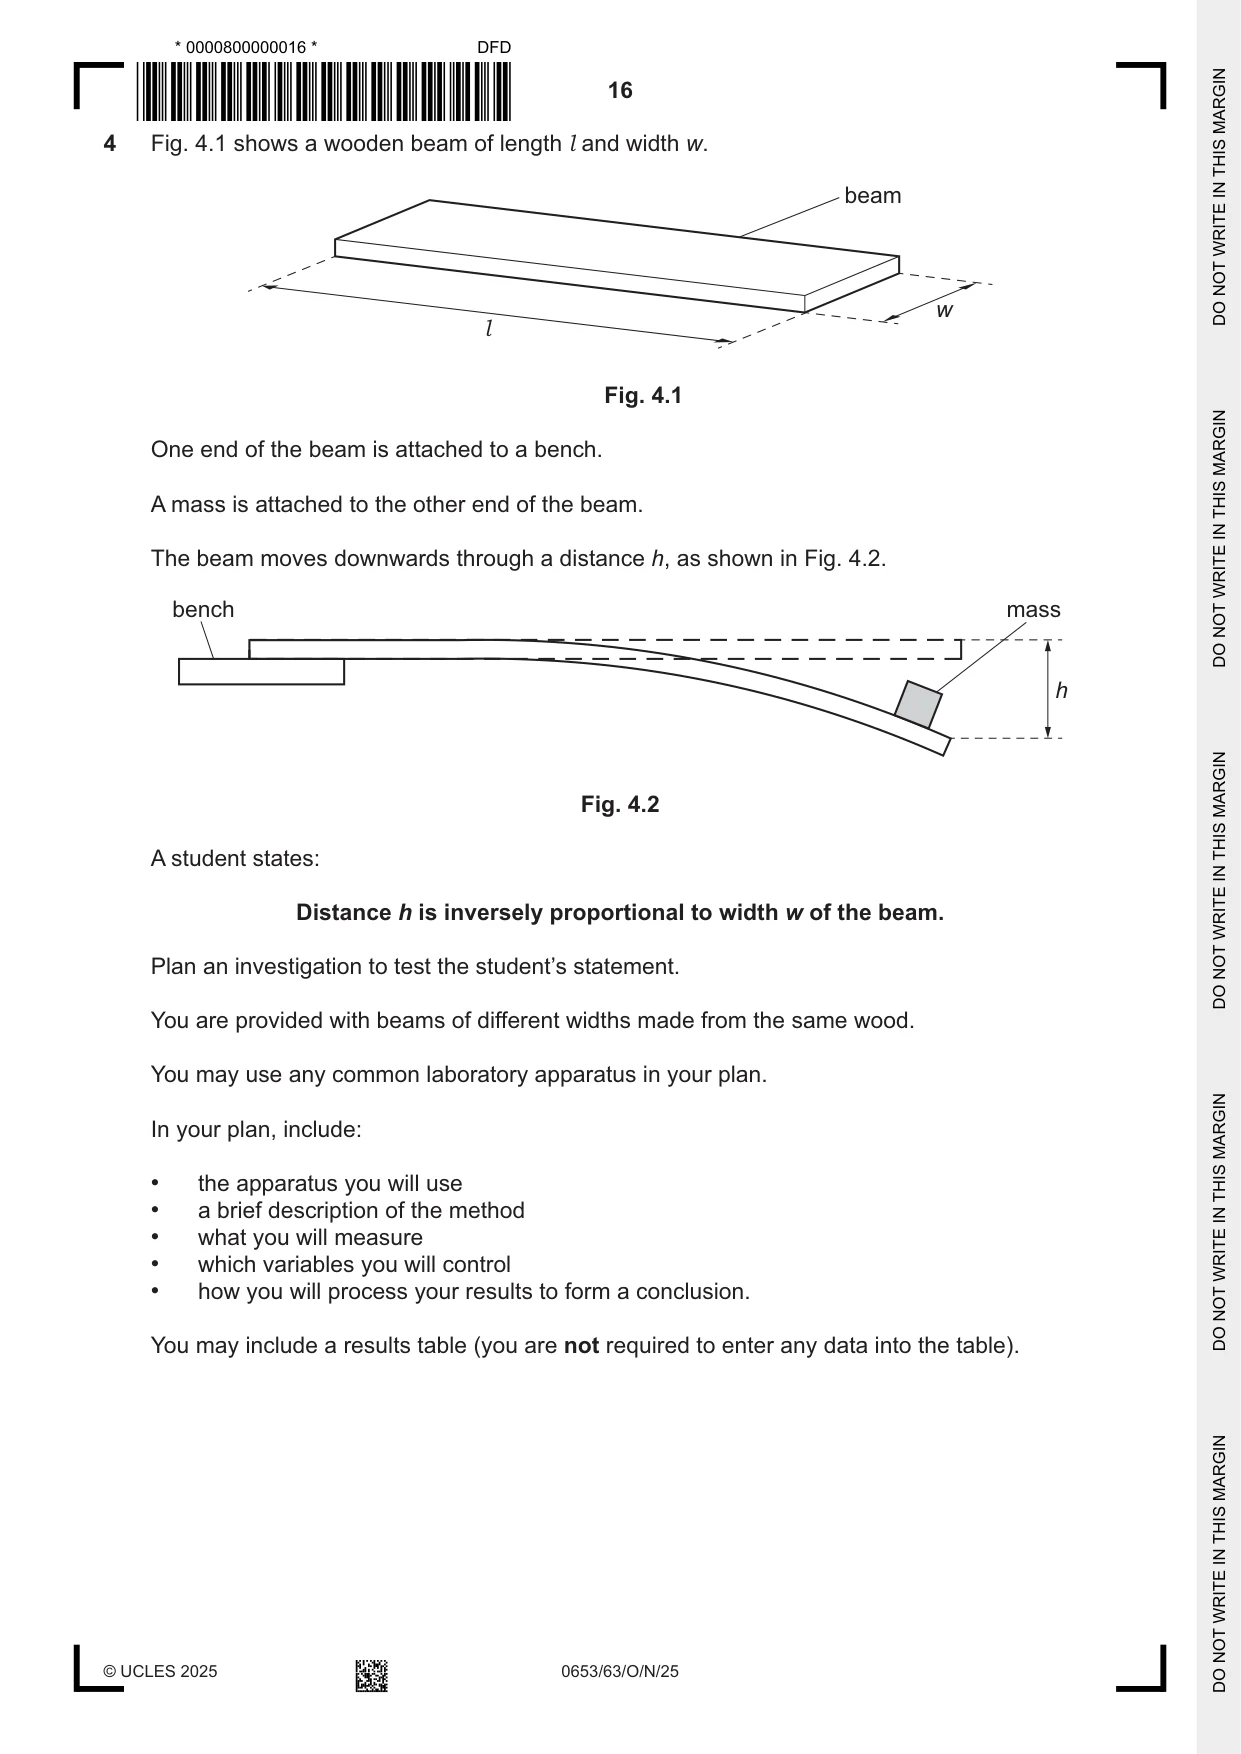
4 Fig. 4.1 shows a wooden beam of length l and width w. beam w l Fig. 4.1 One end of the beam is attached to a bench. A mass is attached to the other end of the beam. The beam moves downwards through a distance h, as shown in Fig. 4.2. bench mass h Fig. 4.2 A student states: Distance h is inversely proportional to width w of the beam. Plan an investigation to test the student’s statement. You are provided with beams of different widths made from the same wood. You may use any common laboratory apparatus in your plan. In your plan, include: • the apparatus you will use • a brief description of the method • what you will measure • which variables you will control • how you will process your results to form a conclusion. You may include a results table (you are not required to enter any data into the table). .......................................................................................................................................................... .......................................................................................................................................................... .......................................................................................................................................................... .......................................................................................................................................................... .......................................................................................................................................................... .......................................................................................................................................................... .......................................................................................................................................................... .......................................................................................................................................................... .......................................................................................................................................................... .......................................................................................................................................................... .......................................................................................................................................................... .......................................................................................................................................................... .......................................................................................................................................................... .......................................................................................................................................................... .................................................................................................................................................... [7]
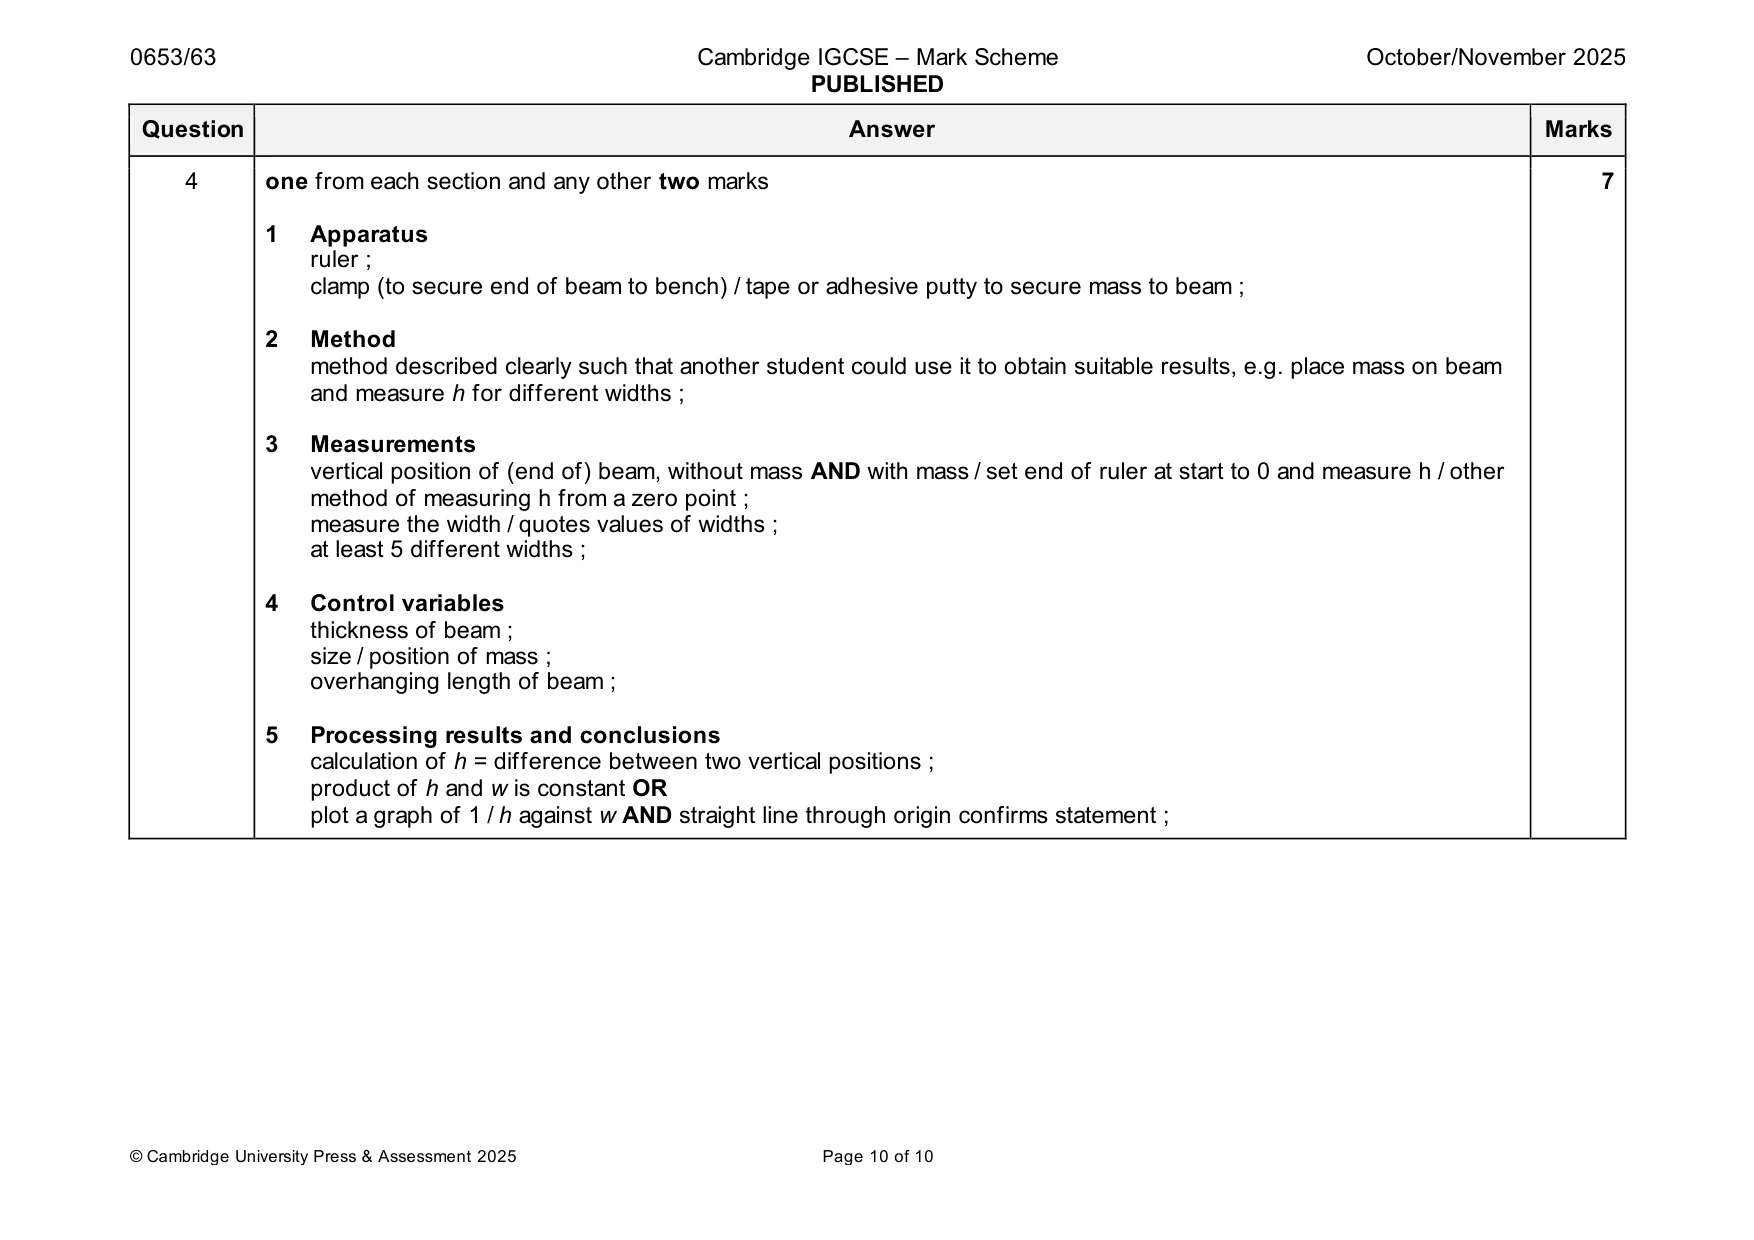
Mark scheme: 4 one from each section and any other two marks 7 1 Apparatus ruler ; clamp (to secure end of beam to bench) / tape or adhesive putty to secure mass to beam ; 2 Method method described clearly such that another student could use it to obtain suitable results, e.g. place mass on beam and measure h for different widths ; 3 Measurements vertical position of (end of) beam, without mass AND with mass / set end of ruler at start to 0 and measure h / other method of measuring h from a zero point ; measure the width / quotes values of widths ; at least 5 different widths ; 4 Control variables thickness of beam ; size / position of mass ; overhanging length of beam ; 5 Processing results and conclusions calculation of h = difference between two vertical positions ; product of h and w is constant OR plot a graph of 1 / h against w AND straight line through origin confirms statement ;
What was in this paper
The subtopics covered by these 4 questions, and how many questions each got. Open one in a new tab to see every Cambridge question on it.
What you needed in this session
Cambridge’s own grade thresholds for 2025 Oct/Nov, Paper 6 · Variant 3. A higher threshold means an easier paper — the bar moves with how the cohort did.