Cambridge IGCSE Science - Combined 0653 — 2024 May/June Paper 6 · Variant 3
0653/63/M/J/24 · 4 questions · 40 marks · ≈45 min
The question paper and its mark scheme, free to read here and free to download. This is Cambridge’s own paper, exactly as it was sat.
Question paper16 pages




Mark scheme8 pages
Answers below. Sit the paper first if you are practising.
Questions as text
Q1 · A student investigates the growth of plants
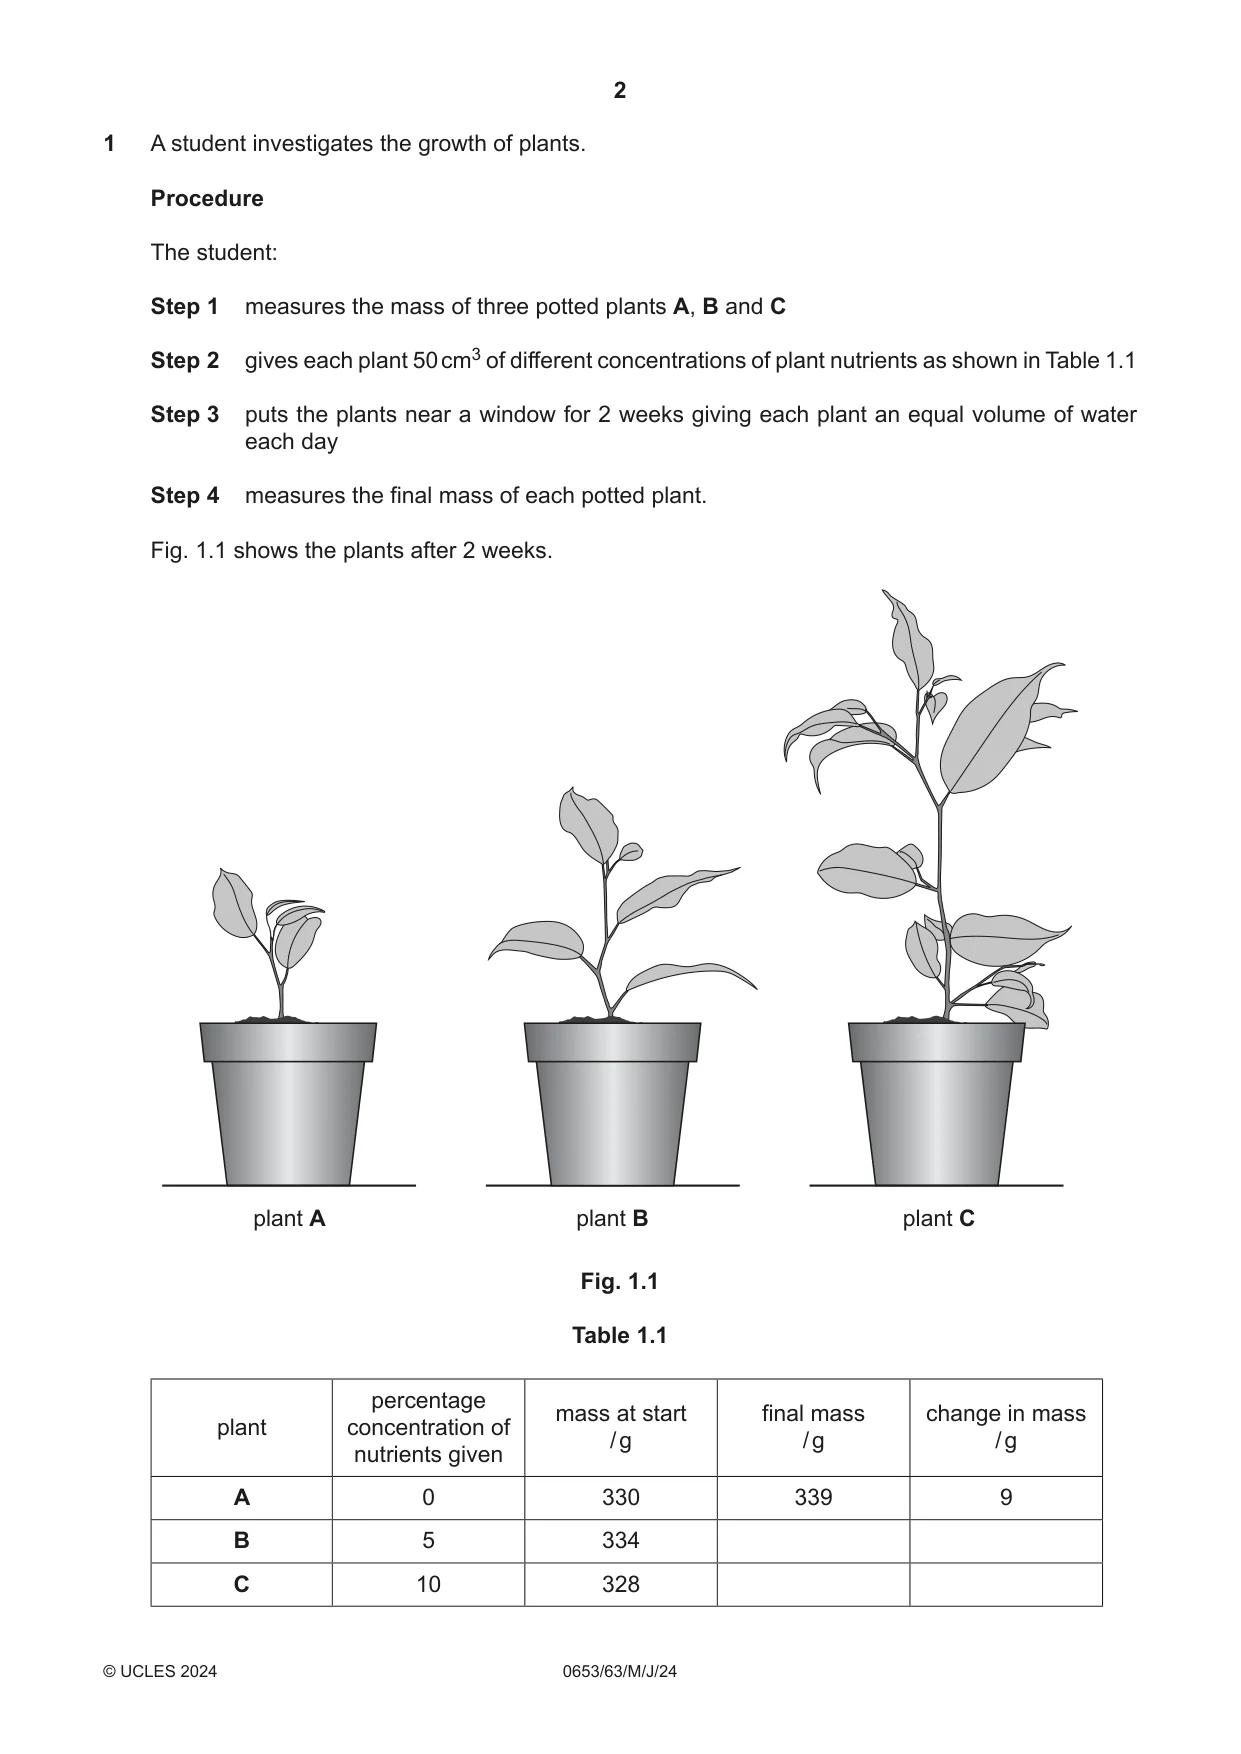
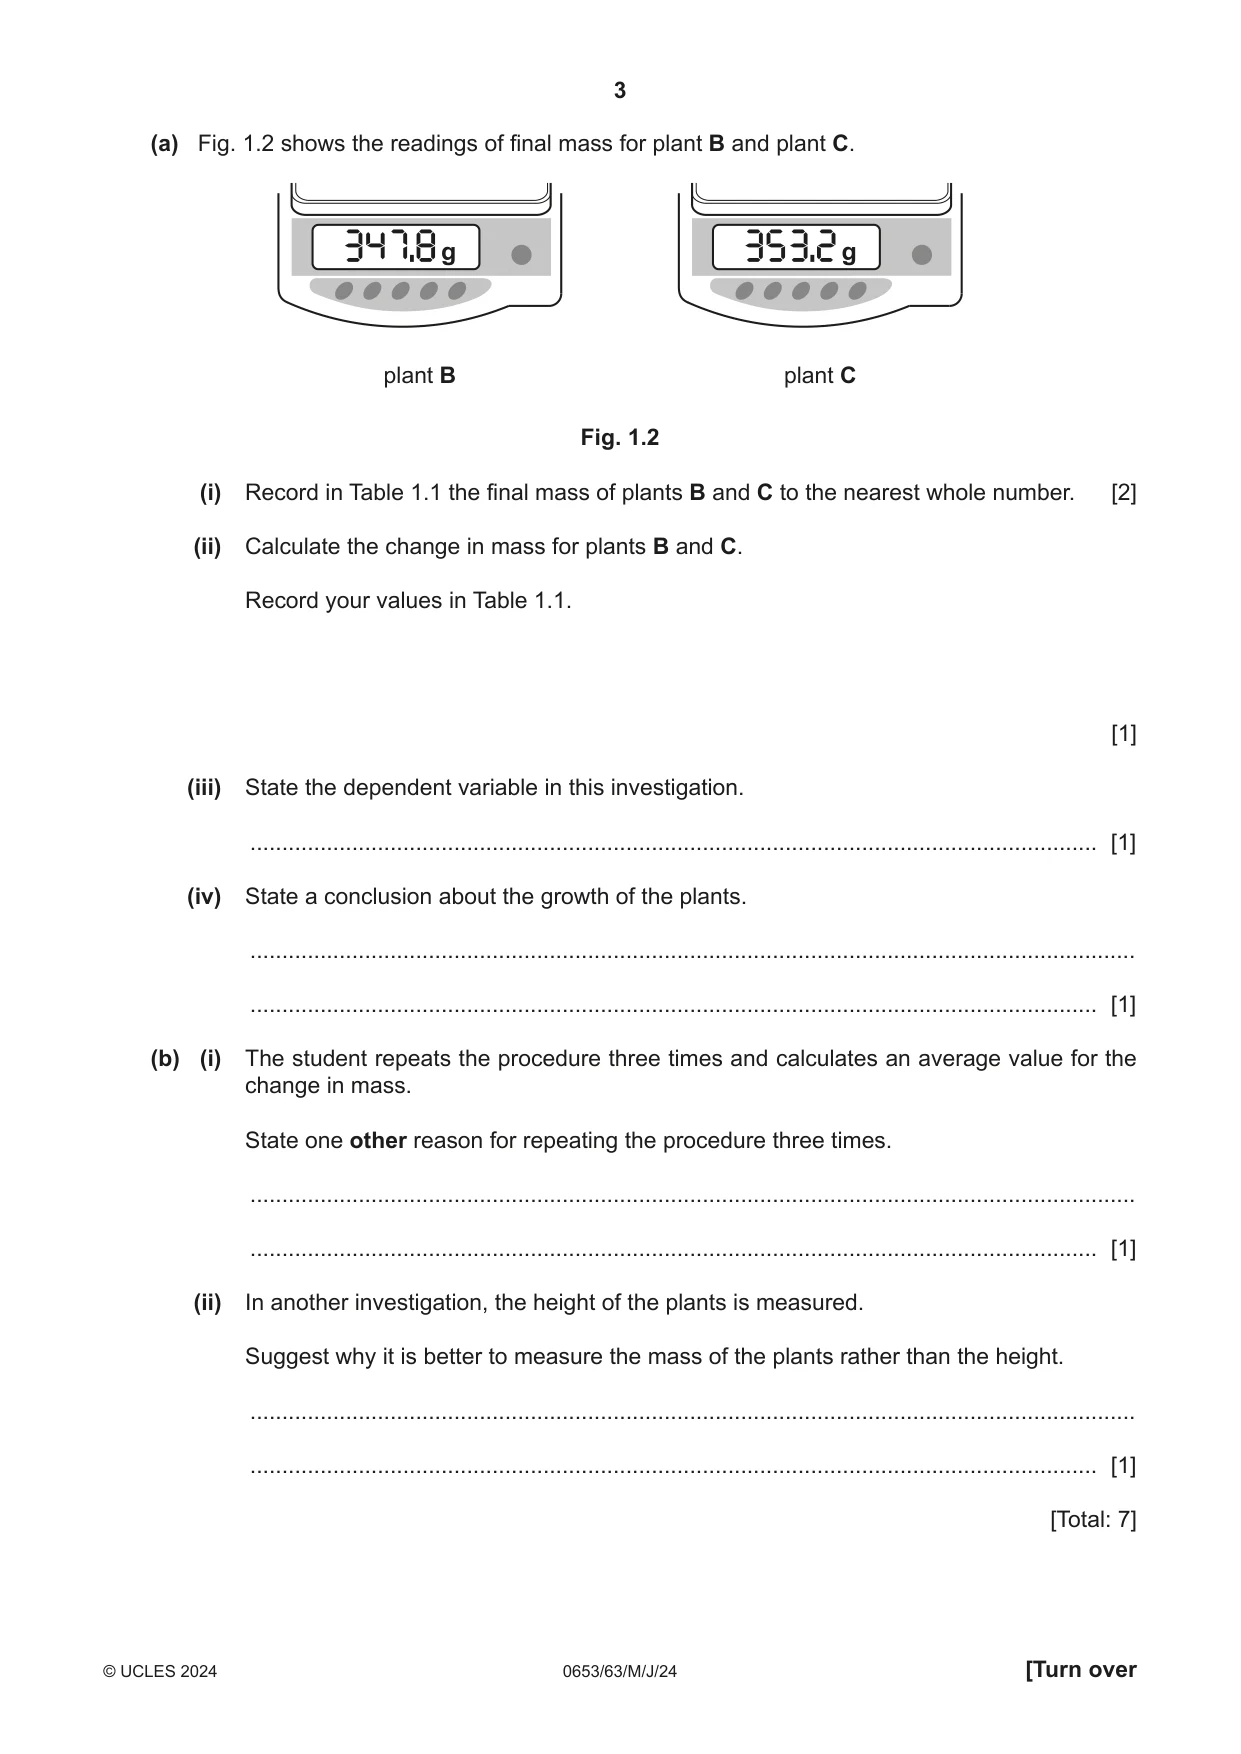
1 A student investigates the growth of plants. Procedure The student: Step 1 measures the mass of three potted plants A, B and C Step 2 gives each plant 50 cm3 of different concentrations of plant nutrients as shown in Table 1.1 Step 3 puts the plants near a window for 2 weeks giving each plant an equal volume of water each day Step 4 measures the final mass of each potted plant. Fig. 1.1 shows the plants after 2 weeks. plant A plant B plant C Fig. 1.1 Table 1.1 percentage mass at start final mass change in mass plant concentration of / g / g / g nutrients given A 0 330 339 9 B 5 334 C 10 328 (a) Fig. 1.2 shows the readings of final mass for plant B and plant C. g g plant B plant C Fig. 1.2 (i) Record in Table 1.1 the final mass of plants B and C to the nearest whole number. [2] (ii) Calculate the change in mass for plants B and C. Record your values in Table 1.1. [1] (iii) State the dependent variable in this investigation. ..................................................................................................................................... [1] (iv) State a conclusion about the growth of the plants. ........................................................................................................................................... ..................................................................................................................................... [1] (b) (i) The student repeats the procedure three times and calculates an average value for the change in mass. State one other reason for repeating the procedure three times. ........................................................................................................................................... ..................................................................................................................................... [1] (ii) In another investigation, the height of the plants is measured. Suggest why it is better to measure the mass of the plants rather than the height. ........................................................................................................................................... ..................................................................................................................................... [1] [Total: 7]
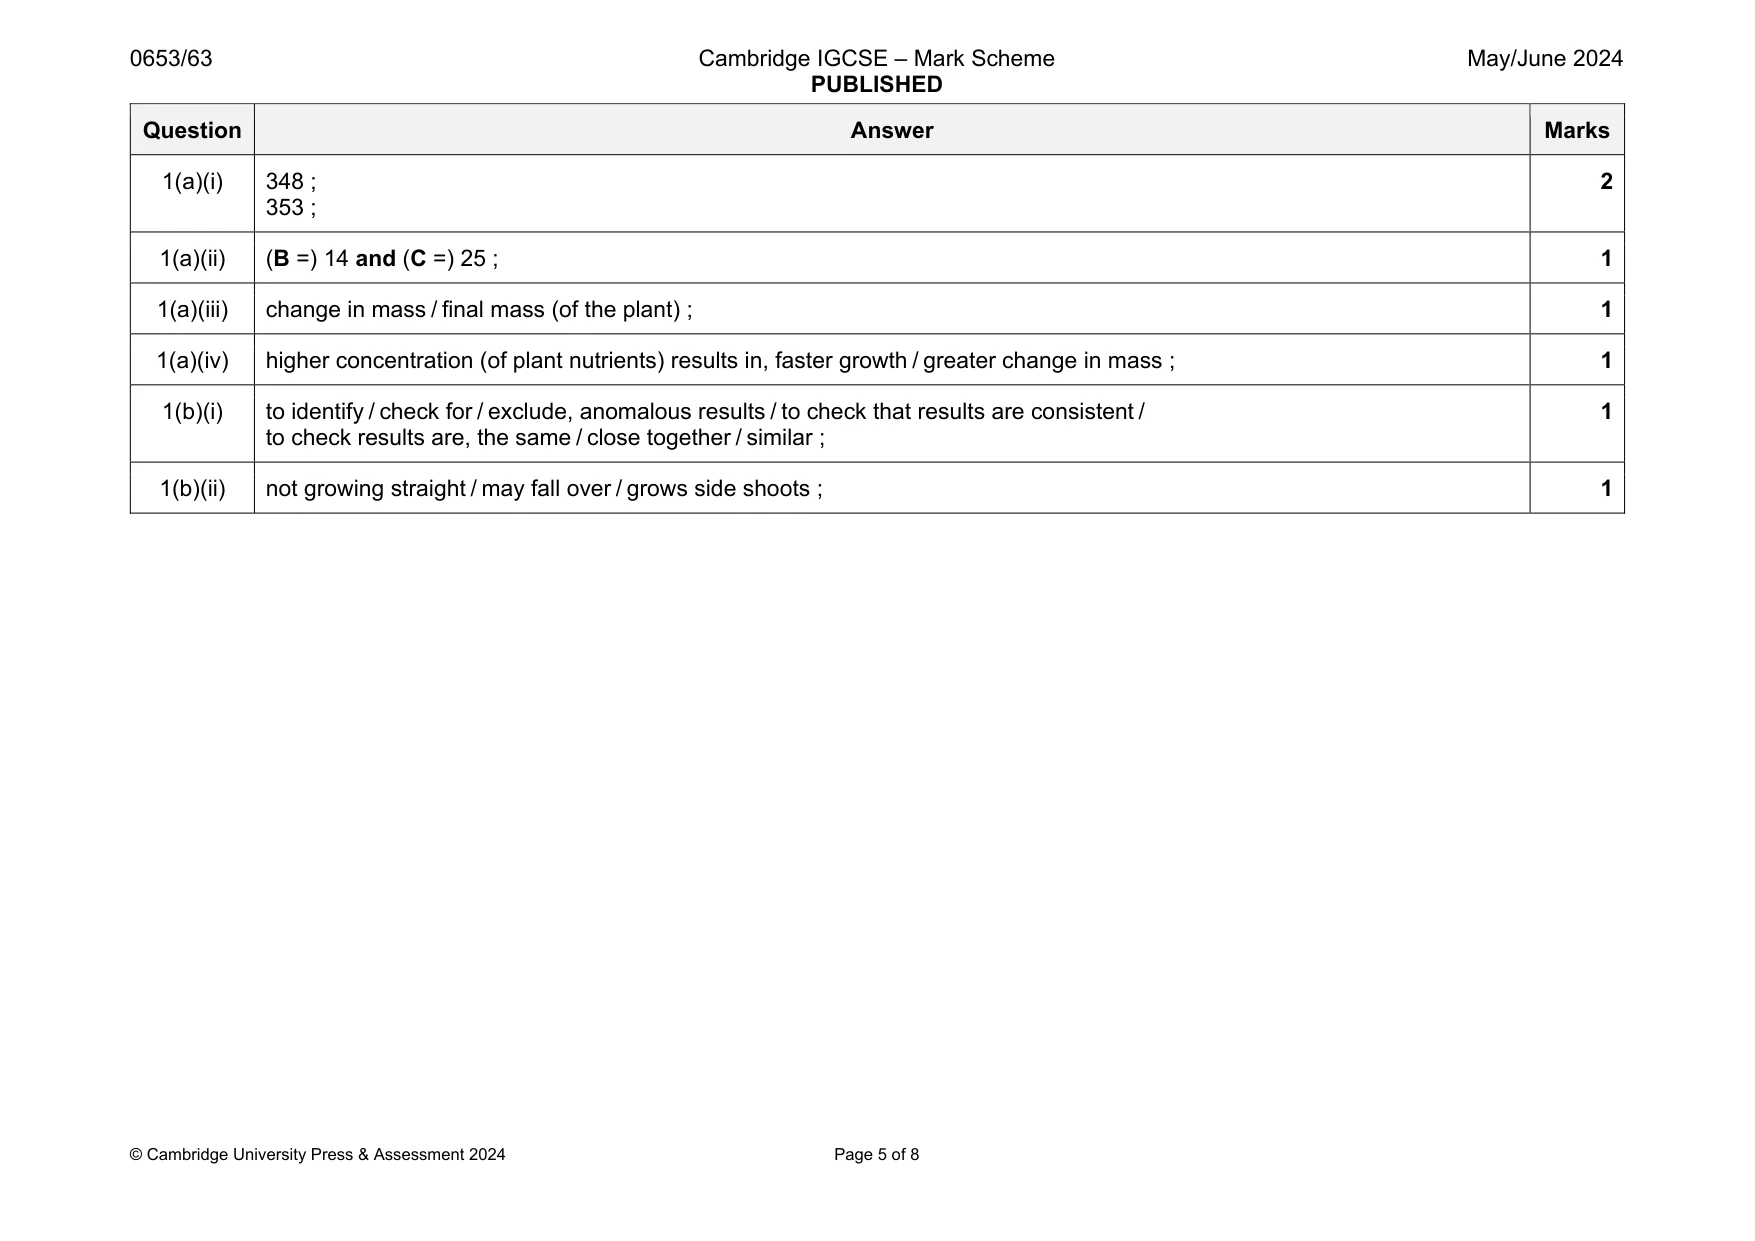
Mark scheme: 1(a)(i) 348 ; 353 ; 2 1(a)(ii) (B =) 14 and (C =) 25 ; 1 1(a)(iii) change in mass / final mass (of the plant) ; 1 1(a)(iv) higher concentration (of plant nutrients) results in, faster growth / greater change in mass ; 1 1(b)(i) to identify / check for / exclude, anomalous results / to check that results are consistent / to check results are, the same / close together / similar ; 1 1(b)(ii) not growing straight / may fall over / grows side shoots ; 1
Q2 · When seeds germinate, they use oxygen gas for aerobic respiration
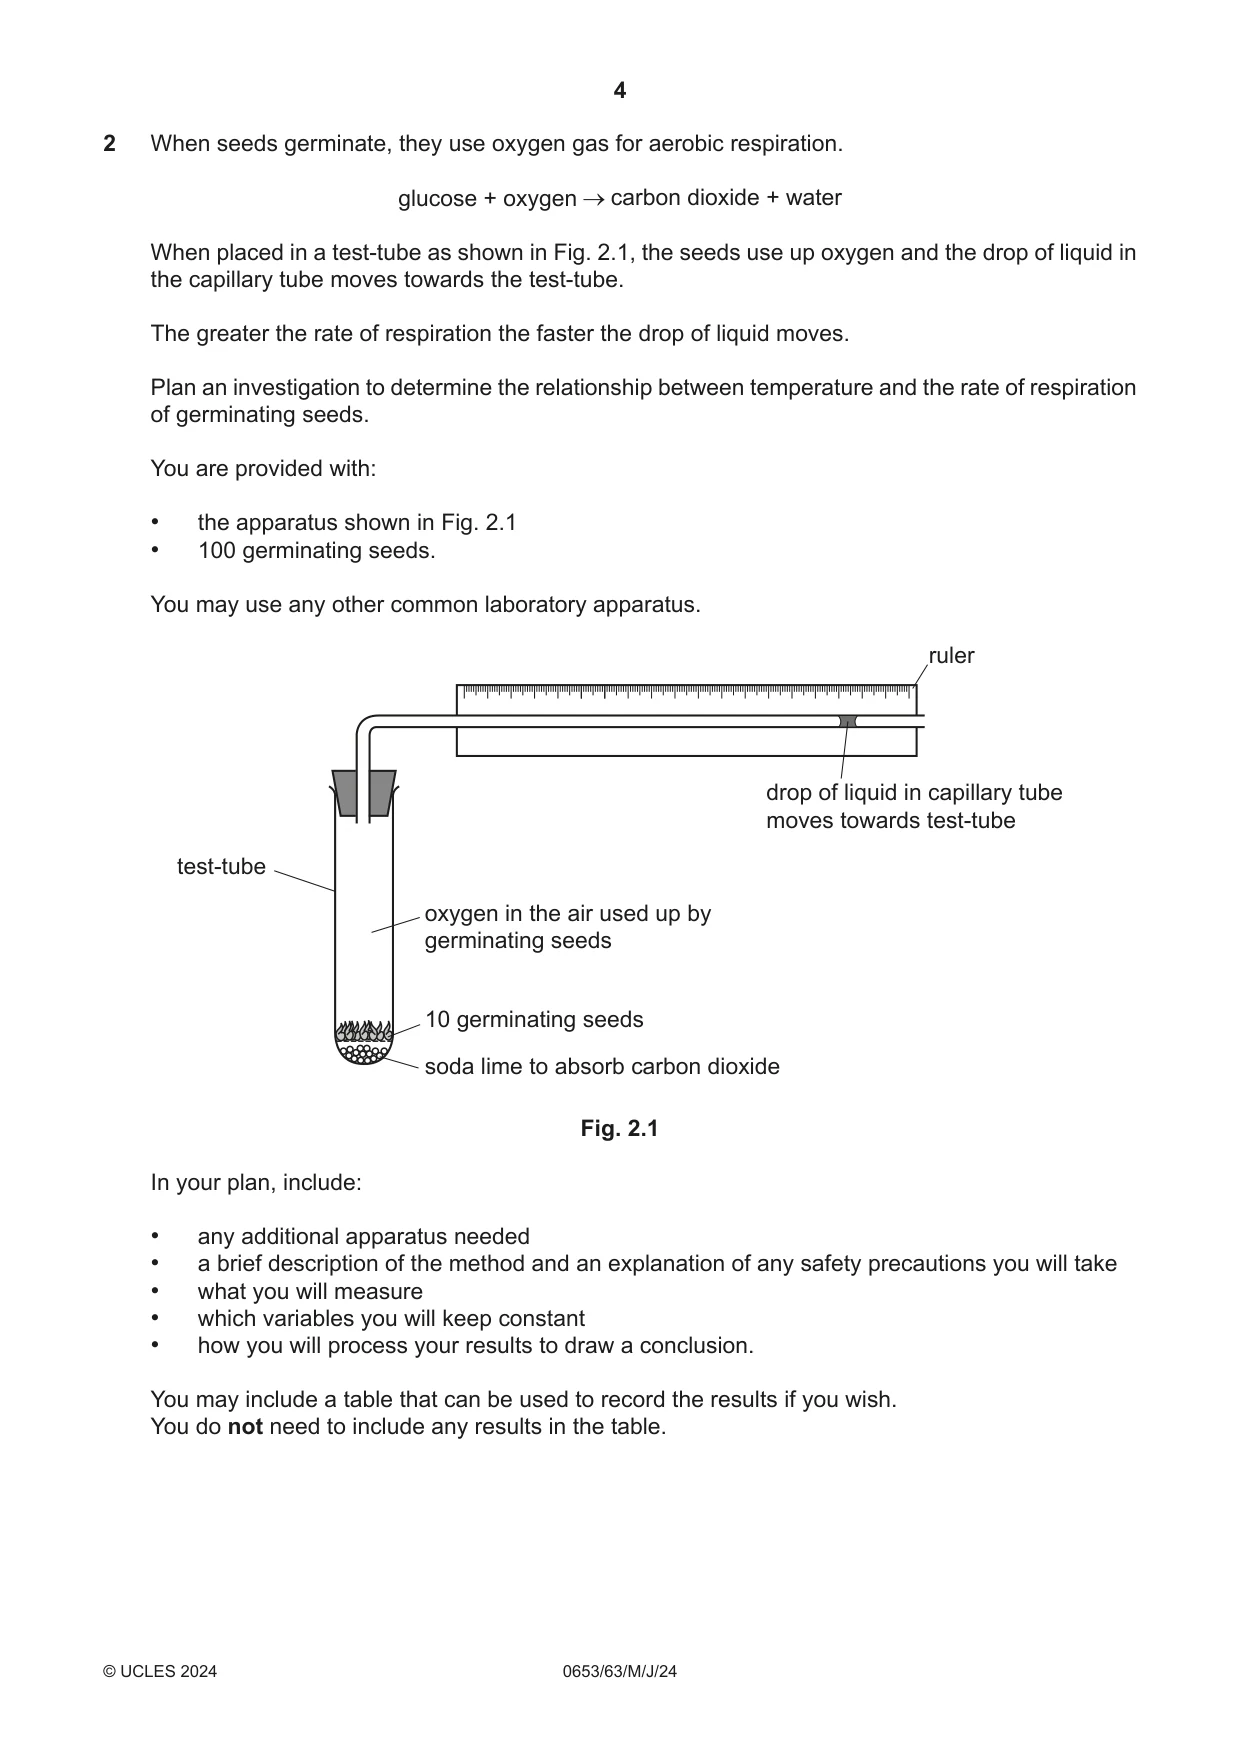
2 When seeds germinate, they use oxygen gas for aerobic respiration. glucose + oxygen carbon dioxide + water When placed in a test‑tube as shown in Fig. 2.1, the seeds use up oxygen and the drop of liquid in the capillary tube moves towards the test‑tube. The greater the rate of respiration the faster the drop of liquid moves. Plan an investigation to determine the relationship between temperature and the rate of respiration of germinating seeds. You are provided with: • the apparatus shown in Fig. 2.1 • 100 germinating seeds. You may use any other common laboratory apparatus. ruler drop of liquid in capillary tube moves towards test-tube test-tube oxygen in the air used up by germinating seeds 10 germinating seeds soda lime to absorb carbon dioxide Fig. 2.1 In your plan, include: • any additional apparatus needed • a brief description of the method and an explanation of any safety precautions you will take • what you will measure • which variables you will keep constant • how you will process your results to draw a conclusion. You may include a table that can be used to record the results if you wish. You do not need to include any results in the table. .......................................................................................................................................................... .......................................................................................................................................................... .......................................................................................................................................................... .......................................................................................................................................................... .......................................................................................................................................................... .......................................................................................................................................................... .......................................................................................................................................................... .......................................................................................................................................................... .......................................................................................................................................................... .......................................................................................................................................................... .......................................................................................................................................................... .......................................................................................................................................................... .......................................................................................................................................................... .................................................................................................................................................... [7]
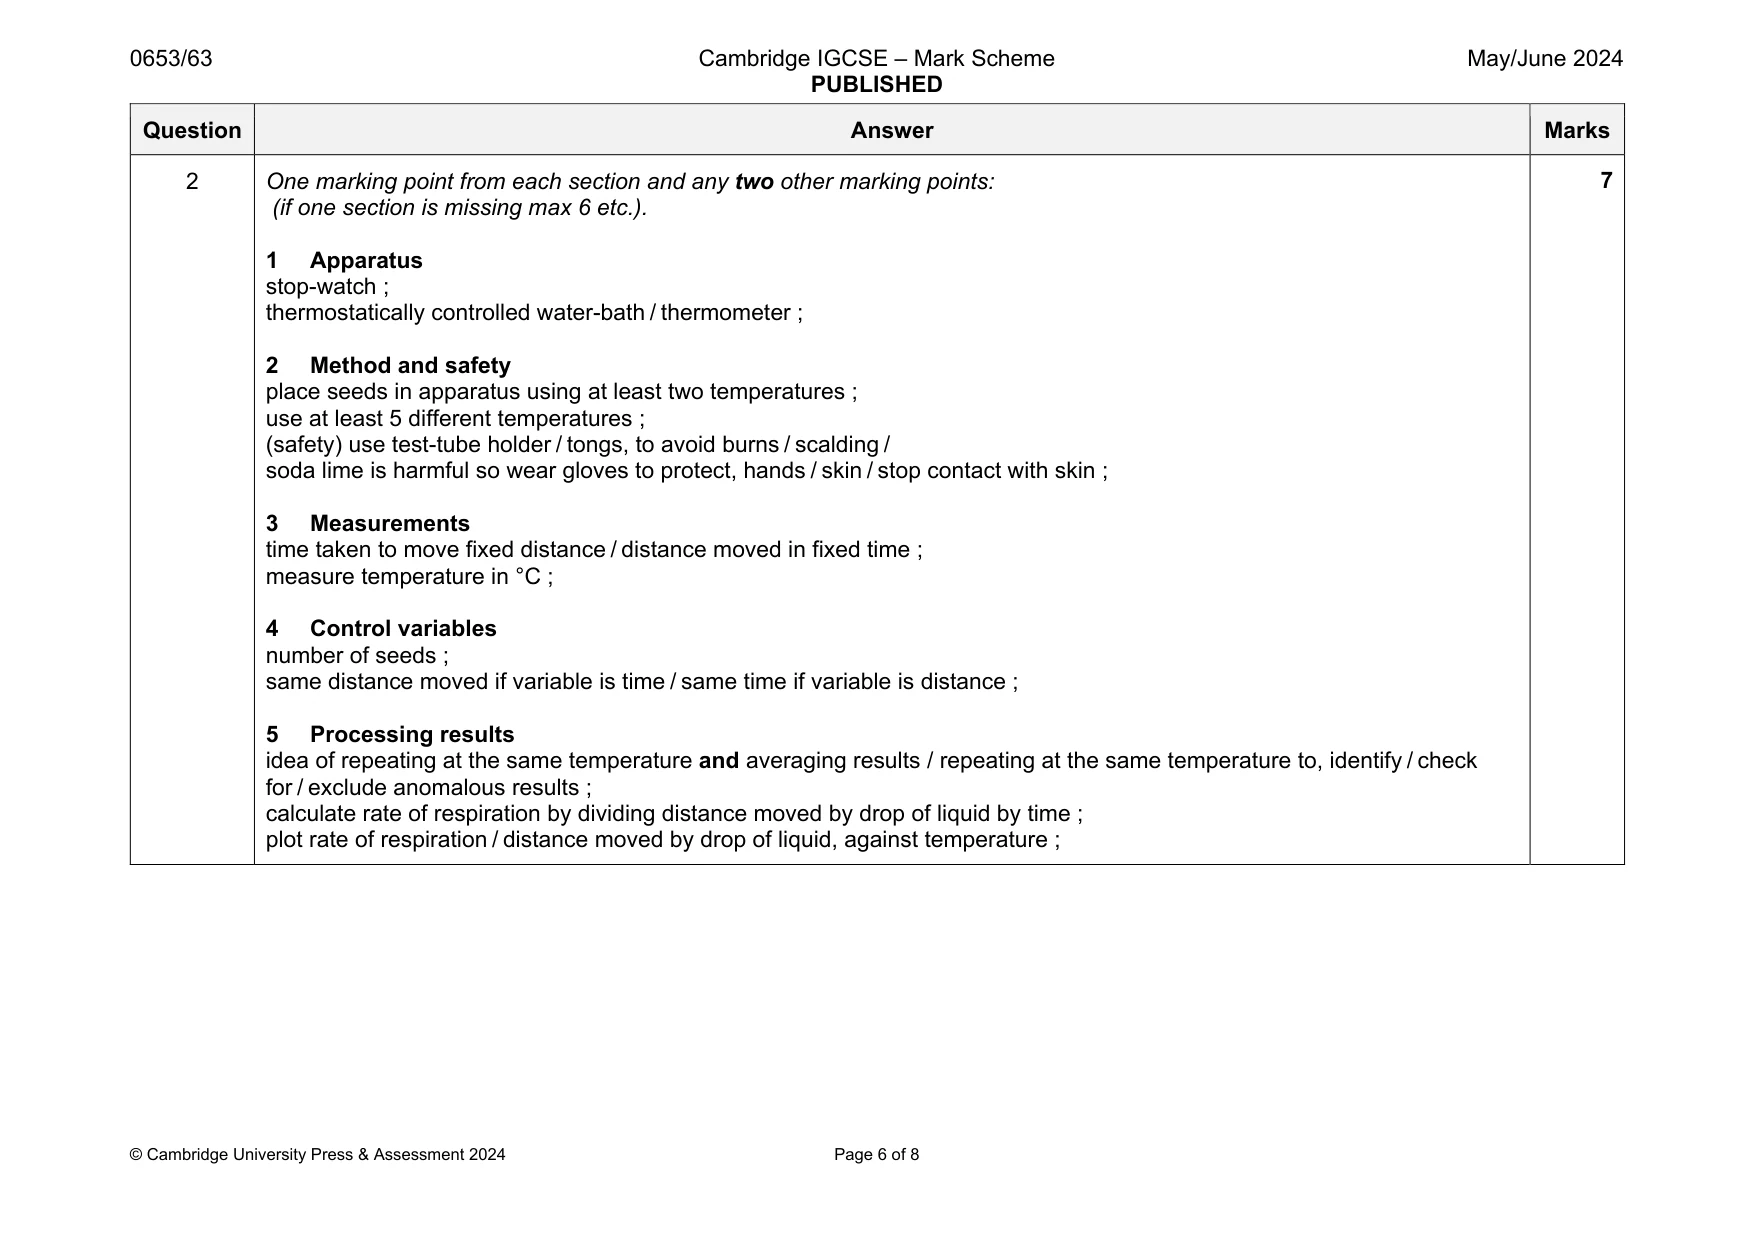
Mark scheme: 2 One marking point from each section and any two other marking points: (if one section is missing max 6 etc.). 1 Apparatus stop-watch ; thermostatically controlled water-bath / thermometer ; 2 Method and safety place seeds in apparatus using at least two temperatures ; use at least 5 different temperatures ; (safety) use test-tube holder / tongs, to avoid burns / scalding / soda lime is harmful so wear gloves to protect, hands / skin / stop contact with skin ; 3 Measurements time taken to move fixed distance / distance moved in fixed time ; measure temperature in °C ; 4 Control variables number of seeds ; same distance moved if variable is time / same time if variable is distance ; 5 Processing results idea of repeating at the same temperature and averaging results / repeating at the same temperature to, identify / check for / exclude anomalous results ; calculate rate of respiration by dividing distance moved by drop of liquid by time ; plot rate of respiration / distance moved by drop of liquid, against temperature ;
Q3 · A student investigates a green liquid
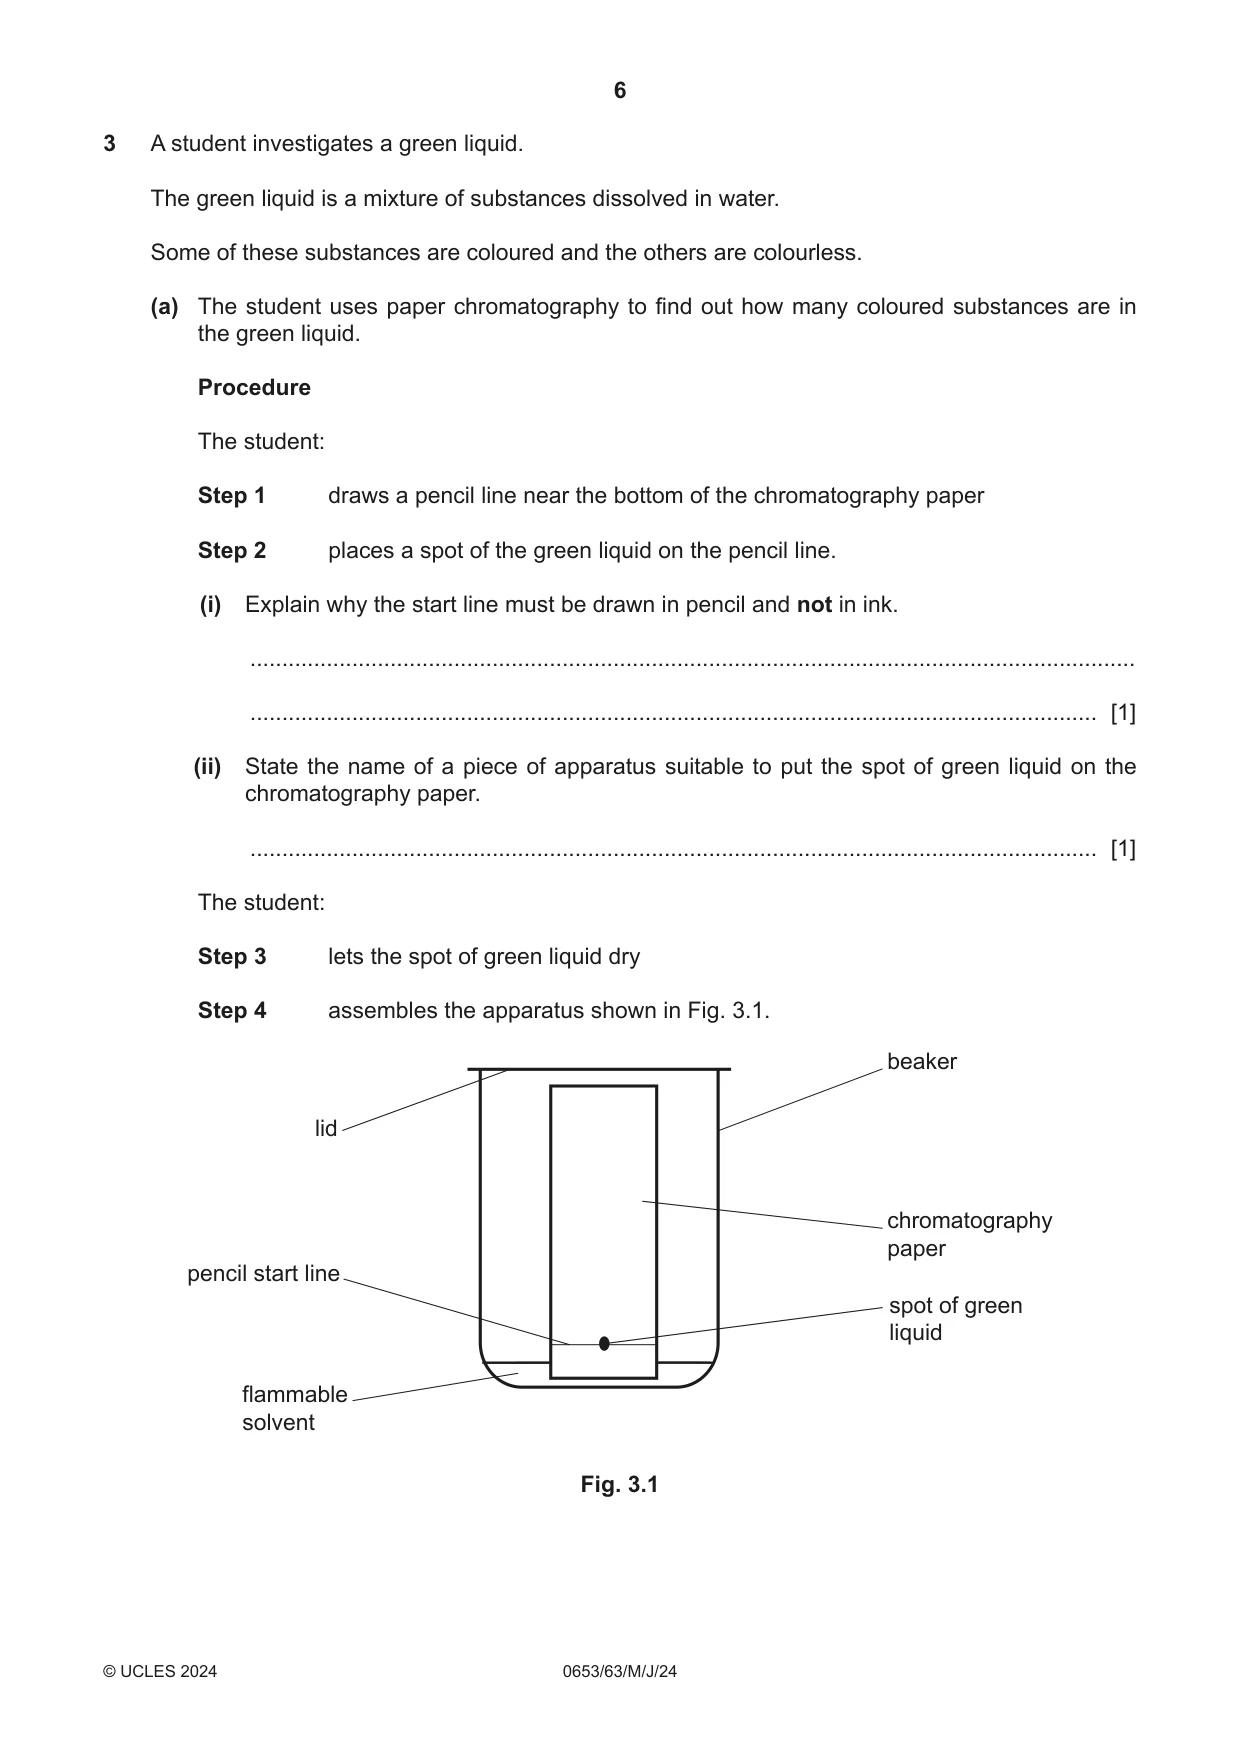
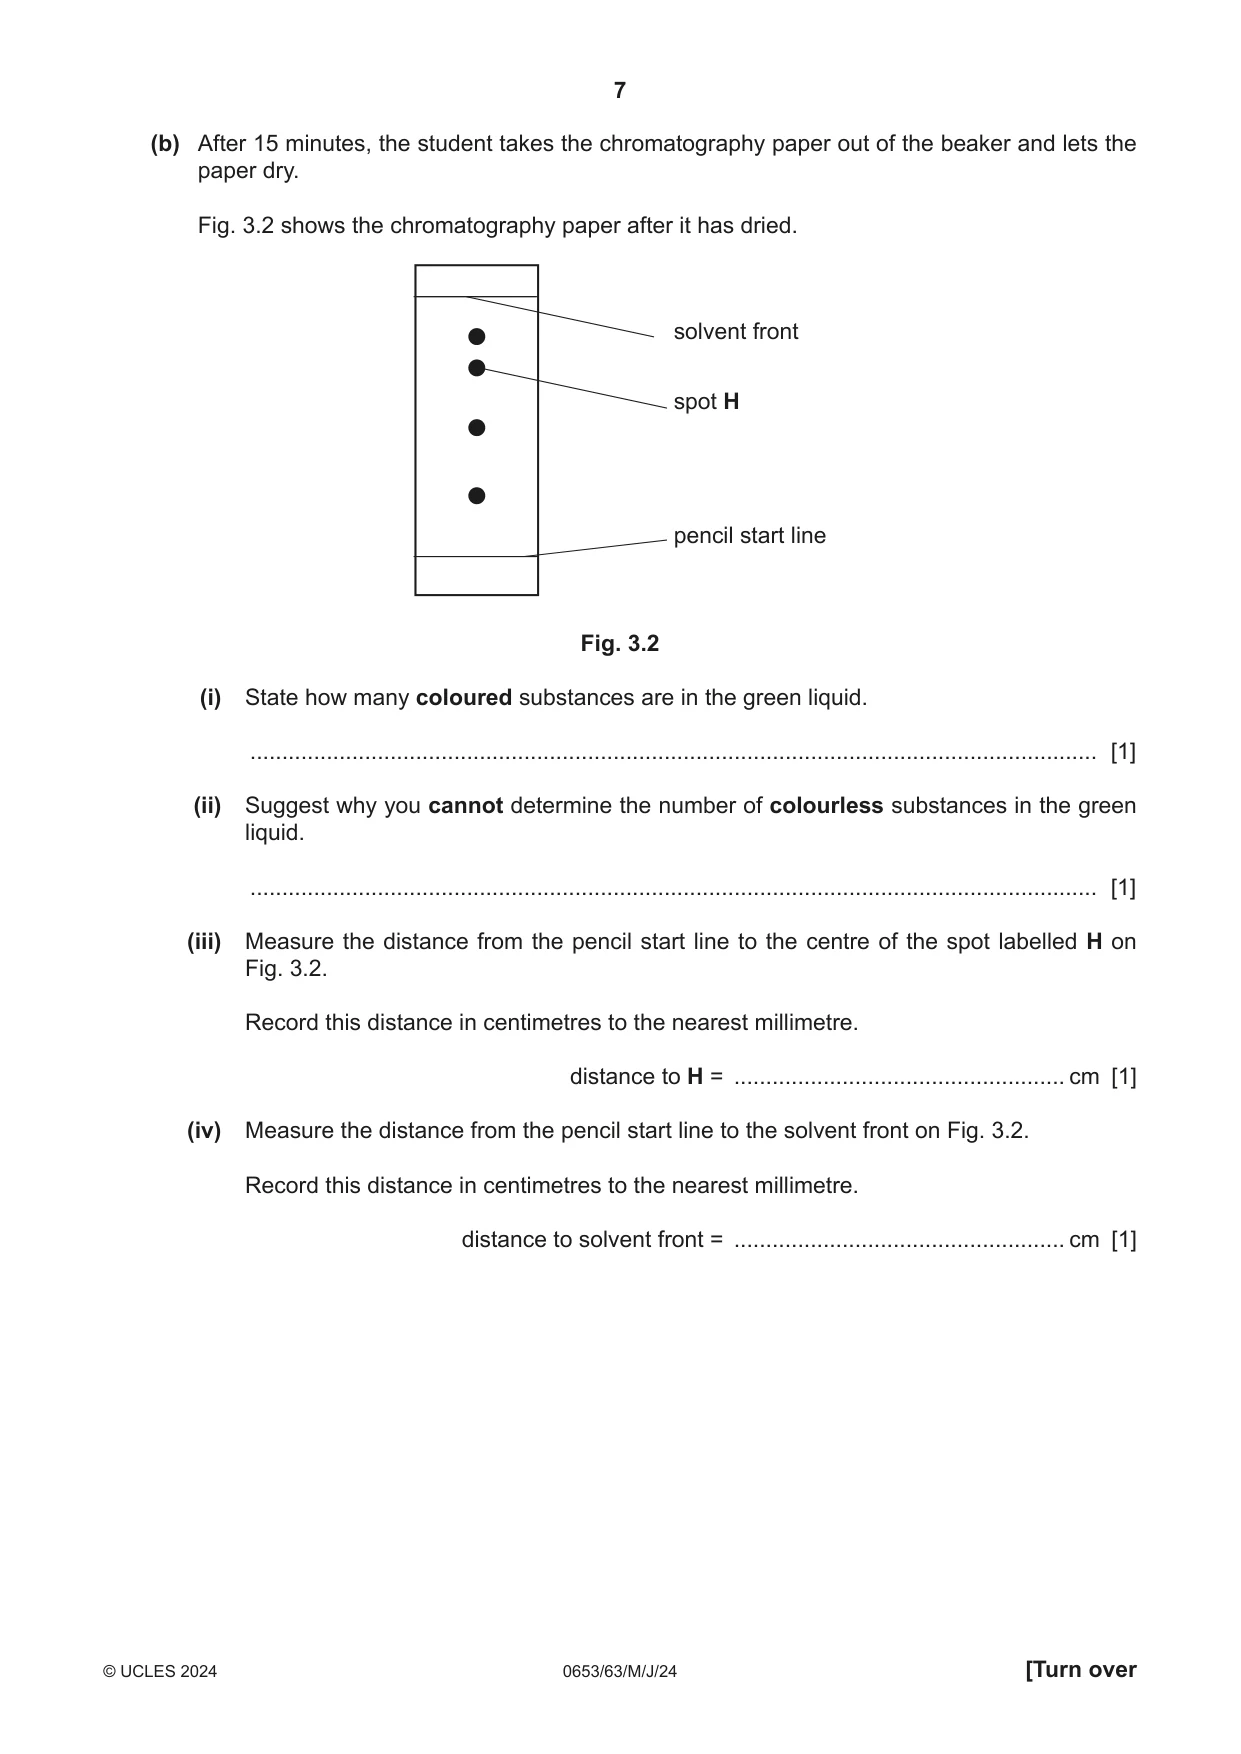
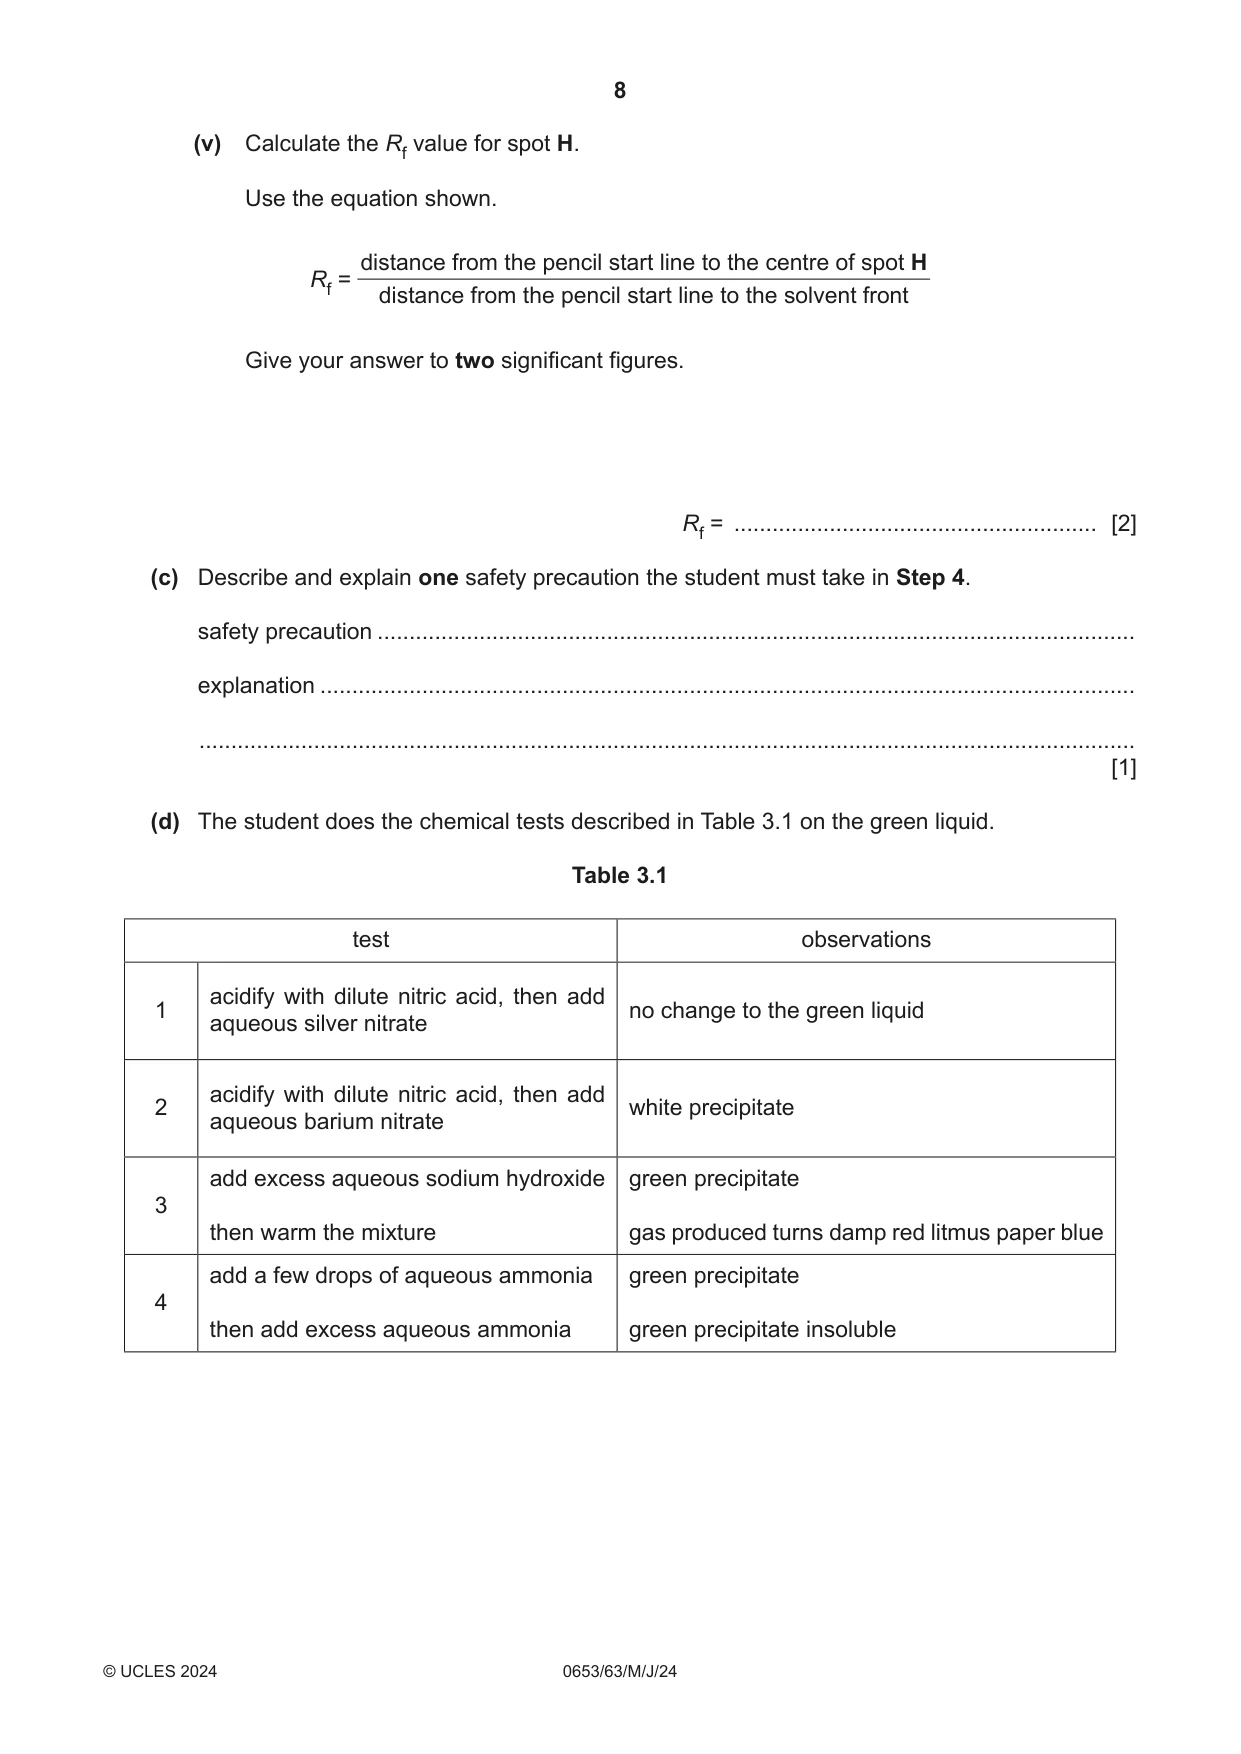
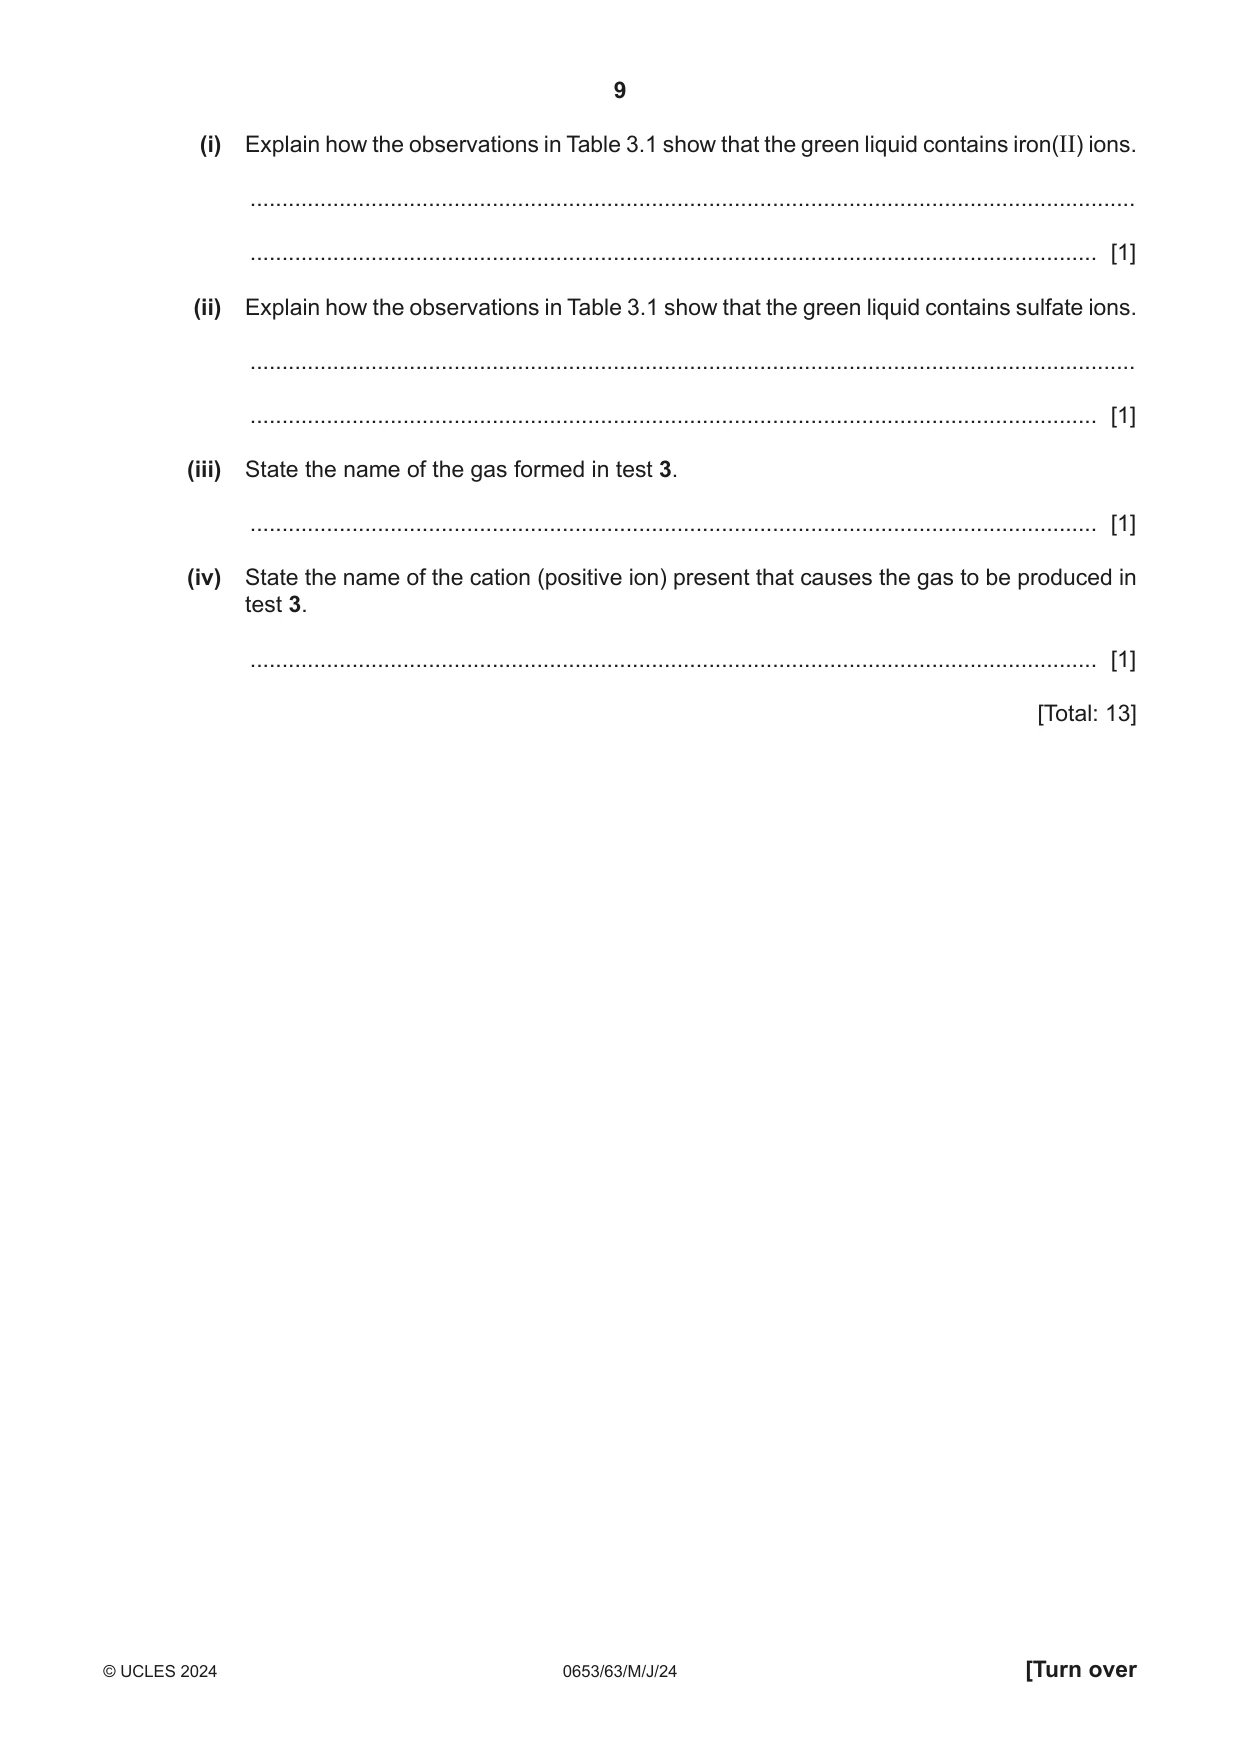
3 A student investigates a green liquid. The green liquid is a mixture of substances dissolved in water. Some of these substances are coloured and the others are colourless. (a) The student uses paper chromatography to find out how many coloured substances are in the green liquid. Procedure The student: Step 1 draws a pencil line near the bottom of the chromatography paper Step 2 places a spot of the green liquid on the pencil line. (i) Explain why the start line must be drawn in pencil and not in ink. ........................................................................................................................................... ..................................................................................................................................... [1] (ii) State the name of a piece of apparatus suitable to put the spot of green liquid on the chromatography paper. ..................................................................................................................................... [1] The student: Step 3 lets the spot of green liquid dry Step 4 assembles the apparatus shown in Fig. 3.1. beaker lid chromatography paper pencil start line spot of green liquid flammable solvent Fig. 3.1 (b) After 15 minutes, the student takes the chromatography paper out of the beaker and lets the paper dry. Fig. 3.2 shows the chromatography paper after it has dried. solvent front spot H pencil start line Fig. 3.2 (i) State how many coloured substances are in the green liquid. ..................................................................................................................................... [1] (ii) Suggest why you cannot determine the number of colourless substances in the green liquid. ..................................................................................................................................... [1] (iii) Measure the distance from the pencil start line to the centre of the spot labelled H on Fig. 3.2. Record this distance in centimetres to the nearest millimetre. distance to H = .................................................... cm [1] (iv) Measure the distance from the pencil start line to the solvent front on Fig. 3.2. Record this distance in centimetres to the nearest millimetre. distance to solvent front = .................................................... cm [1] (v) Calculate the Rf value for spot H. Use the equation shown. distance from the pencil start line to the centre of spot H Rf = distance from the pencil start line to the solvent front Give your answer to two significant figures. Rf = ......................................................... [2] (c) Describe and explain one safety precaution the student must take in Step 4. safety precaution ....................................................................................................................... explanation ................................................................................................................................ ................................................................................................................................................... [1] (d) The student does the chemical tests described in Table 3.1 on the green liquid. Table 3.1 test observations acidify with dilute nitric acid, then add1 no change to the green liquid aqueous silver nitrate acidify with dilute nitric acid, then add2 white precipitate aqueous barium nitrate add excess aqueous sodium hydroxide green precipitate 3 then warm the mixture gas produced turns damp red litmus paper blue add a few drops of aqueous ammonia green precipitate 4 then add excess aqueous ammonia green precipitate insoluble (i) Explain how the observations in Table 3.1 show that the green liquid contains iron(II) ions. ........................................................................................................................................... ..................................................................................................................................... [1] (ii) Explain how the observations in Table 3.1 show that the green liquid contains sulfate ions. ........................................................................................................................................... ..................................................................................................................................... [1] (iii) State the name of the gas formed in test 3. ..................................................................................................................................... [1] (iv) State the name of the cation (positive ion) present that causes the gas to be produced in test 3. ..................................................................................................................................... [1] [Total: 13]
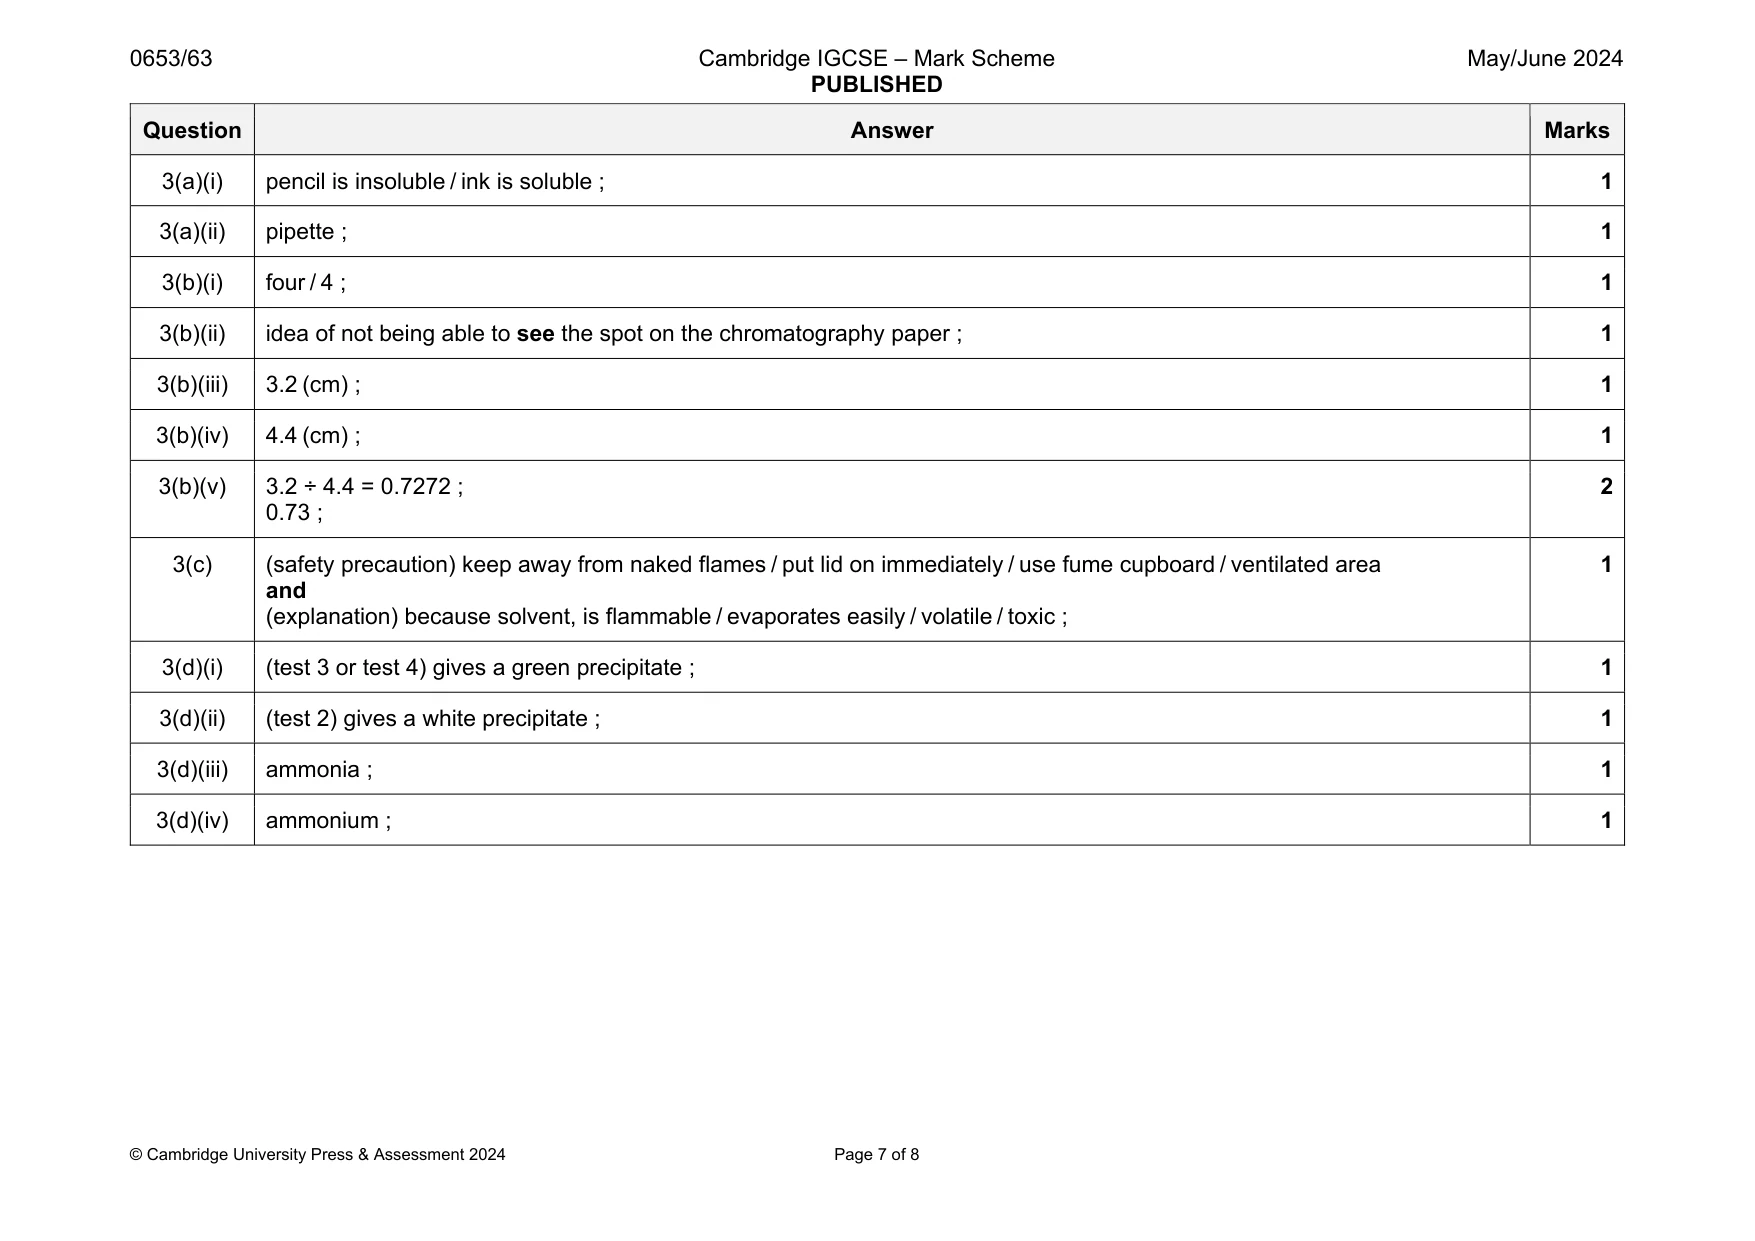
Mark scheme: 3(a)(i) pencil is insoluble / ink is soluble ; 1 3(a)(ii) pipette ; 1 3(b)(i) four / 4 ; 1 3(b)(ii) idea of not being able to see the spot on the chromatography paper ; 1 3(b)(iii) 3.2 (cm) ; 1 3(b)(iv) 4.4 (cm) ; 1 3(b)(v) 3.2 ÷ 4.4 = 0.7272 ; 0.73 ; 2 3(c) (safety precaution) keep away from naked flames / put lid on immediately / use fume cupboard / ventilated area and (explanation) because solvent, is flammable / evaporates easily / volatile / toxic ; 1 3(d)(i) (test 3 or test 4) gives a green precipitate ; 1 3(d)(ii) (test 2) gives a white precipitate ; 1 3(d)(iii) ammonia ; 1 3(d)(iv) ammonium ; 1
Q4 · A student determines the mass M of a metre rule
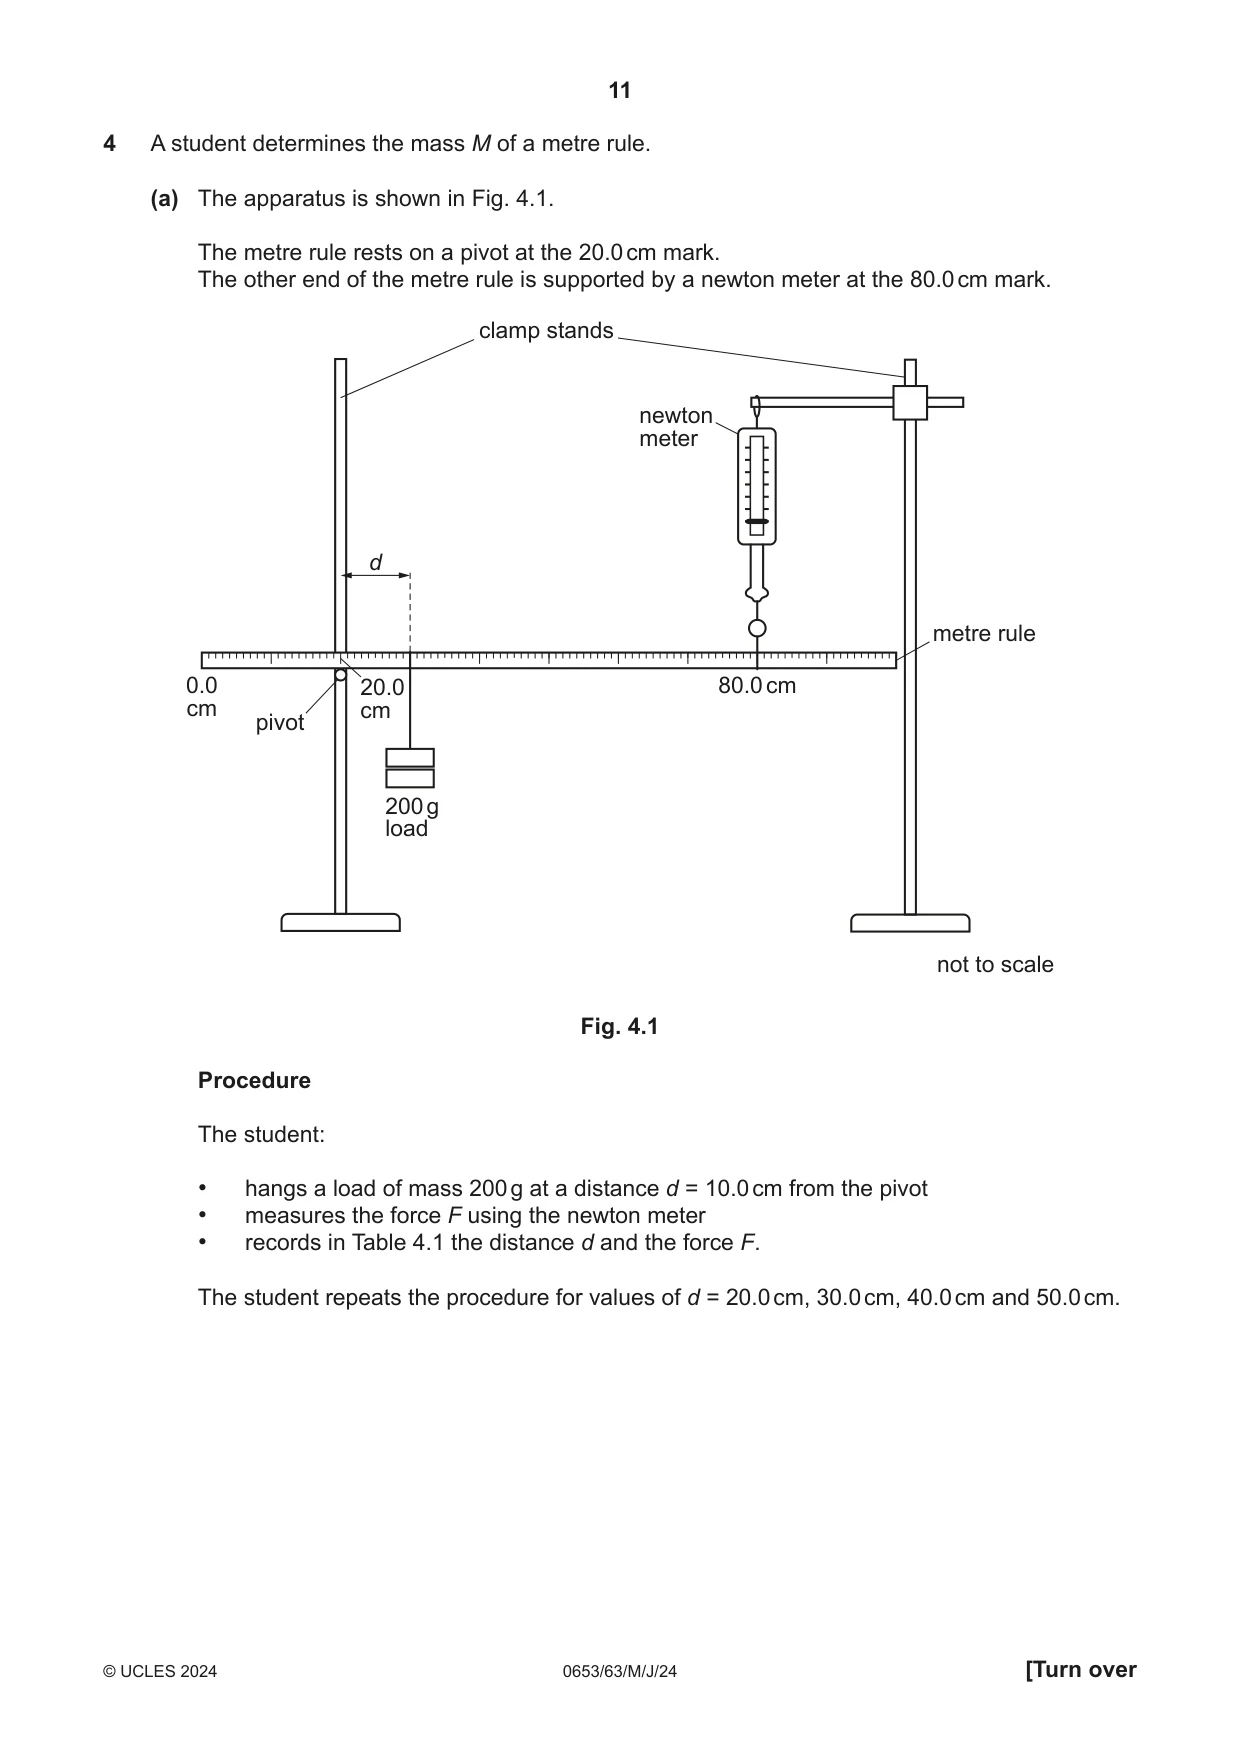
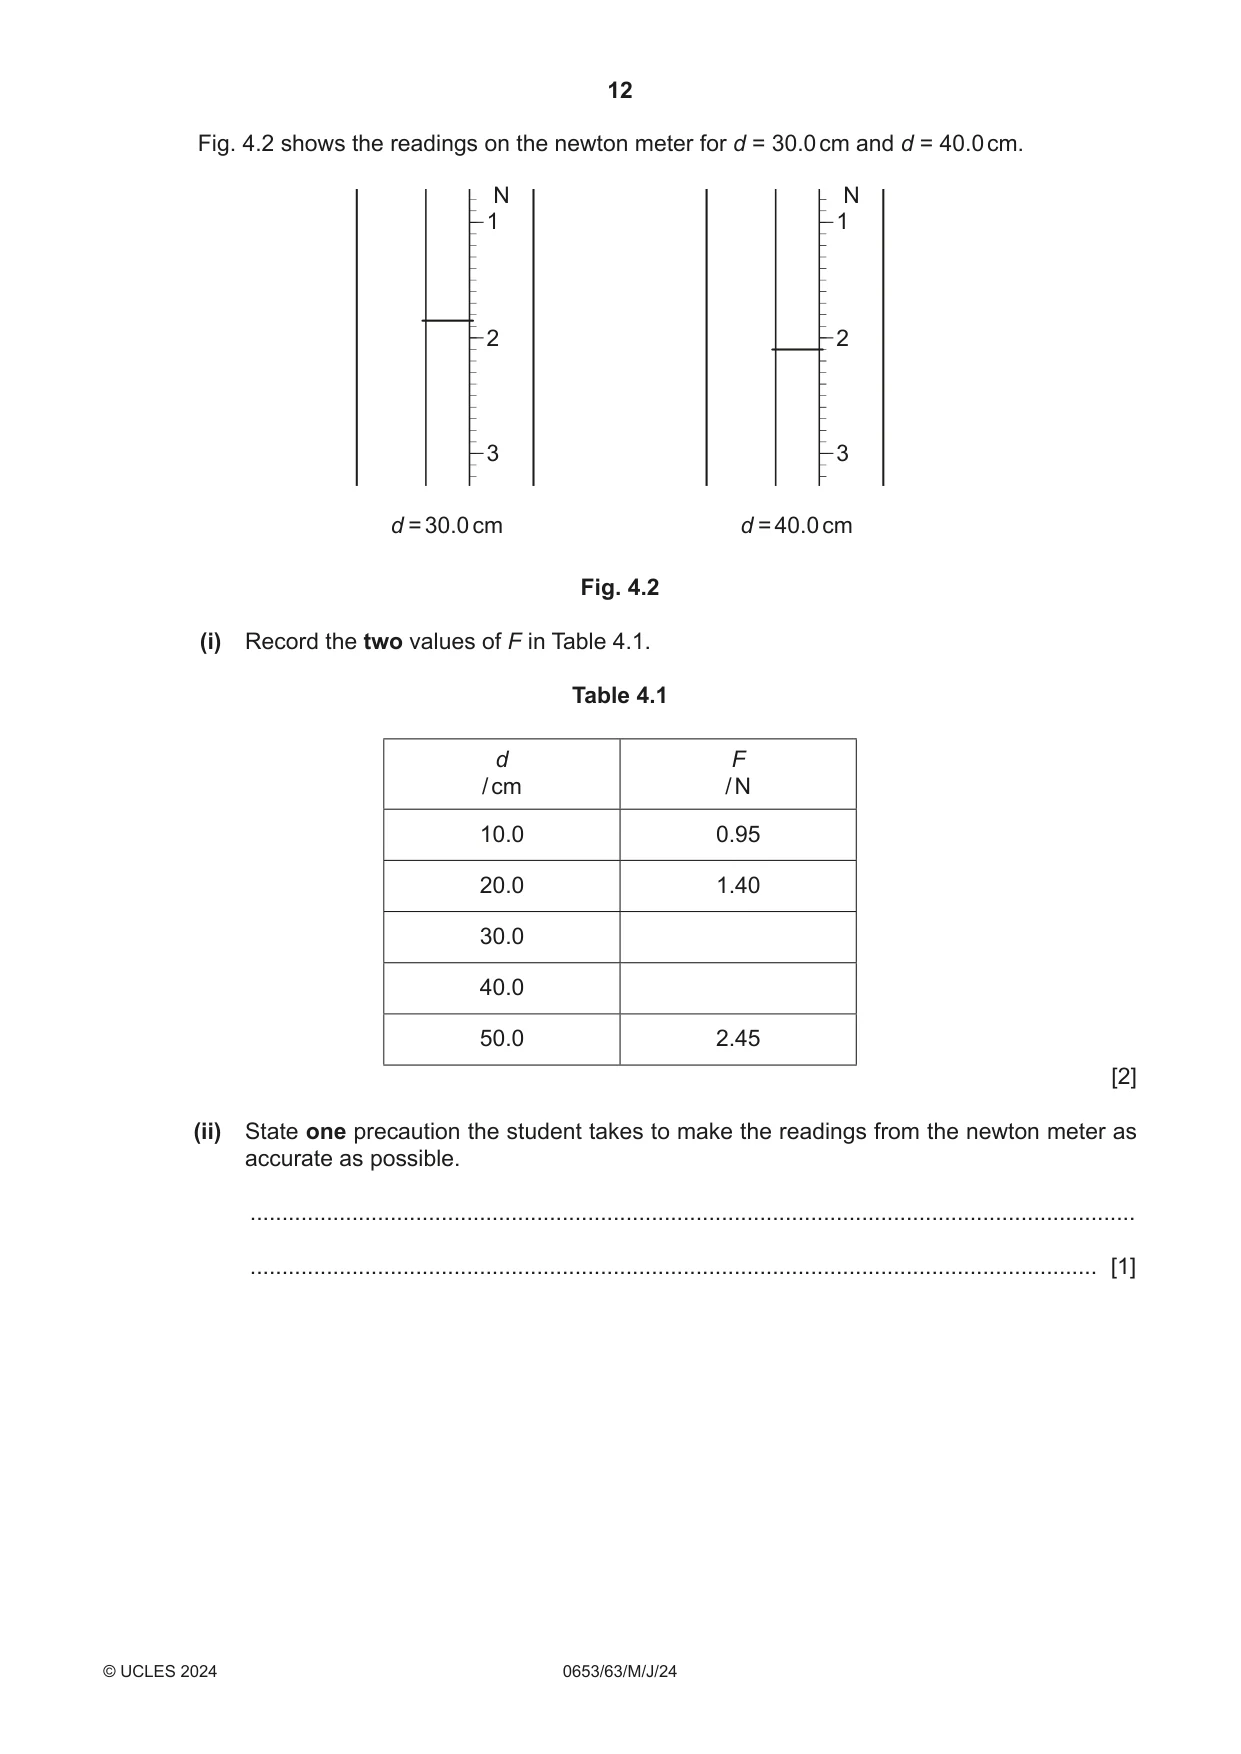
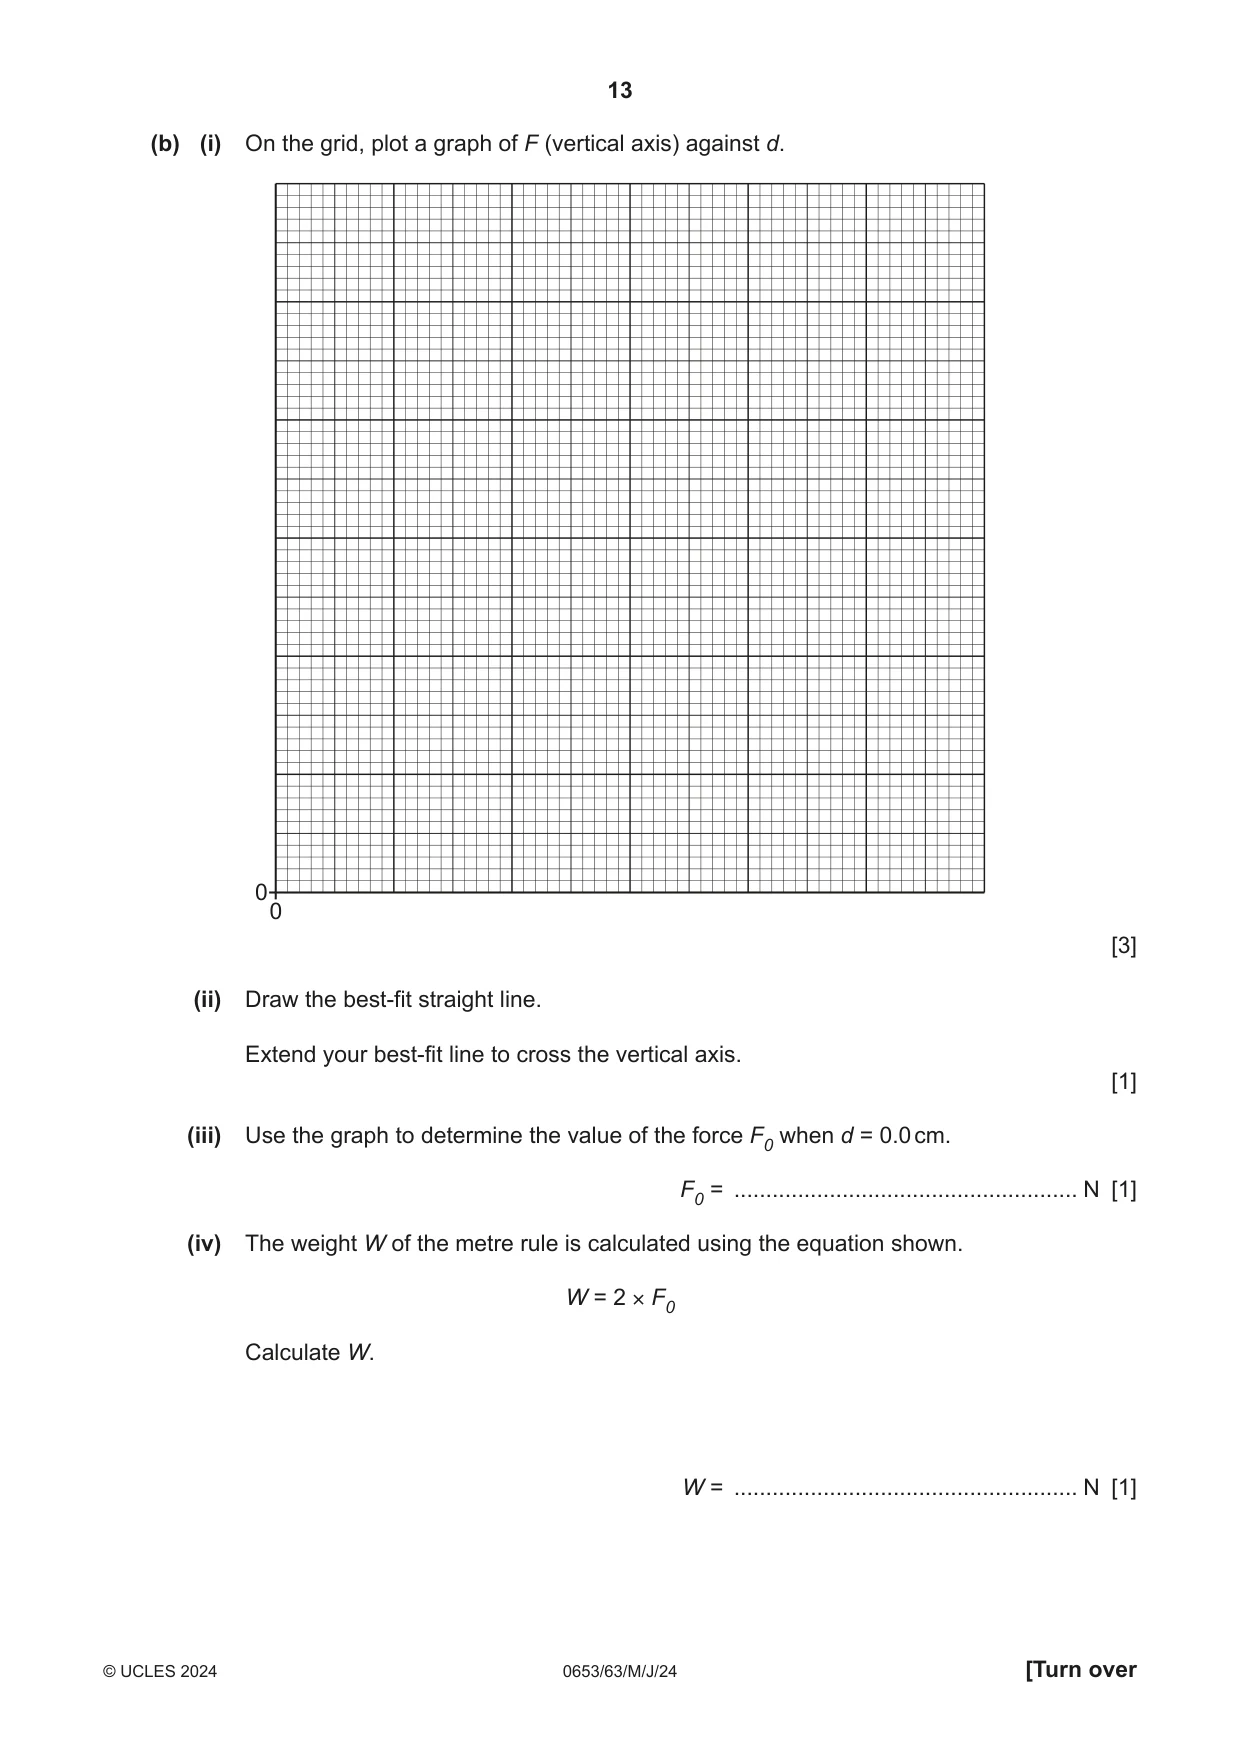
4 A student determines the mass M of a metre rule. (a) The apparatus is shown in Fig. 4.1. The metre rule rests on a pivot at the 20.0 cm mark. The other end of the metre rule is supported by a newton meter at the 80.0 cm mark. clamp stands newton meter d metre rule 0.0 20.0 80.0 cm cm cm pivot 200 g load not to scale Fig. 4.1 Procedure The student: • hangs a load of mass 200 g at a distance d = 10.0 cm from the pivot • measures the force F using the newton meter • records in Table 4.1 the distance d and the force F. The student repeats the procedure for values of d = 20.0 cm, 30.0 cm, 40.0 cm and 50.0 cm. Fig. 4.2 shows the readings on the newton meter for d = 30.0 cm and d = 40.0 cm. N N 1 1 2 2 3 3 d = 30.0 cm d = 40.0 cm Fig. 4.2 (i) Record the two values of F in Table 4.1. Table 4.1 d F / cm / N 10.0 0.95 20.0 1.40 30.0 40.0 50.0 2.45 [2] (ii) State one precaution the student takes to make the readings from the newton meter as accurate as possible. ........................................................................................................................................... ..................................................................................................................................... [1] (b) (i) On the grid, plot a graph of F (vertical axis) against d. 0 0 [3] (ii) Draw the best‑fit straight line. Extend your best‑fit line to cross the vertical axis. [1] (iii) Use the graph to determine the value of the force F0 when d = 0.0 cm. F0 = ...................................................... N [1] (iv) The weight W of the metre rule is calculated using the equation shown. W = 2 × F0 Calculate W. W = ...................................................... N [1]
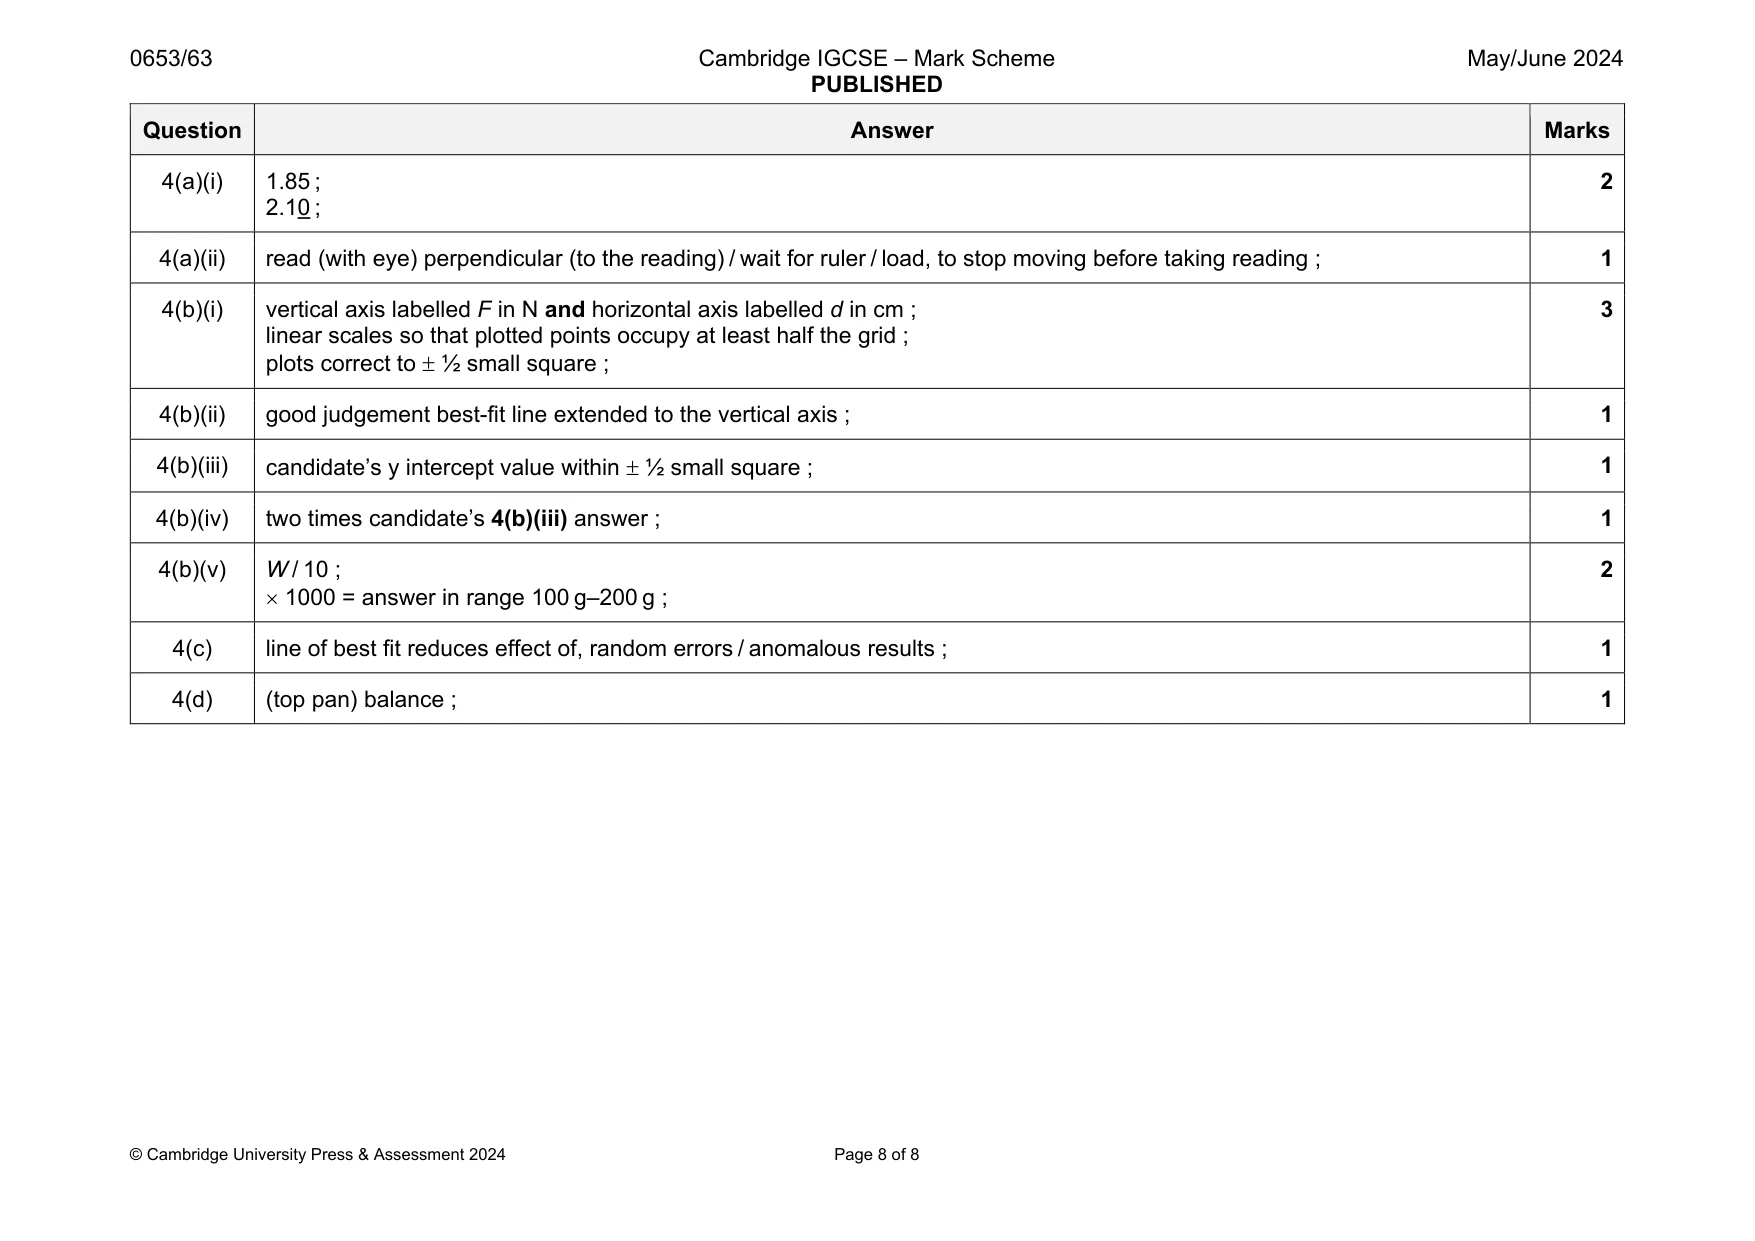
Mark scheme: 4(a)(i) 1.85 ; 2.10 ; 2 4(a)(ii) read (with eye) perpendicular (to the reading) / wait for ruler / load, to stop moving before taking reading ; 1 4(b)(i) vertical axis labelled F in N and horizontal axis labelled d in cm ; linear scales so that plotted points occupy at least half the grid ; plots correct to ½ small square ; 3 4(b)(ii) good judgement best-fit line extended to the vertical axis ; 1 4(b)(iii) candidate’s y intercept value within ½ small square ; 1 4(b)(iv) two times candidate’s 4(b)(iii) answer ; 1 4(b)(v) W / 10 ; 1000 = answer in range 100 g–200 g ; 2 4(c) line of best fit reduces effect of, random errors / anomalous results ; 1 4(d) (top pan) balance ; 1
What was in this paper
The subtopics covered by these 4 questions, and how many questions each got. Open one in a new tab to see every Cambridge question on it.
What you needed in this session
Cambridge’s own grade thresholds for 2024 May/June, Paper 6 · Variant 3. A higher threshold means an easier paper — the bar moves with how the cohort did.