Cambridge IGCSE Science - Combined 0653 — 2023 Oct/Nov Paper 6 · Variant 3
0653/63/O/N/23 · 4 questions · 40 marks · ≈45 min
The question paper and its mark scheme, free to read here and free to download. This is Cambridge’s own paper, exactly as it was sat.
Question paper16 pages



Mark scheme8 pages
Answers below. Sit the paper first if you are practising.
Questions as text
Q1 · A student investigates the effect of light on a plant
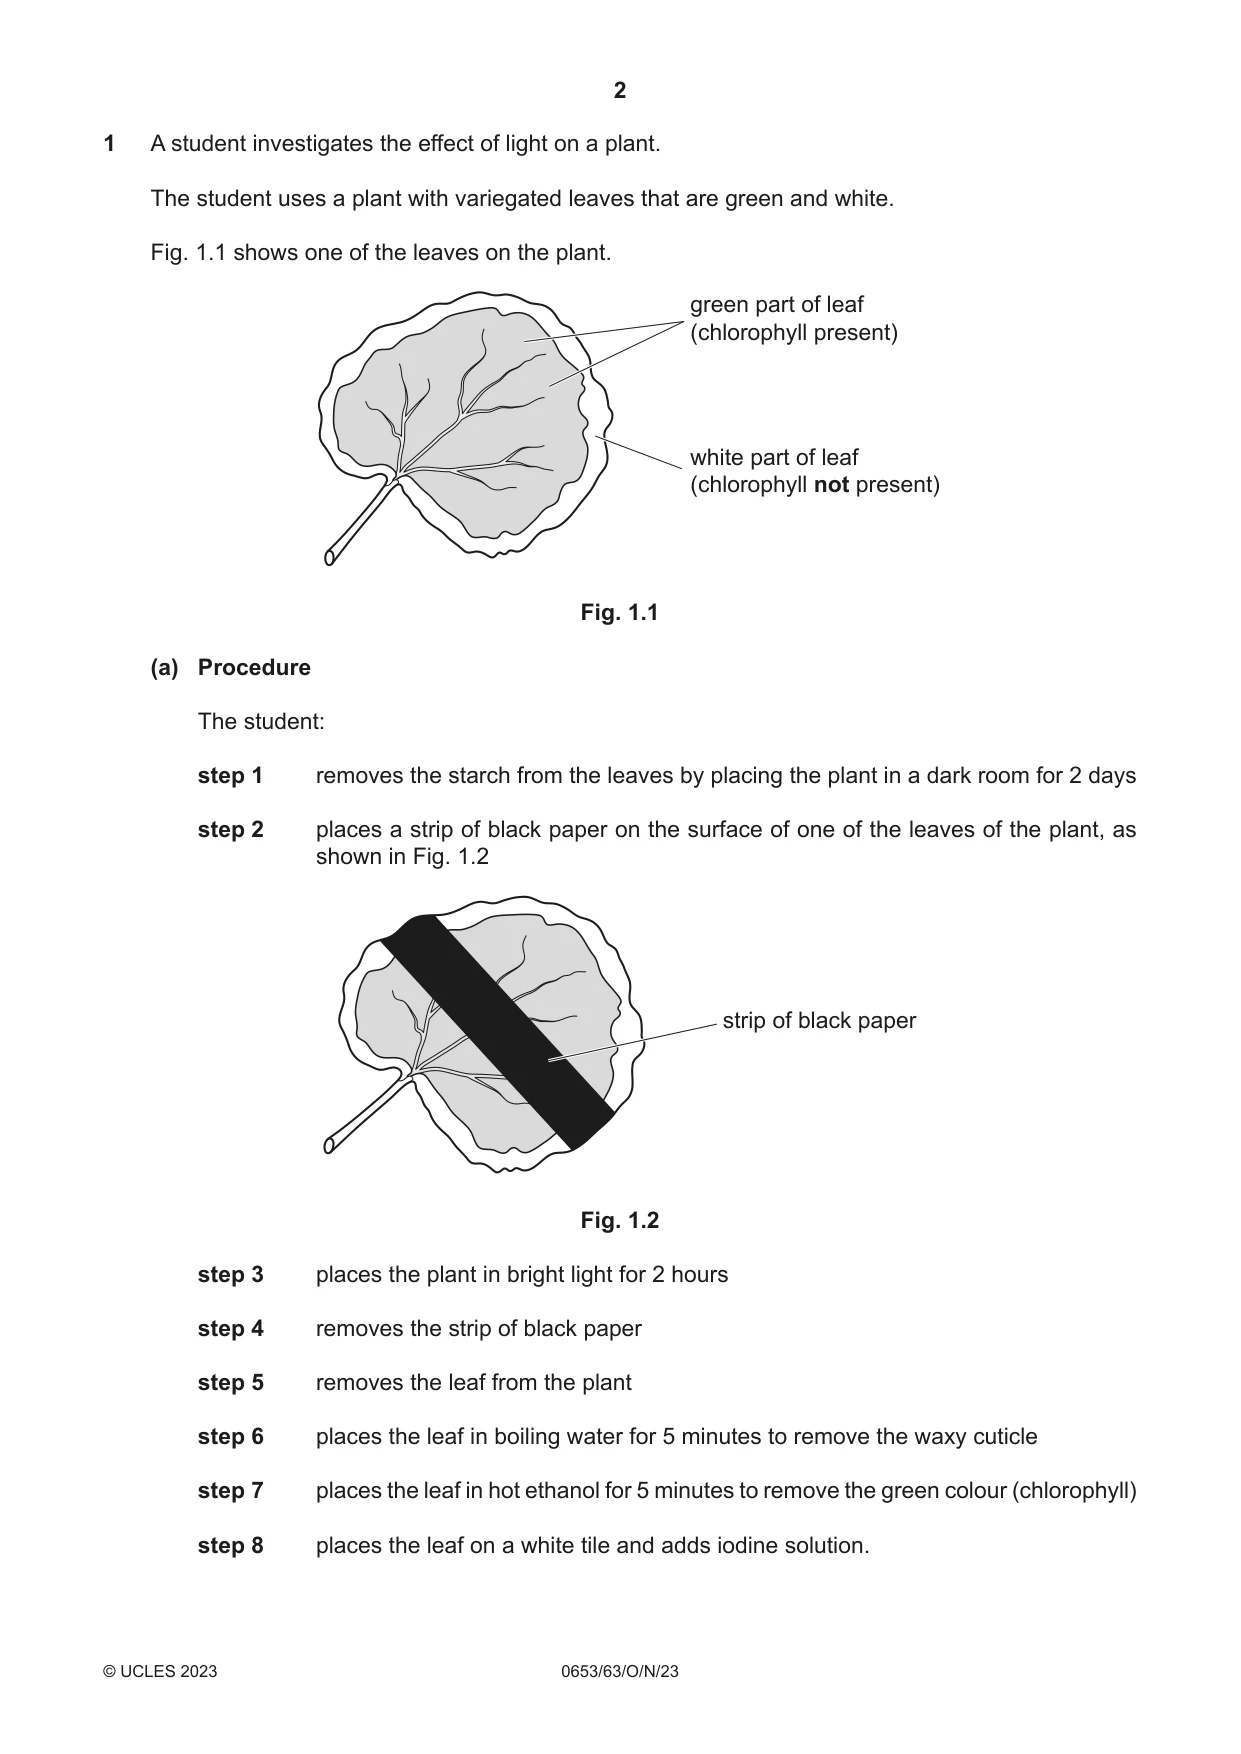
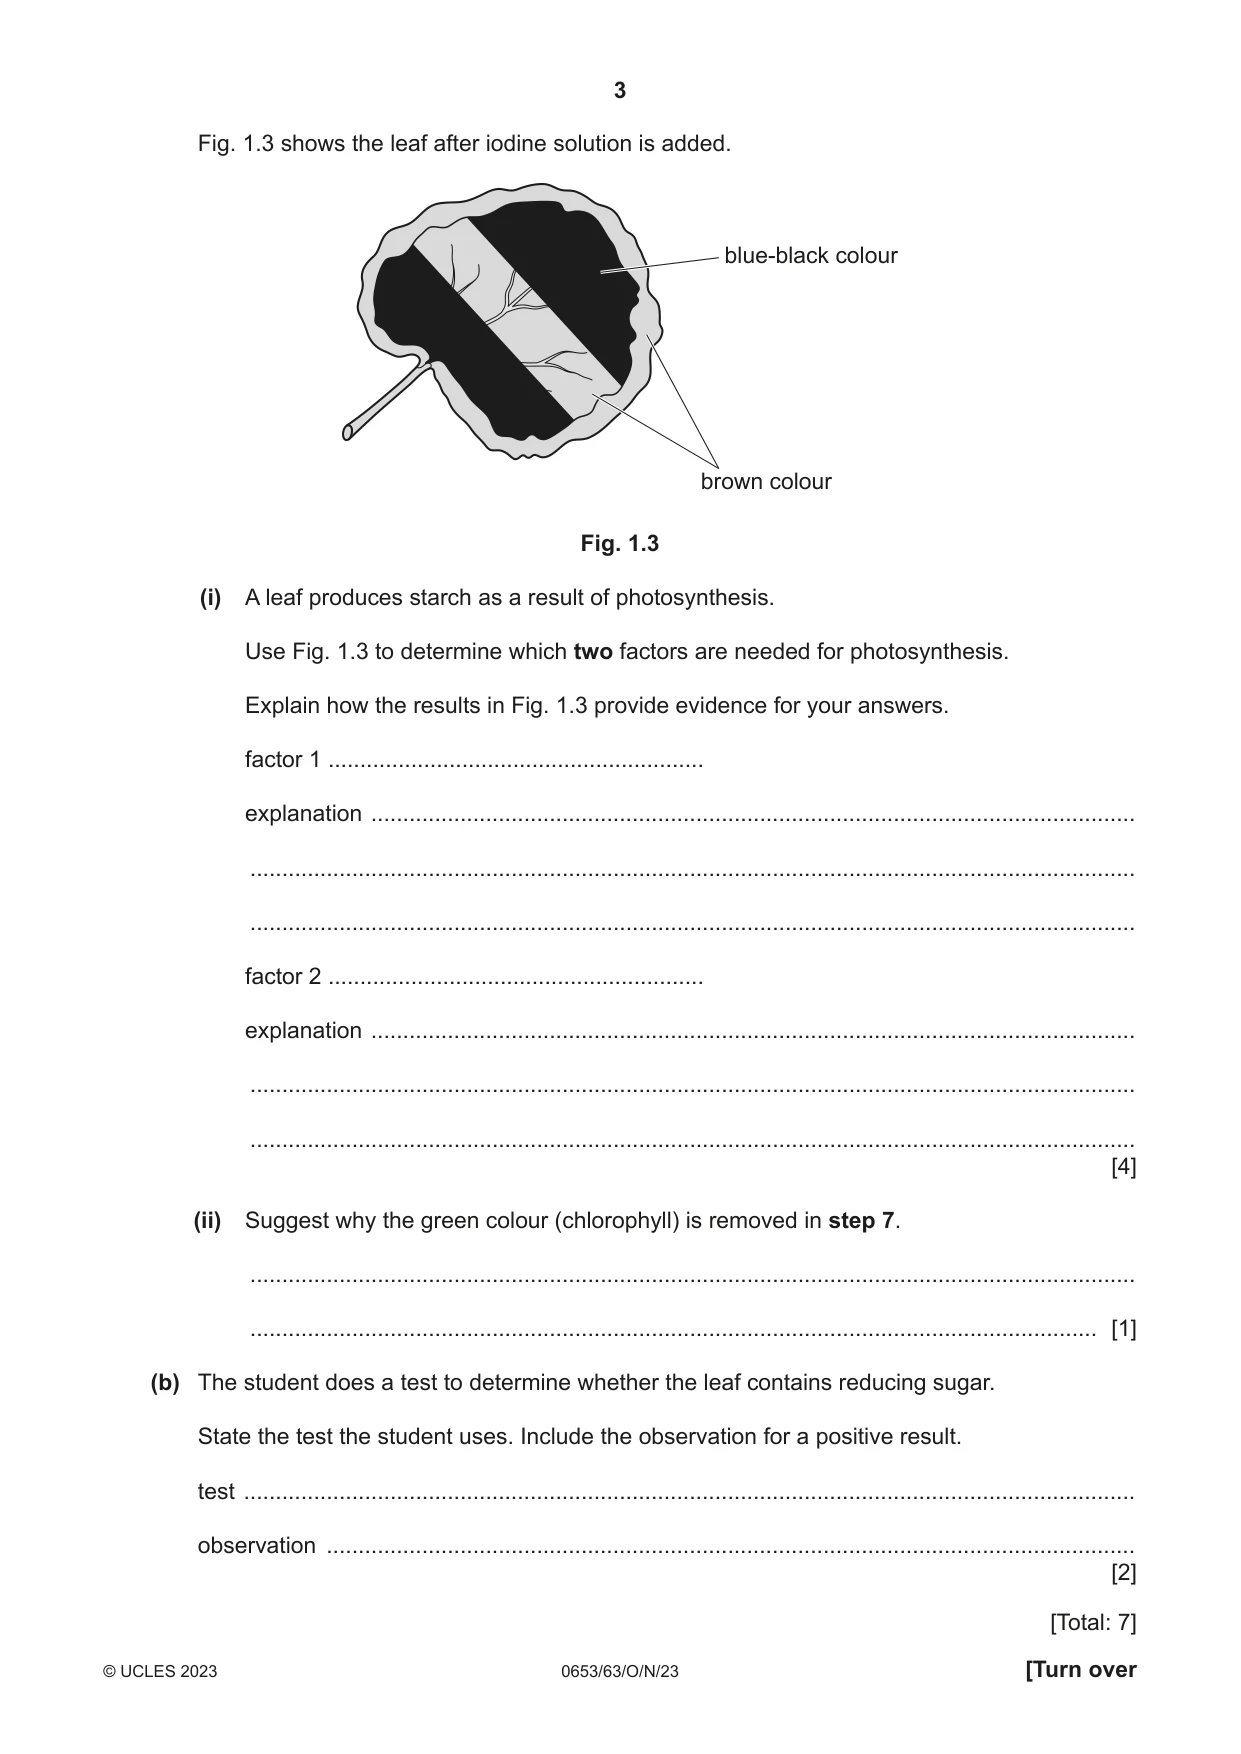
1 A student investigates the effect of light on a plant. The student uses a plant with variegated leaves that are green and white. Fig. 1.1 shows one of the leaves on the plant. green part of leaf (chlorophyll present) white part of leaf (chlorophyll not present) Fig. 1.1 (a) Procedure The student: step 1 removes the starch from the leaves by placing the plant in a dark room for 2 days step 2 places a strip of black paper on the surface of one of the leaves of the plant, as shown in Fig. 1.2 strip of black paper Fig. 1.2 step 3 places the plant in bright light for 2 hours step 4 removes the strip of black paper step 5 removes the leaf from the plant step 6 places the leaf in boiling water for 5 minutes to remove the waxy cuticle step 7 places the leaf in hot ethanol for 5 minutes to remove the green colour (chlorophyll) step 8 places the leaf on a white tile and adds iodine solution. Fig. 1.3 shows the leaf after iodine solution is added. blue-black colour brown colour Fig. 1.3 (i) A leaf produces starch as a result of photosynthesis. Use Fig. 1.3 to determine which two factors are needed for photosynthesis. Explain how the results in Fig. 1.3 provide evidence for your answers. factor 1 ........................................................... explanation ........................................................................................................................ ........................................................................................................................................... ........................................................................................................................................... factor 2 ........................................................... explanation ........................................................................................................................ ........................................................................................................................................... ........................................................................................................................................... [4] (ii) Suggest why the green colour (chlorophyll) is removed in step 7. ........................................................................................................................................... ..................................................................................................................................... [1] (b) The student does a test to determine whether the leaf contains reducing sugar. State the test the student uses. Include the observation for a positive result. test ............................................................................................................................................ observation ............................................................................................................................... [2] [Total: 7]
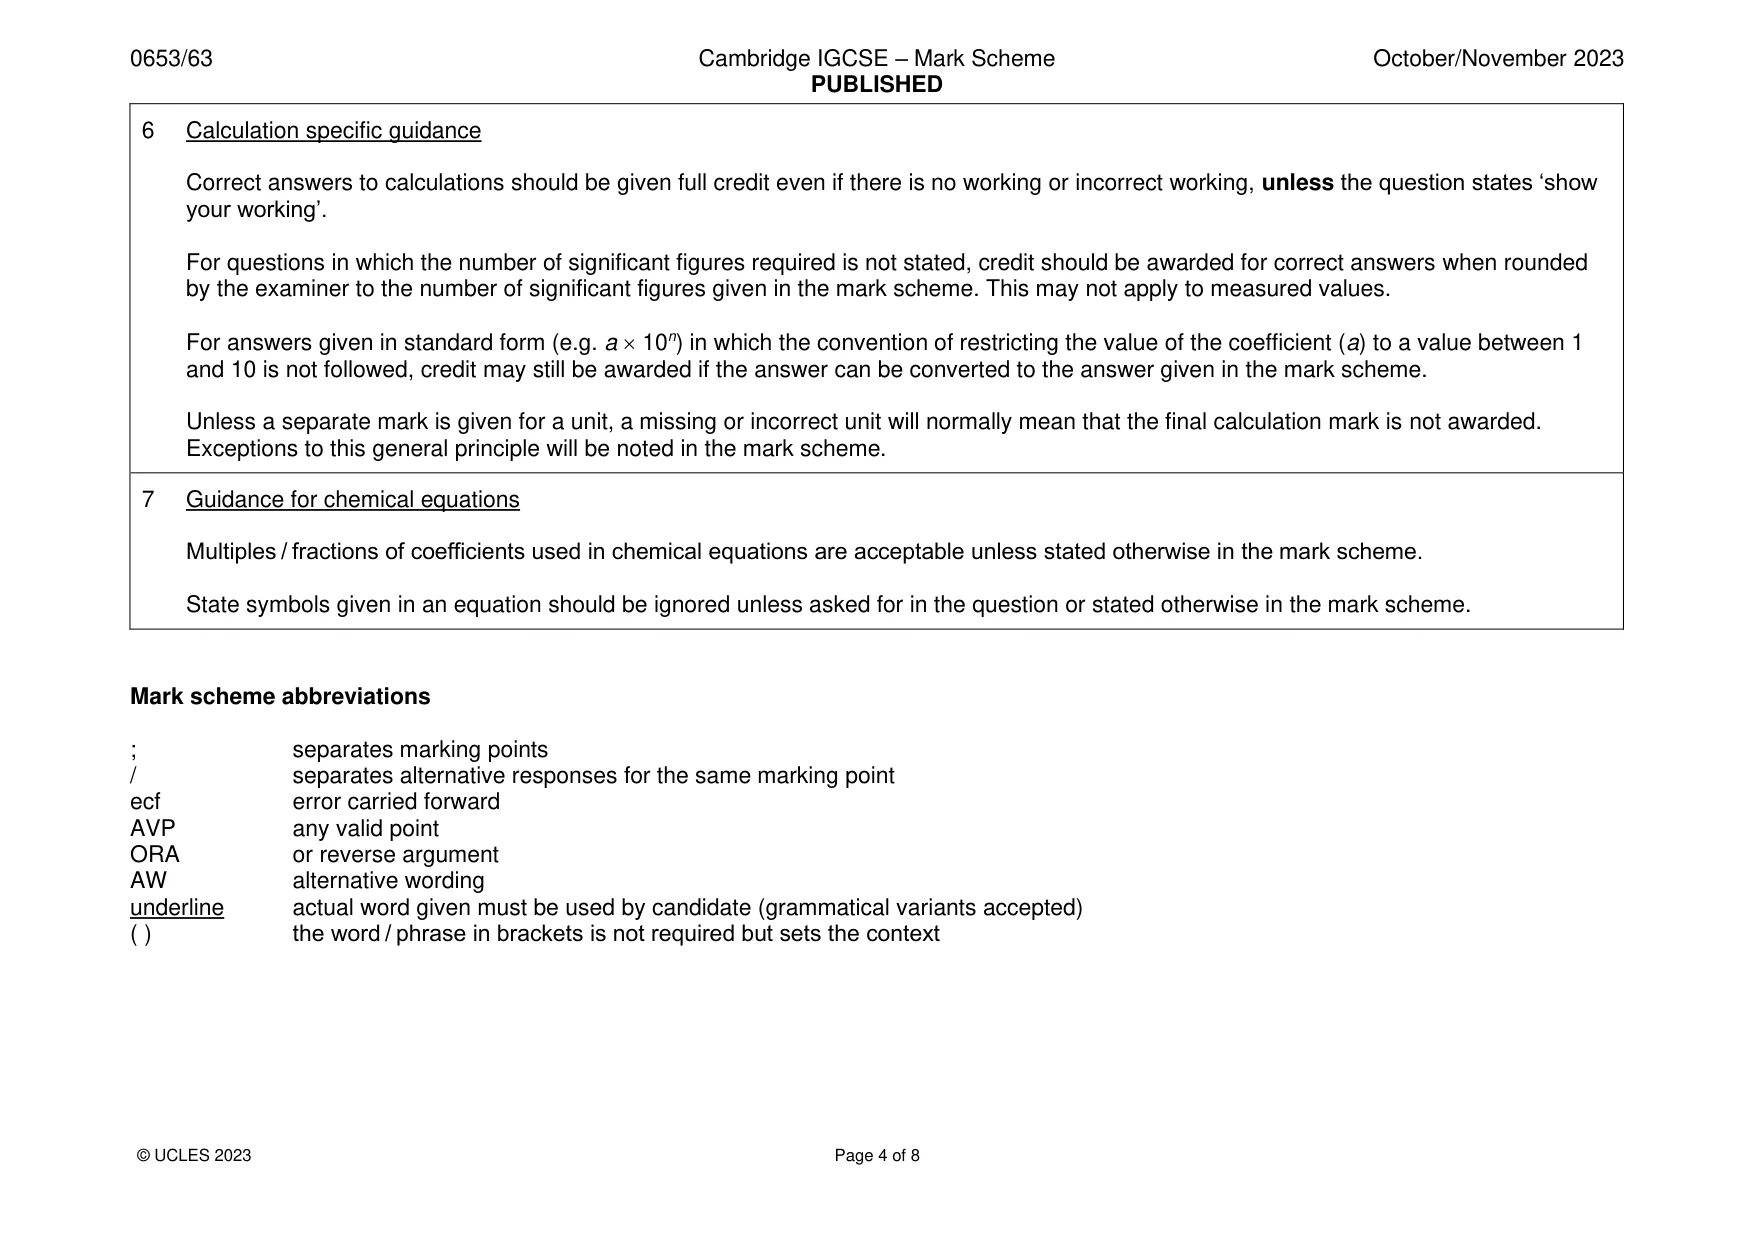
Mark scheme: Question Answer Marks 1(a)(i) factor 1 light ; 4 explanation (only) parts exposed to the light test positive for starch ORA ; factor 2 chlorophyll ; explanation (only) the parts of the leaf that are green test positive for starch ORA ; 1(a)(ii) so colour (change) with iodine can be seen ; 1 1(b) Benedict’s (solution) ; 2 (from blue to) green / yellow / orange / brick-red;
Q2 · Urease is an enzyme that breaks down urea in solution to form aqueous ammonia
2 Urease is an enzyme that breaks down urea in solution to form aqueous ammonia. Urea in solution is almost neutral. The aqueous ammonia formed increases the pH of the solution. Plan an investigation to determine the relationship between the concentration of urease and the pH of the solution formed. You are provided with: • urea solution • 10% urease solution • universal indicator solution and a pH colour chart. You may use any common laboratory apparatus in your plan. In your plan, include: • the apparatus you will use • a brief description of the method, explaining any safety precautions you will take • what you will measure • which variables you will keep constant • how you will process your results to draw a conclusion. You may include a labelled diagram if you wish. You may include a results table if you wish (you do not need to include any results in the table). .......................................................................................................................................................... .......................................................................................................................................................... .......................................................................................................................................................... .......................................................................................................................................................... .......................................................................................................................................................... .......................................................................................................................................................... .......................................................................................................................................................... .......................................................................................................................................................... .......................................................................................................................................................... .......................................................................................................................................................... .......................................................................................................................................................... .......................................................................................................................................................... .......................................................................................................................................................... .......................................................................................................................................................... .......................................................................................................................................................... .................................................................................................................................................... [7]
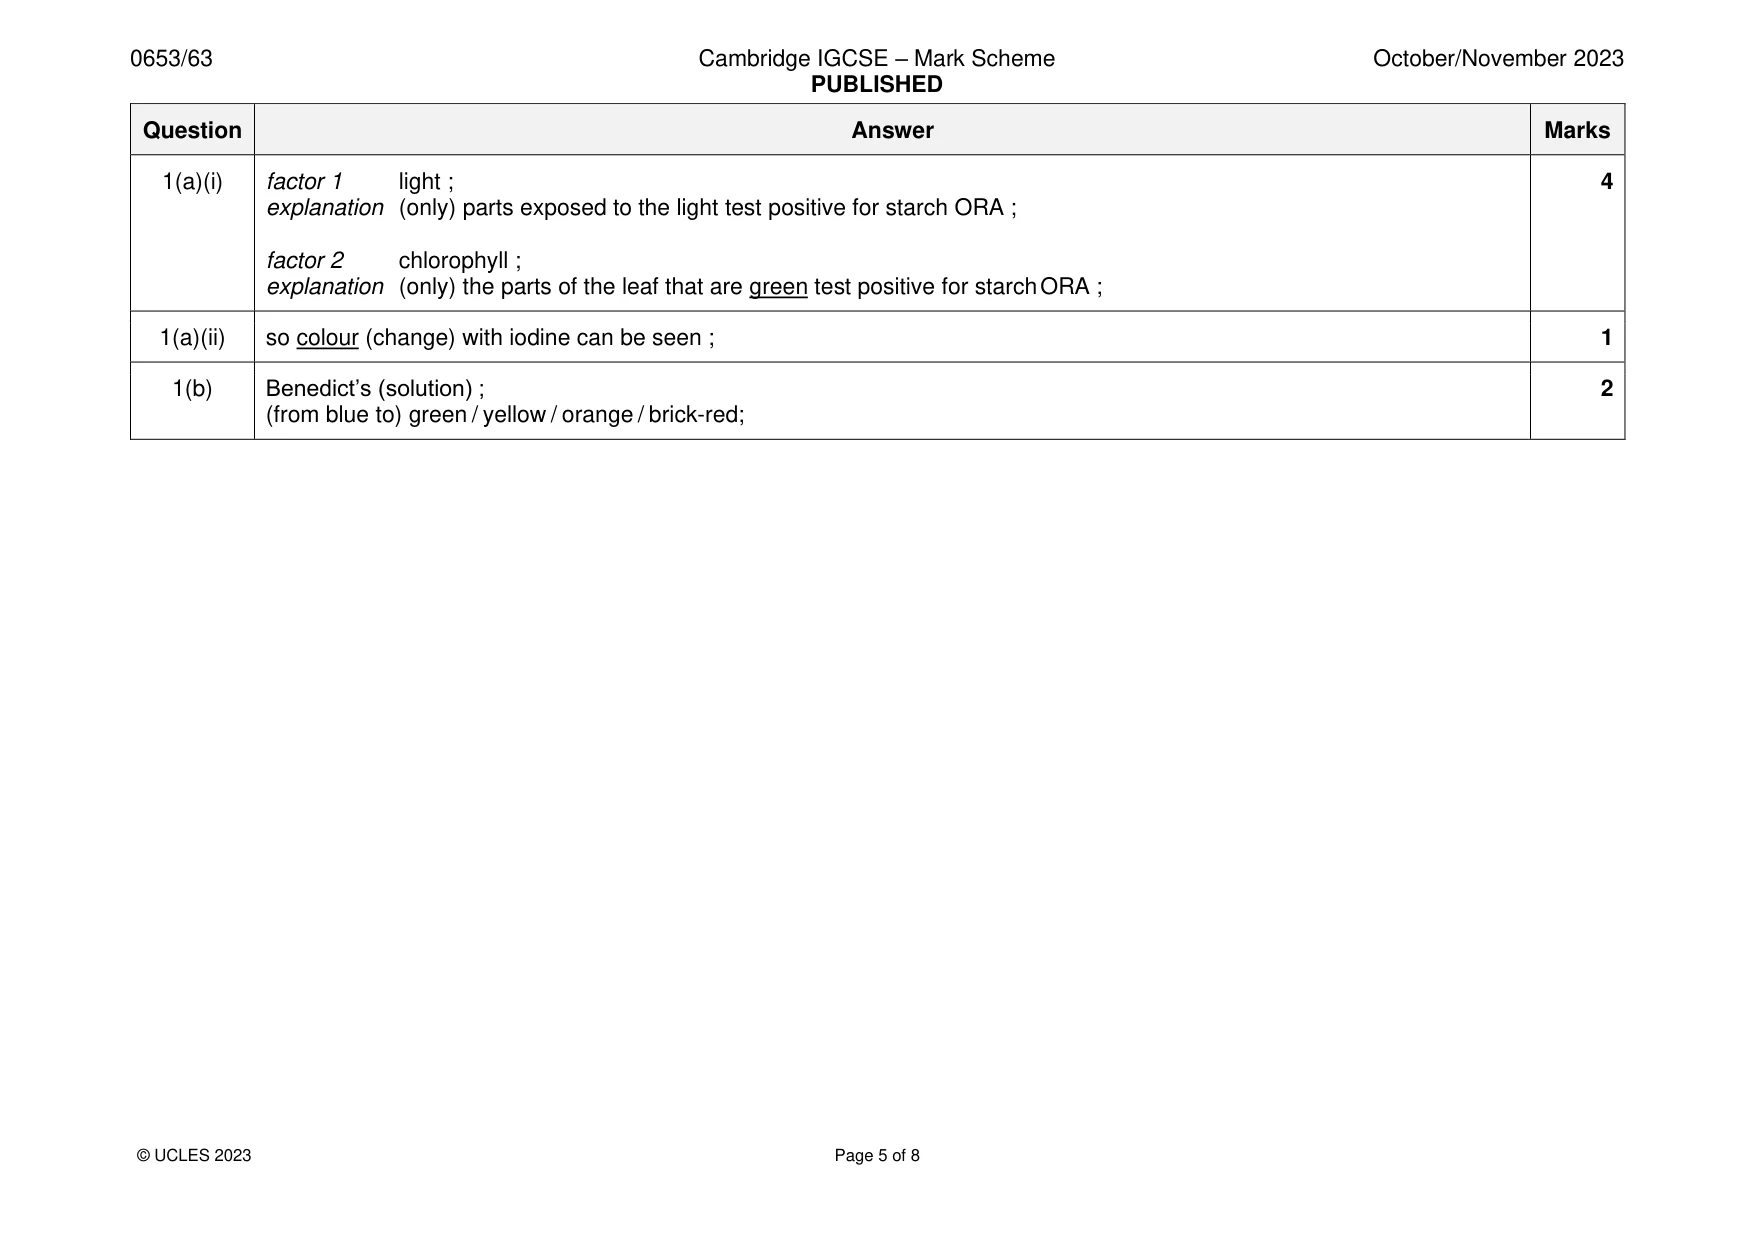
Mark scheme: 2 one mark from each section and any two other marking points 7 1 apparatus measuring cylinder / burette / graduated pipette / volumetric pipette / syringe ; water-bath / thermometer / stop-watch / timer ; safety goggles to keep, urea / urease, out of eyes OR gloves to keep urease / urea from touching skin ; 2 method add two or more concentrations of urease solution to urea solution and add (universal) indicator ; use at least five different concentrations ; 3 measurements volume of urea ; volume of urease (and water) ; compare colour (to chart) to determine pH, value / number ; 4 control variables (for different concentrations of urease) ; same volume / concentration of urea ; same total volume of urease/enzyme and water ; same temperature ; 5 processing and drawing a conclusion plot graph of pH (number) against (enzyme) concentration ; take averages of pH from repeated experiments (at the same concentration) / repeat and exclude anomalous results (at the same concentration) ;
Q3 · A student investigates a white solid, H
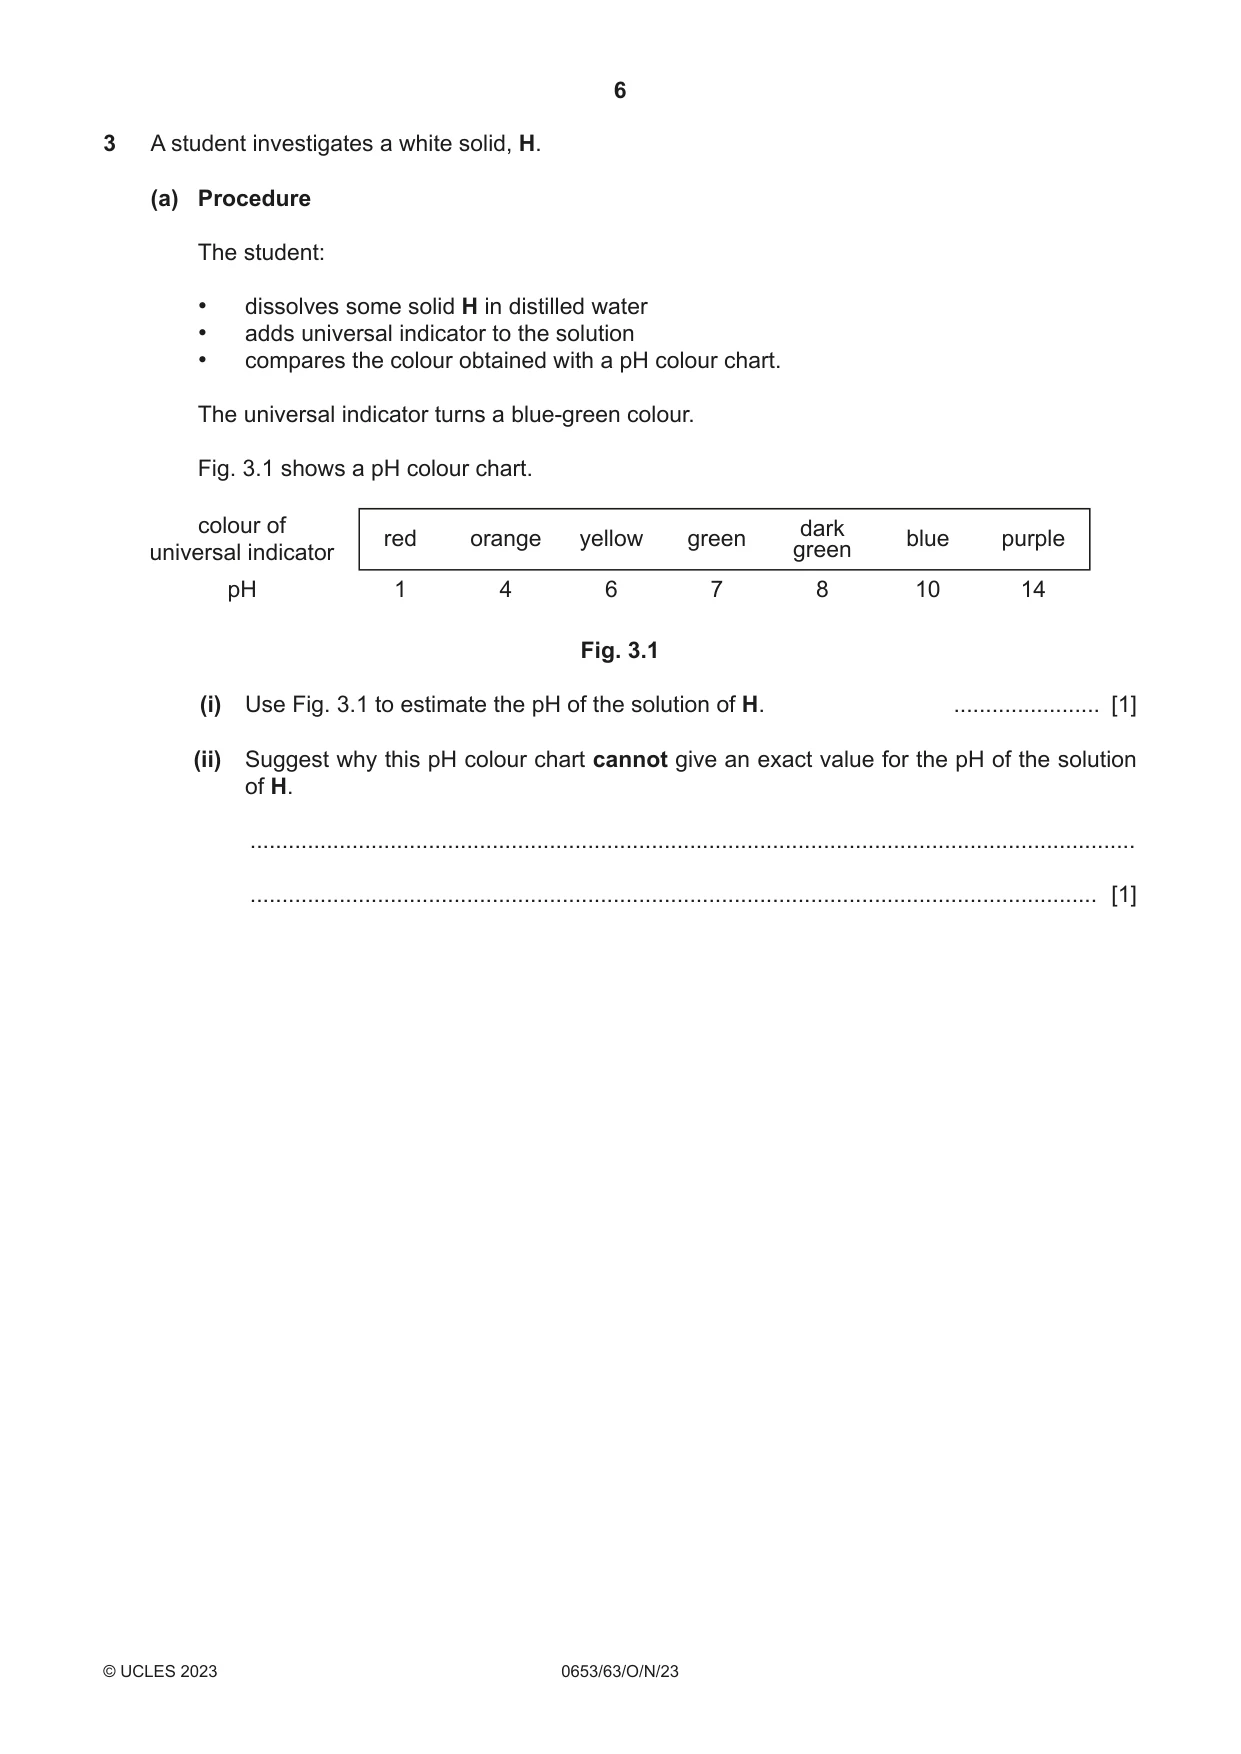
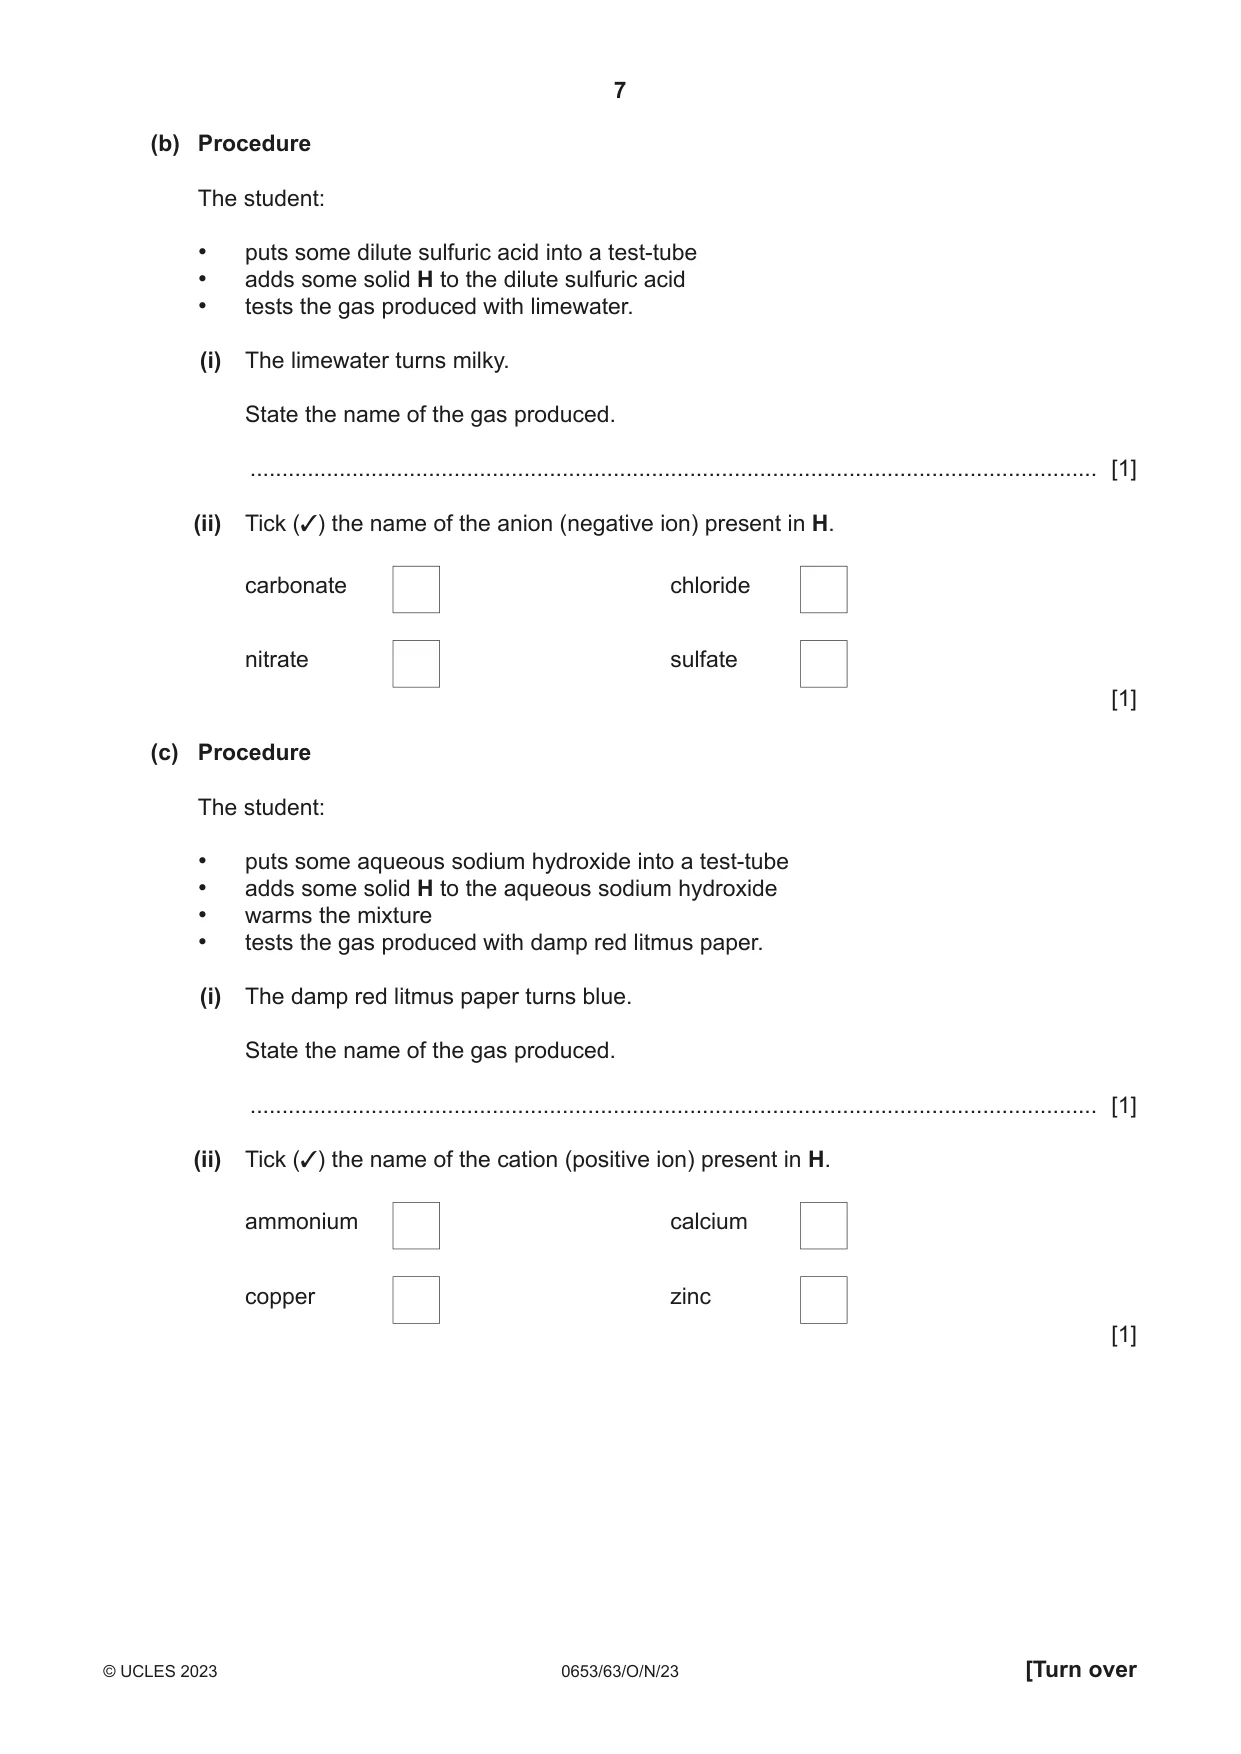
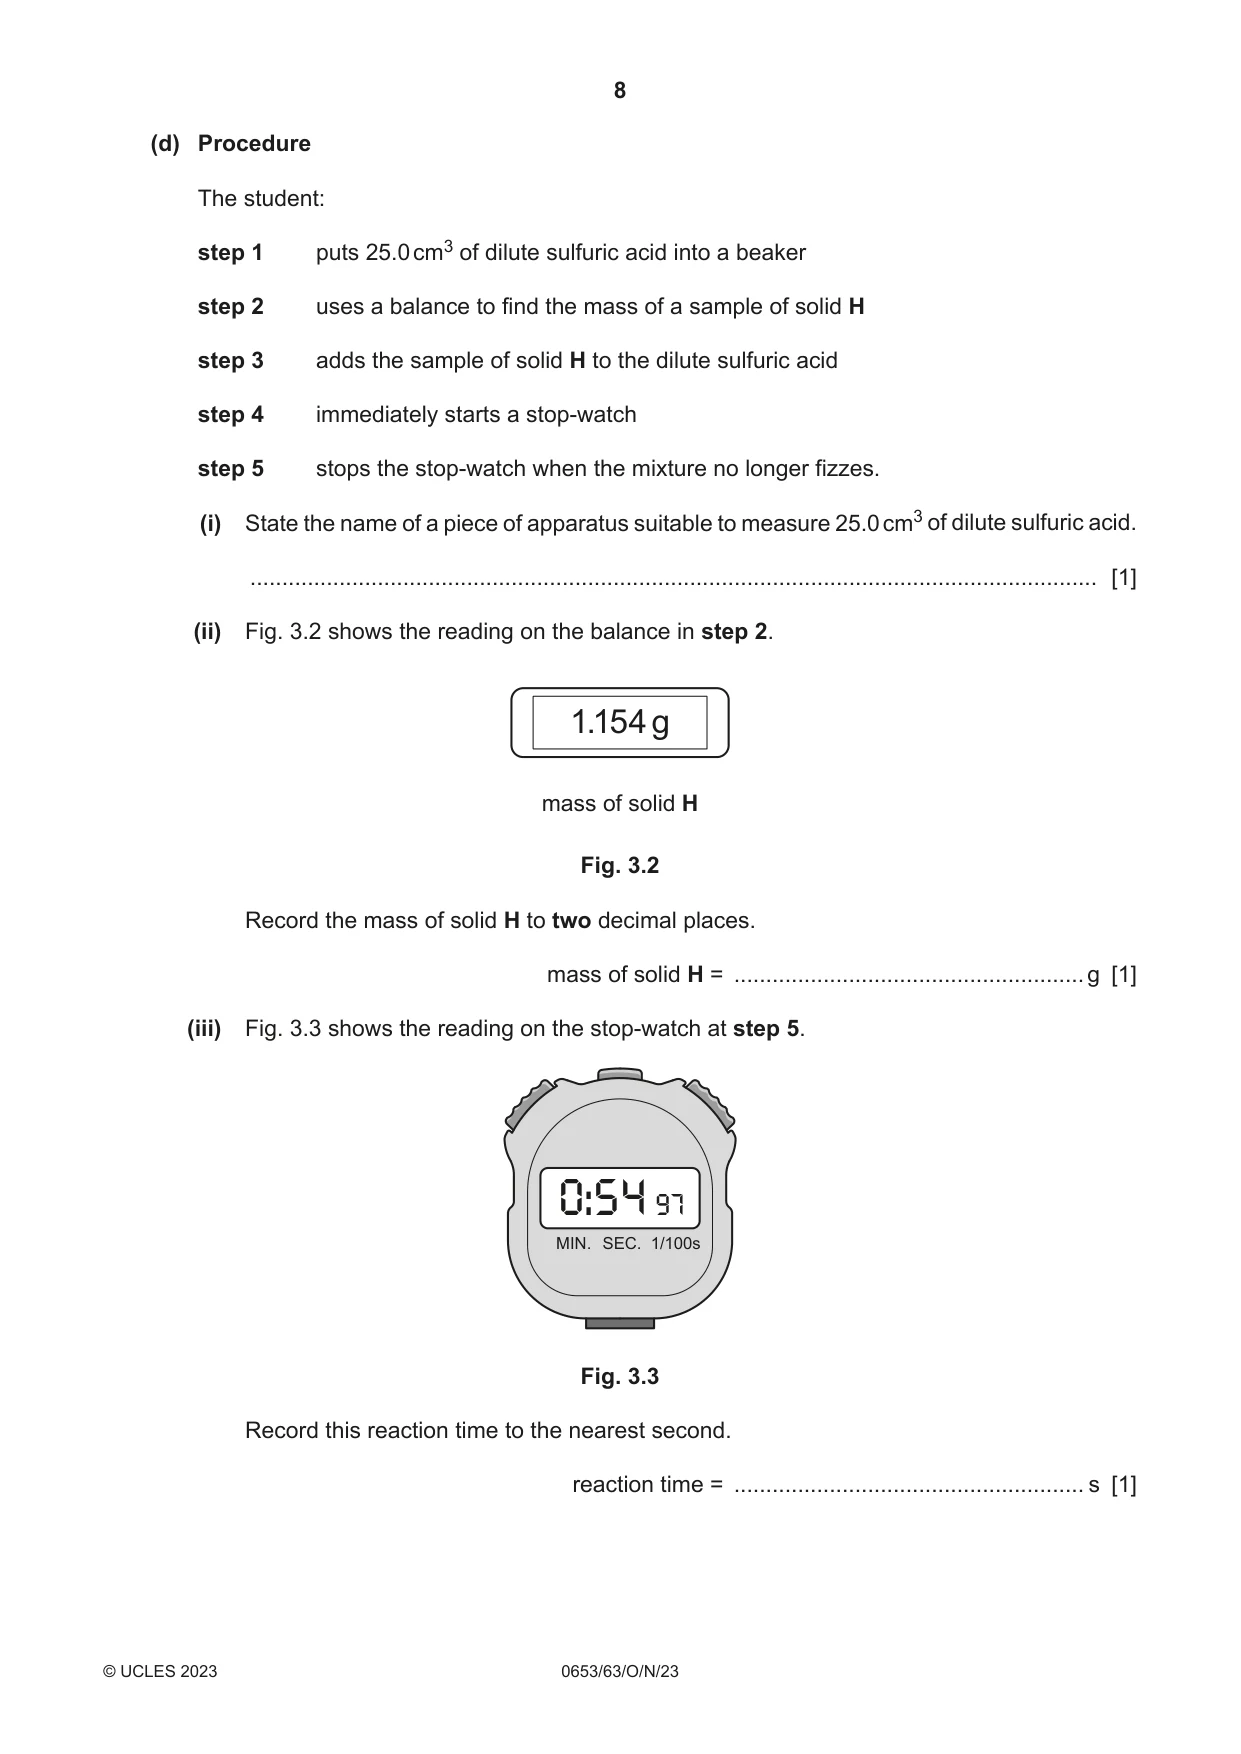
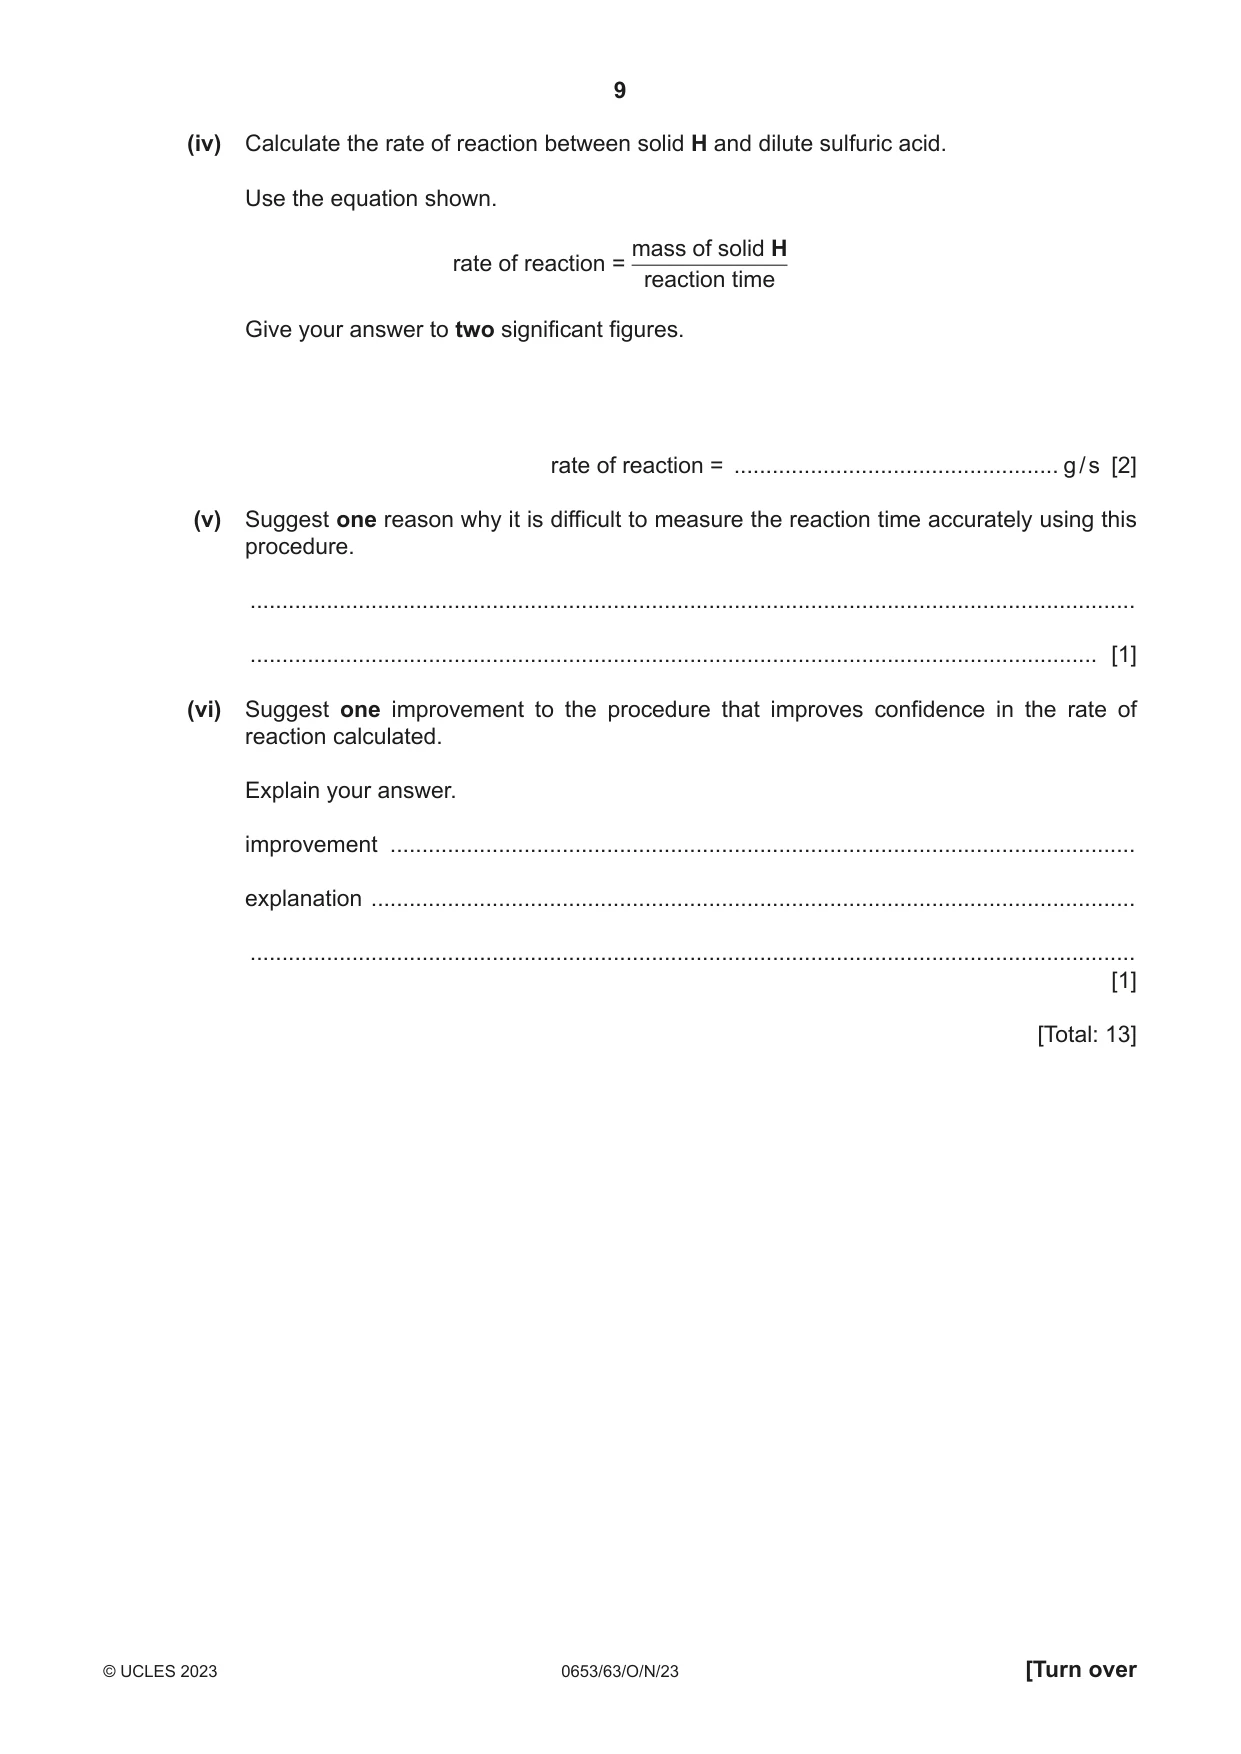
3 A student investigates a white solid, H. (a) Procedure The student: • dissolves some solid H in distilled water • adds universal indicator to the solution • compares the colour obtained with a pH colour chart. The universal indicator turns a blue‑green colour. Fig. 3.1 shows a pH colour chart. colour of dark red orange yellow green blue purple universal indicator green pH 1 4 6 7 8 10 14 Fig. 3.1 (i) Use Fig. 3.1 to estimate the pH of the solution of H. ....................... [1] (ii) Suggest why this pH colour chart cannot give an exact value for the pH of the solution of H. ........................................................................................................................................... ..................................................................................................................................... [1] (b) Procedure The student: • puts some dilute sulfuric acid into a test‑tube • adds some solid H to the dilute sulfuric acid • tests the gas produced with limewater. (i) The limewater turns milky. State the name of the gas produced. ..................................................................................................................................... [1] (ii) Tick (3) the name of the anion (negative ion) present in H. carbonate chloride nitrate sulfate [1] (c) Procedure The student: • puts some aqueous sodium hydroxide into a test‑tube • adds some solid H to the aqueous sodium hydroxide • warms the mixture • tests the gas produced with damp red litmus paper. (i) The damp red litmus paper turns blue. State the name of the gas produced. ..................................................................................................................................... [1] (ii) Tick (3) the name of the cation (positive ion) present in H. ammonium calcium copper zinc [1] (d) Procedure The student: step 1 puts 25.0 cm3 of dilute sulfuric acid into a beaker step 2 uses a balance to find the mass of a sample of solid H step 3 adds the sample of solid H to the dilute sulfuric acid step 4 immediately starts a stop‑watch step 5 stops the stop‑watch when the mixture no longer fizzes. (i) State the name of a piece of apparatus suitable to measure 25.0 cm3 of dilute sulfuric acid. ..................................................................................................................................... [1] (ii) Fig. 3.2 shows the reading on the balance in step 2. 1.154 g mass of solid H Fig. 3.2 Record the mass of solid H to two decimal places. mass of solid H = ....................................................... g [1] (iii) Fig. 3.3 shows the reading on the stop‑watch at step 5. 0:54 97 MIN. SEC. 1/100s Fig. 3.3 Record this reaction time to the nearest second. reaction time = ....................................................... s [1] (iv) Calculate the rate of reaction between solid H and dilute sulfuric acid. Use the equation shown. mass of solid H rate of reaction = reaction time Give your answer to two significant figures. rate of reaction = ................................................... g / s [2] (v) Suggest one reason why it is difficult to measure the reaction time accurately using this procedure. ........................................................................................................................................... ..................................................................................................................................... [1] (vi) Suggest one improvement to the procedure that improves confidence in the rate of reaction calculated. Explain your answer. improvement ..................................................................................................................... explanation ........................................................................................................................ ........................................................................................................................................... [1] [Total: 13]
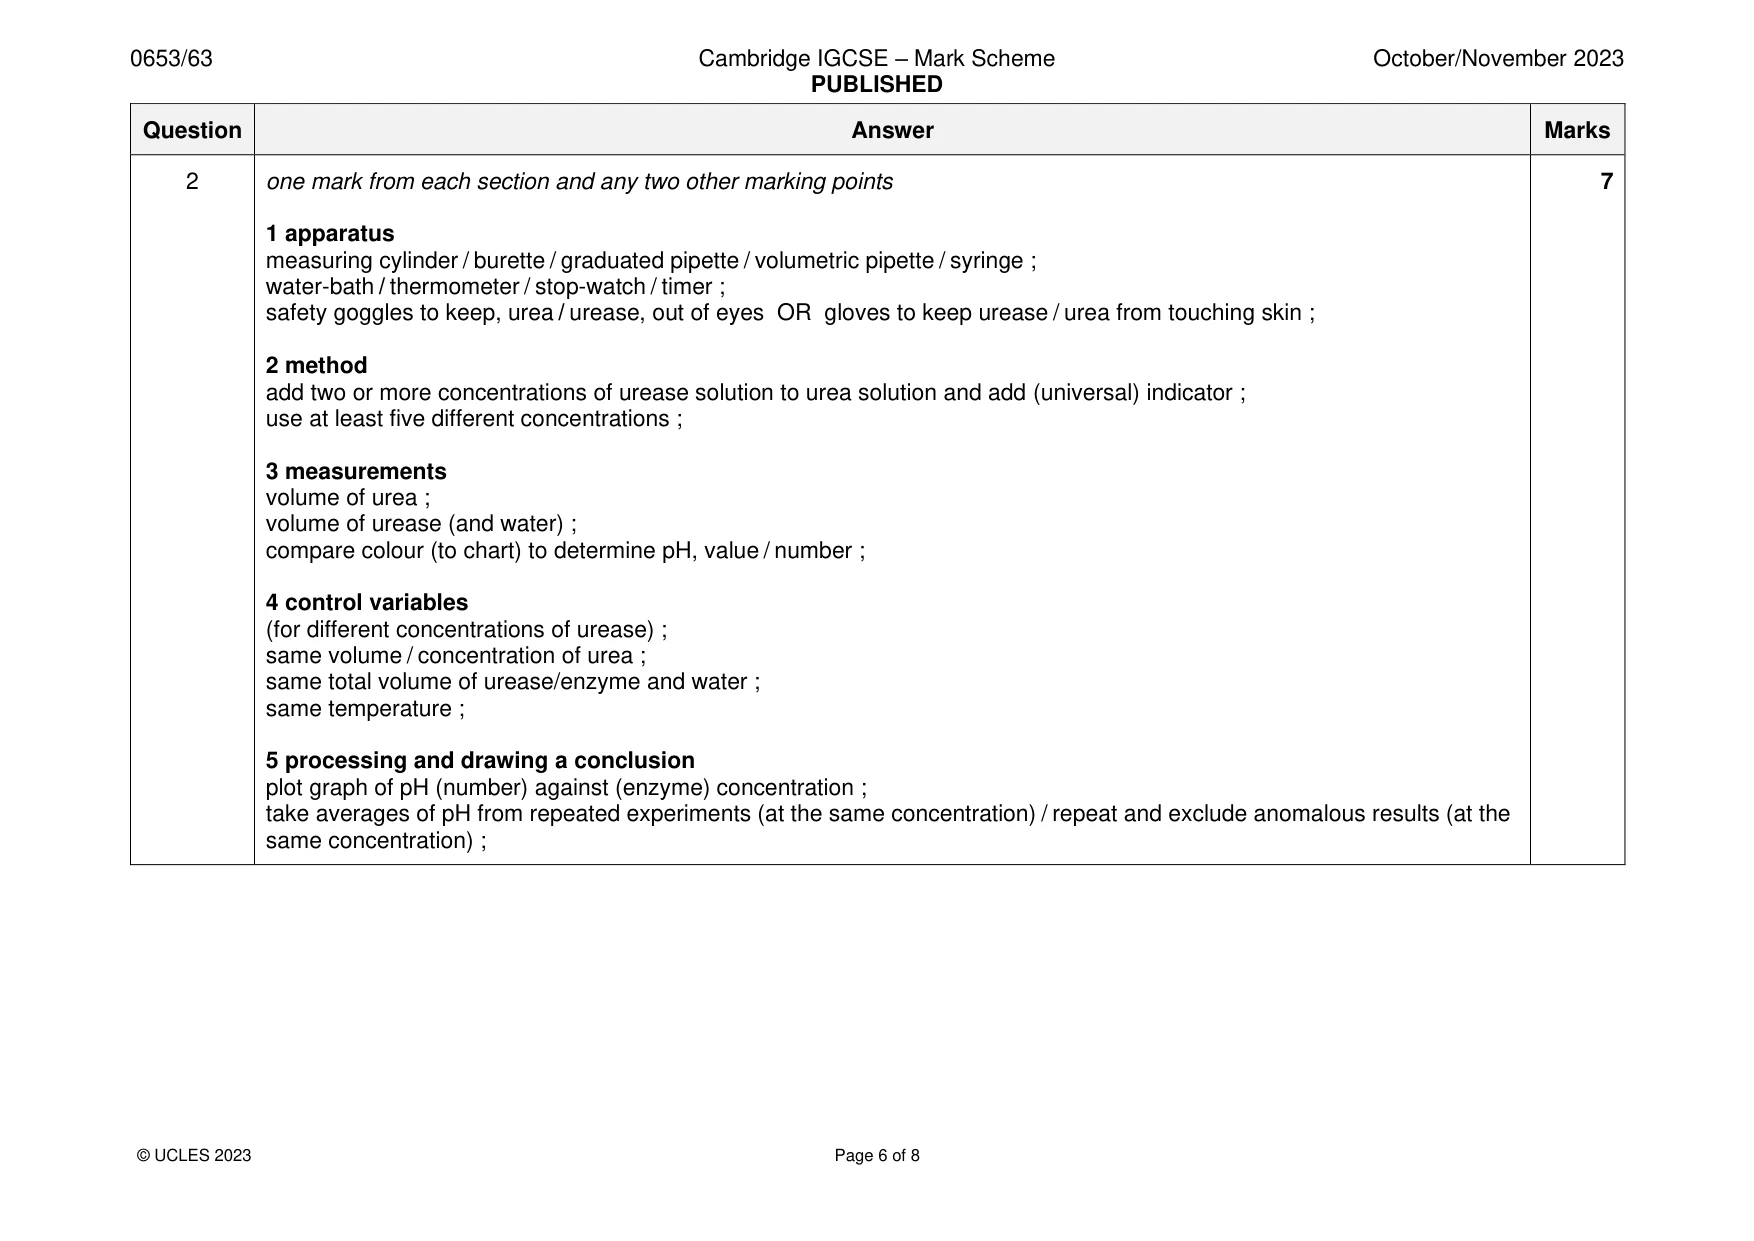
Mark scheme: 3(a)(i) 9 ; 1 3(a)(ii) blue-green is not on the chart / no pH for blue-green ; 1 3(b)(i) carbon dioxide ; 1 3(b)(ii) carbonate ; 1 3(c)(i) ammonia ; 1 3(c)(ii) ammonium ; 1 3(d)(i) measuring cylinder / burette / graduated pipette ; 1 3(d)(ii) 1.15 ; 1 3(d)(iii) 55 ; 1 3(d)(iv) 0.0209 ; 2 to two significant figures 0.021 (g / s) ; 3(d)(v) idea that cannot easily tell when the fizzing stops ; 1 3(d)(vi) any one from: 1 repeat measurements to exclude anomalous results ; repeat AND average to reduce effect of random errors ; use larger amounts of (both) reagents to give a longer reaction time ; measure time to collect fixed volume of gas (e.g. with gas syringe) because not subjective judgment of fizzing / measure volume in a fixed time because not subjective judgement of fizzing ;
Q4 · A student investigates the magnification of a thin converging lens
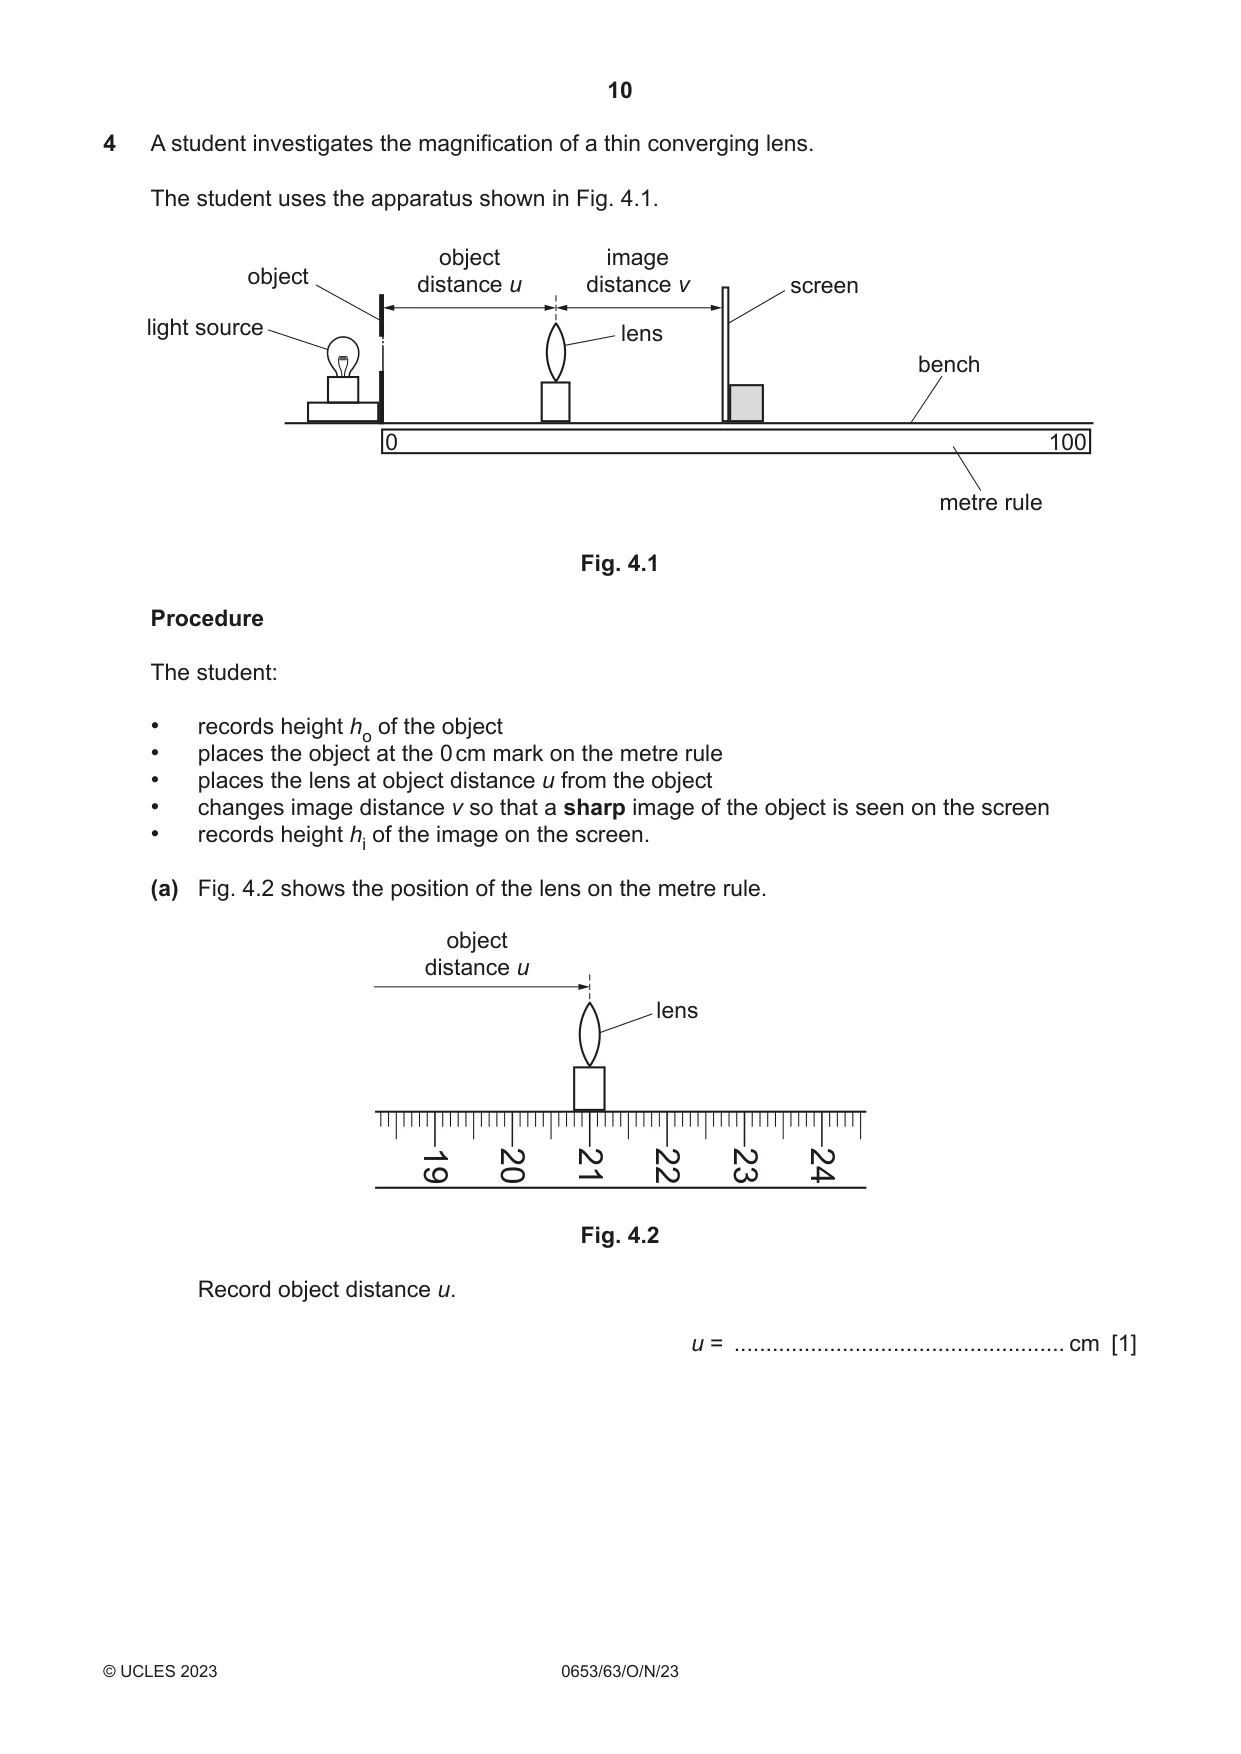
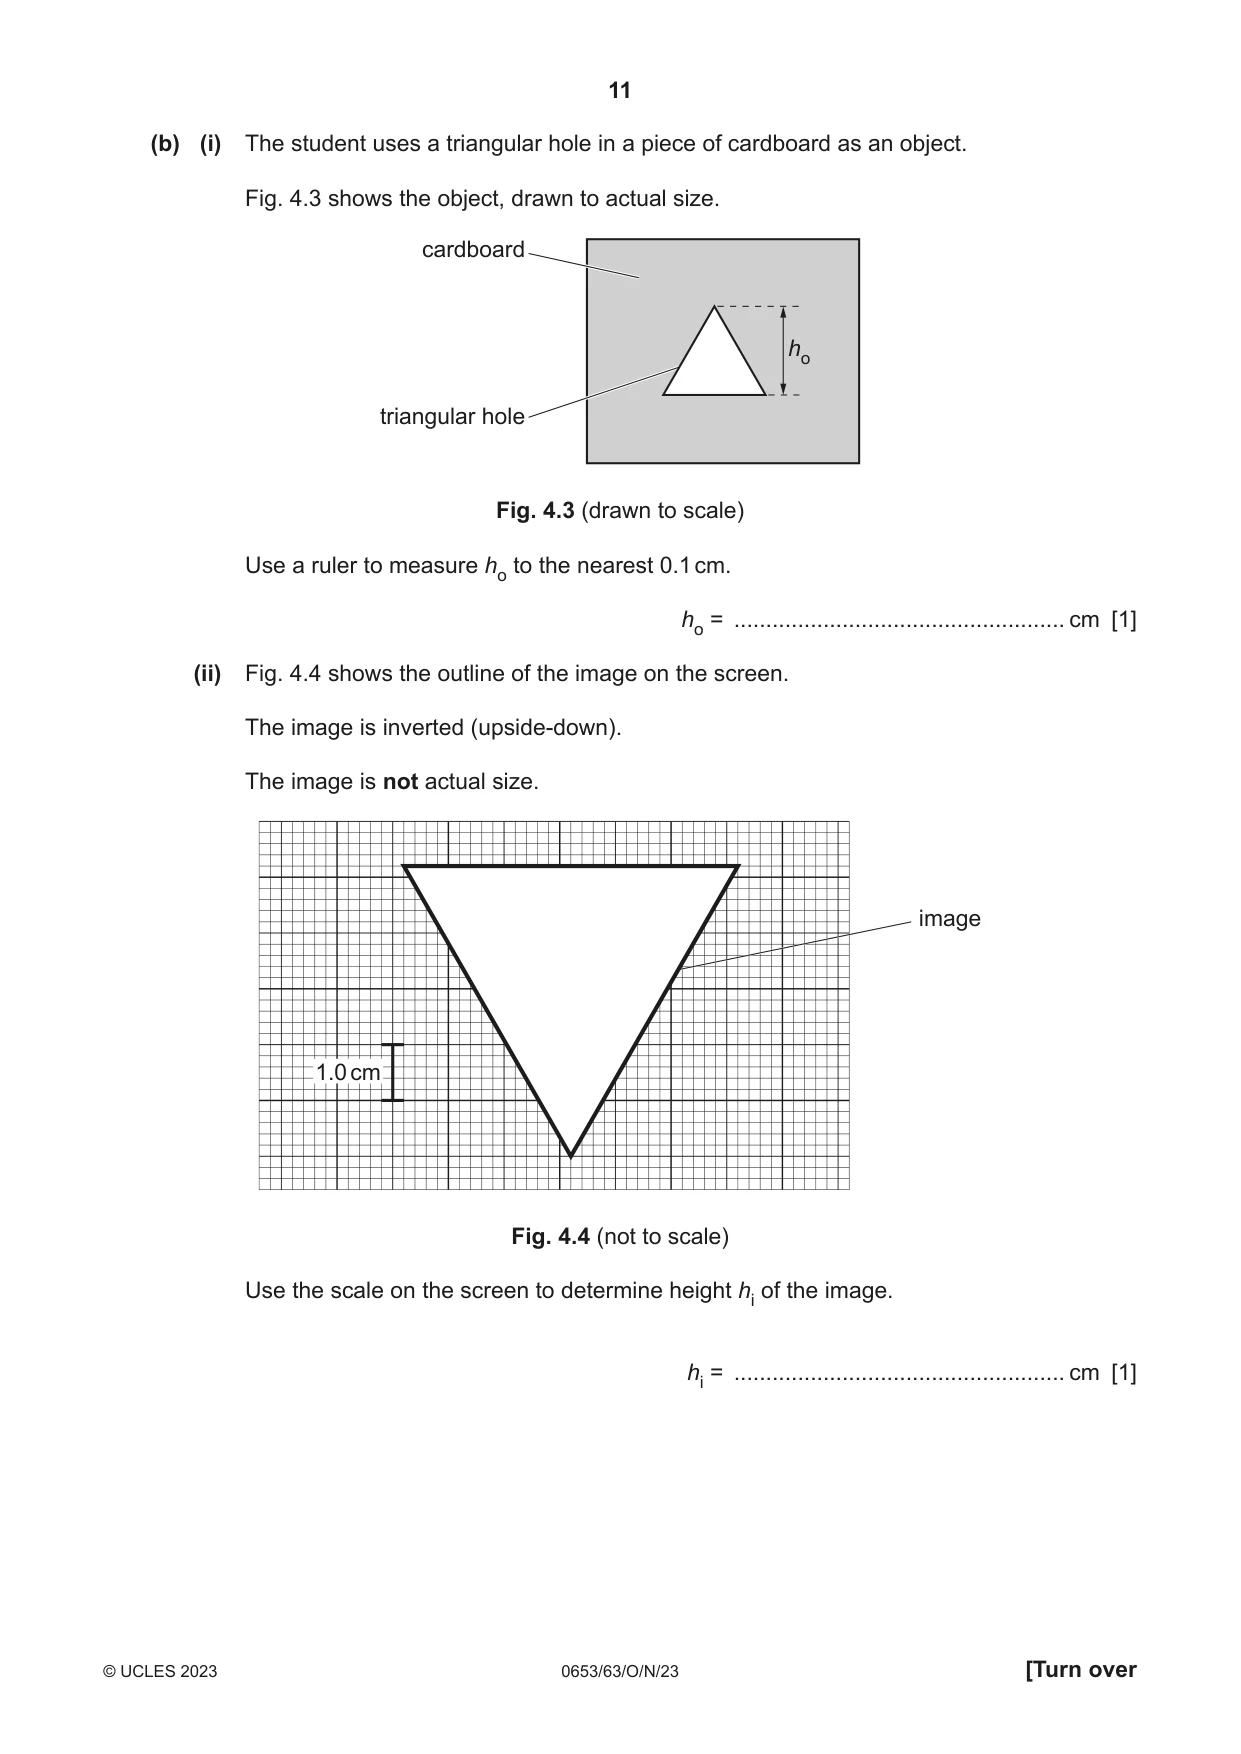
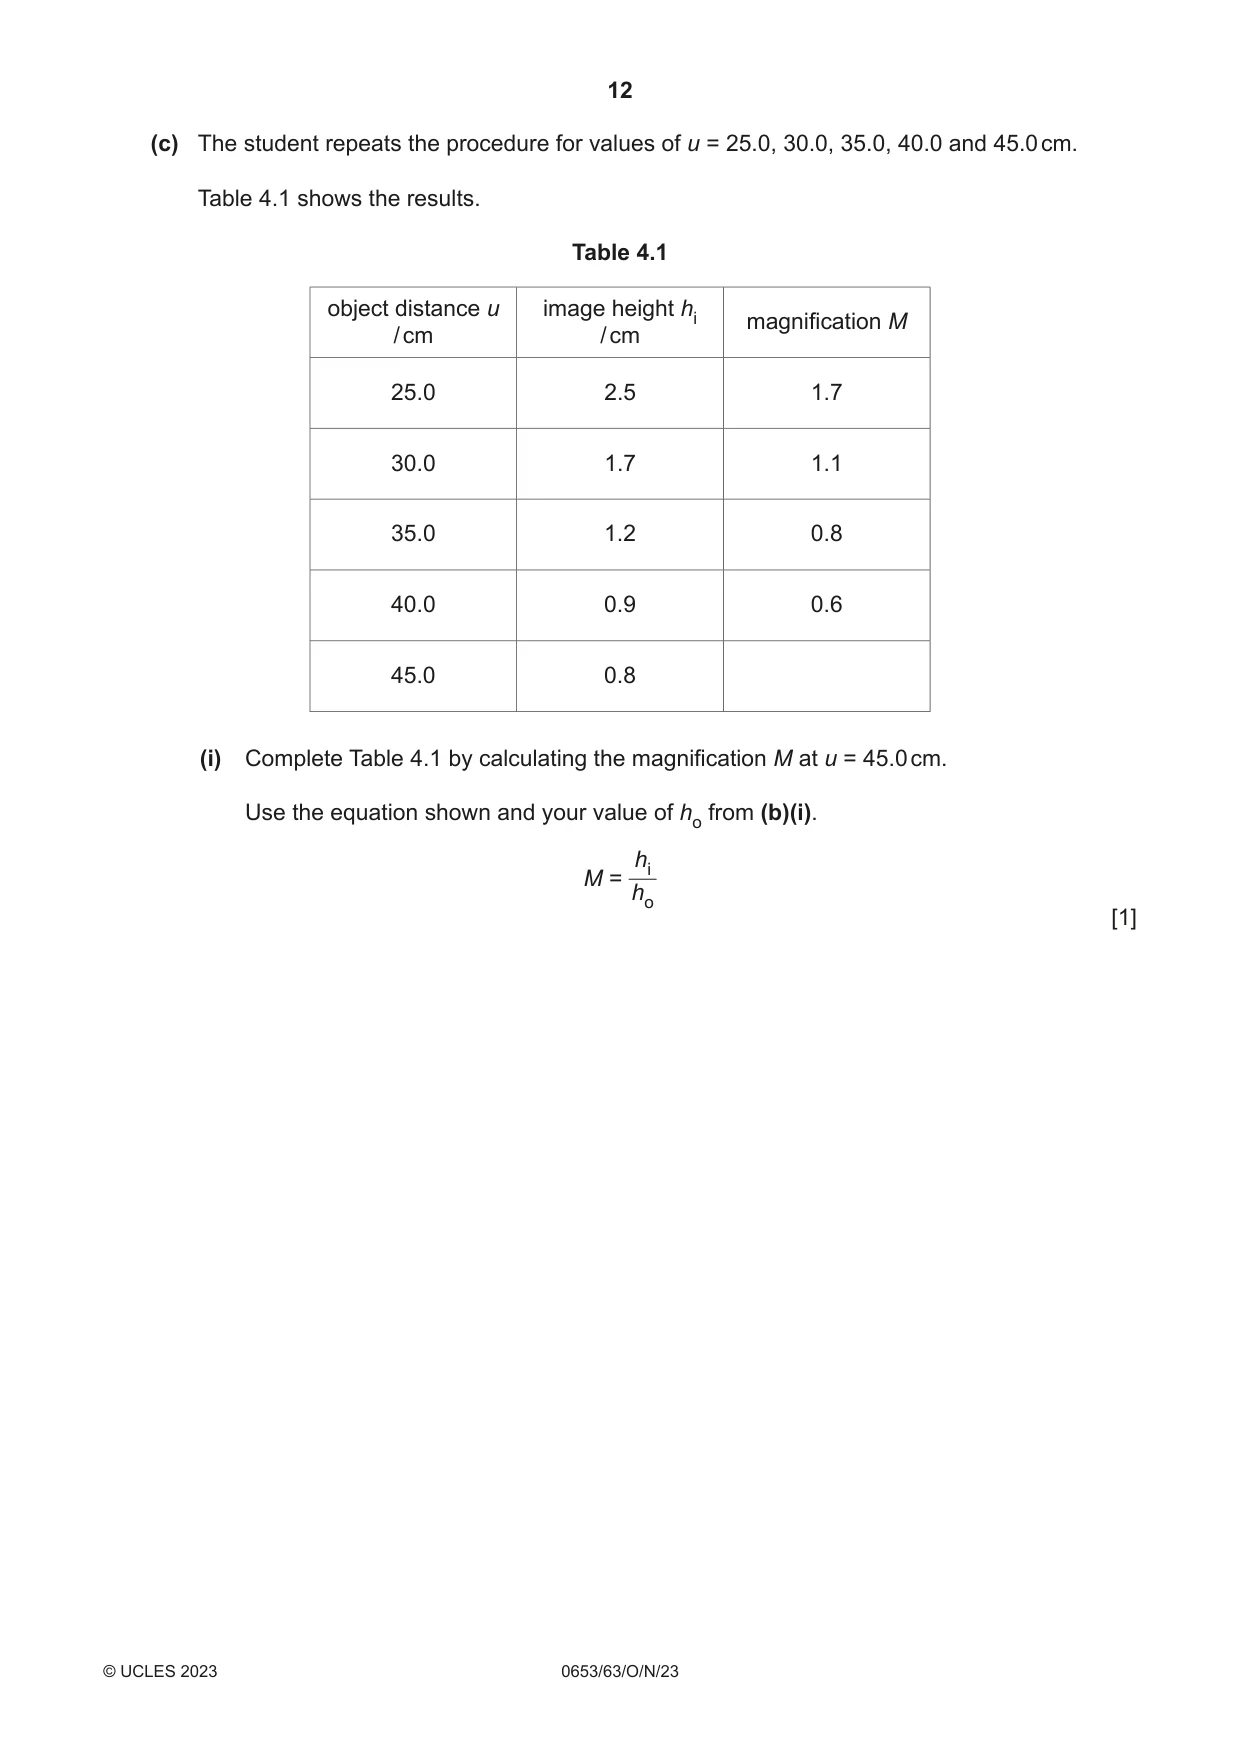
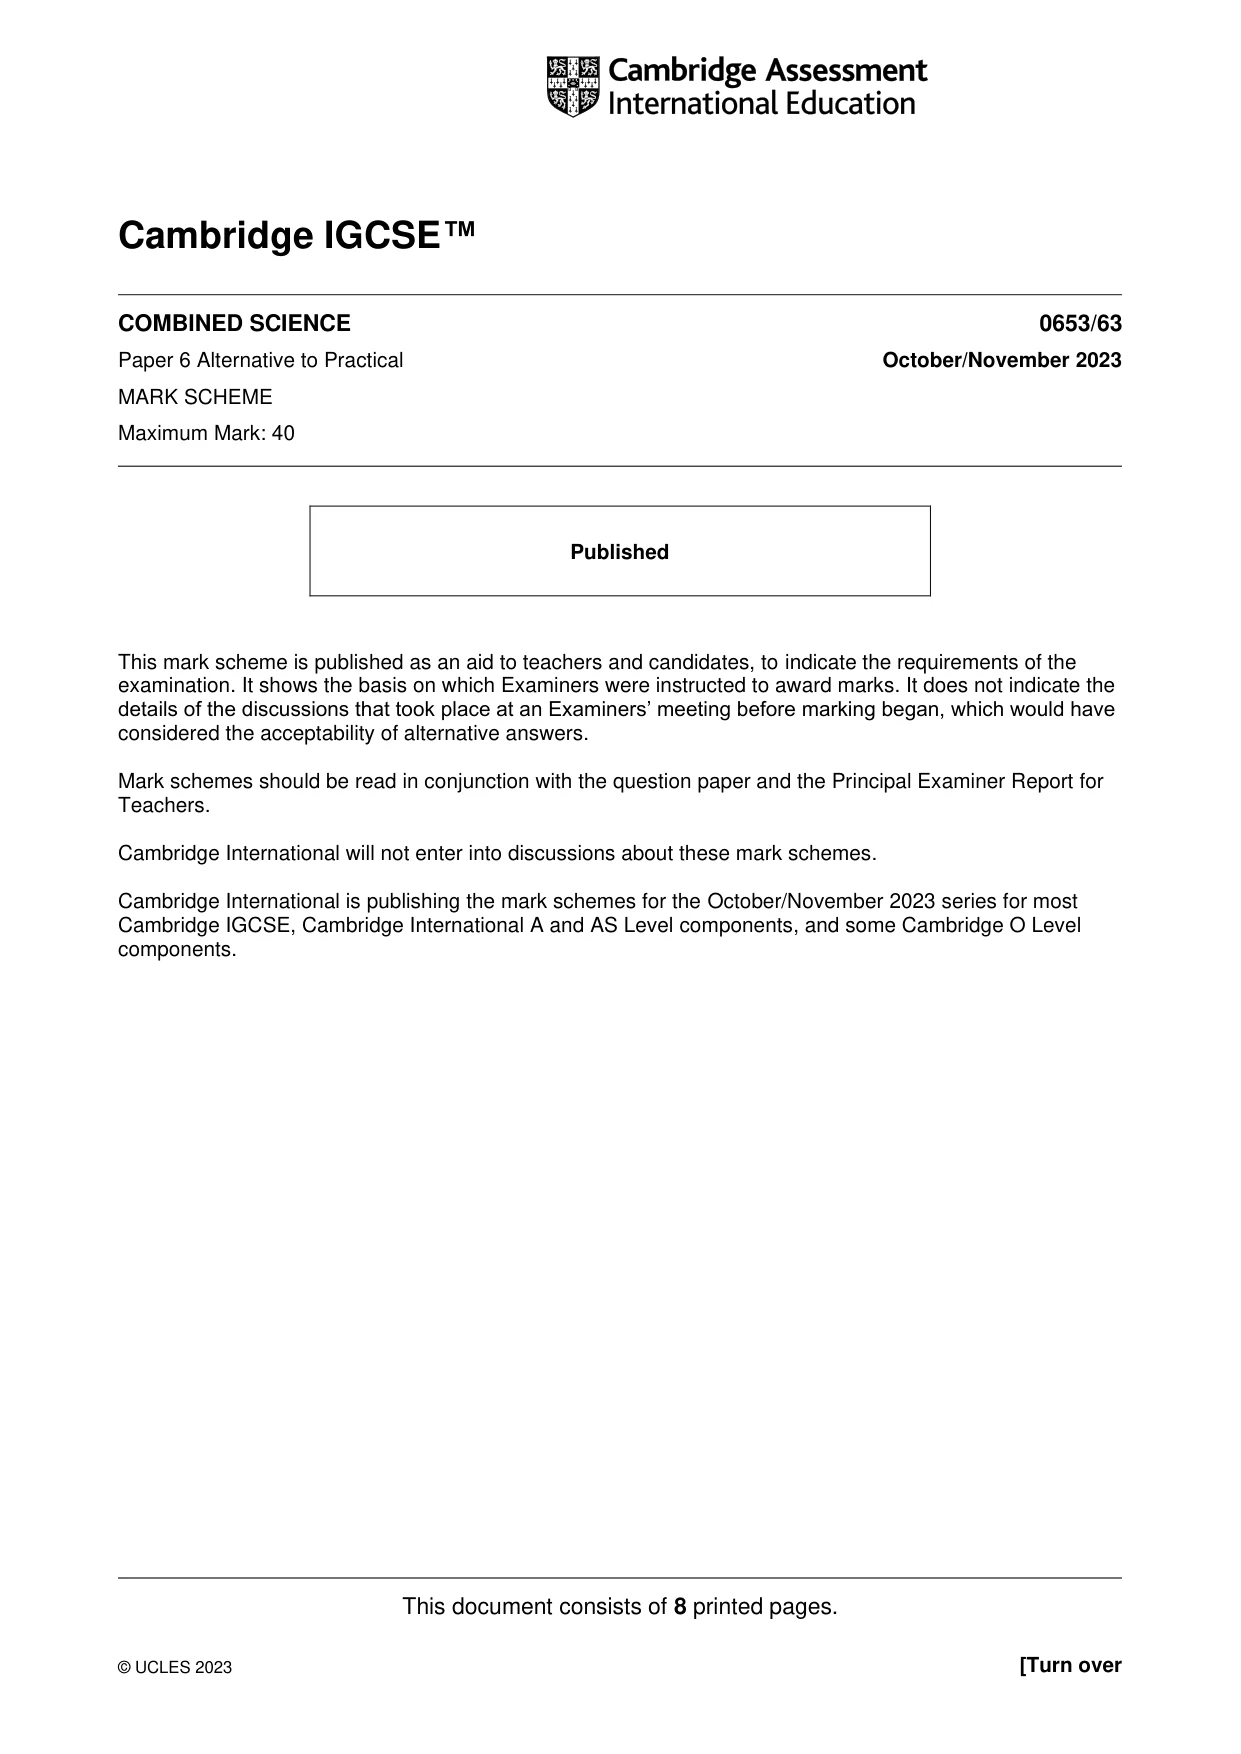
4 A student investigates the magnification of a thin converging lens. The student uses the apparatus shown in Fig. 4.1. object image object distance u distance v screen light source lens bench 0 100 metre rule Fig. 4.1 Procedure The student: • records height ho of the object • places the object at the 0 cm mark on the metre rule • places the lens at object distance u from the object • changes image distance v so that a sharp image of the object is seen on the screen • records height hi of the image on the screen. (a) Fig. 4.2 shows the position of the lens on the metre rule. object distance u lens 19 20 21 22 23 24 Fig. 4.2 Record object distance u. u = .................................................... cm [1] (b) (i) The student uses a triangular hole in a piece of cardboard as an object. Fig. 4.3 shows the object, drawn to actual size. cardboard ho triangular hole Fig. 4.3 (drawn to scale) Use a ruler to measure ho to the nearest 0.1 cm. ho = .................................................... cm [1] (ii) Fig. 4.4 shows the outline of the image on the screen. The image is inverted (upside‑down). The image is not actual size. image 1.0 cm Fig. 4.4 (not to scale) Use the scale on the screen to determine height hi of the image. hi = .................................................... cm [1] (c) The student repeats the procedure for values of u = 25.0, 30.0, 35.0, 40.0 and 45.0 cm. Table 4.1 shows the results. Table 4.1 object distance u image height hi magnification M / cm / cm 25.0 2.5 1.7 30.0 1.7 1.1 35.0 1.2 0.8 40.0 0.9 0.6 45.0 0.8 (i) Complete Table 4.1 by calculating the magnification M at u = 45.0 cm. Use the equation shown and your value of ho from (b)(i). hi M = ho [1]
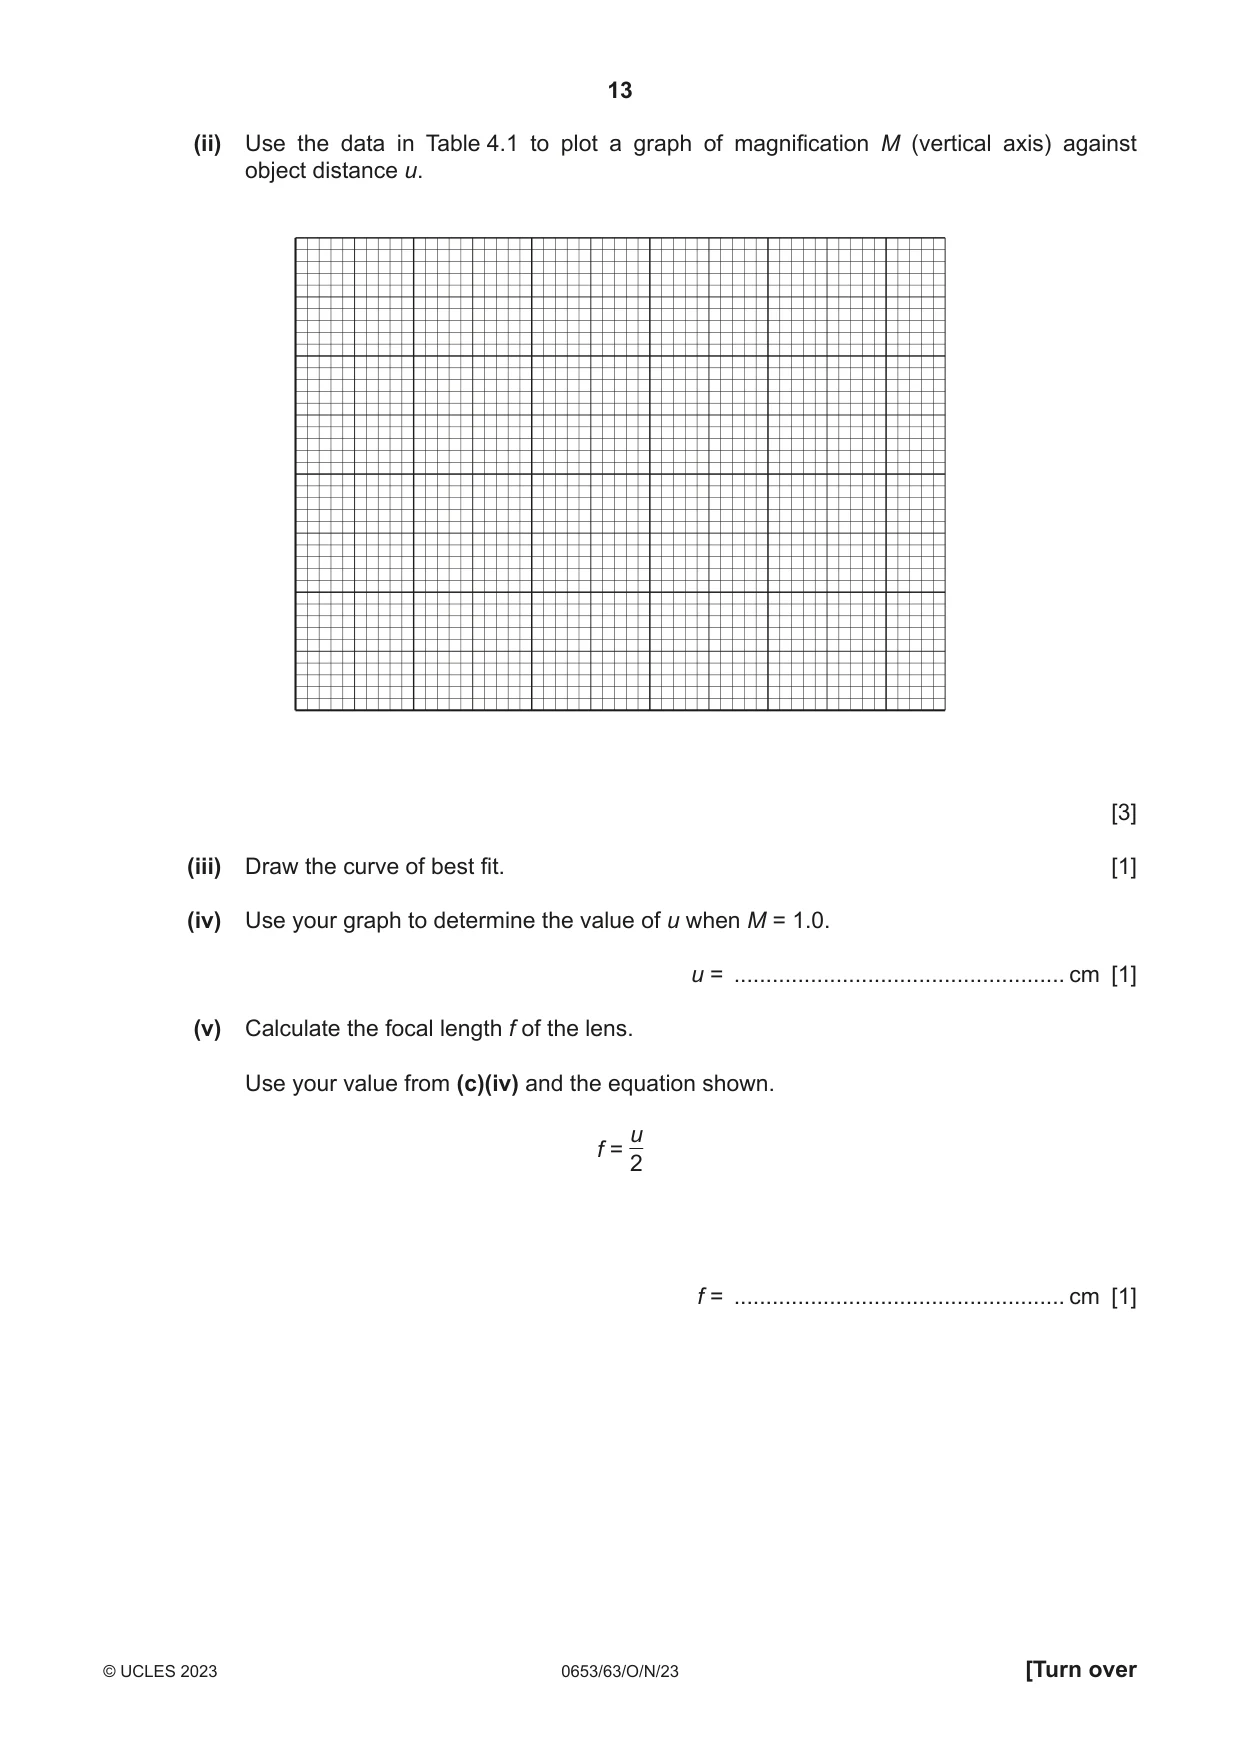
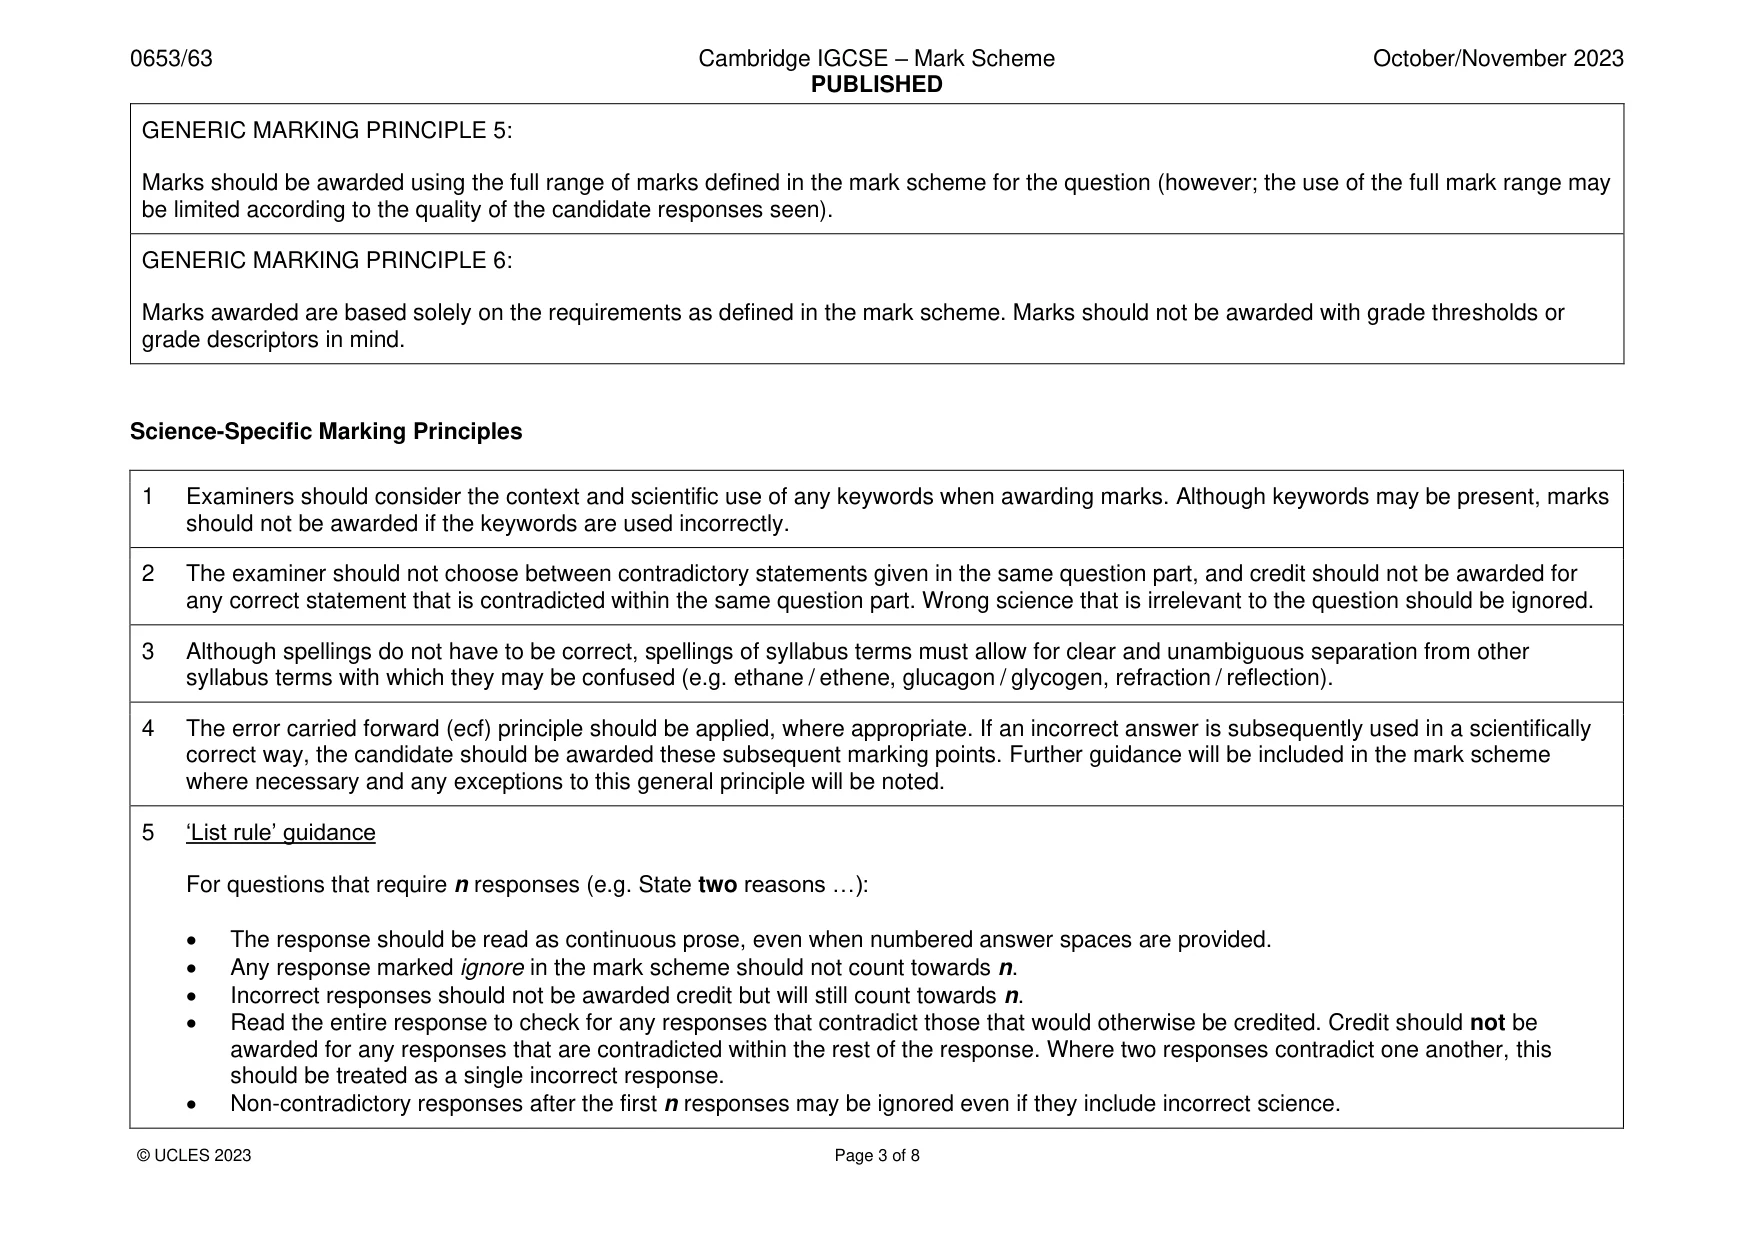
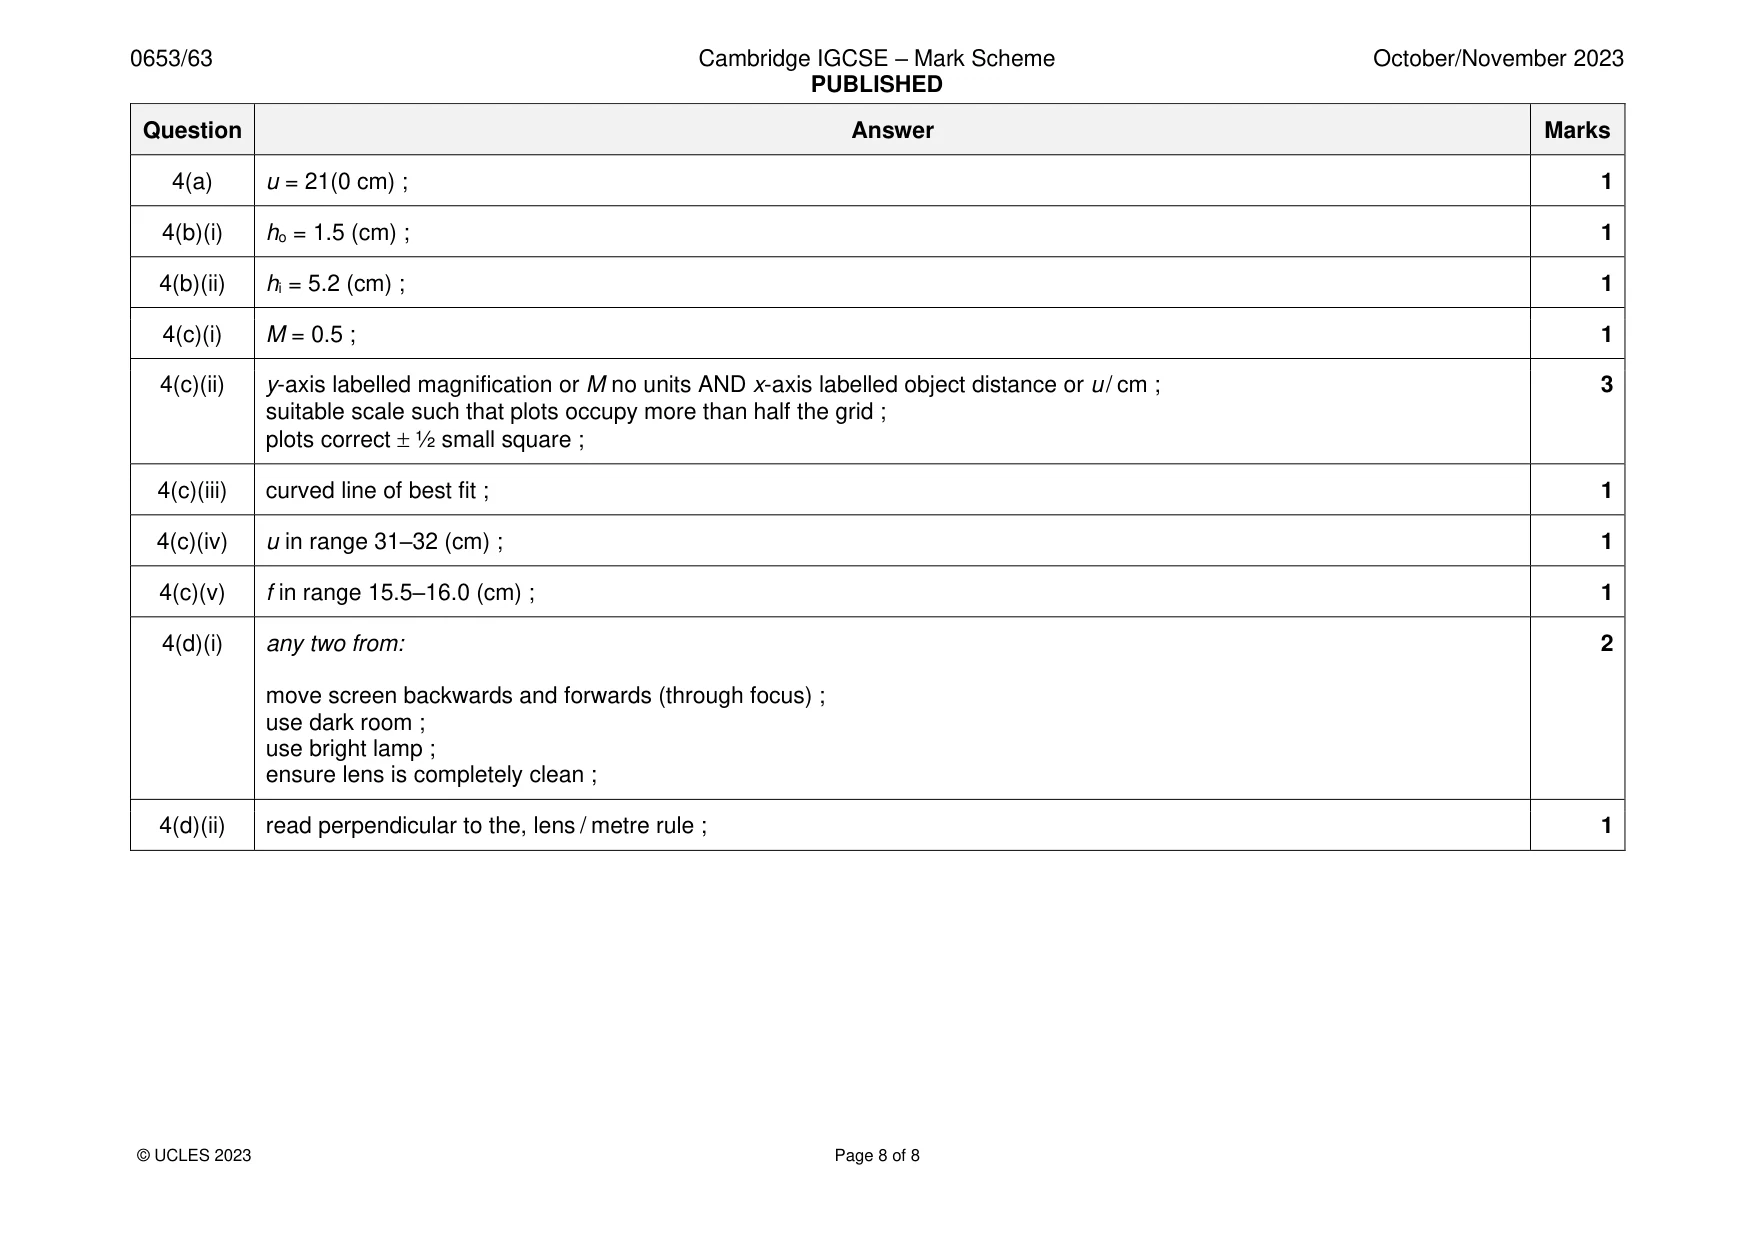
Mark scheme: 4(a) u = 21(0 cm) ; 1 4(b)(i) ho = 1.5 (cm) ; 1 4(b)(ii) hi = 5.2 (cm) ; 1 4(c)(i) M = 0.5 ; 1 4(c)(ii) y-axis labelled magnification or M no units AND x-axis labelled object distance or u / cm ; 3 suitable scale such that plots occupy more than half the grid ; plots correct ½ small square ; 4(c)(iii) curved line of best fit ; 1 4(c)(iv) u in range 31–32 (cm) ; 1 4(c)(v) f in range 15.5–16.0 (cm) ; 1 4(d)(i) any two from: 2 move screen backwards and forwards (through focus) ; use dark room ; use bright lamp ; ensure lens is completely clean ; 4(d)(ii) read perpendicular to the, lens / metre rule ; 1
What was in this paper
The subtopics covered by these 4 questions, and how many questions each got. Open one in a new tab to see every Cambridge question on it.
What you needed in this session
Cambridge’s own grade thresholds for 2023 Oct/Nov, Paper 6 · Variant 3. A higher threshold means an easier paper — the bar moves with how the cohort did.