Cambridge IGCSE Science - Combined 0653 — 2025 Oct/Nov Paper 6 · Variant 1
0653/61/O/N/25 · 4 questions · 40 marks · 60 min
The question paper and its mark scheme, free to read here and free to download. This is Cambridge’s own paper, exactly as it was sat.
Question paper16 pages
Mark scheme10 pages
Answers below. Sit the paper first if you are practising.
Questions as text
Q1 · A student investigates an enzyme-controlled reaction
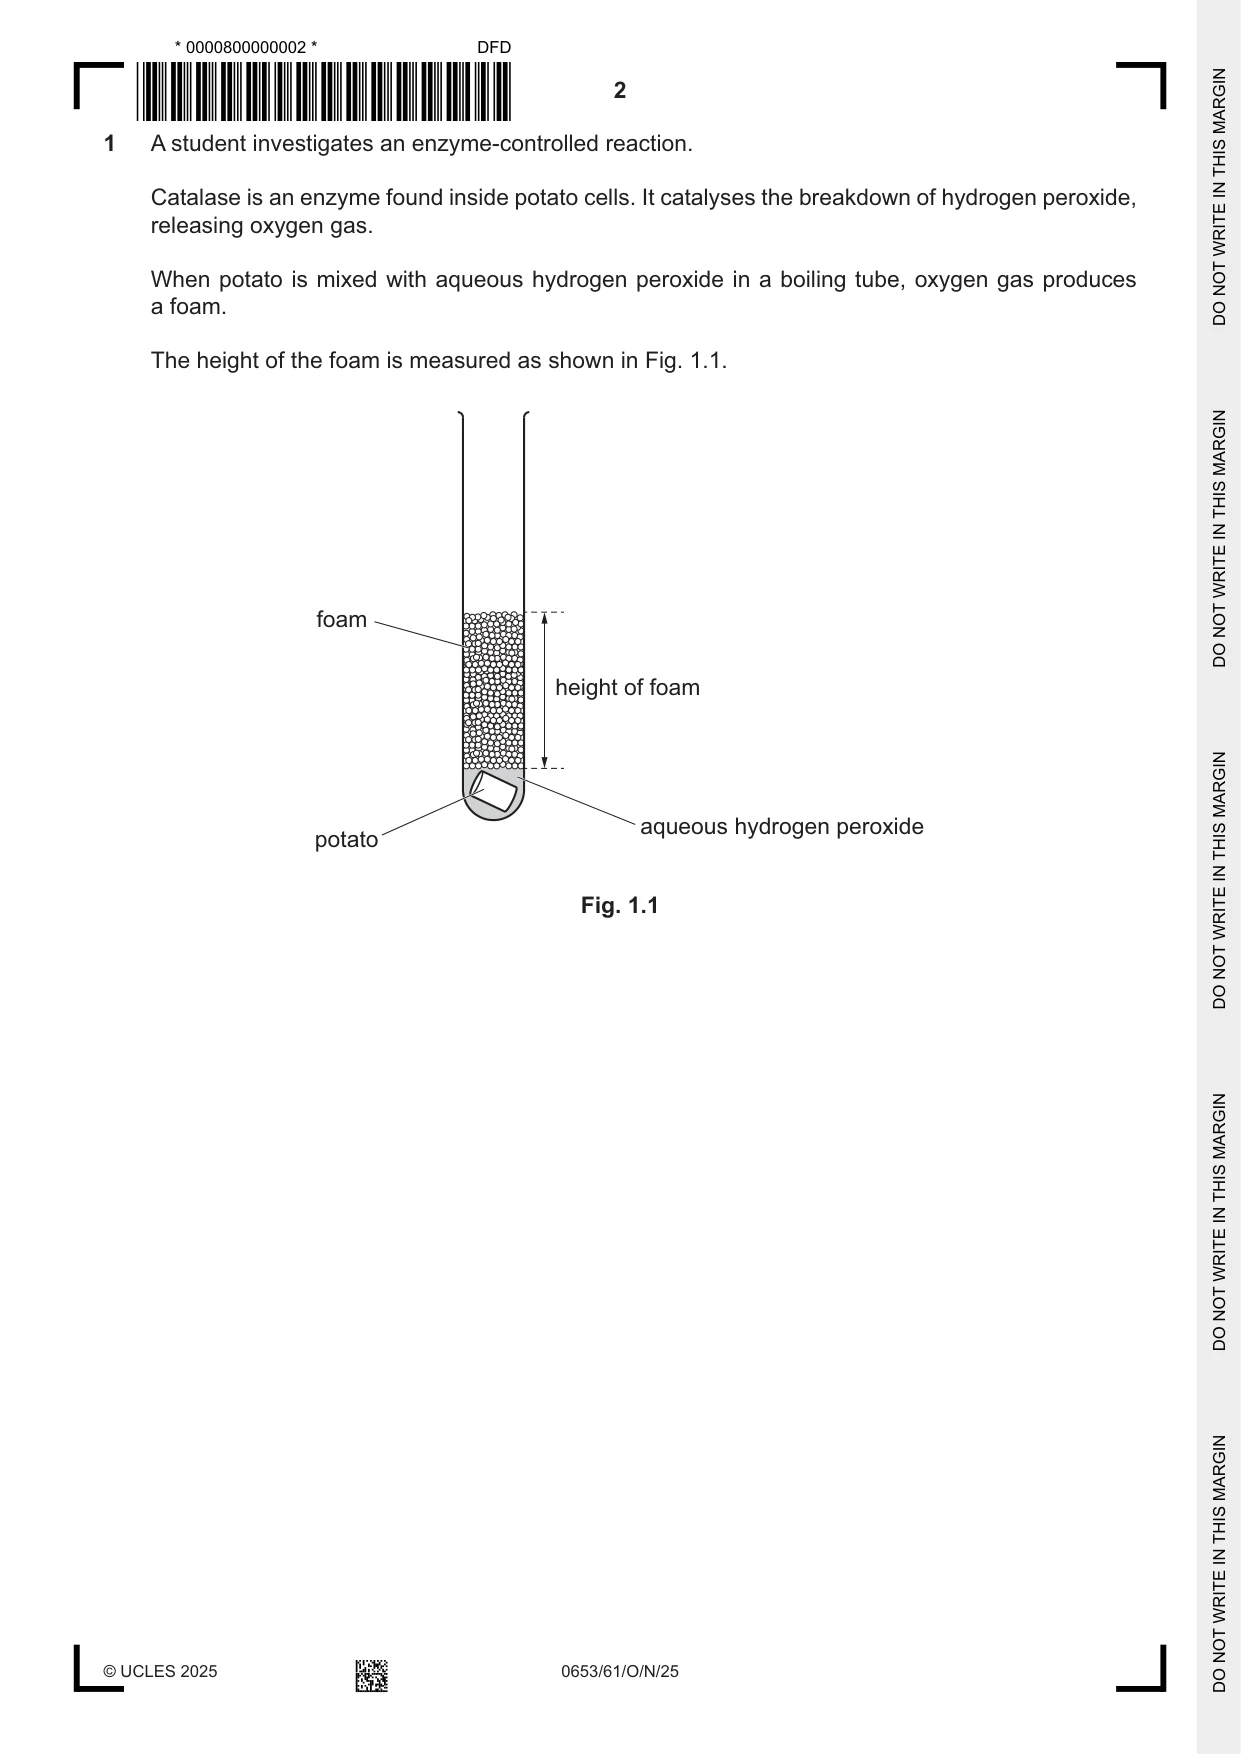
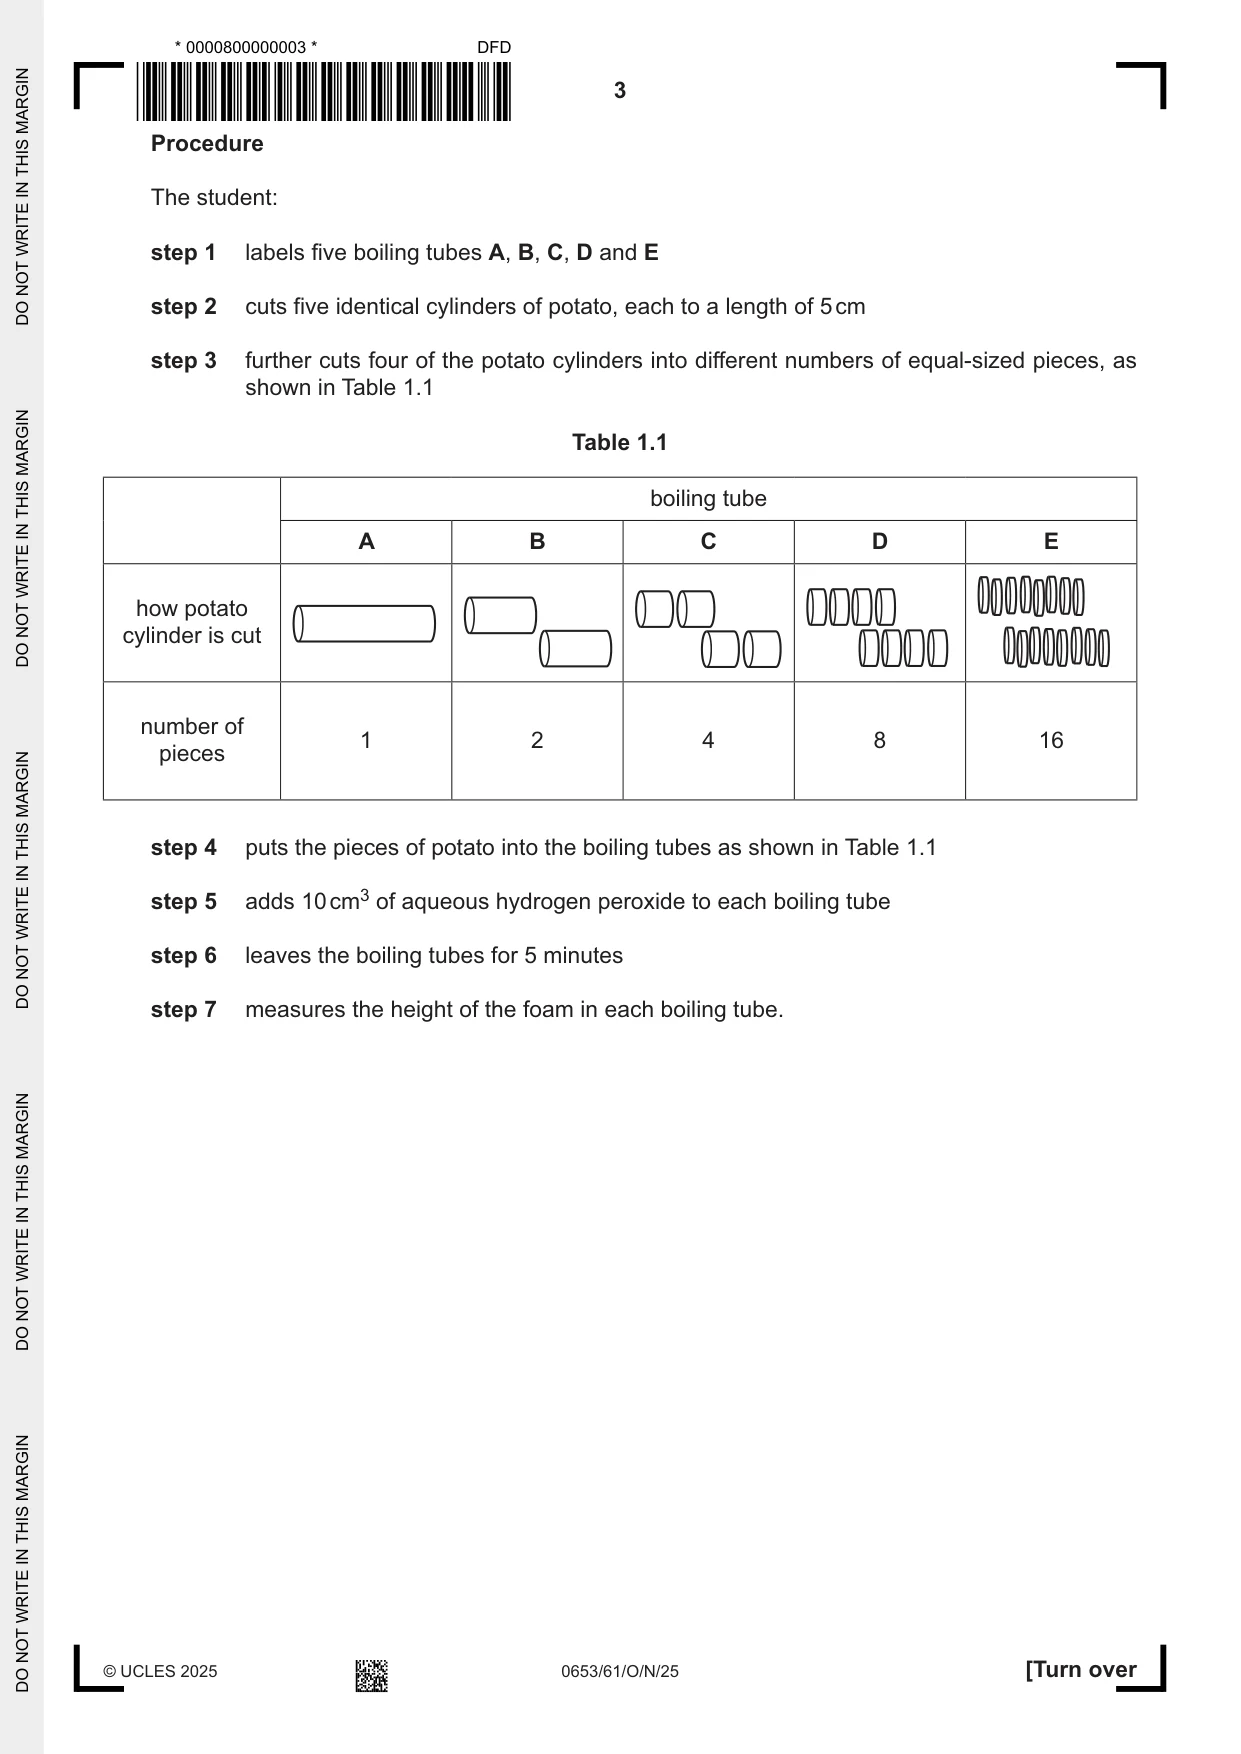
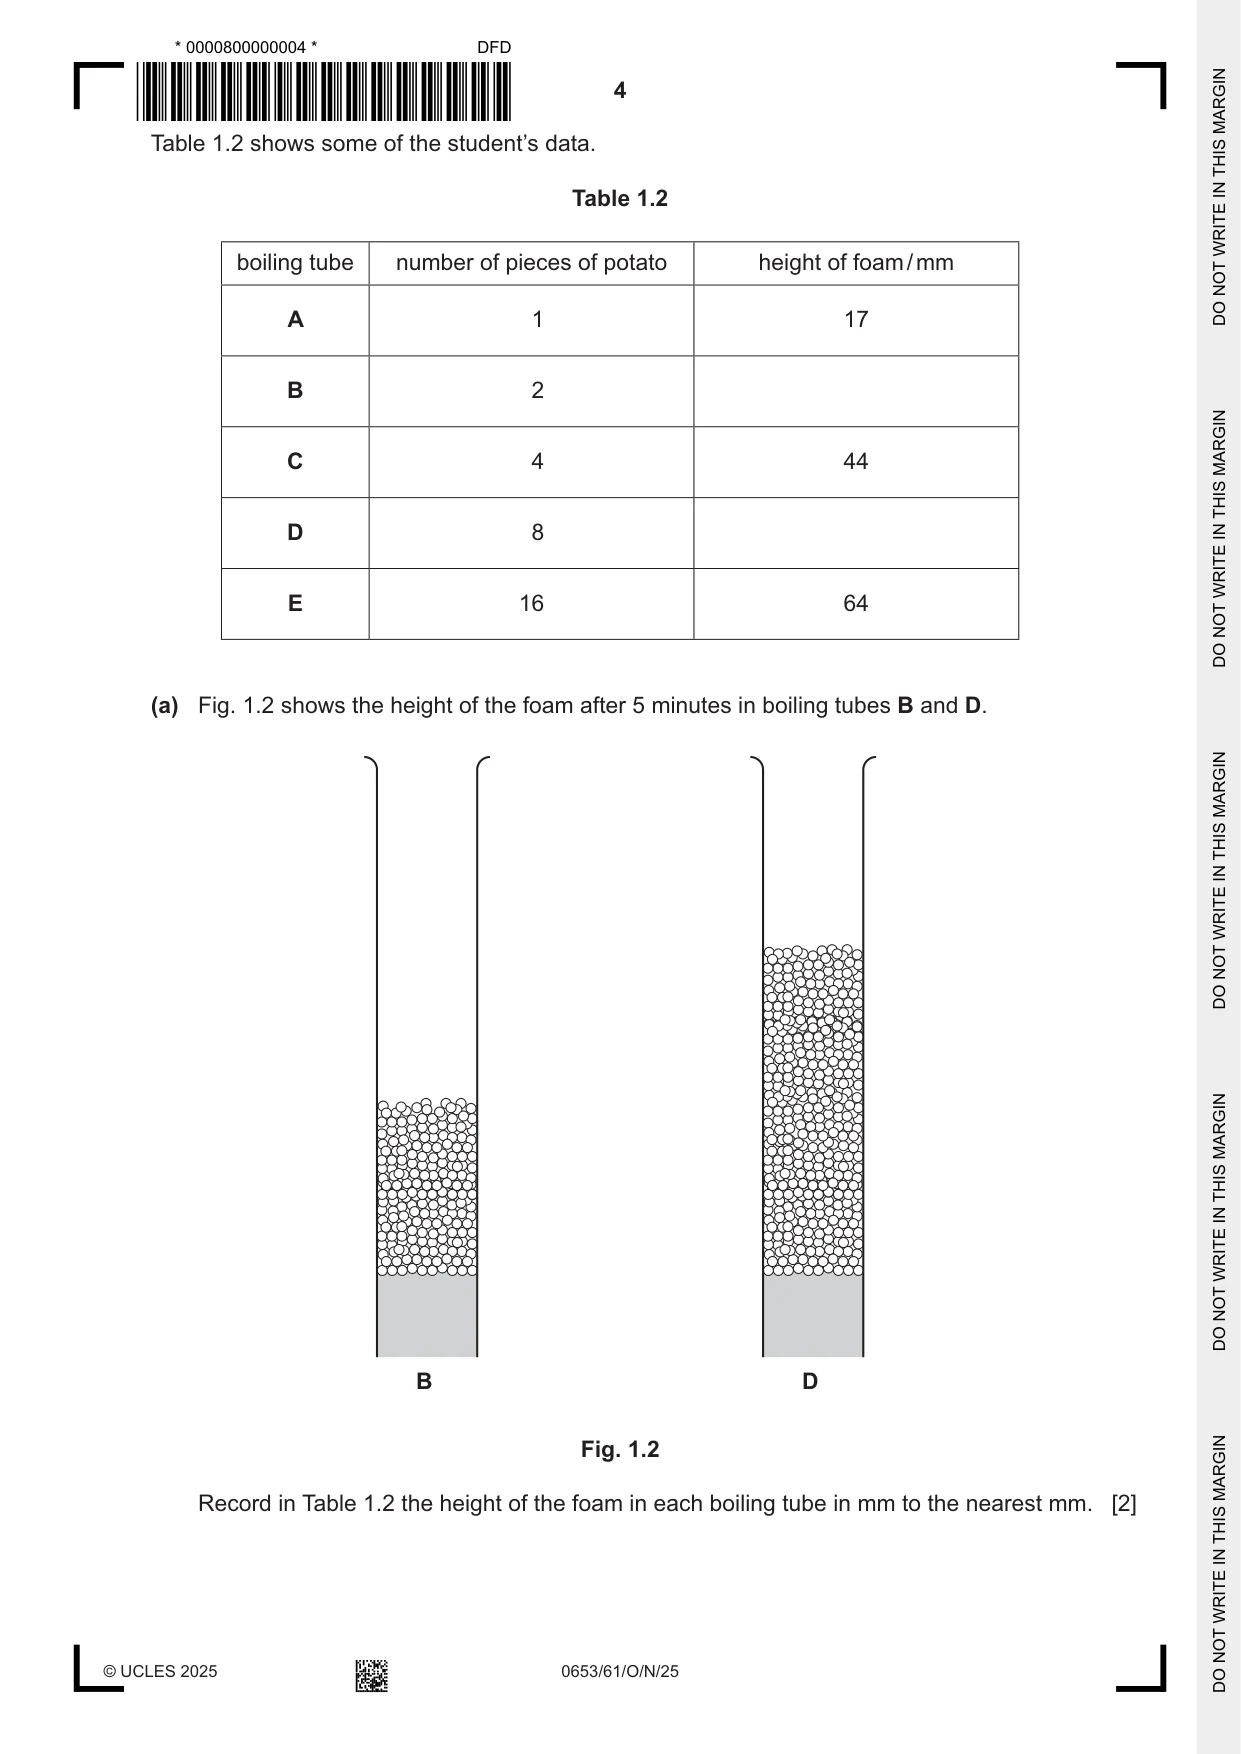
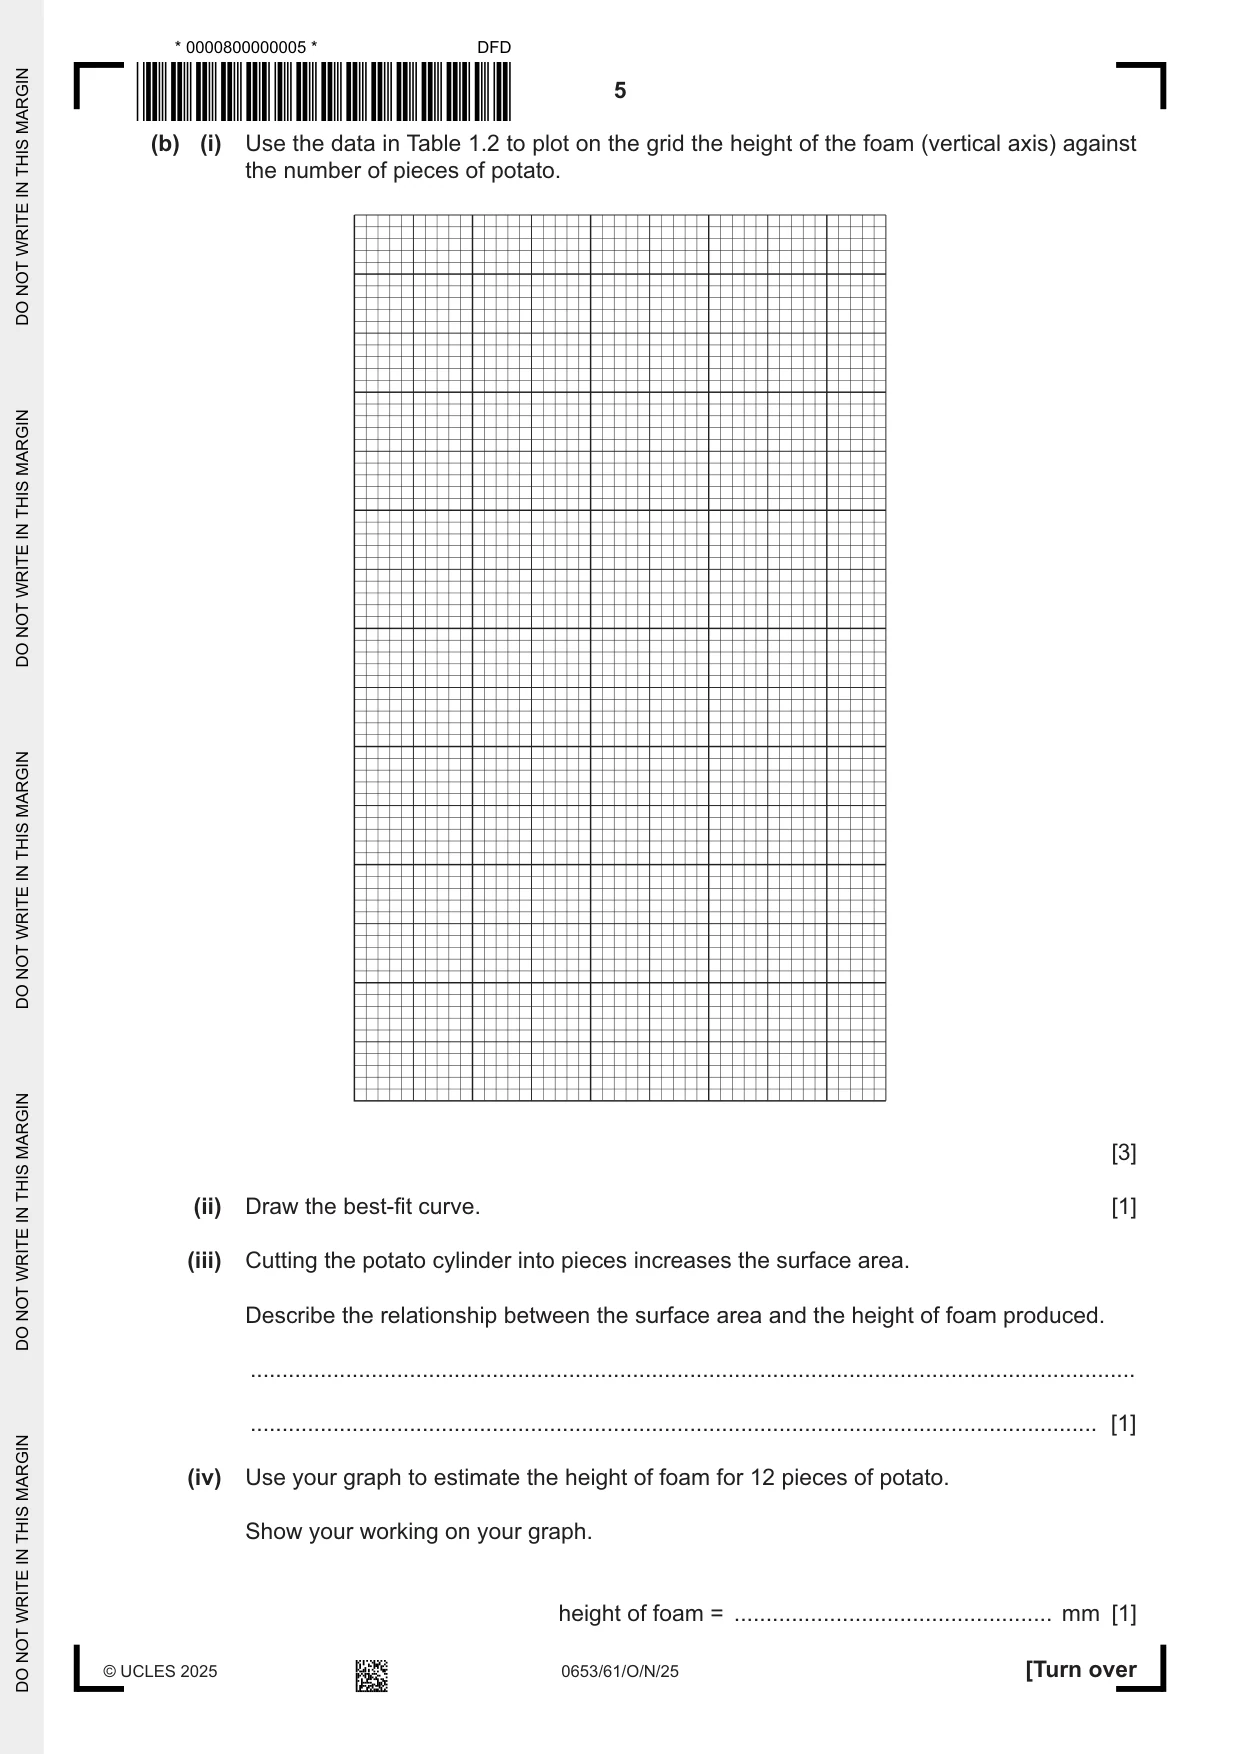
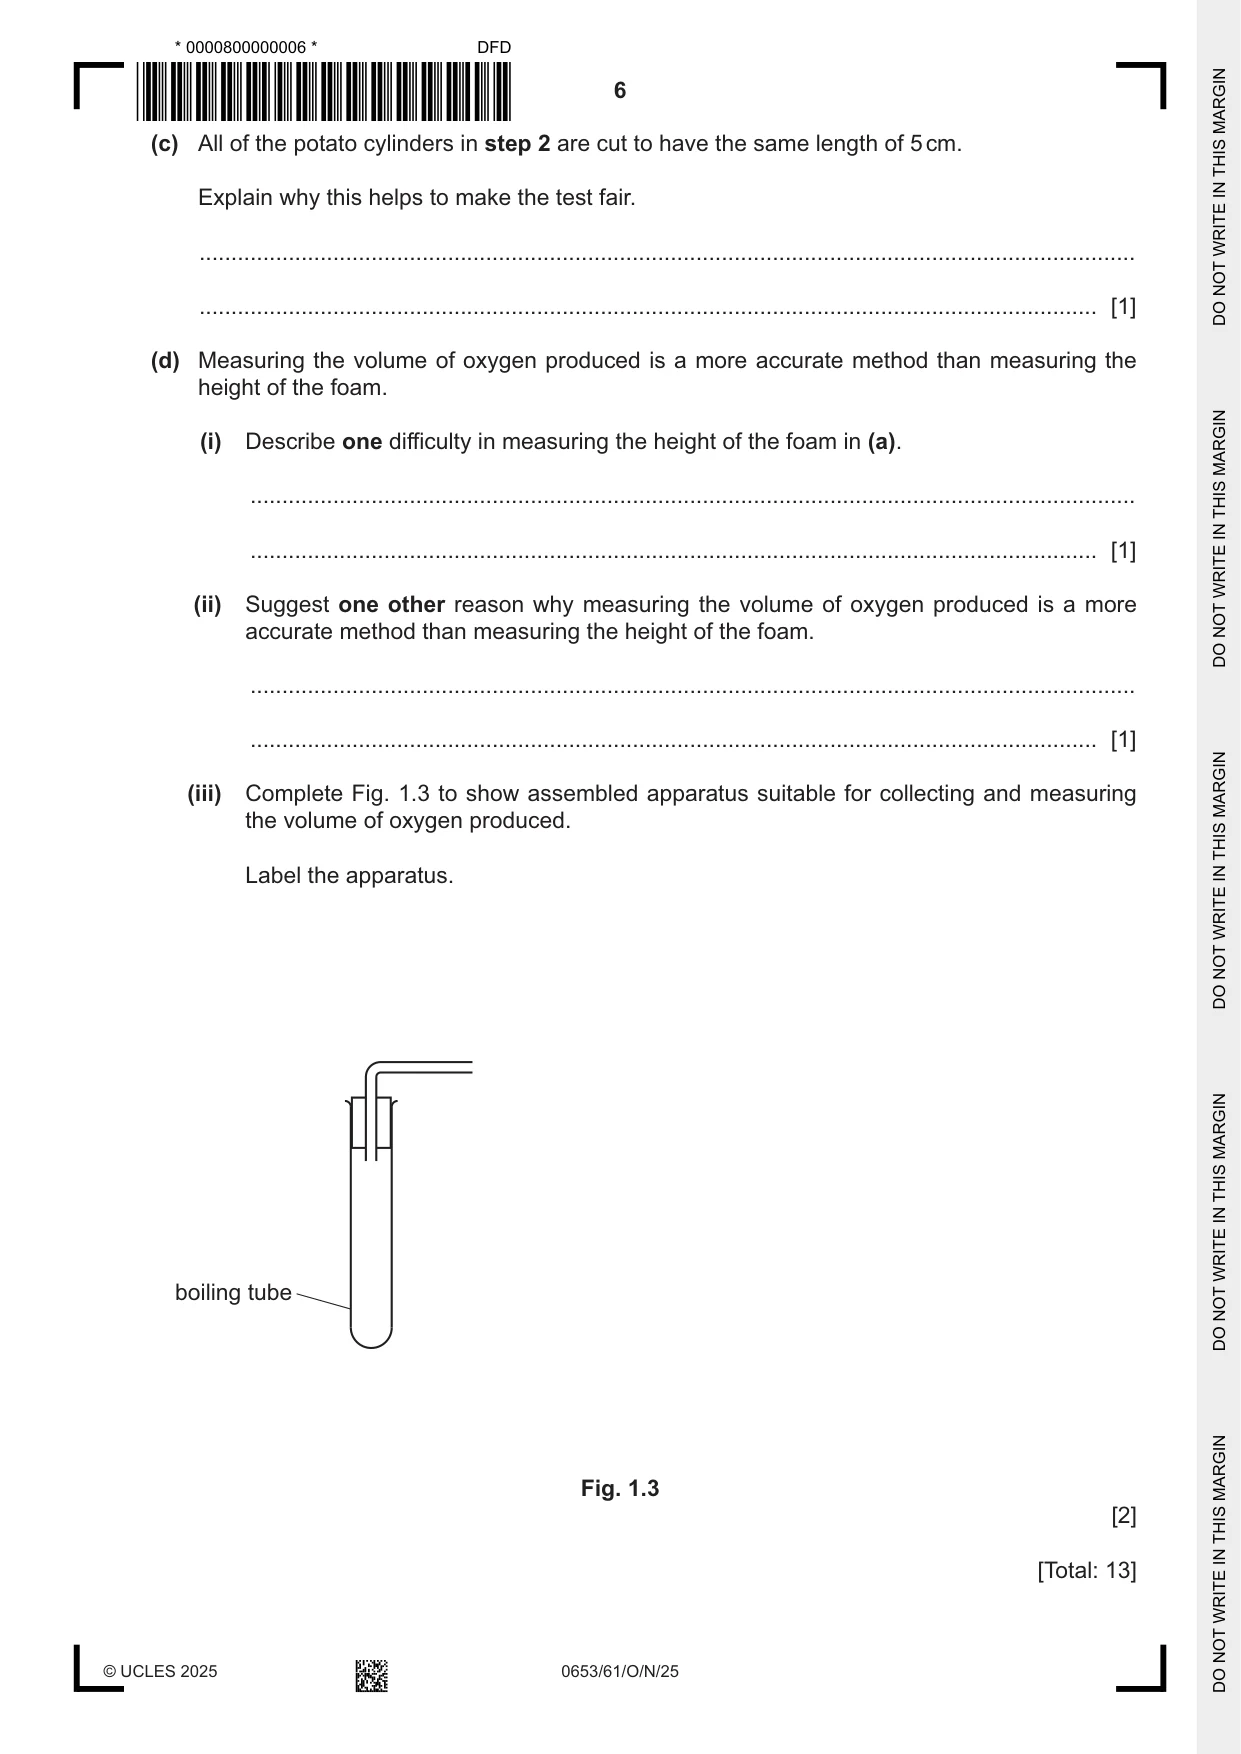
1 A student investigates an enzyme-controlled reaction. Catalase is an enzyme found inside potato cells. It catalyses the breakdown of hydrogen peroxide, releasing oxygen gas. When potato is mixed with aqueous hydrogen peroxide in a boiling tube, oxygen gas produces a foam. The height of the foam is measured as shown in Fig. 1.1. foam height of foam aqueous hydrogen peroxide potato Fig. 1.1 Procedure The student: step 1 labels five boiling tubes A, B, C, D and E step 2 cuts five identical cylinders of potato, each to a length of 5 cm step 3 further cuts four of the potato cylinders into different numbers of equal-sized pieces, as shown in Table 1.1 Table 1.1 boiling tube A B C D E how potato cylinder is cut number of 1 2 4 8 16 pieces step 4 puts the pieces of potato into the boiling tubes as shown in Table 1.1 step 5 adds 10 cm3 of aqueous hydrogen peroxide to each boiling tube step 6 leaves the boiling tubes for 5 minutes step 7 measures the height of the foam in each boiling tube. Table 1.2 shows some of the student’s data. Table 1.2 boiling tube number of pieces of potato height of foam / mm A 1 17 B 2 C 4 44 D 8 E 16 64 (a) Fig. 1.2 shows the height of the foam after 5 minutes in boiling tubes B and D. B D Fig. 1.2 Record in Table 1.2 the height of the foam in each boiling tube in mm to the nearest mm. [2] (b) (i) Use the data in Table 1.2 to plot on the grid the height of the foam (vertical axis) against the number of pieces of potato. [3] (ii) Draw the best-fit curve. [1] (iii) Cutting the potato cylinder into pieces increases the surface area. Describe the relationship between the surface area and the height of foam produced. ........................................................................................................................................... ..................................................................................................................................... [1] (iv) Use your graph to estimate the height of foam for 12 pieces of potato. Show your working on your graph. height of foam = .................................................. mm [1] (c) All of the potato cylinders in step 2 are cut to have the same length of 5 cm. Explain why this helps to make the test fair. ................................................................................................................................................... ............................................................................................................................................. [1] (d) Measuring the volume of oxygen produced is a more accurate method than measuring the height of the foam. (i) Describe one difficulty in measuring the height of the foam in (a). ........................................................................................................................................... ..................................................................................................................................... [1] (ii) Suggest one other reason why measuring the volume of oxygen produced is a more accurate method than measuring the height of the foam. ........................................................................................................................................... ..................................................................................................................................... [1] (iii) Complete Fig. 1.3 to show assembled apparatus suitable for collecting and measuring the volume of oxygen produced. Label the apparatus. boiling tube Fig. 1.3 [2] [Total: 13]
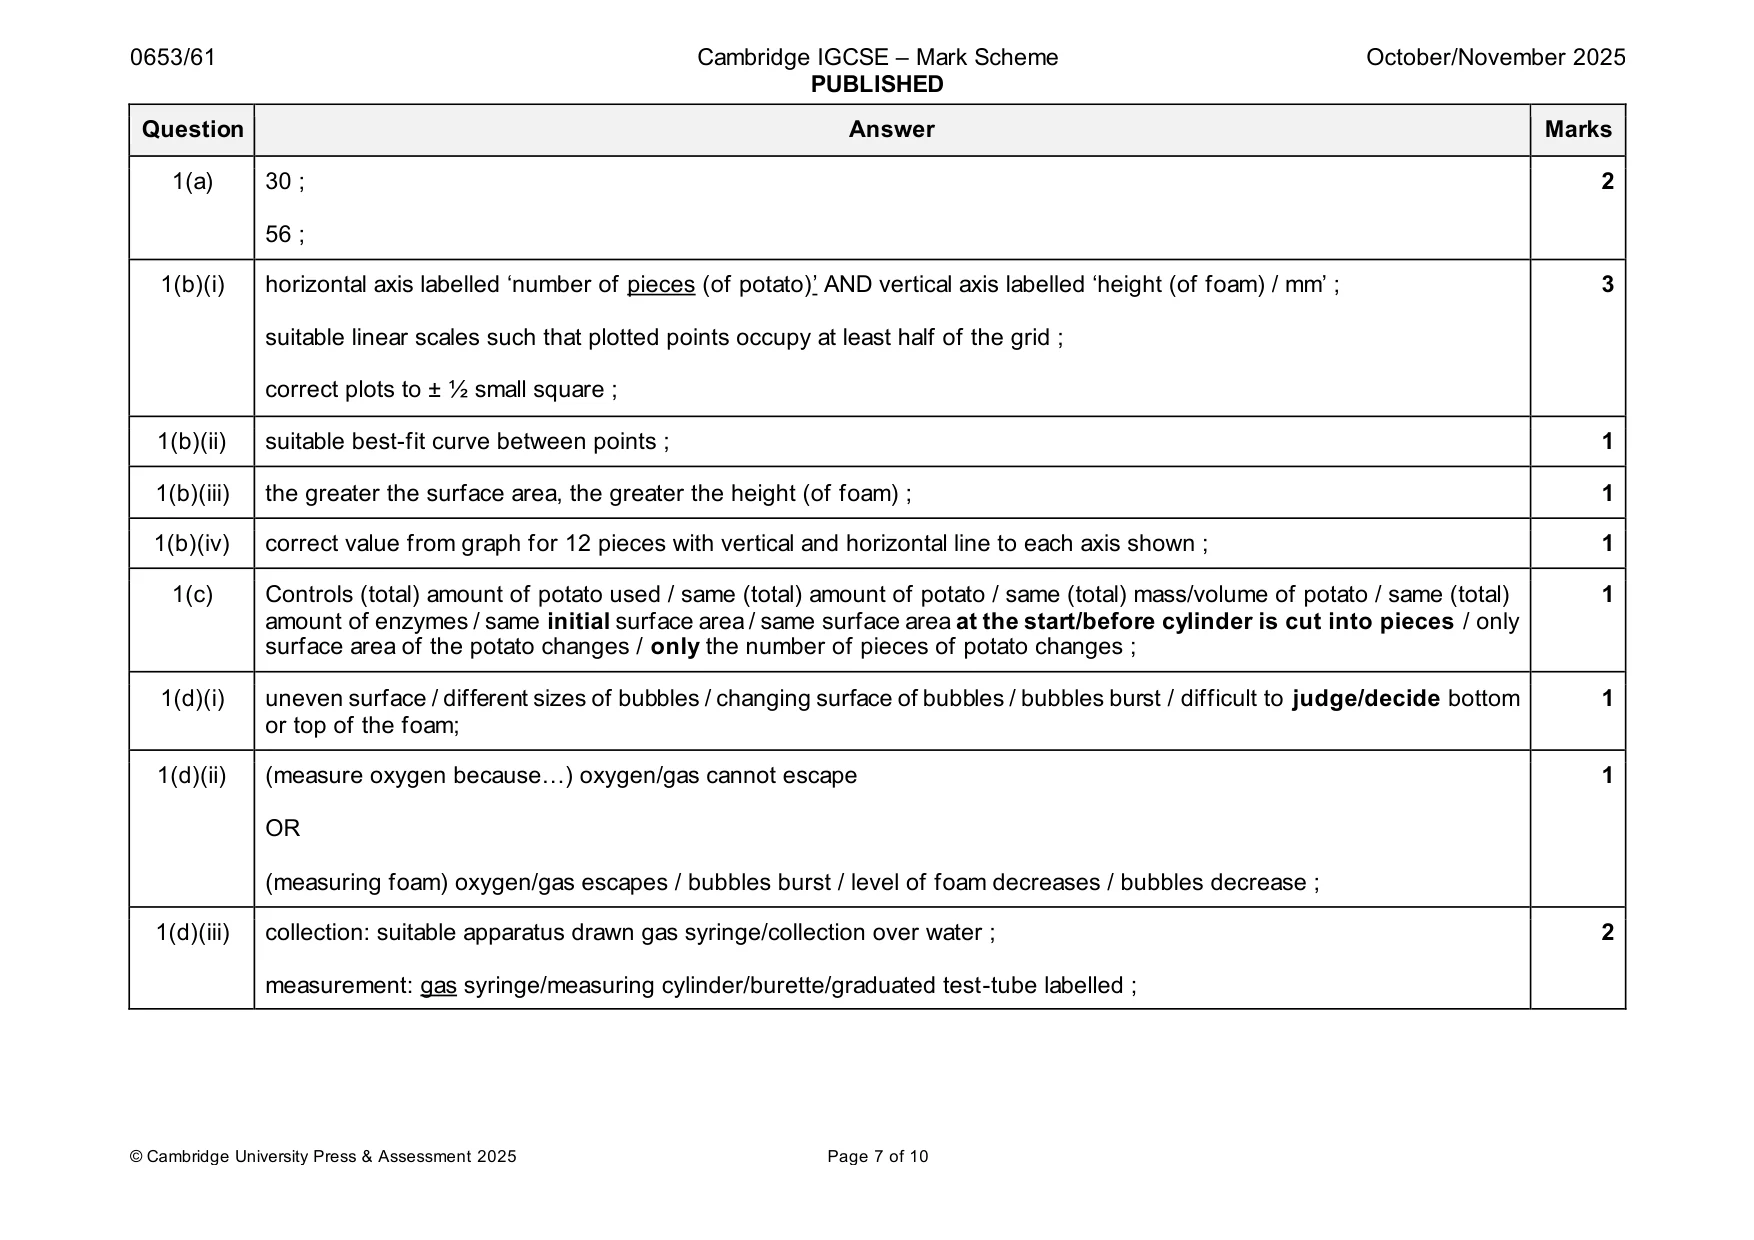
Mark scheme: Question Answer Marks 1(a) 30 ; 2 56 ; 1(b)(i) horizontal axis labelled ‘number of pieces (of potato)’ AND vertical axis labelled ‘height (of foam) / mm’ ; 3 suitable linear scales such that plotted points occupy at least half of the grid ; correct plots to ± ½ small square ; 1(b)(ii) suitable best-fit curve between points ; 1 1(b)(iii) the greater the surface area, the greater the height (of foam) ; 1 1(b)(iv) correct value from graph for 12 pieces with vertical and horizontal line to each axis shown ; 1 1(c) Controls (total) amount of potato used / same (total) amount of potato / same (total) mass/volume of potato / same (total) 1 amount of enzymes / same initial surface area / same surface area at the start/before cylinder is cut into pieces / only surface area of the potato changes / only the number of pieces of potato changes ; 1(d)(i) uneven surface / different sizes of bubbles / changing surface of bubbles / bubbles burst / difficult to judge/decide bottom 1 or top of the foam; 1(d)(ii) (measure oxygen because…) oxygen/gas cannot escape 1 OR (measuring foam) oxygen/gas escapes / bubbles burst / level of foam decreases / bubbles decrease ; 1(d)(iii) collection: suitable apparatus drawn gas syringe/collection over water ; 2 measurement: gas syringe/measuring cylinder/burette/graduated test-tube labelled ;
Q2 · A student investigates the chemical reaction between aqueous barium nitrate and aqueous H
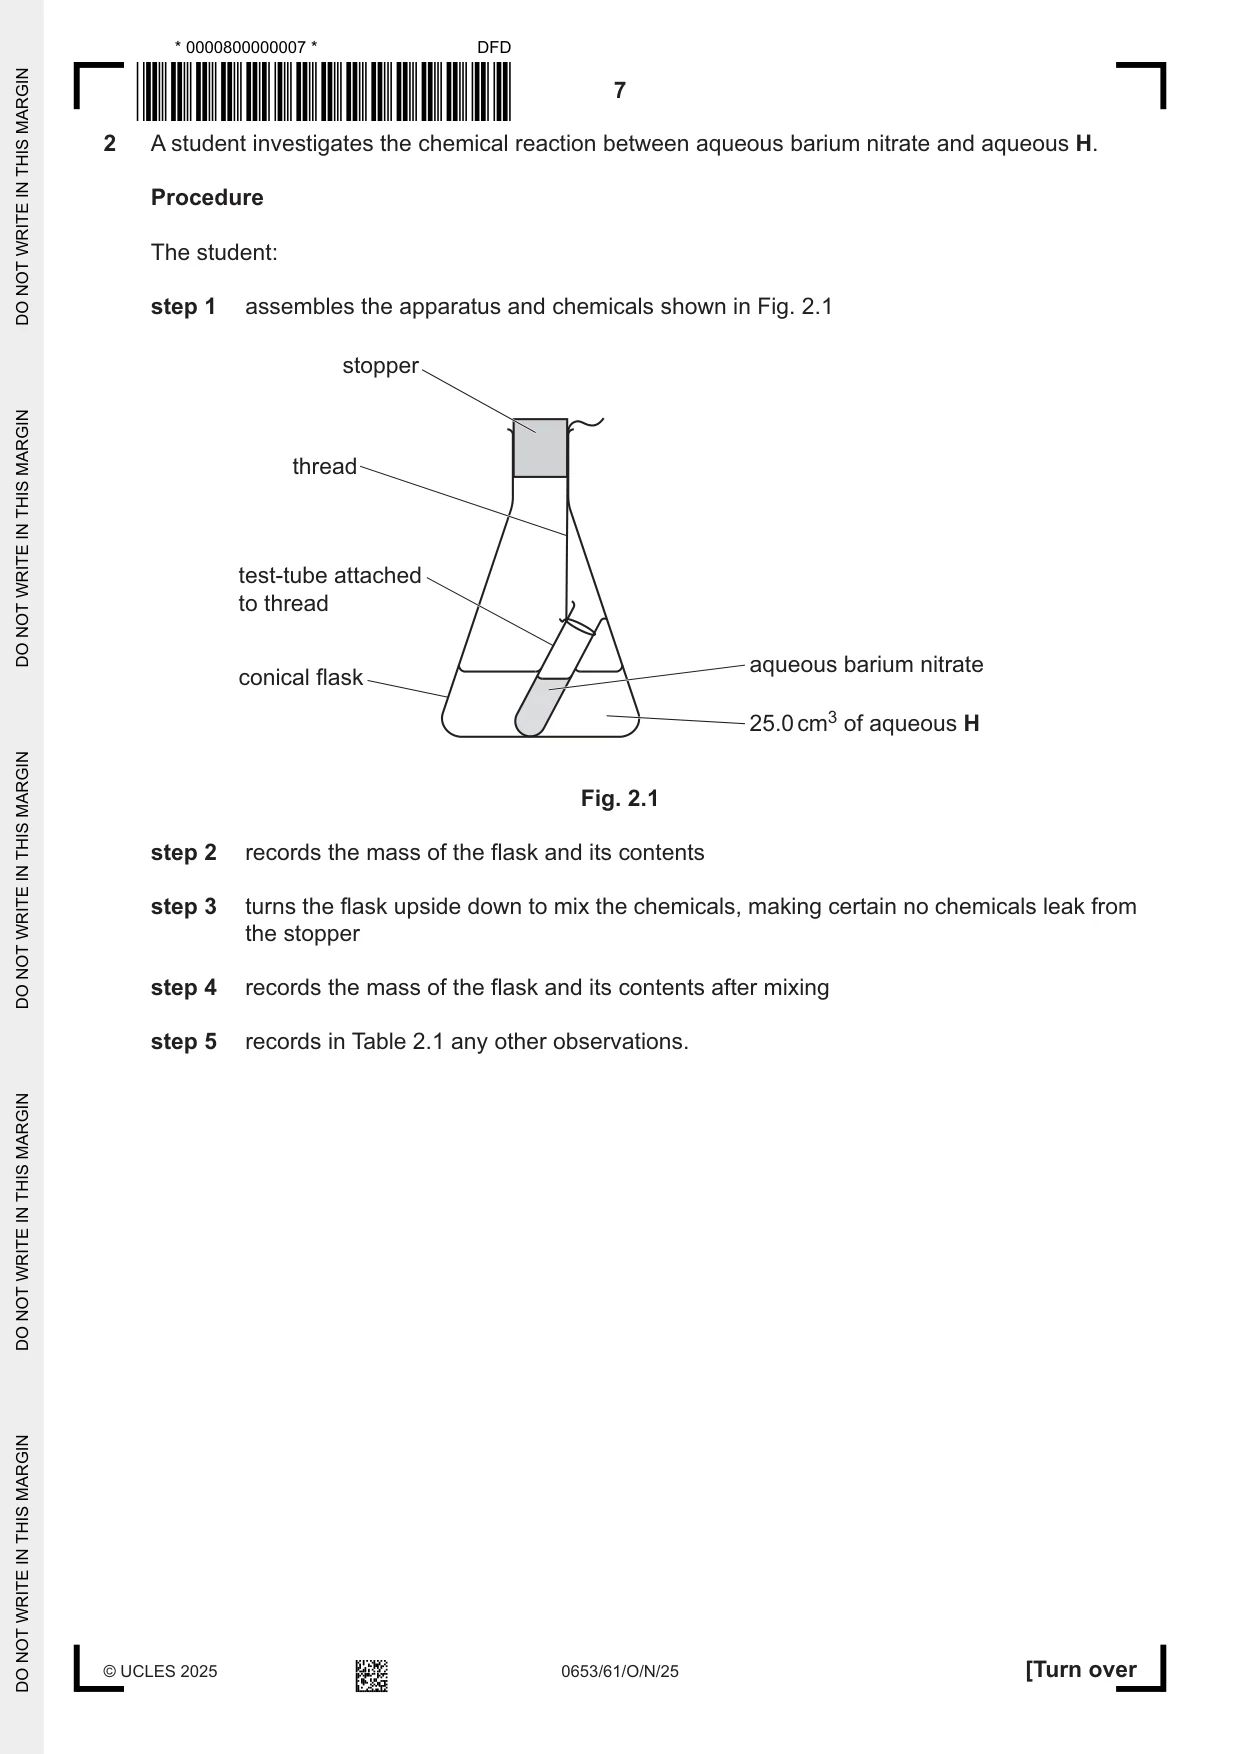
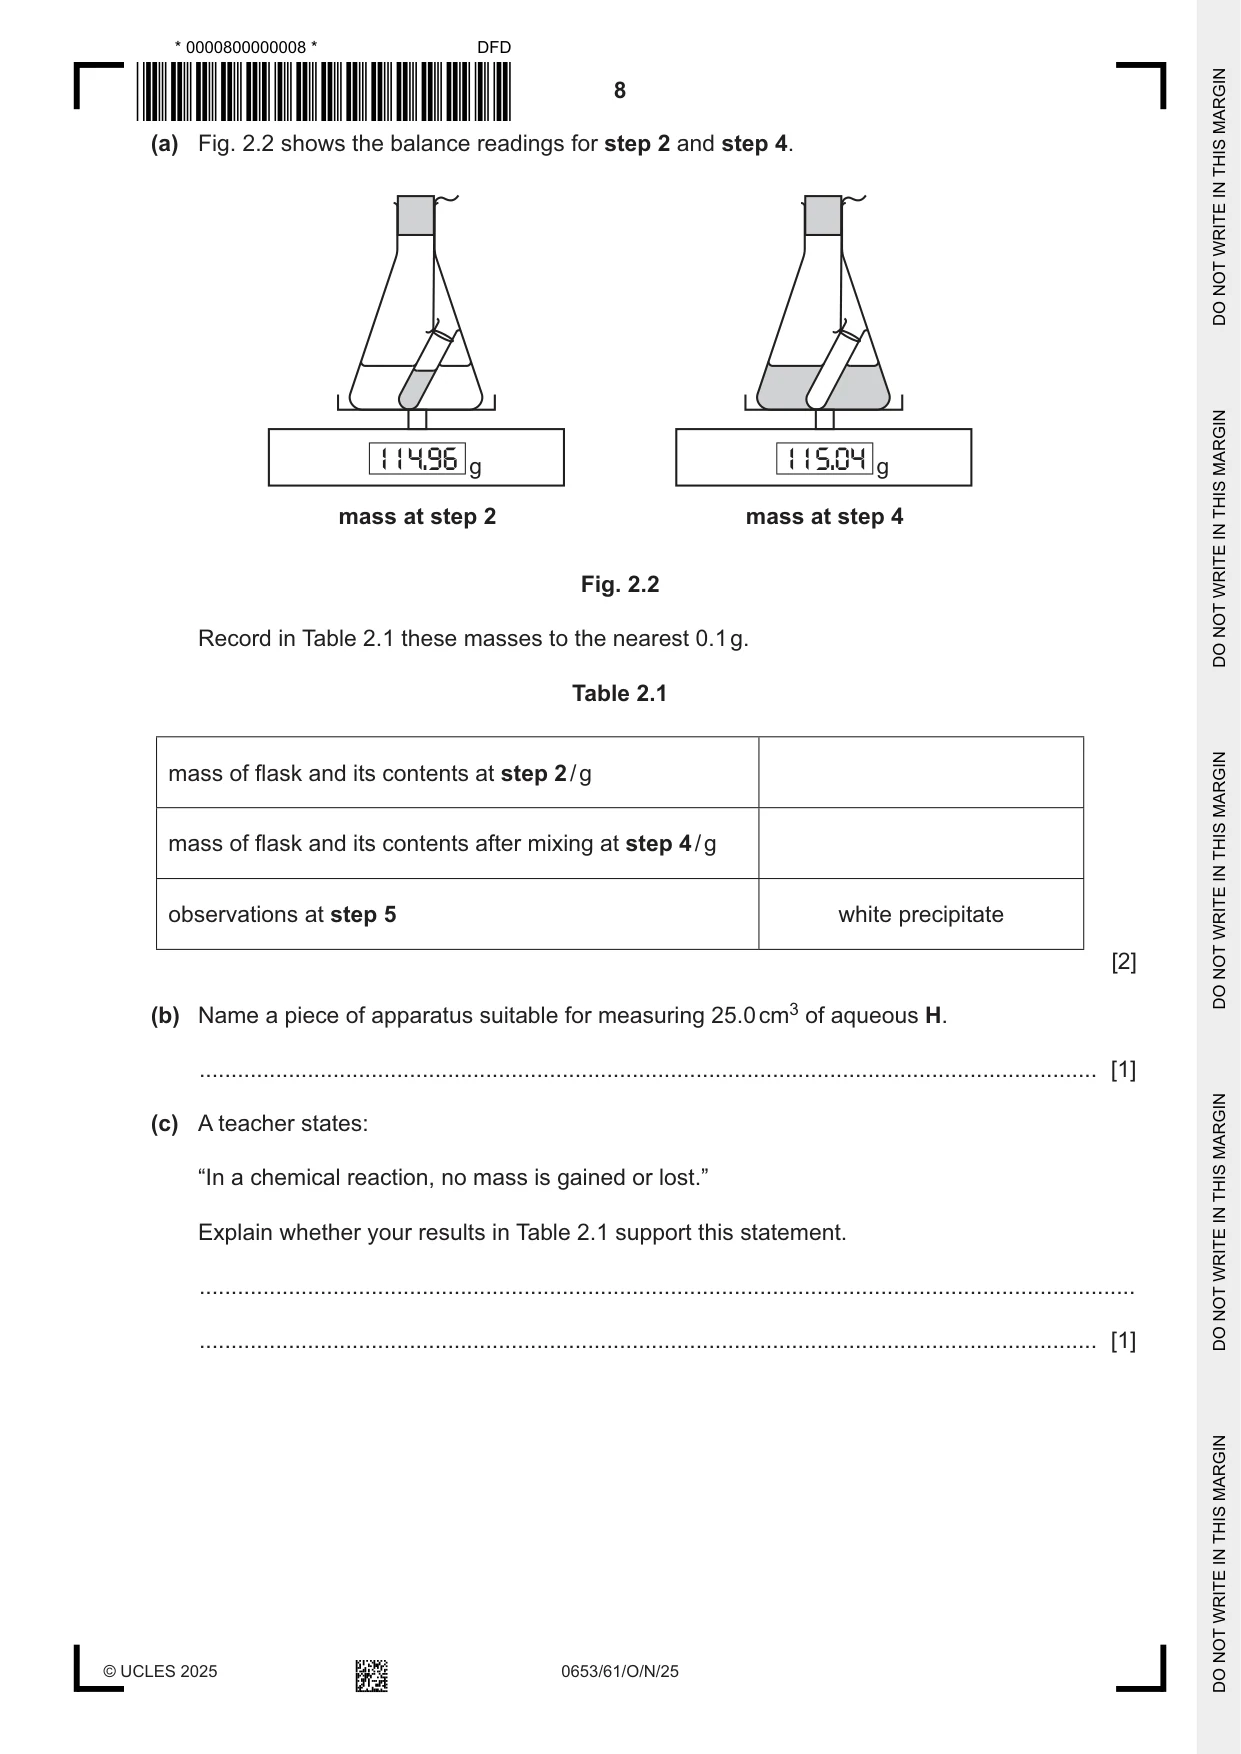
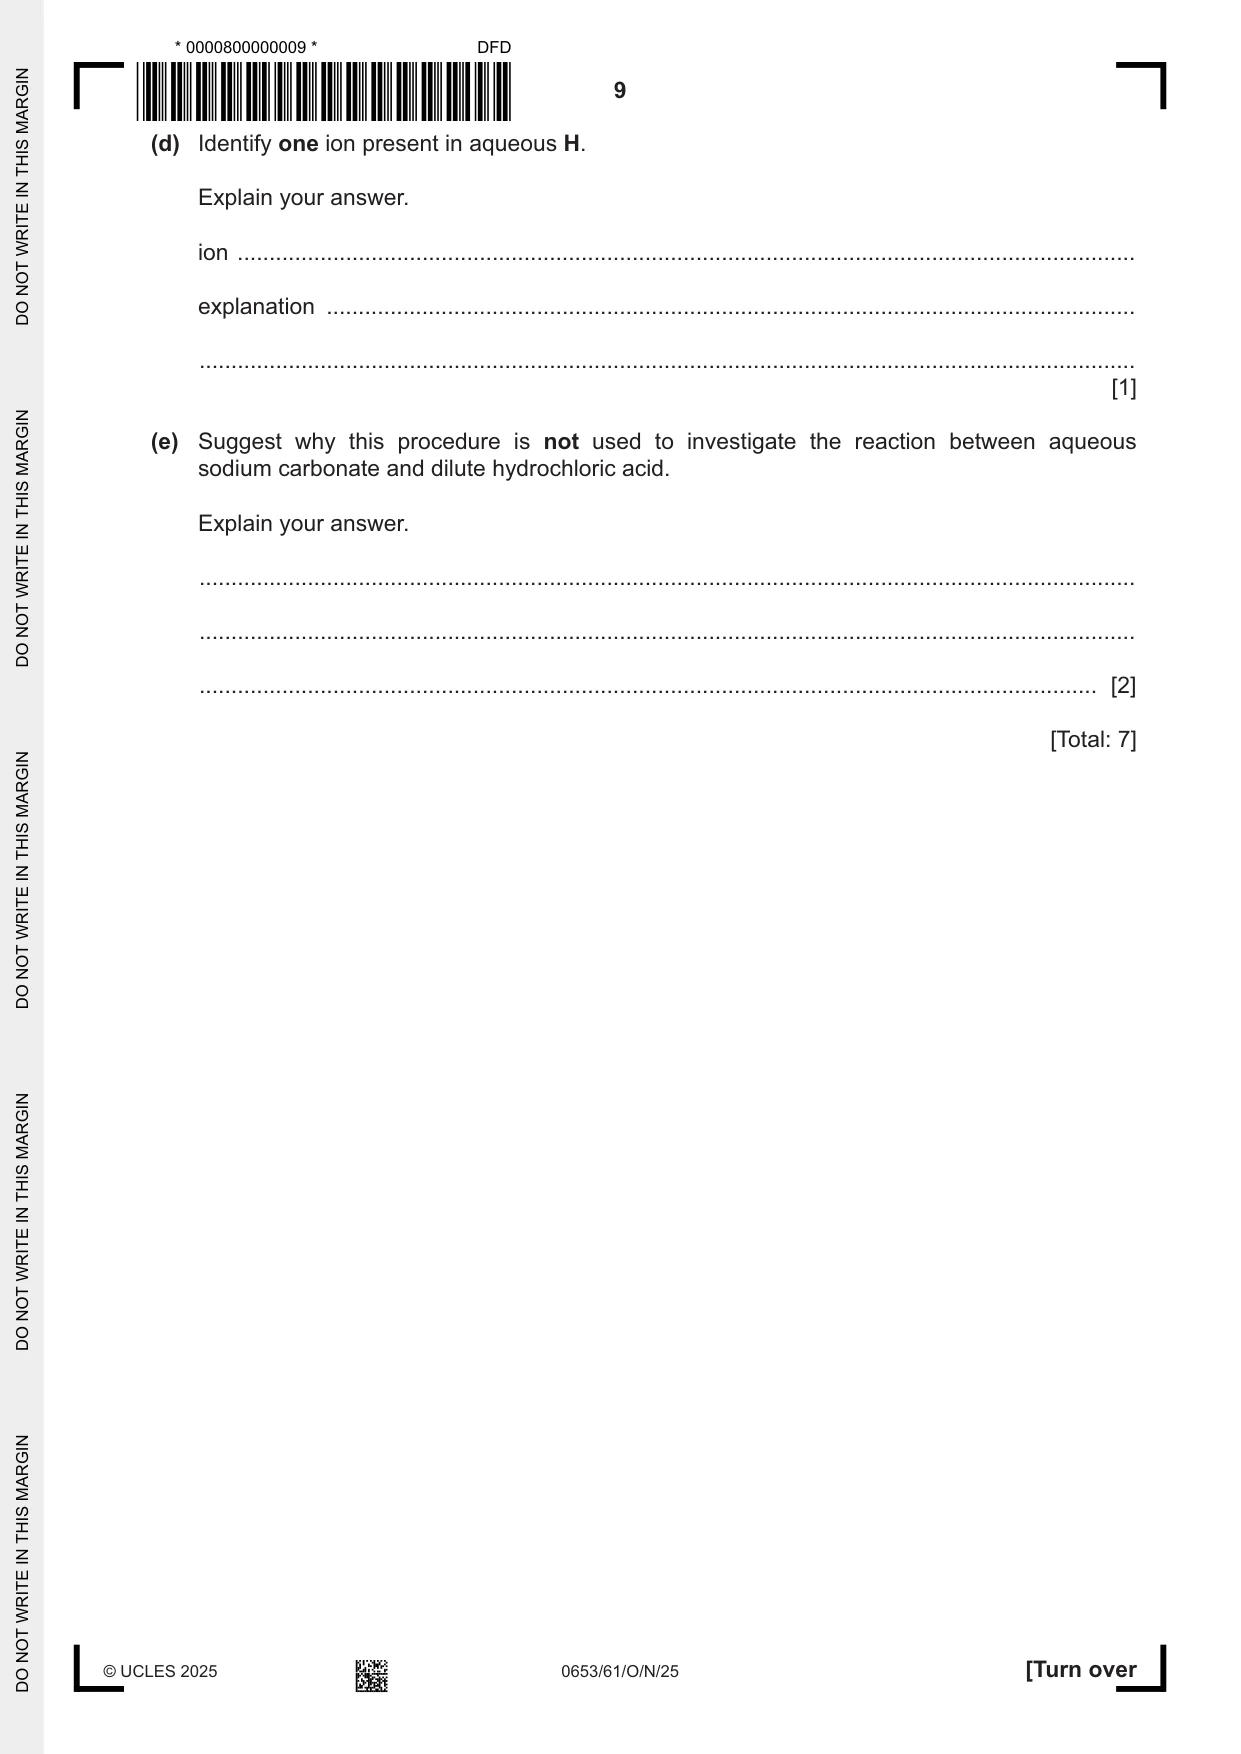
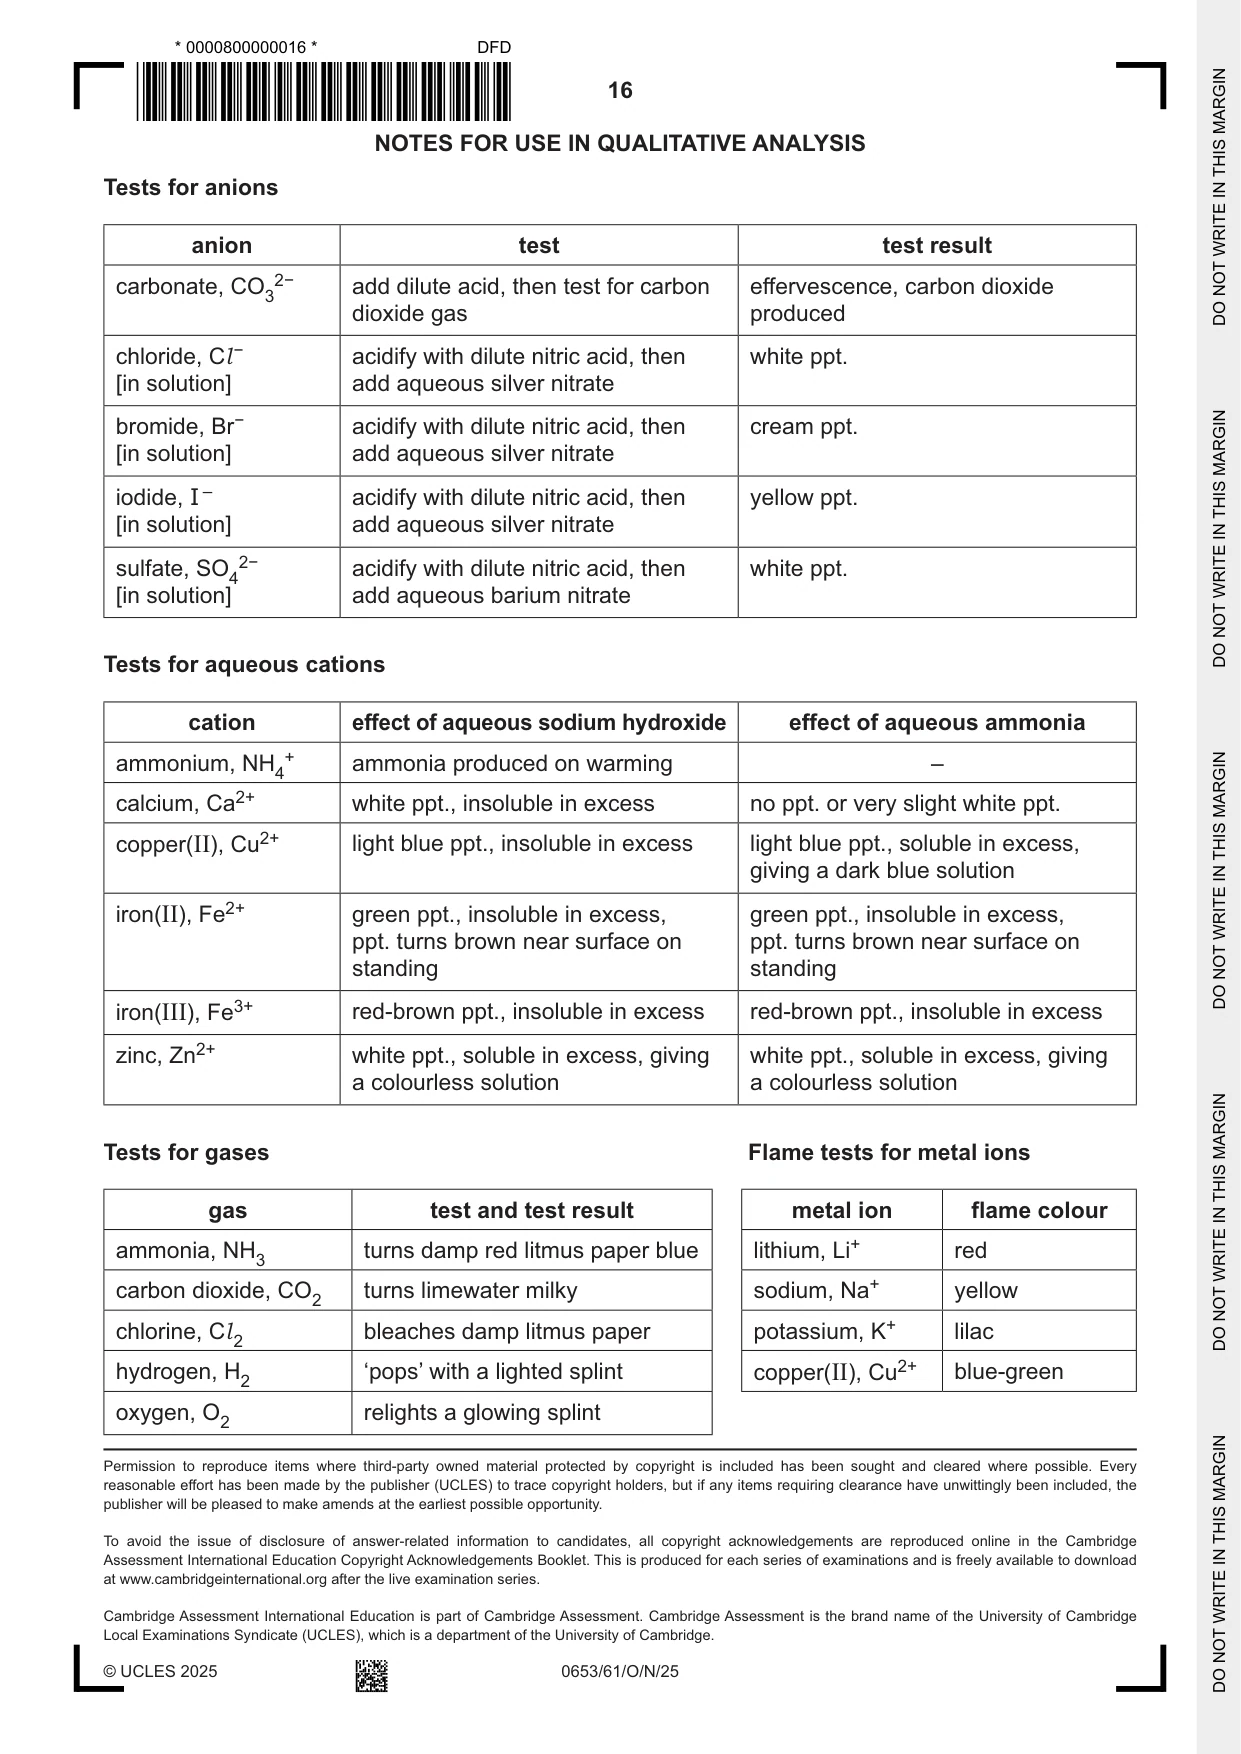
2 A student investigates the chemical reaction between aqueous barium nitrate and aqueous H. Procedure The student: step 1 assembles the apparatus and chemicals shown in Fig. 2.1 stopper thread test-tube attached to thread aqueous barium nitrate conical flask 25.0 cm3 of aqueous H Fig. 2.1 step 2 records the mass of the flask and its contents step 3 turns the flask upside down to mix the chemicals, making certain no chemicals leak from the stopper step 4 records the mass of the flask and its contents after mixing step 5 records in Table 2.1 any other observations. (a) Fig. 2.2 shows the balance readings for step 2 and step 4. 114.96 g 115.04 g mass at step 2 mass at step 4 Fig. 2.2 Record in Table 2.1 these masses to the nearest 0.1 g. Table 2.1 mass of flask and its contents at step 2 / g mass of flask and its contents after mixing at step 4 / g observations at step 5 white precipitate [2] (b) Name a piece of apparatus suitable for measuring 25.0 cm3 of aqueous H. ............................................................................................................................................. [1] (c) A teacher states: “In a chemical reaction, no mass is gained or lost.” Explain whether your results in Table 2.1 support this statement. ................................................................................................................................................... ............................................................................................................................................. [1] (d) Identify one ion present in aqueous H. Explain your answer. ion ............................................................................................................................................. explanation ............................................................................................................................... ................................................................................................................................................... [1] (e) Suggest why this procedure is not used to investigate the reaction between aqueous sodium carbonate and dilute hydrochloric acid. Explain your answer. ................................................................................................................................................... ................................................................................................................................................... ............................................................................................................................................. [2] [Total: 7]
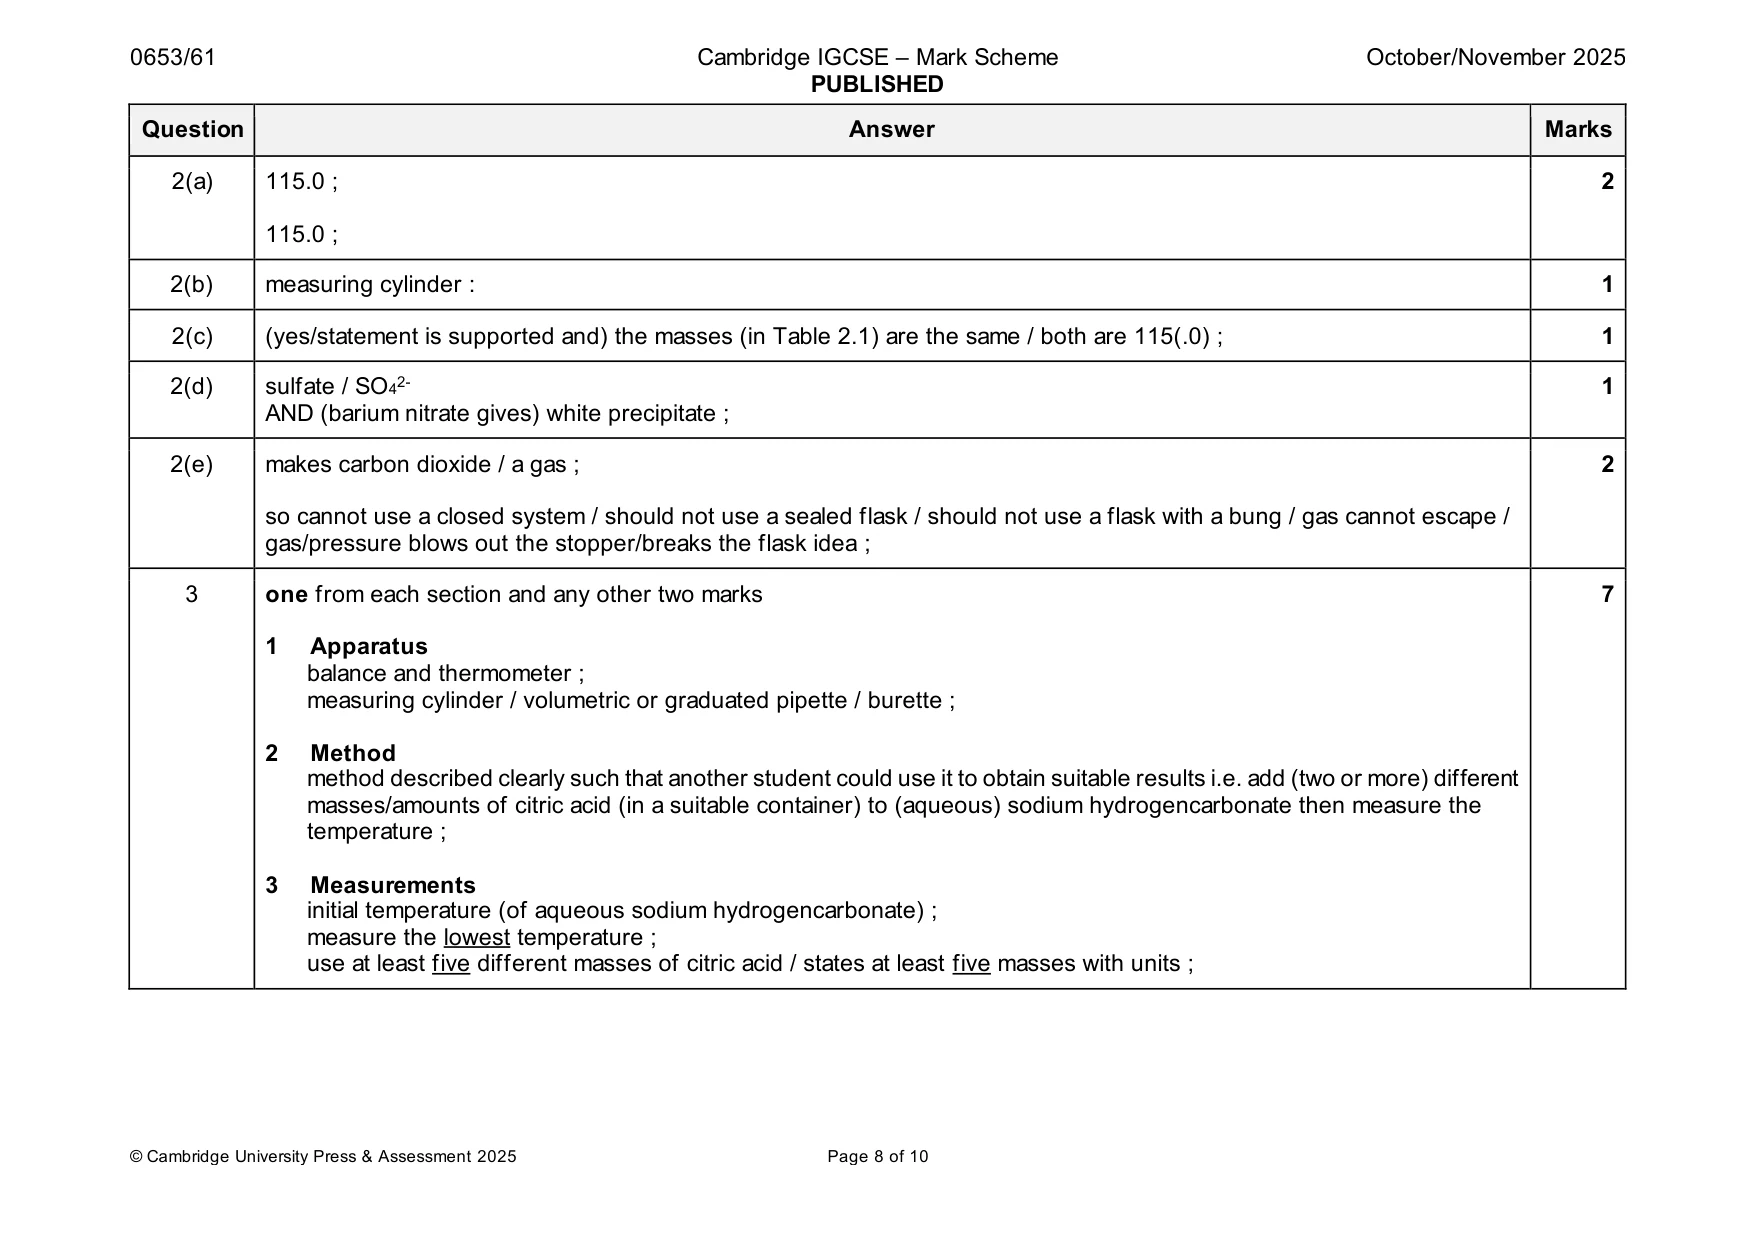
Mark scheme: 2(a) 115.0 ; 2 115.0 ; 2(b) measuring cylinder : 1 2(c) (yes/statement is supported and) the masses (in Table 2.1) are the same / both are 115(.0) ; 1 2(d) sulfate / SO42- 1 AND (barium nitrate gives) white precipitate ; 2(e) makes carbon dioxide / a gas ; 2 so cannot use a closed system / should not use a sealed flask / should not use a flask with a bung / gas cannot escape / gas/pressure blows out the stopper/breaks the flask idea ;
Q3 · Solid citric acid is added to aqueous sodium hydrogencarbonate
3 Solid citric acid is added to aqueous sodium hydrogencarbonate. There is a reaction and the temperature of the aqueous sodium hydrogencarbonate decreases. Plan an investigation to determine the relationship between the mass of citric acid added to the aqueous sodium hydrogencarbonate and the decrease in temperature. You are provided with: • solid citric acid • aqueous sodium hydrogencarbonate. You may use any common laboratory apparatus in your plan. In your plan, include: • the apparatus you will use • a brief description of the method • what you will measure • which variables you will control • how you will process your results to form a conclusion. You may include a results table (you are not required to enter any data into the table). .......................................................................................................................................................... .......................................................................................................................................................... .......................................................................................................................................................... .......................................................................................................................................................... .......................................................................................................................................................... .......................................................................................................................................................... .......................................................................................................................................................... .......................................................................................................................................................... .......................................................................................................................................................... .......................................................................................................................................................... .......................................................................................................................................................... .......................................................................................................................................................... .......................................................................................................................................................... .......................................................................................................................................................... .......................................................................................................................................................... .......................................................................................................................................................... .......................................................................................................................................................... .......................................................................................................................................................... .......................................................................................................................................................... .......................................................................................................................................................... .................................................................................................................................................... [7]
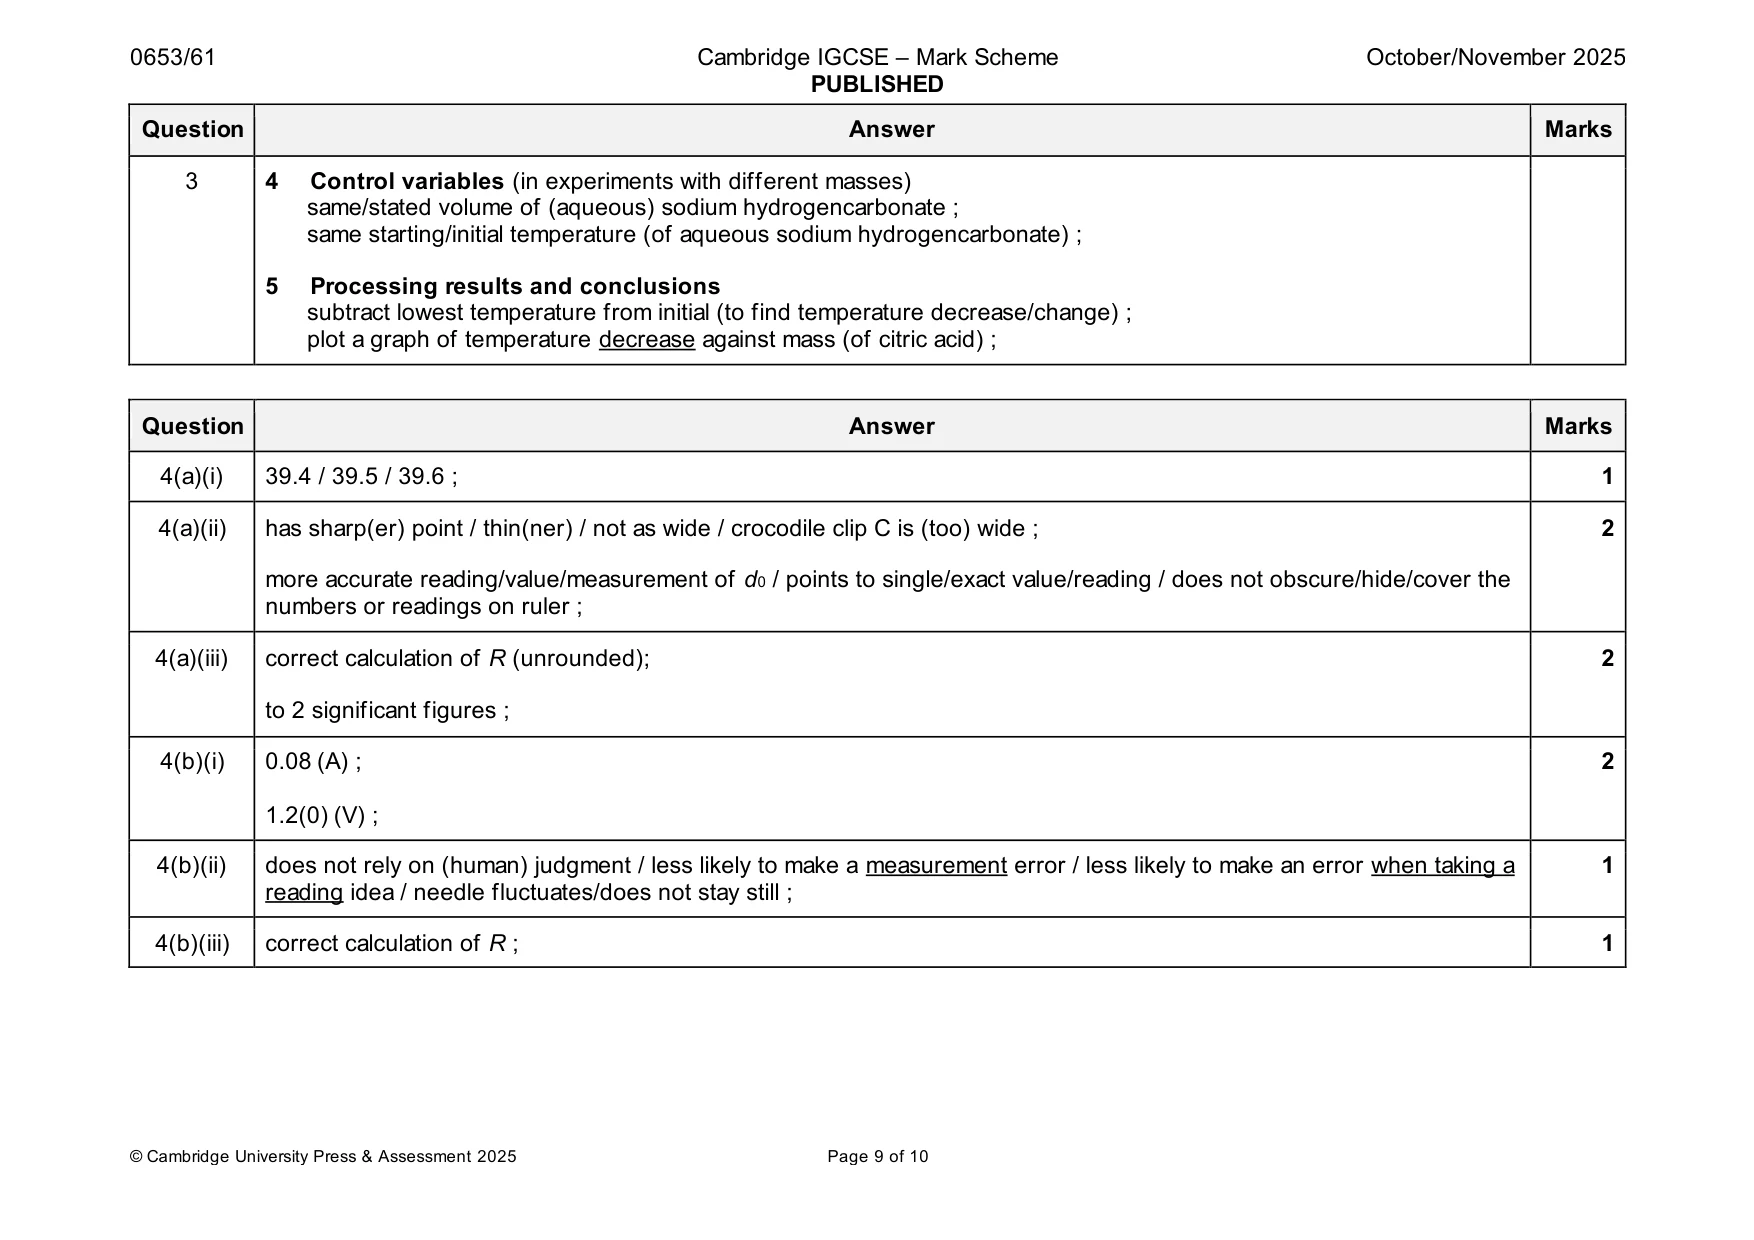
Mark scheme: 3 one from each section and any other two marks 7 1 Apparatus balance and thermometer ; measuring cylinder / volumetric or graduated pipette / burette ; 2 Method method described clearly such that another student could use it to obtain suitable results i.e. add (two or more) different masses/amounts of citric acid (in a suitable container) to (aqueous) sodium hydrogencarbonate then measure the temperature ; 3 Measurements initial temperature (of aqueous sodium hydrogencarbonate) ; measure the lowest temperature ; use at least five different masses of citric acid / states at least five masses with units ; 3 4 Control variables (in experiments with different masses) same/stated volume of (aqueous) sodium hydrogencarbonate ; same starting/initial temperature (of aqueous sodium hydrogencarbonate) ; 5 Processing results and conclusions subtract lowest temperature from initial (to find temperature decrease/change) ; plot a graph of temperature decrease against mass (of citric acid) ;
Q4 · A student uses two methods to determine the resistance R of resistor W
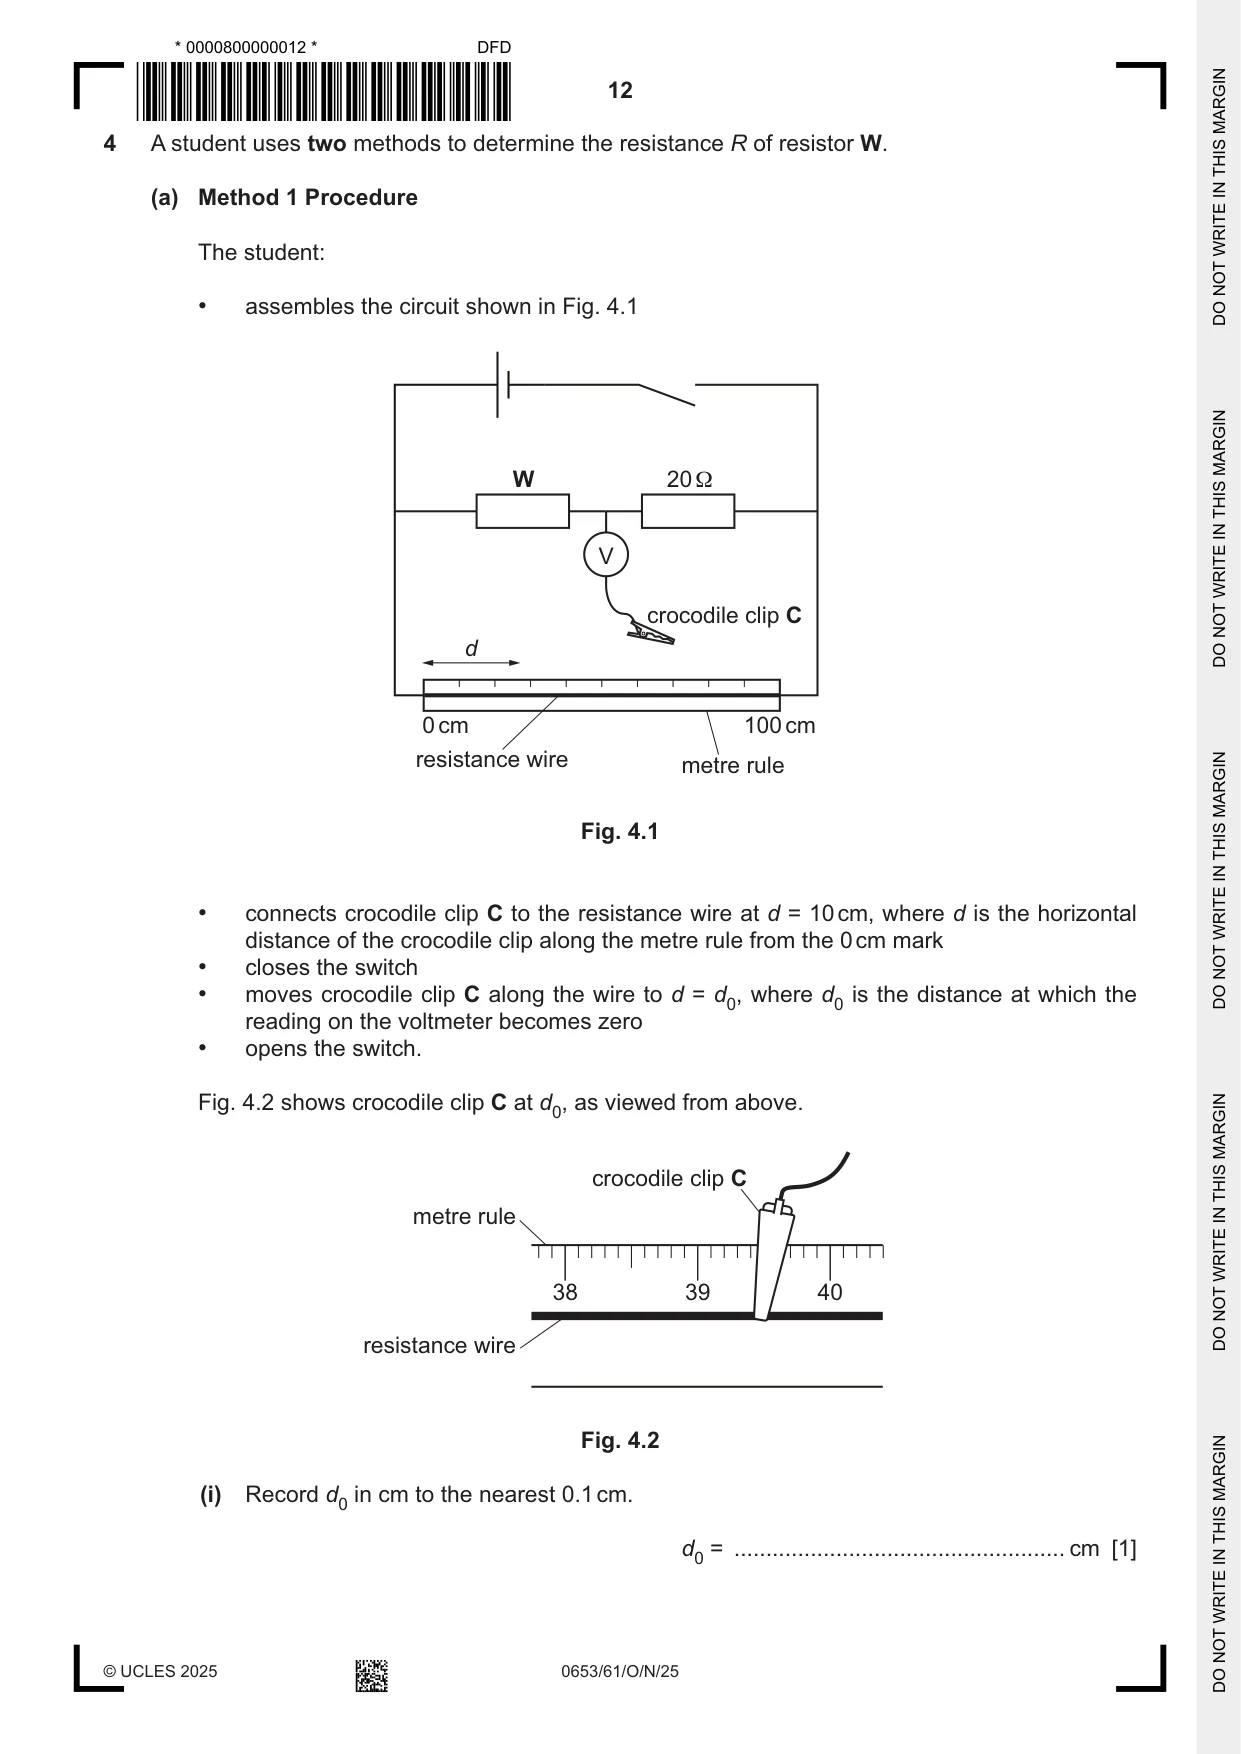
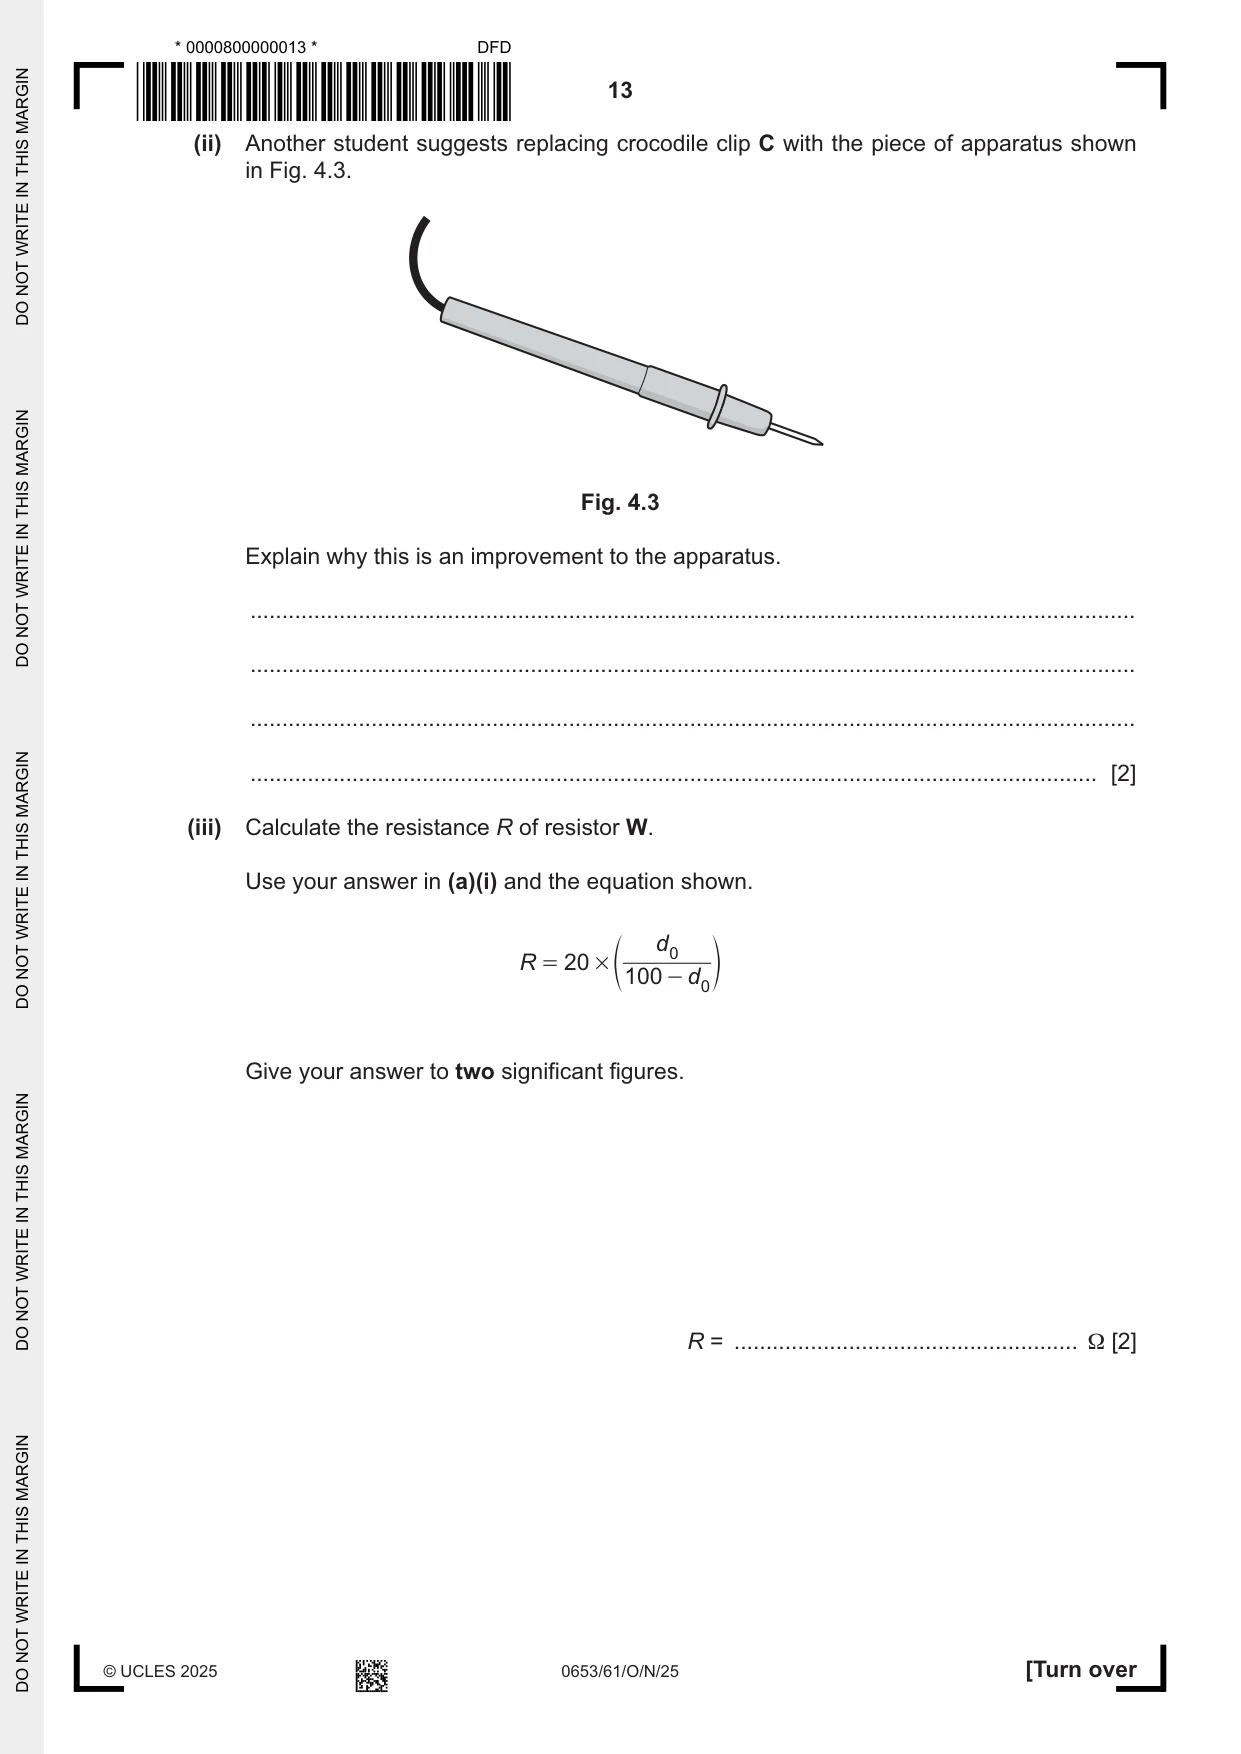
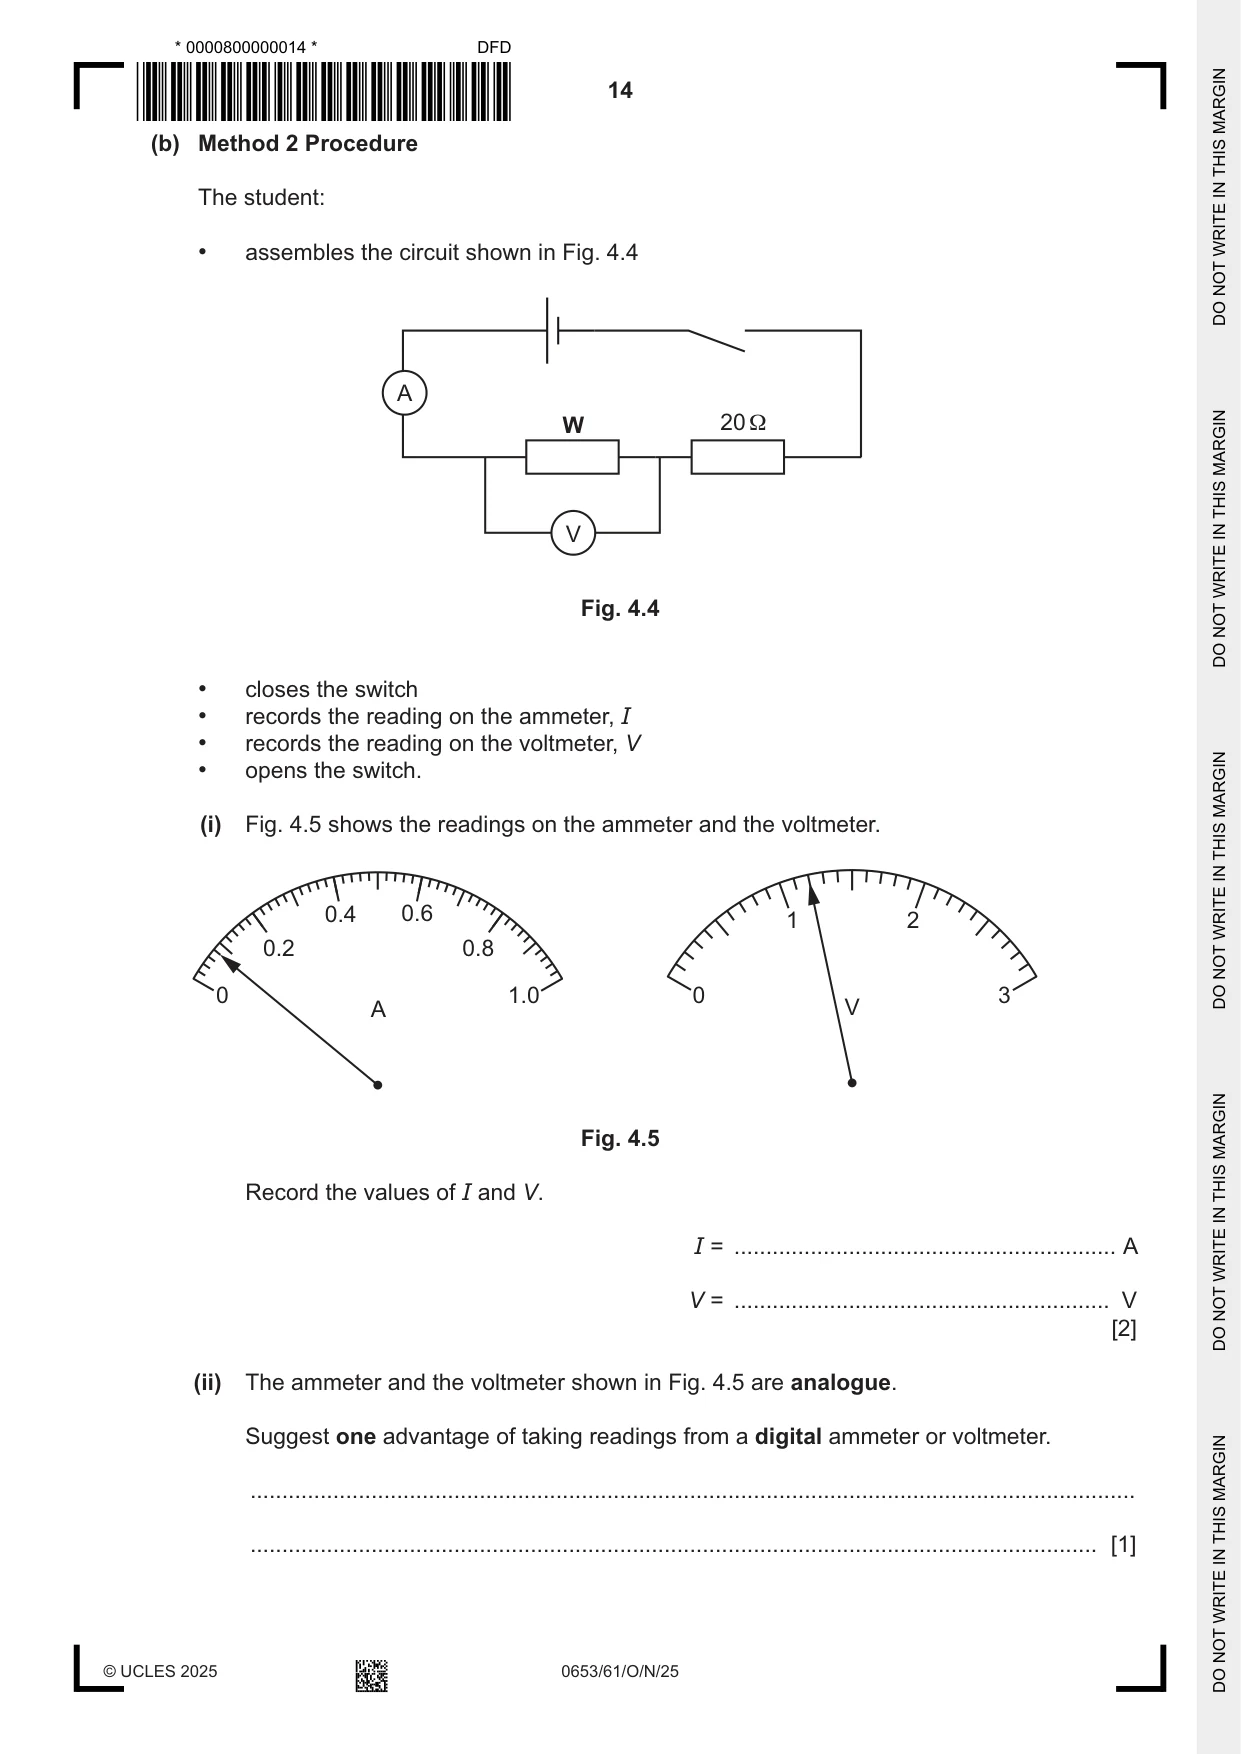
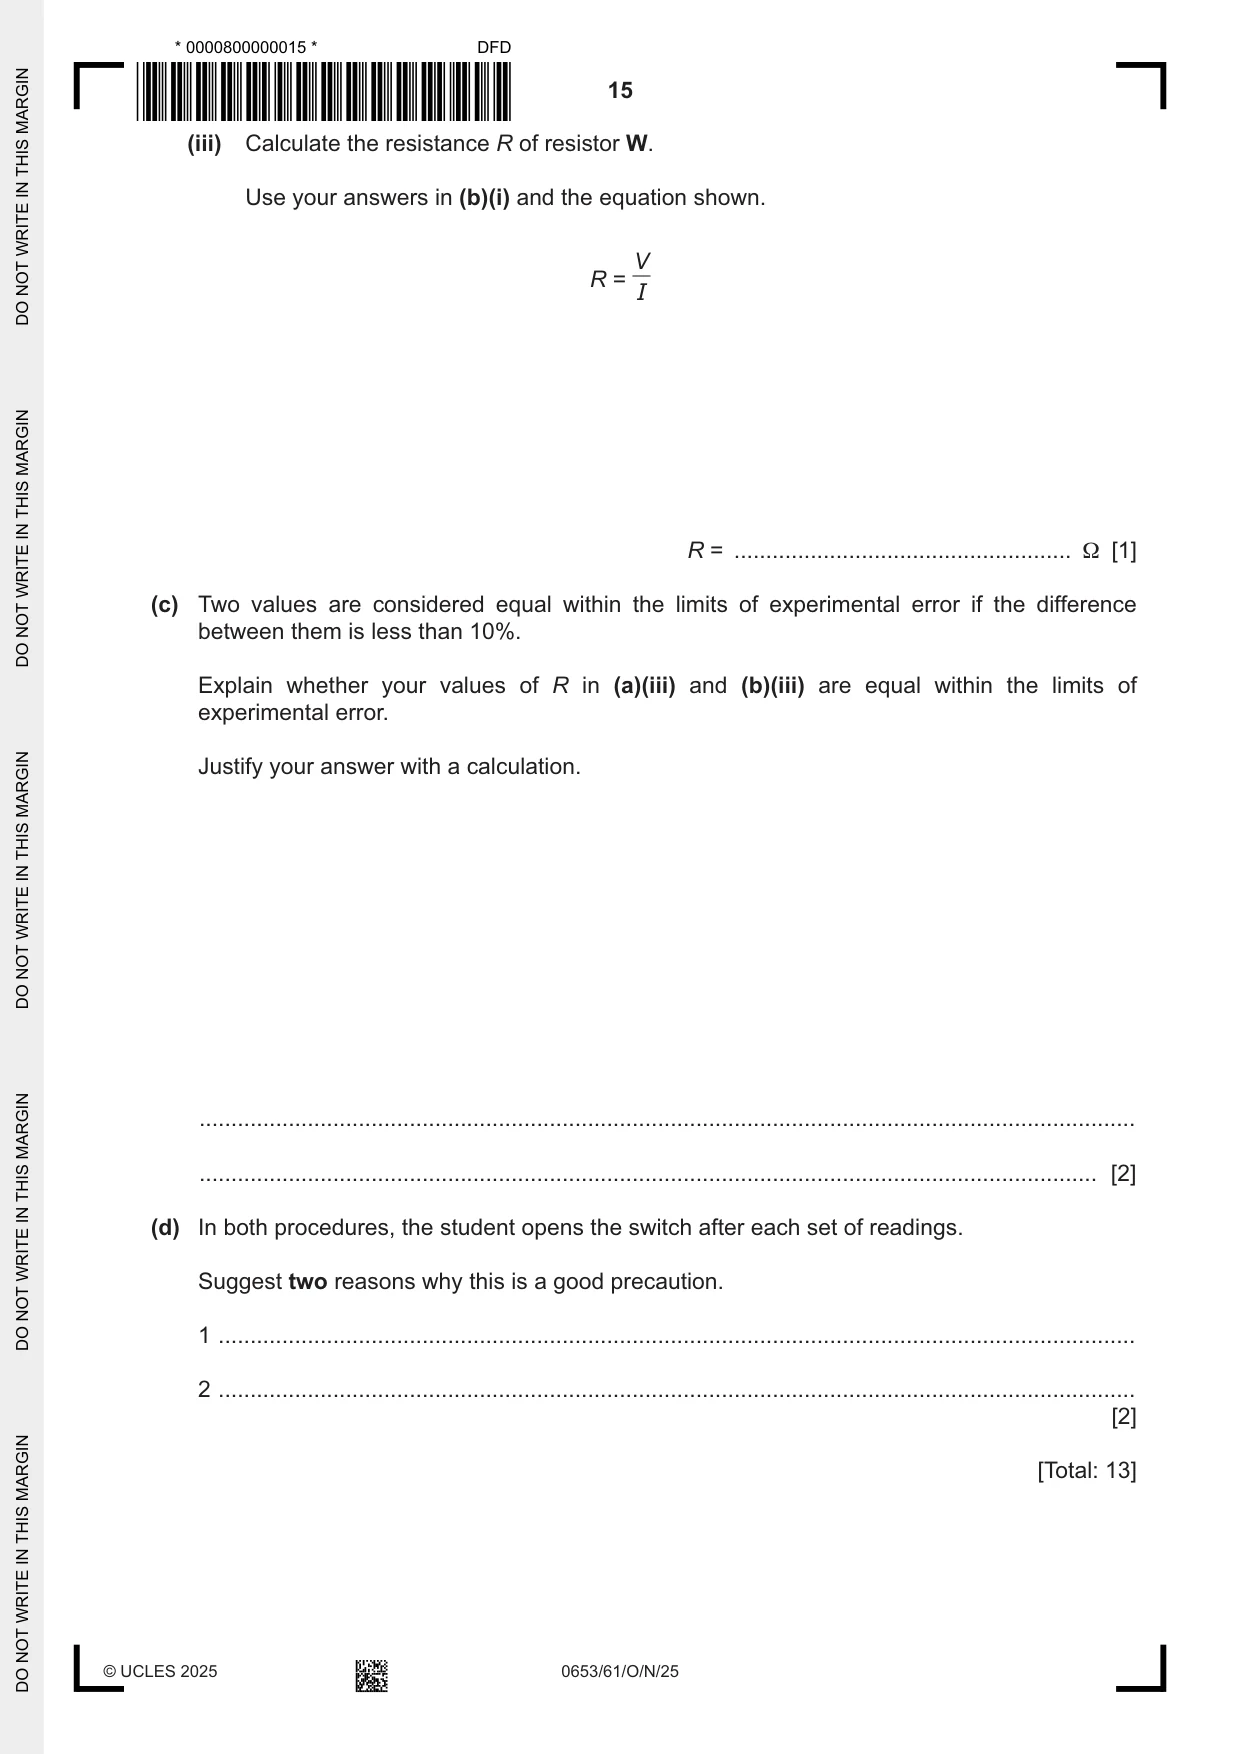
4 A student uses two methods to determine the resistance R of resistor W. (a) Method 1 Procedure The student: • assembles the circuit shown in Fig. 4.1 W 20 Ω V crocodile clip C d 0 cm 100 cm resistance wire metre rule Fig. 4.1 • connects crocodile clip C to the resistance wire at d = 10 cm, where d is the horizontal distance of the crocodile clip along the metre rule from the 0 cm mark • closes the switch • moves crocodile clip C along the wire to d = d0, where d0 is the distance at which the reading on the voltmeter becomes zero • opens the switch. Fig. 4.2 shows crocodile clip C at d0, as viewed from above. crocodile clip C metre rule 38 39 40 resistance wire Fig. 4.2 (i) Record d0 in cm to the nearest 0.1 cm. d0 = .................................................... cm [1] (ii) Another student suggests replacing crocodile clip C with the piece of apparatus shown in Fig. 4.3. Fig. 4.3 Explain why this is an improvement to the apparatus. ........................................................................................................................................... ........................................................................................................................................... ........................................................................................................................................... ..................................................................................................................................... [2] (iii) Calculate the resistance R of resistor W. Use your answer in (a)(i) and the equation shown. d R = 20 # e 0 o 100 - d 0 Give your answer to two significant figures. R = ...................................................... Ω [2] (b) Method 2 Procedure The student: • assembles the circuit shown in Fig. 4.4 A W 20 Ω V Fig. 4.4 • closes the switch • records the reading on the ammeter, I • records the reading on the voltmeter, V • opens the switch. (i) Fig. 4.5 shows the readings on the ammeter and the voltmeter. 0.4 0.6 1 2 0.2 0.8 0 1.0 0 3 A V Fig. 4.5 Record the values of I and V. I = ............................................................ A V = ........................................................... V [2] (ii) The ammeter and the voltmeter shown in Fig. 4.5 are analogue. Suggest one advantage of taking readings from a digital ammeter or voltmeter. ........................................................................................................................................... ..................................................................................................................................... [1]
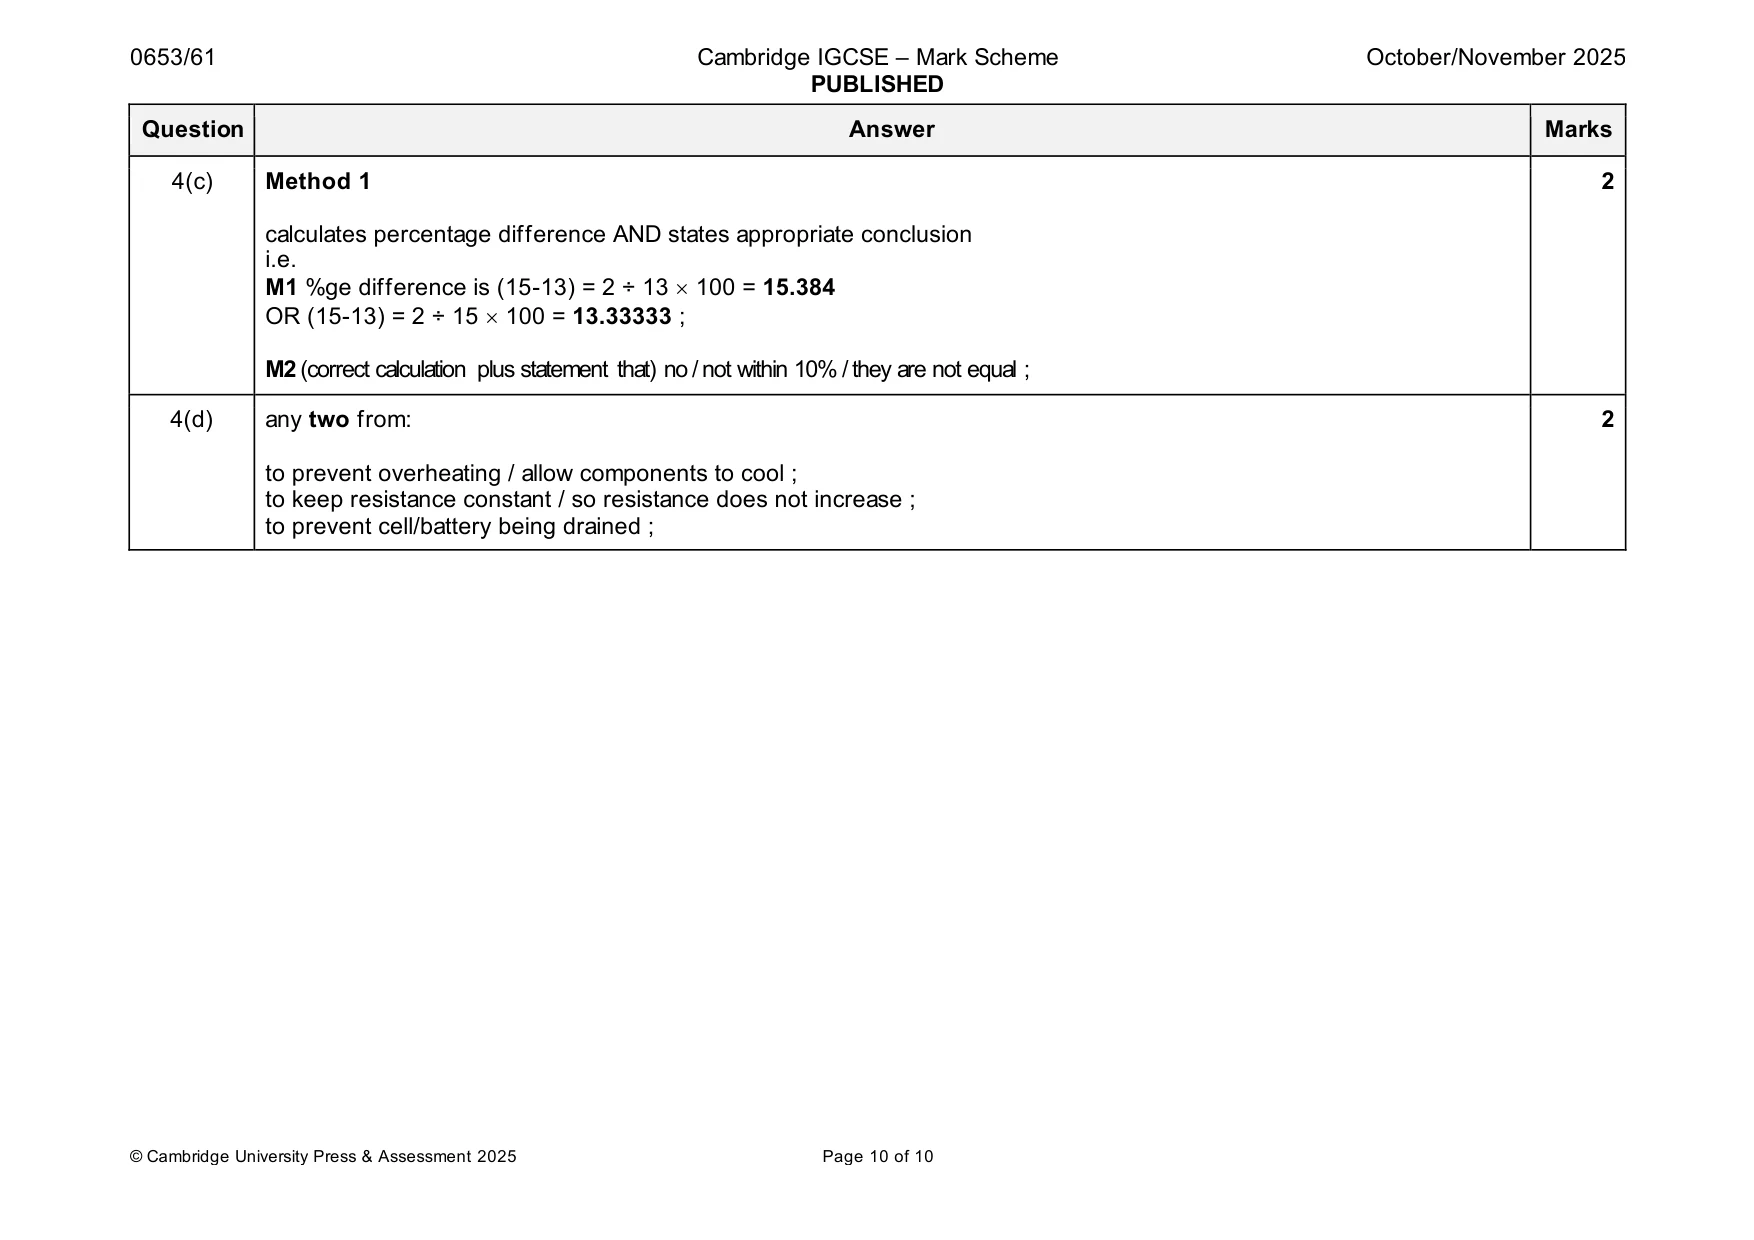
Mark scheme: 4(a)(i) 39.4 / 39.5 / 39.6 ; 1 4(a)(ii) has sharp(er) point / thin(ner) / not as wide / crocodile clip C is (too) wide ; 2 more accurate reading/value/measurement of d0 / points to single/exact value/reading / does not obscure/hide/cover the numbers or readings on ruler ; 4(a)(iii) correct calculation of R (unrounded); 2 to 2 significant figures ; 4(b)(i) 0.08 (A) ; 2 1.2(0) (V) ; 4(b)(ii) does not rely on (human) judgment / less likely to make a measurement error / less likely to make an error when taking a 1 reading idea / needle fluctuates/does not stay still ; 4(b)(iii) correct calculation of R ; 1 4(c) Method 1 2 calculates percentage difference AND states appropriate conclusion i.e. M1 %ge difference is (15-13) = 2 ÷ 13 100 = 15.384 OR (15-13) = 2 ÷ 15 100 = 13.33333 ; M2 (correct calculation plus statement that) no / not within 10% / they are not equal ; 4(d) any two from: 2 to prevent overheating / allow components to cool ; to keep resistance constant / so resistance does not increase ; to prevent cell/battery being drained ;
More questions on Physical quantities and measurement techniques
What was in this paper
The subtopics covered by these 4 questions, and how many questions each got. Open one in a new tab to see every Cambridge question on it.
What you needed in this session
Cambridge’s own grade thresholds for 2025 Oct/Nov, Paper 6 · Variant 1. A higher threshold means an easier paper — the bar moves with how the cohort did.