Cambridge IGCSE Science - Combined 0653 — 2025 May/June Paper 6 · Variant 3
0653/63/M/J/25 · 4 questions · 40 marks · 60 min
The question paper and its mark scheme, free to read here and free to download. This is Cambridge’s own paper, exactly as it was sat.
Question paper16 pages


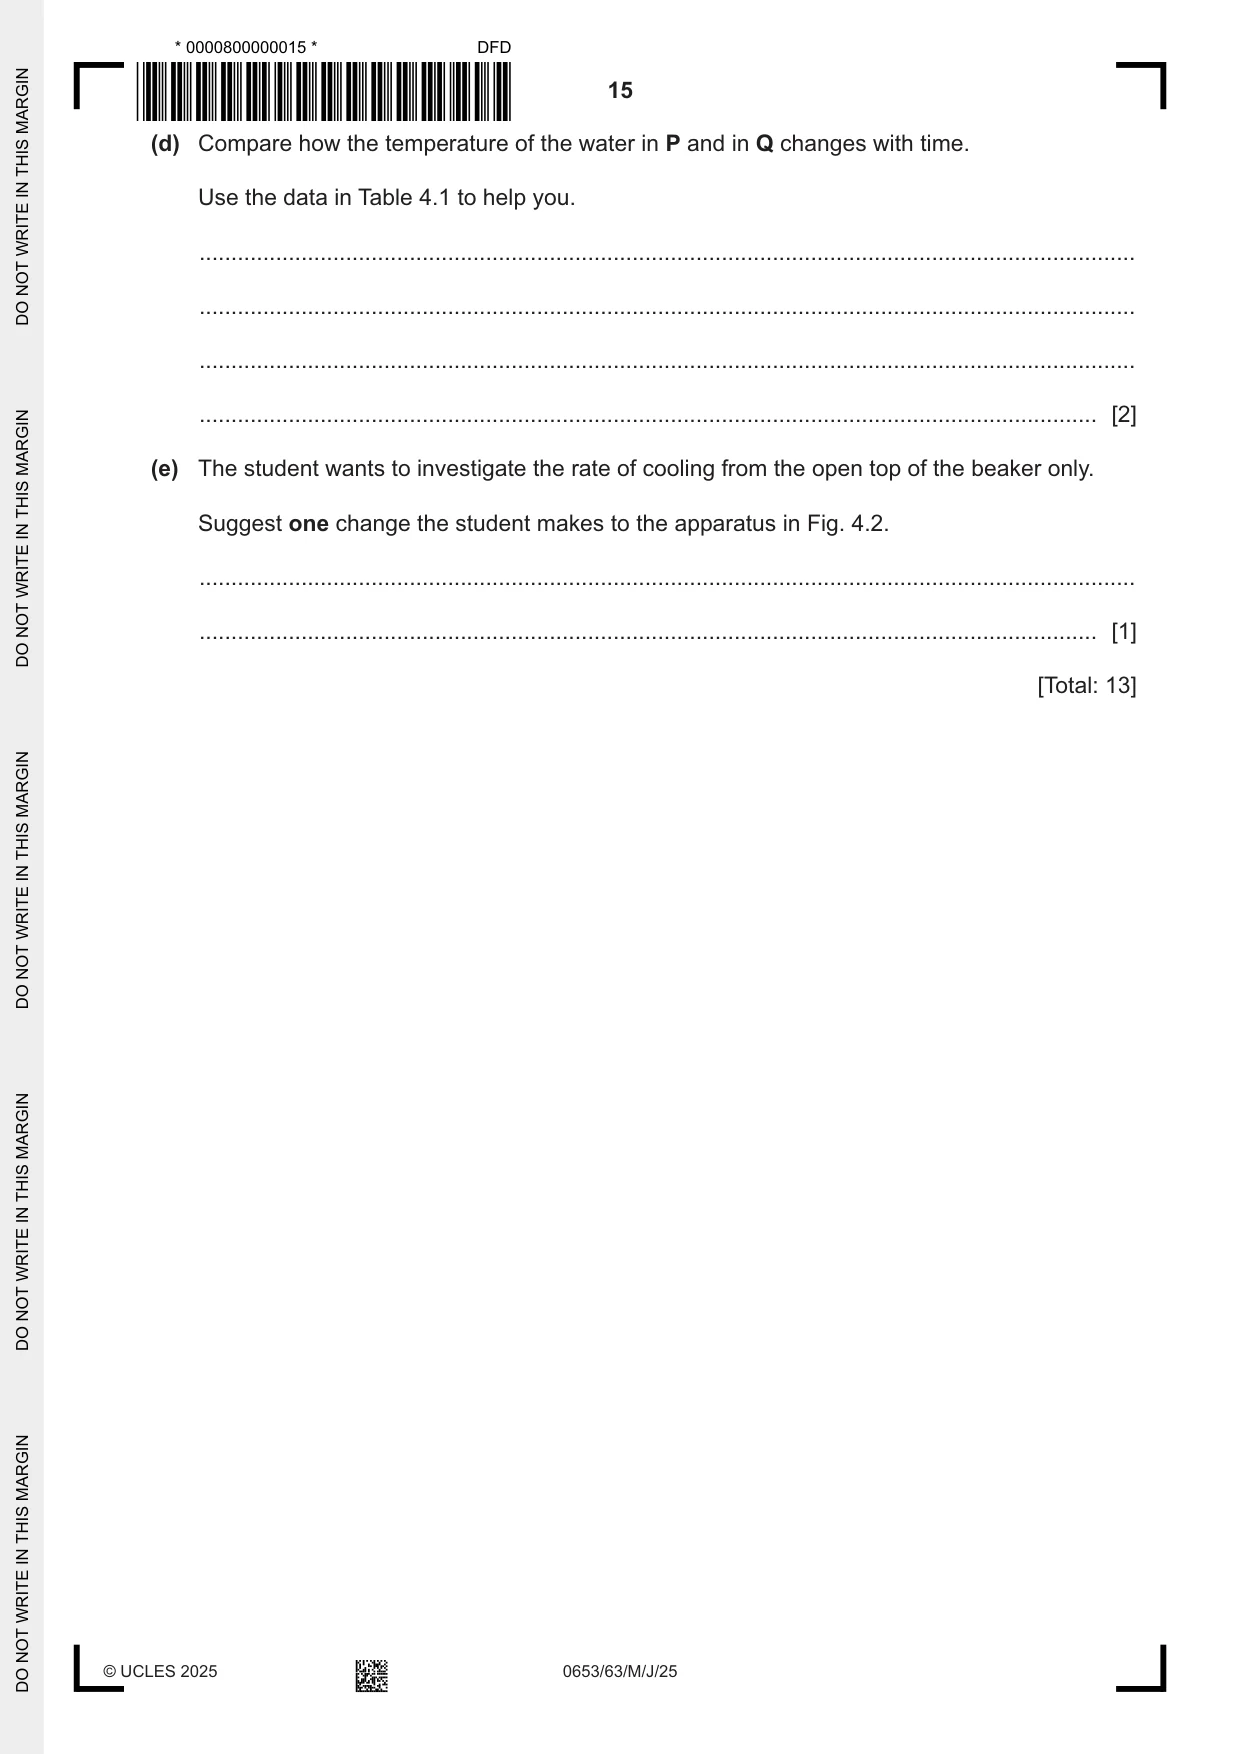
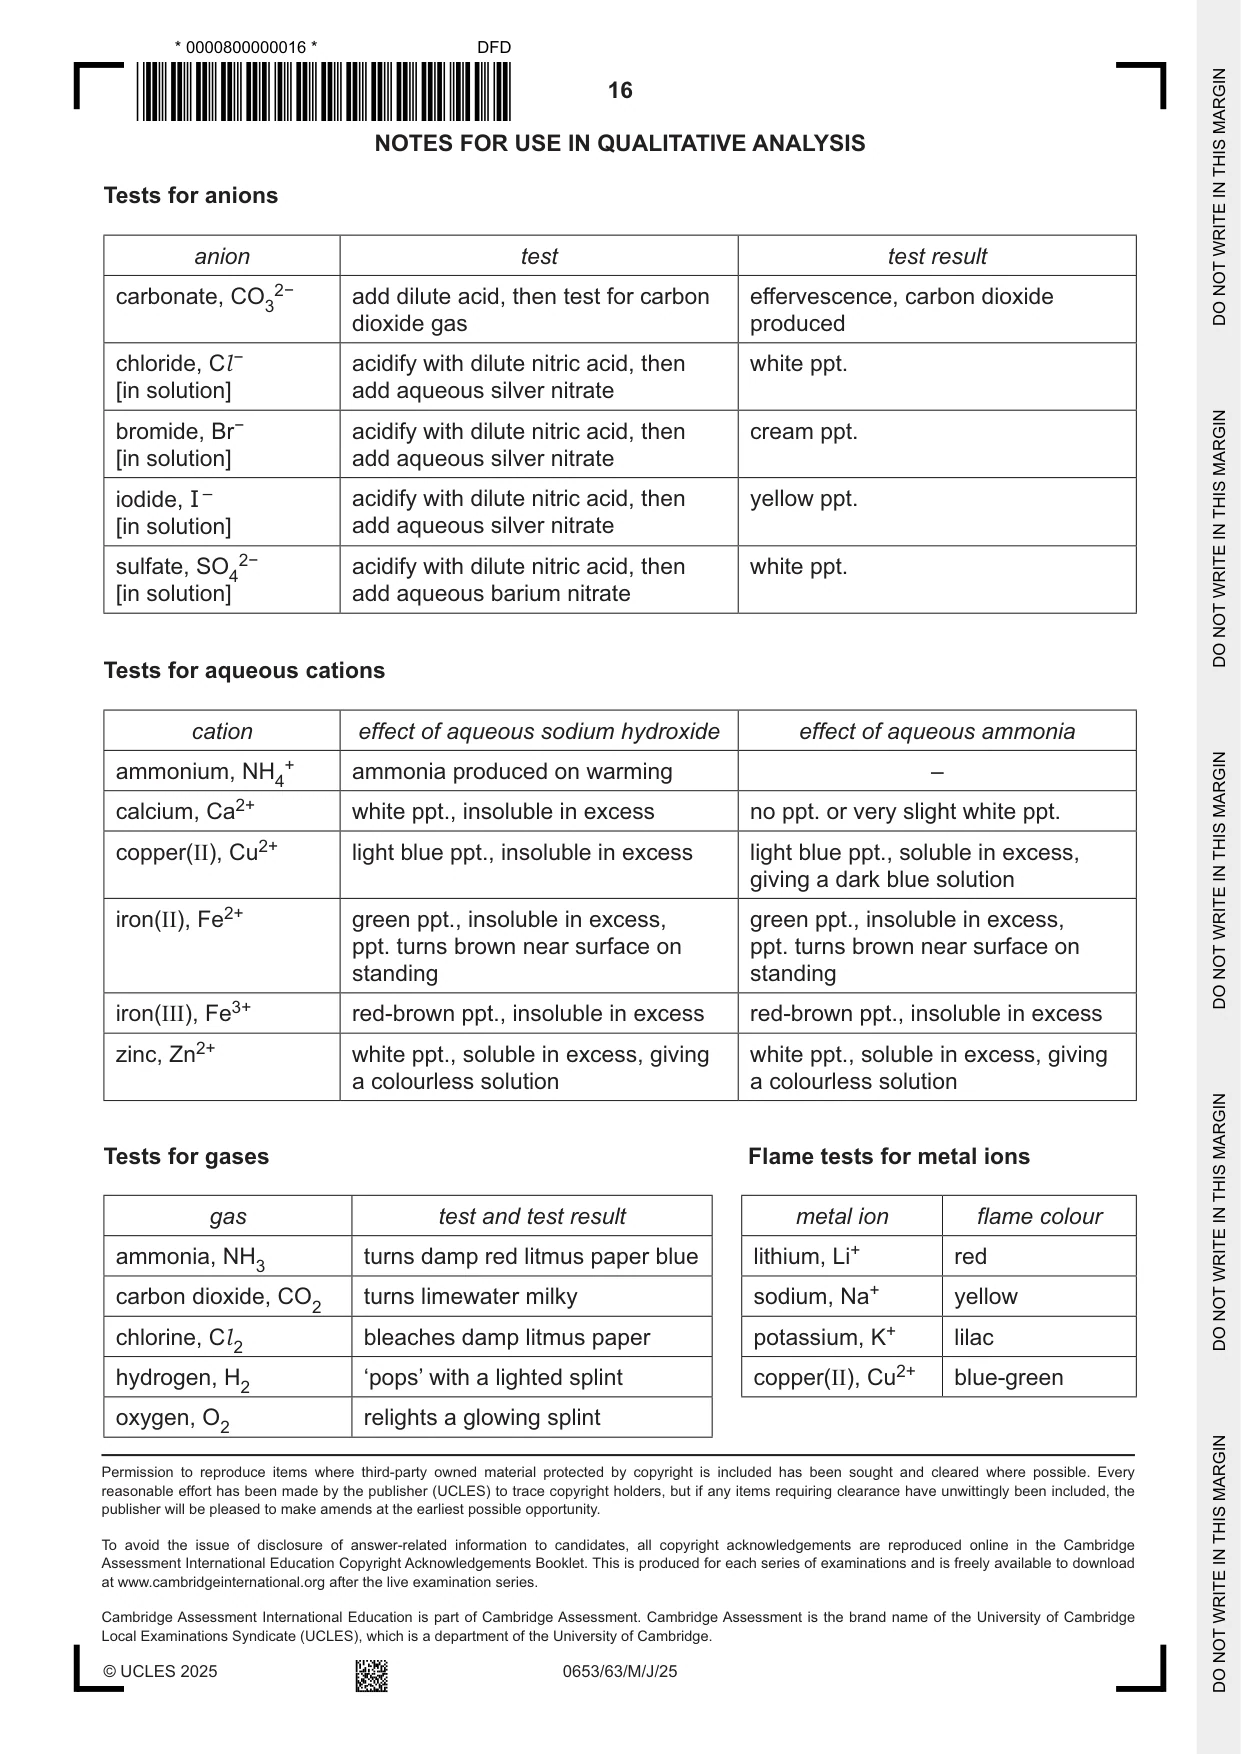
Mark scheme10 pages
Answers below. Sit the paper first if you are practising.
Questions as text
Q1 · A student investigates the effect of oxygen concentration on the germination of pea seeds
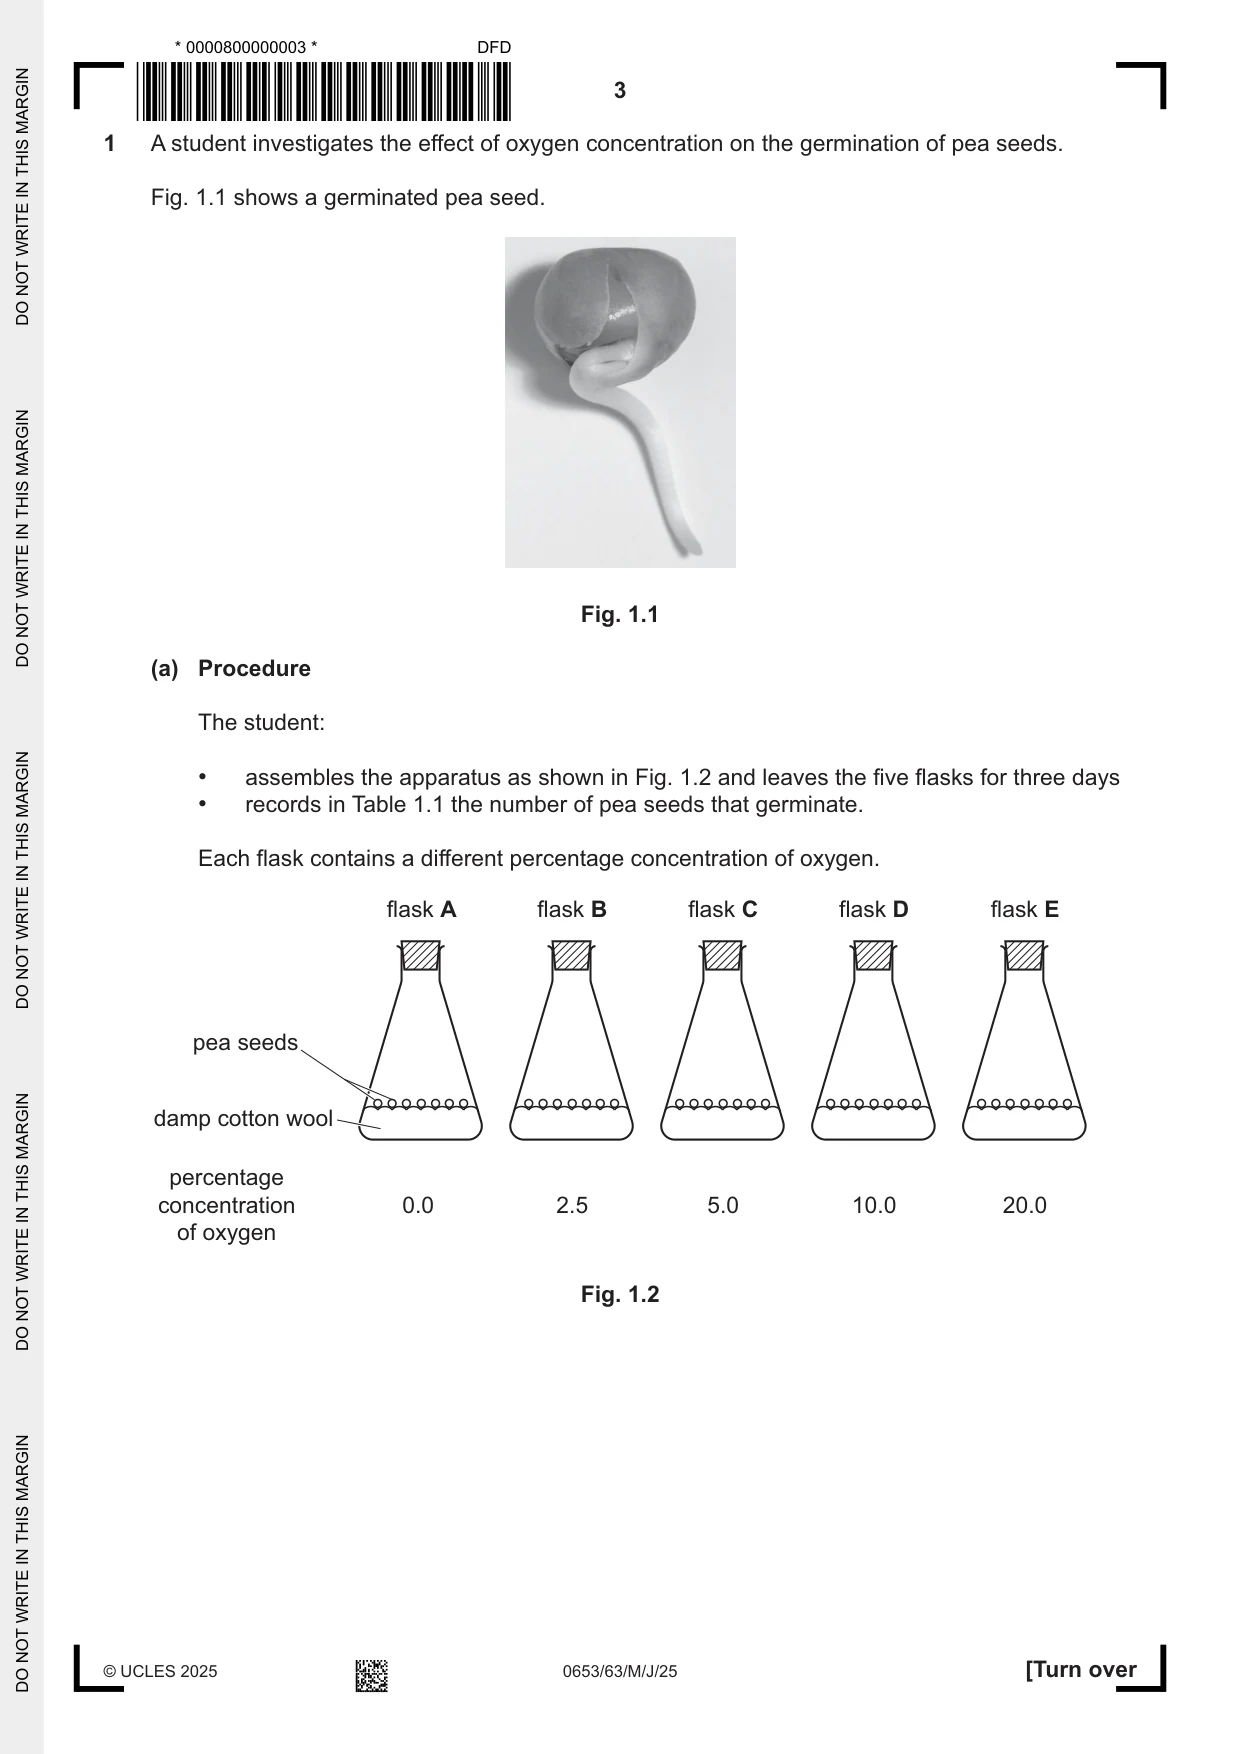
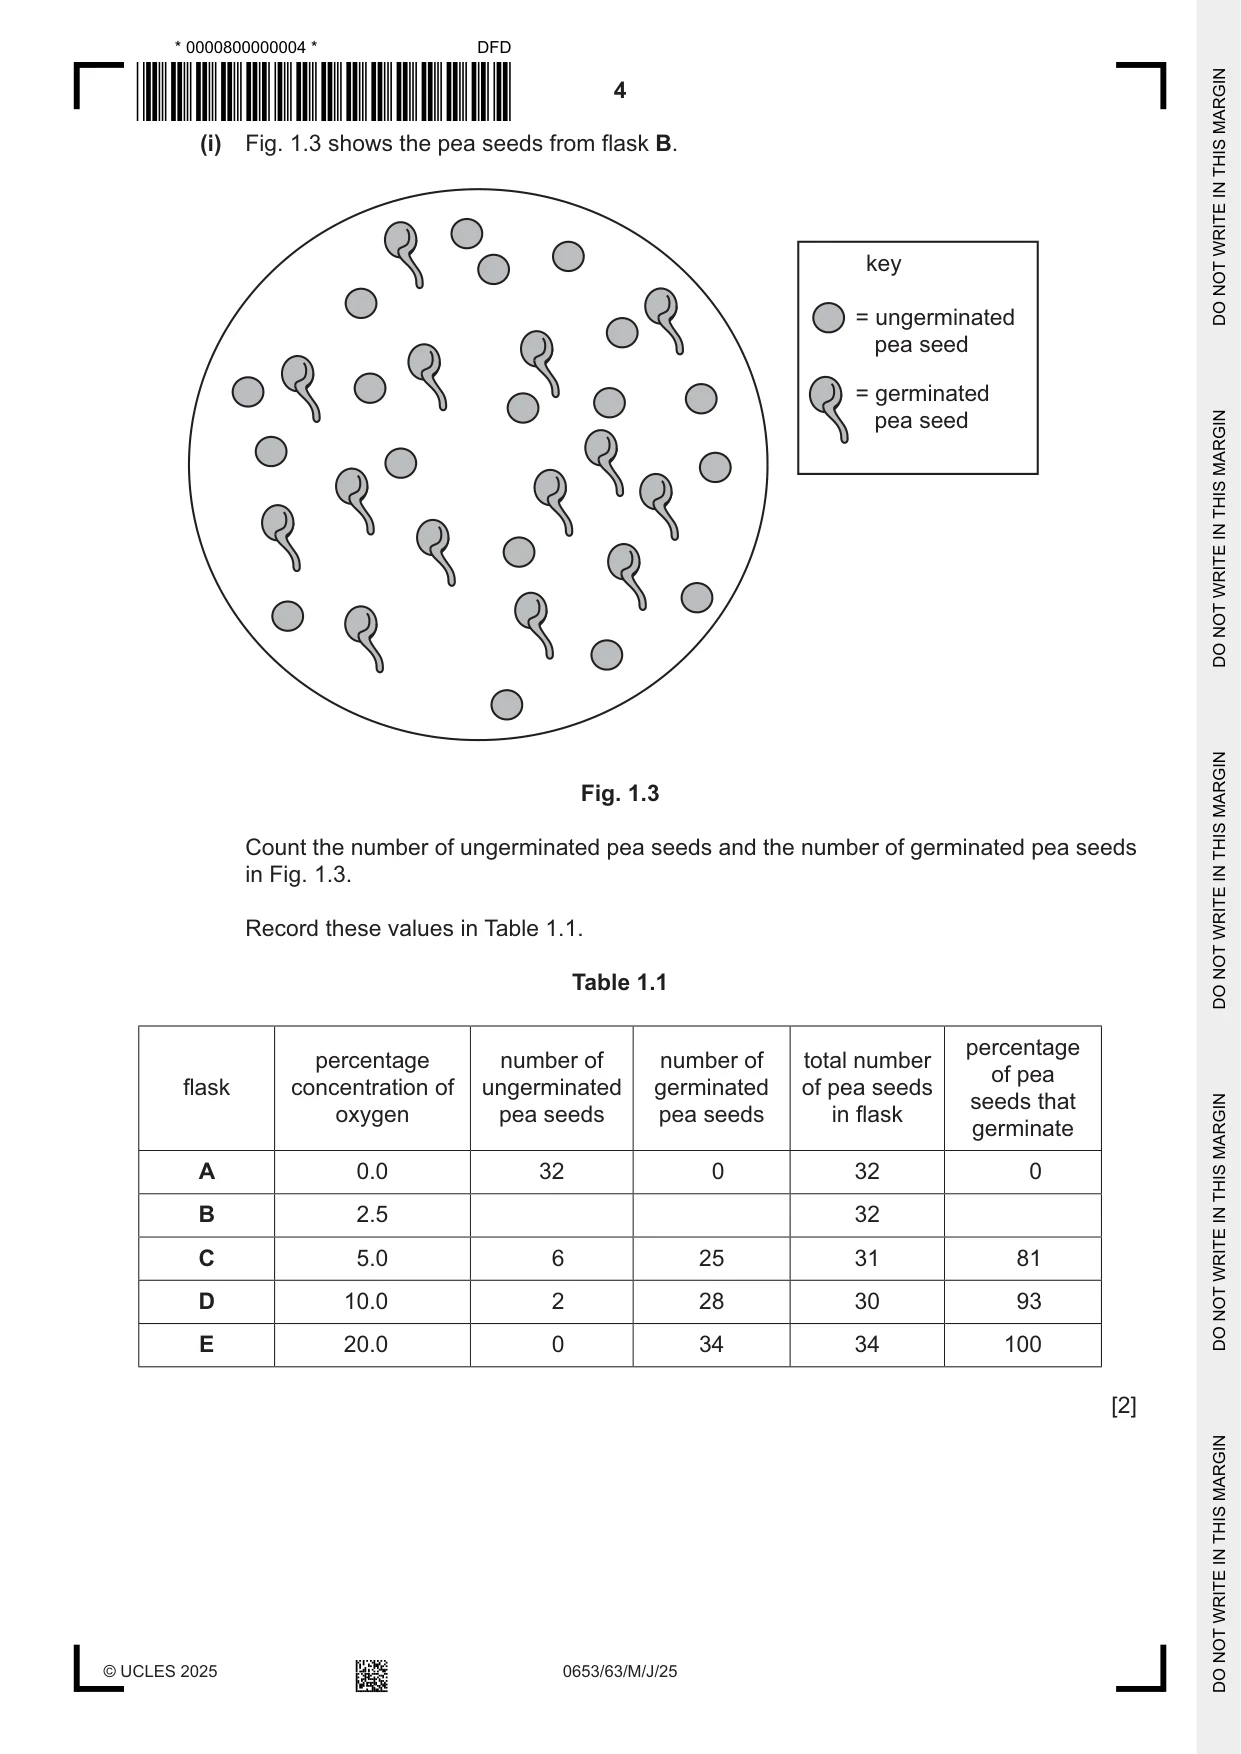
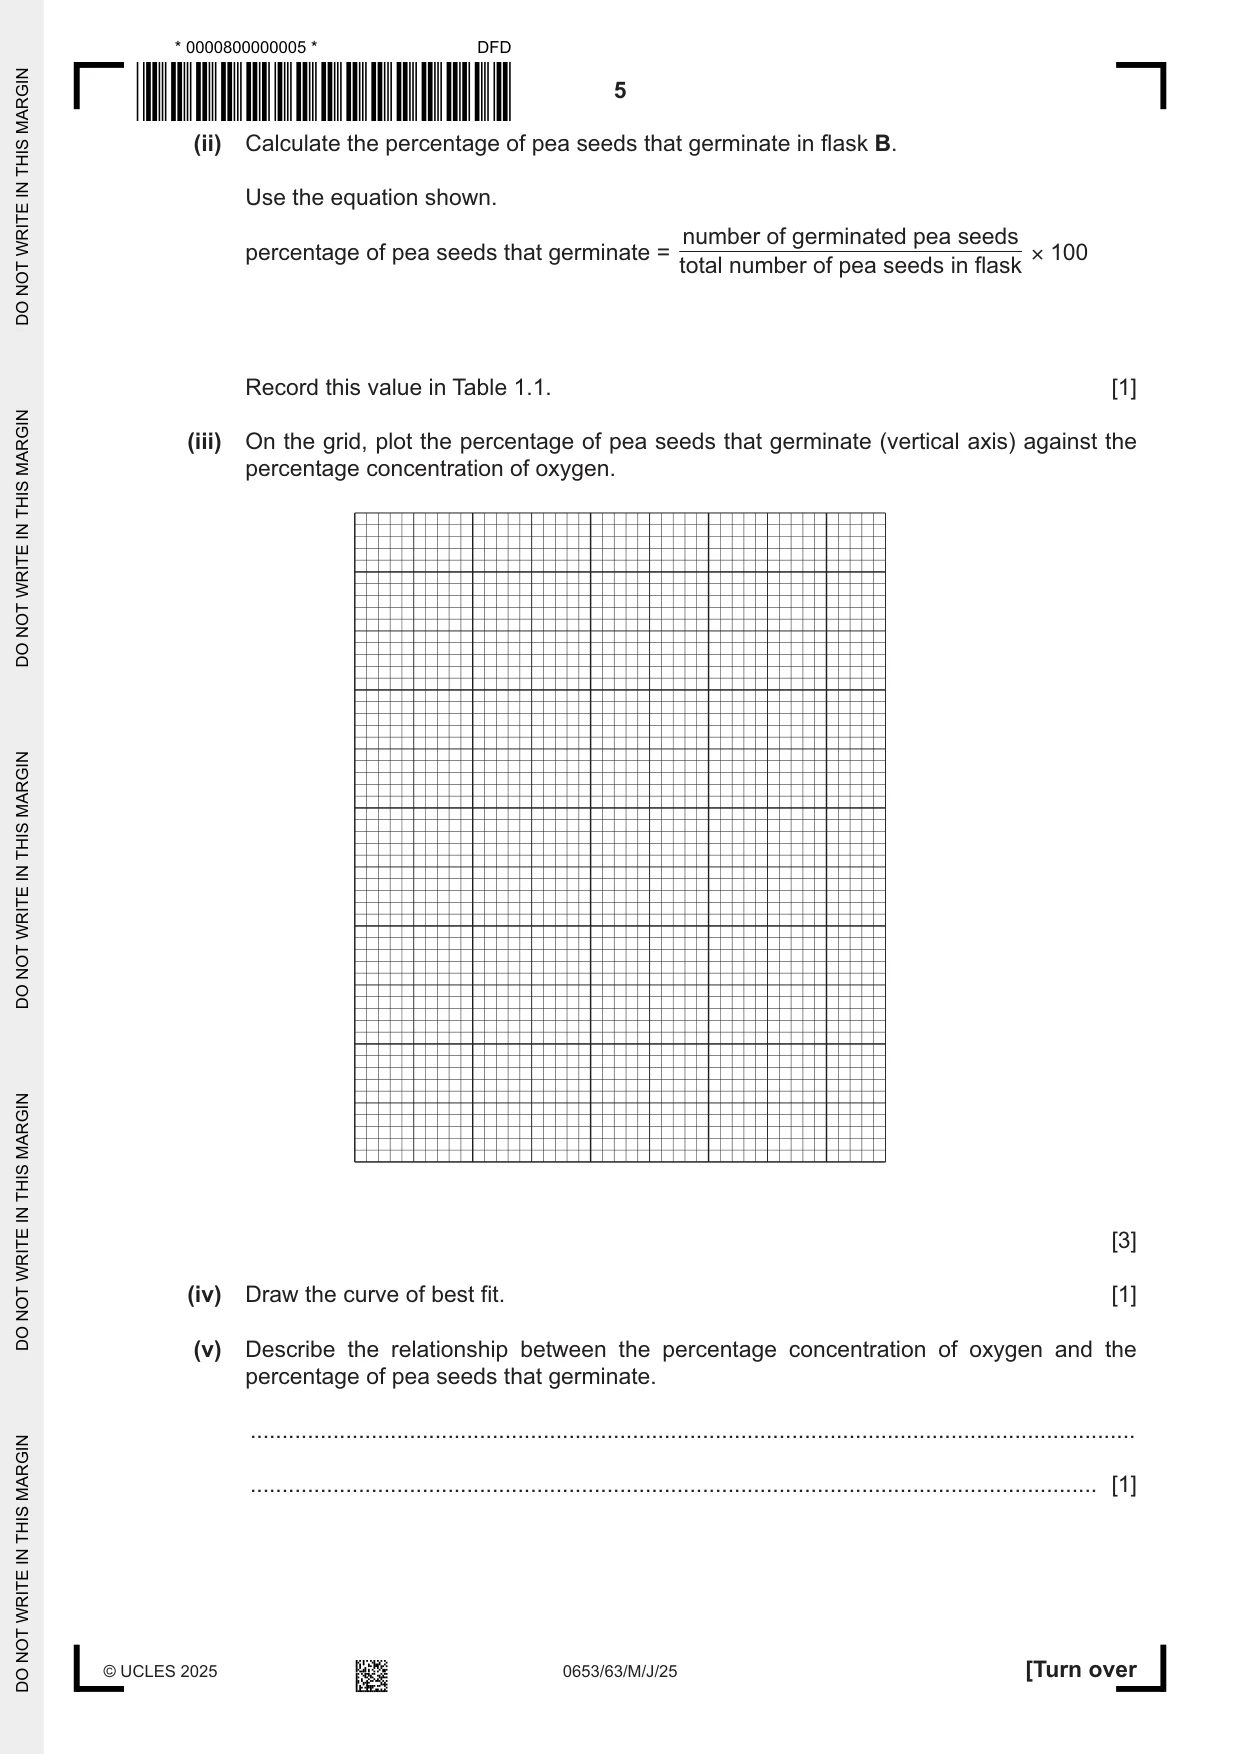
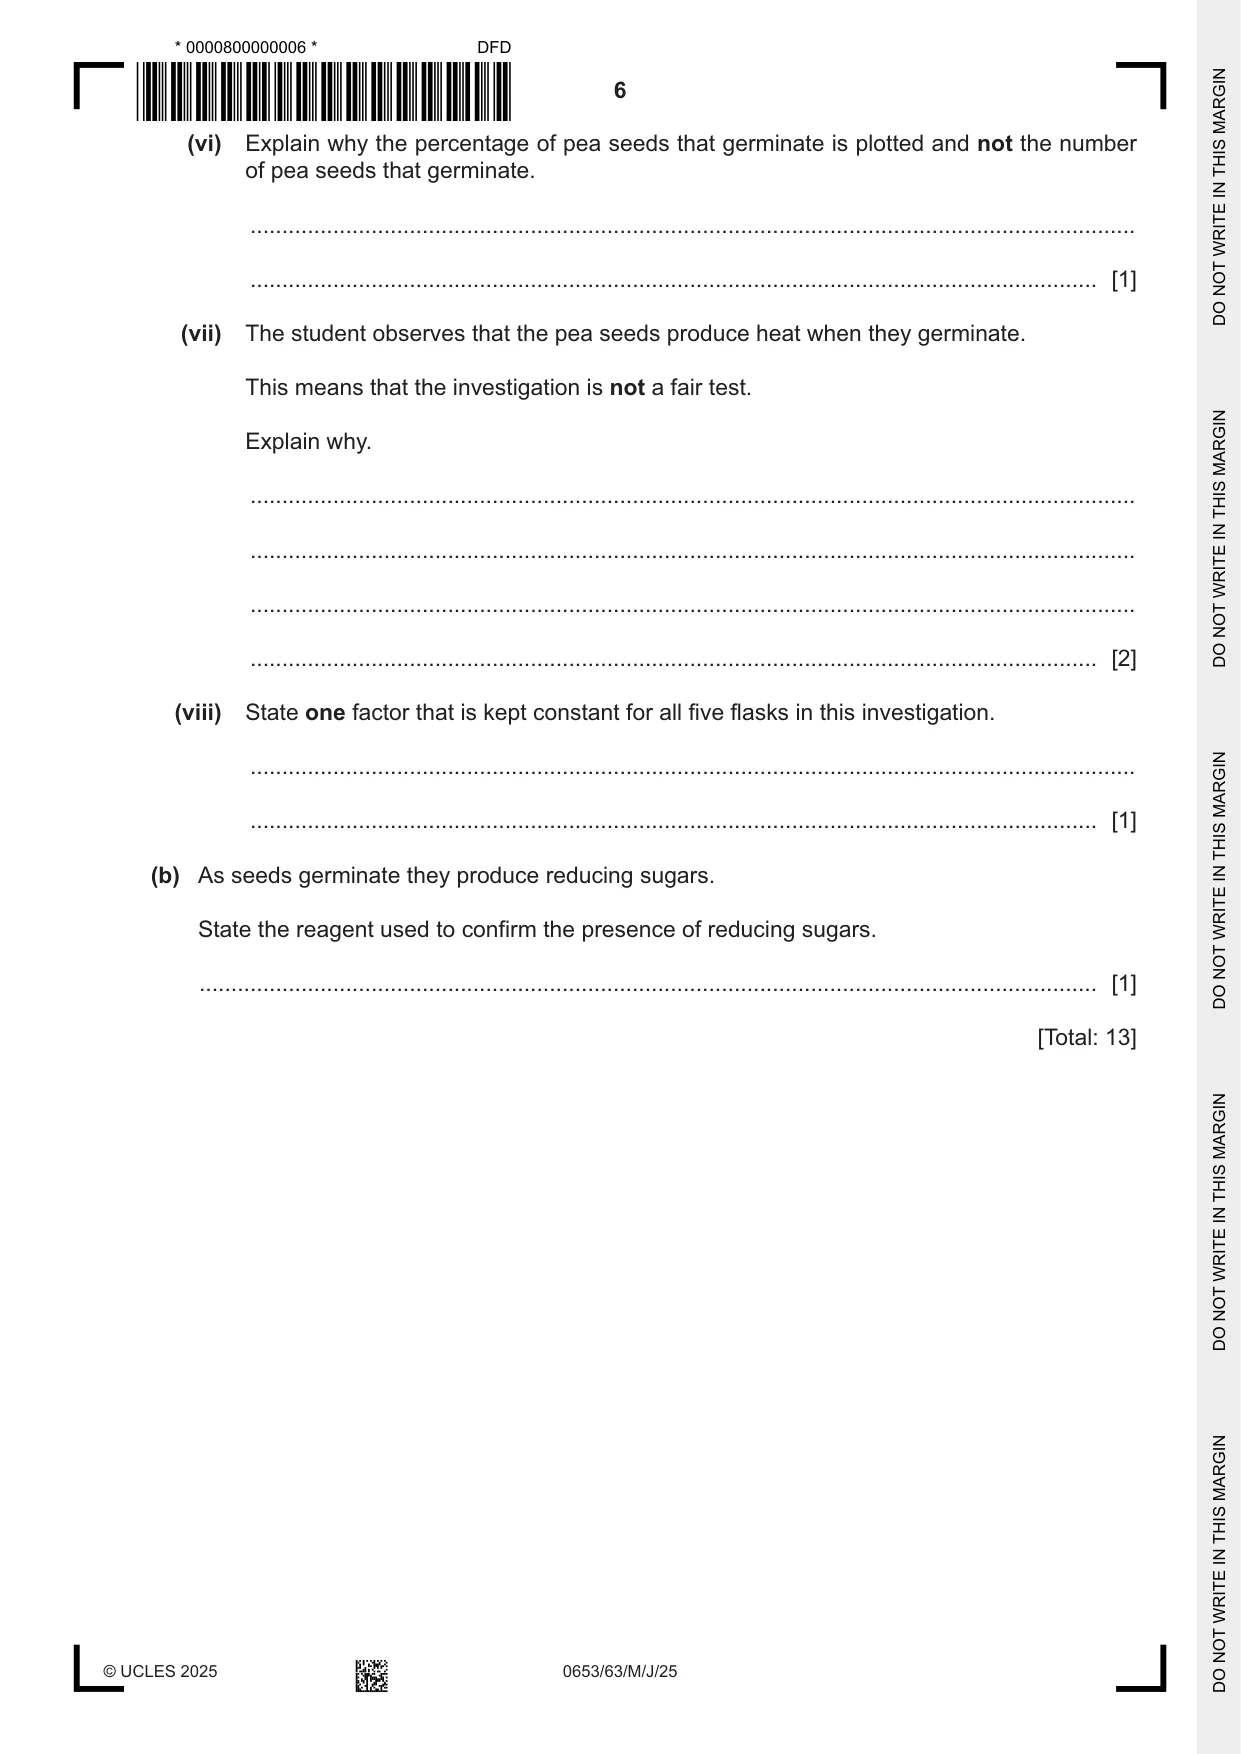
1 A student investigates the effect of oxygen concentration on the germination of pea seeds. Fig. 1.1 shows a germinated pea seed. Fig. 1.1 (a) Procedure The student: • assembles the apparatus as shown in Fig. 1.2 and leaves the five flasks for three days • records in Table 1.1 the number of pea seeds that germinate. Each flask contains a different percentage concentration of oxygen. flask A flask B flask C flask D flask E pea seeds damp cotton wool percentage concentration 0.0 2.5 5.0 10.0 20.0 of oxygen Fig. 1.2 (i) Fig. 1.3 shows the pea seeds from flask B. key = ungerminated pea seed = germinated pea seed Fig. 1.3 Count the number of ungerminated pea seeds and the number of germinated pea seeds in Fig. 1.3. Record these values in Table 1.1. Table 1.1 percentage percentage number of number of total number of pea flask concentration of ungerminated germinated of pea seeds seeds that oxygen pea seeds pea seeds in flask germinate A 0.0 32 0 32 0 B 2.5 32 C 5.0 6 25 31 81 D 10.0 2 28 30 93 E 20.0 0 34 34 100 [2] (ii) Calculate the percentage of pea seeds that germinate in flask B. Use the equation shown. number of germinated pea seeds percentage of pea seeds that germinate = × 100 total number of pea seeds in flask Record this value in Table 1.1. [1] (iii) On the grid, plot the percentage of pea seeds that germinate (vertical axis) against the percentage concentration of oxygen. [3] (iv) Draw the curve of best fit. [1] (v) Describe the relationship between the percentage concentration of oxygen and the percentage of pea seeds that germinate. ........................................................................................................................................... ..................................................................................................................................... [1] (vi) Explain why the percentage of pea seeds that germinate is plotted and not the number of pea seeds that germinate. ........................................................................................................................................... ..................................................................................................................................... [1] (vii) The student observes that the pea seeds produce heat when they germinate. This means that the investigation is not a fair test. Explain why. ........................................................................................................................................... ........................................................................................................................................... ........................................................................................................................................... ..................................................................................................................................... [2] (viii) State one factor that is kept constant for all five flasks in this investigation. ........................................................................................................................................... ..................................................................................................................................... [1] (b) As seeds germinate they produce reducing sugars. State the reagent used to confirm the presence of reducing sugars. ............................................................................................................................................. [1] [Total: 13]
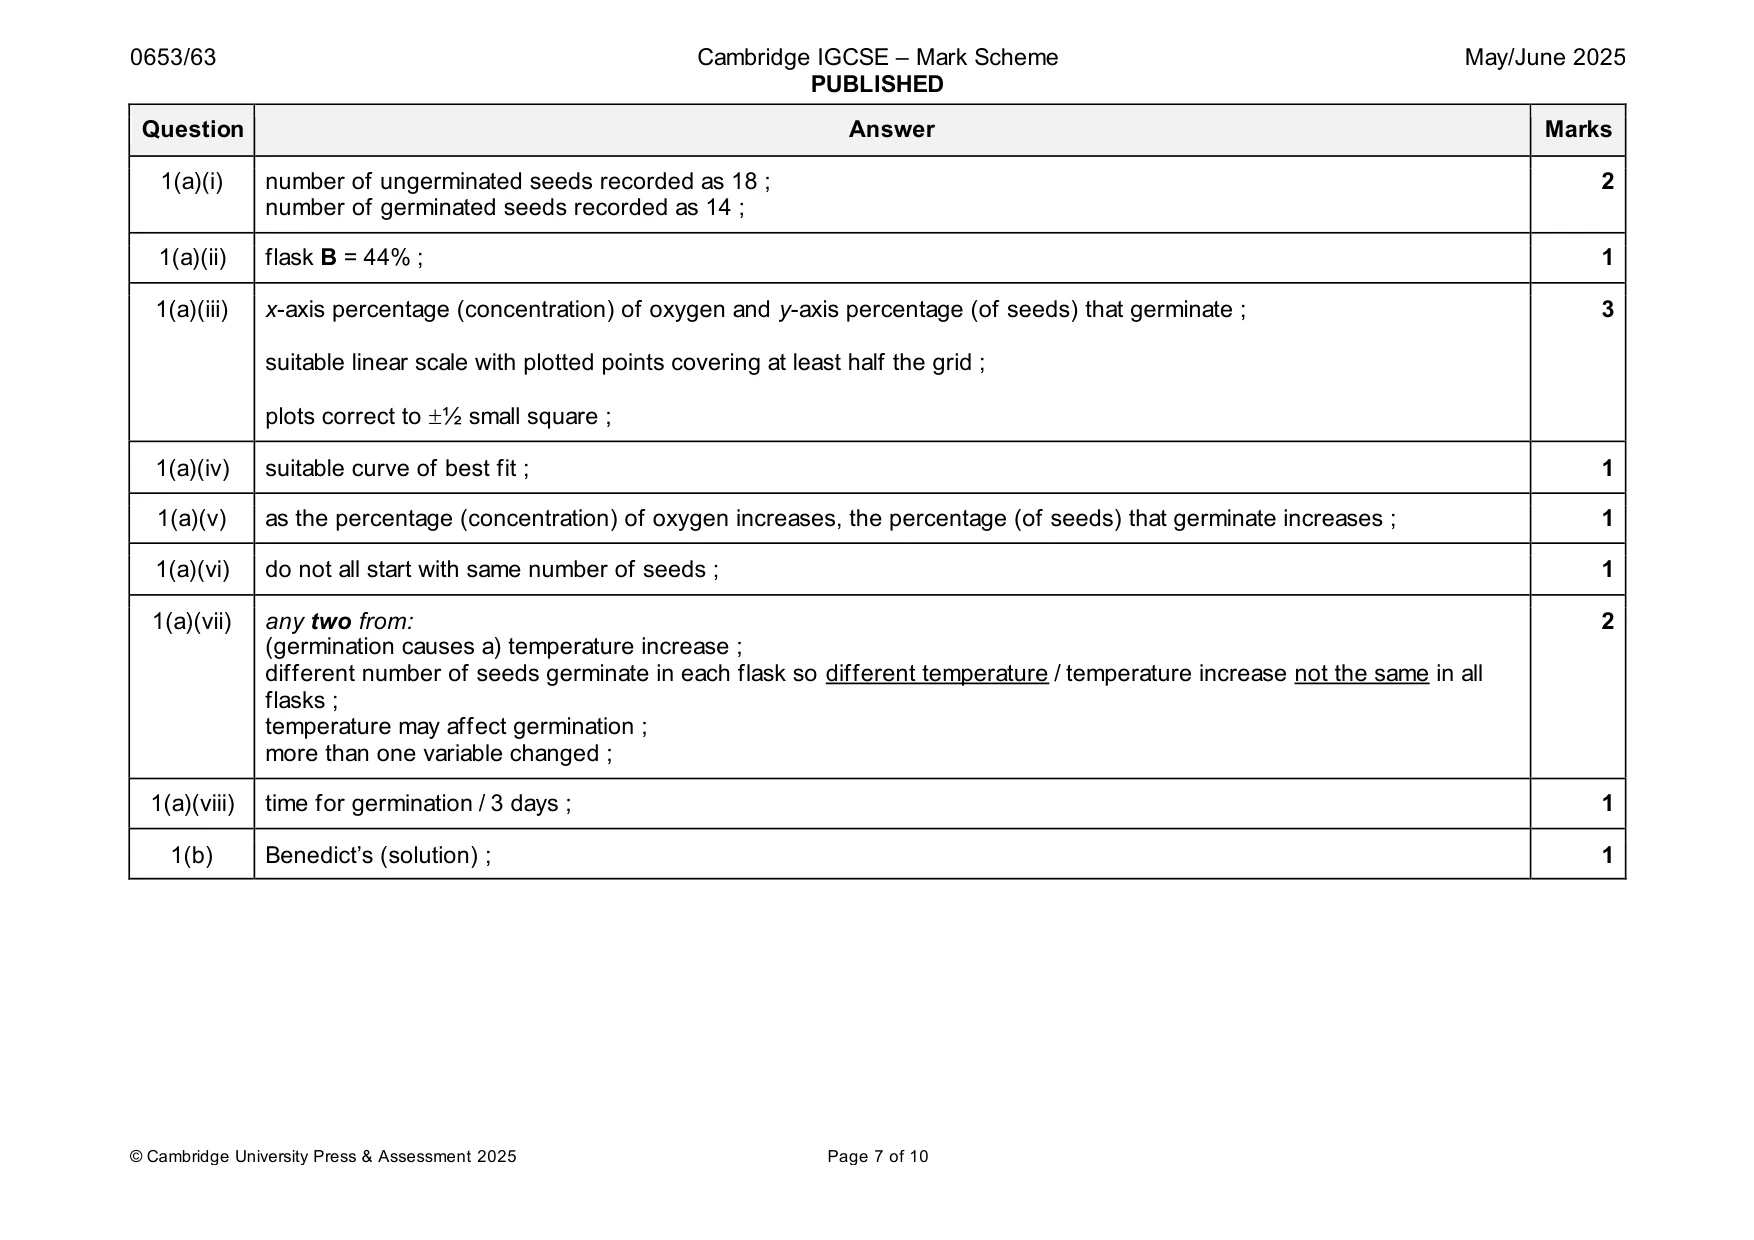
Mark scheme: Question Answer Marks 1(a)(i) number of ungerminated seeds recorded as 18 ; 2 number of germinated seeds recorded as 14 ; 1(a)(ii) flask B = 44% ; 1 1(a)(iii) x-axis percentage (concentration) of oxygen and y-axis percentage (of seeds) that germinate ; 3 suitable linear scale with plotted points covering at least half the grid ; plots correct to ½ small square ; 1(a)(iv) suitable curve of best fit ; 1 1(a)(v) as the percentage (concentration) of oxygen increases, the percentage (of seeds) that germinate increases ; 1 1(a)(vi) do not all start with same number of seeds ; 1 1(a)(vii) any two from: 2 (germination causes a) temperature increase ; different number of seeds germinate in each flask so different temperature / temperature increase not the same in all flasks ; temperature may affect germination ; more than one variable changed ; 1(a)(viii) time for germination / 3 days ; 1 1(b) Benedict’s (solution) ; 1
Q2 · A student investigates a white solid H
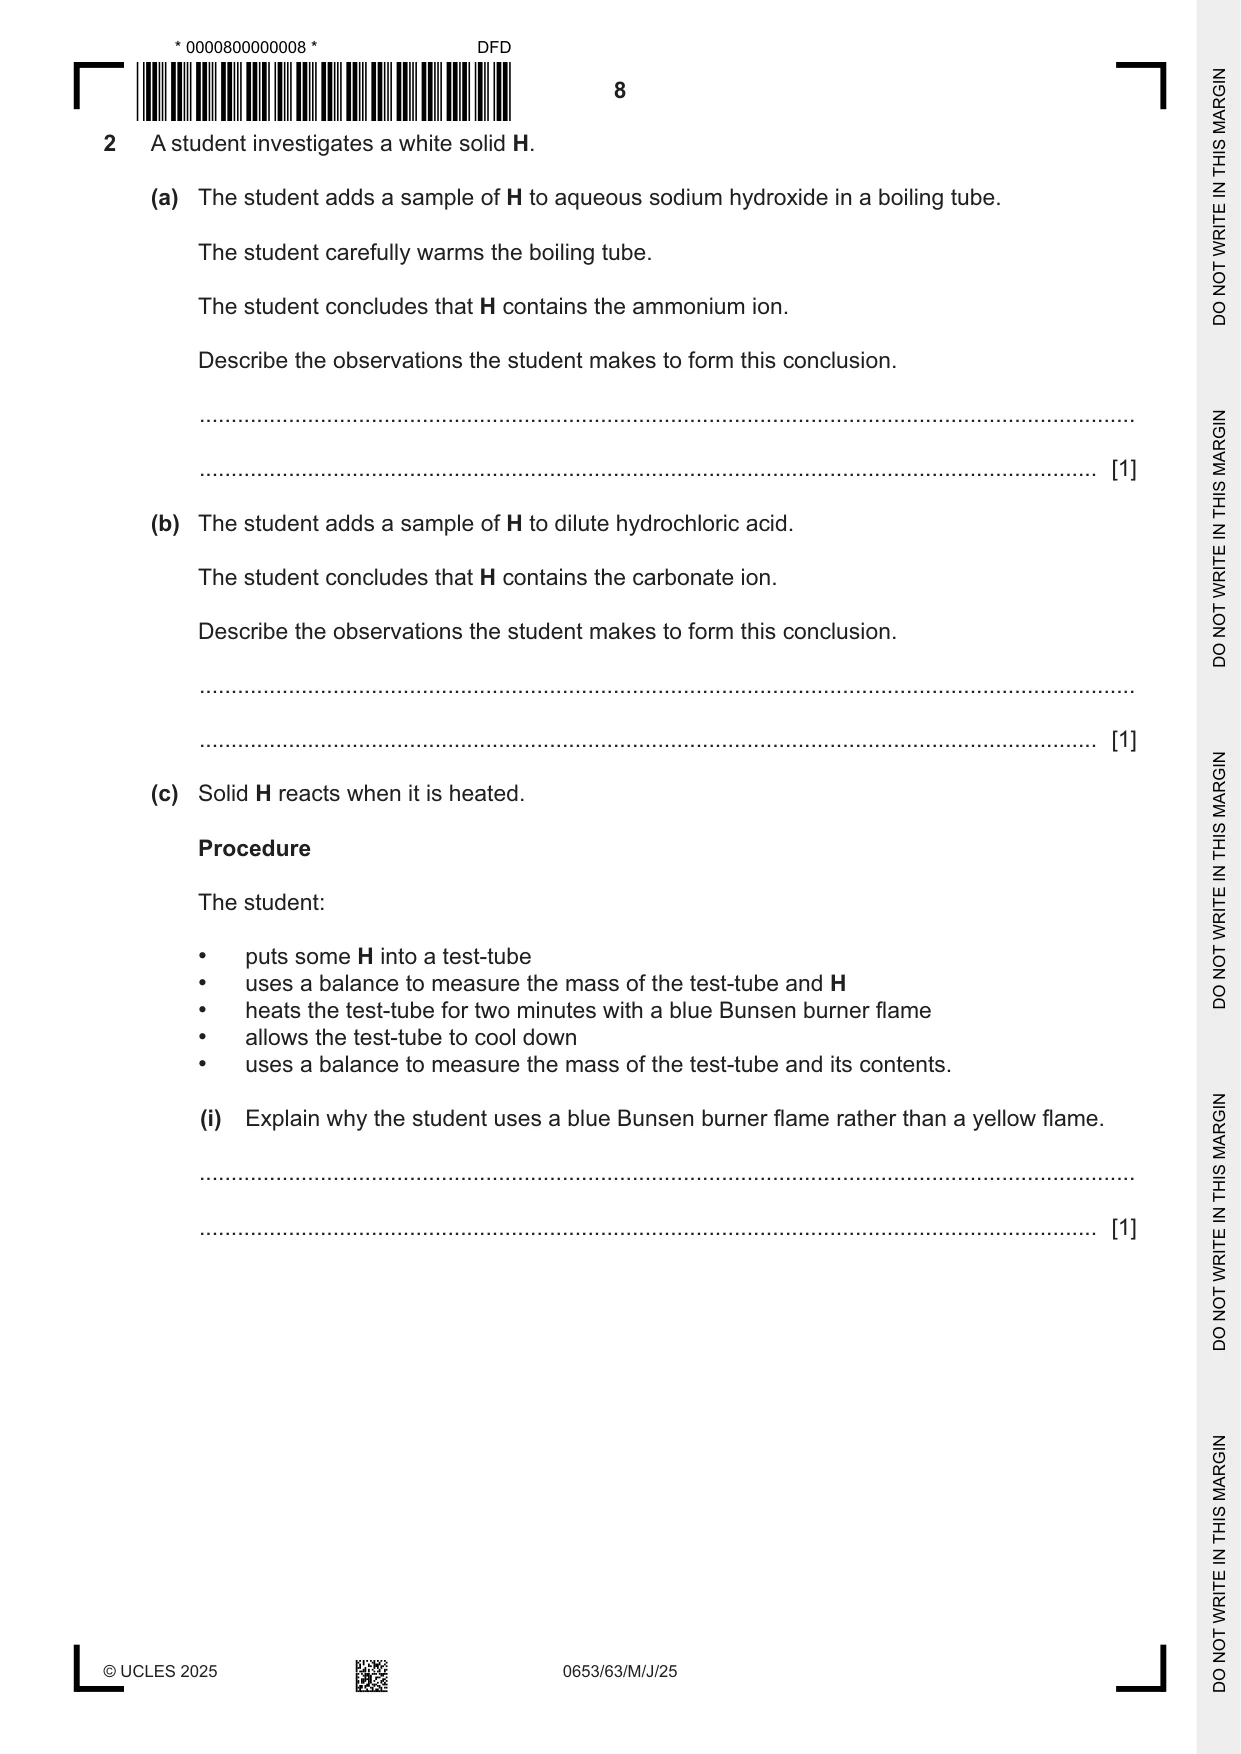
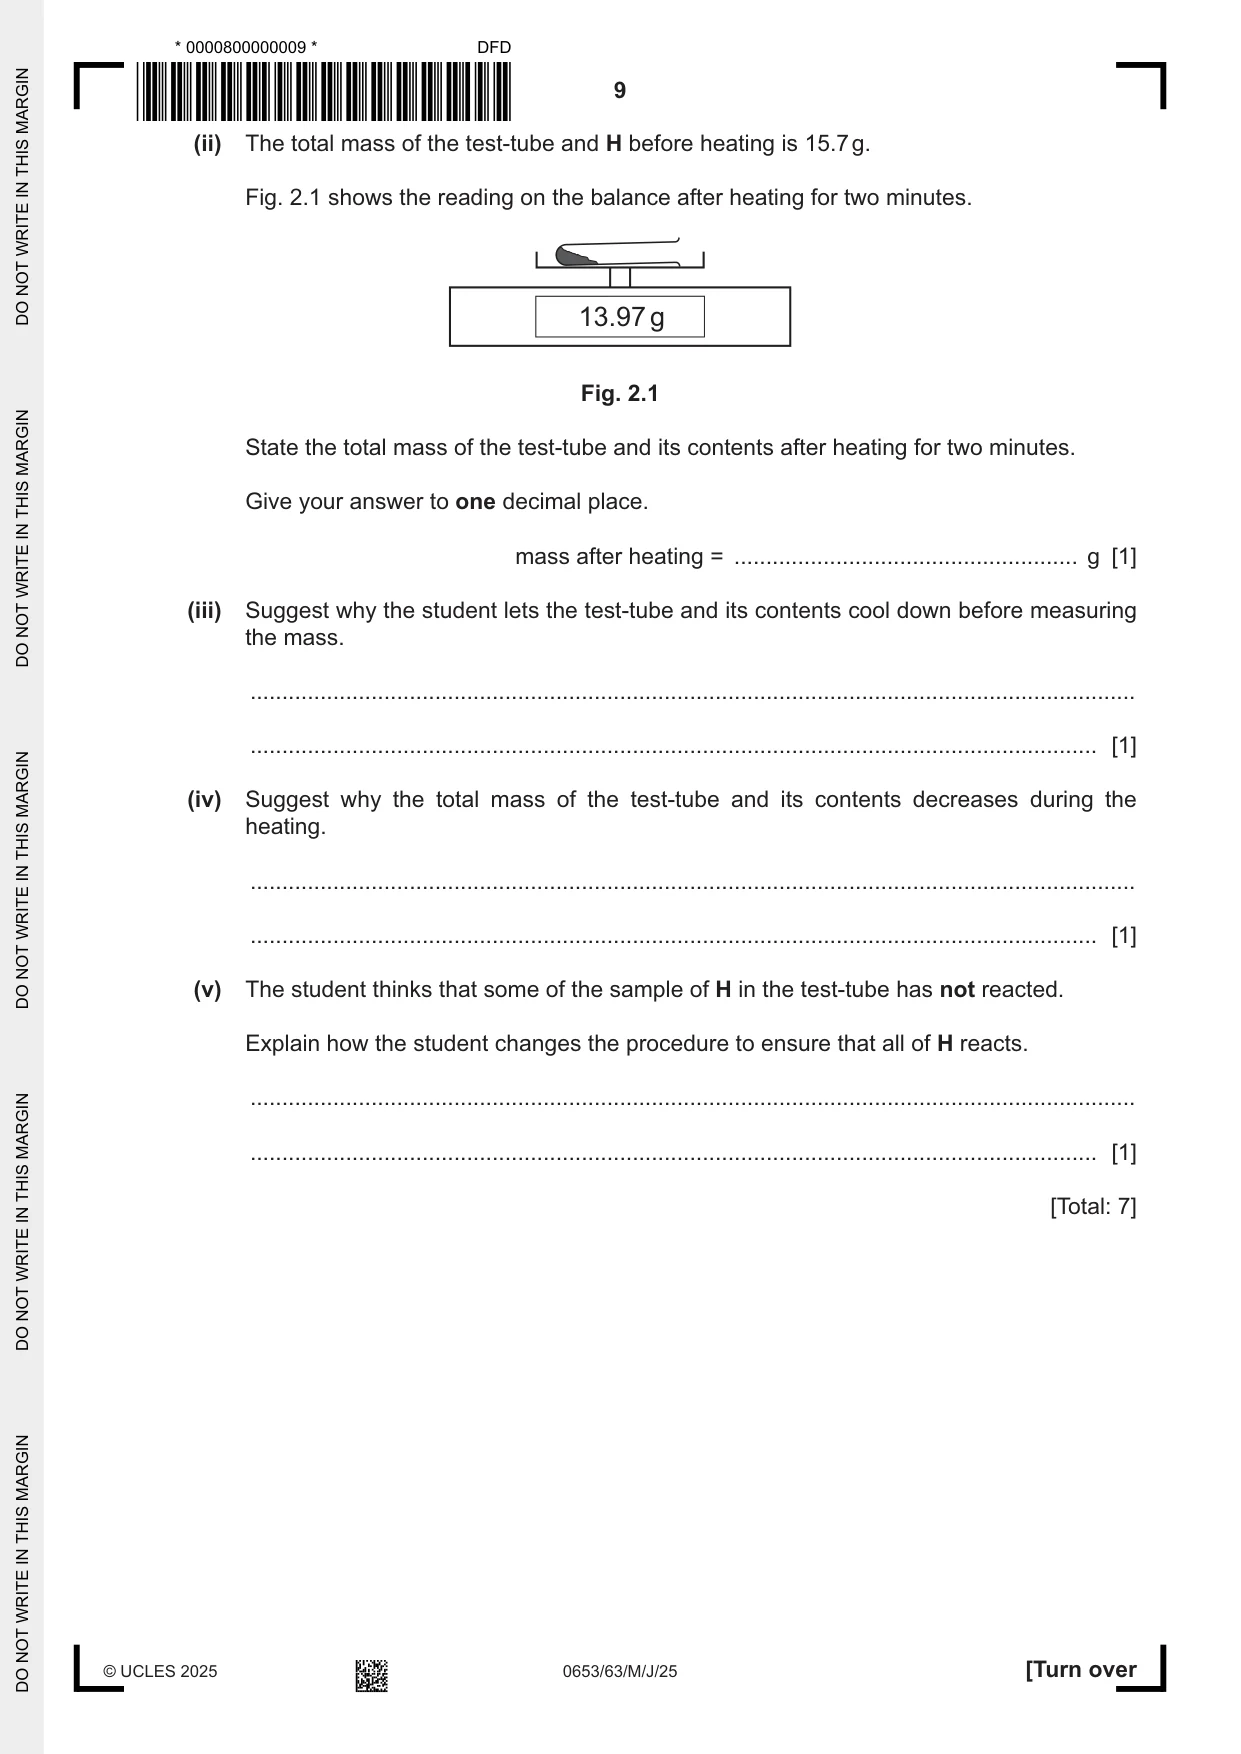
2 A student investigates a white solid H. (a) The student adds a sample of H to aqueous sodium hydroxide in a boiling tube. The student carefully warms the boiling tube. The student concludes that H contains the ammonium ion. Describe the observations the student makes to form this conclusion. ................................................................................................................................................... ............................................................................................................................................. [1] (b) The student adds a sample of H to dilute hydrochloric acid. The student concludes that H contains the carbonate ion. Describe the observations the student makes to form this conclusion. ................................................................................................................................................... ............................................................................................................................................. [1] (c) Solid H reacts when it is heated. Procedure The student: • puts some H into a test-tube • uses a balance to measure the mass of the test-tube and H • heats the test-tube for two minutes with a blue Bunsen burner flame • allows the test-tube to cool down • uses a balance to measure the mass of the test-tube and its contents. (i) Explain why the student uses a blue Bunsen burner flame rather than a yellow flame. ................................................................................................................................................... ............................................................................................................................................. [1] (ii) The total mass of the test-tube and H before heating is 15.7 g. Fig. 2.1 shows the reading on the balance after heating for two minutes. 13.97 g Fig. 2.1 State the total mass of the test-tube and its contents after heating for two minutes. Give your answer to one decimal place. mass after heating = ...................................................... g [1] (iii) Suggest why the student lets the test-tube and its contents cool down before measuring the mass. ........................................................................................................................................... ..................................................................................................................................... [1] (iv) Suggest why the total mass of the test-tube and its contents decreases during the heating. ........................................................................................................................................... ..................................................................................................................................... [1] (v) The student thinks that some of the sample of H in the test-tube has not reacted. Explain how the student changes the procedure to ensure that all of H reacts. ........................................................................................................................................... ..................................................................................................................................... [1] [Total: 7]
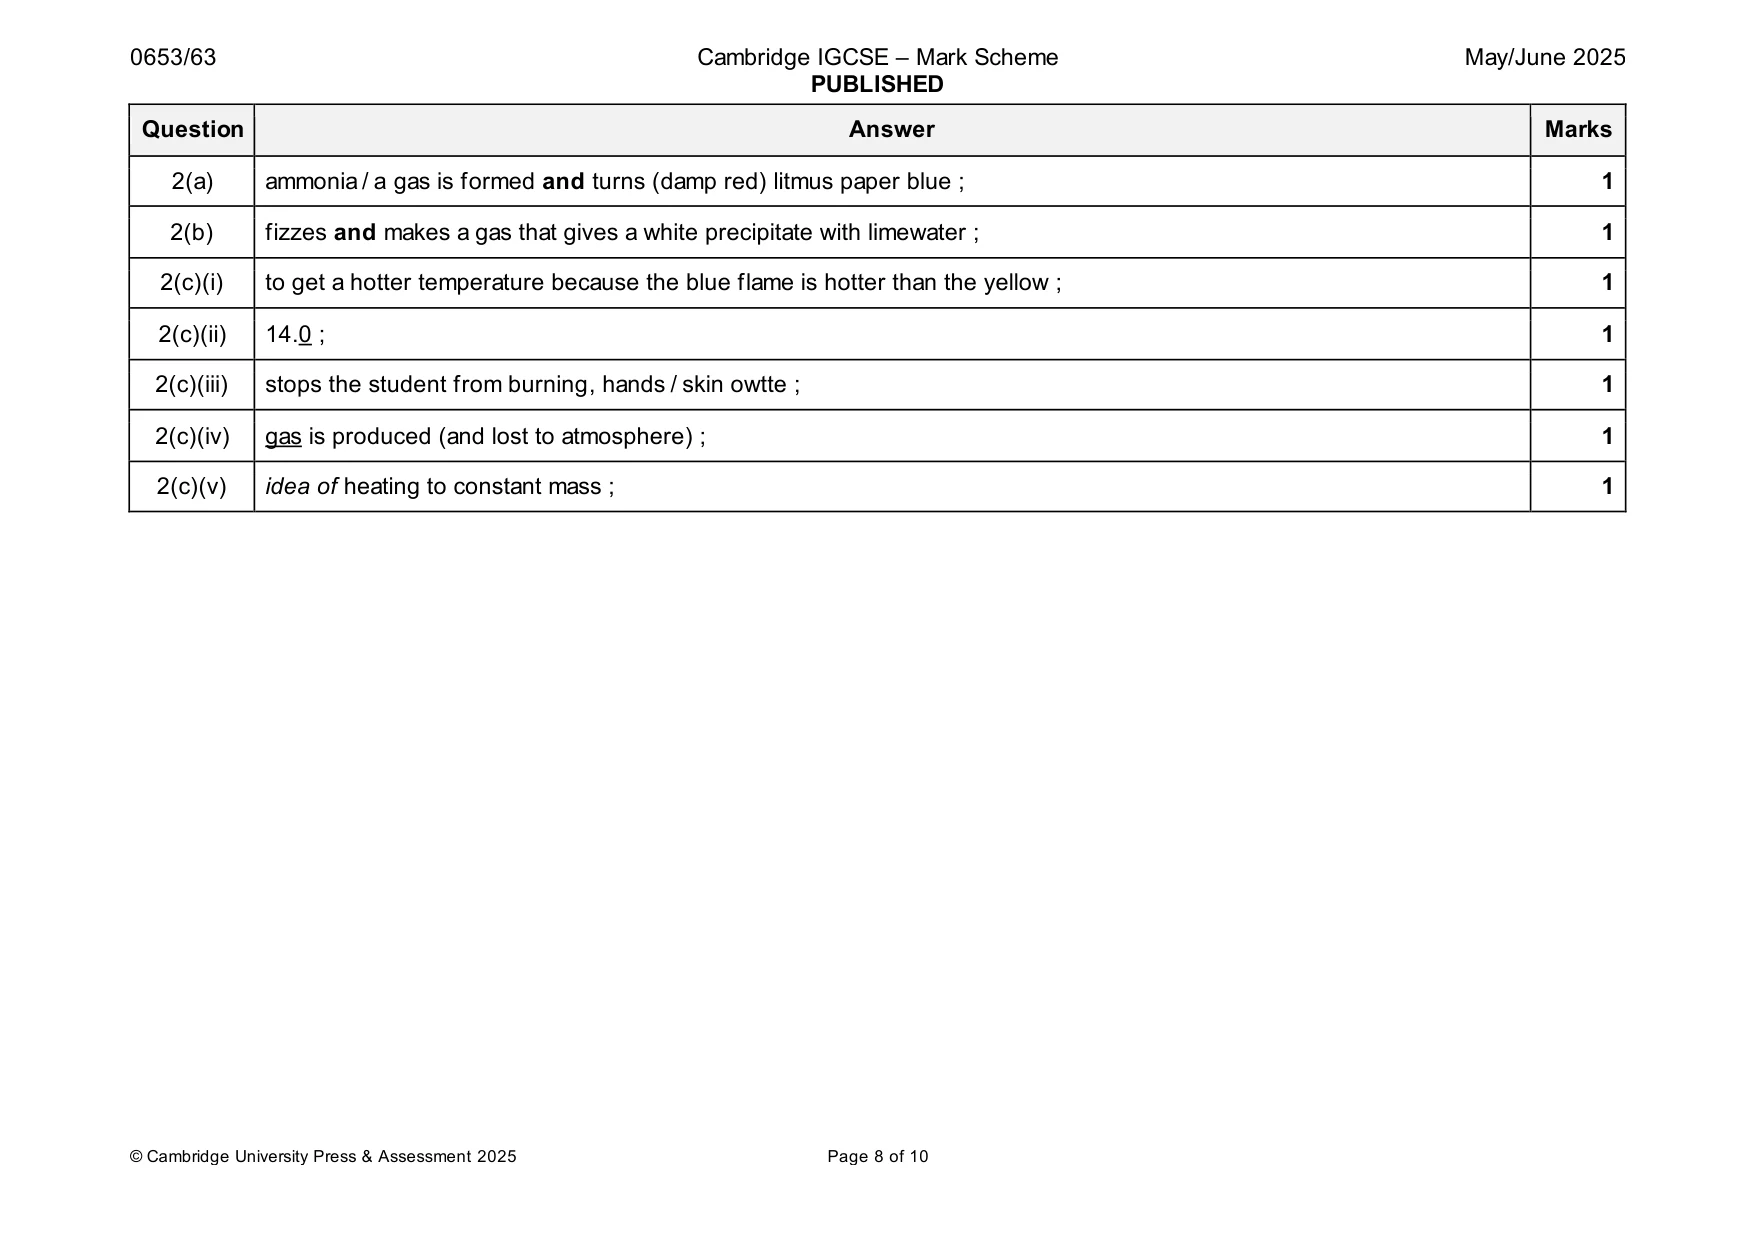
Mark scheme: 2(a) ammonia / a gas is formed and turns (damp red) litmus paper blue ; 1 2(b) fizzes and makes a gas that gives a white precipitate with limewater ; 1 2(c)(i) to get a hotter temperature because the blue flame is hotter than the yellow ; 1 2(c)(ii) 14.0 ; 1 2(c)(iii) stops the student from burning, hands / skin owtte ; 1 2(c)(iv) gas is produced (and lost to atmosphere) ; 1 2(c)(v) idea of heating to constant mass ; 1
Q3 · Aqueous ammonium carbonate reacts with aqueous barium nitrate to form a white precipitate…
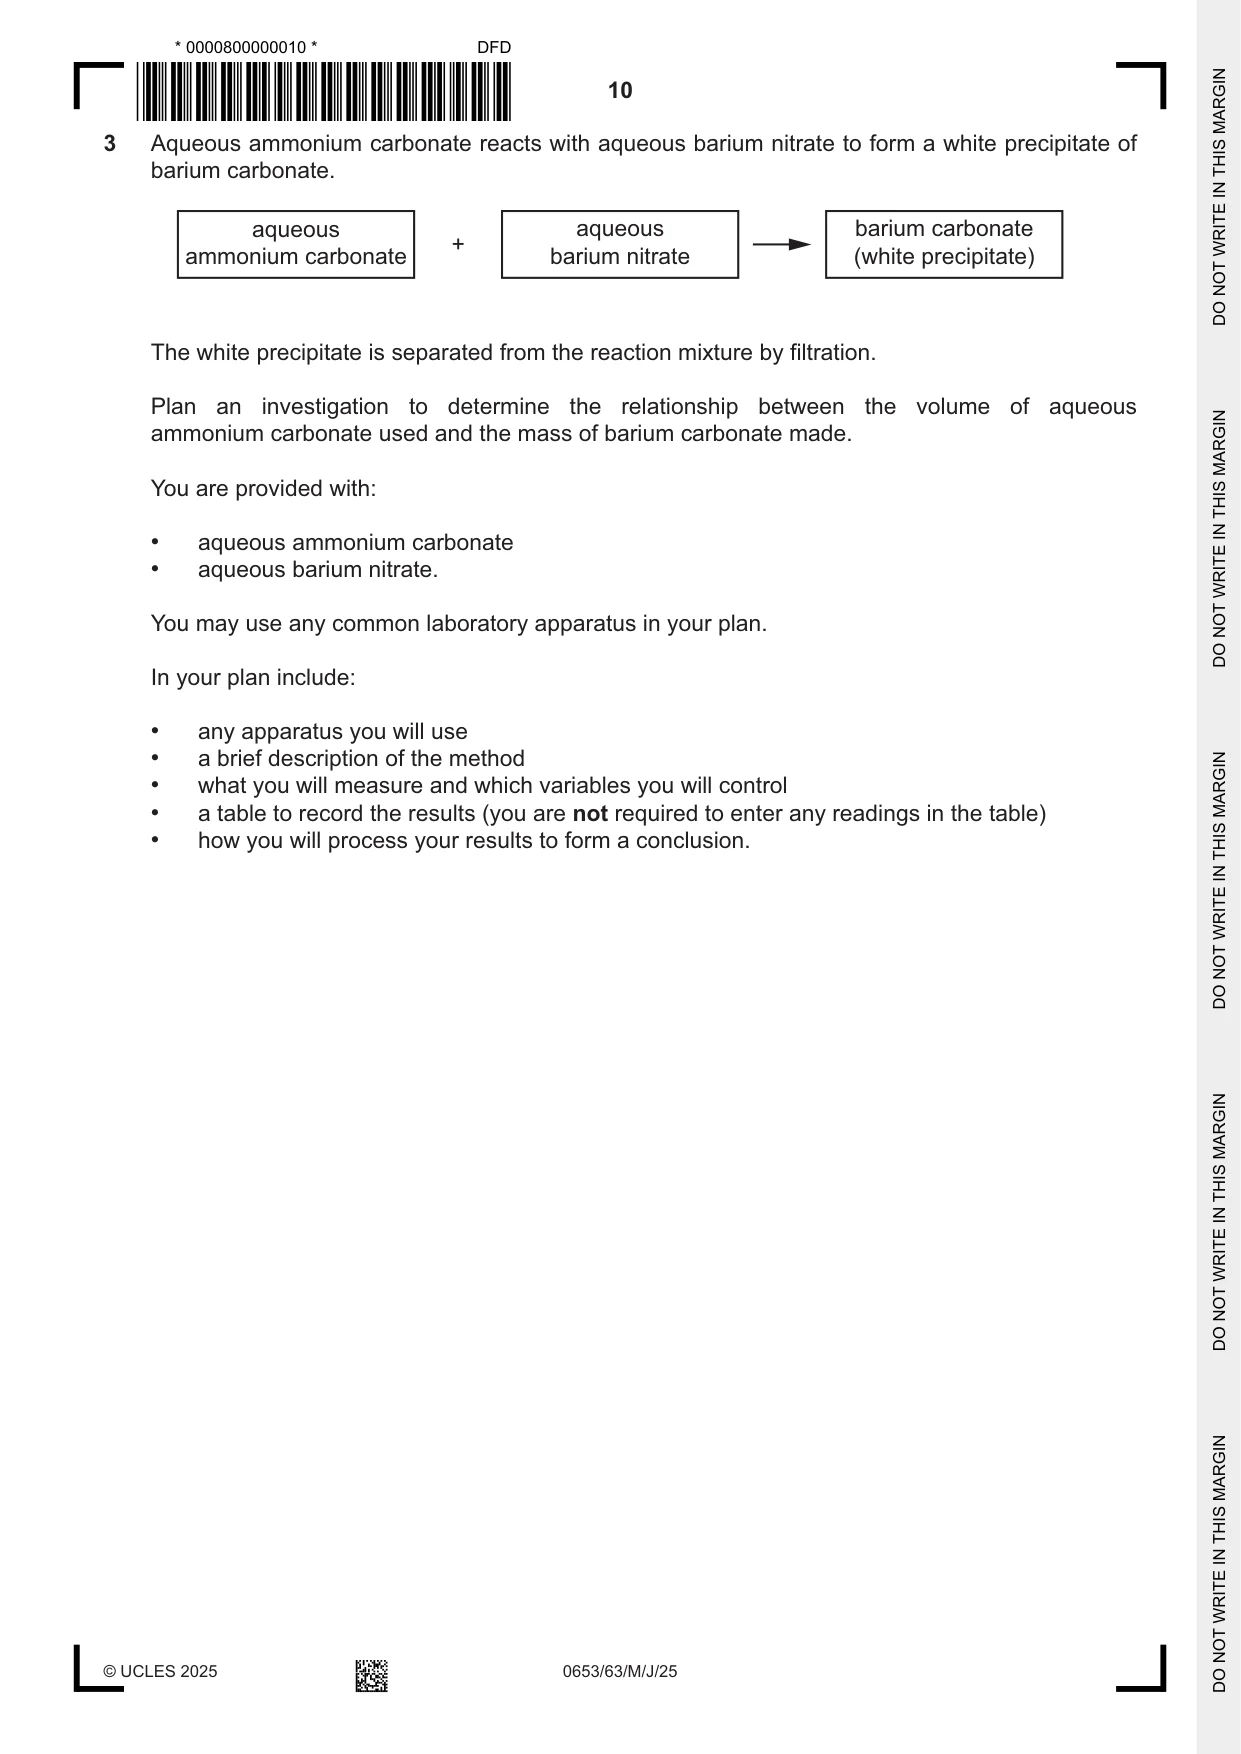
3 Aqueous ammonium carbonate reacts with aqueous barium nitrate to form a white precipitate of barium carbonate. aqueous aqueous barium carbonate + ammonium carbonate barium nitrate (white precipitate) The white precipitate is separated from the reaction mixture by filtration. Plan an investigation to determine the relationship between the volume of aqueous ammonium carbonate used and the mass of barium carbonate made. You are provided with: • aqueous ammonium carbonate • aqueous barium nitrate. You may use any common laboratory apparatus in your plan. In your plan include: • any apparatus you will use • a brief description of the method • what you will measure and which variables you will control • a table to record the results (you are not required to enter any readings in the table) • how you will process your results to form a conclusion. .......................................................................................................................................................... .......................................................................................................................................................... .......................................................................................................................................................... .......................................................................................................................................................... .......................................................................................................................................................... .......................................................................................................................................................... .......................................................................................................................................................... .......................................................................................................................................................... .......................................................................................................................................................... .......................................................................................................................................................... .......................................................................................................................................................... .......................................................................................................................................................... .......................................................................................................................................................... .................................................................................................................................................... [7]
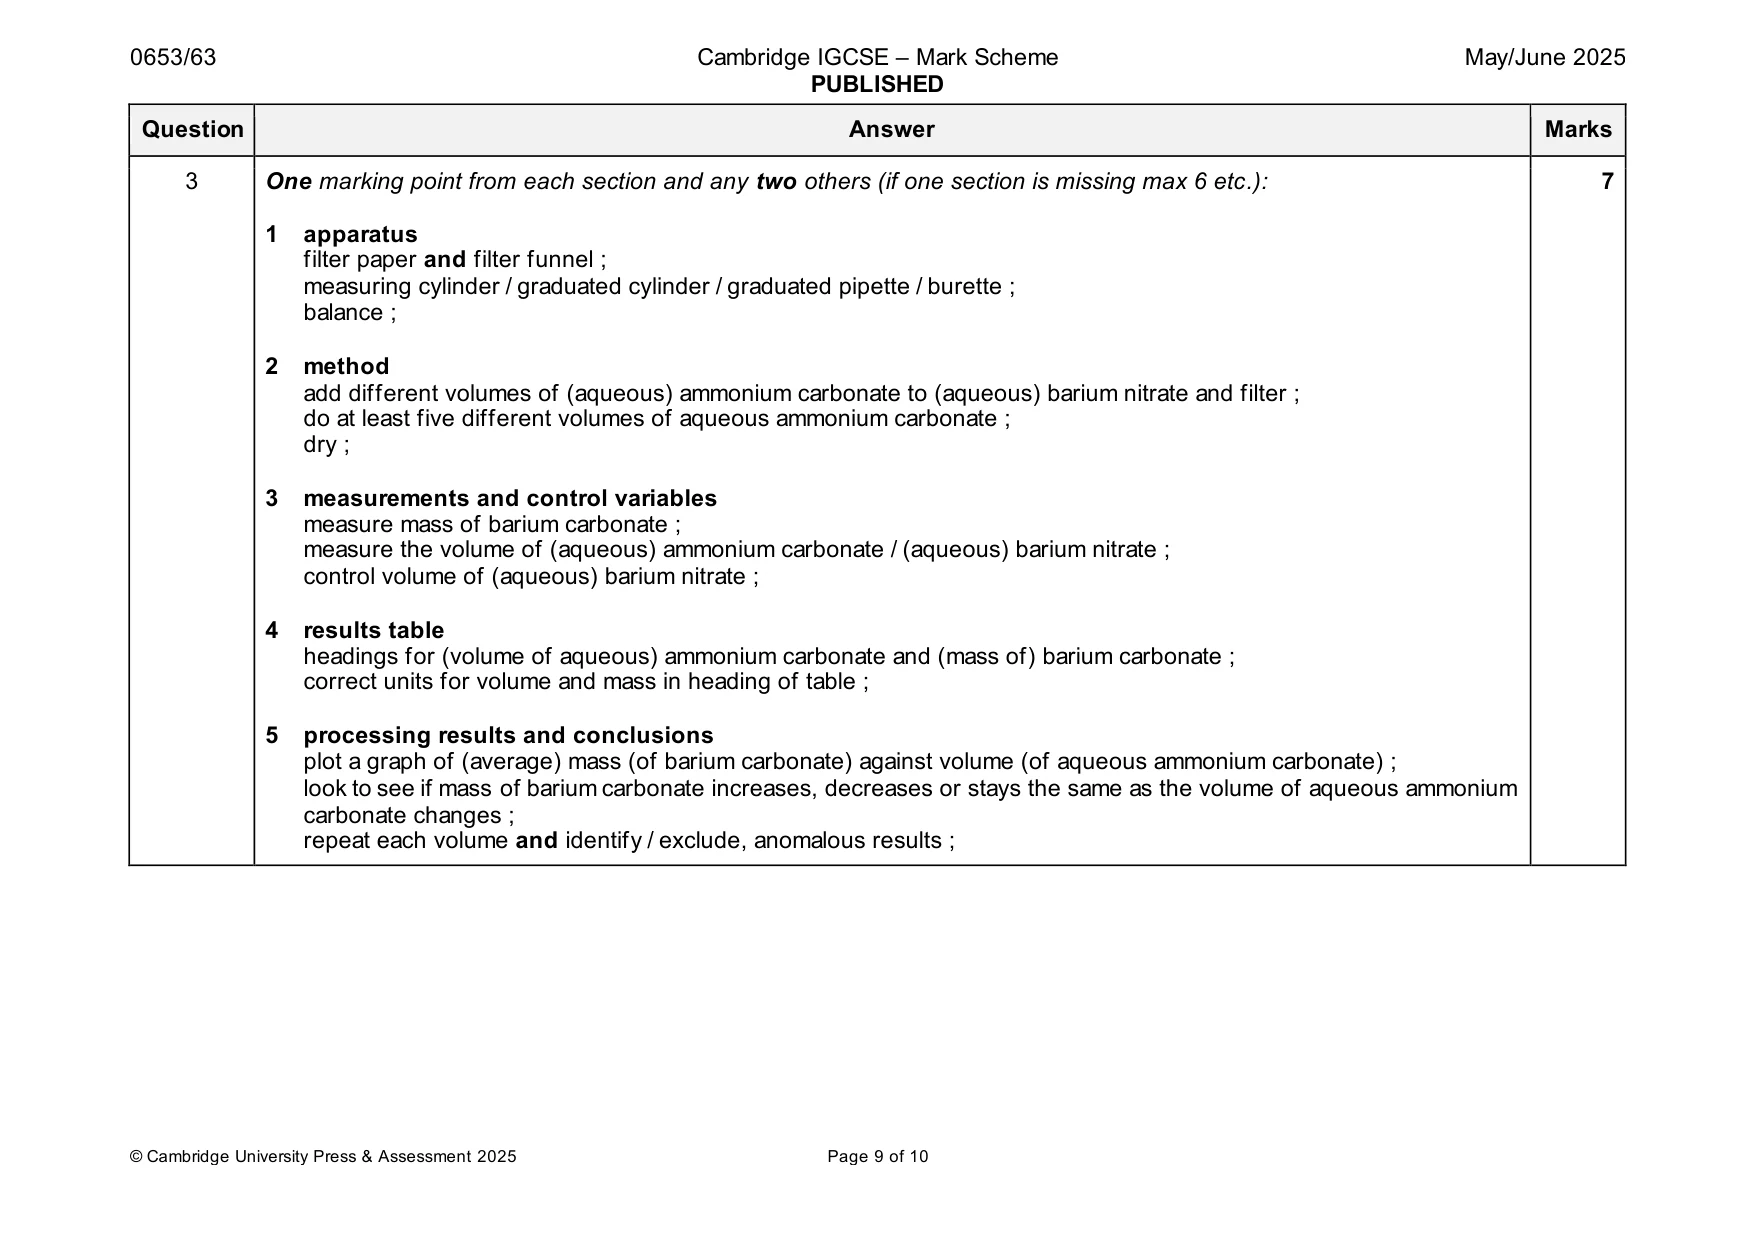
Mark scheme: 3 One marking point from each section and any two others (if one section is missing max 6 etc.): 7 1 apparatus filter paper and filter funnel ; measuring cylinder / graduated cylinder / graduated pipette / burette ; balance ; 2 method add different volumes of (aqueous) ammonium carbonate to (aqueous) barium nitrate and filter ; do at least five different volumes of aqueous ammonium carbonate ; dry ; 3 measurements and control variables measure mass of barium carbonate ; measure the volume of (aqueous) ammonium carbonate / (aqueous) barium nitrate ; control volume of (aqueous) barium nitrate ; 4 results table headings for (volume of aqueous) ammonium carbonate and (mass of) barium carbonate ; correct units for volume and mass in heading of table ; 5 processing results and conclusions plot a graph of (average) mass (of barium carbonate) against volume (of aqueous ammonium carbonate) ; look to see if mass of barium carbonate increases, decreases or stays the same as the volume of aqueous ammonium carbonate changes ; repeat each volume and identify / exclude, anomalous results ;
Q4 · A student investigates the rate of cooling of hot water in two glass beakers P and Q
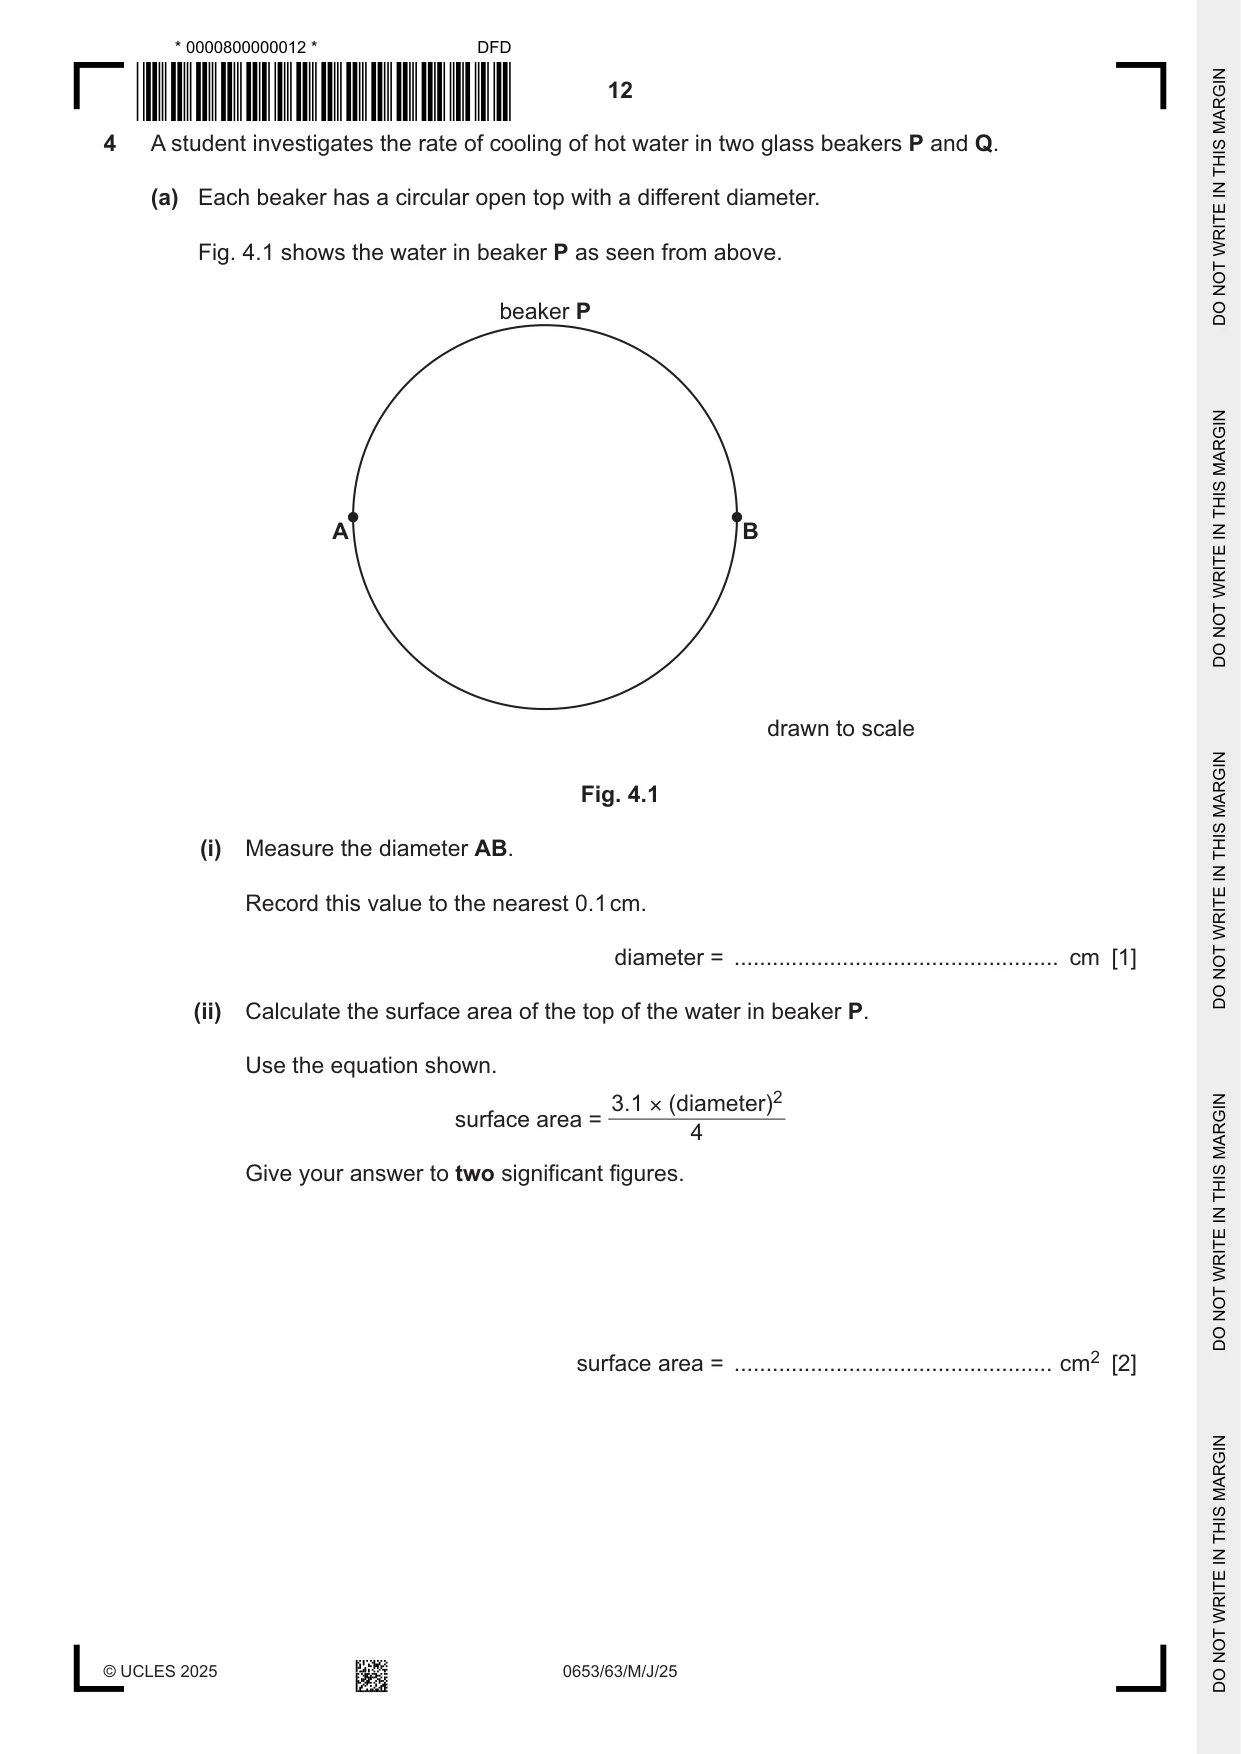
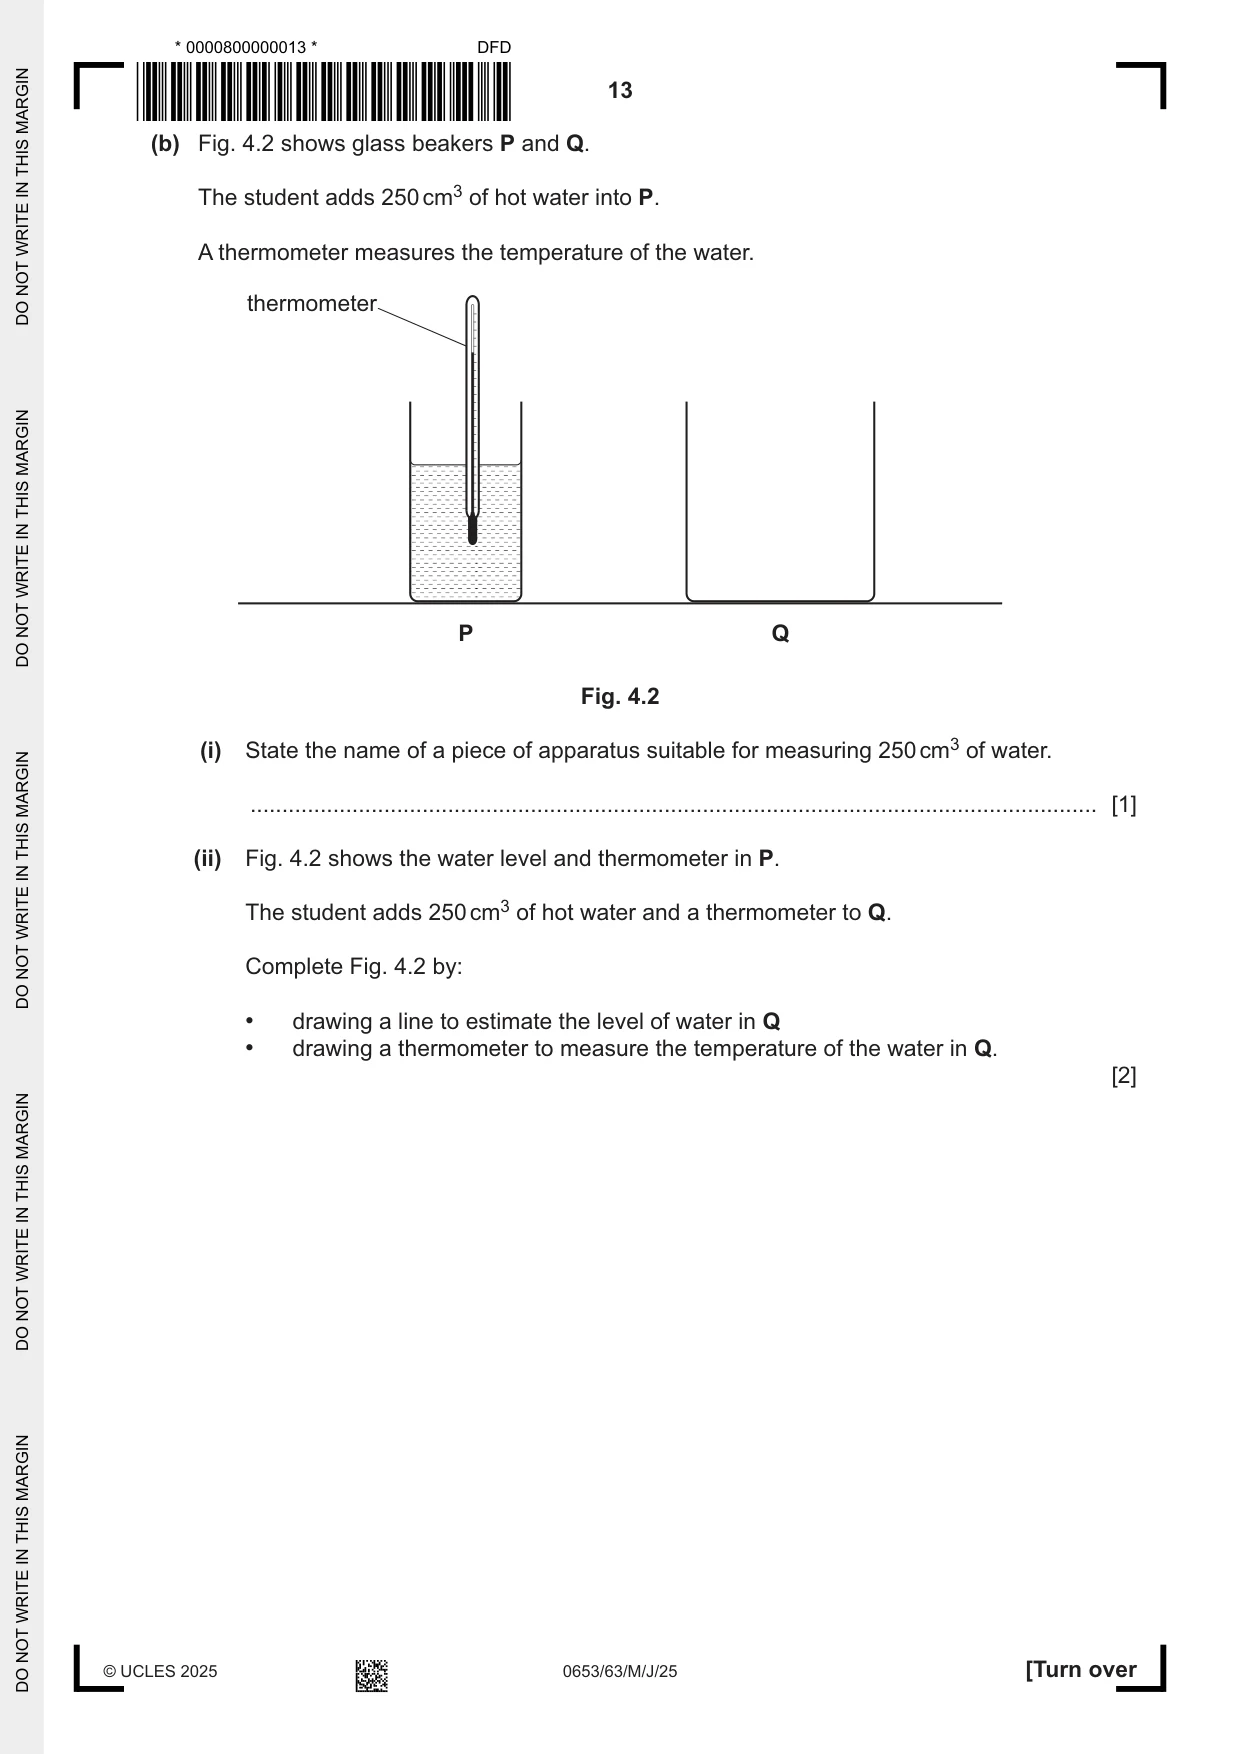
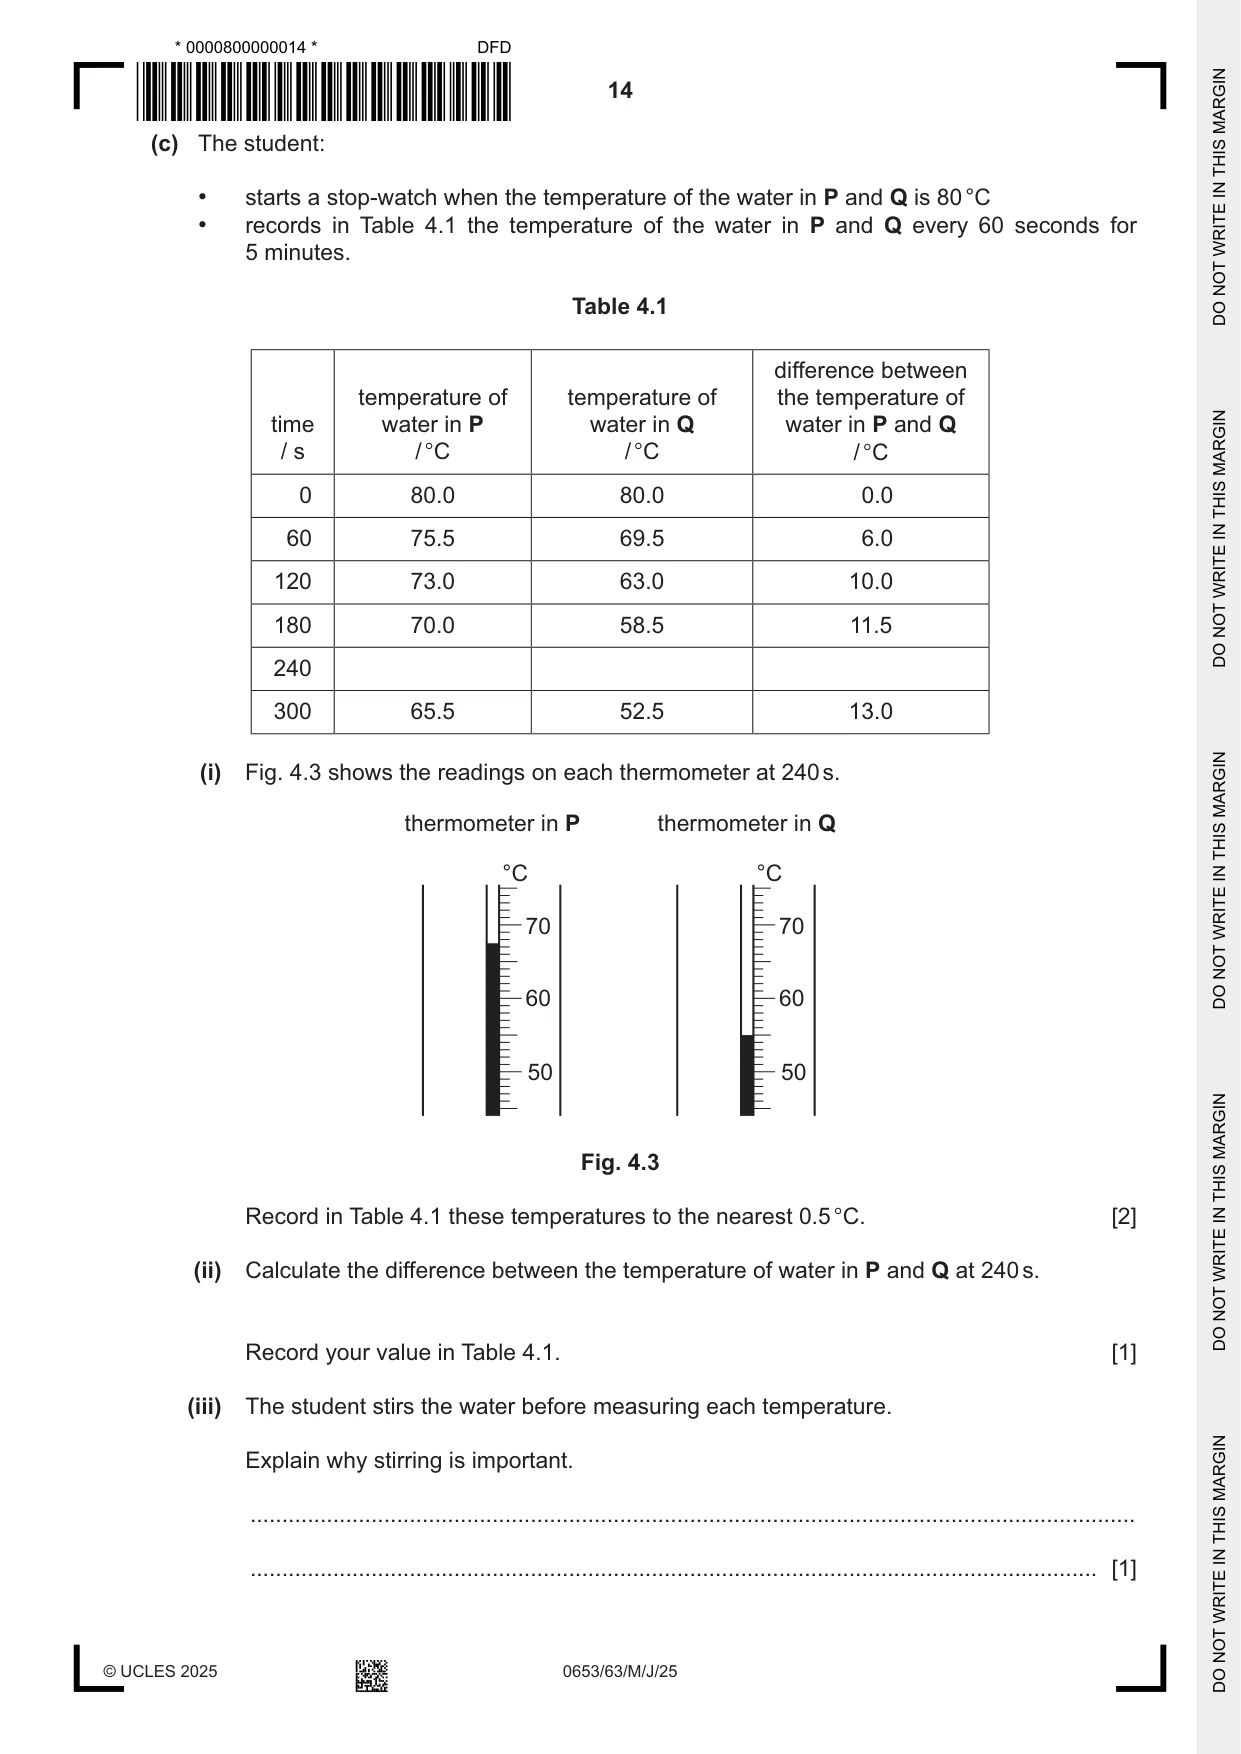
4 A student investigates the rate of cooling of hot water in two glass beakers P and Q. (a) Each beaker has a circular open top with a different diameter. Fig. 4.1 shows the water in beaker P as seen from above. beaker P A B drawn to scale Fig. 4.1 (i) Measure the diameter AB. Record this value to the nearest 0.1 cm. diameter = ................................................... cm [1] (ii) Calculate the surface area of the top of the water in beaker P. Use the equation shown. 3.1 × (diameter)2 surface area = 4 Give your answer to two significant figures. surface area = .................................................. cm2 [2] (b) Fig. 4.2 shows glass beakers P and Q. The student adds 250 cm3 of hot water into P. A thermometer measures the temperature of the water. thermometer P Q Fig. 4.2 (i) State the name of a piece of apparatus suitable for measuring 250 cm3 of water. ..................................................................................................................................... [1] (ii) Fig. 4.2 shows the water level and thermometer in P. The student adds 250 cm3 of hot water and a thermometer to Q. Complete Fig. 4.2 by: • drawing a line to estimate the level of water in Q • drawing a thermometer to measure the temperature of the water in Q. [2] (c) The student: • starts a stop-watch when the temperature of the water in P and Q is 80 °C • records in Table 4.1 the temperature of the water in P and Q every 60 seconds for 5 minutes. Table 4.1 difference between temperature of temperature of the temperature of time water in P water in Q water in P and Q / s / °C / °C / °C 0 80.0 80.0 0.0 60 75.5 69.5 6.0 120 73.0 63.0 10.0 180 70.0 58.5 11.5 240 300 65.5 52.5 13.0 (i) Fig. 4.3 shows the readings on each thermometer at 240 s. thermometer in P thermometer in Q °C °C 70 70 60 60 50 50 Fig. 4.3 Record in Table 4.1 these temperatures to the nearest 0.5 °C. [2] (ii) Calculate the difference between the temperature of water in P and Q at 240 s. Record your value in Table 4.1. [1] (iii) The student stirs the water before measuring each temperature. Explain why stirring is important. ........................................................................................................................................... ..................................................................................................................................... [1]
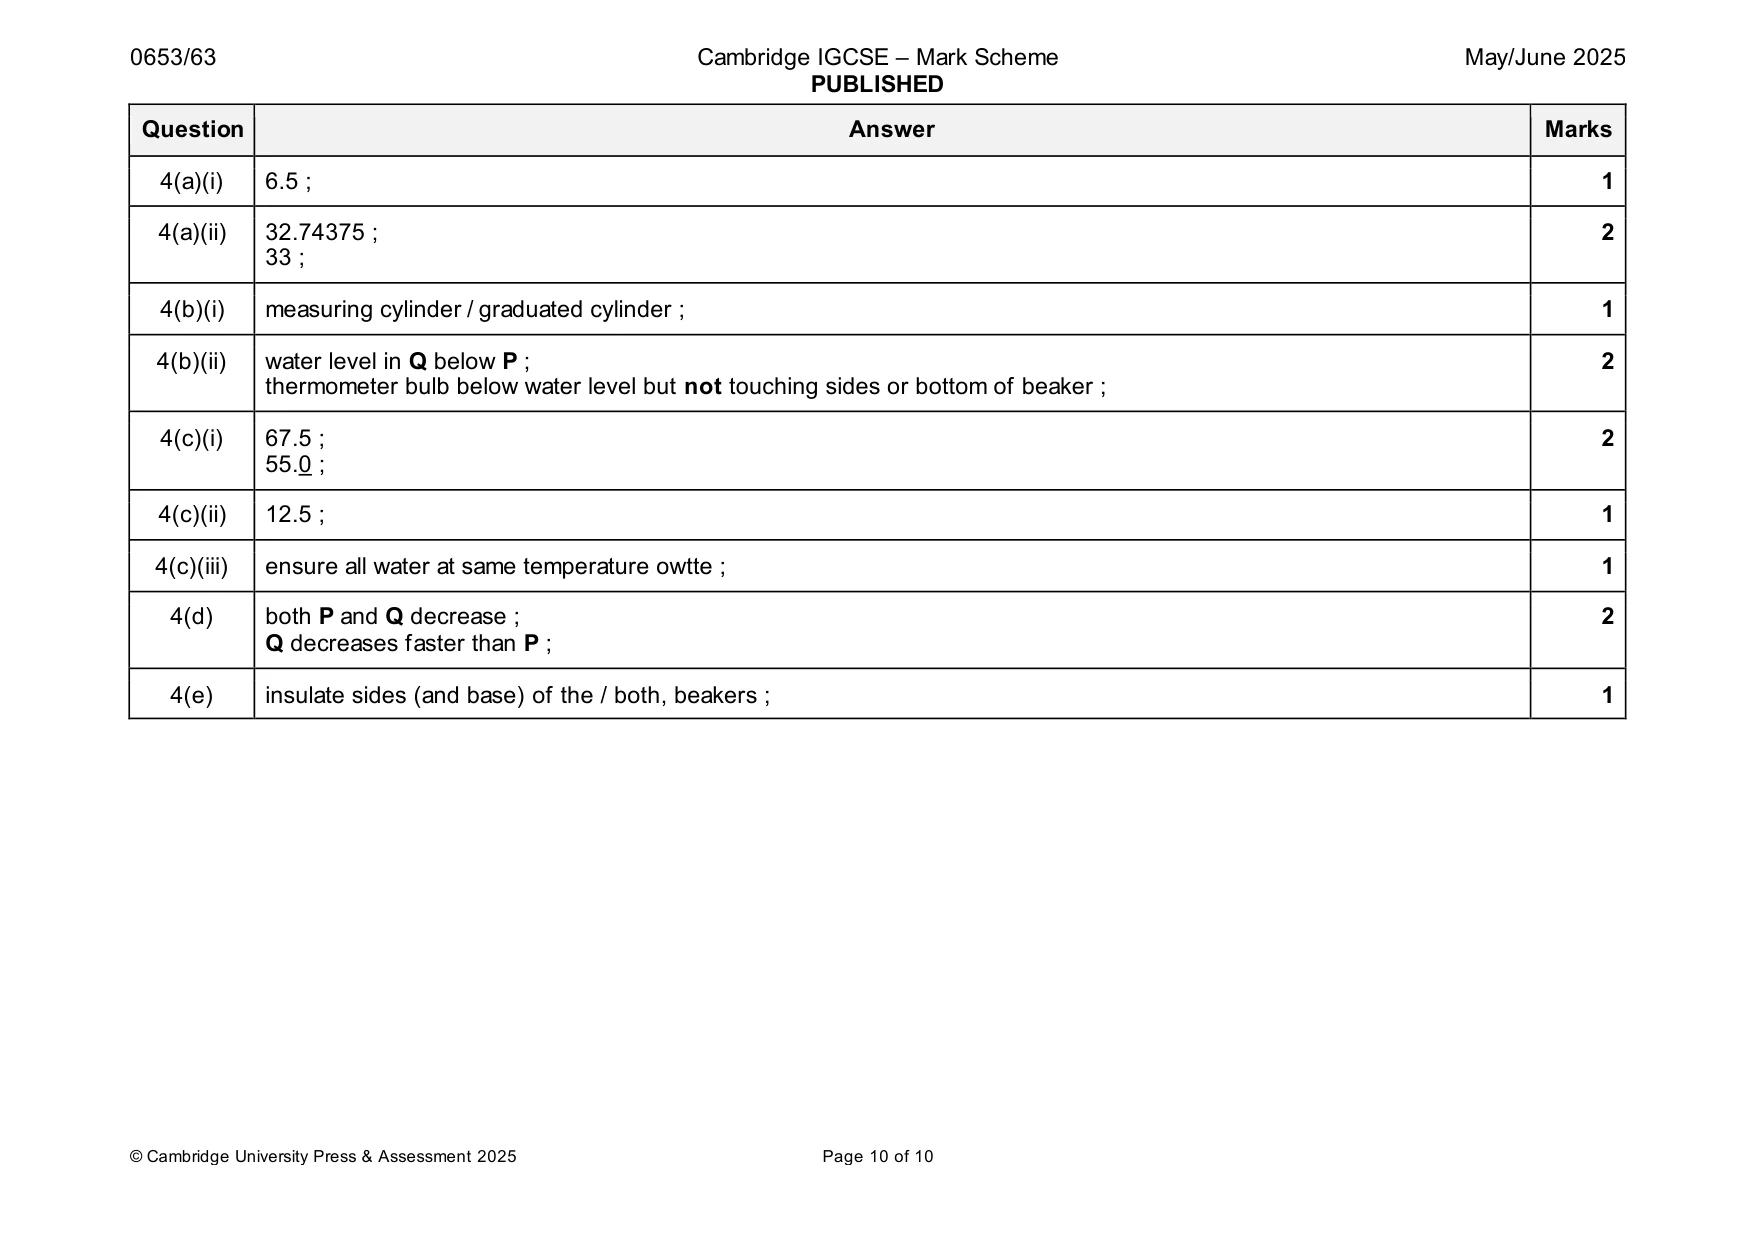
Mark scheme: 4(a)(i) 6.5 ; 1 4(a)(ii) 32.74375 ; 2 33 ; 4(b)(i) measuring cylinder / graduated cylinder ; 1 4(b)(ii) water level in Q below P ; 2 thermometer bulb below water level but not touching sides or bottom of beaker ; 4(c)(i) 67.5 ; 2 55.0 ; 4(c)(ii) 12.5 ; 1 4(c)(iii) ensure all water at same temperature owtte ; 1 4(d) both P and Q decrease ; 2 Q decreases faster than P ; 4(e) insulate sides (and base) of the / both, beakers ; 1
More questions on Physical quantities and measurement techniques
What was in this paper
The subtopics covered by these 4 questions, and how many questions each got. Open one in a new tab to see every Cambridge question on it.
What you needed in this session
Cambridge’s own grade thresholds for 2025 May/June, Paper 6 · Variant 3. A higher threshold means an easier paper — the bar moves with how the cohort did.