Cambridge IGCSE Science - Combined 0653 — 2024 Oct/Nov Paper 6 · Variant 3
0653/63/O/N/24 · 4 questions · 40 marks · ≈45 min
The question paper and its mark scheme, free to read here and free to download. This is Cambridge’s own paper, exactly as it was sat.
Question paper16 pages



Mark scheme8 pages
Answers below. Sit the paper first if you are practising.
Questions as text
Q1 · A student investigates phototropism in a plant
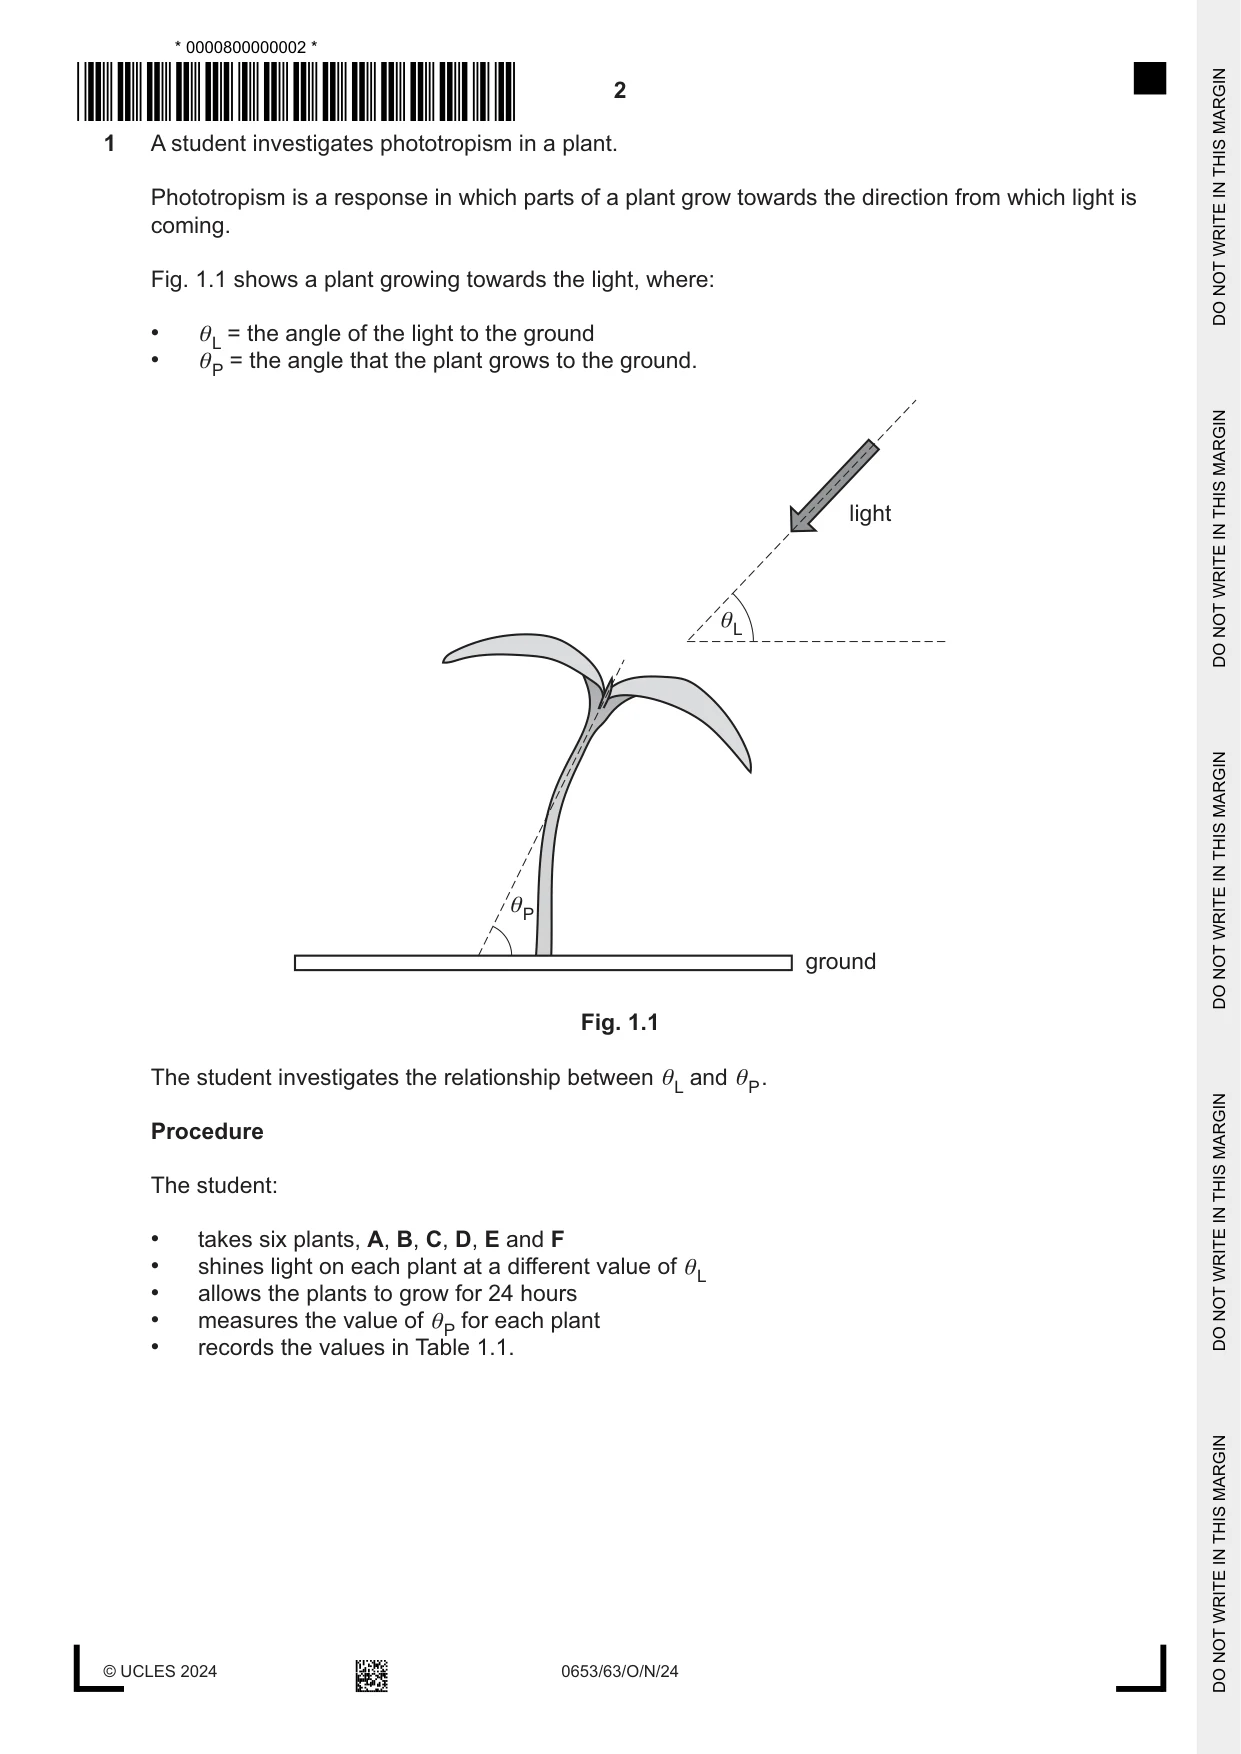
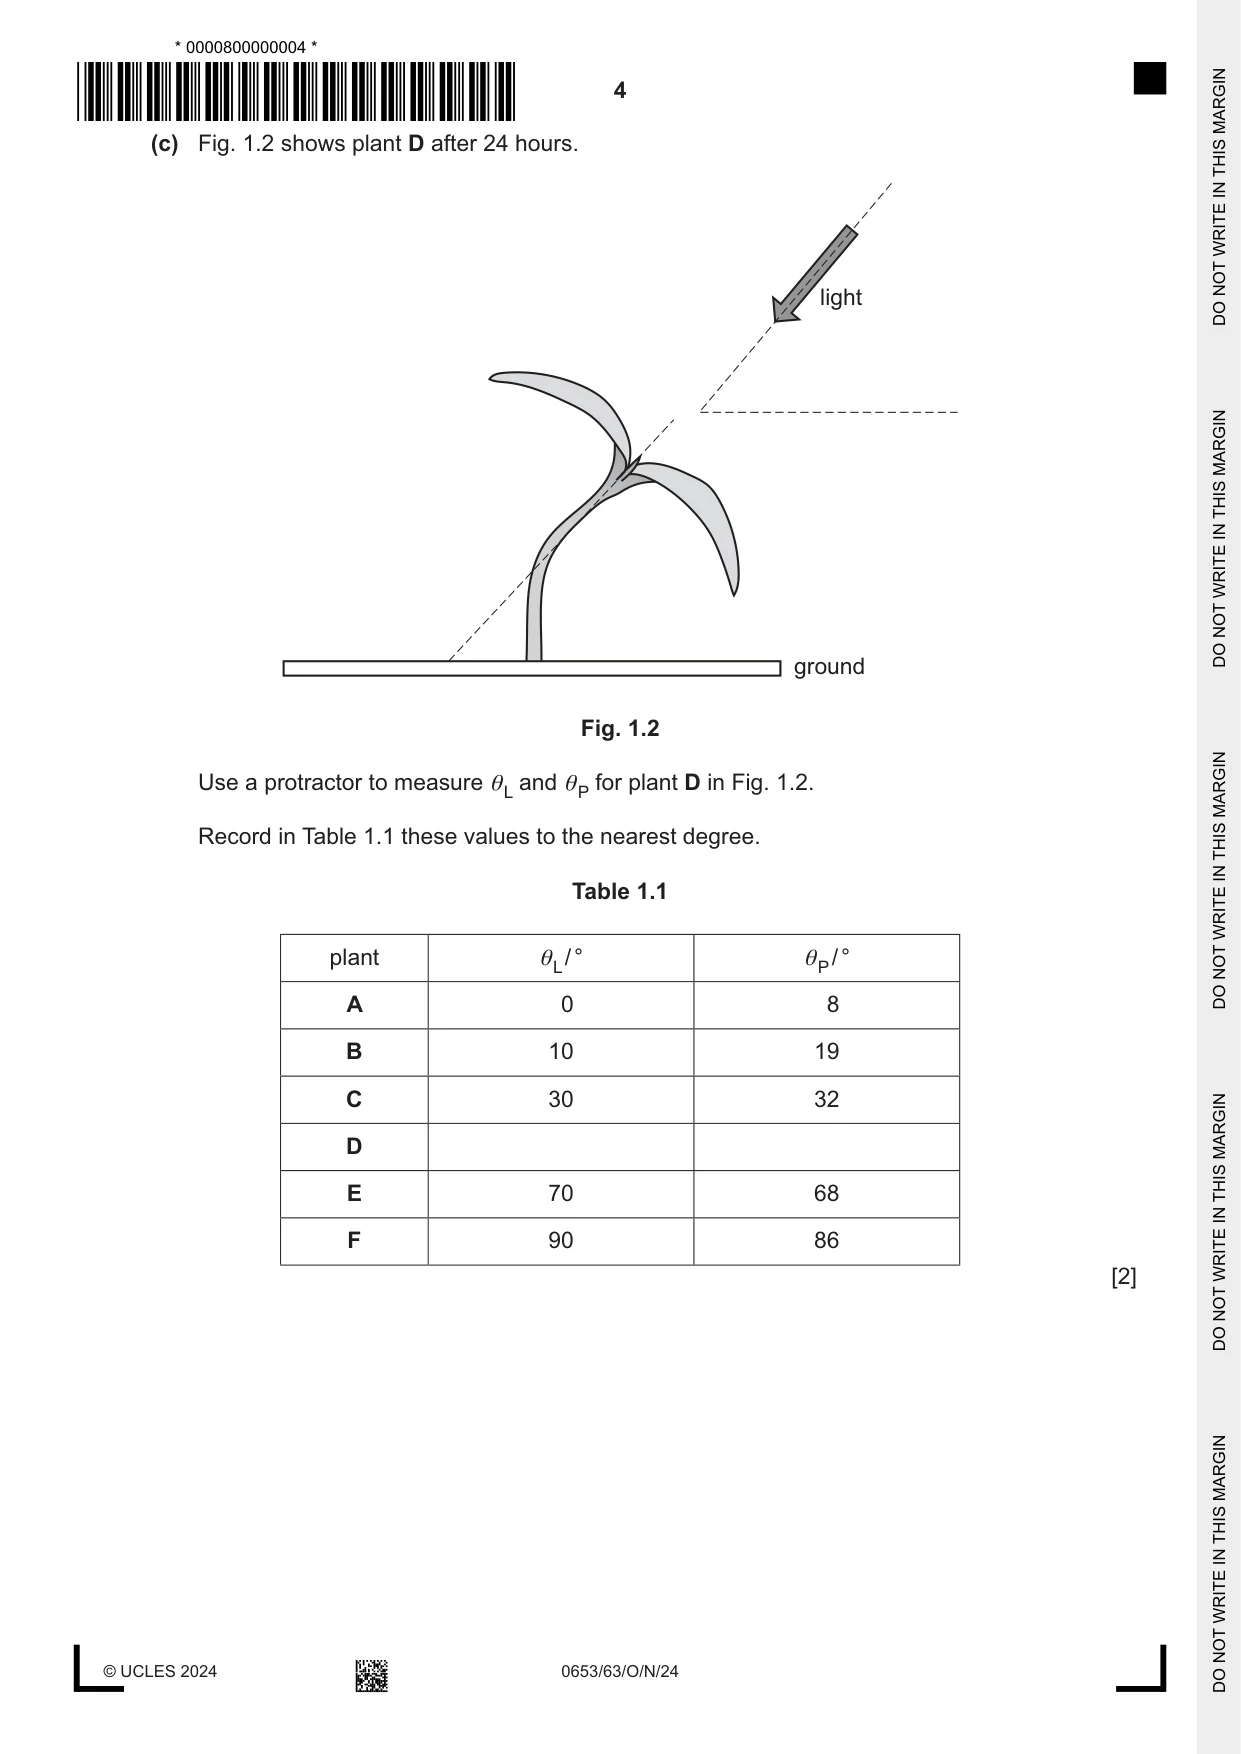
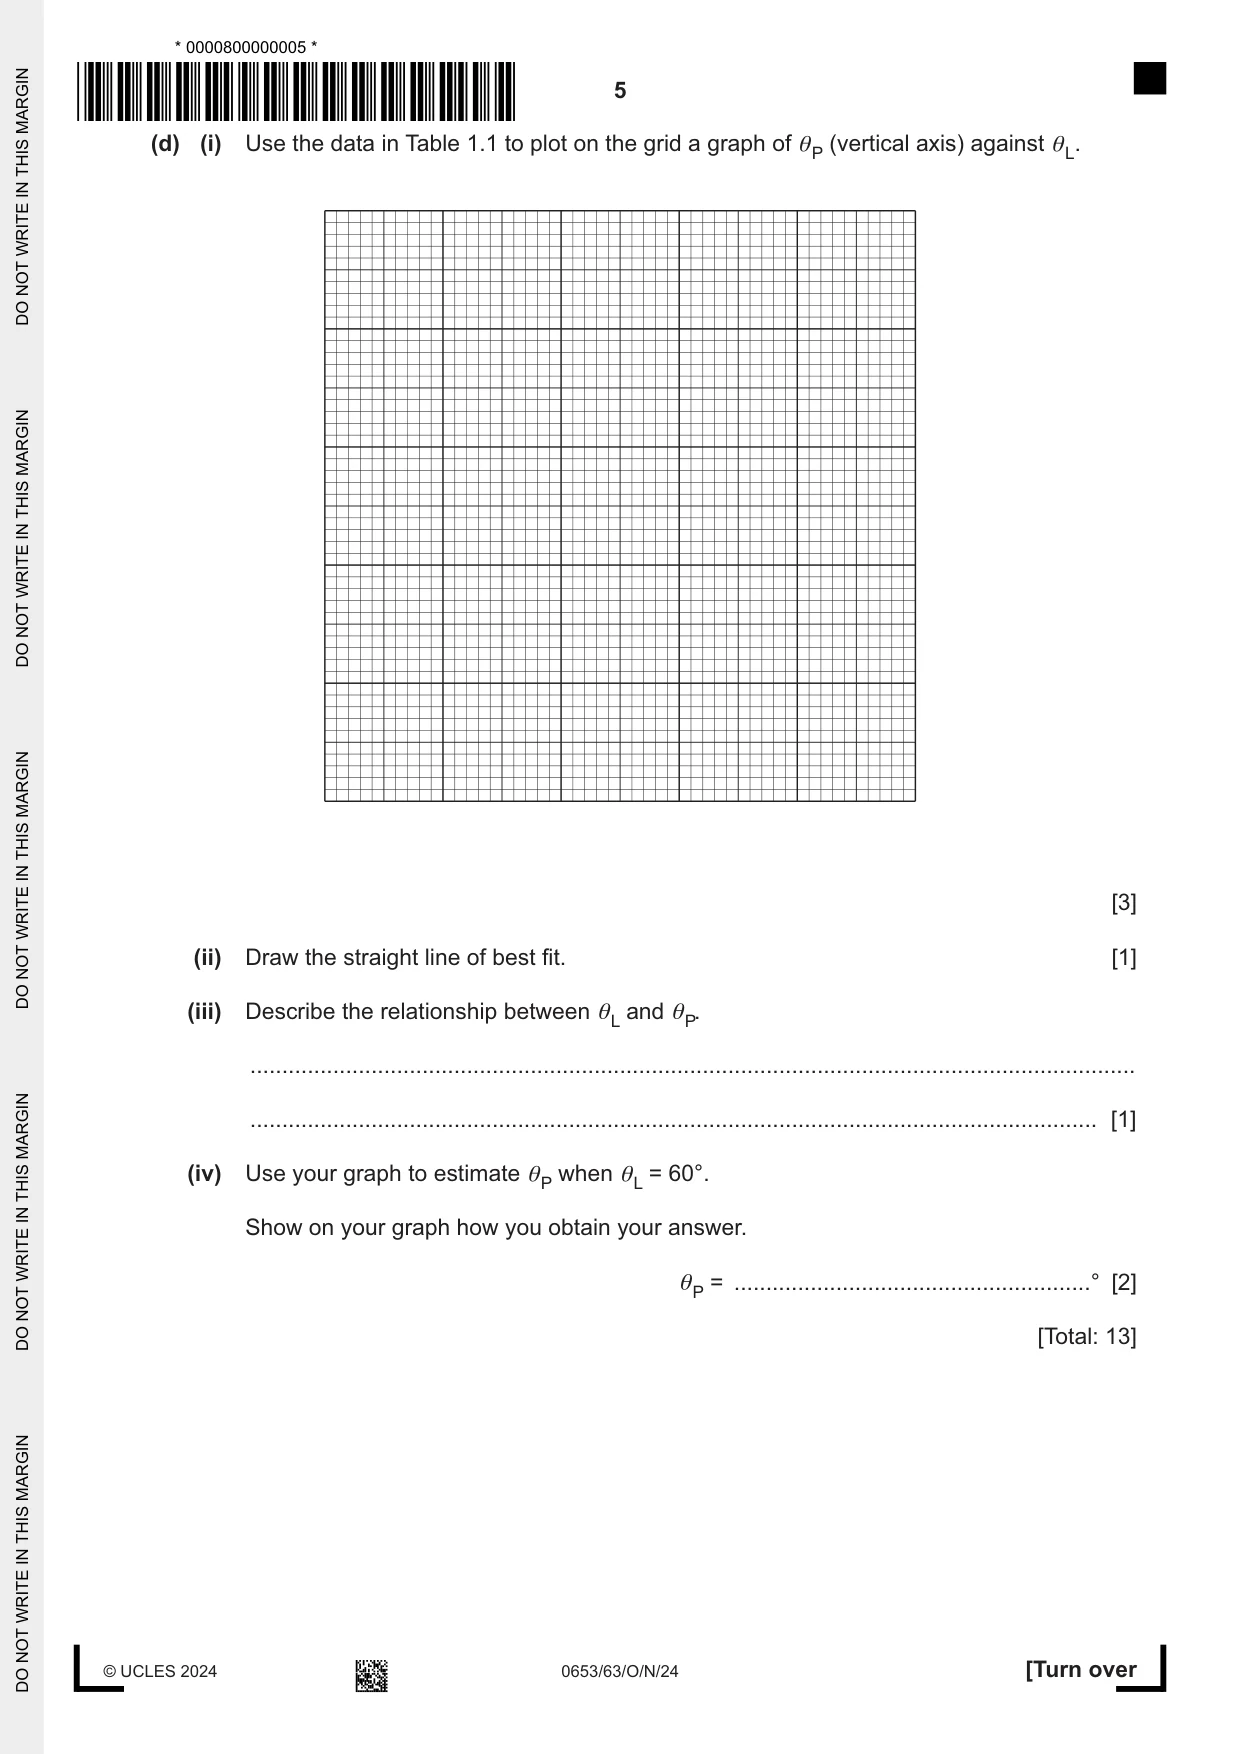
1 A student investigates phototropism in a plant. Phototropism is a response in which parts of a plant grow towards the direction from which light is coming. Fig. 1.1 shows a plant growing towards the light, where: • θ = the angle of the light to the ground L • θ = the angle that the plant grows to the ground. P light θL θP ground Fig. 1.1 The student investigates the relationship between θ and L θ P . Procedure The student: • takes six plants, A, B, C, D, E and F • shines light on each plant at a different value of θ L • allows the plants to grow for 24 hours • measures the value of θ for each plant P • records the values in Table 1.1. (a) The plants are left for 24 hours before θ is measured. P Suggest why the plants are left for 24 hours. ................................................................................................................................................... ............................................................................................................................................. [1] (b) The student states: For a fair test, the light intensity is kept constant during the investigation, and the same light intensity is used for each plant. (i) Explain why keeping the light intensity constant in this way makes it a fair test. ........................................................................................................................................... ........................................................................................................................................... ..................................................................................................................................... [1] (ii) Suggest one way that the student makes sure that the light intensity is kept constant. ........................................................................................................................................... ........................................................................................................................................... ..................................................................................................................................... [1] (iii) Suggest one other factor that is kept constant in this investigation. ..................................................................................................................................... [1] (c) Fig. 1.2 shows plant D after 24 hours. light ground Fig. 1.2 Use a protractor to measure θ and θ for plant D in Fig. 1.2. L P Record in Table 1.1 these values to the nearest degree. Table 1.1 plant θ / ° θ / ° L P A 0 8 B 10 19 C 30 32 D E 70 68 F 90 86 [2] (d) (i) Use the data in Table 1.1 to plot on the grid a graph of θ (vertical axis) against θ P L. [3] (ii) Draw the straight line of best fit. [1] (iii) Describe the relationship between θ and θ L P. ........................................................................................................................................... ..................................................................................................................................... [1] (iv) Use your graph to estimate θ when θ = 60°. P L Show on your graph how you obtain your answer. θ = ........................................................° [2] P [Total: 13]
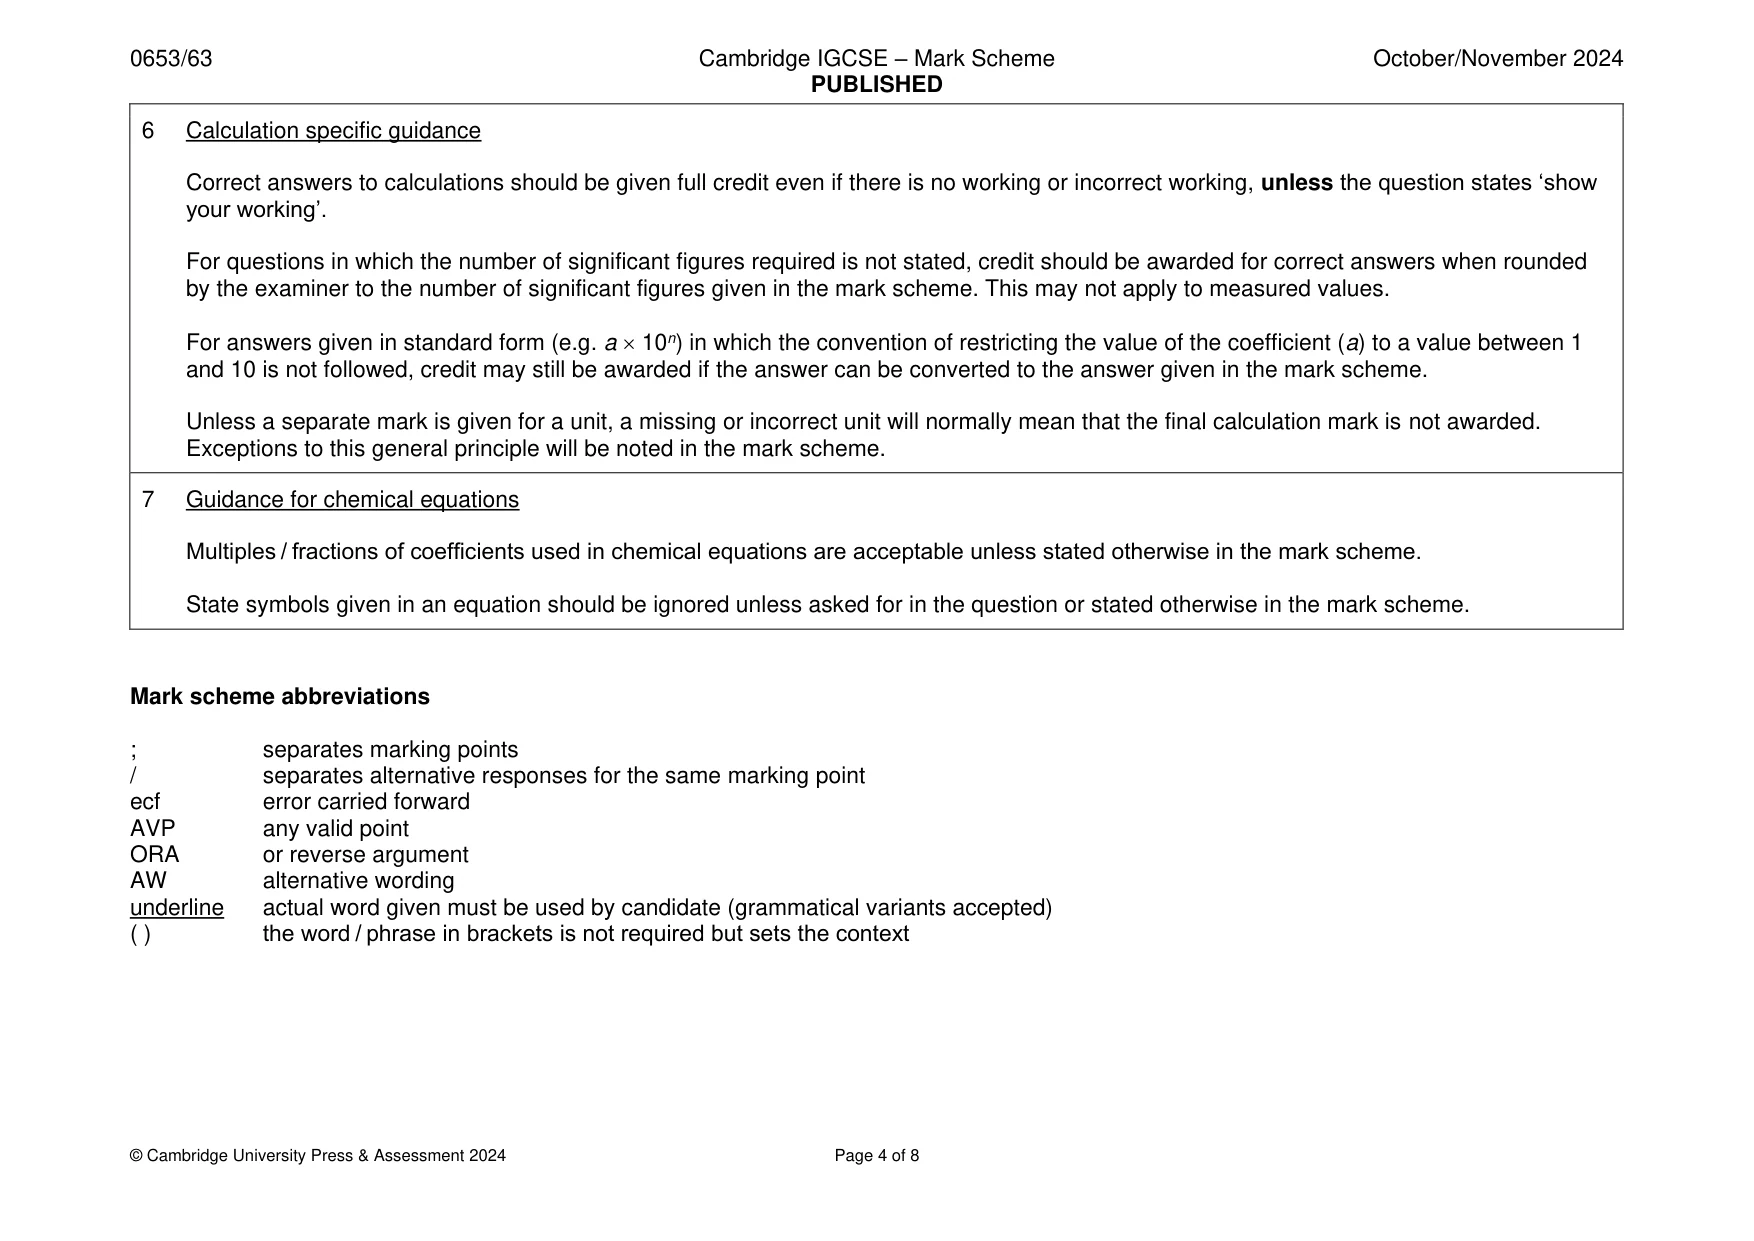
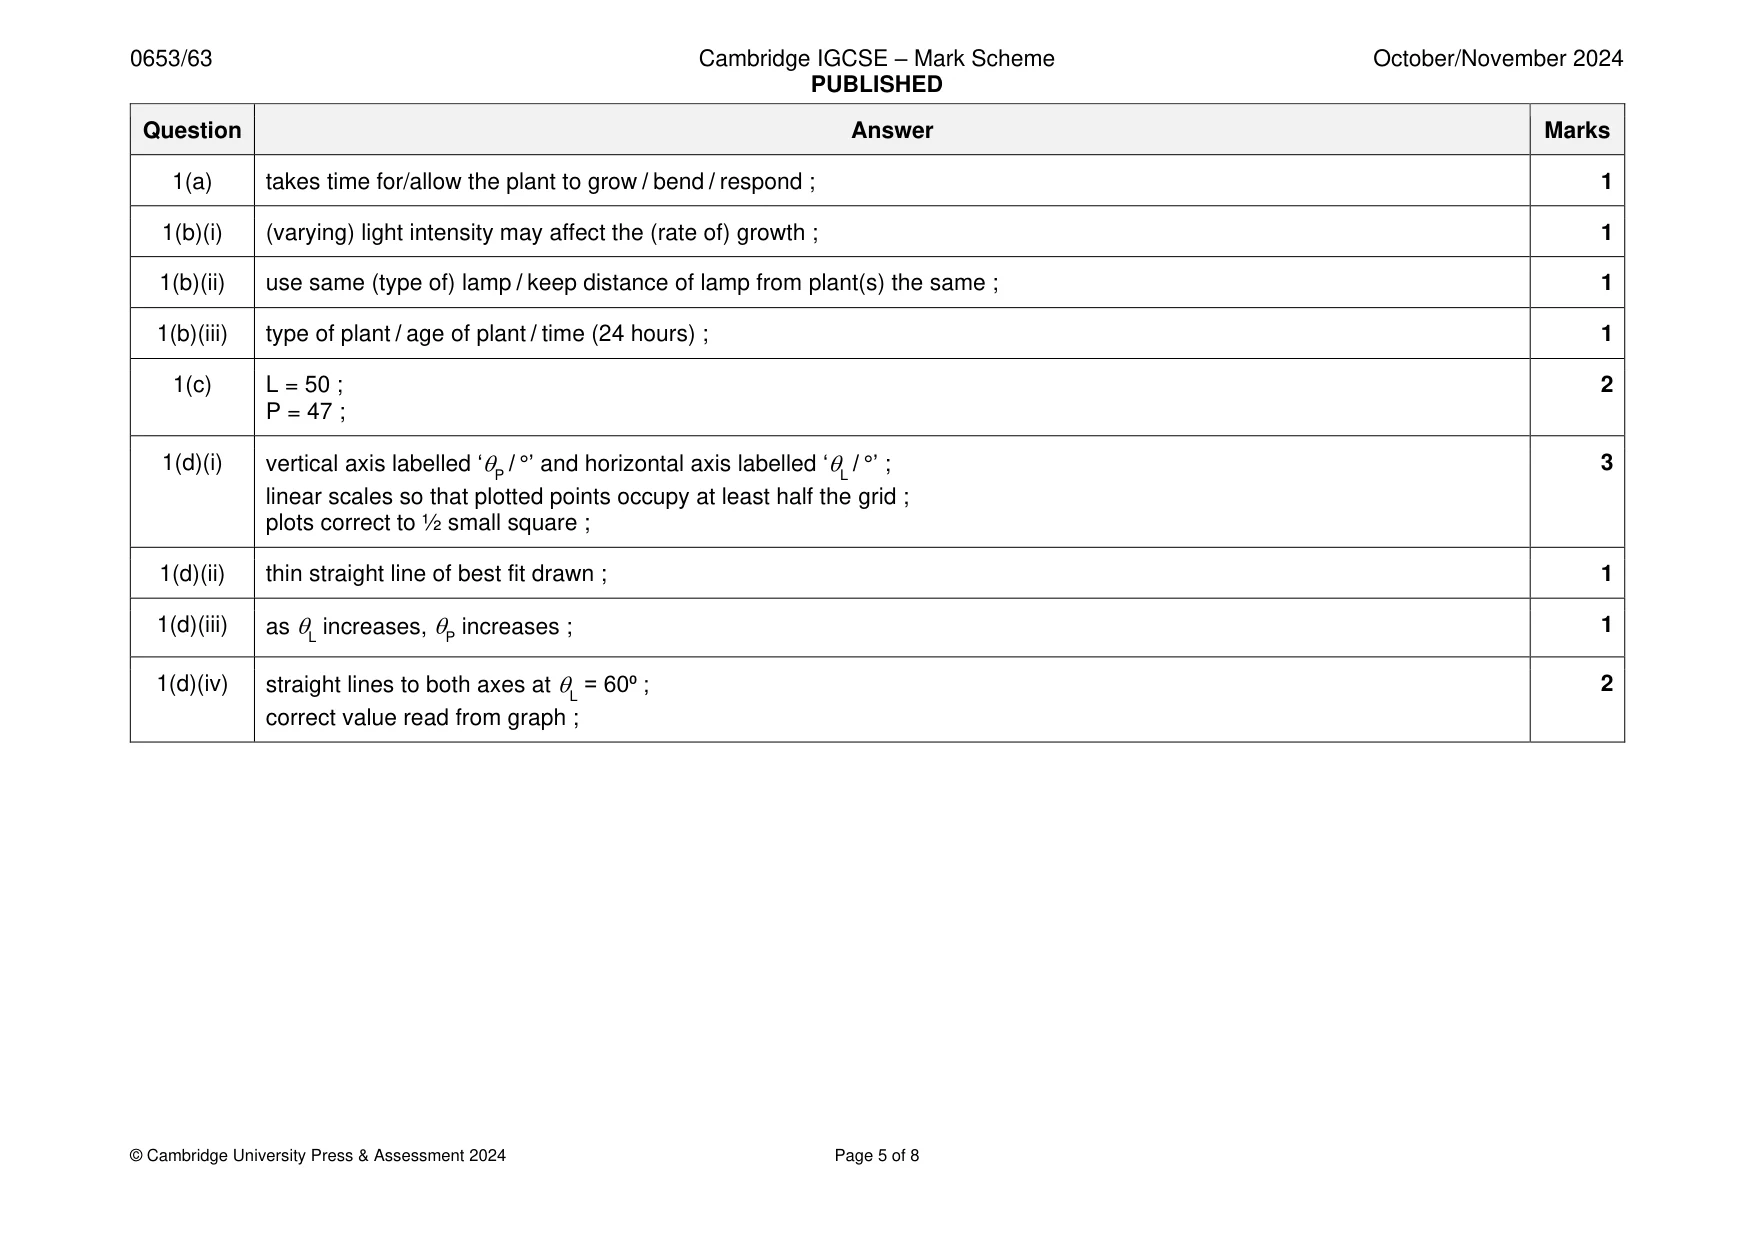
Mark scheme: Question Answer Marks 1(a) takes time for/allow the plant to grow / bend / respond ; 1 1(b)(i) (varying) light intensity may affect the (rate of) growth ; 1 1(b)(ii) use same (type of) lamp / keep distance of lamp from plant(s) the same ; 1 1(b)(iii) type of plant / age of plant / time (24 hours) ; 1 1(c) L = 50 ; 2 P = 47 ; 1(d)(i) vertical axis labelled ‘P / °’ and horizontal axis labelled ‘L / °’ ; 3 linear scales so that plotted points occupy at least half the grid ; plots correct to ½ small square ; 1(d)(ii) thin straight line of best fit drawn ; 1 1(d)(iii) as L increases, P increases ; 1 1(d)(iv) straight lines to both axes at L = 60⁰ ; 2 correct value read from graph ;
Q2 · A student prepares a pure dry sample of the insoluble salt, barium sulfate
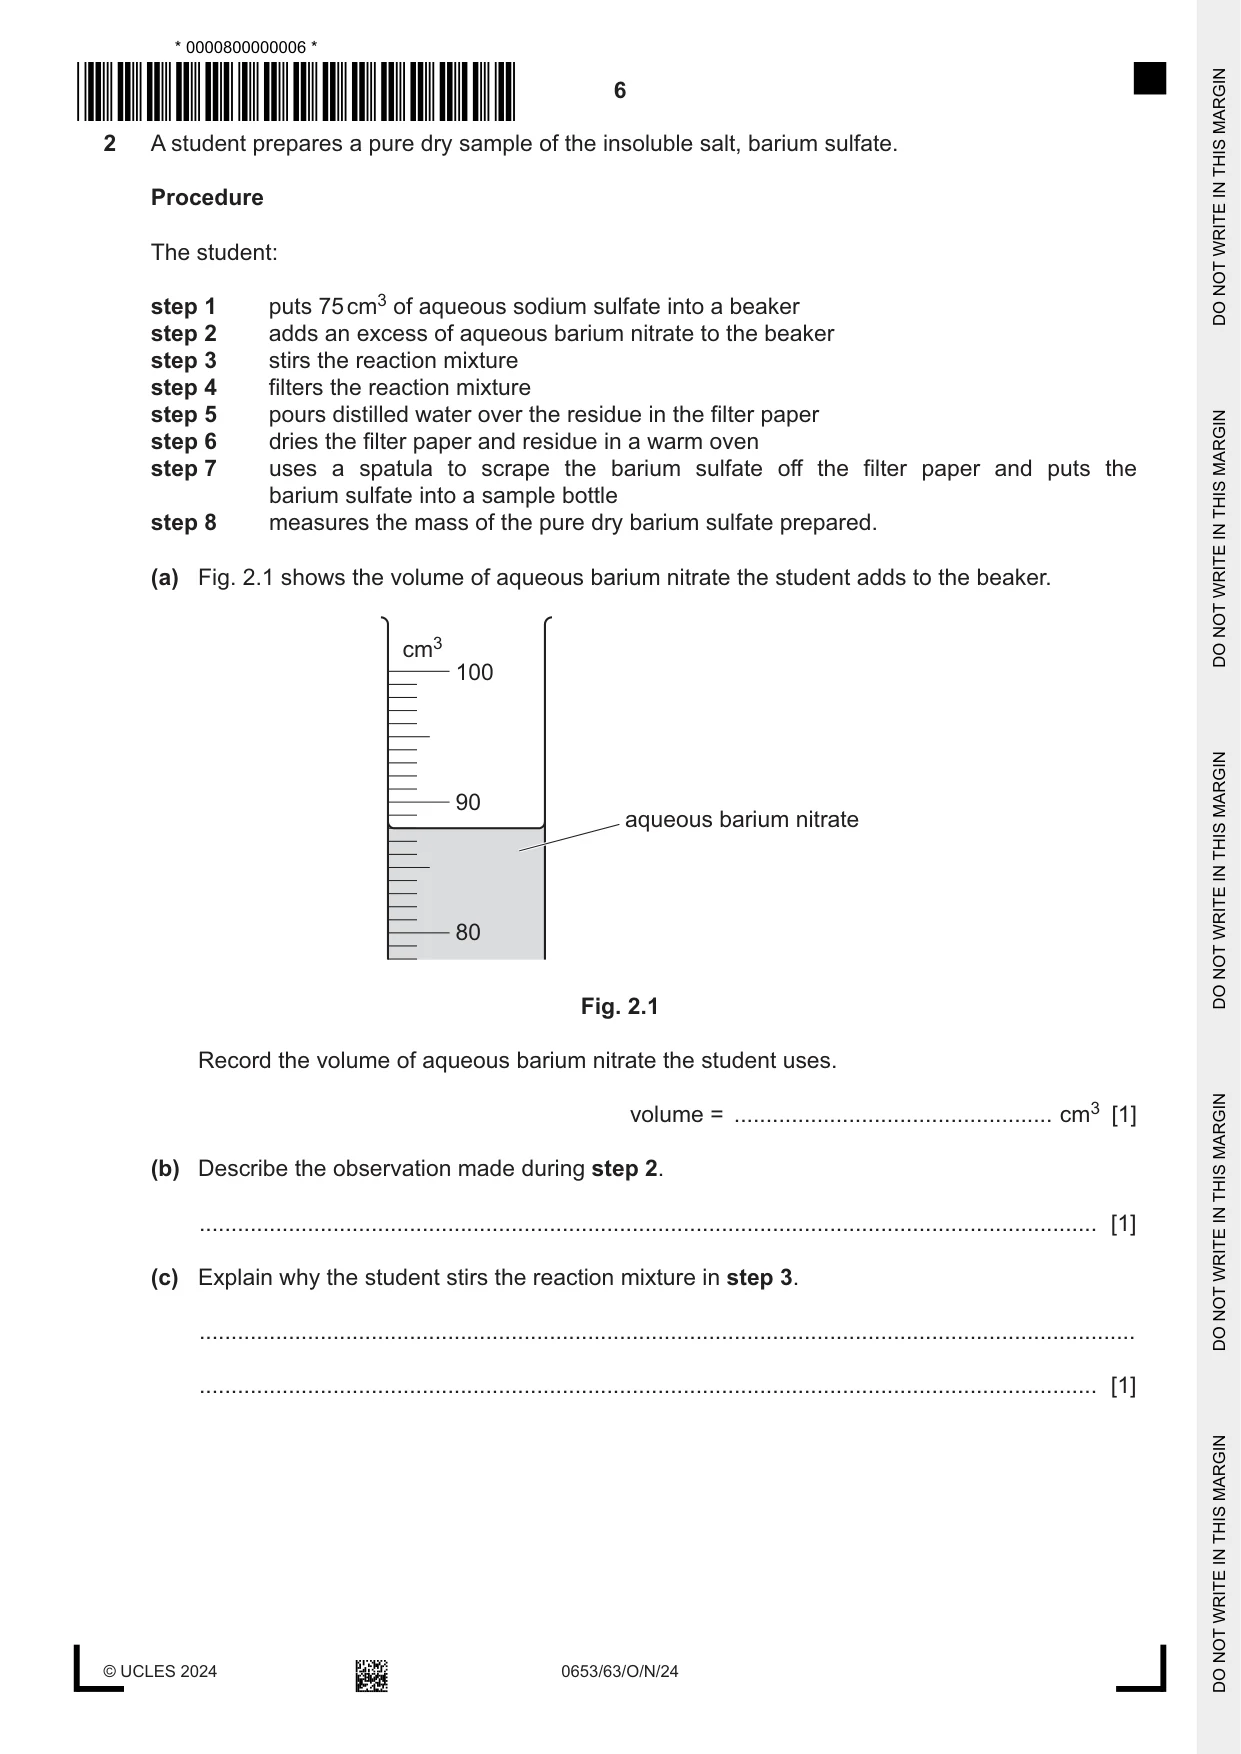
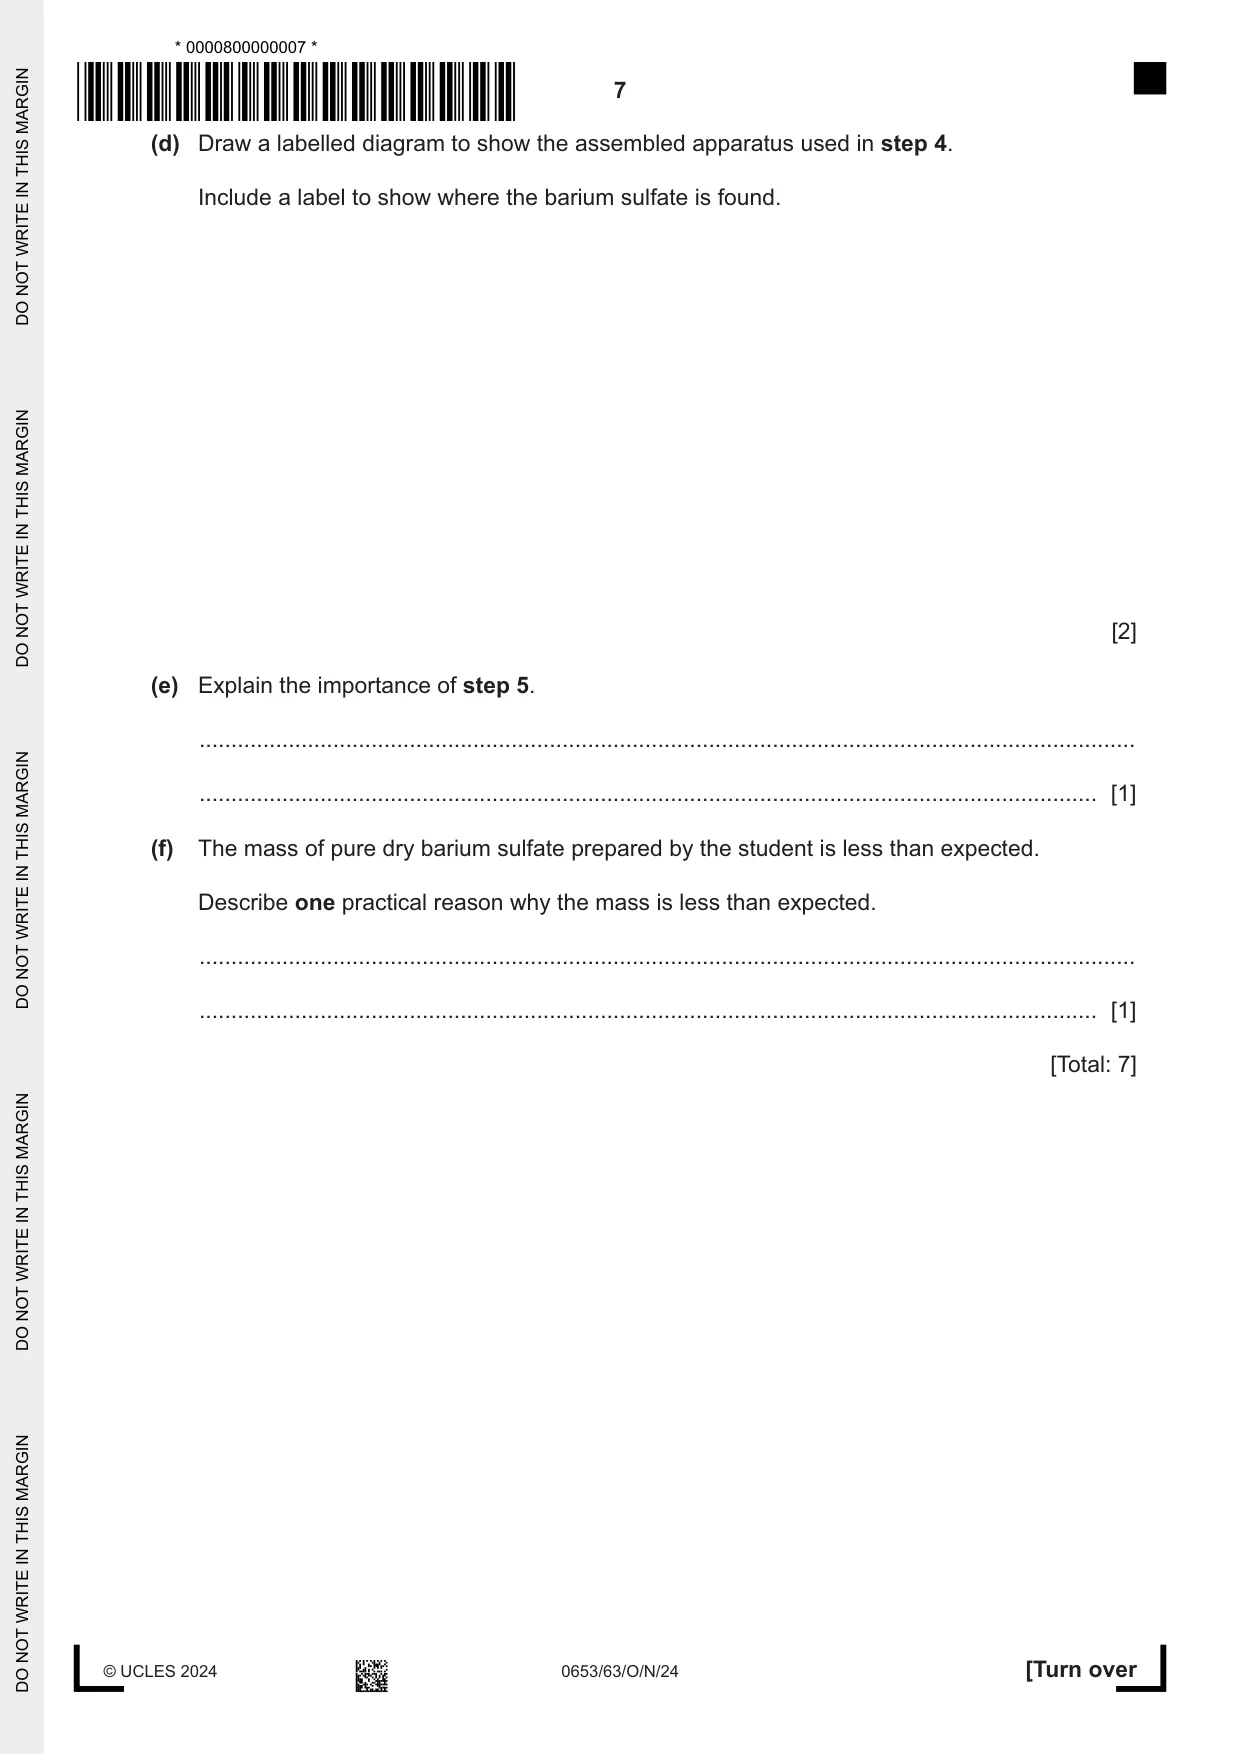
2 A student prepares a pure dry sample of the insoluble salt, barium sulfate. Procedure The student: step 1 puts 75 cm3 of aqueous sodium sulfate into a beaker step 2 adds an excess of aqueous barium nitrate to the beaker step 3 stirs the reaction mixture step 4 filters the reaction mixture step 5 pours distilled water over the residue in the filter paper step 6 dries the filter paper and residue in a warm oven step 7 uses a spatula to scrape the barium sulfate off the filter paper and puts the barium sulfate into a sample bottle step 8 measures the mass of the pure dry barium sulfate prepared. (a) Fig. 2.1 shows the volume of aqueous barium nitrate the student adds to the beaker. cm3 100 90 aqueous barium nitrate 80 Fig. 2.1 Record the volume of aqueous barium nitrate the student uses. volume = .................................................. cm3 [1] (b) Describe the observation made during step 2. ............................................................................................................................................. [1] (c) Explain why the student stirs the reaction mixture in step 3. ................................................................................................................................................... ............................................................................................................................................. [1] (d) Draw a labelled diagram to show the assembled apparatus used in step 4. Include a label to show where the barium sulfate is found. [2] (e) Explain the importance of step 5. ................................................................................................................................................... ............................................................................................................................................. [1] (f) The mass of pure dry barium sulfate prepared by the student is less than expected. Describe one practical reason why the mass is less than expected. ................................................................................................................................................... ............................................................................................................................................. [1] [Total: 7]
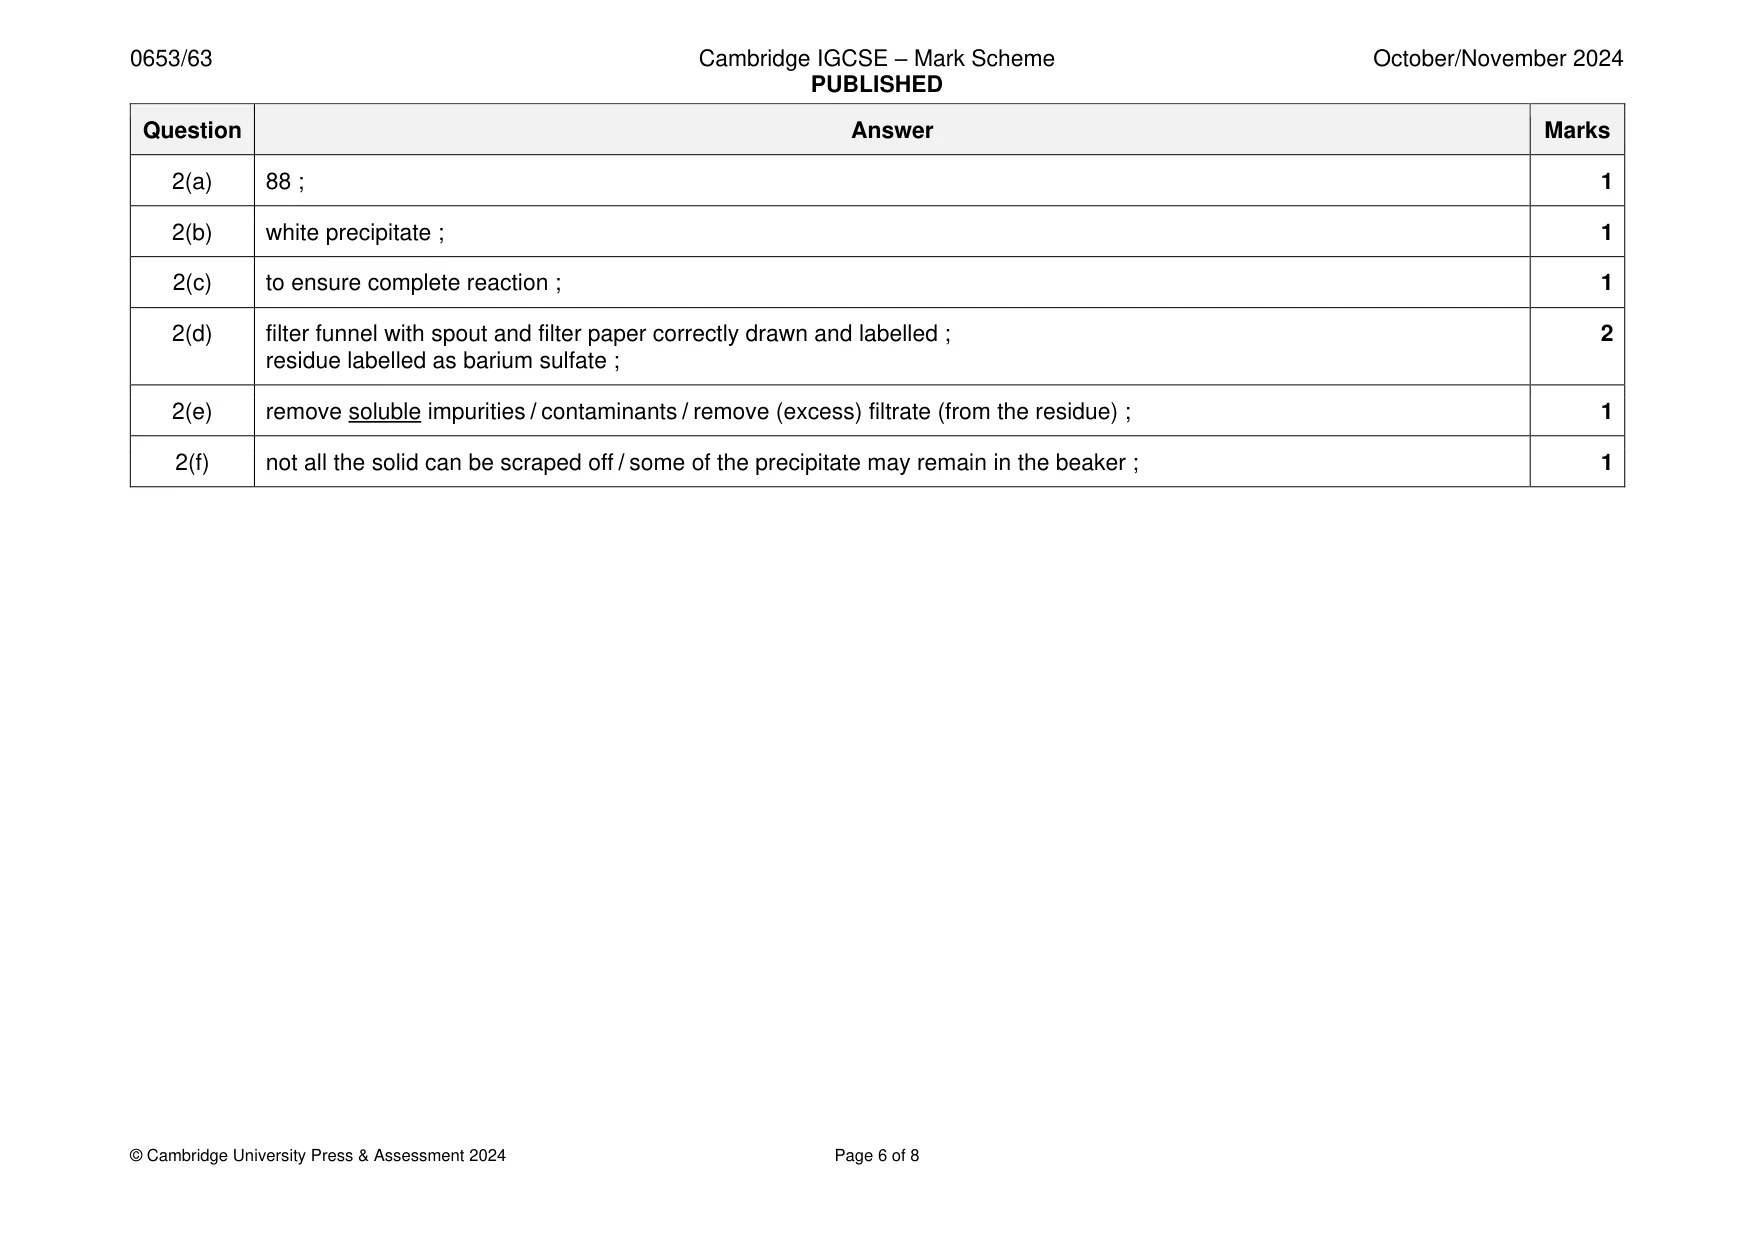
Mark scheme: 2(a) 88 ; 1 2(b) white precipitate ; 1 2(c) to ensure complete reaction ; 1 2(d) filter funnel with spout and filter paper correctly drawn and labelled ; 2 residue labelled as barium sulfate ; 2(e) remove soluble impurities / contaminants / remove (excess) filtrate (from the residue) ; 1 2(f) not all the solid can be scraped off / some of the precipitate may remain in the beaker ; 1
Q3 · Antacids are used to neutralise excess acid in the stomach
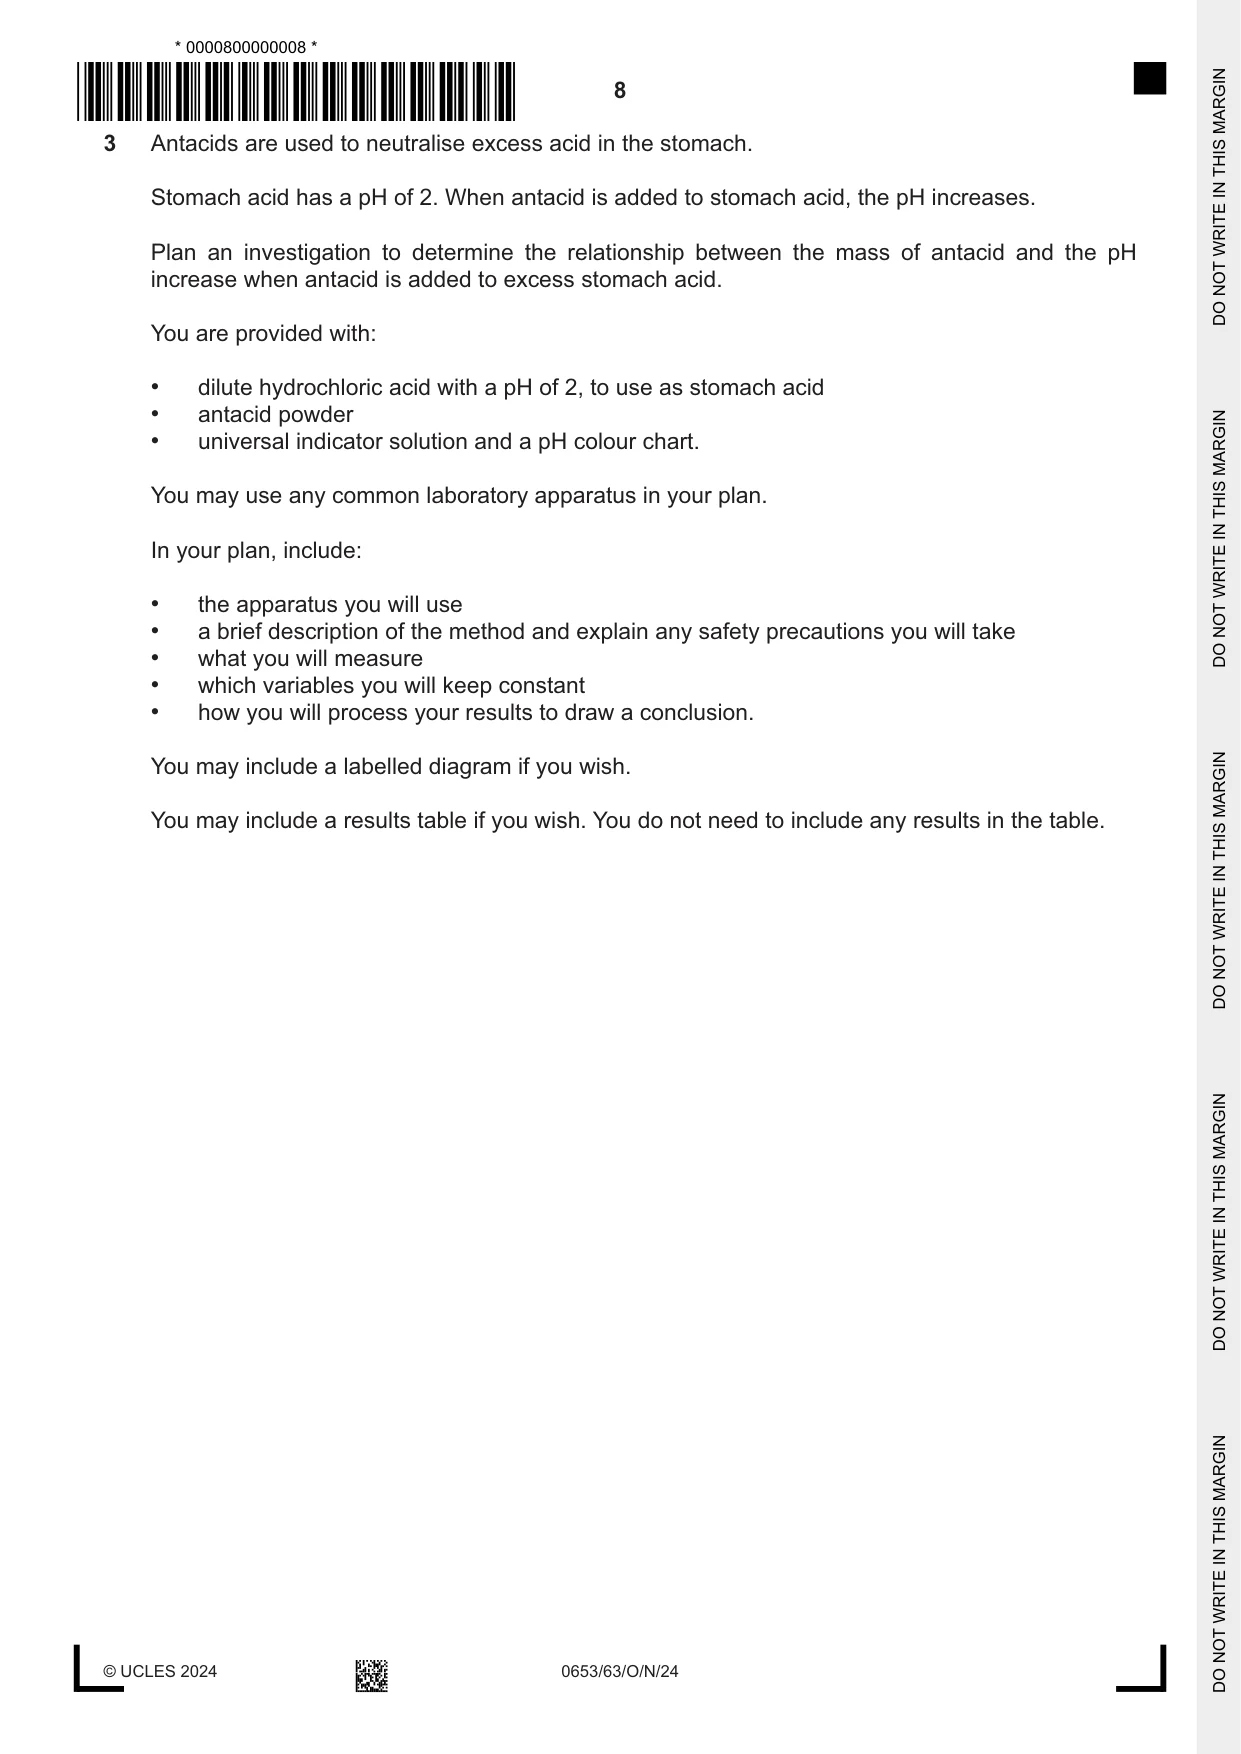
3 Antacids are used to neutralise excess acid in the stomach. Stomach acid has a pH of 2. When antacid is added to stomach acid, the pH increases. Plan an investigation to determine the relationship between the mass of antacid and the pH increase when antacid is added to excess stomach acid. You are provided with: • dilute hydrochloric acid with a pH of 2, to use as stomach acid • antacid powder • universal indicator solution and a pH colour chart. You may use any common laboratory apparatus in your plan. In your plan, include: • the apparatus you will use • a brief description of the method and explain any safety precautions you will take • what you will measure • which variables you will keep constant • how you will process your results to draw a conclusion. You may include a labelled diagram if you wish. You may include a results table if you wish. You do not need to include any results in the table. .......................................................................................................................................................... .......................................................................................................................................................... .......................................................................................................................................................... .......................................................................................................................................................... .......................................................................................................................................................... .......................................................................................................................................................... .......................................................................................................................................................... .......................................................................................................................................................... .......................................................................................................................................................... .......................................................................................................................................................... .......................................................................................................................................................... .......................................................................................................................................................... .......................................................................................................................................................... .......................................................................................................................................................... .................................................................................................................................................... [7]
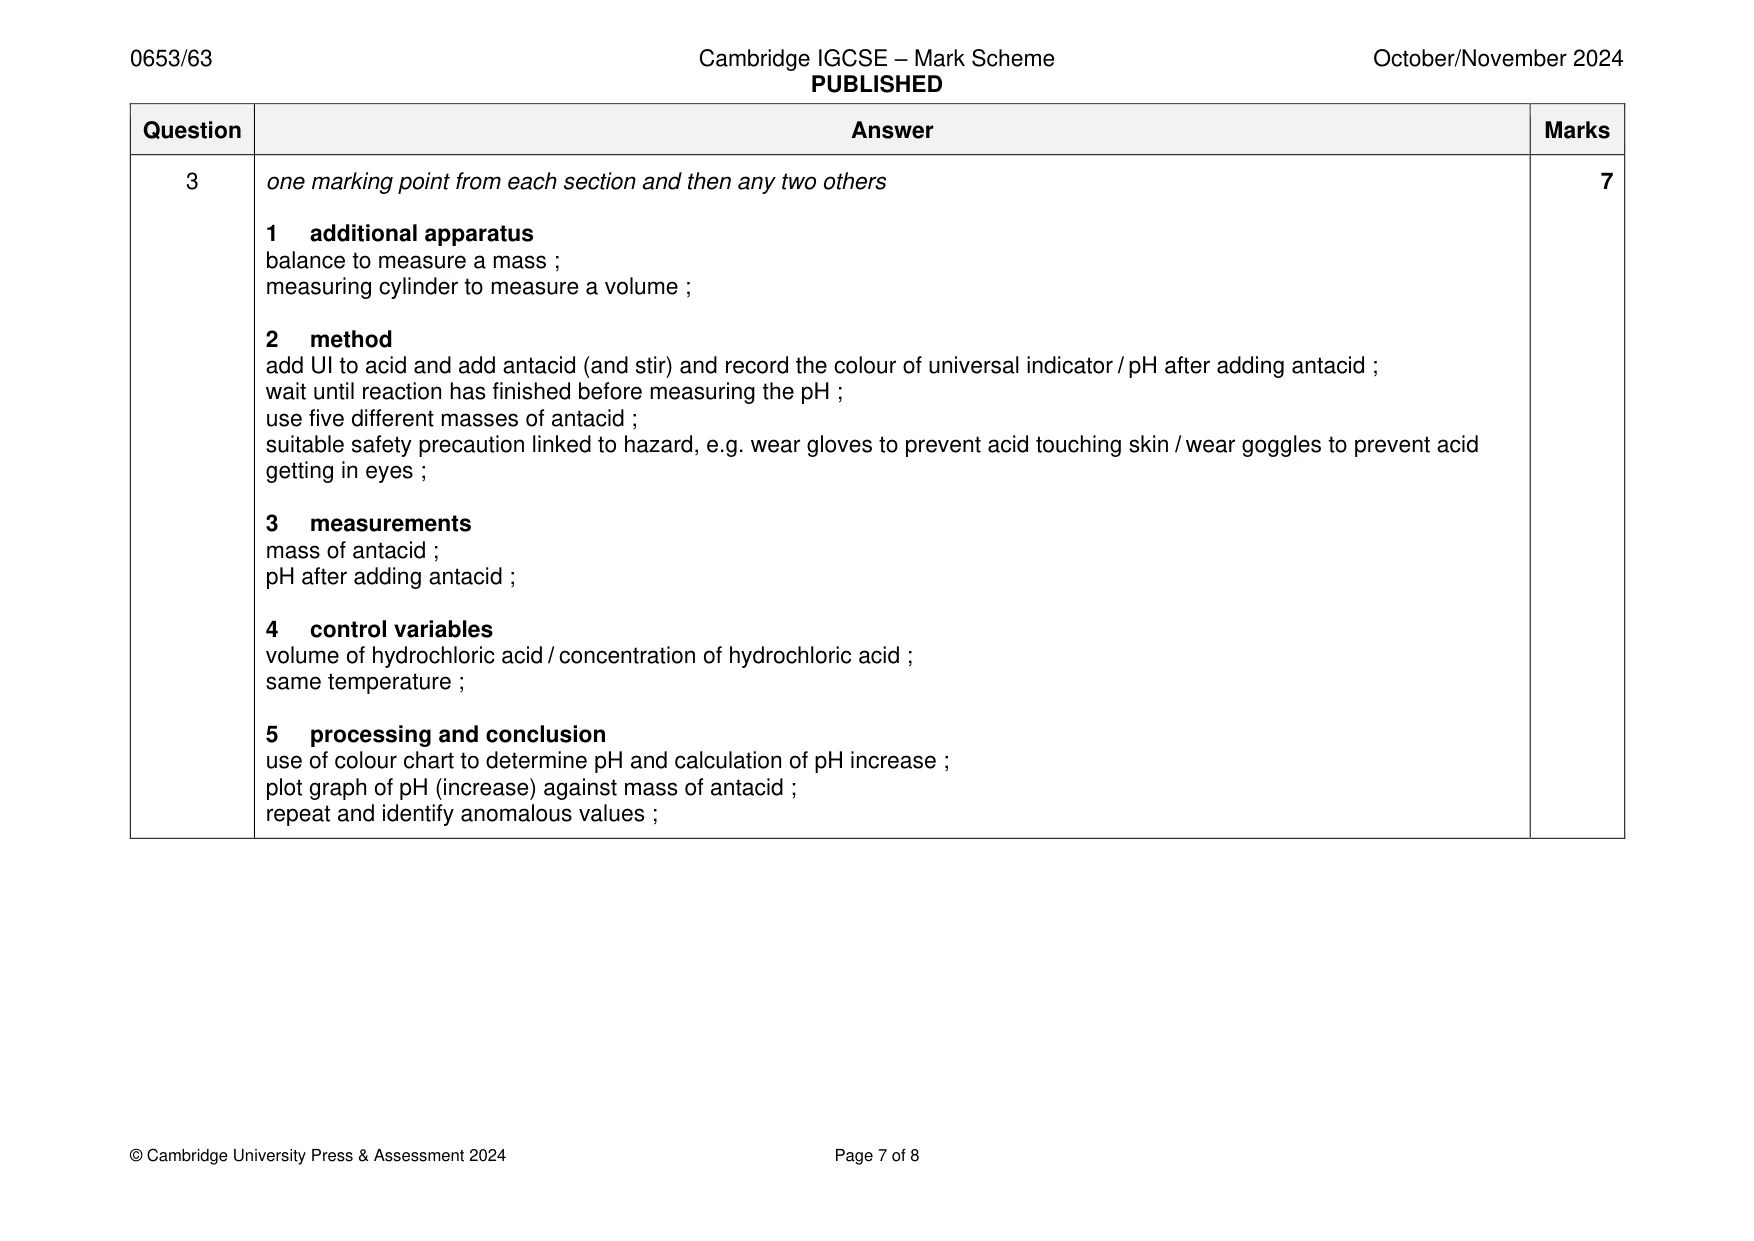
Mark scheme: 3 one marking point from each section and then any two others 7 1 additional apparatus balance to measure a mass ; measuring cylinder to measure a volume ; 2 method add UI to acid and add antacid (and stir) and record the colour of universal indicator / pH after adding antacid ; wait until reaction has finished before measuring the pH ; use five different masses of antacid ; suitable safety precaution linked to hazard, e.g. wear gloves to prevent acid touching skin / wear goggles to prevent acid getting in eyes ; 3 measurements mass of antacid ; pH after adding antacid ; 4 control variables volume of hydrochloric acid / concentration of hydrochloric acid ; same temperature ; 5 processing and conclusion use of colour chart to determine pH and calculation of pH increase ; plot graph of pH (increase) against mass of antacid ; repeat and identify anomalous values ;
Q4 · A student investigates the effects of two factors on the period T of a simple pendulum
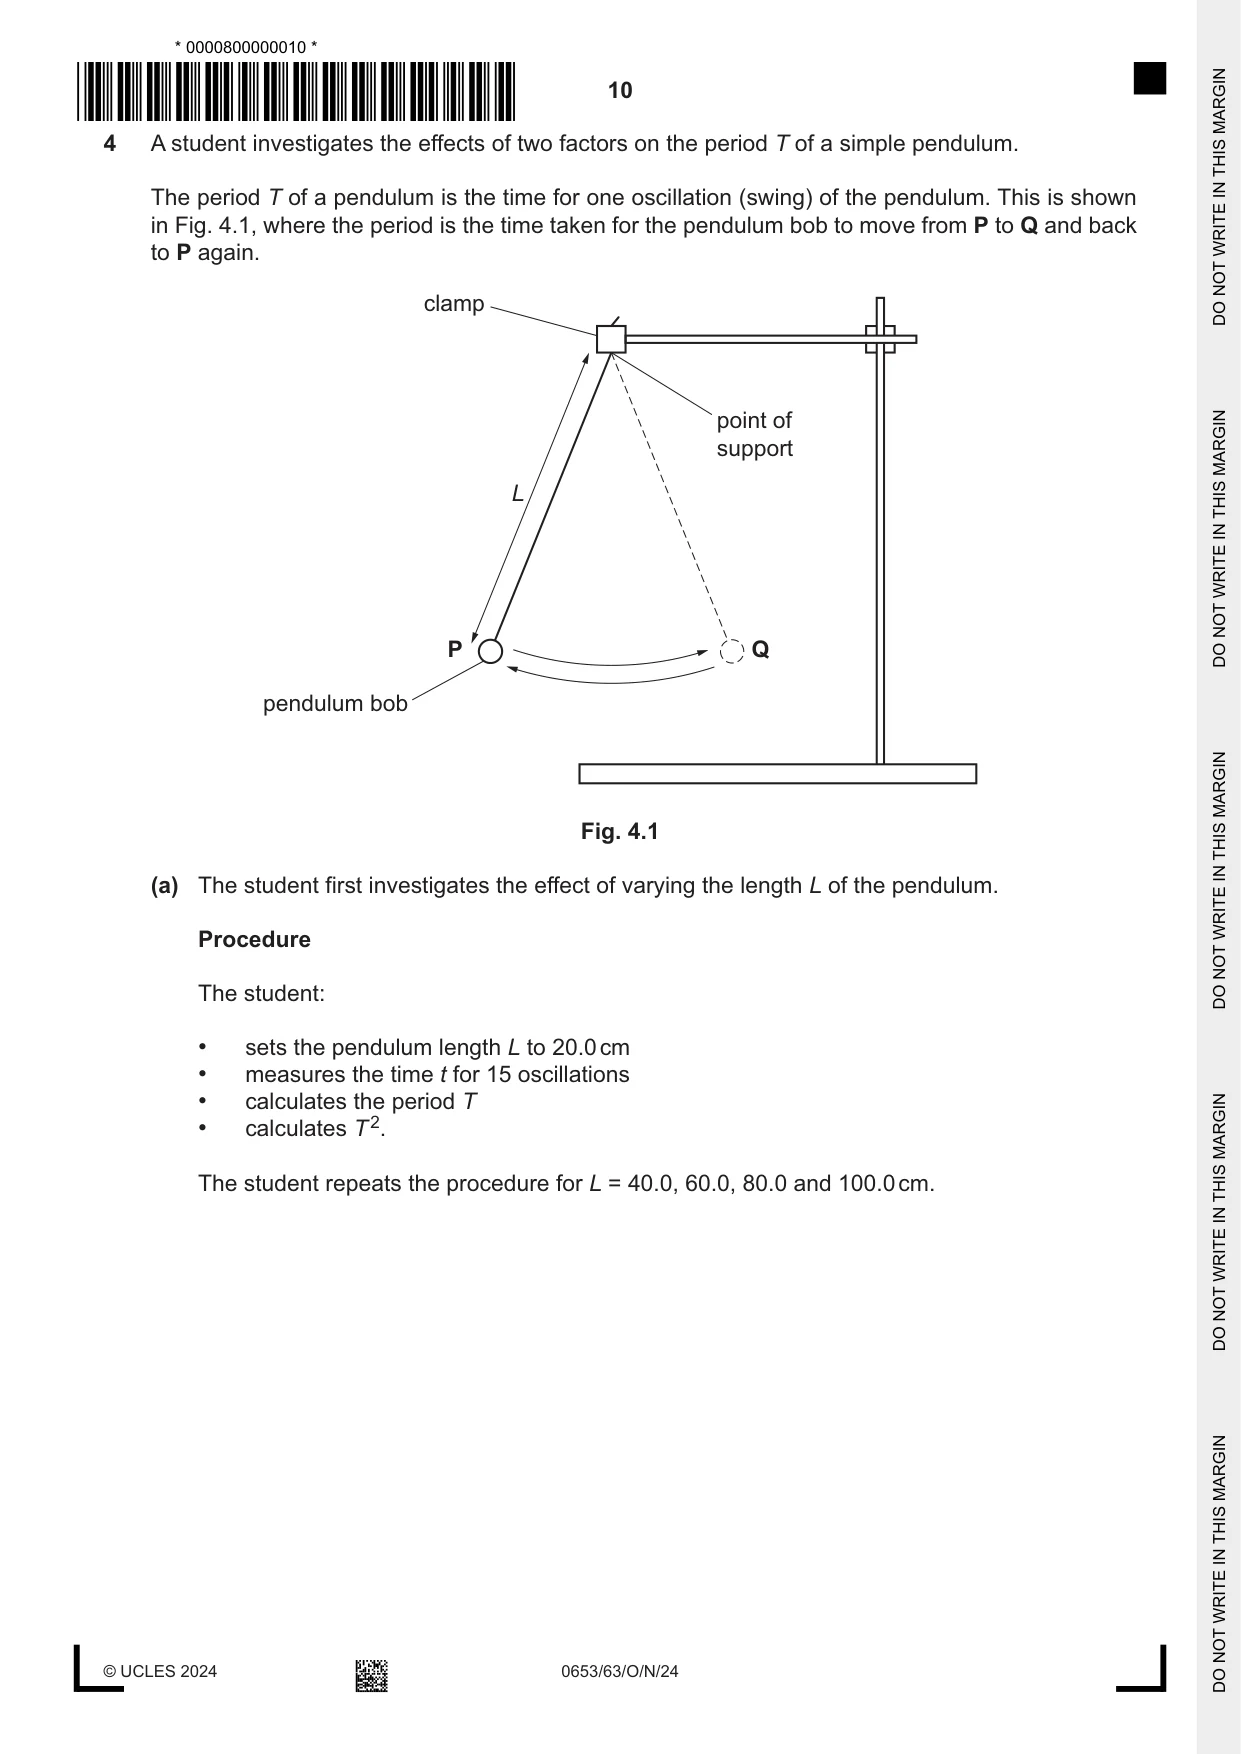
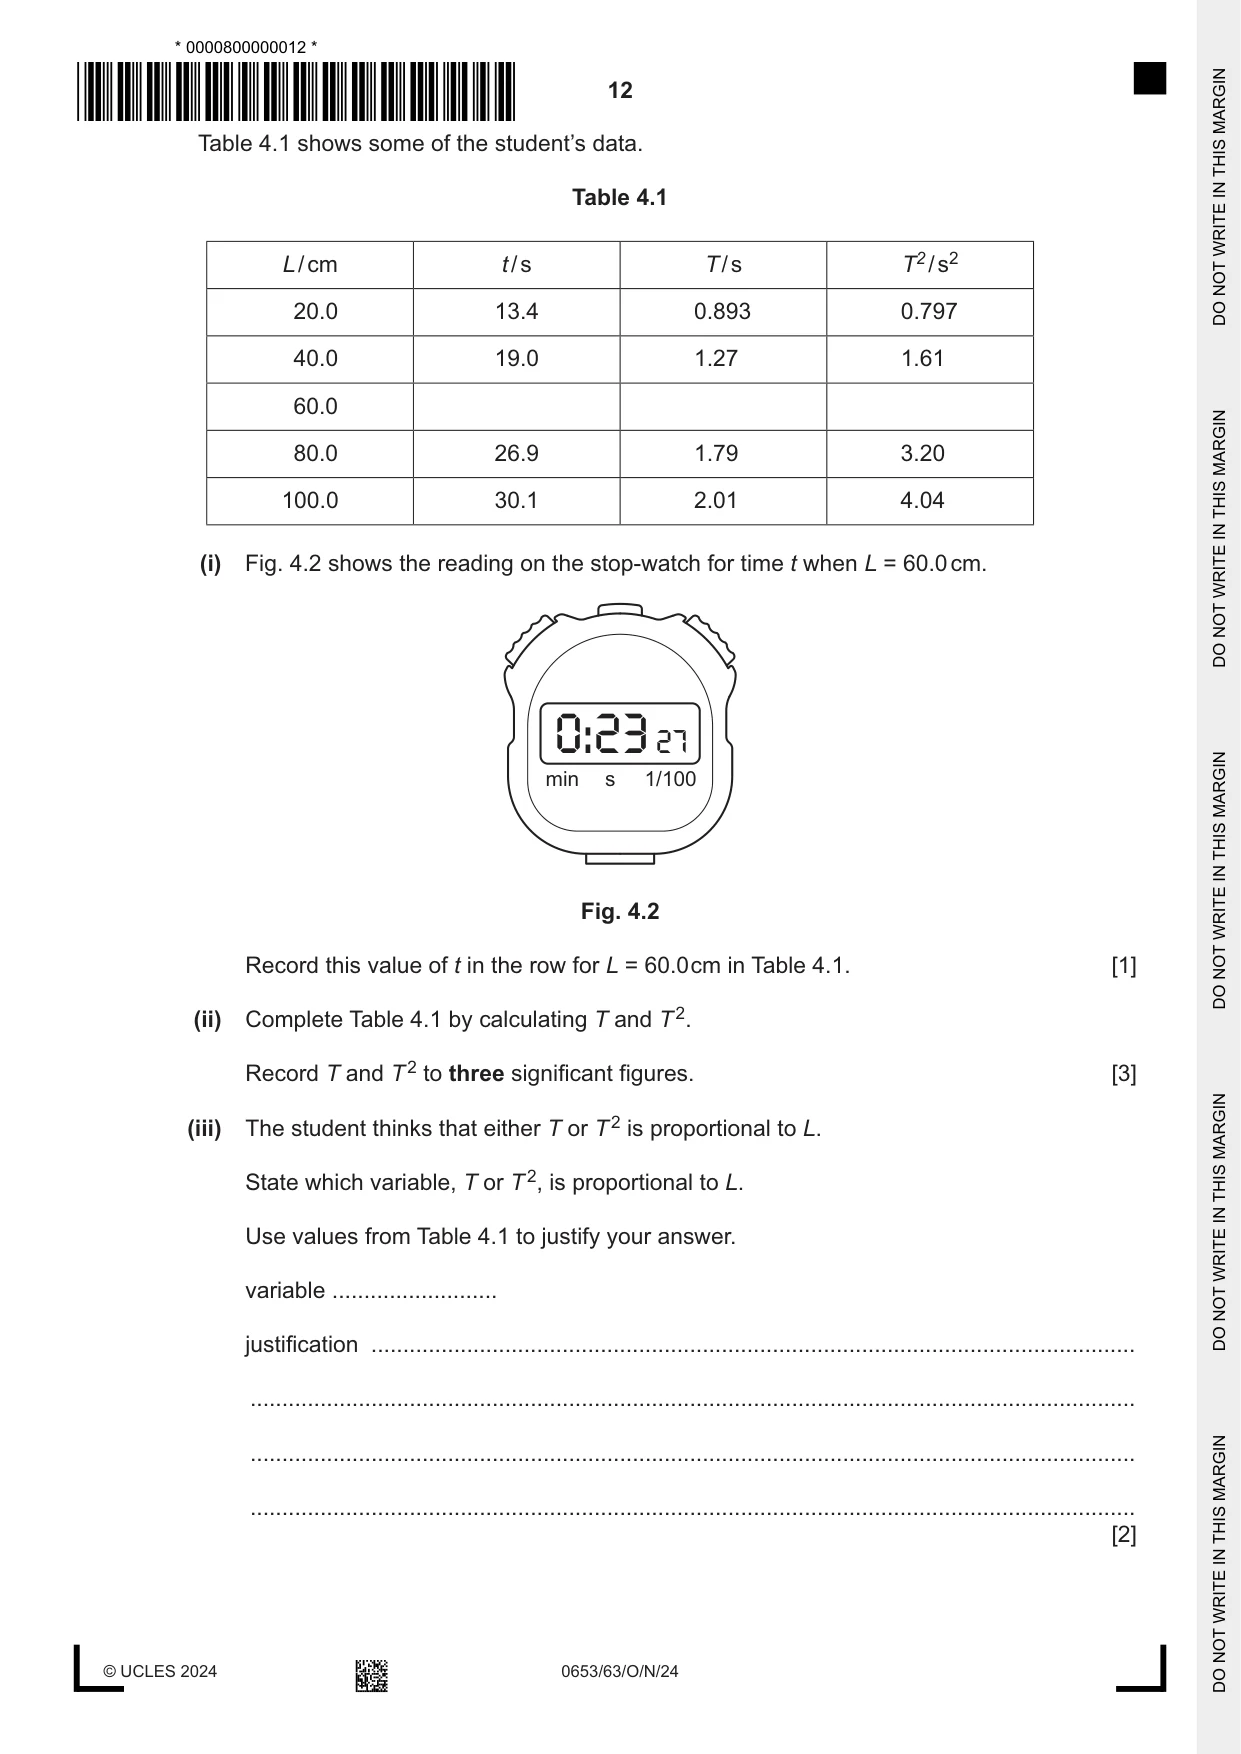
4 A student investigates the effects of two factors on the period T of a simple pendulum. The period T of a pendulum is the time for one oscillation (swing) of the pendulum. This is shown in Fig. 4.1, where the period is the time taken for the pendulum bob to move from P to Q and back to P again. clamp point of support L P Q pendulum bob Fig. 4.1 (a) The student first investigates the effect of varying the length L of the pendulum. Procedure The student: • sets the pendulum length L to 20.0 cm • measures the time t for 15 oscillations • calculates the period T • calculates T 2. The student repeats the procedure for L = 40.0, 60.0, 80.0 and 100.0 cm. Table 4.1 shows some of the student’s data. Table 4.1 L / cm t / s T / s T2 / s2 20.0 13.4 0.893 0.797 40.0 19.0 1.27 1.61 60.0 80.0 26.9 1.79 3.20 100.0 30.1 2.01 4.04 (i) Fig. 4.2 shows the reading on the stop-watch for time t when L = 60.0 cm. 0:23 27 min s 1/100 Fig. 4.2 Record this value of t in the row for L = 60.0 cm in Table 4.1. [1] (ii) Complete Table 4.1 by calculating T and T 2. Record T and T 2 to three significant figures. [3] (iii) The student thinks that either T or T 2 is proportional to L. State which variable, T or T 2, is proportional to L. Use values from Table 4.1 to justify your answer. variable .......................... justification ........................................................................................................................ ........................................................................................................................................... ........................................................................................................................................... ........................................................................................................................................... [2]
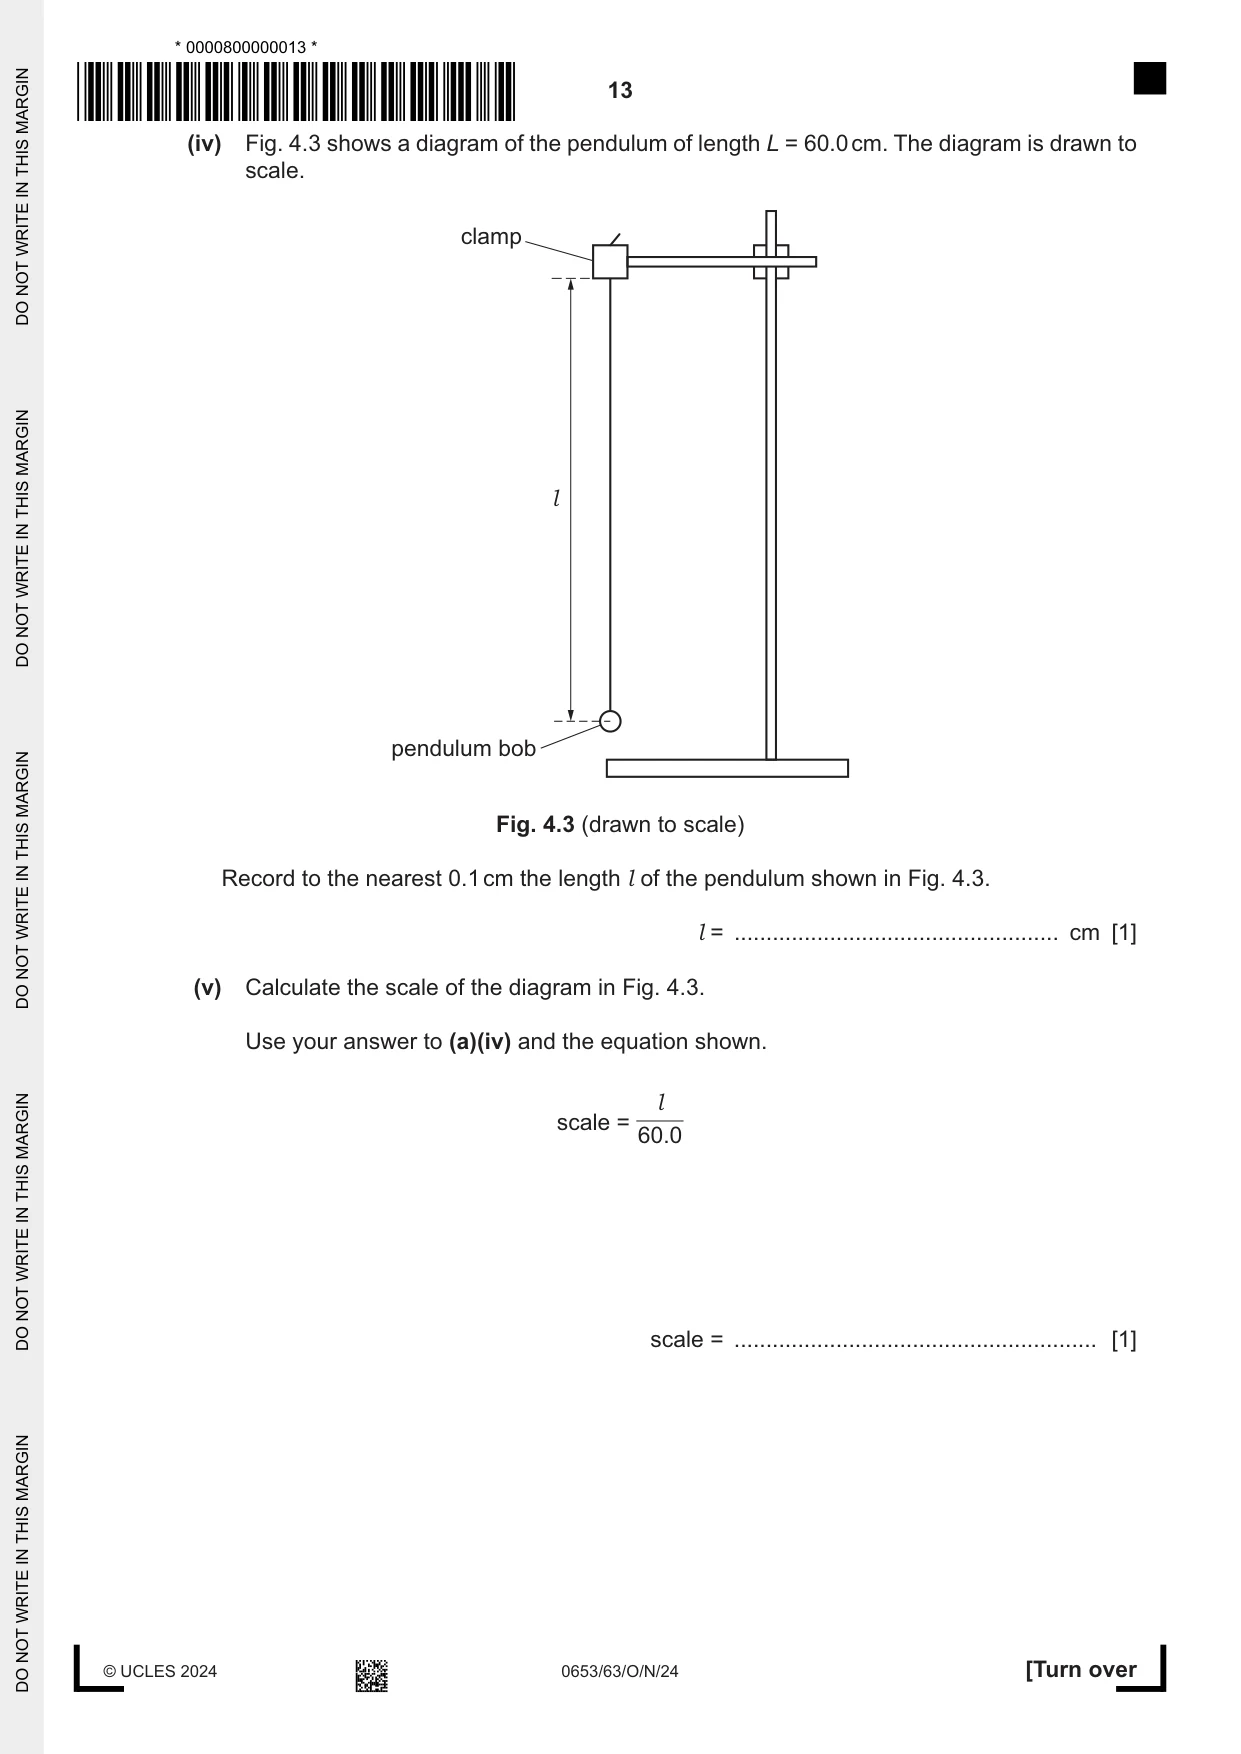
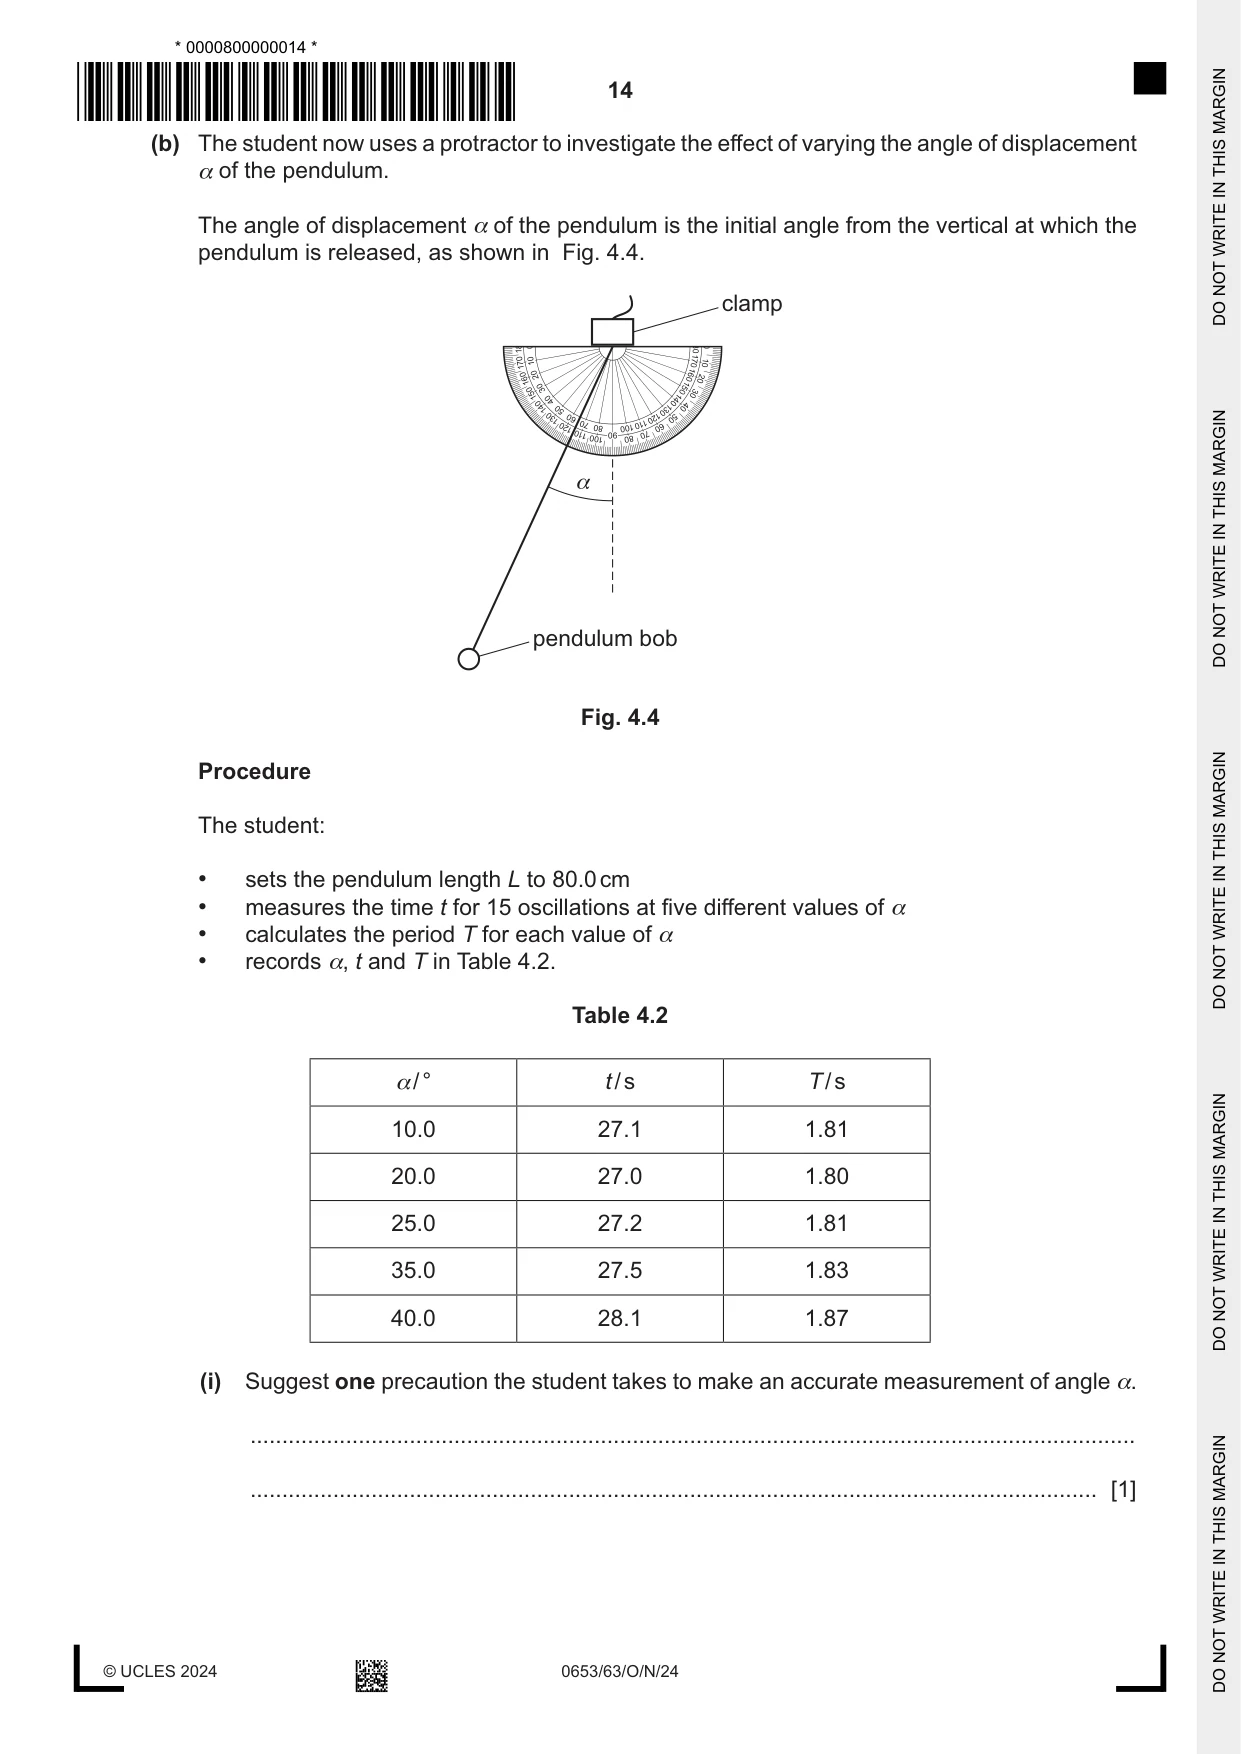
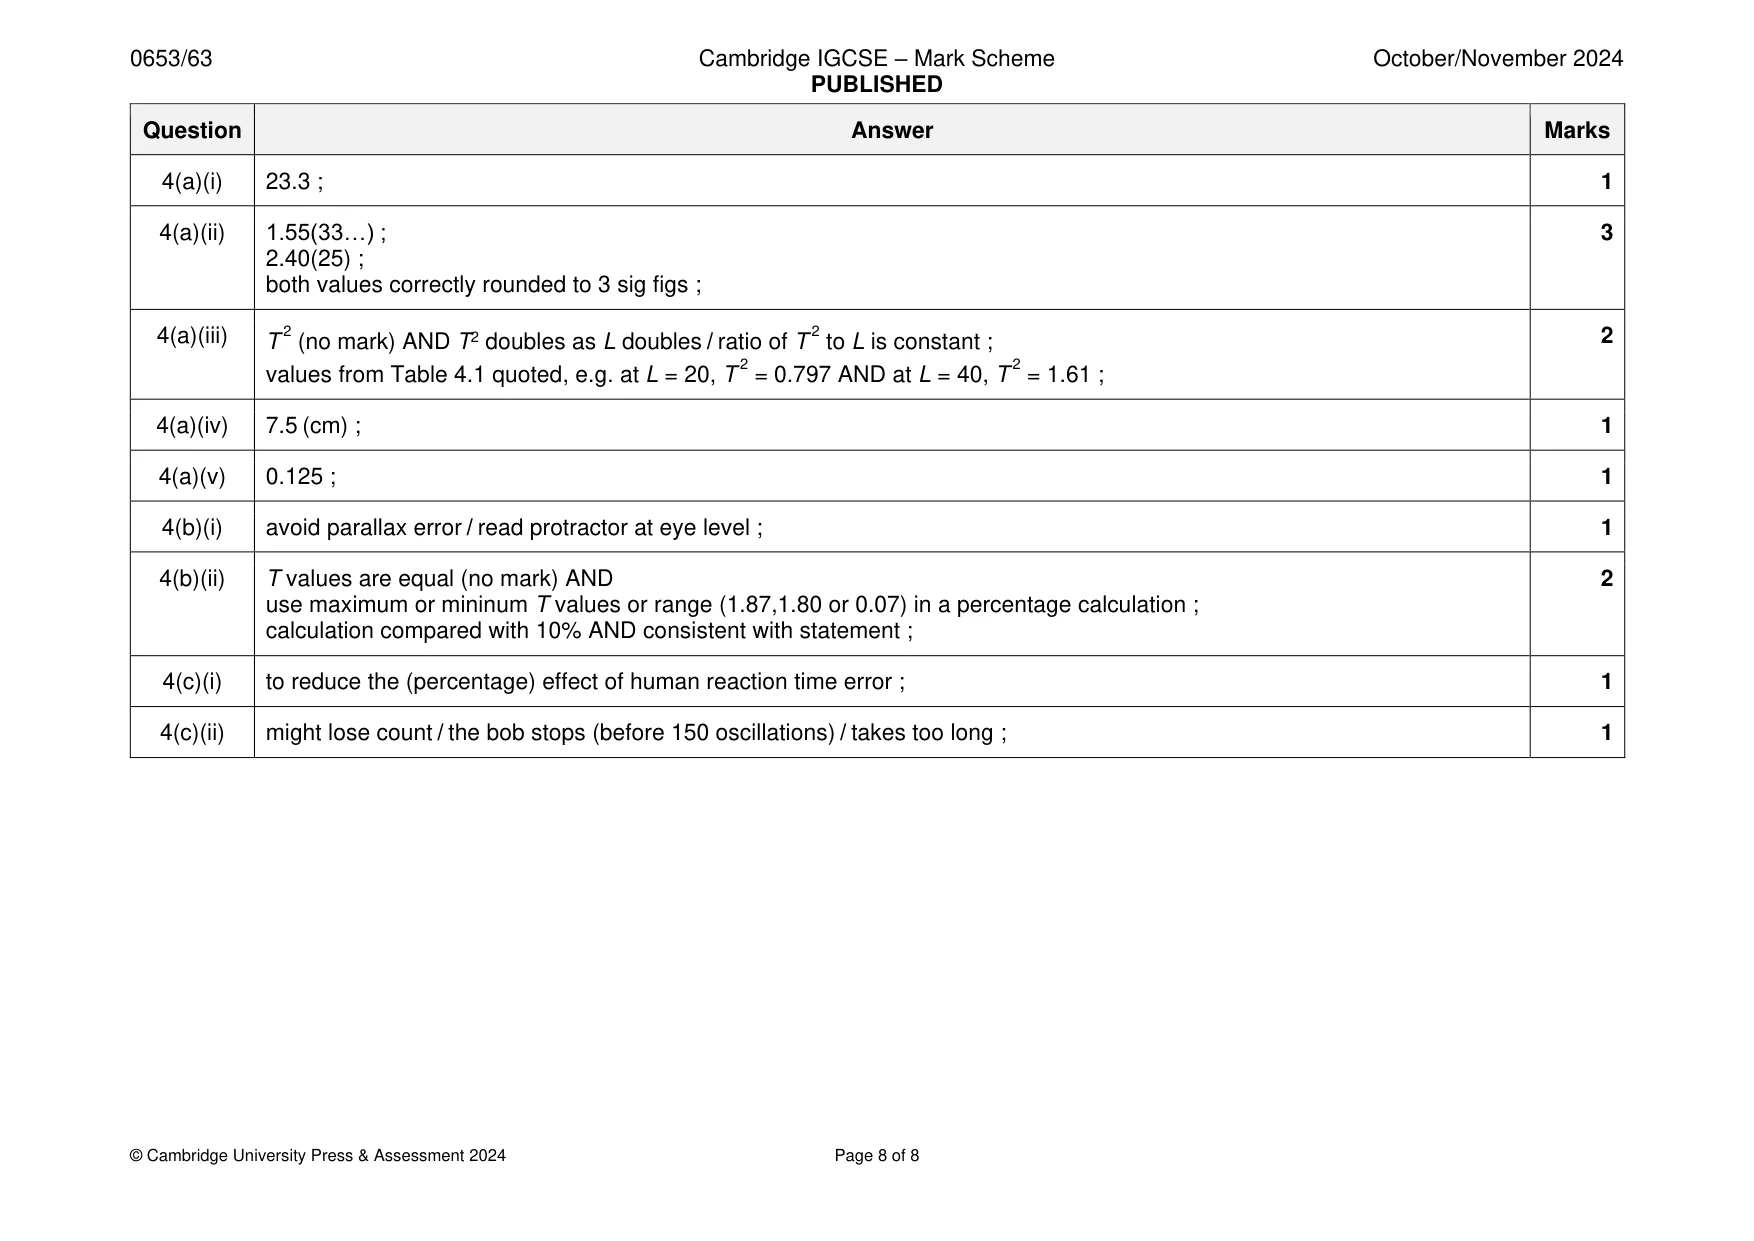
Mark scheme: 4(a)(i) 23.3 ; 1 4(a)(ii) 1.55(33…) ; 3 2.40(25) ; both values correctly rounded to 3 sig figs ; 4(a)(iii) T 2 (no mark) AND T2 doubles as L doubles / ratio of T 2 to L is constant ; 2 values from Table 4.1 quoted, e.g. at L = 20, T 2 = 0.797 AND at L = 40, T 2 = 1.61 ; 4(a)(iv) 7.5 (cm) ; 1 4(a)(v) 0.125 ; 1 4(b)(i) avoid parallax error / read protractor at eye level ; 1 4(b)(ii) T values are equal (no mark) AND 2 use maximum or mininum T values or range (1.87,1.80 or 0.07) in a percentage calculation ; calculation compared with 10% AND consistent with statement ; 4(c)(i) to reduce the (percentage) effect of human reaction time error ; 1 4(c)(ii) might lose count / the bob stops (before 150 oscillations) / takes too long ; 1
More questions on Physical quantities and measurement techniques
What was in this paper
The subtopics covered by these 4 questions, and how many questions each got. Open one in a new tab to see every Cambridge question on it.
What you needed in this session
Cambridge’s own grade thresholds for 2024 Oct/Nov, Paper 6 · Variant 3. A higher threshold means an easier paper — the bar moves with how the cohort did.